financial results analyst briefing 2nd quarter for the...
TRANSCRIPT
Presented by Tn. Hj Ahmad Tifli Dato’ Mohd Talha Chief Financial Officer
Financial Results Analyst Briefing 2nd Quarter for the
Financial Period Ended 30 June 2015 24 August 2015

Disclaimer
These materials have been prepared by Felda Global Ventures Holdings Berhad (“FGVH” or the “Company”) solely for informational purposes, and are strictly confidential and may not be taken away, reproduced or redistributed to any other person. By attending this presentation, participants agree not to remove this document from the conference room where such documents are provided without express written consent from the Company. Participants agree further not to photograph, copy or otherwise reproduce these materials at any point of time during the presentation or while in your possession. By attending this presentation, you are agreeing to be bound by the foregoing restrictions. Any failure to comply with these restrictions may result in a violation of applicable laws and commencement of legal proceedings against you. It is not the Company’s intention to provide, and you may not rely on these materials as providing, a complete or comprehensive analysis of the Company’s financial position or prospects. The information contained in these materials has not been independently verified and is subject to verification, completion and change without notice. The information contained in these materials is current as of the date hereof and are subject to change without notice, and its accuracy is not guaranteed. The Company is not under any obligation to update or keep current the information contained in these materials subsequent to the date hereof. Accordingly, no representation or warranty, express or implied, is made or given by or on behalf of the Company, or any of its directors and affiliates or any other person, as to, and no reliance should be placed for any purposes whatsoever on, the fairness, accuracy, completeness or correctness of, or any errors or omissions in, the information contained in these materials. Neither the Company, its directors, officers or employees nor any other person accepts any liability whatsoever for any loss howsoever arising from any use of these materials or their contents or otherwise arising in connection therewith. These materials contain historical information of the Company which should not be regarded as an indication of future performance or results. These materials may also contain forward-looking statements that are, by their nature, subject to significant risks and uncertainties. These forward-looking statements reflect the Company’s current views with respect to future events and are not a guarantee of future performance or results. Actual results, performance or achievements of the Company may differ materially from any future results, performance or achievements expressed or implied by such forward-looking statements. Such forward-looking statements are based on numerous assumptions regarding the Company’s present and future business strategies and the environment in which the Company will operate in the future, and must be read together with such assumptions. Predictions, projections or forecasts of the economy or economic trends of the markets are not necessarily indicative of the future or likely performance of the Company, and the forecast financial performance of the Company is not guaranteed. No reliance should be placed on these forward-looking statements, if any.
Blank.potx 3
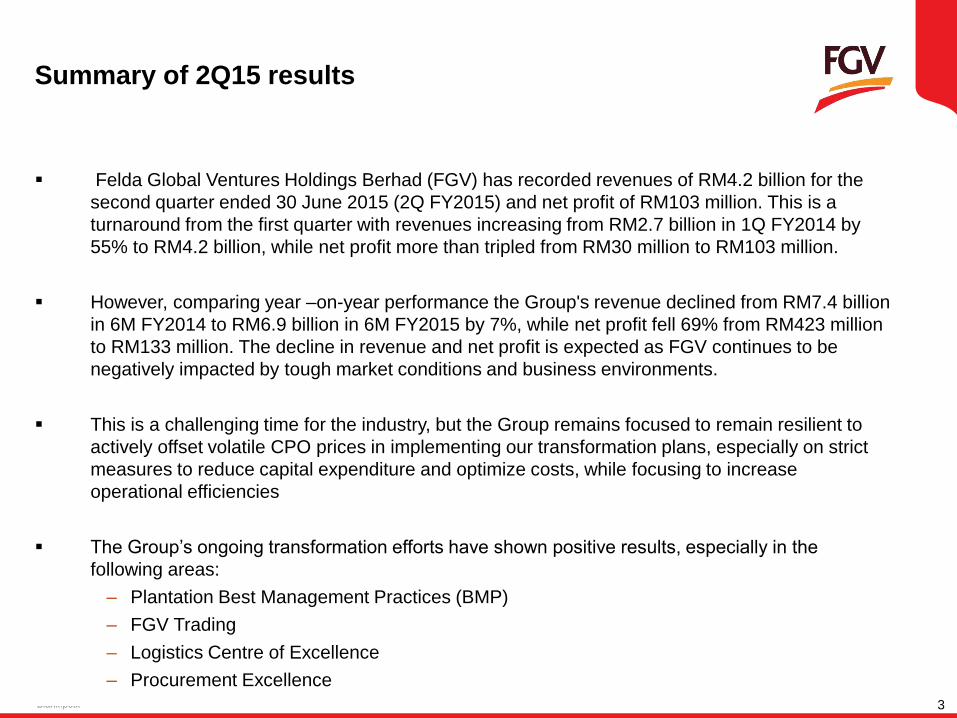
Felda Global Ventures Holdings Berhad (FGV) has recorded revenues of RM4.2 billion for the
second quarter ended 30 June 2015 (2Q FY2015) and net profit of RM103 million. This is a
turnaround from the first quarter with revenues increasing from RM2.7 billion in 1Q FY2014 by
55% to RM4.2 billion, while net profit more than tripled from RM30 million to RM103 million.
However, comparing year –on-year performance the Group's revenue declined from RM7.4 billion
in 6M FY2014 to RM6.9 billion in 6M FY2015 by 7%, while net profit fell 69% from RM423 million
to RM133 million. The decline in revenue and net profit is expected as FGV continues to be
negatively impacted by tough market conditions and business environments.
This is a challenging time for the industry, but the Group remains focused to remain resilient to
actively offset volatile CPO prices in implementing our transformation plans, especially on strict
measures to reduce capital expenditure and optimize costs, while focusing to increase
operational efficiencies
The Group’s ongoing transformation efforts have shown positive results, especially in the
following areas:
– Plantation Best Management Practices (BMP)
– FGV Trading
– Logistics Centre of Excellence
– Procurement Excellence
Summary of 2Q15 results

Blank.potx 4
Overview of results
Blank.potx 5
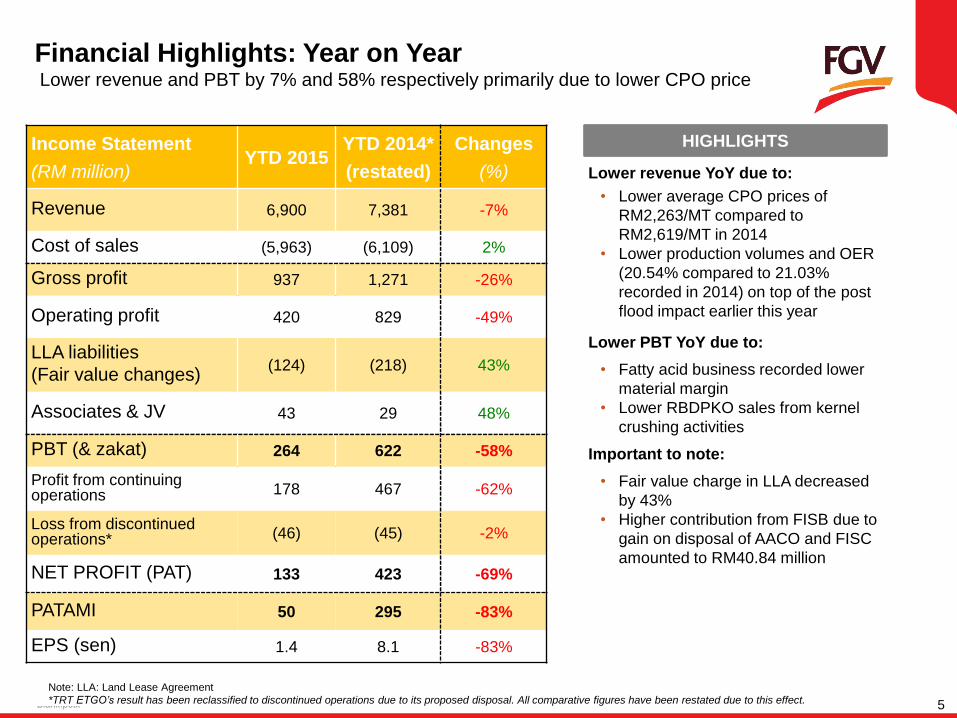
Financial Highlights: Year on Year Lower revenue and PBT by 7% and 58% respectively primarily due to lower CPO price
Lower revenue YoY due to:
• Lower average CPO prices of
RM2,263/MT compared to
RM2,619/MT in 2014
• Lower production volumes and OER
(20.54% compared to 21.03%
recorded in 2014) on top of the post
flood impact earlier this year
Lower PBT YoY due to:
• Fatty acid business recorded lower
material margin
• Lower RBDPKO sales from kernel
crushing activities
Important to note:
• Fair value charge in LLA decreased
by 43%
• Higher contribution from FISB due to
gain on disposal of AACO and FISC
amounted to RM40.84 million
Income Statement
(RM million) YTD 2015
YTD 2014*
(restated)
Changes
(%)
Revenue 6,900 7,381 -7%
Cost of sales (5,963) (6,109) 2%
Gross profit 937 1,271 -26%
Operating profit 420 829 -49%
LLA liabilities
(Fair value changes) (124) (218) 43%
Associates & JV 43 29 48%
PBT (& zakat) 264 622 -58%
Profit from continuing operations 178 467 -62%
Loss from discontinued operations* (46) (45) -2%
NET PROFIT (PAT) 133 423 -69%
PATAMI 50 295 -83%
EPS (sen) 1.4 8.1 -83%
HIGHLIGHTS
Note: LLA: Land Lease Agreement
*TRT ETGO’s result has been reclassified to discontinued operations due to its proposed disposal. All comparative figures have been restated due to this effect.
Blank.potx 6
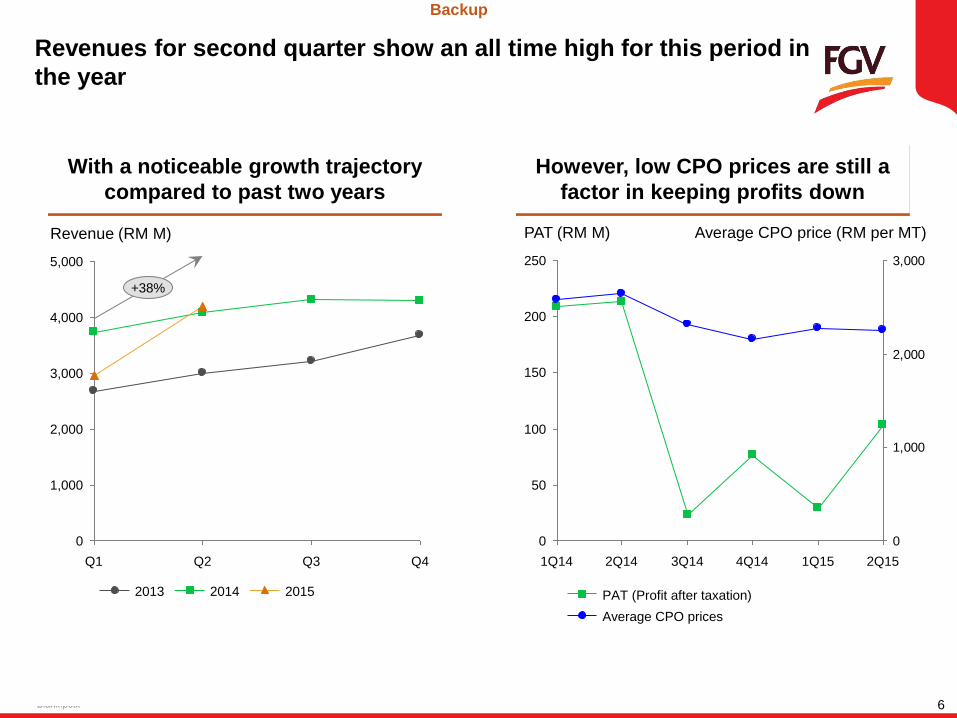
Revenues for second quarter show an all time high for this period in
the year
2,000
3,000
1,000
0
4,000
5,000
+38%
Q1 Q4 Q3 Q2
Revenue (RM M)
2013 2015 2014
With a noticeable growth trajectory
compared to past two years
However, low CPO prices are still a
factor in keeping profits down
0
1,000
2,000
3,000
150
50
100
200
0
250
4Q14 2Q14 1Q14
Average CPO price (RM per MT) PAT (RM M)
3Q14 2Q15 1Q15
PAT (Profit after taxation)
Average CPO prices
Backup
Blank.potx 7
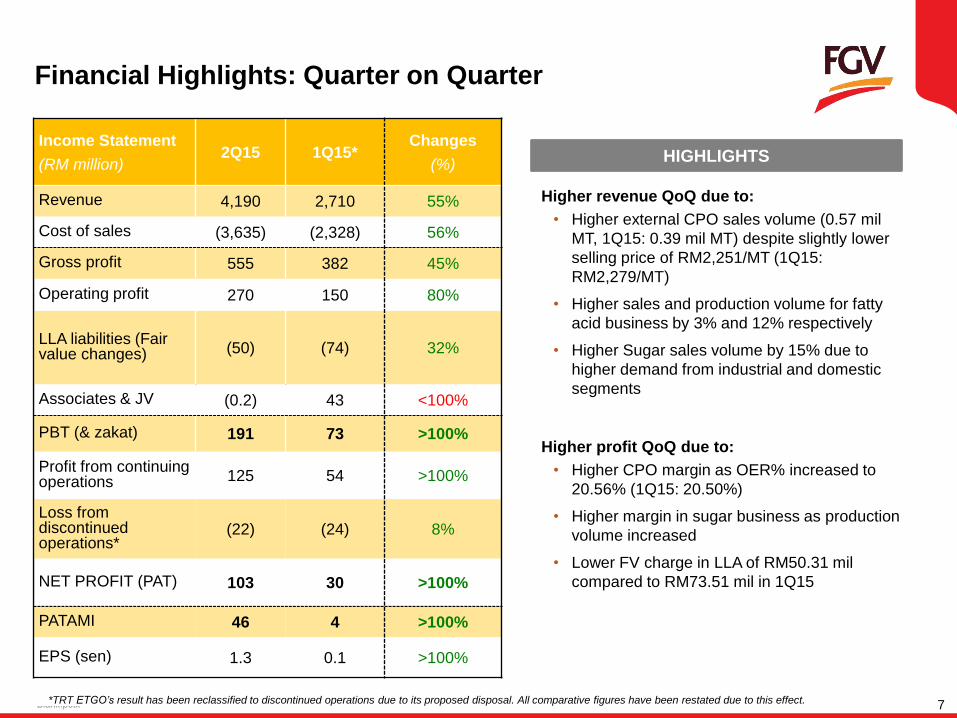
Financial Highlights: Quarter on Quarter
Higher revenue QoQ due to:
• Higher external CPO sales volume (0.57 mil
MT, 1Q15: 0.39 mil MT) despite slightly lower
selling price of RM2,251/MT (1Q15:
RM2,279/MT)
• Higher sales and production volume for fatty
acid business by 3% and 12% respectively
• Higher Sugar sales volume by 15% due to
higher demand from industrial and domestic
segments
Higher profit QoQ due to:
• Higher CPO margin as OER% increased to
20.56% (1Q15: 20.50%)
• Higher margin in sugar business as production
volume increased
• Lower FV charge in LLA of RM50.31 mil
compared to RM73.51 mil in 1Q15
Income Statement
(RM million) 2Q15 1Q15*
Changes
(%)
Revenue 4,190 2,710 55%
Cost of sales (3,635) (2,328) 56%
Gross profit 555 382 45%
Operating profit 270 150 80%
LLA liabilities (Fair value changes) (50) (74) 32%
Associates & JV (0.2) 43 <100%
PBT (& zakat) 191 73 >100%
Profit from continuing operations 125 54 >100%
Loss from discontinued operations*
(22) (24) 8%
NET PROFIT (PAT) 103 30 >100%
PATAMI 46 4 >100%
EPS (sen) 1.3 0.1 >100%
HIGHLIGHTS
*TRT ETGO’s result has been reclassified to discontinued operations due to its proposed disposal. All comparative figures have been restated due to this effect.

Blank.potx 8
EBITDA YTD Q2 2015 vs YTD Q2 2014 Lower EBITDA of RM524m vs RM825m in 2014
Reconciliation YTD Q2 2015
RM million
YTD Q2 2014
RM million
Var
%
EBITDA Reconciliation
Operating profit 420 829 (49)
add: Share of results 43 29 48
add : Depreciation 222 210 6
Others - other (losses)/gains (5) (28) 82
add: EBITDA for Discontinued operation (26) (44) 41
EBITDA (exclude LLA) 654 996 (34)
less: Cash Paid (130) (171) 24
EBITDA (after cash LLA) 524 825 (36)
PATAMI Reconciliation
PATAMI 50 295 (83)
Net LLA 93 163 (43)
less: Cash Paid (130) (171) 24
Adjusted PATAMI 13 287 (95)

Blank.potx 9
CORE PROFIT DEFINITION :
Core net profit relates to the net profit after minority interests excluding one-off item (that are not recurring). The purpose is to find out the recurring operating profit of the
group . The non-recurring will include items like (1) non operational related forex gains; (2) one-off gain from sale of shares/assets; (3) LLA and (4) potentially any one-off
provisions or gains etc.
Core Profit Reconciliation
Q2 15
RM million
Q1 2015
RM million
YTD Q2 2015
RM million
YTD Q2 2014
RM million
PATAMI 46 4 50 295
LLA (credit) / charge, net of tax 38 55 93 163
Reversal FINA Impairment - - - (27)
Realised loss on sales of FINA - - - 18
Gain on disposal of AACO - (29) (29) -
Gain on disposal of FISC - (12) (12) -
Others - - - (33)
Total adjustment 38 14 52 121
Adjusted PATAMI 84 18 102 416
Less: LLA cash paid (68) (62) (130) (171)
CORE PROFIT 16 (44) (28) 245
Core Profit Increase in Core Profit to RM16m compared to loss of RM44m in Q1 2015

Blank.potx 10
Key Performance Highlights and Ratios
* Gearing ratio equals to Borrowings, Loan due to a significant shareholder, LLA liability (in Current Liabilities and Non-Current Liabilities) divided by Shareholders’ Fund.
UOM 30 June 15 31 Dec 14 Growth (%)
Total Assets RM million 21,247 20,723 3%
Total Liabilities RM million 12,451 11,900 -4%
Cash and Cash Equivalents RM million 2,265 3,673 -38%
Net Tangible Assets (NTA) per Share RM 1.30 1.33 -2%
Earning per Share (EPS) sen 1.4 8.9 -85%
Return on Shareholders' Fund
(ROSF) % 0.8 5.1 -85%
Liquidity Ratio % 1.50 1.66 -10%
Gearing Ratio * % 1.47 1.47 -
Gearing Ratio (excluding LLA) % 0.72 0.74 -2%
11
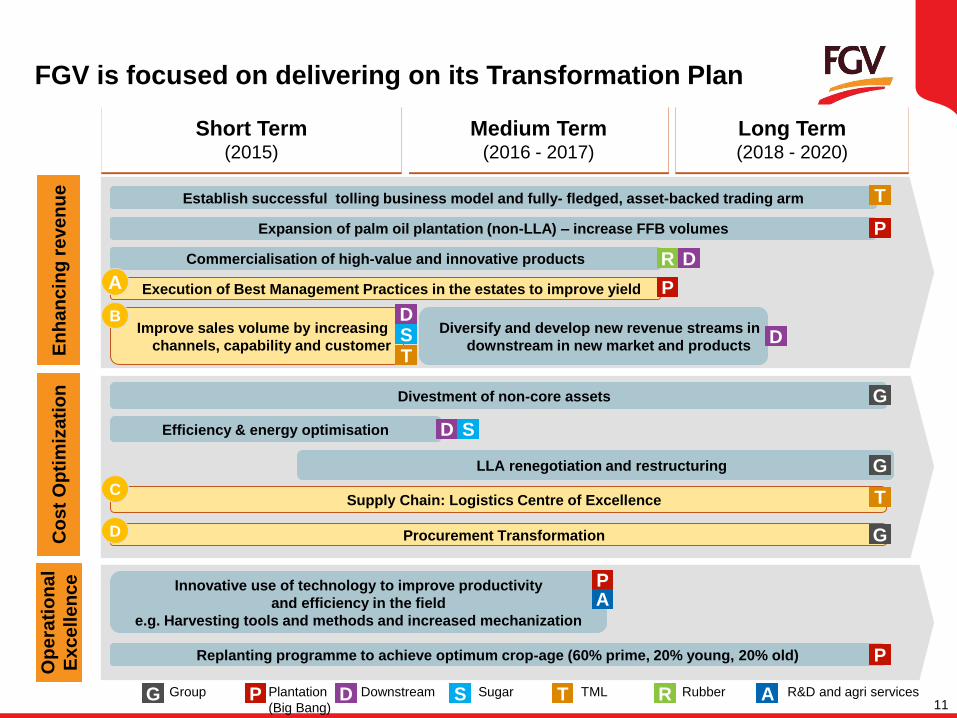
FGV is focused on delivering on its Transformation Plan
Short Term (2015)
Medium Term (2016 - 2017)
Long Term (2018 - 2020)
Op
era
tio
na
l
Excell
en
ce
E
nh
an
cin
g r
eve
nu
e
Co
st
Op
tim
izati
on
Establish successful tolling business model and fully- fledged, asset-backed trading arm
Expansion of palm oil plantation (non-LLA) – increase FFB volumes
Commercialisation of high-value and innovative products
Execution of Best Management Practices in the estates to improve yield
Improve sales volume by increasing
channels, capability and customer
Diversify and develop new revenue streams in
downstream in new market and products
Divestment of non-core assets
Supply Chain: Logistics Centre of Excellence
Procurement Transformation
LLA renegotiation and restructuring
Efficiency & energy optimisation
Innovative use of technology to improve productivity
and efficiency in the field
e.g. Harvesting tools and methods and increased mechanization
Replanting programme to achieve optimum crop-age (60% prime, 20% young, 20% old)
T
P
D
T
G
G
G
D
D
P
P
S
R
T
D
P
S
A
T G S R D A P Plantation
(Big Bang)
Group Downstream Sugar TML R&D and agri services Rubber
B
D
A
C
12
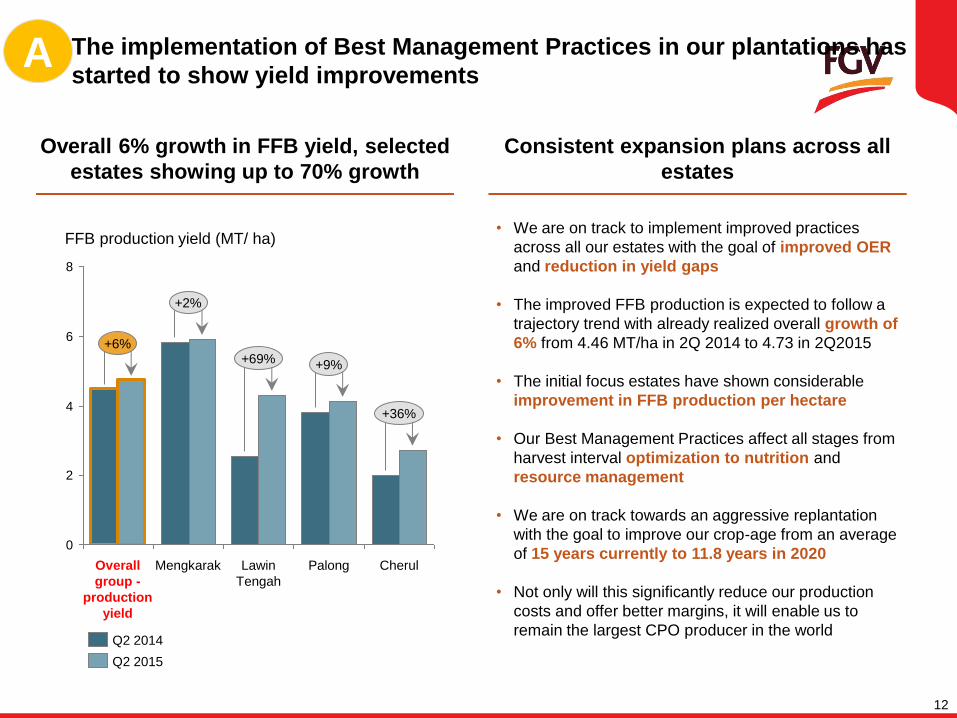
The implementation of Best Management Practices in our plantations has
started to show yield improvements
Consistent expansion plans across all
estates
• We are on track to implement improved practices
across all our estates with the goal of improved OER
and reduction in yield gaps
• The improved FFB production is expected to follow a
trajectory trend with already realized overall growth of
6% from 4.46 MT/ha in 2Q 2014 to 4.73 in 2Q2015
• The initial focus estates have shown considerable
improvement in FFB production per hectare
• Our Best Management Practices affect all stages from
harvest interval optimization to nutrition and
resource management
• We are on track towards an aggressive replantation
with the goal to improve our crop-age from an average
of 15 years currently to 11.8 years in 2020
• Not only will this significantly reduce our production
costs and offer better margins, it will enable us to
remain the largest CPO producer in the world
Overall 6% growth in FFB yield, selected
estates showing up to 70% growth
A
0
2
4
6
8
Cherul
+36%
+9%
Palong
+69% +6%
+2%
FFB production yield (MT/ ha)
Overall
group -
production
yield
Mengkarak Lawin
Tengah
Q2 2015
Q2 2014
13
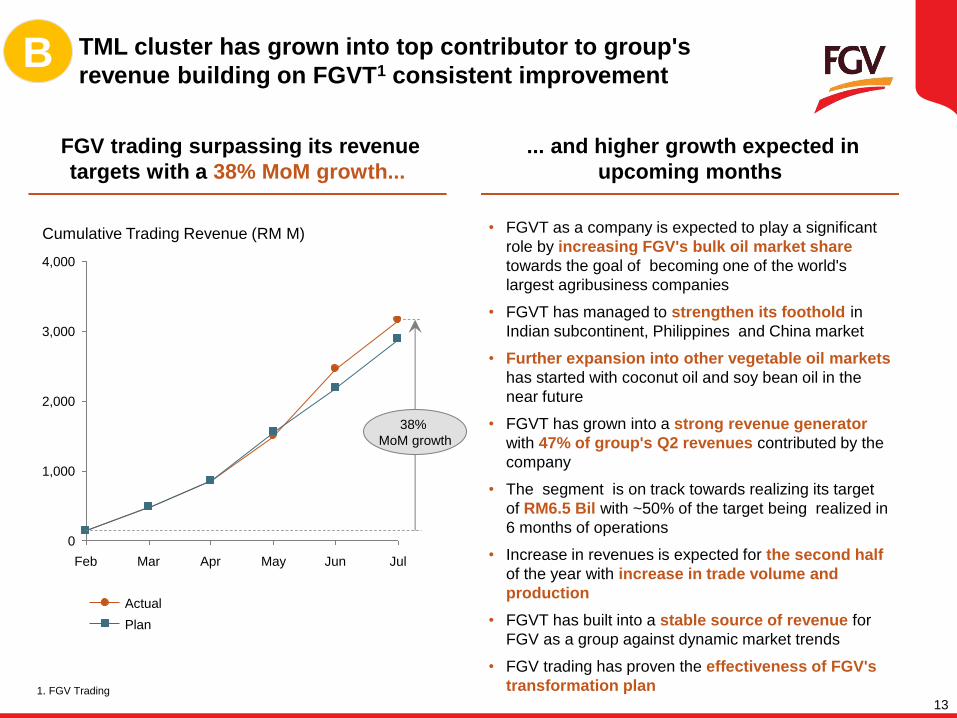
TML cluster has grown into top contributor to group's
revenue building on FGVT1 consistent improvement
... and higher growth expected in
upcoming months
• FGVT as a company is expected to play a significant
role by increasing FGV's bulk oil market share
towards the goal of becoming one of the world's
largest agribusiness companies
• FGVT has managed to strengthen its foothold in
Indian subcontinent, Philippines and China market
• Further expansion into other vegetable oil markets
has started with coconut oil and soy bean oil in the
near future
• FGVT has grown into a strong revenue generator
with 47% of group's Q2 revenues contributed by the
company
• The segment is on track towards realizing its target
of RM6.5 Bil with ~50% of the target being realized in
6 months of operations
• Increase in revenues is expected for the second half
of the year with increase in trade volume and
production
• FGVT has built into a stable source of revenue for
FGV as a group against dynamic market trends
• FGV trading has proven the effectiveness of FGV's
transformation plan
FGV trading surpassing its revenue
targets with a 38% MoM growth...
B
1. FGV Trading
4,000
3,000
2,000
1,000
0
Jul Jun May Apr
Cumulative Trading Revenue (RM M)
38%
MoM growth
Feb Mar
Plan
Actual
14
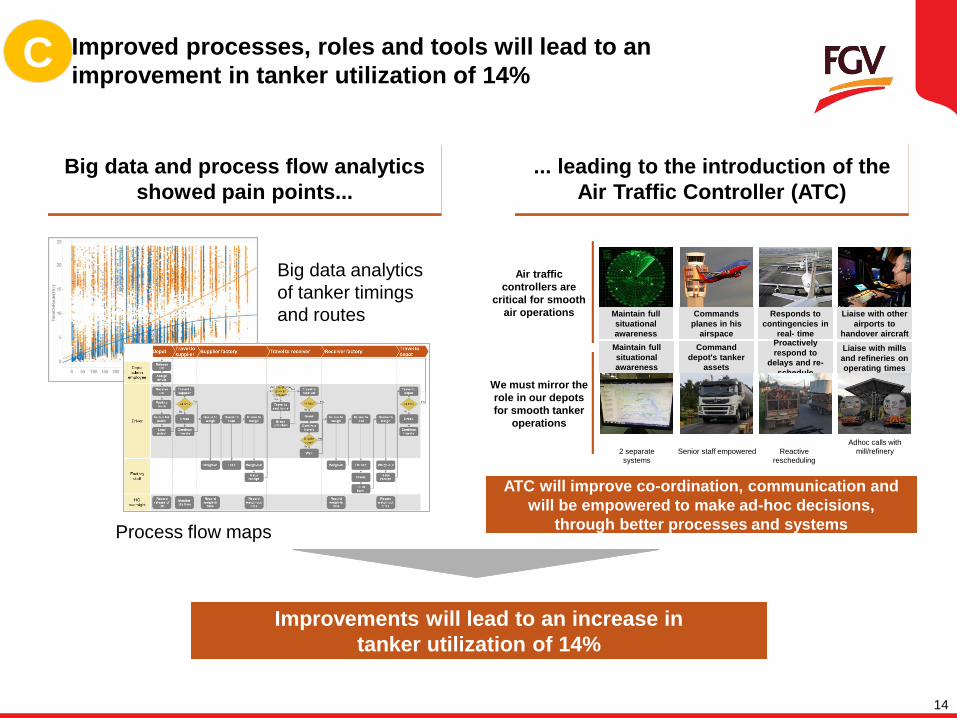
Improved processes, roles and tools will lead to an
improvement in tanker utilization of 14% C
Big data and process flow analytics
showed pain points...
... leading to the introduction of the
Air Traffic Controller (ATC)
Improvements will lead to an increase in
tanker utilization of 14%
Maintain full
situational
awareness
Commands
planes in his
airspace
Responds to
contingencies in
real- time
Liaise with other
airports to
handover aircraft
Maintain full
situational
awareness
Command
depot's tanker
assets
Proactively
respond to
delays and re-
schedule
Liaise with mills
and refineries on
operating times
2 separate
systems
Air traffic
controllers are
critical for smooth
air operations
We must mirror the
role in our depots
for smooth tanker
operations
Senior staff empowered Reactive
rescheduling
Adhoc calls with
mill/refinery
ATC will improve co-ordination, communication and
will be empowered to make ad-hoc decisions,
through better processes and systems
Big data analytics
of tanker timings
and routes
Process flow maps
15
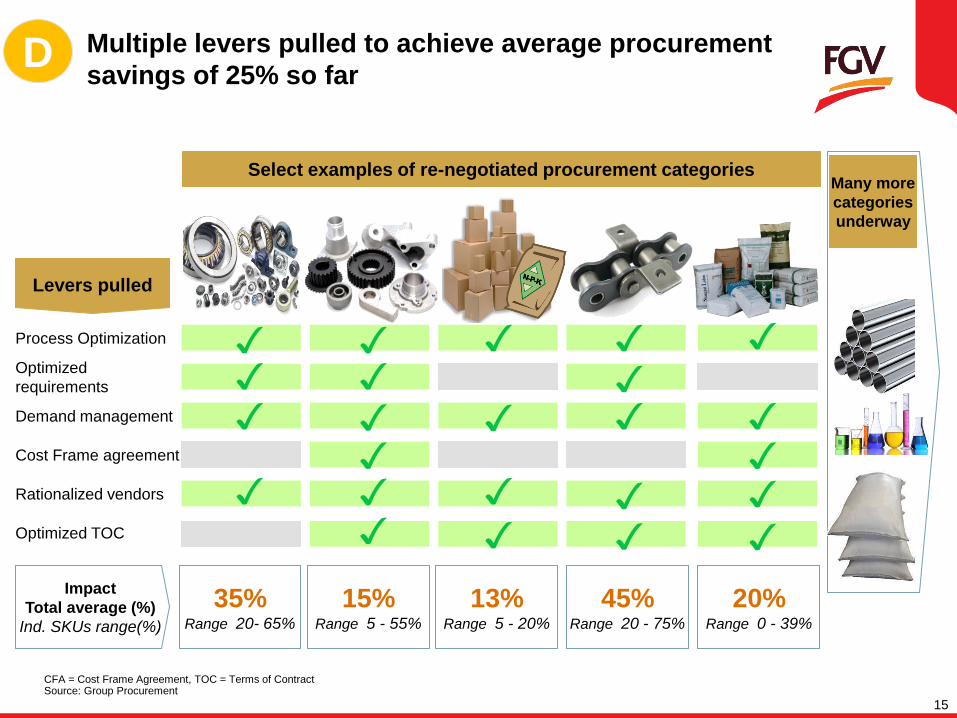
CFA = Cost Frame Agreement, TOC = Terms of Contract Source: Group Procurement
Levers pulled
Impact
Total average (%)
Ind. SKUs range(%)
Select examples of re-negotiated procurement categories Many more
categories
underway
35% Range 20- 65%
15% Range 5 - 55%
13% Range 5 - 20%
20% Range 0 - 39%
45% Range 20 - 75%
Process Optimization
Rationalized vendors
Optimized
requirements
Demand management
Cost Frame agreement
Optimized TOC
D Multiple levers pulled to achieve average procurement
savings of 25% so far
✓ ✓ ✓
✓
✓ ✓ ✓ ✓ ✓ ✓
✓
✓
✓
✓
✓ ✓ ✓
✓ ✓
✓
✓ ✓ ✓ ✓
Performance by Clusters
Blank.potx 17
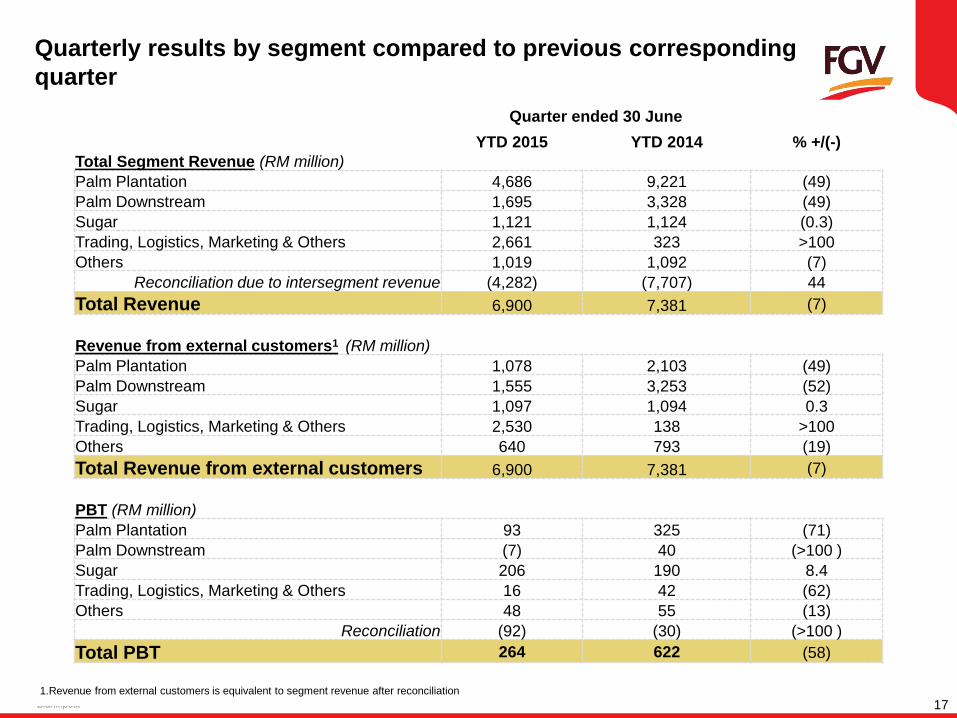
Quarterly results by segment compared to previous corresponding
quarter
Quarter ended 30 June
YTD 2015
YTD 2014
% +/(-)
Total Segment Revenue (RM million)
Palm Plantation 4,686 9,221 (49)
Palm Downstream 1,695 3,328 (49)
Sugar 1,121 1,124 (0.3)
Trading, Logistics, Marketing & Others 2,661 323 >100
Others 1,019 1,092 (7)
Reconciliation due to intersegment revenue (4,282) (7,707) 44
Total Revenue 6,900 7,381 (7)
Revenue from external customers1 (RM million)
Palm Plantation 1,078 2,103 (49)
Palm Downstream 1,555 3,253 (52)
Sugar 1,097 1,094 0.3
Trading, Logistics, Marketing & Others 2,530 138 >100
Others 640 793 (19)
Total Revenue from external customers 6,900 7,381 (7)
PBT (RM million)
Palm Plantation 93 325 (71)
Palm Downstream (7) 40 (>100 )
Sugar 206 190 8.4
Trading, Logistics, Marketing & Others 16 42 (62)
Others 48 55 (13)
Reconciliation (92) (30) (>100 )
Total PBT 264 622 (58)
1.Revenue from external customers is equivalent to segment revenue after reconciliation
Blank.potx 18
533 544
-49%
-57%
-2%
2,103
1,078 1,230
94-2
15793
325
-71%
>100% -40%
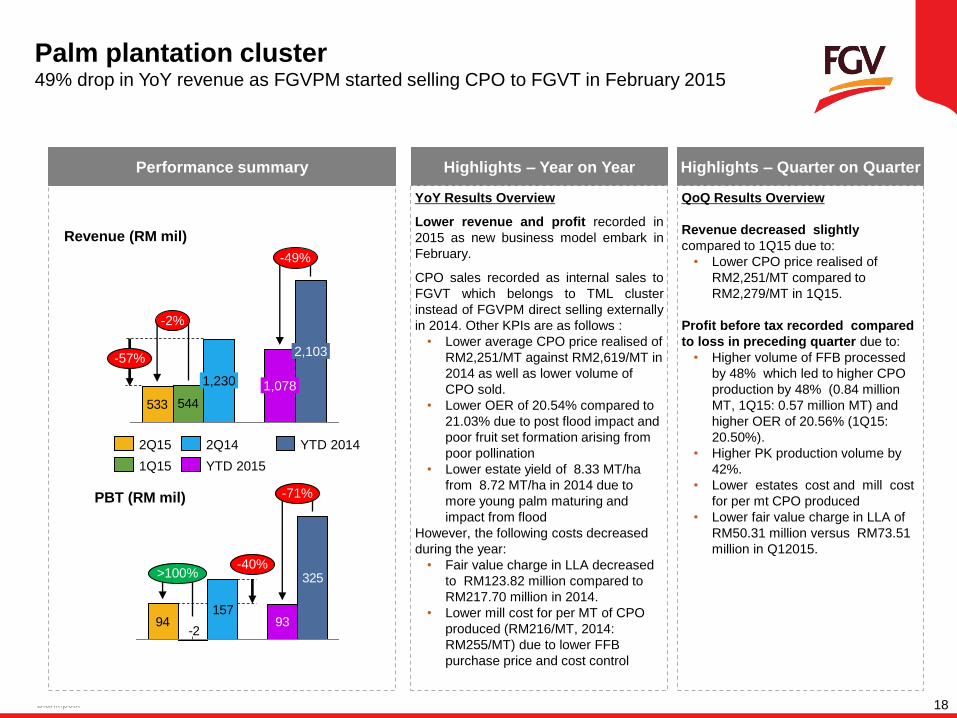
Palm plantation cluster 49% drop in YoY revenue as FGVPM started selling CPO to FGVT in February 2015
Performance summary
YoY Results Overview
Lower revenue and profit recorded in
2015 as new business model embark in
February.
CPO sales recorded as internal sales to
FGVT which belongs to TML cluster
instead of FGVPM direct selling externally
in 2014. Other KPIs are as follows :
• Lower average CPO price realised of
RM2,251/MT against RM2,619/MT in
2014 as well as lower volume of
CPO sold.
• Lower OER of 20.54% compared to
21.03% due to post flood impact and
poor fruit set formation arising from
poor pollination
• Lower estate yield of 8.33 MT/ha
from 8.72 MT/ha in 2014 due to
more young palm maturing and
impact from flood
However, the following costs decreased
during the year:
• Fair value charge in LLA decreased
to RM123.82 million compared to
RM217.70 million in 2014.
• Lower mill cost for per MT of CPO
produced (RM216/MT, 2014:
RM255/MT) due to lower FFB
purchase price and cost control
Highlights – Year on Year
QoQ Results Overview
Revenue decreased slightly
compared to 1Q15 due to:
• Lower CPO price realised of
RM2,251/MT compared to
RM2,279/MT in 1Q15.
Profit before tax recorded compared
to loss in preceding quarter due to:
• Higher volume of FFB processed
by 48% which led to higher CPO
production by 48% (0.84 million
MT, 1Q15: 0.57 million MT) and
higher OER of 20.56% (1Q15:
20.50%).
• Higher PK production volume by
42%.
• Lower estates cost and mill cost
for per mt CPO produced
• Lower fair value charge in LLA of
RM50.31 million versus RM73.51
million in Q12015.
Highlights – Quarter on Quarter
Revenue (RM mil)
PBT (RM mil)
YTD 2014 2Q14
YTD 2015 1Q15
2Q15
Blank.potx 19
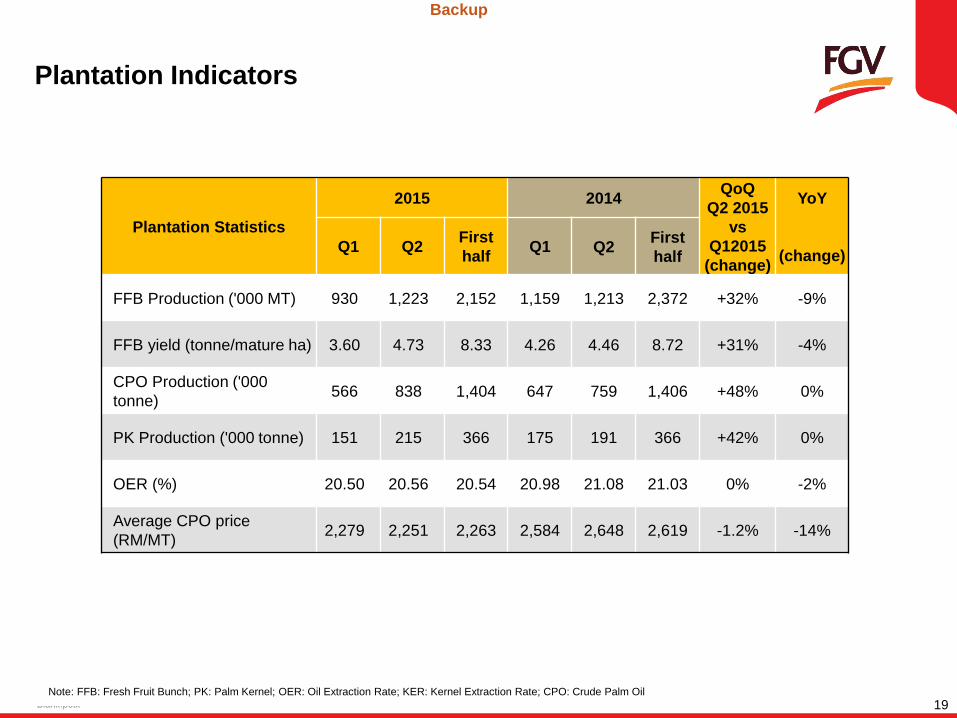
Plantation Indicators
Note: FFB: Fresh Fruit Bunch; PK: Palm Kernel; OER: Oil Extraction Rate; KER: Kernel Extraction Rate; CPO: Crude Palm Oil
Plantation Statistics
2015 2014 QoQ
Q2 2015
vs
Q12015
(change)
YoY
(change) Q1 Q2
First
half Q1 Q2
First
half
FFB Production ('000 MT) 930 1,223 2,152 1,159 1,213 2,372 +32% -9%
FFB yield (tonne/mature ha) 3.60 4.73 8.33 4.26 4.46 8.72 +31% -4%
CPO Production ('000
tonne) 566 838 1,404 647 759 1,406 +48% 0%
PK Production ('000 tonne) 151 215 366 175 191 366 +42% 0%
OER (%) 20.50 20.56 20.54 20.98 21.08 21.03 0% -2%
Average CPO price
(RM/MT) 2,279 2,251 2,263 2,584 2,648 2,619 -1.2% -14%
Backup
Blank.potx 20
15
-22
17
-7
40
<100%
>100%
-12%
708 847
-57% -16%
-52%
3,253
1,555 1,631
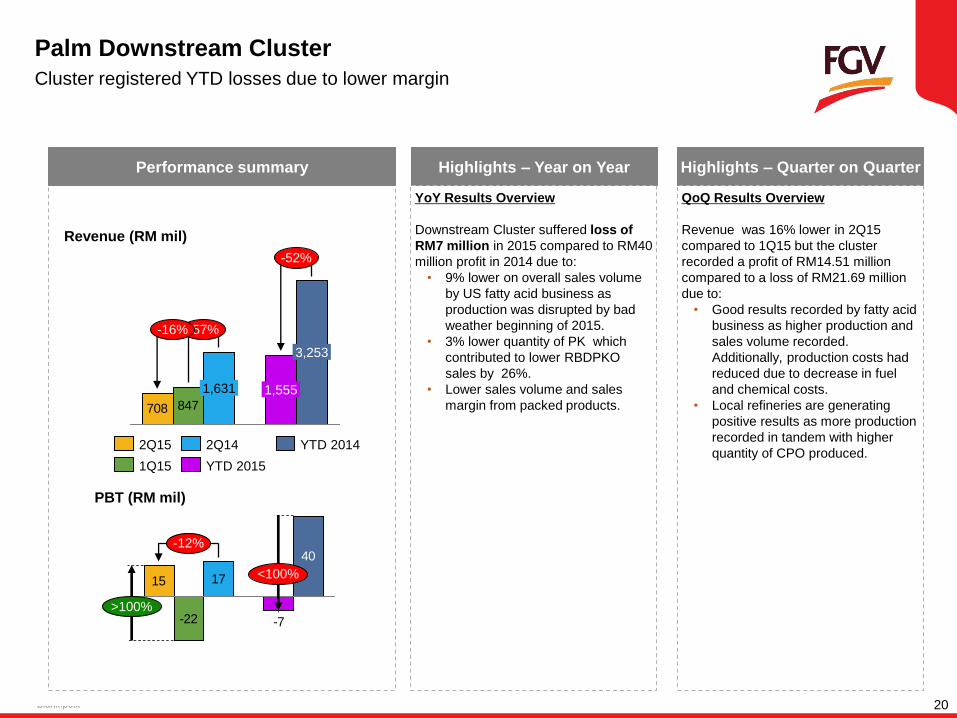
Palm Downstream Cluster
Cluster registered YTD losses due to lower margin
Performance summary
YoY Results Overview
Downstream Cluster suffered loss of
RM7 million in 2015 compared to RM40
million profit in 2014 due to:
• 9% lower on overall sales volume
by US fatty acid business as
production was disrupted by bad
weather beginning of 2015.
• 3% lower quantity of PK which
contributed to lower RBDPKO
sales by 26%.
• Lower sales volume and sales
margin from packed products.
Highlights – Year on Year
QoQ Results Overview
Revenue was 16% lower in 2Q15
compared to 1Q15 but the cluster
recorded a profit of RM14.51 million
compared to a loss of RM21.69 million
due to:
• Good results recorded by fatty acid
business as higher production and
sales volume recorded.
Additionally, production costs had
reduced due to decrease in fuel
and chemical costs.
• Local refineries are generating
positive results as more production
recorded in tandem with higher
quantity of CPO produced.
Highlights – Quarter on Quarter
Revenue (RM mil)
PBT (RM mil)
YTD 2014 2Q14
YTD 2015 1Q15
2Q15
Blank.potx 21
588 508 595
1,094+16% 1,097
-1%
0%
11392 111
206 190
+2%
+23%
+8%
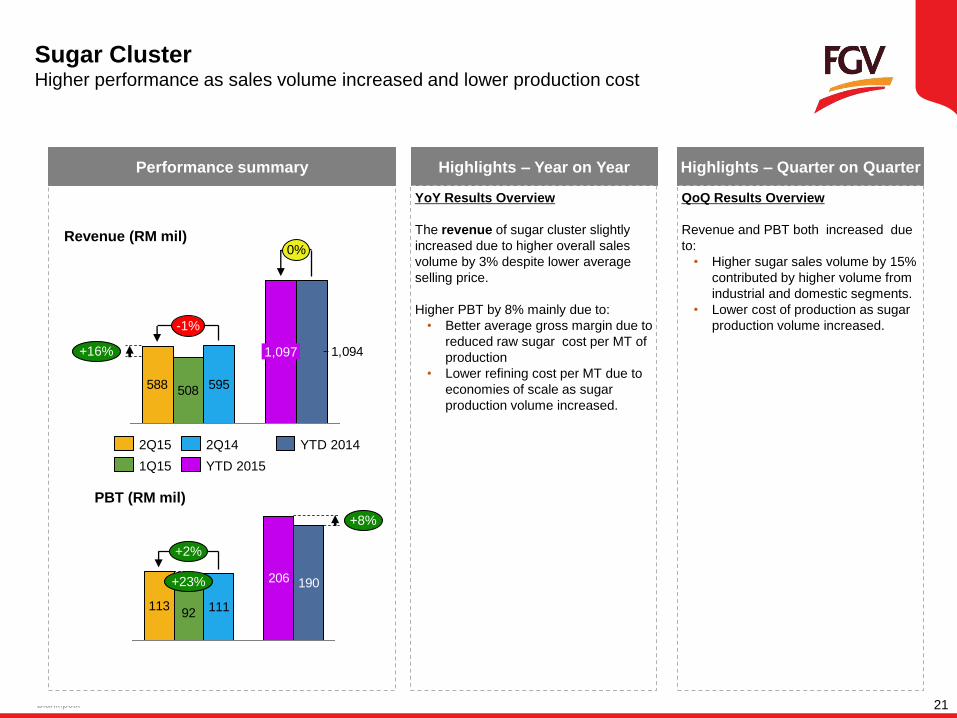
Sugar Cluster Higher performance as sales volume increased and lower production cost
Performance summary
YoY Results Overview
The revenue of sugar cluster slightly
increased due to higher overall sales
volume by 3% despite lower average
selling price.
Higher PBT by 8% mainly due to:
• Better average gross margin due to
reduced raw sugar cost per MT of
production
• Lower refining cost per MT due to
economies of scale as sugar
production volume increased.
Highlights – Year on Year
QoQ Results Overview
Revenue and PBT both increased due
to:
• Higher sugar sales volume by 15%
contributed by higher volume from
industrial and domestic segments.
• Lower cost of production as sugar
production volume increased.
Highlights – Quarter on Quarter
Revenue (RM mil)
PBT (RM mil)
YTD 2015
2Q15 YTD 2014
1Q15
2Q14
Blank.potx 22
543 31
1,987
>100%
138
2,530 >100%
>100%
16
20
16
43
<100%
<100%
-63%
-0.02
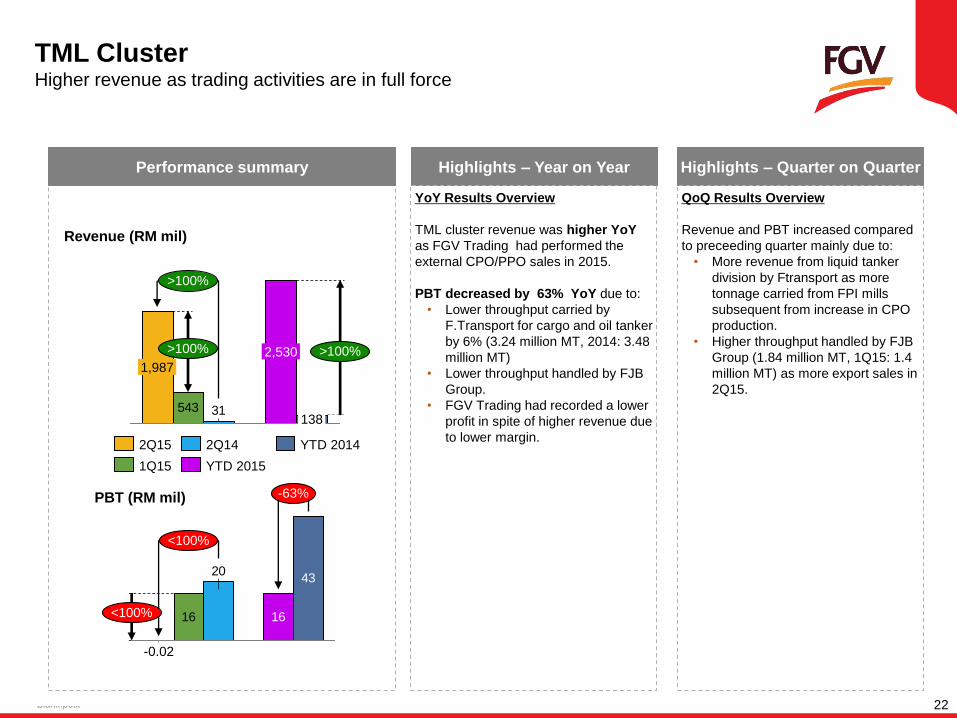
TML Cluster Higher revenue as trading activities are in full force
Performance summary
YoY Results Overview
TML cluster revenue was higher YoY
as FGV Trading had performed the
external CPO/PPO sales in 2015.
PBT decreased by 63% YoY due to:
• Lower throughput carried by
F.Transport for cargo and oil tanker
by 6% (3.24 million MT, 2014: 3.48
million MT)
• Lower throughput handled by FJB
Group.
• FGV Trading had recorded a lower
profit in spite of higher revenue due
to lower margin.
Highlights – Year on Year
QoQ Results Overview
Revenue and PBT increased compared
to preceeding quarter mainly due to:
• More revenue from liquid tanker
division by Ftransport as more
tonnage carried from FPI mills
subsequent from increase in CPO
production.
• Higher throughput handled by FJB
Group (1.84 million MT, 1Q15: 1.4
million MT) as more export sales in
2Q15.
Highlights – Quarter on Quarter
Revenue (RM mil)
PBT (RM mil)
YTD 2014 2Q14
1Q15
2Q15
YTD 2015
Blank.potx 23
366268
383
635787
-4% +36%
-19%
2127 30
4855
-29% -20%
-12%
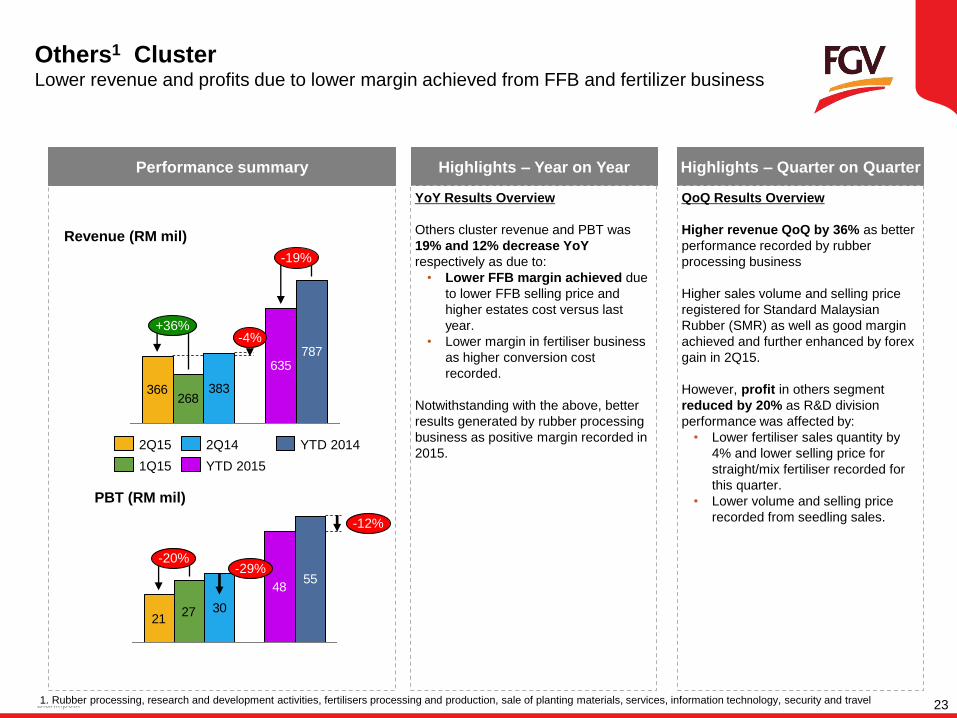
Others1 Cluster Lower revenue and profits due to lower margin achieved from FFB and fertilizer business
Performance summary
YoY Results Overview
Others cluster revenue and PBT was
19% and 12% decrease YoY
respectively as due to:
• Lower FFB margin achieved due
to lower FFB selling price and
higher estates cost versus last
year.
• Lower margin in fertiliser business
as higher conversion cost
recorded.
Notwithstanding with the above, better
results generated by rubber processing
business as positive margin recorded in
2015.
Highlights – Year on Year
QoQ Results Overview
Higher revenue QoQ by 36% as better
performance recorded by rubber
processing business
Higher sales volume and selling price
registered for Standard Malaysian
Rubber (SMR) as well as good margin
achieved and further enhanced by forex
gain in 2Q15.
However, profit in others segment
reduced by 20% as R&D division
performance was affected by:
• Lower fertiliser sales quantity by
4% and lower selling price for
straight/mix fertiliser recorded for
this quarter.
• Lower volume and selling price
recorded from seedling sales.
Highlights – Quarter on Quarter
Revenue (RM mil)
PBT (RM mil)
2Q14
YTD 2015
YTD 2014
1Q15
2Q15
1. Rubber processing, research and development activities, fertilisers processing and production, sale of planting materials, services, information technology, security and travel

Appendix
Blank.potx 25
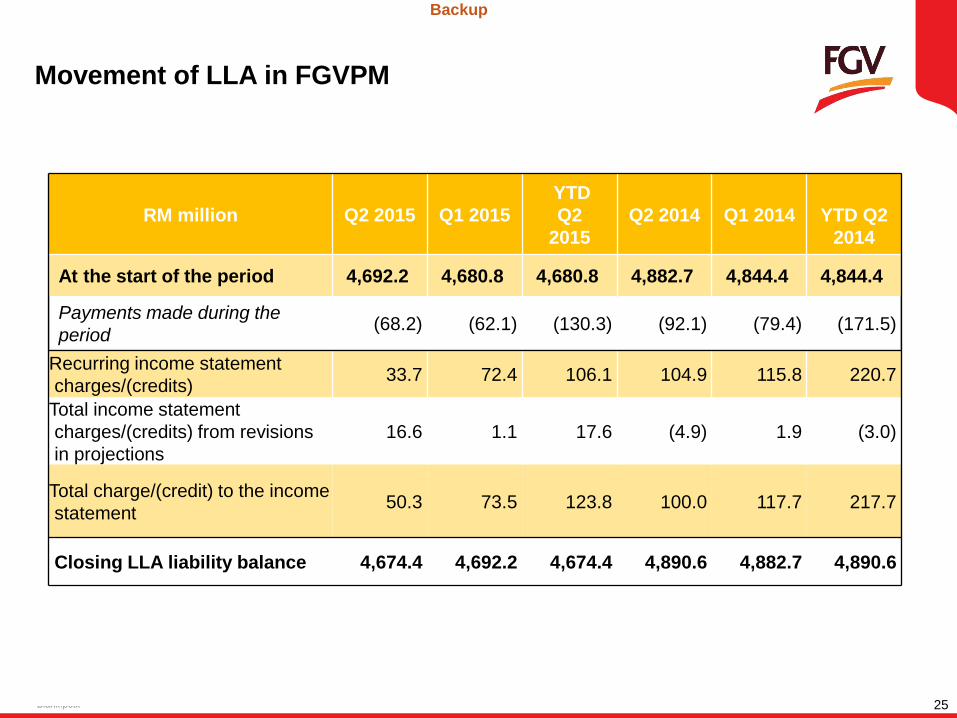
Movement of LLA in FGVPM
RM million Q2 2015 Q1 2015
YTD
Q2
2015
Q2 2014
Q1 2014
YTD Q2
2014
At the start of the period 4,692.2 4,680.8 4,680.8 4,882.7 4,844.4 4,844.4
Payments made during the
period (68.2) (62.1) (130.3) (92.1) (79.4) (171.5)
Recurring income statement
charges/(credits) 33.7 72.4 106.1 104.9 115.8 220.7
Total income statement
charges/(credits) from revisions
in projections
16.6 1.1 17.6 (4.9) 1.9 (3.0)
Total charge/(credit) to the income
statement 50.3 73.5 123.8 100.0 117.7 217.7
Closing LLA liability balance 4,674.4 4,692.2 4,674.4 4,890.6 4,882.7 4,890.6
Backup
Blank.potx 26
Presented by
Tn. Hj Ahmad Tifli Dato’ Mohd Talha
Group Chief Financial Officer
Financial Results Analyst Briefing
2nd Quarter for the
Financial Period Ended 30 June 2015 24 August 2015