financial management in selected public...
TRANSCRIPT

i
FINANCIAL MANAGEMENT
IN SELECTED PUBLIC PRIMARY SCHOOLS IN GAUTENG
by
BHARATHI NAIDOO
Submitted in accordance with the requirements
for the degree of
MASTER OF EDUCATION
in the subject
EDUCATION MANAGEMENT
at the
UNIVERSITY OF SOUTH AFRICA
SUPERVISOR: PROF A E VAN ZYL
JUNE 2010

ii
DECLARATION
I declare that Financial Management in Selected Public Primary Schools in Gauteng is my
own work and that all the sources that I have used or quoted have been indicated and
acknowledged by means of complete references.
_________________________
B. Naidoo
February 2010

iii
ACKNOWLEDGEMENTS
I wish to express my gratitude to the under-mentioned for their assistance in this research
project:
• To God for giving me the knowledge, wisdom and strength to complete this
dissertation.
• My husband, Prakash, for his motivation, assistance and support.
• My daughters, Talira, for her assistance in the preparation of the graphs, and Tamiraa
and Akira for their support and understanding during my studies.
• My supervisor, Prof. A.E. van Zyl for his invaluable assistance and guidance.
• Prof. M. Dhurup for his inspiration, guidance and advice.
• Mr. S.N. Chetty (Department of Education Ekurhuleni South District) for his
assistance.
• Principals and members of School Governing Bodies (Ekurhuleni South District) for
completing the questionnaires.
• My family and friends for their encouragement and continued support throughout my
period of study.

iv
SUMMARY
The implementation of the South African Schools Act (Act 84 of 1996) has placed additional
financial management responsibilities on school principals and school governing bodies.
Financial management has created several challenges for school principals and members of
school governing bodies who do not have the necessary financial knowledge, skill and
expertise to perform this function.
This research was undertaken primarily to determine how principals and members of school
governing bodies, in public primary schools, implement financial policy. The research is
supported by a detailed literature study covering financial policy, the budget process,
approaches to budgeting, the advantages of a budget system and requirements for effective
financial control.
In order to determine the financial management practices at public primary schools a
questionnaire was designed and administered amongst twenty five public primary schools in
the Ekurhuleni South District of the Gauteng Department of Education.
The findings suggest that there is a need for schools to communicate resolutions adopted at
parents’ meetings and other consultative procedures to parents of learners and in this way
ensure the dissemination of pertinent information. There is a need for early intervention by
schools concerning outstanding school fees to prevent the exacerbation of the problem.
Educational institutions should prepare their budgets on the basis of their main objectives and
policies in order to ensure an efficient allocation of funds...
KEY TERMS
budgeting, school governing body, school fees, financial policy, financial planning, Gauteng
Department of Education (GDE), South African Schools Act (SASA), public primary schools

v
TABLE OF CONTENTS
CHAPTER 1 INTRODUCTION AND PROBLEM
ORIENTATION
PAGE
1.1 Introduction 1
1.2 Motivation for research 4
1.3 Description of problem and problem formulation 7
1.4 Aims of the Research 9
1.5 Hypotheses 9
1.6 Research Approach and Methods 10
1.6.1 Introduction 10
1.6.2 Research Approach 10
1.6.3 Research Design 10
1.6.4 Research Method 11
1.6.4.1 Literature Study 11
1.6.4.2 Questionnaire 11
1.6.5 Data Analysis 12
1.6.6 Population 13
1.6.7 Sampling Method and Procedure 13
1.7 Validity and Reliability 14
1.8 Area of Study 14
1.9 Ethical Measures 15
1.10 Definition of Terms 16
1.11 Classification of Chapters 18
CHAPTER 2 LITERATURE REVIEW ON FINANCIAL
MANAGEMENT IN SELECTED PUBLIC
PRIMARY SCHOOLS
2.1 Introduction 19
2.2 Financial Policy 19
2.3 Budgeting 22
2.3.1 The Concept of Budgeting 22
2.3.2 Fundamental Assumptions in Budgeting 25

vi
2.3.3 Functions of a Budget 26
2.3.4 The Budget Process 28
2.3.5 The Advantages of a Budget System 30
2.3.6 The Relationship between Planning and Budgeting 31
2.3.7 Approaches to Budgeting 34
2.3.7.1 Incremental Budgeting 35
2.3.7.2 Line Item Budgeting 35
2.3.7.3 Program Budgeting 37
2.3.7.4 Program, Planning and Budgeting System 37
2.3.7.5 Zero Based Budgeting 38
2.3.7.6 School Site Budgeting 41
2.3.8 Budget Profiling 42
2.4 Requirements for Effective Financial Control 42
2.5 Summary 45
CHAPTER 3 RESEACH DESIGN AND METHODOLOGY
3.1 Introduction 46
3.2 The Sampling Design Procedure 47
3.2.1 Defining the Population 47
3.2.2 Identifying the Sample Frame 48
3.2.3 Selecting the Sampling Technique 48
3.2.4 Determining the Sample Size 49
3.2.5 Selecting the Sample Elements 50
3.3 Data Collection Method and Measuring Instrument 51
3.4 Pilot Questionnaire 52
3.5 Validity and Reliability 53
3.6 Data and Statistical Analysis 57
3.7 Application of Research Ethics 58
3.8 Summary 59

vii
CHAPTER 4 RESEARCH FINDINGS
4.1 Introduction 60
4.2 The Pilot Study 60
4.3 The Main Survey 62
4.3.1 Data Gathering Process 62
4.3.2 Section A – Biographical Details of Respondents 62
4.3.3 Section B – School Details 66
4.3.4 Section C – School Fees 68
4.3.5 Section D – Budgetary Planning 77
4.3.6 Section E – Financial Planning 88
4.4 Correlations 98
4.5 Reliability Analysis 101
4.6 Validity Analysis 101
4.6.1 Content Validity 101
4.6.2 Construct Validity 102
4.7 Summary 102
CHAPTER 5 CONCLUSIONS AND RECOMMENDATIONS
5.1 Introduction 103
5.2 Achievement of the Aims of the Research 104
5.3 Recommendations/Guidelines for Principals and Members of SGBs’ 105
5.4 Contributions of the Study 112
5.5 Limitations of the Study 113
5.6 Suggestions for Further Research 113
5.7 Concluding Remarks 114
LIST OF REFERENCES 115
Annexure A: Letter Requesting Permission to Conduct Research 121
Annexure B: Letter to Requesting Participation in Research Study 122
Annexure C: Questionnaire 123
Annexure D: Item Total Correlations – Section C 130
Annexure E: Item Total Correlations – Section D 131
Annexure F: Item Total Correlations – Section F 132

viii
1
CHAPTER ONE
INTRODUCTION AND PROBLEM ORIENTATION 1.1 INTRODUCTION
The restructuring of the education and training system has been one of the many priorities of
the government, since the first democratic elections in 1994. Prior to this era South Africa did
not have a comprehensive national system of education and training. Education was
characterized by separate education tailored specifically for the various race groups within
the national populace. Disparity was abundantly evident as schools in townships were poorly
resourced both in people management (Human Resources) and financial management
resources as the per capita expenditure was highly unequal (Mothata 2000:2). In an attempt
to build a just and equitable system the Department of Education and Training published
numerous policy documents with the aim of restructuring the South African education
system. Such policies were in congruence with the stipulations of the Constitution of the
Republic of South Africa, Act 108 of 1996.
The White Paper on Education and Training of 1995 (Education White Paper 1) (Mothata
2000:6) was the predominant official policy document on education published by the ANC-
led government. The White paper set out the policy directions, values and principles for the
education system in accordance with the Constitution. The document emphasized an
integrated approach to education and training, an outcomes based approach, lifelong learning,
access to education and training, equity and redress in transforming the legacies of the past.
Education White paper 2 was published in 1996. It was titled “Organization, Governance and
Funding of Schools” and was based on proposals set out in the Hunter Report. It built on the
principles that were set out in White Paper 1. In essence parental rights, the governance
policy of public schools, roles and responsibilities of public school governing bodies,
employment of teachers, public and independent schools and learners with special education
needs were included in this Paper. The Paper formed the cornerstone of the South African
Schools Act 84 of 1996. Within the broader educational paradigm the South African Schools
Act (Act 84 of 1996) came into effect on 1 January 1997. The main objective of the Act is to
provide for a uniform system for the organization, governance and funding of schools. The
act places an enormous responsibility on the state regarding the funding of public schools.
Inter alia the act provides that, “the state must fund public schools from public revenue on an
2
equitable basis in order to ensure the proper exercise of the rights of learners to education and
the redress of past inequalities in educational provision” (South African Schools Act, Act 84
of 1996 section 34(1)).
The South African Schools Act, (Act 84 of 1996), also sets out the national norms and
minimum standards for public school funding. These norms and minimum standards deal
with:
• the public funding of public schools, in terms of section 35 of the Act;
• the exemption of parents who are unable to pay school fees, in terms of section 39(4)
of the South African Schools Act (Act 84 of 1996); and
• public subsidies to independent schools in terms of section 48(1) of the South African
Schools Act (Act 84 of 1996).
Whilst the government has endeavoured to honour the states’ responsibility in terms of the
Constitution and the South African Schools Act (Act 84 0f 1996), i.e. to progressively
provide resources to safeguard the right to education of all South Africans, educational needs
in South Africa are much greater than the current budgetary provision for education. With
financial constraints and limitations of both national and provincial budgets for education, it
has become increasingly difficult for the government to provide for all financial requirements
of a school especially within a disadvantaged educational environment. In essence it is
accepted that the state cannot fund schooling totally out of its own budget. Therefore to effect
redress and improve equity public spending on schools is in the main specifically targeted to
the needs of the poorest within our communities (Bisschoff & Sayed 1999: 310).
Section 20 of the South African Schools Act (Act 84 of 1996) empowers the school
governing body (SGB) to administer, and control the school’s property, buildings and
grounds occupied by the school. Section 37 of the South African Schools Act (Act 84 of
1996) spells out how school governing bodies should manage their funds. Guidelines for the
school governing body on their roles and responsibilities in managing the finances of the
school are also provided within the South African Schools Act (Act 84 0f 1996). The
Department of Education also provides basic training for school governing bodies in
financial management. However, in my experience, as a senior manager at a school, I have
noted that these guidelines and training (if provided) are inadequate and that members of
school governing bodies have little knowledge of the contents of the South African Schools

3
Act (Act 84 of 1996). The interpretation of the South African Schools Act (Act 84 0f 1996)
correctly has also posed problems among principals and SGBs. This has led to funds being
mismanaged and many financial problems being experienced at schools.
Since the implementation of the South African Schools Act (Act 84 0f 1996), financial
management has become an important responsibility for school principals and school
governing bodies. Dealing with financial management has created several difficulties for
school principals and school governing body members who do not have the necessary
financial knowledge, skill and expertise to perform this function. In addition many schools do
not have adequate financial policies to provide clear direction on the use of funds and
resources. Members of school governing bodies are expected to develop financial policies for
the institutions in accordance with directions issued by the Head of Department. The crux of
the problem is that the members of the school governing bodies lack the necessary
knowledge and “know how” to develop, adopt and implement financial policies. These and
other duties (as stated in the South African Schools Act for SGBs) require high levels of
literacy and relevant expertise.
Section 36 of the South African Schools Act (Act 84 of 1996)
places a further responsibility
on SGBs by stating that “a governing body of a public school must take all reasonable
measures within its means to supplement the resources supplied by the State in order to
improve the quality of education provided by the school to all learners at the school”.
Schools are empowered to set their own fees and the SGB has a central role to play in this
process. In addition SGBs must ensure that parents are consulted in fee setting and that
parents approve of a schools budget.
By implication SGBs have enormous financial responsibilities including budgeting (planning
the school’s finances for the following year), managing devolved funding from provincial
departments and raising additional funds to improve the quality of education in the school,
maintaining all the financial records of the school, purchasing educational materials,
equipment or textbooks for the school as well as controlling and maintaining school property,
buildings and play grounds. Considering that financial management of schools is a relatively
new concept in most South African schools and that many members of SGBs do not have the
necessary capacity, experience and competence to carry out all the above mentioned financial

4
responsibilities, there is an urgent need for research in this field to improve the current
financial management situation in schools.
1. 2 MOTIVATION FOR RESEARCH
Studies conducted by Bush and Heystek (2006:12) of principals in Gauteng reveal that many
principals consistently demonstrated their anxiety about carrying out the financial
management function and their need for additional training to do so effectively. Similar
findings were also noted by McLennan (2006:12) in her study on governance and
management. She notes that “finance was one of the two most common issues discussed by
SGBs in township schools in Gauteng”. The author further reiterates that, “fees were rarely
set higher than one hundred rands and almost never paid. Financial irregularities were often
noted or were in the process of being investigated”.
Bush (2006:13) carried out interviews in three schools South of Johannesburg and noted that
“there is ambiguity that surrounds the budgeting process. Principals often do not know what
proportion of notional fee income will actually be received and this makes it difficult to
construct an appropriate budget”.
In addition the Ministerial Review Committee (2004:104) also found that finance and school
fees occupy most of SGBs’ time and financial management is ranked as the most important
part of the SGB’s function. The report adds that SGBs do not regularly and consistently
manage the challenge of fund raising and monitoring school fees. The Ministerial Review
Committee (2004:150) identifies skills deficits, including financial management and lack of
legal expertise, as weaknesses most frequently noted by schools.
In view of the findings noted by the above mentioned researchers, one is obliged to ask how
schools actually do manage their financial responsibilities and what processes are used to
determine school budgets and set school fees. Whilst financial management is the main
responsibility of all governing bodies in South African schools, there is a paucity of research
undertaken on the manner in which financial management and governance actually function
within an educational context. Such assertions are also supported by the Matthew Goniwe
School of Leadership and Governance in their series, Mestry (2004:126) and Segoati (2006:

5
36) where their research emphasized the lack thereof or need for further research in the field
of financial management in schools.
A preliminary investigation, derived from interviews with principals, on financial
management in schools reveals that schools are struggling to cope efficiently and effectively
with financial management. Although principals and SGB members play a pivotal role in
financial decision making at schools, literature too suggests that there is a lack of capacity
building within SGBs. This view is substantiated by Segoati (2006: 36) who, conducted case
studies in four schools, using in-depth interviews with principals and personal questionnaire
interviews with parents. The author found that the principals feel that parents cannot
contribute to the financial management of the school because of a lack of skills and
knowledge, and training that was provided did not help them to acquire the requisite skills.
In my experience as a senior manager at two different schools I found the members of the
school governing body to be seriously lacking in financial knowledge and expertise. This
huge gap created by the lack of relevant skills and knowledge impacts negatively on policy
and budget planning, formulation and implementation. Thus the effects of this lack in
capacity can be felt in all departments of the school
Segoati’s (2006: 36) view is further supported by Motha’s (2006: 37) research on the
financial accountability of primary schools. Motha’s research based on four case studies in
one Gauteng district supports the view that SGBs experience difficulty in managing funds
because of a lack of experience and training. In my experience I have noted that the
Department of Education provides very little training for newly appointed members of school
governing bodies. The training that is provided is inadequate and is not facilitated by experts
in the financial management field. It is done on a once off basis. No further support is offered
nor is any further training done in the SGB’s three year term of office. In addition to the
inadequate training and lack of capacity to carry out the necessary functions of the SGB,
cognizance must be taken that some members of school governing bodies resign within the
three years or their membership ceases due to them no longer having children at the school.
The remaining members of school governing bodies and principals are left to devise ways to
find solutions to ensure that all functions, including that of financial management, of the
SGB are adequately fulfilled.

6
Mestry (2004:126-132) examined the competences needed by effective governing bodies and
noted their lack of capacity and experience to play an active role in the school budgeting
process. Findings of Mestry (2004:126-132) emanating from focus group interviews shows
that the Department of Education has no mechanisms in place to support schools on financial
issues and problems. It is thus evident from the above that principals and SGBs with their
limited knowledge of finances and capacity are left to make their own decisions regarding the
finances of the school.
In addition financial management of South African schools is a relatively new function for
many principals and SGB’s. Ngcongo and Chetty (2000: 78) also resonate similar views of
researchers and have observed “an acute lack of expertise in some schools, in areas such as
financial management and budgeting.” The authors have also found that “for various
reasons, capacity building for school governing bodies has not materialized. A clear
implementation strategy for capacity building in many instances was non existent”. Therefore
without a sound implementation strategy for capacity building of governing bodies, the
effectiveness of the South African Schools Act (Act 84 of 1996) is threatened. Ngcongo and
Chetty (2000:78) further reiterate that
the need for capacity building and transformation for
different levels of management in the education system in South Africa has been highlighted
and motivated in various official and policy documents. Paramount among these is the
Constitution of South Africa and the South African Schools Act (Act 84 of 1996).
Bisschoff and Sayed (1999:310-315) conducted research at six Gauteng Department of
Education (GDE) schools on the changing role of the principal and their findings on the
possible problems and obstacles encountered in fulfilling financial school management
functions were twofold. Firstly, principals reported that payment and collection of
outstanding fees posed a problem and secondly lack of relevant knowledge and information
among parents, governing body members and principals appeared to be an obstacle
particularly amongst disadvantaged schools.
Lemmer and Van Wyk (2004: 262) have also found that the contribution of parents in school
governing bodies is limited and reported that “many working class and rural black parents
face constraints in terms of participation in school governing bodies as a result of
poor skills, distance from schools and lack of time”.

7
Financial management thus forms an integral focus of school governance and management
since it covers all activities of a school’s overall financial performance mosaic. Although a
school may have sufficient financial resources, such resources will not contribute to the
attainment of educational goals and objectives if these resources are not efficiently and
effectively managed (Bisschoff & Sayed 1999: 311).
Although the need for capacity building for members of school governing bodies, especially
in the financial management, have been emphasized and pointed out by many researchers,
very little is being done to address the situation. This study aims to establish the current
financial management systems existing at schools and make recommendations on the
budgeting process in an attempt to increase the effectiveness of financial management by the
principal and SGBs. In taking cognisance of findings from various researchers the following
issues appear to be key aspects of financial governance that is lacking in many schools: the
financial policy of such schools, its implementation, monitoring and review and the
accountability for the finances of such schools. Researchers have also accentuated the
importance of budgeting and proper financial management within schools. From the above it
must be acknowledged that many SGBs do not have the required financial skills and
experience to effectively manage the finances of schools they serve. The review of some of
the available literature in this field reflects a dire need for more research within this field.
Further research on the budgeting process, school fees collection, monitoring and financial
management issues in different types of schools would inform the development of sound
financial management practices.
1.3 DESCRIPTION OF THE PROBLEM AND PROBLEM
FORMULATION
Financial accountability is of crucial importance in any organization. The financial policy of
an organization provides direction on how available funds and resources should be utilized
optimally for the benefit of the organization. Although public schools are non-profit
organizations, the effective and efficient management of its finances and financial
accountability should be consistent with profit-making organizations.
Whilst the South African education system has undergone fundamental changes in the last
decade, the process of transformation remains far from complete. The Constitution and the
South African Schools Act (Act 84 0f 1996) still remain transformation mechanisms which
8
are not realised, albeit the persistent efforts to redress imbalances inherited from the previous
political dispensation.
The financial management of schools is one aspect, amongst many others that needs to be
urgently redressed. In my experience as a senior manager at two schools in the Ekurhuleni
West district I have experienced and noted the difficulties that members of SGBs experience
in fulfilling the financial management function as stipulated by the South African Schools
Act (Act 84 0f 1996)
. There are serious challenges around budgeting, collection and
monitoring of school fees, raising additional funds to improve the quality of education,
purchasing educational materials, equipment, and textbooks. During discussions with
principals from other schools in the Ekurhuleni West district, I have noted that these
challenges are prevalent because of a serious lack of capacity within SGBs. Furthermore, the
Department of Education offers minimal support to schools on financial issues and capacity
building exercises for both SGBs and senior managements of schools. This further
exacerbates the problem of financial management in public primary schools.
Mestry (2004:126) concurs that there are many principals and SGB members who lack the
necessary financial knowledge and skills and are placed under tremendous pressure because
they are unable to work out practical solutions to problems. Mestry (2004:126) further
reports that “in many instances principals and school governing bodies have been subjected
to forensic audits by the Department of Education due to the mismanagement of funds
through misappropriation, fraud, theft and improper control of financial records”.
Based on the above description of the problem the following main research question has been
formulated:
• How do principals and SGBs determine and implement the key aspects of financial policy
within public primary schools?
The following sub questions have been formulated to support the above research question:
• How do principals and SGBs make decisions about the budgeting process within public
primary schools?
• How do principals and SGBs make decisions relating to fee setting within public primary
schools?
9
• How do principals and SGBs make decisions about financial resource planning within
public primary schools?
1.4 AIMS OF THE RESEARCH
The main aim of this study is:
• To determine how principals and members of SGBs implement financial policy at public
primary schools.
In order achieve the main aim of the study; the following secondary aims are developed:
• To examine how principals and members of SGBs make decisions about the budgeting
process within public primary schools.
• To establish the procedures followed in school fee setting within public primary schools.
• To determine how principals and members of SGBs undertake financial resource
planning within public primary schools.
1.5 HYPOTHESES
Where possible, the research problem should be translated into research hypotheses.
Research hypotheses assist the researcher on implications inferred from theory in order to
provide answers to the research problem (Welman & Kruger 1999:23).
In this study the following hypotheses were proposed:
H1:
A negative relationship exists between experience (of SGB members) and an
understanding of the budgetary planning process.
H2:
A negative relationship exists between qualifications (of SGB members) and the
understanding of the budgetary planning process.
H3: A negative relationship exists between experience (of SGB members) and their level of
qualification.

10
1.6 RESEARCH APPROACH AND METHODS
1.6.1 Introduction
Research is a systematic process of collecting and logically analysing information for some
purpose. Research methodology refers to the methods a researcher uses to collect and analyze
data. Research methodology is systematic and purposeful. Procedures are planned to yield
data on a particular research problem, and are not just haphazard activities. More specifically
it refers to a design whereby the researcher selects data collection and analysis procedures to
investigate a specific research problem (McMillan & Schumacher 1993: 9).
1.6.2 Research Approach
A quantitative approach was followed in this study. Quantitative studies adopt a positivist
philosophy of knowing which emphasizes objectivity and quantification of phenomena.
Quantitative designs maximize objectivity by using numbers, statistics, structure and
experimental control (McMillian & Schumacher 1993: 32).
The research problem stated in this study relates to financial issues at schools are more suited
to a quantitative approach. Quantitative measures take into account factors that can be
expressed in numerical terms while qualitative factors cannot be measured in numerical
terms (Horngren, Foster & Datar 1994:389). Quantitative approaches assist managers in
taking decisions with a reasonable degree of confidence (Ball, 1991:281). A quantitative
approach will enable managers to make a proper assessment of all alternatives in the
decision-making process.
1.6.3 Research Design
A non-experimental research design, namely descriptive research was also used in this study.
In a non-experimental design there is no manipulation of conditions. The researcher obtains
measures from respondents to describe an occurrence. This type of research describes
existing achievement, attitudes, behaviours or other characteristics of a group of respondents.
A descriptive study reports things the way they are. Descriptive research is also concerned
primarily with the present and does not involve the manipulation of independent variables
(McMillian & Schumacher 1993: 266).
11
This research design was appropriate as the aim of the study was to establish the financial
management systems prevalent in schools. Using this design the researcher was able to
correctly describe the current financial management systems used at schools.
1.6.4 Research Method
The survey method was used to obtain relevant data. The survey method was chosen due to
its ability to accommodate the required sample size at relatively low costs and its ease of
administration among respondents (Zikmund 2000:220). A questionnaire based on a
literature study was used to obtain relevant data in this research study.
1.6.4.1 Literature Study
The thorough review of literature relevant to the area of study was undertaken in order to
establish a theoretical background. The literature study focused on:
financial policy
the concept of budgeting and the budgeting process at schools
the use of budgets as a tool for planning, implementation and control.
1.6.4.2 Questionnaire
Primary data was generated by means of a structured questionnaire. Questionnaires are
widely used as a technique in obtaining information from respondents (McMillan &
Schumacher 1993: 238). The questionnaire was designed to elicit information to meet the
objectives of this study. The questionnaire contained five sections: section A comprised
biographical information such as gender, educational experience, financial experience and
current position held at the school; section B comprised questions aimed on gathering data on
the school such as its location, type of school, and number of learners at the school; section C
comprised questions aimed on gathering data on school fees; section D comprised questions
on the budget and budgetary planning process; and finally section E comprised questions
aimed at gathering information on financial management.

12
Permission to conduct this research at the schools had been sought from the Ekurhuleni
South district director via a letter (refer to Appendix A).
In order to ensure that the questions were clear, simple, unambiguous and relevant to the
study, the questionnaire was pre-tested with principals and members of SGBs. The revised
questionnaires were hand delivered to the schools selected for this study by the researcher.
The questionnaires were addressed to the principal and members of the SGB, since they are
directly involved in the implementation of the finance policy, decision making and fee setting
at schools. The principal and the members of the SGB of each school were required to
complete the questionnaire. A covering letter (refer to Appendix B) addressed to the
principals and members of the SGB was handed together with the questionnaire to principals.
The letter
informed the principals and members of SGBs about the nature and purpose of the
research and assured them of the confidentiality, anonymity and encouraged them to respond.
The researcher was available to answer any queries, questions and problems that the
respondents had pertaining to this study or the completion of the questionnaire. The
completed questionnaire was collected from each of the participating schools personally by
the researcher on a mutually agreed date. A letter of appreciation for their valuable time and
effort in completing the questionnaire was handed to all participating principals and members
of the SGBs.
1.6.5 Data Analysis
An analysis of responses to the questionnaire was undertaken according to accepted
quantitative methods. The analysis of closed type questions lends itself to statistical analysis
of responses. Data was analyzed using the Statistical Package for Social Sciences (SPSS –
version 16.0 for windows) by a statistician. The statistician used descriptive and statistical
procedures so that:
• the researcher was able to formulate questions that were fully understood and thus
could discuss results confidently.
• So that the analysis could be user friendly to principals who need not be statistical
experts.

13
Since a quantitative research approach was used, the data was analysed primarily through
descriptive analysis and then followed through the use of correlation analysis in order to
establish the relationship between variables.
The method of analysis is further explained in Chapter Three. The responses were
interpreted, and the findings are presented and discussed in chapter four. Conclusions,
recommendations and limitations are reported in chapter five.
1.6.6 Population
The study was restricted to the Ekurhuleni South District in the Gauteng Province of South
Africa. The Ekurhuleni South District is one of the fifteen school districts within the
province. The units of analysis were schools located within this district. The elements chosen
for the study comprised principals and members of the SGBs.
1.6.7 Sampling Method and Procedure
A non-probability sampling technique namely, purposive sampling was used in this study.
According to Patton (cited in McMillian & Schumacher 1993: 378) purposive sampling is
“selecting information-rich cases for an in depth study”. The sample for this study comprised
of ordinary public schools as well as former Model C schools. The schools were located in
urban areas, rural areas and township areas. Purposive sampling is undertaken to increase the
utility of information obtained from small samples. “Information rich” participants are
chosen because they are likely to be “knowledgeable and “informative” about the phenomena
under investigation (McMillian & Schumacher 1993:378).
Schools in the Ekurhuleni South District (Gauteng Province) were selected for the purpose of
this study. All schools were public primary schools within the Ekurhuleni South District. A
letter was written to these principals and SGBs indicating the nature and purpose of this
study. It also sought their permission to participate in this study and assured them that all
information obtained from the schools will be held in strict confidence and that the
questionnaire is anonymous (refer to appendix B). Principals and members of the finance
committee of the SGB of the selected schools were required to complete the questionnaires.

14
Principals and members of the finance committee of the SGB of the selected schools had
been chosen to complete the questionnaire because they are directly involved in the
implementation of the finance policy, decision making and fee setting at their respective
schools.
1.7 VALIDITY AND RELIABILITY
According to Johnson and Christensen (2004: 140) validity refers to “the accuracy of the
inferences, interpretations, or actions made on the basis of test scores”. Reliability refers to
“the consistency or stability of test scores. If a test or assessment procedure provides reliable
scores, the scores will be similar on every occasion.” (Johnson & Christensen 2004: 133).
According to Best and Kahn (2006: 324) “basic to the validity of a questionnaire is asking
the right questions phrased in the least ambiguous way”. To ensure validity of the
questionnaire the researcher ensured that the questions were directly related to the purpose
and objectives of the study, that the meanings of all terms were clearly defined so that the
questions were correctly interpreted by all respondents and that the questionnaire was free of
ambiguities.
Piloting is the process of testing a questionnaire before a survey commences to make sure
that any errors are identified and then corrected (Boyce 2002: 371). Hence piloting provides a
final pre-survey assurance that the questionnaire contains no errors and to affirm that the
questionnaire captures the information sought by the researcher (Malhotra & Birks 2004:
345). Piloting the questionnaire was done by the researcher on a sample of five academics,
SGB members and a Principal of a school. In addition, the questionnaire was pilot tested with
20 respondents.
Reliability of questionnaires may be inferred by a the computation of Cronbach alpha
coefficients for the scale (Best & Kahn 2006: 329).
1.8 AREA OF STUDY
The study was conducted at schools that fall under the jurisdiction of the Gauteng
Department of Education. Gauteng Department of Education comprises fifteen districts. The

15
Ekurhuleni South Region is one of the fifteen districts, which covers parts of the
east rand
area and includes Bedfordview, Edenvale, Germiston, Katlehong, Tembisa, Thokoza,
Alberton and Boksburg. This research was limited to selected public primary schools in the
Ekurhuleni South Region. It should be noted that the data obtained from these institutions is
sufficient for this dissertation of a limited scope.
1.9 ETHICAL ISSUES
All ethical measures were taken into consideration throughout this study. These measures
included:
1.9.1 Informed consent
Consent was sought from all participants (principals / SGB members). They were informed
of the purpose of the study, the demands and risks of the study and were given all
information that influenced his /her willingness to participate.
1.9.2 Freedom to withdraw
The research participants were informed that they were free to withdraw from the research
study at any time without penalty.
1.9.3 Confidentiality and anonymity
Participants were assured that their identities, their responses and the names of their schools
will not be mentioned/ revealed in this research study. Pseudonyms were used to report
findings. In addition the data was analyzed on an aggregate basis without delineating any
particular school or respondent. As the primary researcher of this study I take full
responsibility for the ethical standards to which this study needs to adhere to.

16
1.10 DEFINITION OF TERMS
The following provides a clarification of concepts / terms used in this study:
School Governing Body (SGB)
According to the South African Schools Act (Act 84 of 1996), the governance of every
public school is vested in its governing body. This term refers to members of the school
governing body. The membership of the governing body of an ordinary public school is made
up of elected parent members, the principal, elected educator members, elected members of
staff at the school who are not educators and elected learners who are in the eighth grade or
higher and co-opted members (South African Schools Act, Act 84 of 1996 section 2A).
Gauteng Department of Education (GDE)
The Republic of South Africa has a single co-ordinated national department of education
headed by the minister. The minister is assisted by the director general and her deputies. In
addition, each of the nine provinces of the Republic of South Africa has its own department
of education. Each provincial department of education is headed by a member of the
executive committee. Gauteng is one of the nine provinces in the Republic of South Africa.
Thus GDE refers to the Gauteng Department of Education.
Budget
Knight, Morris & Tapply (1993: 19) describe a budget as “one of those items which is taken
for granted because of its familiarity- it is often seen as a statement of planned expenditure
against which actual expenditure can be matched.” They elaborate further by stating that “a
budget is multi-purpose management tool, adaptable for different purposes”.
“Educational planning, the weighting of priorities and of alternative means to accomplish
them, is the essential feature of effective budgeting in the schools. The educational budget is
the translation of educational needs into a fiscal plan that, when formally adopted, expresses
the kind of educational program the community is willing to support, financially and morally,
for the budget period. The school budget expresses to the citizens of a community the dollar
value of the program of education provided them”. (Candoli, Hack & Ray 1992: 111).

17
Financial Policy
According to Ryan (1994:25) a good policy identifies and articulates the values and the basic
principles to be applied to specific needs in an organization. It sets the broad objectives that
should be achieved in managing the school’s finances and informs the administrator of what
is required. An effective policy set and gives direction.
A good policy must spell out the rules and regulations of handling the money/ assets of the
school. The procedures for handling school fees, donations, post dated cheques, authorization
for cheque payments, signatories to the bank account and every aspect related to the school’s
finances should be included in the school’s finance policy (Mestry: 2004: 131).
A comprehensive financial policy refers to a compact policy document of all financial and
financial related policies
Equity
According to Marishane & Botha (2004: 96-97) “[e]quity refers to an impartial and
consistent application of rules governing (financial) resource allocation to schools.”
Redress
Redress refers to improving (financial) resource allocation by targeting the specific needs of
the poor and previously disadvantaged (Marishane & Botha 2004 : 96-97).
Efficiency
Efficiency refers to the allocation of (financial) resources to the school in such a way that the
allocated resources once deployed will match the (financial) needs of the school
(Marishane & Botha 2004: 96-97).
Quality
Quality refers to the provision of (financial) resources in such a way that resulting
improvements will be sustained (Marishane & Botha 2004: 96-97).

18
1.11 CLASSIFICATION OF CHAPTERS
CHAPTER TWO: LITERATURE REVIEW ON FINANCIAL MANAGEMENT IN
SELECTED PUBLIC PRIMARY SCHOOLS
The main focus of chapter two is on financial policy, the concept of budgeting and the
budgeting process at schools. This chapter also discusses how budgets could be used as a tool
for planning and control.
CHAPTER THREE: RESEARCH DESIGN AND METHODOLOGY
Chapter three describes the research design and methodology and the specific measures taken
to ensure research ethics, reliability and validity of the results.
CHAPTER FOUR: RESEARCH FINDINGS
In this chapter an analysis of the data is presented and the findings of the research are
discussed and interpreted.
CHAPTER FIVE: CONCLUSIONS, RECOMMENDATIONS AND
LIMITATIONS
The conclusions and limitations of the study are presented. Recommendations emanating
from the study are made. Benefits and limitations of the research study are highlighted.
Implications for future research are discussed.

19
CHAPTER TWO
LITERATURE REVIEW ON FINANCIAL MANAGEMENT IN SELECTED PUBLIC PRIMARY SCHOOLS
2.1 INTRODUCTION Many public primary schools in South Africa now have control over their own budgets.
Some of these schools, like the former Model C schools, have enjoyed self management of
their finances for several years, whilst other schools in previously disadvantaged areas have
experienced tremendous difficulty with financial management. Caldwell and Spinks (in Bush
and Gamage: 2001:39) suggest that a self-managing school is one for which there has been
significant decentralization to the school level of authority to make decisions related to the
allocation of resources. The problem with financial management, in self management
schools, is that there are many principals and SGB members who lack the necessary financial
knowledge and skills (Mestry 2004: 126). This view is supported by Bischoff (1999: 313)
who affirms that “in some cases governing body members may not be knowledgeable on
financial management issues”. This is as a result of school principals and school governing
body members not receiving adequate specialist preparation for this important management
role. Although management of school finances becomes easier with experience, it becomes
more complex for several reasons (Knight, Morris & Tapply 1993: V). Chapter two focuses
on financial policy, the concept of budgeting and the budgeting process at schools. This
chapter will also discuss how budgets can be used as a tool for planning and control. The
significance of this chapter is that these three aspects, namely financial policy, the concept of
budgeting and the budgeting process at schools also relate to questions that are contained in
the questionnaire.
2.2 FINANCIAL POLICY
According to Guthrie, Garms and Pierce (1988: 1) “a policy is a uniform decision rule that
guides action”. Policies prescribe how members of the society will act, make decisions or be
treated by others. Policy is also defined as “a course of action adopted or proposed by an
organization or person” (South African Pocket Oxford Dictionary 2004: 688, s.v. “policy”).
A policy must comply with applicable legislation. A policy, thus, provides the framework
and parameters within which an organization may function.

20
According to Mestry (2004: 131) a good policy has four distinct components that should be
identifiable within any policy document:
• A statement of the need for a policy. When the need is clearly articulated the
credibility of the policy and the policy making process will be enhanced.
• A statement of the values and the principles that should be brought to bear on that
need. Values and principles drive policy. Values such as transparency, democracy
and honesty should form the basis of the policy.
• A statement of the “guide for discretionary action”. Once the guide for discretionary
action is identified, it must be a guide or a directive that an administrator must
merely implement.
• A statement of expected outcomes. Identification of expected outcomes assists in
the necessary process of policy review or evaluation.
Bisschoff (1997: 155) describes a financial policy as “a statement concerning the manner in
which funds will be generated and spent at a specific school”. He further states that “the
starting point of the financial policy lies with the mission statement of the school”. Every
school must formulate its own mission statement and from that create goals. The realization
of these aims should be directed by action plans, which lead to the budget of the school.
Bisschoff (1997: 65) further reiterates that a budget is the mission statement of a school
written in monetary terms. The mission statement directs all policies of the school. The
financial policy should be seen as a document that may change over time.
According to Ryan (1994: 25) a good financial policy should identify and articulate the
values and the basic principles to be applied to specific needs in an organization. It should
spell out to an administrator what is required and it should set the broad objectives that
should be achieved in managing the school’s finances. An effective policy should not only
set direction but should also give direction. Administrators must be left to apply that policy
with the discretion required by circumstances and their own professional judgment.
Mestry (2004: 131) emphasizes the need to spell out the rules and regulations of handling the
money and assets of the school in the finance policy. The procedures for handling school
fees, donations, post dated cheques, authorization for cheque payments, signatories to the
bank account, trust accounts, recording transactions, documentation and every aspect
pertaining to the school’s finances should be included in the school’s finance policy.
21
Mestry (2004: 131) is also of the view that the finance policy should clearly outline the duties
or responsibilities of the treasurer, finance officer, auditor, finance committee, the principal,
and other persons (educators) delegated for specific tasks. According to Mestry (2004: 131)
one of the most important principles in school financial management is the “separation of
powers”. The School Governing Body must ensure that the various tasks are delegated to
different people who have the necessary knowledge and skills to perform these tasks
efficiently. This ensures transparency and accountability and avoids or minimizes fraud,
pilfering, theft and collusion.
Financial control mechanisms are an important aspect that must be included in a finance
policy. The finance committee of the SGB should develop and put in place control
mechanisms that will contribute effectively to the safe and accurate administration of funds,
including procedures for fundraising. Key control mechanisms for the following should be
developed and form part of the finance policy (Mestry 2004: 131):
• Cash receipts and cash payments
• School fees
• Management of assets
• Petty cash payments
• Stock control (cleaning materials and stationery)
• Tuck shop control (if the school has one)
• Budgetary control
The financial policy of the school should include aspects of sections 36, 37 and 38 of the
South African Schools Act 84 of 1996. Sections 36 and 37 of the South African Schools Act
84 of 1996 prescribe the way in which schools should manage their funds. It also provides
guidelines on the roles and responsibilities of the members of the school governing body and
the principal in managing the finances of the school. According to section 15 of the South
African Schools Act a public school is a juristic person with the legal capacity to perform its
functions. This means that the school may buy, sell, enter into contracts, make investments,
hire or own property and sue or be sued. The school performs all these actions through its
governing body. The school governing body has decision making powers and may bind the
school legally (Mestry 2004: 127). In addition, Section 38 of the South African Schools Act
stipulates that a governing body of a public school must prepare a budget each year according
to prescriptions determined by the Member of the Executive Council.
22
Taking into consideration this vast array of financial functions thrust upon the school
governing body by the South African Schools Act (Sections 36, 37 and 38), it is of utmost
importance that the SGB determine the financial policy for a particular school. The finance
policy should clearly outline the rules by which the finances are organized, managed, and
controlled, how the assets of the school are controlled, what criteria are applied to appoint a
registered auditor, correct procurement and tendering procedures.
2.3 BUDGETING
According to Igbuzor (2005: 3) budgeting is simply the process of preparing a budget. It
refers to the procedures and mechanisms by which the budget is prepared, implemented and
monitored. Preparing a good budget requires a responsible leadership, broad accurate and
reliable information and effective monitoring and control over the execution of the budget
plan. The budgeting process traces the budget in one year from conception through to
preparation, approval, execution, control, monitoring and evaluation. Adams (2006: 124) also
resonates a similar view by stating that “budgeting has an essential role to play in converting
all elements of the strategic plan into actual financial statements to provide a standard for
performance for the short-term future, set in the long term aims and objectives of the
organization”. Budgeting is, thus, the key to financial management.
2.3.1 THE CONCEPT OF BUDGETING A budget is a financial plan for the future that is able to identify objectives and the actions
needed to achieve those objectives (Hansen & Mowen, 2008: 334). Smith (2007: 137) views
budgets as a collection of plans and forecasts. They reflect the financial implications of
business plans, identifying the amount, quantity and timing of resources needed. The
Chartered Institute on Management Accounts (2000: 51) defines a budget as “a quantitative
statement, for a defined period of time, which may include planned revenues, expenses,
assets, liabilities and cash flows”.
Thompson, Wood and Honeyman (1994: 307) provide the following three dimensional
operational definition of a budget:
• A budget should be defined as the description of a desirable educational program.

23
• A budget should be defined as an estimate of expenditures required to carry out the
desired programs.
• A budget should be defined as an estimate of revenues available to meet the defined
expenses.
This definition is illustrated in Figure 2.1:
FIGURE 2.1 The Ideal Budget Triangle
Source: Thompson et al. (1994:307)
The budget triangle illustrates that a definition of a budget should be firstly based on quality
educational programs, and supported by revenue and expenditure plans that make the
envisioned outcomes possible.
According to Thompson et al. (1994: 305-307) the first and most fundamental principle of
school budgets is that educational programmes cost money: without funds there are no
schools. The second fundamental principle is that the primary purpose of a budget is to
translate educational priorities into programmatic and fiscal terms. Thus the school’s budget
is a statement of priorities. Prioritization of programmes occurs through the budget process

24
where top priorities are funded first and other programmes’ survival is a function of
economic fortunes. A third fundamental principle of budgets is that they are not natural
phenomena that occur spontaneously in educational environments but are created by people
charged with carrying out a school district’s legal educational obligations, which are
influenced by philosophical and fiscal realities. A fourth fundamental principle is that
budgets must be seen as a powerful political tool in school districts. The process by which
money talks within budgets is highly political. The budget is the means by which public
approval or disapproval of the school is expressed (Thompson et al., 1994: 305-306).
Candoli, Hack and Ray (1992: 136) also resonates similar views in that they too believe that
the school budget can be conceptualized as an equilateral triangle, with the educational
programme as the base and expenditures and revenues as the other two legs. If any one of the
three sides is shortened, the other two must also be shortened. Only when the three side
lengths are in proportion, the basis of a feasible budget document would be in place.
Candoli et al. also differentiate between a needs and a working budget. In the needs budget,
programmes costs are projected as if all educational needs are to be met. The working budget
is the final document drawn according to educational priorities and will serve as the financial
plan throughout the year. The working budget is actually a further refinement of the needs
budget. The needs budget is more idealistic, in that it lacks the realistic parameters that
surround the working budget. The working budget calls for the establishment of programme
priorities.
Horngren, Foster and Datar (1994:183) define a budget as a “quantitative expression of a
plan of action and an aid to co-ordination and implementation of this plan”. Hammer, Carter
and Usry (1994:394) aptly define a budget “as a plan expressed in financial and other
quantitative terms”. Budgeting in non-financial and non-quantifiable terms would be difficult
to achieve since there are no definite targets to be achieved if such terms exist.
In addition there is a clear distinction between a forecast and a budget and it is important to
take note of the difference. A forecast is a prediction of what can happen in the future whilst
a budget is a target that management wishes to achieve. This target is part of the macro-
planning process of any organization. In order to attain the goals and objectives of the
organization, budgeting plays a vital role in coordinating the activities needed to implement

25
the plans of action to achieve these goals and objectives. Barfield, Raiborn and Kinney
(1998: 620) emphasize the need for budgeting to provide focused direction for the planning
of an organization. Budgeting in schools is just as important as in commercial organizations.
Sollenberger and Schneider (1996: 285) suggest that budgets are relevant for the following
functions:
• formalizing the planning process
• creating a plan of action
• creating a basis of performance evaluation
• promoting continuous improvement
• co-ordinating and integrate management’s efforts
• aiding in resource allocation
• creating an aura of control
• motivating managers and employees positively
It is through budgeting that an organization aligns its resources with its purposes.
(Guthrie et al.,1988: 223). The budget process is the concrete, practical link between
planning and evaluation and comprises of three fundamental assumptions.
2.3.2 FUNDAMENTAL ASSUMPTIONS IN BUDGETING
According to Guthrie et al. (1988: 223), for budgeting to be most effective, the following
three critical conditions should exist: annularity, comprehensiveness and balance:
• Annularity
A budget, an organization’s resource allocation plan, is intended to cover a fixed period,
generally a year. The budget year is generally known as a fiscal year. The important
principle is that there is a previously agreed–upon span of time over which resource
allocation and financial administration occur.

26
• Comprehensiveness
An organization’s budget should encompass all fiscally related activity, on both the
resource and the expenditure sides. All revenues received by an organization, regardless
of source or purpose, and all that an organization spends, regardless of source or purpose,
must be encompassed by the budget and the budget process. If a budget is not
comprehensive, organizational resources may be accrued or utilized for purposes outside
its leaders’ control.
• Balance
What is received by way of resources must not exceed what is spent. A budget assumes
explicit organizational acknowledgement of resources and obligations, and the two must
match. If they are out of balance, an organization is out of control.
2.3.3 FUNCTIONS OF A BUDGET At most schools a budget is seen as one of those items which is taken for granted because of
its familiarity. It is simply seen as a statement of planned expenditure against which actual
expenditure can be matched (Knight et al., 1993:19).
A budget, however, serves many other functions, which include the following:
• forecasting
• matching expenditure to income
• establishing priorities
• comparing the planning
• value of alternatives
• implementing plans
• co-ordinating school activities
• allocating resources
• authorising expenditure and activities
• communicating objectives to personnel
• motivating personnel by delegation
• controlling expenditure
• strengthening accountability
• obtaining value for money, economizing
• matching inputs against outcomes

27
It must therefore be noted, from the above listed functions, that a budget is a multi-purpose
management tool that can be adapted for many different purposes. A budget does not only
relate to expenditure and spending, of course, can only be done against projected income.
Smith (2007: 138-139) supports the view that budgets have a multi-functional role and
outline the following multiple functions of budgets:
• it forces managers to plan ahead and reduce the number of ad hoc decisions;
• it provides a yardstick against which managers can be evaluated;
• it provides standards and plans which can be employed as part of the control process;
• it sets clearly defined targets which aid motivation;
• it helps to co-ordinate the separate activities of different departments and ensure that
all parts of the organization are in mutual harmony; and
• it aids communication. Through the budget top management communicates its
expectations to lower level management.
The concept of budgeting is widely used in all types of organizations. Managers do a better
job of running the business with a budget than with no budget at all. In education
institutions, such as schools, the budget must also be seen as a management instrument. It
can, in fact, also be considered to be a policy document since the priorities of the institution
and the essential changes, as reflected in the school improvement plan, are reflected therein.
In schools, for example, the budget reflects decisions that are made about income, expenses,
extra murals coaching and personnel. This relationship of matching income and expenses in
schools is vital to the existence of the institution. Allocation of resources changes with the
level of activity and available revenue. Inflation also impacts on the allocation of funds.
28
2.3.4 THE BUDGET PROCESS
In a large commercial organization a budget committee is responsible for co-ordinating and
directing the budget process. This committee usually comprises directors, accountants, sales
managers, production managers, and other members of top management. In schools, co-
ordinating and directing the budget process is the responsibility of the members of the school
governing body.
Mowen and Hansen (2008:336) outline the following as functions of the committee:
• reviews the budget
• provides policy guidelines and budgetary goals
• resolves differences that arise as the budget is prepared
• approves the final budget
• monitors the actual performance of the organization as the year unfolds
The following factors must be taken into consideration in the process of developing and
implementing the budget:
• All levels of management are acquainted with the process and understand how the
system works.
• The budgetary process should involve as many individuals of the organization, not
only for their expertise in certain fields, but also for commitment by participating in
the development of the budget.
• The budget targets must be realistically set in terms of its objectives.

29
Adams (2006: 130) outlines the following sequence of activities in the budgeting process:
The accountant is usually responsible for the administrative control of the budgetary process
in an organization (Adams 2006: 130). In schools this would be the responsibility of the
chairperson of the finance committee within the SGB.
According to Knight, Morris and Tapply (1993: 20-21) there are four main stages in the
budget process viz., preliminary analysis, construction, control and monitoring and
evaluation. These steps are discussed below:
• Preliminary analysis
This step is usually done in the early part of the academic year. At this stage
objectives and priorities of the school development plan are introduced. Various
alternatives for their delivery are considered, costed, and early projections for the
coming financial year and their implications are discussed.
Prepare and circulate timetable to involved persons
Identify the key commercial factors that will affect the business
Prepare a set of guidelines stating the key budget factors and conditions
Prepare the draft budgets at departmental level including explanations where guidelines have not been met in full
Review and revise draft budgets following discussion
Draft the consolidated master budget

30
• Construction
This stage is done before the new financial year. As detailed information becomes
available on outcomes of the previous budget, the new delegated budget total,
projected enrolment, staff changes and salary increases and draft budgets can be
constructed, leading to a final version for the governors’ approval.
• Control and monitoring
This occurs during the academic year. Once the year commences, actual expenditure
needs to be monitored against the intended expenditure and controlled to ensure that
expenditures are properly authorized and subject to audit controls. Control and
monitoring is discussed in further detail later in this chapter, under the heading
Requirements for effective financial control.
• Evaluation
This takes place after the end of the financial year. This involves evaluating the final
expenditure situation and matching this against intended objectives and actual
outcomes.
The whole process of budgeting must be seen in the context of the managerial planning
function, since the use of budgets is an essential component of an integrated planning
process. According to Thompson et al. (1994: 319) the general budget process is regarded as
consisting of four sequential and interrelated activities: estimating the revenues a school/
district will receive for the upcoming budget cycle, envisioning the educational programme,
estimating the expenditures required to support the proposed programme, and balancing
programme needs against revenue and expenditure realities. Thus the general budget process
is the operationalization of the budget triangle as discussed earlier in this chapter.
2.3.5 THE ADVANTAGES OF A BUDGET SYSTEM
According to Mowen and Hansen (2008:334) “a budgetary system gives an organization
several advantages”. These authors have identified the following advantages:
• It forces managers to plan for the future.
• It provides information that can be used to improve decision making.

31
• It provides a standard for performance evaluation.
• It improves communication and coordination.
Berkhout and Berkhout (1992: 51) maintain similar views on the advantages of a budget
system and list the following as the most significant advantages of a sound budget system:
• The budget educates all parties concerned to think in terms of money and costs.
Demands for more and better equipment, sports facilities etc. will be approached
more rationally by the staff members concerned, because costs and income become
‘visible’ and can be judged.
• Requirements of other departments and of the whole institution can be observed and
evaluated by all the officials concerned.
• It shows the estimated costs and income upon which services are based.
• It encourages members to economize.
• Members of management are able to study results which deviate from the budgeted
data, plan and implement corrective measures and prevent the recurrence of
irresponsible financial excesses or deficits.
• At budget committee meetings, staff members are committed to analysis, self analysis
and accountability.
• The budget assists in exposing difficulties of a material nature or those relating to any
personal interests which may be prevalent in the institution. These difficulties and any
costs which may stem from them can then be eliminated to facilitate a smoother and
more economical operation of the organization.
These advantages can only be achieved if the budget is prepared correctly and efficiently.
This implies that budgeting must be executed with as much detail as possible, the budget
documents must be designed correctly and proper control must be exercised and maintained.
2.3.6 THE RELATIONSHIP BETWEEN PLANNING AND BUDGETING
Guthrie et al. (1988: 215) view planning as “the systematic determination of future allocation
of resources.” It shares many features with rational decision making. It differs primarily in
three ways:

32
• The planner/s may not be the individual or team of individuals responsible for
implementing the plan. Planners are not necessarily executives or decision makers.
• Planning is oriented toward a time horizon beyond the immediate present.
• Planning involves systematic efforts to reduce uncertainty. Planning can mitigate the
risks involved in having to make instant decisions.
Planning and evaluation are two major stages in a cycle of events aimed at enhancing an
educational organization’s ability to serve its clients, namely, learners, parents and the public.
The full cycle involves planning for future events, implementing or executing a plan, and
evaluating outcomes (Guthrie et al., 1988: 216).
Budgeting is a practical bridge between planning and evaluation. Figure 2.2 illustrates the
relationships among planning, budgeting and evaluation. Budgeting is an important
component of planning and evaluation. After all, budgets represent the financial
crystallization of an organization’s intentions. It is through budgeting that a school can
decide how to allocate resources so as to achieve organizational goals. Resources are
expended consistent with an organization’s overall plans and evaluations of programmes and
activities subsequently inform the next cycle of planning and budgeting. Planning and
evaluation are meaningless unless they can influence an organization’s resource allocation.
Budgeting is the process of allocating an organization’s resources (Guthrie et al., 1998: 216).
Planning is a management function that should occur at all levels within an education system.
The prime purpose of planning is to reduce uncertainty and focus organizational activities so
as to utilize resources efficiently (Guthrie et. al., 1988:216-218). It is through budgeting that
an organization aligns its resources with its purposes (Guthrie et al.,1988: 223).
Management takes the responsibility of setting goals and objectives for the organization.
These are transformed into plans to be achieved. Budgeting is that quantifiable part of the
planning process which is needed to expedite the achievability of the goals and objectives of
the organization.

33
Figure 2.2 The Planning - Budgeting – Evaluation cycle
Source: Adapted, Guthrie et al. 1998: 217
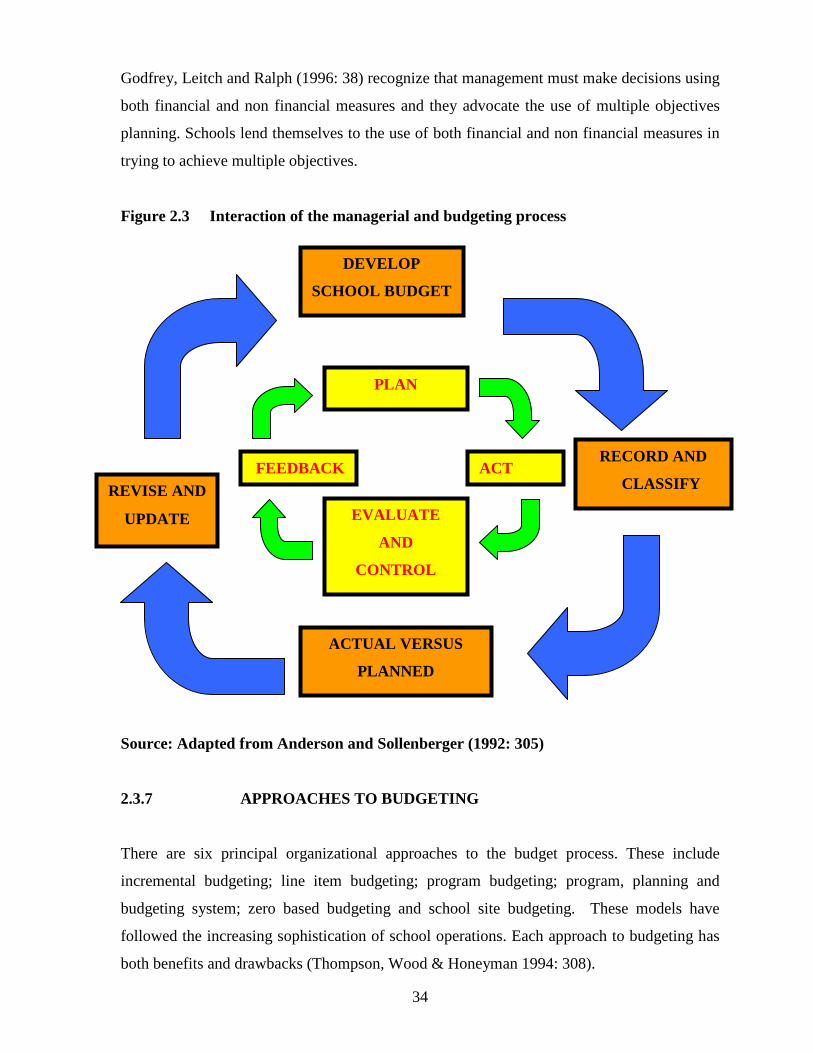
Figure 2.3 confirms the interaction of the managerial process and budgeting system process
which could be used in an educational institution. The diagram which illustrates two
interconnecting cycles namely, PLAN - ACT - EVALUATE – FEEDBACK cycle indicates
that managers at each step of the inner circle must use the outer circle to plan and control.
This re-affirms that budgets link the objectives and objectives and outcomes to strategic
plans.
EVALUATION
LONG RANGE PLANNING
(Strategic goals)
SHORT RANGE GOALS
(Objectives that promote
attainment of strategic goals)
BUDGETING
(Allocation of resources
to accomplish objectives)
IMPLEMENTATION
(Carrying out of budget plan)
1 2
3 4
34
Godfrey, Leitch and Ralph (1996: 38) recognize that management must make decisions using
both financial and non financial measures and they advocate the use of multiple objectives
planning. Schools lend themselves to the use of both financial and non financial measures in
trying to achieve multiple objectives.
Figure 2.3 Interaction of the managerial and budgeting process
Source: Adapted from Anderson and Sollenberger (1992: 305)
2.3.7 APPROACHES TO BUDGETING
There are six principal organizational approaches to the budget process. These include
incremental budgeting; line item budgeting; program budgeting; program, planning and
budgeting system; zero based budgeting and school site budgeting. These models have
followed the increasing sophistication of school operations. Each approach to budgeting has
both benefits and drawbacks (Thompson, Wood & Honeyman 1994: 308).
DEVELOP
SCHOOL BUDGET
PLAN
ACTUAL VERSUS
PLANNED
EVALUATE
AND
CONTROL
REVISE AND
UPDATE
FEEDBACK ACT RECORD AND
CLASSIFY
35
2.3.7.1 Incremental Budgeting
Incremental budgeting is a highly simplistic model that assumes that the previous level of
expenditure is a reasonable base for estimating needs and revenues for the next budget cycle.
Incremental budgeting assumes that each budget entity will receive the same increment as a
percentage increase or decrease for the next cycle (Thompson et al., 1994:308)
The drawback of this technique is that it focuses on aggregate trends and does not take into
account the effects of revenue and expenditure changes within a budget unless deliberate
efforts are made to track such changes. Furthermore incremental budgeting has historically
failed to focus on the uses of money within budgets. Additionally, it must be noted that rigid
application of incremental budgeting results in uncritical incremental increases to each
budget line item in equal proportions when such neutrality may result in over-funding or
under-funding of individual areas. This technique does little more than reveal gross trends
and does not communicate to either methods of internal allocation or returns on investment in
the educational enterprise (Thompson et al., 1994: 309).
In addition, Smith (2007:143) states that “the major disadvantage of the incremental
approach is that the majority of expenditure remains unchanged. Thus, past inefficiencies and
waste inherent in the current way of doing things are perpetuated”.
2.3.7.2 Line Item Budgeting
According to Husain (2003:15-16) the line item budget enumerates estimated expenditure by
type for a specified period of time. Personnel are listed by type of position, for example, a
clerk, typist, engineer or inspector. The budget is divided into sections according to
organizational units, departments and divisions an
d various types of expenditure is listed by
category, such as salaries of teaching, non teaching and administrative staff etc.
Thompson et al. (1994:309) have a similar explanation of line item budgeting. According to
these authors this technique assigns amounts to each expenditure category of the budget. In
line item budgeting, the emphasis is placed on the specific objects for which funds are

36
expended wherein each line item shows in the budget document is assumed to be the proper
base for expenditure. Budgets are thus planned around each line separately, and the new
budget is based on increases applied to each line’s base, usually the expenditure level of the
previous budget cycle. For example, the line items in a typical budget might include
instructional salaries, administrative and clerical salaries, repair and upkeep of grounds,
supplies and capital construction. Each line receives separate consideration wherein lines
may be increased by different amounts.
Line item budgeting has several advantages over incremental methods. The major benefit is
that the budget is now considered a sum of its parts, with each part considered separately in
terms of some measure of need. Line item budgeting permits some tracking of expenditures
over time. Line item budgeting suggests some consideration of programmatic needs
(Thompson et al.,1994:309).
Husain (2003:16) lists the following as limitations of line item budgeting:
• It does not encourage examining whether or not activities are producing desirable
results.
• New appropriations are made on the basis of the previous year’s budgets.
• Any duplication, redundant activities and tasks are hard to detect.
• It is very difficult to identify and locate all items of expenditure relating to a single
programme.
In addition, the following are highlighted by Thompson et al. (1994: 309-310) as major
drawbacks of line item budgeting:
• This technique depends on the budget document almost exclusively for allocation
decisions.
• Too little information is provided about how allocations are made, the process is too
dependent on experience, and little or no record of decision processes is evident.
• Furthermore use of this method is not considered totally appropriate to determine
levels of expenditure for particular grade levels, programs or projects.

37
• The use of this method fosters the cloistered appearance of budgets, vests decisions in
only a few persons, and does not facilitate the greater degree of accountability
required of today’s educational planners.
2.3.7.3 Program Budgeting
According to Lalli (2003: 30.1-30.2) program budgeting does not have a standardized
definition because of its encompassing nature. Its many aspects include concepts; a system
and process; a technique and format; and a management philosophy. It is a management
decision-making system that ties together strategic and long
-range planning with
conventional budgeting and supporting analysis so that an organization can most effectively
assign resources to achieve both its short-and long-range objectives.
According to Thompson et al. (1994: 310) program budgeting differs from line item
budgeting in that the various funds in a budget are internally organized by the school
according to their specific objective or purpose. Enabling this process is an elaborate system,
developed with the advent of electronic accounting systems using various reporting
standards, wherein various fund sub-accounts break expenditures in a budget into
incrementally smaller parts related to how the money is used. The emphasis in this technique
is placed on the program being supported by a set of funds. This conceptually moves the
budget process into a conscious recognition of the relationship between money and programs,
and the opportunity now becomes available to think of the budgeting process as an
educational enterprise. The advent of electronic cataloging of expenditures and programs
introduces possible productivity questions that were previously unavailable. The major
benefit is that greater data are available for schools that choose to view budgets and
instruction as interdependent functions.
2.3.7.4 Program, Planning and Budgeting Systems (PPBS)
This approach extended program budgeting to require each individual budget unit within a
school (or larger units, e.g. districts) to establish its own goals and direction through a
systematic planning process. The process requires the development of an educational plan
wherein each unit, such as the school in this case, develops individual plans for programs to

38
meet instructional objectives, supported by a plan for spending which is justified by
educational needs. Funds are then allocated according to the plan (Thompson et al.,1994:311)
This technique links educational programs and school expenditures into a model that
presume some cause and effect interaction. PPBS contributes powerfully to the concept of
accountability, as a consequence of its focus on outcomes and its ability to continue and
extend the object- function code account system to include analysis of success. The
introduction of PPBS marked the beginning of modern productivity analysis. PPBS were a
major contributor to the modern instructional environment of today’s schools (Thompson et
al,. 1994: 311).
Husain (2003: 17) compared PPBS with traditional budgeting and lists the following as
improvements:
• A better understanding of problems and alternatives.
• Improved information related to objectives.
• Use of analysis in decision making.
• Greater involvement of managers and evaluation of management efficiency.
One of the drawbacks of PPBS is that both thinking and technology can outpace
organizational readiness for change towards this budgeting system. As a result of the
different value structures inherent to the model, significant discord often develop in school
systems as programs and staff becomes competitors for resources. This has also led to
confusion due to inconsistency between budgetary objectives, existing organizational
patterns, and new organizational structures required by PPBS. Additionally, PPBS is heavily
data driven. Significant investments of time, complicated processes, and expensive
machinery is necessary to gather and interpret information required by the system’s logical
demands (Thompson et al, 1 994:311).
2.3.7.5 Zero Based Budgeting (ZBB)
Phyrr (in Husain 2003:19) defines zero based budgeting as “an operating planning and
budgeting process which requires each manager to justify why any money should be spent at
all, as well as how the job can be done better. This approach requires that all activities be

39
identified in decision packages (or programmes) that relate to inputs, each one be evaluated
by systematic analysis and all programmes be ranked in order of preference”.
According to Thompson et al. (1994:313) the basic premise supporting ZBB is that all budget
categories must be completely re-justified each fiscal year to cut waste and thus improve
organizational and fiscal efficiency. From an operational perspective, all budget categories
must be set at zero and those responsible for preparing budgets must carefully justify the
amount of money to be placed in each fund. To complete each budget cycle requires
rebuilding the need for every staff position, every piece of new equipment, and every supply
purchase.
One of the conceptual benefits of ZBB is that budget growth should not continue unchecked
without serious questions about positive contribution to the educational enterprise.
Additionally, the concept of multiple scenarios was sound in principle in that organizational
planning would improve when rampant growth in expectations was systematically restrained
(Thompson et al.,1994: 313).
According to Adams (2006:144-145) the advantages of ZBB are that the process
• concentrates on the cash value of each department’s activities and budget and not on
percentage increases;
• can reallocate funds to the department or activity providing the greatest benefit to the
organization;
• provides a quality of information about the organization that would otherwise not be
available;
• involves all levels of management and supervision in the budgeting process; and
• obliges managers to identify inefficient or obsolete functions within their areas of
responsibility.
In addition, Candoli et al. (1992:132) outline the following advantages of ZBB:
• ZBB controls staff expenses.
• ZBB focuses management processes on analysis and decision making rather than on
quibbling about incremental requests.

40
• ZBB combines planning, budgeting, business proposals, and operational decision
making into one process.
• In ZBB, managers have an ongoing requirement to evaluate in detail their operations,
efficiency, and cost effectiveness.
• With ZBB all expenditures are evaluated, and discretionary and penalty cost
exposures are specifically identified.
• ZBB offers mechanisms to trade off manpower and expenses between decision units.
• In ZBB, management has a follow – up tool to determine the level of achievement of
each programme relative to the cost and effectiveness of the program.
• In ZBB the ranking sheet can be used to adjust the budget during the operating year.
• ZBB identifies similar functions among different staffs for comparison and
evaluation.
• ZBB provides management training and participation in decision making.
These authors have identified the following as the disadvantages or problems with ZBB:
• ZBB is threatening.
• Administration and communications are more complicated because more people are
involved in decision making.
• ZBB requires more time in budget preparation.
• ZBB places emphasis on work measures and evaluative data that are often
unavailable.
• ZBB forces management to make decisions.
• The large volume of decision packages inherent in ZBB makes ranking difficult.
• ZBB involves the evaluation of dissimilar functions, which is not feasible.
• Evaluation of the “priority” or “required” packages can become a political nightmare.
In addition, according to Thompson et al. (1994: 313), one of the drawbacks of ZBB is that
the process of zeroing budgets was extremely complicated. ZBB was also criticized as a cost
reduction method that required more resources for effective preparation than could be saved
by the process.

41
2.3.7.6 School Site Budgeting
This is a site based management technique following on decentralized school administration
wherein budget related decisions are made at the individual school building level. School site
budgeting is an extension of program budgeting applied to each individual building site
within a single district. Under this plan each school site is allocated resources each year
based on a district level allocation formula that takes into account the number of students
served at each site in each specific grade level and in each specific program (Thompson et
al., 1994:314).
There are numerous advantages for school site budgeting. According to Thompson et al.
(1994:314) school site budgeting recognizes the importance of resources at the point of actual
utilization. School site budgeting is also conceptually sound in that it involves all
stakeholders (parents and teachers) in the total education of the child. The special value of
this technique is in providing a more holistic and inclusive view of education. Newcombe et
al. (1997: 94) argue strongly for the teachers’ participation in financial decision making so as
to remove the stigma of the principal centred financial decision making approaches.
The disadvantage of this approach is the complexity of the process. The addition of
community members and parents to central decision structures is a complex and time
intensive undertaking. The process of site based budgeting requires much learning and
training for all stakeholders as administrators, teachers and parents must learn about
organizational and technical structures of funding and learn to work together in a cooperative
and collegial non threatening environment. (Thompson et al. 1994: 314)
Although there are many approaches to budgeting, Husain (2003: 15) points out that
“generally educational institutions prepare their budgets on the basis of their main objectives
and policies”. Husain (2003: 6) reiterates that organizations prepare budgets in order to
ensure the most efficient allocation of funds and also for the accomplishment of their
objectives as economically as possible. Budgets are used as the “most potent tool of financial
planning and decision making in most modern organizations, so much so, that budgeting has
become the most crucial component of modern financial literature”.

42
2.3.8 BUDGET PROFILING
Budget profiling is the analysis of the expected patterns of expenditure and income during
the financial year. Budget profiles are used to compare the expected budget position with the
actual position. This will reveal whether the budget plan is on target and provide early
warning of any problems.
There are four main advantages of budget profiling:
• It aids budget planning
• It provides feedback with errors and omissions when monitoring budgets
• It is a useful management tool to analyse resource consumption
• It provides important information for cash flow forecasting
A budget profile is a prediction of the pattern of budget spending over the year and where
regular profiles can be established, they can be used as models for future plans and reduce the
amount of uncertainty in budget planning. The recording of budget profiles over a number of
years assists in making comparisons and provides reassurance that the budget is reasonable.
Budget profiling provides a record of spending patterns over time which may be used in the
future as the basis for cash flow forecasts (Knight et al., 1993: 37-39).
2.4 REQUIREMENTS FOR EFFECTIVE FINANCIAL CONTROL
Knight, Morris and Tapply (1993: 64) distinguish between the terms “control” and
“monitoring” which are sometimes used synonymously. The authors state that “control
requires setting up systems to ensure that money is spent for the purposes for which it has
been authorized, and that proper standards have been adopted for the school’s financial
management. Monitoring involves checking whether actual expenditure tallies with the
pattern expected, and whether any remedial action is needed”.
The following sets of standards/guidelines have been suggested by these authors for effective
financial control/administration in schools:
• Organisation of responsibility and accountability: definition of roles, limits of
delegated authority, register of financial interests;

43
• budget management, particularly setting objectives, securing value for money, and
effective monitoring;
• internal controls: a system of checks, written procedures, provision for staff absence,
sound records, traceability of transactions;
• insurance: adequacy, annual review;
• computer system: effective back-up disaster recovery plan, controlled access;
• purchasing: value for money, provision for quotations and tenders, ordering
procedures, checking and authorization of payments;
• personnel: personnel procedures, records, processing and checking payroll
transactions;
• assets: security of cash, capital assets and stock, maintenance and checking of
inventories, procedures for borrowing items;
• income: charging policy, collection and receipts from income, reconciliation with
bank records, bad debts;
• banking arrangements: definition of limits, signatories, cheque procedures,
reconciliation of bank records, investment of surplus funds;
• petty cash: agreed level, procedures, checks; and
• voluntary funds/public funds: treasurer and auditor, procedures, signatories, annual
accounts, insurance/ fidelity arrangements, separation from official funds.
Budgets are closely linked to the strategic plan of organizations. This linkage can be seen in
Figure 2.4. The illustration shows the pivotal role budgets play in the link between planning,
control and achieving the objectives of an organization. In order to attain the goals and
objectives of the organization, budgeting plays the vital
role of co-ordinating the activities
needed to implement the plans of action to achieve these goals and objectives. Barfield,
Raiborn and Kinney (1998:620) emphasize the need for budgeting to provide focused
direction for the planning of an organization.
Mowen and Hansen (2008:334) describe planning as the process of “looking ahead to see
what actions should be taken to realize particular goals” and control as the process of
“looking backward, determining what actually happened and comparing it with the
previously planned outcomes”.

44
Figure 2.4 Planning, Control, and Budgets
Before a budget is prepared, an organization, such as the school, should develop a strategic
plan. The strategic plan identifies strategies for future activities and operations, covering at
least five years. The organization can translate the overall strategy into long- and short-term
objectives. These objectives form the basis of the budget. The budget and the strategic plan
should be tightly linked. This linkage helps management to ensure that all attention is not
focused on the short run, as budgets are generally seen as one-year period plans. Budgeting
forces management to plan for the future. It encourages managers to develop an overall
direction for the organization, foresee problems, and develop future policies (Mowen &
Hansen 2008: 335).
Planning Control
Source: Hansen and Mowen (2008:
335)
Strategic Plan
MONITORING AND
ACTUAL ACTIVITY
Long term
Objectives
Short term plan
Budgets
COMPARISON OF ACTUAL
WITH PLANNED
Feedback
INVESTIGATION
CORRECTIVE ACTION
Short term
Objectives

45
Budgets set standards that can control the use of a company’s/school’s resources. Control is a
vital part of the budgetary system. Control is achieved by comparing actual results with
budgeted results on a periodic basis (e.g. monthly). A large difference between actual and
planned result in feedback reveal that a system is out of control. Steps should, then, be taken
to find out why, and the situation should then be corrected (Mowen & Hansen 2008:335).
2.5 SUMMARY
Management of a school’s finances is an integral part of effective school management. The
school governing body is responsible and accountable for the management of the funds of the
school. It is therefore essential that the school should establish and implement sound internal
financial control systems to ensure the reliability and accuracy of its financial transactions. In
this regard, the existence and effective execution of a sound, watertight financial policy
cannot be over emphasized. Financial policies are of utmost importance in guiding financial
decisions in all organizations. The financial policy must comply with applicable legislation
such as the South African Schools Act and it must give direction and guidance. Schools need
policies and a financial policy may eliminate or reduce mismanagement of school funds.
Tooley and Guthrie (2007:21), in investigating budgeting in New Zealand secondary schools,
reiterated the view that it was important that school managers make use of budgetary and
accounting technologies as important school-based management tools.
A budget is basically concerned with the allocation of funds and means in accordance with
the activities anticipated by the governing body of a public school. A budget is also the plan
of action by means of which the use of the allocated resources is coordinated, monitored and
evaluated. The budget also creates the opportunity for continuous financial control, through
which adaptations and corrective actions can be effected in good time so that set goals may
be reached. The application of budgetary procedures and control ensures that the governing
body and staff have to operate realistically within the prevailing economic climate.

46
CHAPTER THREE
RESEARCH DESIGN AND METHODOLOGY
3.1 INTRODUCTION
According to Welman and Kruger (2000: 2), research methodology refers to “the application
of various methods, techniques and principles in order to create scientifically obtained
knowledge by means of objective methods and procedures within a particular discipline”.
Research methodology therefore refers to the techniques a researcher utilises to collect and
analyse the data. The methods must be systematic, reliable and the procedures followed must
be valid and purposeful (McMillan & Schumacher 1993: 27). Within the educational context,
research may inter alia be used to acquire a new or different perspective about education or
educational processes that generates ideas on how to approach a practical problem to aid
policy and decision making. Hence, this study is intended to advance knowledge and to
improve financial and educational practices at public primary schools.
Research design refers to a plan for selecting subjects, research sites and data collection
procedures to answer particular research question/s. The design indicates which individuals
will be studied and when, where and under which circumstances they will be studied
(McMillan & Schumacher 1993: 157). Research design is the plan and structure of the
investigation that will be used to obtain evidence to answer the research question/s. The
purpose of the research design is to provide results that will be judged to be credible.
This chapter provides an overview of the methodology employed in the design of the
empirical research. It focuses on the sampling design procedure, data collection method, and
the measuring instrument. Reliability and validity issues are also highlighted. Descriptive and
statistical techniques applied in the study are explained. Ethical considerations applicable to
this study are discussed. A brief discussion of the sampling design procedure follows.

47
3.2 THE SAMPLING DESIGN PROCEDURE
Malhotra and Birks (2004: 358) outline certain procedures that researchers can follow when
drawing a sample from a population. The steps are sequentially reflected in Figure 3.1. A
discussion of each of the steps is then pursued within the context of the current study.
Figure 3.1 Steps in the sampling procedure
Source: Malhotra and Birks (2004: 358) 3.2.1 Defining the population A population (sometimes called a target population) is the set of all elements. It is the large
group to which a researcher wants to generalize the sample results. (Johnson & Christensen
2004: 199). Best and Kahn (2006: 13) define a population as any group of individuals that
has one or more characteristics in common and that are of interest to the researcher. Hair,
Bush and Ortinau (2002: 328) views a population as an identified group of elements that are
of interest to the researcher and pertinent to infer something about the population.
For the purpose of this study, the population was restricted to the Ekurhuleni South District
in the Gauteng Province of South Africa. The Ekurhuleni South District is one of the fifteen
school districts within the province. The units of analysis were twenty five public primary
Determine the sample size
Select the sample elements
Define the target population
Identify the sampling frame
Select the sampling technique
48
schools located within this district. The Ekurhuleni South District has a total of one hundred
and sixteen public primary schools. In this study the names of the schools and the
respondents are anonymous. The reason for this is discussed in detail later in this chapter.
The elements chosen for the study comprised principals and members of the SGBs. The study
was also restricted among public schools that are within the ambit of the Department of
Education (DoE).
3.2.2 Identifying the sample frame
A sampling frame is a list of all the elements in a population (Johnson & Christensen
2004:199). A sample frame is a complete list on which each unit of analysis is listed only
once. Unless such a sampling frame is borne in mind, it is, in fact, impossible to judge the
representativeness of the obtained sample properly (Welman & Kruger, 2000: 49). The
sample should be representative of the sampling frame, which ideally is the same as the
population, but often differs due to practical problems relating to the availability of
information.
For the purpose of this study the sample frame consists of a list of primary schools in the
Ekurhuleni South District in the Gauteng Province of South Africa. This list was obtained
from the regional office of the Department of Education in Ekurhuleni.
3.2.3 Selecting the sampling technique A major decision on the choice of a sampling technique is whether to use a non-probability
or probability sampling. Non-probability sampling relies on the judgement of the researcher,
while probability sampling relies on chance (Malhotra & Birks, 2004: 360).
Non-probability sampling techniques include convenience, volunteer, purposeful and
snowball sampling (Best & Kahn 2006: 18). This study made use of purposive sampling.
With purposive sampling, researchers rely on their experience and ingenuity to deliberately
obtain units of analysis in such a manner that the sample they obtain may be regarded as
being representative of the relevant population (Welman & Kruger 2000: 63). The sample
chosen by the researcher is representative of the population because it included public
schools that were located in surburbs, in rural areas, in township areas as well as in urban
areas within the Ekhurleni South district. The schools also comprised of former Model C
schools as well as ordinary public schools. The basis of this sampling technique is that the

49
sample units should meet certain criteria which are appropriate to the successful completion
of the investigation (Webb, 2002: 57).
A purposive sample of twenty five schools was selected for this study. Criteria for the sample
were threefold: the selected schools were public schools; they were primary schools and the
schools were located in the Ekurhuleni South District of the Gauteng Department of
Education.
3.2.4 Determining the sample size Since the sample size formulas cannot be appropriately used for non-probability samples, the
determination of the necessary sample size is usually a subjective, intuitive judgement made
by the researcher based on past studies (Zikmund 2000: 519). Webb (2002: 59) is of the view
that sample size primarily depends on the degree of accuracy that is needed, i.e. the sample
must be representative of the population with respect to the characteristics/variables of
interest. The author further re-iterates that the accuracy depends upon two characteristics of
the population namely:
The degree of variability in the population: populations which have high degrees of
heterogeneity require larger sample sizes than those populations which are more
homogeneous.
The presence of population subgroups: the sample must be large enough to allow for
valid analysis of any subgroups that may be present in the population.
Churchill (2001: 521) asserts that one of the methods used by researchers is to determine the
sample size used by similar studies in the past (i.e. the historical evidence approach). Based
on previous studies on school finances, undertaken by Mestry (2004: 126), who conducted
four focused interviews in four schools in Gauteng, and Bisschoff and Sayed (1999: 312)
who interviewed six individual school principals from the South of the Gauteng, the sample
size of twenty five schools were deemed adequate.
As public primary schools have similar characteristics, a sample of twenty five selected
public primary schools can provide accurate details. Although 25 schools were selected from
a possible of 116 schools, these schools merely formed the unit of analysis. Whilst the
respondents were purposively selected, the 25 schools were selected at random in order to
avoid sampling error in the selection process. A total of 21% of the schools were surveyed.
50
During the sampling process, the researcher ensured an equitable representation of principals,
chairpersons, treasurers, and secretaries of SGBs. In addition, the population was limited to
principals and SGBs in order to reduce variability within the sample in terms of the
characteristics of the respondents. With 116 schools in the region and each comprising the
principal, chairperson, treasurer and secretary, the total population for the study was 464
possible respondents. A total of 83 questionnaires that were analyzed represent
approximately 18% of the true total population which is a reasonable sample size. In the
absence of a yardstick for the calculation of sample sizes for non-probability sampling and
previous samples used with specific reference to the management of finances and the
budgetary process in primary schools in a South African context, the researcher based the
estimate of the sample sizes from previous studies using educators. Based on the quantitative
studies of O’Conner and Geiger (2009:257) with n = 80 and Putter (2003:30) n=40 the
sample seems consistent with previous studies.
The schools selected were based on the criteria that each had to be a public school, each a
primary school and each school had to be located within the designated area in order to avoid
contamination in the data collection and the sample. In addition this study is limited in its
scope in terms of the population being investigated.
3.2.5 Selecting the sampling elements
A sampling element is the unit of analysis or case in a population. It can be a person, a group,
an organization, or a written document that is being measured (Neuman 2006: 224).
Execution of the sampling process requires a detailed specification of how the sample design
decisions with respect to the population, sampling unit, sampling frame, sampling technique
and sample size are to be implemented. The researcher identified all the relevant principals
and members of the SGB’s in the twenty five schools as sampling elements in order to ensure
that the correct persons were contacted.

51
3.3 DATA COLLECTION METHOD AND MEASURING INSTRUMENT
The survey method was employed to obtain the data. In a survey method the researcher
receives data from the sample of respondents. According to Webb (2002: 66) the following
factors have to be considered when making use of the survey method:
versatility: the ability of the research approach to adapt the data collection method to
the specific needs of the project or of the respondents,
available budget,
constraints of time,
sample control, i.e. the ability of the communication method to reach the stipulated
units in the sampling plan effectively and efficiently,
what quantity of data needs to be collected, and
what quantity of data needs to be collected: i.e. the extent to which that collected data
is free from potential bias resulting from the use of a particular communications
approach.
Taking cognizance of the above mentioned factors, a structured questionnaire was used as
measuring instrument in the data collection. A questionnaire is a self report data collection
instrument that each research participant completes as part of a research study (Johnson &
Christensen 2004: 164). The questionnaire is a versatile tool for researchers. Questionnaires
are common techniques for data collection in educational research. Questionnaires require
subjects to respond to written questions. The questions are designed to elicit information
about thoughts, feelings, values, perceptions, reactions, beliefs and attitudes. Researchers
attempt to measure many different kinds of characteristics using questionnaires. The
researcher constructs a set of relevant questions and presents it to the subject to answer. The
content and organization of the questionnaire will correspond to the research objectives.
Questionnaires may include multiple questions and statements.
A fully structured questionnaire (see Appendix C) was chosen for this study as it ensures a
standardized data collection procedure so that the data obtained are internally consistent and
can be analysed in a uniform and coherent manner (Boyce, 2002: 318). The questionnaire
comprises five sections, namely:
Section A - biographical information such as gender, educational experience,
financial experience and current position held at the school,

52
Section B - questions aimed on gathering data on school details,
Section C - questions aimed on gathering data on school fees
Section D - questions aimed at gathering data on the budget and the budgetary
planning process
Section E - questions aimed at gathering information on financial management.
, and finally
In sections A and B, multiple choice and dichotomous types of questions were used. In
sections C, D and E, a 5-point Likert scale was used which required respondents to indicate a
degree of agreement or disagreement with a series of statements. The scale was anchored
with 5 implying strong agreement and 1 implying strong disagreement. The motivation for
the use of such scales was based on the premise that these scales can be analysed on an item-
by-item basis (profile analysis) or a total (summated) score may be calculated for each
respondent by summing across items (Malhotra & Birks, 2004: 304). In addition reverse
scores can be computed for negatively worded statements. Finally, Likert scales are easy to
construct and administer and respondents readily understand how to use the scale, making it
suitable for the current study.
The Financial Management Questionnaire was administered to all twenty five schools in the
fourth school term in 2008. The questionnaire was addressed to the chairperson of the school
governing body. In each case, the purpose of the questionnaire and explicitly clear
instructions for the completion of the questionnaire was attached to the questionnaire. The
requirement was that the principal, chairperson of the school governing body and the
treasurer (or all members of the financial committee) must each complete the questionnaire
over a two-week period. Each completed questionnaire was to be handed to the
administrative clerk at each school. The completed questionnaire was collected from the
administrative clerk of each of the twenty five
schools. Three days prior to the due date, a
courtesy telephone call was made to the school administrative clerk to confirm the
appointment for the collection of the questionnaires.
3.4 PILOT QUESTIONNAIRE
Piloting is the process of testing a questionnaire before a survey commences to make sure
that any errors are identified and then corrected (Boyce, 2002: 371). Hence piloting provides
a final pre-survey assurance that the questionnaire contains no errors and to affirm that the

53
questionnaire captures the information sought by the researcher (Malhotra & Birks, 2004;
345).
Pilot-testing was undertaken with 20 respondents from public schools, which were drawn
randomly from schools within the Ekurhuleni South District. In addition, pre-testing was
undertaken by vetting the questionnaire with two academics who are engaged in research in
the field of education. This was followed by a process of debriefing where the researchers
requested the respondents to share their thoughts about the questions, their answers and any
shortcomings in the questionnaire. Whilst the respondents were drawn from the same
population, they were not part of the main sample survey in order to avoid duplication of
sample elements.
3.5 VALIDITY AND RELIABILITY
McMillan and Schumacher (1993:157) define validity as the degree to which scientific
explanations of phenomena match the realities of the world. Validity refers to the truth of
propositions that are generated by research. Validity is the degree to which a test measures
what it is supposed to measure. Several techniques are used to access the validity of a
measuring instrument; criterion-related validity, construct validity, convergent validity and
discriminant validity.
According to McMillan and Schumacher (1993: 227) reliability refers to the consistency of
measurement, the extent to which the results are similar over different forms of the same
instrument or occasions of data collecting. Best and Kahn (2006: 289) define reliability as the
degree of consistency that the instrument or procedure demonstrates. According to Malhotra
and Birks (2004: 313) reliability refers to the extent to which a scale produces consistent
results if repeated measurements are made.
Figure 3.2 provides an overview of the various types of validity and reliability measures.
Although the exhibit treats validity and reliability as being independent of each other, there is
actually a one-way relationship between them. A scale must be reliable to be valid: it does
not have to be valid to be reliable (Shao 2002: 249). Hence, reliability and validity are two
standard criteria for assessing the appropriateness of any measuring instrument.

54
Figure 3.2 Types of Reliability and Validity
Source: Shao (2002:249)
As seen in the table above various forms of reliability exist in literature, namely, test-retest,
alternative forms, and internal consistency reliability. There are also various types of validity,
namely, content related, criterion related and construct related validity.
Internal consistency reliability refers to how consistently the items on a test measure a single
construct or concept (Johnson & Christensen 2004: 136). Two commonly used approaches to
measuring internal consistency are split-half reliability and coefficient alpha. Split-half
reliability refers to a measure of the consistency of the scores obtained from two equivalent
halves of the same test. Coefficient alpha refers to a formula that provides an estimate of the
ASSESSING MEASUREMENT INSTRUMENTS
RELIABILITY VALIDITY
Test-Retest
Alternative forms
Internal consistency Content
Criterion related
Construct
Split Half
Coefficient alpha
Concurrent Predictive Convergent Discriminant

55
reliability of a homogenous test or an estimate of the reliability of each dimension in a
multidimensional test (Johnson & Christensen 2004: 137-138).
Content related validity refers to evidence based on a judgement of the degree to which the
items, tasks, or questions on a test adequately represent the construct domain of interest
(Johnson & Christensen 2004:137). McMillan and Schumacher (1993:224) are of the view
that it is important to establish content related evidence for research involving achievement.
Construct validity refers to the extent to which a higher-order construct is accurately
represented in the particular study (Johnson & Christensen 2004: 247).Construct related
evidence is of primary importance with instruments that assess a trait or theory that cannot be
measured directly( McMillan & Schumacher 1993:225).
Criterion related validity refers to evidence based on the extent to which scores from a test
can be used to predict or infer performance on some criterion such as a test (Johnson &
Christensen 2004: 144). McMillan and Schumacher (1993:224) are of the view that the value
of criterion related validity evidence depends on the appropriateness and quality of the
criterion.
Johnson & Christensen (2004:146) refer to predictive evidence as evidence based on the
relationship between test scores collected at one point in time and criterion scores obtained at
a later time. Convergent evidence is validity evidence based on the relationship between the
focal scores and independent measures of the same construct. Discriminant evidence exists
when test scores on your focal test are not highly related to scores from other tests that are
designed to measure theoretically different constructs (Johnson & Christensen 2004:145-
146).
This study made use of internal consistency reliability which is suitable for summated scales
such as the Likert scale used in the study. The widely used form of internal consistency
reliability is the coefficient alpha (Cronbach α). This is discussed in detail in chapter four.
This method was also chosen as it requires only one administration of the questionnaire and
consequently is supported to be most effective, especially in field studies. The Cronbach
alpha is the average of all possible split-half coefficients resulting from different ways of
splitting the scale items. This coefficient varies from 0 to 1, and a value of 0.6 or less

56
generally indicates unsatisfactory internal consistency reliability. Thus an instrument with no
reliability will score 0 or close to 0 and an instrument with high reliability will score close to
1.
This study made use of the following types of validities: Content validity: Often referred to as face validity which is a subjective but
systematic evaluation of how well the content of a scale represents the measurement
task at hand (Malhotra & Birks, 2004: 314). One way to judge the validity of a scale
is to request professional or experts on the test topic to assess the scale (Shao 2002:
245). Content validity in this study was ensured during the pre-testing stages. This
test of validity is highly subjective, because the personal experiences and beliefs of
the expert’s inevitability come into play. Given the subjective nature of content
validity; it is not a sufficient measure of the validity of the scale.
Convergent validity: Convergent validity is the extent to which the scale correlates
positively with other measurements of the same construct. Convergent validity in this
study was assessed using simple correlation from the data obtained from sections D
(Budgeting process) and E (financial planning).
Reliability and validity are essential to the effectiveness of any data-gathering procedure
(Best & Kahn 2006: 288). This study made use of a questionnaire for data gathering.
According to Best & Kahn (2006: 324) basic to the validity of a questionnaire is asking the
right questions phrased in the least ambiguous way. Hence it is essential that the researcher
asks the right questions, i.e. the questions must relate to the research problem and objectives
of the study. The questions should not be ambiguous. The meaning of all terms must be
clearly defined so that they have the same meaning to all respondents. Researchers should try
to get colleagues or experts in the field of inquiry to peruse the questionnaire and offer
suggestions. The researcher can ask the experts to rate the instrument in terms of how
effectively it samples significant aspects of its purpose. In this way ambiguities and items
that do not contribute to the purpose of the questionnaire may be removed.

57
3.6 DATA AND STATISTICAL ANALYSIS
The following procedures were used in the data analysis.
3.6.1 Frequency distributions: A frequency distribution, is a systematic arrangement of
data values in which the data are rank ordered and the frequencies of each unique data
value are shown (Johnson & Christensen 2004:436).
The final questionnaire comprised fifty three items, grouped into five sections. A total
of one hundred questionnaires were distributed. Eighty three questionnaires were
returned. Data was analysed using the Statistical Package for Social Sciences (SPSS
– version 16.0 for windows) by a statistician. The statistician used descriptive and
statistical procedeures. The findings are reported in chapter four.
3.6.2 Correlations: Correlation was used to summarize the strength of association between
two variables. If a relationship is present between two variables, it is important to
know the direction of the relationship. The direction of the relationship can either be
positive or negative. The strength of a relationship is generally categorized as non-
existent, weak, moderate or strong (Hair, et al. 2002: 562). If a consistent and
systematic relationship is not present, then the strength of an association is non-
existent. A weak association means that there is a low probability of the variables
having a relationship. A strong association means that there is a high probability of a
consistent and systematic relationship.
The Pearson product-moment correlation coefficient was used to determine the level of
association between variables. This is discussed in detail in chapter four
.
The above analysis was conducted using SPSS (Statistical Package for Social Sciences)
version 16.0 for windows.

58
3.7 APPLICATION OF RESEARCH ETHICS
Ethics is the principles and guidelines that assist researchers to uphold the things they value.
(Johnson & Christensen 2004: 94). Research ethics are basically a set of principles which
guide and assist researchers in conducting ethical studies.
Ethical guidelines (as outlined by the American Educational Research Association (AERA)
(Johnson & Christensen, 2004:118-119) that needs to be followed by educational researchers
are outlined below. Only those issues relevant to this study are discussed.
The necessity of obtaining informed consent. A person can only participate in a
research study when one has agreed to participate and has been provided with all the
information that would influence one’s willingness to participate. Deception,
however, may be used if full disclosure will alter the outcome and invalidate the
results of the study. The researcher must justify the deception. Deception must be
revealed during a debriefing session (Johnson & Christensen 2004:118). It is an
ethical norm in research that no one is forced to participate in a research study. For
the purpose of this study consent was sought from the district director, Ekurhuleni
South Region (see Appendix A) to undertake this study in this region.
All principals and chairpersons of school governing bodies were informed via a letter
(see Appendix B) of all the features and purpose of the study.
Freedom to withdraw. The research participants must be informed that they are free
to withdraw from the research study at any time without any penalty (Johnson &
Christensen 2004:119). In this study, respondents were encouraged but not forced to
participate in the study.
Confidentiality and anonymity. Anonymity means that the identity of the participants
is not known to the researcher. Confidentiality means that the participant’s identity,
although known to the research group, is not revealed to anyone besides the
researcher (Johnson & Christensen, 2004:119). Confidentiality and anonymity are
important to avoid connecting the participant with any information that would be
embarrassing or harmful. Confidentiality and anonymity are also important because it

59
is impossible to know how people might interpret responses or what responses might
have adverse consequences for the participant (Johnson & Christensen 2004: 112). In
view of these facts the name of the school or the name of the respondents are not
revealed and not recorded on the questionnaire used in this study. Therefore it was
necessary to use code names for the different schools. In addition confidentiality and
anonymity was assured by using aggregate scores in data analysis. Principals and
chairpersons of school governing bodies were assured that their responses on the
questionnaire will not be identified by anyone else (see Appendix B
). Principals and
chairpersons of school governing bodies were also given the assurance that their
responses to the questionnaire will be treated in the strictest confidence and their
rights would not be violated (see Appendix B).
Hence, this research study has complied with all the above listed ethical guidelines to
ensure that this study is ethically sound in all aspects.
3.8 SUMMARY
In this chapter the research methodology applied, namely, the sampling procedure, data
collection, reliability and validity, data analysis and the adherence of the various ethical
issues were explored.

60
CHAPTER FOUR
RESEARCH FINDINGS
4.1 INTRODUCTION
The preceding chapters provided an introduction and background, a theoretical perspective
and methodology for the study. Issues relevant to financial management in public primary
schools were reflected in these chapters. The objective of this chapter is to report on these
research findings. The analysis was conducted using the Statistical Package for Social
Sciences (SPSS), version 16.0 for Windows. Data analysis was undertaken in two phases.
Firstly pilot testing the questionnaire was conducted. This was followed by an analysis of the
main survey findings. Descriptive analysis of the main survey was undertaken using pie
charts, bar charts and tables.
The questionnaire used in the main research study (see Appendix C) comprised five sections:
Section A relates to the biographical details of the respondents, Section B relates to school
details, Section C relates to school fees, Section D relates to budgetary planning and Section
E relates to aspects of financial management. The responses to the different questions in each
section are reported in the sections which follow after the discussion of the pilot study.
All data necessary for this research study was collected and presented in a tabular or
graphical format for easy reading and understanding. The simplicity of the presentation in
this form is guided by the assumption, that the findings and recommendations presented here
are useful to school principals/managers, SGB members, policy makers within the ministry
of education and other stakeholders requiring simple and useful information to guide
financial planning and management.
4.2 THE PILOT STUDY
A pilot survey was conducted, prior to the actual survey, to ensure that the questionnaire
contained no errors and to affirm that the questionnaire captured the information sought by
the researcher. In the preliminary pilot survey twenty questionnaires were administered. The
questionnaire consisted of four sections. The first section captured the respondents’ gender,

61
their current positions at the school, their qualifications, their involvement with public
primary education and their understanding of accounting/finance.
The second section related to the payment of school fees, legislation regarding the exemption
from paying school fees, determination of school fees, and consultation of parents before
levying school fees, school fee accounts that are outstanding, incentives that are offered to
parents for full payment of school fees and the monitoring of the collection of school fees by
the SGB.
Section three included elements of budgetary planning, drawing up the school budget in
consultation with all stakeholders, the SGB managing the finances of the school, the
budgeting system used by the school, inclusion of funds received from the state in the school
budget, the calculation of budget estimates, the school having a good cost saving and an
effective expense monitoring mechanism in place, the strict adherence to the budget and the
annual presentation of the school budget to parents for approval.
The fourth section pertained to financial planning. It consisted of questions the on the
schools’ financial policy, consultation of all stakeholders in drawing up of the financial
policy, the direction the financial policy provides on the use of funds and resources, the role
played by the SGB in fund raising, the schools’ bank and investment accounts, the amount of
petty cash kept by the finance officer, the system used to monitor the use of petty cash, the
provision of audited financial statements annually to the GDE, the existence of a duly elected
finance committee, financial irregularities and the schools’ strategic plan.
The questionnaires were completed by principals and members of financial committees at
various schools within the Ekurhuleni South District. Changes were made to the
questionnaire in terms of question format, phrasing and content for the main survey. In the
main survey the number of sections changed from four to five, the number of items increased
from forty three to fifty three, making the content more specific, and individual items were
rephrased to be more precise.

62
4.3 MAIN SURVEY
Findings from the main survey are summarized and these are discussed in the sections that
follow.
4.3.1 Data Gathering Process
Questionnaires were sent to twenty five public primary schools in the Ekurhuleni South
District. This study made use of purposive sampling. Criteria for the sample were threefold:
the selected schools were public schools, they were primary schools and the schools were
located in the Ekurhuleni South District of The Gauteng Department of Education.
The final questionnaire comprised of fifty three items, grouped into five sections. A covering
letter was distributed with the research instrument to encourage the respondents to co-operate
in the survey (Appendix B). A total of one hundred questionnaires were sent out to public
primary schools in the Ekurhuleni South District. Of the questionnaires that were distributed
eighty three were returned. Seventy nine of these questionnaires were properly completed.
4.3.2 Section A – Biographical Details Of Respondents
Figure 4.1 Gender of the respondents
Gender
52%
47%
1%
Males FemalesMissing data

63
Figure 4.1 sets out the gender of the respondents. There were more male (52%) than female
respondents (47%) in the sample. The missing data represents the one percent of the
respondents who did not answer this question.
Figure 4.2 Respondents’ current position held at school
Figure 4.2 indicates that 25 % of the questionnaires were completed by chairpersons of
SGBs. Thirty six percent
of the questionnaires were completed by principals, twenty two
percent were completed by treasurers of SGBs and thirteen percent of the respondents were
secretaries of the SGB at the selected schools. Four percent of the respondents did not
answer the question that required them to indicate the positions they currently hold at their
schools.

64
Table 4.1 Respondents’ involvement with public primary education
Involvement in Education Frequencies Percentage %
1-5 years 25 30
6-10 years 22 27
11–15 years 9 11
16-20 years 7 8
More than 20 years 20 24
Total 83 100
The majority (30% + 27% + 11% + 8%= 76%) of the respondents in the study were involved
with public primary education for between 1 and 20 years. Twenty four percent of the
respondents were involved with public primary education for more than twenty years.
Figure 4.3 Respondents’ understanding of financial management
Understanding of Financial Management
0
10
20
30
40
50
60
Limited Fair Good Excellent
Percentage %
In answering the question on the respondents’ understanding of financial management, the
following results were obtained: 70 percent (20% + 50%) of respondents have a good to an
excellent understanding of accounting/finance. According to their perceptions thirty percent
(2% + 28%) of respondents consider themselves to have a limited to fair understanding of
financial management. In their research, Bisschoff and Sayed (1999: 310-315) have noted

65
that one of the obstacles, encountered in fulfilling financial school management functions,
was the lack of relevant knowledge and information amongst parents, governing body
members and principals.
Figure 4.4 Respondents’ Qualifications
0
5
10
15
20
25
30
35
Qualifications
percentage 32 30 16 14 7 1Matric Diploma Degree Honours Masters Missing
The above statistics in figure 4.4 indicate that many of the respondents, although all are
involved in management or governance of schools, have limited levels of education.
Approximately thirty two percent of the respondents were in possession of a matriculation
certificate. Similar findings have been made by Segoati (2006:36) who found that parents
cannot contribute to financial management of the school because of a lack of skills,
knowledge and training. This view was also supported by Motha (2006:37), who found that
SGBs experience difficulty in managing funds because of a lack of experience and training.
Mestry (2006:126-132) examined the competences needed by effective governing bodies and
noted their lack of capacity and experience to play an active role in the school budgeting
process. One percent of the respondents did not answer this question.

66
4.3.3 Section B - School Details
Figure 4.5 Location of the school
Location of the Schools
51%
19%
28%
2%
SuburbRuralTownshipUrban
Fifty one percent of the schools in this survey were located in a suburb, 19 percent in a rural
area, 28 percent were in the township areas and 2 percent were in urban city centre areas.
Figure 4.6 Former model C institutions
Thirty four percent of the schools in this survey were former model C institutions and 66
percent of the schools were ordinary public schools.
Former Model C Institutions
34%
66%
Former Model COrdinary Public Schools

67
Figure 4.7 Residence of the learners
Residence of the Learners
65%
33%
2%
Near Away missing
Sixty five percent of the learners enrolled at the schools used in the survey reside within the
vicinity of the school and walk to and from the school. Thirty three percent of the learners
reside away from the school and use public transport to and from the school. The missing
data refers to the two percent of respondents who did not answer this question.

68
4.3.4 SECTION C: SCHOOL FEES
Figure 4.8 School fees are charged at the school as a resolution to do so has been
adopted by majority of parents
05
1015202530354045
Parents are liable for School Fees
Percentage %
Percentage % 16.9 3.6 6 24.1 44.6
Strongly Disagree Disagree Neutral Agree Strongly
Agree
Missing = 4.8%
A large proportion of the respondents (44.6% + 24.1% = 68.7%) have indicated that school
fees are charged at their schools as a resolution to do so has been adopted by a majority of
parents. Approximately four percent of the respondents chose not to respond to this
statement. About 20% (16.9% + 3.6%) of respondents have provided a negative response to
the statement, possibly
implying that these may be from no fee schools. School fees are
probably not charged, at these public schools, because they form part of the “poorest of the
poor schools” and have been declared as no fee schools by the department of education.
Recommendations pertaining to the charging of school fees are discussed in the next chapter.
69
Figure 4.9 Parents of learners at the school are consulted annually before school fees
are levied.
Parents are consulted before school fees are levied
0
10
20
30
40
50
60
Percentage %
Percentage % 18.1 1.2 7.2 18.1 50.6
Strongly Disagree Disagree Neutral Agree Strongly
Agree
With reference to the total sample, sixty nine percent (50.6% + 18.1%) of the respondents
were certain that parents of learners at their respective schools were consulted annually
before school fees were levied. Nineteen percent (18.1% + 1.2%) of respondents indicated
that parents were not consulted annually prior to school fees being levied. The possible
reason for the non-consultation of parents could be that the members of the SGB at these
ordinary public schools are oblivious to this requirement that is stipulated in SASA. The non-
consultation of parents pertaining to the levying of school fees is in contradiction with SASA
and recommendations pertaining to this aspect are presented in the next chapter.

70
Table 4.2 Parents of learners at the school are informed of the equitable criteria
and procedures for exemption from paying school fees.
Parents are informed of
criteria for exemption
from paying school fees
Frequencies Percentage
Strongly disagree 13 15.7
Disagree 0 0
Neutral 8 9.6
Agree 15 18.1
Strongly agree 43 51.8
TOTAL 79 95.2
Missing: 4
Table 4.2 provides the overall views of the total sample, relating to whether parents are
informed of the equitable criteria and procedures for the total, partial or conditional
exemption to pay school fees. Sixty nine percent (51.8% + 18.1%) of respondents were
certain that parents are informed of the equitable criteria and procedures for the total, partial
or conditional exemption of parents who are unable to pay school fees, and 15.7 percent of
respondents indicated that the parents were not informed of these criteria and procedures.
The parents are probably not informed of these criteria because the SGB has failed to keep
them informed. The missing data refers to the approximately four percent of the respondents
who chose not respond to this statement.
Table 4.3 Parents of learners at the school are liable for the payment of school fees.
Parents are liable for the
payment of school fees
Frequencies Percentage %
Strongly disagree 13 15.7
Disagree 5 6
Neutral 6 7.2
Agree 11 13.3
Strongly Agree 44 53
Total 79 95.2
Missing: 4

71
Sixty six percent (53% + 13.3%) of respondents indicated that parents of learners at the
school were liable for the payment of school fees. Twenty one percent (15.7% + 6%) of
respondents disagreed with this statement possibly indicating that these may be from no fee
schools (i.e. forming part of the ordinary public schools that have been declared poorest of
the poor schools
by the department of education) and parents are therefore not charged
school fees. Some respondents (about 4%) chose not to respond to this statement.
Recommendations pertaining to the payment of school fees are made in chapter five.
Table 4.4 School fees are determined after a careful analysis of the operational
requirements of the school
School fees are
determined after a careful
analysis of the operational
requirements
Frequencies Percentage %
Strongly disagree 13 15.7
Disagree 2 2.4
Neutral 5 6
Agree 17 20.5
Strongly Agree 42 50.6
Total 79 95.2
Missing: 4
The majority of the respondents (50.6% + 20.5% = 71.1%) indicated that school fees were
carefully determined after a careful analysis of the operational requirements of the school.
Four respondents did not answer this question. About eighteen percent (15.7% + 2.4%) of
respondents were of the view that operational requirements are not carefully examined prior
to school fees being determined. This negative response could be attributed to lack of insight,
of members of SGBs, in
financial management.

72
Table 4.
5 Rules and procedures for handling school fees, post dated cheques etc.
are clearly outlined in the school’s financial policy.
Rules and Procedures for
handling school fees, post
dated cheques etc. are
outlined in the school’s
financial policy
Frequencies Percentage %
Strongly disagree 9 10.8
Disagree 2 2.4
Neutral 8 9.6
Agree 29 34.9
Strongly Agree 31 37.3
Total 79 95.2
Missing: 4
Table 4.5 indicates a highly positive response to the statement that rules and procedures for
handling school fees; post dated cheques etc. are clearly outlined in the schools’ financial
policy. Seventy two percent (37.3% 34.9+ %) of respondents provided a positive response
and thirteen percent (10.8% + 2.4%) responded negatively, implying that, rules and
procedures for handling school fees, post dated cheques etc. are not clearly outlined in the
financial policy of these schools. Mestry (2004: 126) has found that there are many principals
and SGB members, who lack the necessary financial knowledge and skills, are placed under
tremendous pressure, because they are unable to work out practical solutions to problems.
Mestry has further reported that “in many instances principals and school governing bodies
have been subjected to forensic audits by the department of education due to the
mismanagement of funds through misappropriation, fraud, theft and improper control of
financial records. Many of these “instances” can be minimized if procedures are outlined in
the schools’ financial policy and decisions are guided by policy.

73
Table 4.6 Most parents school fee accounts are up to date.
Most parents school fee
accounts are up to date
Frequencies Percentage %
Strongly disagree 21 25.3
Disagree 23 27.7
Neutral 17 20.5
Agree 12 14.5
Strongly Agree 6 7.2
Total 79 95.2
Missing: 4
Table 4.6 shows a varied response. Twenty one percent (7.2% + 14.5%) of respondents have
shown that most parents’ school fee accounts are up to date. Fifty three percent (25.3% +
27.7%) of respondents have shown that most parents’ school fee accounts were not up to
date. This high percentage indicates that there are many parents who are probably
experiencing financial difficulties, and possibly don’t see the payment of school fees as one
of their top priorities. About four of respondents chose not to respond to this statement.
Table 4.7 Parents are offered incentives for the full payment of school fees
by a stipulated date
Parents are offered
incentives
Frequencies Percentage %
Strongly disagree 24 28.9
Disagree 7 8.4
Neutral 9 10.8
Agree 20 24.1
Strongly Agree 19 22.9
Total 79 95.2
Missing: 4
The responses indicate that in about forty seven percent (22.9% + 24.1%) of the schools in
this research survey, parents were offered incentives for the full payment of school fees by a

74
stipulated date. Thirty seven percent (28.9% + 8.4%) of respondents provided a negative
response, implying that at these schools parents were not offered incentives for the full
payment of school fees by a stipulated date. About ten percent (10.8%) of respondents (most
likely from ordinary public schools) have provided a neutral response possibly indicating that
these may be no fee schools. Approximately four percent of respondents did not respond to
this statement.
Table 4.8 Parents whose school fee accounts are outstanding are handed over to
debt collectors after three months
Parents whose school fee
accounts are outstanding
are handed over to debt
collectors
Frequencies Percentage %
Strongly disagree 29 34.9
Disagree 12 14.5
Neutral 12 14.5
Agree 7 8.4
Strongly Agree 19 22.9
Total 79 95.2
Missing: 4
Table 4.8 shows that thirty one percent (22.9% + 8.4%) of respondents provided a positive
response, implying that parents whose school fee accounts are outstanding were handed over
to debt collectors after three months. As schools are dependent on the income from school
fees to function optimally, it becomes necessary for schools to take drastic action and refer
outstanding accounts to debt collectors. Forty nine percent (34.9% + 14.5%) have revealed
that parents whose school fee accounts were outstanding were not handed over to debt
collectors after three months. These schools probably hand over outstanding accounts at a
later stage (end of the school financial year) or have other means of enforcing payment of
school fees. Approximately four percent of respondents did not provide a response to this
statement, whereas fourteen percent of respondents provided a neutral response possibly
implying that they may not be collecting school fees at these schools.

75
Table 4.9 School fees that are outstanding for more than a year are written off.
School fees that are
outstanding for more than
a year are written off
Frequencies Percentage %
Strongly disagree 21 25.3
Disagree 17 20.5
Neutral 21 25.3
Agree 11 13.3
Strongly Agree 9 10.8
Total 79 95.2
Missing: 4
Table 4.9 reveals that only twenty four percent (10.8% + 13.3%) of respondents have
indicated that school fees that are outstanding for more than a year, at their respective schools
are written off. Forty five percent (25.3% + 20.5%) of respondents disagreed with the
statement. This indicates that school fees that are outstanding for more than a year, at these
institutions are not written off, and are thus carried forward. A few respondents (4%) did not
provide a response to this statement.
76
Figure 4.10 The SGB monitors the collection of school fees closely
0
5
10
15
20
25
30
35
StronglyDisagree
Disagree Neutral Agree StronglyAgree
SGB Monitors the Collection of School Fees
Percentage %
The responses show that in about 60% (34.9% + 25.3%) of the schools in this research
survey, the collection of school fees is closely monitored by the SGB. Thirteen percent of
respondents provided a neutral response. These responses are most likely from “no fee”
schools. Twenty two percent (14.5% + 7.2%) of respondents have revealed that the SGB does
not monitor the collection of school fees closely, at their respective schools. These findings
affirm the Ministerial Review Committee’s report (2004: 104), which cited that “SGBs do
not regularly and consistently manage the challenge of fund raising and monitoring school
fees.” In
the recommendations in the following chapter this issue will receive further
attention.

77
4.3.5 Section D: Budgetary Planning
Table 4.10 The SGB prepares a budget annually showing the estimated income and
expenditure of the school for the following year
SGB prepares a budget
showing estimated income
and expenditure
Frequencies
Percentage %
Strongly disagree 0 0
Disagree 1 1.2
Neutral 6 7.2
Agree 26 31.3
Strongly Agree 50 60.2
Total 83 100
The high positive responses (91%) imply that in most schools the SGB prepares a budget
annually showing the estimated income and expenditure of the school for the following year.
However, one percent of respondents disagreed with this statement and seven percent have
provided a neutral response. These responses are most likely from ordinary public schools.
These responses indicate
d that there are some schools were budgets are not prepared by
SGBs.
Table 4.11 The school budget is drawn up annually in consultation with all
stakeholders
School budget drawn up
in consultation
Frequencies Percentage %
Strongly disagree 5 6
Disagree 4 4.8
Neutral 11 13.3
Agree 21 25.3
Strongly Agree 42 50.6
Total 83 100

78
The majority of the respondents (50.6% + 25.3% = 75.9%) provided a positive response,
showing that the school budget is drawn annually in consultation with all stakeholders. This
indicates that most schools do in fact, consult all stakeholders in the budgetary planning
process. However, the table also shows that there are 10.8% of respondents who did not
agree with this statement. This indicates that there are schools where the budget is drawn up
without the involvement of all stakeholders. This links to the findings made by Bush
(2006:13), where it was noted that “there is ambiguity that surrounds the budgeting process”
The 10.8% negative response is most likely to have come from ordinary public schools
located in the rural areas, where parents are not so keen to become thoroughly involved in
their children’s education.
Table 4.12 The budgeting system that is used by the school is easy to follow
Budgeting system used is
easy to follow
Frequencies Percentage %
Strongly disagree 2 2.4
Disagree 1 1.2
Neutral 11 13.3
Agree 23 27.7
Strongly Agree 46 55.4
Total 83 100
Table 4.12 indicates that eighty three percent (55.4% + 27.7%) of respondents have found
that the budgeting system used by the school is easy to follow. Only three percent (2.4% +
1.2%) of respondents indicated that the budgeting system used at their respective schools was
not easy to follow. This may be due to the low levels of education of respondents in the
sample.

79
Figure 4.11 Funding received from the state is included in the budget
Funds Received from the State is included in the Budget
0
10
20
30
40
50
60
70
StronglyDisagree
Disagree Neutral Agree StronglyAgree
Percentage %
A large proportion of respondents (62.7% + 26.5% = 89.2%) have indicated that funds
received from the state are included in the budget. Eight percent (8.4%) of respondents
provided a neutral response to the statement. A small percentage (2.4%) of respondents
strongly disagreed with this statement, indicating that funds received from the state are not
included in the budget. These findings are in congruence with the findings made by Bush
(2006:13) which revealed that “principals often do not know what proportion of notional fee
income will actually be received and this makes it difficult to construct an appropriate
budget.”
Table 4.13 The money raised through the various fund raising events/ activities during
the year is included in the budget
Money raised through
fund raising activities is
included in the budget
Frequencies Percentage %
Strongly disagree 7 8.4
Disagree 7 8.4
Neutral 11 13.3
Agree 19 22.9
Strongly Agree 39 47
Total 83 100

80
Sixty nine percent (47% + 22.9%) of respondents provided a positive response, indicating
that money raised through the various fund raising events/ activities during the year is
included in the budget. Thirteen percent have provided a neutral response. Sixteen percent
(8.45 + 8.4%) have indicated that money raised via the various fund raising events/ activities
are not included in the budget. These responses could most likely come from ordinary public
schools and could be indicative of a lack of knowledge concerning good financial
management practices. Good financial management practices are discussed in further detail
in chapter five.
Table 4.14 The annual budget is broken down into time periods, e.g.
per school term
Budget is broken down
into time periods
Frequencies Percentage %
Strongly disagree 13 15.7
Disagree 11 13.3
Neutral 21 25.3
Agree 17 20.5
Strongly Agree 21 25.3
Total 83 100
The majority of schools do break the annual budget into time periods. This is evident in table
4.14 which indicates that forty five percent (25% + 20%) of the respondents agreed with the
statement that the annual budget is broken down into time periods. Twenty eight percent
(15% + 13%) of respondents
have indicated that the annual budget is not broken down into
time periods, at their respective schools.

81
Figure 4.12 The budget estimates are calculated using the previous year’s actual
figure
Budget Estimates are Calculated using Last Years Actual Figure
0
5
10
15
20
25
30
35
40
45
StronglyDisagree
Disagree Neutral Agree StronglyAgree
Percentages %
The responses reflected in the above graph (Figure 4.12) reveal that 42 percent of
respondents strongly agree and 21 percent agree that the budget estimates are calculated
using the previous year’s actual figure. This indicates that, at the majority of the schools
(63%) in this research study, budget estimates are calculated using the previous year’s actual
figure. Sixteen percent (12% + 4%) of respondents disagreed with this statement, indicating
that they may be using alternative methods to calculate budget estimates. Schools should
actually use the previous year’s actual figure as a guide to calculate budget estimates, as this
would make the estimate realistic.

82
Table 4.15 The budget estimates are calculated using the previous year’s actual plus
a % increase
Budget estimates are
calculated using last years
actual plus a % increase
Frequencies Percentage %
Strongly disagree 7 8.4
Disagree 2 2.4
Neutral 21 25.3
Agree 23 27.7
Strongly Agree 30 36.1
Total 83 100
The majority of respondents (36.1% + 27.7% = 63.8%), have shown that budget estimates are
calculated using the previous year’s actual plus a percentage increase at their respective
schools. About ten percent (8.4% + 2.4%) of respondents have provided a negative response,
implying that they may be using alternate methods to calculate budget estimates. Using the
previous year’s actual figure and adding a percentage increase may make the calculation of
budget estimates easier and simpler, but may not necessarily be the best thing to do in such
important calculations.

83
Table 4.16 The budget estimates are calculated using the previous year’s budget
plus a % increase (incremental budgeting)
Budget estimates are
calculated using the
previous year’s budget
plus a % increase
Frequencies Percentage %
Strongly disagree 17 20.5
Disagree 2 2.4
Neutral 27 32.5
Agree 20 24.1
Strongly Agree 17 20.5
Total 83 100
Forty four percent (20.5% + 24.1%) of respondents have indicated that the schools budget
estimates are calculated using the previous years’ budget plus a percentage increase.
Although forty four percent of respondents have indicated what is practised at their
respective schools, using the previous year’s budget and adding a percentage increase may
not provide a true reflection of the current financial situation in the school, as there are
various factors that may influence the budget estimates. Twenty two percent (20.5% + 2.4%)
of respondents provided a negative response, signifying that other methods of calculating
budget estimates may be employed at these schools.
84
Table 4.17 The budget estimates are calculated using a completely new
estimate (zero based budgeting)
Budget estimates are
calculated using a
completely new estimate
Frequencies Percentage %
Strongly disagree 23 27.7
Disagree 7 8.4
Neutral 33 39.8
Agree 13 15.7
Strongly Agree 7 8.4
Total 83 100
Only twenty four percent (15.7% + 8.4%) of respondents have shown that zero based
budgeting is used at the schools they serve. Thirty six percent (27.7% + 8.4%) of respondents
have provided a negative response , implying that zero based budgeting is not used at these
schools or that alternate methods of calculating budget estimates are used at these
institutions. The small percentage of positive responses received indicates that many schools
are unaware of the advantages of using zero based budgeting (as discussed in chapter two).
The disadvantages of using zero based budgeting are minor in comparison to the benefits
schools can derive from the use of such a system. This is discussed in further detail in the
next chapter.

85
Table 4.18 Only financial measures are used in drawing up the budget
estimates
Only Financial measures
are used in drawing up
the budget estimates
Frequencies Percentage %
Strongly disagree 3 3.6
Disagree 6 7.2
Neutral 19 22.9
Agree 30 36.1
Strongly Agree 25 30.1
Total 83 100
Sixty six percent (30.1% + 36.1%) of the schools use only financial measures to draw up the
budget estimates. Ten percent (3.6% + 7.2%) of respondents have revealed that other
measures, such as non financial measures, e.g. the poverty level of the community, the
number of children from an orphanage/ children’s home (the caregivers of these children are
exempt from the payment of school fees) that attend the school etc. are also taken into
consideration in drawing up the budget estimates.
Table 4.19 Actual expenditures are compared with the budget estimates at
the end of each year
Actual expenditures are
compared with the budget
estimates
Frequencies Percentage %
Strongly disagree 7 8.4
Disagree 1 1.2
Neutral 13 15.7
Agree 28 33.7
Strongly Agree 34 41
Total 83 100

86
Majority of the respondents (41% + 33.7% = 74.7%) have indicated that actual expenditures
are compared with the budget estimates at the end of each year while fifteen percent of
respondents have provided a neutral response to this statement. Small percentages (9%) of
respondents have provided a negative response to this important financial monitoring
measure. This indicates that actual expenditures are not compared with the budget estimates
at some schools. This is most likely to be at ordinary public schools in the rural areas, where
many SGB members lack the necessary financial knowledge or expertise to undertake such a
task.
Table 4.20 The school has a good cost saving mechanism in place
School has a good cost
saving mechanism
Frequencies Percentage %
Strongly disagree 2 2.4
Disagree 8 9.6
Neutral 20 24
Agree 26 31.3
Strongly Agree 27 32.5
Total 83 100
Sixty three percent (32.5% + 31.3%) of respondents have provided a positive response,
indicating that, at most ordinary public schools at which they serve, a good cost saving
mechanism in place. These schools have procurement policies that ensure cost saving. They
may also have a list of parents and other community members who volunteer their services,
thereby saving costs for the school. Twelve percent (2.4% + 9.6%) of respondents have
shown that a good cost saving mechanism is lacking in some schools. This is most likely, to
be the case, at ordinary public schools, where SGB members lack the necessary financial
management knowledge and skills to put a cost saving mechanism in place.

87
Table 4.21 The school has an effective expense monitoring mechanism in
place
School has an effective
expense monitoring
mechanism
Frequencies Percentage %
Strongly disagree 3 3.6
Disagree 8 9.6
Neutral 16 19.2
Agree 22 26.5
Strongly Agree 34 40.9
Total 83 100
The majority of the institutions surveyed (40.9% + 26.5% =67.4%) have an effective expense
monitoring mechanism in place. However, effective expense monitoring mechanisms are
lacking in about thirteen percent (3.6% + 9.6%) of schools surveyed.
Table 4.22 Budget is strictly adhered to and an effective monitoring
mechanism is in place
Budget is strictly adhered
to and a monitoring
mechanism is in place
Frequencies Percentage %
Strongly disagree 2 2.4
Disagree 7 8.4
Neutral 17 20.4
Agree 39 46.9
Strongly Agree 18 21.6
Total 83 100
A major proportion of respondents (21.6% + 46.9% = 68.5%) have indicated that the budget
is strictly adhered to and that an effective monitoring mechanism is in place. A small
proportion of respondents (2.4% + 8.4% = 10.8%) have shown that the budget is not strictly
adhered to and that an effective monitoring mechanism is non existent.

88
4.3.6 SECTION E FINANCIAL PLANNING
Table 4. 23 The SGB manages the finances of the school
SGB manages the
finances
Frequencies Percentage %
Strongly disagree 2 2.4
Disagree 3 3.6
Neutral 3 3.6
Agree 35 42.2
Strongly Agree 37 44.6
Total 80 96.4
Missing: 3
The finances of the school are managed by the SGB, at most of the schools surveyed. This is
evident from the positive response provided by eighty six percent (44.6% + 42.2%) of
respondents, There is, however, a small percentage (6%) of ordinary public schools were this
is, indeed, not the case. A possible reason for this could be that members of the SGB at these
schools are oblivious of their responsibilities. A small percentage (3%) of respondents did
not provide a response to this statement.
Table 4.24 A duly elected finance committee exists and is effective
A duly elected finance
committee exists and is
effective
Frequencies Percentage %
Strongly disagree 9 10.8
Disagree 3 3.6
Neutral 9 10.8
Agree 23 27.7
Strongly Agree 36 43.4
Total 80 96.4
Missing : 3

89
At the majority (43.4% + 27.7% = 71.1%) of the schools in this survey there is a duly elected
finance committee which is effective. Fourteen percent (10.8% + 3.6%) of the respondents
have shown that a duly elected finance committee is non-existent at some schools. A few
respondents (3%) did not provide a response to this statement.
Figure 4.13 The school has a comprehensive financial policy
05
101520253035404550
StronglyDisagree
Disagree Neutral Agree StronglyAgree
The School has a Comprehensive Financial Policy
Percentage %
Missing: 3
Majority (47% + 32.5% =79.5%) of schools in the sample have a comprehensive financial
policy. Small percentages (4%) of respondents have indicated that a comprehensive financial
policy is lacking at some schools. Three percent of respondents did not respond to this
statement.

90
Table 4.25 The financial policy was drawn up in consultation with all
stakeholders
Financial policy drawn in
consultation
Frequencies Percentage %
Strongly disagree 8 9.6
Disagree 5 6
Neutral 10 12
Agree 25 30
Strongly Agree 32 38.6
Total 80 96.4
Missing: 3
The majority of the schools in this survey have consulted all stakeholders whilst drawing up
the financial policy. Fifteen percent (9.6% + 6%) of the respondents in this survey have
indicated that the financial policy may have been drawn up without the involvement of all
stakeholders. A few (3%) respondents did not provide a response to this statement.
Table 4.26 The school’s financial policy provides clear direction on the use of
funds and resources
Financial policy provides
clear direction
Frequencies Percentage %
Strongly disagree 3 3.6
Disagree 2 2.4
Neutral 5 6
Agree 38 45.8
Strongly Agree 32 38.6
Total 80 96.4
Missing; 3
Table 4.26 indicates that eighty four percent (38.6% + 45.8%) of the respondents have found
that the school’s financial policy provides clear direction on the use of funds and resources.
Only six percent of respondents have shown that the school’s financial policy does not
91
adequately provide clear direction on the use of funds and resources. Some respondents (3%)
chose not to respond to this statement.
Table 4.27 All decisions pertaining to finances of the school are made in
accordance with the financial policy
Decisions pertaining to
finances are made in
terms of policy
Frequencies Percentage %
Strongly disagree 3 3.6
Disagree 3 3.6
Neutral 7 8.4
Agree 30 36.1
Strongly Agree 37 44.6
Total 80 96.4
Missing: 3
The responses (44.6% + 36.1% = 80.7%) reveal that at the majority of the schools surveyed
all decisions pertaining to the finances of the school are made in accordance with the
financial policy. A small percentage (3.6% + 3.6% =7%) of respondents have shown that, at
some schools, all decisions pertaining to finances of the school are not necessarily made in
accordance with the financial policy. A small number (3%) of respondents chose not to
respond to this statement.

92
Figure 4.14 A needs analysis is undertaken before resources are purchased for
the school
A needs Analysis is Undertaken
0
5
10
15
20
25
30
35
40
45
StronglyDisagree
Disagree Neutral Agree StronglyAgree
Percentage %
Missing: 3
A major proportion (41% + 26.5% = 67.5%) of respondents have indicated that a needs
analysis is undertaken before resources are purchased for the school. The twelve percent
negative response received, suggests, that a needs analysis is not undertaken before resources
are purchased at some of the schools in this research survey. Three percent of respondents
did not provide a response to this statement.

93
Table 4.
the school are deposited in this account
28 The school has only one bank account and all funds received by
The school has only one
bank account
Frequencies Percentage %
Strongly disagree 4 4.8
Disagree 1 1.2
Neutral 4 4.8
Agree 17 20.5
Strongly Agree 54 65.1
Total 80 96.4
Missing: 3
Majority of the schools, in this study, have only one bank account and all funds received by
the school are deposited in this account. This is evident from the very high positive response
(65.1% + 20.5% = 85.6%) received. Six percent of the respondents provided a negative
response, suggesting that there are schools that have more than one bank account and that all
funds received by these schools are not necessarily deposited in the same account. Schools
may have more than one bank account, provided that the school has sought and has been
granted permission to hold more than one account by the department of education. A small
percentage (3%) of respondents chose not to respond to this statement.
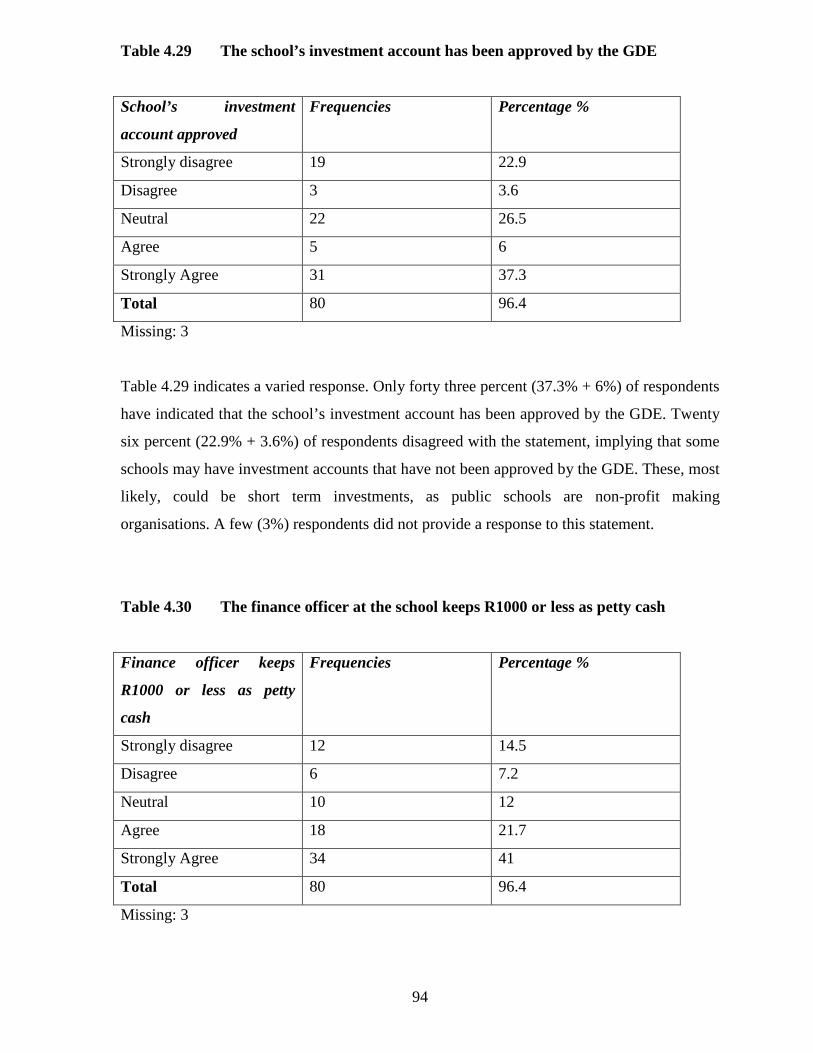
94
Table 4.29 The school’s investment account has been approved by the GDE
School’s investment
account approved
Frequencies Percentage %
Strongly disagree 19 22.9
Disagree 3 3.6
Neutral 22 26.5
Agree 5 6
Strongly Agree 31 37.3
Total 80 96.4
Missing: 3
Table 4.29 indicates a varied response. Only forty three percent (37.3% + 6%) of respondents
have indicated that the school’s investment account has been approved by the GDE. Twenty
six percent (22.9% + 3.6%) of respondents disagreed with the statement, implying that some
schools may have investment accounts that have not been approved by the GDE. These, most
likely, could be short term investments, as public schools are non-profit making
organisations. A few (3%) respondents did not provide a response to this statement.
Table 4.30 The finance officer at the school keeps R1000 or less as petty cash
Finance officer keeps
R1000 or less as petty
cash
Frequencies Percentage %
Strongly disagree 12 14.5
Disagree 6 7.2
Neutral 10 12
Agree 18 21.7
Strongly Agree 34 41
Total 80 96.4
Missing: 3

95
At most schools surveyed the finance officer at the school keeps one thousand rand or less as
petty cash. This is evident from the sixty two percent (41% + 21.7%) positive response
received. Twenty one percent (14.5% + 7.2%) of respondents provided a negative response,
suggesting that the finance officer at these schools may be keeping more than one thousand
rand as petty cash. Some respondents (3%) did not provide a response to this statement.
Table 4.31 The imprest system of petty cash is in place
Imprest system is used Frequencies Percentage %
Strongly disagree 17 20.5
Disagree 3 3.6
Neutral 22 26.5
Agree 17 20.5
Strongly Agree 21 25.3
Total 80 96.4
Missing: 3
The responses indicate that in about forty five percent (25.3% + 20.5%) of the schools
surveyed, the imprest system is used to monitor the use of petty cash. However, this system is
not used to monitor the use of petty cash at all schools. This is evident from the twenty four
percent (20.5% + 3.6%) negative response received. A response was not received from
approximately three percent of the respondents.

96
Table 4. 32 Strict monitoring and control is exercised during fund raising events at
the school
Strict monitoring and
control is exercised
during fund raising
Frequencies Percentage %
Strongly disagree 4 4.8
Disagree 2 2.4
Neutral 15 18.1
Agree 26 31.3
Strongly Agree 33 39.8
Total 80 96.4
Missing: 3
A major proportion of the respondents (39.8% + 31.3%) have indicated that strict monitoring
and control is exercised during fund raising events at the school. The negative response
received from seven percent of respondents implies that strict monitoring and control does
not necessarily take place during fund raising events at all schools. A small number (3%) of
respondents chose not to respond to this statement.
Table 4.33 Audited financial statements are provided to the GDE annually
Audited financial
statements are provided to
the GDE
Frequencies Percentage %
Strongly disagree 0 0
Disagree 0 0
Neutral 8 9.6
Agree 15 18.1
Strongly Agree 57 68.7
Total 80 96.4
Missing: 3

97
Majority of the respondents (68.7% + 18.1% = 86.8%) indicated that audited financial
statements are provided to the GDE annually. This reveals a high degree of compliance to
GDE policy. Only a few (3%) respondents did not respond to this statement.
Table 4.34 Financial irregularities are attended to in terms of policy
Financial irregularities
are attended to in terms of
policy
Frequencies Percentage %
Strongly disagree 1 1.2
Disagree 1 1.2
Neutral 10 12
Agree 24 28.9
Strongly Agree 44 53
Total 80 96.4
Missing: 3
Table 4.34 reveals that at most of the schools surveyed (53% + 28.9%), financial
irregularities are attended to in terms of policy. Two percent of respondents have indicated
that this, however, is not the case at all schools. Three percent of respondents did not
provide a response to this statement.
Table 4.35 The school has a strategic financial plan and abides by it
The school has a strategic
financial plan
Frequencies Percentage %
Strongly disagree 9 10.8
Disagree 3 3.6
Neutral 12 14.5
Agree 27 32.5
Strongly Agree 29 34.9
Total 80 96.4
Missing: 3

98
The majority (34.9% + 32.5% = 67.4%) of the respondents agree that the school has a
strategic plan and abides by it. Fourteen percent (10.8% + 3.6%) of respondents reveal that
some schools do not have a strategic plan and can therefore not abide by it. The lack of a
strategic plan implies that the school has undertaken very little or no financial resource
planning for the future. Three percent of respondents chose not to respond to this statement.
In addition to the above analysis, the study progressed by examining correlations and by
providing reliability analysis and validity analysis.
4.4 CORRELATIONS The Pearson product-moment correlation coefficient was used to determine the level of
association between the variables mentioned above. The range of possible value is from -1.00
for a perfect negative correlation to +1.00 for a perfect positive correlation (Malhotra, 2004).
The following rule of thumb proposed by Huck, Cormier and Bounds (1974) were used in
examining the level of association between the internal service quality and internal customer
satisfaction.
0 to + 0.25 (or-0.25) = little or no relationship
+ 0.26 (-0.26) to + 0.60 (or -0.60) indicates a moderate relationship
above + 0.60 (or-0.60 and above) indicates a strong relationship The sections which follow examine the following relationships:
Qualifications (A5) and Section D (the budgetary planning process) of SGB members.
Experience (A3) and Section D (the budgetary planning process) of SGB members.
Qualifications (A5) and experience (A3) of SGB members
In examining such relationships it was necessary to formulate and test the hypothesis on
whether a strong positive or negative relationship exists among the qualifications, experience
categories of SGB members and their understanding of the budgetary planning process of
public primary schools.
Experience categories were classified as SGB members having one to 5 years, six to ten
years, eleven to fifteen years, sixteen to twenty years and more than twenty years of
experience within the public primary education milieu and the understanding of the
budgetary planning process were by measured by including the 17 item scale of the

99
budgetary planning process (refer to section D of the questionnaire). Qualification (A5)
categories were classified as SGB members having a matriculation, post matriculation
diploma, degree, honours degree, master’s degree or a doctorate.
The following hypotheses were proposed:
H1
: A negative relationship exists between experience (of SGB members) and an understanding of the budgetary planning process.
H2
: A negative relationship exists between qualifications (of SGB members) and the
understanding of the budgetary planning process.
H3
: A negative relationship exists between experience (of SGB members) and their level of
qualification.
The results are reported in table 4.36. The first hypothesis is not rejected. With the exception
of D5 (The money raised through the various fund raising events/activities during the year is
included in the budget) where r =0.22 at a 0.05 level of significance the results indicate that
experience is uncorrelated with the understanding of the budgetary planning process. The
second hypothesis is also not rejected as the results reflect that qualifications are uncorrelated
with the budgetary planning process. The third hypothesis is not rejected as experience (A3)
positively correlated with an SGB level of qualification (A5) at p= 0.01 level of significance.

100
Table 4.36 Correlations – qualifications, experience and budgetary planning
Qual Exp D1 D2 D3 D4 D5 D6 D7 D8 D9 D10 D11 D12 D13 D14 D15 D16 D17
Qual 1.000 .466 .016 ** .092 .130 .105 .225 .050 * -.023 -.011 -.073 -.120 -.061 .014 .057 -.004 .037 .010 -.085
Exp .466 1.000 ** -.015 .175 .060 .071 .112 .104 .104 .040 .053 .069 .004 .102 .018 .040 .083 -.079 -.120
D1 .016 -.015 1.000 .543 .562** .509** .333** .330** .554** .370** .154 ** .016 .344 .617** .539** .656** .543** .580** .567**
D2
**
.092 .175 .543 1.000 ** .543 .212 ** .259 .560* .615** .556** .259** .340* .366** .680** .372** .466** .385** .616** .626**
D3
**
.130 .060 .562 .543** 1.000 ** .519 .285** .359** .436** .407** .059 ** .150 .284 .533** .490** .519** .398** .326** .424**
D4
**
.105 .071 .509 .212 ** .519 1.000 ** .146 .142 .242 .365* .121 ** -.134 .286 .244** .323* .279** .103 * .200 .152
D5 .225 .112 * .333 .259** .285* .146 ** 1.000 .288 .180 ** .175 .425 .248** .121 * .267 .319* .263** .380* .280** .295*
D6
**
.050 .104 .330 .560** .359** .142 ** .288 1.000 ** .579 .272** .277* .193 * .381 .518** .409** .404** .427** .360** .474**
D7
**
-.023 .104 .554 .615** .436** .242** .180 * .579 1.000 ** .455 .216** .318* .266** .671* .497** .578** .394** .532** .578**
D8
**
-.011 .040 .370 .556** .407** .365** .175 ** .272 .455* 1.000 ** .077 .144 .106 .375 .237** .340* .192 ** .272 .379*
D9
**
-.073 .053 .154 .259 .059 * .121 .425 .277** .216* .077 * 1.000 .432 .296** .230** .135 * .081 .176 .207 .175
D10 -.120 .069 .016 .340 .150 ** -.134 .248 .193 * .318 .144 ** .432 1.000 ** .112 .272 .083 * .191 .259 .221* .298*
D11
**
-.061 .004 .344 .366** .284** .286** .121 ** .381 .266** .106 * .296 .112 ** 1.000 .484 .271** .317* .292** .296** .238**
D12
*
.014 .102 .617 .680** .533** .244** .267* .518* .671** .375** .230** .272* .484* 1.000 ** .546 .610** .509** .684** .644**
D13
**
.057 .018 .539 .372** .490** .323** .319** .409** .497** .237** .135 * .083 .271 .546* 1.000 ** .808 .654** .484** .521**
D14
**
-.004 .040 .656 .466** .519** .279** .263* .404* .578** .340** .081 ** .191 .317 .610** .808** 1.00” ** .761 .544** .602**
D15
**
.037 .083 .543 .385** .398** .103 ** .380 .427** .394** .192 ** .176 .259 .292* .509** .654** .761** 1.000 ** .370 .432**
D16
**
.010 -.079 .580 .616** .326** .200 ** .280 .360* .532** .272** .207 * .221 .296* .684** .484** .544** .370** 1.000 ** .840
D17
**
-.085 -.120 .567 .626** .424** .152 ** .295 .474** .578** .379** .175 ** .298 .238** .644* .521** .602** .432** .840** 1.000 **
** Correlations is significant at the 0.01 level (2-tailed) * Correlations is significant at the 0.05 level (2-tailed)

101
4.5 RELIABILITY ANALYSIS
In order to assess the reliability of the measurement the internal consistency reliability
was computed for sections C, D and E. These sections pertain to levying of school fees,
the budgetary planning process and the financial management aspects of schools
respectively. The computation of coefficient alpha (Cronbach α) was computed for each
of the scales (Page & Meyer, 2003:292). On examination of the “item-to-total correlation
and “alpha if deleted column” from the reliability output tables none of the items required
deletion. The tables reflecting “item-to-total correlations” for the various sections are
placed in annexure C, D, and E. The result for the reliability analysis is reported on Table
4.37.
Table 4.37 Reliability - Cronbach alpha coefficients
Sections No of items Cronbach α
Section C – school fees scale 11 0.932
Section D – budgetary planning scale 17 0.908
Section E – financial management scale 15 0.908
The reliability for all three scales was considered adequate as the Cronbach α values were
above the recommended acceptable levels i.e. above 0.70 (Nunnally & Bernstein,
1994:265).
4.6 VALIDITY ANALYSIS 4.6.1 Content validity
To ensure that the questionnaire satisfies content validity, a mixed methodology research
process was followed. The following steps were undertaken to ensure content validity of
the research instrument:

102
Various sources of evidence were consulted from literature in order to develop an
appropriate measuring instrument
Content validity was also established by pre-testing the questionnaire among
academics and educators. In addition a pilot test of the questionnaire was run among
twenty respondents. Changes were made to the questionnaire in terms of question
format, phrasing and content.
4.6.2 Construct validity
The construct validity of a questionnaire refers to the extent it measures the theoretical
dimensions. If there is evidence of construct validity, the questionnaire then measures
what it supposed to measure. Evidence of reliability confirms the construct validity of the
measuring instrument (Bosch, Boshoff & Louw, 2003). In the study, the scale items in
section C, D and E reflected acceptable levels of reliability of the research instrument.
Hence, construct validity of the scale can be confirmed.
4.7 SUMMARY
This chapter provided a detailed discussion of all data collected via the questionnaire. A
detailed discussion and analysis is provided after each graph and table. In addition this
chapter examined correlations and provided reliability analysis and validity analysis. The
researcher is also satisfied that the questionnaire and the good response rate are sufficient
to validate this research study and can therefore be relied upon.
The final chapter will focus on recommendations emanating from the study.

103
CHAPTER FIVE
CONCLUSION AND RECOMMENDATIONS
5.1 INTRODUCTION
Financial management in public primary schools and the research design have been the
focus of the previous chapters. Data was obtained from principals and members of SGBs,
through the use of a structured questionnaire. The questionnaire was used to illicit
responses on the status of financial management in twenty five public primary schools in
the Ekurhuleni South District. An analysis of the responses was also undertaken and
reported on in chapter four.
The literature study examined, amongst others, relevant issues in public primary schools,
the concept of budgeting, functions of a budget, the budget process, the advantages of a
budget system, approaches to budgeting, financial policy and requirements for effective
financial control. The research findings of this study were identified and discussed by
descriptive and statistical methods.
This chapter provides a general overview of the study by placing the main and secondary
aims into perspective. Arising out of the empirical study, recommendations regarding
financial management are made. Contributions of the study, limitations and implications
for further research are outlined.

104
5.2 ACHIEVEMENT OF THE AIMS OF THE RESEARCH
The main aim of the study was stated as follows (refer to section 1.4 of chapter 1)
5.2.1 The main aim
• To determine how principals and members of SGBs implement financial policy at
public primary schools.
In order to achieve the main aim of the study, the following secondary aims were
developed:
5.2.2 Secondary aims
• To examine how principals and members of SGBs make decisions about the
budgeting process within public primary schools.
• To establish the procedures followed in school fee setting within public primary
schools.
• To determine how principals and members of SGBs undertake financial resource
planning within public primary schools.
In order to achieve the above aims, an empirical research study was conducted by means
of a questionnaire sent to twenty five public primary schools in the Ekurhuleni South
District, of the Gauteng Department of Education.
The first secondary aim was addressed in Section D of the questionnaire, which was
designed to examine how principals and members of SGBs make decisions about the
budgeting process within public primary schools. The following are some of the
conclusions that are drawn from the responses received: at many of schools the school
budget is drawn up annually in consultation with all stakeholders, at most schools
funding received from the state is included in the budget, at the majority of schools
budget estimates are calculated using last years actual figure, only financial measures are
used in drawing up the budget estimates, most schools have good cost saving and

105
expense monitoring mechanisms in place and at many schools the school budget is
presented annually to parents for approval at a SGB meeting.
The secondary aim pertaining to the procedures that are followed in the setting of school
fees within public primary schools was addressed in section C of the questionnaire. From
the analysis of the responses to the questions in section C, the following are some of the
conclusions that can be drawn: at most schools parents of learners are informed of
legislation regarding exemption from paying school fees, school fees are carefully
determined after a careful analysis of the operational requirements of the school and that
parents are consulted annually before school fees are levied.
Finally, Section E of the questionnaire addressed the last secondary aim, relating to
financial resource planning. The following are some of the conclusions that are drawn
from the analysis of the responses: many schools have comprehensive financial policies
that have been drawn up in consultation with all stakeholders, at most schools the
schools’ financial policy provides clear direction on the use of funds and resources, all
decisions pertaining to the finances of the school are made in accordance with the
financial policy, a needs analysis in undertaken before resources are purchased for the
school, audited financial statements are provided to the GDE annually and schools have
strategic financial plans and abide by it.
5.3 RECOMMENDATIONS/GUIDELINES FOR PRINCIPALS AND
MEMBERS OF SGBs TO MANAGE SCHOOL FUNDS EFFECTIVELY
AND EFFICIENTLY
In the light of the descriptive and statistical analysis undertaken in chapter 4 and the
objectives of the study the following recommendations/guidelines are suggested.
5.3.1 While the majority of the respondents were in agreement that school fees are
charged based on a resolution and adopted by them, the fact that 20% (refer
to figure 4.8) of the respondents provided negative responses to the statement

106
is a cause for concern. In addition, whilst the majority of the parents of
learners indicated that they are consulted annually (refer to figure 4.9) before
school fees are levied, a moderate percentage of respondents (nineteen
percent) disagreed on the issue of the consultation process. Hence, school
principals and members of government bodies need to communicate such
resolutions and consultation processes to parents of children. For example,
signed letters communicating such decisions need to be insisted upon and
collected via the learners from parents. This will ensure that the dissemination
of pertinent information reaches the parents of children.
5.3.2 Table 4.6 shows that fifty three percent of respondents have revealed that
most parents’ school fee accounts were not paid up to date. This high
percentage indicates that there are many parents who are experiencing
financial difficulties, and are therefore finding it difficult to meet their
financial obligation to the school. Schools need this income on a regular basis
in order to function effectively. Schools therefore, need to take steps to
address this issue, such as “educating” their parents on procedures they need
to follow should they find themselves in financial difficulty, for example,
request a meeting with the SGB to discuss different options for payment,
holding an information sharing session to inform parents of the criteria and
procedures for the application for exemption from the payment of school fees.
This pro-active approach will not only benefit the school but also the parents
and the school community.
5.3.3 Many schools (forty nine percent, as indicated in Table 4.8), have indicated
that parents whose school fee accounts were outstanding after three months
were not handed over to debt collectors. Thus it can be deduced that these
schools allow the problem of outstanding school fees to perpetuate without
early intervention. As schools are dependent on the income from school fees
to function optimally, it is recommended that members of the SGB intervene
in such situations, by setting up meetings with the parents concerned and

107
discussing ways and means of ensuring that these parents meet their financial
obligation on a monthly basis or enlisting the voluntary service of a debt
counsellor to advise parents on consolidating debt and making small
payments.
5.3.4 Forty five percent of schools in this survey revealed that school fees that are
outstanding for more than a year are carried forward into the following year
(refer to table 4.9). Similar findings have been made by McLennan (2006:12),
where it has been noted that “fees were rarely set higher than one hundred
rands and almost never paid” as well as by Bisschoff and Sayed (1999:310-
315) who have also reported that principals have found that the “payment and
collection of outstanding school fees posed a problem”. Outstanding school
fees is a huge portion of a school’s income that is not received within the
allocated time period. As public schools are nonprofit making organisations
and budgets are planned for a fiscal year, one is obliged to question how do
these schools function effectively without receiving this portion of its
projected income. In such situations, schools should endeavour to use the
services of debt recovery agencies to try to get parents to pay the outstanding
school fees. This will ensure that adequate cash funds are available to ensure
the ongoing operations and financial stability of the school.
5.3.5 Offering incentives is a good means to stimulate payment. In approximately
forty seven percent of the schools surveyed parents utilize the incentives
offered for the full payment of school fees by a stipulated date (refer to table
4.7). In order to improve the rate of payment of school fees, it is
recommended that schools that do not currently offer incentives, for the full
payment of school fees, consider different incentives, for example, offering
ten percent discount on the total school fees payable for the year with the
provision that the school fees are paid in full before the seventh of February,
and factor this into the school budget in the future.

108
5.3.6 Forty five percent of the schools (refer to table 4.14) have found that, breaking
the annual budget down into time periods, is effective. Twenty eight percent
of respondents have indicated that the annual budget is not broken down into
control periods. It is recommended that the annual budget is broken down into
time periods as this would help to monitor actual expenditure against the
intended expenditure and it will ensure that expenditures are properly
authorized and subject to audit controls. Furthermore breaking down the
annual budget into time periods, creates the opportunity for continuous
financial control, through which adaptations and corrective actions can be
effected in good time so that set goals may be reached.
5.3.7 Table 4.17 indicates that only twenty four percent of schools are using zero
based budgeting
and Table 4.16 shows that forty four percent schools are
using incremental budgeting. Although both these approaches have
advantages and disadvantages (as outlined in chapter two), Husain (2003:15)
advises that “educational institutions should prepare their budgets on the basis
of their main objectives and policies.” The author further reiterates that
organizations prepare budgets in order to ensure an efficient allocation of
funds in order to accomplish their objectives as economically as possible.
5.3.8 Twenty six percent of respondents have indicated that the school’s investment
account has not been approved by the GDE (refer to Table 4.29). This
indicates a deviation from GDE policy. Although schools are non-profit
making organisations, the effective and efficient management of its’ financ
es
and financial accountability should be aligned with profit making
organisations. To ensure accountability and compliance to GDE policy it is
recommended that SGBs of these schools, firstly, seek the approval of parents
for the maintenance of an investment account at the annual general meeting
and secondly apply annually to the MEC for education for permission to
invest surplus money in a second bank account.

109
5.3.9 Strategic plans identify strategies for future activities and operations, covering
at least five years. The school budget and the strategic plan should be closely
linked. Table 4.35 indicates that fourteen percent of schools surveyed do not
have a strategic plan. The lack of a strategic plan implies that the school has
undertaken very little or no financial resource planning for the future. A
strategic plan helps management to ensure that all attention is not focussed on
the short term, as budgets are generally seen as one-year period plans.
Strategic plans encourage managers to develop an overall direction for the
school, foresee problems, and develop future policies and projects, for
example, building a swimming pool for the school or extending the computer
laboratory. Hence it is recommended that all schools do financial resource
planning for the future and develop effective strategic plans, that will ensure
overall school improvement.
5.3.10 Figure 4.10 indicates that twenty two percent of respondents have revealed
that the SGB does not monitor the collection of school fees closely at their
respective schools. These findings affirm the Ministerial Review Committee’s
report (2004: 104), which cited that “SGBs do not regularly and consistently
manage the challenge of fund raising and monitoring school fees.” Mestry
(2006:35) outlines the following three guidelines for principals and members
of school governing bodies to manage the school finances more effectively
and efficiently:
5.3.10.1 Drafting and implementing the school’s financial policy. The
formulation of rules and regulations for handling the money/assets of the
school in the financial policy is necessary. The policy should clearly state the
procedures for handling school fees, donations, post dated cheques,
authorisation for cheque payments, signatories to the bank account, bank
overdrafts, trust accounts, documentation, recording transactions, and every
aspect related to the school’s finances. A clear set of rules must be drawn up
when collecting school fees and this must be communicated to the parents, for

110
example, no educator will be allowed to collect monies from learners. Only
the finance officer is responsible for collecting school fees from parents or
learners. A receipt must be issued for monies received and all monies received
must be deposited the same day if the circumstances allow for such action.
5.3.10.2 Training school governing bodies in financial management.
Training in financial management is fundamental in preparing and equipping
school managers with financial skills. Every member of the SGB must receive
training. Where provincial departments are unable to provide the training to
every member because of cost implications, schools should form partnerships
with tertiary institutions or other service providers that offer training in
financial management. The training should enable the SGB to be responsible
and accountable for funds that have been received for the attainment of
specific school objectives. It will also equip them to make a contribution
towards the improvement of the overall quality of teaching and learning at the
school.
5.3.10.3 Committees and sub-committees of the school governing body.
According to section 30 of the SASA, the SGB may form committees and
sub-committees. School governing bodies may delegate various financial
functions to committees especially set up to manage aspects of the school’s
finances. They may also delegate these functions to individuals who have the
necessary expertise, specialised knowledge or skills in school’s finances. It is
essential, however, that the finance committee should coordinate the activities
of the various sub-committees. Good communication structures are also
essential. Feedback from the SGB to the finance committee and various sub-
committees and backwards is critical for the effective management of the
school’s finances.
111
5.3.11 The finance committee of the SGB has a pivotal role to play in managing the
finances of the school. Mestry (2006: 36) therefore recommends that, where
members of the SGB have little or no knowledge regarding financial matters
and procedures, they should solicit the services of an expert with sound
financial knowledge from the community, or co-opt someone with the
necessary knowledge and expertise from outside the parent community.
Where schools cannot co-opt members with the necessary financial
knowledge and skills to assist in managing the funds of the school, the
department of education should provide the necessary support to the SGBs of
these schools.
5.3.12 Mestry (2006: 36) further reiterates that it is vital for the finance committee to
conduct regular meetings to discuss financial matters. Decisions relating to
financial matters taken by the finance committee must always be ratified by
the SGB, as this body is accountable for the school funds even though most of
the financial functions may be delegated to the finance committee.
5.3.13 Furthermore financial reports should be produced monthly for the SGB and
the format and content of these reports should enable the members of the SGB
to make informed and timely decisions. To ensure sound financial
management, schools are advised to have
budgets that have been approved by
the department of education, and to ensure that these budgets are monitored
monthly by the finance committee of the SGB.
5.3.14 In addition to the above recommendations, a very practical and useful
recommendation regarding financial management in schools has been made
by the Ministry of Education in New Zealand. The handbook, (Financial
Information For Schools) published by the Ministry of Education in New
Zealand (2007:06) suggests the establishment of a team of approximately six
financial advisers per district who are able to provide guidance, advice and
support to schools. This financial advisory service should be available to all

112
schools and the following are examples of the type of services that should be
provided by the team:
• Assisting principals and SGBs when the schools face financial problems
• Assisting schools to develop financial policies and finance systems
• Guidance on the preparation of school budgets
• Provision of “best practice” examples
• Providing technical accounting advice to schools that require it
• Facilitating financial management workshops
• Producing training material for schools
• Producing self review material for schools
• Facilitating contact between schools and their auditors and accounting
service providers
The financial advisers should be available by phone and email and should visit
schools to discuss any problems schools are experiencing. Instituting this team of
financial advisors per district will alleviate many of the financial problems
experienced by schools, as this will ensure that schools can get the necessary financial
guidance and assistance as and when required.
5.4 CONTRIBUTIONS OF THE STUDY
As SGBs have the responsibility of implementing financial policy and of preparing the
school’s budget, the SGBs must take every step necessary to ensure that the school
budget is prepared on the basis of the school’s main objectives and policies. This will
ensure an efficient allocation of funds to accomplish the main objectives of the school as
economically as possible.
As schools are community organisations and need the financial support of parents to
function effectively, it is imperative that parents be kept informed of processes pertaining
to school fees and of resolutions passed at parents’ meetings. As some parents are unable

113
to attend all such meetings, school principals and SGB members must endeavour to
e
nsure the dissemination of such pertinent information to parents’ as soon as possible.
The need for early intervention, by SGBs, concerning outstanding school fees cannot be
over emphasized.
Finally to improve financial management and accountability at public schools the
Department of Education should consider the establishment of a team of financial
advisers per district to advice and support schools on various financial matters.
5.5 LIMITATIONS OF THE STUDY
This study has the following limitation: The study was limited to twenty five public
primary schools in the Ekhurhuleni South District of the Gauteng Department of
Education. The results therefore cannot be generalised to other regions, districts or
provinces. Another limitation of the study was the small sample size. Larger sample sizes
including other districts may enhance the understanding of the extent of implementation
of proper financial management and measures within public schools. It should be noted
that these limitations do not nullify the conclusions emerged from the study.
5.6 SUGGESTIONS FOR FURTHER RESEARCH
Researchers within the financial management domain may examine priorities that are
implemented and the monitoring of available funds from various sources. The
relationship with academic performance of learners and resource availability in terms of
funding may also provide ‘rich’ experiences for future research.
In addition, research should be extended into a study to other districts in order to obtain a
comprehensive understanding of the application of financial policy and management in
public schools. A study of public and private schools financial management and policies
could also provide meaningful comparisons in future studies. These results may provide

114
various strengths and weaknesses with regard to financial management and budgeting
within different contexts.
5.7 CONCLUDING REMARKS
Among the important aspects in improving financial management of public schools are
activities such as annual budget planning, delineating the roles of various committees
with budget responsibilities, setting criteria for budget allocation, and regular monitoring
of the budget.
Although this study focussed on public primary schools in the Ekurhuleni South District
of the Gauteng Department of Education, the principles for sound financial management
portrayed in this study may be applicable to all schools.

115
LIST OF REFERENCES
ADAMS, D. 2006. Management Accounting for the Hospitality, Tourism and Leisure
Industries: A Strategic Approach. 2nd
Ed. London: Thomson Learning.
ANDERSON, L.K. & SOLLENBERGER, H.M.1992. Managerial Accounting. 8th
Ed.
Ohio: Southern- Western.
BALL, R. 1991. Quantitative Approach to Management. Oxford: Butterworth- Heinemann. BARFIELD, J.T., RAIBORN, C.A. & KINNEY, M. R. 1998. Cost Accounting. 3rd
Ed.
Ohio: South-Western.
BERKHOUT, F. & BERKHOUT, S.J. 1992. The School Financial Management Tools.
1st
Ed. Pretoria: J.L. van Schaik (Pty) Ltd.
BEST, J.W. & KAHN, J.V. 2006. Research in Education. 10th
Ed. Boston: Pearson
Education Inc.
BISSCHOFF, T. & SAYED, M. K.1999, The changing role of the principal of a primary
school: A financial school management perspective. South African Journal of Education,
19 (4): 310-314.
BISSCHOFF, T. 1997. Financial School Management Explained. 1st
Ed. Pretoria: Kagiso
Publishers.
BOYCE, J. 2002. Market Research in practice. Sydney: McGraw-Hill.
BUSH, T. & HEYSTEK, J. 2006, Leadership and Management. In: Bush, Glover,
Bischoff, Moloi, Heystek & Joubert. School Leadership, Management and Governance
in South Africa: A Systematic Literature Review, 2:4-21

116
BUSH, T. AND GAMAGE, G. 2001. Models of self-governance in schools: Australia
and the United Kingdom. The International Journal of Educational Management. 15(1):
39-44.
BUSH, T., BISCHOFF, T., GLOVER, D., HEYSTEK, J., JOUBERT, R AND MOLOI,
K.C. 2005. Desk Research on School Leadership and Governance in South Africa: First
Interim Report, Matthew Goniwe School of Leadership and Governance. Johannesburg.
CANDOLI, I. C., HACK, W.G. & RAY, J. R. 1992. School Business Administration: A
Planning Approach. 4th
Ed. Massachusetts: Allyn and Bacon.
Chartered Institute of Management Accountants. 2000. Official Terminology. London:
CIMA.
CHURCHILL, G.A. (Jr). 2001. Basic Marketing Research. 4th
Ed. Ohio: Thomson
Learning.
GODFREY, J.T., LEITCH, R.A. & RALPH, E.S. 1996. Budgeting for multiple
objectives. Management Accounting (CIMA): 38-41, Jan.
GUTHRIE, J.W., GARMS, W. I. & PIERCE, L. C. 1988. School Finance and Education
Policy: Enhancing Educational Efficiency, Equality and Choice. 2nd
Ed. New Jersey:
Prentice Hall.
HAIR, J.F. (Jr)., BUSH, R.P. & ORTINAU, D.J. 2002. Marketing Research within a
changing information environment. 2nd
Ed. Boston: McGraw-Hill.
HAMMER, H. L., CARTER, W. K. & USRY, M. F. 1994. Cost Accounting. 2nd
Ed.
Ohio: South- Western.

117
HANSEN, D. R. & MOWEN, M. M. 2000. Cost Management – Accounting and Control
3rd
Ed. Ohio: South- Western
HORNGREN, C. T., FOSTER, G. & DATAR, S. 1994. Cost accounting – A Managerial
Emphasis. 8th
Ed. New Jersey: Prentice Hall.
HUCK, S.W. CORMIER, W.H. & BOUNDS, W.G. 1974. Reading Statistics and
Research. NY:Harper and Row Publishers.
HUSAIN, I. 2003. Budgeting and Budgetary Control in Educational Institutions. Delhi:
Abhijeet Publications
IGBUZOR, O. 2005. A Handbook on Budgeting. A Guide to the Due Process Approach.
Lagos: Centre for Democracy and Development.
INNES, J. 2004. Handbook of Management Accounting. 3rd
Ed. Oxford: CIMA
Publishing.
JOHNSON, B. & CHRISTENSEN, L. 2004. Educational Research Quantitative,
Qualitative and Mixed Approaches. 2nd
Ed. Boston: Pearson Education Inc.
KNIGHT, B.; MORRIS, P. & TAPPLY G. 1993, Questions And Answers: Finance.
Kingston upon Thames: Croner Publications Ltd
LALLI,W.R. 2003. Handbook of Budgeting. 5th Ed. New Jersey: John
Wiley & Sons, Inc.
LEMMER
, E. & VAN WYK, N. 2004, Schools reaching out: Comprehensive parent
involvement in South African Primary Schools. In: Jeevanantham, L.S. (editor), Ntshoe,
I.M. (assistant editor) ). Africa Education Review, 1(2), 259-279
118
MALHOTRA, N.K. & BIRKS, D.F. 2004. Marketing Research: An applied orientation.
4th
Ed. Essex, England: Prentice-Hall.
MARISHANE, R. N. & BOTHA, R. J. 2004, Empowering school based management
through decentralized financial control. Africa Education Review 1 (1), 95-112
McLENNAN, A. 2000, Leadership and Management. In Bush, Glover, Bischoff, Moloi,
Heystek & Joubert. School Leadership, Management and Governance in South Africa: A
Systematic Literature Review, 2:4-21.
McMILLAN, J.H. & SCHUMACHER, S. 1993. Research in Education A Conceptual
Introduction. New York: Harper Collins College Publishers.
MESTRY, R. 2004, Financial accountability: the principal or the school governing body?
South African Journal of Education, 24 (2): 126-132.
MOTHA, E. 2003, School Governance. In Bush, Glover, Bisschoff, Moloi, Heystek &
Joubert. School Leadership, Management and Governance in South Africa: A Systematic
Literature Review. Johannesburg: MGSLG
MOTHATA, S. 2000, Developments in policy and legislation in the education and
training system. In: Mda & Mothata (editors). Critical Issues in South African Education
– After 1994. South Africa: Juta & Company
MOWEN, M.M. & HANSEN, D.R. 2008. Cornerstones of Managerial Accounting . 2nd
Ed. USA: Thomson South Western
NEUMAN, W.L. 2006. Social Research Methods Qualitative and Quantitative
Approaches. 6th
Ed. Boston: Allyn and Bacon
119
NEWCOMBE, G., MCCORMICK, J. AND SHARPE, F. 1997. Financial decision
making: teacher involvement and the need for trust. International Journal of Educational
Management, 11(3):94-101.
NGCONGO, R.G.P. & CHETTY, K. 2000, Issues in school management and
Governance. In Mda & Mothata (editors). Critical Issues in South African education
after 1994. South Africa: Juta & Company
NUNNALLY, J.C. & BERNSTEIN, I.H. 1994. Psychometric Theory.3rd
ed. New York: McGraw-Hill.
NEW ZEALAND. 2007. Financial Information for Schools. Ministry of Education O’CONNER, J & GEIGER M. 2009. Challenges facing primary school educators of
English Second or other Language learners in the Western Cape. South African Journal
of Education, Vol 29:253-269
PAGE, C. & MEYER, D. 2003. Applied research design for business and management. Australia: McGraw Hill.
PUTTER, L. 2003. Stress factors among teachers in schools of industry. Unpublished
Masters Dissertation, Faculty of Education, Potchefstroom University for Christian
Higher Education.
REPUBLIC OF SOUTH AFRICA. 1996. South African Schools Act, Act 84 of 1996.
RYAN, P. 1994. Cleaning up a dirty word – Policy. The Practising Administrator
Journal, 2:25-26
S.A. POCKET OXFORD DICTIONARY, 2004. 3rd
edition. South Africa: Oxford
University Press.

120
SEGOATI, M. 2002. School Governance. In: Bush, Glover, Bisschoff , Moloi, Heystek
& Joubert. School Leadership, Management and Governance in South Africa: A
Systematic Literature Review, 2:22-46.
SHAO, A.T. 2002. Marketing research: an aid to decision making. 2nd
Ed. Cincinnati,
Ohio: Thomson Learning.
SMITH, J.A.2007. Handbook of Management Accounting. 4th
Ed. Oxford: CIMA
Publishing.
SOLLENBERGER, H.M. & SCHNEIDER, A. 1996. Managerial Accounting. Ohio:
South- Western College Publishing.
THOMPSON, D. C., WOOD, R. C. & HONEYMAN, D. S. 1994. Fiscal Leadership for
Schools: Concepts and Practices. New York: Longman Publishing Group.
TOOLEY, S. AND GUTHRIE, J. 2007. Budgeting in New Zealand secondary schools in
a changing devolved financial management environment. Journal of Accounting and
Organisational Change, 3(1):4-28
WEBB, J.R. 2002. Marketing Research: Understanding and designing. 2nd
London:
Thompson.
WELMAN, J.C. & KRUGER, S.J. 2000.
Research Methodology for the Business and
Administrative Sciences. Cape Town: International Thompson Publishing.
ZIKMUND, W.A. 1999. Business Research Methods. 6th
ed. Fort Worth, Texas: Dryden Press.
ZIKMUND, W.G. 2000. Exploring Marketing Research. 7Ed. Fortworth: Harcourt
College Publishers.

121
ANNEXURE A
Persal No. 11020288
Mrs. B. Naidoo
P.O. Box 2723
Alberton
1450
22 October 2007
The District Director
Mr. M. Nkonyane
Fuchs Building
Old Vereeniging Road
Alrode
Dear Sir
Request: Permission to Conduct Research
I am currently employed by the GDE and in the process of completing the M.Ed. degree
in educational management through UNISA.
I hereby seek permission to conduct research at schools in the Ekurhuleni South District
via a questionnaire. Principals/ chairpersons of SGBs will be required to complete the
questionnaire based on financial management at their schools. All information obtained
from the schools will be held in strict confidence and the participants in this survey will
remain anonymous.
Thanking you for your kind consideration of the above.
__________________________
Mrs. B. Naidoo

122
ANNEXURE B
The Principal and Members of the SGB
Dear Sir / Madam
Request to Participate in Research Study
I am currently conducting research on Financial Management in selected public primary
schools in Gauteng ( Ekurhuleni South District). In this dissertation I aim to determine
how principals and SGBs implement financial policy at schools, examine how principals
and SGBs make decisions about budgeting, fee setting and financial resources allocated
by the state and make recommendations on the budgeting process.
I hereby seek your participation in this research study. Your participation will entail
completing a questionnaire on the financial management practices at your school. The
questionnaire is anonymous and all information obtained from the school will be held in
strict confidence. Names of participants and names of schools will not be disclosed.
However, an analysis of the responses to the questionnaire will be done and used in my
dissertation.
It will be greatly appreciated if the principal, chairperson of the SGB and the treasurer of
the SGB (or three members of the schools’ financial committee) could each complete a
copy of the attached questionnaire.
Your participation in this research study is greatly appreciated.
Kind Regards
Bharathi Naidoo

123
ANNEXURE C
FINANCIAL MANAGEMENT IN SELECTED PUBLIC PRIMARY SCHOOLS
QUESTIONNAIRE
The response to this questionnaire and all information obtained from the school will be held in strict confidence. Please do not write the name of the school on this questionnaire. SECTION A: BIOGRAPHICAL DETAILS Please complete the following by placing a tick in the appropriate column.
Official use
5
1
Please indicate your gender 1. Male 2. Female
6
2
Please indicate your current position held at the school. 1. Secretary of the SGB 2.Treasurer of the SGB 3. Chairperson of the SGB 4. Principal
7
3
Into which of the following experience-categories does your involvement (years served) with public primary education fall? 1. 1 to 5 years 2. 6 to 10 years 3. 11 to 15 4. 16 to 20 5. More than 20 years
8

124
4
My understanding of financial management is: 1. Limited 2. Fair / Acceptable 3. Good 4. Excellent
9
5
Please indicate your highest qualifications, eg Matric / Post Matric Qualification 1. Matric 2. Post matric diploma 3. Degree 4. Honours degree 5. Masters degree 6. Doctorate
10
SECTION B: SCHOOL DETAILS
6
Please state the number of learners enrolled at the school
14
7
Please state the number of educators deployed at the school (including those that are employed by the SGB)
16
8
The school is situated in Please mark the appropriate column with a tick 1. An urban area, city centre 2. An urban area, suburb 3. A rural area 4. A township
18

125
9
Is the school a former Model C institution? Please mark the appropriate column with a tick 1. Yes 2. No
19
10
Majority of the learners enrolled at the school reside Please mark the appropriate column with a tick 1. within the vicinity of the school and walk to and from the school
2. away from the school and use public transport to and from the school
20

126
SECTIONS C, D AND E Next to each statement, please circle the number that best expresses the extent to which you agree or disagree with the statement. There is no right or wrong answer. Please circle only one number for each statement. Please use the following scale / key to guide your decision. 1 2 3 4 5 Strongly disagree
Disagree Neutral Agree Strongly Agree
SECTION C : SCHOOL FEES
11
01 In terms of section 39 (1) of the SASA,
school fees are charged at the school as a resolution to do so has been adopted by a majority of parents.
1 2 3 4 5
02 In terms of section 39 (1) of the SASA, parents of learners at the school are consulted annually before school fees are levied
1 2 3 4 5
03 In terms of section 39 (2b) of the SASA, parents of learners at this school are informed of the equitable criteria and procedures for the total, partial or conditional exemption of parents who are unable to pay school fees.
1 2 3 4 5
04 Parents of learners at the school are liable for the payment of school fees
1 2 3 4 5
05 School fees are carefully determined after a careful analysis of the operational requirements of the school
1 2 3 4 5
06 The rules and procedures for handling school fees, post dated cheques etc. are clearly outlined in the school’s financial policy
1 2 3 4 5
07 Most parents school fee accounts are up to date
1 2 3 4 5

127
0 Parents are offered incentives for the full payment of school fees by a stipulated date
8 1 2 3 4 5
0 Parents whose school fee accounts are outstanding are handed over to debt collectors after three months
9 1 2 3 4 5
School fees that are outstanding for more than a year are written off
10 1 2 3 4 5
1 The SGB monitors the collection of school fees closely
1 1 2 3 4 5
31
SECTION D: BUDGETARY PLANNING
12
01 In terms of section 38 of the SASA the
SGB prepares a budget annually which shows the estimated income and expenditure of the school for the following year.
1 2 3 4 5
02 The school budget is drawn up annually in consultation with
1 all stakeholders
2 3 4 5
03 The budgeting system that is used by the school is easy to follow
1 2 3 4 5
04 Funds received from the state is included in the budget
1 2 3 4 5
05 The money raised through the various fund raising events/ activities during the year is included in the budget.
1 2 3 4 5
06 The annual budget is broken down into time periods, eg. per school term
1 2 3 4 5
The budget estimates are calculated using : (07-10)
07 Last years actual figure 1 2 3 4 5 08 Last years actual plus a % increase 1 2 3 4 5 09 Last years budget plus a % increase
(incremental budgeting) 1 2 3 4 5
10 A completely new estimate (zero based budgeting)
1 2 3 4 5
11 Only financial measures are used in drawing up the budget estimates
1 2 3 4 5
12 Actual expenditures are compared with the budget estimates at the end of each year
1 2 3 4 5

128
13 The school has a good cost saving mechanism in place
1 2 3 4 5
14 The school has an effective expense monitoring mechanism in place
1 2 3 4 5
15 Budget is strictly adhered to and an effective monitoring mechanism is in place
1 2 3 4 5
16 In terms of section 38 (2) of the SASA, the school budget is presented annually to a general meeting of parents for consideration and approval by a majority of parents present and voting.
1 2 3 4 5
17 In terms of section 38 (3) of the SASA, parents are informed that the budget is available for inspection at the school at least 14 days prior to the general meeting of parents.
1 2 3 4 5
48

129
SECTION E: FINANCIAL MANAGEMENT
13
01 The SGB manages the finances of the
school 1 2 3 4 5
02 A duly elected finance committee exists and is effective
1 2 3 4 5
03 The school has a comprehensive financial policy
1 2 3 4 5
04 The financial policy was drawn up in consultation with all stakeholders
1 2 3 4 5
05 The school’s financial policy provides clear direction on the use of funds and resources
1 2 3 4 5
06 All decisions pertaining to the finances of the school are made in accordance with the financial policy
1 2 3 4 5
07 A needs analysis is undertaken before resources are purchased for the school
1 2 3 4 5
0 The school has only one bank account and all funds received by the school are deposited in this account
8 1 2 3 4 5
09 The school’s investment account has been approved by the GDE
1 2 3 4 5
10 The finance officer at the school keeps R1000 or less as petty cash
1 2 3 4 5
11 The imprest system is used to monitor the use of petty cash
1 2 3 4 5
12 Strict monitoring and control is exercised during fund raising events at the school
1 2 3 4 5
13 Audited financial statements are provided to the GDE annually
1 2 3 4 5
14 Financial irregularities are attended to in terms of policy
1 2 3 4 5
15 The school has a strategic financial plan and abides by it
1 2 3 4 5
63
THANK YOU FOR YOUR TIME AND VALUABLE INPUT. YOUR INPUTS WILL MAKE A VALUABLE CONTRIBUTION IN
ENHANCING FINANCIAL MANAGEMENT IN PUBLIC PRIMARY SCHOOLS
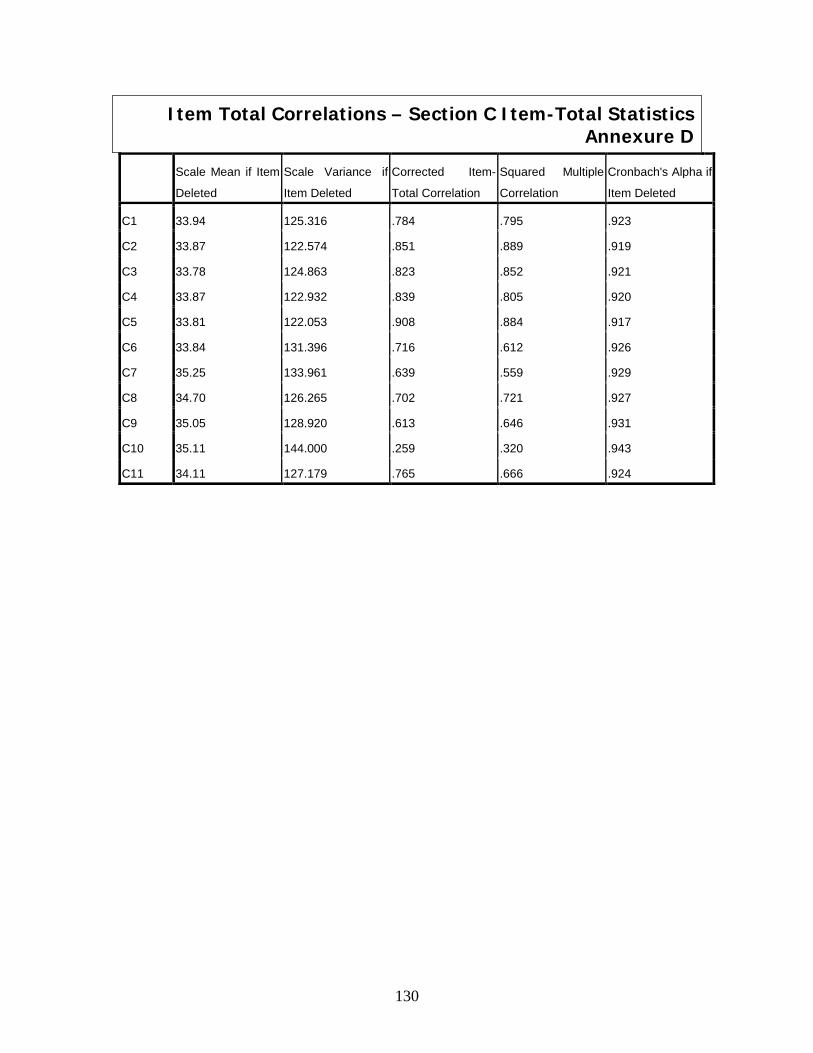
130
Item Total Correlations – Section C Item-Total Statistics Annexure D
Scale Mean if Item
Deleted
Scale Variance if
Item Deleted
Corrected Item-
Total Correlation
Squared Multiple
Correlation
Cronbach's Alpha if
Item Deleted
C1 33.94 125.316 .784 .795 .923
C2 33.87 122.574 .851 .889 .919
C3 33.78 124.863 .823 .852 .921
C4 33.87 122.932 .839 .805 .920
C5 33.81 122.053 .908 .884 .917
C6 33.84 131.396 .716 .612 .926
C7 35.25 133.961 .639 .559 .929
C8 34.70 126.265 .702 .721 .927
C9 35.05 128.920 .613 .646 .931
C10 35.11 144.000 .259 .320 .943
C11 34.11 127.179 .765 .666 .924

131
ITEM TOTAL CORRELATIONS – SECTION D ANNEXURE E
Item-Total Statistics
Scale Mean if Item
Deleted
Scale Variance if
Item Deleted
Corrected Item-
Total Correlation
Squared Multiple
Correlation
Cronbach's Alpha if
Item Deleted
D1 61.07 139.775 .699 .727 .896
D2 61.48 130.301 .743 .728 .891
D3 61.25 137.703 .601 .612 .897
D4 61.11 144.098 .335 .571 .903
D5 61.66 137.251 .413 .385 .903
D6 62.31 130.754 .596 .574 .897
D7 61.81 127.889 .708 .667 .892
D8 61.77 137.398 .452 .494 .901
D9 62.36 139.038 .331 .429 .906
D10 62.89 140.195 .327 .476 .906
D11 61.76 139.770 .427 .390 .901
D12 61.60 129.169 .786 .723 .890
D13 61.76 134.380 .647 .721 .895
D14 61.66 131.348 .719 .825 .892
D15 61.81 136.792 .614 .704 .896
D16 61.31 132.754 .677 .809 .894
D17 61.63 128.359 .722 .798 .892

132
ITEM-TOTAL-CORRELATIONS – SECTION E ANNEXURE F
Item-Total Statistics
Scale Mean if Item
Deleted
Scale Variance if
Item Deleted
Corrected Item-
Total Correlation
Squared Multiple
Correlation
Cronbach's Alpha if
Item Deleted
E1 55.86 105.791 .720 .656 .879
E2 56.21 102.726 .578 .627 .883
E3 55.89 104.810 .769 .766 .878
E4 56.29 98.992 .748 .838 .875
E5 55.96 102.872 .849 .876 .875
E6 55.95 102.630 .797 .850 .876
E7 56.21 99.764 .766 .766 .875
E8 55.69 114.623 .195 .212 .897
E9 56.81 109.800 .228 .241 .904
E10 56.44 107.869 .326 .506 .897
E11 56.86 105.437 .416 .611 .892
E12 56.11 103.823 .679 .705 .879
E13 55.52 112.328 .507 .480 .887
E14 55.78 108.075 .633 .684 .883
E15 56.34 99.594 .727 .824 .876

133