financial integration in europe - april 2008 · 6 ecbfinancial integration in europe april 2008...
TRANSCRIPT

F INANC IAL INTEGRAT ION IN EUROPEAPR I L 2008
EUR
OP
EAN
CEN
TRAL
BAN
KFI
NAN
CIAL
INTE
GR
ATIO
NIN
EUR
OPE
APR
IL20
08

In 2008 all ECB publications
feature a motif taken from the €10 banknote.
FINANCIAL INTEGRATIONIN EUROPE
APRIL 2008

© European Central Bank, 2008
Address Kaiserstrasse 29
60311 Frankfurt am Main
Germany
Postal address Postfach 16 03 19
60066 Frankfurt am Main
Germany
Telephone +49 69 1344 0
Website http://www.ecb.europa.eu
Fax +49 69 1344 6000
All rights reserved. Reproduction for educational and non-commercial purposes is permitted provided that the source is acknowledged.
Unless otherwise stated, this document uses data available as of early April 2008
ISSN 1830-7140 (print)
ISSN 1830-7159 (online)

3ECB
Financial integration in Europe
April 2008
CONTENTSPREFACE 6
EXECUTIVE SUMMARY 8
CHAPTER 1:
THE STATE OF FINANCIAL INTEGRATION
IN THE EURO AREA 11
1 Introduction 11
2 Overview of the fi nancial
market segments 11
CHAPTER 11:
SPECIAL FEATURES 21
A. FINANCIAL DEVELOPMENT: CONCEPTS
AND MEASURES 21
1 Introduction 21
2 Conceptual background 22
3 Evidence from the fi nance
and growth literature 25
4 General indicators 26
5 Market-specifi c indicators 29
6 Conclusions 36
B. THE STEP INITIATIVE 37
1 Introduction 37
2 Need for and approach to
further integration of the short-
term European paper market 37
3 The preparatory phase 40
4 The launch of STEP 40
5 The outcome to date 43
6 Related developments 46
7 Opportunities and challenges 47
8 Conclusions 48
C. INTEGRATION AND DEVELOPMENT
OF MORTGAGE MARKETS IN EUROPE 50
1 Introduction 50
2 Mortgage credit markets 51
3 Policy considerations 54
4 Mortgage funding markets 59
5 Conclusions 66
D. INTEGRATION OF LARGE-VALUE
PAYMENT AND SECURITIES
TRANSACTIONS: TARGET2, TARGET2-
SECURITIES AND CCBM2 67
1 Introduction 67
2 The euro area market
infrastructure before monetary
union 68
3 A fi rst generation of euro area –
wide infrastructures provided
by the Eurosystem: TARGET
and CCBM 69
4 The fi rst step towards
a second-generation market
infrastructure: TARGET2 71
5 Integrating large-value
payments, securities settlement
and collateral handling:
CCBM2 and T2S 73
6 Conclusions 77
CHAPTER 111:
EUROSYSTEM ACTIVITIES FOR FINANCIAL
INTEGRATION 79
1 Legislative and regulatory
framework for the fi nancial system 79
2 Catalyst for private sector
activities 84
3 Knowledge about the state of
fi nancial integration 87
4 Central bank services that foster
integration 91
STATISTICAL ANNEX S1

4ECB
Financial integration in Europe
April 2008
ABCP Asset-backed commercial paper
ACH Automated clearing house
ACI Financial Markets Association
AMEX American Stock Exchange
ATM Automated teller machine
BIS Bank for International Settlements
BSC Banking Supervision Committee
CCBM Correspondent Central Banking Model
CCBM2 Collateral Central Bank Management
CCP Central counterparty
CD Certifi cate of deposit
CDO Collateralised debt obligation
CEIOPS Committee of European Insurance and Occupational Pensions Supervisors
CESAME Clearing and Settlement Advisory Monitoring Expert Group
CESR Committee of European Securities Regulators
CFS Center for Financial Studies
CLS Continuous Linked Settlement
CMBS Commercial mortgage-backed security
CP Commercial paper
CPIS Coordinated Portfolio Investment Survey
CPSS Committee on Payment and Settlement Systems
CRD Capital Requirements Directive
CSD Central securities depository
EBF European Banking Federation
ECB European Central Bank
ECBC European Covered Bond Council
ECD Euro certifi cate of deposits
ECOFIN Council of Economics and Finance Ministers
ECP Euro commercial paper
ECSDA European Central Securities Depository Association
EFMLG European Financial Markets Lawyers Group
EFTPOS Electronic funds transfer at point of sale
EMI European Monetary Institute
EMU Economic and Monetary Union
EONIA Euro overnight index average
EPC European Payments Council
EPM ECB payment mechanism
ESCB European System of Central Banks
ESF European Securitisation Forum
EU European Union
EUREPO Repo market reference rate for the euro
EURIBOR Euro interbank offered rate
FISCO Fiscal Compliance Expert Group
FSAP Financial Services Action Plan
FSC Financial Services Committee
GDP Gross domestic product
HICP Harmonised index of consumer prices
ICM Information and control module
ICMA International Capital Market Association
LIST OF ABBREVIATIONS

5ECB
Financial integration in Europe
April 2008
ABBREVIAT IONS
ICSD International CSD
IFRS International Financial Reporting Standards
IIMG Inter-institutional Monitoring Group
IMF International Monetary Fund
IOSCO International Organisation of Securities Commissions
IPMA International Primary Market Association
IPO Initial public offering
LIBOR London interbank offered rate
LVPS Large-value payment system
M&A Merger and acquisition
MEW Mortgage equity withdrawal
MFI Monetary fi nancial institution
MiFID Markets in Financial Instruments Directive
MIR MFI interest rate
MMF Money market fund
MOG Monitoring Group
MSCI Morgan Stanley Capital International
NASDAQ National Association of Securities Dealers Automated Quotations
NCB National central bank
NYSE New York Stock Exchange
OECD Organisation for Economic Co-operation and Development
OLS Ordinary least squares
OTC Over the counter
PSD Payment Services Directive
R&D Research and development
RMBS Residential mortgage-backed securities
RTGS Real-time gross settlement
SEPA Single Euro Payments Area
SIFMA Securities Industry and Financial Markets Association
SPV Special purpose vehicle
SSP Single shared platform
SSS Securities settlement system
STEP Short-term European paper
STP Straight-through processing
TARGET Trans-European Automated Real-time Gross settlement Express Transfer system
TCN Titres de créances négociables
T2S TARGET2-Securities
UCITS Undertaking for collective investment in transferable securities
UNIDO United Nations Industrial Development Organization
VC Venture capital

6ECB
Financial integration in Europe
April 2008
PREFACE
INTRODUCTION
This is the ECB’s second annual report on
“Financial Integration in Europe”.1 The main
purpose of this report is to contribute towards
the advancement of European fi nancial
integration and to raise public awareness of the
Eurosystem’s role in supporting the fi nancial
integration process.
Against the background of its core tasks, the
Eurosystem has a keen interest in the integration
and effi cient functioning of the fi nancial
system in Europe, particularly in the euro area.2
Financial integration is of key importance for
the conduct of the single monetary policy, as
a well-integrated fi nancial system enhances
the smooth and effective transmission of
monetary policy impulses throughout the
euro area. Furthermore, fi nancial integration
is highly relevant to the Eurosystem’s task of
contributing to safeguarding fi nancial stability.
In addition, fi nancial integration is fundamental
to the Eurosystem’s task of promoting the
smooth operation of payment systems, which
also relates to its great interest in the safe and
effi cient functioning of securities clearing and
settlement systems. Finally, in accordance
with Article 105 of the Treaty, the Eurosystem
supports, without prejudice to the objective of
price stability, the general economic policies of
the Community. Financial integration is a key
component of the general economic policy of
the EU, as it promotes the development of the
fi nancial system, thereby raising the potential
for stronger non-infl ationary economic growth.
The Eurosystem fully supports the efforts of the
private sector as well as those of the European
Commission, the European Parliament and the
Council of Ministers to enhance the integration
and development of the European fi nancial
system. In particular, the ECB works in very
close and effective co-operation with the
European Commission, which has primary
responsibility in this fi eld. As such, this ECB
report complements the work of the European
Commission aimed at enhancing European
fi nancial integration. It focuses mainly on issues
related to the ECB’s core tasks and, in terms of
geographical scope, on developments pertaining
to the euro area. Where relevant, however, issues
will be addressed from an EU perspective.
MAIN ELEMENTS OF THE ECB WORK IN THE FIELD
OF FINANCIAL INTEGRATION3
The ECB considers the market for a given set
of fi nancial instruments or services to be fully
integrated, when all potential participants in
such a market (i) are subject to a single set of
rules when deciding to buy or sell those fi nancial
instruments or services, (ii) have equal access to
this set of fi nancial instruments or services, and
(iii) are treated equally when they operate in the
market.4 Building on this defi nition, the ECB has
developed quantitative indicators of fi nancial
integration in the euro area, which provide
the basis for a comprehensive assessment of
both the current level of fi nancial integration
and its evolution over time. Accordingly, this
report starts with a chapter providing the ECB’s
assessment of the state of fi nancial integration
in the euro area, based on a set of quantitative
indicators.
The analysis of the state of European fi nancial
integration and the monitoring of its progress
over time are prerequisites for targeted action
designed to foster fi nancial integration. The
Eurosystem contributes to this process in four
main ways: (i) by giving advice on the legislative
and regulatory framework for the fi nancial
system and on direct rule-making; (ii) by acting
The fi rst report was published on 28 March 2007 and is available 1
at http://www.ecb.europa.eu/pub/pub/prud/ html/index.en.html.
The Governing Council of the ECB formulated the Eurosystem’s 2
mission statement: “We in the Eurosystem have as our primary
objective the maintenance of price stability for the common
good. Acting also as a leading fi nancial authority, we aim to
safeguard fi nancial stability and promote European fi nancial
integration.” (For more details: http://www.ecb.int/ecb/orga/
escb/html/mission/ eurosys.en.html.)
See also the ECB Monthly Bulletin articles “The integration 3
of Europe’s fi nancial markets” (October 2003) and “The
contribution of the ECB and the Eurosystem to European
fi nancial integration” (May 2006).
The term “market” is used in a broad sense, covering all possible 4
exchanges of fi nancial instruments or services, be these via an
organised market, such as a stock exchange, or via an over-the-
counter market created by a fi nancial institution supplying a
fi nancial instrument or service.

7ECB
Financial integration in Europe
April 2008
PREFACE
as a catalyst for private sector activities by
facilitating collective action; (iii) by enhancing
knowledge, raising awareness and monitoring
the state of European fi nancial integration; and
(iv) by providing central bank services that
also foster European fi nancial integration. In
this vein, the report gives an overview of the
main Eurosystem activities to foster fi nancial
integration during the past year.
Some of the ECB’s initiatives are also explained
in more detail in the Special Features, which
provide in-depth assessments of selected issues
relating to fi nancial integration. The topics of
the Special Features are mainly selected on the
basis of their importance regarding the EU’s
fi nancial integration agenda and their relevance
for the pursuit of the ECB’s tasks. In addition,
some contain analytical articles on the subject
of fi nancial integration.
FUTURE EXTENSION OF THE REPORT’S SCOPE
Financial integration is an important driver for
increasing the fi nancial system’s effi ciency,
which also depends on other factors, such as
the degree of development of the fi nancial
system and the quality of the fundamentals
that determine the framework conditions of the
fi nancial market.
To capture all aspects of fi nancial effi ciency, it
is therefore envisaged to widen the report’s
scope over time to encompass these factors as
well. A fi rst step in this direction is provided by
the Special Feature in Chapter 2, entitled
“Financial development: concepts and
measures”. Such wider analysis is also in line
with the invitation by the Council of Economics
and Finance Ministers (ECOFIN) to the ECB
“to monitor and assess relevant institutional
features that hinder the effi cient functioning of
the fi nancial system, and to pursue efforts aimed
at improving the fi nancial market framework
conditions.”5, 6
See the press release of the ECOFIN meeting, Luxembourg, 5
10 October 2006. This request was also addressed to the
European Commission.
See also “The role of fi nancial markets and innovation for 6
productivity and growth in Europe”, ECB Occasional Paper
No 72, September 2007.

8ECB
Financial integration in Europe
April 2008
EXECUTIVE SUMMARY
The report comprises three main chapters.
Chapter I, together with the statistical annex,
sets out the ECB’s assessment of the degree of
fi nancial integration in the different segments
of the euro area fi nancial system, highlighting
in particular those areas in which integration
is still lagging behind and pertinent recent
developments. Based on a set of quantitative
indicators of fi nancial integration developed by
the ECB, the analysis covers the money, bond,
equity and banking markets, as well as the
underlying market infrastructures.
The degree of integration is found to vary
considerably across the different market
segments, depending also on the degree
of integration of the respective market
infrastructure. The fi nancial market segment
closest to the single monetary policy, the euro
area money market, is already highly integrated.
The signifi cant progress in this area has been
supported by the high degree of integration
of large-value payment systems. The recently
introduced TARGET2 system will establish an
even more uniform wholesale payment service
in the euro area. In addition, a considerable
degree of integration has been achieved in
government and corporate bond markets and,
to an increasing extent, also in euro area equity
markets. A number of initiatives to reduce
the fragmentation of securities settlement
systems, such as the Eurosystem’s TARGET2-
Securities (T2S) project and the industry Code
of Conduct for Clearing and Settlement, are
aimed at fostering further improvements in
securities markets integration. While the euro
area banking markets for wholesale and capital
market-related activities also show clear signs
of increasing integration, the retail banking
segment has remained more fragmented,
as has been the case with the underlying
market infrastructure. However, the Single
Euro Payments Area (SEPA), once fully
implemented, will enhance the integration of
the euro area payment infrastructure and is
expected to provide a major impetus to further
integration in the retail banking segment.
Chapter II includes four Special Features.
The fi rst Special Feature, entitled “Financial development: concepts and measures”, provides
a selection of indicators of fi nancial development
that can be used to monitor and assess potential
frictions in the functioning of fi nancial systems. A
well-functioning fi nancial system is an EU policy
priority as it allows an economy to fully exploit
its growth potential, fosters the accumulation of
capital and improves the diversifi cation of risk.
In addition, the ECB has a special interest in the
functioning of the euro area fi nancial system
since this plays an important role in the effective
performance of the tasks assigned to it by the
Treaty.
The Special Feature introduces the concept
of fi nancial development, clarifi es its relation
to other fi nancial system concepts, such as
integration and stability, and its link to economic
growth. It also presents some key evidence from
the fi nance and growth literature on how the
framework conditions of fi nancial systems impact
on the effi ciency of an economy. The focus
of the Special Feature lies in the presentation
of a selection of indicators to quantify the
functioning of fi nancial systems in the euro area.
These indicators suggest that a fair degree of
heterogeneity in fi nancial system performance
exists across markets and countries in the euro
area. Overall, there appears to be further scope
for structural reforms in the fi nancial sectors of
the euro area.
The second Special Feature, entitled “The STEP initiative”, describes, by means of an example,
one of the ways in which the ECB and the
Eurosystem can promote fi nancial integration
in the euro area, namely by acting as a catalyst
for private sector activities. Specifi cally, it
focuses on the prominent example of this kind
of activity, relating to the ECB’s support for the
market-led Short-Term European Paper (STEP)
initiative to develop a pan-European short-term
paper market.
The Special Feature provides an overview of
the STEP initiative, which originated from the

9ECB
Financial integration in Europe
April 2008
EXECUTIVE SUMMARY
observation that the short-term securities market
has been the least integrated money market
segment since the introduction of the euro. The
main objective of the STEP initiative has been to
address this gap in fi nancial integration via the
development of and the voluntary compliance of
market participants with a core set of commonly
agreed market standards and practices. This
common framework, put forward as the STEP
label for compliant issuance programmes,
was formally launched with the signing of
the STEP Market Convention in June 2006.
The article shows that the STEP initiative has
already yielded signifi cant progress in market
integration and transparency, although efforts
to further expand the recognition and use of the
STEP label are necessary.
The Special Feature highlights the fact that
catalytic action by the Eurosystem has been
instrumental in achieving the success of the
STEP initiative. For example, the Eurosystem
facilitated the interaction among different
market participants in the preparatory phase of
the project, contributed to the development of
the STEP Market Convention and provided
support in raising the awareness of market
participants and the public at large regarding
the initiative. Furthermore, some of the
Eurosystem’s national central banks (NCBs)
are providing technical support for the labelling
process, and the ECB produces daily statistics
on yields and volumes relating to this new
market.
The third Special Feature is entitled “Integration and development of mortgage markets in Europe”. Mortgage markets are an
important part of the euro area fi nancial system,
with mortgage loans being key retail fi nancial
services. Mortgage-backed securities also
constitute a major share of the Eurosystem’s
collateral, second only to public debt. However,
the integration process in the European mortgage
markets has been slow up to now, and a high
degree of diversity as to the range of products and
contract types still prevails, both in the lending
as well as in the secondary funding market.
Apart from natural barriers, such as language
diversity and different consumer preferences,
important economic, legal and institutional
obstacles to further integration remain. The
European Commission released a white paper
on mortgage credit markets in December 2007,
setting out its policy vision for promoting further
integration in and development of EU mortgage
markets. The Special Feature discusses the main
areas of interest from the ECB’s point of view,
with a particular emphasis on the implications
of further integration in European mortgage
markets for monetary policy and fi nancial
stability.
The Eurosystem strongly supports further
integration in mortgage markets, given that it
could result in a more uniform transmission of
monetary policy impulses and a more stable
fi nancial system. However, as more integration
does not preclude the existence of certain risks
to monetary and fi nancial stability (e.g. an
increased vulnerability to shocks from abroad,
foreign competition that may affect credit
standards), the process also has to be carefully
monitored. Moreover, further integration in
these markets is a process that is likely to take
many years.
Although there may be scope for targeted
legislative action, signifi cant further progress
can also be achieved by market participants
themselves. Possible areas of action in that
respect are improvements in transparency
and statistics, the promotion of standardised
products across countries and the development
of market benchmarks. Within the scope of its
responsibilities, and in line with its catalytic
role, the ECB stands ready to support and assist
any market initiatives in the above-mentioned
areas.
The fourth Special Feature, entitled “Integration of large-value payment and securities transactions: TARGET2, TARGET2-Securities and CCBM2”, considers the evolutionary
process towards an integrated and well-
functioning European market infrastructure,
focusing on the contribution of the Eurosystem.
More specifi cally, the article describes the

10ECB
Financial integration in Europe
April 2008
Eurosystem’s role and activities in providing
payment and settlement facilities that foster
market infrastructure integration and ensure the
highest standards of effi ciency and safety.
During a fi rst phase, launched during the
run-up to the introduction of the euro, the
Eurosystem already took a major step forward
with the establishment of TARGET and the
Correspondent Central Banking Model (CCBM)
which enabled the area-wide settlement of
large-value transactions in central bank money
and the cross-border delivery of collateral to the
Eurosystem. However, TARGET and CCBM
did not yet allow market participants to manage
their cash, collateral and securities positions in
an integrated way. The recent establishment of
TARGET2 as a centralised technical service
not only addresses this shortcoming for euro-
denominated large-value and urgent payments,
but also enables the move towards a fully
integrated infrastructure in the fi elds of securities
settlement, liquidity and collateral management.
The Eurosystem has initiated action to realise
this opportunity with the envisaged T2S and
Collateral Central Bank Management (CCBM2)
facilities. Once implemented, the three “second
generation” services – TARGET2, CCBM2, and
T2S – will represent a quantum leap forward
in the integration and quality of the euro area
core infrastructure, with substantial benefi ts for
fi nancial market integration.
Chapter III of the report provides an overview
of the main activities that the Eurosystem
pursued in 2007 with the aim of advancing the
integration of the euro area fi nancial system.7
Key activities related especially to the following
issues:
First, as regards the provision of advice on the legislative and regulatory framework for the fi nancial system, particularly important
areas of ECB and Eurosystem involvement
related in 2007 to the fi rst full review of the
Lamfalussy framework for fi nancial regulation
and supervision across fi nancial sectors and to
various initiatives to enhance the integration,
effi ciency and safety of EU clearing and
settlement systems.
Second, with respect to the catalytic role of the ECB and the Eurosystem for private sector
activities, the Eurosystem provided further
support for the Single Euro Payments Area
(SEPA), which was formally launched in
January 2008. Furthermore, the Eurosystem
continued to contribute to the development
of the STEP market, as set out in the second
Special Feature.
Third, as regards enhancing knowledge, raising awareness and monitoring the state of fi nancial integration, the ECB, among other things,
continued its work on indicators of fi nancial
integration, further developed its work on the
concept of fi nancial development, and deepened
its assessment of the major EU banking groups
in the EU.
Finally, regarding central bank services that also foster fi nancial integration, the launch
of the TARGET2 system in November 2007
constituted a major accomplishment. The
ECB also made signifi cant progress in the
development of the two important projects T2S
and CCBM2, as explained in the fourth Special
Feature.
Chapter III also expands on the chapter on fi nancial integration 7
in the ECB Annual Report.

11ECB
Financial integration in Europe
April 2008
THE STATE OF FINANCIAL INTEGRATION
IN THE EURO AREA
This chapter presents the ECB’s assessment of the degree of fi nancial integration in the euro area, based on a set of fi nancial integration indicators developed and regularly updated by the ECB.1 The annex to this report also contains additional indicators and the methodological notes.
1 INTRODUCTION
This chapter briefl y touches upon the most
signifi cant developments that took place in
2007 in the money, bond, equity and banking
markets. While the chapter provides an overall
assessment of the state of integration in these
markets, the focus is mainly on those elements
that either are not yet adequately integrated
or exhibit interesting dynamics. The analysis
also serves as background documentation for
the topics discussed in the Special Features in
Chapter II.
The available evidence suggests that the degree
of integration varies greatly depending on the
market segment and is, among other things,
correlated with the degree of integration of
the underlying infrastructure. In this respect,
this chapter will introduce some measures of
integration in fi nancial infrastructures, which
will be analysed in more detail in the Special
Feature D in Chapter II.
Finally, as set out in the preface to this report, the
effi ciency of a fi nancial system depends not only
on the degree of fi nancial integration but also on
the degree of its development and the quality
of the fundamentals determining its framework
conditions. In this respect, possible indicators of
fi nancial development are presented in Special
Feature A in Chapter II.
2 OVERVIEW OF THE FINANCIAL MARKET
SEGMENTS
MONEY MARKETS
The euro area money market, defi ned as the
market for interbank short-term debt or deposits,
has been characterised by a high degree of
integration since 1999.
The cross-sectional standard deviation of
the EONIA2 lending rates across euro area
countries fell sharply to close to zero following
the introduction of the euro, and has remained
stable thereafter (see Chart 1 below and
Chart C1 in the annex). During the period under
analysis, an important development was the
emergence of liquidity problems in the short-
term money markets in the context of the global
fi nancial market turbulence. Since August 2007
the volatility of very short-term money market
rates, notably the volatility of the overnight
rates, increased signifi cantly on the back of
these turbulences, not only on a day-to-day
basis, but also intraday. This was refl ected in a
sharp widening of the cross-standard deviation,
in line with an overall increase in the volatility
of the rates among banks in the EONIA panel.
In order to ensure the orderly functioning of the
money market, the ECB provided liquidity in a
series of refi nancing operations.
The increased cross-country dispersion in the
EONIA lending rates might refl ect differences
in credit risk among banks or, alternatively,
higher segmentation in the market and, therefore,
less integration. It could also suggest a move in
transactions towards a preference for national
counterparties and local knowledge of credit
risk. The behaviour of the related indicator for
For a biannual update of the indicators, see the ECB's website at 1
http://www.ecb.int/stats/fi nint/html/index.en.html.
Euro overnight index average.2
CHAPTER 1

12ECB
Financial integration in Europe
April 2008
secured rates – the 1-month and 12-month
EUREPO 3 rates – suggests that the increase in
variability in credit risk is the most probable
explanation. The secured rates segment, in terms
of pricing, has also reached a high degree of
integration (see Chart C2 in the annex) and has
not been affected by the turbulences of last
summer.
The high level of integration suggested by price-
based indicators for the euro area money market
continues to co-exist with a limited degree of
cross-border activity in the euro area short-term
debt securities market. Although the share of
short-term debt securities issued by euro area
residents and held by residents of other euro
area countries has increased over time, it is quite
low when compared with the corresponding
indicators for bonds and equities (see Chart 2
below and Chart C3 in the annex).
The market for short-term securities has
remained much more fragmented, largely
owing to differences in market standards and
practices relating to short-term debt instruments.
By publishing statistics on yields and volumes
of securities complying with the standards
encompassed in the STEP market convention, the
ECB aims to enhance market transparency and to
promote the development of a pan-European short-
term paper (see Special Feature B in Chapter II).
Integration in the money markets has been
accompanied and sustained by the high degree
of integration of the large-value payment
systems (LVPS), which are mostly used for
interbank payment transactions. While in
1998 there were 17 LVPS, this number had
declined one year later to only fi ve systems
plus TARGET, the Trans-European Automated
Real-time Gross settlement Express Transfer
system, which links national real-time gross
settlement (RTGS) systems and the ECB
payment mechanism (EPM) (see Chart C4 in
the annex). Between the introduction of the
euro in 1999 and the end of 2007, two of the
remaining systems closed down. Among the
current systems, most of the payment traffi c is
processed by TARGET and EURO1 (the private
net settlement system). In 2007, TARGET had
a market share of 89.1% by value and 60.5%
by volume of payments processed in euro
LVPSs. The corresponding fi gures for EURO1
Repo market reference rate for euro.3
Chart 1 Cross-country standard deviation of the average unsecured interbank lending rates across euro area countries
(61-day moving average; basis points)
0.0
0.5
1.0
1.5
2.0
2.5
3.0
3.5
4.0
4.5
5.0
0.0
0.5
1.0
1.5
2.0
2.5
3.0
3.5
4.0
4.5
5.0
1999 2000 2001 2002 2003 2004 2005 2006 2007
overnight
1-month maturity
12-month maturity
Sources: EBF, ECB calculations.
Chart 2 The degree of cross-border holdings of short-term debt securities issued by euro area residents
(percentages)
0
2
4
6
8
10
12
14
0
2
4
6
8
10
12
14
Intra-euro area Extra-euro area
2001
2002
2003
2004
2005
2006
Sources: Bank for International Settlements (BIS), International Monetary Fund (IMF) and ECB calculations. Note: “Intra-euro area” is defi ned as the share of short-term debt securities issued by euro area residents and held by residents (excluding central banks) of other euro area countries. “Extra-euro area” is defi ned as the share of short-term debt securities issued by euro area residents and held by non-euro area residents (excluding central banks).
13ECB
Financial integration in Europe
April 2008
I THE STATEOF F INANCIALINTEGRATION
IN THEEURO AREA
were 8.5% and 34.9% respectively. The share
of inter-Member State payments in the total
number of payments processed by TARGET
stood at about 17% in the fi rst half of 1999.
Since then, it has further increased, accounting
for 23% in the fi rst half of 2007 after having
reached a peak of 25% in the fi rst half of 2004
(see Chart C5 in the annex).
The large-value payments segment in Europe
has already reached a high level of streamlining
and consolidation. However, TARGET2, an
enhanced and technically integrated version of
TARGET introduced on 19 November 2007,
provides an even more uniform wholesale
payment service by means of a single technical
platform that allows for the provision of a
harmonised service level, ensuring a level
playing fi eld for banks across Europe. The
TARGET2 system is expected to further improve
the degree of integration of wholesale payment
infrastructures and to provide harmonised cash
settlement services in central bank money
for all kinds of ancillary systems (see Special
Feature D in Chapter II).
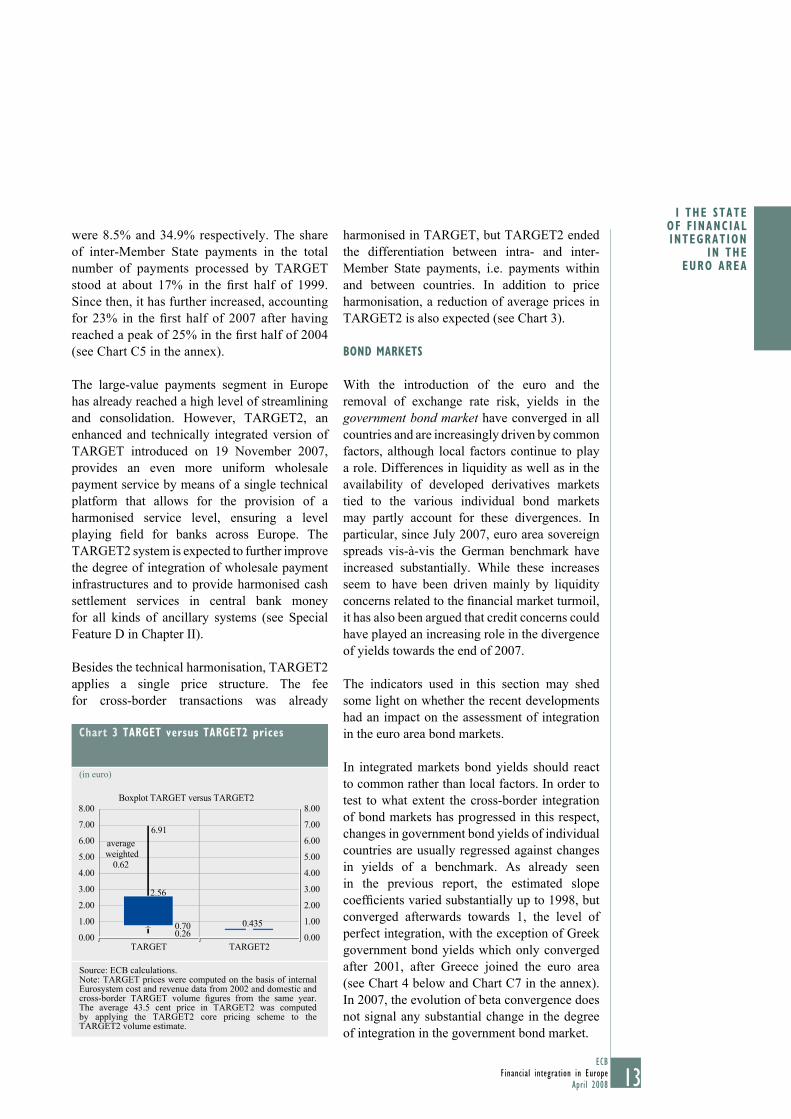
Besides the technical harmonisation, TARGET2
applies a single price structure. The fee
for cross-border transactions was already
harmonised in TARGET, but TARGET2 ended
the differentiation between intra- and inter-
Member State payments, i.e. payments within
and between countries. In addition to price
harmonisation, a reduction of average prices in
TARGET2 is also expected (see Chart 3).
BOND MARKETS
With the introduction of the euro and the
removal of exchange rate risk, yields in the
government bond market have converged in all
countries and are increasingly driven by common
factors, although local factors continue to play
a role. Differences in liquidity as well as in the
availability of developed derivatives markets
tied to the various individual bond markets
may partly account for these divergences. In
particular, since July 2007, euro area sovereign
spreads vis-à-vis the German benchmark have
increased substantially. While these increases
seem to have been driven mainly by liquidity
concerns related to the fi nancial market turmoil,
it has also been argued that credit concerns could
have played an increasing role in the divergence
of yields towards the end of 2007.
The indicators used in this section may shed
some light on whether the recent developments
had an impact on the assessment of integration
in the euro area bond markets.
In integrated markets bond yields should react
to common rather than local factors. In order to
test to what extent the cross-border integration
of bond markets has progressed in this respect,
changes in government bond yields of individual
countries are usually regressed against changes
in yields of a benchmark. As already seen
in the previous report, the estimated slope
coeffi cients varied substantially up to 1998, but
converged afterwards towards 1, the level of
perfect integration, with the exception of Greek
government bond yields which only converged
after 2001, after Greece joined the euro area
(see Chart 4 below and Chart C7 in the annex).
In 2007, the evolution of beta convergence does
not signal any substantial change in the degree
of integration in the government bond market.
Chart 3 TARGET versus TARGET2 prices
(in euro)
Boxplot TARGET versus TARGET2
2.56
6.91
0.26
average
weighted
0.62
0.00
1.00
2.00
3.00
4.00
5.00
6.00
7.00
8.00
0.00
1.00
2.00
3.00
4.00
5.00
6.00
7.00
8.00
TARGET TARGET2
0.70 0.435
Source: ECB calculations.Note: TARGET prices were computed on the basis of internal Eurosystem cost and revenue data from 2002 and domestic and cross-border TARGET volume fi gures from the same year. The average 43.5 cent price in TARGET2 was computed by applying the TARGET2 core pricing scheme to the TARGET2 volume estimate.

14ECB
Financial integration in Europe
April 2008
Additionally, differences in bond yields
across countries may also refl ect (perceived)
differences in credit risk, but this should
not be seen as an indication of poor integration.
Chart 5 (see also Chart C9 in the annex) presents
the estimated constant and slope coeffi cients
of a similar model where sovereign risks
are explicitly proxied by country rating dummies.
Again, in a situation of perfect integration
these coeffi cients should converge to 0 and 1
respectively, assuming that no variables other
than sovereign risk are affecting the change in
yield.
Overall, sovereign risk does play a role, albeit
very small, in explaining differences in bond
yields across countries. This indicator does
not signal any particular increase in this factor
in 2007.
The introduction of the euro has also been one of
the driving forces behind the strong development
of the euro area corporate bond market, whose
integration may be measured by testing whether
risk-adjusted yields have a systematic country
component. In an integrated market, the
proportion of the total yield spread variance that
is explained by country effects should be close
to zero. The respective indicator shows that the
euro area corporate bond market is quite well
integrated. Country effects explain only a very
small constant proportion of the cross-sectional
variance of corporate bond yield spreads
(see Chart 6 above and Chart C11 in the annex).
The fi nding that bond markets are quite well
integrated is also broadly confi rmed when
looking at the share of cross-border holdings. For
instance, holdings of long-term debt securities
issued by governments and non-fi nancial
corporations from other euro area countries
Chart 4 Evolution of beta coefficients for ten-year government bond yields
-3.0-2.0-1.00.01.02.03.04.0
-3.0-2.0-1.00.01.02.03.04.0
Austria
Belgium
Finland
France
Greece
Ireland
Italy
The Netherlands
Portugal
Spain
1992 1994 1996 1998 2000 2002 2004 2006
Sources: Reuters and ECB calculations.Note: The benchmark is the ten-year German government bond.
Chart 5 Evolution of intercept and beta coefficients for ten-year government bond yields, adjusted for sovereign risk
(difference from perfect integration values)
-0.20
-0.10
0.00
0.10
0.20
0.30
0.40
0.50
-0.20
-0.10
0.00
0.10
0.20
0.30
0.40
0.50
1995 1997 1999 2001 2003 2005 2007
constant
beta
Sources: Reuters and ECB calculations.Note: The benchmark is the ten-year German government bond.
Char t 6 P ropor t i on o f c ro s s - s e c t i ona l va r i ance exp l a ined by va r i ous f a c to r s
(percentages)
6050403020100
-10
6050403020100
-101999 2000 2001 2002 2003 2004 2005 2006 2007
explained by country effectexplained by rating effect
explained by common, maturity, coupon, liquidity and industry effects
explained by regression
Sources: Merrill Lynch, Bloomberg, ECB calculations.

15ECB
Financial integration in Europe
April 2008
I THE STATEOF F INANCIALINTEGRATION
IN THEEURO AREA
and held by euro area residents have continued
to increase in the last ten years (see Chart C15
in the annex). In the case of monetary fi nancial
institutions (MFIs), cross-border holdings of
debt securities increased from about 15% to
nearly 40% (see Chart 7 above and Chart C14
in the annex). In particular, the holdings of debt
securities issued by non-fi nancial corporations
have increased markedly from a very low
level, suggesting that investors are increasingly
diversifying their portfolios across the euro area.
An important factor contributing to the integration
of fi nancial markets is related to fi nancial
innovation, in particular to the development
of synthetic credit risk transfer products and
securitisation. The principal role of fi nancial
innovation is to promote market completeness,
which contributes both to the functioning
and development of credit markets and to the
integration and the development of euro area bond
markets (see Special Feature A in Chapter II).
The integration of bond and equity markets
relies greatly on the degree of integration of the
underlying infrastructure, in particular of the
securities settlement systems (SSSs) and central
counterparties.4
The number of legal entities operating a central
securities depository (CSD) in the euro area
merely declined from 21 in 1998 to 20 in 2007,
while the number of central counterparties
(CCPs) for fi nancial instruments (derivatives,
securities) declined from 13 to 7 over the
same period. Some consolidation activities in
clearing and settlement infrastructures have
been purely legal mergers, and the bodies
involved continue to operate and serve their
own markets on separate technical platforms. At
the same time, some initiatives are being taken
to achieve the technical integration of clearing
and settlement processes of different providers.
The most signifi cant initiatives in this regard
are the Eurosystem’s envisaged pan-European
securities settlement platform T2S and the
industry Code of Conduct for Clearing and
Settlement.5 SSSs and CCPs may become better
integrated not only through consolidation, but
also by establishing links between different
systems, subject to their effective interoperability.
In this respect, it is important to note that the
implementation of the Code of Conduct is
expected to boost interoperability between
different trading and post-trading platform
providers signifi cantly. For Eurosystem credit
operations within the euro area, the number of
eligible links for SSSs increased considerably
in the fi rst two years of EMU (see Chart C17 in
the annex). However, the use of these links in
the delivery of collateral to the Eurosystem has
remained moderate because of market preferences
for using the Eurosystem’s CCBM service.6
EQUITY MARKETS
Measures of euro area equity market integration
indicate progress in this market segment too.
The SSSs also play a crucial role in the Eurosystem’s collateral 4
framework, as they provide the necessary infrastructure to allow
counterparties to transfer collateral to the Eurosystem. It is
interesting to note that the share of cross-border collateral held
by the Eurosystem has increased signifi cantly, from 28% in 2002
to 48.5% in 2007 (see Chart C20 in the annex).
See Special Feature D in Chapter II as well as Chapter III for 5
further information.
This is further discussed in Special Feature D in Chapter II.6
Chart 7 Share of MFI cross-border holdings of debt securities issued by euro area and EU non-MFIs: outstanding amounts by residency of the issuer
(as a share of total holdings, excluding the Eurosystem)
other euro area - government and corporate bonds
other euro area - corporate bonds
other euro area - government bonds
rest of EU - government and corporate bonds
1998 19991997 2000 2001 2002 2003 2004 2005 2006 2007
0
5
10
15
20
25
30
35
40
45
0
5
10
15
20
25
30
35
40
45
Sep. Mar. Sep. Mar. Sep. Mar. Sep. Mar. Sep. Mar. Sep. Mar. Sep. Mar. Sep. Mar. Sep. Mar. Sep. Mar. Sep.
Source: ECB.

16ECB
Financial integration in Europe
April 2008
One simple indicator of equity market integration
compares the country and sector dispersions
in monthly stock returns over time. The more
integrated the market, the greater are the benefi ts
of diversifi cation through sector-based equity
investments strategies rather than through
country-based ones. Chart 8 (see also Chart C21
in the annex) shows that this has been the case
since 2001. This trend reversed in the second half
of 2007. It is still too early to assess whether this
is due to a national entrenchment resulting from
the fi nancial market turmoil in the second half of
2007 or whether it is of a more permanent nature.
However, both country and sector dispersions
have strongly decreased in the past few years.
This has rendered it more diffi cult to assess the
relative importance of sector diversifi cation
and country diversifi cation. In this respect,
the analysis needs to be complemented with
alternative indicators, which can be derived, for
instance, from factor models.
In an integrated equity market, prices should
be mainly driven by common euro area factors,
rather than by country-specifi c ones. Under the
assumption that equity returns react to both
local and global factors – proxied respectively
by shocks in aggregate euro area and US equity
markets (whereby the latter also capture effects
from globalisation) – it is possible to measure
the proportion of the total domestic equity
volatility that can be explained by local and
global factors respectively (“variance ratios”).
Looking at the data, it can be seen that variance
ratios have increased over the past 30 years with
respect to both euro area-wide and US shocks,
although the rise has been stronger for the former
(see Chart 9 above and Chart C22 in the
annex). This suggests that regional euro area
integration has proceeded more quickly than
worldwide integration, even though the level
of the variance explained by common factors
(about 38% for euro area shocks and 16%
for US shocks) reveals that local shocks are
still important.
Chart 8 Filtered cross-country and cross-sector dispersions in euro area equity returns
(percentages)
0.00
0.01
0.02
0.03
0.04
0.05
0.060.06
0.000.00
0.010.01
0.020.02
0.030.03
0.040.04
0.050.05
0.060.06
country dispersion
sector dispersion
19801976 1984 1988 1992 1996 2000 2004 2008
Sources: Thomson Financial Datastream and ECB calculations.
Chart 9 Proportion of variance in local equity returns explained by euro area and US shocks
(percentages)
05
1015202530354045
051015202530354045
1999-2007
US shocksEU shocks
1973-1985 1986-1991 1992-1998
Sources: Thomson Financial Datastream and ECB calculations.
Chart 10 Investment funds’ holdings of equity issued in other euro area countries and the rest of the world
(as a percentage of total holdings of equity)
0
10
20
30
40
50
60
0
10
20
30
40
50
60
other euro area Member States
rest of the world
1999 2000 2001 2002 2003 2004 2005 2006 2007
Source: ECB.

17ECB
Financial integration in Europe
April 2008
I THE STATEOF F INANCIALINTEGRATION
IN THEEURO AREA
Quantity-based measures also indicate a rising
degree of integration in the equity markets (see
Chart C24 in the annex). Between 1997 and
2006 euro area residents doubled their holdings
of equity issued in other euro area countries (as
a share of their total portfolio of shares issued in
their own country and elsewhere in the euro area)
to 29%, whereas the share of euro area equity
assets held outside the euro area remained at a
much lower level and increased only slightly.
Institutional investors contributed to the process
of reallocation of domestic equity holdings to
equity holdings elsewhere within the euro area.
Chart 10 (see also Chart C25 in the annex) shows
what share of investment funds’ total holdings of
all shares and other equity (excluding investment
fund shares/units) is issued by residents of the
euro area outside the Member State in which
the investment fund is located. Since 1999 this
share has increased from 17% to 25%.
Regarding market infrastructures, the euro area
securities settlement infrastructure for equities
is even less integrated than the one for bonds.
For instance, while the cross-border settlement
of bonds is largely concentrated in two
international CSDs, the international settlement
of equities still relies heavily on national CSDs.
In addition, other qualitative barriers – such as
differences in settlement cycles or the handling
of corporate events and taxation – continue to
hinder progress in the integration of equities
infrastructures considerably. However, efforts
to reduce these barriers are currently under way,
as described in Special Feature D in Chapter II
and in Chapter III.
BANKING MARKETS
Banking markets encompass interbank (or
wholesale) activities, capital market-related
activities and retail banking activities. The
indicators reveal that the euro area retail banking
markets continue to be fragmented, whereas the
euro area interbank (or wholesale) market and
capital market-related activities show clear signs
of increasing integration.7
The cross-border activity of banks plays an
important role in the process of fi nancial
integration. One simple way to measure the
development of cross-border activity is to
monitor the establishment and activity of foreign
branches and subsidiaries over time.
Charts 11 and 12 (see also Charts C28 and C29
in the annex) show that the share of assets held
in foreign branches and subsidiaries established
in other euro area countries is limited in both
cases. However, whereas the median share of
assets of foreign subsidiaries increased in the
six years to 2007 from 8.8% to 14.4% of total
banking assets, the median share of assets of
foreign branches decreased slightly over time,
accounting for 2.0% in 2007. These fi gures
suggest that most of the assets of the euro area
banks in other euro area countries are still held
in subsidiaries rather than in branches.
Another indicator of the cross-border presence
of euro area banks is their cross-border merger
Recent research based on the European syndicated loan 7
market concludes that less-than full cross-border integration
still persists in that market segment. See L. Barbosa and
N. Ribeiro, “Determinants of spreads in syndicated loans to
euro area corporates”, Banco de Portugal Economic Bulletin,
Summer 2007.
Chart 11 Dispersion of the total assets of euro area bank branches across euro area countries
(as a percentage of the total assets of the euro area banking sector)
0
10
20
00
1010
2020
2001 2002 2003 2004 2005 2006 2007
Source: ECB. Note: The lower and upper markers show the minimum and maximum observations among the 12 euro area countries. The bottom and top of the box show the fi rst and third quartile. The blue line shows the median share of assets of branches in all euro area countries.

18ECB
Financial integration in Europe
April 2008
and acquisition (M&A) activity, as shown in
Chart 13 (see also Chart C30 in the annex).
While on average there has been much less
cross-border banking consolidation than
domestic consolidation over the past few years,
the indicator does reveal that there has been
an increase in euro area cross-border M&A
transactions in terms of value since 2003. This
trend was particularly strong in 2005, when
several large-value transactions were conducted,
amounting to over 50% of the total M&A
value in the euro area banking system. At the
same time, the recent trend towards a declining
number of M&A transactions also continued
in the fi rst half of 2007, signalling an overall
increase in the average transaction value.
Quantity-based indicators for wholesale and
capital market-related securities transactions
of MFIs indicate a rising share of cross-border
holdings since the end of the 1990s. Chart 14 (see
also Chart C36 in the annex) shows that the share
of securities issued by MFIs from other euro area
countries has almost tripled in the last ten years.
The dispersion of interest rates on loans
and deposits from banks to non-fi nancial
corporations and households can be taken as
an indicator for the degree of integration in the
retail bank market. Chart 15 (see Chart C32 in
the annex) shows that the euro area cross-country
dispersion of bank interest rates, in particular
of interest rates on loans to households for
consumption purposes, has remained relatively
high and has tended to increase in recent years
while the dispersion of interest rates has been
lower in the case of loans for house purchases
(see also the Special Feature C in Chapter II).
Although there are still signifi cant differences in
the levels of interest rates in euro area countries,
Chart 13 Euro area cross-border bank M&A activity
(as a percentage of the total value of euro area banking sector M&As and in absolute numbers)
70
60
50
40
30
20
10
0
181614121086420
2000 2001 2002 2003 2004 2005 2006 2007
value of cross-border deals (%)number of cross-border deals
Sources: Bureau van Dijk (Zephyr database), ECB calculations.Note: M&A deals include both controlling and minority stakes. In 2005 some large-value euro area cross-border M&A transactions were conducted.
Chart 14 MFI holdings of securities issued by MFIs: outstanding amounts by residency of the issuer
(percentages; as a share of total holdings; excluding the Eurosystem)
0
5
10
15
20
25
30
35
0
5
10
15
20
25
30
35
other euro area Member States
rest of EU
1998 19991997 2000 2001 2002 2003 2004 2005 2006 2007Sep. Mar. Sep. Mar. Sep. Mar. Sep. Mar. Sep. Mar. Sep. Mar. Sep. Mar. Sep. Mar. Sep. Mar. Sep. Mar. Sep.
Source: ECB.
Chart 12 Dispersion of the total assets of euro area bank subsidiaries across euro area countries
(as a percentage of the total assets of the euro area banking sector)
2001 2002 2003 2004 2005 2006 20070
10
20
30
40
50
60
70
80
0
10
20
30
40
50
60
70
80
Source: ECB.Note: See note to Chart 11.

19ECB
Financial integration in Europe
April 2008
I THE STATEOF F INANCIALINTEGRATION
IN THEEURO AREA
a process of convergence is underway. One way
to measure this process is to see whether interest
rates across euro area countries have converged
to a specifi c benchmark over time. For the
purposes of this report, the benchmark has been
chosen to be the lowest interest rate level within
a euro area country in each category, under the
assumption that this should refl ect the level
towards which, as a result of increased
integration and competition within the euro area,
the interest rates for the same product in other
euro area countries should converge.8 In order
to measure the speed of convergence, the
important parameter is the β-coeffi cient, which
is the estimated coeffi cient of a regression where
the change in the spread between a specifi c
country interest rate and the benchmark is
regressed on the lagged spread. Negative values
of the β-coeffi cient signal that convergence is
taking place. In particular, a coeffi cient close to
-1 signals a completed convergence process.
The presence of country-specifi c effects in the
estimation controls for the existence of
differences at country level.
Large values of the country-specifi c effects
indicate the existence of market heterogeneity
that may be related to differences in institutional
and other factors. Chart 16 (see also Chart C33
in the annex) shows the evolution of the average
value of the country effects. These effects have
See also L. Vajanne (2006), Integration in euro area retail 8
banking markets – convergence of credit interest rates, Suomen
Pankki, Working paper No 8. This methodology does not take
into consideration differences in credit risks across countries and
the fact that loan interest rates could be lower than what would
be the effi cient outcome.
Chart 15 Cross-country standard deviation of MFI interest rates on loans to households
(basis points)
0
20
40
60
80
100
120
140
160
0
20
40
60
80
100
120
140
160
consumer credit: over 1 year and up to 5 years
house purchase: with variable rate and initial rate
fixation up to 1 year
house purchase: with initial rate fixation over
5 years and up to 10 years
2003 2004 2005 2006 2007
Source: ECB.Note: The measure is based on MFI interest rates on new business.
Chart 16 Intercept convergence for selected banking retail interest rates
-1.0
-0.5
0.0
0.5
1.0
1.5
2.0
2.5
3.0
3.5
4.0
1991 1993 1995 1997 1999 2001 2003 2005 2007-1.0
-0.5
0.0
0.5
1.0
1.5
2.0
2.5
3.0
3.5
4.0
loans to non-financial corporations up to an amount
of € 1 million; variable rate and up to 1 year initial
rate fixation
loans to non-financial corporations over an amount
of € 1 million; variable rate and up to 1 year initial
rate fixation
loans to households for house purchases;
variable rate and up to 1 year initial rate fixation
loans to households for house purchases;
over 5 and up to 10 years initial rate fixation
Source: ECB.
Chart 17 Beta convergence for selected banking retail interest rates
-1.00
-0.80
-0.60
-0.40
-0.20
0.00
0.20
1991 1993 1995 1997 1999 2001 2003 2005 2007-1.00
-0.80
-0.60
-0.40
-0.20
0.00
0.20
loans to non-financial corporations up to an amount of
loans to non-financial corporations over an amount of
loans to households for house purchases; variable rate
loans to households for house purchases; over 5 and
€1 million; variable rate and up to 1 year initial
€1 million; variable rate and up to 1 year initial
and up to 1 year initial rate fixation
up to 10 years initial rate fixation
Source: ECB.

20ECB
Financial integration in Europe
April 2008
become smaller over time, pointing to a reduction
in the differences for some selected indicators.
Chart 17 (see also Chart C 34 in the annex)
reports the evolution of the β-coeffi cient over
time for selected interest rates. The fact that the
coeffi cient is almost always negative indicates
that the process of convergence has been
continuing over time, although the speed of
convergence (given by the size of the coeffi cient)
tends to be far from -1.
In this respect, it should be noted that differences
in bank interest rates can be due to several
factors, such as different conditions in national
economies (credit and interest rate risk, fi rm
size, industrial structure, degree of capital
market development), institutional factors
(taxation, regulation, supervision, consumer
protection), and fi nancial structures (degree of
bank/capital market fi nancing, competitiveness).9
Moreover, the co-existence of different products
in different countries may not be a symptom of
lack of integration; rather, it may result from
different preferences, the age structure or other
intrinsic characteristics of the population.
The low level of retail banking integration is
also associated with a relatively high level of
fragmentation of retail payment infrastructures
(see Charts C43 and C44 in the annex), where
procedures, instruments and services offered to
customers are not yet completely harmonised.
This shortcoming is being addressed in the
context of the SEPA project. With the realisation
of SEPA, there will no longer be any differences
in the euro area between national and cross-
border retail payments.10
See “Differences in MFI interest rates across euro area 9
countries”, September 2006.
See Chapter III for updated information on SEPA. A 10
comprehensive overview of the SEPA project was provided
in Special Feature C in Chapter II of the 2007 ECB Report on
Financial Integration.

21ECB
Financial integration in Europe
April 2008
A. FINANCIAL DEVELOPMENT: CONCEPTS AND
MEASURES
Previous research and policy work has emphasised the importance of fi nancial integration for fi nancial market effi ciency. Some frictions in fi nancial markets can persist even if fi nancial integration is complete. The development of fi nancial systems helps to overcome these frictions. Financial development is therefore complementary to fi nancial integration in fostering fi nancial market effi ciency. This Special Feature provides a selection of indicators of fi nancial development that can be used to monitor and assess potential frictions (and therefore a lack of fi nancial development) in the functioning of fi nancial systems. These indicators suggest a fair degree of heterogeneity across markets and countries in the euro area. Overall, there appears to be further scope for structural reforms in the fi nancial sectors of the euro area.
1 INTRODUCTION
This Special Feature focuses on the functioning
of the fi nancial sector and its contribution to
productivity, innovation and growth in the euro
area. A well-functioning fi nancial system
contributes to allowing an economy to fully
exploit its growth potential, as it ensures that the
best real investment opportunities receive the
necessary funding. Moreover, an effi cient
fi nancial system fosters the accumulation of
capital, enhances risk sharing and improves the
diversifi cation of risk. Consequently, the
fi nancial system has received special attention
in European public policy in recent years.1 The
ECB has a special interest in the functioning of
the euro area fi nancial system since it plays a
crucial role in the implementation and
transmission of the single monetary policy, it
has implications for the ECB’s task of helping
to safeguard fi nancial stability and is important
for the smooth functioning of payment and
securities settlement systems.2
While fi nancial integration is an important driver
for increasing the effi ciency of a fi nancial system,
the latter also depends on other factors such as
the level of its development and the quality of
the fundamentals determining the framework
conditions of fi nancial markets. For example,
to understand how problems in the market for
sub-prime residential mortgages in the US
spilled over globally fi rst to other credit markets
and then to the money markets, it is necessary
to consider asymmetric information problems
between buyers and sellers of complex fi nancial
products. To capture all aspects of fi nancial
effi ciency, it is therefore envisaged to widen the
scope of the report on Financial Integration in
Europe over time to address these issues.3
This Special Feature is a fi rst step in this
direction.4 Section 2 introduces the concept of
fi nancial development and looks at its relation to
other fi nancial system concepts such as integration
The EU made structural reform of the fi nancial sector one of 1
the priorities under the Lisbon Agenda. In particular, in the
European Commission’s Financial Services Action Plan (FSAP)
(1999-2004), the implementation of which is in the process of
being fi nalised in Member States, greater European fi nancial
integration to complete the single market for fi nancial services
is an important objective. Following up on this, the Commission
published a white paper explaining its fi nancial sector policies
for the period from 2005 to 2010 (EU commission, “White
paper – Financial Services Policy 2005-2010”, December 2005).
The interest of the ECB in fi nancial sector issues is, apart from 2
this report and the fi rst issue of the ECB’s report “Financial
integration in Europe” (March 2007), also refl ected inter alia
in the articles entitled “Recent developments in fi nancial
structures of the euro area” and “The contribution of the
ECB and the Eurosystem to European fi nancial integration”
in the October 2003 and May 2006 issues of the ECB's
Monthly Bulletin respectively, in the publication of the
bi-annual ECB Financial Stability Review since December 2004
and in V. Gaspar, P. Hartmann and O. Sleijpen (eds.) ( 2003), “The
Transformation of the European Financial System”, Proceedings
of the Second ECB Central Banking Conference, ECB,
Frankfurt.
This is in line with the ECOFIN’s invitation to the ECB and 3
the European Commission “to monitor and assess relevant
institutional features that hinder the effi cient functioning of the
fi nancial system, and to pursue efforts aimed at improving the
fi nancial market framework conditions.” (see the press release of
the ECOFIN meeting, Luxembourg, 10 October 2006).
This Special Feature and its conceptual background draw 4
extensively on the article entitled “Assessing the performance
of fi nancial systems” in the October 2005 issue of the ECB’s
Monthly Bulletin and on P. Hartmann, F. Heider, E. Papaioannou
and M. Lo Duca (2007), “The Role of Financial Markets
and Innovation in Productivity and Growth in Europe”, ECB
Occasional Paper No 72; an earlier version of this Occasional
Paper was prepared as a background document for a discussion
of the EU fi nance ministers and central bank governors at the
informal ECOFIN meeting in Helsinki on 8 and 9 September
2006.
CHAPTER 2
SPECIAL FEATURES

22ECB
Financial integration in Europe
April 2008
and stability and its link to economic growth.
Section 3 presents some key evidence from the
fi nance and growth literature that studies how the
framework conditions of fi nancial systems impact
on the effi ciency of an economy. Sections 4 and 5
present a selection of indicators to quantify the
functioning of fi nancial systems in the euro area.
Section 4 shows indicators that are of general
nature and that cannot be linked to a specifi c
market, while Section 5 considers indicators
pertaining to bond, equity and banking markets
respectively. Where possible, fi ndings on these
indicators for the 12 euro area countries, the euro
area aggregate, other European countries
(Sweden, Switzerland and the United Kingdom)
and major non-European countries (the United
States and Japan) are displayed.5 Subject to data
availability, indicators are tracked over time to
identify trends. The comparison with non-euro
area countries allows to distinguish trends which
are specifi c to the euro area and trends which are
not. Section 6 concludes.
2 CONCEPTUAL BACKGROUND
A fi nancial system allocates resources from
agents which have a surplus to those which have
a shortage of funds. It can be defi ned as the set
of markets, intermediaries and infrastructures
through which households, corporations and
governments obtain funding for their activities
and invest their savings.6 For example, fi rms
may see profi table real investment opportunities,
but may not have enough internal funds to
fi nance them. Households may want to even out
consumption over their life-cycle by investing
their savings in assets that pay a return when
their income is reduced due to retirement.
Finally, governments may wish to increase
investment spending during recessions, drawing
on the savings of other sectors.7
Chart 18 below presents a simple framework
to guide and summarise discussions of the
performance of fi nancial systems.
There are three levels of the analysis. The
fi rst level concerns the “conditioning”
elements of fi nancial systems. These are
fundamental elements that do not change
very fast and therefore tend to be taken as
given by market participants, e.g. legal and
regulatory frameworks or the balance between
intermediaries and markets. The second level
relates to the performance of fi nancial systems,
e.g. with respect to how well information is
incorporated into stock prices or the extent of
securitisation. The third level focuses on the
performance of the economy as a whole, using
standard economic objectives such as growth
and price stability.
This Special Feature concentrates on how the
fundamentals of a fi nancial system relate to
its performance. While previous research and
policy work has emphasised the importance
of fi nancial integration, this Special Feature
focuses on the role of fi nancial development.
Financial integration and fi nancial development
are distinct, but interrelated because they both
affect the performance of a fi nancial system.
Integration generates competitive pressures on
fi nancial intermediaries, creates economies of
scale, increases overall market liquidity and
improves the scope for diversifi cation and risk
sharing.8 However, frictions in fi nancial markets
Slovenia became member of the euro area on 1 January 2007. 5
Cyprus and Malta joined the euro area on 1 January 2008. They
are not included as all the data refer to the period before their
entry.
See P. Hartmann, A. Maddaloni and S. Manganelli (2003), “The 6
Euro-Area Financial System: Structure, Integration and Policy
Initiatives”, Oxford Review of Economic Policy, 19, pp. 180-213.
Early work on fi nance and growth can be found in J. Schumpeter
(1912), “Theorie der Wirtschaftlichen Entwicklung”, Duncker und
Humblot, Leipzig; R. Goldsmith (1969), “Financial Structure and
Development”, Yale University Press, New Haven, Connecticut;
and R.I. McKinnon (1973), “Money and Capital in Economic
Development”, Brookings Institution, Washington, DC.
Accordingly, the fl ow of funds in the euro area shows that 7
the household sector is a net provider of funds, whereas the
government and non-fi nancial fi rm sectors are net receivers of
funds. In line with its intermediation role in these fl ows, the
fi nancial sector is in balance (see ECB, “Report on Financial
Structures”, October 2002).
For evidence on competition among fi nancial intermediaries and 8
the impact of integration in banking on fi nancial development
see P.E. Strahan (2003), “The Real Effects of US Banking
Deregulation”, The Federal Reserve Bank of St. Louis Review,
85, pp. 111-128; and M. Bertrand, A. Schoar and D. Thesmar
(2007), “Banking Deregulation and Industry Structure: Evidence
from the French Banking Reforms of 1985”, Journal of Finance,
62, pp. 597-628; and P. Hartmann et al. (2007), op. cit.

23ECB
Financial integration in Europe
April 2008
2 SPEC IAL FEATURES
can persist even after fi nancial integration is
completed.
An important source of frictions is asymmetric
information among economic agents active in
the fi nancial system. For example, investors
delegate real investment decisions to managers
who usually have better information about the
quality of the investment. Since investors cannot
perfectly monitor managers they demand a
premium on their investment return that
increases the cost of capital for fi rms. The
drying-up of the interbank market during the
sub-prime mortgage turmoil is another example
of how asymmetric information leads to
frictions. As a bank may not know what risks it
will be exposed to by lending to another bank
that in turn may face large negative shocks, e.g.
due to credit lines to issuers of collateralised
debt obligations (CDOs), it protects itself by
charging a higher interest rate or, in the extreme,
by not lending at all (this is an example of
adverse selection).9 Asymmetric information
can be directly reduced via more transparency
and disclosure. Venture capital fi nancing and
bank relationship fi nancing are indirect
responses of fi nancial systems to this problem,
For classic accounts of market breakdowns and adverse selection 9
caused by asymmetric information see G. Akerlof (1970), “The
Market for ‘Lemons’: Quality Uncertainty and the Market
Mechanism”, Quarterly Journal of Economics, 84, pp. 488-500;
J. Stiglitz and A. Weiss (1981), “Credit Rationing in Markets
with Imperfect Information”, American Economic Review,
71, pp. 393-410; and S. Myers and N. Majluf (1984), “Corporate
Financing and Investment Decisions When Firms Have
Information that Investors Do Not Have”, Journal of Financial Economics, 13, pp. 187-221.
Chart 18 Financial system concepts and their interrelation
Fundamentals of the financial system
Financial Integration
Performance of the financial system
FinancialEfficiency
FinancialStability
Performance of the economy
Economic Stability• Price Stability
Economic Efficiency• Economic Growth
MonetaryInstitutions
FinancialStructure
MarketInfrastructures
Other ConditioningFeatures
Legal System,Financial Regulation andCorporate Governance
Financial Development / Modernisation
Source: ECB.

24ECB
Financial integration in Europe
April 2008
which is particularly pronounced for small and
medium-sized fi rms that constitute large parts of
the corporate sector and also account for much
of the employment in European economies. For
larger and more mature fi rms, the pricing
mechanism in stock markets is important for
reducing asymmetric information.
A related friction is caused by providers and
users of capital having different investment
objectives. For example, owners of fi rms
may wish to maximise value, whereas other
stakeholders may concentrate on maintaining
control or increasing the size of the fi rm.10
Similarly, borrowing households may have
different risk preferences than banks, which are
primarily interested in loan repayment. These
differences distort investment decisions. Good
corporate governance and reliable enforcement
through the legal system help fi nancial systems
to minimise such ineffi ciencies.
Other sources of frictions are the dispersion of
capital across many investors and the mismatch
between the time horizons of fi nancial investors
and real investment projects.11 The dispersed
supply of capital needs to be pooled through
intermediaries and markets. Human capital and
physical assets used in production are illiquid
whereas households often wish to preserve the
fl exibility to use their savings for consumption.
Financial institutions and markets solve these
problems to a large extent by pooling large
numbers of investors and performing maturity
transformations.
Finally, there are frictions in the exchange
of goods and services more generally, such
as transaction costs, which can be alleviated
through an effi cient fi nancial system. Sight
deposits, credit cards with overdraft facilities
and special forms of fi nance, such as consumer
credit, help households in the exchange process.
The development of fi nancial systems helps to
overcome these frictions. It refers to the process
of fi nancial innovation and organisational
improvements that reduces asymmetric
information, increases the completeness of
markets, adds possibilities for agents to engage
in fi nancial transactions through (explicit or
implicit) contracts, reduces transaction costs and
increases competition.
The performance of a fi nancial system has two
basic dimensions, its effi ciency and its stability.
This Special Feature focuses only on the
effi ciency of a fi nancial system, which can be
understood as a condition in which the available
capital in a fi nancial system is allocated towards
the most valuable investment opportunities at
the lowest possible cost.12 An effi cient allocation
of capital therefore supports economic growth.
In an effi cient fi nancial system markets are
competitive, information is accessible, credible
and widely distributed, and agency confl icts
are resolved e.g. through contracts enforced by
well-functioning legal systems. Frictions in the
fi nancial system hamper the allocation of capital,
lead to ineffi ciency, and impair the contribution
of fi nance to growth.13
There is an extensive literature on how fi nancial
development promotes economic growth (the
link between the second and third levels in
Chart 18) which we present next.14
See M.C. Jensen and W.H. Meckling (1976), “Theory of the 10
Firm: Managerial Behaviour, Agency Costs and Ownership
Structure”, Journal of Financial Economics, 3, pp. 303-360.
See F. Allen and D. Gale (1997), “Financial Market, 11
Intermediaries and Intertemporal Smoothing”, Journal of Political Economy, 105, pp. 523-546.
Distinct from fi nancial effi ciency, fi nancial stability can be 12
understood as a condition in which the fi nancial system –
comprising fi nancial intermediaries, markets and market
infrastructures – is capable of withstanding shocks and the
unravelling of fi nancial imbalances, thereby mitigating the
likelihood of disruptions in the fi nancial intermediation process
which are severe enough to signifi cantly impair the allocation of
savings to profi table investment opportunities (see the preface
of the December 2006 ECB Financial Stability Review). The
distinction between these two concepts is based on standard
economic theory which distinguishes, for example, between the
effi ciency and the stability of equilibria in an economic system,
and on the fact that ensuring effi ciency and stability often
requires different policies.
See R. Levine (2005), “Finance and growth: Theory and 13
evidence”, in P. Aghion and S. Durlauf (eds): Handbook of Economic Growth, Elsevier, Amsterdam.
See R. Levine (2005), op.cit.; and E. Papaioannou (2008), 14
“Finance and Growth: a Macroeconomic Assessment of the
Evidence from a European Angle”, in X. Freixas, P. Hartmann
and C. Mayer (eds), Handbook of European Financial Markets and Institutions, Oxford University Press, Oxford,
United Kingdom, pp. 68 - 98.
25ECB
Financial integration in Europe
April 2008
2 SPEC IAL FEATURES
3 EVIDENCE FROM THE FINANCE AND GROWTH
LITERATURE
The fi rst signifi cant econometric evidence using
substantive cross-country panel data showed
that countries in which banks extend more credit
to the private sector experience stronger
economic growth.15 Next, it was found that both
the extent of bank lending and the development
of stock markets have independent benefi cial
effects on economic growth.16 Furthermore, the
positive effect of fi nancial intermediation on
growth is due to increases in total factor
productivity rather than increased investment
per se or the accumulation of human capital.17
The literature then examined more closely how
exactly fi nance affects growth. Sectors and
fi rms that depend more on external fi nancing
for technology-related reasons grow faster in
countries in which banks extend more credit to
the private sector, stock markets are larger and
accounting standards are of higher quality.18
Further empirical work also suggested that
industries in countries with more developed
fi nancial markets and with more open trade
possibilities are able to adopt new production
technologies more quickly.19 Deregulation in
the banking sector in the United States and in
France, e.g. lifting the restrictions on out-of-
state branching or on some bank activities,
provided another fruitful testing ground to show
how increased competition in the banking sector
may improve the effi ciency of fi nancial markets
and contribute to a higher economic effi ciency
and growth.20
Of particular interest is the Schumpeterian
hypothesis that fi nance fosters growth by
stimulating “creative destruction”. The idea is
that fi nancial markets help to channel scarce
capital from declining industries to fi rms,
entrepreneurs and sectors with good growth
prospects. Since capital is allocated to sectors
that earn higher returns, fi nancially developed
economies converge faster to the effi cient
production frontier and experience higher
overall productivity growth. For example,
the surge in productivity growth in the United
States after the mid-1990s, which was mainly
concentrated in sectors which are big users
of information technology and research and
development (R&D), can be attributed to the
effi ciency with which US fi nancial markets
channeled scarce capital to start-up fi rms in these
growing industries. There is also evidence that
more fi rms enter industries with large growth
opportunities in countries with more developed
fi nancial markets.21
One way to test the Schumpeterian hypothesis is
to examine whether industries with better growth
prospects experience more investment in countries
with more developed fi nancial markets.22 Using
R. King and R. Levine (1993), “Finance and Growth: Schumpeter 15
Might Be Right”, Quarterly Journal of Economics, 153,
pp. 717-738.
R. Levine and S. Zervos (1998), “Stock Markets, Banks, 16
and Economic Growth”, American Economic Review, 88,
pp. 559-586.
R. Levine, N. Loyaza and T. Beck (2000), “Financial 17
Intermediation and Growth: Causality and Causes”, Journal of Monetary Economics, 46, pp. 31-77; R. Levine, L. Norman and
T. Beck (2000), “Finance and the Sources of Growth”, Journal of Financial Economics, 58, pp. 261-300; and J. Benhabib and
M. Spiegel (2000), “The Role of Financial Development in Growth
and Investment”, Journal of Economic Growth, 5, pp. 341-360.
See R.G. Rajan and L. Zingales (1998), “Financial Dependence 18
and Growth”, American Economic Review, 88, pp. 559-586, for
industry level evidence. A. Demirguc-Kunt and V. Maksimovic
(1998), “Law, Finance, and Firm Growth”, Journal of Finance,
53, pp. 2107-2137, use fi rm level data to address the issue of
possible measurement error when using industry level data.
R. Fisman and I. Love (2003), “Trade Credit, Financial 19
Intermediary Development, and Industry Growth”, Journal of Finance, 58, pp. 353-374; R. Fisman and I. Love (2004),
“Financial Development and Growth in the Short and Long
Run”, NBER Working Paper 10236; P. Aghion, P. Howitt, and
D. Mayer-Foulkes (2005), “The Effect of Financial Development
on Convergence: Theory and Evidence”, Quarterly Journal of Economics, 120, pp. 173-222; G. Bekaert, C. Harvey, C.
Lundblad and S. Siegel (2007), “Global Growth Opportunities
and Market Integration”, Journal of Finance, 62, pp. 1081-1137.
P.E. Strahan (2003), op. cit.; and M. Bertrand, et al. (2007), 20
op. cit.
T. Beck, A. Demirguc-Kunt, L. Laeven and R. Levine (2004), 21
“Finance, Firm Size and Growth”, NBER Working Paper 10983.
J. Wurgler (2000), “Financial Markets and the Allocation of 22
Capital”, Journal of Financial Economics, 58, pp. 187-214. The
test is closely related to the q-theory of investment (J. Tobin
(1969), “A General Equilibrium Approach to Monetary Theory”,
Journal of Money, Credit, and Banking, 1, pp. 15-29).

26ECB
Financial integration in Europe
April 2008
this basic idea, Chart 19 provides evidence in
favor of fi nance stimulating “creative destruction”
in a group of high-income countries.
There is a positive relationship between a
country’s fi nancial development, measured by
the size of capital markets, and the elasticity
of investment to value-added across industries
within a country.23 Countries with larger
capital markets tend to have industries in
which investment is more sensitive to growth
opportunities.
The next two sections of this Special Feature
show indicators that measure the state of fi nancial
development. First, there is a presentation of
indicators that are of general nature and that
cannot be linked to a single market segment of
the fi nancial sector. Then the Special Feature
turns to indicators pertaining to the bond, equity
and banking markets respectively.
4 GENERAL INDICATORS
The fi nance and growth literature shows that the
size of capital markets is a useful summary
statistic of a country’s degree of fi nancial
development.24 An important element of this
fi nding is that both the size of domestic securities
markets and the amount of bank lending to the
non-bank private sector positively affect
growth.25 Chart 20 therefore shows a broad
measure of the size of capital markets that
aggregates the size of stock, bond and loan
markets.26, 27
On average, euro area capital markets tend
to be smaller than the capital markets in the
United Kingdom and the United States, and
they are roughly comparable in size to Japanese
capital markets. Switzerland and Luxembourg
have the largest capital markets relative to
their economies. Within the euro area, the
Netherlands and Ireland have the largest capital
markets after Luxembourg. Some euro area
countries with smaller fi nancial sectors have
See P. Hartmann, et al. (2007), op. cit.23
See for example R. King and R. Levine (1993), op. cit.; R. Levine 24
and S. Zervos (1998), op. cit.; R. Rajan and L. Zingales (1998),
op. cit.; P. Hartmann, F. Heider, E. Papaioannou and M. Lo Duca
(2007), op. cit.; and E. Papaioannou (2007), op. cit.
R. Levine (2002), “Bank-based or Market-based Financial 25
Systems: Which Is Better?”, Journal of Financial Intermediation,
11, pp 1-30.
One should bear in mind that for bond markets, companies often 26
set up foreign subsidiaries to take advantage of lower transaction
costs and/or more favourable fi scal regimes.
For the purposes of this 27 Special Feature, it was considered
important to ensure comparability with countries outside Europe.
Therefore, data for stock market capitalisation in the euro area
and in individual euro area countries are taken from the World
Federation of Stock Exchanges. For the same reason, GDP data
have been sourced from the IMF. This implies some differences
to the indicators constructed from more harmonised securities
issues and GDP data for Europe as disseminated by the ECB and
Eurostat, respectively.
Chart 19 Elasticity of investment to growth opportunities and financial development in high-income countries
2.5
FI
FR
JP
NL
0.8
0.6
0.4
0.2
0.0
-0.2
0.8
0.6
0.4
0.2
0.0
-0.2
AT
UK
SE
US
PT
BE
ES
IEGR IT
DE
0.5 1.0 1.5 2.0
Source: Hartmann, et al. (2007), op. cit.Notes: The elasticity of investment to growth opportunities (y-axis) is estimated using international data on sectoral investment (gross fi xed capital formation) and production (value-added) from the Industrial Statistics Database of the United Nations Industrial Development Organization (UNIDO). These data cover 28 manufacturing industries in 65 (non-socialist) economies during the period 1963-2003. See Hartmann et al. (2007), op. cit., for further details. Capital market size (x-axis) is defi ned as the sum of (i) private credit by deposit money banks and other fi nancial institutions and (ii) stock market capitalisation as a share of GDP. Capital market size is averaged over the period 1980-1995. The high-income countries are 22 OECD countries (Australia, Austria, Belgium, Canada, Denmark, Finland, France, Germany, Greece, Ireland, Italy, Japan, South Korea, the Netherlands, Norway, New Zealand, Portugal, South Korea, Spain, Sweden, the United Kingdom and the United States) plus Barbados, Cyprus, Hong Kong, Israel, Kuwait, Malta and Singapore. Only individual euro area countries, Switzerland, Sweden, the US, the UK and Japan are labelled in the chart.

27ECB
Financial integration in Europe
April 2008
2 SPEC IAL FEATURES
experienced strong growth in their capital
markets over the past 15 years. For example,
they have more than doubled in Ireland,
Portugal and Spain.
Turning now to the fundamentals of the fi nancial
system, the Special Feature presents indicators
related to the legal and supervisory framework.
The reliability and effi ciency of the legal system
in dealing with fi nancial contracts is important
for the performance of fi nancial systems. The
inter-temporal nature of many fi nancial contracts
implies that investors relinquish control of their
funds for a promise of future cash fl ows. The
legal system makes sure that such contracts
are honoured and that possible disputes among
contracting parties are resolved.
Ample evidence is available that laws affect the
working of fi nancial systems and infl uence
economic effi ciency. For example, in a country
with an ineffi cient and slow legal system,
fi nancial contracts cannot be enforced effectively
and creditors have more limited rights. Countries
with well-defi ned and adequately enforced
investor rights exhibit more entrepreneurship
and greater product market competition.
Moreover, they have more liquid private bond,
venture capital and primary equity markets.28
There is also evidence that sound investor
protection rights and a fast-proceeding legal
system stimulate cross-border mergers and
acquisitions, foster syndicated lending and help
to attract foreign capital.29
Chart 21 displays one of the measures of legal
effi ciency used in the literature called “duration of
S. Djankov, R. La Porta, F. López-de-Silanes and A. Shleifer 28
(2003), “Courts: The Lex Mundi Project”, Quarterly Journal of Economics, 65, pp. 453-517; S. Djankov, R. La Porta,
F. López-de-Silanes and A. Shleifer, “The Law and
Economics of Self-dealing”, Journal of Financial Economics forthcoming; S. Djankov, C. McLiesh and
A. Shleifer (2007), “Private Credit in 129 Countries”, Journal of Financial Economics, 84, pp. 299-329; R. La Porta,
F. López-de-Silanes, A. Shleifer and R. Vishny (1997), “Legal
Determinants of External Finance”, Journal of Finance, 52,
pp. 1131-1150; R. La Porta, F. López-de-Silanes, A. Shleifer
and R. Vishny (1998), “Law and Finance”, Journal of Political Economy, 106, pp. 1113-1155; R. La Porta, F. López-de-
Silanes and A. Shleifer (2006), “What Works in Security
Laws?”, Journal of Finance, 61, pp. 1-32.
L. Alfaro, S. Kalemli-Ozkan and V. Volosovych (2005), 29
“Why Capital Doesn’t Flow from Rich to Poor Countries?
An Empirical Investigation”, NBER Working Paper 11901;
S. Rossi and P. Volpin (2004), “Cross Country Determinants of
Merger and Acquisitions”, Journal of Financial Economics, 74,
pp. 277-304; J. Quian and P. Strahan (2005), “How Law and
Institutions Shape Financial Contracts: The Case of Bank Loans”,
NBER Working Paper 11052; B. Esty and W. Megginson (2003),
“Creditor Rights, Enforcement and Debt Ownership Structure:
Evidence from the Global Syndicated Loan Market”, Journal of Financial and Quantitative Analysis, 38, pp. 37-59.
Chart 20 Size of capital markets
(percent of GDP)
0
100
200
300
400
500
600
700
800
0
100
200
300
400
500
600
700
800
1990-1994
1995-1999
2000-2004
2005-2006
AT BE DE ES FI FR GR IE IT LU
0
100
200
300
400
500
600
700
800
0
100
200
300
400
500
600
700
800
NL PT EA CH SE UK JP USEX
Sources: BIS, Datastream, ECB, Eurostat, IMF, World Federation of Exchanges and own calculations.Notes: Sum of (i) stock market capitalisation, (ii) bank credit to the private sector and (iii) debt securities issued by the private sector divided by GDP. Euro area (EA) and Euronext countries (EX) fi gures are averages of EA and EX country data weighted by GDP. Stock Market capitalisation: BE, data start in 1991, calculated for 2005 and 2006. FI, calculated for 2005 and 2006. FR, data start in 1991, calculated for 2005 and 2006. NL, data start in 1991, calculated for 2002 to 2006. PT, data start in 1995, calculated for 2002 to 2006. SE, calculated for 2005 and 2006. Figures for JP include Tokyo Stock Exchange. Figures for US include AMEX, NYSE and NASDAQ. EA stock market capitalisation is the sum of the values for Euronext and for countries not included in Euronext. Bank credit to the private sector: loans granted to the domestic private sector. EA fi gures for bank credit are the sum of EA country fi gures and include cross border loans between EA countries. Debt securities issued by the private sector: For EA countries, data are from the SEC database. Data for GR, IE and LU start in 1992. BIS data are used for GR for the years 1992 to 1994. For IE, BIS data are used for the years 1992 to 2002 for fi nancial institutions and for the years 1992 to 2006 for corporate issuers. For LU BIS data for the years 1992-2006 are used for corporate issuers. For non-EA countries, BIS data are used (sum of international and domestic amounts outstanding of bonds issued by corporate issuers and fi nancial institutions).

28ECB
Financial integration in Europe
April 2008
enforcement”.30 It indicates the speed with which
commercial disputes are resolved in the courts, by
counting the number of days it takes on average
to resolve a simple commercial dispute.31
This particular legal process seems to be
relatively slow in Italy, where it takes on
average four years to resolve the fi nancial
dispute, and in Greece, where it takes about
two years. The indicator may partly overstate
the time of the legal dispute, as other, speedier,
legal procedures may be available in some
cases. Resolving simple commercial disputes
is fastest in Finland, followed by a group
of countries consisting of the United States,
Japan, Luxembourg and France. This indicator
suggests that the speed with which legal systems
in the EU solve commercial disputes could be
increased in some European countries in order
to generate further performance gains.
The banking sector is distinct from other sectors
because of its greater potential for instability
and the need to protect small and relatively
uninformed depositors.32 Banking regulations
and supervisory practices are primarily aimed at
ensuring the safety and soundness of banks with
a view to safeguarding fi nancial stability. A key
element from a broader perspective is that
fi nancial regulation also considers fi nancial and
economic effi ciency, given that ill-designed
banking regulations and supervisory practices
may also hamper fi nancial development, e.g. by
giving fi nancial markets too much protection
from competition or by imposing excessive
administrative costs.33
An important complement to banking regulation
and supervision is the private sector monitoring of
banks, as it provides strong additional incentives
for banks to conduct their business in a safe and
effi cient manner. Furthermore, effective market
discipline has become increasingly important
in view of the expansion of the market-based
activities of banks and the growing regulatory
reliance on the internal approaches for risk
measurement and management used by banks.
With a view to supporting effective private
sector monitoring, regulators have signifi cantly
A legal system also supports the functioning of a fi nancial 30
system through the protection of property rights. As reported in
P. Hartmann,, A. Ferrando, F. Fritzer, F. Heider, B. Lauro and
M. Lo Duca (2006), “The Performance of the European Financial
System”, Mimeo, ECB, shareholder rights are well protected in
and vary little across the euro area. A similar fi nding holds for
a “law and order” indicator that assesses the observance of the
law, its strength and impartiality.
See Djankov et al. (2003), op. cit.31
M. Dewatripont and J. Tirole (1993), 32 The Prudential Regulation of Banks, MIT Press, Cambridge, United States; C. Goodhart,
P. Hartmann, D. Llewellyn, L. Rojas-Suarez and S. Weisbrod
(1998), Financial Regulation: Why, How and Where Now?,
Routledge, London.
See P.E. Strahan (2003), op. cit.; M. Bertrand, A. Schoar, and 33
D. Thesmar (2007), op.cit.; L. Guiso, P. Sapienza, and
L. Zingales (2005), “The Cost of Banking Regulation”, Working
paper, Northwestern University; J. Barth, G. Caprio and
R. Levine (2006), Rethinking Bank Regulation: Till Angels Govern, Cambridge University Press, New York.
Chart 21 Legal efficiency
(number of calendar days)
0
200
400
600
800
1,000
1,200
1,400
0
200
400
600
800
1,000
1,200
1,400
AT BE DE ES FI FR GR IE IT
0
200
400
600
800
1,000
1,200
1,400
0
200
400
600
800
1,000
1,200
1,400
LU NL PT EA CH SE UK JP US
Sources: World Bank: Doing Business 2008; Creating Jobs-Enforcing Contracts.Notes: The total number of calendar days needed to enforce a commercial contract, i.e. the time between the moment the plaintiff fi les the lawsuit in court until payment. This is the sum of: (i) duration until completion of service of process; (ii) duration of trial; and (iii) duration of enforcement. The survey refers to a sale of goods; the value of the claim is 200% of the gross national income (GNI) per capita of the respondent country. Euro area (EA) fi gures are averages of EA country data weighted by GDP. Data refer to 2007.

29ECB
Financial integration in Europe
April 2008
2 SPEC IAL FEATURES
strengthened the public disclosure requirements
for banks in recent years (for example with the
provisions in pillar 3 of the new framework for
capital standards of the Basel Committee on
Banking Supervision and the corresponding
EU Capital Requirements Directive (CRD)).34
Some research shows that stronger incentives
for the private monitoring of banks may lead
for example to lower net interest margins and to
fewer non-performing loans.35
Chart 22 presents a possible index of the extent
to which banking regulations support effective
market discipline.
The index aggregates several formal requirements
aimed at enhancing market discipline, notably
accounting and disclosure requirements. Based
on this measure, all countries have a signifi cant
amount of regulation in place to support market
discipline. In 2005 the regulatory environments
in Ireland, Portugal, Switzerland, the United
Kingdom and Japan were the most conducive to
private monitoring.
5 MARKET-SPECIFIC INDICATORS
The principal role of fi nancial innovation is to
make markets more complete so that fi rms,
households and governments can interact in
fi nancial markets with lower transaction costs
and more risk sharing possibilities.36 At times
however, strong growth in new fi nancial
instruments may be associated with fi nancial
instabilities. But as the markets for fi nancial
innovations become more mature the benefi ts
tend to be no longer impaired by such risks.
One example of a relatively mature fi nancial
innovation has been the development of
derivatives. The use of derivatives enhances the
allocation of capital and risk across time and
space because issuers, dealers and investors
can manage risks, lock in the future price of the
In addition, the introduction of the International Financial 34
Reporting Standards (IFRS) in the EU is having a signifi cant
impact on enhancing market discipline for banks, although it
is not specifi cally targeted at banks but at listed companies in
general. Indeed, several important elements of the indicator on
bank regulations supporting market discipline suggested below
form part of IFRS (in particular as regards the comprehensiveness
of bank accounting), rather than of specifi c banking regulations.
J. Barth, G. Caprio and R. Levine (2004), “Bank Regulation 35
and Supervision: What Works Best?”, Journal of Financial Intermediation, 13, pp. 205-248. Note that the indicator in
Chart 22 is higher when there is no explicit deposit insurance
scheme. However, the presence of such a scheme may be
benefi cial for fi nancial stability.
F. Allen and D. Gale (1997), op. cit.; and D. Acemoglu and 36
F. Zilibotti (1997), “Was Prometheus Unbound by Chance? Risk,
Diversifi cation and Growth”, Journal of Political Economy, 105,
pp. 709-751.
Char t 22 Bank regulations supporting market discipline
0
1
2
3
4
5
6
7
8
0
1
2
3
4
5
6
7
8
19992002
2005
AT BE DE ES FI FR GR IE IT
0
1
2
3
4
5
6
7
8
0
1
2
3
4
5
6
7
8
LU NL PT EA CH SE UK JP US
Sources: World Bank and P. Hartmann et al. (2006), op. cit.Notes: The index ranges from 0 to 8 and the higher the score the better market discipline is supported by regulations. The index combines information on the following categories: (1) external certifi ed auditor required (yes=1, no=0); (2) No explicit deposit insurance scheme (yes=1, no=0); (3) comprehensiveness of bank accounting, sum of the values (yes=1, no=0) assigned to: (a) income statement containing accrued but unpaid interest/principal while loan is non-performing, (b) consolidated accounts covering bank and any non-bank fi nancial subsidiaries required, and (c) directors legally liable for erroneous/misleading information; (4) off-balance-sheet items disclosed to public (yes=1, no=0); (5) banks disclose risk management procedures to the public (yes=1, no=0); and (6) subordinated debt allowable (required) as part of capital (yes=1, no=0). No 2005 updates for France (FR), Italy (IT), the Netherlands (NL). Euro area (EA) fi gures are averages of EA country data weighted by total assets of the banking sector. Due to data availability, 2005 fi gures are weighted by 2004 assets.

30ECB
Financial integration in Europe
April 2008
underlying assets and even alter the terms of the
underlying fi nancial contract. Chart 23 shows the
amount of outstanding interest rate derivatives
(forwards, options and swaps) by currency.37
The most active markets are euro and US dollar
interest rate derivatives with outstanding volumes
of EUR 86 and 75 trillion respectively.
In order to better assess the evolution of the
market for interest rate derivatives, Chart 24
normalises the amount outstanding across all
currencies at 100 in 1999, fi xes the exchange
rate at the level in 1999 and then tracks the
real growth rate. Interest rate derivatives in US
dollars saw the highest growth, with the amount
outstanding increasing by a factor of six. The
second fastest growing markets are interest rate
derivatives in euro and in pound sterling, which
both quadrupled from 1999 to 2006.
A related area of fi nancial innovation is
securitisation. Securitisation allows for the
transformation of formerly illiquid assets into
portfolios of assets that can be sold widely. It can
also be seen as an alternative fi nancing tool for
banks seeking to transfer the cost and risk of funding
to other investors. The risks of the securitised assets
can therefore be split, repackaged and sold to
economic agents that are less vulnerable to funding
liquidity shocks and aim to be remunerated for
purchasing marketable but still relatively illiquid
assets. Banks, for example, need to retain costly
economic capital as a buffer against their risky
lending activities. “True sales” of this risk via
securitisation may allow them to reduce their
holdings of costly capital in some circumstances
and to reinvest freed-up resources in the economy.
The price of a traded security that is backed by
illiquid assets conveys information about them to
the market that would not be available otherwise.38
Despite these undoubted benefi ts of securitisation,
there may also be some risks, especially when the
market for a new fi nancial instrument is still young.
Some securitisation may then be motivated by
regulatory or tax arbitrage, or by the desire to exploit
a lack of transparency and sell overvalued securities,
which could entail effi ciency losses and pose risks
to stability. Due to a lack of reliable, comprehensive
and disaggregated data, and given that some forms
of securitisation are relatively new and have only
recently started to be analysed, it is diffi cult to make
This indicator is not presented at the country level since the 37
market for interest rate derivatives is a global one that cannot be
linked to a specifi c geographic area.
P. DeMarzo (2005), “The Pooling and Tranching of Securities: 38
A Model of Informed Intermediation”, Review of Financial Studies, 18, pp. 1-35.
Charts 24 Size of OTC single currency interest rate derivatives
(at constant 1999 euro billions, 1999 = 100)
0
100
200
300
400
500
600
700
0
100
200
300
400
500
600
700
1999 2000 2001 2002 2003 2004 2005 2006
Euro
Pound sterling
Swedish krona
Swiss franc
US dollar
Japanese yen
Sources: BIS, IMF and own calculations.Notes: The index is constructed in the following way:(i) Amounts outstanding denominated in currencies other than the euro are expressed in euro by holding the exchange rate constant at the 1999 level; (ii) the level in 1999 is indexed at 100.
Chart 23 Notional amounts outstanding of OTC single currency interest rate derivatives
(EUR billions)
0
10,000
20,000
30,000
40,000
50,000
60,000
70,000
80,000
90,000
0
10,000
20,000
30,000
40,000
50,000
60,000
70,000
80,000
90,000
2006
2005
2004
2003
2002
2001
2000
1999
Euro Pound
sterling
Swedish
krona
Swiss
franc
US
dollar
Japanese
yen
Sources: BIS and IMF.Notes: Notional (or nominal) amounts outstanding are defi ned as the gross nominal value of all deals concluded and not yet settled at the reporting date. OTC single currency interest rates derivatives include forward rate agreements, swaps and options.

31ECB
Financial integration in Europe
April 2008
2 SPEC IAL FEATURES
a full assessment of how the benefi ts of different
forms of securitisation (for example, cash versus
synthetic securitisation) compare with open issues
and risks.39
Chart 25 shows an example of a relatively
mature form of fi nancial innovation, i.e. the
extent of off-balance sheet securitisation via
asset-backed and mortgage-backed securities
relative to gross domestic product (GDP), using
the location of the collateral to link this fi nancial
innovation to countries.
According to this indicator, the most active
market by far for securitising mortgages and
receivables such as auto loans or credit card
loans is the United States with a volume of
issuance of a quarter of GDP. Within the euro
area, this kind of securitisation is greatest in
Spain, the Netherlands, Luxemburg, Ireland and
Portugal. On average, the euro area has a volume
of issuance equivalent to 2% of GDP. More
concretely, as the lack of integration in the
European mortgage markets suggests, the ease
with which issuers can include illiquid assets
from any European country, irrespective of their
own location, seems to be an important
determinant of further securitisation. Obstacles
to this may include fi nancial regulations,
consumer protection rules or aspects of
taxation.40
European securitisation is, however, distinct in
that in some countries there is a long-standing
and very active market in covered bonds, which
are similar to asset-backed securities. The main
difference between covered bonds and asset/
mortgage-backed securities is that the former
are kept economically and legally on the balance
sheet of the issuer who is typically a bank.
Moreover, the buyer of covered bonds, besides
receiving preferential treatment with respect
to the cash fl ows of the underlying assets, is
also eligible, together with the remaining bank
creditors, for further payments.41 Chart 26
shows the extent of securitisation via covered
bonds relative to the amount of loans and bonds
outstanding in a country.
The chart shows that securitisation via covered
bonds is substantial in Germany, Luxembourg,
Ireland, Spain and Sweden. For example,
the amount of covered bonds outstanding in
For example, it is still too early to come to a verdict on and draw 39
all the necessary conclusions from the turmoil caused by the
problems in the sub-prime mortgage market. But it is important
to note that the sub-prime market turmoil is associated with
CDOs, i.e. a second layer of securitisation in which mortgage-
backed securities are themselves repackaged into CDOs.
See European Commission (2005), White Paper – Financial 40
Services Policy 2005-2010, Brussels, December.
Examples are German Pfandbriefe, Spanish cédulas and French 41
obligations foncières. Covered bonds are not directly comparable
across countries as their strong legal component is governed
by different national legislations. At the moment there is no
harmonized framework for covered bonds in Europe (see also
Special Feature C in this Chapter).
Chart 25 Securitisation
(as percentage of GDP; by country of collateral)
0
5
10
15
20
25
30
0
5
10
15
20
25
30
2000-2004
2005-2006
AT BE DE ES FI FR GR IE IT
0
5
10
15
20
25
30
0
5
10
15
20
25
30
LU NL PT EA CH SE UK JP US
Sources: European Securitisation Forum, Bond Market Association and Eurostat.Notes: For European countries, data report the issuance placed in the Euromarket or in European domestic markets. For the United States (US), data refer to issuance placed in the US market and include issuance from government sponsored agencies. As there is no information about the country of collateral for US, it is assumed that US issuances have mainly domestic collateral. Data include asset-backed securities and mortgage-backed securities (auto loans, CMBS, RMBS, credit card receivables, leases, loans and other receivables), does not include CDOs and covered bonds. No data for Japan (JP). Latest data for Luxembourg (LU) and Switzerland (CH) are for 2003. Data for Finland (FI) available only for 2001 and 2003. Euro area (EA) fi gures are averages of EA country data weighted by GDP.

32ECB
Financial integration in Europe
April 2008
Germany is one third of the amount of all loans
and bonds outstanding (which represents an
amount of outstanding covered bonds of nearly
one half of GDP). Looking at Charts 25 and 26,
it is apparent that securitisation takes different
forms in different countries. The market for
covered bonds is large in some of the countries
in which the ABS/MBS market is small (e.g. in
Germany, France or Sweden).
Turning to equity markets, Chart 27 shows
one possible measure for assessing how well
they function, i.e. the average annual amount
of turnover of domestic shares on a stock
market relative to the market capitalisation of
these shares (the “turnover velocity”). A high
volume of trading indicates a liquid market
in which there are few frictions so funds can
be channelled easily and in a timely manner
across investors and capital-raising fi rms. The
turnover velocity as a measure of liquidity has
Char t 27 S tock market tu rnover ve lo c i t y
(percentages of market capitalisation)
020
40
60
80
100
120
140
160
180
200
020
40
60
80
100
120
140
160
180
200
AT BE DE ES FI FR GR IE IT
1995-1999
2000-2004
2005-2006
0
20
40
60
80
100
120
140
160
180
200
0
20
40
60
80
100
120
140
160
180
200
LU NL PT Euro-
next
OMX EA CH SE UK JP US
Source: World Federation of Exchanges.Notes: The turnover velocity is the ratio of the turnover of domestic shares to their market capitalisation. The turnover velocity is computed in the following way; (i) for each month, the ratio of the domestic share turnover to the domestic market capitalisation is computed; (ii) the ratio is annualised by multiplying by 12; (iii) the annual turnover is computed as the average monthly annualised turnover velocity computed in (ii). For the United States (US), turnover velocity is the average of the turnover for the NYSE and the NASDAQ, weighted by the respective market capitalisation. Data for Belgium (BE), France (FR) and the Netherlands (NL) end in 2000. Data for Portugal (PT) end in 2001. Data for Finland (FI) and Sweden (SE) end in 2004 and are part of the OMX thereafter. OMX includes Denmark, Estonia, Finland, Iceland, Lithuania, Latvia and Sweden. Data for Euronext start in 2001, for OMX in 2005 and for Spain in 2002. Euro area (EA) fi gures are averages of EA country data weighted by stock market capitalisation.
Chart 26 Covered Bonds outstanding
(as a percentage of total bonds and loans outstanding)
0
5
10
15
20
25
30
35
0
5
10
15
20
25
30
35
2003
2004
2005
2006
AT BE DE ES FI FR GR IE IT
0
5
10
15
20
25
30
35
0
5
10
15
20
25
30
35
LU NL PT EA CH SE UK JP US
Sources: BIS, ECB, European Mortgage Federation and IMF.Notes: Amounts outstanding of covered bonds in percentage of the sum of (i) total bonds outstanding (public plus private) and (ii) total loans to the private sector. It includes public sector bonds, mortgage backed bonds and mixed bonds. Data for Belgium (BE), Greece (GR) or Japan (JP) are not available. Euro area (EA) fi gures are averages of EA country data weighted by the sum of total bonds outstanding and total loans.

33ECB
Financial integration in Europe
April 2008
2 SPEC IAL FEATURES
been shown to be an important element of the
positive link between fi nancial development
and economic growth since greater liquidity
usually improves price discovery and lowers
transaction costs.42
The chart shows that stock market trading
activity varies considerably across the euro
area. There is very active trading in Germany,
Spain and Italy at a level which in recent years
has even surpassed that in the United States,
whose stock markets are traditionally seen as
the most active. But there are also a number of
euro area countries where stock markets are not
very liquid. One can also see that the trading
volume relative to market capitalisation on the
Euronext stock exchange is larger than what
was previously achieved on any stock market of
its member countries. Furthermore, the turnover
velocity has increased throughout the sample
period in the most liquid stock markets, e.g.
Germany and Italy, but it has shown uneven
growth in less liquid markets such as the
Austrian or Greek markets.
As many frictions in fi nancial markets are due
to asymmetric information between market
participants, the production and dissemination
of information is a crucial part of the well-
functioning of a fi nancial system. For example,
public reporting by fi rms allows investors to
make better investment decisions and alleviates
the control problem between outsiders and
management, and in turn lowers the cost of
capital. The recent problems in US sub-prime
lending and global structured fi nance also
underline the importance of information in
fi nancial markets.
Another measure based on equity markets is the
R-squared (R2) indicator. It assesses the
information processing capacity of stock
markets that is based on the synchronicity of
fi rms’ stock returns within a market. If fi rms’
stock prices are mainly driven by market-wide
factors and not by fi rm-specifi c news then they
move together indicating that little valuable
private information is revealed to or used by
investors. It has been shown that countries with
a high synchronicity of stock returns tend to
have less developed fi nancial systems and lower
per-capita GDP.43 The synchronicity of stock
returns has been associated in turn with the
opaqueness of stock markets.44 Firms whose
stock prices move less due to market-wide
factors often invest more effi ciently. Moreover,
stock prices appear to be a better predictor of
future earnings if fi rms operate in industries
with a low synchronicity of stock returns.45
The synchronicity of stock returns is calculated
using the R2 statistic of a regression of stock returns
on market-wide factors. A typical regression is:
rijt = αi + β1MKjt + β2EAt + β3USt + β4EMt + εijt
where rijt is the weekly return on stock i in
country j at time t, MKjt is the return on the
stock market index in country j at time t, EAt
is the return on a euro area stock market index
at time t, USt is the return on the US stock
market index at time t and EMt is the return
on an emerging markets index at time t. The
independent variables capture systematic stock
price movements across the most important
market segments. Therefore the R2 statistic of
the regression measures the amount of variation
in stock returns that can be explained by market-
wide or systematic information. The remainder,
1-R2, is the average amount of fi rm-specifi c
information incorporated into stock prices.
Levine and Zervos (1998), op. cit.42
R. Morck, B. Yeung and W. Yu (2000), “The Information 43
Content of Stock Markets: Why Do Emerging Markets Have
Synchronous Stock Price Movements?”, Journal of Financial Economics, 58, pp. 215-260. It is important to stress the cross-
country dimension of this indicator as its time-series could also
be caused by macro-economic fl uctuations.
L. Jin and S.C. Myers (2006), “R44 2 Around the World: New
Theory and New Tests”, Journal of Financial Economics, 79,
pp. 257 -292.
A. Durnev, R. Morck and B. Yeung (2004), “Value Enhancing 45
capital Budgeting and Firm-specifi c Stock Returns Variation”,
Journal of Finance, 59, pp. 65-106; Durnev, A., R. Morck,
B. Yeung and P. Zarowin (2003), “Does Greater Firm-Specifi c
Return Variation Mean More or Less Informed Stock Pricing?”,
Journal of Accounting Research, 41, pp. 797–836.

34ECB
Financial integration in Europe
April 2008
Chart 28 displays the R2 statistic.46 Higher bars
indicate a greater role of market-wide factors in
fi rms’ stock prices, which is a sign of lower
effi ciency with respect to fi rm-specifi c
information. The informational effi ciency of
stock markets in the euro area is comparable to
the United Kingdom and the United States.
Within the euro area, Greece, Italy and Sweden
have stock markets that incorporate the least
amount of fi rm-specifi c information into prices.
Turning from public to private equity markets, the
next indicator of fi nancial development considers
the extent of venture capital fi nancing. It is diffi cult
for start-ups and small fi rms to raise capital. At the
same time, small and medium-sized fi rms are an
important element of an economy. Financing the
activities of small and medium-sized enterprises
is crucial for fostering entrepreneurship,
competition, innovation and growth in Europe.
But the asymmetric information problems that
create frictions in fi nancial markets are particularly
pronounced for these fi rms as they often have
no access to public capital markets. Even bank
fi nancing may be diffi cult, as they are usually very
risky and at the same time have little collateral to
offer. Modern fi nancial systems therefore provide
signifi cant private equity and venture capital
fi nancing. A venture capital investor acquires a
signifi cant equity stake in the fi rm, which provides
the right incentive to monitor and control the fi rm.
Venture capital fi nancing is designed to overcome
asymmetric information problems through its close
relationship with fi rms.
Chart 29 measures total venture capital fi nancing
(early-stage investment) as a share of GDP for
the sample countries.
Despite having grown substantially over the
past ten years, venture capital fi nancing in most
euro area countries remains only a fraction of
venture capital fi nancing in the United Kingdom
or, especially, in the United States. While
average euro area venture capital fi nancing in
the late 1990s was larger than in the United
Kingdom, this is no longer the case. Within the
euro area, only Finland has levels of venture
capital fi nancing that can rival those of the
United States. Belgium, Germany, France,
Ireland and the Netherlands have comparable
amounts of venture capital fi nancing. The
indicator shows low levels of early-stage
venture capital fi nancing in Austria, Greece,
It has been estimated on weekly returns for all the companies 46
included in each country’s DataStream Total Market Index on
31 December 2004. The sample covers 4,051 stocks listed in the
countries studied. All the returns are in local currency and returns
on foreign factors are converted into local currency. Regarding
common factors, the Datastream total market index for the euro
area, the S&P100 for the United States, and the MSCI index for
emerging markets have been used. Firms that do not have 30
weekly observations are excluded. As in Durnev et al. (2003),
op cit., initial public offerings (IPOs) are excluded since they are
unusual information events and weekly returns are used because
they are less likely to be affected by thin trading problems.
For the returns of the stock price of each company, the factor
regression is estimated per year and pseudo R2 is computed.
Country averages of R2 are then computed and compared. All the
computations have been made with E-views 5.
Chart 28 Pricing of firm-specific information in the stock market
(R² statistics)
0.00
0.05
0.10
0.15
0.20
0.25
0.30
0.35
0.40
0.00
0.05
0.10
0.15
0.20
0.25
0.30
0.35
0.40
1990-1994
1995-1999
2000-2004
2005-2007
AT BE DE ES FI FR GR IE IT
0.00
0.05
0.10
0.15
0.20
0.25
0.30
0.35
0.40
0.00
0.05
0.10
0.15
0.20
0.25
0.30
0.35
0.40
LU NL PT EA CH USUK JPSE
Sources: Datastream and ECB calculations.Notes: Average R² statistics for each country are obtained by regressing fi rms’ stock prices on market factors, i.e. the returns on domestic, euro area, US and emerging countries’ stock market indices. Low bars indicate that stock prices refl ect more fi rm-specifi c information. Euro area (EA) fi gures are averages of EA country R² statistics weighted by stock market capitalisation.

35ECB
Financial integration in Europe
April 2008
2 SPEC IAL FEATURES
Italy and Spain.47 The indicator is however
silent on whether the apparent weakness of the
European venture capital sector is caused by a
lack of capital supplied, a lack of liquidity in
still somewhat nationally segmented venture
capital markets, a lack of demand from
entrepreneurs or a shortage of exit options for
venture capitalists through liquid equity
markets.
Another indicator of fi nancial development
that this Special Feature presents is a measure
of fi nancial innovation in the retail banking
sector. Chart 30 shows the number of cashless
transactions (e.g. credit transfers, direct debit,
card payments, cheques and e-money payments)
across countries.
Like other fi nancial innovations, such
transactions make fi nancial markets more
complete, allow transaction costs to be low and,
most importantly, facilitate the exchange of
goods and services. Cashless payments support
the effi cient functioning of markets more than
bilateral cash payments and make use of the
strong network effects and economies of scale
in payment systems.
Cashless payments per capita have risen in all
countries over time. There are twice as many such
payments per capita in the United States than in
the euro area. Within the euro area, the Austrians,
The results are quite similar if venture capital that fi nances later 47
stage replacements and venture capital by country of destination
are taken into consideration (see Hartmann et al. (2006), op cit.).
Chart 30 Number of cashless transactions
(per capita)
0
50
100
150
200
250
300
350
0
50
100
150
200
250
300
350
2000-2004
2005
AT BE DE ES FI FR GR IE IT
0
50
100
150
200
250
300
350
0
50
100
150
200
250
300
350
LU NL PT EA CH SE UK JP US
Sources: ECB and BIS.Notes: The number of cashless transactions represents the number of cashless payment transactions per capita by non-MFIs including credit transfers, direct debits, card payments, cheques and e-money payment transactions. Data for Austria (AT) and Luxembourg (LU) start in 2001.
Char t 29 Venture cap i t a l f i nanc ing ( ea r l y - s tage i nve s tment )
(as a percentage of GDP; by country of management)
0.00
0.02
0.04
0.06
0.08
0.10
0.12
0.14
0.00
0.02
0.04
0.06
0.08
0.10
0.12
0.14
1990-1994
1995-1999
2000-2005
AT BE DE ES FI FR GR IE IT
0.00
0.02
0.04
0.06
0.08
0.10
0.12
0.14
0.00
0.02
0.04
0.06
0.08
0.10
0.12
0.14
LU NL PT EA CH SE UK JP US
Sources: European Private Equity and Venture Capital Association, PricewaterhouseCoopers and Eurostat.Notes: Venture capital early-stage investment is defi ned as private equity raised for seed and start-up fi nancing. The data report investment by venture capital fi rms according to their country of residence. Data for Luxembourg (LU) and Japan (JP) are not available. Data for Germany (DE) start in 1993, for Greece (GR) and the United States (US) in 1995. Euro area (EA) fi gures are averages of EA country data weighted by GDP.

36ECB
Financial integration in Europe
April 2008
Finns and Dutch are the most frequent users of
cashless payments, while the Spanish, Italians and,
in particular, Greeks use them least frequently.
6 CONCLUSIONS
This Special Feature presents a number
of quantitative indicators that measure the
degree of fi nancial development in the euro
area and some reference countries. Financial
development is a process through which
fi nancial market framework conditions translate
into fi nancial and economic effi ciency. While
fi nancial development and fi nancial integration
are similar as both of them affect effi ciency,
they are also distinct as they describe different
economic processes. For example, adverse
selection problems among investors that impair
the allocation of capital may persist even in a
fully integrated market. The aim of providing
indicators of fi nancial development is to enable
the assessment of the functioning of fi nancial
systems and the monitoring of potential
obstacles to the effi cient and smooth allocation
of capital from a broad perspective.
It is important to bear in mind that this Special
Feature only presents a selection of possible
indicators of fi nancial development.48
Consequently, not all aspects of European
fi nancial systems are fully captured by the
indicators presented here. Moreover, publicly
available data may not capture issues that can
only be identifi ed by those individuals that are
active in fi nancial markets. While formal laws
and rules are easier to measure, informal rules
and practices may be just as important. In
addition, information is often available on
wholesale, market-based transactions, but not
on retail, relationship-based activities.
The selection of indicators presented here shows
that there is a fair amount of heterogeneity in
fi nancial system performance across euro area
countries. Relative to the group of benchmark
countries, on average the euro area fi nancial
system compares well, except perhaps relative
to the United Kingdom and the United States,
which perform better across most of the
indicators presented here. These results suggest
that there appears to be further scope for
structural reforms of fi nancial sectors in the euro
area and that against this background looking at
fi nancial development in addition to fi nancial
integration is a fruitful avenue to take.
For a more complete list see Hartmann et al. (2006), op.cit. and 48
Hartmann et al. (2007), op.cit.

37ECB
Financial integration in Europe
April 2008
2 SPEC IAL FEATURES
B. THE STEP INITIATIVE
One of the ways in which the ECB and the Eurosystem can foster the integration in the euro fi nancial system is by acting as a catalyst for private sector initiatives, as further illustrated in Chapter III of this report. A prominent example of this kind of activity was the promotion of the development of a pan-European short-term paper market via the market-led Short-Term European Paper (STEP) initiative and the continued operational support for this project. This Special Feature provides an overview of the STEP initiative, takes stock of its main achievements and remaining challenges, and describes how the catalytic role of the ECB and the Eurosystem contributed to the success of this important project.
1 INTRODUCTION
The short-term securities market has been the
component of the money market in the EU in
which the least progress towards integration
has been achieved since the launch of the
euro in 1999. Indeed, the market for European
commercial paper (CP) and certifi cates of
deposit (CD) has remained fragmented. The
STEP initiative was aimed at addressing this
gap in fi nancial integration by developing a pan-
European short-term paper market through the
voluntary compliance of market participants
with a core set of commonly agreed standards.
After several years of preparatory work, this
initiative went live in June 2006, when the
STEP Market Convention was signed. Since
then, the STEP initiative has shown its benefi ts
in enhancing market transparency and fostering
convergence of market standards and practices
through the compliance of market participants
with the STEP Market Convention.
The Eurosystem acted as a catalyst for the STEP
initiative in a number of respects, including
(i) drawing the attention of market participants
to the opportunity to enhance integration in
this market by means of self-regulatory action,
(ii) assisting, with observer status, in the
setting up of the STEP Market Convention,
(iii) helping to reconcile the views of different
agents potentially interested in the project, and
(iv) helping to make the project known to fi nancial
players and the public at large. Furthermore, the
Eurosystem’s catalytic role in the development
of STEP has been complemented with continued
operational support for the project since its
launch: some NCBs will be providing technical
support for the labelling process until June 2008,
and the ECB produces daily statistics on yields
and volumes relating to this new market.
The Special Feature is organised as follows.
Section 2 introduces the business case for this
market-led initiative, elaborating on the need to
further integrate the short-term European paper
market and describing the approach followed by
market participants with the support of the ECB.
Sections 3 and 4 describe the preparatory phase
of STEP and the launch of STEP in terms of its
legal, institutional and statistical frameworks.
Section 5 reviews market developments since
STEP commenced operations in June 2006,
while Section 6 looks at related developments,
such as the acceptance of STEP as a “non-
regulated” market for collateral purposes in
Eurosystem credit operations. Section 7 assesses
future opportunities and challenges for STEP
and Section 8 concludes.
2 NEED FOR AND APPROACH TO FURTHER
INTEGRATION OF THE SHORT-TERM
EUROPEAN PAPER MARKET
THE MONEY MARKET AFTER THE INTRODUCTION
OF THE EURO
The introduction of the euro led very quickly to
the creation of a large, liquid and integrated
money market across the euro area, particularly in
the unsecured and derivatives segments. While
the euro area repurchase agreement market
initially took a while longer to achieve the same
degree of integration, it has eventually even
surpassed the unsecured segment in importance.49
See also Chapter I and the fi nancial integration indicators for 49
money markets set out in the statistical annex.

38ECB
Financial integration in Europe
April 2008
By contrast, the integration among the various
segments of the market for short-term securities
(i.e. CPs, which are generally issued by
corporates and securitisation special purposes
vehicles (SPVs) and CDs, which are issued
by banks) was seriously lagging behind. This
assessment was shared both by the ECB and by
the commercial banks represented in the ECB’s
Money Market Contact Group, a forum in
which information on issues of common interest
is exchanged.
THE STEP INITIATIVE 50
In 2001, with a view to addressing the observed
gap in fi nancial integration, the ECB drew the
attention of the ACI (The Financial Market
Association) 51 to the opportunity for taking
collective market action to improve this
situation. In response, the ACI created the
Euribor ACI STEP Task Force (“the STEP Task
Force”) with the mandate to identify measures
that could enhance the development and the
integration of CP and CD markets in Europe.
The basic idea of the STEP initiative was to
foster the integration of the different European
market segments for short-term securities
through the convergence of market standards.
With a view to this objective, the STEP initiative
was aimed at (i) identifying a set of common
market standards and practices capable of
promoting market integration and (ii) fostering
the voluntary compliance of market participants
with these standards and practices by granting a
STEP label to compliant issuance programmes.
During the long preparatory phase, market
participants (with the assistance of the ECB
which participated as an observer) defi ned,
agreed, and codifi ed these common standards in
the STEP Market Convention.
The promoters of the STEP initiative were
motivated by the expectation that convergence
of market standards would stimulate signifi cant
progress in the integration of short-term
securities markets, thereby enhancing the depth
and liquidity of these markets. As a result, the
diversifi cation opportunities for issuers and
investors would increase.
However, the promoters also acknowledged that
not all sources of the existing market segmentation
– in particular those stemming from legislative,
regulatory and supervisory factors – could be
addressed by the STEP initiative.
A MARKET-LED APPROACH
Market participants agreed to pursue a self-
regulatory approach based on commonly agreed
standards for two reasons. First, they considered
that such an approach did indeed have great
potential to improve the state of integration of
the CP market. Second, they were of the opinion
that while regulatory or fi scal measures could
have useful additional effects, they would not
reduce the necessity for more convergent market
standards and practices. As a consequence, the
STEP standards were not aimed at substituting
or changing existing national regulations, but
were designed to complement them.
Another option considered in the early stages
of STEP was the creation of a new European
market that would be an alternative to the
existing markets, but this was discarded. The
selected option, by contrast, requires issuers
to add the STEP standards to their issuance
programmes (for issuance in, for example,
the international Euro CP (ECP) 52 market, the
French domestic CP and CD market, and the
Spanish domestic CP market). Consequently, an
issuer cannot create a STEP issuance programme
as such, but he can add the STEP standards to a
national issuance programme which would then
be granted the STEP label.
See for further reference http://www.stepmarket.org/ index.html.50
ACI is a global association of wholesale fi nancial market 51
professionals aimed at contributing to market development
through initiatives in the fi eld of education, market practices,
technical advice and networking events. For further information,
see http://www.aciforex.com/
Traditionally, and already before the introduction of the euro, the 52
prefi x “Euro” for CP or CD signals that the short-term securities
are issued outside a given country but are denominated in that
country’s currency.

39ECB
Financial integration in Europe
April 2008
2 SPEC IAL FEATURES
In this sense, the existing European markets
could be seen as the “underlying markets” with
respect to the STEP market.
THE STEP LABEL
The STEP label is granted at the request of
the issuer putting forward an existing or a
new issuance programme that meets the STEP
standards. Credit institutions, non-fi nancial
corporations, fi nancial intermediaries other
than credit institutions (including securitisation
SPVs) and public authorities are all entitled
to apply for the STEP label for their issuance
programmes.
The STEP label does not refer to the fi nancial
soundness of the issuer, the liquidity of the
assets or the accuracy of information provided
in the underlying STEP information
memorandum. The STEP label only certifi es
that the issue complies with the STEP standards,
which cover disclosure, documentation,
settlement and the provision of data and are set
out in detail in the STEP Market Convention.53
All papers traded on short-term securities markets
may be awarded the STEP label, provided that
(i) the programmes under which these papers
are issued comply with the standards set out
in the STEP Market Convention and (ii) the
relevant security settlement systems are eligible
for STEP.
INVOLVEMENT OF EUROPEAN MONEY MARKET
PARTICIPANTS
The STEP Task Force was mainly composed of
dealers and arrangers active in all of the main
segments of the European CP and CD markets,
including the domestic segments and the
international ECP segment. Moreover, the STEP
Task Force included members of the issuer and
investor community as well as representatives of
other market associations (e.g. the International
Primary Market Association – IPMA). The
STEP Task Force established a constructive
dialogue with other relevant parties, such
as securities settlement systems and public
authorities. Moreover, the ACI invited the ECB
to support the STEP initiative and the ECB
accepted this invitation.
The European Financial Markets Lawyers
Group (the EFMLG) 54 also contributed in the
early stages by providing assistance to the ACI
with regard to certain legal aspects.55
THE CATALYTIC ROLE OF THE EUROSYSTEM
As described in more detail in Chapter III,
the Eurosystem supports fi nancial integration
processes in four main ways, namely by
(i) giving advice on fi nancial legislation and
regulation, (ii) acting as a catalyst to facilitate
collective action by the private sector,
(iii) enhancing knowledge, raising awareness
and monitoring the state of European fi nancial
integration, and (iv) providing central bank
services that contribute to fostering European
fi nancial integration.
As part of its catalytic function, the Eurosystem
contributed to the preparatory phase of the
STEP initiative by facilitating and supporting
coordination among market players and actively
contributing to the work of the STEP Task
Force, notably by acting as a neutral broker
between the different stakeholders. In 2002 the
ECB also hosted a public consultation on the
STEP Task Force’s initial set of proposals at the
request and on behalf of the ACI. This catalytic
See in particular Chapter 1 and Annex 4 of the STEP Market 53
Convention at http://www.stepmarket.org/documents/STEP_
market_convention.pdf.
The EFMLG was established in 1999 to discuss and promote 54
initiatives leading to greater harmonisation of European fi nancial
market activities (laws and market practices) following the
introduction of the euro. The EFMLG is composed of senior
lawyers from credit institutions based in the EU and selected on
the basis of their personal expertise. For further information see
http://www.efmlg.org/.
See the 2002 EFMLG Report on the Money Market: Legal Aspects 55
of Short-term Securities and Up-date 2003 EFMLG Report (http://
www.efmlg.org.) and the ACI-EFMLG Report on the Information
Memorandum for Short-Term European Paper (STEP) (2004),
available on the ACI website (http://www.aciforex.com/euribor/
paper.cfm/sector/4/StepWorkingGroup.html). The report is dated
15 December 2003 and was made public in March 2004.

40ECB
Financial integration in Europe
April 2008
role followed naturally from the Eurosystem’s
institutional characteristics as a public authority
with a pan-European remit and, in its capacity as
the euro area’s central bank, as an active market
participant with the knowledge that it entails.
3 THE PREPARATORY PHASE
Following the public consultation on the initial
set of proposals mentioned above, the STEP
Task Force set out its recommendations in a
report published in March 2004.56 The ACI
confi rmed the objective of the convergence of
standards through the compliance of market
players with the STEP Market Convention,
covering disclosure, documentation, settlement
and the provision of data. The report also
included some recommendations addressed to
the ESCB.
SUPPORT FROM THE EUROSYSTEM
The Governing Council of the ECB closely
followed the preparatory phase of the STEP
initiative.
In 2004 the Governing Council assessed the
ACI’s recommendations and took an overall
favourable attitude towards them. In April 2006
the Governing Council gave its fi nal approval
to the Eurosystem’s involvement in the STEP
market. More specifi cally, in line with the
recommendations addressed by the ACI to the
Eurosystem, the Governing Council decided
that, under certain conditions, the Eurosystem
would support the activities pertaining to the
introduction of the STEP label during the
fi rst two years after its launch. Nevertheless,
the entire responsibility for the granting and
withdrawal of the STEP label would rest with
the STEP Secretariat, as explained in Section 4
of this Special Feature. Furthermore, the
Governing Council agreed that the ECB would
produce and publish comprehensive statistics on
yields and volumes, subject to a check regarding
the effi ciency of the collection process.
BROADENING THE LIST OF PARTNERS
Since May 2005 the European Banking
Federation (EBF) has supported ACI in the
STEP initiative, in line with previous joint
projects (e.g. the EURIBOR57 and EONIA58
indices). The following section provides further
information on the EBF’s contribution to the
functioning of the STEP market.
4 THE LAUNCH OF STEP
THE STEP LEGAL FRAMEWORK
In April 2006 Euribor EBF and Euribor ACI, two
international associations under Belgian law,
adopted the amended version of their Statutes,
which now include references to STEP-related
tasks and responsibilities.
On 9 June 2006 Euribor ACI and Euribor EBF
signed the STEP Market Convention.59
THE STEP INSTITUTIONAL FRAMEWORK
The STEP Market Convention includes the Code
of Conduct of the STEP Market Committee,
which is a joint steering committee of Euribor
ACI and Euribor EBF and is responsible for
the establishment, interpretation and possible
revision of the standards on which the STEP
label is based. The chairman of the Committee
is the Secretary General of Euribor EBF.
With the signing of the Convention, the STEP
Secretariat has been created under the joint
responsibility of Euribor ACI and Euribor EBF.
See the ACI-EFMLG Report on the Information Memorandum 56
for Short-Term European Paper (STEP) (2004).
Euro interbank offered rate.57
Euro overnight index average.58
See http://www.stepmarket.org/documents/STEPmarket_convention.59
pdf.

41ECB
Financial integration in Europe
April 2008
2 SPEC IAL FEATURES
The STEP Secretariat is responsible for the
day-to-day management of the STEP label and
is located at the premises of Euribor EBF in
Brussels.
More specifi cally, the main functions of the
STEP Secretariat are the following: to grant,
withhold or withdraw the STEP label on the
basis of the criteria and requirements of the
STEP Market Convention; to make available
the electronic format of the information
memoranda of STEP-labelled programmes and
related information on the STEP website; to
provide certain data to the ECB and the eligible
data providers to produce STEP statistics;
to act as the secretariat to the STEP Market
Committee; and to administer the STEP Market
website.
SUPPORT FROM THE EUROSYSTEM
In order to make the project known to fi nancial
players and the public at large, on 11 July 2006
the President of the ECB, together with the
Presidents of the EBF and of ACI, held a press
conference to mark the offi cial launch of the
STEP market.
Since then, and in line with the decisions of
the Governing Council mentioned above, the
Eurosystem’s contribution to the STEP market
has focused on two activities.
First, the ECB and nine euro area NCBs 60 are
providing technical assistance to the STEP
Secretariat in the STEP labelling process,
although, as mentioned above, the ultimate
responsibility for granting and withdrawing the
STEP label rests with the STEP Secretariat. The
task currently performed by the central banks is
planned to be taken over by the STEP Secretariat
at the end of June 2008.
Second, the ECB produces comprehensive
statistics on yields and volumes for the STEP
market on a permanent basis and regularly
publishes them on the ECB website.
THE STEP STATISTICAL FRAMEWORK
The obligation for issuers to accept pre-defi ned
disclosure requirements and further arrangements
on the statistics compiled and published by the
ECB are the key elements of the STEP Market
Convention. These arrangements, described in
particular in Article 1.12 and Annex 6 of the STEP
Market Convention, ensure market transparency
regarding issuance activity on both an aggregated
level and as regards individual programmes.
In particular, issuers are required to make all
necessary arrangements with the eligible data
providers to deliver complete and accurate
data to the ECB. To make the most effi cient
use of existing information and to minimise
the reporting burden, the types of eligible
data providers differ from country to country.
These data providers, who will report security-
by-security and transaction-by-transaction
information for each STEP programme to the
ECB, may be security settlement systems,
NCBs or other entities which comply with both
the eligibility criteria set out in Annex 6 of the
STEP Market Convention and with the ECB
reporting instructions.
As illustrated in Chart 31, the ECB reconciles
the information it receives from the STEP
Secretariat regarding the STEP programme
and the issuer (so-called static data) and the
information on related transactions and securities
(so-called dynamic data) from its eligible data
providers.
The reporting requirements were established by
the ECB together with the NCBs and eligible data
providers, taking into consideration the initial
proposals of STEP participants. These proposals
were streamlined as part of the above-mentioned
effi ciency check required by the Governing
Council, which helped to reduce costs. At the
Banque Nationale de Belgique, Deutsche Bundesbank, Banco de 60
España, Banque de France, Central Bank and Financial Services
Authority of Ireland, Banca d’Italia, De Nederlandsche Bank,
Banco de Portugal, Suomen Pankki.

42ECB
Financial integration in Europe
April 2008
same time, the publication frequency for some
breakdowns now goes beyond the original plans,
as the related marginal costs to data providers
turned out to be negligible.
Since September 2006 the ECB publishes total
outstanding amounts on a monthly basis. Since
2 April 2007 the ECB also publishes daily yield
statistics, currently based on data concerning
French programmes.61 The yield statistics
already comprise aggregate data on discount
paper issued under STEP-labelled programmes
broken down by issuer sector, rating and
maturity. Yield spreads above benchmark rates,
in particular EONIA, are also available. Yields
of individual transactions and issuers are treated
confi dentially. In line with a clarifi cation of the
STEP Market Committee, specifi c yield
information is only released for aggregate
transactions from at least three issuers.
Moreover, the ECB is about to release for
the fi rst time the outstanding amounts for
each STEP programme. This information,
complemented with a currency breakdown, will
further enhance transparency for investors and
While the relative share of French programmes has decreased, 61
they constitute the bulk of the STEP labelled outstanding amount
and are thus representative of the market for the purpose of
calculating yield curves. See also the next paragraph.
Char t 31 Comp i l a t i on o f STEP s ta t i s t i c s
Issuer and programme metadata
Consolidated STEP
statistics
Transactions and outstanding amounts by ISIN
STEP Secretariat
Program STEP ID
Issuer Sector
Credit Rating
Static Data
CoECB
Program STEP ID
Volumes
Currency
Dynamic Data
SSSNCB
Issuer (i.e. Dealers)
Settlement Date
Yield
Issuer Sector
Credit Rating
Source: ECB.

43ECB
Financial integration in Europe
April 2008
2 SPEC IAL FEATURES
allow them to easily access the information that
is useful for the monitoring of exposures to their
counterparties. While this is already helpful
under normal market conditions, the relevance of
this information increases under more turbulent
conditions, such as those witnessed during the
summer of 2007.
The complete foreseen set of STEP statistics
includes volumes, i.e. stocks and fl ows, and
yields for euro-denominated issues. In addition
to the already published data on aggregate
volume statistics, i.e. outstanding amounts, it is
envisaged to publish more detailed information
on the ECB website on a daily basis in the near
future. The new data will contain aggregate
outstanding amounts and new issues broken
down by maturity, credit rating categories
and issuer sector. A currency breakdown
for outstanding amounts will also be made
available.
As regards the STEP yields, data from all
remaining data providers will be added.
The ECB is technically in a position to provide
all the aforementioned statistics. A gradual
phasing-in of the data provision to the ECB has
been planned, which should lead to a full regular
release by the end of 2008.62
5 THE OUTCOME TO DATE
This section provides an overview of the
developments since the signing of the STEP
Market Convention in June 2006.
MARKET DEVELOPMENTS
Chart 32 shows that in July 2006, only one
month after the adoption of the Convention, eight
programmes had been granted the STEP label.
Taken together, these programmes accounted
for an outstanding volume in all currencies of
more than €70 billion. By December 2007, the
volume had risen to €320 billion.
The relevance of the STEP Market is illustrated
by the fact that the outstanding amount of euro-
denominated STEP-labelled securities already
accounts for about 30% of all euro-denominated
short-term paper placed by non-government
issuers worldwide (see Chart 33).
STEP statistics are available on: http://www.ecb.europa.eu/stats/62
money/step/html/index.en.html
Char t 32 STEP month l y out s tand ing amount s , p rogramme ce i l i ng s and number o f p rogrammes
0
100
200
300
400
500
600
700
July Sep. Nov. Jan. Mar. May July Sep. Nov.
0
10
20
30
40
50
60
70
outstanding amounts (EUR billions equivalent;
left-hand scale)
program ceiling (EUR billions, left-hand scale)
number of programmes (right-hand scale)
2006 2007
Sources: ECB, STEP Secretariat, ECB calculations.
Chart 33 Outstanding amount of euro-denominated STEP and worldwide euro-denominated non-government short-term paper, September 2007
(EUR billions)
euro-denominated non-government
short-term debt securities issued world-wide
€842.0 billion
of
which euro-
denominated
STEP issues
€235.9 billion
Source: ECB.

44ECB
Financial integration in Europe
April 2008
The most important types of issuers are currently
MFIs, in particular credit institutions (see Chart 34),
which have issued 43 out of 69 programmes. Second
in importance are non-fi nancial corporations, in
particular the treasury arms of large corporate
issuers, followed by fi nancial intermediaries other
than MFIs, in particular SPVs issuing asset-backed
commercial paper (ABCP).
The generally high programme ceilings reported
in Charts 32 and 35, i.e. the amounts that the
issuers of each programme undertake not to
exceed, refl ect the fact that the STEP standards
are relatively recent. Not surprisingly, large
issuers are typically the fi rst to adopt new
standards and practices because they are better
equipped to follow and adopt fi nancial
innovation and to act as leaders. This initial bias
towards big players, which is expected to
diminish over time, appears even more evident
when looking at the distribution of the
programmes by programme ceiling size (see
Chart 35). For the “underlying markets” (i.e. all
markets in which the STEP standards can be
potentially adopted) the share of smaller
programme ceilings is much higher.63
Currently, the markets which could potentially
make most recourse to the STEP label are, in
particular, the French market for negotiable debt
instruments, “titres de créances négociables”
(TCNs), on which non-domestic issuers are
also active, the Spanish market for “pagarés
de empresa” (CPs), and the German, Finnish,
Italian, and Belgian CP markets. An overview of
the respective market sizes is contained in Chart
36, which clearly illustrates the importance of
the largely London-based international market
(ECP, ECD) and the French domestic market.
For example, in the ECP market, some 80% of the programmes 63
have a ceiling of USD 1 billion or lower.
Char t 34 D i s t r ibut ion o f STEP programmes by i s sue r s e c to r (number o f p rogrammes )
Non-financialcorporation
19
Supranational 1 Other financial
intermediary (ABCP)
4
General government
2
Monetary financial
institution (bank)
43
Source: ECB.
Char t 35 D i s t r ibut ion o f STEP programme ce i l i ng s i z e s
2
64
14
11
7
-
25
0
5
10
15
20
25
0.1 0.5 1 5 10 20 50 1000
10
20
30
40
50
60
70
80
90
100
number of programmes with a programme ceiling
in the respective size class (left-hand scale)
cumulative percentage share of programmes with a
programme ceiling up to the respective size class
(right-hand scale)
x-axis: programme ceiling up to (in EUR billions)
Source: ECB.
Chart 36 Size of short-term paper markets
(market outstanding amounts EUR billions)
International,1,115
FranceDomestic,
470
BelgiumDomestic,
34
SpainDomestic,
85
Sources: NCBs, Dealogic, ECB calculations. Note: Non-resident issuers also can issue short-term paper on so-called domestic markets.
45ECB
Financial integration in Europe
April 2008
2 SPEC IAL FEATURES
Most of the STEP labelled programmes (35 out of
69) are in the legal form of TCN and, to a lesser
extent, ECPs (24). However, as can be inferred
from Chart 37, the international market segment
is not yet represented as much as its market share
in Chart 36 would imply. The STEP Market
Committee is currently studying some measures to
further develop the STEP label so as to also provide
further incentives to the ECP market (see below).
Concerning other “underlying” CP markets,
some aspects may be worth mentioning. In some
countries, unfavourable tax regimes, the lack of an
adequate platform or established market place, or
a relatively old legal framework (e.g. minimum
issuance amounts or language obstacles that
sometimes confl ict with STEP requirements) may
not provide the necessary incentives for issuers.
Generally, these frameworks tend to slightly favour
longer-term funding. In many countries, with the
clear exception of France, the limited activity of
money market funds does not act in favour of the
development of a market for short-term securities.
Once these points have been addressed, the place
of establishment of the issuers of STEP-labelled
paper may also be distributed more in line with
the underlying issuance of short-term paper than
the current data (see Chart 38) suggest.
As regards yield developments, the STEP market
was also infl uenced by the fi nancial market
Char t 37 D i s t r ibut ion o f STEP l abe l among under l y ing market s (number of programmes)
International 24
Domestic 45
Source: ECB.
Chart 38 Distribution of STEP label by residency of ultimate issuer
FR
73%
IE
2%
IT
4%
NL
6%
US
3% AT
0%
BE
1%CH
1%
DE
8%ES
0%
DK
0%
UK
0%
International
Organizations
2%
Source: ECB.
Char t 39 STEP y i e ld s and re l a ted market i nd i ce s
(percentage points)
3.25
3.45
3.65
3.85
4.05
4.25
4.45
4.65
3.25
3.45
3.65
3.85
4.05
4.25
4.45
4.65
EONIAall STEP issues with maturity of 0-3 days
MFI STEP issues with maturity of 10-40 days, rating 1EURIBOR 1- month
May June July Aug. Sep.2007
Source: ECB.Note: The blue circle indicates that on the given day fewer than three issuers issued STEP papers for the respective maturity, issuer sector and rating breakdown. The observation was therefore suppressed.

46ECB
Financial integration in Europe
April 2008
turbulences which started impacting CP markets
(including the ABCP market) in August 2007.
The direct effect on the STEP market was small,
as at that time only three ABCP programmes were
STEP-labelled. However, well-rated MFI STEP
programmes were apparently less affected by the
turmoil, as their yields rose less than EURIBOR
in, for example, the one-month segment
(see Chart 39).
6 RELATED DEVELOPMENTS
EUROSYSTEM COLLATERAL
On 14 September 2006 the Governing Council
of the ECB decided that the non-regulated STEP
market would be accepted for collateral purposes
in Eurosystem credit operations as soon as the
STEP statistics on yields were published on
the ECB website. This condition was necessary
to fulfi l the transparency requirements of the
Eurosystem's collateral framework.
As of 2 April 2007 the ECB publishes daily
STEP yield statistics for STEP-labelled issues
on its website.64 Hence, the STEP market has
since been accepted as a non-regulated market
for collateral purposes in Eurosystem credit
operations. In order to be eligible as collateral
for Eurosystem operations, the securities issued
under a STEP Programme have to comply with
all eligibility criteria.65
The Governing Council assessed the STEP
market on the basis of the provisions of the STEP
Market Convention and related documents. The
non-regulated STEP market (i.e. non compliant
with MiFID) was considered a safe, accessible
and transparent market and thus, for the purpose
of the collateral framework of the Eurosystem,
equivalent to a regulated market. Retention
of this characteristic depends on the strict
implementation of the STEP provisions.
TREATMENT UNDER THE UCITS DIRECTIVE
There is no unifi ed legal framework applicable
to short-term securities at the EU level. MiFID 66
defi nes money market instruments as “those
classes of instruments which are normally
dealt in on the money market, such as treasury
bills, certifi cates of deposit and commercial
papers excluding instruments of payment”.67
The Prospectus Directive 68 covers transferable
securities with the exception of money market
instruments as defi ned in MiFID and having
a maturity of less than 12 months, for which
national legislation may be applicable.69
For the purposes of the UCITS Directive,70
money market instruments are defi ned as
instruments normally dealt in on the money
market which are liquid, and have a value which
can be accurately determined at any time.71
UCITS can invest in money market instruments
without any limits, provided that they are
transacted on, for instance, a regulated market
within the meaning of the MiFID, or admitted to
http://www.ecb.europa.eu/stats/money/step.64
See Chapter 6 of “The implementation of monetary policy in 65
the euro area: General documentation on Eurosystem monetary
policy instruments and procedures” for the criteria. For further
information see also http://www.ecb.europa.eu/mopo/assets/
html/index.en.html and http://www.ecb.europa.eu/pub/pdf/other/
gendoc2006en.pdf. STEP compliant ABCP can also be eligible
if they fulfi l all the eligibility criteria.
Directive 2004/39/EC of the European Parliament and of the 66
Council of 21 April 2004 on markets in fi nancial instruments
amending Council Directives 85/611/EEC and 93/6/EEC and
Directive 2000/12/EC of the European Parliament and of the
Council and repealing Council Directive 93/22/EEC (OJ L 145,
30.4.2004, p. 1). Directive as last amended by Directive 2006/31/
EC (OJ L 114, 27.4.2006, p. 60) (MiFID).
Article 4 (1)(19) of the MiFID.67
Directive 2003/71/EC of the European Parliament and 68
of the Council of 4 November 2003 on the prospectus to
be published when securities are offered to the public or
admitted to trading and amending Directive 2001/34/EC
(OJ L345/64 of 31.12.2003, p. 64).
Article 2(1)(a) of the Prospectus Directive.69
Undertaking for collective investment in transferable securities. 70
See Council Directive 85/611/EEC of 20 December 1985 on the
coordination of laws, regulations and administrative provisions
relating to undertakings for collective investment in transferable
securities (the UCITS Directive) (OJ L375, 31.12.1985, p.3).
Article 1(9) of the UCITS Directive. Recital 4 of the Directive 71
2001/108/EC of the European Parliament and of the Council of
21 January 2002 amending the UCITS Directive, with regard to
investments of UCITS (OJ L 41, 13.2.2002, pp. 35–42) provides
that: “money market instruments cover those transferable
instruments which are normally not traded on regulated markets
but dealt in on the money market, for example treasury and
local authority bills, certifi cates of deposit, commercial paper,
medium-term notes and bankers’ acceptances”.

47ECB
Financial integration in Europe
April 2008
2 SPEC IAL FEATURES
offi cial listing on a stock exchange in a non-
Member State.72 UCITS may also invest in
money market instruments which are not
admitted to or not dealt in on a regulated market
within the meaning of the MiFID,73 provided
that they fulfi l the criteria set out by the
implementing measures of the UCITS
Directive.74 If the money market instruments do
not fall into the two above main categories, they
remain eligible, but within the ceiling of 10%
imposed by the UCITS Directive.75
As regards, in particular, the criteria applicable to
money market instruments issued by corporations
and certain types of securitisation vehicles,76 the
information on both the issue or the issuance
programme and the legal and fi nancial situation
of the issuer prior to the issue must be “verifi ed
by appropriately qualifi ed third parties not subject
to instructions from the issuer”. The criteria
applicable to money market instruments issued by
establishments subject to prudential supervision
are less stringent. The ECB has recently stressed
that the requirement of an appropriately qualifi ed
third party controlling the information does
not lend itself to an easy interpretation and also
that it is not clear who should ultimately decide
on the “appropriateness” of third parties.77 In
light of these diffi culties, it is crucial to ensure
a uniform application of this criterion in the
various EU Member States. In particular, it
needs to be clarifi ed which entities are covered
by the expression “third parties” (i.e. whether,
for instance, central banks active in this fi eld, the
STEP Secretariat or law fi rms are included in this
category).
7 OPPORTUNITIES AND CHALLENGES
HARNESSING MARKET FORCES FOR FINANCIAL
INTEGRATION
STEP has been successfully launched and the
number of STEP-labelled issuance programmes
has been steadily growing. However, the
STEP initiative and its governance still face
important challenges and opportunities.
First, the STEP Market Convention should
be regularly reviewed to make sure that it
accurately refl ects the structural developments
in the market and that its provisions effectively
enhance fi nancial integration and development.
Second, it is essential that the STEP Market
Committee, in particular when reviewing the
STEP Market Convention, ensures that the
coverage of STEP appropriately matches the
overall European short-term paper market.
Third, the STEP Market Committee should
continue to strike an appropriate balance among
the different constituencies (issuers, dealers
and investors) that are active in the various
underlying markets.
Finally, the STEP initiative is designed in such
a way that it interacts with the success of the
underlying market segments (e.g. TCN, ECP).
More competitive, open and transparent market
segments and the granting of a STEP label, will
ultimately lead to higher market integration
and business activity and a more developed
short-term securities market in Europe.
The sustained success of the initiative will be
promoted if the STEP Market Committee and
the STEP Secretariat work closely with the
relevant European associations representing the
different constituencies, and possibly extend
their partnership with these.
See Article 19(1) (a), (b) and (c) of the UCITS Directive.72
See Article 19(1)(h) of the UCITS Directive and paragraph 9 of 73
the preamble of the Commission’s Directive.
Commission Directive 2007/16/EC of 19 March 2007 74
implementing Council Directive 85/611/EEC on the coordination
of laws, regulations and administrative provisions relating to
undertakings for collective investment in transferable securities
(UCITS) as regards the clarifi cation of certain defi nitions (the
Commission’s Directive).
Article 19 (2)(a) of the UCITS Directive.75
Article 19(1)(h), second and fourth indents of the UCITS Directive.76
See the ECB opinion of 12 December 2006 on a draft Commission 77
Directive implementing Council Directive 85/611/EEC of
20 December 1985 on the coordination of laws, regulations and
administrative provisions relating to undertakings for collective
investment in transferable securities (UCITS) as regards the
clarifi cation of certain defi nitions (CON/2006/57), OJ C31/1 of
13 February 2007, paragraph 2.4.

48ECB
Financial integration in Europe
April 2008
LEGAL SOUNDNESS AND EFFECTIVENESS
In a heterogeneous legal environment, the STEP
Market Committee will need to ensure that the
legal effectiveness of the STEP label and the
legal soundness of the STEP Market Convention
is maintained. This may require continued
attention and present organisational challenges.
TOWARDS BEST STANDARDS FOR DOCUMENTATION
AND DISCLOSURE
In terms of concrete initiatives which are being
undertaken, particular interest is raised by the
current discussions among market participants
and the STEP Market Committee to assess
the performance of the STEP market. The
EBF, ACI, the International Capital Market
Association (ICMA), market participants and
lawyers from the different domestic (e.g. TCN)
or international (e.g. ECP) market segments are
currently working towards further enhancing the
quality of STEP’s market standards.
The STEP Market Committee can also contribute
to the continuous success of the STEP market
by actively following all relevant debates
and initiatives that affect European short-
term securities. One example is the initiative
launched by the European Securitisation Forum
(ESF) and the Securities Industry and Financial
Markets Association (SIFMA) to improve the
functioning of the ABCP market. The best
market practices and standards for ABCP will
be best pursued if the STEP Market Committee
closely cooperates with all relevant parties.
FURTHER IMPROVEMENTS IN DATA
TRANSPARENCY
The ECB, together with some NCBs and
securities settlement systems, is progressively
improving STEP statistics. In 2008 the
remaining data providers will be added to the
daily data transmission. This will enable the
ECB to release the full set of statistics on daily
issuance, broken down by sector, maturity and
rating and on outstanding amounts for which, in
addition, a currency breakdown will be released.
This will complement the future daily releases of
outstanding amounts by individual programme,
which will also show the respective currency
composition.
The ECB statistics framework aims to serve
the needs of short-term securities market
participants, especially fi nal investors. The role
of the STEP Market Committee and the STEP
Secretariat in regularly monitoring the data
concerns and needs of the different categories of
participants will be crucial in this respect.
In particular, it will be very important that
the STEP Market Committee and the STEP
Secretariat regularly contribute to enhancing
market transparency by defi ning those data needs
which (i) cannot be adequately accomplished by
commercial entities, in particular for reasons
of confi dentiality of individual information,
and (ii) are aimed at improving the smooth
functioning of the market under normal and
stress conditions.
SMOOTH HANDLING OF THE LABELLING PROCESS
While the STEP Secretariat will remain
responsible for granting, withholding or
withdrawing the STEP label in accordance with
the criteria and requirements laid down in the
STEP Market Convention, this does not rule
out operational arrangements with qualifi ed
third parties, based on a sound contractual
framework.
8 CONCLUSIONS
This Special Feature fi rst described the history of
the STEP initiative, its characteristics and main
actors. Second, it highlighted how the catalytic
role performed by the ECB, complemented
by the operational support provided by the
Eurosystem NCBs, was instrumental in the
success of the project. Third, the Special Feature
showed how rapidly the STEP label has been
accepted, promoting transparency and fi nancial
integration. However, the STEP Market
Committee and the STEP Secretariat still face

49ECB
Financial integration in Europe
April 2008
2 SPEC IAL FEATURES
both important challenges and opportunities in
expanding the recognition and usage of the STEP
label with the objective of further promoting the
development of the pan-European market for
short-term securities.
The STEP experience illustrates the powerful
role of private sector initiatives in fostering
progress in the integration of the euro area
fi nancial market. The Eurosystem continues
to stand ready to act as a catalyst for market-
led cooperation within this fi eld and any other
market segment where this may be useful.
50ECB
Financial integration in Europe
April 2008
C. INTEGRATION AND DEVELOPMENT OF
MORTGAGE MARKETS IN EUROPE
The process of further integration of mortgage markets in Europe has not seen major advancements over the past few years. Markets continue to be characterised by signifi cant differences across countries and obstacles that restrict cross-border activity, both on the lending and on the funding side. Recently, the European Commission published its White Paper on the Integration of EU Mortgage Credit Markets, setting out its policy vision in this area. This Special Feature discusses the main areas of interest from the ECB’s point of view, with a particular emphasis on the implications of further integration in European mortgage markets for monetary policy and fi nancial stability.
1 INTRODUCTION
The fi nancial system performs a crucial role in
the economy. Mortgage markets constitute an
important part of the euro area fi nancial system,
accounting for approximately 16% of total MFI
assets and 29% of total MFI loans at the end
of the third quarter of 2007. At the same time,
mortgages are by far the most important liability
of the household sector, making up 59% of the
total of its liabilities. Housing debt to GDP
ratios have increased across the euro area, but to
different degrees in different countries, with the
ratio being higher and growing faster in some
countries than in others.
The mortgage markets within the euro area are,
despite some progress, still not fully integrated.
Qualitative factors such as language, affi nity,
and consumer preferences create natural
barriers, resulting in market diversities that put
limits to the potential for integration. In addition,
other factors such as domestic infrastructures
(e.g. land registers, notarisation requirements)
and differing legal and consumer protection
frameworks create barriers that restrict the range
of mortgage products on offer in individual
countries; they also prevent advantage being
taken of economies of scale resulting from a
more integrated market. These factors can, and
should, be addressed by policy makers and
market participants.
Over the past years, the Commission has studied
and conducted consultations on the need for, and
the possibilities of, further strengthening the
mortgage market integration process. This resulted
in the publication of a green paper in 2005 followed
by a white paper and an accompanying impact
assessment study in December 2007.78 These set
out and give the background to the Commission’s
policy vision on promoting further integration and
development across the mortgage markets in the
EU. The ECB welcomes and agrees with the
measures and further actions that have been
announced by the Commission.
The ECB will continue to work in close
cooperation with the Commission in this area
of fi nancial market integration. In this respect,
the role of the public authorities is to create an
economic, legal and institutional environment
conducive to fi nancial integration. Although
mortgage-backed securities are an important
segment of the Eurosystem’s collateral and
therefore very relevant to the ECB, the ECB sees
the process of fi nancial integration in mortgage
markets fi rst and foremost as a market-driven
process. The ECB stands ready to encourage
and support initiatives by market participants to
strengthen convergence in market practices.
This Special Feature presents the main policy
considerations, from the ECB’s point of
view, regarding the situation of the euro area
mortgage markets. In view of its signifi cance
in the fi nancial system, further integration of
the mortgage markets may be of relevance for
the conduct of monetary policy, since it will
tend to impact the monetary policy transmission
mechanism. By fostering the development
of the fi nancial system, further integration
also increases the potential for stronger non-
infl ationary growth.
“Green Paper on Mortgage Credit in the EU”, COM(2005) 327, 78
19 July 2005; “White Paper on the Integration of EU Mortgage
Credit Markets”, COM(2007) 807, 18 December 2007; “Impact
Assessment”, COM(2007) 1683, 18 December 2007.

51ECB
Financial integration in Europe
April 2008
2 SPEC IAL FEATURES
The integration of mortgage markets is also
relevant to the Eurosystem’s task of contributing
to the safeguarding of fi nancial stability. Recent
developments in the fi nancial markets that
originated in the sub-prime mortgage markets in
the United States have shown that a high degree
of integration of mortgage (funding) markets and
the development of new, globally used products
may also entail risks to fi nancial stability through
the spill-over of shocks across countries. Thus,
any initiative to foster the further integration of
European mortgage markets needs to be well
designed and its possible implications for policy
carefully assessed.
This Special Feature discusses in more detail
both the credit/product side and the funding side
of the mortgage markets in Europe. Section 2
describes the present situation in the mortgage
credit markets, the causes and consequences
of their diversity and the scope for further
integration. The credit side, in particular,
has monetary policy and fi nancial stability
implications, which are discussed in Section 3.
Section 4 then turns to the funding markets,
reviewing them in a similar way to the credit
markets. Section 5 concludes by presenting the
main policy implications.
2 MORTGAGE CREDIT MARKETS
PRESENT LANDSCAPE
The mortgage credit markets in the euro area
are characterised by their heterogeneity across
Member States. In particular, the relative
importance of various products and contract
features differ signifi cantly from country to
country. For example, the use of fi xed and
variable rate mortgages, early repayment and
prepayment options vary considerably, as
well as the practices regarding loan-to-value
ratios and loan maturity. Chart 40 illustrates
the diversity of initial interest rate fi xation
periods in terms of new business across euro
area countries.
Over the past ten years, mortgage interest rates
have fallen across euro area countries in line
with the general reduction in nominal interest
rates. Although some convergence in the prices
of mortgage credit occurred, this development
has ceased since January 2003, and the current
rates still feature a non-negligible degree of
cross-country heterogeneity,79 as illustrated by
the example of variable rate mortgages in
Chart 41.80
Overall, the mortgage rates in the euro area
seem to be more dispersed across countries than
the rates in the United States are across regions,
which suggests that the euro area mortgage
market is less integrated.81 Figures indicate that
dispersion in the United States is less than a third
of that in the euro area at the short end of the
mortgage rates and only a fraction of that at the
long end.
Signifi cant diversity across countries is also
observed in what is often referred to as mortgage
equity withdrawal (MEW).82 However, available
survey evidence indicates that, although
growing, MEW is not a phenomenon of
considerable importance in the euro area.83 This
Apart from differences in institutional and fi scal frameworks, 79
cross-country differences in mortgage rates may also refl ect
differences in consumers’ intrinsic characteristics, such as
preferences, age and other factors that determine systematic
or cyclical differences in credit risk; see C. Kok Sørensen and
J.D. Lichtenberger (2007), “Mortgage Interest Rate Dispersion
in the Euro Area”, ECB Working Paper No. 733.
A similar degree of heterogeneity is also found for interest rate 80
differences on loans to households for house purchase with a
longer period of initial rate fi xation, see ECB (2006), “Differences
in MFI interest rates across euro area countries”, 20 September.
See Box 11 in the ECB’s Annual Report 2005. Because of 81
differences in underlying loans and in the relative importance
of the different market segments, due care should be taken in
comparing mortgage rates between the euro area and the United
States.
This term refers to the practice of households to take on debt 82
that is secured on the housing stock but not invested in it, using
it instead to fi nance consumption spending, the acquisition of
other assets or the repayment of unsecured debt. In principle,
this is possible whenever the value of the property exceeds the
outstanding amount of loans drawn against it, while the existence
of collateral (the house) would normally lead to terms that are
more favourable than unsecured debt.
See Box 2 entitled “The results of the July 2006 bank lending 83
survey for the euro area”, in the August 2006 issue of the ECB’s
Monthly Bulletin.
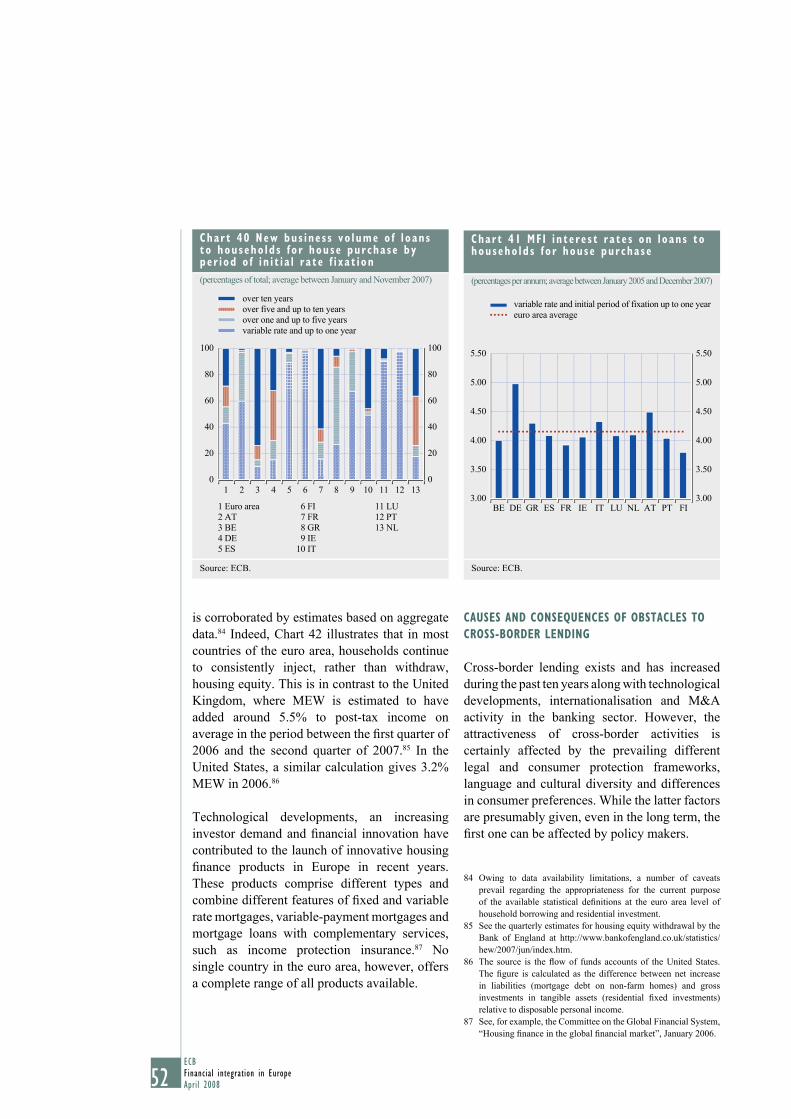
52ECB
Financial integration in Europe
April 2008
is corroborated by estimates based on aggregate
data.84 Indeed, Chart 42 illustrates that in most
countries of the euro area, households continue
to consistently inject, rather than withdraw,
housing equity. This is in contrast to the United
Kingdom, where MEW is estimated to have
added around 5.5% to post-tax income on
average in the period between the fi rst quarter of
2006 and the second quarter of 2007.85 In the
United States, a similar calculation gives 3.2%
MEW in 2006.86
Technological developments, an increasing
investor demand and fi nancial innovation have
contributed to the launch of innovative housing
fi nance products in Europe in recent years.
These products comprise different types and
combine different features of fi xed and variable
rate mortgages, variable-payment mortgages and
mortgage loans with complementary services,
such as income protection insurance.87 No
single country in the euro area, however, offers
a complete range of all products available.
CAUSES AND CONSEQUENCES OF OBSTACLES TO
CROSS-BORDER LENDING
Cross-border lending exists and has increased
during the past ten years along with technological
developments, internationalisation and M&A
activity in the banking sector. However, the
attractiveness of cross-border activities is
certainly affected by the prevailing different
legal and consumer protection frameworks,
language and cultural diversity and differences
in consumer preferences. While the latter factors
are presumably given, even in the long term, the
fi rst one can be affected by policy makers.
Owing to data availability limitations, a number of caveats 84
prevail regarding the appropriateness for the current purpose
of the available statistical defi nitions at the euro area level of
household borrowing and residential investment.
See the quarterly estimates for housing equity withdrawal by the 85
Bank of England at http://www.bankofengland.co.uk/statistics/
hew/2007/jun/index.htm.
The source is the fl ow of funds accounts of the United States. 86
The fi gure is calculated as the difference between net increase
in liabilities (mortgage debt on non-farm homes) and gross
investments in tangible assets (residential fi xed investments)
relative to disposable personal income.
See, for example, the Committee on the Global Financial System, 87
“Housing fi nance in the global fi nancial market”, January 2006.
Char t 40 New bus ine s s vo lume o f l oans to househo ld s f o r house purchase by per iod o f i n i t i a l r a te f i xa t i on
(percentages of total; average between January and November 2007)
0
20
40
60
80
100
0
20
40
60
80
100
1 Euro area
2 AT
3 BE
4 DE
5 ES
6 FI
7 FR
8 GR
9 IE
11 LU
12 PT
13 NL
over ten years
over five and up to ten years
over one and up to five years
variable rate and up to one year
1 2 3 4 5 6 7 8 9 10 11 12 13
10 IT
Source: ECB.
Char t 41 MF I i n te re s t r a te s on l oans to househo ld s f o r house purchase
(percentages per annum; average between January 2005 and December 2007)
variable rate and initial period of fixation up to one year
euro area average
3.00
3.50
4.00
4.50
5.00
5.50
3.00
3.50
4.00
4.50
5.00
5.50
BE DE GR ES FR IE IT LU NL AT PT FI
Source: ECB.

53ECB
Financial integration in Europe
April 2008
2 SPEC IAL FEATURES
The current limited cross-border activity may
affect economic growth. In general, more
integrated mortgage credit and funding markets
are likely to stimulate competition and effi ciency
in the mortgage markets. This should increase
the ability of the economy to sustain a higher
rate of output growth. A more competitive
market should lead to more choice and better
value for consumers, thereby enhancing market
completeness. Indeed, some studies show that
full integration of the EU mortgage market
could increase the level of EU GDP by 0.1 to
0.7%.88
In principle, less developed and integrated
mortgage markets do not allow economic agents
to share risks optimally. This also affects the
monetary transmission mechanism, which
Section 3 investigates in more detail.
Finally, the differences across countries as
regards mortgage funding markets, discussed
in more detail in Section 4, may also infl uence
the provision of mortgage loans as it may affect
the products on offer to the consumer. For
example, if a mortgage lender does not have
suitable stable long-term fi nancing, it may not
be able to fi nance products such as longer-term
fi xed rate mortgages. Conversely, a supply of
certain standardised products in the housing
credit market may enhance the functioning of
the cross-border funding market via improved
cross-border knowledge on products that such
standardisation would imply.
Overall, higher integration and competition
in the mortgage credit markets would benefi t
consumers, who would have a wider array of
products to choose from according to their
individual risk preferences and consumption
plans. The process of integration should in
addition result in economies of scale, leading to
lower prices and the access of more households
to mortgage markets.
See, for example, Mercer Oliver Wyman and the European 88
Mortgage Federation, “The Costs and Benefi ts of Integration
of EU Mortgage Markets”, London Economics, August 2005,
and “Study on the Financial Integration of European Mortgage
Markets”, October 2003.
Chart 42 Mortgage equity withdrawal in euro area countries
(as a percentage of disposable income)
-10
-8
-6
-4
-2
0
2
4
6
-10
-8
-6
-4
-2
0
2
4
6
Euro area
Germany
France
Italy
Spain
The Netherlands
1998 1999 2000 2001 2002 2003 2004 2005 2006-10
-8
-6
-4
-2
0
2
4
6
1998 1999 2000 2001 2002 2003 2004 2005 2006-10
-8
-6
-4
-2
0
2
4
6
BelgiumGreeceIrelandAustriaFinland
Sources: ECB and Eurostat.Notes: Mortgage equity withdrawal is calculated as the difference between the annual net fl ows in loans to households for house purchase and annual gross fi xed capital formation in housing. Luxembourg and Slovenia are not shown, owing to data availability limitations.

54ECB
Financial integration in Europe
April 2008
SCOPE FOR FURTHER INTEGRATION
Survey evidence shows that lenders in particular
are generally interested in expanding their cross-
border mortgage activity.89 Indeed, the
December 2007 White Paper of the European
Commission recognises that many mortgage
lenders express a signifi cant interest in
developing their activities in countries where
they are not yet present. However, the economic,
legal and institutional differences across
countries form signifi cant impediments to
entering foreign markets.
European borrowers, by contrast, show only
a limited interest in shopping for mortgage
products outside their national boundaries.
Reasons for this are factors such as language,
distance, consumer preferences, but also
insuffi cient information about, and confi dence in,
lenders not operating in the borrower’s country and
uncertainty about the legal and institutional rules
governing loans taken up in other Member States.
The Commission therefore concludes in its
White Paper that the integration of EU mortgage
markets will essentially be supply driven, in
particular through the establishment of branches,
collaborations, etc. in other Member States.
As regards the type of policies to be pursued,
those that increase information availability and
transparency both for lenders and borrowers,
and those that help increase product diversity
by removing obstacles to the integration of
the general banking market seem to be most
promising.
In this context, the White Paper identifi es a number
of key areas of interest, such as pre-contractual
information, the transparency of the annual
percentage rate of charge, promoting responsible
lending behaviour and proposes further work on
the early repayment option. The Commission
envisages conducting a profound impact analysis
on the possible actions on these issues in 2008.
In addition, it will present a Recommendation
on issues linked with harmonised foreclosure
procedures as well as cross-border availability of
information on registration and property valuation.
Integration of the banking market and the
broadening of the range of products available
to all European customers could be further
fostered through initiatives which favour product
standardisation across countries, as this is likely
to foster consumers’ product knowledge. At the
same time, it is important to ensure that such
standardisation does not hamper competition and
product innovation. Increased transparency and
a more harmonised terminology and defi nitions
would be benefi cial as well. The ECB also agrees
with the Commission that this process towards a
more integrated mortgage market needs to involve
a careful consideration of all options and engage
both market participants and policy makers.
Furthermore, product diversity could be
improved by enhancing lender access to
mortgage funding, as will be discussed in more
detail in section 4.
3 POLICY CONSIDERATIONS
GENERAL CONSIDERATIONS
The integration of mortgage lending markets
across the euro area may have implications
for monetary policy and fi nancial stability,
two policy areas where the Treaty entrusts
important responsibilities to the Eurosystem.
Integration affects the structure and operation
of fi nancial markets and services which should
result in a more homogeneous transmission
of monetary policy impulses across euro area
countries. However, by the same token, it
may entail new risks. First, the probability of
shocks originating within the area becoming
area-wide may increase. Second, integration
may strengthen the reaction of the economic
and fi nancial system to all shocks, whether
originating inside or outside the euro area. This
might result in higher cyclical volatility and more
See, for example, “Eurobarometer 205: Public Opinion in 89
Europe – Financial Services”, January 2004; “Eurobarometer 230:
Public Opinion in Europe on Financial Services”, August 2005;
“The Costs and Benefi ts of Integration of EU Mortgage Markets”,
London Economics, August 2005, p. 57.

55ECB
Financial integration in Europe
April 2008
2 SPEC IAL FEATURES
unstable price developments. Any initiatives to
foster integration will have to take the possible
implications for monetary policy and fi nancial
stability into account.
Monetary policy affects the economy by
infl uencing both the business sector in its
productive activity and investment behaviour
(the so-called investment channel) and the
household sector in its consumption behaviour
(the consumption channel). As the residential
mortgage markets are part of the retail credit
market, the integration of the mortgage markets
will primarily affect the consumption channel
and thereby its prominence relative to the
investment channel.
In terms of the transmission mechanism,
monetary policy affects the economy by
infl uencing bank lending rates and also by
shaping fi nancial market expectations about
the future course of monetary policy. These
expectations infl uence the prices of fi nancial
instruments, including mortgage loans. Focusing
on the household sector, monetary policy
actions may, furthermore, affect household
consumption decisions in two ways. First, they
induce changes in the net worth of the household
mortgage liabilities and hence in their net wealth
and, second, in so doing affect their ability to
take up credit against collateral.
A broader and more integrated mortgage market
should improve pricing transparency, with rates
more likely to refl ect the creditworthiness of
borrowers, while cost effi ciency would at the
same time benefi t from increased competition and
potentially larger economies of scale.
Highly integrated and developed mortgage
markets allow more effective risk-sharing as
creditors can better diversify their mortgage
credit portfolios across countries and thereby
mitigate country-specifi c mortgage credit
risk. This increases the ability of the euro area
economies to absorb asymmetric shocks and
those common shocks that, due to structural
differences, generate different responses in the
economies.
The downside of such risk sharing and
diversifi cation is that national mortgage
markets could become more vulnerable to the
spillover from shocks coming from abroad.
Increased foreign competition resulting from
more integration may also affect banks’ credit
standards and pricing power. To the extent
that a decrease in banks’ interest margins is
compensated for by volume growth, this could
lead to irresponsible lending and generate
fi nancial vulnerabilities.
IMPACT ON THE MONETARY POLICY
TRANSMISSION MECHANISM
More mortgage market integration may
have implications for the monetary policy
transmission mechanism, by changing the speed
and degree of interest rate pass-through. More
specifi cally, the monetary policy transmission
channel may be affected by the availability of
a broad range of mortgage products, such as
variable and fi xed rate mortgages, mortgages
with early repayment and prepayment options,
and MEW products.
At present, there is a wide diversity across
countries as regards the use of variable and fi xed
rate mortgages (see Chart 40). A higher
homogeneity in the interest rate fi xation structure
is expected to reduce heterogeneity in the
transmission of monetary policy impulses. With
a predominance of variable rate mortgages in
the euro area, the interest rate risk would be
shifted to the borrowers (households). The
response of private consumption to changes in
monetary policy would be amplifi ed because of
its more immediate impact on households’
disposable income.90 Fixed rate mortgages, by
Angeloni et al.(2003), “Monetary policy transmission in the Euro 90
Area”, CUP. A fi xed rate contract shifts the interest rate risk to
the lender (banks) which will tend to pass it on to other investors
via interest rate conditions on the funding of the loan. Non-
fi nancial corporations, however, generally borrow at short rates
to fi nance working capital and inventories. Moreover, the share
of variable rate, long-term lending to non-fi nancial corporations
has tended to increase over recent years. Therefore, a change
in the stance of monetary policy will induce lenders (banks) to
change the cost of credit to fi rms (which, in turn, will adjust their
investment plans).

56ECB
Financial integration in Europe
April 2008
contrast, tend to smooth the effect of monetary
policy on private consumption because the debt
service burden of existing borrowers is not
affected.
Currently, fi xed rate mortgages prevail in about
half of the euro area countries, while variable
rate mortgages dominate in the other countries.
Fixed rate mortgages, however, are dominant
in the largest euro area countries, which may
be one factor explaining the evidence that it is
currently not the consumption channel, but the
investment channel that is dominant in the euro
area.91
Monetary policy would be more effi cient if
households made well-informed and forward-
looking decisions on the basis of accurate and
transparent information on the price and other
terms and conditions of a mortgage loan. It is
also likely that some of the differences across
countries that are related to limitations in supply,
and not to different preferences, would decline
with increasing integration of markets, thereby
reducing heterogeneous responses to monetary
policy shocks that are not rooted in the structure
of the economy.
The degree to which mortgage loans are
contracted at a variable or fi xed rate is also
relevant for fi nancial stability, as it infl uences
how the interest rate risk entailed in mortgage
lending is distributed between mortgage
creditors and debtors. If mortgage loans are
contracted at a fi xed rate, the risk of rising
interest rates in effect constitutes an income
risk to creditors, unless this risk has been passed
on to their funding providers (e.g. through the
issuance of covered bonds). By contrast, if
variable rates prevail, the risk of a rate increase
constitutes a risk to the mortgage debt service
capacity of debtors and therefore, ultimately, a
credit risk to mortgage lenders. The credit risk
depends on the duration of the fi xation period of
the contracted mortgage interest rates and on the
maturity of the loan. If the maturity of the loan
tends to be relatively short, short-term fi xed rate
mortgage borrowers are nonetheless exposed
to interest rate risk when the interest fi xation
period expires.
Therefore, while the interest rate risk of banks
may have somewhat decreased through the
increasing popularity of variable rate mortgages
in a number of countries, their credit risk could
have increased if the capacity of borrowers to
service their loans deteriorates when interest rates
are going up.
Early repayment and prepayment options in
mortgage contracts and requiring banks to price
them separately should lead to greater cost
transparency and fl exibility for consumers.92 At
the same time, the separate pricing of the
repayment option, preferably linked to the
expected path and volatility of interest rates,
would ensure that decisions to repay early will be
taken on the basis of the real refi nancing costs
that early repayment entails to the lender.
Furthermore, a more homogeneous regime and
the resulting broader range of products available
across the euro area as a whole would reduce the
differences in the transmission mechanism, which
arise from the asymmetric reactions of borrowers
under heterogeneous conditions.
As regards its effect on the monetary policy
transmission mechanism, the prepayment option
will tend to lead to an asymmetric reaction of
households to changes in monetary policy stance.
During a monetary policy easing, borrowers
would fi nd it opportune to refi nance their loans at
Recent empirical evidence suggests that interest rate pass-91
through in the euro area mortgage markets is relatively quick
and complete. For the euro area as a whole, changes in market
rates are passed on, on average, by around two-thirds after three
months and by more than 90% after six months (Gropp et al.
(2007), “The dynamics of bank spreads and fi nancial structure”
ECB Working Paper No. 714). However, some heterogeneity
across countries remains in the extent to which monetary policy
interest rate changes pass through to the mortgage market. This
refl ects differences in competition, cyclical positions and bank-
specifi c conditions (C. Kok Sørensen and T. Werner (2006),
“Bank interest rate pass-through in the euro area – a cross country
comparison”, ECB Working paper No. 580), as well as supply
side factors and institutional factors (C. Kok Sørensen and J.D.
Lichtenberger (2007), “Mortgage Interest Rate Dispersion in the
Euro Area”, ECB Working Paper No. 733).
In some jurisdictions (e.g. in Italy), banks are not allowed to 92
claim a compensation in the case of early repayment.

57ECB
Financial integration in Europe
April 2008
2 SPEC IAL FEATURES
the lower rate, thus reducing their interest burden
and increasing their spending capacity. On the
other hand, as soon as monetary policy enters a
tightening cycle, borrowers would in principle
either retain their fi xed rate loans or refi nance
their variable rate loans with fi xed rate ones in
order to lock in the lower interest rate level.93
Therefore, the prevalence of the early repayment
option tends to increase the effects of an easing
of monetary policy, while reducing the effects of
a monetary policy tightening. The magnitude of
such effects will, of course, depend on the costs
of refi nancing, which should be refl ected in the
early repayment fees.
Greater mortgage market integration may also
increase MEW. The ability of households to
extract equity out of their housing wealth is
potentially an important channel of the monetary
policy transmission mechanism. Credit
availability to households and the cost, i.e. the
interest rate at which it can be obtained, depend
to a very large extent on their net wealth, since
household assets can be used as collateral. In
particular, higher asset prices will imply higher
net worth, which in turn will allow for higher
household borrowing and spending.94 As a
consequence, monetary policy can have an
effect on real activity via the impact of interest
rate changes on house prices and thus household
net wealth.95 The extent to which this channel
will be operational crucially hinges on the ability
of households to borrow against the increased
values of their housing assets to fi nance
consumption expenditure (i.e. on the availability
of MEW credit products). Indeed, international
evidence suggests that the higher the level of
MEW in an economy, the higher is the marginal
propensity to consume out of housing wealth.96
MEW products may, however, raise certain
fi nancial stability concerns, in particular through
their effect on house prices, as discussed in
greater detail in the next sub-section.
Finally, the integration of mortgage funding
markets and the likely increase in the share of
mortgage funding on the capital markets that this
would entail, discussed in greater detail in Section
4, would increase the sensitivity of mortgage
loan supply to monetary policy actions.
POSSIBLE CONSEQUENCES OF THE IMPACT ON
THE TRANSMISSION MECHANISM
As a matter of principle, the design of monetary
policy should take into account the risk that
mortgage markets may exacerbate cyclical
developments, in particular in asset prices,
which may also pose risks to fi nancial stability.
In this respect, some important elements of the
ECB’s two-pillar strategy should be highlighted.
First, the ECB primary objective of price
stability is defi ned in terms of the Harmonised
Index of Consumer Prices (HICP). Therefore,
real estate prices as such do not constitute part
of the policy target variable. However, the
encompassing nature of the economic analysis
in the fi rst pillar guarantees that real estate and
mortgage developments are taken into account in
the assessment of the outlook for price stability.
Moreover, the explicit role of the analysis of
monetary and credit aggregates permits the
information from the real estate sector to be
combined with balance sheet and credit data.
In short, by going beyond the classic indicators
of house price sustainability and by better
identifying and monitoring the credit channel,
the ECB can form a more robust opinion about
the risks to price stability and to the fi nancial
system that stem from mortgage debt.
This may not necessarily be the case if the term spread charged 93
on fi xed-rate loans already incorporates the effect of expected
future interest rate increases, rendering fi xed rate contracts less
attractive for borrowers.
This mechanism is known in the literature as the “fi nancial 94
accelerator”, see B. Bernanke, M. Gertler and S. Gilchrist
(1999), “The Financial Accelerator in a Quantitative Business
Cycle Framework”, in J. Taylor and M. Woodford (eds.),
The Handbook of Macroeconomics, Vol. 1, North-Holland,
Amsterdam. For a model that examines the role of housing as
collateral in particular, see M. Iacoviello (2005), “House Prices,
Borrowing Constraints, and Monetary Policy in the Business
Cycle”, American Economic Review, Vol. 95 (3).
In principle, house prices refl ect the present value of the stream 95
of future benefi ts (rents or user services) stemming from the
residential property. Monetary policy, through its impact on
interest rates, affects the discount factor used to calculate this
present value.
P. Catte, N. Girouard, R. Price and C. André (2004), “Housing 96
market, wealth and the business cycle”, OECD Economics
Department Working Paper No. 394.

58ECB
Financial integration in Europe
April 2008
More complete and comprehensive integration
through a broader range of mortgage products is
likely to reduce the costs of mortgage fi nancing
mainly via economies of scale and greater
effi ciency. This would lead both to some change
in the household consumption basket towards
housing and to a corresponding increase in
the household debt to disposable income ratio.
But these developments will be of a relatively
limited size and therefore cannot by themselves
be expected to have any signifi cant positive
or negative consequences for the conduct of
monetary policy or for the stability of the
fi nancial system. However, when they form
part of an overall comprehensive liberalisation
process accompanied by a period of economic
buoyancy, there may be a risk to fi nancial
stability, as demonstrated by past experiences.
As regards the possible developments in terms
of variable versus fi xed rate mortgages, the
experience of industrialised countries does not
support the notion that countries where the
variable rate contracts dominate are those where
monetary policy is more successful in delivering
low and less volatile infl ation.97 A movement
towards a uniform pattern offering more choice
for the setting of the fi xation period of contracts
across euro area countries would probably result
in a slight strengthening of the consumption
channel of monetary policy transmission.
As regards the early repayment regime,
monetary policy may be confronted with
more or less strong asymmetric effects of
changes in the monetary policy stance. The
more predominant the availability of the
early repayment option, the stronger and the
more direct the expansionary effect of an
easing of the stance would be. On the other
hand, the consumption channel would be less
reliable during tightening phases because of
the tendency of mortgage borrowers to lock
themselves in at the lowest interest rate levels.
This asymmetry may, in practice, be limited
to periods when a tightening and an easing of
policy follow each other relatively quickly. In
that case, the easing of policy may not have
much effect on household behaviour, as they
may still be locked in at interest rate levels that
have not yet been reached.
A strong prevalence of MEW will amplify
the effects of an easing of monetary policy.98
MEW can itself become destabilising, because it
encourages the leveraging of housing equity when
prices go up. The danger is therefore greater when
house prices have been increasing substantially
for a signifi cant period of time. Under such
circumstances, economic agents tend to extrapolate
past house price increases into the future and
thus engage in unsustainable borrowing and
lending behaviour, thereby fuelling the ongoing
house price speculation. Such behaviour would
magnify cyclical volatility and lead to undesirably
pronounced boom and bust phenomena99, which
are to be avoided both from a monetary policy and
a fi nancial stability perspective.
As loan-to-value ratios on mortgage loans also
tend to be relatively high in countries where
MEW prevails, potential credit losses could be
signifi cant if risks for house prices materialise.
However, empirical evidence on this issue is
still relatively limited.
In conclusion, while the Eurosystem is neutral
as concerns the fi nal confi guration which may
This is because monetary policy actions have a direct effect 97
on the mortgage debt servicing of households, which in theory
should translate into changes in consumption decisions.
However, in the case of fi xed rate mortgages, the debt service
burden of the mortgage stock would not change with monetary
policy (D. Miles (2004), “The UK Mortgage Market: Taking a
longer-term view”, Report for HM Treasury, March).
For policy- related aspects of the role MEW and other innovations 98
play in infl uencing the macro-fi nancial environment, see H. Zhu
(2005), “The importance of property markets for monetary policy
and fi nancial stability”, in “Real estate indicators and fi nancial
stability”, BIS Papers No. 21; G. Debelle (2004), “Household
debt and the macroeconomy”, BIS Quarterly Review, March;
M. McConnell, R Peach and A Al-Haschimi (2003), “After the
refi nancing boom: will consumers scale back their spending?”,
Current Issues in Economics and Finance, Federal Reserve
Bank of New York, December. For a theoretical approach see
K. Aoki, J. Proudman, and G. Vlieghe (2004), “House prices,
consumption, and monetary policy: a fi nancial accelerator
approach”, Journal of Financial Intermediation, Vol. 13(4). P. Hoeller and D. Rae (2007), “Housing markets and adjustments 99
in monetary union”, OECD Economics Department Working
Paper No. 550.

59ECB
Financial integration in Europe
April 2008
2 SPEC IAL FEATURES
emerge from further integration in mortgage
markets, the main considerations are the
following. Further integration is likely to enhance
the effi ciency of the fi nancial system, to the extent
that it leads to more competition and an enhanced
supply of products. This should contribute
favorably to the potential for growth of the euro
area, to a more effective implementation of
monetary policy and, in general, to a reduction in
asymmetric responses to monetary policy shocks
not directly linked to the main characteristics of
the economies of euro area countries (and which
relate, for example, to preferences or to the risk
profi le of economic activities). The resulting
change in the transmission mechanism needs to be
monitored in order to be fully taken into account
when formulating monetary policy decisions.
Finally, the possible consequences and risks in
term of fi nancial stability need to be carefully
assessed ex-ante and constantly monitored.
4 MORTGAGE FUNDING MARKETS
PRESENT LANDSCAPE
As discussed above, the market of mortgage
funding instruments remains heterogeneous
across countries in Europe, just like the mortgage
credit market. Since both markets are closely
intertwined, any fragmentation in one will feed
into fragmentation in the other. In that respect,
Section 2 already discussed how the conditions
on which mortgage lenders have access to funds
may have an important impact on both price
and supply of certain types of mortgages for
consumers in the primary market. This section
will focus on additional issues that relate to
lenders and issuers in the secondary market.
A wide range of funding sources is potentially
available to lenders, including customer
deposits, covered bonds, mortgage-backed
securities and whole loan sales. Some of the
capital market instruments, such as medium-
term notes and subordinated debt, have a pan-
European, if not global reach. Although
customer deposits have traditionally been the
main funding source in Europe, the issuance of
capital market instruments, such as residential
mortgage-backed securities (RMBSs)100 and
covered bonds,101 has been increasing in recent
years.102 Funding using whole loan sales – i.e.
transferring part of the mortgage portfolio to
another lender – has so far remained limited.
Despite the increasing issuance of RMBSs and
covered bonds in Europe, the markets are still
smaller than in the United States (see Chart 43).
In the United States, lenders fund approximately
60% of all outstanding residential mortgages
In general, an RMBS consists in an originator of mortgage 100
loans (i.e. the mortgage lender) transferring (i.e. selling) some
of its mortgage loans to a bankruptcy-remote SPV which in turn
issues debt securities that are backed solely by the cash-fl ows
produced by the underlying mortgage portfolio. In the event of
the default of the issuer (i.e. the SPV), the debt securities holder
can claim the cover asset pool (i.e. the mortgage loans). This
increases the safety of the debt securities for the investor (i.e.
the debt securities holder). In addition, the issuance of RMBSs
enables the originator of mortgage loans to transfer some credit
risks off its balance sheet to the SPV, thereby freeing up own
capital to be used for other purposes. RMBSs are usually
issued in several tranches, ranking from senior tranches to
more subordinated tranches. This makes it possible for the
senior tranche to benefi t from a high credit rating, which in turn
facilitates the establishment of an RMBS.
With the covered bond technique, the mortgage loans are not 101
sold to an SPV, but remain on the mortgage lender’s balance
sheet. The particularity of a covered bond for its holder is that
it enjoys legal protection in the event of issuer bankruptcy
(i.e. “ring fencing” of the assets covering the pool against any
creditor claims against the issuer), and the holder may also
turn to the issuer should the cover pool not be suffi cient. Most
Member States have special legislation on covered bonds.
See also the Special Feature A in Chapter II, pp. 29 ff., for 102
indicators on securitisation and covered bonds.
Chart 43 Total size of covered bonds and RMBSs market
(end-2006; EUR billions)
0
1,000
2,000
3,000
4,000
5,000
6,000
0
1,000
2,000
3,000
4,000
5,000
6,000
Euro area (15) EU (27) US
Sources: European Mortgage Federation; European Covered Bond Council; European Securitisation Forum; ECB calculations.

60ECB
Financial integration in Europe
April 2008
with market funding instruments. This market
orientation has been fostered by government-
sponsored enterprises such as Fannie Mae and
Freddie Mac. Their role in the market, especially
the eligibility criteria for the types of mortgage
loans they purchase, has contributed to a high
degree of standardisation in the United States.
In Europe, by contrast, the majority of the
funding comes from customer deposits, and on
average less than 30% from market instruments
(see Chart 44). Thus, there still appears to be
room for growth in market funding instruments.
There is also considerable variation in the
importance of RMBSs and covered bonds in
the national markets. Due to factors such as the
presence of a long-established legal framework
or the existence of certain legal or other obstacles,
only one type of instruments dominates in most
countries, such as covered bonds in Germany or
Denmark or RMBSs in the United Kingdom or
Portugal. Thus, there is also room to improve
the availability of the different mortgage funding
instruments in various countries.
CAUSES AND CONSEQUENCES OF OBSTACLES TO
CROSS-BORDER FUNDING
The diversity across countries on the funding
side results mainly from three factors: (i)
differences in legal frameworks; (ii) asymmetric
information problems; and (iii) diffi culties
in “unbundling” the mortgage value chain,
in particular to allow for the separation of
origination and servicing functions.
There are currently no common European
standards for the issuance of RMBSs. This
fragmentation has two dimensions. First,
diverging legal and regulatory frameworks
and non-uniform tax regimes among Member
States do not allow the setting up of similar
RMBS structures across Europe. Second,
within the same Member State, RMBSs can
differ signifi cantly from each other, as various
originators might have recourse to different
techniques to transfer the assets to the SPV or
might use different defi nitions of terms such as
“default event”, “delinquency rate”, “loan-to-
value ratio”, or the type of underlying collateral.
While pursuing the same goal, and being issued
Chart 44 Share of covered bonds and RMBSs as the source of residential mortgage funding tool
(end 2006; percentages)
0.0
10.0
20.0
30.0
40.0
50.0
60.0
70.0
80.0
90.0
100.0
0.0
10.0
20.0
30.0
40.0
50.0
60.0
70.0
80.0
90.0
100.0
1 Belgium
2 Germany
3 Greece
4 Spain
5 France
6 Ireland
7 Italy
8 Cyprus
9 Luxembourg
10 Malta
11 The Netherlands
12 Austria
13 Portugal
14 Slovenia
15 Finland
16 Bulgaria
17 Romania
18 UK
19 Czech Republic
20 Denmark
21 Estonia
22 Latvia
23 Lithuania
24 Hungary
25 Poland
26 Slovakia
27 Sweden
28 Euro area (15)
29 EU (27)
30 US
covered bonds
RMBS
1 2 3 4 5 6 7 8 9 10 11 12 13 14 15 16 17 18 19 20 21 22 23 24 25 26 27 28 29 30
Source: see Chart 43.
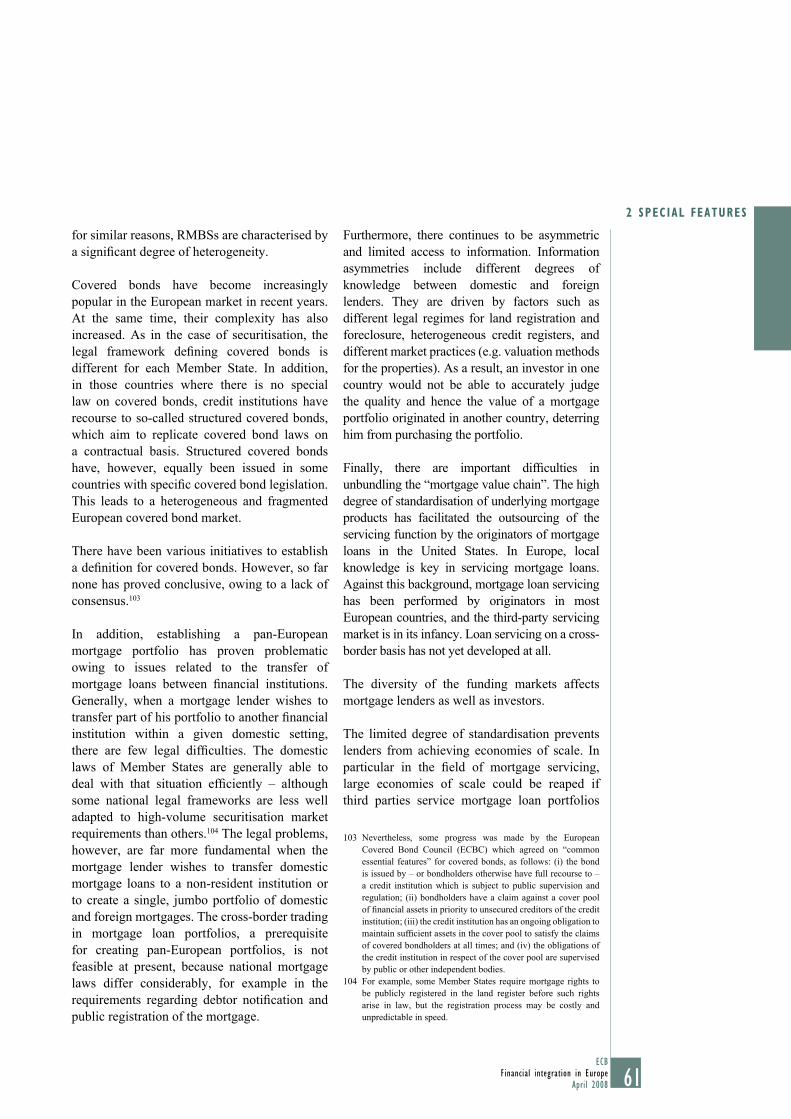
61ECB
Financial integration in Europe
April 2008
2 SPEC IAL FEATURES
for similar reasons, RMBSs are characterised by
a signifi cant degree of heterogeneity.
Covered bonds have become increasingly
popular in the European market in recent years.
At the same time, their complexity has also
increased. As in the case of securitisation, the
legal framework defi ning covered bonds is
different for each Member State. In addition,
in those countries where there is no special
law on covered bonds, credit institutions have
recourse to so-called structured covered bonds,
which aim to replicate covered bond laws on
a contractual basis. Structured covered bonds
have, however, equally been issued in some
countries with specifi c covered bond legislation.
This leads to a heterogeneous and fragmented
European covered bond market.
There have been various initiatives to establish
a defi nition for covered bonds. However, so far
none has proved conclusive, owing to a lack of
consensus.103
In addition, establishing a pan-European
mortgage portfolio has proven problematic
owing to issues related to the transfer of
mortgage loans between fi nancial institutions.
Generally, when a mortgage lender wishes to
transfer part of his portfolio to another fi nancial
institution within a given domestic setting,
there are few legal diffi culties. The domestic
laws of Member States are generally able to
deal with that situation effi ciently – although
some national legal frameworks are less well
adapted to high-volume securitisation market
requirements than others.104 The legal problems,
however, are far more fundamental when the
mortgage lender wishes to transfer domestic
mortgage loans to a non-resident institution or
to create a single, jumbo portfolio of domestic
and foreign mortgages. The cross-border trading
in mortgage loan portfolios, a prerequisite
for creating pan-European portfolios, is not
feasible at present, because national mortgage
laws differ considerably, for example in the
requirements regarding debtor notifi cation and
public registration of the mortgage.
Furthermore, there continues to be asymmetric
and limited access to information. Information
asymmetries include different degrees of
knowledge between domestic and foreign
lenders. They are driven by factors such as
different legal regimes for land registration and
foreclosure, heterogeneous credit registers, and
different market practices (e.g. valuation methods
for the properties). As a result, an investor in one
country would not be able to accurately judge
the quality and hence the value of a mortgage
portfolio originated in another country, deterring
him from purchasing the portfolio.
Finally, there are important diffi culties in
unbundling the “mortgage value chain”. The high
degree of standardisation of underlying mortgage
products has facilitated the outsourcing of the
servicing function by the originators of mortgage
loans in the United States. In Europe, local
knowledge is key in servicing mortgage loans.
Against this background, mortgage loan servicing
has been performed by originators in most
European countries, and the third-party servicing
market is in its infancy. Loan servicing on a cross-
border basis has not yet developed at all.
The diversity of the funding markets affects
mortgage lenders as well as investors.
The limited degree of standardisation prevents
lenders from achieving economies of scale. In
particular in the fi eld of mortgage servicing,
large economies of scale could be reaped if
third parties service mortgage loan portfolios
Nevertheless, some progress was made by the European 103
Covered Bond Council (ECBC) which agreed on “common
essential features” for covered bonds, as follows: (i) the bond
is issued by – or bondholders otherwise have full recourse to –
a credit institution which is subject to public supervision and
regulation; (ii) bondholders have a claim against a cover pool
of fi nancial assets in priority to unsecured creditors of the credit
institution; (iii) the credit institution has an ongoing obligation to
maintain suffi cient assets in the cover pool to satisfy the claims
of covered bondholders at all times; and (iv) the obligations of
the credit institution in respect of the cover pool are supervised
by public or other independent bodies.
For example, some Member States require mortgage rights to 104
be publicly registered in the land register before such rights
arise in law, but the registration process may be costly and
unpredictable in speed.

62ECB
Financial integration in Europe
April 2008
of multiple originators, since the fi xed costs to
establish and maintain this function are high.
In light of the crisis in sub-prime mortgage
market in the United States, however, caution
is warranted. The originator typically has an
advantage in acquiring local information, which
is important for monitoring the loan. Moreover,
the diversity across funding instruments hampers
secondary market liquidity. Overall, this may
result in higher refi nancing costs for originators.
In addition, mortgage lenders can currently
penetrate foreign markets only if they build
up the costly infrastructure there to originate
mortgage loans, owing to the legal diffi culties of
transferring mortgage loan portfolios on a cross-
border basis. This prevents a higher degree
of diversifi cation being achieved by issuing
funding instruments backed by pan-European
mortgage portfolios.
Investors are confronted with a wide diversity
of covered bonds and RMBS structures. Large
investors are able to thoroughly analyse and
understand markets and carefully select the
securities in which they invest. This may be
more problematical for smaller investors. Others
may limit their considerations to the information
provided by credit rating agencies in taking
investment decisions. As a result, the desire
of investors to diversify might be dampened
and, therefore, additional investments might
be prevented. This may explain why market
liquidity in the secondary markets for RBMSs
and covered bonds has remained subdued.
SCOPE FOR FURTHER INTEGRATION
Enhancing the transferability of mortgage loan
portfolios, in particular at a cross-border level,
is key to allowing further innovation to take
place, but is currently beset by many obstacles.
Legally, the transfer of mortgage loans involves
the assignment of the claim and the transfer of
collateral. Some jurisdictions require borrowers
to be notifi ed of the assignment, which is costly
and ineffi cient for lenders to do, particularly
in large-volume transactions. In addition, the
transfer of mortgage portfolios affects the
rights of the underlying borrower under data
and consumer protection legislation both at EU
and domestic levels. The interaction between
these rights and the mortgage lender’s interests
needs to be clarifi ed, particularly in the context
of cross-border sales. As regards the transfer of
collateral, changes to property rights normally
have to be publicly recorded in a land register,
which involves an administrative procedure. The
length, predictability and cost of these procedures
in some Member State jurisdictions may deter
mortgage lenders from cross-border sales.
Investors would also benefi t from easing the legal
restrictions on access to credit registers.
A meaningful improvement in cross-border
transferability of mortgage loans would require
legal action, preferably at the European level,
in order to lay down minimum standards for
such transfers. However, in view of Member
State sensitivities on the subject of property law,
European legislation in this area may only be a
long term goal.
Improved convergence of standards for cross
border securitisation may be more feasible in
the short to medium term. With a view to
reducing the legal fragmentation in this area, the
ECB has indicated that, looking beyond the
Commission’s Financial Services Action Plan,
it sees merits in a strategy of increased
harmonisation at the EU level.105
The ECB has also contributed to the activities of
the European Financial Markets Lawyers Group
(EFMLG) in the fi eld of securitisation. Over the
past two years, this expert group has examined
the legal obstacles to the development of cross-
border securitisation in the EU. In its report,106
the EFMLG concluded that Member States
should adopt a certain number of common
In this respect, see ECB Opinion CON/2004/30 of 14 September 105
2004 at the request of the French Ministry of Economic Affairs,
Finance and Industry on a draft decree concerning fonds communs
de créances (securitisation funds), and ECB Opinion CON/2004/3
of 4 February 2004 at the request of the Ministry of Finance of the
Grand Duchy of Luxembourg on a draft law on securitisation.
EFMLG Report on legal obstacles to cross-border 106
securitisations, 7 May 2007, available on the EFMLG group’s
website at www.efmlg.org.

63ECB
Financial integration in Europe
April 2008
2 SPEC IAL FEATURES
principles to ensure a high level of transparency,
effi ciency and legal certainty with regard to
securitisation transactions. As an alternative
to full harmonisation, the EFMLG suggests
that EU legislation, dealing with certain legal
aspects of securitisation, could incorporate those
principles. In line with these recommendations,
the Commission stated in its White Paper of
December 2007 that it envisages the creation
of an expert group on securitisation in 2008
with a view to developing an appropriate policy
response to these challenges. The ECB supports
the Commission’s intention to set up such an
expert group.
Market-led initiatives can complement and, in
some cases, even substitute public regulation.
Agreements amongst various stakeholders
can lead to effi cient standards and business
practices.
In this regard, the publication of market
statistics at a European level and the publication
of reporting guidelines in 2006 by the European
Securitisation Forum (ESF) have improved
the availability of information. The minimum
common standards for covered bonds agreed
by the ECBC (see footnote 103) can equally be
seen as a preliminary step towards defi ning the
European covered bond universe.
However, there is scope for further
improvements in market disclosure and in
secondary market liquidity, as also underscored
by the recent market turmoil (see Box 1). More
harmonisation in the fi elds of information
disclosure on the collateral pool would help the
market to develop, as it would support investors
in making their assessments. The elaboration
of some additional standards on the underlying
collateral could also facilitate the creation of
cross-border pools. The lack of liquidity during
the recent turmoil, especially in the RMBS
market and, to a lesser extent, also in the covered
bond market, was probably aggravated by the
market diversity, which should be addressed to
make the market more attractive to investors. In
particular, the ECB considers further discussion
on the “benchmark approach” to the integration
of European covered bond markets useful
and stands ready to facilitate such a debate
(see Box 2).
In its recent White Paper, the European
Commission announced its intention to further
examine, in cooperation with the securitisation
industry, whether further measures to improve
transparency are necessary from the perspective
of the end investors. The ECOFIN conclusions
of October 2007 also raised the issues of
transparency and valuation of structured fi nancial
instruments such as RMBSs. This would be an
excellent opportunity for the industry to engage
in a discussion about the required level of detail
of the data, the cross-country standardisation of
the underlying defi nitions and the storage and
access modalities. In view of its competence
in the fi eld of European fi nancial statistics, for
which common defi nitions are also essential,
the ECB is prepared to provide support and
assistance to such work. Of course, reaching an
adequate level of transparency would be a highly
challenging goal and may only be realised in the
long term.
Whatever solution is eventually agreed upon,
the confi dentiality of the personal data of
individual borrowers should be respected, in
accordance with the European Data Protection
Directive107, either by obtaining the borrower’s
consent to a wider dissemination of his data or
by using appropriate statistical techniques to
protect data on the borrowers and the location of
their property.
Directive 95/46/EC (OJ 281, 23 November 1995, p. 31).107

64ECB
Financial integration in Europe
April 2008
Box 1
PROBLEMS IN THE AVAILABILITY OF EUROPEAN DATA ON MORTGAGE LOAN PERFORMANCE IN RMBSS
As the recent crisis in the United States sub-prime mortgage market has shown, the credit quality
and pricing of RMBSs critically depends on the performance of the underlying mortgage loans
used as collateral. Because securitisation markets developed piecemeal across Europe, the
quality, consistency and level of detail of the data on the underlying mortgages that are available
to investors in RMBSs vary considerably across countries and could be substantially improved.
Without aggregate statistics and a suffi ciently detailed disclosure of borrower characteristics
and the performance of the loans over time, investors cannot accurately assess their credit and
prepayment risks.1 Although, in the past, investors in the triple-A rated tranches normally relied
exclusively on rating agencies to monitor credit risk, this is likely to change in the future in the
light of the recent turmoil. While the lack of information on mortgage loan prepayments was
problematic also before the turmoil, even for triple-A investors, the uncertainty regarding the
valuation of RMBSs has now increased, reducing their secondary market liquidity.
In the United States, the availability and consistency of the relevant data is considerably higher
than in Europe, in particular for the so-called “private label” RMBSs, i.e. RMBSs which are
not guaranteed by government-sponsored enterprises. For these transactions, commercial data
providers have comprehensive loan-level underwriting data and performance histories for all
active and historical mortgage loans. Furthermore, despite the lack of a legal requirement, issuers
have reported this information to the data providers for many years. These data include detailed,
anonymised information on individual loans and borrowers, such as the type and location of
the property, the interest rate charged, and the borrower’s income and profession. With such a
large pool of data, investors and market analysts can carry out analyses and simulations of the
likely performance of the mortgage loans that back the RMBS. At the same time, it should be
recognised that this extensive data availability in the United States did not prevent the crisis in
sub-prime RMBSs, although it would probably have been more diffi cult to value such products
without them.
In Europe, the relatively low level of disclosure may be due to the smaller size of the market
and its relatively late emergence, legal constraints, such as data protection and banking secrecy
rules, and less willingness among lenders to share data with their competitors. The main source
of information on European RMBSs is the prospectus, which is the document that acts as
the legal basis for selling the bonds to investors. In the prospectus, issuers typically provide
some aggregate statistics on the characteristics of the underlying pool of mortgages, such as
the proportion of certain borrower types or the share of mortgages with different loan-to-value
ratios. Furthermore, issuers do not systematically update investors on the performance of these
mortgage loans. Although several data providers collect data on mortgage loan performance
from European issuers, a large part of the market is not captured and data are mostly aggregated
over all mortgage loans in the pool. Furthermore, the structure of the data is often inconsistent,
not only among issuers in different countries, but even between issuers in the same country.
Issuers use different defi nitions as to what constitutes a “prime” or a “sub-prime” borrower, how
to calculate loan-to-value ratios or when a loan becomes delinquent or is in default.
1 Credit risk results from defaults on the underlying mortgage loans. Prepayment risk results from the fact that the principal of the RMBS
is repaid when the underlying mortgages are repaid; thus it is not possible for the investor to know in advance when the bonds will
mature. If a bond matures earlier than expected (and in the meantime interest rates have decreased), investors will have earned a lower
return than they expected when purchasing the bonds.

65ECB
Financial integration in Europe
April 2008
2 SPEC IAL FEATURES
Box 2
IMPROVING COVERED BOND LIQUIDITY – THE BENCHMARK CONCEPT
The current diversity in European covered bond market is not optimal from a social welfare
point of view. In a recent study, the Bank for International Settlements stated that there is only a
weak correlation between the broad structure of the legislative frameworks on which bonds are
based and their spreads.1 This would suggest that integration has already been achieved.
However, the study did not include developments that occurred during the recent market
turmoil, when signifi cant widening in spreads between covered bonds from different
legal frameworks as well as a sharp decline in secondary market liquidity were observed.
Market participants attributed this widening in spreads to differences in legal frameworks,
underlying cover pools, country risk restrictions and other secondary market features; lack
of suffi cient information also seems to have played an important role in the drying up of
liquidity. This would indicate that there is still a case for harmonisation in the European
covered bond markets.
Harmonisation does not necessarily imply adaptation of existing covered bond frameworks.
Instead, it could consist of a market initiative leading to the defi nition of a “benchmark” concept
in the covered bond market. This “benchmark” would not replace any of the existing frameworks,
but co-exist and complete with them. The concept of benchmark implies that the security would
fulfi l criteria that have been established in terms of safety, transparency, liquidity, simplicity
and price availability. The concept would have to be established by cooperation between the
various stakeholders in the covered bond market such as issuers, investors, dealers and, possibly,
regulators.
1 F. Packer, R. Stever and C. Upper (2007), “The covered bond market”, Special Feature, BIS Quarterly Review, September,
pp. 43-55.
The fi rst market-based initiative, led by the European Securitisation Forum (ESF), to improve
the availability, consistency and quality of the data, was launched even before the turmoil.
The initiative was aimed at data improvements both at the time of the sale and over the
lifetime of the transaction, but not yet at a loan-by-loan level. Recently the ESF launched a
second initiative, encouraging issuers to disclose loan-by-loan data, although so far only for a
specialised, “non-conforming” segment of the UK RMBS market (this comprises, for example,
mortgages where the borrower certifi es his own income, or where the house is purchased
solely for rental purposes). At this stage, it is not clear to what extent the issuers will adopt
these voluntary guidelines.
The lack of high quality and consistent data also contributes to the continued fragmentation of
securitisation markets in Europe. First, it acts as an obstacle to issuers who want to assemble a
multi-jurisdictional portfolio of mortgage loans with similar fi nancial profi les and characteristics.
Second, it increases the costs to investors of entering a new market, as understanding the various
national defi nitions and data sources requires signifi cant resources. As a consequence of these
drawbacks, mortgage loans are ultimately likely to become more expensive.

66ECB
Financial integration in Europe
April 2008
5 CONCLUSIONS
Mortgage markets are an important part of the
euro area’s fi nancial system, with the provision
of mortgage loans being key retail fi nance
services. At the same time, both the lending
and funding markets continue to be fragmented
and diverse across countries. Further integration
would give economic agents access to a wider
set of products, allowing them to share risk
more effi ciently. This would be benefi cial for
economic growth.
Some of the obstacles to further integration,
like language diversity and different consumer
preferences, are natural barriers that are very
diffi cult to remove. However, obstacles that are
of a legal, economic or institutional nature can,
and should, be addressed by market participants,
with the help of policy-markers when necessary.
In that respect, the Eurosystem welcomes the
various actions that the European Commission
has taken over the past years, including the
setting out of its policy vision in its recent
White Paper. At the same time, and in view of
the seriousness of the existing barriers, it has to
be recognised that the full integration of these
markets is a process that will take many years
and will largely depend on market forces.
The Eurosystem strongly supports further
integration in mortgage markets. More
integration would lead to a euro area-wide
availability of a broad range of mortgage
products, which would affect the transmission
of monetary policy impulses and contribute
to a more stable fi nancial system as a result
of improved risk diversifi cation. However,
the process may equally entail certain risks,
such as the possibility of greater asset price
volatility, an increased vulnerability of
domestic fi nancial systems to external shocks
and excessive competition that results in an
erosion of credit standards. Further integration
should therefore proceed in a balanced way,
duly recognising these risks. The positive
effects will depend, inter alia, on the extent to
which the integration process results in a more
homogenous distribution of mortgage products
across countries.
While there may be scope for some targeted
legislative action to foster the integration
process in mortgage markets, the Eurosystem
takes the view that signifi cant progress can
mostly be achieved by the actions of market
participants. Possible areas are the improvement
in transparency and statistics, the promotion of
standardised mortgage products across countries,
provided that such standardisation does not
hamper competition and product innovation,
and the development of market benchmarks.
Within the scope of its responsibilities, the ECB
stands ready to support and assist such market
initiatives.
The existence of a covered bond benchmark might attract new investors who cannot afford to
investigate the differences in all covered bond frameworks and, therefore, currently refrain from
investing into this sector. Further research and an open debate with the various stakeholders on
their vision of the future European covered bond market and the impact of the “benchmark”
approach on the integration of European covered bond markets would be helpful in assessing more
precisely the potential benefi ts of the concept as well as the ease of its practical implementation.

67ECB
Financial integration in Europe
April 2008
2 SPEC IAL FEATURES
D. INTEGRATION OF LARGE-VALUE PAYMENT
AND SECURITIES TRANSACTIONS: TARGET2,
TARGET2-SECURITIES AND CCBM2
Integrated money and capital markets need to be supported by a well-functioning and integrated market infrastructure. This Special Feature examines how Eurosystem facilities in the fi eld of payment and settlement systems are contributing to progress in this area. Taken together, the recently established TARGET2 platform and the envisaged TARGET2-Securities (T2S) and Collateral Central Bank Management (CCBM2) facilities, once implemented, will establish an integrated euro area market infrastructure for euro-denominated payments, securities settlement, liquidity and collateral management with the highest standards of effi ciency and safety. The corresponding benefi ts for the fi nancial integration process are expected to be substantial.
1 INTRODUCTION
In carrying out its statutory task of promoting
the smooth operation of payment systems, the
Eurosystem has the mandate to provide facilities
and make regulations to ensure effi cient and
sound clearing and payment systems.108 This
operational role is complementary to the
Eurosystem’s oversight and catalytic functions
in this area. Although the main purpose of the
provision of payment and settlement facilities is
the pursuit of the Eurosystem’s central banking
tasks, the Eurosystem also pays close attention
to ensuring that, to the extent possible, the
specifi cations of such services are conducive to
supporting the fi nancial integration process. A
fully integrated market infrastructure would
ensure that all potential market participants are
subject to a single set of rules, have equal market
access and are treated equally.109
The objective of this Special Feature is to
review the progress made and envisaged in the
integration of the market infrastructure via the
provision of Eurosystem facilities, in particular
in relation to the handling of payments and
securities transactions and collateral operations.
A well-functioning infrastructure of an
integrated (collateralised and non-collateralised)
money market and capital market provides
the participants with, among other things, the
possibility of integrated liquidity and collateral
management. Ideally, market participants should
be able to benefi t inter alia from (i) a single
settlement platform for payments and securities
settlement in central bank money; (ii) a single
pool of collateral; (iii) a single access point
for information on relevant liquidity positions
in cash, securities and collateral; and (iv) full
integration and interoperability of all relevant
market facilities.
The Eurosystem’s endeavours to further the
integration of market infrastructures should
be seen in the context of a wide range of
complementary actions being undertaken by
various stakeholders. The Eurosystem actively
supports the efforts of the European Commission
and the banking industry to achieve enhanced
integration in the area of post-trading services.
In particular, MiFID, the Code of Conduct on
clearing and settlement, and the work on the
removal of the “Giovannini barriers”110, taken
together, are expected to support signifi cant
progress in this fi eld inter alia by fostering a
regulatory level playing-fi eld and increasing
competition among service providers. These
three measures are fully complementary to the
Eurosystem initiatives in this fi eld, notably the
T2S project and the ESCB-CESR111 work (see
Chart 45).
This Special Feature is structured as follows: In
order to provide an overview of the evolutionary
process of developing an integrated core
See Article 22 of the Protocol on the Statute of the European 108
System of Central Banks and of the European Central Bank.
See the ECB’s defi nition of fi nancial integration, as set out in 109
the preface to this report.
The Giovannini barriers refer to 15 key barriers to cross-border 110
clearing and settlement, stemming from differences in market
practices, legal, regulatory and fi scal provisions which were
identifi ed by the Giovannini Group in 2001. The Giovannini
Group, which was chaired by Alberto Giovannini and composed
of private sector experts, was an advisory group to the European
Commission which was specifi cally mandated to work on
clearing and settlement issues.
Committee of European Securities Regulators. See Chapter III 111
for further information on ESCB-CESR work.

68ECB
Financial integration in Europe
April 2008
market infrastructure for the euro area, Section
2 reviews the situation in the euro area before
the introduction of the euro. Section 3 then
examines the achievements brought about by
the introduction of the Eurosystem facilities
for large-value payments, TARGET, and the
CCBM for the handling of cross-border collateral
deliveries for Eurosystem credit operations.
Section 4 examines the Eurosystem’s reasons for
introducing a second-generation payment system,
TARGET2, and describes the signifi cant benefi ts
of the new facility, notably in terms of enabling
a more integrated liquidity management. Section
5 discusses the weaknesses still prevailing in
collateral handling and post-trading services for
securities and explains how these shortcomings
will be addressed by the CCBM2 and T2S
projects. Section 6 concludes on the combined
benefi ts of TARGET2, T2S and CCBM2 for the
establishment of an integrated, well-functioning
core euro area market infrastructure and the
fi nancial integration process more broadly.
2 THE EURO AREA MARKET INFRASTRUCTURE
BEFORE MONETARY UNION
During the run-up to the euro, each country
of the prospective currency area had its own
currency, central bank, monetary policy,
money markets and national payment and
settlement infrastructure. The individual market
infrastructures typically consisted of one or two
payment systems and one or more CSDs. While
national markets worked well, cross-border
activities were hampered by the lack of common
market infrastructures as well as by currency
borders. The 1989 Second Banking Coordination
Directive had introduced the “single passport”
and “remote access”, facilitating competition in
national markets through the entrance of foreign
participants. However, setting up and running a
business in a foreign country proved complex
and costly, requiring a strong business case, and
therefore often remained limited to a few large
institutions.
Since only a limited number of institutions
had the necessary resources to work at a
multinational level, most cross-border activities
were undertaken with the help of different types
of agents: correspondent banks, custodians,
etc. Cross-border payments were mainly made
through correspondent banking arrangements,
and foreign securities transactions were settled
by custodians. Participation in different national
markets required the maintenance of credit lines
and/or separate liquidity and collateral pools
for each currency or market. In sum, it was
very complex and costly to operate actively at a
European level.
Against this background, the predecessor of the
ECB, the European Monetary Institute (EMI),
concluded that the market infrastructure
available would not be able to suffi ciently
support the single ECB monetary policy and the
euro money market. Thus, it was decided that
the EMI and the NCBs of the then 15 EU
Member States would set up facilities for the
settlement of large-value euro payments in
central bank money and for the cross-border
delivery of collateral in Eurosystem credit
operations. These facilities were to become
known as TARGET112 and the Correspondent
Central Banking Model (CCBM).
Trans-European Automated Real-time Gross settlement Express 112
Transfer system.
Chart 45 Eurosystem contribution to market infrastructure development and related initiatives
MiFID
Code ofconduct
ESCB-CESR
Removal ofGiovannini
barriers
Securities markets integration
Eurosystem services
Source: ECB.

69ECB
Financial integration in Europe
April 2008
2 SPEC IAL FEATURES
3 A FIRST GENERATION OF EURO AREA-WIDE
INFRASTRUCTURES PROVIDED BY THE
EUROSYSTEM: TARGET AND CCBM
TARGET – FEATURES AND ACHIEVEMENTS
TARGET, the RTGS system for the euro, went
live in January 1999 with the introduction of the
euro. The initial design of TARGET was based
on the principle of minimum harmonisation and
on a decentralised architecture, linking together
the different RTGS infrastructures that existed
at the national level.
TARGET serves all euro area countries.
Moreover, since TARGET is also available in
some non-euro area EU countries, the central
banks of which have joined TARGET on a
voluntary basis, the benefi ts of the system
also spill over to those countries. Therefore,
TARGET plays an important role in facilitating
the wider process of European fi nancial
integration.
Since its launch, TARGET has formed a
benchmark for processing euro payments
in terms of speed, reliability, opening times
and service level, and has contributed to the
integration of euro area fi nancial markets by
providing its users with an area-wide payments
settlement infrastructure.
TARGET is mainly intended for the
processing of large-value and time-critical
interbank payments denominated in euro.
More than 50% of all TARGET payments
are submitted as customer payments that
require urgent execution. The high volume
of commercial payments is welcomed from
the system owner point of view. Payments
that are directly related to monetary policy
operations and involve the Eurosystem are
settled via TARGET. Cross-border and large-
value net settlement systems operating in
euro also settle their end-of-day balances via
TARGET, as is the case for the majority of
retail payment systems and (the cash leg of)
securities settlement systems. TARGET is
thus the backbone infrastructure for the fi nal
settlement of the large majority of payment and
securities transfer systems operating in euro.
The open access to TARGET ensures that, in
principle, all credit institutions can have direct
access to a common set of settlement facilities
in central bank money without having to rely
on commercial competitors, offering a variety
of services with different conditions. The
rapid integration of euro area money markets
in January 1999 was greatly facilitated by the
settlement services offered by, and the smooth
operation of, TARGET.
Minimum reserves (subject to averaging)
held with the Eurosystem can be used in full
on an intraday basis for payment purposes
in TARGET. In addition, intraday credit is
available free of interest, in line with the
Eurosystem operational framework, and is
only capped by the availability of adequate
collateral. There is a large pool of eligible
assets for use as collateral both in Eurosystem
intraday credit and monetary policy operations.
Further fl exibility is provided by collateral
substitution. This approach ensures easy
access to central bank liquidity for all credit
institutions.
Chart 46 Turnover in selected large-value payment systems
(average daily value; EUR billions)
0
500
1,000
1,500
2,000
2,500
0
500
1,000
1,500
2,000
2,500
CLS
TARGET (EU)
Fedwire (US)
CHIPS (US)
BoJ-Net (JP)
CHAPS (UK)
EURO1 (EU)
1999 2000 2001 2002 2003 2004 2005 2006
Sources: Bank of Japan, CHIPS, CLS Services Ltd., EBA Clearing, ECB, Federal Reserve Board.

70ECB
Financial integration in Europe
April 2008
Since its launch, the payment traffi c in TARGET
has grown by around 10% every year, both in
terms of value and the number of payments.113
THE CCBM – FEATURES AND ACHIEVEMENTS
According to the Statute of the ESCB, all
Eurosystem credit operations have to be
collateralised by eligible assets. Moreover, the
Eurosystem’s operational framework stipulates
that counterparties can only obtain credit from
the NCB in the country in which they are
located, and that any Eurosystem counterparty
should be able to use any eligible assets issued
in any euro area country as collateral. Thus, in
the absence of an adequate market arrangement
that could serve the purpose of cross-border
mobilisation of collateral, a specifi c mechanism
had to be established to enable the cross-border
use of collateral, regardless of the location of
the asset or the counterparty.
Against this background, the Eurosystem
introduced the CCBM in 1999 in parallel
with TARGET. At the time that the CCBM
arrangement was established the European
securities market infrastructures were highly
segmented and the network of links between
SSSs in particular was considered incomplete.
The CCBM was initially designed as an interim
solution, with the expectation that market
solutions would develop over time throughout
the euro area.
Through the CCBM counterparties obtain
credit from their “home central bank” based on
collateral provided to another Eurosystem central
bank (the “correspondent central bank”). The
correspondent central bank holds the collateral
on behalf of the home central bank. In the
current framework for the delivery of collateral,
the CCBM provides for a common cross-border
procedure, while national collateral delivery
procedures continue to be non-harmonised.
CCBM provides collateral delivery services for
Eurosystem credit operations, but not for other
market activities.
The CCBM has proven to be a success. There
has been a constant increase in the cross-border
use of assets (see Chart 48).114 At the end of
1999 around 80% of the collateral put forward
For fi gures concerning TARGET, see Chapter III113 . Data used for the chart were taken as a snapshot at the end of 114
each month.
Chart 47 The current framework for the delivery of collateral
Custodian
Custodian
SSS A
NCB B
SSS B
NCB A
NCB A
CounterpartyA
Step D2: Transfer instructionStep D3: Delivery
of collateral
Step D3: Matching
Step D4: Confirmation
Step D1: Requestfor credit
Step D5:Release credit
Step CB1:Request for credit
Step CB6:Release credit
Step CB2:CCBM message
Step CB5:Receipt
Step CB3:Matching
Step CB4:Confirmation
Step CB2: Transfer instruction Step CB3:Delivery of collateral
National/domestic procedures
Cross-border procedure (minimum harmonisation)
Source: ECB.

71ECB
Financial integration in Europe
April 2008
2 SPEC IAL FEATURES
by counterparties for Eurosystem credit
operations was delivered at the domestic level
(i.e. the assets used as collateral and the
counterparty using these assets were located in
the same country), whereas only 20% was
delivered cross-border. Eight years later, the
latter fi gure has increased to slightly over
50%.115 This trend corroborates not only the
growing integration of the euro banking and
fi nancial markets but also the key role the
CCBM played, and continues to play, in this
process.
The CCBM aims only at complementing
market-based solutions and does not present
any obstacles to their development. However,
although the use of links between SSSs has
continuously increased during the past eight years,
these links play a secondary role when compared
to the CCBM. During 2006 some 79% of cross-
border operations were channelled via the
CCBM, while the share of collateral transferred
via links amounted to 21%.
THE INTERPLAY OF THE WHOLESALE
INFRASTRUCTURE
Both TARGET and CCBM have made a
substantial contribution to the successful
introduction of the euro and the subsequent
smooth functioning of the euro fi nancial system.
They represent historical milestones in, and
unique examples of, the creation of a common
market infrastructure for a group of countries
and their fi nancial communities united by a
single currency.
TARGET has provided the integrated
infrastructure required by the integrated non-
collateralised market. The CCBM in turn
has provided an invaluable contribution to
the functioning of the Eurosystem collateral
framework and has strongly supported the
delivery of collateral to the Eurosystem for
both intraday credit and monetary policy
operation purposes. It has also allowed for
further portfolio diversifi cation in enabling the
use of any eligible asset as collateral with any
Eurosystem component.
4 THE FIRST STEP TOWARDS A
SECOND-GENERATION MARKET
INFRASTRUCTURE: TARGET2
OBJECTIVES OF TARGET2
In response to the growing demand from fi nancial
institutions for more advanced and harmonised
payment and settlement services across Europe,
the Eurosystem decided in October 2002 to start
the development of a new and enhanced version
of TARGET, TARGET2, and thus to move from
a “system of systems” to a single shared platform
(SSP) system.116 In legal terms, TARGET2
remains a decentralised system as each central
bank retains full responsibility for the business
relations with its participants. In order to avoid
level playing fi eld concerns, and in line with the
principle of full functional harmonisation, the
rules of the different TARGET2 legal systems
are harmonised to the greatest possible extent.
Although the market segment for large-value
and urgent euro payments has already reached
a high level of streamlining and consolidation,
It is important to note that the observed trend from the use of 115
domestic collateral towards cross-border collateral was broken
in July 2007, when the fi nancial market turmoil began to affect
the euro area.
The platform is operated by the Deutsche Bundesbank, the 116
Banque de France and the Banca d’Italia.
Chart 48 Evolution in the value of collateral transferred by the counterparties for Eurosystem credit operations
(EUR billions)
0
100
200
300
400
500
600
700
800
0
100
200
300
400
500
600
700
800
domestic
CCBM
links
1999 2000 2001 2002 2003 2004 2005 2006 2007
Source: ECB.
72ECB
Financial integration in Europe
April 2008
TARGET2 introduces an even more uniform
wholesale payment infrastructure by means
of the single technical platform. TARGET2 is
also expected to further improve the degree of
integration of wholesale payments by providing
its participants with a harmonised service level,
a single price structure that applies to both
domestic and cross-border transactions, and a
harmonised set of cash settlement services in
central bank money for all other systems settling
their balances in TARGET.
MIGRATION TO TARGET2
On 19 November 2007 TARGET2 was
successfully launched with the connection of the
fi rst migration group which comprised the NCBs
and the respective national user communities in
Austria, Cyprus, Germany, Latvia, Lithuania,
Luxemburg, Malta and Slovenia. Immediately
afterwards some ancillary systems moved their
settlement to TARGET2. The second group of
countries (Belgium, Ireland, Spain, France, the
Netherlands, Portugal and Finland) migrated
to TARGET2 on 18 February 2008. The third
and fi nal group (Denmark, Estonia, the ECB,
Greece, Italy and Poland) will migrate on
19 May 2008.
HOW TARGET2 WILL FACILITATE INTEGRATION
One of the major benefi ts of TARGET2 will be
to allow banks to further integrate their liquidity
management.
Bank treasury managers have a strong interest
in more automated processes to optimise
payment and liquidity management. They
need appropriate tools to track activity across
accounts, and to make accurate intraday and
overnight funding decisions preferably from
a single location, e.g. the head offi ce. In the
TARGET environment multi-country users
had to maintain a large number of technical
communication interfaces with TARGET, but
TARGET2 processes all payments on a single
technical platform. TARGET2 users have equal
access, via the information and control module,
to comprehensive online information and easy-
to-use liquidity control features commensurate
with their business needs.
TARGET2 participants have the possibility
to control the use of the available liquidity by
means of a reservation and limit system which
can be combined according to individual needs.
They may reserve liquidity for urgent and
highly urgent payments as well as dedicate
liquidity for the settlement of ancillary systems.
Furthermore, participants are able to defi ne
bilateral and multilateral sender limits and to
actively manage their payment queues (e.g. by
changing the priority or the order of queued
transactions). Owing to the increased time
criticality of payments, the submission of timed
transactions, such as those needed in the context
of the Continuous Linked Settlement (CLS)
system, has been made possible.
Furthermore, banking groups are in a position
to use a liquidity pooling functionality to view
or use the liquidity of all accounts belonging to
the various entities in the group.117 Liquidity
pooling is achieved by grouping a number of
accounts. Within a group of accounts, group
pricing applies, meaning that a transaction fee
based on a sliding scale applies to all payments
of the group as if they were sent from one
account. In addition, TARGET2 brings benefi ts
to its users in terms of consolidated account
information. Whereas in the past it was not
possible for an institution’s head offi ce to see
the information on balances being held across
its various branches in different countries, with
TARGET2 it can automatically monitor and
process all of its data from a centralised
location.
To a very large extent, ancillary systems have
access to any account in TARGET2 via a
standardised interface. This allows TARGET2
participants to settle balances stemming from
This is, however, only true for participants who have access 117
to intraday credit (i.e. the service is not available to remote
participants or to participants located in non-euro area
countries).

73ECB
Financial integration in Europe
April 2008
2 SPEC IAL FEATURES
any ancillary system (settling in TARGET2) in
which they participate in one RTGS account.118
The trend among the users of wholesale payment
services points towards the centralisation
of business operations. In principle, the
centralisation of payment business is expected
to provide these users with benefi ts stemming
from economies of scale, possible effi ciency
gains in speed and quality, and a better ability
to cope with a rapidly evolving payment market
environment.
The new functionalities of TARGET2 enable
its users, in particular the multi-country ones, to
make advances in the consolidation of internal
functions such as treasury and back offi ce
functions, and to better integrate their euro
liquidity management.
5 INTEGRATING LARGE-VALUE PAYMENTS,
SECURITIES SETTLEMENT AND COLLATERAL
HANDLING: CCBM2 AND T2S
THE SECOND-GENERATION EUROSYSTEM
COLLATERAL MANAGEMENT FACILITY
Within the CCBM the Eurosystem’s
counterparties have to deal with different
communication interfaces and procedures, since
not all the NCBs have implemented the same
level of automation, the same communication
protocol or exactly the same operational rules to
process counterparty instructions. Against this
background market participants have expressed
concerns related to (i) the non-homogeneous
degree of automation across central banks,
(ii) the differences between domestic and cross-
border procedures, and (iii) the resulting lack
of standardisation which prevents in particular
multi-country players from having a centralised
collateral management.
The identifi ed drawbacks led the Governing
Council of the ECB to decide in March 2007
to review the current Eurosystem collateral
management handling procedures and to create
a new collateral management system for the
Eurosystem, called CCBM2. The usage of
CCBM2 is intended to be optional for the
Eurosystem central banks and will thus operate
in parallel to CCBM. Therefore, CCBM2 will be
designed in a modular way, in order to allow for
fl exible use by those central banks wishing to
abandon their old system in favour of CCBM2.
CCBM2 will substantially increase the effi ciency
of the collateral management of Eurosystem
central banks. It will fi rst and foremost provide
a harmonised level of service, thus facilitating
interaction between the Eurosystem central
banks and their counterparties. In terms of
scope, CCBM2 goes beyond the current CCBM
arrangement. While the CCBM was built for
the cross-border use of collateral only, CCBM2
will provide a single set of uniform procedures
both on a domestic and on a cross-border basis.
However, like CCBM, it is only envisaged for
use in Eurosystem credit operations.
CCBM2 will handle all eligible assets. It
will consequently cater to securities and also
incorporate a function facilitating the use
of credit claims as collateral. Furthermore,
CCBM2 will support the two currently used
collateralisation techniques (pledge/pooling
and repo/earmarking) and will be able to accept
collateral through all eligible SSSs and the
eligible linkages between them and collateral
management services. As a result it will offer a
single and standardised collateral management
system, covering all necessary functions needed
to release central bank money on a real-time
basis to all Eurosystem counterparties.
CCBM2 will enable NCBs to rationalise their
internal collateral processes while preserving
the decentralised nature of NCBs’ relations with
counterparties, i.e. regarding the contractual
relationship, accounting and access to credit. It
will be based on existing central bank collateral
While there are currently some 66 ancillary systems, each 118
of which used to settle in its own way, TARGET2 offers six
generic procedures for settlement (two real-time procedures
and four batch procedures), thus resulting in a substantial
harmonisation of settlement practices.

74ECB
Financial integration in Europe
April 2008
management systems, such as that of the
Nationale Bank van België/Banque Nationale
de Belgique and De Nederlandsche Bank. Users
will benefi t in particular from the fact that they
will have a single communication tool with
the Eurosystem, with standardised interfaces
and messages. CCBM2 will therefore be in
full compliance with the initiatives undertaken
to remove Giovannini Barrier One, which are
aimed at the harmonisation of communication
protocols by 2011. CCBM2 will also be fully
compatible with TARGET2 and T2S, in
particular with the envisaged communication
interface and settlement procedures of T2S for
the delivery of securities and the already existing
TARGET2 interface for payments.
While CCBM2 is fi rst and foremost a collateral
management facility for the Eurosystem (a
“single Eurosystem back-offi ce”), it will at the
same time bring new opportunities for
Eurosystem counterparties to reduce back-offi ce
complexity and cost and to optimise their
collateral and liquidity management with the
Eurosystem. By harmonising procedures related
to the Eurosystem credit and collateral
management, it will also create a level playing
fi eld. In order to ensure that CCBM2 is fully in
line with the needs of counterparties, the
Eurosystem is developing this new facility in
close cooperation with market participants.119
COMPLETING THE CIRCLE: INTEGRATED
SECURITIES SETTLEMENT IN CENTRAL BANK
MONEY
Two trends describe developments in the
European securities settlement infrastructure
over the past decade. On the one hand, there
has been considerable progress in integrating
settlement systems at the national level, resulting
in improved effi ciency. In most EU countries,
there is now just one settlement platform for all
types of securities. On the other hand, however,
ineffi ciencies resulting from fragmentation and
lack of harmonisation make the processes of
cross-border securities settlement signifi cantly
more complex and costly than domestic
settlement.
Cross-border company mergers have resulted in
CSDs being brought under common ownership
in some countries. These mergers have the
For more information on the CCBM2 project, see http://www.119
ecb.europa.eu/paym/coll/coll/ccbm2/html/index.en.html.
Chart 49 CCBM2 – Single procedure for domestic and cross-border use of collateral
Custodian
Custodian
SSS A
NCB B
SSS B
NCB ACounterparty A
Step D2: Transfer instructionStep D3: Delivery
of collateral
Step D3:Matching
Step D4:Confirmation
Step D1/CB1:Request for credit
Step D5/CB5:Release credit
Step CB3:Matching
Step CB4:Confirmation
Step CB2: Transfer instruction Step CB3:Delivery of collateral
CCBM2
Single procedure for domestic and cross-borderHarmonised procedure for counterparties
Source: ECB.

75ECB
Financial integration in Europe
April 2008
2 SPEC IAL FEATURES
objective of integrating settlement platforms, but
so far progress has been limited and slow. This
illustrates the diffi culties faced by independent
and competing organisations to effectively
coordinate solutions across multiple countries
involving many different participants. Thus,
nine years after the introduction of the euro,
the euro area still lacks an effi cient, integrated
securities infrastructure that would support the
operation of a single fi nancial market. There
is widespread consensus that more needs to
be done to improve this situation at the cross-
border level.
A fi rst step in this regard has been taken with
the implementation of TARGET2. As set
out above TARGET2 will, for the fi rst time,
provide a single technical infrastructure that
enables market participants to pool their euro
liquidity across different countries. In addition,
TARGET2 offers a range of six standardised
procedures for the settlement of ancillary
systems, including securities settlement systems.
This will make it possible to bring together the
payments associated with securities settlement
across multiple CSDs. However, TARGET2
has no tool designed for the handling of
securities, and therefore does not provide for the
settlement of securities in central bank money
by means of simultaneous bookings in both cash
and securities accounts. Nor does TARGET2
improve the high degree of fragmentation of
the present securities infrastructure composed
of multiple securities settlement engines in the
various CSDs.
Against this background, T2S is the
Eurosystem’s proposal to facilitate integration
in the European post-trading settlement
infrastructure. The concept is currently being
discussed with the market; a fi nal decision is
expected to be taken by the Governing Council
in mid-2008. T2S will be a technical platform
for CSDs for the settlement of euro securities in
central bank money, thereby bringing together
securities and cash settlements within Europe on
an effi cient single platform. In particular, T2S
will, on a technical level, remove the differences
between conducting domestic and cross-
border settlement within Europe and will act
as a catalyst for the integration of the European
post-trading fi nancial sector. It will also foster
enhanced competition and harmonisation in
post-trading by providing equal and less costly
access to a common settlement service. Through
the single platform, economies of scale can be
fully exploited, while at the same time the safe
and smooth settlement of securities transactions
in central bank money is ensured. T2S will
not affect the ability of banks and CSDs to
offer securities settlement in commercial bank
money.
Since the problems of fragmentation and
ineffi ciency not only concern the euro area but
are relevant for the EU as a whole, and some
securities settlement systems serve both euro
area countries and other EU countries, T2S
will be designed in such a way that it can also
provide settlement in other EU currencies where
there is market demand for such a service and
provided that the relevant NCB is prepared to
enable settlement in its currency.
With a view to realising the maximum benefi ts
for the market, the Eurosystem will design the
T2S technical platform so as to fully exploit the
possible synergies with the TARGET2 system.
T2S will therefore draw on the existing technical
architecture designed for TARGET2, including
fully scalable system components and state-of-
the-art business continuity models. Moreover,
T2S will share a common communication
interface with TARGET2. Four NCBs (Banco
de España, Banque de France, Banca d’Italia and
the Deutsche Bundesbank) are ready to develop
and operate T2S on behalf of the Eurosystem.
The potential positive effects of T2S are
manifold and affect a wide range of users. In
addition to the benefi ts referred to above, they
include inter alia the following.
The settlement of cross-border securities
transactions will be as effi cient as domestic
settlement. All markets may operate in real
time under the same settlement engine, thus
allowing a faster reuse of securities and central
76ECB
Financial integration in Europe
April 2008
bank money. This will be achieved by bringing
together the securities accounts of multiple
CSDs (as well as the dedicated sub-cash
accounts of NCBs) on a single platform shared
with TARGET2. The bookings for the transfer
of securities between participants of different
CSDs can all be made simultaneously, together
with the cash movements. This eliminates the
current highly complex processes of interactions
between various platforms, which are costly and
often not synchronised, entailing delays and
posing a risk of failure to achieve settlement
fi nality (the shortcomings responsible for the
current unattractiveness of CSD links). T2S will
also automate the realignment process between
CSDs on a real-time basis without having to use
additional, often costly, procedures. A reduction
in the number of settlement engines will reduce
CSD infrastructure costs on the one hand and
the number of interfaces needed by market
participants on the other. This factor may be
expected to benefi t the back offi ce development
of both providers and users and decrease the
ongoing running costs.
Competition in post-trading will be fostered
by pooling all securities that settle in central
bank money in a single settlement platform
accessible via multiple CSDs. At the same time,
a decentralised structure will be maintained
with CSDs remaining responsible for managing
their legal and business relationships with
intermediaries, investors and issuers and for
handling corporate actions, including ensuring
their compliance with regulatory requirements
and providing custody and asset-servicing. T2S
will encourage CSDs to offer their participants
the opportunity, if they choose, to centralise
their securities holdings in one place. This
will depend on the readiness of CSDs to hold
securities issued in other CSDs, although it
should be noted that CSDs will have an incentive
to do so in order to improve their competitive
position.
T2S will propose the same pricing for domestic
and cross-border settlements. Signifi cant
economies of scale in T2S will provide the
potential for a substantial decrease in settlement
costs on average. This will be the case for cross-
CSD settlement in particular. Moreover, by de
facto introducing standardised euro area-wide
settlement, T2S will signifi cantly contribute to
the momentum for further harmonisation in the
fi nancial markets.
Issuers may potentially reach a much wider set
of participants while continuing to use the same
CSD they are using today (and with the presently
existing procedures under local legal and tax
regimes). This effectively makes the European
fi nancial market a domestic market. In addition,
it will increase the attractiveness of securities,
which are currently marginalised because of
their national nature, by making them available
throughout the European fi nancial market.
Users will have the possibility of choosing one
CSD as their preferred access point to T2S.
They will only need to maintain a single account
with a single CSD to settle any euro security
issued in Europe with any other user. This will
bring increased competition to current national
markets and allow for reduced interface costs.
At the same time, users will have the possibility
of pooling central bank money and securities in
a single platform, thus reducing liquidity and
collateral needs and lowering the corresponding
funding costs.
Investors will obtain cheaper access to non-local
securities, which today requires prohibitive
cross-border settlement procedures, and will
therefore benefi t from greater opportunities to
diversify their portfolio. In addition, institutional
investors are likely to benefi t from lower fees to
access different markets, since infrastructure
costs represents a signifi cant share of the fees
they pay to their custodians.
Finally, the Eurosystem and its counterparties
will also benefi t from T2S in terms of improved
collateral management. With cross-border
deliveries becoming as effi cient as domestic
ones, a new generation of collateral handling
procedures could be implemented. For example,
while CCBM2 will allow market participants to
have a single communication window with the
77ECB
Financial integration in Europe
April 2008
2 SPEC IAL FEATURES
Eurosystem collateral management service, T2S
will allow the CCBM2 platform to have a single
communication window with all CSDs in T2S
for the handling of collateral transactions.
T2S is a European project and is taken forward
by the Eurosystem acting in close cooperation
with market participants. Stakeholders are
strongly involved in defi ning the comprehensive
user requirements as part of the current T2S
governance structure. It is envisaged that T2S
will become operational by 2013.
6 CONCLUSIONS
While TARGET and the CCBM enabled euro
area-wide settlement in central bank money of
individual transactions and the cross-border
delivery of collateral to the Eurosystem, they
represented only fi rst-generation systems in the
sense that they did not allow market participants
to manage their cash, collateral and securities
positions in an integrated way.
Building on the new centralised technical
infrastructure of TARGET2, and drawing on
the experience gained in its development and
operation, the Eurosystem is currently working
to establish integrated solutions also in the fi elds
of securities settlement (T2S) and Eurosystem
collateral management (CCBM2), which are
intended to fully exploit the synergies with
TARGET2 and with each other. The new services
are complementary. While CCBM2 provides for
“a single Eurosystem back-offi ce” for eligible
assets (including credit claims), T2S provides
a single settlement platform for all securities
(including equities). The single interface to T2S
will replace the interfaces to all CSDs eligible in
Eurosystem collateral operations for CCBM2.
CCBM2 again supports auto-collateralisation
services in T2S. As a result, the settlement of
euro-denominated payments and securities
transactions in central bank money and the
management of euro-denominated collateral
are expected to become fully integrated. Thus,
TARGET2 has provided both the trigger and the
enabler of new European integration initiatives.
Besides the individual advantages of
TARGET2, T2S and CCBM2, the three
together are expected to provide for signifi cant
combined benefi ts. There will for the fi rst time
be an integrated, safe and effi cient core market
infrastructure providing harmonised services
for large-value payment, securities and
collateral transactions. Each type of service will
be offered on the basis of a single application
concept. This will allow economies of scale to
be exploited, thereby reducing costs and the
corresponding fees charged to participants.
Market participants will no longer need to
maintain separate liquidity and central bank
collateral pools for different national markets
and multiple communication interfaces for
settlement purposes. A key synergy gain will
be the ability of market participants to move
to a single communication window with the
Eurosystem. This communication window will
provide participants with real-time information
on their liquidity positions in all three services.
This will allow participants to integrate and
consolidate their treasury management and to
simplify and harmonise back-offi ce functions
and procedures. At the same time it will be
much easier for overseas investors to manage
their euro portfolio, thereby increasing the
attractiveness of European fi nancial markets.
Thus, with the three new services, it will
become possible to largely satisfy the conditions
for an integrated and well-functioning market
infrastructure as laid out in the introduction to this
article. Nevertheless, while the advancements
facilitated by the Eurosystem’s services are
very important, other interrelated public and
private sector initiatives must be pursued with
determination as well. For example, progress
in the harmonisation of other infrastructure
features and market practices by market
participants and the removal of legal and fi scal
barriers to integration is of utmost importance.
In this respect, the Eurosystem strongly supports
the work initiated by the European Commission.
More generally, a wide-ranging harmonisation
of the current market practices associated with
the use of the securities infrastructure is essential
to reap all potential benefi ts stemming from the

78ECB
Financial integration in Europe
April 2008
use of the single platforms for settlement and
collateral management.
Taken together, TARGET2, T2S and CCBM2,
once implemented, will represent a great step
forward in terms of the quality of euro area core
infrastructure services and fi nancial integration.
For the fi rst time, an integrated euro area market
infrastructure for euro-denominated payments,
securities settlement and liquidity and central
bank collateral management will be available,
allowing market participants, issuers and
investors to operate throughout the euro area
on a single interface basis. This will simplify
access to infrastructure services, permit better
management and control of transaction fl ows,
avoid the need to maintain multiple liquidity,
securities and central bank collateral pools,
lower operational cost and allow new business
opportunities to be exploited. The co-existence
of the three services will inevitably also impact
the other two components of the fi nancial system
– markets and institutions – which will operate
in a much more integrated way.

79ECB
Financial integration in Europe
April 2008
CHAPTER I I I
EUROSYSTEM ACTIVITIES FOR FINANCIAL
INTEGRATION
The Eurosystem generally distinguishes between four types of activity through which it contributes to the enhancement of fi nancial integration: (i) giving advice on the legislative and regulatory framework for the fi nancial system and direct rule-making; (ii) acting as a catalyst for private sector activities by facilitating collective action; (iii) enhancing knowledge, raising awareness and monitoring the state of European fi nancial integration; and (iv) providing central bank services that also foster European fi nancial integration. The following sections provide an overview of the Eurosystem’s contributions in these areas, focusing on the initiatives pursued during 2007.
1 LEGISLATIVE AND REGULATORY FRAMEWORK
FOR THE FINANCIAL SYSTEM
While the Eurosystem considers fi nancial
integration to be fi rst and foremost a market-
driven process, the legislative and regulatory
framework for the fi nancial system plays an
important facilitative role. With a view to
supporting the effi cient and effective conduct
of cross-border fi nancial activities, the EU
framework should be aimed at lowering legal or
regulatory impediments and at providing a level
playing fi eld.
Against this background and in line with their
advisory and regulatory functions,1 the ECB and
the Eurosystem monitor and actively contribute
to the development of the EU legislative and
regulatory framework.
More specifi cally, the ECB and the Eurosystem
provide input for strategic policy refl ections,
such as on the overall EU fi nancial services
policy strategy or the further development of
the EU institutional framework for fi nancial
regulation and supervision, for example via the
publication of common Eurosystem position
papers on the websites of the ECB and of
Eurosystem NCBs or informal contributions
to the discussions of the relevant regulatory
and supervisory committees. Furthermore, the
ECB and the Eurosystem provide both formal
opinions and informal input for the development
of new Community legislation in the area of
fi nancial services. They may also contribute to
the ex post technical evaluation of regulatory
measures.
During 2007 the respective activities of the ECB
and the Eurosystem related in particular to the
following issues.
EU ARRANGEMENTS FOR FINANCIAL REGULATION
AND SUPERVISION
The effective and effi cient functioning of the EU
regulatory and supervisory framework has been a
major EU fi nancial services policy issue in recent
years. The growing pace of fi nancial integration
and the rising prominence of cross-border
fi nancial groups, which are also increasingly
characterised by a high degree of functional
integration across borders and legal entities,
point to the need for enhanced cross-border
supervisory convergence and cooperation.
The importance of progress in this area
stems from two main considerations. First,
differences in prudential requirements and
approaches and overlapping policy measures
should be reduced as far as possible in order
to streamline the supervisory interface for
fi nancial institutions active on a cross-border
basis and to ensure a level playing fi eld across
the EU. Eventually, this convergence process
should establish a harmonised supervisory
setting in line with the single market objective.2
Second, information-sharing and coordination
between home and host authorities should be
The ECB is to be consulted, within its fi elds of competence, on 1
any Community act or any draft legislative provision proposed
by national authorities. Furthermore, the ECB has the right to
issue regulations in certain areas, for example in the fi elds of
payment systems and statistics.
According to the ECB’s defi nition of fi nancial integration set out 2
in the preface to this report a market for a given set of fi nancial
instruments or services is fully integrated if all potential market
participants in such a market are subject to a single set of rules,
have equal market access and are treated equally.

80ECB
Financial integration in Europe
April 2008
further strengthened to ensure that potential
fi nancial vulnerabilities in cross-border
fi nancial institutions are adequately monitored
and addressed.
In order to achieve the heightened degree of
supervisory convergence and cooperation,
improvements are required both at the regulatory
and the supervisory level. As regards the former,
prudential rules adopted at EU level should
foster the closer convergence of national rules
and provide an adequate regulatory framework
for enhanced home-host authority cooperation.
As regards the latter, supervisors should work
to achieve the consistent implementation of
the enhanced EU rules in closely convergent
supervisory requirements and day-to-day
practices.
The extension of the Lamfalussy framework3 for
fi nancial regulation and supervision to all
fi nancial sectors,4 coupled with improvements
in the regulatory framework for the interaction
between home and host authorities,5 were
designed to establish an appropriate institutional
framework to foster adequate progress in these
areas. In view of the signifi cance and the
innovative character of the enhanced EU
regulatory and supervisory framework, its
effective implementation and smooth
functioning have been closely monitored.
Building on some earlier assessments,6 a fi rst
full review of the Lamfalussy framework across
fi nancial sectors was carried by ECOFIN at its
meeting on 4 December 2007. In forming its
view, ECOFIN took into account the assessments
of various EU institutions and fora, such as
the Inter-Institutional Monitoring Group, the
Commission, the European Parliament and the
Lamfalussy level 3 committees. In addition, the
Eurosystem, which has actively supported the
establishment of the Lamfalussy approach from
the outset and has been closely involved in its
continuous monitoring,7 published a contribution
to the 2007 review of the Lamfalussy framework,
focusing on the banking sector.8
There is broad agreement among the various
EU bodies that the Lamfalussy framework
has signifi cantly increased the effi ciency
and effectiveness of fi nancial regulation and
supervision in the EU. At the same time, a
number of improvements seem warranted at
all levels of the Lamfalussy framework to
ensure that its full benefi ts are reaped in an
effective and timely manner. Key areas for
further enhancement include (i) increased
regulatory convergence, notably in connection
with a reduction in national options and
discretions in EU directives; (ii) strengthened
means for level 3 committees to fulfi l their
tasks in fostering supervisory convergence and
cooperation; and (iii) further improvements
With the objective of rendering the EU’s legislative decision-3
making process more effi cient and fl exible, and of ensuring
a more consistent regulatory and supervisory framework
across Member States, the Lamfalussy framework provides
for four levels of fi nancial services legislation. At level 1 the
basic principles of the legislation are laid down via the normal
legislative process. At level 2 implementing measures for level 1
legislation are adopted. This process benefi ts from the input of a
special regulatory committee comprising the relevant national and
European authorities. Level 3 encompasses initiatives by national
supervisors to ensure a consistent and timely implementation of
level 1 and level 2 measures at the national level; this process is
assisted by a committee of supervisors. Finally, level 4 relates to
Commission measures to strengthen the enforcement of EU law,
underpinned by enhanced cooperation between Member States,
their regulatory bodies and the private sector.
The directive extending the Lamfalussy committee structure 4
from the securities sector to the areas of banking, insurance
and investment funds (Directive 2005/1/EC) was adopted on
9 March 2005.
Several measures adopted under the FSAP have stepped up 5
the requirements for home-host authority cooperation, such
as Capital Requirements Directive (CRD), the Transparency
Directive, the Markets in Financial Instruments Directive,
the Market Abuse Directive, the Prospectus Directive and the
Financial Conglomerates Directive.
These included in particular the Report on Financial Supervision 6
of the Financial Services Committee (FSC) which was fi nalised
in February 2006 and endorsed by ECOFIN in May 2006; the
European Commission’s “White Paper on Financial Services
Policy 2005-2010”, published in December 2005; and the two
interim reports of the Inter-Institutional Monitoring Group
(IIMG), which were issued in March 2006 and January 2007
respectively. All of these assessments pointed to a number of
measures to improve the practical functioning of the Lamfalussy
process (see the 2007 ECB report “Financial Integration
in Europe”, pp. 39 ff., for further information on these
recommendations).
Previously, the Eurosystem provided contributions to the 7
preparation of the Commission’s White Paper and the FSC’s
Report on Financial Supervision.
“Review of the Lamfalussy framework. Eurosystem 8
contribution”, available at http:// www.ecb.europa.eu/ pub/pub/
prud/html/index.en.html

81ECB
Financial integration in Europe
April 2008
3 EUROSYSTEM
ACTIVITIES FOR
FINANCIAL
INTEGRATION
in the supervision of cross-border groups.
Moreover, the Eurosystem has emphasised
the need for effective information sharing
between supervisors and central banks, given
the important responsibilities of central banks
in ensuring the orderly functioning of money
markets, in promoting the smooth operation
of payment systems, and, more generally, in
helping to safeguard fi nancial stability.
ECOFIN is expected to review the progress made
in strengthening the Lamfalussy framework at
its informal meeting in April 2008.
EU FRAMEWORK FOR CROSS-BORDER M&AS
On 5 September 2007 Directive 2007/44/EC of
the European Parliament and of the Council as
regards procedural rules and evaluation criteria
for the prudential assessment of acquisitions and
increase of holdings in the fi nancial sector was
adopted.9
The main aim of the Directive is to specify
the prudential criteria to be considered by
supervisors when assessing the suitability of
a prospective qualifying shareholder in an EU
credit institution, securities fi rm or insurance
company, such as to ensure a consistent
implementation of the respective provisions
across Member States and to enhance the overall
transparency and effi ciency of the approval
process. It forms part of a wider strand of
work to enhance the fi scal, legal and prudential
framework for cross-border M&A operations in
the EU.10
The ECB contributed to the development of the
enhanced prudential framework via its formal
Opinion on the Commission’s original proposal
for the Directive.11
The amending Directive needs to be implemented
by EU Member States before 21 March 2009.
INTEGRATION OF EUROPEAN MORTGAGE MARKETS
The integration and development of European
mortgage markets is relevant for the ECB’s
major tasks that are related to the transmission
and implementation of the single monetary
policy and to its contribution to the safeguarding
of fi nancial stability. As the ECB fi nancial
integration indicators also show, there is further
room for enhancement of the integration of
European mortgage markets.12
The European Commission also stressed further
integration and development of European
mortgage markets as a key priority in its White
Paper on the EU fi nancial services policy during
the period 2005-2010. It developed its vision
for moving forward in this fi eld in a Green
Paper on mortgage credit in 2005.13 Following
up on a public consultation, the Commission
specifi ed its strategy in a White Paper14 issued in
December 2007.
The ECB continued its own analysis of the
further integration and development of European
mortgage markets during 2007 as well, also
liaising closely with the Commission. The
outcome of the ECB analysis is contained in C
Special Feature C in Chapter II of this report.
SECURITIES CLEARING AND SETTLEMENT SYSTEMS
Financial market integration needs to be
complemented and supported by the integration
of the underlying infrastructures for securities
transactions. While the European post-trading
market structure is evolving, it is still fragmented
and has not yet reached the level of effi ciency,
integration, and soundness that would be
Directive 2007/44/EC of the European Parliament and of the 9
Council of 5 September 2007 amending Council Directive
92/49/EEC and Directives 2002/83/EC, 2004/39/EC, 2005/68/
EC and 2006/48/EC as regards procedural rules and evaluation
criteria for the prudential assessment of acquisitions and increase
of holdings in the fi nancial sector (“the amending Directive”)
(OJ L 247, 21.9.2007, p.1).
The Special Feature on “Strengthening the EU framework 10
for cross-border banks” in the 2007 ECB report “Financial
Integration in Europe” provides an overview of the respective
policy initiatives.
CON/2006/60 of 18 December 2006.11
See Charts C32 to C34 in the annex. 12
“Green Paper on Mortgage Credit in the EU”, COM(2005) 327, 13
19 July 2005.
“White Paper on the Integration of EU Mortgage Credit 14
Markets”, COM(2007) 807, 18 December 2007.

82ECB
Financial integration in Europe
April 2008
compatible with the requirements of the Single
Market and the single currency.15
Among the public sector initiatives aimed at an
effi cient, safe and integrated post-trading market
infrastructure in the EU, the main contributions
of the Eurosystem in 2007 were to the Code
of Conduct for Clearing and Settlement, to the
removal of the Giovannini barriers, and to the
work on the ESCB-CESR standards.
The Code of Conduct for Clearing and Settlement, signed by the European industry
associations for exchanges and post-trading
infrastructures in November 2006, is an
initiative that will have a bearing on the entire
trading and post-trading infrastructure. The
Code is essentially aimed at allowing users to
choose freely their preferred service provider
at each layer of the transaction chain. To this
end, the Code provides for commitments
by the signatories within three areas: price
transparency, access and interoperability, and
service unbundling and accounting separation.
The price transparency commitments and
access and interoperability commitments
entered into effect in December 2006 and in
June 2007 respectively. The deadline for service
unbundling was January 2008.
The ECB participates in the Monitoring Group
for the Code (MOG), which organises regular
meetings with infrastructure providers and
representatives of the user community. The
MOG met four times in the course of 2007.
Overall, it concluded that signifi cant steps had
been taken by the industry to implement the
commitments.
As regards price transparency, good progress
has been made towards the majority of
the commitments (publication of prices,
services, discount and rebate schemes, billing
reconcilability). The “Conversion Table”
prepared by the European Central Securities
Depository Association (ECSDA) provides an
important tool for price comparison. However,
there is scope for further refi nement of the Table
to improve price transparency.
With regard to access and interoperability,
the MOG welcomed the “Access and
Interoperability Guideline” prepared by the
industry on the general principles of the Code.
Since the adoption of the Guideline in July there
has been signifi cant demand for links between
infrastructures. The MOG will continue the
close monitoring of progress in implementing
requests for links.
Finally, the Commission drafted Terms of
Reference specifying the details of the Code’s
external audit procedure. The next steps in 2008
will focus on analysing the possible extension
of the Code to other asset classes, such as fi xed
income securities and derivatives.
Establishing freedom of choice ultimately
requires, in addition to the Code, the full
removal of the existing barriers to the effi cient
clearing and settlement of securities. The
fi rst Giovannini Report of 2001 identifi ed
15 Giovannini barriers to integration in
EU post-trading systems. These relate to
technical standards and market practices, legal
uncertainty, and differences in tax procedures.
The second Giovannini report of 2004 set out
a strategy for removing these barriers. The
technical and market practice related barriers are
addressed within the context of the Clearing and
Settlement Advisory Monitoring Expert Group
(CESAME). The fi scal barriers are addressed by
the Fiscal Compliance expert group (FISCO),
while the Legal Certainty Group is working on
the legal barriers.
The ECB is closely involved in the work
aimed at removing the Giovannini barriers via
its participation in CESAME and the Legal
Certainty Group.
The Legal Certainty Group released its fi rst
advice paper in July 2006, concluding that
legislation would be needed in certain areas
to effectively dismantle legal barriers. Since
See H. Schmiedel and A. Schönenberger (2005), “Integration 15
of securities market infrastructures in the euro area”, ECB
Occasional Paper No. 33, July, and the discussion on the state of
integration in bond and equity markets in Chapter I.

83ECB
Financial integration in Europe
April 2008
3 EUROSYSTEM
ACTIVITIES FOR
FINANCIAL
INTEGRATION
then, the Group has set up three sub-groups
to investigate the need for legislation on book
entries on securities accounts, the differences in
national legal provisions affecting the processing
of corporate actions, and the restrictions on
an issuer’s ability to choose the location of its
securities.
In 2007, a number of market associations raised
concerns about the slow progress in removing
the Giovannini barriers related to differences in
fi scal procedures and national securities laws.
In these areas, new legislation will be needed
to effectively eliminate certain barriers. The
ECB shares these concerns and considers that
the swift removal of all Giovannini barriers will
also greatly benefi t the other public initiatives
for the further development and integration of
the European securities market infrastructure (in
particular the Code of Conduct and T2S).
Finally, in order to promote closer convergence
of national securities clearing and settlement
systems towards the highest standards of
safety and effi ciency, the ESCB and the CESR
have since 2001 worked together to develop
the ESCB-CESR standards for the EU SSSs.
A fi rst draft of the standards, which builds on
the CPSS-IOSCO recommendations for SSSs
and adapts them to the specifi c features of
the EU environment, was issued for public
consultation in September 2004. The standards,
once fi nalised, would complement the Code of
Conduct, given that the latter does not cover
prudential aspects and would therefore not
contribute to an enhanced regulatory level
playing fi eld. Furthermore, several of the
envisaged standards would support the objective
of the Code to achieve greater price transparency
and interoperability.
In November 2006, ECOFIN asked the European
Commission to review the effi ciency, integration
and safety of the European post-trade industry,
including reconsidering the standards. The
Commission has equally called for the
completion of the work on the standards.16 On
20 June 2007 Commissioner McCreevy advised
the CESR to conclude those standards applicable
only to international central securities
depositories (ICSDs) with a banking license and
CSDs and not to custodian banks. The scope of
the standards would then be identical to that of
the Code. The ECB concurs with the
Commission’s view and stands ready to
cooperate with the CESR in order to introduce
the necessary amendments for a timely
completion of this work.
EU LEGAL FRAMEWORK FOR PAYMENT SERVICES
In contrast to large-value payment systems,
retail payment systems in the EU have not
become substantially more integrated since
the introduction of the euro, due to differences
in legal requirements, technical standards and
commercial practices.17
With a view to addressing the legal obstacles to
the cross-border provision of payment services,
the European Parliament and Council adopted in
November 2007 a Directive on payment services
in the internal market.18 Member States must
transpose the Directive by 1 November 2009.
The ECB had issued its Opinion on the original
Commission proposal for the Directive in April
2006.19 It regards the adoption of the Payment
Services Directive as a decisive step towards
the realisation of SEPA. By providing the legal
basis for SEPA, the aim of the Payment Services
Directive is to ensure that payments within the
EU – in particular credit transfer, direct debit
and card payments – become as easy, effi cient,
See Commission Staff Working Document “Improving the 16
Effi ciency, Integration and Safety and Soundness of Cross-border
Post-trading Arrangements in Europe” of 25 July 2007, available
at http://ec.europa.eu/internal_market/fi nancial-markets/clearing/
communication_en.htm.
These barriers are, however, addressed by the banking system’s 17
initiative to create a Single Euro Payments Area (SEPA).
For further information, see the section on the ECB’s catalyst
function below.
Directive 2007/64/EC of the European Parliament and of the 18
Council of 13 November 2007 on payment services in the
internal market amending Directives 97/7/EC, 2002/65/EC,
2005/60/EC and 2006/48/EC and repealing Directive 97/5EC
(OJ L 319, 5.12.2007, pp. 1-36).
CON/2006/21 of 26 April 2006, available at http://www.ecb.19
int/ecb/legal/pdf/c_10920060509en00100030.pdf. (OJ C 109,
9.5.2006, p. 10).

84ECB
Financial integration in Europe
April 2008
and secure as domestic payments within a
Member State. The Payment Services Directive
will reinforce the rights and protection of all the
users of payment services.
STATISTICS ON INSTITUTIONAL INVESTORS
In addition to the statistics collected on MFIs,
the ECB also develops and compiles statistical
information on other fi nancial corporations,
focusing on investment funds, fi nancial vehicle
corporations (securitisation vehicles), insurance
corporations and pension funds. Given the growing
fi nancial role of institutional investors in the euro
area, improved statistics on these actors are not
only increasingly relevant from a monetary policy
perspective, but will also help the monitoring of
the fi nancial integration process.
On 27 July 2007 the Governing Council of the
ECB adopted Regulation ECB/2007/8
concerning statistics on the assets and liabilities
of investment funds. The Regulation was
published in the Offi cial Journal of the European
Union on 11 August 200720. It defi nes the
statistical standards for collecting and compiling
investment funds statistics in the euro area. As
set out in this Regulation, reporting will begin in
early 2009 with monthly and quarterly data for
December 2008.
Work is also currently underway to develop
harmonised statistics on the balance sheets
of securitisation vehicles (fi nancial vehicle
corporations). In addition, the ECB, together
with the NCBs, is currently implementing an
approach to produce euro area quarterly statistics
on insurance corporations and pension funds.
2 CATALYST FOR PRIVATE SECTOR ACTIVITIES
While public authorities have the responsibility
to provide an adequate framework conducive
to fi nancial integration, progress in European
fi nancial integration ultimately depends on
private sector initiatives making full use
of the cross-border business opportunities.
Competition among market players is a major
driving force in this regard. In addition, progress
made in the fi eld of fi nancial integration also
depends on effective collective action, notably
where heterogeneous market practices and
standards need to be overcome. However,
possible coordination problems may hamper
such cooperative approaches among market
participants. In such cases, public sector support
for private coordination efforts may help to
overcome possible diffi culties.
Given its institutional characteristics, the ECB
is particularly well placed to play an active role
as a catalyst for private sector activities in the
fi eld of European fi nancial integration. The ECB
is both a public authority with a pan-European
remit and, in its capacity as the central bank of
the euro area, an active market participant, with
the knowledge of and the business contacts in
the fi nancial markets.
Over the past few years, the ECB has acted as a
catalyst in many fi elds. For example, the ECB
calculates and provides the EONIA reference
rate for the unsecured money market, based on
the confi dential contributions from banks.
In 2007 the catalytic activities of the ECB and the
Eurosystem have focused mainly on the following
initiatives: the STEP initiative, the SEPA project,
the completion of the EFMLG report on legal
obstacles to cross-border securitisations in the
EU, and market transparency.
STEP INITIATIVE
The STEP initiative of the ACI and the EBF
seeks to promote the integration and development
of a pan-European short-term paper market
through the voluntary compliance of market
players with a core set of standards. These
standards are contained in the STEP Market
Convention, signed on 9 June 2006. The STEP
market is also accepted as a non-regulated
market for collateral purposes in Eurosystem
credit operations. In December 2007 the
outstanding amount of euro-denominated STEP
OJ L 211, 11.8.2007, p. 8.20

85ECB
Financial integration in Europe
April 2008
3 EUROSYSTEM
ACTIVITIES FOR
FINANCIAL
INTEGRATION
securities reached €320 billion in 69 STEP-
compliant programmes, the vast majority of
which were denominated in euro. Among the
issuers, some 40% were entities other than credit
institutions. Further information on STEP and
STEP-labelled programs can be found on the
STEP Market website.21
The ECB and the Eurosystem have supported
the STEP initiative since its inception in 2001,
by acting as a catalyst to facilitate coordination
among market players.22 During 2007 this
contribution focused on two main activities.
First, the ECB and nine NCBs of the Eurosystem
provide technical assistance to the STEP
Secretariat (formed by Euribor ACI and Euribor
EBF) concerning the STEP labelling process.
The ultimate responsibility for granting and
withdrawing the STEP label rests fully with the
STEP Secretariat. Second, the ECB regularly
produces statistics on yields and volumes in the
STEP market and publishes these fi gures on its
website. Since September 2006, the ECB has
been publishing monthly outstanding amounts of
STEP-labelled issues. As of 2 April 2007, daily
STEP yield statistics for STEP-labelled issues
from selected data providers are also published.23
The statistics cover annualised yields for euro-
denominated, STEP-labelled zero coupon issues,
referring to the primary market interest rates
individually and originally agreed between issuer
and investor for a short-term debt security with an
original maturity of up to one year. Yield statistics
are also published for STEP issues priced with a
spread against reference interest rates. The yield
statistics are published on the ECB’s website on
the fi rst business day of each week and contain
the data of each day of the previous week. Daily
statistics with all data providers are planned to be
released in the course of 2008.
SEPA INITIATIVE
The SEPA initiative, led by the European
Payments Council (EPC), is aimed at achieving
a fully integrated market for retail payment
services in the euro area with no distinction
between cross-border and national payments.24
SEPA will also enhance the automation of
payments throughout Europe, which should
result in substantial benefi ts for users.
Since its inception, the Eurosystem has played
a catalytic role with regard to the SEPA project.
The launch of the SEPA initiative in 2002
was itself inspired by the shared vision of the
Eurosystem and the European Commission to
reap the full benefi ts of a single currency via the
establishment of a fully integrated market for
cashless retail payments.25
Concerning activities undertaken during 2007,
on 20 July 2007 the Eurosystem published the
fi fth SEPA progress report.26 In this report, the
Governing Council of the ECB emphasised the
fact that continued efforts of fi nancial market
participants (such as banks, corporate entities,
public administrations, national banking
communities and merchants) were needed to
ensure the success of the SEPA. Complete
clarity on all features of SEPA, further card
standardisation, the establishment of at least
one additional European debit card scheme,
and the effective and timely accessibility of
banks were highlighted as key issues to address
remaining pressure points in the delivery of
SEPA. While greatly appreciating the work
of the European banking industry for SEPA,
managed by the EPC, the Eurosystem noted
that the project had entered a critical phase, as
its offi cial launch in January 2008 was only a
few months away.
To facilitate progress on the SEPA project,
the ECB organised a number of meetings with
different stakeholders, end-users, infrastructure
See at http://www.stepmarket.org. Statistics are available on 21
http://www.ecb.europa.eu/stats/money/step/html/index.en.html.
The Special Feature B in Chapter II of this report provides 22
detailed information on the STEP initiative and the catalytic role
of the ECB and the Eurosystem.
See the ECB’s website at http://www.ecb.europa.eu/ stats/23
money/step/.
It is noted that whereas the Payment Services Directive targets the 24
existing legal barriers to the cross-border provision of payment
services, the SEPA initiative is aimed at harmonising technical
standards and market practices to support those activities.
Detailed information about the activities of the Eurosystem in 25
this regard is provided at http://www.ecb.int/paym/pol/sepa/
html/index.en.html.
“SEPA: from concept to reality. Fifth progress report”, 20 July 2007.26

86ECB
Financial integration in Europe
April 2008
providers and with card schemes in 2007. The
ECB also participated as an observer in EPC
plenary meetings and in the working groups that
report to the EPC plenary.
Furthermore, throughout 2007 the Eurosystem
continued to provide assistance to the banking
industry regarding the design and preparation
of the new SEPA instruments and frameworks.
The Eurosystem contributed to the creation of
a common set of rules for SEPA credit transfer
and direct debit instruments, and assisted in the
development of different options for the basic
schemes.
In addition, the Eurosystem assisted the banking
industry on a range of horizontal issues related
to SEPA, especially relating to the required
aspects of standardisation and governance. The
Eurosystem also contributed to the preparations
for the implementation of SEPA schemes and
for the migration from national instruments
towards SEPA-compliant practices. The NCBs
have supported the establishment of national
migration plans, and those with an operational
role in retail payments will be involved in the
testing procedures of the different schemes.
All the SEPA migration plans of the euro
area communities are published on the ECB
website.
Finally, the ECB has also carried out, in
cooperation with the banking industry, a
SEPA impact study with the aim of enriching
its understanding of the potential economic
consequences of SEPA.27 The fi ndings of
the study confi rm the view that a dual SEPA
implementation phase (with the parallel use of
national and SEPA schemes) should be as short
as possible. In fact, a coexistence of both SEPA
and national instruments is expected to be costly
for banks, as confi rmed by the ECB study. The
study also shows that a rapid changeover to
SEPA-compliance will help reduce the costs
for banks and infrastructures and concludes that
those institutions that embrace new technological
developments, create new businesses and
provide innovative services are likely to gain
most from SEPA.
Since the end of January 2008, SEPA credit
transfers have become effective for a signifi cant
number of banks and infrastructures. At the same
time banks and infrastructures remain equally
free to continue the existing national schemes.
This means that customers will be offered
both old national and new SEPA instruments.
It is expected, however, that a critical mass of
payments will be made on the basis of SEPA
instruments by the end of 2010.
The SEPA credit transfer is the fi rst achievement
in SEPA, and further efforts need to be
undertaken to make SEPA a success. The SEPA
direct debit, in particular, should be rolled
out and the awareness of users needs to be
increased further. The Eurosystem suggested,
in particular, that more communication was
needed (towards main users such as corporates)
and that additional information on the national
SEPA migration plans should be provided to
facilitate the adoption of the new instruments.
Further clarity on the phasing-out of national
instruments was also needed.
In the next few years, the banking community
will continue the broadening and deepening of
SEPA and will fi nalise other building blocks of
SEPA, such as the standards for card payments
and standards for the messages between the
customers and their banks.
EFMLG REPORT ON LEGAL OBSTACLES TO
CROSS-BORDER SECURITISATIONS IN THE EU
In 2007 the ECB acted as a catalyst to facilitate
and support the activities of the EFMLG
working group on securitisation. On 7 May 2007
the EFMLG adopted a report on legal obstacles
to cross-border securitisations in the EU.28
See H. Schmiedel (2007), “The economic impact of the Single 27
Euro Payments Area”, ECB Occasional paper No. 71, August.
The report is available on the EFMLG group’s website at www.28
efmlg.org. See also Special Feature C in Chapter II of this report
for more information on the activities of the EFMLG. It should
be noted that the EFMLG report does not cover the securitisation
frameworks in the new Member States who joined the EU in
May 2004 and January 2007.
87ECB
Financial integration in Europe
April 2008
3 EUROSYSTEM
ACTIVITIES FOR
FINANCIAL
INTEGRATION
The report concludes that despite some
improvements, mainly at national level, the
legal frameworks for securitisation in the EU
remain diverse and fragmented, and that a
number of legal impediments continue to hinder
the development of pan-European securitisation.
At the same time, full harmonisation of
securitisation laws is deemed neither realistic
nor desirable. Instead, Member States should
adopt a suggested core set of common principles,
set out in the report, to ensure a high level of
transparency, effi ciency and legal certainty. It is
expected that effective progress in this fi eld will
require the support of legislative of action at EU
level, such as the adoption of a Directive dealing
with certain legal aspects of securitisation.
Since the publication of the report, the EFMLG
and the ECB have established contacts with the
Commission and market associations such as
the European Securitisation Forum to examine
the technical issues raised by the lack of legal
integration of securitisation markets.
These issues have become topical as the
securitisation market has received increasing
attention in the context of the fi nancial market
turmoil, as evidenced by the ECOFIN
conclusions of October 2007. The Commission,
as set out in its White Paper on the integration
of EU mortgage credit markets of
December 2007, considers that a range of
different policy options could eventually be
considered to address the issue of the different
and fragmented national securitisation
frameworks, such as a recommendation setting
out certain principles that Member States should
take into account in their securitisation laws, a
directive on securitisation, or the development
of an optional European regime. Given the scope
for enhancing the effi ciency of EU mortgage
funding markets, the Commission also states its
intention in the White Paper to continue its
analysis of the nature, causes and magnitude of
the problems identifi ed by both the Mortgage
Funding Expert Group29 and the EFMLG’s
reports. In doing so, the Commission will take
into account recent market developments, the
complexity and horizontal dimension of the
obstacles identifi ed by the expert groups, and
the wide-ranging implications for all
stakeholders.
The ECB supports the Commission’s intention to
create an expert working group on securitisation
in 2008, which would also constitute an
opportunity to draw lessons from the recent
market turmoil.
3 KNOWLEDGE ABOUT THE STATE OF
FINANCIAL INTEGRATION
A sound analysis of the economic benefi ts of
fi nancial integration and its development over
time forms a prerequisite for effectively targeted
action that can support further progress.
The ECB is in a unique position to provide in-
depth economic analysis and comprehensive
statistics regarding the state of fi nancial
integration in the euro area and its development.
In particular, the ECB is able to sponsor
coordinated analytical research – together
with other members of the Eurosystem and
academics – and can make use of its experience
and knowledge as an active market participant.
Enhancing knowledge and raising awareness
regarding the need for European fi nancial
integration, and measuring the progress achieved
in this regard, therefore form a major part of
the ECB’s contribution to fostering fi nancial
integration.
During 2007 the activities of the Eurosystem
with respect to enhancing knowledge, raising
awareness and monitoring the state of fi nancial
integration were mainly focused on the following
initiatives.
The Mortgage Funding Expert Group (MFEG) report 29
of December 2006 can be found at http://ec.europa.eu/
internal_market/finservices-retail/home-loans/integration_
en.htm#whitepaper.

88ECB
Financial integration in Europe
April 2008
INDICATORS OF FINANCIAL INTEGRATION IN THE
EURO AREA
Quantitative measures of fi nancial integration
provide essential tools for monitoring the
progress made in fi nancial integration. Since
September 2005 the ECB has published
quantitative indicators of integration in the euro
area fi nancial and banking markets.30 These
price- and quantity-based indicators cover the
money market, the government and corporate
bond markets, the equity market and the banking
markets. The latter include the cross-border
presence of euro area banks. Since fi nancial
infrastructures play a signifi cant role in the
ongoing process of fi nancial integration,
indicators on market infrastructures have been
allocated to the main fi nancial markets that they
serve.
The range of indicators is expected to be
extended on the basis of further advances in
research and economic analysis, together
with an improved availability of statistics,
especially with regard to non-bank fi nancial
institutions including investment funds,
securitisation vehicles, insurance corporations
and pension funds. All indicators are updated
and published semi-annually on the ECB
website.31
ASSESSING THE DEVELOPMENT OF THE FINANCIAL
SYSTEM
One important underlying motive of the ECB’s
interest in fostering fi nancial integration
is its expected positive implication for the
development of the fi nancial system, and the
resulting benefi ts in terms of increased potential
for economic growth. The ECB’s work on
fi nancial integration is therefore closely linked
to its wider analysis of factors supporting the
adequate functioning of fi nancial systems. On
this subject, the ECB published Occasional
Paper No. 72 “The role of fi nancial markets and
innovation in productivity and growth in Europe”
in September 2007 and a Monthly Bulletin
article entitled “Assessing the performance of
fi nancial systems” in October 2005. Special
Feature A in Chapter II of this report develops
further the work at the ECB in this important
area.
MONITORING DEVELOPMENTS IN CROSS-BORDER
BANKING
Since 2001 the ESCB’s Banking Supervision
Committee (BSC) has carried out a biennial
survey of the main characteristics of EU banking
groups with signifi cant cross-border activity. The
survey, which has so far been conducted for the
years 2001, 2003 and 2005,32 provides evidence
of the increasing internationalisation of EU
banking groups. While the number of banking
groups included in the survey has increased
only moderately (from 41 to 46) over time, the
consolidated assets of the sample as a whole
grew by 54% from 2001 to 2005, and its share
in consolidated EU banking assets increased
from around 54% to 68%. This indicates that
EU banking groups with signifi cant cross-border
activity hold a sizable – and rising – share of
total EU banking assets.
At the same time, closer ECB analysis of the data
has revealed that the intensity and geographical
scope of foreign activity varies considerably
among the banks included in the sample. During
2005, 16 out of the 46 banking groups included
in the survey held at least 25% of their EU assets
outside their home country and were present in
at least 25% (i.e. at least six) of the other 24
countries and could therefore be considered the
“key cross-border players” in the EU.33
See Chapter I, as well as the ECB reports on “Indicators of 30
fi nancial integration in the euro area”, September 2005 and 2006,
available on the ECB's website.
See http://www.ecb.int/stats/fi nint/html/index.en.html.31
The next BSC mapping exercise, which will produce fi gures for 32
the year 2007, will be carried out during 2008.
For further information on the BSC mapping exercise and the key 33
cross-border players, see “Review of the Lamfalussy framework.
Eurosystem contribution”, available at http:// www.ecb.europa.
eu/ pub/pub/prud/html/index.en.html, pp. 4-5.

89ECB
Financial integration in Europe
April 2008
3 EUROSYSTEM
ACTIVITIES FOR
FINANCIAL
INTEGRATION
ECB-CFS RESEARCH NETWORK ON CAPITAL
MARKETS AND FINANCIAL INTEGRATION IN
EUROPE
In April 2002 the ECB and the Center for
Financial Studies (CFS) in Frankfurt launched
the ECB-CFS Research Network to promote
research on “capital markets and fi nancial
integration in Europe”.34 The Research Network
is aimed at coordinating and stimulating top-
level and policy-relevant research that
signifi cantly contributes to the understanding of
the European fi nancial system and its
international linkages. European fi nancial
integration is one of the three main focal areas
in this regard.35
The Research Network has successfully
established itself as a highly dynamic network
of researchers working in various areas related to
fi nancial integration. The second phase of research
activity – lasting from 2005 to the Symposium
held in February 2008 in Frankfurt – focused on
three priority areas: (i) the relationship between
fi nancial integration and fi nancial stability;
(ii) EU accession, fi nancial development and
fi nancial integration; and (iii) fi nancial system
modernisation and economic growth in Europe.
After an in-depth discussion in July 2006, the
Steering Committee proposed the extension
of the work of the ECB-CFS Network by
another three years. To fi ll the remaining
gaps, the focus shall be on the following three
priority areas: (i) fi nancial systems as risk
managers and risk distributors; (ii) integration
and development of retail fi nancial services
and the promotion of innovative fi rms; and
(iii) fi nancial modernisation, governance and
the integration of the European fi nancial system
in global capital markets. The fi rst area assesses,
among other things, the effects of new fi nancial
instruments on economic effi ciency and policy.
The second area investigates, for example, why
venture capital fi nancing in many European
countries is relatively low and how to foster
more integration in these fi nancial markets. An
example of a topic covered by the last area is the
importance of global coordination of fi nancial
sector reforms among the major economies.
On 8-9 October 2007 the Research Network
organised the ninth conference, hosted by the
Central Bank and Financial Services Authority
of Ireland in Dublin. The topic of the conference
was “Asset Management, Private Equity Firms
and International Capital Flows: Their Role
for Financial Integration and Effi ciency”. On
13-14 February 2008 the ECB hosted the
Second Symposium of the Research Network,
which, as mentioned above, concluded the
second phase of the Network and featured
presentations related to the above-mentioned
priority areas.
Finally, the ECB-CFS Research Network also
awards fi ve “Lamfalussy Fellowships” every
year to promising young researchers whose
projects are related to fi nancial integration.
TRANSPARENCY REQUIREMENTS IN MARKETS
OTHER THAN EQUITIES
Article 65(1) of MiFID requires the European
Commission to submit a review to the European
Parliament on the possible extension of the
transparency provisions set out in the Directive
to cover fi nancial instruments other than
equities, and in particular to bond markets.
Since 2003 market practitioners and regulators
have been extensively debating the implications
of enhanced trading transparency for non-equity
fi nancial instruments, especially corporate
bonds. Beyond the general interest deriving
from the Treaty’s call for competitive markets,
the ECB has a particular interest in well-
functioning, effi cient and integrated European
fi nancial markets, as these can more effectively
contribute to the proper transmission of monetary
policy and help to stabilise the fi nancial system.
The current limited transparency of secondary
bond markets has direct practical implications
http://www.eu-fi nancial-system.org.34
In addition, the ECB-CFS Research Network studies fi nancial 35
system structures in Europe, and fi nancial linkages between the
euro area/EU, the United States and Japan.

90ECB
Financial integration in Europe
April 2008
for the implementation of monetary policy in
particular. Indeed, it affects pricing capability
and the accuracy of risk control measures that
are part of the collateral management function of
the Eurosystem. These valuation shortcomings
were particularly evident during the recent
market turmoil.
In order to increase knowledge on the issue, the
ECB made an assessment and consequently
explained its view at the public hearing on non-
equity market transparency held by the European
Commission on 11 September 2007. The ECB’s
analysis focused on post-trade transparency in
both retail and wholesale markets. In this regard,
the ECB proposed to address the current lack of
empirical evidence on the trade-off between
transparency and liquidity by means of a market-
led pilot project or a controlled experiment.36 In
such an experiment, post-trade transparency
could be gradually introduced into real corporate
bond markets, for instance by starting with the
most liquid market segment and checking
against a control set of similar bonds. The ECB
would support a market-led initiative committed
to carefully analysing the impact of higher post-
trade transparency on market liquidity and to
seeking an adequate transparency framework
for the whole market, without restricting it to
retail markets. If needed, a more active role for
the European Commission and the CESR could
be considered.
DIFFERENCES IN MFI INTEREST RATES ACROSS
EURO AREA COUNTRIES
Building on the main conclusions of the report
on differences in MFI interest rates across euro
area countries,37 the ECB organised a workshop
on 5 February 2007 entitled “Interest rates in
retail banking markets and monetary policy”
which focused on the reasons for differences
in the national retail banking interest rates that
underlie the euro area aggregate.38 A number
of important policy topics of relevance for the
conduct of monetary policy were presented,
including interest rate pass-through asymmetries
and the implications of sluggish and incomplete
pass-through. To varying degrees, MFI interest
rates display differences across countries.
The results discussed during the workshop
suggested that some of these differences
decline in signifi cance once adequate account
is taken of factors affecting the interest rates,
such as differences in competition, product
characteristics, and institutional features.
Since 2006 the Eurosystem releases monthly
tables, in which 15 types of average deposit and
lending interest rates in each country and the euro
area are presented for comparison.39 In addition,
the ECB’s Statistical Data Warehouse 40 and the
NCB websites feature information on altogether
45 instrument categories and breakdowns. By
making available detailed and comprehensive
information on average MFI interest rates, the
Eurosystem aims to ensure that comparisons
across countries are made on a well-informed
basis. A good conceptual framework for the
statistical measurement of retail banking interest
rates is essential in light of the key role of MFI
interest rates in the conduct of monetary policy.
At the ECB workshop, possible enhancements
to the statistical framework for the MFI interest
rate data collection were also discussed.
Consideration is currently being given to these
enhancements in the context of a possible update
of the ECB’s statistical regulations addressed
for MFIs.
PROVISION OF FINANCIAL MARKETS STATISTICS
Increasing transparency fosters integration, as
it facilitates the comparison of products across
the economic area. For this purpose, on 10
July 2007 the ECB published for the fi rst time
the nominal yield curves of AAA-rated euro-
The merits of this approach are also confi rmed in point 70 of 36
the report by the European Securities Market Experts (ESME)
on “Non-Equity Market Transparency”, June 2007. See
http://ec.europa.eu/internal_market/securities/esme/index_
en.htm#070711_2. The ECB participates in the ESME group as
an observer.
“Differences in MFI interest rates across euro area countries”, 37
September 2006, http://www.ecb.europa.eu/ press/pr/date/2006/
html/pr060920.en.html.
See the ECB's website at http://www.ecb.int/events/ conferences/38
html/mir.en.html.
See the ECB's website at http://www.ecb.europa.eu/stats/39
services/escb/html/index.en.html.
Accessible via the ECB’s website under http://sdw.ecb.europa.eu/.40

91ECB
Financial integration in Europe
April 2008
3 EUROSYSTEM
ACTIVITIES FOR
FINANCIAL
INTEGRATION
denominated euro area central government
bonds, with a residual maturity from three
months to 30 years. In addition, the ECB
releases daily yield curves covering all euro
area central government bonds and publishes
the spreads between both curves.41
A yield curve shows the relationship between
the market remuneration rate and the remaining
time to maturity of bonds with a similar risk
profi le at a certain moment in time. From an
ECB monetary policy perspective, the main
benefi t of the euro area yield curve is that it
provides a proper empirical representation of
the term structure of euro area interest rates,
which can be interpreted in terms of market
expectations on monetary policy, economic
activity and infl ation. Publishing a consistent
and comparable set of yield curves based on
euro-denominated central government bonds
also provides reference information for the
wider public and fi nancial market participants,
who previously had to rely on references to
bonds of individual issuers.
4 CENTRAL BANK SERVICES THAT FOSTER
INTEGRATION
The provision of central bank services is another
way in which the Eurosystem seeks to promote
fi nancial integration. Although the main purpose
of such services is the pursuit of the ECB’s
basic central banking tasks, the ECB pays close
attention to ensuring that such services, where
possible, are specifi ed in such a way that they
are also conducive to supporting the fi nancial
integration process.
During 2007 the Eurosystem focused its
activities in the area of central bank services
mainly on the following initiatives.
TARGET AND TARGET2
The rapid integration of the euro area money
markets has been closely related to the
establishment of the related payment system
infrastructure – i.e. TARGET, the RTGS
system for the euro that has been operational
since the fi rst day of Monetary Union.42 With
€2.3 trillion settled every day, TARGET is one
of the three largest wholesale payment systems
in the world, alongside Fedwire in the United
States and CLS, the international system for
settling foreign exchange transactions. Since its
inception, TARGET has formed a benchmark
for processing euro payments in terms of speed,
reliability and service levels, and has contributed
to the integration of fi nancial markets in Europe
by providing its users with a common payment
and settlement infrastructure.
In October 2002 the Eurosystem decided to
commence with the development of an enhanced
version of the TARGET system. It was envisaged
that TARGET2 would become a system that
(i) provides extensively harmonised services
via an integrated IT infrastructure, (ii) improves
cost-effi ciency and (iii) is prepared for swift
adaptation to future developments, including the
enlargement of the Eurosystem.43 During 2007
the Eurosystem fi nalised its preparation for the
launch of the new system. In June and October
the ECB published the fourth and fi fth progress
reports on TARGET2.44 The reports contained
information about the recent decisions of the
Governing Council on outstanding pricing and
fi nancial issues. The progress reports included
the fi nal version of the General Functional
Specifi cations. Like the third progress report
on TARGET2, the most recent progress report
provided information on legal issues, on recent
changes to the envisaged functionality of the
SSP, on testing and migration activities, and on
other ongoing issues of relevance to TARGET2.
It confi rmed that the fi nal stage of preparation of
TARGET2 was progressing as planned.
The yield curves and a description of the methodology used to 41
estimate them can be found on the ECB's website at http://www.
ecb.int/stats/money/yc/html/index.en.html.
See also Chapter I.42
See Special Feature D in Chapter II for further information 43
on the TARGET system and the subsequent development of
TARGET2.
See “Fourth progress report on TARGET2”, 22 June 2007, 44
available on the ECB's website at http://www.ecb. europa.eu/
press/pr/date/2007/html/pr070622.en.html, and “Fifth progress
report on TARGET2”, 29 October 2007, available at http://www.
ecb.europa.eu/pub/pdf/other/target2progressreport5en.pdf.

92ECB
Financial integration in Europe
April 2008
On 8 September 2007 the ECB Guideline of
26 April 2007 on TARGET2 (ECB/2007/2) and
the ECB Decision of 24 July 2007 concerning
the terms and conditions of TARGET2
(ECB/2007/7) were published in the Offi cial
Journal.45
The successful launch of the single technical
platform TARGET2 with the connection of
the fi rst group of countries on 19 November
2007, followed by the second group on
18 February 2008, introduced a harmonised
service level to ensure a level playing-fi eld for
banks across Europe. With the migration of the
third and last group of countries, scheduled for
19 May 2008, all central banks and TARGET
users will have migrated to TARGET2.
A single price structure applies to both domestic
and cross-border transactions. TARGET2 also
provides a harmonised set of cash settlement
services in central bank money for all kinds
of ancillary systems, such as retail payment
systems, money market systems, clearing houses
and SSSs. Moreover, the new functionalities
of TARGET2 enable cross-border banks to
consolidate their internal processes, such as
treasury and back offi ce functions, and to
more successfully integrate their euro liquidity
management. In addition, TARGET2 users
have uniform access to comprehensive online
information, as well as easy-to-use liquidity
control measures.
TARGET2-SECURITIES
With a view to maximising the benefi ts from the
establishment of TARGET2, the Eurosystem
started to explore the possibility of providing
settlement services in central bank money
for euro-denominated securities transactions
in 2006.
The objective of the T2S project is to harmonise
the settlement of securities against central bank
money, thereby concentrating securities and
cash settlements within Europe on an effi cient
single platform. T2S will ensure that there will
no longer be a difference between conducting
domestic and cross-border settlement within the
euro area, act as a catalyst for the integration
of the European post-trading fi nancial sector
and foster competition by providing an equal,
cheaper and harmonised access to settlement
services in the European fi nancial market. All the
other functions traditionally performed by CSDs
would remain their responsibility – i.e. managing
legal and commercial business relationships with
issuers, intermediaries and investors, handling
corporate actions and ensuring compliance with
regulatory requirements.46
After the Governing Council’s conclusion
on 8 March 2007 that the T2S project was
feasible, the remaining part of 2007 was largely
dedicated to detailing the comprehensive user
requirements. This work was performed with
full transparency and in cooperation with the
market, in particular with CSDs and market
participants. During this project phase the T2S
governance structure involved more than 188
persons from 77 organisations who actively
took part in the various public consultations,
mini-consultations and National User Group
meetings in order to ensure that all user needs
and concerns were adequately addressed in the
user requirements.
Furthermore, public authorities such as
ECOFIN, the European Parliament and the
European Commission support the initiative
and are regularly updated on developments. In
addition, any party outside the T2S governance
structure can follow the progress of the project
via the ECB website47 and provide input to the
user requirements through the various public
consultation processes established.
On 18 December 2007 the ECB opened the
T2S user requirements and the methodology
for the assessment of the economic impact of
T2S to public consultation. During the public
OJ L 237, 8.9.2007, pp. 1 and 71.45
For additional information on the T2S project see Special Feature 46
D in Chapter II.
See the “TARGET2-Securities progress report”, 26 October 2007, 47
available at http://www.ecb.europa.eu/ pub/pdf/other/t2s-progress-
report200710en.pdf.
93ECB
Financial integration in Europe
April 2008
3 EUROSYSTEM
ACTIVITIES FOR
FINANCIAL
INTEGRATION
consultation period, i.e. until 2 April 2008, the
Eurosystem intends to maintain close contact
with stakeholders. In parallel, a proposal for a
T2S governance structure for the next phase of
the project will be prepared and submitted to the
Governing Council for decision in spring 2008.
By May 2008 ECOFIN is expected to share its
views on the T2S project with the Eurosystem.
The Governing Council of the ECB will take
these into consideration prior to making a
decision, by the middle of 2008, on whether to
move to the next phase of the project.48
CORRESPONDENT CENTRAL BANKING MODEL
(CCBM)
The CCBM for the cross-border transfer of
collateral within the Eurosystem, established in
1999, is another Eurosystem service conducive
to fostering fi nancial integration.
Over time CCBM has become the major
channel for the cross-border use of collateral
for Eurosystem credit operations. Despite this
success, market participants have identifi ed
some drawbacks in this procedure which mainly
relate to the lack of standardisation of existing
procedures, both domestically and at a cross-
border level.
Against this background, the Governing Council
decided on 8 March 2007 to review the current
Eurosystem collateral management handling
procedures, in particular the CCBM. It has
decided to develop a single technical platform
– called CCBM2 – to enable the Eurosystem to
manage collateral for both domestic and cross-
border operations. CCBM2 will be based on
existing systems such as that of the Nationale
Bank van België/Banque Nationale de Belgique
and De Nederlandsche Bank. Work on the user
requirements for this new procedure is currently
being conducted in consultation with market
participants.49 A public consultation in this
regard was launched on 26 February 2008. Banco de España, Banque de France, Banca d’Italia and the 48
Deutsche Bundesbank have all stated that they are ready to
develop and operate T2S on behalf of the Eurosystem.
See Special Feature D in Chapter II for further information on 49
the CCBM2 project.


1ECB
Financial integration in Europe
April 2008 S
STAT IST ICAL ANNEX
MONEY MARKET INDICATORS
Price-based indicators
Chart C1: Cross-country standard deviation of average unsecured interbank lending rates
across euro area countries S4
Chart C2: Cross-country standard deviation of average interbank repo rates across euro
area countries S4
Quantity-based indicators
Chart C3: The degree of cross-border holdings of short-term debt securities issued by
euro area residents S5
Infrastructure indicators for large-value payment systems (LVPS)
Chart C4: The number of large-value payment systems (LVPS) in the euro area S6
Chart C5: TARGET: the share of payments between Member States in total payments
(in volume) S6
Chart C6: TARGET: the share of payments between Member States in total payments
(in value) S6
BOND MARKET INDICATORS
GOVERNMENT BOND MARKET
Price-based indicators
Chart C7: Evolution of beta coeffi cients for ten-year government bond yields S7
Chart C8: Average distance of intercept/beta from the values implied by complete
integration for ten-year government bond yields S8
Chart C9: Evolution of intercept and beta coeffi cients for ten-year government bond
yields, adjusted for sovereign risk S8
Chart C10: Variance ratio for ten-year euro area government bond yields S9
CORPORATE BOND MARKET
Price-based indicators
Chart C11: Proportion of cross-sectional variance explained by various factors S9
Chart C12: Estimated coeffi cients of country dummies S10
Chart C13: Cross-sectional dispersion of country parameters S10
Quantity-based indicators for government and corporate bond markets
Chart C14: Share of MFI cross-border holdings of debt securities issued by euro area and
EU non-MFIs: outstanding amounts by residency of the issuer S11
Chart C15: The degree of cross-border holdings of long-term debt securities issued by
euro area residents S11
Chart C16: Investment funds’ holdings of debt securities issued in other euro area
countries and the rest of the world S11
Infrastructure indicators
Chart C17: Total number of eligible links for Eurosystem credit operations in the euro area S12
STATISTICAL ANNEX

2ECB
Financial integration in Europe
April 2008S
Chart C18: Share of domestic and non-domestic direct participants in central securities
depositories (CSDs) S12
Chart C19: Origin of securities under custody S12
Chart C20: Share of domestic and cross-border collateral used for Eurosystem credit
operations S13
EQUITY MARKET INDICATORS
Price-based indicators
Chart C21: Filtered country and sector dispersions in euro area equity returns S13
Chart C22: Proportion of variance in local equity returns explained by euro area and US
shocks S14
Chart C23: Euro area and US shock spillover intensity S15
Quantity-based indicators
Chart C24: The degree of cross-border holdings of equity issued by euro area residents S15
Chart C25: Investment funds’ holdings of equity issued in other euro area countries and
the rest of the world S16
BANKING MARKET INDICATORS
Cross-border presence indicators
Chart C26: Dispersion of the number of euro area bank branches across euro area
countries S16
Chart C27: Dispersion of the number of euro area bank subsidiaries across euro area
countries S16
Chart C28: Dispersion of the total assets of euro area bank branches across euro area
countries S17
Chart C29: Dispersion of the total assets of euro area bank subsidiaries across euro area
countries S17
Chart C30: Euro area cross-border bank M&A activity S17
Price-based indicators
Chart C31: Cross-country standard deviation of MFI interest rates on loans to
non-fi nancial corporations S18
Chart C32: Cross-country standard deviation of MFI interest rates on loans to households S18
Chart C33: Intercept convergence for selected banking retail interest rates S19
Chart C34: Beta convergence for selected banking retail interest rates S19
Quantity-based indicators
Chart C35: Non-interbank deposits – percentage of business with other euro area countries
and EU Member States S20
Chart C36: MFI holdings of securities issued by MFIs: outstanding amounts by residency
of the issuer S20
Chart C37: MFI loans to non-MFIs: outstanding amounts by residency of the counterparty S20
Chart C38: MFI loans to MFIs: outstanding amounts by residency of the counterparty S20

3ECB
Financial integration in Europe
April 2008 S
STAT IST ICAL ANNEX
Corporate banking indicators
Chart C39: Cross-country dispersion of gross fees on bond issues charged to euro area
resident fi rms S21
Chart C40: Cross-country dispersion measures of gross fees on equity issues charged
to euro area resident fi rms S21
Chart C41: Euro area cross-country dispersion of spreads on syndicated loans charged
to euro area resident fi rms S21
Chart C42: Cross-country dispersion of fees on syndicated loans charged to euro area
resident fi rms S21
Infrastructure indicators for retail payment systems
Chart C43: Number of retail payment systems in the euro area S22
Chart C44: Number of automated clearing houses in the euro area S22

4ECB
Financial integration in Europe
April 2008S
MONEY MARKET INDICATORS
PRICE-BASED INDICATORS
Description
The EBF makes available (daily) business
frequency data for a panel of individual
institutions for both unsecured and secured
short-term interbank loans or deposits. These
data cover the EONIA and the EURIBOR
(unsecured lending) as well as the EUREPO for
different maturities.1 Data on the EONIA SWAP
INDEX can also be used.
For each dataset, the indicator is the unweighted
standard deviation (Dt ) of average daily interest
rates prevailing in each euro area country.
Reported rates are considered to be the national
rates of country c if the reporting bank is
located there. However, the counterparty of
the transaction is not known, and the reported
interest rate could thus potentially (in part) refer
to transactions with a bank outside country c.
The number of euro area countries (nt in the
formula below) refl ects the number of countries
that had adopted the euro in the reference
period:
Dt = ∑ (rc,t − rt) 2√ 1⎯nt c , (1)
where rc,t is the unweighted average of the
interest rate ri,tc reported by each of the mc panel
banks at time t in a given country c:
rc,t = ∑ ri,t1⎯mc i
c . (2)
The euro area average rt is calculated as the
unweighted average of the national average
interest rates rc,t.
The data are smoothed by calculating a
61 (business) day centred moving average of the
standard deviation, transformed into monthly
fi gures by taking the end-of-month observation
of the smoothed series.
For further information, see http://www.euribor.org/default.htm 1
and http://www.eurepo.org/. See also “The contribution of the
ECB and the Eurosystem to European fi nancial integration” in the
May 2006 issue of the ECB's Monthly Bulletin, p. 67.
Chart C1 Cross-country standard deviation of average unsecured interbank lending rates across euro area countries
(61-day moving average; basis points)
1994 1996 1998 2000 2002 2004 2006
overnight1-month maturity12-month maturity
0
50
100
150
200
250
300
0
50
100
150
200
250
300
0.0
0.5
1.0
1.5
2.0
2.5
3.0
3.5
4.0
4.5
5.0
0.0
0.5
1.0
1.5
2.0
2.5
3.0
3.5
4.0
4.5
5.0
1999 2000 2001 2002 2003 2004 2005 2006 2007
overnight
1-month maturity
12-month maturity
Sources: EBF, ECB calculations.
Chart C2 Cross-country standard deviation of average interbank repo rates across euro area countries
(61-day moving average; basis points)
0.0
0.5
1.0
1.5
2.0
2.5
0.0
0.5
1.0
1.5
2.0
2.5
2002 2003 2004 2005 2006 2007
1-month maturity
12-month maturity
Sources: EBF, ECB calculations.

5ECB
Financial integration in Europe
April 2008 SS
STAT IST ICAL ANNEX
For indicative series prices (EURIBOR,
EUREPO), the data are corrected for obvious
outliers.
The computed indicator has a monthly
frequency.
Additional information
The EONIA is the effective overnight reference
rate for the euro. The banks contributing to the
EONIA are the same as the EURIBOR panel
banks (composed of banks resident in the euro
area and in other EU Member States, as well as
some international banks).
The EURIBOR is the benchmark rate of the
large unsecured euro money market for
maturities longer than overnight that has
emerged since 1999.
The EUREPO is the benchmark rate of the
euro repo market, and has been published since
March 2002. It is the rate at which one prime
bank offers funds in euro to another prime bank
when the funds are secured by a repo transaction
using general collateral.
QUANTITY-BASED INDICATORS
Description
This indicator measures the degree of cross-
border allocation of short-term debt securities,
i.e. securities with an original maturity of up to
one year, between euro area Member States.
Intra-euro area is defi ned as the share of short-
term debt securities issued by euro area residents
and held by other euro area residents (excluding
central banks):
∑MKTi,t + ∑TOutstock i,t − ∑TInstock i,t
∑∑Outstock ij,ti j≠i
i i i
i, j ∈ {euro area countries} (3)
where Outstockij denotes the value of assets
issued by residents of euro area Member State i and held by residents of euro area Member State
j (i ≠ j); MKTi stands for market capitalisation in
country i; TOutstocki is the total foreign assets
held by country i; and TInstocki is the total
foreign liabilities of country i.
Extra-euro area is defi ned as the share of euro
area short-term debt securities held by non-
residents of the euro area (excluding central
banks). The measure takes the following form:
∑MKTr,t + ∑TOutstock r,t − ∑TInstock r,t
∑∑Outstock ir,ti r
r r r
i ∈ {euro area countries}r ∈ {rest of the world} (4)
where Outstockir denotes the value of assets
issued by residents of euro area Member State
i and held by non-residents of the euro area r
(rest of the world); MKTr stands for market
capitalisation in country r; TOutstockr is the total
foreign assets held by country r; and TInstockr is
the total foreign liabilities of country r.
The computed indicator has a yearly frequency.
Char t C3 The degree o f c ro s s -border ho ld ing s o f shor t - t e rm debt s e cur i t i e s i s sued by euro a rea r e s ident s
(percentages)
0
2
4
6
8
10
12
14
0
2
4
6
8
10
12
14
Intra-euro area Extra-euro area
2001
2002
2003
2004
2005
2006
Sources: BIS, IMF and ECB calculations.

6ECB
Financial integration in Europe
April 2008S
Additional information
The indicators are built on the basis of the
Coordinated Portfolio Investment Survey
(CPIS) of the IMF, which is conducted on
an annual basis and undertaken by national
statistics compilers. Short-term debt securities
encompass Treasury bills, commercial paper
and bankers’ acceptances that usually give the
holder the unconditional right to a fi xed sum of
money on a specifi ed date. These instruments
are usually traded on organised markets at a
discount and have an original term to maturity
of one year or less.
INFRASTRUCTURE INDICATORS FOR LARGE-VALUE
PAYMENT SYSTEMS (LVPS)
Description
This indicator counts the absolute number of
LVPSs in the euro area at the end of each year.
The indicator covers, for the whole series, the
Member States of the euro area that had adopted
the euro at the time to which the statistics relate.
The computed indicator has a yearly frequency.
Additional information
LVPSs, also known as wholesale systems, can
be defi ned as systems that generally process
payments of very large amounts. Such payments
are mainly exchanged between banks or
participants in the fi nancial markets and usually
require urgent and timely settlement.
Description
The fi rst indicator shows the share of the volume
of payments between euro area Member States
(inter-Member State payments) in the total
number of payments processed in the TARGET
system.
The second indicator shows the share of the
value of payments between euro area Member
States (inter-Member State payments) in
the total value of payments processed in the
TARGET system.
Both indicators have a half-yearly frequency.
Additional information
The TARGET system is the real-time gross
settlement (RTGS) system for the euro. A second-
generation system, operating on a single shared
Char t C4 The number o f l a rge -va lue payment sy s tems (LVPS ) i n the euro a rea
02468
101214161820
02468101214161820
1998 1999 2000 2001 2002 2003 2004 2005 2006 2007
Source: ECB.
Chart C5 TARGET: the share of payments between Member States in total payments
(in volume; percentages)
15
20
25
15
20
25
1999 2000 2001 2002 2003 2004 2005 2006 2007
Source: ECB.
Chart C6 TARGET: the share of payments between Member States in total payments
(in value; percentages)
101520253035404550
1999 2000 2001 2002 2003 2004 2005 2006 2007101520253035404550
Source: ECB.

7ECB
Financial integration in Europe
April 2008 SS
STAT IST ICAL ANNEX
platform and called TARGET2, was launched
on 19 November 2007 and will fully replace the
former, decentralised TARGET system by 19
May 2008.
A TARGET inter-Member State payment is
defi ned as a payment between counterparties who
maintain accounts with different central banks
participating in TARGET. An intra-Member
State payment is defi ned as a payment between
counterparties who maintain accounts with the
same central bank.
BOND MARKET INDICATORS
GOVERNMENT BOND MARKET
PRICE-BASED INDICATORS
Description
If bond markets are fully integrated and no
country-specifi c changes in perceived credit risk
occur, bond yields should only react to news
common to all markets. That is, bond yields of
individual countries should react exclusively to
common news, which is refl ected in a change
in the benchmark government bond yield. To
separate common from local infl uences, the
following regression is run:
∆Rc,t = αc,t
+ βc,t ∆Rger,t + εc,t (5)
where α denotes a country-varying and time-
varying intercept; β is a country-dependent
and time-dependent beta with respect to the
benchmark (German) bond yield; ΔR is the
change in the bond yield; and ε is a country-
specifi c shock.
The conditional betas are derived by estimating
the above regression using the fi rst 18 months
of monthly averages. Subsequently, the data
window is moved one month ahead and
the equation is re-estimated until the last
observation is reached. A time series for βc,t is
then obtained.
This model-based indicator has a monthly
frequency.
Additional information
The outcome of the econometric specifi cation
depends on the selection of the most appropriate
benchmark bond, in this case the ten-year German
government bond. In addition, one should not
expect common factors to be able to fully explain
changes in local bond yields, as “local news”
concerning credit and liquidity risks will continue
to have an impact on local yields.
Char t C7 Evo lu t i on o f be ta coe f f i c i en t s f o r t en -yea r government bond y i e ld s
-3.0
-2.0
-1.0
0.0
1.0
2.0
3.0
4.0
-3.0
-2.0
-1.0
0.0
1.0
2.0
3.0
4.0
1992 1994 1996 1998 2000 2002 2004 2006
Austria
Belgium
GreecePortugalFrance
Italy
The NetherlandsFinland
Ireland
Spain
Sources: Reuters and ECB calculations.

8ECB
Financial integration in Europe
April 2008S
Description
This indicator is derived using regression (5), as
for the previous indicator. From the individual
country regressions, the unweighted average
αc,t and βc,t values are calculated and measured
in proportion to the values implied by complete
market integration (0 and 1 respectively).
The analysis is based on monthly averages of
government bond yields.
The model-based indicator has a monthly
frequency.
Description
Sovereign risk is controlled for by proxying
it with rating dummies and by modifying
regression (5) as follows:
ΔRc,t = (αc,t + ∑αr,t Dc,t ) + ( βc,t + ∑ βr,t Dc,t )ΔRger,t
+ εc,tr r
r ∈ {AA + ,…, A} r ∈ {AA + ,…, A} (6)
where Dc,tr is a dummy for rating r and country
c, at time t.
A potential problem with this regression is that
coeffi cients are not identifi ed when there is not
suffi cient cross-sectional variation in the ratings.
To avoid this problem, the above regression was
estimated without fi xed effects, i.e.:
ΔRc,t = (αt + ∑αr,t Dc,t ) + ( βt
+ ∑ βr,t Dc,t )ΔRger,t + εc,tr r
r ∈ {AA + ,…, A} r ∈ {AA + ,…, A} (7)
Coeffi cients were made time-varying using a
rolling regression (18-month rolling window).
The coeffi cients (αt ,βt) now capture the average
country reactions to changes in the German
government bond yields, after controlling for
credit risk factors. In a situation of perfect
integration they should converge to 0 and 1
respectively (assuming no other variable besides
sovereign risk is affecting the change in yield).
Chart C8 Average distance of intercept/betafrom the values implied by complete integration for ten-year government bond yields
dispersion in intercept (left-hand scale)
dispersion in beta (right-hand scale)
0.00
0.05
0.10
0.15
0.20
0.25
1992 1994 1996 1998 2000 2002 2004 20060.00
0.20
0.40
0.60
0.80
1.00
1.20
1.40
0.000
0.002
0.004
0.006
0.008
0.010
0.012
0.014
0.016
0.018
0.00
0.20
0.40
0.60
0.80
1.00
1.20
1.40
2002 2003 2004 2005 2006 2007
Sources: Reuters and ECB calculations.
Chart C9 Evo lut ion o f intercept and beta coe f f i c i ents for ten-year government bond y ie lds , ad justed for sovere ign r i sk
(difference from perfect-integration values)
-0.20
-0.10
0.00
0.10
0.20
0.30
0.40
0.50
constantbeta
-0.20
-0.10
0.00
0.10
0.20
0.30
0.40
0.50
1994 1996 1998 2000 2002 2004 2006
Source: Reuters and ECB calculations.

9ECB
Financial integration in Europe
April 2008 SS
STAT IST ICAL ANNEX
The chart reports the estimation results for a
sample starting in the second half of 1994.
Description
This indicator measures the proportion of the
variance of local (country-specifi c) yields
that can be explained by the variance of the
benchmark (German) ten-year government
bond yields, i.e. the “variance ratio”. The
indicator is derived from the same 18-month
rolling regression as for indicators C7 and C8
(see equation (5) above). The total variance of
local yields is given by:
2Var(ΔRc,t) = βc,tVar(∆Rb,t) + Var(εc,t) (8)
and the variance ratio by:
∆Rc,tVarVRc,t =
2 βc,tVar ∆Rb,t
. (9)
Hence, a variance ratio close to one is obtained
when the beta approaches one and when the
volatilities of the local and the benchmark
bond yield changes are of a similar magnitude.
The analysis is based on monthly averages of
government bond yields.
The model-based indicator has a monthly
frequency.
CORPORATE BOND MARKET
PRICE-BASED INDICATORS
Description
This indicator is derived by estimating the
following equation using the ordinary least
squares (OLS) regression technique:
SPc,r (τ,t,zt) = αt + ∑γr,t CRi,t + ∑δs,t Si,t + φt zt + ∑ βc,t Ci,c,t + ei,ti r s i
r =1 K N 2
s =1 c =1 (10)
where SPc,ri (τ,t,zt) is the yield spread for
corporate bond i at time t issued in country c
with τ years to maturity, with credit rating r and
Char t C10 Var i ance ra t i o f o r t en -yea r euro a rea government bond y i e ld s
AustriaBelgiumFinlandFranceGreece
IrelandItalyThe NetherlandsPortugalSpain
20060
20
40
60
80
100
120
0
20
40
60
80
100
120
1992 1994 1996 1998 2000 2002 2004
65
70
75
80
85
90
95
100
105
65
70
75
80
85
90
95
100
105
2002 2003 2004 2005 2006 2007
Sources: Reuters and ECB calculations.
Chart C11 Proportion of cross-sectional variance explained by various factors
(percentages)
-100
102030405060
-100102030405060
1999 2000 2001 2002 2003 2004 2005 2006 2007
explained by regressionexplained by common, maturity, coupon,liquidity and industry effectsexplained by rating effectexplained by country effect
Sources: Merrill Lynch, Bloomberg and ECB calculations.

ECB
Financial integration in Europe
April 2008S 10S
set of instruments zt. α is an intercept common
to all corporate bonds, CRi,tr is a rating dummy
which takes a value of one when corporate bond
i belongs to rating category r at time t, and zero
otherwise, and Si,ts is a sector dummy which
takes a value of one for fi nancial corporations,
and zero for non-fi nancial corporations. The
parameter vector φ groups the sensitivities of
the various corporate bonds to the instruments
contained in zti, namely time to maturity,
liquidity, and coupon of the ith bond. As a proxy
of liquidity, we use the ratio of days that the bond
has been traded relative to the total number of
trading days within each time interval. Ci,c,t is a
country dummy that equals one when corporate
bond i belongs to country c at time t, and zero
otherwise.
The sample is composed of 2,339 individual bonds
incorporating euro-denominated investment-grade
bonds with a minimum issue size of €100 million.
Bonds rated below investment grade and asset-
backed bonds are excluded from the analysis. In
addition, bonds with less than one year to maturity
and bonds which were traded less than once per
week in a given four-week time interval are
excluded. All euro-denominated bonds not issued
in a euro area country are eliminated, as well as
data for countries that do not have at least ten
corporate bonds in each time interval. This results
in an analysis based on a sample of bonds issued
in seven countries: Austria, France, Germany,
Ireland, Italy, the Netherlands and Spain.
The indicator represents the six-month average
of the proportion of cross-sectional variance
that can be explained by the various components
(common, rating, sector, maturity, liquidity
coupon and country effects) over time.
Description
As a test for integration, it is tested whether the
country parameters βc,t in equation (10) are zero,
or at least converge towards zero.
Description
This indicator is derived by calculating the
average size of the estimated country dummies
derived from equation (10). An overall decrease
in the dispersion of the country effects would
be an indication of increasing integration in the
corporate bond market.
Char t C13 C ros s - s e c t i ona l d i spe r s i on o f count ry parameter s
0
2
4
6
8
10
0
2
4
6
8
10
1999 2000 2001 2002 2003 2004 2005 2006 2007
Sources: Merrill Lynch, Bloomberg and ECB calculations.
Char t C12 E s t imated coe f f i c i en t s o f count ry dummies
basis points
-10
-5
0
5
10
15
-10
-5
0
5
10
15
1999 2000 2001 2002 2003 2004 2005 2006 2007
AustriaGermany
Spain
France
Ireland
The Netherlands
Italy
Sources: Merrill Lynch, Bloomberg and ECB calculations.

S
STAT IST ICAL ANNEX
11ECB
Financial integration in Europe
April 2008 11S
STAT IST ICAL ANNEX
QUANTITY-BASED INDICATORS FOR GOVERNMENT
AND CORPORATE BOND MARKETS
Description
For this indicator, see the indicators on the
cross-border securities holdings of the banking
markets below.
Description
This indicator, which measures the degree of
cross-border holdings among euro area Member
States of long-term debt securities, i.e. debt
securities with an original maturity of more
than one year, is derived in the same way as the
similar indicator on the cross-border holdings of
short-term debt securities.
The indicator has an annual frequency.
Description
This indicator shows the share of investment
funds’ total holdings of all securities other
than shares issued by residents of the euro
area outside the Member States in which the
investment fund is located and by residents of
the rest of the world. The composition of the two
areas is the one prevailing during the reference
period.
The computed indicator has a quarterly
frequency.
Char t C15 The degree o f c ro s s -border ho ld ing s o f l ong - te rm debt s e cur i t i e s i s sued by euro a rea r e s ident s
(percentages)
0
10
20
30
40
50
60
70
0
10
20
30
40
50
60
70
Intra-euro area Extra-euro area
1997
2001
2002
2003
2004
2005
2006
Sources: BIS, IMF and ECB calculations.
Chart C16 Investment funds’ holdings of debt securities issued in other euro area countries and the rest of the world
(as a share of total holdings of debt securities; percentages)
0
5
10
15
20
25
30
35
40
45
50
0
5
10
15
20
25
30
35
40
45
50
1999 2000 2001 2002 2003 2004 2005 2006 2007
other euro area Member States
rest of the world
Source: ECB.
Chart C14 Share of MFI cross-border holdings of debt securities issued by euro area and EU non-MFIs: outstanding amounts by residency of the issuer
(as a share of total holdings; excluding the Eurosystem; percentages)
other euro area - government and corporate bonds
other euro area - corporate bonds
other euro area - government bonds
rest of EU - government and corporate bonds
1998 19991997 2000 2001 2002 2003 2004 2005 2006 2007
0
5
10
15
20
25
30
35
40
45
0
5
10
15
20
25
30
35
40
45
Sep. Mar. Sep. Mar. Sep. Mar. Sep. Mar. Sep. Mar. Sep. Mar. Sep. Mar. Sep. Mar. Sep. Mar. Sep. Mar. Sep.
Source: ECB.

ECB
Financial integration in Europe
April 2008S 12S
INFRASTRUCTURE INDICATORS
Description
This indicator counts the absolute number of
eligible links used between SSSs for Eurosystem
credit operations. The indicator refers to the
eligible links in operation at the end of each
year.
Additional information
To be eligible, links have to comply with
the ECB Standards for the use of EU SSSs
in Eurosystem credit operations. The fi gures
provided refl ect the outcome of the assessment
of links between SSSs carried out by the
Eurosystem at the request of an SSS. As from
2003, fi gures refer only to eligible links between
SSSs located in the euro area, as the ECB
Governing Council has decided that, since
1 July 2003, only securities issued and held in
an SSS located in the euro area are eligible for
Eurosystem credit operations.
Description
This indicator shows the ratio of direct non-
domestic participants to the total number of
direct participants. The number of direct
participants refl ects the number of direct account
holders in the case of indirect holding systems
and the number of account operators in the case
of direct holding systems.2 A domestic participant
is one located in the same country as the reporting
CSD. The indicator has an annual frequency.
In an indirect holding system, it is custodian banks or other CSDs 2
who hold accounts with the CSD, while individual customers
(e.g. private individuals) only hold accounts with custodian
banks, not directly with the CSD. In a direct system, any private
individual can hold an account with the CSD. However, the
accounts are operated by only a few companies, the account
operators.
Chart C17 Total number of eligible links for Eurosystem credit operations in the euro area
5959
47
64 66 63 595959
6243
62 59
0
10
20
30
40
50
60
70
0
10
20
30
40
50
60
70
1999 2000 2001 2002 2003 2004 2005 2006 2007
links between euro area SSSslinks from/to non euro area SSSs
Source: ECB.
Chart C18 Direct participants in central securities depositories (CSDs)
0102030405060708090
100
0102030405060708090100
20052006
CSDs ICSDs
Share of direct non-domestic participants
Source: ECB.
Chart C19 Origin of securities under custody
(percentages)
Share of cross-border custody transfer
10
05
15202530354045
10
05
15202530354045
CSDs ICSDs
20052006
Source: ECB.

S
STAT IST ICAL ANNEX
13ECB
Financial integration in Europe
April 2008 13S
STAT IST ICAL ANNEX
Description
This indicator measures the value of securities
transferred across borders to a CSD as a share
of the total value securities held on account with
the reporting CSD. The value of all securities
held on accounts with the reporting CSD covers
all securities issued or in safekeeping in the
reporting CSD, or transferred to the CSD.
The indicator has an annual frequency.
Additional information
Data for Euroclear Bank by source are not
available, so the fi gure does not include
Euroclear Bank.
These indicators represent integration
activities that can be observed at the euro
area level. However, when interpreting these
indicators, it should be borne in mind that
integration has occurred not only between
entities operating within the euro area, but
also at the EU level.
These indicators are based on information
published in the ECB Blue Book for the
respective years.
Description
This indicator measures the proportions of
eligible assets used domestically – i.e. within
the same country – and across national borders –
i.e. between euro area countries – to collateralise
Eurosystem credit operations. The indicator
aggregates the data reported monthly by
Eurosystem NCBs to the ECB on the domestic
use and cross-border use of collateral (composed
of both the CCBM and links data).
The computed indicator has an annual
frequency.
Additional information
In the current framework, counterparties
may transfer cross-border collateral to the
Eurosystem via two main channels: the CCBM,
which is provided by the Eurosystem; and the
links, which represent a market-led solution. The
CCBM remains the principal channel, although
the proportion of collateral transferred through
links has increased.
EQUITY MARKET INDICATORS
PRICE-BASED INDICATORS
Description
This indicator is derived by calculating the
cross-sectional dispersion in both sector and
Chart C21 Filtered country and sector dispersions in euro area equity returns
(percentages)
0.00
0.01
0.02
0.03
0.04
0.05
0.06
1976 1980 1984 1988 1992 1996 2000 2004 20080.00
0.01
0.02
0.03
0.04
0.05
0.06
country dispersion
sector dispersion
Sources: Thomson Financial Datastream and ECB calculations.
Chart C20 Share of domestic and cross-border collateral used for Eurosystem credit operations
(as a percentage of the total collateral provided to the Eurosystem)
51.5
27.7 35.4 40.8 45.3 50.2 48.5
49.954.759.264.672.3
0
20
40
60
80
100
0
20
40
60
80
100
2002 2003 2004 2005 2006 2007
domesticcross-border
Source: ECB.

ECB
Financial integration in Europe
April 2008S 14S
country index returns for the euro area
countries.3 Data are calculated on a weekly
basis from January 1973 onwards. They include
(reinvested) dividends and are denominated in
euro. The indicator has a monthly frequency.
The cross-sectional dispersions are fi ltered using
the Hodrick-Prescott smoothing technique,
which provides a smooth estimate of the long-
term trend component of the series.
Additional information
The indicator refl ects structural changes in the
aggregate euro area equity market.
Description
To compare the relevance of euro area and US
shocks for average changes in country returns,
the indicators report the variance ratios, i.e. the
proportion of total domestic equity volatility
explained by euro area and US shocks,
respectively. The model-based indicator is
derived by assuming that the total variance of
individual country-specifi c returns is given by:
σc,t = hc,t + βteu us2 2 22 2σeu,t + σus,t βt
(11)
where hc,t is the variance of the local shock
component. The euro area variance ratio is then
given by:
βteueu 2 2σeu,t
2σc,t
VRc,t = (12)
and correspondingly for the United States.
The conditional variances are obtained from a
standard asymmetric GARCH (1,1) model.
For each period, the indicators report the
unweighted average of the relative importance
of euro area-wide factors, other than US equity
market fl uctuations, for the variance of individual
euro area countries’ equity market indices (the
“variance ratio”), and the unweighted average
of the relative importance of US equity market
fl uctuations for the variance of euro area equity
markets.
Data refer to the EMU global sector indices, and
have been calculated on a weekly basis from
January 1973 onwards.
Additional information
The variance ratio is derived by assuming that
local shocks are uncorrelated across countries
and that they are similarly not correlated with
the euro area and US benchmark indices.
This indicator is based on an approach fi rst presented by3
K. Adjaouté and J.-P. Danthine (2003), “European fi nancial
integration and equity returns: A theory-based assessment”, in
V. Gaspar, D. Hartmann, and O. Slejpen (eds.), The transformation of the European fi nancial system, Second ECB
Central Banking Conference, Frankfurt am Main.
Chart C22 Proportion of variance in local equity returns explained by euro area and US shocks
(percentages)
05
1015202530354045
051015202530354045
1973-1985 1986-1991 1992-1998 1999-2007
US shocksEU shocks
Sources: Thomson Financial Datastream and ECB calculations.

S
STAT IST ICAL ANNEX
15ECB
Financial integration in Europe
April 2008 15S
STAT IST ICAL ANNEX
Description
This measure is equivalent to the news-based
indicators for the bond market. However,
empirical evidence suggests that equity returns
are signifi cantly driven by global factors. For
this reason, both euro area-wide shocks and
US shocks (as a proxy for global factors) are
included in the assessment of common news.
To calculate the relative importance of euro area-
wide and US stock market fl uctuations for local
stock market returns, the stock market returns of
individual countries are modelled as having both
an expected component as well as an unexpected
one, εc,t.4 The unexpected component is then
decomposed into a purely local shock (ec,t ) and a
reaction to euro area news (εeu,t) and world (US)
news (εus,t):
εc,t = ec,t + βc,t εeu,t + βc,t εus,tuseu
(13)
where β represents the country-dependent
sensitivity to euro area or US market changes (of
the unexpected component of equity returns).
In order to investigate the development of the
betas over time, four dummy variables are
introduced representing the periods 1973-1985,
1986-1991, 1992-1998 and 1999-2007.
For each period, the indicators report the
unweighted average intensity by which euro
area-wide equity market shocks, other than
those from the United States, are transmitted
to local euro area equity markets, as well as
the unweighted average intensity by which US
equity market shocks are transmitted to local
euro area equity markets.
Data refer to the EMU global sector indices,
and are calculated on a weekly basis from
January 1973 onwards.
Additional information
To distinguish global shocks from purely euro
area shocks, it is assumed that euro area equity
market developments are partly driven by events
in the US market. It is furthermore assumed
that the proportion of local returns that is not
explained by common factors is entirely due to
local news.
QUANTITY-BASED INDICATORS
Description
This indicator measures the degree of cross-
border holdings of equity securities among euro
area Member States and is derived in the same
way as the respective indicators for short-term
The expected return is obtained by relating euro area and US 4
returns to a constant term and to the returns in the previous
period. The conditional variance of the error terms is governed
by a bivariate asymmetric GARCH (1,1) model.
Char t C24 The degree o f c ro s s -border ho ld ing s o f equ i ty i s sued by euro a rea r e s ident s
(percentages)
0
5
10
15
20
25
30
35
0
5
10
15
20
25
30
35
Intra-euro area Extra-euro area
1997
2001
2002
2003
2004
2005
2006
Sources: IMF, Thomson Financial Datastream and ECB calculations.
Char t C23 Euro a rea and US shock sp i l l ove r i n tens i t y
0.00.10.20.30.40.50.60.70.80.9
0.00.10.20.30.40.50.60.70.80.9
1973-1985 1986-1991 1992-1998 1999- 2007
euro area shock spillover intensitiesUS shock spillover intensities
Sources: Thomson Financial Datastream and ECB calculations.

ECB
Financial integration in Europe
April 2008S 16S
and long-term debt securities. The computed
indicator has an annual frequency.
Description
The indicator shows the share of investment
funds’ total holdings of all shares and other
equity (excluding investment fund shares/units)
issued by residents of the euro area outside the
Member State in which the investment fund is
located and by resident of the rest of the world.
The composition of the two areas is the one
prevailing during the reference period. The
indicator has a quarterly frequency.
BANKING MARKET INDICATORS
CROSS-BORDER PRESENCE INDICATORS
Description
These two indicators describe the development
over time in the number of foreign branches/
subsidiaries of euro area banks (credit
institutions) within euro area countries as a
share of the total number of domestic credit
institutions. Setting up branches or subsidiaries
is one way of integrating the euro area
banking markets across borders. The level and
dispersion of the country data are described
by the following dispersion measures: the
minimum, the fi rst quartile (25th percentile), the
median value (50th percentile), the third quartile
(75th percentile), and the maximum.
These computed indicators have an annual
frequency. They complement the information
on the assets of branches and subsidiaries, as
provided by the following two indicators (C 28
and C 29).
Chart C25 Investment funds’ holdings of equity issued in other euro area countries and the rest of the world
(as a share of total holdings of equity; percentages)
0
10
20
30
40
50
60
0
10
20
30
40
50
60
1999 2000 2001 2002 2003 2004 2005 2006 2007
other euro area Member Statesrest of the world
Source: ECB.
Chart C26 Dispersion of the number of euro area bank branches across euro area countries
(as a percentage of the total number of banks)
2001 2002 2003 2004 2005 2006 20070
10
20
30
40
0
10
20
30
40
Source: ECB.
Chart C27 Dispersion of the number of euro area bank subsidiaries across euro area countries
(as a percentage of the total number of banks)
0
10
20
30
40
50
0
10
20
30
40
50
20072001 2002 2003 2004 2005 2006
Source: ECB.

S
STAT IST ICAL ANNEX
17ECB
Financial integration in Europe
April 2008 17S
STAT IST ICAL ANNEX
Description
These two indicators describe the development
over time of the assets of foreign branches and
subsidiaries of euro area banks within euro
area countries other than the home country as a
share of the total assets of the euro area banking
sector. These computed indicators have an
annual frequency.
Description
This indicator shows euro area bank M&A
activity as a further measure of the degree of
cross-border integration of euro area banking
markets. The numerator is composed of the
value of all intra-euro area cross-border bank
M&As. The denominator is composed of the
value of all euro area banking system M&As
(i.e. domestic, intra-euro area cross-border and
where the acquirer is resident in the euro area
and the counterparty is outside the euro area).
The absolute number of euro area cross-border
M&As per year is also shown. M&A deals
include both controlling and minority stakes. All
acquisition transactions are taken into account
provided the resulting stake is above 10%. This
also applies to transactions where the value has
not been disclosed as long as the resulting stake
is published (and amounts to more than 10%).
Acquisitions carried out in multiple transactions
are reported in the year in which the ownership
exceeded 50%.
Chart C28 Dispersion of the total assets of euro area bank branches across euro area countries
(as a percentage of the total assets of the euro area banking sector)
0
10
20
00
1010
2020
2001 2002 2003 2004 2005 2006 2007
Source: ECB.
Chart C29 Dispersion of the total assets of euro area bank subsidiaries across euro area countries
(as a percentage of the total assets of the euro area banking sector)
2001 2002 2003 2004 2005 2006 20070
10
20
30
40
50
60
70
80
0
10
20
30
40
50
60
70
80
Source: ECB.
Char t C30 Euro a rea c ro s s -border bank M&A ac t i v i t y
(as a percentage of the total value of euro area banking system M&As and in absolute numbers)
0
10
20
30
40
50
60
70
2000 2001 2002 2003 2004 2005 2006 2007024681012141618
value of cross-border deals (%)number of cross-border deals
Sources: Bureau van Dijk (Zephyr database) and ECB calculations

ECB
Financial integration in Europe
April 2008S 18S
PRICE-BASED INDICATORS
Description
The price measures for credit market integration
are based on MFI interest rates (MIR) on new
business reported to the ECB, at monthly
frequency as from January 2003.
For the purpose of measuring fi nancial
integration, it might be preferable to compute
the dispersion of rates as measured by the
standard deviation using unweighted interest
rates at the level of individual MFIs. However,
these data are not available at the ECB, and
therefore weighted rates and standard deviations
are calculated instead.
The following general notation is used for each
of the above categories of loans:
rc,t = the interest rate prevailing in country c in
month t
bc,t = business volume in country c corresponding
to rc,t
bc,t
Bt wc,t = is the weight of country c in the total
euro area business volume B
Bt =∑bc,tc
The euro area MIR is computed as the weighted
average of country interest rates rc,t, taking the
country weights wc,t
rt =∑wc,t rc,tc (14)
The euro area weighted standard deviation takes
the following form:
wc,tMt = ∑(rc,t − rt)2√ c (15)
The monthly data are smoothed by calculating
a three-month centred moving average of the
standard deviation.
Chart C31 Cross-country standard deviation of MFI interest rates on loans to non-financial corporations
(basis points)
0
10
20
30
40
50
60
70
0
10
20
30
40
50
60
70
variable rate and up to 1 year, up to and
including €1 million
variable rate and up to 1 year, over €1 million
over 5 years, up to and including €1 million
over 5 years, over €1 million
2003 2004 2005 2006 2007
Source: ECB.
Chart C32 Cross-country standard deviation of MFI interest rates on loans to households
(basis points)
0
20
40
60
80
100
120
140
160
0
20
40
60
80
100
120
140
160
2003 2004 2005 2006 2007
consumer credit: over 1 year and up to 5 years
house purchase: with variable rate and initial rate
fixation up to 1 yearhouse purchase: with initial rate fixation over 5 years
and up to 10 years
Source: ECB.
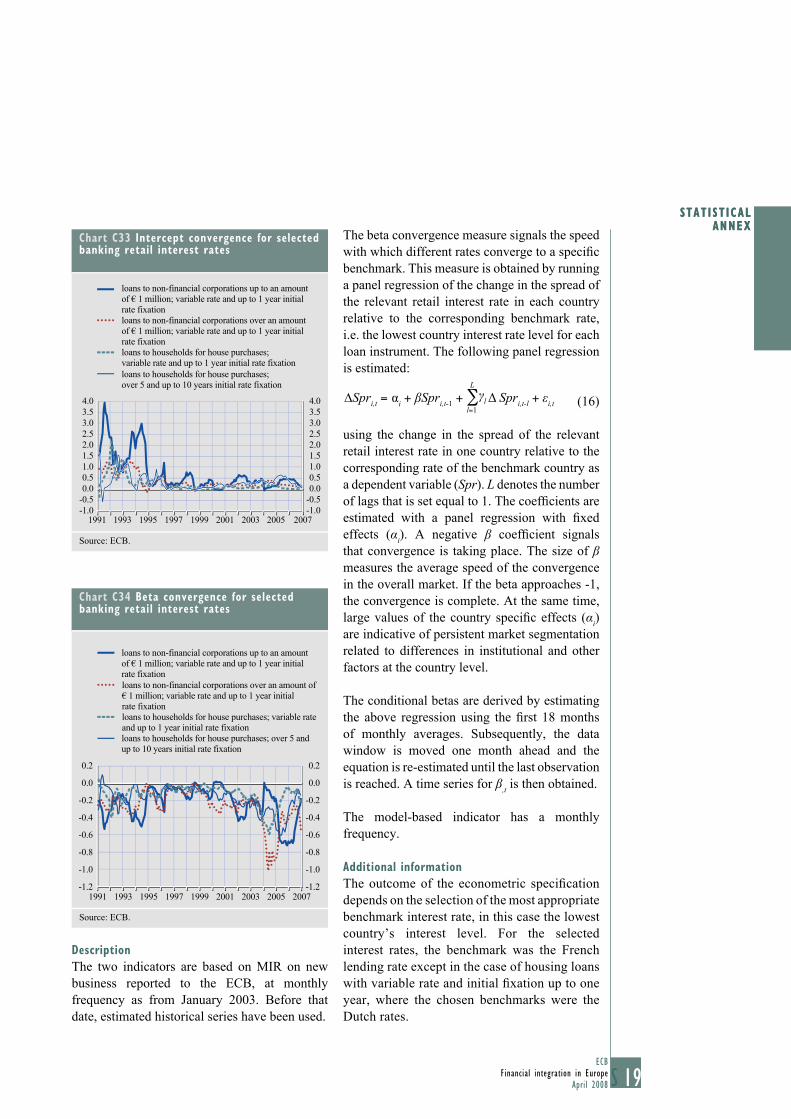
S
STAT IST ICAL ANNEX
19ECB
Financial integration in Europe
April 2008 19S
STAT IST ICAL ANNEX
Description
The two indicators are based on MIR on new
business reported to the ECB, at monthly
frequency as from January 2003. Before that
date, estimated historical series have been used.
The beta convergence measure signals the speed
with which different rates converge to a specifi c
benchmark. This measure is obtained by running
a panel regression of the change in the spread of
the relevant retail interest rate in each country
relative to the corresponding benchmark rate,
i.e. the lowest country interest rate level for each
loan instrument. The following panel regression
is estimated:
∆Spri,t = αi
+ βSpri,t-1 + ∑γl Δ Spri,t-l
+ εi,t
L
l=1 (16)
using the change in the spread of the relevant
retail interest rate in one country relative to the
corresponding rate of the benchmark country as
a dependent variable (Spr). L denotes the number
of lags that is set equal to 1. The coeffi cients are
estimated with a panel regression with fi xed
effects (αi). A negative β coeffi cient signals
that convergence is taking place. The size of β
measures the average speed of the convergence
in the overall market. If the beta approaches -1,
the convergence is complete. At the same time,
large values of the country specifi c effects (αi)
are indicative of persistent market segmentation
related to differences in institutional and other
factors at the country level.
The conditional betas are derived by estimating
the above regression using the fi rst 18 months
of monthly averages. Subsequently, the data
window is moved one month ahead and the
equation is re-estimated until the last observation
is reached. A time series for β,t is then obtained.
The model-based indicator has a monthly
frequency.
Additional information
The outcome of the econometric specifi cation
depends on the selection of the most appropriate
benchmark interest rate, in this case the lowest
country’s interest level. For the selected
interest rates, the benchmark was the French
lending rate except in the case of housing loans
with variable rate and initial fi xation up to one
year, where the chosen benchmarks were the
Dutch rates.
Chart C33 Intercept convergence for selected banking retail interest rates
-1.0
-0.5
0.0
0.5
1.0
1.5
2.0
2.5
3.0
3.5
4.0
1991 1993 1995 1997 1999 2001 2003 2005 2007-1.0
-0.5
0.0
0.5
1.0
1.5
2.0
2.5
3.0
3.5
4.0
loans to non-financial corporations up to an amount
of € 1 million; variable rate and up to 1 year initial
rate fixation
loans to non-financial corporations over an amount
of € 1 million; variable rate and up to 1 year initial
rate fixation
loans to households for house purchases;
variable rate and up to 1 year initial rate fixation
loans to households for house purchases;
over 5 and up to 10 years initial rate fixation
Source: ECB.
Chart C34 Beta convergence for selected banking retail interest rates
-1.2
-1.0
-0.8
-0.6
-0.4
-0.2
0.0
0.2
1991 1993 1995 1997 1999 2001 2003 2005 2007-1.2
-1.0
-0.8
-0.6
-0.4
-0.2
0.0
0.2
loans to non-financial corporations up to an amount
of € 1 million; variable rate and up to 1 year initial
rate fixation
loans to non-financial corporations over an amount of
€ 1 million; variable rate and up to 1 year initial
rate fixation
loans to households for house purchases; variable rate
and up to 1 year initial rate fixation
loans to households for house purchases; over 5 and
up to 10 years initial rate fixation
Source: ECB.

ECB
Financial integration in Europe
April 2008S 20S
QUANTITY-BASED INDICATORS
Description
These indicators show the geographical
counterparty diversifi cation of loans granted by
euro area MFIs (excluding central banks) to the
general government, to non-MFI counterparties
resident in other euro area countries and to other
MFIs resident in non-euro area EU Member
States.5 Similar indicators are computed for
deposits with non-MFIs and securities held by
euro area MFIs and issued by non-MFIs and
MFIs.
The indicators have a quarterly frequency.
Additional information
These indicators are built on the basis of the
national aggregated MFI balance sheet statistics
reported to the EC, at a monthly and quarterly
frequency.6
These balance sheet items are transmitted on
a non-consolidated basis. This means that the
positions with foreign counterparties include
those with foreign branches and subsidiaries.
As applicable during the reference period. 5
These data cover the MFI sector excluding the Eurosystem and 6
also include data on money market funds (MMFs). It is not
yet possible to derive indicators that strictly refer to banking
markets. Consequently, as MMFs typically invest in inter-MFI
deposits and short-term securities, the indicators displaying data
for these assets are somewhat affected by the MMFs’ balance
sheet items. Only for the indicator showing loans to non-MFIs
are the statistics for MFIs and for credit institutions the same.
Chart C35 Non-interbank deposits – percentage of business with other euro area countries and EU Member States
(as a share of total deposits; excluding the Eurosystem; percentages)
0123456789
10
012345678910
other euro area Member States
rest of EU-total
1997 1998 1999 2000 2001 2002 2003 2004 2005 2006 2007Sep. Sep. Sep. Sep. Sep. Sep. Sep. Sep. Sep. Sep. Sep.
Source: ECB.
Chart C36 MFI holdings of securities issued by MFIs: outstanding amounts by residency of the issuer
(as a share of total holdings; excluding the Eurosystem; percentages)
0
5
10
15
20
25
30
35
0
5
10
15
20
25
30
35
other euro area Member States
rest of EU
1998 19991997 2000 2001 2002 2003 2004 2005 2006 2007Sep. Mar. Sep. Mar. Sep. Mar. Sep. Mar. Sep. Mar. Sep. Mar. Sep. Mar. Sep. Mar. Sep. Mar. Sep. Mar. Sep.
Source: ECB.
Chart C37 MFI loans to non-MFIs: outstanding amounts by residency of the counterparty
(as a share of total loans granted by MFIs, excluding the Eurosystem; percentages)
0
1
2
3
4
5
0
1
2
3
4
5
other euro area Member States
rest of EU
1998 19991997 2000 2001 2002 2003 2004 2005 2006 2007Sep.Mar.Sep.Mar.Sep.Mar.Sep.Mar.Sep.Mar.Sep.Mar.Sep.Mar.Sep.Mar.Sep.Mar.Sep.Mar.Sep.
Source: ECB.
Chart C38 MFI loans to MFIs: outstanding amounts by residency of the counterparty
(as a share of total loans granted by MFIs, excluding the Eurosystem; percentages)
0
5
10
15
20
25
0
5
10
15
20
25
other euro area Member Statesrest of EU
1998 19991997 2000 2001 2002 2003 2004 2005 2006 2007Sep. Mar. Sep. Mar. Sep. Mar. Sep. Mar. Sep. Mar. Sep. Mar. Sep. Mar. Sep. Mar. Sep. Mar. Sep. Mar. Sep.
Source: ECB.

S
STAT IST ICAL ANNEX
21ECB
Financial integration in Europe
April 2008 21S
STAT IST ICAL ANNEX
CORPORATE BANKING INDICATORS
Description
These indicators show the cross-country
dispersion of gross fees on bond and equity
issues, respectively, charged to euro area
resident fi rms, whereby the gross fees are
composed of total commissions for management,
underwriting and selling a new issue, expressed
as a percentage of the nominal amount of the
issue. The level and dispersion of the country
data are described by the following dispersion
measures: the minimum, the fi rst quartile (25th
percentile), the median value (50th percentile),
the third quartile (75th percentile) and the
maximum. Each transaction is weighted by the
size of its nominal amount. The computed
indicators have an annual frequency.7
Description
These indicators show the cross-country
dispersion measures of the weighted average
of spreads and fees, respectively, on syndicated
loans where the borrower is from a euro area
country. The average margin is the spread, in
basis points, over the base rates (e.g. LIBOR).
The average fee is calculated as a difference
between the average all-in pricing and the
margin. The presentation is similar to the
one chosen for the previous indicators. Each
transaction is weighted by the size of its nominal
amount.
For the calculation of indicators 39 and 40, private and 7
public corporations and private and public utilities have been
considered. The same applies to indicators 41 and 42.
Char t C42 C ros s - count ry d i spe r s i on o f f e e s on synd i ca ted l oans charged to euro a rea r e s ident f i rms
(basis points)
0
5
10
15
20
25
0
5
10
15
20
25
2000 2001 2002 2003 2004 2005 2006 2007
Sources: Dealogic (Loanware) and ECB calculations.
Chart C41 Euro area cross-country dispersion of spreads on syndicated loans charged to euro area resident firms
(basis points)
0
50
100
150
200
250
300
350
400
0
50
100
150
200
250
300
350
400
2000 2001 2002 2003 2004 2005 2006 2007
Sources: Dealogic (Loanware) and ECB calculations.
Chart C39 Cross-country dispersion of gross fees on bond issues charged to euro area resident firms(percentage points)
0.0
0.5
1.0
1.5
2.0
2.5
0.0
0.5
1.0
1.5
2.0
2.5
2001 2002 2003 2004 2005 2006 2007
Source: Bondware.
Char t C40 C ros s - count ry d i spe r s i on measure s o f g ro s s f ee s on equ i ty i s sue s charged to euro a rea r e s ident f i rms (percentage points)
Dispersion of gross fees on equity issues charged on EA firms
0
1
2
3
4
5
6
7
8
0
1
2
3
4
5
6
7
8
2000 2001 2002 2003 2004 2005 2006 2007
Source: Bondware.

ECB
Financial integration in Europe
April 2008S 22S
INFRASTRUCTURE INDICATORS FOR RETAIL
PAYMENT SYSTEMS
Description
The fi rst indicator counts the total number
of retail payment systems in the euro area. A
retail payment system is viewed as a funds
transfer system which handles large volumes of
payments of relatively low value in forms such
as cheques, credit transfers, direct debits and
ATM (automated teller machine) and EFTPOS
(electronic funds transfer at point of sale)
transactions.
The second indicator counts the total number
of retail payment systems which operate in the
form of an automated clearing house (ACH) in
the euro area. Unlike retail payment systems
that operate manually or in real-time processing
mode, an ACH is viewed as an electronic
clearing system in which payment orders are
exchanged among fi nancial institutions at a
central data processing centre.
The frequency of both indicators is annual.
Additional information
These two indicators are based on the information
and defi nitions reported in the ECB Blue Book
for the respective years. When interpreting
these statistics, it should be borne in mind that
the data collection for the ECB Blue Book is
currently voluntary. It is at the discretion of the
respective NCBs to select which systems should
be reported for the Blue Book on the basis of
their signifi cance in the national context.
Chart C43 Number of retail payment systems in the euro area
0
2
4
6
8
10
12
14
16
18
20
0
2
4
6
8
10
12
14
16
18
20
1998 1999 2000 2001 2002 2003 2004 2005 2006 2007
Source: ECB.
Chart C44 Number of automated clearing houses in the euro area
012345678
12345678
1998 1999 2000 2001 2002 2003 2004 2005 2006 20070
Source: ECB.


F INANC IAL INTEGRAT ION IN EUROPEAPR I L 2008
EUR
OP
EAN
CEN
TRAL
BAN
KFI
NAN
CIAL
INTE
GR
ATIO
NIN
EUR
OPE
APR
IL20
08