financial integration in europe april 2010 · 2010 financial integration in europe april 2010. ......
TRANSCRIPT

EURO
PEAN
CEN
TRAL
BAN
K
FiN
ANCi
AL i
NTE
gRA
TiO
N i
N E
URO
PE
APRi
L 20
10
F INANC IAL INTEGRAT ION IN EUROPEAPR I L 2010

FINANCIAL INTEGRATIONIN EUROPE
APRIL 2010
In 2010 all ECB publications
feature a motif taken from the
€500 banknote.

© European Central Bank, 2010
Address Kaiserstrasse 29
60311 Frankfurt am Main
Germany
Postal address Postfach 16 03 19
60066 Frankfurt am Main
Germany
Telephone +49 69 1344 0
Website http://www.ecb.europa.eu
Fax +49 69 1344 6000
All rights reserved. Reproduction for educational and non-commercial purposes is permitted provided that the source is acknowledged.
Unless otherwise stated, this document uses data available as at end February 2010.
ISSN 1830-7140 (print)
ISSN 1830-7159 (online)

3ECB
Financial integration in Europe
April 2010
PREFACE 7
EXECUTIVE SUMMARY 8
CHAPTER I
RECENT DEVELOPMENTS IN FINANCIAL
INTEGRATION IN THE EURO AREA 11
1 Introduction 11
2 Overview of the fi nancial
market segments 12
CHAPTER II
SPECIAL FEATURES 31
A. BANKING INTEGRATION AND
SUPERVISION IN THE EU 31
1 Introduction 31
2 Developments in cross-border
banking 32
3 The new supervisory framework
for the EU 38
B. EUROPEAN COVERED BONDS 45
1 Introduction 45
2 What is a covered bond? 46
3 Market developments and
some basic structural features 46
4 The regulatory framework 49
5 Recent price developments
and impact of the covered bond
purchase programme 51
6 Scope for further integration
and market-led initiatives 53
C. HARMONISATION IN THE
POST-TRADING SECTOR 55
1 Introduction 55
2 The benefi ts of harmonisation 55
3 Existing initiatives
at the EU level 59
4 The way forward 66
D. STABILITY IMPLICATIONS
OF FINANCIAL MARKET INTEGRATION
AND DEVELOPMENT 68
1 Introduction 68
2 The relationship between
fi nancial integration and
fi nancial stability 69
3 The relationship between
fi nancial development
and fi nancial stability 74
4 Conclusions 81
CHAPTER III
EUROSYSTEM ACTIVITIES
FOR FINANCIAL INTEGRATION 83
1 The legislative and regulatory
framework for the fi nancial system 83
2 Catalyst for private sector
activities 86
3 Knowledge about the state
of fi nancial integration 90
4 Central bank services that foster
integration 94
STATISTICAL ANNEX S1
CONTENTS

4ECB
Financial integration in Europe
April 2010
COUNTRIES LU Luxembourg
BE Belgium HU Hungary
BG Bulgaria MT Malta
CZ Czech Republic NL Netherlands
DK Denmark AT Austria
DE Germany PL Poland
EE Estonia PT Portugal
IE Ireland RO Romania
GR Greece SI Slovenia
ES Spain SK Slovakia
FR France FI Finland
IT Italy SE Sweden
CY Cyprus UK United Kingdom
LV Latvia JP Japan
LT Lithuania CH Switzerland
US United States
OTHERS
ABS Asset-backed security
ACI Financial Markets Association
AMEX American Stock Exchange
BIC Bank identifi er code
BIS Bank for International Settlements
CADES Caisse d’Amortissement de la Dette Sociale
CBIC Covered Bond Investor Council
CBPP Covered bond purchase programme
CCBM Correspondent central banking model
CCBM2 Collateral Central Bank Management
CCP Central counterparty
CDO Collateralised debt obligation
CDS Credit default swap
CEBS Committee of European Banking Supervisors
CESAME Clearing and Settlement Advisory and Monitoring Expert Group
CESR Committee of European Securities Regulators
CFS Center for Financial Studies
CLO Collateralised loan obligation
CLS Continuous Linked Settlement
COGESI Contact Group on Euro Securities Issues
CPSS Committee on Payment and Settlement Systems
CRT Credit risk transfer
CRD Capital Requirements Directive
CSD Central securities depository
CSM Clearing and settlement mechanism
DTCC The Depository Trust & Clearing Corporation
DVP Delivery versus payment
EA Euro area
EBF European Banking Federation
EBRD European Bank for Reconstruction and Development
ABBREVIATIONS

5ECB
Financial integration in Europe
April 2010
ABBREVIAT IONS
ECB European Central Bank
ECBC European Covered Bond Council
ECBDA European Covered Bond Dealers Association
Ecofi n Council Council of Economic and Finance Ministers
ECP Euro commercial paper
ECSDA European Central Securities Depositories Association
EEA European Economic Area
EFMLG European Financial Markets Lawyers Group
EMU Economic and Monetary Union
EONIA Euro overnight index average
EPC European Payments Council
ESCB European System of Central Banks
ESFS European System of Financial Supervisors
ESRB European Systemic Risk Board
EU European Union
EUREPO Repo market reference rate for the euro
EURIBOR Euro interbank offered rate
EX Euronext countries
FCD Financial Collateral Directive
FISCO Clearing and Settlement Fiscal Compliance expert group
FSB Financial Stability Board
GDP Gross domestic product
GFS General functional specifi cations
GTD General technical design
IBAN International bank account number
ICMA International Capital Market Association
ICSD International central securities depository
IMF International Monetary Fund
IOSCO International Organization of Securities Commissions
ISDA International Swaps and Derivatives Association, Inc.
ISLA International Securities Lending Association
KfW Kreditanstalt für Wiederaufbau
LBO Leveraged buy-out
LCG Legal Certainty Group
LTRO Longer-term refi nancing operation
LTV Loan-to-value
LVPS Large-value payment system
M&A Merger and acquisition
MBS Mortgage-backed security
MFI Monetary fi nancial institution
MiFID Markets in Financial Instruments Directive
MMF Money market fund
NASDAQ National Association of Securities Dealers Automated Quotations
NCB National central bank
NTMA National Treasury Management Agency
NYSE New York Stock Exchange
OECD Organisation for Economic Co-operation and Development
OIS Overnight index swap

6ECB
Financial integration in Europe
April 2010
OJ Offi cial Journal of the European Union
OTC Over the counter
PHA Proprietary home account
RMBS Residential mortgage-backed security
ROA Return on assets
ROE Return on equity
RTGS Real-time gross settlement
SCT SEPA credit transfer
SDD SEPA direct debit
SEPA Single Euro Payments Area
SFD Settlement Finality Directive
SIFMA Securities Industry and Financial Markets Association
SSP Single shared platform
SSS Securities settlement system
STEP Short-term European paper
STP Straight-through processing
TARGET Trans-European Automated Real-time Gross settlement Express Transfer system
TARGET2 Second generation of the TARGET system that commenced operations in
November 2007
T2S TARGET2-Securities
UCITS Undertakings for Collective Investments in Transferable Securities
UDFS User detailed functional specifi cations
UNIDROIT International Institute for the Unifi cation of Private Law
URD User requirements document
WFE World Federation of Exchanges

7ECB
Financial integration in Europe
April 2010
PREFACE
The aim of the ECB’s annual report on
fi nancial integration in Europe is to contribute
to the advancement of the European fi nancial
integration process by analysing its development
and the related policies. It is also aimed at
raising public awareness of the importance of
fi nancial integration, and of the Eurosystem’s
role in supporting it.
The Eurosystem has a keen interest in the
integration and effi cient functioning of the
fi nancial system in Europe, especially in the
euro area.1 Financial integration is of key
importance for the conduct of the single
monetary policy, as it fosters a smooth and
balanced transmission of monetary policy
throughout the euro area. Financial integration
is also relevant for fi nancial stability; on the one
hand, it enhances the opportunity for risk
diversifi cation and improves access to fi nancial
markets; on the other hand, it may increase the
scope for spillover effects and contagion.
Moreover, fi nancial integration is linked to the
Eurosystem’s task of promoting the smooth
operation of payment systems, including the
safe and effi cient functioning of securities
clearing and settlement. Finally, the Eurosystem
supports, without prejudice to price stability, the
objective of completing the Single Market in
order to realise the full economic potential of
the European Union.
In pursuing these goals, the Eurosystem supports
also activities conducted by the private sector
and by other European institutions. In particular,
the ECB works in close cooperation with the
European Commission, which has a primary
responsibility for Single Market policies. This
report complements the monitoring work
undertaken by the Commission in the fi eld
of European fi nancial integration.2 It focuses
mainly on issues pertaining to the euro area but
where relevant it also addresses issues from an
EU perspective.
Financial integration is part of the Eurosystem’s mission statement; 1
for details, see the ECB’s website at www.ecb.europa.eu.
See, in particular, the European Commission’s annual European 2
Financial Integration Report.
PREFACE

8ECB
Financial integration in Europe
April 2010
EXECUTIVE SUMMARY
This report 3 comprises three main chapters.
Chapter I, together with the Statistical Annex,
sets out the ECB’s assessment of the degree
of fi nancial integration and development in the
different segments of the euro area fi nancial
system – money, bond, equity and banking
markets, as well as the underlying market
infrastructures. The chapter highlights those
market segments that are lagging behind and
points to a few salient implications of the
fi nancial crisis for the integration process.
As observed in previous reports, the degree
of integration varies considerably across the
different market segments, depending partly
on the characteristics of the underlying market
infrastructures. As a rule, integration is the more
advanced the closer the market is to the single
monetary policy and the more integrated the
underlying market infrastructure is.
The crisis affected fi nancial markets to very
different degrees. The most integrated ones, such
as the money markets, showed clear signs of
retrenchment within national borders. The bond
and retail banking markets, by contrast, were
less affected, and the equity markets did not
show any appreciable retreat from cross-border
integration. This report specifi cally illustrates
that, as fi nancial markets gradually returned to
more normal conditions in 2009, the markets
that had suffered most from the crisis also
returned more rapidly and clearly towards their
pre-crisis integration levels.
In Chapter II, Special Feature A, “Banking integration and supervision in the EU”, looks
at the trends in cross-border banking integration
over the past year, and at the recent proposals
for a new EU supervisory architecture from a
fi nancial integration perspective.
Financial integration has advanced well over
time in the wholesale activities of banks.
Retail banking, by contrast, continues to lag
behind, largely owing to legal, regulatory
and information-related barriers, but also to
the fragmented underlying infrastructure and
payment instruments. Conversely, the fi nancial
crisis has affected the cross-border wholesale
and securities activities markedly, while the
impact on retail banking has remained low.
Cross-border mergers and acquisitions (M&As)
in the banking sector decreased signifi cantly in
the wake of the crisis. Care should be taken that
measures adopted by authorities to address the
fi nancial stability concerns resulting from the
fi nancial crisis do not lead to a fragmentation of
the Single Market.
Besides meeting the fi nancial stability challenges
of increasingly integrated fi nancial markets, the
new European System of Financial Supervisors
(ESFS) is expected to contribute to fi nancial
integration through the promotion of a single
set of prudential rules and the equal treatment of
market participants. The new European Systemic
Risk Board (ESRB) will also contribute
indirectly to fi nancial integration, as enhanced
fi nancial stability will allow market participants
to more fully exploit the opportunities offered
by cross-border activities.
Special Feature B is entitled “European covered bonds”. Over the past decade, covered bonds
have become a key funding instrument for
European banks, and nearly all Member States
now have a specifi c legal framework in place
that supports their issuance, although with major
legal and regulatory differences across countries.
Integration in the European covered bond
markets has made progress since the introduction
of the euro. However, markets continue to be
considerably fragmented, and investors still
show a signifi cant home bias. The fi nancial crisis
has increased the cross-country dispersion in
covered bond spreads. Moreover, primary market
issuance dropped signifi cantly and secondary
market liquidity dried up. The Eurosystem
successfully revitalised the market through the
covered bond purchase programme launched in
July 2009.
This is the fourth report published by the ECB on the subject. 3
The reports are available on the ECB’s website at www.ecb.
europa.eu.

9ECB
Financial integration in Europe
April 2010
EXECUTIVE SUMMARY
There is still considerable scope for further
integration of this market, in particular
by improving the clarity, simplicity and
comparability of the different legal frameworks.
The development of a common standard or
defi nition for covered bonds would be an
important step in that respect. Various market-led
initiatives are underway to address these
concerns.
Special Feature C looks at “Harmonisation in the post-trading sector”. Securities clearing
and settlement systems play a crucial role with
respect to fi nancial integration and stability, as
underscored by the crisis. Integration in this
area, however, continues to be hampered by
legal, fi scal and technical obstacles. The Special
Feature reviews the EU’s main harmonisation
initiatives in the post-trading sector, focusing
on the Eurosystem’s contribution in particular.
This contribution takes various forms, with the
Eurosystem acting as overseer (for instance, in
the case of the ESCB-CESR Recommendations),
operator (e.g. CCBM2 and T2S), or catalyst
(e.g. by monitoring the implementation of the
self-regulatory Code of Conduct for market
infrastructures). Although T2S will provide
one of the most important tools for delivering a
harmonised and integrated post-trading trading
infrastructure for securities transactions in euro,
it alone will not achieve full harmonisation. The
Eurosystem will therefore continue to actively
support other complementary initiatives to
further harmonise post-trading processes,
bringing its own perspective and expertise into
the debate to ensure progress is made towards a
more integrated, effi cient and resilient securities
infrastructure for Europe.
Special Feature D reviews the academic literature on “Stability implications of fi nancial market integration and development”.
Well-integrated and developed fi nancial systems
improve effi ciency and risk-sharing, and may
also possess enhanced shock-absorbing capacity.
Under certain conditions, however, systemic
risk may be increased on account of a higher
scope for contagion across countries, more risk-
taking and higher volatility in fi nancial markets;
market participants’ incentives may change and
market transparency could be reduced as well.
As regards the relationship between fi nancial
integration and fi nancial stability, topics such
as the impact of fi nancial globalisation and
openness, the increasing importance of cross-
border banking, the behaviour of the well-
integrated interbank market during the crisis and
the increased interdependence between fi nancial
markets are addressed.
As to the relationship between fi nancial
development and fi nancial stability, the Special
Feature investigates fi nancial innovation and, in
particular, the new instruments for transferring
credit risk. Moreover, it reviews the role of
central counterparties as a way to reduce the
counterparty risk for over-the-counter (OTC)
derivatives. Finally, the role of marking-to-
market accounting in the fi nancial crisis is
discussed.
Policies that could help contain the transmission
of instability in integrated fi nancial markets
include greater transparency, as well as more
effective macro-prudential supervision and
crisis management. Furthermore, the academic
research identifi es specifi c suggestions that
merit further refl ection in the context of
fi nancial reform.
Chapter III provides an overview of the main
activities that the Eurosystem has pursued
in 2009 with the view to advancing fi nancial
integration in the euro area.4
First, as regards the provision of advice on the legislative and regulatory framework for the fi nancial system, a major contribution concerned
the legal advice on the establishment of the
EU’s new supervisory architecture. In the area
of fi nancial infrastructure, an important step was
taken with the publication of the ESCB-CESR
Chapter III also supplements the chapter on fi nancial integration 4
in the ECB’s Annual Report 2009.

10ECB
Financial integration in Europe
April 2010
recommendations for securities settlement
systems and central counterparties in the EU.
Second, with respect to the role the ECB and the Eurosystem play as a catalyst, support continued
for projects that had been initiated earlier, such
as SEPA, STEP, the Code of Conduct for
Clearing and Settlement and the removal of
the so-called Giovannini barriers to effi cient
cross-border clearing and settlement. In the wake
of the fi nancial crisis, the ECB and Eurosystem,
together with participants from the fi nancial
industry, have also been involved in initiatives
to reactivate the structured fi nance market,
which is the market segment that suffered the
most during the crisis.
Third, in the fi eld of enhancing knowledge, raising awareness and monitoring the state of fi nancial integration, the ECB continued its
work on fi nancial integration and development
indicators, as well as on fi nancial market
statistics. The ECB was also involved in
various research initiatives related to fi nancial
integration, in particular through the ECB-CFS
Research Network. Research papers delivered
within the scope of the ECB’s Lamfalussy
fellowship programme in 2009 addressed
different aspects of the interplay between
fi nancial integration, market effi ciency, risk-
allocation and risk-creation, and stability.
Finally, with regard to central bank services that foster fi nancial integration, the focus was on
the smooth operation of the TARGET2 system
against the background of very challenging
market conditions and the continued work on the
T2S project with the aim of starting operations
in 2013.
11ECB
Financial integration in Europe
April 2010
CHAPTER I
RECENT DEVELOPMENTS IN FINANCIAL
INTEGRATION IN THE EURO AREA
This chapter illustrates the main developments of fi nancial integration in the euro area in 2009.As described in the ECB’s 2009 Report on fi nancial integration in Europe (hereinafter referred to as the “2009 Report”), the tensions in the fi nancial markets, particularly acute in the last quarter of 2008, had resulted in a tendency of many market segments to retrench within national borders. The main focus of this year’s report is on how markets have evolved since.At the beginning of 2009 and more clearly in the middle of the year, the tensions in money and fi nancial markets progressively eased and cross-border integration improved, more markedly and rapidly in those market segments that had suffered most during the fi nancial turmoil. Joint contributing factors were an improved climate in international fi nancial markets and the policy actions undertaken by the Eurosystem as well as other authorities.
1 INTRODUCTION
This chapter reviews the most signifi cant
developments in the integration of main segments
of the euro area fi nancial sector in 2009:
the money, bond, equity and banking markets.
As discussed in depth in the 2009 Report, the
fi nancial crisis has had a profound impact on
euro area fi nancial convergence, particularly
in the last months of 2008. Hence, the focus
in this report remains on the consequences of
the crisis and, in particular, on how integration
has evolved during the recent months in which
fi nancial markets have gradually started to
function properly again. The analysis builds on
a detailed set of fi nancial integration indicators,
updated – as in the past – to refl ect the most
recent information available.
The 2007-08 fi nancial turmoil affected the
euro area fi nancial sector in ways that
differed considerably across market segments
and countries. A consequence was a temporary
retrenchment of market activity within national
borders, to differing degrees across market
segments. The impact was felt most strongly in
the money markets, and relatively less in bond
and banking activities, while the equity market
was affected little or not at all. The return to more
normal conditions in recent months followed
a similar pattern in reverse, with the most dramatic
improvements taking place in money markets,
as will be described in detail below.
This outcome refl ected the improved climate of
expectations in fi nancial markets, globally and
in the euro area, and benefi ted in particular from
the measures put in place by central banks and
other policy-makers to support, or temporarily
supplement, the functioning of the banking and
fi nancial markets and to limit the contraction of
aggregate demand.
The Eurosystem was particularly proactive
in the money markets during the crisis period.
Its refi nancing techniques were strengthened
substantially in the autumn of 2008, namely by
lengthening the maturities of open market
operations, by moving to a fi xed-rate tender and
full-allotment procedure and by extending the
list of assets eligible as collateral.1 Refl ecting
the benefi cial effect of this action on fi nancial
integration, the usual indicators of cross-border
activity and price dispersion commented in this
report, which had worsened dramatically at the
peak of the crisis, have gradually recovered
since the beginning of 2009. Further measures
adopted by the ECB’s Governing Council
in 2009 consolidated these improvements
further. In particular, the Governing Council
adopted a programme in the spring of 2009
that comprised three one-year longer-term
refi nancing operations (LTROs) and additional
forms of “enhanced credit support” (such as the
purchase of covered bonds), thereby contributing
to the easing of tensions in the money and
fi nancial markets. These actions – combined
with the measures taken by national
governments, including further guarantees and
See the descriptions published periodically in the ECB’s Monthly 1
Bulletin.

12ECB
Financial integration in Europe
April 2010
capital injections – helped to extend the
improvements from the money markets to the
banking and other market segments.
The high degree of fi nancial integration achieved
in the euro area in the decade prior to the crisis
appears to have acted as an anchor, preventing a
widespread disintegration of markets at the peak
of the crisis and limiting the risks of a more
lasting impact from it.
2 OVERVIEW OF THE FINANCIAL MARKET
SEGMENTS
The overall size of the capital markets,
represented by the aggregate volume of shares,
bonds and loans outstanding in the markets as a
share of GDP, continued on an upward trend
despite the adverse conditions since mid 2007
(see Chart 1). The growth of capital market size
in the euro area was close to that observed in the
United States over the period under analysis.
This mirrors the global trends – the size
of capital markets has grown steadily over
the past fi fteen years in virtually all developed
economies, with a tendency to converge.
Some convergence in size has also been
observed across euro area countries, with
countries with smaller ratios showing a generally
higher average growth than others. 2 These are,
however, very slow developments, that can be
appreciated only over a number of years.
MONEY MARKETS
The euro area money market has been
characterised by a high degree of integration
since shortly after the introduction of the euro.
Given its function of channelling funds to
enable banks to cover their most immediate
funding needs, the money market is by nature
vulnerable and sensitive to counterparty risk.
For this reason, it was strongly affected by
the crisis, but was also the market where the
recovery has been more prompt and evident.
A full assessment of the impact of the crisis
on fi nancial integration will only be possible
after some time. However, the latest evidence
from the indicators of fi nancial integration
described in this report suggests a gradual
return to a normal functioning of the market.
Taking the sudden deepening of the crisis
following the bankruptcy of Lehman Brothers
(September 2008) as the starting point,
three phases can be distinguished. In the fi rst,
discussed extensively in last year’s report
and lasting roughly until the end of 2008,
the turbulence had a sharp negative impact
on market integration. The second, until
May-June 2009, was characterised by a gradual
return to more stable conditions. Finally, in the
months thereafter, the further support measures
adopted by the ECB’s Governing Council
contributed to strengthen and consolidate those
gains, with further benefi cial effects also on
fi nancial integration.
During the second phase, the improvement in
the activity indicators – encompassing both
prices and quantities – refl ected the gradual
effect of the various policy actions undertaken
Notable exceptions are small fi nancial centres such as 2
Luxembourg and Ireland.
Chart 1 Size of capital markets
(aggregate volume of shares, bonds and loans to the private sector as a percentage of GDP)
0
200
400
600
800
1,000
1,200
0
200
400
600
800
1,000
1,200
1990-1994
1995-1999
2000-2004
2005-2008
1 2 3 4 5 6 7 8 9 10111213141516171819
1 BE
2 DE
3 IE
4 GR
5 ES
6 FR
7 IT
8 LU
9 NL
10 AT
11 PT
12 FI
13 EX
14 EA
15 CH
16 SE
17 UK
18 JP
19 US
Sources: WFE, IMF, Datastream, Eurostat and ECB calculations.

13ECB
Financial integration in Europe
April 2010
I RECENT
DEVELOPMENTS
IN FINANCIAL
INTEGRATION IN
THE EURO AREA
in the last quarter of 2008, as well as the
improved international environment. A key
element in improving market conditions, also
from the perspective of cross-border integration,
was given by the Eurosystem’s “enhanced credit
support” measures, in particular the fi xed rate
tenders with unlimited amounts and maturities
of up to one year.
The pace of improvement accelerated further
after the announcement and subsequent
settlement of the fi rst one-year LTRO (7 May and
25 June 2009 respectively). The fi rst one-year
LTRO attracted unprecedented demand, both
in terms of volume (€442 billion were allotted)
and in terms of the number of participating
banks (1,121 bidders). The demand in
the second one-year LTRO, conducted on
30 September 2009, was lower (€75 billion),
but the number of bidders remained high
(589 banks). The third and last one-year LTRO,
conducted on 16 December 2009, attracted
fewer banks (224 banks) for a total allotted
amount of €97 billion.
The substantial liquidity surplus that resulted
and the stability signals provided by the longer-
term refi nancing put signifi cant downward
pressure on short-term interest rates. The
EONIA – which measures banks’ overnight
funding costs – moved lower and closer to the
Eurosystem’s deposit facility rate, with
overnight operations trading close to, or – in
some cases – even below, the deposit facility
rate.3 The one-year LTROs also contributed to a
signifi cant decline in forward and longer-term
rates. Both the unsecured and secured cash
curves have shifted signifi cantly downwards
since the fi rst operation. By the end of 2009, the
three-month EURIBOR fi xing in the unsecured
market declined to below 0.70%, from around
1.20% before the operation, the six-month fi xing
was below 1%, down from 1.40%, while the
12-month fi xing was below 1.25%, from 1.58%.
A similar pattern was visible in the EONIA
swap curve, which declined sharply after the
fi rst one-year LTRO. In July 2009, following
the ECB’s press conference after the Governing
Council meeting, overnight index swap (OIS)
rates declined further, refl ecting market
participants’ expectations that ample liquidity
conditions would prevail for some time to
come.
Price-based indicators reveal that,
notwithstanding the still evident effect of the
crisis on the overall dispersion of funding
rates across countries, a convergence of
cross-border funding costs has taken place
recently, supported by the Eurosystem-wide
provision of liquidity. Quantity-based indicators,
by contrast, suggest the opposite, as they
show an increase in the domestic component
for turnover in the unsecured and repo money
markets.
While the vast amount of liquidity provided
by the Eurosystem was the major force behind
fi nancial convergence, as illustrated by the
dispersion of money market rates, from the
quantity side a retrenching towards domestic
funding was observed. Indeed, the limited effect
of policy measures on quantities, as compared
with prices, indicates that the impact of the
crisis on money market integration is still far
from coming to an end.
PRICE-BASED INDICATORS OF INTEGRATION
The cross-sectional standard deviation of the
overnight EONIA lending rates across euro area
countries increased, from a level of 1 basis point
in 2006, to 4 basis points in mid-2007, then
reaching more than 15 basis points in
October 2008 and in the second quarter of 2009
before returning to 4 basis points by August 2009
(see Chart 2 and Chart C1 in the Statistical
Annex). The period of high cross-country
dispersion, spanning roughly from the Lehman
Brothers’ demise to the beginning of 2009,
correspond to the period of most acute and
widespread uncertainty about counterparty
resilience. Since it is not possible in many cases
to ascertain whether the counterparties are
located domestically or internationally, and the
For instance, banks issuing STEP notes on the French short-term 3
paper market could refi nance themselves at rates below 0.25%
for all maturities of up to nine days.

14ECB
Financial integration in Europe
April 2010
precise nature and extent of the risks they are
subject to, price measures refl ect a mix of
varying perceptions and expectations on the part
of market participants, coupled with a high
degree of risk aversion.4
After peaking at the end of 2008, partly due to
window-dressing behaviour, the cross-country
dispersion of money market lending rates
declined signifi cantly after the turn of the year
and in the fi rst quarter of 2009, although there
was still noticeable day-to-day volatility. The
positive effect of the Eurosystem measures
announced in early May 2009 on the euro money
market marked the transition to the more recent
phase of the crisis. The last time at which the
daily standard deviation was at a value above
15 basis points was on 29 April 2009, with
24 June 2009 marking the last date at which the
daily standard deviation reached a level above
10 basis points.
Similar developments to those observed in the
overnight market were also evident – albeit
less dramatically – across longer maturities,
refl ecting the drying up of liquidity across a
signifi cant maturity spectrum and suggesting the
existence of high perceived counterparty risk for
market participants engaged in wholesale-based
funding strategies with maturity transformation.
Unlike the overnight market, however, cross-
country dispersion of longer maturity rates in the
euro area only increased sharply in the aftermath
of the collapse of Lehman Brothers. Indeed, the
high cross-country dispersion of interbank rates
prevailing in early 2009 was limited to the short
end of the money market yield curve (maturities
of less than one month).
An in-depth analysis of the dispersion of
interbank rates within and across countries
in the euro area provides another perspective
of the regional characteristics of uncertainty.
A comparison of the standard deviation of the
EURIBOR across and within euro area countries
reveals that the cross-country segmentations
that were so evident in the most acute phase
of the crisis, which explain the large spread
between domestic and cross-border standard
deviation (see Chart 3), have faded away in the
more recent months. As the crisis waned, the
dispersion of rates within country and across
countries gradually converged for both the
one-month and the 12-month EURIBOR. This
dispersion, however, remained signifi cantly
above the levels that characterised the pre-crisis
period. This suggests that market functioning
remains far from its pre-crisis levels, although
there is no signifi cant difference in its extent
between the domestic and the cross-border
components.
While the price diversity in the early phases of the
crisis stemmed largely from the pricing behaviour
vis-à-vis foreign counterparties, as noted in the
2009 Report, the remaining dispersion as the
crisis eased showed little or no distinction related
to the geographical location of the counterparties.
This may suggest weaker reasons for concern
from the perspective of fi nancial integration.
However, this interpretation must be taken with
caution, since there is evidence that the mix of
market players may have changed as a result of
See the Statistical Annex for a detailed description of the price-4
based indicators.
Chart 2 Cross-country standard deviation of the average unsecured interbank lending rates across euro area countries
(61-day moving average; basis points)
0
2
4
6
8
10
12
14
16
18
0
2
4
6
8
10
12
14
16
18
1999 2000 2001 2002 2003 2004 2005 2006 2007 2008 2009
overnight
1-month maturity
12-month maturity
Sources: EBF and ECB calculations.

15ECB
Financial integration in Europe
April 2010
I RECENT
DEVELOPMENTS
IN FINANCIAL
INTEGRATION IN
THE EURO AREA
the crisis, with the more risky ones concentrating
on domestic trades, while the larger and safer ones
remained active internationally. To the extent
that this is the case, cross-country segmentations
would not be inconsistent with the evidence of
an equal dispersion, regardless of location, that
emerges from the data.
Comparable indications emerge from the
dispersion of rates in the secured money market
segment, although the patterns there were more
subdued (see Chart 4).
Not only was the magnitude of the impact of the
crisis on rates’ cross-country dispersion half as
large as that of unsecured rates, but also the
duration was shorter, and prevailing conditions
as of September 2009 were almost at pre-crisis
levels for the one-month repo rate. The
subsequent increase in the dispersion since then
2009 owes much to the technical particularities
of the secured repo market.5
The fact that, by their nature, collateralised
transactions refl ect the security provided by
the collateral, which is similar across borders
in most cases, would seem to explain the lower
dispersion observed. Likewise, the abundant
liquidity provided, also against collateral,
by the Eurosystem at favourable conditions
played a key role in restoring better pricing
conditions in this market segment – more so
than in the unsecured one – as it addressed the
high demand for repos, and thereby their price.
This is also supported by the fi nding that the
dispersion of interest rates on longer maturities
Even though Eurepo contributions should be related to the most 5
liquid euro area government paper, an earlier defi nition referred
to all euro area governments. It included quotes from some
participants referred to collateral that experienced a signifi cant
rise in repo rates. For example, in early October 2009, the Greek
fi scal defi cit forecast was doubled and Greek collateral traded at
higher rates in the repo market.
Chart 3 Standard deviation of the EURIBOR
(basis points)
cross-country
within-countrydifference
1-month 12-month
0
5
10
15
20
25
30
0
5
10
15
20
25
30
Jan. Jan.May Sep. May Sep. Jan. May Sep.2007 2008 2009
-2
0
2
4
6
8
10
12
14
16
18
-2
0
2
4
6
8
10
12
14
16
18
Jan. Jan.May Sep. May Sep. Jan. May Sep.2007 2008 2009
Sources: EBF and ECB calculations.
Chart 4 Cross-country standard deviation of the average interbank repo rates across euro area countries
(61-day moving average; basis points)
0
1
2
3
4
5
6
7
8
0
1
2
3
4
5
6
7
8
2002 2003 2004 2005 2006 2007 2008 2009
1-month maturity
12-month maturity
Sources: EBF and ECB calculations.

16ECB
Financial integration in Europe
April 2010
took longer to return to lower levels; a sharp
decline in the dispersion was only seen after
the launch of the one-year LTROs. Indeed, the
last daily cross-country standard deviations of
the 12-month EUREPO rates above 8 and
6 basis points were at the end of April (prior
to the announcement of the one-year LTRO)
and at the end of June (the time of its fi rst
settlement) respectively.
As was the case in the unsecured money market,
comparing the standard deviations across the
euro area with the within country average for the
(secured) EUREPO rates suggests that country-
specifi c factors declined in importance in driving
both the one-month and the 12-month EUREPO
rates by September 2009: the difference in the
dispersion of rates between within and across
countries converged to values close to those that
had prevailed prior to the most acute phase of
the crisis, then increased after September 2009
for the reasons explained above (see Chart 5).
The remaining rate dispersion for secured
transactions seems to have lost the bulk of the
geographical component observed at the peak of
the crisis, and now refl ects a more generalised
diversity of perceptions about counterparty risk.
Factors other than the residence of market
participants may have infl uenced the dispersion
of interbank rates in the more recent months.
Anecdotal information suggests that one may
have been the uncertainty about banks’ own
liquidity needs in the face of funding uncertainty.
It is also evident that both the announcement of
the one-year LTROs and the settlement of the
fi rst one had a substantial positive effect on
market integration. The gradual withdrawal
of these measures will reveal the extent to
which the integration of money markets returns
to pre-crisis levels.
QUANTITY-BASED INDICATORS OF INTEGRATION
A growing exposure of banks to domestic rather
than cross-border counterparties was observed
2009 in both the unsecured and the secured
markets (see Charts 6 and 7). 6 For the unsecured
volumes, the upward trend of activity with
domestic counterparties appears to have been
initiated as early as 2006, and can thus not be
ascribed to the crisis alone, although the crisis
subsequently played an important role. The drop
in lending turnover was concentrated mainly on
longer maturities (for instance, decreases of
47% and 56% were registered in the one to
three-month and in the three-month to one-year
segments respectively.
According to the Euro Area Money Market
Survey of September 2009, the impact of the
crisis on turnover in the unsecured market was
substantial, with 2009 average daily lending
turnover falling 20% against 2008 levels.
See 6 Euro Money Market Survey 2009, ECB, 24 September 2009
(available on the ECB’s website at www.ecb.europa.eu).
Chart 5 Standard deviation of EUREPO rates
(basis points)
cross-country
within-country
difference
1-month
0
2
4
6
8
10
12
0
2
4
6
8
10
12
Jan. Jan.May Sep. May Sep. Jan. May Sep.2007 2008 2009
12-month
0
2
4
6
8
10
12
14
0
2
4
6
8
10
12
14
Jan. Jan.May Sep. May Sep. Jan. May Sep.2007 2008 2009
Sources: EBF and ECB calculations.

17ECB
Financial integration in Europe
April 2010
I RECENT
DEVELOPMENTS
IN FINANCIAL
INTEGRATION IN
THE EURO AREA
Half of the market participants indicated
in September 2009 that the unsecured market
did not work effi ciently and an equal share
found that conditions had worsened relative
to 2008.
The impact of the crisis in the secured money
market was less clear. The share of domestic
transactions declined between 2007 and 2008,
rising again in 2009 (see Chart 7). This increase
was remarkable, as it took place – unlike
the decrease registered in 2008 – against the
backdrop of increasing borrowing and roughly
stable lending volumes.
In terms of the turnover maturity structure, there
was a clear tendency to shorter maturities, with
overnight transactions accounting for close
to 30% in 2009, compared with well below
20% in 2007.
It is hard to predict at this stage how lasting
the negative effect of the crisis on the activity
of secured and unsecured money markets
will be, especially considering that the liquidity
provision by the Eurosystem will play less of a
supporting role in the coming months.
OTHER INDICATORS
In contrast to the unsecured and secured
money market segments, the market for short-
term securities has shown only limited signs
of integration since the introduction of the
euro, mainly because of differences in market
practices and standards, legal systems and
regulatory frameworks.
Notwithstanding the domestic nature of
commercial paper markets, the STEP initiative –
which fosters the integration of this market by
promoting the convergence of market
standards – has proved successful.7 Securities
with a STEP label developed in recent years
more dynamically than euro denominated
commercial paper (see Chart 8). Partly
underlying this development is the eligibility of
commercial paper with the STEP label as
collateral for Eurosystem credit operations,
underlining the important role that harmonised
requirements at the euro area level – in this case
See “Special Feature B – The STEP initiative”, 7 Financial Integration in Europe, ECB, April 2008, and Chapter III of this
report.
Chart 6 Geographical counterparty breakdown for unsecured transactions
(percentages)
0
20
40
60
80
100
0
20
40
60
80
100
2002 2003 2004 2005 2006 2007 2008 2009
national
euro area
other
Source: ECB’s Euro Money Market Survey 2009.
Chart 7 Geographical counterparty breakdown for secured transactions
(percentages)
0
20
40
60
80
100
0
20
40
60
80
100
2003 2004 2005 2006 2007 2008 2009
national
euro area
other
Source: ECB’s Euro Money Market Survey 2009.

18ECB
Financial integration in Europe
April 2010
the Eurosystem’s criteria for the eligibility of
collateral – can play in fostering market
integration.
A second dimension of policy initiatives with
an impact on the integration of money markets
is the settling since 1999 of large-value euro
payments in TARGET. Of particular relevance
was the enhanced and technically integrated
second generation system which has been in
operation since May 2008 and which is based on
a single shared platform that allows the provision
of a harmonised service level, ensures a single
price structure and benefi ts from economies of
scale supporting lower average prices.
In 2009, TARGET had a market share of 89%
by value and 60% by number of payments
processed in the two large-value payment
systems in euro, with the remainder being
accounted for by EURO1.
BOND MARKETS
The fi nancial turmoil has had a strong impact on
most euro area bond markets.
The impact of the crisis on government bond
markets was widely heterogeneous. Some
sovereign bond markets benefi ted from a
“fl ight to safety” effect as investors sought
to reduce risk by purchasing government
securities and became more selective
in evaluating borrowers’ creditworthiness.
Euro area sovereign spreads vis-à-vis the
German benchmark rose sharply during
the fi nancial turmoil, particularly in the
fi nal months of 2008. Since March 2009,
the sovereign spreads have decreased
substantially. However, at the end of 2009,
they still remained well above the pre-crisis
levels (see Chart 9), with Greek and Irish
spreads remaining wide.
Chart 8 Outstanding amounts of commercial paper
(percentage of GDP)
0
1
2
3
4
5
6
7
8
9
10
0
1
2
3
4
5
6
7
8
9
10
20092008200720062005200420032002200120001999
STEP
commercial paper in EuropeUS commercial paper
Sources: ECB, Euroclear, Banque de France, Dealogic and Federal Reserve.
Chart 9 Ten-year government bond yield spread vis-à-vis the German bond
(daily data; basis points)
-50
0
50
100
150
200
250
300
350
400
-50
0
50
100
150
200
250
300
350
400
GR
IE
IT
NL
PT
AT
BEES
FIFR
Jan. Jan.Apr. July2008
Oct. Jan. Apr. July Oct.2009
Source: Thomson Reuters Financial Datastream.

19ECB
Financial integration in Europe
April 2010
I RECENT
DEVELOPMENTS
IN FINANCIAL
INTEGRATION IN
THE EURO AREA
The generalised decrease in spreads in 2009
may partly be related to a repricing of credit
risk as a result of relative differences in
the creditworthiness of sovereign issuers
(a country-specifi c effect), and partly to
improved market liquidity (a general effect).
An estimate of the credit risk premium can be
derived from the credit default swap (CDS)
premium on government bonds.8 Specifi cally,
the comparison of the individual euro area
countries’ CDS spread vis-à-vis the German
CDS benchmark with the corresponding
sovereign yield spread shows that they moved
in parallel in the case of Austria, Belgium,
Greece, Ireland, Italy, the Netherlands, Portugal
and Spain. This suggests that credit default risk
is one of the main reasons for fl uctuations in the
respective credit spreads (see Chart 10).
On the one hand, by the end of the year, the
difference in the CDS spread vis-à-vis the
German fi ve-year CDSs was greatest for
Greece and Ireland, the countries that featured
the highest budget defi cits in 2008 and 2009.
Spreads also remained high for Italy, Spain
and Portugal. On the other hand, although
Austria’s budget defi cit was considerably
below the euro area average in 2008 and 2009
and its public debt is limited, Austria’s CDS
spread remained at elevated levels. Its elevated
CDS premium in comparison with the German
CDS premium may possibly be explained by
Austrian banks’ relatively high exposures to
central and eastern European (CEE) countries,
many of which are still challenged by the
international economic crisis.
CDS spreads have decreased considerably since
March 2009, but they remained far above the
pre-crisis levels at the end of 2009. This implies
that, given the economic outlook, sovereign risk
has been repriced and that the country risk factor
continues to play a major role.
Conversely, the difference between French and
German CDSs fl uctuated around zero, while
French-German bond yields spreads have risen
with the fi nancial turmoil. Similar developments
occurred for Finland. Given that the CDS
spread captures the country risk factor, the gap
between the CDS spread and the bond yield
A CDS is a swap contract in which the 8 buyer of the CDS makes
a series of payments to the seller and, in exchange, receives
a payoff if a credit instrument (typically a bond or loan) goes
into default. CDSs are traded over-the-counter and their degree
of liquidity may vary, hence the information drawn from their
prices should be treated with care.
Chart 10 Average five-year CDS premia
(daily data; basis points)
0
20
40
60
80
100
120
140
160
180
200
0
20
40
60
80
100
120
140
160
180
200
AT, BE, GR, IR, IT, NL, PT, ES, CDS spread
against DE
AT, BE, GR, IR, IT, NL, PT, ES, yield spread
against DE
20092008May July Sep. Nov. Nov.May July Sep.Jan. Jan.Mar.
-20
0
20
40
60
80
100
-20
0
20
40
60
80
100
20092008May July Sep. Nov. May July Sep.Jan. Nov. Jan.Mar.
FI, FR CDS spread against DE
FI, FR yield spread against DE
Sources: Thomson Reuters Financial Datastream.Note: The fi ve-year CDS (yield) spread is computed as a difference between the fi ve-year CDS (bond yield) of the respective countries against the CDS (bond yield) of Germany.

20ECB
Financial integration in Europe
April 2010
spread can be explained mainly by differences
in liquidity effects, which – given the size of
the Bund futures market – favoured the German
bond market.9
In order to examine the role of liquidity
premia further, the yields of specifi c bonds
with similar credit quality were compared.
Specifi cally, government-guaranteed agency
bonds can help to disentangle credit and
liquidity premia in the sovereign market.
Since the credit risk component of agency
bond yields is assumed to be the same as that
of bonds issued directly by the guaranteeing
government, any differences between agency
and government bond yields should refl ect
liquidity effects.
Focusing on the two largest euro area countries,
this analysis uses bonds issued by the German Kreditanstalt für Wiederaufbau (KfW) and the
French Caisse d’Amortissement de la Dette Sociale (CADES). While the objectives and
core activities of these institutions differ, both
have an explicit and full debt guarantee from the
respective governments. Furthermore, the KfW
and CADES are the largest euro area agencies
in terms of issuance volume and, unlike other
agencies, the number of outstanding bonds is
suffi cient to estimate reliable yield curves.
Chart 11 presents the spreads between the
French and German two-year and the ten-year
sovereign and agency bonds. The results are
qualitatively the same for other maturities. It is
striking that although a pronounced peak was
observed for the French-German sovereign
spread in the fi rst half of 2009, the agency
spread between CADES and KfW remained
remarkably stable with an absolute divergence
of less than 10 basis points, suggesting that
there were no signifi cant changes in the relative
perceived credit quality of the sovereign
issuers. However, the two-year and the ten-
year sovereign spreads, which peaked at 33 and
54 basis points respectively on 9 December
2008 and 9 March 2009, call for liquidity
factors favouring the German bond market in
relative terms, particularly at longer maturity.
This implies not only that there is a certain
degree of market specialisation in the euro
area, but also that the associated liquidity risks
have changed over time, increasing during the
turmoil and decreasing after the Governing
Council’s decision of 5 March 2009 to
continue the fi xed rate tender procedure with
full allotment for the refi nancing operations for
as long as necessary.10
Useful is also the assessment of developments
in the covered bond market, a class of bonds
generally issued by banks and backed by assets,
typically mortgages or public sector loans.
For further details, see “Box 4 – New evidence on credit and 9
liquidity premia in selected euro area sovereign yields”, Monthly Bulletin, ECB, September 2009.
There need not be a one-to-one relationship between market 10
liquidity and segmentation. For example, during the fi nancial
turmoil, the sovereign liquidity premium increased in highly
integrated markets such as in the United States. By contrast,
other features of this relationship are related to the presence
of idiosyncratic elements such as, in the euro area, different
fi scal regimes, market conventions and other national fi nancial
characteristics.
Chart 11 Zero coupon sovereign and agency yield spreads
(fi ve-day moving averages; basis points)
-20
-10
0
10
20
30
40
50
60
-20
-10
0
10
20
30
40
50
60
Jan.
2006
July Jan.
2007
July Jan.
2008
July Jan. Jan.
2009
July
FR-DE 2 years
FR-DE 10 years
CADES-KfW 2 years
CADES-KfW 10 years
Sources: Bloomberg and ECB calculations.Note: Spreads between French and German sovereign bonds (red line) and French and German agency bonds (blue line) with ten-year maturity.
21ECB
Financial integration in Europe
April 2010
I RECENT
DEVELOPMENTS
IN FINANCIAL
INTEGRATION IN
THE EURO AREA
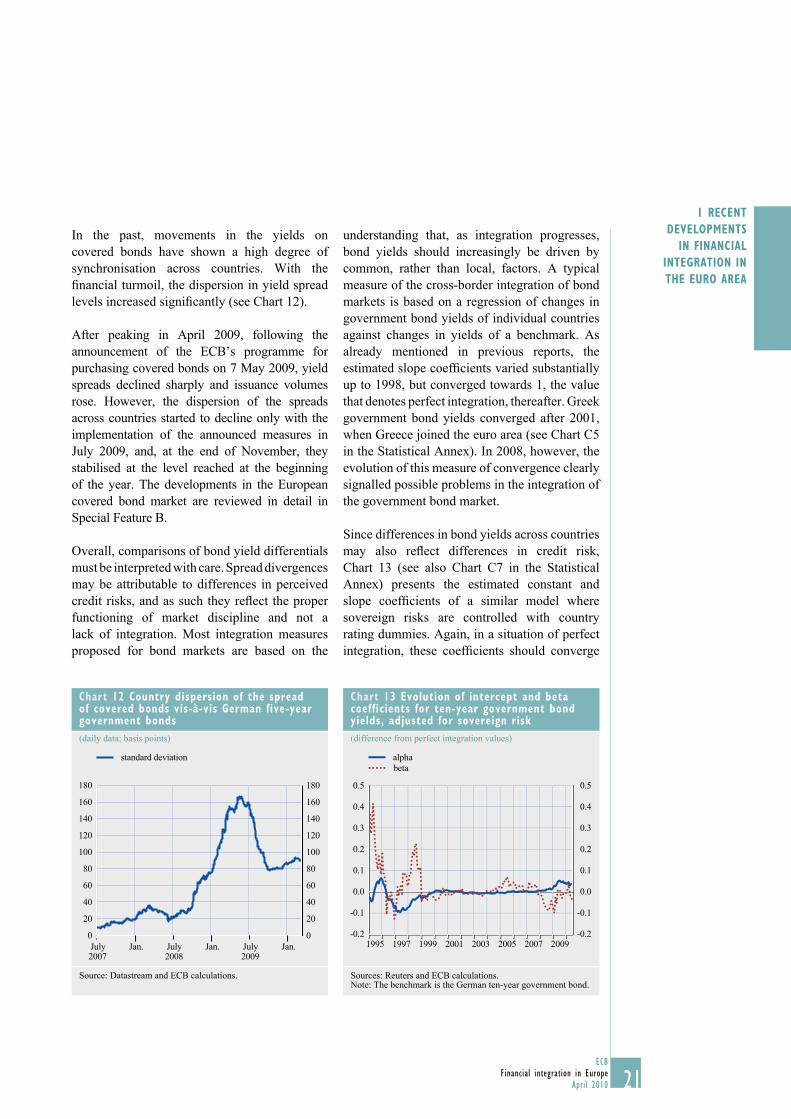
In the past, movements in the yields on
covered bonds have shown a high degree of
synchronisation across countries. With the
fi nancial turmoil, the dispersion in yield spread
levels increased signifi cantly (see Chart 12).
After peaking in April 2009, following the
announcement of the ECB’s programme for
purchasing covered bonds on 7 May 2009, yield
spreads declined sharply and issuance volumes
rose. However, the dispersion of the spreads
across countries started to decline only with the
implementation of the announced measures in
July 2009, and, at the end of November, they
stabilised at the level reached at the beginning
of the year. The developments in the European
covered bond market are reviewed in detail in
Special Feature B.
Overall, comparisons of bond yield differentials
must be interpreted with care. Spread divergences
may be attributable to differences in perceived
credit risks, and as such they refl ect the proper
functioning of market discipline and not a
lack of integration. Most integration measures
proposed for bond markets are based on the
understanding that, as integration progresses,
bond yields should increasingly be driven by
common, rather than local, factors. A typical
measure of the cross-border integration of bond
markets is based on a regression of changes in
government bond yields of individual countries
against changes in yields of a benchmark. As
already mentioned in previous reports, the
estimated slope coeffi cients varied substantially
up to 1998, but converged towards 1, the value
that denotes perfect integration, thereafter. Greek
government bond yields converged after 2001,
when Greece joined the euro area (see Chart C5
in the Statistical Annex). In 2008, however, the
evolution of this measure of convergence clearly
signalled possible problems in the integration of
the government bond market.
Since differences in bond yields across countries
may also refl ect differences in credit risk,
Chart 13 (see also Chart C7 in the Statistical
Annex) presents the estimated constant and
slope coeffi cients of a similar model where
sovereign risks are controlled with country
rating dummies. Again, in a situation of perfect
integration, these coeffi cients should converge
Chart 12 Country dispersion of the spread of covered bonds vis-à-vis German five-year government bonds
(daily data; basis points)
0
20
40
60
80
100
120
140
160
180
0
20
40
60
80
100
120
140
160
180
Jan.July Jan.July Jan.July2007 2008 2009
standard deviation
Source: Datastream and ECB calculations.
Chart 13 Evolution of intercept and beta coefficients for ten-year government bond yields, adjusted for sovereign risk
(difference from perfect integration values)
-0.2
-0.1
0.0
0.1
0.2
0.3
0.4
0.5
-0.2
-0.1
0.0
0.1
0.2
0.3
0.4
0.5
1995 1997 1999 2001 2003 2005 2007 2009
alpha
beta
Sources: Reuters and ECB calculations.Note: The benchmark is the German ten-year government bond.
22ECB
Financial integration in Europe
April 2010
towards 1 (0 in Chart 13, since the slope is
normalised by subtracting 1), assuming that no
variables other than sovereign risk are affecting
the change in yield.11
This indicator shows that, even after accounting
for differences in sovereign risk, there are signs
of divergence from the theoretical benchmark
value. Under the hypothesis that the credit
assessment of the markets is the same as that of
the rating agencies, this evidence suggests that
spreads in the government bond market remain
sizeable even after controlling for country credit
risk, and that liquidity risk premia remain non-
negligible, partly refl ecting the lack of non-
Bund euro-denominated bond futures markets.
However, it should be pointed out that both
coeffi cients had started to converge towards
0 by the end of 2009.
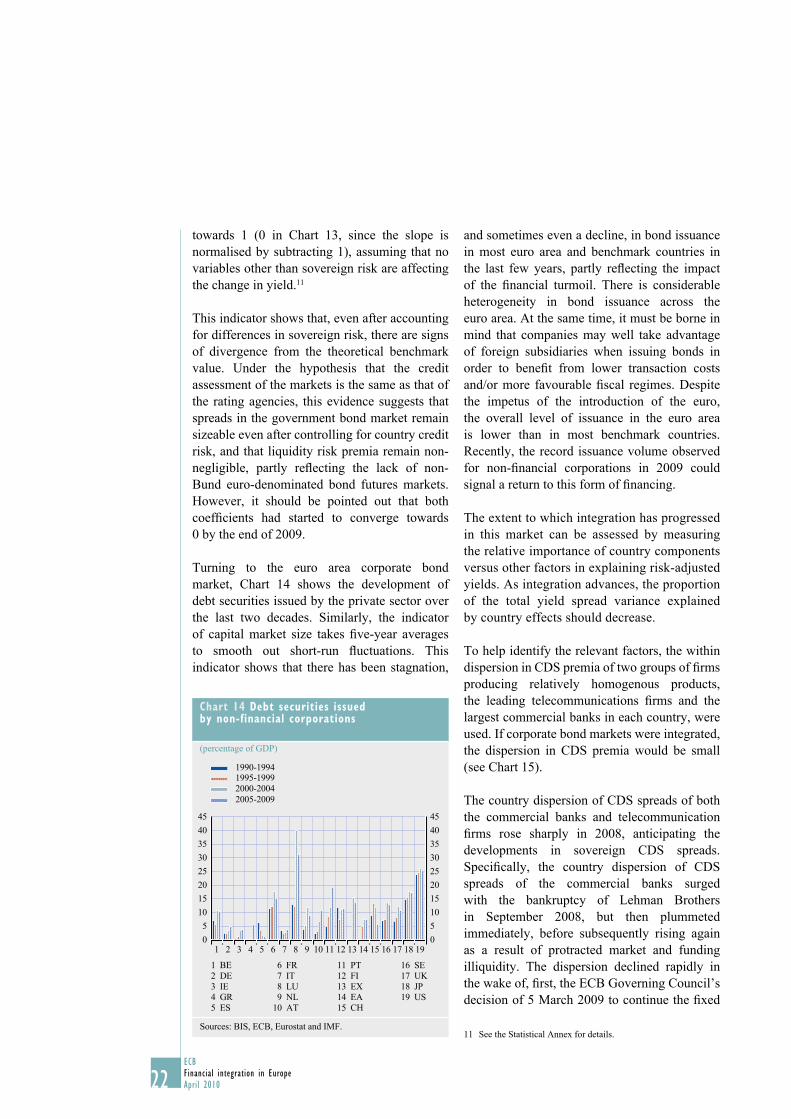
Turning to the euro area corporate bond
market, Chart 14 shows the development of
debt securities issued by the private sector over
the last two decades. Similarly, the indicator
of capital market size takes fi ve-year averages
to smooth out short-run fl uctuations. This
indicator shows that there has been stagnation,
and sometimes even a decline, in bond issuance
in most euro area and benchmark countries in
the last few years, partly refl ecting the impact
of the fi nancial turmoil. There is considerable
heterogeneity in bond issuance across the
euro area. At the same time, it must be borne in
mind that companies may well take advantage
of foreign subsidiaries when issuing bonds in
order to benefi t from lower transaction costs
and/or more favourable fi scal regimes. Despite
the impetus of the introduction of the euro,
the overall level of issuance in the euro area
is lower than in most benchmark countries.
Recently, the record issuance volume observed
for non-fi nancial corporations in 2009 could
signal a return to this form of fi nancing.
The extent to which integration has progressed
in this market can be assessed by measuring
the relative importance of country components
versus other factors in explaining risk-adjusted
yields. As integration advances, the proportion
of the total yield spread variance explained
by country effects should decrease.
To help identify the relevant factors, the within
dispersion in CDS premia of two groups of fi rms
producing relatively homogenous products,
the leading telecommunications fi rms and the
largest commercial banks in each country, were
used. If corporate bond markets were integrated,
the dispersion in CDS premia would be small
(see Chart 15).
The country dispersion of CDS spreads of both
the commercial banks and telecommunication
fi rms rose sharply in 2008, anticipating the
developments in sovereign CDS spreads.
Specifi cally, the country dispersion of CDS
spreads of the commercial banks surged
with the bankruptcy of Lehman Brothers
in September 2008, but then plummeted
immediately, before subsequently rising again
as a result of protracted market and funding
illiquidity. The dispersion declined rapidly in
the wake of, fi rst, the ECB Governing Council’s
decision of 5 March 2009 to continue the fi xed
See the Statistical Annex for details.11
Chart 14 Debt securities issued by non-financial corporations
(percentage of GDP)
0
5
10
15
20
25
30
35
40
45
0
5
10
15
20
25
30
35
40
45
1990-19941995-1999
2000-2004
2005-2009
1 2 3 4 5 6 7 8 9 10 11 12 13 14 15 16 17 18 19
1 BE
2 DE
3 IE
4 GR
5 ES
6 FR
7 IT
8 LU
9 NL
10 AT
11 PT
12 FI
13 EX
14 EA
15 CH
16 SE
17 UK
18 JP
19 US
Sources: BIS, ECB, Eurostat and IMF.

23ECB
Financial integration in Europe
April 2010
I RECENT
DEVELOPMENTS
IN FINANCIAL
INTEGRATION IN
THE EURO AREA
rate tender procedure with full allotment and,
then, the implementation of the covered bond
purchase programme in July 2009.
Conversely, the country dispersion of CDS
spreads in the telecommunication sector already
started to decline in January 2009 and followed
the pattern of sovereign CDSs during the
year. At the end of 2009, the dispersion in the
commercial bank CDS market remained above
that in the sovereign CDS market, while that
in the telecommunication industry was lower,
suggesting that the market for commercial bank
bonds remains heavily subject to perceived
credit risk.
The quantity-based indicators also point to
decreasing integration in the corporate bond
market in 2008 and 2009. Cross-border
holdings of debt securities by MFIs decreased
from about 40% in 2006 to just above 30%
in 2009 (see Chart 16 and Chart C9 in the
Statistical Annex).
The decline in the proportion of cross-border
euro area holdings of government bonds in
2006 and 2007 refl ects a substitution between
government and corporate bonds in the
portfolios of MFIs, which can be explained
by MFIs’ diversifi cation of their investments
in search of higher yields in the fi xed income
market. The decline of cross-border holdings
in 2008 and 2009, by contrast, results from
the MFIs’ holdings of debt securities issued
by non-fi nancial corporations declining sharply.
The integration of bond and equity markets
relies greatly on the degree of integration
of the underlying infrastructure, in particular
that of the securities settlement systems (SSSs)
and central counterparties (CCPs).12
There were 22 legal entities operating a
central securities depository (CSD) in the euro
area in 2009. The increase by one from the
previous year is explained by the enlargement
SSSs also play a crucial role in the Eurosystem’s collateral 12
framework, as they provide the necessary infrastructure to allow
counterparties to transfer collateral to the Eurosystem. It is
interesting to note that the share of cross-border collateral held
by the Eurosystem has increased signifi cantly from 28% in 2002
to 50.2% in 2006, and stood at 45.3% in 2008 (see Chart C13 in
the Statistical Annex).
Chart 15 Dispersion in five-year CDS premia among leading telecommunication firms and commercial banks across euro area countries
(daily data; basis points)
0
20
40
60
80
100
120
140
160
180
200
220
0
20
40
60
80
100
120
140
160
180
200
220
2004 2005 2006 2007 2008 2009
sovereign
telecomunication
commercial banks
Source: Thomson Reuters Financial Datastream.Notes: For detailed information on the construction of the sectoral indices, see Chart C8 in the Statistical Annex.
Chart 16 The share of MFI cross-border holdings of debt securities issued by euro area and EU non-MFIs: outstanding amounts, by residency of the issuer
(share of total holdings; excluding the Eurosystem; percentages)
0
5
10
15
20
25
30
35
40
45
0
5
10
15
20
25
30
35
40
45
1997 1999 2001 2003 2005 2007
other euro area – government and corporate bonds
other euro area – corporate bonds
other euro area – government bonds
rest of EU – government and corporate bonds
Source: ECB.Notes: This indicator shows the geographical counterparty diversifi cation of securities held by euro area MFIs vis-à-vis the non-MFI sector over the total amount outstanding. Debt securities issued by domestic non-MFIs and non-MFIs in the rest of the world are not displayed in the chart.

24ECB
Financial integration in Europe
April 2010
of the euro area to also include Slovakia and its
local CSD.
Integration between, and consolidation
among, SSSs can take various forms. Within
the Euroclear group, the Belgian, Dutch
and French CSDs have operated on one
common platform, known as ESES (Euroclear
Settlement for Euronext-zone Securities), since
January 2009. Progress was also made in 2009
in the implementation of the “Link Up Markets”
initiative. In terms of technically integrating
settlement, the most signifi cant initiative is
the Eurosystem’s pan-European securities
settlement platform T2S.
EQUITY MARKETS
The very large fl uctuation of equity prices in
recent times (with sustained growth prior to the
fi nancial turmoil followed by a sharp decline
until March 2009 and a subsequent recovery)
does not seem to have had an appreciable
impact on the degree of cross-border integration
of European equity markets.
Chart 17 displays the synchronicity of stock
returns across euro area and reference countries.
This indicator of development assesses the
information capacity of stock markets that is
based on the synchronicity of companies’ stock
returns within a market. If fi rms’ stock prices
are driven mainly by market-wide factors and
not by fi rm-specifi c news, they tend to move
together, indicating that little valuable
fi rm-specifi c information is revealed to, or used
by, investors. The measure is obtained from
the explained variance of stock returns when
regressing them on a number of market-wide
and global factors.13 Higher bars therefore
represent a higher synchronicity of stock
returns, which in turn indicates a lower
information content of individual stock prices.
The extent to which equity markets are
information effi cient varies across the euro area
and is generally comparable to the benchmark
countries. While stock markets had become
informationally more effi cient in the 1990s,
most equity markets have become somewhat
less effi cient over the past few years in
incorporating fi rm-specifi c news in prices.
Furthermore, the increase in the synchronicity
of stock returns observed in the last period is
due mainly to the 2008 results, where the
general downward movements of stock markets
clearly increased the amount of variation in
returns that can be explained by market-wide
common shocks.
It is harder to assess the degree of integration of
equity markets than that of money and government
bond markets as equity returns are not directly
comparable. One simple integration indicator
compares the country and sectoral dispersions in
monthly stock returns over time. Dispersions are
indicative of the diversifi cation opportunities:
the higher the dispersion, the greater the
benefi ts in terms of risk reduction from a proper
diversifi cation strategy. Chart 18 shows that,
For details, see “Special Feature A – Financial development: 13
concepts and measures”, Financial Integration in Europe, ECB,
April 2008.
Chart 17 Pricing of firm specific-information in the stock market
(R2 statistics)
0.00
0.05
0.10
0.15
0.20
0.25
0.30
0.35
0.40
0.45
0.50
0.00
0.05
0.10
0.15
0.20
0.25
0.30
0.35
0.40
0.45
0.50
1990-1994
1995-1999
2000-2004
2005-2009
1 2 3 4 5 6 7 8 9 10 11 12 13 14 15 16 17 18
1 AT
2 BE
3 DE
4 ES
5 FI
6 FR
7 GR
8 IE
9 IT
10 LU
11 NL
12 PT
13 EA
14 CH
15 SE
16 UK
17 JP
18 US
Sources: Datastream and ECB calculations.

25ECB
Financial integration in Europe
April 2010
I RECENT
DEVELOPMENTS
IN FINANCIAL
INTEGRATION IN
THE EURO AREA
since 2001, the benefi ts of diversifi cation through
sector-based equity investment strategies have
been at least of the same size as those obtained
through country-based strategies. These results
are consistent with a paradigm change in the asset
management industry, involving a progressive
move from a country-based to a sector-based
equity allocation strategy, which should ultimately
lead to a reduction in home bias.
A complementary, direct strategy to quantify
the impact of integration in equity markets
consists in looking at the cross-country asset
allocations in investors’ portfolios. In a truly
integrated market, investors should not, all other
things being equal, prefer national over foreign
equities.
Quantity-based measures indicate a rising
degree of integration in equity markets.
As shown in Chart 19, euro area residents
constantly increased their holdings of equity
issued in other euro area countries (expressed as
a share of their total portfolio of shares issued in
their own country and elsewhere in the euro area)
between 2001 and 2007. Moreover, this share
increased very substantially further in 2008.
On the other hand, since 2001, the share of euro
area equity assets held outside the euro area has
remained at a far lower level and has increased
only marginally.
The moves out of domestic equity and into
equity issued elsewhere in the euro area
displayed in the previous indicators were
also due to the contribution of institutional
investors. Chart 20 shows that the percentage
of investment funds’ total holdings of all shares
Chart 18 Filtered country and sector dispersions in euro area equity returns
(percentages)
0.00
0.01
0.02
0.03
0.04
0.05
0.06
0.00
0.01
0.02
0.03
0.04
0.05
0.06
sector
country
1973 1979 1985 1991 1997 2003 2009
Sources: Thomson Reuters Financial Datastream and ECB calculations.
Chart 19 The degree of cross-border holdings of equity issued by euro area residents
(percentages)
0
0.05
0.10
0.15
0.20
0.25
0.30
0.35
0.40
0.45
0
0.05
0.10
0.15
0.20
0.25
0.30
0.35
0.40
0.45
intra trade extra trade
2001
2002
2003
2004
2005
2006
2007
2008
Source: ECB.
Chart 20 Investment funds’ holdings of equity issued in other euro area countries and the rest of the world
(percentage of total holdings of equity)
0
10
20
30
40
50
60
0
10
20
30
40
50
60
other euro area Member States
rest of the world
19991998 200020012002200320042005200620072008
Source: ECB.

26ECB
Financial integration in Europe
April 2010
and other equity (excluding investment fund
shares/units) issued by residents of the euro
area outside the Member State in which the
investment fund is located actually increased
from 17% to around 25%. The recent fi nancial
turmoil affected the allocation of euro area
investment only slightly.
Regarding market infrastructures, the euro
area securities settlement infrastructure for
equities is even less integrated than that for
bonds, also due to qualitative barriers, such as
differences in settlement cycles or the handling
of corporate events and taxation, which continue
to hinder progress in the integration of these
infrastructures.
In 2009, the clearing industry has been
subject to considerable change following
the implementation of the Code of Conduct
for Clearing and Settlement. In particular,
competition between CCPs had considerably
increased with the rise of “competitive
clearing”, i.e. exchanges being served by two
CCPs. Moreover, there has been a large number
of requests for establishing links between CCPs
and other market infrastructures which has led
to a further increase in effective and potential
competition between CCPs. As a result, there
has been a sharp decline in clearing fees.
BANKING MARKETS
Euro area banking activities were profoundly
affected by the crisis, primarily as a result of
increased lending and funding risks, but also
as a consequence of government support and
regulatory initiatives being confi ned within
national borders. A general setback in banks’
and investors’ risk appetite was also observed.
STRUCTURAL INDICATORS
At a structural level, this setback was refl ected
in signifi cant changes in the euro area banking
landscape, where a number of group mergers
and “splits” as well as functional reorganisation
occurred. Simple measures of cross-border
activity – the degree of establishment and
activity of foreign branches and subsidiaries
over time – reveal a certain tendency away from
integration. The decline in the share of assets
held by cross-border branches and subsidiaries
of banking groups within a given country
in 2009 – a proxy for the degree of cross-border
integration of that country’s banking sector –
stood in contrast to the positive trend observed
in previous years. Although the median
share across countries had risen from 2006
to 2008, suggesting an increased relevance
of foreign-controlled institutions tapping
non-domestic markets up to that point in time,
fi gures for 2009 show a light reversal of this
trend (see Chart 21, and Charts C17 and C18 in
the Statistical Annex).
Indeed, the distribution across countries of this
indicator reveals that a general increase in the
share of foreign-located assets was observed
across the board until 2008, even though the
movement at the upper end of the distribution
(banking systems heavily geared to a foreign
presence) appears to have been mainly in the
opposite direction. By and large, banking
systems oriented more towards an international
business strategy appear to have taken a different
course in 2009 as a consequence of the crisis.
Chart 21 Dispersion of the total assets of euro area bank branches and subsidiaries across euro area countries
(percentage of the total assets of the euro area banking sector)
0
10
20
30
40
50
60
70
80
100
90
0
10
20
30
40
50
60
70
80
100
90
2001 2002 2003 2004 2005 2006 2007 2008 2009
Source: ECB.Notes: The lower and upper markers show the minimum and maximum shares across euro area countries. The bottom and top of the box show the fi rst and third quartiles, and the red line the median.

27ECB
Financial integration in Europe
April 2010
I RECENT
DEVELOPMENTS
IN FINANCIAL
INTEGRATION IN
THE EURO AREA
Similarly, bank cross-border merger and
acquisitions (M&As) experienced a marked
slowdown in 2009, even though the number
of transactions in the period was signifi cant
(see Chart 22).
Whereas the value of euro area cross-border
M&As increased substantially in the fi rst half
of 2008, as a consequence of the takeover of one
large institution, the fi gures for the subsequent
12 months were characterised by the unwinding
of very large internationally active institutions
whose business models were most affected
by the events that followed the collapse of
Lehman Brothers.
ACTIVITY-BASED INDICATORS
Retail activities were already fragmented
substantially prior to the crisis, unlike wholesale
and capital market activities that were more
closely integrated across borders, so that the
impact of the crisis on integration was more
evident in the case of the latter activities.
Indicators of banking activity provide some
evidence. The share of cross-border interbank
lending in total interbank lending revealed a
substantial level of integration: far more than
35% of all interbank loans were extended across
borders (see Chart 23).
The decline in the share of domestic activity
in the total observed since the beginning of this
decade was reversed in 2008, as reported in
last year’s report. Specifi cally, activity across
borders (both within and outside the euro area)
declined, marking a departure from the positive
trend that had been observed previously.
The setback in interbank activity across the
euro area and the EU, however, seems to have
slowed down somewhat in 2009.
Retail cross-border lending has traditionally
been characterised by far lower levels of
activity: less than 6% of all loans to non-credit
institutions were extended across borders to
euro area countries and less than half of that
percentage across borders to EU countries
(see Chart 24). Despite these modest levels,
cross-border lending had been rising slowly
over years, a trend that may – based on the most
recent developments – have been interrupted by
the onset of the crisis.
Chart 22 Euro area cross-border bank M&A activity
(value of intra-euro area cross-border M&As; absolute numbers)
0
10
20
30
40
50
60
0
2
4
6
8
10
12
14
2002 2003 2004 2005 2006 2007 2008 2009
value of cross-border deals (EUR billions; left-hand scale)
number of cross-border deals (right-hand scale)
Sources: Bureau van Dijk and ECB calculations.
Chart 23 Interbank (MFI) loans: outstanding amounts, broken down by residency of the issuer
(share of total holdings; excluding the Eurosystem; percentages)
0
10
20
30
40
50
60
70
0
10
20
30
40
50
60
70
domestic
other euro area Member States
rest of EU
1997 1999 2001 2003 2005 2007
Source: ECB.

28ECB
Financial integration in Europe
April 2010
Correspondingly, the share of domestic lending
activity in total lending seems to have stabilised,
after the decline that had been observed in the
last decade.
PRICE-BASED INDICATORS
The negative integration-related impact of the
crisis on banking activity is most evident in price
measures, where the cross-country dispersion
in interest rates increased sharply across
all maturities and loan sizes (see Chart 25).
Whereas cross-country dispersion of euro area
bank interest rates on loans to non-fi nancial
corporations had consistently remained at
relatively high levels since collection of these
statistics started in 2003, these measures have
increased substantially since the last report.
For cross-border loans of over fi ve years’
maturity and larger than €1 million, the
dispersion of rates across countries more than
doubled in the course of 2009, contributing to
the much wider dispersion across countries
in the perception of risk in the segment.
By contrast, the dispersion of interest rates on
loans to households continued to be stable in the
period under review and remained substantial
in the case of loans for consumption purposes
(see Chart C21 in the Statistical Annex).
Differences in bank interest rates can be
attributed to several factors, including different
conditions in national economies (credit and
interest rate risk, fi rm size, industrial structure
and the degree of capital market development),
Chart 25 Cross-country standard deviation of MFI interest rates on loans to non-financial corporations
(basis points)
0
10
20
30
40
50
60
70
80
90
0
10
20
30
40
50
60
70
80
90
floating rate and up to 1 year, up to and including
€1 million
floating rate and up to 1 year, over €1 million
over 5 years, up to and including €1 million
over 5 years, over €1 million
2003 2004 2005 2006 2007 2008 2009
Source: ECB.
Chart 24 MFI loans to non-MFIs: outstanding amounts, broken down by residency of the counterparty
(share of total holdings; excluding the Eurosystem; percentages)
0
1
2
3
4
5
6
0
1
2
3
4
5
6
other euro area Member States
rest of EU
1997 1999 2001 2003 2005 2007
83
84
85
86
87
88
89
90
91
92
93
83
84
85
86
87
88
89
90
91
92
93
domestic
1997 1999 2001 2003 2005 2007
Source: ECB.

29ECB
Financial integration in Europe
April 2010
I RECENT
DEVELOPMENTS
IN FINANCIAL
INTEGRATION IN
THE EURO AREA
institutional factors (taxation, regulation,
supervision and consumer protection) and
fi nancial structures (degree of bank/capital
market fi nancing and competitiveness). 14
Therefore, a greater dispersion of interest rates
across countries also refl ects the market’s
perceptions of the varied degree to which
national markets would respond to the shock
infl icted by the crisis.
In addition to the simple spread across
countries, the coeffi cient of convergence of
the speed with which different rates converge
to a specifi c benchmark – also called beta
convergence – provides an analytical measure
of the convergence of interest rates across euro
area banking systems (see Chart 26).15 Whereas
the evolution over time of the estimated slope
coeffi cients is almost always negative –
indicating convergence of the observed rate to the
benchmark rate – the speed of this convergence
decreased considerably after August 2007,
but seems to have turned around again later
in 2009. This evidence mitigates, to some extent,
the message conveyed by the rise in the interest
rate spreads.
OTHER INDICATORS
The low level of retail banking integration
depicted by quantitative indicators is also
associated with a still relatively high level of
fragmentation in the retail payments market.
This shortcoming is being addressed in the
context of the Single Euro Payments Area
(SEPA) project 16 Measuring the progress of
migration to SEPA at the national level,
as documented by the national SEPA credit
transfer (SCT) indicators (see Chart 27),17 there
are signifi cant differences across countries.
See 14 Differences in MFI interest rates across euro area countries,
ECB, September 2006.
See the Statistical Annex for technical details.15
See the ECB’s website at 16 www.ecb.europa.eu.
The results are published and updated regularly on the ECB’s 17
website at www.ecb.europa.eu.
Chart 26 Beta convergence for selected banking retail interest rates
-1.2
-1.0
-0.8
-0.6
-0.4
-0.2
0.0
0.2
-1.2
-1.0
-0.8
-0.6
-0.4
-0.2
0.0
0.2
1991 1993 1995 1997 1999 2001 2003 2005 2007 2009
loans to households for house purchases;
floating rate and up to 1 year initial rate fixation
loans to households for house purchases;
over 5 and up to 10 years initial rate fixation
loans to non-financial corporations up to
an amount of €1 million; floating rate and
up to 1 year initial rate fixation
loans to non-financial corporations over
an amount of €1 million; floating rate and
up to 1 year initial rate fixation
Source: ECB. Note: See the Statistical Annex for a precise defi nition of retail interest rates.
Chart 27 Credit transfer transactions processed in SEPA format (euro area countries)
(percentages; euro area countries)
10
20
30
40
50
60
70
80
90
100
10
20
30
40
50
60
70
80
90
100
SCT indicator (H1 2008)
SCT indicator (H2 2008)SCT indicator (H1 2009)
SCT indicator (H2 2009)
0 0BE DE IE GR ES FR IT CY LU MT NL AT PT SI SK FI
Source: ECB.

30ECB
Financial integration in Europe
April 2010
These differences in the usage of this pan-
European payment instrument could be
attributed in part to different regulatory
set ups,18 as well as to diverse time schedules
for the migration of important users such as
public authorities and large enterprises.19
At the European level, the euro area SCT
indicator shows that the use of the SCT has been
rising steadily since the launch of SEPA on
28 January 2008, and has accelerated in 2009
(see Chart C27 in the Statistical Annex).
Overall, the upward trend in all countries, as
well as at the European level as a whole,
demonstrates the ongoing progress towards
market integration.
The level of integration is still low,
as refl ected in the high number of national retail
payment infrastructures. On the other hand,
the concentration ratio of the largest fi ve retail
payment infrastructures in the euro area is rather
high; in 2008, these fi ve largest infrastructures
processed 86% of the total market volume
(Chart C26 in the Statistical Annex).
In Luxembourg, for example, use of the IBAN and BIC, the key 18
elements of an SCT, is mandatory also for domestic payments.
According to European Commission’s 2nd Survey on Public 19
Administrations’ Preparedness and Migration to SEPA, the share
of SCTs in all credit transfers initiated by public authorities in
March 2009 was 100% in Luxembourg, 60% in Slovenia and
18% in Belgium. The report is available on the Commission’s
website at http://ec.europa.eu

31ECB
Financial integration in Europe
April 2010
CHAPTER I I
SPECIAL FEATURES
A. BANKING INTEGRATION AND SUPERVISION
IN THE EU
The integration of European fi nancial markets in recent years has exposed, to an increasing extent, the challenges stemming from the fragmented nature of the EU’s supervisory architecture. Two links are relevant in this context. On the one hand, market integration requires a consistent area-wide regulatory and supervisory framework in order to maintain a level playing fi eld and to promote healthy cross-border competition. On the other hand, consistent regulation and supervision, in turn, facilitates further integration and enhances the effi ciency and competitiveness of the fi nancial sector in the EU.Against this background, this Special Feature comprises two related sections. The fi rst reviews the recent trends in cross-border banking, including the effect that the fi nancial crisis has had on them. All in all, while a number of measures seem to point to an increasing degree of integration in the last decade, there is also contrasting evidence and the overall picture is mixed. The second section discusses how the new EU supervisory architecture, besides responding to the challenges of fi nancial stability, is expected to also improve the level playing fi eld for cross-border banks and thereby foster integration in the EU banking markets further.
1 INTRODUCTION
The banking sector plays a central role in the
functioning of fi nancial markets in Europe; bank
loans account for almost half of the EU capital
markets. Banks are particularly important for
the provision of fi nancing for small and medium-
sized enterprises, a sector that is pivotal for
growth and job opportunities in the EU.1
Cross-border banking activity (a major driver
of banking integration) is largely concentrated
in large-sized banking groups. Cross-border
banking groups increase competition in the
EU banking markets and channel innovation in
fi nancial products and services across borders.
As a consequence, they also promote the use of
the most effi cient banking practices in the EU.
Developments in cross-border banking are thus
of great importance for fi nancial integration and
development in Europe.
This Special Feature presents, in its fi rst section,
a summary of the evidence on cross-border
banking integration on the basis of a number
of indicators. As already noted in earlier issues
of this report, wholesale and securities-related
activities continue being more integrated than
retail banking. The fi nancial crisis has slowed
or stopped the integration process in a number
of market segments. But there are reasons to
believe that the halt may be temporary, and
that the earlier trends may resume, perhaps
soon, since the fundamental drivers of banking
integration (effi ciency enhancements such as
the concentration of functions at the group
level, the transfer of technology and managerial
skills, diversifi cation and advances in the
harmonisation and integration of retail payment
legislation and infrastructures) remain in
place in the EU. The share of banking assets
held by foreign establishments in the EU is
expected to continue its increase after a decline
in 2008. Subsidiaries remain the dominating
form of foreign establishment in the EU and in
particular in the Member States that have joined
the EU in 2004 and 2007. Cross-border merger
and acquisition (M&A) activity has subdued
somewhat during the fi nancial crisis but is also
expected to pick up again once the economic
conditions will further improve.
See, for example, 1 Statistics Pocket Book, ECB, January 2010.
Capital markets are defi ned here as the sum total of bank credit,
outstanding debt securities and stock market capitalisation.
In the case of non-fi nancial corporations, bank loans accounted
for, on average, 63% of their total fi nancing between 2004 and
the second quarter of 2007. Four-fi fths of all small and medium-
sized enterprises use bank loans to fi nance their operations.
See “The external fi nancing of households and non-fi nancial
corporations”, Monthly Bulletin, ECB, April 2009, and “Special
Feature C – Financing of small and medium-sized enterprises and
young innovative companies in Europe”, Financial Integration Report, ECB, April 2009.

32ECB
Financial integration in Europe
April 2010
The second and fi nal section of the Special
Feature outlines the recent proposals for changes
to the EU supervisory framework. As cross-
border activities have increased, the adequacy of
the existing regulatory and supervisory set-up has
been questioned to an increasing degree. Efforts
to harmonise the EU regulatory and supervisory
framework in the past years have been based
on an evolutionary approach of intensifying
cooperation and coordination between national
supervisors. Although much had been achieved
in this way, it has become increasingly clear
over the years that cross-border banking may
be facilitated by further convergence and
consistency in implementation of EU legislation.
The fi nancial crisis has given new impetus to the
debate on fi nancial regulation and supervision
in Europe and resulted in a fundamental
review. Although the proposals for the new EU
supervisory architecture are aimed, fi rst and
foremost, at improving fi nancial stability in
the Single Market, they also have an additional
potential for fostering fi nancial integration
further, in particular in the fi eld of cross-border
banking. The creation of the European System
of Financial Supervisors (ESFS) is expected to
reduce barriers to fi nancial integration through
the development of a single EU rulebook, and
by ensuring that EU law is transposed uniformly
in national law and applied consistently in
day-to-day supervision. In addition, the
European Systemic Risk Board (ESRB) is
expected to enhance systemic stability in the
Single Market, and thus to promote the safe
and smooth functioning of the fi nancial system,
which can, in turn, increase the potential for
further fi nancial integration in Europe.
2 DEVELOPMENTS IN CROSS-BORDER BANKING
This section presents the recent developments
in cross-border provision of fi nancial services,
foreign establishments and cross-border
mergers and acquisitions (M&As). It also
presents evidence from an alternative measure
for assessing banking integration, based on the
convergence of bank profi tability.
Charts 28 and 29 depict the development of the
cross-border provision of fi nancial services in
the euro area since the start of Monetary Union.
The charts show that fi nancial integration has
advanced well over time in the wholesale and
securities activities, while that in the retail
banking market has lagged behind. The fi nancial
crisis has reduced the cross-border provision of
fi nancial services and, in particular, wholesale
and securities-related activities. Banks have
clearly been relying more on domestic than
on foreign counterparties in their transactions.
Chart 28 Cross-border provision of financial services in the euro area – assets
10
20
30
40
50
00
10
20
30
40
60 60
50
cross-border non-bank securities other than shares
cross-border interbank loans
cross-border loans to non-banks
cross-border non-bank shares and other equity
1999 2000 2001 2002 2003 2004 2005 2006 2007 2008 2009
Source: ECB.Note: Cross-border activity is expressed as a percentage of the total provision of fi nancial services in the euro area.
Chart 29 Cross-border provision of financial services in the euro area – liabilities
0
10
20
40
30
0
10
20
40
30
1999 2000 2001 2002 2003 2004 2005 2006 2007 2008 2009
cross-border interbank deposits
cross-border non-bank deposits
Source: ECB.Note: Cross-border activity is expressed as a percentage of the total provision of fi nancial services in the euro area.

33ECB
Financial integration in Europe
April 2010
2 SPEC IAL FEATURES
By contrast, retail banking integration, originally
remaining at a lower level, seems to have been
affected to a lesser extent.
Academic literature and contributions by the
industry and authorities broadly confi rm the
conclusion that retail banking markets remain
fragmented. Commonly stated reasons include
the importance of proximity and a relationship
to the customer and language, as well as legal,
regulatory and information-related barriers to
entry.2 The limited impact of the fi nancial crisis
on retail banking also supports the fi nding that
this market is driven by structural rather than
cyclical developments. Box 1 presents an
alternative way to investigate integration in
banking markets that is based on the convergence
of bank profi tability. The results corroborate the
view that some convergence is already taking
place in these markets as well.
See, for example, A.N. Berger, R. DeYoung and G. Udell, 2
“Effi ciency barriers to the consolidation of European fi nancial
services industry”, European Financial Management, Vol. 7,
No 1, March 2001, pp. 117-130. For a comprehensive overview
of the literature, see, for example, J.P. Goddard, P. Molyneyx,
J.O.S. Wilson and M. Tavakoli, “European banking:
An overview”, Journal of Banking and Finance, Vol. 31, No 7,
July 2007, pp. 1911-1935. For industry contributions, see, for
example, S. Schäfer, “EU retail banking: measuring integration”,
Deutsche Bank Research, April 2009.
Box 1
THE DEVELOPMENT OF BANK PROFITABILITY IN THE EURO AREA
Academic literature has debated at length
whether fi nancial integration might have an
impact on the development of profi tability
among banks.1 As fi nancial integration
affects the degree of competition across
national markets and intermediaries, it
should be expected to generate a convergence
of profi tability margins among different
countries. In the euro area, where markets
have become more contestable over time 2 and
where there is an active market for corporate
control through takeovers, acquisitions
or mergers of underperforming banks,
profi tability could be considered a meaningful
measure of banking integration.
Chart A displays the average profi tability,
expressed in terms of the return on assets
(ROA), across a sample of euro area banks, broken down by category, namely listed banks,
non-listed commercial banks, and savings and cooperative banks (the use of other measures
of profi tability, such as the return on equity, does not materially change the conclusions, as
1 See for instance F. de Guevara, J. Maudos and F. Perez, “Integration and competition in the European fi nancial markets”, Journal of International Money and Finance, No 26, 2007, pp. 26-45.
2 A perfect contestable market is one in which entry and exit are at no cost. In such a market, competitive pressures, either as a result of
the threat of entry or on account of the presence of actual competitors, can prevent monopoly behaviour.
Chart A Return on assets of a sample of euro area banks
(percentages)
0.0
0.5
1.0
2000 2001 2002 2003 2004 2005 2006 2007 2008
savings and cooperative banks
listed banks
non-listed commercial banks
all banks
1.5
0.0
0.5
1.0
1.5
Sources: Amadeus, Bureau Van Dijk and ECB calculations.

34ECB
Financial integration in Europe
April 2010
explained below).3 The chart shows that there is substantial difference in profi tability levels
across bank types; listed banks take the top rank, while savings and cooperative banks are at the
lowest level in terms of average ROA. No trend towards convergence among these groups can
be discerned. In particular, the positive profi tability gap between listed banks and the rest of the
population has increased in recent years, contrary to the expectation that listed banks face a more
aggressive environment in terms of market entry and takeover threats. However, listed banks are
exposed to intense pressure from shareholders to generate higher returns and are generally more
investment-oriented and thus structurally more profi table.
Chart B shows the cross-country dispersion within types of banks. In the case of listed banks,
the dispersion across countries has decreased since 2001 but due to the global fi nancial crisis,
it has increased in 2008. For non-listed commercial banks, the convergence process seems to
have started two years later, and has not yet shown signs of stabilisation. Differences in bank
profi tability have remained almost unchanged for savings and cooperative banks over the same
period. Moreover, there are signs of an increased dispersion, which were accentuated in the last
year of the analysis, most likely related to the impact of the fi nancial turmoil.
This increase in the dispersion of profi tability is confi rmed using a different sample of banking
groups, normally analysed for the cyclical monitoring in the ECB’s Financial Stability Review,
from which quarterly data are also collected (see Chart C).
3 Our sample consists of 3,047 banks, 116 of which are listed banks, and covers the period from 2000 to 2008. Data was collected
for banks in Austria (5% of the total sample), Belgium (2%), France (8%), Germany (56%), Italy (22%), Luxembourg (2%), the
Netherlands (1%) and Spain (4%). Roughly 21% of the sample consists of unlisted commercial banks, while 78% represents cooperative
and savings banks. From a country perspective, two-thirds of all cooperative and savings banks are located in Germany, and one-fi fth
in Italy.
Chart B Cross-country standard deviation of the return on assets (ROA) in the euro area
(percentages)
0.0
0.2
0.4
0.6
0.8
0.0
0.2
0.4
0.6
0.8
2000 2001 2002 2003 2004 2005 2006 2007 2008
listed banks
non-listed commercial banks
all banks
savings and cooperative banks
Sources: Amadeus, Bureau Van Dijk and ECB calculations.
Chart C Return on assets of large banks – cross-country standard deviation
(percentages)
0.0
0.1
0.2
0.3
0.4
0.5
0.6
0.0
0.1
0.2
0.3
0.4
0.5
0.6
ROA (percentage)
cross-banks standard deviation of ROA
2004 2005 2006 2007 2008 2009
Sources: Individual institutions’ fi nancial reports and ECB calculations.

35ECB
Financial integration in Europe
April 2010
2 SPEC IAL FEATURES
In order to pin down convergence towards a common profi tability level as accurately as possible,
the following equation was estimated 4:
ΔROAit = α + λΔROA*t – βΔROAit-1 + εit (1) 5
where ROAit is the return on assets of bank i at time t and ROA*
t is the common target profi tability
towards which all banks should converge if the banking market is integrated. Empirically, this
is calculated as the yearly mean rate of profi tability and, as described in column 1 of the table
below, for all banks in the sample, for different types of banks and for individual countries.
Profi tability is measured with the ROA, as is often done in empirical analysis.6
The results of the estimation are depicted in
Chart D. First, the convergence of the whole
sample of banks towards a common target
profi tability (ROAt*) is tested; then it is
checked whether the speed of convergence
differs if banks report profi ts above or below
the benchmark. Starting from the fi rst panel on
the left, the estimated speed of convergence
for the whole sample (blue column) is 0.66,
which is a relatively high value when the fact
is taken into consideration that the business
models of the banks in the sample differ quite
signifi cantly. The second and the third panels
report additional information on the dynamics
of the convergence process: the former may
be interpreted as expressing the impact of
competitive forces, while the second indicates
that on the potential threat of takeovers.
As expected, the speed of convergence
is higher for banks with a profi tability in
excess of the ROAt* since competition
for extraordinary rents is relatively higher
compared with potential threats due to forms
of corporate control.7
Turning to the different bank categories (listed
(red bars) versus unlisted commercial banks
(green and light blue bars)), it appears that,
4 As proposed by R. Gropp and A.K. Kashyap, “A new metric for banking integration in Europe”, NBER Working Paper Series,
No 14735, National Bureau of Economic Research, 2009.
5 This equation is derived by taking the lags of both sides of the equation and taking the difference of the following equation
ΔROAit= α + β (ROA*t – ROAit-1) + ui + εit , (see R. Gropp and A.K. Kashyap, op. cit., 2009). In principle, the coeffi cient β on the lagged
dependent variable in equation (1) should be equal to (1-λ).
6 The measure of ROA is used as provided by Bankscope, which is calculated as the ratio of net interest revenue and earnings assets and
is consistent with the defi nition used in Financial Stability Review, ECB, December 2009.
7 Notably, both speed-of-adjustment coeffi cients are signifi cant It is also interesting to note that there is no convergence for listed banks
towards the common long-run equilibrium profi tability (ROA*).
Chart D Speed of convergence of the ROA for a sample of euro area banks 1)
0.0
0.1
0.2
0.3
0.4
0.5
0.6
0.7
0.8
0.9
1.0
0.0
0.1
0.2
0.3
0.4
0.5
0.6
0.7
0.8
0.9
1.0
n.s.
n.s.
total sample adjustment
from above
adjustment
from below
all banks – target: EA mean ROA
listed banks – target: EA mean ROA of listed banks
unlisted commercial banks – target:
EA mean ROA of listed banks
unlisted commercial banks – target:
country-specific mean ROA of commercial banks
Source: ECB calculations.Note: n.s. indicates that the coeffi cients are not statistically signifi cant.1) When the model is re-estimated using the ROE as measure of profi tability, the results are confi rmed. In the case of unlisted commercial banks, the convergence of profi tability is higher and signifi cant (0.33) when the long-run profi tability is based on the mean ROE of listed companies, and the potential threat of takeovers seems stronger (the coeffi cient is 0.43 and signifi cant).

36ECB
Financial integration in Europe
April 2010
With regard to retail markets, it is also
important to note that the infrastructure for
retail payments in Europe has remained
fragmented until recently, a factor that has
contributed to the slow pace of integration
of the market itself. Technical progress and
the integration of market infrastructures have
the potential to spur the integration of retail
markets in the coming years. In particular,
SEPA has now been launched in credit and
debit transfers, and in card schemes. A wide-
ranging application of SEPA instruments is
expected to bring substantial benefi ts in the
near future.3
Aside from what occurs through the direct cross-
border provision of services, banking integration
takes place via foreign establishments, either
branches or subsidiaries. Foreign establishments
have been playing an increasing role in the EU,
and their share of total banking assets in 2008
amounted to over one-quarter, despite a slight
decline from 2007. In terms of assets, subsidiaries
have a slight lead over branches as the preferred
form of establishment across the EU.4 The total
assets in branches have decreased slightly since
2007. The median share of assets that are held in
foreign branches in the euro area countries, after
having risen in 2008, decreased again in 2009
(see Chart C17 in the Statistical Annex).
Cross-border ownership patterns differ sharply
across individual EU areas. Whereas domestic
institutions dominate, on average, in the EU-
15, the share of foreign ownership in the
banking sector in 2008 accounted for almost
three-quarters in the Member States that joined
the EU in 2004 and 2007. Almost 90% of the
foreign assets in those Member States were held
in subsidiaries.
Finally, Charts 30 and 31 show the number
and value of bank M&A transactions, grouped
See the section on the SEPA project in Chapter III of this report.3
A notable exception is the United Kingdom where foreign assets 4
are typically held in branches.
while competitive pressures are present among listed banks, the pressure from threats of takeovers
is almost non-existent. This is not surprising in the light of evidence that listed companies are
relatively few, usually large and that opportunities of takeovers are relatively rare.8
As regards unlisted commercial banks, a strong pressure towards homogeneous profi tability
emerges within countries (light blue bars), as could be explained by the fact that unlisted banks
are normally rooted in national or regional realities and compete with each other on a smaller
scale. The results given in the last panel tend to confi rm this by showing that a much higher
speed of adjustment is indeed due to the threat of takeovers when the target ROA is country-
specifi c, more closely refl ecting within-country features.
Overall, while there are signs of integration in the retail banking sector, as seen from the
profi tability trends, a large part of the convergence seems to be driven by competitive pressure
that originated domestically, rather than from across borders.9 This confi rms previous results
that, over and beyond reasons related to the scope and scale of banking business models, the
existing fragmentation of the retail banking sector might be related to country-specifi c legal and
regulatory features and barriers to entry.
8 When the model is re-estimated using the ROE, however, the effect of market of corporate control becomes stronger, although not
statistically signifi cant.
9 The results obtained in this exercise are somewhat different from those given in R. Gropp and A.K. Kashyap, op. cit., 2009. This
may refl ect differences in the country composition (the focus here is on euro area banks, while Gropp and Kashyap also considered
the United Kingdom), in the defi nition of profi tability (the ratio of net interest revenue to earnings assets here, while Gropp and
Kashyak use that of pre-tax-profi ts to total assets), in the choice of type of banks (for instance Gropp and Kashyap categorise as
commercial banks also bank holding companies, medium and long-term credit banks and mortgage banks, while they were excluded in
this analysis) and in the sample period (2000-2007 here and 1994-2006 in the case of Gropp and Kashyap).

37ECB
Financial integration in Europe
April 2010
2 SPEC IAL FEATURES
according to whether they have involved
domestic, cross-border intra-euro area, or
cross-border extra-euro area counterparts.
Despite the higher uncertainty in fi nancial
markets, M&A activities continued to take place
in 2008 and 2009. The cross-border component
of M&A transactions, however, decreased
signifi cantly in 2008 and remained low in 2009,
both within the EU and in other countries.5
Two main factors lie behind the reduction in
cross-border M&As. First, an ESCB survey on a
sample of EU cross-border banks in May 2009
revealed that many are now refocusing on their
core activities and markets, thereby stopping or
delaying cross-border plans.6 The bulk of the
M&As that have taken place have therefore
been motivated by survival and divestments of
non-core business lines, rather than by strategic
expansion, and banks that have retained a strong
position may have been hunting for bargains in
troubled markets Second, M&A activities have
shifted towards domestic deals owing to the
higher government involvement in the banking
sector, which resulted from the stabilisation
measures adopted by many Member States
following the intensifi ed problems and the loss
of confi dence in the markets in Autumn 2008.
Indeed, in some countries, EU governments are
now major stakeholders in the market owing to
the recapitalisation measures adopted by the
Member States.7 In this regard, and also more
generally, care should be taken that the measures
adopted by authorities to address concerns
related to fi nancial stability conditions do not
lead to a fragmentation of the Single Market.
Effective competition and the avoidance of the
emergence of disincentive for cross-border
activities need to be in the focus of the
assessment of banks’ restructuring plans.8
The total value of transactions in 2008 exceeded the value of 5
2007; however, the acquisition of ABN Amro by the consortium
of Royal Bank of Scotland, Fortis and Santander alone accounted
for 90% of the cross-border component of this fi gure.
The ESCB survey comprised 43 major banking groups with 6
signifi cant cross-border banking activities and head offi ces in
EU Member States. The results were compared to those of
a similar exercise in 2005, in order to determine trends in
cross-border banking.
See, for example, J. Schildbach, “Global banking trends after 7
the crisis”, Deutsche Bank Research, EU Monitor, No 67,
15 June 2009, and “Back to the domestic market”, PWC Financial Services, PriceWaterhouseCoopers, March 2009.
The European Commission which is responsible for this 8
assessment, has also stressed this aspect in its Communication
on the return to viability and the assessment of restructuring
measures in the fi nancial sector in the current crisis under the
State Aid rules (OJ L 195 of 19.8.2009, pp. 9-20).
Chart 30 Bank M&As: number of transactions
0
20
40
60
80
100
120
140
160
0
20
40
60
80
100
120
140
160
2000 2001 2002 2003 2004 2005 2006 2007 2008 2009
domestic
cross-border
outward
inward
Sources: Zephyr and Bureau Van Dijk.Notes: M&As include both controlling and minority stakes. For some of the deals, the value is not reported. Cross-border M&As refer to intra-EU27 transactions involving a non-domestic acquirer. Inward refers to an M&A by a non-EU27 bank in the EU27 and outward indicates M&As of EU27 banks outside the EU27.
Chart 31 Bank M&As: value of transactions
(EUR billions)
0
20
40
60
80
100
120
0
20
40
60
80
100
120
2000 2001 2002 2003 2004 2005 2006 2007 2008 2009
domestic
cross-border
outward
inward
Sources: Zephyr and Bureau Van Dijk.Notes: M&As include both controlling and minority stakes. For some of the deals, the value is not reported. Cross-border M&As refer to intra-EU27 transactions involving a non-domestic acquirer. Inward refers to an M&A by a non-EU27 bank in the EU27 and outward indicates M&As of EU27 banks outside the EU27.

38ECB
Financial integration in Europe
April 2010
However, there are reasons to believe that
the decrease in cross-border M&As may be
temporary. First, the government recapitalisation
measures are intended to be of limited duration,
and opportunities for accelerated M&A activity
may thus arise in the future. Second, the ESCB
survey revealed that, rather than revising their
internationalisation strategies, banks have
temporarily stopped or delayed their plans.
The situation is less clear-cut in emerging and
developing countries. On the one hand, banks
expect that business risks will increase in the
near future owing to the economic downturn,
and, on the other, they continue to consider the
high growth potential in the host country to be the
most important driver for a decision to expand
abroad. The general recourse to traditional
banking services, often associated with
moderate profi t margins, may also increase the
attractiveness of exploiting profi t opportunities
in foreign markets with high growth potential.9
Therefore, M&A activity may quickly pick up
not only in the EU, but also in emerging markets
once the economic cycle turns.
3 THE NEW SUPERVISORY FRAMEWORK
FOR THE EU
The public sector can support market forces in
fi nancial integration by providing a regulatory and
supervisory framework for cross-border banks
that fosters a single set of rules, as well as equal
market access for, and equal treatment of, market
participants across the EU. At the same time,
differences in languages, customer preferences
or national conditions, which are outside the
remit of policy-makers, may be important factors
behind fragmentation in some market segments.
The forthcoming changes in the EU supervisory
architecture aim to meet the fi nancial stability
challenges of, in particular, the increasingly
integrated fi nancial markets. However, they also
have the potential to signifi cantly improve the
level playing fi eld for cross-border banks in the
EU, in particular by reducing the surplus that
they have been paying in compliance costs as a
result of the multiplicity of rules and supervisory
contacts. In addition, the new supervisory
architecture provides for a single body for
macro-prudential supervision in the EU.
The section starts with a brief description of the
history of supervisory cooperation in the EU,
before explaining the structure of the proposed
new supervisory architecture. The section
concludes with a discussion of the impact on
fi nancial integration.
DEVELOPMENTS THUS FAR
The Single European Act and the Second
Banking Directive created the Single Market for
banks in the early 1990s, and the Financial
Services Action Plan and the Lamfalussy
process (see Box 2) have contributed to the
harmonisation of the EU’s regulatory and
supervisory framework. The establishment of
colleges of supervisors for large cross-border
banks is another important contribution to
supervisory cooperation and information
exchange. Furthermore, the Memorandum of
Understanding on crisis management between
the EU supervisory authorities, central banks
and fi nance ministries adopted in 2008 provides
a fl exible framework for crisis prevention and
management, relying to the extent possible
on existing networks. These initiatives have
all pushed fi nancial integration further,
as demonstrated by the indicators in the
previous section.10 Nevertheless, the national
implementation of EU legislation, as well as the
actual conduct of supervision across countries,
has remained fragmented.
See also “Overcoming the crisis and moving beyond: EBF policy 9
recommendations for advancing the integration of European fi nancial
services markets”, European Banking Federation, Brussels, 2009.
The link between the regulatory and supervisory harmonisation 10
and fi nancial integration has also been acknowledged by market
participants in surveys. See, for example, The Global Financial Centres Index, Vol. 3, City of London, March 2008.

39ECB
Financial integration in Europe
April 2010
2 SPEC IAL FEATURES
Box 2
THE LAMFALUSSY PROCESS AND ITS REVIEW
After the introduction of the euro, it became evident that the EU’s regulatory framework, based
on national and uncoordinated systems, was inadequate in the face of the challenges of the single
and progressively integrated EU fi nancial market. A major problem in this context was that the
directives and regulations agreed at the EU level were implemented differently across countries.
This resulted in inconsistencies in the treatment of the same type of business, threatening the
competitive neutrality of supervision. Consequently, in 2001 the European Council invited a
Committee of Wise Men on the Regulation of European Securities Markets, also known as the
Lamfalussy Committee, to investigate the matter and make reform proposals.
In its fi nal report, the Committee recommended a four-level approach to European securities
regulation and supervision.1 The decision-making process should be speeded up by separating
the principles of the legislative framework, expected to remain relatively stable over time, from
the technical details, which are more likely to be subject to market developments. Whereas
the former should be decided upon according to the normal co-decision procedure with the
European Council and the European Parliament at so-called level 1, the latter should be adopted
as implementing rules via a more fl exible process at level 2, which would involve representatives
of the Member States and the European Commission. The coherent implementation of measures
across Member States would be strengthened through enhanced supervisory cooperation at
level 3. Finally, level 4 would consist of measures of the European Commission to strengthen
the enforcement of EU rules in the Member States.
The recommendations were adopted for the securities markets in 2002, and extended to cover
banking, insurance, occupational pensions and investment funds in 2003. The Lamfalussy
process attained broad support among the stakeholders. Decision-making and supervisory
arrangements became far more effi cient and fl exible. The level 3 committees – the Committee
of European Securities Regulators (CESR), the Committee of European Banking Supervisors
(CEBS) and the Committee of European Insurance and Occupational Pension Supervisors
(CEIOPS) – markedly enhanced multilateral cooperation between national supervisors. In
addition, the private sector was included in the legislative process more systematically.2
The Ecofi n Council reviewed the Lamfalussy process in December 2007 and agreed on a number
of measures to exploit its full benefi ts.3 In particular, the level 3 committees were granted the
possibility of using qualifi ed-majority voting in their charters, and invited to report annually on
the achievement of their objectives to the European Commission, Parliament and Council for
better accountability. The Member States were invited to introduce a European dimension into
the mandates of the national supervisors.4 Finally, the coherence between the so-called colleges
of supervisors, set up to enhance coordination in the supervision of cross-border groups, was to
be improved by means of a common set of level 3 operational guidelines.
1 “Final report of the Committee of Wise Men on the regulation of European securities markets”, Brussels, 15 February 2001.
2 See, for example, Final Report Monitoring the Lamfalussy Process, Inter-institutional Monitoring Group, Brussels, October 2007.
3 “Council conclusions on review of the Lamfalussy process”, 2836th Economic and Financial Affairs Council meeting, Brussels,
4 December 2007. See also COM Decision 2009/78/EC of 23 January 2009 establishing the Committee of European Banking
Supervisors (OJ L 25, 29.1.2009, p. 23).
4 In its review of progress made in May 2008, the Council introduced a time limit of mid-2009 for the introduction of the European
dimension into the supervisory mandates. See “Council conclusions on the EU supervisory framework and fi nancial stability
arrangements”, 2866th Economic and Financial Affairs Council meeting, Brussels, 14 May 2008.

40ECB
Financial integration in Europe
April 2010
A review of the Lamfalussy process was already
under way when the fi nancial crisis deepened and
made it clear that the EU supervisory architecture
needed to be fundamentally revised in order
to meet the fi nancial stability challenges of the
emerging Single Market. In general, the run-up to
the crisis and its unfolding unveiled shortcomings,
including some relating to (i) the capability of
public authorities to identify all relevant risks
and vulnerabilities to fi nancial stability, (ii) the
ability to translate warnings about identifi ed
risks into concrete policy actions and changes in
the behaviour of market participants and (iii) the
effectiveness of cross-border cooperation and
coordination among the competent authorities.
Consequently, the European Commission in
October 2008 mandated an independent High
Level Group, named after its Chairman as the de
Larosière Group, to develop proposals to strengthen
the supervision of European fi nancial institutions
and markets, and fi nancial stability arrangements.
In February 2009, the group published a
comprehensive set of recommendations relating to
international cooperation in fi nancial regulation,
the EU’s supervisory architecture and cooperation
between authorities in crisis situations.
THE FUTURE SUPERVISORY ARCHITECTURE
In its fi nal report of February 2009, the de
Larosière Group proposed that the European
fi nancial supervisory framework should be
based on two pillars, tasked with micro and
macro-prudential supervision respectively at the
EU level. Following the support of the European
Council in June 2009, the European Commission
proposed on 23 September 2009 that two bodies
be established, a European System of Financial
Supervisors (ESFS) and a European Systemic
Risk Board (ESRB).11 The Ecofi n Council agreed
on the substance of the draft Regulation on the
ESRB on 20 October, and on a general approach
regarding the draft Regulation establishing
the European Supervisory Authorities (ESAs)
on 2 December. As part of the co-decision
procedure for the adoption of the legislative
proposals, the European Parliament is now in
the process of discussing them.
The main elements of the ESFS are the national
supervisors and three European Supervisory
Authorities (ESAs), namely a European Banking
Authority (EBA), a European Insurance and
Occupational Pensions Authority (EIOPA), and
a European Securities and Markets Authority
(ESMA).12 These authorities will be founded
through a transformation of the existing
level 3 committees. In addition to the existing
tasks of the level 3 committees, the ESAs will
carry out, inter alia, the following activities: 13
the issuance of binding and non-binding –
rules, also with a view to creating a single EU
rulebook;
the promotion of a consistent application of –
EU legislation and of a common supervisory
culture across the Member States;
the provision of binding mediation in the –
case of disagreements between national
supervisors;
the imposition of specifi c common actions –
to be taken by supervisors in a cross-border
emergency situation;
the promotion of effi ciency and coherence –
across colleges of supervisors;14
See the proposals for a Regulation establishing a European 11
Banking Authority (COM (2009) 501 fi nal), a European Insurance
and Occupational Pensions Authority (COM (2009) 502 fi nal)
and a European Securities and Markets Authority (COM (2009)
503 fi nal), and for a Regulation on Community macro prudential
oversight of the fi nancial system and establishing a European
Systemic Risk Board (COM (2009) 499 fi nal).
The proposal differs from the recommendation in the de 12
Larosière Report in that occupational pensions are also covered
by the ESFS.
These tasks are subject to the qualifi cation in the Ecofi n 13
Council’s general approach that the decisions taken by the ESAs
should not have any effect on the fi scal responsibilities of the
Member States.
The establishment of supervisory colleges for the performance 14
of certain tasks related to the consolidated supervision of cross-
border EU banking groups is mandated by the end of 2010 in
the Directive 2009/111/EC of the European Parliament and of
the Council of 16 September 2009 amending Directives 2006/48/
EC, 2006/49/EC and 2007/64/EC as regards banks affi liated to
central institutions, certain own funds items, large exposures,
supervisory arrangements, and crisis management (OJ L 302,
17.11.2009, pp. 97-119).

41ECB
Financial integration in Europe
April 2010
2 SPEC IAL FEATURES
the establishment and management of EU –
supervisory databases; and
the direct supervision of credit rating agencies –
by ESMA.
The ESRB will be established as a new body
without legal personality to conduct macro-
prudential oversight in the EU. Its tasks include
risk assessment and monitoring for the entire
fi nancial system in the EU, and the issuance of
risk warnings and recommendations in the event
of these being deemed necessary, as well as the
monitoring of the follow-up actions to such
warnings and recommendations. The ESRB will
work together with the IMF, the Financial
Stability Board, and other relevant fi nancial
institutions and third-country bodies at the
international level. The ECB will take care of
the secretariat function and thereby provide the
ESRB with analytical, statistical, administrative
and logistical support. The secretariat will
moreover also support the work of the Advisory
Technical Committee of the ESRB.15
Finally, the European Commission’s proposal
to establish the ESFS and the ESRB is
accompanied by a proposal for what is known as
See the proposal for a Council Decision entrusting the European 15
Central Bank with specifi c tasks concerning the functioning of
the European Systemic Risk Board, COM (2009) 500 fi nal, for
the ECB responsibilities. The ECB’s statistical support will draw
from information made available by the ESAs and by the ESCB
on fi nancial institutions and markets, and on their interaction
with the non-fi nancial economy. The Advisory Technical
Committee provides advice and assistance to the General Board
on the issues that are within the scope of the latter and consists
of representatives of the national central banks, ECB, national
supervisory authorities, ESAs, the European Commission and
the Economic and Financial Committee.
Chart 32 Structure of the new EU architecture for financial supervision
Macro-prudentialsupervision
Micro-prudential information Information on systemic risk
Macro-prudentialsupervision
Early RiskWarnings
+Policy
Recommendations
ESRB
Chairs of EBA,
EIOPA & ESMAECB
EU Central Banks
European
Commission
lon
EBA
National Banking
Supervisors
ESFS
EIOPA
National Insurance
Supervisors
ESMA
National Securities
Supervisors
Sources: European Commission and ECB.

42ECB
Financial integration in Europe
April 2010
an Omnibus Directive. The proposal outlines the
necessary changes to several EU fi nancial sector
directives, in order to make them consistent with
the new supervisory set-up.16
The ESFS and the ESRB constitute the core
elements of the new fi nancial supervisory
architecture (see Chart 32). The organisation of
micro-prudential supervision at the EU level will
remain sector-oriented.17 It builds on the existing
level 3 committees and is aimed at intensifying
supervisory convergence and coordination at the
EU level via the transfer of some competences
to the EU level. A Joint Committee of ESAs
will be established for regular and close
coordination to ensure consistency across the
three sectors. The macro-prudential approach,
by contrast, provides for the establishment of
a new independent body for macro-prudential
oversight, covering all fi nancial sectors. This is
due to the fact that systemic risk can stem from
any relevant part of the fi nancial system, so that
the effective monitoring and detection thereof
requires a comprehensive view. According to the
proposals, the ECB President and Vice-President
and the Governors of all EU central banks will
be members of the ESRB’s General Board, as
well as the chairpersons of the three ESAs and a
representative of the EU Commission.
In order to be effective, the EU’s new fi nancial
supervisory structure will require effi cient
cooperation between the ESFS and the ESRB.
In this regard, the ESRB will participate as
an observer in the meetings of both the Joint
Committee of the ESAs and the Board of
Supervisors of each ESA. Conversely, the
ESRB will include the three chairpersons of
the ESAs in its composition and will moreover
have the national supervisors as non-voting
members. The ESFS will provide data input
to the work of the ESRB. In addition, it will
contribute to a proper follow-up to the warnings
and recommendations of the ESRB. The ESRB,
for its part, will provide its views on the macro-
prudential environment and systemic risk for the
benefi t of the national supervisory authorities.
Appropriate coordination mechanisms will need
to be put in place for exchanging information
between the ESRB and the ESFS.
The EU’s new fi nancial supervisory architecture
is expected to be in place by the end of 2010.
The general approach agreed with respect to the
proposed ESAs Regulation on 2 December 2009
provides for the three ESAs tol be established
on 1 January 2011. A review of the functioning
of both the ESRB and the ESFS is planned for
no later than 2013.
IMPACT OF THE NEW ARCHITECTURE
ON FINANCIAL INTEGRATION
A more effective framework for fi nancial
supervision was needed, fi rst and foremost, to
meet the fi nancial stability challenges related to
the increased level of fi nancial integration in
Europe. At the same time, the new framework
has the potential to foster fi nancial integration
further in providing a more harmonised
regulation and supervision across Member
States. Chart 33 illustrates how factors
contributing to the fragmentation of fi nancial
supervision might lead to multiple interpretations
of EU law and to the coexistence of diverging
supervisory practices. This, in turn, can hinder
the development of cross-border banking
because it leads to high compliance costs, owing
to the obligation to comply with different rules
and interact with several authorities. High
compliance costs consequently reduce the scope
for benefi ting from economic synergies from
integrated corporate processes and structures.18
Such changes include the conversion of the three supervisory 16
committees into authorities. See the proposal for a Directive
amending Directives 1998/26/EC, 2002/87/EC, 2003/6/EC,
2003/41/EC, 2003/71/EC, 2004/39/EC, 2004/109/EC, 2005/60/
EC, 2006/48/EC, 2006/49/EC, and 2009/65/EC in respect of
the powers of the European Banking Authority, the European
Insurance and Occupational Pensions Authority and the European
Securities and Markets Authority, COM (2009)576 fi nal.
At national level, Member States retain different models of micro-17
prudential supervision: sector-oriented, based on objectives (“twin
peaks”), or consolidated in a single supervisory body.
See also “Impact assessment”, SEC(2009) 1234, European 18
Commission, 23 September 2009.

43ECB
Financial integration in Europe
April 2010
2 SPEC IAL FEATURES
The creation of the ESFS is expected to reduce
obstacles to fi nancial integration by ensuring that
EU law is transposed uniformly into national
law and is consistently applied in day-to-day
supervision. In particular, the ESFS will reduce
the room for diverging national interpretations
through the single EU rulebook of binding
technical standards, and non-binding guidelines
and recommendations that will be subject to a
“comply or explain” mechanism. Complying
with one set of rules, instead of with several
deviating national regulations, will reduce costs
for cross-border banks and improve the level
playing fi eld in the Single Market.
In addition to the development of a single EU
rulebook, the ESFS will promote the equal
treatment of market participants. The expanded
mandates of the ESAs will render them more
effective than the level 3 committees are
under their current mandates in promoting the
consistent application of EU rules. The new
mandates will make a two-fold improvement
of coherence possible in the treatment of cross-
border banks: fi rst, one across jurisdictions and,
second, one across colleges of supervisors.
In terms of differences across jurisdictions,
the new structure is expected to improve
information-sharing and cooperation, create
effective mediation mechanisms between
national supervisors and further enhance
convergence of national supervisory practices,
also by reinforcing the possibilities to challenge
the decisions of national supervisors at the
EU level. The new intervention powers of the
ESAs are key to achieving these objectives. In
particular, the ESAs will form a single entity for
the settlement of disputes between supervisors in
situations where the authorities in question have
been unable to reach an agreement during a given
period of conciliation. As a last resort, the ESAs
may moreover address fi nancial institutions
directly in specifi c cases of non-compliance by
national authorities. Finally, consistency across
jurisdictions will also be increased via the EU’s
Chart 33 Supervisory obstacles to cross-border banks
Divergent application of EU law
Divergentsupervisorypractices
Minimum harmonisation allows Member States to make additions
to national laws
National exceptions/derogations to EU law
Use of Directives leaves discretion to Member States
Insufficient information sharing between national supervisors
Lack of effective cooperation between national supervisors
Lack of effective mediation andsanctioning in case of non-agreement
among national supervisors
High compliancecosts for
cross-borderinstitutions
Sources: ECB and European Commission.

44ECB
Financial integration in Europe
April 2010
central supervisory databases, which are to be
used for peer analysis and information-sharing
among the supervisors.
Additional tasks of the ESAs vis-à-vis the
colleges of supervisors are envisaged to improve
the equal treatment of cross-border banks and
coherence across the colleges. The ESAs will be
responsible for the coordination of supervisory
colleges and their consistent and effective
functioning. To this end, they may participate as
observers in colleges and receive all relevant
information that is shared among the members
of the colleges. The supervisory databases are
likewise aimed at facilitating the work of the
colleges of supervisors by making all the
relevant information available to them.
The ESAs will also determine and collect as
appropriate all relevant information from
national supervisory authorities in order to
facilitate the work of those colleges and will
establish and manage a central system to make
such information accessible to these authorities
in colleges of supervisors.19
The ESRB will support the further integration
of fi nancial markets through its contribution
to increased fi nancial stability in the EU.
In order to enable the market participants to
fully exploit the possibilities offered by cross-
border activities in the EU, they will have to
be confi dent that interdependences between
the countries, institutions and markets are
properly taken into account by authorities
when fulfi lling their prudential tasks. Enhanced
stability is therefore expected to improve the
smooth functioning of the internal market.
Conversely, the role to be played by the ESRB
in safeguarding systemic stability in Europe is
expected to become even more important in
the face of intensifying fi nancial integration,
i.e. the need to identify potential vulnerabilities
associated with increased fi nancial integration.
This will include guiding rules that may contribute to more 19
comparable quantitative and qualitative information.

45ECB
Financial integration in Europe
April 2010
2 SPEC IAL FEATURES
B. EUROPEAN COVERED BONDS
Over the past decade, covered bonds have developed from a traditional source of secured funding that existed only in few countries to one of the key funding instruments for European credit institutions. With volume of €2.4 trillion outstanding in 2008,20 the covered bond market has become an important segment of European capital markets.While covered bonds existed only in few countries, such as Germany, Denmark, France and Spain, with sometimes very long historical traditions a decade ago, almost all European countries have now introduced dedicated – though not internationally homogeneous – covered bond legislations.The Special Feature reviews the main developments in the covered bond market in the past ten years and investigates the extent to which this form of funding has progressed towards more common features across the euro area countries. Particular attention is paid to the impact of the covered bond purchase programme launched by the Eurosystem in July 2009 in order to revitalise the covered bond market, since this market, too, suffered from the effects of the fi nancial market turmoil.The Special Feature also assesses the extent to which there is still fragmentation along national borders, in particular at the regulatory level, and where scope can be seen for further integration, an issue that has in part already been addressed by some market-led initiatives.
1 INTRODUCTION
Covered bond markets at the euro area level
are still clearly separated by different legal and
regulatory national frameworks, but show signs
of an increasing degree of homogeneity, both
in terms of yields and with respect to structural
features such as the nature of the cover pool and
the maturity structure. Although some two-thirds
of the euro area market remains concentrated in
three countries, 21 the covered bond market has also
seen an increase in the number of issuing countries,
especially in the last two years. In May 2009,
the Eurosystem’s covered bond purchase
programme (CBPP) seems to have given new
impetus to covered bonds markets in Europe.
It may therefore be inferred that, since the
inception of the euro, the European covered bond
markets have made some progress towards
integration. A decade ago, these markets were
almost totally national and confi ned to only a
few countries. Meanwhile, covered bonds have
increasingly become a cross-border product with
a European focus. The term covered bonds has
been established (although a clear defi nition is
lacking), which was literally non-existent ten
years ago. At that time, covered bonds were
classifi ed as mortgage bonds (for covered bonds
that were backed by mortgages) or by the names
for the respective national product (Pfandbriefe,
cedulas, obligation foncière, etc.). Nowadays,
the joint efforts of national covered bond
industries to express their common concerns via
a European organisation can also be seen as a
refl ection of the move towards further integration
and internationalisation. The European Covered
Bond Council (ECBC), which was established in
2004, currently represents the interests of the
covered bond market industry from 20 different
countries. Furthermore, almost all EU Member
States have now introduced covered bond
legislation, in line with the recommendation
which the Mortgage Funding Expert Group made
in its 2006 report to the European Commission.
But despite these developments, it is also evident
that the market is still considerably fragmented
along the different national jurisdictions.22 There
is still a clear home bias, although international
investors have expressed their interest in entering
the various national market segments. The lack
of a common defi nition and standard makes it
challenging to compare the product across
national legal frameworks. This was also one of
the reasons why the criteria for covered bonds
that are eligible for the CBPP have remained
rather general, given the need to embrace the
whole market. Further progress towards more
Data provided by the ECBC.20
France, Germany and Spain.21
In some countries (e.g. in Hungary), only specialised mortgage 22
banks are authorised to issue covered bonds.

46ECB
Financial integration in Europe
April 2010
harmonisation is desirable in order to broaden
the investor base and to strengthen covered
bonds further as a separate and homogeneous
asset class with clearly defi ned quality standards.
At the same time, it should be acknowledged that
differences across national jurisdictions (e.g. the
geographical dispersion of the cover pool) might
provide issuers and investors with additional
diversifi cation opportunities.
2 WHAT IS A COVERED BOND?
Covered bonds are dual recourse bonds issued
by (or offering recourse to) a credit institution
and with priority recourse to a cover pool of
collateral,23 typically mortgages or public sector
loans. In contrast to asset-backed securities
(ABSs), there is no credit risk transfer to the
bondholder. Another difference is to be found
in the fact that covered bond issuers are obliged
to safeguard a certain value of the covered bond
holders’ collateral. Issuers of covered bonds are
liable for all payments of interest and principal,
which is why investors benefi t from double
protection against default. Covered bonds are
therefore often referred to as dual recourse
instruments.
The main advantage of covered bonds can
therefore be seen in reduced funding costs for
banks and usually high standards of investor
protection.
In Europe, the vast majority of covered bonds
are issued on the basis a special legislative
framework that ensures the protection of bond
investors in the event of the bankruptcy of the
issuer (see Section 4).
Most covered bonds are issued in the
so-called Jumbo format. This benchmark product,
which is subject to certain requirements,24 was
introduced as a covered bond offering high
liquidity and aimed at attracting international
investors in Germany in 1995.
To date, however, no commonly agreed clear
defi nition of a covered bond exists. Agreement has
been reached only on a rather general defi nition
or characterisation, which has been derived
from the UCITS Directive 25 and the Capital
Requirements Directive 26 (see Section 4).
3 MARKET DEVELOPMENTS AND SOME BASIC
STRUCTURAL FEATURES
Driven by the issuance of Jumbo Pfandbriefe in
Germany since 1995 (see above), the covered
bond market started to change from a purely
domestic market into a rather more cross-border
market. But it was only with the introduction
of the euro and the increased need of liquidity
that covered bond markets started to experience
buoyant growth. The amounts outstanding of
covered bonds reached more than €100 billion at
the end of 1997, €600 billion in 2000 and about
€2.4 trillion at the end of 2008 (see Table 1).
Starting with the long-established covered bond
markets in Germany, France and Spain, an
increasing number of European countries have
allowed the issuance of covered bonds
(see Chart 34) 27 Currently there are
24 jurisdictions in Europe 28 that allow fi nancial
institutions to issue covered bonds. In the euro
area, there are 14 such jurisdictions.
For the defi nition, see 23 Covered bonds in the EU fi nancial system,
ECB, 2008.
The main features of Jumbo bonds are a minimum issuance size 24
of €1 billion and the reciprocal quotation of bid/ask prices by at
least fi ve market makers.
Council Directive 85/611/EEC of 20 December 1985 on the 25
coordination of laws, regulations and administrative provisions
relating to undertakings for the collective investment in
transferable securities (UCITS) (OJ L 375, 31.12.1985,
pp. 3-18).
Directive 2006/48/EC of the European Parliament and of the 26
Council of 14 June 2006 relating to the taking up and pursuit of
the business of credit institutions (recast) (OJ L 177, 30.6.2006,
pp. 1-200) and Directive 2006/49/EC of the European Parliament
and of the Council of 14 June 2006 on the capital adequacy
of investment fi rms and credit institutions (recast) (OJ L 177,
30.6.2006, pp. 201-255).
Outside the euro area, the Danish covered bond market is the 27
second largest in the EU in terms of its size (outstanding volume
as well as yearly issuance), while the UK and Swedish markets
take fi fth and sixth place respectively.
These are Austria, Bulgaria, Belgium, the Czech Republic, 28
Denmark, Finland, France, Germany, Greece, Hungary, Ireland,
Italy, Latvia, Luxembourg, the Netherlands, Poland, Portugal,
Romania, Slovakia, Slovenia, Spain, Sweden, Switzerland and
the United Kingdom.

47ECB
Financial integration in Europe
April 2010
2 SPEC IAL FEATURES
In terms of market share, Germany had the
largest share of bonds outstanding in 2008, with
a total amount outstanding of about
€800 billion, followed by Spain, with an amount
outstanding of about €332 billion, and France,
with an amount outstanding of about
€265 billion.29 As regard Jumbo bonds, Spain
accounted for 37% of the total market, Germany
for 34% and France for 17%, which reveals that
the covered bond market remains relatively
concentrated in a few countries, despite the
increasing number of euro area countries
issuing covered bonds.
Chart 35 shows the development in the issuance
volume of Jumbo covered bonds by cover pool
between January 2001 and December 2009. It
reveals the collapse of the market at the end of
2008 and its subsequent recovery in concurrence
with the implementation of the CBPP in July 2009
(see Section 5).
Viewed from a historical perspective, the
development of issuance volumes offers
interesting insights. First of all, the issuance
Date provided by the ECBC.29
Table 1 Outstanding amounts of covered bonds
(EUR millions)
Outstanding (in mln EUR) 2003 2004 2005 2006 2007 2008
Total covered bonds outstandingOutstanding covered bonds backed by public sector 869,714 858,645 869,924 884,038 858,773 772,999
Outstanding covered bonds backed by mortgage 606,009 677,427 784,968 963,403 1,161,268 1,514,958
Outstanding covered bonds backed by ships 10,087 9,542 10,586 11,341 13,136 16,333
Outstanding covered bonds backed by mixed assets 34,530 41,350 50,040 61,930 80,097 80,631
Total outstanding 1,520,340 1,586,964 1,715,518 1,920,712 2,113,274 2,384,921
Source: ECBC.Notes: Data refer to Austria, Bulgaria, Canada, the Czech Republic, Demark, Finland, France, Germany, Greece, Hungary, Iceland, Ireland, Italy, Latvia, Luxembourg, the Netherlands, Norway, Poland, Portugal, Romania, Slovakia, Slovenia, Spain, Sweden, Switzerland, Turkey, Ukraine, the United Kingdom and the United States.
Chart 35 Issuance volumes of Jumbo covered bonds
(EUR billions; six-month moving average)
0
2
4
6
8
10
12
14
16
18
0
2
4
6
8
10
12
14
16
18
2000 2002 2004 2006 2008
Jumbo public
Jumbo mortgage
Jumbo other
Source: Dealogic.
Chart 34 Outstanding amounts of covered bonds in selected euro area countries
(EUR billions)
0
200
400
600
800
1,000
1,200
1,400
1,600
1,800
0
200
400
600
800
1,000
1,200
1,400
1,600
1,800
2003 2004 2005 2006 2007 2008
IT
FI
GR
AT
NL
PT
LU
IE
ES
FR
DE
Source: ECBC.

48ECB
Financial integration in Europe
April 2010
volumes for all countries fell dramatically during
the fi nancial market turmoil. Second, the decline
was most pronounced for Germany. Third, while
the market has been dominated by Germany
in terms of issuance more and more countries
have been issuing covered bonds since 1999.
Looking forward by extrapolating the current
trend, it is fair to expect that the market for Jumbo
covered bonds will become less concentrated and
that the divergence of issuance volumes across
countries will stabilise or decline further. This
is supported, for instance, by the fact that more
countries are expected to start issuing covered
bonds (Belgium, for example, passed a law in
October 2009 that allows covered bonds to be
issued, while Cyprus is preparing legislation on
covered bonds).
As regards the maturity of the covered bonds
issued, most bonds continued to be issued in
the fi ve to ten-year maturity bracket, but still
mainly concentrated on the fi ve- or seven-year
maturities and to a much lesser extent on the
ten-year maturity (see Table 1). In recent years,
however, a tendency towards issuance at longer
maturities has become more evident, which
indicates that covered bonds are well-established
as a long-term funding instrument. Viewed
from a country perspective, bonds with longer
maturities have been issued mainly by countries
that have joined the market more recently, such
as Portugal, while other countries like France
and Germany have also seen an increase in
issuance volumes at longer maturities.
All in all, the market remains focussed on the
medium to long-term maturity brackets, but on
average there is a trend towards a lengthening of
the maturity.
In terms of the cover pool, while the market has
traditionally seen a predominance of public loans,
mortgage-backed loans have gained steadily in
importance in recent years, while that of covered
bonds backed by public loans has declined
(see Table 1). In 2006, the outstanding value of
covered bonds backed by mortgage loans was
larger than that of such bonds backed by public
loans.30 In the EU, ship loans are only used by a
minority of countries, and only by Germany in
See 30 Fact book, ECBC, 2009.
Chart 36 Issuance volumes of Jumbo covered bonds, broken down by country
(Jumbo issuance volume in percentage; 1 January 2009 until 2 November 2009)
France
41
Spain
17
Germany
19
Italy
7
Netherlands
6
Portugal
6
Austria
1
Ireland
2Greece
1
Sources: Dealogic and ECB calculations.
Chart 37 Jumbo covered bond issuance in the euro area since May 2009, broken down by maturity
(EUR billions; data until 14 December 2009)
0
5
10
15
20
25
30
35
40
0
5
10
15
20
25
30
35
40
2012 2014 2016 2018 2020 2022 20262024
Source: Dealogic.Note: “Jumbo covered bonds” include public, mortgage and other asset-backed Jumbo covered bonds.

49ECB
Financial integration in Europe
April 2010
2 SPEC IAL FEATURES
the euro area. From a country perspective, this
was due mainly to the diminishing supply of
public assets eligible for the public pool in
Germany and, at the same time, to the growing
popularity of bonds backed by mortgage loans in
countries that had experienced buoyant housing
market developments and a rapid growth of
mortgage credit. Overall, the majority of covered
bonds backed by public loans has been issued in
Germany, while there has been a more balanced
geographical distribution for bonds backed by
mortgage loans, with France, Spain and Germany
the main countries of issuance.
As described in the previous section, Jumbo
covered bonds accounted for the most liquid part
of the market, at least until 2008.31 In the case
of Jumbo covered bonds, too, market shares are
relatively concentrated.
4 THE REGULATORY FRAMEWORK
The majority of European covered bonds are
issued on the basis of a special legal framework
(and are thus “regulated covered bonds”), which
ensures that the bondholder has a privileged
position in the event of a default by the issuer.
This usually means that the bondholder’s
investment will not become due immediately
after an issuer’s default, i.e. that both cash fl ows
and the maturity remain as agreed, and that the
bondholder has a priority claim on the proceeds
of the cover assets ahead of unsecured creditors.
In most cases, the latter is achieved through asset
segregation, which ensures that the cover assets
are not included in the bankruptcy procedure.32
Most regulated covered bonds are designed to
comply with the provisions of Article 22(4)
of the UCITS Directive and with the Capital
Requirements Directive (CRD) (see Box 3). Since
covered bonds in order to be CRD-compliant
must be UCITS-compliant, all CRD-compliant
covered bonds are automatically compliant with
the latter. For this reason, the vast majority of
regulated covered bonds comply with both
directives. One exception is to be found in the
Netherlands, where there are UCITS-compliant
bonds that do not comply with the CRD. Thus
far (up to 2009), 24 countries in Europe have
introduced special covered bond legislation.
The European regulated covered bond market
is therefore characterised by many different
national legal frameworks for covered bonds,
which can – irrespective of their common
goals – vary substantially in respect of many
features, such as issuer characteristics, cover
pool requirements, asset liability management
and the monitoring of the cover pool.
In addition to regulated covered bonds, more
and more structured or general law-based
covered bonds have been issued in recent
years. These are designed to achieve similar
economic effects as regulated covered bonds,
but do so via contractual arrangements, instead
of on the basis of special legislation. In some
countries, such as France, the Netherlands and
the United Kingdom, regulated covered bonds
and structured covered bonds coexist.
It should be recalled that Jumbo covered bonds, too, suffered in 31
terms of secondary market liquidity when the market seized up
in the wake of the turmoil.
Covered bonds in the EU fi nancial system32 , ECB, 2008.
Chart 38 Outstanding amounts with cover pool
(public sector and mortgage bonds; in EUR billions)
0
100
200
300
400
500
600
700
0
100
200
300
400
500
600
700
Public Sector Mortgage
AT (estimate)
FI
FR
DE
GR
IE
IT
LU
NL
PT
SK
ES
Source: ECBC.

50ECB
Financial integration in Europe
April 2010
Although both directives already provide some
harmonisation for covered bonds, the defi nitions
therein remain general, in particular those in the
UCITS Directive. Regulated covered bonds can
differ substantially across the various European
countries with regard to a number of features
such as the issuer type (specialised credit
institution versus universal credit institution
with or without a special licence), the type and
structure of cover assets (mortgage loans, public
sector loans, ship loans, residential mortgage-
backed securities and aeroplane loans), the
Box 3
EU LEGISLATION
UCITS Directive
Article 22(4) of the UCITS Directive, in which the special character of covered bonds is
enshrined, stipulates certain minimum standards for the protection of bondholders. In the UCITS
Directive, covered bonds are defi ned as bonds issued by a credit institution that is subject by law
to special public supervision designed to protect bondholders. In particular, bondholder claims
must be secured throughout the term of the bonds by assets that would, under the applicable law,
be used on a priority basis to reimburse the principal and to pay the interest in the event of an
issuer’s failure.
Covered bonds that comply with these requirements are considered particularly safe investments.
Therefore, investment funds (i.e. undertakings for the collective investment in transferable
securities) can invest up to 25% (instead of at most 5%) of their assets in the covered bonds of
a single issuer that fulfi ls the criteria of Article 22(4). Similar, the EU Directives on Life and
Non-Life Insurance 1 allow insurance companies to invest up to 40% (instead of at most 5%) in
covered bonds of the same issuer that meet the requirements of the UCITS Directive.
Capital Requirements Directive
Under the Capital Requirements Directive (CRD), which provides the framework for
implementing Basel II rules on capital standards in the EU, covered bonds qualify for reduced
risk weights if they comply with the defi nition in the UCITS Directive and with certain eligibility
requirements for underlying assets. The categories of assets listed in the CRD as complying with
such requirements include, for example, exposures to governments or other public sector entities
in the EU, exposures to non-EU governments and public sector entities that qualify for credit
quality step 1 under the “standardised approach”, loans secured by residential or commercial
property with a loan-to-value (LTV) ratio not higher than 80% and 60% respectively, loans
secured by ships with an LTV ratio not higher than 60% and exposures to banks that qualify for
credit quality step 1 and do not exceed 15% of the cover pool.2, 3
1 Council Directive 92/96/EEC of 10 November 1992 on the coordination of laws, regulations and administrative provisions relating
to direct life assurance and amending Directives 79/267/EEC and 90/619/EEC (third life assurance Directive) (OJ L 360, 9.12.1992,
pp. 1-27) and Council Directive 92/49/EEC of 18 June 1992 on the coordination of laws, regulations and administrative provisions
relating to direct insurance other than life assurance and amending Directives 73/239/EEC and 88/357/EEC (third non-life insurance
Directive) (OJ L 228, 11.8.1992, pp. 1-23).
2 See Fact Book, ECBC, 2009; and Covered bonds in the EU fi nancial system, ECB, 2008.
3 The European Commission had launched a public consultation in mid 2009 on a proposal to change the CRD, which generally aims at
harmonising EU wide banking standards further. The changes proposed would also have an impact on covered bonds’ risk weight, such
as, among other issues, a proposed 20% limit for MBSs in the cover pool as of end-2010. However, no amendment has been adopted
by January 2010.

51ECB
Financial integration in Europe
April 2010
2 SPEC IAL FEATURES
loan-to-value ratios, over-collateralisation, cover
pool monitoring requirements (independent
monitoring is required in most cases), etc.
A comprehensive analysis of the main features
of European covered bonds and their differences
across countries is provided in the ECB’s
publication “Covered bonds in the EU fi nancial
system” of December 2008.
The diversity of the covered bond world and the
rather general defi nitions provided in the UCITS
Directive and the CRD make it diffi cult to agree
on a clear common defi nition of covered bonds.
The attempt by the ECBC to identify the
essential features of covered bonds can be seen
as progress in direction of a more widely
recognised common defi nition of covered
bonds.33 However, further refi nements would be
desirable, as outlined in Section 6.
5 RECENT PRICE DEVELOPMENTS AND
IMPACT OF THE COVERED BOND PURCHASE
PROGRAMME
In terms of yield developments, as in the
government bond market and, to some extent,
in the corporate bond market, movements in
covered bond yields typically show a high
degree of synchronisation across countries.
This is not surprising as covered bonds have
traditionally been perceived as close substitutes
for government bonds, although they carry a
somewhat greater credit risk. Chart 39 shows the
evolution of the spread of selected covered bond
yields vis-à-vis German fi ve-year government
bond yields as from July 2008.
While yield spreads of different countries have
clearly shown a high degree of synchronisation,
i.e. have all moved up or down at the same time,
they have also been characterised by a relatively
low dispersion (see Chart 41), and thus point
towards a process of convergence between
covered bonds of different countries or covered
bond legislation. Not surprisingly, this was not
the case during the fi nancial turmoil. Starting
in the summer of 2007, the dispersion in yield
spreads increased signifi cantly, while they all
widened and continued to maintain a high degree
of synchronisation. The main factor behind the
widening of the spread has been the “country-
risk” component, although the developments in
spreads could also indicate that the difference
between countries and the respective national
legislative frameworks does indeed play a role.
According to market participants, liquidity risk
has played a non-negligible role with regard
to the comparatively high risk premia. Also,
the perception of investors vis-à-vis covered
bonds has changed since the beginning of
the crisis. Furthermore, the announcement by
Covered bonds are characterised by the following common and 33
essential features that are set out in legal frameworks based
either on special laws or general legislation:
the bond is issued by – or bondholders otherwise have full –
recourse to – a credit institution that is subject to public
supervision and regulation;
bondholders have a priority claim against a cover pool –
of fi nancial assets over unsecured creditors of the credit
institution;
the credit institution has the ongoing obligation to maintain –
suffi cient assets in the cover pool to satisfy the claims of
covered bondholders at all times; and
the obligations of the credit institution in respect of the cover –
pool are supervised by public or other independent bodies
(ECBC).
Chart 39 Covered bond spreads against German five-year government bonds
(basis points)
0
50
100
150
200
250
300
350
400
450
500
0
50
100
150
200
250
300
350
400
450
500
all
France
Pfandbriefe (mortgages)
Ireland
Spain
all Germany
Jan.Sep.July JulyMayMar. Mar.Nov. Nov. Jan.Sep.
2008 2009 2010
Sources: Datastream and ECB calculations.

52ECB
Financial integration in Europe
April 2010
Standard & Poor’s in 2009 of amendments to
the rating methodology led to some uncertainty
among market participants.
Although the covered bond market was
not affected severely by the crisis until
mid-2008, primary market issuance has dropped
signifi cantly since September 2008, and
secondary market liquidity, too, has dried up.
On 7 May 2009, the Governing Council
announced that, in order to revitalise the market,
the Eurosystem would purchase covered bonds
issued in the euro area up to a total value of
€60 billion. The CBPP, which was put in place
in July 2009, has had positive effects on the
covered bond market, with fi rst signs of a
recovery already being observed immediately
after the announcement in May. The programme
has mainly led to more primary market activity,
with increased issuance volumes even in
countries that are not covered by the CBPP
(see Chart 40), and to sharply declining yield
spreads.34
In addition, the cross-country dispersion of
yield spreads declined rapidly after July 2009,
and stabilised at around 80 basis points
(see Chart 41). Since September/October 2009,
however, risk premia have not narrowed
signifi cantly further.
However, a decline of this kind was not observed
only in the covered bond market. As can be seen
in Chart 42, the yields on corporate bonds issued
by banks, as measured by the Iboxx index,
decreased as well.
However, issuance volumes in France and Germany were below 34
their pre-crisis levels in 2009, despite the positive impact of the
CBPP.
Chart 40 Issuance volumes of Jumbo covered bonds, broken down by country of the issuer
(EUR billions)
0
5
10
15
20
25
30
0
5
10
15
20
25
30
Jan. Apr. July Oct. Jan. Jan.Apr. July Oct.
AT
DK
FI
FR
DE
GR
HU
IE
IT
NL
PT
ES
SE
UK
2008 2009
Source: Dealogic.
Chart 41 Cross-country dispersion of covered bond spreads against German five-year government bonds
(basis points)
0
20
40
60
80
100
120
140
160
180
0
20
40
60
80
100
120
140
160
180
Jan.Sep. May Jan.Sep. May Jan.Sep.
2007 2008 2009 2010
Sources: Datastream and ECB calculations.
Chart 42 Unsecured bonds and covered bond spreads
(percentages, left-hand scale; basis points, right-hand scale)
0
1
2
3
4
5
6
7
8
0
50
100
150
200
250
Jan. JulyJuly Jan. July Jan. Jan.July
6th July:
start of implementation
of CBPP
7th May:
announcement
of CBPP
2006 2007 2008 2009 2010
yield of Iboxx senior financial bond
yield of Iboxx collateralized covered
spread (right-hand scale)
Sources: Datastream and ECB calculations.

53ECB
Financial integration in Europe
April 2010
2 SPEC IAL FEATURES
While caution must be exercised on account
of the simplicity of the analysis, such results
give some support to the notion that, given the
progress made in integration, developments in
the covered bond market may have an impact on
related markets.
6 SCOPE FOR FURTHER INTEGRATION
AND MARKET-LED INITIATIVES
The differences in national regimes and the
increased complexity of some covered bonds
make it diffi cult and costly for investors to
accurately assess the quality of the individual
products. Covered bond investors tend to
concentrate on their national markets, a pattern
that has actually been reinforced since the
fi nancial turmoil. Bank of America/Merrill
Lynch, for instance, has repeatedly reported an
increased home bias among covered bond
investors.35 The same pattern can be observed
with regard to the covered bonds that banks use
as collateral in Eurosystem credit operations.
When analysing the asset pool that banks put
forward as collateral for Eurosystem credit
operations, two patterns can be identifi ed.
First, compared with other asset classes, banks
generally hold a relatively higher share of
domestic covered bonds. Between August 2008
and October 2009, this share was approximately
10-15% higher for covered bonds than for
all other assets that can be used as collateral
(Chart 43).
Second, while the domestic share for covered
bonds decreased from 2005 to 2007, it started to
increase again in 2008, and reached more than
70% in 2009, i.e. almost the same level as in
2005 (see Chart 44).
The latter pattern, however, holds true for all
assets, as can also be seen in Chart 44 where
the relative share of domestic use for all assets
increased as from 2008. Credit institutions
are the largest covered bond investor group,
(holding approximately 40% of all covered
bonds) There is also anecdotal evidence that the
existing fragmentation of national markets is a
disincentive for certain international investors
“Global Covered bond markets 2009-2010”, Bank of America/35
Merrill Lynch, 2009, and “Tracing Investor Base Dynamics”,
Bank of America/Merrill Lynch, 2009.
Chart 43 Domestic use of covered bonds versus all assets
(percentages)
0
10
20
30
40
50
60
70
80
90
100
0
10
20
30
40
50
60
70
80
90
100
cross-border use covered bonds
domestic use covered bonds
domestic use all assets
Aug. Oct. Dec. Feb. Apr. June Aug. Oct.2008 2009
Source: ECB.Note: The domestic use of covered bonds also includes covered bonds where the issuer and the counterparty using it belong to the same banking group, even if they are entities in two different countries.
Chart 44 Domestic versus cross-border use of covered bonds as collateral
(percentages)
0
10
20
30
40
50
60
70
80
90
100
0
10
20
30
40
50
60
70
80
90
100
2005 2006 2007 2008 2009
cross-border
domestic
Source: ECB.Notes: The domestic use of covered bonds also includes covered bonds where the issuer and the counterparty using it belong to the same banking group, even if they are entities in two different countries. Data are based on snapshots taken at the end of year; for 2009, the snapshot was taken in October.

54ECB
Financial integration in Europe
April 2010
to enter the European covered bond market,
even though this instrument might match their
portfolio requirements rather well.
The existence of a considerable number of
investor reports that are aimed at explaining
the different national products and legislative
regimes and provide detailed overviews of up
to 40 programmes is in itself an indication that,
from the investor’s perspective, there is scope for
greater clarity, simplicity and comparability in
the world of covered bonds. As stated in one of
the investor reports, “[i]nvestors’ ability to fully
assess the risks different covered bond products
present … will require deep understanding of
the regulatory and legal framework.” 36
Market-driven initiatives aimed at providing
clarity with regard to the different frameworks,
but also at other issues like increasing secondary
market liquidity and transparency (of the cover
pool and prices), have already been launched,
most of them in the course of 2009. The
following initiatives might serve as examples:
The European Covered Bond Council (ECBC) –
provides a “Comparative Framework Tool”
on its website 37 that allows all or selected
features of covered bonds issued in different
jurisdictions to be compared.
The Covered Bond Investor Council –
(CBIC) was set up under the umbrella of
the International Capital Market Association
(ICMA) in early 2009. This investor-driven
organisation regards itself as independent
of both issuers and the market. The key
objectives of the CBIC are the promotion of
the long-term development of covered bonds
as a highly secure product and covered bond
market liquidity. The major issues addressed
by the CBIC are transparency in the cover
pool and the restoration of market liquidity.
The European Covered Bond Dealers –
Association (ECBDA) is an affi liate of the
Securities Industry and Financial Markets
Association (SIFMA). It was set up in late
2008 and represents the interests of covered
bond dealers in European covered bond
markets.
Covered bond regulators from different –
European countries have, for the fi rst time,
started to meet on an informal basis in order,
inter alia, to exchange views on legislation
and explore possibilities for working towards
greater convergence. The harmonisation of
the regulation and supervision of covered
bonds could have many benefi ts, such as
maintaining a balance between protecting the
interests of depositors and those of holders
of covered bonds by placing limits on asset
encumbrance.
In order to broaden the investor base, but
also to strengthen covered bonds further as a
separate and homogeneous asset class with
clearly defi ned quality standards, there is indeed
scope for further integration. The attempt of
the ECBC to fi nd a common defi nition can be
seen as a step in the right direction, although
it needs to be taken further. Moreover, market
participants should prioritise and support the
ECBC’s recent project for the development of
a common standard or defi nition of covered
bonds. This should at least produce clearer
defi nitions of certain minimum features, such as
the quality and type of assets in the cover pool
and the transparency of the cover pool, in order
to facilitate investor due diligence.
The Covered Bond Book36 , Bank of America/Merrill Lynch, 2009.
See www.ecbc.eu.37

55ECB
Financial integration in Europe
April 2010
2 SPEC IAL FEATURES
C. HARMONISATION IN THE POST-TRADING
SECTOR
The recent fi nancial crisis has highlighted the crucial role played by post-trading infrastructures in fi nancial market integration and stability. The Ecofi n Council has repeatedly stated that a fragmented European post-trading sector is not compatible with the single market, calling on both the industry and public authorities to work towards harmonising cross-border securities processing. Such harmonisation would bring important benefi ts in terms of integration, cost effi ciency and safety. Because of its unique position as guardian of monetary and fi nancial stability, the Eurosystem plays a key role in initiatives aiming to harmonise fi nancial infrastructure services across the EU. Against this background, the development by the Eurosystem of TARGET2-Securities can in particular be expected to revolutionise cross-border securities settlement in Europe. Other complementary initiatives, like the removal of the Giovannini barriers, the implementation of the ESCB-CESR Recommendations and the Eurosystem initiatives in the fi eld of collateral management will be equally important.
1 INTRODUCTION
Historically, fi nancial market infrastructures in
Europe were created to meet national
requirements and to manage securities
denominated in national currencies. In many
cases, there were only one or two dominant
players at each stage of the value chain: typically
one stock exchange for trading, possibly one
central counterparty (CCP) for clearing and at
least one central securities depositary (CSD) for
settlement.38 Today, despite the introduction of
the euro in 16 countries, the provision of
post-trading services (clearing and settlement)
remains fragmented along national lines.
The lack of harmonisation in technical
arrangements, market practices, regulatory
requirements and legal frameworks has made
progress towards integration diffi cult and means
that cross-border securities transactions have
high costs and additional risks.
This situation is not aligned with the needs of a
single currency and confl icts with the objective
of a competitive and integrated European
market for fi nancial services. In order to ensure
that the EU, and the euro area in particular,
possesses an infrastructure that permits a safe
and effi cient fl ow of payments and securities,
a number of public and private initiatives have
been launched. Their common objective is to
align post-trading systems rules and processes
across EU Member States.
The aim of this Special Feature is to present
the main harmonisation initiatives under way
at the EU level, focusing on the contribution
of the Eurosystem towards improving the
functioning of the post-trading sector. Section 2
recalls the main bottlenecks created by market
fragmentation and the key arguments in favour
of strong involvement by public authorities in
support of harmonisation. Section 3 then shows
how the existing harmonisation initiatives
complement each other. Finally, Section 4 looks
at the future priorities of the Eurosystem in
this area.
2 THE BENEFITS OF HARMONISATION
HARMONISATION AS A DRIVER OF EFFICIENCY
AND LOWER COSTS
Today, clearing and settling cross-border
transactions within the EU remains many
times more expensive for investors than
clearing and settling domestic transactions
(see Table 2). Moreover, domestic transactions
in the EU have remained far more expensive
Typically, once a trade is completed on an exchange 38
(when a buy instruction and a sell instruction are matched),
the CCP or clearing mechanism calculates the obligations
of each respective market participant, and the settlement
mechanism of the CSD subsequently transfers the securities
to the buyer’s account against a cash payment to the seller
(a process known as “delivery versus payment” or DVP).

56ECB
Financial integration in Europe
April 2010
than their equivalents in the United States,
where trades are settled either by the Depository
Trust and Clearing Corporation (DTCC) or the
Fedwire-Securities system.39
The lack of harmonisation across EU countries
on a legal, fi scal and technical level implies that
transacting across borders requires some form of
intermediation, either through the establishment
of links or more commonly through the use of
custodians. The 2001 Giovannini report showed
that a typical cross-border equity transaction
can require the involvement of as many as
11 intermediaries (compared with only 5 for an
equivalent domestic transaction) and a minimum
of 14 instructions between parties. Such a high
level of intermediation always comes at a cost.
However, despite these costs, recent years
have seen an increase in cross-border securities
transactions and a rising proportion of members
of trading platforms and CSDs originating from
outside the country in which the infrastructures
are domiciled.
To reduce costs, further integration and
harmonisation are needed. Streamlining and
automating post-trading systems to achieve
so-called straight-through processing (STP) will
require current infrastructures to harmonise
the way in which they operate. Effi ciency
gains as a result of harmonisation are likely
to be substantial because, like other utilities,
post-trading infrastructures are characterised
by positive network externalities and important
economies of scale and scope.40 The ultimate
cost savings will not only benefi t European
investors 41 but will also make Europe a more
competitive and attractive fi nancial marketplace
vis-à-vis the rest of the world.
HARMONISATION AS A WAY TO FOSTER
COMPETITION AND INTEGRATION
Harmonisation lowers entry barriers,
giving new players increased opportunities
to compete in the market. In addition,
harmonisation reduces obstacles to cross-
border consolidation and to the establishment
of links between infrastructures, which
also fosters competition. With close to
40 CSDs operating in the EU in 2009 (only
some of which are represented in Chart 45),
and with the five largest of these CSDs
accounting for 81% of the total value of
delivery instructions processed in the
market, harmonisation is likely to trigger a
process of consolidation and re-orientation.
This may result in a decreasing overall
number of infrastructures, although these will
be increasingly likely to be servicing multiple
markets.
Harmonisation does not necessarily lead to
consolidation into a single or few entities.
By promoting more closely aligned standards
and processes, harmonisation can also facilitate
the coordination and interlinking of different
systems. Interoperability agreements allow
participants in different systems to exchange
and settle payments or securities transactions
across markets and country borders. For
instance, a CSD can decide to establish a link
with another CSD in order to make it possible
for its participants to access the market covered
by the other CSD. By reducing the cost of
switching systems and by helping providers
extend their service offerings to other markets,
interoperability fosters competition. It creates
more transparency and freedom of choice for
investors by making post-trading services more
compatible and comparable.
See, for example, 39 The Direct Costs of Clearing and Settlement, Nera Economic Consulting, 2004.
See H. Schmiedel and A. Schönenberger, “Integration of securities 40
market infrastructures in the euro area”, Occasional Paper Series,
No 33, ECB, 2005.
In its May 2008 Conclusions, the Ecofi n Council explicitly 41
requested that the potential cost savings at the infrastructure
level be transmitted to retail investors.
Table 2 Average price per transaction of equities clearing and settlement services provided by European CSDs
(EUR)
Year Domestic Cross-border
2006 0.35 2.33
2008 0.25 2.88
Source: Monitoring prices, costs and volumes of trading and post-trading services, Report prepared for the European Commission, Oxera, 2009.

57ECB
Financial integration in Europe
April 2010
2 SPEC IAL FEATURES
HARMONISATION AND FINANCIAL STABILITY
In addition to improving effi ciency and
integration, harmonisation can also help make
the post-trading sector more sound and stable.
In 2008, 322 million delivery instructions were
processed by CSDs in the EU, with a total value
of €831 trillion (see Charts 46 and 47). Despite
a decrease of 9% in the value of transactions
from 2007 to 2008, the overall trend has been
one of steady growth in the last few years. The
size of the business and the interdependence
between securities settlement systems and
payment systems are such that any problem
affecting a major infrastructure could have
serious repercussions for the stability of the
fi nancial system as a whole.42 The experience of
the recent fi nancial crisis has shown that an
integrated infrastructure can contribute to
enhanced stability. In particular, although
infrastructures have proved resilient during the
crisis, the existence of non-harmonised
infrastructure features has resulted in increased
complexity and given rise to uncertainties,
particularly for those players active in more than
one market.
First, lack of harmonisation creates uncertainty
about which rules should apply to particular
trades.
Second, it creates complexity (and gives rise
to related costs) for players active in more than
one jurisdiction, which stems from the need to
deal with different legal and operational issues
for the same kind of trades. In particular,
default rules (including provisions of European
“The interdependencies of payment and settlement systems”, 42
CPSS Publications, No 84, Committee on Payment and
Settlement Systems, 2008.
Chart 45 Fragmentation among major European infrastructures and comparison with the United States
Trading
Clearing
Securitiessettlement and Assetservicing
Cashsettlement
EurexClearing EMCF
Euro-CCP
LCH.CLEARNET SA
LCH.CLEAR
NET LTD
CassaDi
Comp
SIX-xClear NSCC FICC
BMEGroup
DeutscheBörse
NasdaqOMX
NordicNasdaq
MTFs eg.Chi-x/
Turquoise
LUS.E.
EURONEXTPT, BE, FR, NL
LondonStock
Exchange
BorsaItaliana
SIXGroup NYSE
MTFseg.
BATS
Iberclear VP CSDx
InterBolsa
MonteTitoli
SIS
DTCC
FED
EUROCLEARClear
streamBankingFranfurt
Clearstream
BankingLuxembourg
Europe United States
NCBx
SNB
BE FI FR NL SEUK&IE
Source: ECB.Note: This simplifi ed overview of the securities landscape does not include all existing European infrastructures nor does it features the horizontal links between infrastructures.

58ECB
Financial integration in Europe
April 2010
Directives), are not consistently applied and
enforced throughout the EU. Differences
in default rules may relate to areas such as
the sequencing of the procedural steps to
activate default (i.e. the close-out rule), prices
for collateral evaluation, decision-making
mechanisms, different responsibilities and/or
degrees of discretion for system operators or
relevant authorities.
Third, additional problems may arise from
different rules for credit and liquidity management,
especially in emergency situations that trigger
non-cooperative precautionary behaviour from
market participants and give rise to increased
diffi culties in the liquidation of collateral.
THE ROLE OF THE EUROSYSTEM IN PROMOTING
HARMONISATION
In principle, it should be primarily the
responsibility of the industry to ensure an
appropriate degree of harmonisation of
market practices and technical arrangements.
However, coordination problems and vested
interests may constitute hurdles to progress.
For example, existing providers may have
an interest in maintaining the status quo,
as ineffi cient processes and barriers to
competition can translate into higher profi ts.
Harmonisation efforts can also be held up
by differences in legal, fi scal, and regulatory
frameworks for post-trading activities. This is
why harmonisation initiatives need the support
of public authorities.
Safe and effi cient clearing and settlement
systems are of utmost importance to the
Eurosystem in view of its statutory tasks in
relation to the implementation of monetary
policy, the smooth operation of payment
systems and the preservation of fi nancial
stability. The post-trading market infrastructure
is involved in the transmission of monetary
policy impulses, supports the functioning of
the money market, is used by counterparties in
the delivery of collateral to the Eurosystem in
credit operations, and in market participants’
liquidity and collateral management. Due to
their close interdependencies, problems in the
handling of securities can quickly endanger
the smooth operation of payment systems and
hamper the orderly functioning of money, repo
and fi nancial markets.
Chart 46 Value of securities held by CSDs
(EUR billions; end of period)
0
50,000
100,000
150,000
200,000
250,000
300,000
350,000
400,000
0
50,000
100,000
150,000
200,000
250,000
300,000
350,000
400,000
EU excluding euro area
euro area
2004 2005 2006 2007 2008
Source: ECB Statistics.
Chart 47 Value of securities transactions processed by CSDs
(delivery instructions; EUR billions)
0
200,000
400,000
600,000
800,000
1,000,000
1,200,000
1,400,000
1,600,000
1,800,000
0
200,000
400,000
600,000
800,000
1,000,000
1,200,000
1,400,000
1,600,000
1,800,000
341,927
661,362
745,881
916,318
830,849
225,395
512,261577,788
727,483
662,236
2004 2005 2006 2007 2008
euro area
EU27
Source: ECB Statistics.

59ECB
Financial integration in Europe
April 2010
2 SPEC IAL FEATURES
In this context, the Eurosystem’s involvement
in the furthering of harmonisation and
integration of the post-trading sector has to
be understood in relation to its core tasks
and mission. This involvement can take
different forms: acting as a catalyst for
change; oversight action; and/or operational
involvement. Section 3 describes relevant EU
harmonisation initiatives in the light of the
Eurosystem’s three main roles.
3 EXISTING INITIATIVES AT THE EU LEVEL
THE EUROSYSTEM AS A CATALYST FOR CHANGE
The Eurosystem acts as a catalyst for
change by supporting the market’s efforts
to harmonise post-trading practices and by
collaborating with other relevant public
authorities (EU institutions and national
authorities) to address regulatory obstacles to
effi cient cross-border clearing and settlement.
Over the years, the ECB has developed a strong
expertise in post-trading issues. Together with
the other Eurosystem central banks, it has
established close cooperation with the different
industry stakeholder groups. A key forum for
this cooperation is the Contact Group on Euro
Securities Issues (COGESI). In this context,
the Eurosystem has, in close interaction
with the private sector, carried out and
discussed surveys that have provided valuable
information to support work on harmonisation.
Examples of surveys include DVP settlement
procedures, interoperability links between
CCPs and settlement fails. This latter exercise
highlighted the lack of available data on some
aspects of fails management in Europe and the
heterogeneity of the measures put in place by
securities settlement systems to ensure timely
settlement and to mitigate the impact of fails.
Such fact-fi nding exercises are valuable in that
they allow the Eurosystem and market players
to gain knowledge about prevailing practices in
the post-trading sector and to discuss ways to
address shortcomings.
As regards the cooperation with authorities,
one initiative in which the Eurosystem
plays a catalyst role (together with the
European Commission) is the removal of
the “Giovannini barriers” to clearing and
settlement. Following two ground-breaking
reports by a group of fi nancial market experts
(called the Giovannini Group) set up by the
Commission, 15 barriers to the effi cient cross-
border clearing and settlement of securities
in Europe were identifi ed, as well as the
entities responsible for achieving harmonised
solutions to address them.43 Whereas some
barriers are embedded in diverging market
practices, and therefore require changes in
the way market players do business (“private
sector barriers”), nine barriers pertain to the
fi scal and legal frameworks of Member States
(“public barriers”). In order to support the
efforts of the private sector to harmonise
market practices, such as different rules
for the processing of corporate actions and
different message standards, an expert group,
called CESAME, was put in place by the
Commission in 2004. The ECB contributed
to the work of both the Giovannini Group
and CESAME, and continues to actively
participate in CESAME2, the new group
set up in the second half of 2008 to replace
CESAME.
The ECB also contributed to the identifi cation,
inter alia, of the correct actions for removing
Giovannini barriers 4 and 7 (covering intra-day
fi nality and differences in operating hours
respectively). Differences in operating hours
(and also in cut-off times for sending
instructions) constitute an obstacle to the cross-
border transfer of securities between different
EU settlement systems.44 Harmonisation of
operating hours among CSDs was therefore
See “Cross-Border Clearing and Settlement Arrangements 43
in the European Union”, the Giovannini Group, Brussels,
November 2001 and April 2003, available at http://ec.europa.eu.
The ECB User Standards laid down in 1999 require all SSSs 44
used for Eurosystem monetary policy and intraday credit
operations to have operating days and hours consistent with
those of TARGET.

60ECB
Financial integration in Europe
April 2010
identifi ed as a crucial action to foster integration.
Together with the European Central Securities
Depositories Association (ECSDA) and the
Securities Industry and Financial Markets
Association (SIFMA), the ECB conducted a
mapping exercise on the deadlines used in
different European markets. In particular, this
analysis showed that CSDs used different cut-
off times for internal transactions and for cross-
border transactions and that those for cross-
border transactions differ between systems. As a
consequence, the simple harmonisation of
domestic operating hours was not suffi cient to
remove Giovannini barriers 4 and 7.
In parallel to the work of CESAME, discussions
on how to remove the legal and fi scal barriers to
cross-border clearing and settlement took place
within the framework of two expert groups
composed mostly of offi cials from the Member
States, namely the Legal Certainty Group (LCG),
in which the ECB participated (see Box 4),
and the Fiscal Compliance Group (FISCO)
established by the European Commission.
Box 4
TOWARDS HARMONISATION OF SECURITIES LAW IN THE EU
The laws that apply to securities clearing and settlement and to the holding of securities are
complex and vary from jurisdiction to jurisdiction. There is currently no single EU legal
instrument regulating these activities per se. The Settlement Finality Directive (SFD) 1 and
the Financial Collateral Directive (FCD) 2 both provide some protection against certain risks
inherent in settlement and the use of securities as collateral, and their scope has recently
been extended.3 The Directives also usefully provide that when securities are provided as
collateral via book entry, for example to a system participant or central bank, it is the law
of the place where the securities account is maintained that determines the rights of the
collateral taker.4
The lack of a legal framework for rights in intermediated securities remains however
the single most important legal obstacle to integrated clearing and settlement in the EU.
In 2005 the Commission therefore established the Legal Certainty Group (LCG), a group of
securities law experts, to advise on solutions to legal barriers related to the cross-border holding
and settlement of securities. In August 2008, the LCG delivered its second advice,5 confi rming
the need for such a harmonised framework. It recommended that EU Member States should
confer on account holders a legal position in respect of securities credited to their account,
including the right to exercise and receive certain essential rights attached to the securities
1 Directive 98/26/EC of the European Parliament and of the Council of 19 May 1998 on settlement fi nality in payment and securities
settlement systems, as amended (OJ L 166 of 11.06.1998, pp. 45–50 ).
2 Directive 2002/47/EC of the European Parliament and of the Council of 6 June 2002 on fi nancial collateral arrangements, as amended
(OJ L 168 of 27.06.2002, p. 43).
3 This was effected by Directive 2009/44/EC of the European Parliament and of the Council of 6 May 2009 amending Directive 98/26/
EC on settlement fi nality in payment and securities settlement systems and Directive 2002/47/EC on fi nancial collateral arrangements
as regards linked systems and credit claims.
4 The so-called “PRIMA” rule – viz. Article 9(2) of Directive 98/26/EC of the European Parliament and of the Council of 19 May 1998
on settlement fi nality in payment and securities settlement systems, as amended, (OJ L 166, 11.6.1998, pp. 45–50), and, as regards
certain proprietary matters, also Article 9 of Directive 2002/47/EC of the European Parliament and of the Council of 6 June 2002 on
fi nancial collateral arrangements, as amended (OJ L 168, 27.6.2002, p. 43).
5 “Second Advice to the European Commission of August 2008 on solutions to legal barriers related to post trading in the EU”,
LCG, 2008.

61ECB
Financial integration in Europe
April 2010
2 SPEC IAL FEATURES
In November 2006, the European Commission
launched the Code of Conduct on Clearing
and Settlement. The Code is a self-regulatory
initiative which does not aim at harmonisation
per se, but which is likely to provide momentum
in support of harmonisation efforts. Signed
by all major European Exchanges, CCPs and
CSDs, it aims to create the conditions that
will facilitate more competition between
infrastructures.45 Based on three building
blocks, it contains common guidelines for
infrastructures in terms of price transparency,
interoperability, and service unbundling. The
ECB actively contributes to the work of the
expert group set up to assess the progress made
in implementing the Code.46
The principles of access and interoperability
in particular, by encouraging infrastructures
to seek linkages with one another, are likely
to contribute to harmonising the processes
used by Exchanges, CCPs and CSDs to
interact with other infrastructures and with
their users. In 2007, the ESCB conducted a
survey on existing link arrangements between
CCPs, the results of which offered a number
of interesting insights. In particular, the
survey highlighted three main categories of
arrangements: cross-participation, cross-
margining and mergers between CCPs.47
Overall, it found that the limited degree of
integration in CCP clearing and the difficulty
of establishing cross-margining agreements
in Europe (as opposed to the United States)
were partly due to the lack of a harmonised
EU regulatory framework. This work has
proved very helpful and the main findings
were confirmed later when the discussions on
CCP interoperability triggered by the Code
of Conduct started. Since the Code entered
into force the number of link requests
between infrastructures has substantially
increased. However, only a limited number
of links have been effectively established,
partly for commercial reasons (since
competitive clearing introduces competition
between the linked CCPs) and in part due to a
lack of harmonisation in CCP risk
management practices.
In addition, in the context of the Code of
Conduct, the ECB has been working together
with securities infrastructures and the
Commission to improve price transparency
and comparability, encouraging among other
things the development of best practice tools
The Code of Conduct is available at http://ec.europa.eu. 45
The Monitoring Group comprises representatives of the 46
Commission, the ECB and CESR. Representatives of market
infrastructures and their users are also invited to the meetings.
See 47 The role of central counterparties: issues related to central counterparty clearing; ECB-Fed Chicago conference, 3-4 April 2006, ECB and Federal Reserve Bank of Chicago,
July 2007.
(e.g. voting rights, payments), to instruct the account provider to dispose of the securities and
the right to hold them in a different manner. Certain methods of acquiring and disposing of
book-entry securities, namely crediting and debiting accounts and earmarking should also be
harmonised and should prevail over other methods. The group’s other recommendations concern
the duties of intermediaries, differing rules on the cross-border processing of corporate actions
and the dismantling of restrictions on the location of securities.
Building on this work the Commission announced in mid-2009 that it would adopt a proposal
for an EU directive on securities law by 2010 and issued a consultation document 6 inviting
stakeholders to comment. October 2009 also saw agreement on the draft UNIDROIT convention
on rights in intermediated securities,7 an encouraging development which should give impetus to
the Commission’s initiative.
6 Consultation document of the Services of the DG Internal Market and Services, G2/PP D (2009), 16 April 2009.
7 Viz. the second session of the fi nal diplomatic conference on the draft UNDIROIT Convention on substantive rules regarding
intermediated securities, Geneva, 5-9 October 2009.

62ECB
Financial integration in Europe
April 2010
such as online price simulators. In particular,
the ECB provided some monitoring and
analytical work on the “Conversion Table”
developed by ECSDA to provide a common grid
for understanding the price lists of CSDs, despite
the fact that each of them tends to use different
terminology and pricing models. Furthermore,
in 2009 the ECB carried out two fact-fi nding
studies on price examples and price simulators,
which concluded that, while substantial progress
had been made on price transparency, real
comparability remains diffi cult to achieve in the
absence of a harmonised defi nition of services.
THE EUROSYSTEM AND ITS OVERSIGHT ACTIVITIES
The Eurosystem and the other EU central banks
have worked with securities regulators to
harmonise regulatory and oversight standards in
the post-trading sector. Indeed, a convergence
of post-trading processes is only possible if
allowed by supervisors. Each market
infrastructure is supervised/overseen by the
authorities of the Member State in which it is
incorporated and there is no common EU
framework for the supervision and oversight of
CCPs and CSDs. In order to fi ll this gap and
promote a common EU supervisory approach,
the ESCB and the CESR (the Committee of
European Securities Regulators) have published
two sets of recommendations for clearing and
settlement arrangements in Europe: one for
securities settlement systems, and one for CCPs.
The recommendations, based on the
recommendations of the CPSS/IOSCO and
published on 23 June 2009, mainly focus
on risk issues and contain minimum safety
requirements that CCPs, CSDs, and ICSDs 48
need to comply with. Although the main aim of
the ESCB-CESR Recommendations is to ensure
the resilience of the post-trading securities and
derivatives infrastructure, their implementation
would foster harmonisation in two ways.
First, they create the conditions to ensure that
oversight of post-trading infrastructures takes
place in a harmonised way. More specifi cally,
they aim to reduce the differences in the existing
regulatory frameworks across Europe and hence
the risk of regulatory arbitrage, as well as
regulatory impediments to the creation of links
and interoperability. A common assessment
methodology has been developed in parallel to
facilitate a common and consistent application
of the Recommendations in practice.
Second, although the Recommendations are
addressed to public authorities, they also affect
infrastructures. These are encouraged to take
the Recommendations into account while
operating their businesses. By complying
with the Recommendations, post-trading
infrastructures can be expected to undergo a
process of convergence, not only in terms of
risk management standards, but also in terms of
effi ciency, transparency and governance.
The implementation of the ESCB-CESR
Recommendations would contribute to
removing a number of Giovannini barriers and,
in particular, would foster the harmonisation of
operating hours, fi nality rules and settlement
cycles. The ESCB-CESR Recommendations
will also facilitate the implementation of the
Code of Conduct (see Chart 48).
THE EUROSYSTEM AS OPERATOR
While its primary purpose as operator is to
provide services necessary for its central
banking tasks, the Eurosystem seeks to provide
its services in such a way that they support
integration and foster harmonisation. For
instance, the Eurosystem provides a uniform
service and pricing structure for the settlement
of large-value payments in its second generation
TARGET2 system, which is operated on a
single shared platform. It also plans to operate
two new platforms: TARGET2-Securities (T2S)
for settling European securities transactions in
central bank money; and CCBM2 for managing
collateral for central bank operations.
The two international central securities depositories (ICSDs) in 48
the European Union are Euroclear Bank (based in Belgium) and
Clearstream Banking Luxembourg. They were initially created
to settle Eurobonds and now offer a wide variety of services for
transactions in international and domestic securities.

63ECB
Financial integration in Europe
April 2010
2 SPEC IAL FEATURES
T2S aims to overcome the fragmentation
of settlement in Europe by creating a single
technical platform for the settlement of European
securities trades. T2S will provide harmonised
and commoditised DVP settlement in central
bank money, eliminating the distinction between
domestic and cross-border securities transactions
within the European market.
28 CSDs from 26 European countries have
signed the T2S Memorandum of Understanding
with the Eurosystem. This means that a large
majority of European CSDs intend to join the
T2S initiative, thereby supporting a harmonised
solution for the processing of securities
settlement transactions. Not only does T2S
attract CSDs beyond the euro area, but its multi-
currency dimension also means that it will
support the harmonisation of post-trading
processes throughout Europe. Indeed, several
non-euro area national central banks have
already confi rmed their interest in bringing their
currency into T2S.49 The implementation of T2S
will certainly be the most signifi cant milestone
in the harmonisation of European securities
settlement practices.
Although T2S will not address all the existing
barriers to cross-border securities processing in
Europe, it will de facto create a domestic market
for the settlement of European securities thanks
to a single platform and harmonised services and
prices for all participating CSDs. The impact
of T2S on harmonisation will be both direct
and indirect. Direct, because the development
of the platform itself will force harmonisation
to take place in those areas related to the core
settlement process, and indirect, because T2S
can be expected to trigger a “virtuous cycle”
whereby the harmonisation of core processes
will create both pressure and incentives to
harmonise further aspects such as safekeeping
and custody.
In terms of its direct impact, T2S will bring about
harmonisation by replacing current divergent
national practices with a single solution.
A common settlement platform for European
CSDs has the advantage that it involves going
from standards agreed on paper to the defi nition
of common processes which will become
market practice. Building T2S forces decisions
to be taken on the existing options to harmonise
securities settlement, such as the adoption of a
common interface, common message formats,
a common set of rules for intra-day settlement
The CSDs and the central banks of Denmark, Lithuania, Norway 49
and Sweden have confi rmed their interest in providing for the
settlement of their national currencies in T2S, in addition to
settlement in euro.
Chart 48 The ESCB-CESR Recommendations, the Code of Conduct and the Giovannini barriers
Giovanninibarriers
14 (netting)
6 (settlementcycles)
7 (operatinghours)
4 (intradayfinality)
5 (remoteaccess)
1 ( IT obstacles)
ESCB-CESRRecommendations
RSSS 1 and RCCP 1(legal risk)
RSSS 3 (settlement
cycles & operating times)
RSSS 8 (timing of settlement finality)y)
RSSS 5 (securities lending)
RSSS 9 (CSD risk controls)
RSSS 10 (cash settlement)
RSSS 13 and RCCP 13(governance)(g )
RSSS 14 (access) and RCCP 2 (participation
requirements)q )
RSSS 16 (communication)
RSSS 19 (risks on links)
RSSS 6-12 and 18 (risks)
RSSS 17 and RCCP 14(transparency)( p y)
RSSS 15 and RCCP 12(efficiency)
Code of Conduct
Accoutingseperation & serviceunbunding
Access &interoperability
Pricetransparency
direct impact
indirect impact
RSSS: Recommendations for Securities Settlement Systems
RCCP: Recommendations for Central Counterparties
Source: ECB.

64ECB
Financial integration in Europe
April 2010
fi nality and a harmonised daily timetable and
calendar. In the process, T2S will therefore
contribute to removing in one stroke many of the
private sector Giovannini barriers (see Table 3).
For example, T2S will contribute to eliminating
Giovannini barrier 1 as it will provide a single
IT platform with common interfaces and a single
messaging protocol (known as ISO 20022)
covering instructing, matching, settlement,
querying and reporting across all connected
markets. This single interface will benefi t all
participants, whether they connect directly to
T2S or via their CSD. Moreover, by introducing
a single operational schedule and calendar for
all connected markets (including a single start
and end-of-day, a common night-time settlement
window and a single calendar per T2S-eligible
currency), T2S will not allow different national
cut-off times and will therefore be instrumental
in removing Giovannini barrier 7. Besides, by
extending a single harmonised settlement model,
comprising RTGS DVP in central bank money,
to all domestic and cross-border transactions,
T2S will signifi cantly help remove the remaining
technical obstacles to interoperability, connectivity
and intraday fi nality across different markets
(Giovannini barriers 2, 4 and 5). Lastly, the
lifecycle management and matching functionality
in T2S will provide completely harmonised
services in the area of settlement instruction
management (Giovannini barriers 2 and 5).
T2S will not only force harmonisation in
many crucial areas, it will also increasingly
act as a catalyst for further harmonisation.
This is because T2S creates incentives for
both Member States and market participants to
harmonise current national practices and adopt
European standards. For instance, an important
feature of T2S is that the platform will provide
a “lean” settlement process which will not
support existing national specifi cities. Whereas
CSDs are free to offer services tailored to the
specifi cities of a local market at their own cost
after T2S is operational, this extra cost creates
incentives for harmonisation. Furthermore, T2S
will allow intermediaries to harmonise their
back-offi ce processes. Indeed, banks and other
CSD users will have the possibility of routing
their settlement instructions directly to the T2S
platform rather than via a CSD, which will
enable them to rationalise their back-offi ces
and to centralise the processing of securities
settlement.
In general, it is expected that T2S will have an
indirect impact on Giovannini barriers other
than those highlighted in Table 3. The removal
of these other barriers is necessary for T2S to
deliver its full potential in terms of cost savings.
Table 3 TARGET2-Securities and the 15 Giovannini barriers
Giovannini barrier Will T2S contribute to removing it?
1. National differences in information technology and interfaces
Yes
2. National clearing and settlement restrictions that require the use of multiple systems
Yes
3. Differences in national rules relating to corporate actions, benefi cial ownership and custody
Yes
4. Absence of intra-day settlement fi nality
Yes
5. Practical impediments to remote access to national clearing and settlement systems
Yes
6. National differences in settlement
periods
No
7. National differences in operating hours/settlement deadlines
Yes
8. National differences in securities
issuance practice
No
9. National restrictions on the location
of securities
No
11. Domestic withholding tax regulations
serving to disadvantage foreign
intermediaries
No
12. Transaction taxes collected through
a functionality integrated into a local
settlement system
No
13. The absence of an EU-wide
framework for the treatment of
interests in securities
No
14. National differences in the legal
treatment of bilateral netting for
fi nancial transactions
No
15. Uneven application of national
confl ict of law rules
No
Source: ECB.

65ECB
Financial integration in Europe
April 2010
2 SPEC IAL FEATURES
Following a strong request from the market, the
Eurosystem published a harmonisation proposal
addressed to the CSDs on 23 May 2008, which
underlines the commitment of the ECB’s
Governing Council to promote harmonisation
efforts. Three lists of areas requiring further
harmonisation were specifi ed to allow a
prioritised approach:
List A contained the aspects which would be •
harmonised as a direct effect of implementing
the version of the T2S user requirements
developed during the project’s preparation
phase, which lasted until mid-2008.
These aspects have already been mentioned
as having a direct impact on eliminating the
Giovannini barriers (e.g. a common interface
and daily timetable);
List B contained aspects with a direct •
impact on the T2S user requirements, which
have subsequently been harmonised during
the project’s specifi cation phase between
mid-2008 and the end of 2009. These aspects
included the development of harmonised
end-to-end processing standards for corporate
actions on pending transactions in T2S, as
well as the harmonisation of several other
processes aimed at enhancing processing
effi ciency in T2S;
List C covered other aspects which, although •
important for progress on wider market
harmonisation, do not directly affect T2S
functionality. These aspects are for the most
part monitored in the context of CESAME2
(e.g. fi scal and legal aspects).
The implementation of T2S will act as a
catalyst to progress towards harmonising the
aspects contained in List B. With respect to
the wider harmonisation issues (List C), the
T2S team keeps track of progress and supports
steps to promote further harmonisation. For
example, the T2S Advisory Group contributed
to the on-going discussion in CESAME2
on the harmonisation of settlement cycles.
The T2S community is also working on the
harmonisation of CSD account structures.
Another important fi eld of harmonisation to
which the Eurosystem contributes in its role as
an operator concerns collateral, i.e. those assets
that are transferred to the Eurosystem as
security for monetary policy credit operations
and for the provision of intraday credit in
TARGET2. In response to market concerns
about the diffi culty of mobilising collateral in a
cross-border context (mainly due to varying
degrees of automation at central bank level and
to different procedures for domestic and cross-
border collateral), the Eurosystem decided in
2008 to move from a decentralised to a
technically consolidated collateral management
system. The new collateral management
platform, called CCBM2, will ensure the
greatest possible synergies with T2S and also
TARGET2. The three systems together will
enhance liquidity management for Eurosystem
counterparties (see Chart 49). CCBM2 aims to
support harmonisation and effi ciency in
collateral management,50 both in terms of speed
and cost.
More specifi cally, the CCBM2 User
Requirements published in July 2008 set out
key aspects of collateral management that will
be harmonised as a result of implementation of
the project, such as communication standards,
collateralisation practices and credit claim
management. However, many respondents
to the public consultations on CCBM2
For more information on the CCBM2 project, see the dedicated 50
section of the ECB’s website at http://www.ecb.europa.eu.
Chart 49 Synergies between Eurosystem projects
Provision of euro
Central Bank Money
Adjustment
of credit
lines
Information
to facilitate
auto-collateralisationMobilisation
of securities for
collateralisation
purposes
Source: ECB.

66ECB
Financial integration in Europe
April 2010
carried out by the ECB in 2007 and 2008
highlighted the need to harmonise further areas
in order to fully exploit the effi ciency gain
opportunities of the project. Following two
ad hoc meetings between the Eurosystem and
market participants in March and May 2008,51
a list of issues for harmonisation was produced
which identifi es three areas of harmonisation
for CCBM2: a) harmonisation issues already
included in the CCBM2 user requirements;
b) other harmonisation issues directly related
to the CCBM2, but not part of the CCBM2 user
requirements (aspects which, if harmonised,
would further enhance CCBM2 and allow the
platform to yield even more effi ciencies, such
as auto-collateralisation and triparty services);
and c) issues involving wider harmonisation of
the post-trading environment, which are also
benefi cial for CCBM2.
4 THE WAY FORWARD
The Eurosystem will continue to support
harmonisation as a powerful means to achieve
its long-term vision of a European “domestic”
market for payments and securities settlement.
In the fi eld of LVPSs, the distinction between
national and cross-border transactions in
euro has already been largely abolished.52
In contrast, the process of European integration
is only beginning in relation to securities
infrastructures. With T2S, the Eurosystem will
provide one of the most important tools for
delivering the vision of a harmonised and
integrated post-trading system. However, T2S
will not by itself achieve full harmonisation.
Supporting other complementary initiatives
will therefore also remain a priority.
Against this background, the ECB and EU
central banks are heavily involved in other
complementary initiatives to reap further
benefi ts from Europe-wide harmonisation.
First, the Eurosystem works hand in hand
with other public authorities to ensure that
the regulatory and supervisory framework for
post-trading supports the goals of
harmonisation, effi ciency and safety. Together
with CESR, the ESCB will now endeavour, as
a matter of priority, to ensure that the ESCB-
CESR Recommendations are consistently
applied throughout Europe. Although the
Recommendations constitute an important step
towards greater convergence of the supervisory
and oversight approaches of Member States,
many national differences persist which
make it diffi cult to perform cross-country
comparisons of the risk reviews carried out.
Since the Recommendations are non-binding, it
is essential that the ESCB and the CESR jointly
monitor their consistent implementation.
The close cooperation with the European
Commission, which has a leading role in a
number of key initiatives, such as the Code of
Conduct and CESAME2, will be continued.
Through its contribution to the work of both
CESAME2 and the Monitoring Group, the ECB
can bring its own perspective to the debate,
stressing the benefi ts of harmonisation for
fi nancial stability and the smooth interaction
between securities settlement and payment
systems. In general, the Eurosystem supports
the priorities identifi ed in the CESAME report 53
and recognises that, while some barriers have
been largely removed (e.g. the absence of a
harmonised process for allocating ISIN codes to
new securities), other important barriers remain
and require urgent action (e.g. differences
in settlement periods and the processing of
corporate actions).
The minutes of these meetings are available on the ECB’s 51
website at http://www.ecb.europa.eu
With the creation of the TARGET system (initially as a fi rst 52
generation version in 1999, which was subsequently replaced
with a second generation version) and EURO1, users of LVPSs
now benefi t from a single, harmonised set of tools, services and
procedures to transfer euro payments within and across national
borders under the same conditions. In the case of retail payments,
the Single Euro Payments Area (SEPA) aims to achieve the same
objective by replacing the current fragmentation with a truly
domestic market for euro payments.
See “Solving the Industry Giovannini Barriers to post-trading 53
within the EU”, CESAME, 2008.

67ECB
Financial integration in Europe
April 2010
2 SPEC IAL FEATURES
In addition, the Eurosystem regularly publishes
opinions on draft securities legislation prepared
by the Commission or the Member States.
In June 2009, it provided input to the public
consultation on harmonising EU securities law
to provide legal certainty for securities holdings
and dispositions (see Box 4).
Secondly, the Eurosystem deems it essential to
continue to support private sector initiatives in
the fi eld of harmonisation, whether or not related
to T2S. Such cooperation with the industry is
proving successful in ensuring that progress is
made towards harmonisation. Overall, it is clear
that the various EU post-trading initiatives to
which the Eurosystem has contributed, such as the
Code of Conduct and CESAME2, have together
contributed to create a new momentum in the
market, notably by instilling more competition
between what used to be national monopolies.
In particular, there are some encouraging signs
that market infrastructures, whether CCPs or
CSDs, are adapting their practices, and even
their business models, to take account of the
drive towards more harmonisation. In this
respect, two major private initiatives are worth
mentioning. In 2009, the Euroclear Group
completed the Euroclear Settlement of
Euronext-zone Securities (ESES) project,
which fully integrates clearing and settlement
in France, Belgium and the Netherlands.
Users now need hold only one account at one
of the three CSDs to access securities in the
other CSDs of the group. Another initiative,
involving eight European CSDs and two
non-European CSDs54 is the joint venture
called “Link Up Markets” launched in
March 2009. Unlike the Euroclear initiative,
Link Up Markets does not aim to create a
single consolidated settlement engine, but
rather focuses on the provision of more effi cient
cross-border settlement and custody services
between legally independent CSDs, through an
enhanced exchange of messages. Although the
two initiatives refl ect alternative approaches,
they are likely to pave the way for more
harmonisation in the future.
In the fi eld of collateral management, in addition
to implementing CCBM2, the Eurosystem will
support the market in establishing a secondary
market for credit claims (bank loans). The
objective is to increase the availability of
collateral and make the market more effi cient,
through more harmonised legal and technical
processes for the use of credit claims as
collateral. Although credit claims are not
securities, it is expected that the technical
infrastructure to be developed around them
(e.g. settlement platforms) will operate in a
similar way to post-trading infrastructures for
securities. Achieving synergies between this
project, CCBM2, T2S and other related projects
will therefore be essential in the future.
All in all, harmonisation is an ongoing process
which requires the involvement and close
collaboration of public and private actors
alike. The fragmented nature of post-trading
arrangements means that Europe is not as
competitive as it could be. Action is required
in a number of complex areas, including
market practices, technical arrangements, legal
frameworks, fi scal procedures, risk management
standards and regulatory conditions. Because
of its unique responsibilities, the Eurosystem
is well placed to support harmonisation
initiatives, whether in its capacity as operator,
overseer or catalyst. A more integrated, effi cient
and resilient EU post-trading sector will not
only bring benefi ts to the users of securities
infrastructures. In the long term, it will also
support the Europe 2020 strategy for growth and
jobs, contributing to the economic well-being of
European citizens.
As of 2 March 2010, Link Up Markets had ten members: 54
Clearstream Banking (Germany), the Cyprus Stock Exchange,
the Hellenic Exchange (Greece), IBERCLEAR (Spain), OeKB
(Austria), SIX SIS (Switzerland), VP Securities (Denmark), VPS
Norway, Strate (South Africa) and MCDR (Egypt).

68ECB
Financial integration in Europe
April 2010
D. STABILITY IMPLICATIONS OF FINANCIAL
MARKET INTEGRATION AND DEVELOPMENT
This Special Feature evaluates research results on the fi nancial stability implications of fi nancial market integration and development, with special focus on recent trends in the fi nancial structures that have played a role in the context of the crisis.Integrated and developed fi nancial systems are highly effi cient in allocating fi nancial resources, but are also exposed to risks of instability. The crisis has shown, in particular, that an extensive and under-regulated combination of securitisation and banking, together with signifi cant complexity in the design and valuation of securities, tends to erode bank credit monitoring and undermine market transparency, fuelling systemic risk. A high degree of geographical and sectoral interconnection of banking and fi nancial markets in such conditions compounds the problem by spreading contagion across institutions and markets. Moreover, certain regulatory and institutional features, like marking-to-market accounting and the predominant use of over-the-counter transactions in credit derivative markets, can also contribute to instability under stressed market conditions.An intense debate is under way on how to enhance the resilience of fi nancial systems. Increased transparency, reduced complexity of fi nancial instruments, macro-prudential supervision aimed at a timely detection of prospective imbalances and assessment of cross-market contagion, as well as coordination (and when necessary, harmonisation) of regulatory and supervisory policies across national borders are some of the ways suggested in academic and policy discussions to retain the benefi ts of integration and development and – at the same time – contain the fi nancial stability risks associated with them.
1 INTRODUCTION
The years preceding the crisis were characterised
by rapid growth and structural transformation
of the global fi nancial system. Spurred, inter alia, by a high appetite for – and benign
perceptions of – risk among market participants,
as well as favourable liquidity conditions, a
general and mutually reinforcing process of
fi nancial integration, deepening and innovation
was set in motion. This process increased the
breadth, fl exibility and effi ciency of the fi nancial
system, but also contributed to the build-up of
vulnerabilities that have exacerbated the recent
fi nancial crisis.
The crisis demonstrates that a process tending
towards a more closely integrated and more highly
developed fi nancial system does not necessarily
improve its performance in terms of both “effi ciency” and “stability”. Financial integration
and development 55 can raise the effi ciency of a
fi nancial system – and thereby productivity and
growth in the economy as a whole – if
accompanied by adequate legal and regulatory
frameworks, corporate governance, market
infrastructures, etc.56 A more open and innovative
fi nancial sector offers better opportunities for risk
diversifi cation and facilitates access to funding
and market liquidity which, in turn, tend to
improve the shock-absorbing capacity of the
system under normal circumstances.
However, some recent advances and trends in
the global fi nancial system have also impacted
adversely on incentive structures and information
asymmetries within the system, as we shall
discuss. This experience shows that the impact
of integration and development on stability
needs careful qualifi cation. Certain forms of
Financial integration and fi nancial development are distinct, but 55
interrelated notions. Both affect the performance of a fi nancial
system. Integration generates competitive pressures on fi nancial
intermediaries, creates economies of scale, increases overall
market liquidity and improves the scope for diversifi cation
and risk sharing. However, frictions in fi nancial markets can
persist even after fi nancial integration has been completed.
The development of fi nancial systems helps to overcome
these frictions. It refers to the process of fi nancial innovation
and organisational improvements that reduces asymmetric
information, increases the completeness of markets, multiplies
the possibilities for agents to engage in fi nancial transactions
through (explicit or implicit) contracts, reduces transaction
costs and increases competition. See P. Hartmann, F. Heider,
E. Papaioannou, and M. Lo Duca, “The role of fi nancial
markets and innovation in productivity and growth in Europe”,
Occasional Paper Series, No 72, ECB, 2007.
See “Special Feature A – Financial development: concept and 56
measures”, Financial Integration in Europe, ECB, April 2009.

69ECB
Financial integration in Europe
April 2010
2 SPEC IAL FEATURES
fi nancial innovation may increase systemic risk,
owing to perverse incentives and a stronger
inter-connectivity between fi nancial markets
and fi nancial institutions, raising the scope for
imbalances and contagion, as well as magnifying
the potential damage from small probability
events.57 The challenge of gauging the stability
impact of fi nancial innovation ex ante is further
complicated by the fact that large fi nancial
crises are rather rare and idiosyncratic events,
rendering empirical tests of relevant hypotheses
particularly diffi cult.
Against this background, this Special Feature
summarises the academic literature on the fi nancial
stability implications of certain phenomena that
characterised fi nancial developments prior to the
current crisis. Section 2 addresses the relationship
between fi nancial openness (including foreign
bank ownership) and cross-market integration
(in the money market, including the impact of
hedge funds and private equity fi rms), on the one
hand, and fi nancial stability on the other. Section 3
analyses the fi nancial stability implications of
certain features of modern fi nancial systems,
namely securitisation, fi nancial complexity,
mark-to-market accounting and fi nancial
derivates. Although fi nancial integration and
development are distinct concepts, in practice,
the issues addressed in the two sections are also
interrelated, sometimes blurring the demarcation
lines between them. For example, securitisation
was a vehicle of increased international fi nancial
integration and risk-sharing prior to the crisis,
which integrated mortgages with other market
segments. Moreover, certain features of
securitisation made the relationships between
ultimate borrowers and lenders more complex,
less transparent and prone to incentive problems.
Section 4 derives a few conclusions that emerge
from the literature.
2 THE RELATIONSHIP BETWEEN FINANCIAL
INTEGRATION AND FINANCIAL STABILITY
International fi nancial integration can normally
be assumed to be benefi cial. Access to world
capital markets expands investors’ opportunities
for portfolio diversifi cation, enables higher
risk-adjusted rates of return, improves effi ciency,
strengthens market discipline and enhances
risk-sharing. At the same time, economists
have also recognised the risk of volatility and
abrupt reversals of capital fl ows, contagion
and cross-border transmission of fi nancial shocks
that are normally associated with higher
integration.58 The current crisis has also brought
some stability risks of integrated fi nancial systems
to the fore, and highlighted a certain
“disintegrating” potential of widespread fi nancial
turmoil. Against this background, this section
reviews current thought and analyses regarding
the benefi ts and costs of fi nancial integration with
respect to fi nancial stability, as well as the
literature on various regulatory measures that
have been proposed in order to reduce the costs
without diminishing the benefi ts.
FINANCIAL GLOBALISATION AND FINANCIAL
OPENNESS
The two decades before the onset of the present
crisis were characterised by rapid globalisation
of fi nancial markets and services. While
different markets were integrating at a different
speed even within the same economic zone
(for example, money and bond markets in the
euro area became almost perfectly integrated
while retail banking markets were much less so),
fi nancial globalisation as a whole was moving
at an unprecedented speed. For example, one
commonly used measure of an individual
country’s degree of fi nancial integration
(gross external liabilities) – increased from about
20% of GDP in 1970 to well over 200% of GDP
in 2007 for high-income countries.59 Since such
See 57 Financial Integration in Europe, ECB, April 2009, p. 7,
and R. Rajan, “Has Finance Made the World Riskier?”,
European Financial Management, Vol. 12, No 4, 2006,
pp. 499-533.
See F. Fecht, H. Grüner and P. Hartmann (2009), “Financial 58
Globalization and Stability”, in D. Evanoff, D. Hoelscher,
and G. Kaufman (eds.), Globalization and Systemic Risk,
World Scientifi c Publishers, 2009, pp. 53-84, for a discussion
of effi ciency benefi ts and stability risks.
A. Faria, P. Lane, P. Mauro, and G.M. Milesi-Ferretti, 59
“The Shifting Composition of External Liabilities”, Journal of the European Economic Association, Vol. 5, No 2-3, 2007,
pp. 480-490.

70ECB
Financial integration in Europe
April 2010
rapid fi nancial globalisation has been followed
by such a severe global crisis, the question
of the link between fi nancial openness and
stability has become even more relevant.
Financial integration provides access to a wider
range of assets and therefore helps improve
risk-sharing. It improves the liquidity of markets
and strengthens their resilience to shocks.
It also enhances information and competitiveness
in various markets, reducing the likelihood
of mis-pricing of fi nancial instruments and
strengthening market discipline. The latter
effect should in principle be associated with
more robust and healthy fi nancial institutions in
the long term.60
In addition, recent research has looked at
one particular channel via which fi nancial
integration affects stability, namely,
the channel of optimal diversifi cation.
Evidence from a large 40-year panel of OECD
countries suggests that fi nancial integration
tends to accelerate the economy’s convergence
towards a diversifi cation benchmark based
on the idea of allocative effi ciency. By doing
so, fi nancial integration reduces economic
volatility and dampens the effect of fi nancial
instability. However, the evidence also implies
that there might be a point beyond which a
country becomes “over-integrated”, in the
sense that further integration is associated
with movement away from rather than towards
optimal diversifi cation, thus increasing the
likelihood of recessions and thereby worsening
effi ciency and stability.61
A high degree of openness and integration may
also be associated with higher cross-border
contagion risk. Its role in enhancing competition
can furthermore increase incentives for
risk-taking in the short run and intensify the
search for yield, especially in a low interest rate
environment. Financial integration could also be
conducive to a high degree of volatility in capital
movements in the shape of large reversals of
short-term fl ows (although arguably, this effect
is more relevant to smaller economies).62
Stability risks may also arise if the driving forces
underlying stronger international fi nancial
integration refl ect economic imbalances.
It has been argued 63 that the pre-crisis boom
in US real estate and securitisation markets
refl ected high foreign demand for safe US
assets resulting from “excess world savings”
in the context of persistent global imbalances.
According to this interpretation, foreign asset
demand not only pushes down the domestic
(US) risk-free interest rate but also compresses
the risk premia on risky assets. The low cost
of fi nancing, in turn, fosters an increase in the
level of leverage of the domestic fi nancial sector
which exacerbates systemic risk. Leverage is
also enhanced by the introduction of securitised
products, which are perceived as close
substitutes for riskless assets, in order to meet
the high foreign demand for such assets.
Prior to the current crisis, there had been no
evidence that more open developed countries
were likely to experience more costly crises.64
In fact, more fi nancially open countries seem not
to have experienced a higher cost, even in the
context of this crisis, barring a few small and very
open economies like Iceland and Ireland.
Nevertheless, the severity and length of the crisis
has highlighted the increasing importance of
contagion risks in global fi nancial markets today.
In particular, cross-border fi nancial integration
may produce fi nancial stability risks in the
presence of continued national autonomy in the
fi nancial policy sphere (regulation, supervision
and stability), and the supervisory framework
needs to adjust to this evolution. This is true both
P.-R. Agenor, “Benefi ts and Costs of International Financial 60
Integration: Theory and facts”, Policy Research Working Paper Series, No 2699, World Bank, 2001.
See S. Manganelli and A. Popov, “Finance, Effi ciency, 61
and Recessions”, mimeo, ECB, 2009.
R. Chang and A. Velasco, “Banks, Debt Maturity, and Financial 62
Crises”, Journal of International Economics, Vol. 51, No 1,
2000, pp. 169-194.
R. J. Caballero and A. Krishnamurthy, “Global Imbalances and 63
Financial Fragility”, American Economic Review, Vol. 99(2),
May 2009, pp. 584-588.
R. Ferguson, P. Hartmann and F. Panetta, “International 64
Financial Stability”, Geneva Report on the World Economy,
No 9, 2007.

71ECB
Financial integration in Europe
April 2010
2 SPEC IAL FEATURES
at the European and at the global level. Thus, it is
important that the “internationalisation” of
fi nancial policy keeps step with the speed at
which international fi nancial integration
progresses.65 In addition, fi nancial supervision
should pay particular attention to assessing in real
time not just the build-up of within-market risk,
but also cross-market contagion and linkages
between large and complex fi nancial institutions.
By providing the basis for a strong European
macro-prudential supervisory framework, the
de Larosière Report,66 the subsequent Ecofi n
Council proposal 67 and the European
Commission’s legislative proposals constitute
vital steps in that direction in Europe.68
FOREIGN BANK PENETRATION
One of the main developments in the European
banking landscape in the past decade has
been the increasing importance of cross-
border banking. Foreign banks account for the
ownership of over a quarter of domestic bank
sector assets in the euro area, and for almost
three quarters of domestic bank sector assets in
the ten EU Member States that joined in 2004
and 2007 (with highs of 99% in Estonia and
Slovakia).69 Naturally, this development raises
the question of the link between foreign bank
ownership and fi nancial stability. Increasing
integration offers the prospect of important gains
in terms of effi ciency and diversifi cation, but it
also creates potential systemic risks. There are a
number of reasons why foreign bank ownership
can be expected to contribute to stability. For
one, foreign bank penetration may contribute
to a reduced volatility of capital fl ows if in
periods of instability depositors shift their funds
to foreign institutions that are perceived to be
sounder than domestically owned banks, rather
than transferring assets abroad or engaging in
capital fl ight.70 Second, foreign banks that enter
emerging markets tend to allocate capital to the
more effi cient fi rms, alleviating asymmetric
information problems and thus reducing the
probability of fi nancial crises and contagion.71
However, there are also arguments to explain
why increasing penetration by foreign banks can
be associated with instability, and this possibility
is not limited to the experience of the developing
world. For example, foreign banks may exploit
governments’ fear of many banks failing at the
same time and select portfolios that resemble
those of large domestic fi nancial fi rms, thereby
increasing the probability of a crisis.72
Second, there may be important moral hazard
problems involved. In particular, ineffi cient
cross-border banks may be engaging in riskier
investment strategies than ineffi cient domestic
banks in a high-growth environment where they
lack information to price investment
opportunities. Evidence from European banks
indeed suggests that ineffi cient cross-border
banks are likely to be riskier, and that loan
growth has a clear effect on banks’ risk and
ineffi ciency.73 A third risk associated with cross-
border banking stems from the possibility that a
shock to a cross-border bank’s capital will result
in a reduction in lending to fi rms and consumers
in locations far from the origins of the shock.
Theory suggests that banks routinely respond to
capital losses stemming from asset-price
fl uctuations by curtailing new lending, which
leads the real sector to deteriorate and increases
the losses on the banks’ portfolios.74
The behaviour of lenders in the early phase of
the crisis suggests that this fi nancial accelerator
See I. Angeloni, “Testing times for global fi nancial governance”, 65
Bruegel Essay, 2008, and D. Schoenmaker, “The Trilemma of
Financial Stability”, mimeo, University of Amsterdam, 2009.
“The High Level Group on Financial Supervision in the EU 66
Report”, Brussels, 25 February 2009.
“Council Conclusions on Strengthening EU Financial 67
Supervision”, Luxembourg, 9 June 2009.
See Special Feature A for more information on the new EU 68
supervisory architecture.
See 69 Structural indicators for the EU banking sector, ECB,
January 2010, and 2009 Transition Report: Transition in crisis,
EBRD, November 2009.
G. Caprio and P. Honohan, “Restoring Banking Stability: 70
Beyond Supervisory Capital Requirements”, Journal of Economic Perspectives, Vol. 13, 1999, pp. 43-64.
See M. Giannetti and S. Ongena, “Financial Integration and Firm 71
Performance: Evidence from Foreign Bank Entry in Emerging
Markets”, Review of Finance, Vol. 13, 2009, pp. 181-223.
V. Acharya, “A Theory of Systemic Risk and Design of 72
Prudential Bank Regulation”, Journal of Financial Stability,
Vol. 5, 2009, pp. 224-255.
F. Fiordelisi, D. Marques and P. Molyneux, “Effi ciency and 73
risk-taking in European banking”, mimeo, ECB, 2009.
G. von Peter, “Asset Prices and Banking Distress: 74
A Macroeconomic Approach”, Journal of Financial Stability,
Vol. 5, 2009, pp. 298-319.

72ECB
Financial integration in Europe
April 2010
effect may be larger when foreign-owned banks
are involved, as they prefer to shrink their
portfolio abroad in response to asset shocks rather
than damage relationships with domestic
customers (although this behaviour may depend
on the structure of the group and the group-level
funding management policies).75 Finally,
evidence from the ten EU Member States that
joined in 2004 and 2007 suggests that there was
an increase in pre-crisis credit risk stemming
from the rapid increase in the importance of
foreign banks, through channels like the readiness
to provide foreign currency consumer and
mortgage loans and the tendency to underestimate
the build-up in credit risk arising from rapid
credit growth in emerging economies.76
The pros and cons of foreign ownership in
the banking sector and increased cross-border
exposure pose the obvious question of the
role of regulation in curtailing the cons
without diminishing the pros. In normal
market conditions, bank deregulation has been
suggested as a tool to improve loan quality and
lower credit risk. Evidence from European bank
balance-sheet data implies that screening
intensifi ed and that loan quality subsequently
improved in the wake of the Second Banking
Directive.77 However, theoretical studies have
suggested that different regulatory steps should
be taken in the wake of a fi nancial crisis, such as
prompt closure of insolvent institutions, prompt
identifi cation of claims and assignment of losses
and prompt re-capitalisation and re-privatisation
of failed institutions.78 In other words, the policy
measures appropriate for crisis management
may differ markedly from regulatory and
supervisory measures needed in normal times,
which is only natural given the swing in the
appropriate balance of effi ciency and stability
that occurs between “good” and “bad” times.
INTERBANK MARKET INTEGRATION
The interbank market was the most successful
example of European integration before the
crisis, full integration having been achieved
almost immediately after the introduction of
the euro. It was also one of the fi rst victims of
the current crisis, with signs of segmentation
and even re-nationalisation from August 2007
and especially from September 2008.79 More
recently, however, as discussed in Chapter 1 of
this report, tensions in the money market have
increasingly receded.
The interbank market contributes to fi nancial
stability through risk-sharing. When banks
report their funding needs truthfully, the
secured interbank market is an optimal risk-
sharing device, which allows diversifi cation
without the risk of cross-regional fi nancial
contagion. However, in the absence of
suffi cient retail market integration, free-riding
on liquidity provision may limit the achievable
level of risk-sharing.80
It has also been suggested, on the basis of
theoretical models of interbank markets, that
the integration of such markets may increase
the risk of a systemic crisis in the event of a
sudden freeze prompted by market liquidity
shocks,81 the perceived insolvency of interbank
market players 82 or asset rollover risk with
uncertain asset quality.83
A. Popov and G. Udell, “Cross-border banking and the 75
international transmission of fi nancial distress during the credit
crunch of 2007-08”, mimeo, ECB, 2009. Similar behaviour has
been observed in J. Peek, and E. Rosengren,. ”The International
Transmission of Financial Shocks: The Case of Japan”.
American Economic Review, Vol. 87, 1997, pp. 495-505.
D. Mihaljek, “The Financial Stability Implications of Increased 76
Capital Flows for Emerging Market Economies”, Financial Globalisation and Emerging Market Capital Flows, Vol. 44,
BIS, 2009, pp. 11-44.
X. Chen, “Banking Deregulation and Credit Risk: Evidence 77
from the EU”, Journal of Financial Stability, Vol. 2, 2007,
pp. 256-290.
R. Eisenbeis and G. Kaufman, “Cross-Border Banking and 78
Financial Stability in EU”, Journal of Financial Stability,
Vol. 4, 2008, pp. 168-204.
N. Çassola, C. Holthausen and M. Lo Duca, “The 2007/2008 79
Crisis: A Challenge for the Integration of the Euro Area
Market?”, mimeo, ECB, 2008.
F. Fecht, H. Grüner and P. Hartmann, “Welfare Effects of 80
Financial Integration”, CEPR Discussion Paper, No 6311,
Centre for Economic Policy Research, 2007.
X. Liu and A. Mello, “The Capital Structure of Financial 81
Institutions and Liquidity Crises”, mimeo, University of
Wisconsin, 2009.
F. Heider, M. Hoerova and C. Holthausen, “Liquidity Hoarding 82
and Interbank Market Spreads: The Role of Counterparty Risk”,
mimeo, ECB, 2009.
V.V. Acharya, D. Gale and T. Yorulmazer, “Rollover Risk and 83
Market Freezes”, mimeo, New York University, 2009.
73ECB
Financial integration in Europe
April 2010
2 SPEC IAL FEATURES
A further consequence of interbank market
integration when markets are incomplete
is contagion. Interbank linkages mean that
problems in one bank can spread to other
(potentially sound) banks. The possibility of
contagion arises from the overlapping claims
that different banks have on one another rather
than from asset price volatility. When one bank
defaults another bank suffers a loss because its
claims on the troubled bank fall in value, and
this process can give rise to domino effects
throughout the system.84 Interbank market
integration results in lower lending rates for
businesses, which have a benefi cial effect on
the cost of capital, but may also contribute to
fi rm leverage. The build-up of high leverage in
“good” times may then exacerbate the adverse
market reaction in a subsequent crisis, through
the fi rm balance sheet channel.85
The sequence of events in the recent crisis
demonstrates the need for central banks to
act as liquidity providers in times of liquidity
strains. One point of concern arising from this
action, however, is moral hazard. The costs of
intervention thus need to be traded-off not only
against the costs of contagion, but also against
those of the future moral hazard associated with
increased risk-taking by fi nancial institutions in
the future.86
CROSS-MARKET INTEGRATION
One particular development in fi nancial
integration in the past decade has been the
deepening of cross-dependencies and cross-
penetration between different fi nancial markets.
A prime role is played in this regard by many
hedge funds and private equity companies.
Market interdependencies associated with the
activities of these fi nancial fi rms derive from the
nature of funding liquidity and asset liquidity.
When leveraged fi nancial institutions like hedge
funds and private equity funds make losses, these
affect both the providers of funding liquidity
(through collateral) and the providers of asset
liquidity (through the falling prices of assets
resulting from fi re sales).87 This sub-section will
review recent evidence on such interdependency,
as well as the direct channel of involvement of
this type of market participant in “new” markets,
and will assess the contribution of this
cross-market integration to fi nancial stability.
While the concept of cross-market integration
is arguably somewhat detached from the
defi nition of fi nancial integration in this report
(which uses a geographic criterion), the academic
literature has pointed to the increasing
contribution of this phenomenon to systemic risk,
rendering it relevant to the link between
integration and stability.
Regular hedge fund activities tend to improve
liquidity conditions, in particular in markets
where relatively illiquid securities are traded
(e.g. MBSs, convertible bonds, CDOs), and
their wide variety of arbitrage activities further
enhance cross-market integration. While this
involvement has well understood positive
effects in the form of risk diversifi cation and
price discovery, there are also implications for
fi nancial instability. For one, although hedge
funds generally use rather heterogeneous
investment strategies or “styles” – which is
one reason for the relatively weak average
return correlation across different styles – their
trades and returns can become highly correlated
in times of stress, posing additional threats
to systemic stability. For example, there is
evidence for increased “contagion risk” among
hedge fund styles owing to coordinated asset
fi re sales to meet margin calls and investor
redemptions in response to large initial shocks
to general funding and asset liquidity.88 In such
situations, hedge funds also tend to disengage
from their regular liquidity-enhancing activities.
As a result, hedge funds can accelerate emerging
F. Allen and D. Gale, “Financial Contagion”, 84 Journal of Political Economy, Vol. 108, 2001, pp. 1-33.
S. Ongena and A. Popov, “Interbank market integration, loan 85
rates and fi rm leverage”, mimeo, ECB, 2009.
F. Allen and E. Carletti, “Credit Risk Transfer and Contagion”, 86
Carnegie Rochester Conference Series on Public Policy,
Vol. 53, pp. 89-111.
M. Brunnermeier and L. Pedersen, “Market Liquidity and 87
Funding Liquidity”, Review of Financial Studies, Vol. 22, 2009,
pp. 2201-2238.
M. Boysen, C.W. Stahel and R.M. Stulz, “Hedge Fund 88
Contagion and Liquidity Shocks”, mimeo, Ohio State
University, 2009.

74ECB
Financial integration in Europe
April 2010
“liquidity spirals” 89 and exacerbate segmentation
across markets lacking suffi cient arbitrage
trades (e.g. the collapse of two highly leveraged
Bear Stearns hedge funds on 20 June 2007 was
one trigger of the collapse in the market for
subprime backed CDO securities).90
Second, hedge funds impose counterparty credit
risk on other investors. A lack of transparency
of hedge funds’ positions can make it diffi cult
to assess how leveraged and exposed hedge
funds are, and it may be diffi cult to assess the
magnitude of counterparty risk. Since systemic
crises are characterised by investor panic, this
lack of hedge fund transparency may lead to
more extreme reactions by their investors, prime
brokers and other lenders. Finally, over the
past decade hedge funds have started entering
the private equity business, thus making this
market more liquid and mitigating the fi nancing
constraints of the most risky fi rms,91 but at
the same time exposing it to the downsides
of cross-market integration just discussed.
Specifi c considerations apply to private equity
companies, which share much in common with
hedge funds, in particular their liquidity and
leverage. Such companies play a useful role, as
they strengthen market discipline by enhancing
the contestability of corporate control. However,
there are also other implications. More than half
of the volume of leveraged buy-out (LBO) deals
is fi nanced with bank loans, mostly syndicated
debt issued by banks, which is then sold off to
other institutions, like hedge funds, and/or traded
in secondary markets or packaged into structured
products like collateralised loan obligations
(CLOs). The weakened screening and high
lending associated with this may induce risks
associated with high leverage in the fi nancial
sector. The opacity of the distribution of LBO
debt across fi nancial institutions, following the
institution of the originate-and-sell model, and
the increasingly dispersed nature of LBO
creditors, makes them more sensitive to signals
from other creditors. Thus, even a small shock to
the LBO sector can result in liquidity diffi culties,
as creditors revise their priors and reduce their
lending. This process could affect not just the
re-fi nancing of LBO deals, but the fi nancing of
other assets as well, including lending by banks.92
Various regulatory actions have been suggested
to alleviate the systemic risk associated with
cross-market integration in the case of hedge
funds and private equity fi rms. For example,
greater transparency on asset positions (on-and
off-balance sheet), leverage levels, the proportion
of illiquid positions and risk concentration can
be achieved through secondary trading platforms
for CLO tranches and registers of institutional
ownership, for instance. Public disclosure may
be important to market participants in reducing
the counterparty risk that hedge funds and private
equity companies impose. It might be desirable
to obtain coded information from prime brokers
or lengthen lock-up periods.93 Finally, in order to
address the problem of the large share of
syndicated debt involved in the LBO market,
higher capital requirements could be applied to
the high-yield exposures of banks, although such
requirements are not binding under Basel II for
unregulated lenders like hedge funds and private
equity fi rms. However, this should be done
carefully so as not to encourage some new form
of regulatory arbitrage like the complex CDO
structures and the special investment vehicles
and conduits witnessed during the run-up to
the crisis.
3 THE RELATIONSHIP BETWEEN FINANCIAL
DEVELOPMENT AND FINANCIAL STABILITY
As mentioned before, the relationship between
fi nancial development and fi nancial stability
depends on the specifi c circumstances and
M. Brunnermeier and L. Pedersen, op. cit., 2009.89
M. Brunnermeier, “Deciphering the Liquidity and Credit 90
Crunch 2007-08”, Journal of Economic Perspectives, Vol. 23,
2009, pp. 77-100.
D. Brophy, P. Ouimet and C. Sialm, “Hedge Funds as Investors 91
of Last Resort”, Review of Financial Studies, Vol. 22, 2009,
pp. 541-574.
Arguably, however, while warehoused exposures might be 92
signifi cant for some banks, the business has shrunk substantially
throughout the world and in Europe (a total LBO new loan
volume of merely €2,4 billion in the period from January to
September 2009).
M. King and P. Maier, “Hedge Funds and Financial Stability: 93
Regulating Prime Brokers Will Mitigate Systemic Risks”,
Journal of Financial Stability, Vol. 5, 2009, pp. 283–297.

75ECB
Financial integration in Europe
April 2010
2 SPEC IAL FEATURES
characteristics of the events in question.
For example, if fi nancial innovation (in particular
new credit-risk shifting instruments) contributes
to enhancing risk diversifi cation within the
economy, it could make the fi nancial system
more stable by improving its shock-absorbing
capacity. On the other hand, the same instruments
also have the potential to undermine fi nancial
stability – for example, the complexity of the
instruments offered might lead to a misallocation
of capital and risk among market participants.
In light of the recent fi nancial crisis, this section
focuses on how specifi c features of recent
fi nancial development may erode incentives and
transparency and lead to unforeseen feedbacks
and increased systemic risk.
SECURITISATION
Securitisation refers to the pooling of
individual loans into securities, the holders
of such securities being entitled to some
fraction of all the interest and principal
paid out by the loan portfolio. Prior to the
current crisis, the benefi ts of securitisation
were widely recognised. Lenders, as
originators, use their superior knowledge of
borrowers to issue loans, but are unable to
diversify away the idiosyncratic risk of their
borrowers. Securitisation allows risk to be
transferred from the originators of the loans
to fi nancial investors willing to hold the
risk, thus allowing risk to be allocated more
effi ciently both at national and international
levels, at least when symmetric distribution
of information prevails. As a consequence,
the overall amount of credit available to the
non-fi nancial sector might expand.94 The large
and increasing amount of securitisation was
interpreted as evidence that capital markets
were working. However, the recent fi nancial
crisis has highlighted weaknesses in the way
securitisation was implemented.
The Financial Stability Board (FSB) has identifi ed
a number of core defi ciencies in the securitisation
process before the crisis: 95 i) misaligned
incentives; ii) a lack of transparency with regard to
the risks underlying securitised products, including
those relating to the quality and correlation of the
underlying assets; and iii) poor management of
the risks associated with the securitisation business,
including liquidity risk, and of credit lines and
of stress testing of these risks.
The “originate-to-distribute” model of
securitisation has relied on the assumption that
the potential problems between originators,
securitisers and fi nancial investors are negligible;
however, two main problems have been
identifi ed.96 First, the loans included in the
securitisation programme suffer from an adverse
selection problem when loan originators have
“no skin in the game”. Because lenders have
more information than investors about the
quality of the loans, originators have incentives
to hold the good loans and sell off the poor
quality ones. Second, even if originators do not
have higher-quality information about the loans,
they have no incentive to evaluate and monitor
the loans. These issues have also been
documented by recent academic literature,
which argues that securitisation did indeed
contribute to a reduction in loan quality.97
For example, securitisation of US mortgages has affected the 94
average homeowner: it has been progressively easier to access
credit markets and to reduce credit market imperfections.
The percentage of the stock of outstanding mortgages securitised
has increased dramatically from approximately 0% in 1975 to
more than 55% in 2005 (see K. Gerardi, H. Rosen and P. Willen,
“The Impact of Deregulation and Financial Innovation on
Consumers: The Case of the Mortgage Market”, Journal of Finance, forthcoming).
“The Financial Crisis and Information Gaps, Report to the 95
G20 Ministers and Central Bank Governors”, FSB and IMF,
29 October 2009.
Ashcraft and Schuermann provide an analysis of the information 96
frictions in the securitisation process and point out a number of
important fl aws (see A. Ashcraft and T. Schuermann, “The Seven
Deadly Frictions of Subprime Mortgage Credit Securitization,”
The Investment Professional, Fall 2008, pp. 2-11).
B. Keys, T. Mukherjee, A. Seru and V. Vig, “Did Securitization 97
Lead To Lax Screening? Evidence From Subprime Loans
2001-2006”, Quarterly Journal of Economics, forthcoming;
G. Dell’Ariccia, D. Igan and L. Laevan, “Credit Booms and
Lending Standards: Evidence from the Subprime Mortgage
Market”, IMF Working Paper, No 08/106, IMF, 2008; A. Mian
and A. Sufi , “The Consequences of Mortgage Credit Expansion:
Evidence form the 2007 Mortgage Default Crisis”, Quarterly Journal of Economics, Vol. 124, 2009, pp. 1449–1496;
A. Maddaloni and J.-L. Peydro, “Bank Risk-Taking,
Securitization, Supervision, and Low Interest Rates: Evidence
from Lending Standards”, Working Paper, Financial Crisis
Conference, Yale SOM International Centre for Finance, 2009.

76ECB
Financial integration in Europe
April 2010
A tool that has gained prominence in recent
discussions is tranche retention: the idea that
originators should be forced to retain exposure
to the loans they originate. The choice of the
mandatory retention ratio is a complex issue,
since if the ratio is set too low the behaviour of
originators may not be signifi cantly affected,
while higher ratios risk making securitisation
unattractive.98 An additional way to align
the incentives of originators, securitisers and
investors would be to make the origination
fee payable to the lender conditional upon the
number of defaults over some period of the loans.
Thus, if default occurs within a certain period of
time, the originator would only receive a portion
of the fee. This would provide incentives for
originators to securitise low risk loans, since high
risk loans are more likely to default during the
initial period.99 In addition, originators might not
be able to sell the loan servicing rights, in which
case they would have an incentive to choose
good loans and monitor them accordingly.
However, the presence of strong confl icts of
interest is also a result of the long intermediation
chain that has characterised the securitisation
process (fi nal investors, credit originators, credit
agencies, arrangers, trustees and borrowers).
In this regard, the EU covered bond market
has been more sheltered from these incentive
problems than securitisation markets. This is
partly due to its simpler structure and a much
stricter regulatory framework, which ties the
incentives of originators more strongly to those
of investors.100 The holders of covered bonds,
unlike those of MBSs, are paid by the issuing
bank, which retains the covered bonds on its
balance sheet. If any of the underlying loans
default, the bank must replace them in the cover
pool with other loans. In the event of the issuer’s
bankruptcy, the holders of covered bonds have a
prior claim on the asset pool, ahead of all others.
If the issuing bank does not pay the holders of
covered bonds, then they receive the payment
stream from the underlying mortgages.
The need for increased transparency in
securitisation markets in order to restore
confi dence has also been discussed by market
participants and regulatory authorities. Market
initiatives include, among others, introducing
codes of conduct and term securitisation issuers,
facilitating access to transaction information,
prospectuses and investor reports, standardising
defi nitions and reporting templates, and
producing publicly available aggregate statistical
data.101 At the same time it is clear that the level
of information available to investors in these
markets is very limited and varies greatly from
country to country, both at the time of issuance
and thereafter.102
Securitisation worked well for more than thirty
years before the subprime crisis. However,
in practice, instead of dispersing the risks
associated with bank lending, securitisation had
the perverse effect of concentrating them in the
banking system.103 It is argued that securitisation
allowed banks to leverage up in quiet times
on the basis of funds from new creditors
such as pension funds, insurance companies,
mutual funds and foreign central banks. As the
“originate-to-distribute” securitisation model
is characterised by long chains of fi nancial
intermediation and is heavily dependent on
overall capital market conditions, risks became
concentrated in the intermediary sector itself
Directive 2009/111/EC of the European Parliament and of the 98
Council of 16 September 2009 amending Directives 2006/48/
EC, 2006/49/EC and 2007/64/EC as regards affi liated to
central institutions, certain own funds items, large exposures,
supervisory arrangements, and crisis management, OJ L302,
17.11.2009, p. 97, requires EU credit institutions to ensure
that, in their investments in asset-backed securities, the
originator retains at least 5% of the total credit risk exposure
of the securitisation. Similar rules mandating a minimum risk-
retention ratio for originators have been also proposed by US
authorities.
B. Hartman-Glaser, T. Piskorski and A. Tchistyi, “Optimal 99
Securitization with Moral Hazard”, Working Paper, Haas
Business School, University of California, Berkeley, 2009.
See also Special Feature B on European covered bonds.100
“Ten Industry Initiatives to Increase Transparency in the 101
Securitisation Market”, European Securitisation Forum, Press
Release of 2 July 2008.
For instance, losses are accounted for in very different ways 102
across countries and instruments, and there are often lags in the
reporting of this data by trustees.
Around half of the approximately $1.4 trillion total exposure 103
to sub-prime mortgages was borne by US leveraged fi nancial
institutions, such as commercial banks and securities fi rms,
according to D. Greenlaw, J. Hatzius, A. Kashyap and H.S. Shin,
“Leveraged Losses: Lessons from the Mortgage Market
Meltdown”, US Monetary Policy Forum Report No 2, 2008.

77ECB
Financial integration in Europe
April 2010
2 SPEC IAL FEATURES
with damaging consequences for fi nancial
stability.104 In this respect, the EU covered
bonds model is a valuable alternative to the
US mortgage backed securities model because
it is a form of securitisation that mitigates the
perverse effects arising from the lengthening of
intermediation chains.
FINANCIAL COMPLEXITY
There has been a signifi cant recent trend towards
the creation of complex fi nancial securities. In
this regard, re-securitisations are an illustrative
case. Re-securitisations are securitisations in
which the underlying credits include tranches of
ABSs. For instance, a CDO collateralised by a
pool of mezzanine tranches of various mortgage-
backed securitisations is a re-securitisation.
A typical tranching scheme involves prioritising
the cash fl ows from the underlying securities, in
such a way that the senior claim suffers losses
only after the principal of the subordinate
tranches has been exhausted. This prioritisation
scheme has been designed to ensure that senior
tranches have low default probabilities and
gain a high credit rating. A study has shown
that these senior tranches bear enormous
systemic risk, as they are increasingly likely
to experience signifi cant losses as the overall
economy or market deteriorates.105 In addition,
the same study provides evidence that senior
tranches did not offer their investors large
enough premia to compensate for the systematic
risks they bore. Hence, it is generally recognised
that many banks, owing to the complexity
of these securities, failed to make capital
provisions commensurate with the higher
level of risk associated with them. In fact, the
applicable regulatory capital regime often
failed to distinguish re-securitisations from
ordinary ABSs, not fully recognising the larger
potential risks associated with the former.106
Accordingly, the Basel Committee has put
forward proposals to have a different set of
(higher) risk weights applied to re-securitisation
exposures and the European Commission
included higher risk weights for re-securitisation
exposures in its proposal of July 2009 for an
amendment to the CRD.
As a result of complexity and opacity such
assets are diffi cult to price. Many investors
therefore relied excessively on the assessments
of rating agencies who adopted similar models.
By construction, these valuation models need to
make a number of assumptions and, because of
the leverage, the slightest change in these
assumptions can often lead to signifi cant
changes in the price of the security. For example,
a modest imprecision in the parameter estimates
(e.g. for the correlation among pooled loans)
can lead the default risk of the structured fi nance
securities to vary to such an extent that a security
rated AAA is actually likely to default with a
relatively high probability.107 In fact, these
breakdowns in modelling assumptions often
occur during extreme market conditions, which
tend to further aggravate the level of systemic
stress. There is also evidence that the valuation
of a given product by different sophisticated
market participants can vary substantially,108
suggesting that signifi cant differences in
valuation can be attributed to either differing
valuation methodologies or asymmetric
information.109 In addition, even a single bank’s
See J. Geanakoplos, “Promises, Promises”, in W.B. Arthur, 104
S. Durlauf and D. Lane (eds.), The Economy as an Evolving Complex System, Vol. II, Addison-Wesley, Reading MA, 1997,
pp. 285-320; and H.S. Shin, “Financial Intermediation and the
Post-Crisis Financial System”, Working Paper, 8th BIS Annual
Conference, 2009.
J. Coval, J. Jakub and E. Stafford, “Economic Catastrophe 105
Bonds”, American Economic Review, Vol. 99, 2009,
pp. 628-666.
Re-securitisations are typically more exposed to larger marking-106
to-market losses and more extreme rating migration than an
equivalently rated ordinary asset-backed security, mainly due to
their increased leverage.
See J. Coval, J. Jakub and E. Stafford, “The Economics of 107
Structured Finance”, Journal of Economic Perspectives,
Vol. 23, 2009, pp. 3-25, and D. Marqués and M. Scheicher,
“Securitisation: Causes and Consequences”, in A. Berger,
P. Molyneux and J. Wilson (eds.), Handbook of Banking,
Oxford University Press, forthcoming.
See A. Bernardo and B. Cornell, “The Valuation of Complex 108
Derivatives by Major Investment Firms: Empirical Evidence”,
Journal of Finance, Vol. 52, No 2, 1997, pp. 785-798.
Downing, Jaffee and Wallace document that mortgages 109
securitised have higher probability of early prepayment
compared to assets that are not. Their analysis suggests that
asymmetric information has an economically important impact
on the operation of the market for MBS (see C. Downing,
D. Jaffee and N. Wallace, “Is the Market for Mortgage-Backed
Securities a Market for Lemons?”, Review of Financial Studies,
Vol. 22, 2009, pp. 2457-2494).

78ECB
Financial integration in Europe
April 2010
evaluations of different tranches of the same
security may be mutually inconsistent.110
Recent academic work has explicitly addressed
the role of complexity in fi nancial securities.
It has been argued that despite its importance it
is surprisingly hard to fi nd a workable defi nition
of the term “complexity”, posing a challenge
for policy proposals targeted at complex
securities.111 They point out that, at a theoretical
level, complexity only becomes important in
fi nancial markets when agents have a limited
ability to process information. Nevertheless,
they suggest three ways to deal with complexity:
i) by dividing up the valuation of a security into
the valuation of its components; 112 ii) by using
models, but keeping in mind potential modelling
pitfalls; and iii) through standardisation of
securities or limiting the set of investors allowed
to invest in these securities.
The recent crisis suggests that most investors
hugely underestimated the risks of the most
complex instruments. Therefore, future securities
are expected to be much simpler. Standardisation
of contractual rules is an effective tool to reduce
complexity, but it may lead to less fi nancial
innovation. Economic effi ciency might be
adversely affected if fi nancial markets are unable to
innovate in parallel with changes in the economy.
MARKING-TO-MARKET ACCOUNTING
The processing of information on fi rms is
an important function of fi nancial systems.
Accounting systems need to be designed so as
to provide investors with accurate information
and allow them to value securities correctly.113
Complex securities such as MBSs and CDOs
have to be evaluated. Marking-to-market or fair-
value accounting rules are intended to help
investors understand the value of these assets at
any point in time, rather than just relying on their
historical purchase price. Given the combination
of volatile market prices and the leveraged and
maturity-mismatched positions of some fi nancial
institutions, marking-to-market accounting has
been an essential factor when monitoring
adherence to capital standards.114 The recent
credit turmoil, however, led to low or non-existent
trading volumes in many instruments, and an
unprecedented difference between market bids
and what informed investors considered the
fundamental value of various sub-prime MBSs
and CDOs.115 Many large fi nancial institutions
have recognised signifi cant losses since the onset
of the crisis as a result of marking down MBS
asset prices to market value.
The market breakdown was so severe in the
United States, that the Emergency Economic
Stabilization Act of 2008 gave the Securities
and Exchange Commission (SEC) the power
to suspend the application of FAS 157 if the
SEC determines that it is in the public interest
and protects investors. In addition, an update of
FAS 157 by the Financial Accounting Standards
See D. Duffi e, “Innovations in Credit Risk Transfer: Implication 110
for Financial Stability,” Working Paper, Graduate School of
Business, Stanford University, 2007.
M. Brunnermeier and M. Oehmke, “Complexity in Financial 111
Markets”, Working Paper, Princeton University, 2009.
Fox example, the price of an index like the ABX, a synthetic 112
asset-backed credit derivatives index, can facilitate valuing
structured products (such as a CDO) without performing a full
analysis. However, as recent experience has shown, once an index
like the ABX becomes illiquid and ceases to be informative,
investors have to revert to valuing the security without the help
of a building block. Stanton and Wallace document that, during
the credit turmoil, prices for the ABX indices were inconsistent
with any fi nite assumption for mortgage default rates, and that
ABX price changes were uncorrelated with changes in the
credit performance of the underlying loans (see R. Stanton and
N. Wallace, “The Bear’s Lair: Indexed Credit Default Swaps and
the Subprime Mortgage Crisis,” Working paper, Haas Business
School, University of California, Berkeley, 2009).
See, for example, Hartmann et al. , op. cit., 2007, and Special 113
Feature A of the 2008 ECB Report on Financial Integration in
Europe and the references therein.
For potential fi nancial stability implications of full 114
fair-value accounting, see also A. Eria, L. Cappiello, F. Dierick,
S. Grittini, A. Haralambous, A. Maddaloni, P. Molitor, F. Pires
and P. Poloni, “Fair Value Accounting and Financial Stability”,
Occasional Paper Series, No 13.ECB, 2004.
For some institutions, the low marking-to-market valuation also 115
triggered margin calls. When an investor buys a security, such as
an MBS, he can use the security as collateral and borrow against
it. But he cannot borrow the entire price. The difference between
the security’s price and the collateral value is denoted as margin.
A margin call occurs, when the margin posted is below the
minimum margin requirement. The investor has to increase the
margin that he has deposited or he can close out the position
selling the MBS. This might result in further forced sales of
MBSs and emergency efforts to obtain cash (liquidity) to pay off
the margin call. Write-downs may also reduce the value of bank
regulatory capital, requiring additional capital to be raised and
creating uncertainty regarding the health of the bank.

79ECB
Financial integration in Europe
April 2010
2 SPEC IAL FEATURES
Board was issued that eases the marking-to-
market rules when the market is unsteady or
inactive and provides the option to reclassify
held-for-trading assets into the held-to-maturity
category. Following the US policy interventions,
the European Commission adopted amendments
to accounting regulations to ensure that EU
fi nancial institutions have the same fl exibility as
their American competitors.
Recent academic work has explicitly addressed
the role of marking-to-market valuation and
fi nancial stability. One study examines the
consequences of marking-to-market valuation on
fi nancial institutions’ balance sheets in the
presence of externally imposed regulatory
solvency requirements.116 It is shown that a shock
that depresses the market value of assets might
lead to their forced disposal to avoid violation of
capital requirements, depressing their price still
further. Moreover, a marking-to-market
accounting regime can lead to pro-cyclical trades
(e.g. fi nancial institutions may be forced to sell
securities when prices are falling or to buy them
when prices are rising), which amplify the price
fall in declining markets, and may thus potentially
increase systemic risk in the fi nancial system.117
Under these extreme circumstances,
marking-to-market accounting may understate a
fi nancial institution’s solvency, which may deter
potential lenders or shareholders, thus
exacerbating the liquidity crisis. Moreover,
empirical evidence based on US bank holding
company data suggests that marking-to-market
valuation is associated with an increased risk of
bank contagion and thus increased systemic
risk.118 In fact, the analysis indicates that the
additional bank contagion associated with
marking-to-market valuation is more likely to
spread to banks i) that are poorly capitalised or ii)
that have a high proportion of fair value assets
and liabilities. In a different vein, it is also argued
that marking-to-market accounting is unlikely to
have added signifi cantly to the severity of the
current fi nancial crisis.119 First, the impact of
marking-to-market valuation on bank income and
regulatory capital is limited.120 Second, banks
made use of the safeguards and discretion built
into marking-to-market accounting, to avoid
marking to potentially distorted market prices
and the consequent accounting-induced
downward spirals and contagion.121
Ultimately, marking-to-market valuation per
se can only interact with market conditions to
increase contagion among banks especially when
fair values are used as inputs in the calculation
of capital requirements or in incentive contracts
for management. Moreover, marking-to-market
prices are generally the best available measure
of economic value. However determining the
net balance of the pros and cons of marking-to-
market valuation is a diffi cult task for regulators
and standard setters. One possible policy action
would be to provide specifi c guidance delineating
the conditions under which the market for an
instrument is no longer considered active enough
for marking-to-market accounting to be required,
so that valuation based on other criteria,122 such
as the discounted value of the instrument’s
R. Cifuentes, G. Ferrucci and H.S. Shin, “Liquidity risk and 116
contagion”, Journal of the European Economic Association,
Vol. 3, 2005, pp. 556-566.
See G. Plantin, H. Sapra and H.S. Shin, “Marking-to-market: 117
Panacea or Pandora’s box?”, Journal of Accounting Research,
Vol. 46, 2008, pp. 435-460.
U. Khan, “Does fair value accounting contribute to systemic 118
risk in the banking industry?”, Working paper, Columbia
Business School, 2009.
C. Laux and C Leuz, “Did Fair Value Accounting Contribute 119
to the Financial Crisis?”, Journal of Economic Perspectives,
forthcoming.
For example, banks that focus on traditional lending business 120
can largely avoid the effects of marking-to-market accounting
on their balance sheets or income statements by classifying their
loans as held-for-investment. Similarly, for held-to-maturity
securities, marking-to-market accounting is not required.
For example, in the fourth quarter of 2008, Citigroup reclassifi ed 121
debt securities with a carrying value of approximately
USD 60 billion as held-to-maturity; in this way, Citigroup was
able to limit the negative effect of further declines in fair value
on net income or shareholders’ equity.
Fair-value accounting guidelines recently stipulated by Financial 122
Accounting Standards Board (FASB) and International
Accounting Standards Board (IASB) have several safeguards
against marking to potentially distorted market prices and hence
against accounting-induced downward spirals and contagion.
First, the rules explicitly state that prices from a forced
liquidation, or distress sales, should not be used in determining
the fair value. Second, when markets become inactive and
transaction prices are no longer available, market participants
might rely on an income approach valuation technique,
discounting the contractual cash fl ows at an appropriate
discount rate (See, for example, “Determining the Fair Value
of a Financial Asset When the Market for That Asset is Not
Active”, FASB Staff Position Paper, Financial Accounting
Standards Board, October 2009.

80ECB
Financial integration in Europe
April 2010
future expected payment streams, is allowed.123
Another policy action would be to minimise the
ineffi ciencies arising from the interaction between
marking-to-market and capital requirements. For
example, if market participants are unwilling to
sell securities at prices that force them to mark
down other assets, because doing so could force
asset sales, the capital requirement could reduce
trading, thereby further exacerbating illiquidity
in the market. These undesirable effects might
be avoided by redefi ning capital requirements so
as to make them counter-cyclical, instead of by
abandoning marking-to-market accounting and
the other benefi ts associated with it.124
DERIVATIVES AND CENTRAL COUNTERPARTIES
Financial derivatives generally play an
important role for the effi cient allocation of
fi nancial and real capital in the economy: by
the unbundling and re-bundling of certain
characteristics of the underlying instruments,
derivatives help overcome fi nancial frictions
through reducing the number and size of
discontinuities in the spectrum of available
fi nancial instruments which, in turn, erodes
some of the differences between different
forms of fi nancial intermediation.125 Financial
derivatives are traded on exchanges or over the
counter (OTC), meaning through private
negotiation. The majority of these positions are
in the form of dealer-to-dealer positions,
refl ecting the role of dealers as market
intermediaries. Certain relatively new
derivatives also played a major role in the
recent fi nancial turmoil by interconnecting
market participants to an extent that was not
evident because of the lack of transparency
resulting from the predominant over-the-
counter market structure. Most of the regulatory
and public attention has focused on credit
default swaps (CDS). A credit default swap is
a derivative contract whose payoff depends on
the default of a specifi c borrower, such as a
corporation, or of a specifi c security, such as a
bond. As a result of the overall size of the CDS
market and its close linkages with the bond,
loan and equity markets, large exposures to
CDS can be associated with substantial
systemic risk. Specifi cally, counterparty risk is
the main concern: the potential amount at risk
if a counterparty to a CDS contract fails to
meet its contractual obligations. Given the
signifi cant concentration of CDS risks in a
small number of major fi nancial institutions,
the failure of one important participant in the
CDS market could destabilise the fi nancial
system by infl icting signifi cant losses on many
other market participants simultaneously.
Central clearing through central counterparties
(CCPs) can reduce and more effectively manage
counterparty risk. By interposing itself as a seller
to every buyer and a buyer to every seller in
the market, a CCP enables multilateral netting,
diversifi cation and sharing of risk exposures,
thereby reducing the levels of counterparty
risk and the need of collateral. Furthermore,
by fully collateralising all exposures on the
basis of stringent margining procedures, a CCP
prevents potential defaults of its participants
from propagating to other participants and into
the wider fi nancial system. Following up on
substantial public sector impetus, a number of
CCPs for CDS have been established in recent
months, including the US-based ICE Trust
and Chicago Mercantile Exchange, the British
ICE Clear Europe and the German Eurex
Credit Clear. Another CCP for CDSs is under
development by the French LCH.Clearnet SA.
Plantin, Sapra and Shin argue that the discount rate to be 123
adopted should be an average of the discount factors observed
in the past. Market participants could then be confi dent that
sales by other market participants would have a limited impact
on the end-of-period valuation of their assets. This procedure
could largely remove the risk of liquidity shocks, while also
mitigating the absence of price signals in a historical cost regime
(see G. Plantin, H. Sapra and H.S. Shin, op. cit., 2008).
J. Heaton, D. Lucas and R. McDonald, “Is Mark-to-Market 124
Accounting Destabilizing? Analysis and Implications for
Policy”, Journal of Monetary Economics, forthcoming.
D. T. Lewellyn, “Financial Innovation and the Economics 125
of Banking and the Financial System”, in L. Anderloni,
D.T. Lewellyn and R.H. Schmidt (eds), Financial Innovation in Retail and Corporate Banking, Edward Elgar, 2009, pp. 1-40.

81ECB
Financial integration in Europe
April 2010
2 SPEC IAL FEATURES
Recent research 126 indeed suggests that fi nancial
institutions should be encouraged to use
clearinghouses to clear CDS and other
derivatives contracts.127 It shows in particular
that adding a central clearing counterparty for
CDS mitigates counterparty risk and collateral
demands, relative to bilateral netting between
pairs of dealers.
In addition to CCPs, the establishment of trade
repositories for OTC derivatives has received
growing attention. Trade repositories are
centralised registries where evidence of OTC
derivative trades is maintained. In principle, they
can thus provide information not only on the
volumes and values of trades but also on the terms
and conditions (e.g. pricing). Trade repositories are
expected to signifi cantly enhance both regulatory
and public transparency regarding markets for
OTC derivatives, in line with the information
needs of the respective constituencies.
Besides the enhanced establishment and
use of CCPs and trade repositories for OTC
derivatives, two additional requirements need to
be met to ensure adequate progress towards safe
and transparent OTC derivatives markets.
First, all infrastructures should be properly
regulated in a consistent way at the global
level, given the global nature of OTC
derivatives markets.
Second, as not all OTC derivatives are suffi ciently
liquid and standardised to allow their central
clearing, supervisors should take measures to
enhance transparency and risk management
also for bilaterally cleared transactions,
in particular through mandatory reporting for
trade repositories and enhanced collateralisation.
The importance of this issue was illustrated
during the recent crisis by the case of AIG, a large
net seller of CDSs. Most of AIG’s CDSs were
customised to specifi c packages of mortgages
and would not have satisfi ed the requirements
for central clearing. As a result, the near-default
of AIG would have occurred, even if clearing
houses for CDSs had been in place.
Finally, given the systemic importance of
securities clearing and settlement systems
and considering the large proportion of
euro-denominated OTC derivatives, there should
be at least one CCP for CDS (as well as for other
OTC derivatives) in the euro area. The Governing
Council confi rmed the importance of the issue
in its decisions of 18 December 2008 and
16 July 2009. The Eurosystem gives particular
priority to the use of euro area infrastructures
for OTC derivatives denominated in euro and
monitors the respective developments.
4 CONCLUSIONS
Financial development and fi nancial integration
affect fi nancial stability through a variety of
channels. They improve fi nancial effi ciency,
diversifi cation, and risk-sharing, which tend to
have stabilising effects, but at the same time they
may increase instability through the proliferation
of less transparent fi nancial products, changed
incentive structures that encourage excessive
risk-creation and risk-taking, the choice of
correlated strategies and increased contagion
risks.
While the progress towards more advanced
and integrated fi nancial markets cannot and
should not be seen to stand in contrast with
the objective of fi nancial stability, a stronger
prudential framework, including both effective
regulation and supervision, is essential in
order to limit the ensuing potential risks for
fi nancial stability.
See “Credit Default Swaps, Clearinghouses and Exchanges”, 126
Squam Lake Working Group on Financial Regulation, 2009;
V.V Acharya, R. F. Engle, S. Figlewski, A.W. Lynch and
M. G. Subrahmanyam (2009), “Centralized Clearing for Credit
Derivatives”, in V.V. Acharya and M. Richardson (eds),
Restoring Financial Stability, How to Repair a Failed System,
John Wiley & Sons, 2009, pp. 251-268; and D. Duffi e and
H. Zhou, “When Does a Central Clearing Counterparty Reduce
Counterparty Risk?”, Working Paper, Graduate School of
Business, Stanford University, 2009.
See also Commission communication “Ensuring Effi cient, 127
Safe and Sound Derivatives Markets”, COM (2009) 332, Staff
Working Paper SEC (2009) 905, and Consultation Document
SEC (2009) 914.

82ECB
Financial integration in Europe
April 2010
This Special Feature has evaluated the recent
research on the fi nancial stability implications
of certain fi nancial trends that have played a
role in the context of the present crisis. In this
respect, the uncontrolled spreading of extreme
securitisation techniques, the advent of complex
hard-to-value securities and weaknesses in the
trading infrastructures for credit derivatives
seem, according to this research, to have been
particularly important. It was also noted that,
in the context of highly complex and volatile
markets, marking-to-market accounting rules
may in some situations act as a conduit for
crisis propagation.
Specifi c suggestions emerging from research
deserve attention in the context of the ongoing
refl ection on the prospects for fi nancial reform.
They include requirements that originators retain
an economic interest in their securitisations, that
products be simpler and more standardised,
intermediation chains shorter, collateral
better documented, the role of ratings reduced
and investor diligence strengthened, and –
more generally – that capital and liquidity
requirements be strengthened and made less
pro-cyclical. It may also be desirable that the
role of covered bonds is promoted relative to
off-balance-sheet securitisation in countries
where the former is still underdeveloped.
Credit derivatives markets would benefi t
from standardisation and a move to a small
number of central clearing counterparties.
As regards the role of marking-to-market
accounting, possibilities to ease the rules
during stress and counter-cyclical regulatory
capital requirements have also been examined.
Policies that could help to contain the rapid
transmission of instability in integrated fi nancial
markets include greater transparency regarding
the assets, liquidity and leverage of non-bank
fi nancial intermediaries such as hedge funds
and private equity fi rms. Macro-prudential
supervision aimed at an early identifi cation
of the build-up of widespread imbalances
and a careful measurement of cross-market
contagion risk, as well as more effective crisis
management (including transparent resolution
and recapitalisation mechanisms for large
cross-border fi nancial groups) are promising
ways to alleviate the systemic risk potential of
integration and development without reducing
their benefi ts. All these initiatives, if pursued
carefully over time, would considerably
reduce the likelihood of a re-emergence of the
fi nancial weaknesses that contributed to the
fi nancial crisis.
83ECB
Financial integration in Europe
April 2010
CHAPTER I I I
EUROSYSTEM ACTIVITIES FOR FINANCIAL
INTEGRATION
The Eurosystem distinguishes between four types of activity through which it contributes to the enhancement of fi nancial integration: (i) advising on the legislative and regulatory framework for the fi nancial system and direct rule-making; (ii) acting as a catalyst for private sector activities by facilitating collective action; (iii) enhancing knowledge, raising awareness and monitoring the state of European fi nancial integration; and (iv) providing central bank services that also foster European fi nancial integration. The following sections provide an overview of the Eurosystem’s contributions in these areas, focusing on the initiatives pursued during 2009.
1 THE LEGISLATIVE AND REGULATORY
FRAMEWORK FOR THE FINANCIAL SYSTEM
While the Eurosystem considers fi nancial
integration to be fi rst and foremost a market-
driven process, the legislative and regulatory
framework for the fi nancial system clearly
plays an important facilitating role. In order
to support the effi cient and effective conduct
of cross-border fi nancial activities, the EU
framework should be designed to lower legal
and regulatory impediments and provide a
level playing-fi eld, while ensuring that the
necessary fi nancial stability safeguards are
in place. In particular, strong mechanisms for
information-sharing and coordination between
home and host authorities are needed to ensure
that potential cross-border vulnerabilities are
detected and adequately addressed.
Against this background and in line with their
advisory and regulatory functions,1 the ECB and
the Eurosystem monitor and actively contribute
to the development of the EU legislative and
regulatory framework.
More specifi cally, the ECB and the Eurosystem
provide input for strategic policy refl ections,
such as on the overall EU fi nancial services
policy strategy or on the further development
of the EU framework for fi nancial regulation
and supervision. Examples of such input are the
publication of Eurosystem position papers on
the websites of the ECB and NCBs and informal
discussions with the regulatory and supervisory
committees. Furthermore, the ECB and the
Eurosystem provide both formal opinions and
informal input for EU legislation in the area of
fi nancial services. They may also contribute to
the ex post evaluation of regulatory measures.
During 2009 the activities of the ECB and the
Eurosystem in this area related in particular to
the following issues.
EU SUPERVISORY ARRANGEMENTS
The Lamfalussy process 2 for fi nancial regulation
and supervision was designed to speed up the
regulatory decision-making process and to
enhance convergence and cooperation in the
supervision of European fi nancial institutions
and markets. In order to reap the full benefi ts
of the process, the Ecofi n Council carried
out a review of the Lamfalussy process in
2007 and evaluated the progress made in its
implementation in May 2008.3
The fi nancial crisis, however, intensifi ed the
debate on the EU supervisory architecture. As a
result, the European Commission set up an
independent High Level Group in October 2008
to develop proposals to strengthen the
supervision of European fi nancial institutions
and markets and fi nancial stability arrangements.
In February 2009, the group published a
The ECB must be consulted, within its fi elds of competence, on 1
any Community act or any draft legislative provision proposed
by national authorities. Furthermore, the ECB has the right to
issue regulations in certain areas, for example in the fi eld of
payment systems and statistics.
With the objectives of a more effi cient and fl exible EU legislative 2
decision-making process and more consistent regulation and
supervision across Member States, the Lamfalussy process
provides for four levels of fi nancial services legislation.
The Ecofi n Council started a review of the process in 2007 in
order to reap the full benefi ts of the process (see Box 2 in Special
Feature A of this report for more information).
See the “Council conclusions on the EU supervisory framework 3
and fi nancial stability arrangements”, 2866th Economic and
Financial Affairs Council meeting, Brussels, 14 May 2008.

84ECB
Financial integration in Europe
April 2010
comprehensive set of recommendations
relating to international cooperation in fi nancial
regulation, EU supervisory architecture, and
cooperation between authorities in crisis
situations. In particular, it proposed that an
enhanced European fi nancial supervisory
framework should be based on two core
elements that would take care of micro- and
macro-prudential supervision at the EU level.
Following the support of the European
Council in June 2009, the European
Commission presented legislative proposals on
23 September 2009 for the establishment of
a European Systemic Risk Board (ESRB) •
to assess risks to the stability of the entire
fi nancial system and to issue risk warnings
and, when necessary, recommendations.
The ECB will ensure the provision of the
ESRB secretariat and thereby provide the
Board with the necessary analytical, statistical,
administrative and logistical support; and
a European System of Financial Supervisors •
(ESFS) for the supervision of individual
fi nancial institutions.
These proposals are now being discussed by
the European Parliament. The content of the
proposals and their expected impact on fi nancial
integration is studied in more detail in Special
Feature A of this report.
The ECB has liaised closely with the European
Commission during the process and has also
been formally consulted on the establishment of
the ESRB and European Supervisory Authorities
(ESAs) that form part of the ESFS.
In its opinion on the proposals to establish the
ESRB and to entrust the ECB with specifi c tasks
concerning its functioning, the ECB expressed its
broad support for the proposed legal framework. 4
The ECB in particular stands ready to support
the ESRB and to provide its secretariat. The
macroeconomic, fi nancial and monetary
expertise of all of the EU national central banks
will be made available to the ESRB. In the
area of statistics, the ECB is also prepared to
provide the necessary information to the ESRB
on the macroeconomic and macro-fi nancial
environment, including in particular information
on market conditions and market infrastructures.
The ECB fi nally noted that the involvement
of the ECB and the ESCB will not alter their
primary objective of maintaining price stability.
In its opinion on the proposal to establish the
ESAs, the ECB proposed an institutional
framework, as well as the planned establishment
of a single European rulebook applicable to all
fi nancial institutions.5 The ECB expressed its
strong support for effi cient institutional
arrangements for cooperation between the ESAs
and the ESRB, and the close involvement of the
ESRB within the new micro-prudential
institutional framework. The ECB suggested a
few amendments, in particular with a view to
removing any obstacles to smooth fl ows of
information between the ESRB and the ESFS,
and with respect to ensuring an adequate
institutional involvement and participation of
the ECB and the ESCB as regards the ESAs and
the newly established committees.
EU LEGAL FRAMEWORK FOR PAYMENT SERVICES
To address the legal obstacles to the creation
of a single retail payments market, including
the provision of cross-border payments
services, the European Parliament and Council
adopted the Payment Services Directive in
November 2007. 6 The deadline for transposition
Opinion of the European Central Bank of 26 October 2009 on 4
a proposal for a Regulation on Community macro-prudential
oversight of the fi nancial system and establishing a European
Systemic Risk Board and a proposal for a Council Decision
entrusting the European Central Bank with specifi c tasks
concerning the functioning of the European Systemic Risk
Board, CON/2009/88.
Opinion of the European Central Bank of 8 January 2010 on 5
three proposals for regulations establishing a European Banking
Authority, a European Insurance and Occupational Pensions
Authority and a European Securities Markets Authority,
CON/2010/5.
Directive 2007/64/EC of the European Parliament and of the 6
Council of 13 November 2007 on payment services in the
internal market amending Directives 97/7/EC, 2002/65/EC,
2005/60/EC and 2006/48/EC and repealing Directive 97/5/EC
(OJ L 319, 5.12.2007, p. 1).

85ECB
Financial integration in Europe
April 2010
3 EUROSYSTEM ACT IV IT IES
FOR F INANCIAL INTEGRATION
of the Directive into Member States’ national
law was 1 November 2009. However, in some
Member States the transposition has been
delayed and the Directive will not be in place
until early 2010. To ensure a harmonised
transposition, the European Commission
established a transposition working group (the
work of which has now concluded), in which
the ECB participated. In connection with the
new category of payment service provider
introduced by the Directive (i.e. “payment
institutions”), the ECB is developing a
framework to ensure that relevant statistics
continue to be produced, in particular in relation
to the coverage, classifi cation and recording of
their activities under the European System of
Accounts framework.
Another EU legislative process which is
expected to foster fi nancial integration in Europe
is the reviewed Regulation (EC) 2560/2001
(now named Regulation 924/2009) on cross-
border payments in euro.
The scope of this Regulation has now been
expanded to include direct debit transactions.
The revised Regulation requires, inter alia, that
all euro area banks currently offering direct
debit services in euro at national level should
also be reachable for cross-border direct debits
in euro by 1 November 2010. It also prescribes
temporary arrangements for cross-border and
domestic direct debit interchange fees. The new
Regulation refl ects recent market developments
and is extended to cover direct debits, a payment
instrument which is of vital importance in the
creation of SEPA. The ECB’s opinion on the
proposal was published on 12 January 2009.
The ECB has also been involved in the
European Commission’s review of the
E-Money Directive, which establishes the
legal framework for the activities of e-money
institutions with a view to facilitating the
provision of e-money by introducing a lighter
supervisory regime. In 2007, the results of an
internal ESCB questionnaire confi rmed that
the national treatment of e-money institutions
varied signifi cantly across the EU and that
a harmonised approach for the treatment,
and notably the statistical reporting, of such
institutions was needed. The revised rules
of the new E-Money Directive aim to add
certainty concerning the applicability of
certain business models and facilitate market
entry for new providers. A major modifi cation
of the revised rules is a change in the legal
defi nition of e-money institutions from “credit
institutions” to “fi nancial institutions”. The
ECB nevertheless considers that e-money
institutions are, and remain, money creating
institutions in the economic sense. Thus,
e-money institutions will remain within the
MFI population for the purposes of monetary
statistics, which in turn will enable regular
monitoring of their business for minimum
reserves and payment oversight tasks.
SECURITIES CLEARING AND SETTLEMENT SYSTEMS
In order to promote convergence of national
securities clearing and settlement systems
towards the highest standards of safety,
soundness and effi ciency, the ESCB
and the CESR published in June 2009
“Recommendations for securities settlement
systems and central counterparties in the
European Union”. The initial work to adapt the
2001 CPSS-IOSCO (Committee on Payment
and Settlement Systems – International
Organization of Securities Commissions)
Recommendations for SSSs – and from 2004,
the recommendations for CCPs – to the specifi c
features of the EU environment started in 2001
and was temporarily frozen in 2005 owing to
diffi culties in resolving three issues regarding
the scope, content and legal basis of the ESCB-
CESR recommendations.
Upon invitation from the Ecofi n Council, the
ESCB and the CESR resumed their work in
June 2008. The review took into account all
recent regulatory and legal developments and
other initiatives. The European Commission, the
Committee of European Banking Supervisors
(CEBS) and relevant market participants and
associations were closely consulted during the
process. In view of the fi nancial stability risk

86ECB
Financial integration in Europe
April 2010
posed by the growing scale of OTC derivatives
exposures, the risks relating to OTC derivatives
were also taken into account when reviewing
and fi nalising the recommendations for CCPs.
The recommendations are addressed to
regulators and overseers, who will use them
as a regulatory tool and will strive to achieve
their consistent implementation and a level
playing fi eld for SSSs and CCPs in the EU. It is
envisaged that all SSSs and CCPs will have
been assessed against these recommendations
by the end of 2011.
2 CATALYST FOR PRIVATE SECTOR ACTIVITIES
While public authorities have the responsibility
of providing an adequate framework conducive
to fi nancial integration, progress in European
fi nancial integration ultimately depends
on private sector initiatives making full
use of cross-border business opportunities.
Competition among market players is a major
driving force in this regard. In addition, progress
made in the fi eld of fi nancial integration also
depends on effective collective action, notably
where heterogeneous market practices and
standards need to be overcome. However,
possible coordination problems may hamper
such cooperative approaches among market
participants. In such cases, public sector support
for private coordination efforts may help to
overcome possible diffi culties.
Given its institutional characteristics, the
Eurosystem is particularly well placed to play an
active role as a catalyst for private sector activities
in the fi eld of European fi nancial integration.
The ECB is both a public authority with a pan-
European remit and, in its capacity as the central
bank of the euro area, an active market participant,
with knowledge of and business contacts in the
fi nancial markets. Over the past few years, the
ECB has acted as a catalyst in many fi elds. For
example, the ECB calculates and provides the
EONIA for the unsecured money market, based
on confi dential contributions from banks.
In 2009, the catalytic activities of the ECB
and the Eurosystem focused mainly on the
following initiatives.
STEP INITIATIVE
The STEP initiative, pursued by market
participants under the auspices of the European
Banking Federation (EBF) and the Financial
Markets Association (ACI), and steered by
the STEP Market Committee, promotes the
integration and development of a pan-European
short-term paper market through a voluntary
core set of market standards and practices.
The ECB and the Eurosystem have supported
the STEP initiative since its inception in 2001
by facilitating interaction among market
participants, contributing to the development
of the STEP Market Convention and by raising
public awareness.
Following the successful launch of the STEP
market in June 2006, the Eurosystem has
continued its support in two ways. First, the
ECB provides statistics on the STEP market,
which include monthly outstanding amounts,
daily yields and spreads on new issues, and
publishes these on its website.7 Since end-
November 2009, the ECB also publishes daily
statistics on aggregated outstanding amounts
and new issues broken down by sector, maturity,
rating and currency. Second, the Eurosystem
continues to assist the STEP Secretariat in the
labelling of STEP paper on the basis of a
temporary arrangement until June 2010.
The ultimate responsibility for granting and
withdrawing the STEP label rests fully with the
STEP Secretariat.
Notwithstanding the distressed market
conditions, the total outstanding amount of
STEP debt securities increased by 6.4% (year
on year) in December 2009, reaching
€404.8 billion. One reason could be that the
STEP market is accepted as a non-regulated
market for collateral purposes in Eurosystem
See the ECB’s website at http://www.ecb.europa.eu.7

87ECB
Financial integration in Europe
April 2010
3 EUROSYSTEM ACT IV IT IES
FOR F INANCIAL INTEGRATION
credit operations. The increase was partly
fuelled by the decision of the ECB’s Governing
Council in October 2008 to expand the list of
assets eligible as collateral in Eurosystem credit
operations to include STEP labelled paper
issued by banks. Since the introduction of the
STEP label in 2006, there are 149 active STEP
label programmes (as of 31 December 2009).
Further information on STEP and STEP-
labelled programmes can be found on the STEP
Market website.8
STRUCTURED FINANCE MARKETS
In order to reactivate the structured fi nance
market in Europe, the Eurosystem may act as a
catalyst by supporting market-led initiatives that
promote the reactivation of the securitisation
markets and create a viable structure which
would also attract medium to long-term
institutional investors. In this respect, and to
increase transparency on ABSs, the Eurosystem
may, together with rating agencies, issuers and
investors, launch an initiative aimed at providing
loan level data on the underlying assets of ABS
deals. A well functioning securitisation market,
backed by standardisation and enhanced post-
issuance transparency, contributes to the
completeness of the European fi nancial system
and fosters integration through the improved
comparability of deals across borders.
The severity of the current economic
contraction prompted the ECB to introduce a
comprehensive set of non-standard liquidity
measures. One of these measures was an
outright purchase programme for covered
bonds. The covered bond market, which
has historically been an important source of
funding for banks in large parts of the euro
area, has suffered during the fi nancial crisis,
both in terms of primary and secondary
market activity. The total sum allocated to the
purchase programme (€60 billion, representing
about 5% of the outstanding eligible covered
bonds) proved to be suffi ciently signifi cant to
support activity in this market. Although the
covered bond purchase programme is part of
the enhanced credit support package, it also
refl ects the Eurosystem’s roles of supporting
the functioning of the market and acting as
a catalyst for this market rather than as a
market-maker of last resort.9
SEPA INITIATIVE
The Single Euro Payments Area (SEPA) is an
initiative aimed at achieving a fully integrated
market for retail payment services in the euro
area with no distinction between cross-border
and national payments. Moreover, SEPA will
also contribute to the more general integration
of retail banking markets.
In particular, SEPA allows individuals,
corporations and public administrations to
make cashless payments denominated in euro
throughout the euro area and the other SEPA
countries from a single account anywhere in the
SEPA, using a single set of payment instruments,
as easily, effi ciently and safely as they can make
them today at the national level.
SEPA will bring substantial economic benefi ts
to society, e.g. by enhancing the automation of
payments throughout Europe.10 SEPA is a logical
consequence of the introduction of the euro in
(currently) 16 countries in Europe. SEPA now
comprises 32 countries and 2 territories.11
Since the start of the SEPA project by the
market, the Eurosystem has played a catalyst
role.12 In 2009, the Eurosystem continued to
organise and attend meetings with various
stakeholders, including end-users, infrastructure
providers and card schemes. The ECB also
participated as an observer at plenary meetings
of the European Payments Council (EPC) and
See http://www.stepmarket.org.8
See also Special Feature B on European covered bonds in this 9
report.
Whereas the Payment Services Directive targets the existing 10
legal barriers to the cross-border provision of payment services,
the SEPA initiative is aimed at harmonising technical standards
and market practices to support those activities.
The EU27, Iceland, Norway, Liechtenstein, Switzerland, 11
Monaco, Mayotte and Saint-Pierre-et-Miquelon.
Detailed information on the activities of the Eurosystem in this 12
regard is provided on the ECB’s website at http://www.ecb.
europa.eu.
88ECB
Financial integration in Europe
April 2010
in the working groups that report to the EPC
plenary. In this context, throughout 2009 the
Eurosystem continued to provide assistance to
the banking industry with regard to the design
and preparation of the new SEPA instruments
and frameworks.
The Eurosystem assisted with removing the
last obstacles to the launch of the SEPA Direct
Debit (SDD). In particular, the ECB and the
European Commission provided clarity in two
joint press releases of 4 September 2008 and
24 March 2009 13 on the European authorities’
expectations concerning the interim and long-
term interchange fees for the SDD.
The SDD was launched successfully on
2 November 2009, by which date more than
2,500 banks had signed up to offer this truly
new European payment service. The launch
of the SDD marked the second major SEPA
milestone after the launch of the SEPA credit
transfer (SCT) in January 2008.
Furthermore, the Eurosystem has been
monitoring the migration towards the usage
of the SEPA payment instruments on the basis
of “SEPA indicators”.14 The migration from
domestic credit transfers to SCTs also advanced
in 2009, reaching 6.2% in January 2010
(see Chart C27 of the Statistical Annex).
In addition, the Eurosystem organised two
eSEPA 15 meetings with market agents (in April
and December 2009) to discuss the current
status of relevant initiatives. Currently, work
is continuing on the development of a pan-
European online payment solution 16 and
progress is being made in the fi eld of mobile
payments and electronic invoicing. These
innovative payments initiatives can build on
the foundations laid by the SCT and SDD.
The Eurosystem will continue to monitor the
progress in this area.
Despite the positive developments in the
SEPA project in 2009, further work needs to
be done. In particular, the Eurosystem expects
at least one additional European card scheme
to emerge in the coming years which meets its
requirements and those of cardholders, banks,
merchants and competition authorities. Several
market initiatives are under way to create such a
European card scheme.
In addition, the migration to EMV chip cards
with a personal identifi cation number (PIN) and
the updating of ATM and POS terminals with
the EMV standard, an important SEPA building
block, both advanced well in 2009. Indicators
for the migration to SEPA of cards are available
on the ECB website.17
In May 2009, the Eurosystem organised a meeting
with a broad range of stakeholders on a SEPA
certifi cation framework for cards and terminals.
Such a framework would result in card and
terminal manufacturers having to follow a single
evaluation and certifi cation process in SEPA,
instead of a different one for each card scheme.
Moreover, in the Sixth SEPA Progress
Report,17 the Eurosystem recognised that
improvements may be needed to the overall
governance of SEPA, mainly in relation to
stakeholder involvement, transparency and the
SEPA migration progress. This issue is being
addressed jointly by the Eurosystem and the
European Commission.
Furthermore, the Eurosystem stated in its Sixth
SEPA Progress Report that setting a realistic
but ambitious end date for the migration to the
SCT and SDD is a necessary step in order to
reap the benefi ts of SEPA early. Research has
shown that a long period of maintaining dual
systems would be costly for all.19 In this
Available on the ECB’s website at http://www.ecb.europa.eu.13
Available on the ECB’s website at http://www.ecb.europa.eu.14
“eSEPA” is an abbreviation for “electronic SEPA” and 15
comprises the development in the area of new and innovative
payment solutions.
An online payment (or e-payment) is based on an internet 16
banking payment, but has the additional feature that the
web-merchant receives a payment confi rmation in real time, so
that the goods can be released immediately.
Available on the ECB’s website at http://www.ecb.europa.eu.17
Available at http://www.ecb.europa.eu.18
H. Schmiedel, “The economic impact of the Single Euro Payments 19
Area”, Occasional Paper Series, No 71, ECB, August 2007.

89ECB
Financial integration in Europe
April 2010
3 EUROSYSTEM ACT IV IT IES
FOR F INANCIAL INTEGRATION
context, the European Commission issued a
public consultation on a possible end date for
SEPA migration in June 2009.20 In
December 2009, the Ecofi n Council invited the
European Commission to carry out a thorough
assessment of the need for EU legislation to set
binding end dates for SDD and SCT and to
come with a legislative proposal should the
need for binding end dates be confi rmed.21
Finally, on 25-26 May 2009, a joint research
conference “Retail payments: integration and
innovation” took place, jointly organised by the
ECB and De Nederlandsche Bank.22 Around
200 high-level policy-makers, academics,
practitioners and central bankers from more than
30 countries attended this conference, giving
proof of the high topicality of this subject.
The conference explored the linkages between
payments policy, research activities and market
practice in the integration and innovation of
retail payments.
INTEGRATION OF SECURITIES INFRASTRUCTURES
Financial market integration needs to
be complemented and supported by the
integration of the underlying infrastructures
for securities transactions. While the European
post-trading market structure is evolving, it
is still fragmented and has not yet reached a
level of effi ciency, integration and soundness
compatible with the requirements of the Single
Market and the single currency.
Among the private and public sector initiatives
aimed at fostering the integration of the
post-trading market infrastructure in the EU, the
main contributions of the Eurosystem acting as
a catalyst in 2009 were related to the Code of
Conduct for Clearing and Settlement and the
removal of the Giovannini barriers.
The Code of Conduct for Clearing and
Settlement, signed by the European industry
associations for exchanges and post-trading
infrastructures in November 2006, is an initiative
that has had a bearing on the entire trading and
post-trading infrastructure for cash equities. The
Code is essentially aimed at allowing users to
choose their preferred service provider freely
at each layer of the transaction chain. To this
end, the Code provides for commitments by the
signatories in three areas: price transparency,
access and interoperability, and service
unbundling and accounting separation.
Together with the European Commission and
CESR, the ECB is a member of the ad-hoc group
charged with monitoring the implementation of
the Code of Conduct.
The Monitoring Group met three times in
the course of 2009. The ECB conducted an
analysis on the use of price simulators and
examples by CSDs as a way of improving price
comparability. This work has helped to promote
price transparency and comparability in the post-
trading environment (see Special Features C for
more details).
The Code has provided a voluntary framework
and triggered a dialogue to mitigate the trend
of increasing frictional costs. It has therefore
contributed to an environment in which investors
have consistently enjoyed better results.
In particular, interoperability plays a key role
in reducing frictional costs and it is therefore
important that the momentum in this area is
maintained. Even if the future landscape will
be more complex, interoperability will for the
fi rst time deliver user choice and competition.
Moreover, a future interlinked post-trading
system may well be more resilient.
However, there are limits to what the Code can
achieve as regards regulatory and commercial
barriers. To address regulatory barriers, some
market participants have been calling for a more
proactive involvement of regulators and even
The responses show that a large majority of the respondents are 20
in favour of setting a migration end-date by regulation. However,
half of them want this subject to some conditions.
The complete Conclusions of the Ecofi n Council meeting on 21
2 December 2009 are available on the European Council’s
website at www.consilium.europa.eu.
For further details and conference papers, see the ECB’s website 22
at http://www.ecb.europa.eu.

90ECB
Financial integration in Europe
April 2010
legislative action at the EU level, especially in
the area of clearing.
As the Code of Conduct ultimately aims
to establish freedom of choice, it must be
complemented by the full removal of the
so-called Giovannini barriers to effi cient clearing
and settlement. In 2009, the ECB continued to
contribute to the work of the CESAME2 which
is addressing the removal of those Giovannini
barriers to effi cient clearing and settlement
which result from differences in technical
standards and business practices.
Progress in respect of public sector barriers was
initially slower, but signifi cant progress has
since taken place. In this area, both public sector
barrier 5 (on remote access) and barrier 14
(on netting) have been dismantled, and the
MiFID 23 has been implemented. More recently,
a Recommendation, based on the work of the
FISCO, has been published. After more than
nine years without any steps having been taken
in this area, the European Commission, in close
cooperation with the Member States, achieved a
well-balanced text urging Member States to
grant withholding tax relief and allowing
intermediaries to send pooled withholding rate
information to the upstream intermediary.24
Much of this work is closely linked to the
implementation of T2S and aims to foster
harmonisation in the post-trading environment.
The importance of harmonisation and the role
of the Eurosystem in this fi eld are presented in
greater detail in Special Feature C of this report.
EFMLG ACTIVITIES ON THE DRAFT COMMON
FRAME OF REFERENCE AND ON STANDARD
MARKET DOCUMENTATION
In December 2008, two academic groups –
the Study Group on a European Civil Code
and the Research Group on EC Private Law
(Acquis Group) – submitted to the European
Commission the fi nal version of a joint Draft
Common Frame of Reference which provides a
set of “model rules” covering core areas of civil
law such as contract law and proprietary security
rights in movable assets. Since these areas are
relevant for the fi nancial industry, the EFMLG
responded to the public consultation launched
by the European Commission. The ECB has
contributed to the work of the EFMLG.25
The ECB was also involved in the EFMLG
dialogue with the leading industry organisations
sponsoring standard market documentation
to discuss the lessons to be learned from
the recent market turmoil regarding specifi c
provisions commonly used in fi nancial
transactions documentation, and to look at
potential divergences between various master
agreements.26 In the context of the Lehman
Brothers bankruptcy and of the freezing orders
of the Icelandic and UK Governments, the
termination and close-out procedures, as well
as the master agreements supporting them, were
severely tested. During the crisis, close-outs of
fi nancial transactions were complicated by the
fragmentation and diversity of standard market
documentation and the co-existence of different,
sometimes outdated, versions caused unforeseen
issues which need to be addressed.27
3 KNOWLEDGE ABOUT THE STATE
OF FINANCIAL INTEGRATION
A sound analysis of the economic benefi ts
of fi nancial integration and its development
over time forms a prerequisite for effectively
targeted action that can support further
Directive 2004/39/EC of the European Parliament and of the 23
Council of 21 April 2004 on markets in fi nancial instruments,
amending Council Directives 85/611/EEC and 93/6/EEC and
Directive 2000/12/EC of the European Parliament and of the
Council and repealing Council Directive 93/22/EEC (OJ L 45,
30.4.2004, p. 1).
Commission Recommendation C(2009)7924 fi nal of 24
19 October 2009 on withholding tax relief procedures.
The EFMLG position paper was published in September 2009 25
and is available on the EFMLG website at www.efmlg.org.
On 15 September 2009, the EFMLG organised a High-Level 26
Legal Symposium in London, in which various representatives
from market and banking associations such as ISDA, SIFMA,
ICMA, ISLA, EBF and the European Savings Banks Group,
and from various major fi nancial institutions, companies, legal
groupings and international law fi rms participated.
An EFMLG report refl ecting these issues and identifying the 27
areas in which action is available on the EFMLG’s website at
www.efmlg.org.

91ECB
Financial integration in Europe
April 2010
3 EUROSYSTEM ACT IV IT IES
FOR F INANCIAL INTEGRATION
progress. The ECB is in a unique position
to provide in-depth economic analysis and
comprehensive statistics regarding the state
of fi nancial integration in the euro area and
its development. In particular, the ECB
is able to sponsor coordinated analytical
research – together with other members of the
Eurosystem and academics – and can make use
of its experience and knowledge as an active
market participant. Enhancing knowledge
and raising awareness regarding the need for
European fi nancial integration, and measuring
the progress achieved in this regard, therefore
form a major part of the ECB’s contribution to
fostering fi nancial integration.
During 2009, the activities of the Eurosystem
with respect to enhancing knowledge, raising
awareness and monitoring the state of fi nancial
integration were mainly focused on the
following initiatives.
INDICATORS OF FINANCIAL INTEGRATION
IN THE EURO AREA
Quantitative measures of fi nancial integration
provide essential tools for monitoring the
progress made in fi nancial integration. Since
September 2005 the ECB has published
quantitative indicators of integration in the
euro area fi nancial and banking markets.28
These price and quantity-based indicators
cover the money market, the government and
corporate bond markets, the equity market and
the banking markets (which include the cross-
border presence of euro area banks). Since
fi nancial infrastructures play a signifi cant role
in the ongoing process of fi nancial integration,
indicators on market infrastructures have been
allocated to the main fi nancial markets that
they serve.
The range of indicators may be extended on
the basis of further advances in research and
economic analysis, together with an improved
availability of statistics, especially with regard
to non-bank fi nancial institutions, including
investment funds, securitisation vehicles,
insurance corporations and pension funds.
In line with last year’s report, the scope of
the reporting has been extended to encompass
indicators of fi nancial development. In fact,
while fi nancial integration is an important
factor in increasing the effi ciency of a fi nancial
system, the latter also depends on each
fi nancial system’s own degree of development.
Here, important factors are the quality of the
institutional environment (including laws,
regulations, corporate governance structures
and market infrastructures) and of the political
and cultural factors determining the fi nancial
market environment.
All indicators are updated and published semi-
annually (in March and September) on the
ECB’s website.29 The last update was carried
out in March 2010.
ECB-CFS RESEARCH NETWORK ON CAPITAL
MARKETS AND FINANCIAL INTEGRATION
IN EUROPE
In April 2002 the ECB and the Center for
Financial Studies (CFS) in Frankfurt launched
the ECB-CFS Research Network to promote
research on “capital markets and fi nancial
integration in Europe”.30 The Research Network
is aimed at coordinating and stimulating
top-level and policy-relevant research that
signifi cantly contributes to the understanding
of the European fi nancial system and its
international linkages. European fi nancial
integration is one of the three main focal areas
in this regard.
After in-depth discussions in July 2006 and
February 2008, the Steering Committee
proposed the extension of the work of the
ECB-CFS Network by another three years,
and modifi ed the Network’s research agenda in
view of the ongoing fi nancial market turmoil.
It was particularly emphasised that network
research should focus more on the implications
See Chapter I, as well as the ECB reports entitled “Indicators of 28
fi nancial integration in the euro area”, September 2005 and 2006,
available on the ECB’s website at http://www.ecb.europa.eu.
See the ECB’s website at http://www.ecb.europa.eu.29
See http://www.eu-fi nancial-system.org.30

92ECB
Financial integration in Europe
April 2010
for fi nancial stability and monetary policy
and especially for fi nancial stability. The
following three priority areas emerged from
these discussions: (1) fi nancial systems as risk
managers, risk distributors and risk creators; (2)
integration and development of retail fi nancial
services and the promotion of innovative fi rms
and (3) fi nancial modernisation, governance and
the integration of the European fi nancial system
in global capital markets.
In 2009, the work of the Network focused
on priorities (1) and (3), with a specifi c
emphasis on risk creation, fi nancial stability,
and international fi nancial architecture.
On 12-13 November 2009, the 12th Conference
of the ECB-CFS Network on “Learning from
the Crisis: Financial Stability, Macroeconomic
Policy, and International Institutions” took place
in Rome, hosted by the Einaudi Institute and
Banca d’Italia. It provided research insights into
the causes and consequences of the fi nancial
crisis, proposals for macro-prudential regulatory
and supervisory agenda, as well as interventions
by policy-makers in keynote addresses on
potential regulatory remedies.
Finally, as it does every year, in 2009 the ECB-
CFS Research Network awarded fi ve
“Lamfalussy Fellowships” to promising young
researchers. In the light of the fi nancial crisis
and the pressing need to prepare for a new
macro-prudential supervisory function in the
EU under the leadership of national central
banks and the ECB, particular attention was
paid to choosing research projects in relation to
important issues in this regard. Research papers
delivered within the scope of the ECB’s
Lamfalussy fellowship programme in 2009 also
addressed different aspects of the interplay
between fi nancial integration, market effi ciency,
and stability. In a paper analysing the effect of
retail product choice on investor welfare, Daniel
Dorn 31 documents substantial price dispersion
among covered warrants (also known as bank-
issued derivatives) that are close substitutes, as
well as a general inability of investors to
discover attractively priced such warrants. His
results imply that the search cost associated with
choosing among many instruments, even when
they are relatively homogenous and their pricing
is well understood, erases much of the benefi ts
associated with product proliferation. And Nuno
Fernandes 32 fi nds that one way in which fi rms
take advantage of fi nancial globalization is by
increasingly cross-listing in countries with
stronger investor protection. However, he also
provides evidence of another process
independent of these gains from competition
among stock exchanges, namely, the propensity
of fi rms to cross-list on stock exchanges that are
experiencing temporarily high valuations,
leading to more mis-pricing in the future.
PROVISION OF FINANCIAL MARKETS STATISTICS
Increasing transparency fosters integration, as
it facilitates the comparison of products across
the economic area. Since 10 July 2007, the ECB
publishes nominal yield curves of AAA-rated
euro-denominated euro area central government
bonds, with a residual maturity from three
months to 30 years. In addition, the ECB releases
daily yield curves covering all euro area central
government bonds and publishes the spreads
between both curves.33
A yield curve shows the relationship between
the market remuneration rate and the remaining
time to maturity of bonds with a similar risk
profi le at a certain moment in time. From an
ECB monetary policy perspective, the main
benefi t of the euro area yield curve is that it
provides a proper empirical representation of
the term structure of euro area interest rates,
which can be interpreted in terms of market
expectations on monetary policy, economic
activity and infl ation. Publishing a consistent
and comparable set of yield curves based on
euro-denominated central government bonds
also provides reference information for the
D. Dorn, “Investors with Too Many Options?”, 31 Working Paper Series, ECB, forthcoming.
N. Fernandes, “On the Fortunes of Stock Exchanges and Their 32
Reversals: Evidence from Foreign Listings”, Working Paper Series, ECB, forthcoming.
The yield curves and a description of the methodology used to 33
estimate them can be found on the ECB’s website at http://www.
ecb.europa.eu.

93ECB
Financial integration in Europe
April 2010
3 EUROSYSTEM ACT IV IT IES
FOR F INANCIAL INTEGRATION
wider public and fi nancial market participants,
who previously had to rely on references to
bonds of individual issuers.
Since the introduction of the euro, and in
particular in recent times, there has been
increasing demand both from the public and
from institutions for timely and accurate
statistical data on the euro money market
activity. To satisfy this need, an annual euro
money market survey has been conducted since
1999 by the ECB and the NCBs that are
members of the ESCB. This survey collects data
on euro money market activity in the EU during
the second quarter of each year. The data include
daily average turnover for a variety of market
segments (the unsecured market, repo market,
derivatives market and short-term securities
market) and their respective maturity ranges
(from overnight to over ten years). The data are
released to the general public as the “Euro
Money Market Survey”.34 This annual
publication complements the results published
in the “Euro Money Market Study” 35 which
presents, in alternate years, an in-depth analysis
of money market activity.
STATISTICS ON INSTITUTIONAL INVESTORS
Given the growing fi nancial role of institutional
investors in the euro area, improved statistics
on these agents are not only increasingly
relevant from a monetary policy perspective,
but will also help the monitoring of the fi nancial
integration process (see Chapter I). Hence, apart
from the statistics collected on MFIs, the ECB
also develops and compiles statistics on other
fi nancial corporations, focusing on securitisation
vehicles, investment funds and insurance
corporations and pension funds.
In 2008, the ECB, together with the NCBs,
worked on (i) enhancing the statistical
requirements addressed to MFIs concerning
balance sheet items and interest rate statistics
and (ii) collecting statistics on MFI securitisation
and fi nancial vehicle corporations’ balance
sheets.36 Two regulations addressing these
requirements were adopted by the ECB’s
Governing Council on 19 December 2008.37
A third regulation addressing the requirements
with regard to MFI interest rate statistics
was approved by the Governing Council on
13 March 2009.38 In accordance with these
regulations, reporting of monthly and quarterly
data will begin in 2010, with data for June 2010,
except in the case of securitisation data, which
will be for December 2009.
In 2009, the ECB has implemented new
investment fund balance sheet statistics.
In practice, these consist of two separate
datasets, one covering investment funds as
part of the other fi nancial intermediaries
sector,39 which will be made available on a
monthly basis, and the other covering money
market funds, as part of the MFI sector,
which will be made available on a quarterly
basis. The regular euro area investment fund
statistics provide users with a harmonised and
more detailed picture of the funds industry
in the euro area. These statistics provide
valuable information, particularly in relation
to the portfolio shifts and investment policies
of investment funds. With the introduction
of the new money market fund balance sheet
statistics, the ECB has also enhanced the credit
institution balance sheet statistics.
See the ECB’s website at http://www.ecb.europa.eu.34
See the ECB’s website at http://www.ecb.europa.eu.35
Financial vehicle corporations are securitisation vehicles and are 36
defi ned in Regulation (EC) No 24/2009 of the European Central
Bank of 19 December 2008 concerning statistics on the assets and
liabilities of fi nancial vehicle corporations engaged in securitisation
transactions (ECB/2008/30) (OJ L 15, 20.1.2009, p. 1).
Regulation (EC) No 24/2009 of the European Central Bank 37
of 19 December 2008 concerning statistics on the assets
and liabilities of fi nancial vehicle corporations engaged in
securitisation transactions (ECB/2008/30) (OJ L 15, 20.1.2009,
p. 1) and Regulation (EC) No 25/2009 of the European Central
Bank of 19 December 2008 concerning the balance sheet of the
monetary fi nancial institutions sector (Recast) (ECB/2008/32)
(OJ L 15, 20.1.2009, p. 14).
Regulation EC No 290/2009 of the European Central Bank 38
of 31 March 2009 amending Regulation (EC) No 63/2002
(ECB/2001/18) concerning statistics on interest rates applied
by monetary fi nancial institutions to deposits and loans vis-à-
vis households and non-fi nancial corporations (ECB/2009/7)
(OJ L 94, 8.4.2009, pp. 75-96).
Collected under Regulation (EC) No 958/2007 of the European 39
Central Bank concerning statistics on the assets and liabilities
of investment funds (ECB/2007/8) (OJ L 211, 11.8.2007,
pp. 8-29).

94ECB
Financial integration in Europe
April 2010
In addition, the ECB has been compiling
quarterly insurance corporation and pension
fund statistics for the euro area, based on
existing information. Signifi cantly improved
data reported by euro area NCBs, in liaison
with national supervisory authorities, have
enabled the ECB to develop and start producing
quarterly estimates for the euro area aggregates.
The ECB is currently preparing for their regular
dissemination and publication (possibly in
late 2010). Emphasis is placed on the insurance
corporations sub-sector, in particular for
fi nancial stability purposes.
In response to important gaps in statistics on
credit risk transfer (CRT) instruments revealed
by the current fi nancial crisis, important
improvements are being made in the statistics
on credit derivatives (principally credit default
swaps) compiled by the BIS, including the
granularity of counterparty breakdowns by
sector and region, which is based on the work of
a CGFS/BIS Working Group in which the ECB
participated.40
4 CENTRAL BANK SERVICES THAT FOSTER
INTEGRATION
The provision of central bank services is
another way in which the Eurosystem seeks
to promote fi nancial integration. Although the
main purpose of such services is the pursuit of
the Eurosystem’s basic central banking tasks,
the Eurosystem pays close attention to ensuring
that such services, where possible, are specifi ed
in such a way that they are also conducive to
supporting the fi nancial integration process.
During 2009, the ECB and the Eurosystem
focused their activities in the area of central
bank services on the following initiatives.
TARGET2
The fi rst-generation TARGET system started
operations in January 1999 and facilitated a
rapid integration of the euro money market.
Between November 2007 and May 2008, it was
replaced by an enhanced second-generation
system. While the fi rst-generation system was
based on a technically decentralised structure
made up of several systems, TARGET2 is based
on a single technical platform, also referred to
as the Single Shared Platform (SSP), jointly
developed and operated by three Eurosystem
central banks, namely Deutsche Bundesbank,
Banque de France and Banca d’Italia (the so-
called 3CB). At present, 23 central banks of
the EU and their respective user communities
participate in the single platform. In addition,
some fi nancial institutions located in other
countries of the European Economic Area (EEA)
participate in TARGET2 via remote access. The
SSP is used for the processing of euro payments
and the management of accounts opened for
fi nancial institutions with participating central
banks. The launch of TARGET2 enables the
entire European user community to benefi t from
the same comprehensive and advanced real-time
gross settlement services. TARGET2 offers
broad access to credit institutions and ancillary
systems.
TARGET2 represents a decisive contribution
by the Eurosystem to European fi nancial
integration. The fi rst market infrastructure
to be completely integrated and harmonised
at a European level, the second-generation
TARGET2 system has eliminated the
fragmented situation that previously existed
in the management of central bank liquidity
and the real-time settlement in central bank
money of euro payments. The move to a
single platform TARGET2 system represents
a signifi cant step towards a more effi cient,
competitive, safe and fully integrated European
payments landscape, offering all market
participants equal conditions and services
regardless of their location. The harmonised
service level of TARGET2, offered with
a single price structure, ensures a level
playing-fi eld for all participants across Europe.
“Credit risk transfer statistics”, 40 CGFS papers, No 35, Committee
on the Global Financial System, BIS, September 2009.

95ECB
Financial integration in Europe
April 2010
3 EUROSYSTEM ACT IV IT IES
FOR F INANCIAL INTEGRATION
The move from the fi rst generation TARGET
system to TARGET2 was regarded by the user
community as very smooth and successful, with
a system performance that gave satisfaction to
all stakeholders. In January 2009, Slovakia
adopted the euro and Národná banka Slovenska
joined TARGET2.41 In addition, National Bank
of Bulgaria expressed its intention to connect to
TARGET2 as a non-euro area central bank
before adoption of the euro. After the necessary
preparatory activities had been successfully
completed, National Bank of Bulgaria and its
national user community joined TARGET2 in
February 2010.
The TARGET2 system functioned smoothly
in 2009. The system’s market share was stable,
with 89% of the total value of payments in euro
large-value payments systems being executed
via TARGET2. In 2009, the average number
of payments processed by the system each
day was 345,771, while the average value was
€2,153 billion. These fi gures position TARGET2
as one of the largest wholesale payment systems
in the world, alongside Fedwire in the United
States and Continuous Linked Settlement (CLS),
the international system for settling foreign
exchange transactions. The technical availability
of the Single Shared Platform of TARGET2 for
the whole year was 100%.
Observations made with regard to the use of the
harmonised and advanced TARGET2 services
(payment prioritisation, liquidity reservation,
sender limits, liquidity pooling, etc.) confi rm
that they are actively used by a wide range of
participants and that they contribute to the
smoother settlement of transactions. TARGET2
and its new features have both enabled and
driven organisational changes by credit
institutions that operate in several European
countries by allowing these entities to rationalise
their back offi ce functions and consolidate their
management of euro liquidity.
TARGET2 provides a harmonised set of cash
settlement services in central bank money for all
kinds of ancillary systems, such as retail payment
systems, money market systems, clearing houses
and securities settlement systems. The main
advantage for ancillary systems is that they
are able to access any account in TARGET2
via a standardised interface with standardised
settlement procedures, thus providing for a
substantial harmonisation of business practices.
The Eurosystem has agreed that all euro
payments settled in central bank money should
ultimately be settled in TARGET2. To facilitate
the migration to TARGET2 of central banks and
their banking communities, some central banks
have opted to maintain some transactions in
local systems – referred to as proprietary home
account (PHA) applications – for a transition
period of up to four years. By December 2009 the
volume of TARGET2 transactions settled on the
local PHAs was very limited and only accounted
for less than 1% of total TARGET2 traffi c. This
means that the settlement activities on the PHAs
are marginal and, in practice, the fragmentation
of participants’ liquidity between the SSP and
the PHAs had limited and manageable effects.
In 2009, two central banks took the initiative
to move all their payment activities to the SSP
before the end of the transition period (Portugal
in March 2009 and Belgium in June 2009).
TARGET2-SECURITIES
The T2S project is the Eurosystem initiative that
aims to overcome the current fragmentation in
the securities settlement layer of the European
post-trading landscape. The existence of
fragmentation and procedures that have not been
harmonised across national settlement systems
contributes to high costs and ineffi ciencies,
especially for cross-border securities
transactions, which constitute a considerable
competitive disadvantage for European capital
markets. The development and operation of
T2S have been assigned by the Eurosystem to
the so-called 4CB, i.e. Deutsche Bundesbank,
All euro area countries participate in TARGET, as its use is 41
mandatory for the settlement of any euro operations with the
Eurosystem. TARGET is also available, on a voluntary basis, to
non-euro area Member States to facilitate the settlement of euro-
denominated transactions in these countries.

96ECB
Financial integration in Europe
April 2010
Banco de España, Banque de France and Banca
d’Italia.
The objective of T2S is to achieve harmonised
and commoditised delivery-versus-payment
settlement in central bank money, in euro and
other participating currencies, for virtually
all securities in Europe. T2S will not only
signifi cantly reduce cross-border settlement fees
in Europe, but will also increase the effi ciency
and stability of capital markets. Together with
other European initiatives, such as the Code of
Conduct for Clearing and Settlement and the
MiFID, T2S will also contribute to the further
integration of the European fi nancial industry
(see also Special Feature C of this report).
The T2S project made signifi cant progress in
2009. One important milestone was the decision
to establish the T2S Programme Board in
March 2009. The new body, composed of eight
members representing both central banks and
industry experts, was formed as a streamlined
management structure with the main aim of
ensuring the successful and timely completion
of the project. The Programme Board is
responsible for preparing strategic policy
decisions for the ECB’s Governing Council,
for day-to-day management of the programme
and for managing relations with the CSDs, the
NCBs, users and other external stakeholders.
The Governing Council, however, remains the
ultimate decision-making body on T2S issues.
The second major achievement was the
signature of the T2S Memorandum of
Understanding (MoU) between the Eurosystem
and CSDs in July 2009. The MoU was signed
in 2009 by 28 CSDs encompassing all euro area
CSDs as well as those of Denmark, Estonia,
Iceland, Latvia, Lithuania, Norway, Romania,
Sweden, Switzerland and the United Kingdom.
The signing of the MoU confi rmed the parties’
commitment to the T2S project and set out the
mutual obligations and responsibilities of the
CSDs and the Eurosystem, forming a solid
basis for the negotiation of the Framework
Agreement, which is expected to be signed in
mid 2010.
The third key milestone achieved in
November 2009 was the fi nalisation of the
General Functional Specifi cations (GFS),
which describe how the T2S platform will
support the functional requirements of the User
Requirements Document (URD), and the General
Technical Design (GTD), which describes the
high level architectural design aiming, inter alia,
to exploit synergies with T2. The GFS and GTD
pave the way for the preparation of the User
Detailed Functional Specifi cations (UDFS).
The benefi ts of the T2S project – in terms of
price reductions, greater effi ciency and higher
competition in the post-trading environment –
can be signifi cantly leveraged by fostering further
market harmonisation at all stages of the post-
trading value chain. The T2S platform itself will
only deal with the integration and harmonisation
of the settlement stage. In order to integrate the
other stages (such as asset-servicing and custody)
and to create a “single pool of European securities”
(that is accessible regardless of the location of the
issuer, CSD or investor) it is necessary to make
it easier and less costly for post-trading service
providers to enter markets in other countries.
Harmonisation is the best way to achieve this,
as it reduces the investments new entrants need
to make to understand the specifi cities of the
non-local market.
In recognition of these wider benefi ts, the ECB’s
Governing Council, when deciding to go ahead
with building T2S, committed itself to support
the work on European harmonisation. Special
Feature C of this report provides more details on
what T2S is doing in this area, in particular the
work of the Corporate Actions Subgroup 42 and
The Corporate Actions Subgroup has developed three sets 42
of standards (for market claims, transformations and buyer
protection) on corporate actions on unsettled transactions. These
standards complement the work of the European Commission’s
Corporate Actions Joint Working Group.

97ECB
Financial integration in Europe
April 2010
3 EUROSYSTEM ACT IV IT IES
FOR F INANCIAL INTEGRATION
the Process Effi ciency Subgroup,43 as well as on
the monitoring of other wider harmonisation
issues.
Although the URD will be “frozen” as of early
2010, T2S will continue to actively work on
harmonisation in the coming years, monitoring
developments in the industry of relevance for
T2S, acting as a catalyst for wider harmonisation
initiatives and supporting the market in the
implementation of existing agreed standards.
EUROSYSTEM COLLATERAL MANAGEMENT
SERVICES
The correspondent central banking model
(CCBM) fosters fi nancial market integration,
since its implementation in 1999, by enabling
all euro area counterparties to use the common
set of eligible assets as collateral in Eurosystem
credit operations, regardless of the location in
which the security has been issued.
CCBM is the main channel for the cross-border
use of collateral in Eurosystem credit operations.
In December 2009 it accounted for 25.1% of the
total collateral provided to the Eurosystem.
Since the model builds upon the principle of
minimum harmonisation, market participants
called for a further standardisation of existing
procedures, both domestically and at the cross-
border level.
Against this background, the ECB’s Governing
Council decided, on 17 July 2008, to launch the
Collateral Central Bank Management (CCBM2)
project. The development and operation of
CCBM2 was assigned to the Nationale Bank
van België/Banque Nationale de Belgique and
De Nederlandsche Bank.
The objective of CCBM2 is to consolidate the
existing technical infrastructure into one single
platform for domestic and cross-border use of
marketable and non-marketable assets. Building
upon this infrastructure, a further harmonised
service level for Eurosystem counterparties
will be implemented. CCBM2 will be fully
compatible with TARGET and T2S, in
particular with the communication interfaces of
both of these platforms and with the settlement
procedures of T2S for the delivery of securities.
Consequently, effi ciency will be increased by
optimising the cost of mobilising collateral
through enhanced liquidity management.
Moreover, the adoption of real-time and straight-
through processing in the system will increase
the pace of mobilisation, thereby additionally
promoting effi ciency.
Although aiming for a technically consolidated
management of collateral, CCBM2 will be
implemented in accordance with the principle of
decentralised access to credit.
In terms of service offering, CCBM2 will support
all existing collateralisation techniques and
methods such as pledge, repo and assignment,
as well as pooling and earmarking.
The Eurosystem is currently in the process
of fi nalising the detailed specifi cations for
users, based on the already approved user
requirements.44 The Eurosystem will maintain
an open dialogue with market participants
throughout the subsequent phases of the
CCBM2 project.
The launch of CCBM made all collateral
available to all counterparties in the euro
area, and thus allowed for enhanced portfolio
diversifi cation and the integration of collateral
markets. With CCBM2, its common technical
infrastructure and the harmonised service
level, further integration of fi nancial markets is
envisaged.
See the ECB’s website at http://www.ecb.europa.eu.43
The Process Effi ciency Subgroup has worked on 11 key issues 44
in 2009, in many cases developing harmonised rules and
procedures: T2S handling of repo settlement; recycling rules
for “hold” status; recycling rules after matching; threshold for
partial settlement; auto-collateralisation; multilateral settlement
without a CCP; period for data archiving; single framework for
fails management; amendment of settlement instructions; future
and backdated transactions; validation rules.


1ECB
Financial integration in Europe
April 2010 S
STAT IST ICAL ANNEX
GENERAL INDICATORS
Chart C1S: Size of Capital Markets S3
MONEY MARKET INDICATORS
Price-based indicators
Chart C1: Cross-country standard deviation of average unsecured interbank lending rates
across euro area countries S4
Chart C2: Cross-country standard deviation of average interbank repo rates across euro
area countries S4
Quantity-based indicators
Chart C2S: Outstanding amounts of commercial paper (% of GDP) S5
Infrastructure indicators for large-value payment systems (LVPS)
Chart C3: TARGET2: the share of payments between Member States in total payments
(by volume) S5
Chart C4: TARGET2: the share of payments between Member States in total payments
(by value) S5
BOND MARKET INDICATORS
GOVERNMENT BOND MARKET
Price-based indicators
Chart C5: Evolution of beta coeffi cients for ten-year government bond yields S6
Chart C6: Average distance of intercept/beta from the values implied by complete
integration for ten-year government bond yields S7
Chart C7: Evolution of intercept and beta coeffi cients for ten-year government bond
yields, adjusted for sovereign risk S7
CORPORATE BOND MARKET
Chart C3S: Debt securities issued by non-fi nancial corporations S8
Price-based indicators
Chart C8: Dispersion in the fi ve-year CDS premia among leading telecommunication
fi rms and commercial banks across euro area countries, daily data, basis points S8
Quantity-based indicators for government and corporate bond markets
Chart C9: Share of MFI cross-border holdings of debt securities issued by euro area and
EU non-MFIs: outstanding amounts by residency of the issuer S9
Chart C10: Investment funds’ holdings of debt securities issued in other euro area
countries and the rest of the world S9
STATISTICAL ANNEX

2ECB
Financial integration in Europe
April 2010S
Infrastructure indicators
Chart C11: Share of domestic and cross-border collateral used for Eurosystem
credit operations S10
EQUITY MARKET INDICATORS
Chart C4S: Early-stage venture capital fi nance, as share of GDP, by country of management S10
Chart C5S: Private equity investment by independent funds as share of total private equity
investment, by country of management S10
Price-based indicators
Chart C6S: Pricing of fi rm-specifi c information in the stock market S11
Chart C12: Filtered country and sector dispersions in euro area equity returns S11
Chart C13: Proportion of variance in local equity returns explained by euro area and US shocks S12
Chart C14: Euro area and US shock spillover intensity S12
Quantity-based indicators
Chart C15: The degree of cross-border holdings of equity issued by euro area residents S13
Chart C16: Investment funds’ holdings of equity issued in other euro area countries and
the rest of the world S14
BANKING MARKET INDICATORS
Cross-border presence indicators
Chart C17: Dispersion of the total assets of euro area bank branches across euro area
countries S14
Chart C18: Dispersion of the total assets of euro area bank subsidiaries across euro area
countries S14
Chart C19: Euro area cross-border bank M&A activity S15
Price-based indicators
Chart C20: Cross-country standard deviation of MFI interest rates on loans
to non-fi nancial corporations S15
Chart C21: Cross-country standard deviation of MFI interest rates on loans to households S15
Chart C22: Intercept convergence for selected banking retail interest rates S16
Chart C23: Beta convergence for selected banking retail interest rates S16
Quantity-based indicators
Chart C24: MFI loans to non-MFIs: outstanding amounts by residency of the counterparty S17
Chart C25: MFI loans to MFIs: outstanding amounts by residency of the counterparty S18
Infrastructure indicators for retail payment systems
Chart C26: Concentration ratio of retail payment infrastructures in the euro area S18
Chart C27: Credit Transfer transactions processed in SEPA format S19

3ECB
Financial integration in Europe
April 2010 S
STAT IST ICAL ANNEX
MONEY MARKET INDICATORS
PRICE-BASED INDICATORS
Description
This indicator is calculated as the sum of
(i) stock market capitalisation, (ii) bank credit to
the private sector and (iii) debt securities issued
by the private sector, divided by GDP.
Euro area (EA) and Euronext countries (EX)
fi gures are averages of country data weighted by
GDP.
Stock market capitalisation: fi gures for Japan
refer to the Tokyo Stock Exchange. Figures for
the United States include AMEX, NYSE and
NASDAQ. EA stock market capitalisation is the
sum of the values for Euronext and for euro area
countries not included in Euronext. Stock market
capitalisation includes only shares issued by
domestic companies; it does not include shares
issued by foreign companies.
Debt securities issued by the private sector: for
EA countries, data are from the SEC database.
Data for Greece, Ireland and Luxembourg start
in 1993. For IE, BIS data are used for the years
1993 to 2002 for monetary fi nancial institutions
and for the years 1993 to 2007 for other issuers.
For Luxembourg, BIS data for the years 1993
to 2007 are used for non-MFI issuers. For
non-EA countries, BIS data are used (sum of
international and domestic amounts outstanding
of bonds issued by corporate issuers and
fi nancial institutions).
Bank credit to the private sector: EA fi gures
are the sum of EA country fi gures and include
cross-border loans between EA countries.
Chart C1S Size of capital markets
(aggregate volume of shares, bonds and loans to the private sectors as a percentage of GDP)
0
100
200
300
400
500
600
700
800
0
100
200
300
400
500
600
700
800
1990-1994
1995-1999
2000-2004
2005-2008
1 2 3 4 5 6 7 8 9 10 11 12 13 14 15 16 17 18 19
1 BE
2 DE
3 IE
4 GR
5 ES
6 FR
7 IT
8 LU
9 NL
10 AT
11 PT
12 FI
13 EX
14 EA
15 SE
16 CH
17 UK
18 JP
19 US
Sources: WFE, IMF, ECB, Datastream, Eurostat, ECB calculations.

ECB
Financial integration in Europe
April 2010S 4
Description
The EBF makes available (daily) business
frequency data for a panel of individual
institutions for both unsecured and secured
short-term interbank debt or deposits. These
data cover the EONIA and the EURIBOR
(unsecured lending) as well as the EUREPO for
different maturities.1 Data on the EONIA SWAP
INDEX can also be used.
For each dataset, the indicator is the
unweighted standard deviation (Dt) of average
daily interest rates prevailing in each euro
area country. Reported rates are considered
to be the national rates of country c if the
reporting bank is located there. However, the
counterparty of the transaction is not known,
and the reported interest rate could thus
potentially (in part) refer to transactions with
a bank outside country c.
The number of euro area countries (nt in the
formula below) refl ects the number of countries
that had adopted the euro in the reference period:
∑c
Dt = rc,t − rt2
)(nt
1 (1),
where rc,t is the unweighted average of the
interest rate ri,tc reported by each of the mc panel
banks at time t in a given country c:
∑i
rc,t = mc
1 rc
i,t (2).
The euro area average rt is calculated as the
unweighted average of the national average
interest rates rc,t.
The data are smoothed by calculating a 61
(business) day centred moving average of the
standard deviation, transformed into monthly
fi gures and taking the end-of-month observation
of the smoothed series.
For further information, see http://www.euribor.org/ default.htm 1
and http://www.eurepo.org/. See also “The contribution of the
ECB and the Eurosystem to European fi nancial integration”,
Monthly Bulletin, ECB, May 2006.
Chart C1 Cross-country standard deviation of average unsecured interbank lending rates across euro area countries
(aggregate volumes of shares)
0
50
100
150
200
250
300
0
50
100
150
200
250
300
1994 1996 1998 2000 2002 2004 2006 2008
overnight
1-month maturity
12-month maturity
(61-day moving average; basis points)
0
2
4
6
8
10
12
14
16
18
0
2
4
6
8
10
12
14
16
18
1999 2001 2003 2005 2007 2009
Sources: EBF, ECB calculations.
Chart C2 Cross-country standard deviation of average interbank repo rates across euro area countries
(61-day moving average; basis points)
0
1
2
3
4
5
6
7
8
0
1
2
3
4
5
6
7
8
1-month maturity
12-month maturity
20092002 2003 2004 2005 2006 2007 2008
Sources: EBF, ECB calculations.

5ECB
Financial integration in Europe
April 2010 S
STAT IST ICAL ANNEX
For indicative series prices (EURIBOR,
EUREPO), the data are corrected for obvious
outliers.
The computed indicator has a monthly frequency.
Additional information
The EONIA is the effective overnight reference
rate for the euro. The banks contributing to the
EONIA are the same as the EURIBOR panel
banks (composed of banks resident in the euro
area and in other EU Member States, as well as
some international banks).
The EURIBOR is the benchmark rate of the large
unsecured euro money market for maturities longer
than overnight that has emerged since 1999.
The EUREPO is the benchmark rate of the
euro repo market, and has been published since
March 2002. It is the rate at which one prime
bank offers funds in euro to another prime bank
when the funds are secured by a repo transaction
using general collateral.
QUANTITY-BASED INDICATORS
Description
The height of the bar for Europe is the sum of euro
commercial paper (ECP), and the commercial
paper outstanding in the Belgian, German,
Dutch, Spanish and French markets. Certifi cates
of deposit and asset-backed commercial paper
are excluded. The red bar indicates securities
with a STEP label. Since issuance in the ECP
market is mainly undertaken by residents in
the euro area and the United Kingdom, the
outstanding amounts of euro commercial paper
are expressed as a percentage of the sum of euro
area and UK GDP.
INFRASTRUCTURE INDICATORS FOR LARGE-VALUE
PAYMENT SYSTEMS (LVPS)
Chart C2S Outstanding amounts of commercial paper
(percentage of GDP)
0
1
2
3
4
5
6
7
8
9
10
0
1
2
3
4
5
6
7
8
9
10
20092008200720062005200420032002200120001999
STEP
commercial paper in EuropeUS commercial paper
Sources: ECB, Euroclear, Banque de France, Dealogic and FED.
Chart C3 TARGET2: the share of payments between Member States in total payments
(volumes; percentages)
15
20
25
30
35
15
20
25
30
35
1999 2000 2001 2002 2003 2004 2005 2006 2007 20082009
Source: ECB.
Chart C4 TARGET2: the share of payments between Member States in total payments
(values; percentages)
10
15
20
25
30
35
40
45
50
10
15
20
25
30
35
40
45
50
1999 20012000 20022003200420052006200720082009
Source: ECB.

ECB
Financial integration in Europe
April 2010S 6
Description
The fi rst indicator shows the share of the volume
of payments between euro area Member States
(inter-Member State payments) in the total
number of payments processed in the TARGET
system.
The second indicator shows the share of the
value of payments between euro area Member
States (inter-Member State payments) in
the total value of payments processed in the
TARGET system.
Both indicators have a half-yearly frequency.
Additional information
The TARGET system is the RTGS system for
the euro. A second-generation system operating
on a single shared platform (TARGET2) was
launched in November 2007 and fully replaced
the former decentralised fi rst-generation
TARGET system in May 2008.
A TARGET inter-Member State payment is
defi ned as a payment between counterparties
who maintain accounts with different central
banks participating in TARGET. An intra-
Member State payment is defi ned as a payment
between counterparties who maintain accounts
with the same central bank.
BOND MARKET INDICATORS
GOVERNMENT BOND MARKET
PRICE-BASED INDICATORS
Description
If bond markets are fully integrated and no
country-specifi c changes in perceived credit risk
occur, bond yields should only react to news
common to all markets. That is, bond yields of
individual countries should react exclusively to
common news, which is refl ected in a change
in the benchmark government bond yield.
To separate common from local infl uences, the
following regression is run:
ΔRc,t = αc,t + βc,tΔRger,t + εc,t (3)
where α denotes a country-varying and
time-varying intercept; β is a country-dependent
and time-dependent beta with respect to
the benchmark (German) bond yield; ΔR
is the change in the bond yield and ε is a
country-specifi c shock. In this framework, and
in the context of complete market integration,
α and β would have the values of zero and one
respectively.
The conditional betas are derived by estimating
the above regression using the fi rst 18 months
of monthly averages. Subsequently, the data
window is moved one month ahead and the
equation is re-estimated until the last observation
is reached. A time series for βc,t is then obtained.
The model-based indicator has a monthly
frequency.
Chart C5 Evolution of beta coefficients for ten-year government bond yields
-3
-2
-1
0
1
2
3
4
-3
-2
-1
0
1
2
3
4
1992 1994 1996 1998 2000 2002 2004 2006 2008
Austria
Belgium
Finland
France
Greece
Ireland
Italy
Netherland
Spain
Portugal
Sources: Reuters and ECB calculations.

7ECB
Financial integration in Europe
April 2010 S
STAT IST ICAL ANNEX
Additional information
The outcome of the econometric specifi cation
depends on the selection of the most appropriate
benchmark bond, in this case the ten-year German
government bond. In addition, one should
not expect common factors to be able to fully
explain changes in local bond yields, as “local
news” concerning credit and liquidity risks will
continue to have an impact on local yields.
Description
This indicator is derived using regression (3), as
for the previous indicator. From the individual
country regressions, the unweighted average αc,t and βc,t values are calculated and measured as
a difference to the values implied by complete
market integration (0 and 1 respectively).
The analysis is based on monthly averages of
government bond yields.
The model-based indicator has a monthly
frequency.
Description
Sovereign risk is controlled for by proxying
it with rating dummies and by modifying
regression (3) as follows:
= ∆Rc,t ∆R ger,tc,t c,t c,tDD+ + + +(α α r,t r,t∑ ∑ β) )c,tβ rr ( c,tεr ∈{ +AA ,...,A} r ∈{ +AA ,...,A}
(4)
where c,tDr is a dummy for rating r and
country c, at time t.
A potential problem with this regression is that
coeffi cients are not identifi ed when there is not
suffi cient cross-sectional variation in the ratings.
Chart C6 Average distance of intercept/beta from the values implied by complete integration for ten-year government bond yields
0.00
0.05
0.10
0.15
0.20
0.25
0.00
0.20
0.40
0.60
0.80
1.00
1.20
1.40
1992 1994 1996 1998 2000 2002 2004 20082006 2010
dispersion in intercept (left-hand scale)
dispersion in beta (right-hand scale)
0.000
0.005
0.010
0.015
0.020
0.025
0.030
0.035
0.040
0.045
0.050
0.055
0.060
0.00
0.20
0.40
0.60
0.80
1.00
1.20
1.40
2002 2003 2004 2005 2006 2007 2008
Sources: Reuters and ECB calculations.
Chart C7 Evolution of intercept and beta coefficients for ten-year government bond yields, adjusted for sovereign risk
(difference from perfect-integration values)
-0.2
-0.1
0.0
0.1
0.2
0.3
0.4
0.5
-0.2
-0.1
0.0
0.1
0.2
0.3
0.4
0.5
1995 1997 1999 2001 2003 2005 2007 2009
alpha
beta
Sources: Reuters and ECB calculations.

ECB
Financial integration in Europe
April 2010S 8
To avoid this problem, the above regression is
estimated without fi xed effects, i.e.:
Coeffi cients are made time-varying using a
rolling regression (18-month rolling window).
The coeffi cients (αt, βt ) now capture the average
country reactions to changes in the German
government bond yields, after controlling for
credit risk factors. Values are calculated and
measured as a difference to the values implied
by complete market integration (0 and 1
respectively, assuming no other variable besides
sovereign risk is affecting the change in yield).
The chart reports the estimation results for a
sample starting in the second half of 1995.
CORPORATE BOND MARKET
This indicator shows the outstanding amounts
of debt securities issued by non-fi nancial
corporations, as a percentage of GDP.
For euro area countries, data are from the SEC
database. For Ireland and Luxembourg, BIS
data are used. Data for Greece, Ireland and
Luxembourg start in 1993. For non-EA countries,
BIS data are used (sum of international and
domestic amounts outstanding of bonds issued
by corporate issuers).
PRICE-BASED INDICATORS
Description
This indicator is based on the evolution of Credit
Default Swap (CDS) premia. Specifi cally,
the cross-country standard deviation in CDS
premia of a set of homogenous fi rms across
euro area countries, such those of leading
telecommunications fi rms and those of the
largest commercial banks is used. The panel
comprises the largest banks in terms of total
assets by country. For banks, the measure
of dispersion is the standard deviation of the
unweighted national average across institutions.
Chart C3S Debt securities issued by non-financial corporations
(percentage of GDP)
0
5
10
15
20
25
30
35
40
0
5
10
15
20
25
30
35
40
19
1990-1994
1995-1999
2000-2004
2005-2009
1 2 3 4 5 6 7 8 9 10 11 12 13 14 15 16 17 18
1 BE
2 DE
3 IE
4 GR
5 ES
6 FR
7 IT
8 LU
9 NL
10 AT
11 PT
12 FI
13 EX
14 EA
15 CH
16 SE
17 UK
18 JP
19 US
Sources: BIS, ECB, Eurostat and IMF.
Chart C8 Dispersion in the five-year CDS premia among leading telecommunication firms and commercial banks across euro area countries
(daily data; basis points)
0
20
40
60
80
100
120
140
160
180
200
220
0
20
40
60
80
100
120
140
160
180
200
220
2004 2005 2006 2007 2008 2009
sovereign
telecomunication
commercial banks
Sources: Thomson Reuters Financial Datastream and ECB calculations.
= ∆Rc,t ∆R ger,tt c,t c,tDD+ + + +(α αr,t r,t∑ ∑ β) )tβ rr ( c,tεr ∈{ +AA ,...,A} r ∈{ +AA ,...,A}
(5)

9ECB
Financial integration in Europe
April 2010 S
STAT IST ICAL ANNEX
Additional information
Sovereign includes Austria, France, Germany,
Greece, Italy, Netherlands, Portugal, Spain.
Commercial banks include ABN AMRO (NL),
Alpha Bank (GR), Allied Irish Banks (IE),
Anglo Irish Bank Corporation (IE), Banca
Monte dei Paschi di Siena (IT), Banca
Popolare di Milano (IT), Banco Commercial
Portugues (PT), Banco Sabadell (ES), Banco
Espirito Santo (PT), Banco Santander Central
Hispano (ES), Bank der Oesterreichischen
Sparkassen (AT), Bank of Ireland (IE),
Bayerische Hypo-und Vereinbank (DE),
BNP Parisbar (FR), Commerzbank (DE), Credit
Agricole (FR), Deutsche Bank (DE), Dexia
Group (BE), EFG Eurobank Ergass (GR),
Fortis NL (NL), Intesa San Paolo SPA (IT),
Mediobanca (IT), Natixis (FR), National Bank of
Greece (GR), Nordea Bank (FI), Piraeus Group
Fin PLC (GR), Societe Generale (FR), Unicredito
Italiano (IT). Telecommunication includes
Deutsche Telecom (DE), France Telecom (FR),
Hellenic Telecom (GR), KPN (NL), Portugal
Telc (PT), Telecom Italia (IT), Telefonica (ES),
Telekom Austria (AT).
QUANTITY-BASED INDICATORS FOR GOVERNMENT
AND CORPORATE BOND MARKETS
Description
For this indicator, see the indicators on the
cross-border securities holdings of the banking
markets below (C26 and C27).
Description
This indicator shows the share of investment
funds’ total holdings of all securities other than
shares (including money market paper) issued
by residents of the euro area outside the Member
States (OMUMS) in which the investment
fund is located and by residents of the rest of
the world (RoW). The composition of the two
areas is the one prevailing during the reference
period.
The computed indicator has a quarterly
frequency.
Chart C9 Share of MFI cross-border holdings of debt securities issued by euro area and EU non-MFIs: outstanding amounts by residency of the issuer
(share of total holdings, excluding the Eurosystem; percentages)
0
5
10
15
20
25
30
35
40
45
0
5
10
15
20
25
30
35
40
45
other euro area - government and corporate bonds
other euro area - corporate bonds
other euro area - government bonds rest of EU - government and corporate bonds
1997 1999 2001 2003 2005 2007
Source: ECB.
Chart C10 Investment funds’ holdings of debt securities issued in other euro area countries and the rest of the world
(percentages; share of total holdings of debt securities)
0
5
10
15
20
25
30
35
40
45
50
0
5
10
15
20
25
30
35
40
45
50
1999 2000 2001 2002 2003 2004 2005 2006 2007 2008 2009
other euro area Member Statesrest of the world
Source: ECB.

ECB
Financial integration in Europe
April 2010S 10
INFRASTRUCTURE INDICATORS
Description
This indicator measures the proportions of
eligible assets used domestically,
i.e. within the same country, and across national
borders, i.e. between euro area countries, to
collateralise Eurosystem credit operations. The
indicator aggregates the data reported monthly
by Eurosystem NCBs to the ECB on the
domestic use and cross-border use of collateral
(composed of both the CCBM 2 and links 3 data).
An increase in the cross-border use of collateral
points towards greater integration of the
collateral market. The ability to use any eligible
assets as collateral with any Eurosystem
component promotes portfolio diversifi cation
by counterparties.
The computed indicator has an annual frequency.
Additional information
In the current framework, counterparties
may transfer cross-border collateral to the
Eurosystem via two main channels: the CCBM,
which is provided by the Eurosystem, and the
links, which represent a market-led solution.
The CCBM remains the principal channel,
although the proportion of collateral transferred
through links has increased.
EQUITY MARKET INDICATORS
No data are available for Luxembourg, Malta,
Slovenia or Japan. Data for Greece and the
United States start in 1995. Euro area fi gures are
averages of country data weighted by GDP.
Including direct access to an SSS outside the NCB’s own 2
jurisdiction.
Both direct and indirect links.3
Chart C11 Share of domestic and cross-border collateral used for Eurosystem credit operations
(percentage of the total collateral provided to the Eurosystem)
0
10
20
30
40
50
60
70
80
90
100
0
10
20
30
40
50
60
70
80
90
100
domestic
cross-border
19992000200120022003200420052006200720082009
Source: ECB.
Chart C4S Early-stage venture capital finance, as share of GDP, by country of management
0.00
0.02
0.04
0.06
0.08
0.10
0.12
0.14
0.16
0.00
0.02
0.04
0.06
0.08
0.10
0.12
0.14
0.16
2001-2004
2005-2008
1993-1996
1997-2000
1 2 3 4 5 6 7 8 9 10 11 12 13 14 15 16 17
1 AT
2 BE
3 DE
4 ES
5 FI
6 FR
7 GR
8 IE
9 IT
11 PT
12 EA
13 CH
14 DK
15 SE
16 UK
17 US
10 NL
Sources: European Private Equity and Venture Capital Association, PricewaterhouseCoopers and Eurostat.
Chart C5S Private equity investment by independent funds as share of total private equity investment, by country of management
0.0
0.2
0.4
0.6
0.8
1.0
1.2
0.0
0.2
0.4
0.6
0.8
1.0
1.2
1 AT
2 BE
3 ES
4 DE
13 DK
14 CH
15 SE
16 UK
1993-1997 1998-2002 2003-2007
1 2 3 4 5 6 7 8 9 10 11 12 13 14 15 16
5 FI
6 FR
7 GR
8 IE
9 IT
10 PT
11 NL
12 EA
Sources: European Private Equity and Venture Capital Association.

ECB
Financial integration in Europe
April 2010 S
STAT IST ICAL ANNEX
11
Independent private equity investment is
provided by private equity fi rms that are
not themselves owned by another fi nancial
institution. Data report investments made
by companies in each country. No data are
available for Luxembourg, Malta, Slovenia,
Japan and the United States. Data for Greece
are not available for 1993 and 1994. Euro area
fi gures are averages of country data weighted by
GDP.
PRICE-BASED INDICATORS
Average R² statistics for each country are
obtained by regressing fi rms’ stock returns on
market factors, i.e. the returns on domestic,
euro area, US and emerging countries’ stock
market indices. Typically, low values of the
indicator suggest that stock returns contain more
fi rm-specifi c information. Euro area fi gures are
averages of country R² statistics weighted by
stock market capitalisation.
Description
This indicator is derived by calculating the cross-
sectional dispersion in both sector and country
index returns for the euro area countries.4 Data
are calculated on a weekly basis from
January 1973 onwards. They include (reinvested)
dividends and are denominated in euro.
The indicator has a monthly frequency.
The cross-sectional dispersions are fi ltered using
the Hodrick-Prescott smoothing technique,
which provides a smooth estimate of the
long-term trend component of the series. The
smoothing parameter λ is equal to 14,400.
This indicator is based on an approach fi rst presented by 4
K. Adjaouté and J.P. Danthine, “European Financial Integration
and Equity Returns: A Theory-based Assessment”, in V. Gaspar,
P. Hartmann and O. Sleijpen (eds.), The transformation of the European fi nancial system, ECB, May 2003, pp. 185-236.
Chart C6S Pricing of firm-specific information in the stock market
(R2 statistics)
0.00
0.05
0.10
0.15
0.20
0.25
0.30
0.35
0.40
0.45
0.50
0.00
0.05
0.10
0.15
0.20
0.25
0.30
0.35
0.40
0.45
0.50
1990-1994
1995-1999
2000-2004
2005-2009
1 2 3 4 5 6 7 8 9 10 11 12 13 14 15 16 17 18
1 BE
2 DE
3 IE
4 GR
5 ES
6 FR
7 IT
8 LU
9 NL
10 AT
11 PT
12 FI
13 EA
14 CH
15 SE
16 UK
17 JP
18 US
Sources: Datastream and ECB calculations.
Chart C12 Filtered country and sector dispersions in euro area equity returns
(percentages)
0.00
0.01
0.02
0.03
0.04
0.05
0.06
1973 1979 1985 1991 1997 2003 20090.00
0.01
0.02
0.03
0.04
0.05
0.06
sector
country
Sources: Thomson Reuters Financial Datastream and ECB calculations.

ECB
Financial integration in Europe
April 2010S 12
Additional information
The indicator refl ects structural changes in the
aggregate euro area equity market.
Description
To compare the relevance of euro area and
US shocks for average changes in country
returns, the indicators report the variance ratios,
i.e. the proportion of total domestic equity
volatility explained by euro area and US shocks
respectively. The model-based indicator is
derived by assuming that the total variance of
individual country-specifi c returns is given by:
σc,t = hc,t + (β eu) σeu,t + (β
us ) σus,t2 22 2 2
tt (6)
where hc,t is the variance of the local shock
component.5 The euro area variance ratio is then
given by:
VRc,t = eu2
2( β
eu) σeu,t
σ2
t
c,t(7)
and correspondingly for the United States.
The conditional variances are obtained from a
standard asymmetric GARCH (1,1) model.
For each period, the indicators report the
unweighted average of the relative importance
of euro area-wide factors, other than US equity
market fl uctuations, for the variance of individual
euro area countries’ equity market indices (the
“variance ratio”), and the unweighted average
of the relative importance of US equity market
fl uctuations for the variance of euro area equity
markets.
Data refer to the EMU global sector indices, and
have been calculated on a weekly basis from
January 1973 onwards.
Additional information
The variance ratio is derived by assuming that
local shocks are uncorrelated across countries
and that they are similarly not correlated with
the euro area and US benchmark indices.
Description
This measure is equivalent to the news-based
indicators for the bond market. However,
empirical evidence suggests that equity returns
are signifi cantly driven by global factors. For
this reason, both euro area-wide shocks and
See L. Baele, A. Ferrando, P. Hördahl, E. Krylova and 5
C. Monnet, “Measuring fi nancial integration in the euro area”,
Occasional Paper Series, No 14, ECB, April 2004, pp. 19-21.
Chart C13 Proportion of variance in local equity returns explained by euro area and US shocks
(percentages)
0
5
10
15
20
25
30
35
40
45
0
5
10
15
20
25
30
35
40
45
1999-2009
US shocks
EU shocks
1973-1985 1986-1991 1992-1998
Sources: Thomson Reuters Financial Datastream and ECB calculations.
Chart C14 Euro area and US shock spillover intensity
0.0
0.1
0.2
0.3
0.4
0.5
0.6
0.7
0.8
0.9
1.0
0.0
0.1
0.2
0.3
0.4
0.5
0.6
0.7
0.8
0.9
1.0
1973-1985 1986-1991 1992-1998 1999-2009
euro area shock spillover intensities
US shock spillover intensities
Sources: Thomson Financial Datastream and ECB calculations.

ECB
Financial integration in Europe
April 2010 S
STAT IST ICAL ANNEX
13
US shocks (as a proxy for global factors) are
included in the assessment of common news.
To calculate the relative importance of euro
area-wide and US stock market fl uctuations for
local stock market returns, the stock market
returns of individual countries are modelled as
having both an expected component as well as
an unexpected one, εc,t.6 The unexpected
component is then decomposed into a purely
local shock (ec,t ) and a reaction to euro area
news (εeu,t ) and world (US) news (εus,t ):
usc,tβεeu,t + εus,tεc,t = ec,t + c,tβ
eu
(8)
where β represents the country-dependent
sensitivity to euro area or US market changes
(of the unexpected component of equity
returns).
In order to investigate the development of the
betas over time, four dummy variables are
introduced representing the periods 1973-1985,
1986-1991, 1992-1998 and 1999-2008.
For each period, the indicators report the
unweighted average intensity by which euro
area-wide equity market shocks, other than
those from the United States, are transmitted
to local euro area equity markets, as well as
the unweighted average intensity by which US
equity market shocks are transmitted to local
euro area equity markets.
Data refer to the EMU global sector indices,
and are calculated on a weekly basis from
January 1973 onwards.
Additional information
To distinguish global shocks from purely
euro area shocks, it is assumed that euro area
equity market developments are partly driven
by events in the US market. It is furthermore
assumed that the proportion of local returns that
is not explained by common factors is entirely
attributable to local news.
QUANTITY-BASED INDICATORS
Description
This indicator measures the degree of
cross-border holdings of equity securities
among euro area Member States.
Intra-euro area is defi ned as the share of equity
issued by euro area residents and held by other
euro area residents (excluding central banks):
Outstockij,tj ≠ i∑∑
i
i,j euro area countries{ }∈
+ TOutstocki,ti∑i,tMKT
i∑ −∑TInstocki,t
i
(9)
where Outstockij denotes the value of equity
issued by residents of euro area Member State
i and held by residents of euro area Member
State j (i ≠ j); MKT stands for stock market
capitalisation in country i; TOutstocki is the total
foreign equity held by country i and TInstocki is
the total foreign liabilities of country i.
The expected return is obtained by relating euro area and US 6
returns to a constant term and to the returns in the previous
period. The conditional variance of the error terms is governed
by a bivariate asymmetric GARCH (1,1) model.
Chart C15 The degree of cross-border holdings of equity issued by euro area residents
(percentages)
0
0.05
0.10
0.15
0.20
0.25
0.30
0.35
0.40
0.45
0
0.05
0.10
0.15
0.20
0.25
0.30
0.35
0.40
0.45
intra trade extra trade
2001
2002
2003
2004
2005
2006
2007
2008
Source: ECB.

ECB
Financial integration in Europe
April 2010S 14
Extra-euro area is defi ned as the share of euro
area equity held by non-residents of the euro
area (excluding central banks). The measure
takes the following form:
where Outstockir denotes the value of equity
issued by residents of euro area Member State i and held by non-residents of the euro area r
(rest of the world); MKTr stands for market
capitalisation in country r; TOutstockr is the total
foreign equity held by country r and TIntstockr
is the total foreign liabilities of country r.
The computed indicator has an annual
frequency.
Description
The indicator shows the share of investment
funds’ total holdings of all shares and other
equity (excluding investment fund shares/units)
issued by residents of the euro area outside
the Member State in which the investment
fund is located and by residents of the rest of
the world. The composition of the two areas is
the one prevailing during the reference period.
The indicator has a quarterly frequency.
BANKING MARKET INDICATORS
CROSS-BORDER PRESENCE INDICATORS
Chart C17 Dispersion of the total assets of euro area bank branches across euro area countries
(percentage of the total assets of the euro area banking sector)
0
10
20
0
10
20
2008 20092001 2002 2003 2004 2005 2006 2007
Source: ECB.
Chart C18 Dispersion of the total assets of euro area bank subsidiaries across euro area countries
(percentage of the total assets of the euro area banking sector)
0
10
20
30
40
50
60
70
80
0
10
20
30
40
50
60
70
80
2001 2002 2003 2004 2005 2006 2007 20092008
Source: ECB.
Outstockir,tr∑∑
i
r,t r,tr,t ∑MKTr
+ TOutstockr∑∑ − TInstock
r
i euro area countries{}
}∈r rest of the world{∈ (10)
Chart C16 Investment funds’ holdings of equity issued in other euro area countries and the rest of the world
(as a share of total holdings of equity; percentages)
0
10
20
30
40
50
60
0
10
20
30
40
50
60
other euro area Member States
rest of the world
19991998 200020012002200320042005200620072008
Source: ECB.

ECB
Financial integration in Europe
April 2010 S
STAT IST ICAL ANNEX
15
Description
These two indicators describe the development
over time of the assets of foreign branches
and subsidiaries of euro area banks within
euro area countries other than the home
country as a share of the total assets of the
euro area banking sector. The level and
dispersion of the country data are described
by the following dispersion measures: the
minimum, the fi rst quartile (25th percentile),
the median value (50th percentile), the third
quartile (75th percentile), and the maximum.
These computed indicators have an annual
frequency.
Description
This indicator shows the value of the euro area
bank M&A activity as a further measure of the
degree of cross-border integration of euro area
banking markets. The number of deals is also
displayed.
PRICE-BASED INDICATORS
Chart C19 Euro area cross-border bank M&A activity
(value of intra euro area cross-border M&A and absolute numbers)
0
10
20
30
40
50
60
0
2
4
6
8
10
12
14
2002 2003 2004 2005 2006 2007 2008 2009
value of cross-border deals (EUR billions; left-hand scale)
number of cross-border deals (right-hand scale)
Sources: Bureau van Dijk (Zephyr database) and ECB calculations.
Chart C20 Cross-country standard deviation of MFI interest rates on loans to non-financial corporations
(basis points)
0
10
20
30
40
50
60
70
80
90
0
10
20
30
40
50
60
70
80
90
floating rate and up to 1 year, up to and including
€1 million
floating rate and up to 1 year, over €1 million
over 5 years, up to and including €1 million
over 5 years, over €1 million
2003 2004 2005 2006 2007 2008 2009
Source: ECB.
Chart C21 Cross-country standard deviation of MFI interest rates on loans to households
(basis points)
0
20
40
60
80
100
120
140
160
180
0
20
40
60
80
100
120
140
160
180
consumer credit: over 1 year and up to 5 years
house purchase: with floating rate and initial rate
fixation up to 1 year
house purchase: with initial rate fixation over 5 years
and up to 10 years
2003 2004 2005 2006 2007 2008 2009
Source: ECB.

ECB
Financial integration in Europe
April 2010S 16
Description
The price measures for credit market integration
are based on MFI interest rates on new business
reported to the ECB, at monthly frequency as
from January 2003.
For the purpose of measuring fi nancial
integration, it might be preferable to compute
the dispersion of rates as measured by the
standard deviation using unweighted interest
rates at the level of individual MFIs. However,
these data are not available at the ECB, and
therefore weighted rates and standard deviations
are calculated instead.
The following general notation is used for each
of the above categories of loans or deposits:
rc,t = the interest rate prevailing in country c in
month t
bc,t = business volume in country c corresponding
to rc,t
wc,t = bc,t
Bt
is the weight of country c in the total
euro area business volume B
Bt = bc,t∑c
The MFI interest rates in the euro area are
computed as the weighted average of country
interest rates rc,t , taking the country weights wc,t
rt = wc,t
rc,t
∑c
(11)
The euro area weighted standard deviation takes
the following form:
Mt = ∑c
(rc,t – rt2 wc,t) (12)
The monthly data are smoothed by calculating
a three-month centred moving average of the
standard deviation.
Chart C22 Intercept convergence for selected banking retail interest rates
-1
1
2
3
4
5
-1
0
1
2
3
4
5
1991 1993 1995 1997 1999 2001 2003 2005 2007 2009
loans to households for house purchases;
floating rate and up to 1 year initial rate fixationloans to households for house purchases;
over 5 and up to 10 years initial rate fixation
loans to non-financial corporations up to an amount
of €1 million; floating rate and up to 1 year initial rate fixation
loans to non-financial corporations over an amount
of €1 million; floating rate and up to 1 year initial rate fixation
0
Source: ECB.
Chart C23 Beta convergence for selected banking retail interest rates
-1.2
-1.0
-0.8
-0.6
-0.4
-0.2
0.0
0.2
-1.2
-1.0
-0.8
-0.6
-0.4
-0.2
0.0
0.2
1991 1993 1995 1997 1999 2001 2003 2005 2007 2009
loans to households for house purchases;
floating rate and up to 1 year initial rate fixation
loans to households for house purchases;
over 5 and up to 10 years initial rate fixation
loans to non-financial corporations up to
an amount of €1 million; floating rate and
up to 1 year initial rate fixation
loans to non-financial corporations over
an amount of €1 million; floating rate and
up to 1 year initial rate fixation
Source: ECB.

ECB
Financial integration in Europe
April 2010 S
STAT IST ICAL ANNEX
17
Description
The two indicators are based on the MFI interest
rates on new business reported to the ECB,
at monthly frequency as from January 2003.
Before that date, estimated historical series have
been used.
The beta convergence measure signals the speed
with which different rates converge to a specifi c
benchmark. This measure is obtained by running
a panel regression of the change in the spread of
the relevant retail interest rate in each country
relative to the corresponding benchmark rate,
i.e. the lowest country interest rate level for each
loan instrument. The following panel regression
is estimated:
∆Spri,t = αi + βSpri,t-1 +∑L
l=1
γl ∆Spri,t-l + εi,t (13)
using the change in the spread of the relevant
retail interest rate in one country relative to the
corresponding rate of the benchmark country as
a dependent variable (Spr). L denotes the number
of lags that is set equal to 1. The coeffi cients are
estimated with a panel regression with fi xed
effects (αi ). A negative β coeffi cient signals
that convergence is taking place. Furthermore,
the negative β indicates that high spreads have
a tendency to decrease more rapidly than low
spreads. The size of β measures the average
speed of the convergence in the overall market.
If the beta approaches -1, the convergence is
complete. At the same time, large values of
the country specifi c effects (αi ) are indicative
of persistent market segmentation related to
differences in institutional and other factors at
the country level.
The conditional betas are derived by estimating
the above regression using the fi rst 18 months
of monthly averages. Subsequently, the data
window is moved one month ahead and the
equation is re-estimated until the last observation
is reached. A time series for β,t is then obtained.
The model-based indicator has a monthly
frequency.
Additional information
The outcome of the econometric specifi cation
depends on the selection of the most appropriate
benchmark interest rate, in this case the lowest
country’s interest level. For the selected interest
rates, the benchmark was the French lending rate
except in the case of housing loans with variable
rate and initial fi xation up to one year, where the
chosen benchmarks were the Dutch rates.
QUANTITY-BASED INDICATORS
Chart C24 MFI loans to non-MFIs: outstanding amounts by residency of the counterparty
(share of total loans granted by MFIs, excluding the Eurosystem; percentages)
0
1
2
3
4
5
6
0
1
2
3
4
5
6
1998 2000 2002 2004 2006 2008
other euro area Member States
rest of EU
83
84
85
86
87
88
89
90
91
92
93
83
84
85
86
87
88
89
90
91
92
93
1998 2000 2002 2004 2006 2008
domestic
Source: ECB.

ECB
Financial integration in Europe
April 2010S 18
Description
These indicators show the geographical
counterparty diversifi cation of loans granted by
euro area MFIs (excluding central banks) to the
general government, to non-MFI counterparties
resident in other euro area countries and to other
MFIs resident in non-euro area EU Member
States.5 The indicators have a quarterly
frequency.
Additional information
These indicators are built on the basis of the
national aggregated MFI balance sheet statistics
reported to the European Commission, at a
monthly and quarterly frequency.6
These balance sheet items are transmitted on
a non-consolidated basis. This means that the
positions with foreign counterparties include
those with foreign branches and subsidiaries.
INFRASTRUCTURE INDICATORS FOR RETAIL
PAYMENT SYSTEMS
Description
This indicator is a concentration ratio of retail
payment infrastructures in the euro area in
2008 and shows the number of transactions
processed by retail payment infrastructures
and the cumulative share of the processed
volumes. In 2008 there were 19 retail payment
infrastructures located in the euro area. The three
largest ones processed in total 72% of the total
market volume. The fi gure increases to 86% for
the fi ve largest infrastructures. The fi ve smallest
infrastructures processed altogether only 0.04%
of the total market transactions volume.
Additional information
This indicator is based on the information
reported in the ECB Payments Statistics.
As applicable during the reference period.7
These data cover the MFI sector excluding the Eurosystem and 8
also include data on money market funds (MMFs). It is not yet
possible to derive indicators that refer strictly to banking markets.
Consequently, as MMFs typically invest in inter-MFI deposits
and short-term securities, the indicators displaying data for these
assets are somewhat affected by the MMFs’ balance sheet items.
Chart C26 Concentration ratio of retail payment infrastructures in the euro area (2008)
86.24%
71.94%
0
2,000
4,000
6,000
8,000
10,000
12,000
14,000
1 2 3 4 5 6 7 8 9 10111213141516171819
x-axis: number of retail payment systems in the
euro area (by size)y-axis: volume of transactions (in million; left-hand scale)
0
20
40
60
80
100
y-axis: concentration ratio (in percentage; right-hand scale)
volume of non-cash transactions processed
(in million)
concentration ratio
Source: ECB.
Chart C25 MFI loans to MFIs: outstanding amounts by residency of the counterparty
(share of total loans granted by MFIs, excluding the Eurosystem; percentages)
0
10
20
30
40
50
60
0
10
20
30
40
50
60
1998 2000 2002 2004 2006 2008
domestic (right-hand scale)other euro area Member States
rest of EU
70 70
Source: ECB.

ECB
Financial integration in Europe
April 2010 S
STAT IST ICAL ANNEX
19
Description
This indicator presents, on a monthly basis,
the share of euro area SEPA Credit Transfer
(SCT) transactions as a percentage of the
total volume of all credit transfer transactions
(i.e. credit transfers in “old” format as well as
SCT) processed by the infrastructures, namely
clearing and settlement mechanisms (CSMs)
located in the euro area. The indicator does
not include “on-us” transactions (i.e. credit
transfers between accounts at the same bank) or
transactions cleared between banks bilaterally
or via correspondent banking. Nevertheless,
focusing on the transactions processed by CSMs
provides a good approximation of the SCT
usage within SEPA.
The higher the value of the indicator, the
higher the usage of the SEPA product.
A value of 100% would indicate that only SEPA
products are used and have fully replaced the
non-SEPA instruments (i.e. SEPA has been
fully implemented with regard to this particular
instrument) in the “bank-to-bank” domain, as
measured by the CSM data.
Chart C27 Credit Transfer transactions processed in SEPA format
(percentage of total transactions)
0.0
1.0
2.0
3.0
4.0
5.0
6.0
7.0
0.0
1.0
2.0
3.0
4.0
5.0
6.0
7.0
Feb.Apr.JuneAug.Oct. Dec. Dec.Feb.Apr.June Aug.Oct.2008 2009
Source: ECB.

EURO
PEAN
CEN
TRAL
BAN
K
FiN
ANCi
AL i
NTE
gRA
TiO
N i
N E
URO
PPE
APRi
L 20
10
F INANC IAL INTEGRAT ION IN EUROPEAPR I L 2010