financial indicators and major revenue sources
TRANSCRIPT
FINANCIAL INDICATORS AND MAJOR REVENUE SOURCES
INTRODUCTION
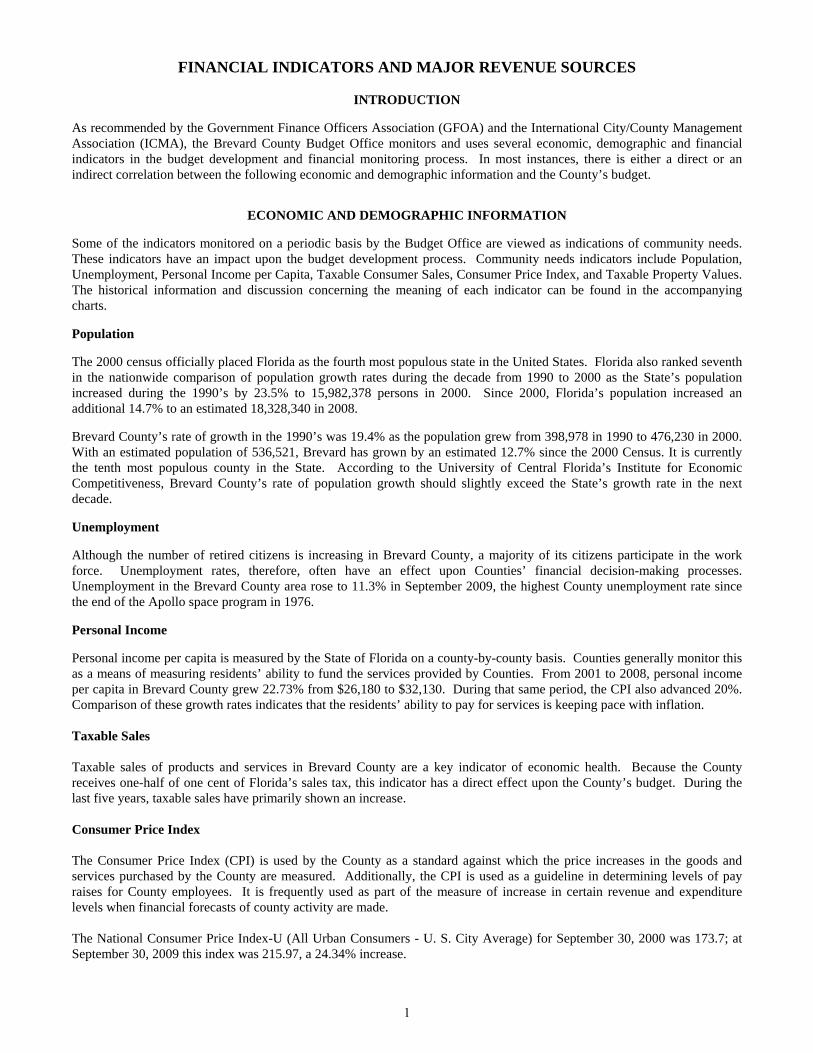
As recommended by the Government Finance Officers Association (GFOA) and the International City/County Management Association (ICMA), the Brevard County Budget Office monitors and uses several economic, demographic and financial indicators in the budget development and financial monitoring process. In most instances, there is either a direct or an indirect correlation between the following economic and demographic information and the County’s budget.
ECONOMIC AND DEMOGRAPHIC INFORMATION
Some of the indicators monitored on a periodic basis by the Budget Office are viewed as indications of community needs. These indicators have an impact upon the budget development process. Community needs indicators include Population, Unemployment, Personal Income per Capita, Taxable Consumer Sales, Consumer Price Index, and Taxable Property Values. The historical information and discussion concerning the meaning of each indicator can be found in the accompanying charts.
Population
The 2000 census officially placed Florida as the fourth most populous state in the United States. Florida also ranked seventh in the nationwide comparison of population growth rates during the decade from 1990 to 2000 as the State’s population increased during the 1990’s by 23.5% to 15,982,378 persons in 2000. Since 2000, Florida’s population increased an additional 14.7% to an estimated 18,328,340 in 2008.
Brevard County’s rate of growth in the 1990’s was 19.4% as the population grew from 398,978 in 1990 to 476,230 in 2000. With an estimated population of 536,521, Brevard has grown by an estimated 12.7% since the 2000 Census. It is currently the tenth most populous county in the State. According to the University of Central Florida’s Institute for Economic Competitiveness, Brevard County’s rate of population growth should slightly exceed the State’s growth rate in the next decade.
Unemployment
Although the number of retired citizens is increasing in Brevard County, a majority of its citizens participate in the work force. Unemployment rates, therefore, often have an effect upon Counties’ financial decision-making processes. Unemployment in the Brevard County area rose to 11.3% in September 2009, the highest County unemployment rate since the end of the Apollo space program in 1976.
Personal Income
Personal income per capita is measured by the State of Florida on a county-by-county basis. Counties generally monitor this as a means of measuring residents’ ability to fund the services provided by Counties. From 2001 to 2008, personal income per capita in Brevard County grew 22.73% from $26,180 to $32,130. During that same period, the CPI also advanced 20%. Comparison of these growth rates indicates that the residents’ ability to pay for services is keeping pace with inflation. Taxable Sales Taxable sales of products and services in Brevard County are a key indicator of economic health. Because the County receives one-half of one cent of Florida’s sales tax, this indicator has a direct effect upon the County’s budget. During the last five years, taxable sales have primarily shown an increase. Consumer Price Index The Consumer Price Index (CPI) is used by the County as a standard against which the price increases in the goods and services purchased by the County are measured. Additionally, the CPI is used as a guideline in determining levels of pay raises for County employees. It is frequently used as part of the measure of increase in certain revenue and expenditure levels when financial forecasts of county activity are made. The National Consumer Price Index-U (All Urban Consumers - U. S. City Average) for September 30, 2000 was 173.7; at September 30, 2009 this index was 215.97, a 24.34% increase.
1

FINANCIAL INDICATORS AND MAJOR REVENUE SOURCES
Taxable Property Values Taxable property values and the rate of new construction activity are key indicators monitored by the Budget Office. Property tax revenues remain the single most significant source of revenue for the general government activities of the County. Changes in property values and the resulting changes in tax rates are the primary considerations in the budget development process. Property values declined in 2009, due to the decline in the overall economy. Florida tax reform efforts also decreased the gross taxable property values due to the increased homestead exemption, Save Our Homes portability and the assessment cap on non-homesteaded properties. Other Measurements Several measurements of local activity and a few national indicators are also monitored by the Budget Office. Local airport activity, Port Canaveral activity, and NASA tour attendance are taken as indicators of local economic health. On a national basis, the year-end Dow Jones Industrial Average (DJIA) is watched. Mortgage financing and refinancing is measured on a statewide and local basis. There had been a correlation between the year-end DJIA and mortgage activity and the level of State Shared Revenue received by the County. However, this correlation has been lost with the recent legislative changes in the elements of the State Shared Revenue format.
FINANCIAL INDICATORS Revenue and Expenditure Indicators The Budget Office examines a number of financial indicators related to the financial condition of the County as reported in its Comprehensive Annual Financial Report annually. These indicators include Revenues per Capita, General-Countywide Property Tax Revenues, Intergovernmental Revenues, Expenditures per Capita, Fund Balances, Number of Full-Time Employees, and Long-Term Debt. These “indicators” are presented in the accompanying charts. Most of the indicators also present per capita information and adjustments for inflation so that the reader may see the appropriate trends adjusted for inflation’s effect. Fund Balance The County’s Fund Balance is used to provide governmental agencies with funds necessary to meet their cash flow requirements at the beginning of each fiscal year. The County’s Fund Balance also includes funds which have been brought forward from prior year capital projects, as well as funds retained because of the County’s debt reserve requirements. The General Fund Balance on October 1, 2008 was $49,565,902, or 18.71% of General Fund operating revenues at the end of FY 2006-2007. The Government Finance Officers' Association (GFOA) recommends that governments maintain unreserved fund balance in the General Fund of no less than five to 15 percent of General Fund operating revenues. While rating agencies and creditors have provided minimum guidelines for fund balance for Florida governments, a variety of factors must be considered when evaluating the adequacy of fund balance in the General Fund. Some of these considerations are: the timing of revenue collections, transfers to Charter Officers, the limited ability to increase property taxes, and investment earnings of Fund Balance.
CONCLUSION
Brevard County has been significantly impacted by the downturn in the national economy, leaving no facet of the market untouched. While many indicators show signs of stabilization over the last several months, it is anticipated that Brevard County will not see sustained growth until at least 2012. Among the local concerns is the reduction-in-force occurring at the Kennedy Space Center as the shuttle program winds down. While the impact is not expected to be as significant as the termination of the Apollo program in the 1970’s, it is anticipated that the county’s unemployment rate could reach 13% in 2011 as a result. Nevertheless, Brevard County ranks high in recovery trends when compared to the other major Florida metropolitan areas.
2

x x
x x
Formula: Population
Source: U.S. Census Bureau
Analysis:
Population change can directly affect governmental services. A sudden increase in population can create immediate pressuresfor new capital outlay and higher levels of service. Brevard County's population has been steadily increasing during theperiods presented here.
FINANCIAL INDICATORS AND MAJOR REVENUE SOURCES
485,966 494,593 503,436516,503 526,805 531,959 536,161 536,521
0
100,000
200,000
300,000
400,000
500,000
600,000
2001 2002 2003 2004 2005 2006 2007 2008
Population of Brevard County, Florida
3

x x
x x
Formula: Local, State And National Unemployment Rates As Of September 2009
Source: State Of Florida Department Of Labor And Security
Analysis:
Unemployment rates are a traditional indicator of the relative economic health of the County. Consumers who lose their jobscurtail spending in response to the loss of income, while others who remain employed may curtail spending in anticipation offuture job losses. As a result, even small increases in unemployment, if accompanied by a loss of consumer confidence, canhave a major impact on sales tax-dependent revenue sources. Changes in unemployment affect all of the revenue sourcesassociated with the purchase of goods and services: state revenue sharing, local government local half-cent sales tax, localoption gas tax, constitutional gas tax, county gas tax and local option resort tax.
FINANCIAL INDICATORS AND MAJOR REVENUE SOURCES
Brevard County’s unemployment rate decreased from 2003 until 2006, remaining below state and national levels. Theincrease in the 2007 through 2009 unemployment rates on the local, state, and national levels reflect losses in occupationalfields tied to the declining housing market and overall macroeconomic conditions.
Unemployment RatesLocal, State, and National
0
2
4
6
8
10
12
Local 5.4 4.9 4.2 3.4 3.3 4.5 6 11.1
State 5.5 5.4 4.5 3.7 3.4 4.3 6.4 11.2
National 5.8 5.8 5.4 4.8 4.4 4.5 5.7 9.5
2002 2003 2004 2005 2006 2007 2008 2009
4

x x
x x
Formula: Personal Income Divided By Population
Source: University Of Florida Bureau Of Economic And Business Research Brevard County Budget Office
Analysis:
Brevard County's personal income per capita trend reflects significant growth from 2001 to 2008.
Personal income per capita is one measure of a community's ability to pay taxes: the higher the personal income per capita, themore property tax and sales tax a community can generate. Credit rating firms use per capita income as an important measureof a local government's ability to repay debt. They compare personal income per capita with the government expenditures percapita to determine whether the community has the capacity for growth in expenditures. If not, it is an indicator that acommunity may develop an inability to meet future financial obligations.
FINANCIAL INDICATORS AND MAJOR REVENUE SOURCES
Personal Income Per Capita
$0
$5,000
$10,000
$15,000
$20,000
$25,000
$30,000
$35,000
Personal Income Per Capita $26,180 $26,577 $27,194 $27,884 $29,190 $29,793 $30,615 $32,130
2001 2002 2003 2004 2005 2006 2007 2008
5

x x
x x
Formula: Property Valuations For The Fiscal Years Ending As Indicated
Source: Brevard County Property Appraiser
Analysis:
Property values reflect the overall strength of the County's real estate market. This market, in turn, reflects the strength of theCounty as a whole. When the economy is growing, new residents and businesses are attracted to the County, increasing theprices of existing properties and encouraging the development of undeveloped land. Property values may also indicatestrength in the construction industry, which in itself, contributes to the local economy.
FINANCIAL INDICATORS AND MAJOR REVENUE SOURCES
The rate of growth in property values began to become unstable in 2003. Significant increases were experienced from 2003through 2007, followed by a sharp decrease associated with the nationwide housing and real estate market decline in 2008 and2009. Smaller decreases or even a slight increase are anticipated in the next one to two years.
Percentage Change in Property Value
-15%
-10%
-5%
0%
5%
10%
15%
20%
25%
30%
% Change 7.80% 7.50% 11.84% 14.68% 22.78% 26.81% -2.77% -12.08%
2002 2003 2004 2005 2006 2007 2008 2009
6

x x
x x
Formula: General Fund Revenues Divided By PopulationGeneral Fund Revenues Adjusted For Inflation
Source: Brevard County Comprehensive Annual Financial Reports, 2001 through 2008University Of Florida Bureau Of Economic And Business Research United States Department of Labor; Consumer Price Index for All Urban Consumers (CPI-U)
Analysis:
As the County's population grows, it is anticipated that revenues and the needs for services will increase in a directrelationship. Therefore, the level of revenues per capita should at least remain constant and, at a minimum, equal expendituresper capita. If revenues per capita decrease, or become lower than expenditures per capita, it may hamper the County's ability to maintain the existing level of services unless new sources of revenues, or ways of trimming expenses, can be found.
FINANCIAL INDICATORS AND MAJOR REVENUE SOURCES
The County's revenue per capita, not adjusted for inflation, has increased 59.9%, and inflation has increased 23.5% for theperiods analyzed. The County's expenditures per capita, not adjusted for inflation, have increased by 46.3%. During the sameperiod, the County’s population has grown by 10.4%.
General Fund Revenues Per Capita(Not-Adjusted and Adjusted for inflation)
$0
$100
$200
$300
$400
$500
$600
Not Adjusted $309 $330 $354 $369 $441 $458 $522 $494
Adjusted $217 $226 $235 $235 $260 $261 $283 $243
2001 2002 2003 2004 2005 2006 2007 2008
7

x x
x x
Formula: General Fund Expenditures Divided By PopulationGeneral Fund Expenditures Adjusted For Inflation
Source: Brevard County Comprehensive Annual Financial Reports, 2001 through 2008University Of Florida Bureau Of Economic And Business Research United States Department of Labor; Consumer Price Index for All Urban Consumers (CPI-U)
Analysis:
Changes in expenditures per capita reflect changes in expenditures relative to changes in population. Increasing expenditurescan indicate that the cost of providing services is outstripping the community's ability to pay, especially if spending isincreasing faster than the residents’ collective personal income. If spending is increasing faster than can be accounted for byinflation or the implementation of new programs, it may indicate declining productivity; that is, the government is spendingmore funds to support the same level of services.
FINANCIAL INDICATORS AND MAJOR REVENUE SOURCES
The trend in Brevard County expenditures has been for small increases totaling 46.3% from 2001 to 2008, while inflationincreased 23.5% during the same time period. This expenditure pattern is viewed as successful, considering inflation and theunfunded mandates that the County has been required to absorb. From 2001 through 2008, General Fund Revenues Per Capitahave maintained a level that is greater than or equal to the General Fund Expenditures Per Capita.
General Fund Expenditures per Capita(Not-Adjusted and Adjusted for inflation)
$-
$50
$100
$150
$200
$250
$300
$350
$400
$450
$500
Not Adjusted $298 $328 $354 $353 $396 $389 $423 $436
Adjusted $209 $225 $235 $225 $234 $221 $229 $215
2001 2002 2003 2004 2005 2006 2007 2008
8

x x
x x
Formula: General-Countywide Property Tax Revenues
Source: Brevard County Comprehensive Annual Financial Reports, 2001 through 2009Brevard County Budget OfficeUnited States Department of Labor; Consumer Price Index for All Urban Consumers (CPI-U)
Analysis:
The 2007 increase in property tax revenues is primarily a result of a change in the revenue and billing methodologies for theFire Service and Emergency Medical Service (EMS). Whereas the Fire Service was formerly funded primarily from propertytaxes, this service is now funded primarily from a non-ad valorem assessment. Conversely, whereas EMS was formerly fundedin large part from a non-ad valorem assessment, this services is now funded in large part from property taxes via the generalcountywide property tax.
Property tax revenues are considered separately from other revenues because Brevard County relies heavily on this revenuesource. Approximately 73.6% of the General Fund’s operating revenues are derived from a General-Countywide property tax.A decline or a diminished growth rate in taxable property can result from a number of causes. First, it may reflect an overalldecline in property values. Second, it may result from the transfer of taxable property to organizations that are exempt fromproperty taxes. Third, it may result from decline in new development.
FINANCIAL INDICATORS AND MAJOR REVENUE SOURCES
As indicated in this presentation, from 2003 through 2006, despite repeated reductions in the General-Countywide millage, theCounty's property tax revenues, adjusted for inflation, reflect consistent increases associated primarily with increases intaxable values.
It is noteworthy that increases in taxable property values from new construction result in additional revenues. Increases intaxable values from existing properties do not generate additional revenue, without advertising a tax increase, due to themillage rolled back procedure required by Florida’s “Truth in Millage” Law.
General-Countywide Property Tax RevenuesEffects of inflation on the County's Property Tax Revenues(Not-Adjusted and Adjusted for inflation)In Millions
$-
$10
$20
$30
$40
$50
$60
$70
$80
$90
$100
$110
$120
$130
$140
$150
$160
$170
Not Adjusted $67.1 $74.7 $84.7 $94.2 $100.3 $108.1 $145.6 $152.07 $146.14
Adjusted $47.0 $51.2 $56.1 $60.0 $59.2 $61.5 $78.9 $74.9 $70.1
2001 2002 2003 2004 2005 2006 2007 2008 2009
9
x x
x x
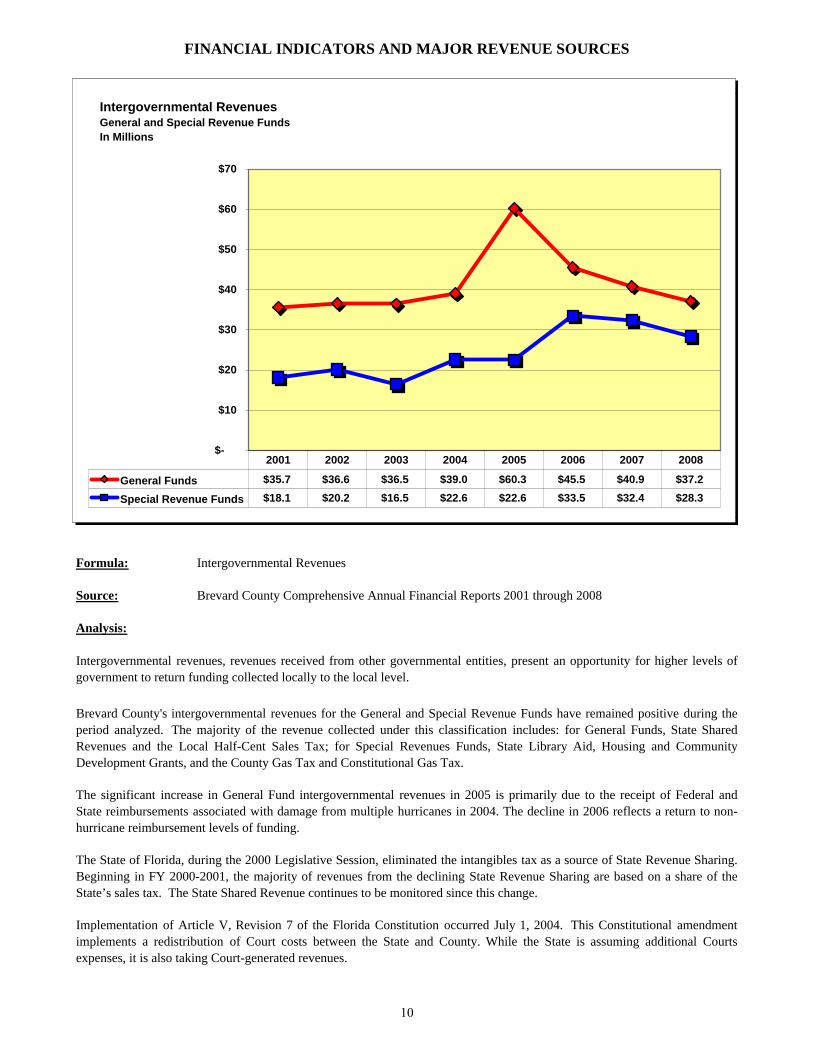
Formula: Intergovernmental Revenues
Source: Brevard County Comprehensive Annual Financial Reports 2001 through 2008
Analysis:
Implementation of Article V, Revision 7 of the Florida Constitution occurred July 1, 2004. This Constitutional amendmentimplements a redistribution of Court costs between the State and County. While the State is assuming additional Courtsexpenses, it is also taking Court-generated revenues.
Intergovernmental revenues, revenues received from other governmental entities, present an opportunity for higher levels ofgovernment to return funding collected locally to the local level.
FINANCIAL INDICATORS AND MAJOR REVENUE SOURCES
Brevard County's intergovernmental revenues for the General and Special Revenue Funds have remained positive during theperiod analyzed. The majority of the revenue collected under this classification includes: for General Funds, State SharedRevenues and the Local Half-Cent Sales Tax; for Special Revenues Funds, State Library Aid, Housing and CommunityDevelopment Grants, and the County Gas Tax and Constitutional Gas Tax.
The State of Florida, during the 2000 Legislative Session, eliminated the intangibles tax as a source of State Revenue Sharing.Beginning in FY 2000-2001, the majority of revenues from the declining State Revenue Sharing are based on a share of theState’s sales tax. The State Shared Revenue continues to be monitored since this change.
The significant increase in General Fund intergovernmental revenues in 2005 is primarily due to the receipt of Federal andState reimbursements associated with damage from multiple hurricanes in 2004. The decline in 2006 reflects a return to non-hurricane reimbursement levels of funding.
Intergovernmental RevenuesGeneral and Special Revenue FundsIn Millions
$-
$10
$20
$30
$40
$50
$60
$70
General Funds $35.7 $36.6 $36.5 $39.0 $60.3 $45.5 $40.9 $37.2
Special Revenue Funds $18.1 $20.2 $16.5 $22.6 $22.6 $33.5 $32.4 $28.3
2001 2002 2003 2004 2005 2006 2007 2008
10
x x
x x
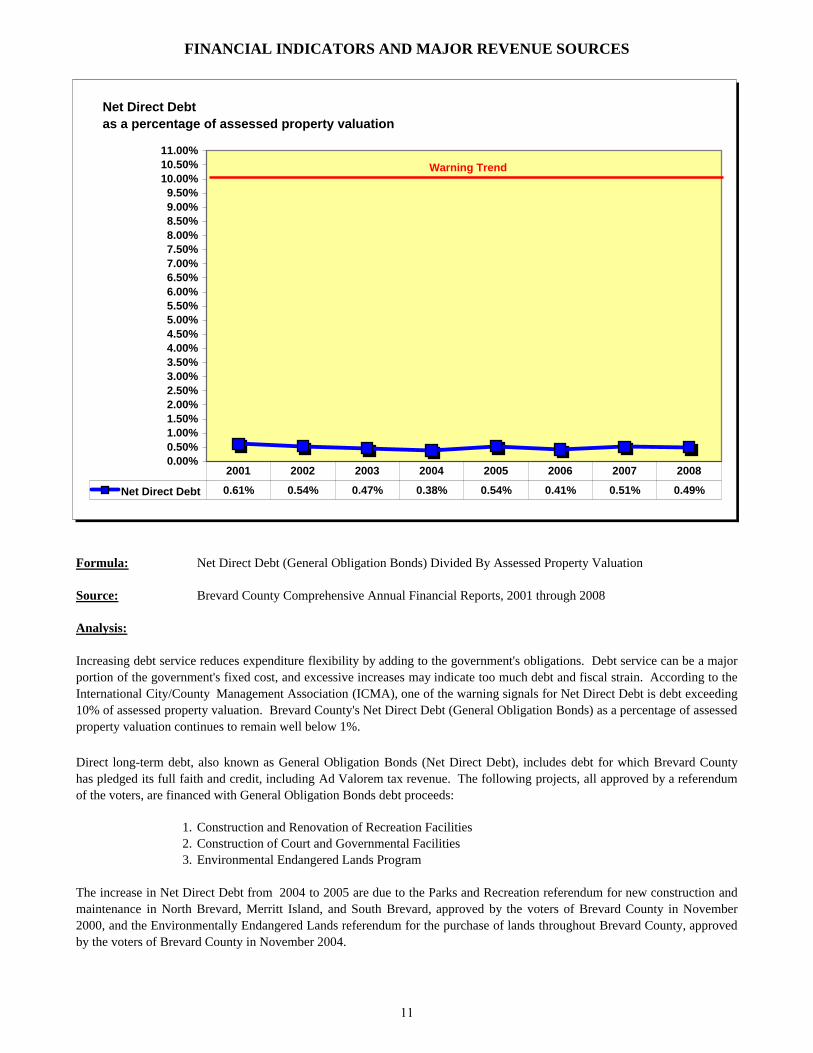
Formula: Net Direct Debt (General Obligation Bonds) Divided By Assessed Property Valuation
Source: Brevard County Comprehensive Annual Financial Reports, 2001 through 2008
Analysis:
1. Construction and Renovation of Recreation Facilities2. Construction of Court and Governmental Facilities3. Environmental Endangered Lands Program
Direct long-term debt, also known as General Obligation Bonds (Net Direct Debt), includes debt for which Brevard Countyhas pledged its full faith and credit, including Ad Valorem tax revenue. The following projects, all approved by a referendumof the voters, are financed with General Obligation Bonds debt proceeds:
FINANCIAL INDICATORS AND MAJOR REVENUE SOURCES
The increase in Net Direct Debt from 2004 to 2005 are due to the Parks and Recreation referendum for new construction andmaintenance in North Brevard, Merritt Island, and South Brevard, approved by the voters of Brevard County in November2000, and the Environmentally Endangered Lands referendum for the purchase of lands throughout Brevard County, approvedby the voters of Brevard County in November 2004.
Increasing debt service reduces expenditure flexibility by adding to the government's obligations. Debt service can be a majorportion of the government's fixed cost, and excessive increases may indicate too much debt and fiscal strain. According to theInternational City/County Management Association (ICMA), one of the warning signals for Net Direct Debt is debt exceeding10% of assessed property valuation. Brevard County's Net Direct Debt (General Obligation Bonds) as a percentage of assessedproperty valuation continues to remain well below 1%.
Net Direct Debt as a percentage of assessed property valuation
0.00%0.50%1.00%1.50%2.00%2.50%3.00%3.50%4.00%4.50%5.00%5.50%6.00%6.50%7.00%7.50%8.00%8.50%9.00%9.50%
10.00%10.50%11.00%
Net Direct Debt 0.61% 0.54% 0.47% 0.38% 0.54% 0.41% 0.51% 0.49%
2001 2002 2003 2004 2005 2006 2007 2008
Warning Trend
11

x x
x x
Formula: Fund Balance As A Percentage Of Operating Revenue
Source: Brevard County Comprehensive Annual Financial Reports, 2001 through 2008
Analysis:
The unreserved fund balance for the General Fund was $49,565,902 on October 1, 2008, or 18.71% of General Fund operatingrevenues. The Government Finance Officers' Association (GFOA) recommends that governments maintain unreserved fundbalance in the General Fund of no less than five to 15 percent of General Fund operating revenues. The County realizes theimportance of maintaining the fund balance within recommended guidelines and has exceeded last year's goal of 10% ofGeneral Fund operating revenues. This is to be reviewed annually as the County will strive to maintain a strong unreservedfund balance. A major portion of the unreserved fund balance is expended early in the subsequent fiscal year before advalorem tax revenue collections begin.
FINANCIAL INDICATORS AND MAJOR REVENUE SOURCES
The aggregate fund balance of Special Revenue funds will fluctuate within a wider range because a number of the moresignificant Special Revenue funds involve major construction projects. As the activity level of these projects increases ordecreases, so will fund balances.
Fund BalancesGeneral and Special Revenue FundsIn Millions
$0
$20
$40
$60
$80
$100
$120
$140
$160
$180
$200
$220
$240
General Fund $19.9 $13.1 $9.3 $10.2 $31.7 $45.4 $49.7 $49.6
Special Revenue Fund $84.6 $90.5 $91.3 $97.9 $119.0 $186.9 $232.6 $223.7
2001 2002 2003 2004 2005 2006 2007 2008
12

x
x
Formula: Number Of Employees Divided By Population
Source: Number Of Employees As Of October 1, Including:Board AgenciesClerk of Courts' OfficeSheriff's OfficeSupervisor of Elections OfficeCourt Operations
Analysis:
FINANCIAL INDICATORS AND MAJOR REVENUE SOURCES
However, during this same period, the County has reduced positions in other areas such as general governmental services,administrative and managerial positions, and internal service agencies. The decrease from 2005 to 2006 represents decreasesin positions, including layoffs of existing employees, associated with tax rate reductions.
This trend also analyzed the actual number of employees working for Brevard County on October 1 as compared to thepopulation of the County.
During the period analyzed, increases have been experienced primarily in the Sheriff's Office and the Parks and RecreationDepartment.
Because employee costs are a major portion of the total cost of County government, analyzing changes in the number ofemployees per 1,000 population is a good way to track changes in expenditures. An increase in employees per 1,000population might indicate that expenditures are rising, the government may be becoming labor intensive, or personnelproductivity is declining.
Employees Per 1,000 Population
0.00
1.00
2.00
3.00
4.00
5.00
6.00
7.00
8.00
9.00
10.00
Employees 7.19 7.47 7.34 7.27 6.95
2004 2005 2006 2007 2008
Number Of County Residents
2004 516,503 2005 526,805 2006 531,959 2007 536,161 2008 536,521
13

FY 2003-2004 FY 2004-2005 FY 2005-2006 FY 2006-2007 FY 2007-2008 FY 2008-2009 FY 2009-2010
Actual Actual Actual Actual Actual Final* Adopted
Revenue Source Collections Collections Collections Collections Collections Budget Budget
Property Taxes $176,269,157 $188,755,485 $210,856,963 $240,293,242 $237,663,072 $225,269,214 $195,643,478
State Shared
Revenues $9,128,343 $9,707,430 $10,421,063 $9,942,262 $9,038,034 $8,740,967 $8,435,284
Local Half-Cent
Sales Tax $21,694,253 $24,157,449 $24,622,156 $22,644,094 $20,873,214 $19,288,573 $17,133,284
Franchise Fees
& Comm Svc Tax $10,913,390 $19,743,734 $22,340,968 $25,092,674 $25,023,434 $25,286,861 $24,657,098
Building Permits $3,459,209 $4,034,545 $4,199,350 $3,100,178 $2,472,270 $2,308,059 $1,598,993
County Gas Tax $2,505,663 $2,673,396 $2,943,189 $2,888,252 $2,745,206 $2,562,560 $2,660,000
Constitutional
Gas Tax $5,006,395 $5,337,812 $5,187,408 $5,679,061 $5,449,799 $5,597,734 $5,342,296
Local Option
Gas Tax $6,950,043 $6,473,047 $6,924,336 $7,672,914 $7,177,345 $6,935,000 $6,935,000
Tourist Development
Tax $5,174,302 $6,263,603 $8,001,228 $8,721,853 $7,674,644 $7,308,984 $7,308,984
Water/Wastewater
Fees $23,926,402 $24,089,534 $24,110,981 $26,452,394 $27,723,599 $29,740,377 $29,667,696
Solid Waste
Disposal Fees $20,391,457 $21,322,409 $21,757,077 $22,639,484 $23,555,944 $23,708,643 $23,010,119
Total Revenue $285,418,614 $312,558,444 $341,364,719 $375,126,408 $369,396,561 $356,746,972 $322,392,232
* Unaudited
Major sources of information in the projection of County revenues (such as the Half-Cent Sales Tax distribution, State SharedRevenues, and various gas taxes) are received from the Florida Legislative Council on Intergovernmental Relations (LCIR), apart of the Florida Legislature’s Division of Economic and Demographic Research, and the Office of Tax Research (OTR),Florida Department of Revenue. These offices provide information concerning those revenues which are collected anddistributed by the State .
Revenue forecasts are developed by the Budget Office through the review of historical trends of the various revenue sources,input from the operating departments responsible for collecting the revenue, the County Finance Department, and current orestimated economic information provided by Federal, State, local and private sources.
FINANCIAL INDICATORS AND MAJOR REVENUE SOURCES
The operating revenue sources whose histories are summarized below and on the following pages represent the major sourcesof revenues for Brevard County. These revenues, in the aggregate, represent approximately 55.5% of the County’s estimatedtotal operating revenues for FY 2009-2010
This presentation outlines the procedures followed by the Budget Office in forecasting various key revenue sources during thebudget development process.
Major Revenue Sources
14

x x
Property tax collections in FY 2008-2009 totaled $225.3 million. Property tax collections for FY 2009-2010 are estimated at$195.6 million; this represents a decrease of 29.7 million, or 13.2% from the County’s FY 2008-2009 collections, primarilydue to the decrease in property valuations and the County maintaining the same millage rate as the previous fiscal year, perdirection by the Board of County Commissioners.
FINANCIAL INDICATORS AND MAJOR REVENUE SOURCES
Property taxes, which are more specifically called ad valorem taxes, are based on the value of the property. The County leviescountywide property taxes to support services provided to all county property owners regardless of whether the property islocated in a municipality or not. These services include, but are not limited to, the Sheriff’s Office, Supervisor of Elections’Office, Property Appraiser’s Office, Tax Collector’s Office, Clerk of Courts and Court Services, County Commission, CountyManager, County Attorney, Parks and Recreation, Agriculture and Extension Services, Medicaid, Family and ChildrenServices, Veterans Services, Country Acres, Animal Protection Services, Library Services, Probation, Pretrial Diversion andRelease, Dispute Resolution, Alternative Sentencing Services, Medical Examiner, Ocean Lifeguards, Road and BridgeMaintenance, Detention Facility, Mosquito Control, and Emergency Management.
The County also levies separate ad valorem taxes on property in various geographic areas of the County for specific benefitsfunded by these taxes to those residents. These Municipal Services Taxing Units (MSTU’s), or special districts, includeservices for Law Enforcement, Fire Control, District #1 Recreation, Recreation District #4, the Titusville-Cocoa AirportAuthority and seven Road and Bridge MSTU's. Additionally, eight operating and debt service levies for the Port StJohn/Canaveral Groves Recreation Facilities MSTU, the North and South Brevard Recreation Special Districts and the MerrittIsland Recreation MSTU were voter-approved in the districts affected. The County also levies four operating and debt servicevoter-approved property taxes countywide in support of the Environmentally Endangered Lands program.
Property Taxes
$176.3$188.8
$210.9
$240.3 $237.7$225.3
$195.6
$0
$20
$40
$60
$80
$100
$120
$140
$160
$180
$200
$220
$240
$260
FY 2003-2004 FY-2004-2005 FY 2005-2006 FY 2006-2007 FY 2007-2008 FY 2008-2009 FY 2009-2010
Property TaxesBrevard County, FloridaIn Millions
15
x x
FINANCIAL INDICATORS AND MAJOR REVENUE SOURCES
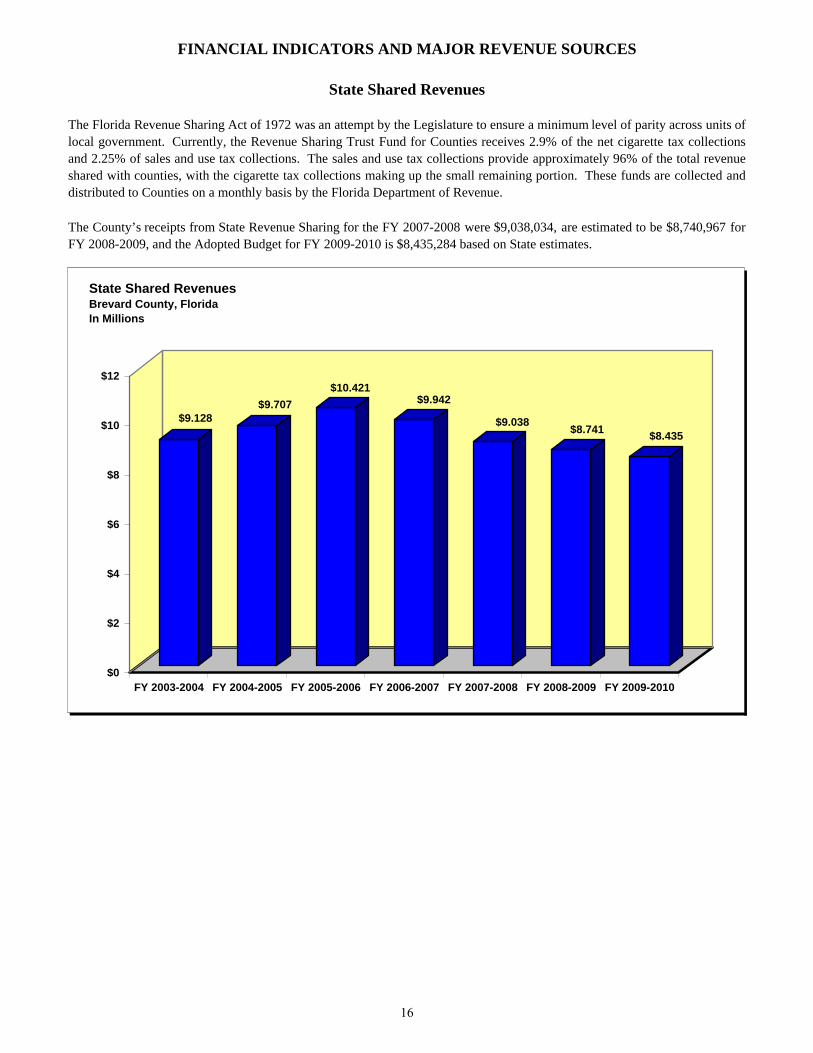
The Florida Revenue Sharing Act of 1972 was an attempt by the Legislature to ensure a minimum level of parity across units oflocal government. Currently, the Revenue Sharing Trust Fund for Counties receives 2.9% of the net cigarette tax collectionsand 2.25% of sales and use tax collections. The sales and use tax collections provide approximately 96% of the total revenueshared with counties, with the cigarette tax collections making up the small remaining portion. These funds are collected anddistributed to Counties on a monthly basis by the Florida Department of Revenue.
The County’s receipts from State Revenue Sharing for the FY 2007-2008 were $9,038,034, are estimated to be $8,740,967 forFY 2008-2009, and the Adopted Budget for FY 2009-2010 is $8,435,284 based on State estimates.
State Shared Revenues
$9.128$9.707
$10.421$9.942
$9.038$8.741
$8.435
$0
$2
$4
$6
$8
$10
$12
FY 2003-2004 FY 2004-2005 FY 2005-2006 FY 2006-2007 FY 2007-2008 FY 2008-2009 FY 2009-2010
State Shared RevenuesBrevard County, FloridaIn Millions
16

x x
FINANCIAL INDICATORS AND MAJOR REVENUE SOURCES
In October, 1982 Brevard County began receiving a distribution of funds equal to one-half of the fifth cent sales tax remitted tothe State by local retail sales establishments. These funds are collected and distributed on a monthly basis by the FloridaDepartment of Revenue. Increases in the local government half-cent sales tax are sensitive to increases in the County’spopulation and the Consumer Price Index (CPI).
During FY 2007-2008, half-cent sales tax receipts were $20,873,214. Estimates of the County’s FY 2008-2009 and FY 2009-2010 share of the half-cent sales tax revenues are $19,288,573 and $17,133,284, respectively.
Local Half-Cent Sales Tax
$21.694
$24.157 $24.622
$22.644$20.873
$19.289
$17.133
$0
$2
$4
$6
$8
$10
$12
$14
$16
$18
$20
$22
$24
$26
FY 2003-2004 FY 2004-2005 FY 2005-2006 FY 2006-2007 FY 2007-2008 FY 2008-2009 FY 2009-2010
Local Half-Cent Sales TaxBrevard County, FloridaIn Millions
17

x x
Franchise fee revenues realized for FY 2007-2008 were $25,023,434 and are estimated to be $25,286,861 for FY 2008-2009.The Adopted Budget is $24,657,098 for FY 2009-2010, a decrease from the previous year due to lower power consumption bythe customers of FPL.
FINANCIAL INDICATORS AND MAJOR REVENUE SOURCES
Franchise fees are charged by Counties for the use of publicly owned rights-of-way for power and telecommunicationscompanies to construct, operate, and maintain power, telephone and cable television transmission lines or related componentsand for the sale of electric power and cable television services in the unincorporated areas.
Franchise Fees and Communications Services Tax
The franchise fees charged to Florida Power and Light (FPL) are levied in accordance with a 30-year franchise agreement.Franchise fees are charged at a rate equal to 5.9% of the gross charges for the sale of electric power.
On October 1 2001, the State Communications Services Tax became effective. Brevard County no longer collects the CableTelevision franchise fees; the Department of Revenue collects the tax and returns a percentage back to the County, togetherwith telecommunications companies, and set the rate at 1.66% through August 2004. Beginning January 2005 the rate was setat 5.22%, comparable with surrounding counties and municipalities.
$10.913
$19.744
$22.341
$25.093 $25.023
$25.287
$24.657
$0
$5
$10
$15
$20
$25
$30
FY 2003-2004 FY-2004-2005 FY 2005-2006 FY 2006-2007 FY 2007-2008 FY 2008-2009 FY 2009-2010
Franchise Fees and Communications Services TaxBrevard County, FloridaIn Millions
18

Building permit revenue in FY 2007-2008 was $2,472,270, and for FY 2008-2009 revenue is estimated at $2,308,059; thisdecrease is associated with the continued decline in the housing and real estate markets. The Adopted Budget of $1,598,993 inFY 2009-2010 reflects an estimate of further decreases in building construction.
FINANCIAL INDICATORS AND MAJOR REVENUE SOURCES
Building permit revenue is derived from fees paid by developers of residential and commercial property. These fees areintended to offset the cost of permit review and inspections ensure that construction meets local, State, and Federal buildingcode requirements. The County collects permit fees only for development occurring in the unincorporated areas of BrevardCounty.
Building permit revenue is sensitive to the population increase and other economic factors. This revenue is also sensitive toinflation in that all permit fees are based upon the value of the work being performed except single-family dwellings, whosepermit fees are based on a square footage computation. Thus, while permit fees are somewhat sensitive to inflation (because ofconstruction costs), the level of sensitivity is difficult to measure. Other economic factors such as interest and employmentrates have a greater impact upon this revenue source.
Building Permit Fees
$3.459
$4.035$4.199
$3.100
$2.472$2.308
$1.599
$0
$1
$2
$3
$4
FY 2003-2004 FY-2004-2005 FY 2005-2006 FY 2006-2007 FY 2007-2008 FY 2008-2009 FY 2009-2010
Building Permit FeesBrevard County, FloridaIn Millions
19
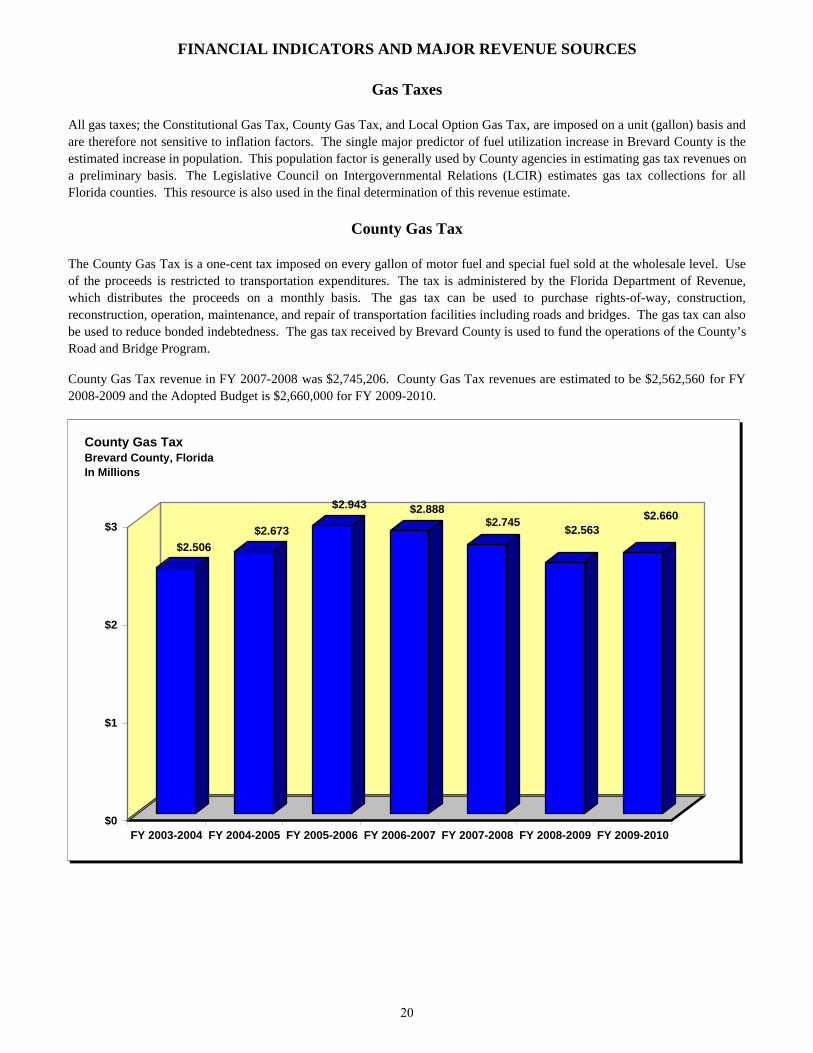
County Gas Tax revenue in FY 2007-2008 was $2,745,206. County Gas Tax revenues are estimated to be $2,562,560 for FY2008-2009 and the Adopted Budget is $2,660,000 for FY 2009-2010.
FINANCIAL INDICATORS AND MAJOR REVENUE SOURCES
All gas taxes; the Constitutional Gas Tax, County Gas Tax, and Local Option Gas Tax, are imposed on a unit (gallon) basis andare therefore not sensitive to inflation factors. The single major predictor of fuel utilization increase in Brevard County is theestimated increase in population. This population factor is generally used by County agencies in estimating gas tax revenues on a preliminary basis. The Legislative Council on Intergovernmental Relations (LCIR) estimates gas tax collections for allFlorida counties. This resource is also used in the final determination of this revenue estimate.
The County Gas Tax is a one-cent tax imposed on every gallon of motor fuel and special fuel sold at the wholesale level. Useof the proceeds is restricted to transportation expenditures. The tax is administered by the Florida Department of Revenue,which distributes the proceeds on a monthly basis. The gas tax can be used to purchase rights-of-way, construction,reconstruction, operation, maintenance, and repair of transportation facilities including roads and bridges. The gas tax can alsobe used to reduce bonded indebtedness. The gas tax received by Brevard County is used to fund the operations of the County’sRoad and Bridge Program.
Gas Taxes
County Gas Tax
$2.506
$2.673
$2.943 $2.888$2.745
$2.563$2.660
$0
$1
$2
$3
FY 2003-2004 FY 2004-2005 FY 2005-2006 FY 2006-2007 FY 2007-2008 FY 2008-2009 FY 2009-2010
County Gas TaxBrevard County, FloridaIn Millions
20

x x
Constitutional Gas Tax revenues in FY 2007-2008 were $5,449,799. The Constitutional Gas Tax revenues are estimated at$5,597,734 for FY 2008-2009 and the Adopted Budget is $5,342,296 for FY 2009-2010.
FINANCIAL INDICATORS AND MAJOR REVENUE SOURCES
The Constitutional Gas Tax is a two-cent tax imposed on every gallon of motor fuel and special fuel sold at the wholesale level.Use of the proceeds is restricted to the acquisition, construction, and maintenance of roads. The tax is administered by theFlorida Department of Revenue and distributed by the State Board of Administration (SBA).
The distribution formula is comprised of: the ratio of county area to state area; ratio of county population to state population;and the ratio of total Constitutional Gas Tax collected in each county to the total collected statewide during the previous fiscalyear. This distribution is divided into an 80% portion and a 20% portion. The SBA uses the 80% portion to fund debt servicerequirements of bond issues pledging Constitutional Gas Tax receipts. If there is a surplus from the 80% portion, it isdistributed to the various counties on a monthly basis. If the SBA determines that the 80% portion is not sufficient to coverrequired debt service, it will withhold the difference from the 20% portion. Otherwise, the 20% portion is distributed directlyto the counties. Brevard’s 80% and 20% portions have been pledged for debt service payments on the County’s ConstitutionalFuel Tax Revenue Bonds, Series 2000 and Series 2005. The debt service for both bonds approximates $3,120,788 annually.These tax funds and the related $39,735,000 for the Series 2000 and $25,525,000 for Series 2005 original bond sale proceedsare used for road improvements.
Constitutional Gas Tax
$5.006$5.338
$5.187
$5.679$5.450 $5.598
$5.342
$0
$1
$2
$3
$4
$5
$6
FY 2003-2004 FY 2004-2005 FY 2005-2006 FY 2006-2007 FY 2007-2008 FY 2008-2009 FY 2009-2010
Constitutional Gas TaxBrevard County, FloridaIn Millions
21

x x
FINANCIAL INDICATORS AND MAJOR REVENUE SOURCES
The Local Option Gas Tax is a six-cent tax imposed on every gallon of motor fuel and special fuel sold at the retail level. Useof the proceeds is restricted to transportation expenditures. The tax is administered by the Florida Department of Revenue,which distributes the proceeds monthly to the County and the various municipalities within the County based on an interlocalagreement.
Local Option Gas Tax revenues in FY 2007-2008 were $7,177,345. The Local Option Gas Tax revenues are estimated at$6,935,000 for FY 2008-2009 and the Adopted Budget is $6,935,000 for FY 2009-2010.
Local Option Gas Tax
$6.950
$6.473
$6.924
$7.673
$7.177$6.935 $6.935
$0
$1
$2
$3
$4
$5
$6
$7
$8
FY 2003-2004 FY 2004-2005 FY 2005-2006 FY 2006-2007 FY 2007-2008 FY 2008-2009 FY 2009-2010
Local Option Gas TaxBrevard County, FloridaIn Millions
22
x x
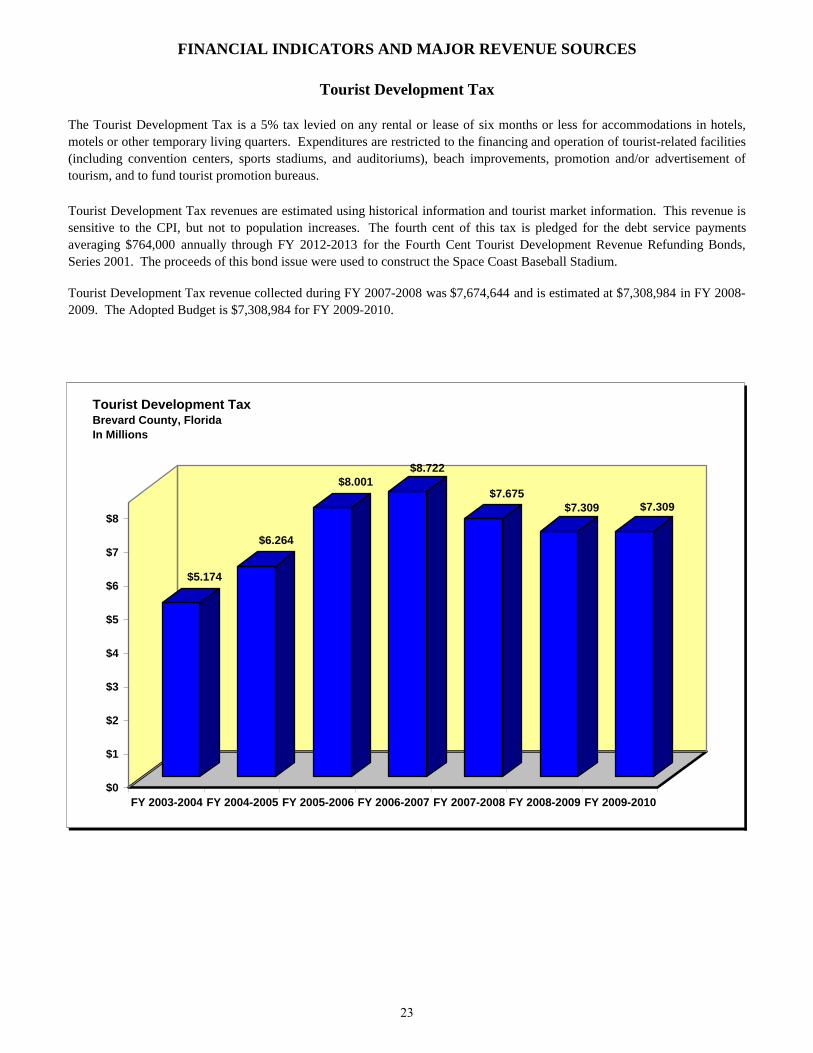
Tourist Development Tax revenue collected during FY 2007-2008 was $7,674,644 and is estimated at $7,308,984 in FY 2008-2009. The Adopted Budget is $7,308,984 for FY 2009-2010.
FINANCIAL INDICATORS AND MAJOR REVENUE SOURCES
The Tourist Development Tax is a 5% tax levied on any rental or lease of six months or less for accommodations in hotels,motels or other temporary living quarters. Expenditures are restricted to the financing and operation of tourist-related facilities(including convention centers, sports stadiums, and auditoriums), beach improvements, promotion and/or advertisement oftourism, and to fund tourist promotion bureaus.
Tourist Development Tax revenues are estimated using historical information and tourist market information. This revenue issensitive to the CPI, but not to population increases. The fourth cent of this tax is pledged for the debt service paymentsaveraging $764,000 annually through FY 2012-2013 for the Fourth Cent Tourist Development Revenue Refunding Bonds,Series 2001. The proceeds of this bond issue were used to construct the Space Coast Baseball Stadium.
Tourist Development Tax
$5.174
$6.264
$8.001$8.722
$7.675$7.309 $7.309
$0
$1
$2
$3
$4
$5
$6
$7
$8
FY 2003-2004 FY 2004-2005 FY 2005-2006 FY 2006-2007 FY 2007-2008 FY 2008-2009 FY 2009-2010
Tourist Development TaxBrevard County, FloridaIn Millions
23

x x
Water/Wastewater fee revenue in FY 2007-2008 was $27,723,599. Water/Wastewater fee revenue is estimated at $29,740,377for FY 2008-2009 and the Adopted Budget is $29,667,696 for FY 2009-2010.
FINANCIAL INDICATORS AND MAJOR REVENUE SOURCES
The Water/Wastewater program provides protection of the health, safety and welfare of the public, as well as certainenvironmental conditions, through the operation and maintenance of the County-owned water supply, treatment anddistribution system, and the County-owned wastewater collection, treatment and disposal system. Water/Wastewater fees arecharged to users of the County’s water/wastewater system. Brevard County currently provides water/wastewater services tounincorporated areas of north Brevard and wastewater services to unincorporated areas of central and south Brevard.
The estimation of Water/Wastewater fees revenues is based on historical collection data, population growth and developmentplans, as well as other current factors, which would affect the demand for services. A 5% increase was implemented forWater/Wastewater rates effective October 1, 2007.
Water/Wastewater Fees
$23.926 $24.090 $24.111
$26.452$27.724
$29.740 $29.668
$0
$2
$4
$6
$8
$10
$12
$14
$16
$18
$20
$22
$24
$26
$28
FY 2003-2004 FY 2004-2005 FY 2005-2006 FY 2006-2007 FY 2007-2008 FY 2008-2009 FY 2009-2010
Water/Wastewater FeesBrevard County, FloridaIn Millions
24
x x
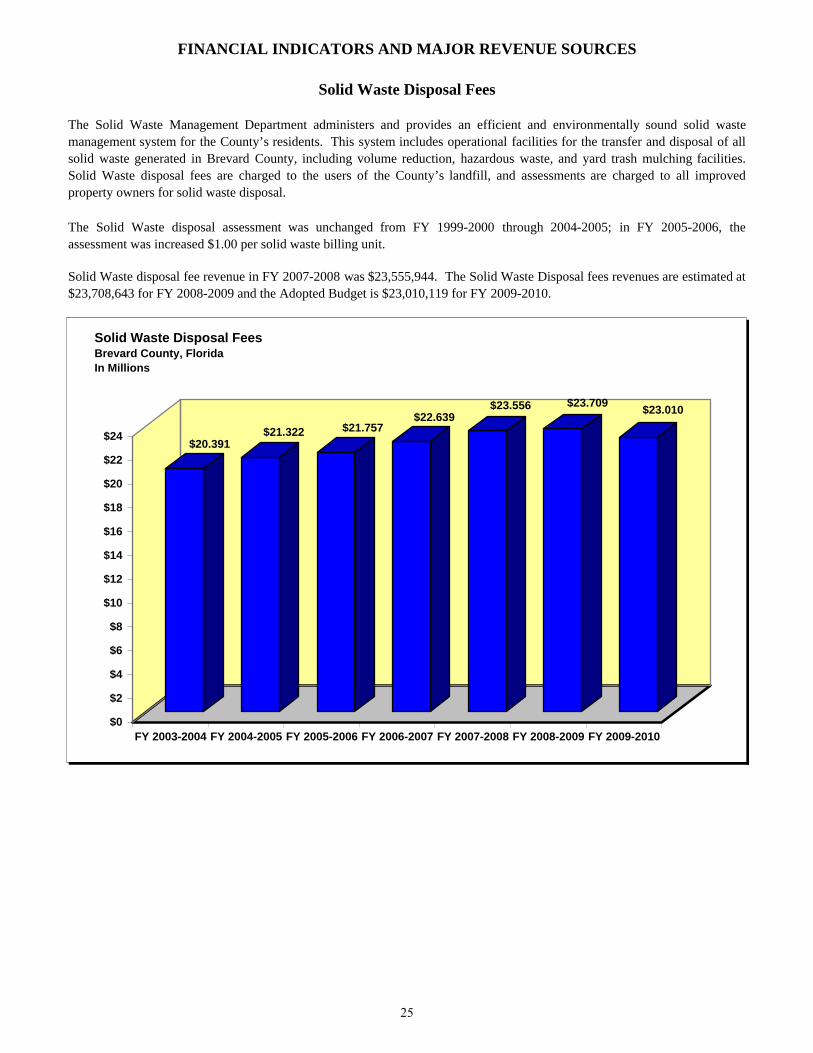
Solid Waste disposal fee revenue in FY 2007-2008 was $23,555,944. The Solid Waste Disposal fees revenues are estimated at$23,708,643 for FY 2008-2009 and the Adopted Budget is $23,010,119 for FY 2009-2010.
FINANCIAL INDICATORS AND MAJOR REVENUE SOURCES
The Solid Waste Management Department administers and provides an efficient and environmentally sound solid wastemanagement system for the County’s residents. This system includes operational facilities for the transfer and disposal of allsolid waste generated in Brevard County, including volume reduction, hazardous waste, and yard trash mulching facilities.Solid Waste disposal fees are charged to the users of the County’s landfill, and assessments are charged to all improvedproperty owners for solid waste disposal.
The Solid Waste disposal assessment was unchanged from FY 1999-2000 through 2004-2005; in FY 2005-2006, theassessment was increased $1.00 per solid waste billing unit.
Solid Waste Disposal Fees
$20.391$21.322 $21.757
$22.639$23.556 $23.709
$23.010
$0
$2
$4
$6
$8
$10
$12
$14
$16
$18
$20
$22
$24
FY 2003-2004 FY 2004-2005 FY 2005-2006 FY 2006-2007 FY 2007-2008 FY 2008-2009 FY 2009-2010
Solid Waste Disposal FeesBrevard County, FloridaIn Millions
25