financial flexibility, corporate investment and … annual meetings... · financial flexibility,...
TRANSCRIPT

1
Financial Flexibility, Corporate Investment and Performance
1
Özgür Arslana, Chrisostomos Florackis
b* and Aydin Ozkan
c
aHacettepe University, Turkey
bUniversity of Liverpool, UK
cUniversity of Hull, UK
Abstract
This study examines the impact of financial flexibility on the investment and performance of
1,068 non-financial corporations that were significantly affected by the 1997-1998 Asian
crisis. We find that firms can attain financial flexibility, primarily through conservative
leverage policies and less commonly through large cash holdings. Our analysis shows that
firms that are financially flexible prior to the crisis (i) have a greater ability to take
investment opportunities, (ii) rely much less on the availability of internal funds to invest,
and (iii) perform better than less flexible firms during the crisis. Our results also suggest that
leverage-based and cash-based flexibility indicators are better predictors of corporate
investment and performance than traditional measures of financial constraints (e.g. firm size,
dividend payout, firm age and business group affiliation).
JEL classification: G31; G32
Keywords: Financial Flexibility, Liquidity Management, Investment, East Asian Financial Crisis,
Business Groups.
1 We are grateful to Viral Acharya, Matthew T. Billett, Jon A. Garfinkel, Marc Goergen, Klaus Gugler, Iftekhar
Hasan, Andros Gregoriou, Alexandros Kostakis, Leone Leonida, Maria-Teresa Marchica, Roberto Mura, Uday
Rajan, conference participants at the 2009 FMA Annual European meeting in Turin and the 2010 Mid-West
Finance Association Annual Meeting in Las Vegas, as well as seminar participants at the ESRC seminar on
Corporate Governance, Regulation, and Development at the University of Birmingham; the workshop on
Methods and Applications in Macroeconomics and Finance at Ege University; University of Liverpool
Management School, Hull University Business School, Illinois Institute of Technology and University of
Leicester for helpful comments and suggestions on earlier versions of the paper.
* Corresponding author. The Management School, University of Liverpool, United Kingdom. Tel.: + 44 (0)
151 7953807. Fax: +44 (0) 151 7953000, E-mail: [email protected].

2
Financial Flexibility, Corporate Investment and Performance
Abstract
This study examines the impact of financial flexibility on the investment and performance of
1,068 non-financial corporations that were significantly affected by the 1997-1998 Asian
crisis. We find that firms can attain financial flexibility, primarily through conservative
leverage policies and less commonly through large cash holdings. Our analysis shows that
firms that are financially flexible prior to the crisis (i) have a greater ability to take
investment opportunities, (ii) rely much less on the availability of internal funds to invest,
and (iii) perform better than less flexible firms during the crisis. Our results also suggest that
leverage-based and cash-based flexibility indicators are better predictors of corporate
investment and performance than traditional measures of financial constraints (e.g. firm size,
dividend payout, firm age and business group affiliation).
JEL classification: G31; G32
Keywords: Financial Flexibility, Liquidity Management, Investment, East Asian Financial Crisis,
Business Groups.

3
1. Introduction
The majority of senior corporate managers around the world consider financial flexibility as
one of the most important determinants of their capital structure decisions (Graham and
Harvey, 2001; Bancel and Mittoo, 2004; and Brounen, De Jong and Koedijk, 2006). The
motives to attain financial flexibility are related to the future ability and need of firms to
raise external funds and restructure their financing at low cost (see, e.g., DeAngelo and
DeAngelo, 2007; Gamba and Triantis, 2008; and Byoun, 2008a). It is argued that firms with
financial flexibility enjoy easier access to external capital markets to meet funding needs
arising from unanticipated earnings shortfalls - and/or new growth opportunities - and hence,
avoid situations that lead to suboptimal investment and poor performance.2
In this study we empirically investigate the effects of financial flexibility on corporate
investment and performance during the East Asian crisis of 1997-1998. Focusing on a crisis
period provides us with clear advantages. Economic and financial crises clearly represent
exogenous shocks to firms’ viability, profitability and cash flows, and generally reduce the
expected return on investment opportunities. Moreover, due to lower asset prices, crises
create opportunities for firms with the ability to invest (Mitton, 2002). To the extent that
flexible firms are better equipped to cope with the adverse consequences of exogenous
shocks, a crisis period would allow us to provide stronger tests on the impact of financial
flexibility on corporate performance and investment policy during the crisis. The main
hypothesis we investigate in this paper is that, ceteris paribus, the greater a firm’s financial
flexibility at the onset of the crisis, the less severe the decline in its investment expenditures
and performance during the crisis.
Our analysis begins with the construction of simple indicators of financial flexibility.
Existing studies mainly focus on leverage and cash holdings decisions as ways of preserving
2 Similar views have also been put forward by earlier studies. For example, the pecking order theory of capital
structure, proposed by Myers (1984) and Myers and Majluf (1984), is based on the assumption that firms
preserve financial slack to avoid the need for external funds in financing future investment opportunities. Also,
Froot, Scharfstein and Stein (1993) suggest that firms maintain financial flexibility to avoid the costs
ofunderinvestment.

4
flexibility, though these policies are generally considered separately.3 Only recently have
studies adopted the view that firms can attain financial flexibility through both their debt
financing and cash holdings policies.4 By drawing insights from these studies and
recognizing that firms can attain financial flexibility through alternative routes (e.g. by
accumulating cash, adopting a conservative leverage policy or adjusting simultaneously their
cash and leverage levels), we classify firms into several groups of financial flexibility on the
basis of their leverage and cash holding positions during the pre crisis period (at time t).We
then examine whether firms that attain financial flexibility in the pre crisis period benefit
from it by having a greater ability to take investment opportunities during the crisis period
(at time t+k).
To address the relationship between financial flexibility and investment we estimate
cash flow sensitivities using the investment equation framework commonly used in the
literature (see e.g. Fazzari, Hubbard and Petersen, 1988; Hubbard, Kashyap and Whited,
1995; Cleary, 2006; and Carpenter and Guariglia, 2008 among others). However, our
emphasis is similar to that in recent studies that attempt to provide insights into the effects of
supply-side shocks on corporate investment (see Duchin, Ozbas and Sensoy, 2010). We also
examine whether the performance of firms with greater flexibility differs from that of less
flexible firms. By doing so, our study adds to the literature that investigates the effects of
financial crises on corporate performance and contributes to the recent research on the value
3 A number of studies emphasize the importance of obtaining financial flexibility through low leverage policies
(Goldstein, Ju and Leland, 2001; Billet, King and Mauer, 2007; Byoun, 2008a; Lins, Servaes and Tufano, 2010
and Campello, Graham and Harvey, 2010) or moderate/high cash balances (Opler et al., 1999; Billet and
Garfinkel, 2004; Almeida, Campello and Weisbach, 2004; Acharya, Almeida and Campello, 2007; Faulkender
and Wang, 2006; Dittmar and Mahrt-Smith, 2007; Kalcheva and Lins, 2007; Berrospide, Purnanandam and
Rajan, 2008; Harford, Mansi and Maxwell, 2008; and Riddick and Whited, 2008). The main argument of both
lines of research is that firms with readily available large cash balances or low leverage can better cope with
earnings shortfalls and hence avoid underinvestment. 4 For example, DeAngelo and DeAngelo (2007) explicitly consider leverage and cash holdings to define
financial flexibility and argue that low leverage combined with moderate cash holdings and high dividend
payouts constitute an optimal policy regarding flexibility. In line with this view, Gamba and Triantis (2008)
show that financial flexibility can be a result of the firm’s strategic decisions regarding its capital structure,
liquidity and investment. Moreover, in the light of increased risk in the economic environment, Bates, Kahle
and Stulz (2008) argue that high cash holdings are related to low levels of debt and hence the simultaneous
practice of these policies enable firms to forestall distress and default. Finally, Byoun (2008a) reports that small
developing firms are more likely to seek financial flexibility and do so through lower leverage and larger cash
holdings policies.

5
of financial flexibility (see e.g., Gamba and Triantis, 2008; Byoun, 2008a; Byoun, 2008b).
For example, prior studies of the East Asian crisis present strong evidence for the importance
of several firm characteristics, such as ownership structure and corporate governance, in
determining corporate performance (see, e.g., Johnson et. al, 2000; Mitton, 2002; Fisman,
2002; Lemmon and Lins, 2003). Our analysis builds on these studies by putting a specific
focus on the potential role that financial flexibility might play for corporate valuation during
the crisis.
Finally, drawing on recent findings showing strong inter-relations across several
indicators of financial constraints and financial health (see Cleary, 2006; Carpenter and
Guariglia, 2008), our study also examines how traditional measures of financial constraints,
such as dividend, firm size, firm age and business group affiliation, interact with the
flexibility indicators utilized in this study. To this end, we evaluate the relative importance of
traditional measures of financing constraints and simple leverage-based and cash-based
flexibility indicators in explaining corporate investment and performance. By doing so, our
study also contributes to the rich literature that examines whether large investment to cash
flow sensitivities can be treated as evidence of financing frictions (see e.g. Fazzari, Hubbard
and Petersen, 1988; Kaplan and Zingales, 1997; Cleary, 1999 and Guariglia, 2008).
Our empirical analyses provide several important findings. First, flexible firms seem to
have greater capacity to pursue growth opportunities in the face of unanticipated earnings
shortfalls during the crisis. Second, among the two components of flexibility, namely cash
and leverage, leverage seems to be the main driver of investment behaviour during the crisis
period. Our results imply that cash is mainly held as a form of insurance against financial
distress and bankruptcy. Third, companies cannot solely rely on a business group affiliation
to hedge against uncertain future contingencies. Fourth, financial flexibility not only leads to
higher investment expenditures and lower investment cash flow sensitivity but also to better
performance during the crisis. Finally, our results, which go through a battery of robustness
checks, demonstrate that cash and leverage policies of flexible firms in the pre crisis period
6
are not random or driven by constraints arising from capital market imperfections. They
rather reflect companies’ expectations about the likelihood of a contraction of economic
activity and capital adequacy in the future.
The rest of the paper is organized as follows: Section 2 describes the data and provides
summary statistics. Section 3 provides a detailed analysis regarding the role of financial
flexibility in determining corporate investment. Section 4 investigates the relationship
between financial flexibility and corporate performance, and Section 5 provides a series of
robustness tests. Finally, Section 6 concludes.
2. Data and Descriptive Statistics
Our analysis to examine the value of financial flexibility is based on a sample of 1,068 listed
firms from the following countries: Hong Kong, Indonesia, Malaysia, South Korea, and
Thailand. This list of countries includes the four most affected Asian economies plus Hong
Kong, a key market in the region that was generally less affected by the crisis than others but
was still subject to some large shocks due to the openness of its economy and its close
relationship with the other East Asian economies. We exclude from the analysis Philippines,
Singapore and Taiwan as they account for three of the mildly affected countries from the
Asian Crisis in contrast to the severely affected other East Asian countries (see Winters,
1999).5
Our dataset is constructed using data from several sources. Specifically, we obtain data
on accounting and market variables from Thomson Datastream. The dataset covers both the
pre crisis (i.e. 1994 to 1996) and crisis periods (i.e. 1997 to 1998).6 To select the sample of
5 Characteristically, between July-November 1997, both Taiwan and Singapore had a current account surplus of
more than 10 percent and Philippines had almost no deficit although the other countries in the region had a
current account deficit of more than 10 percent on average. Also, between May 1997 and May 1998 Taiwan
was the only East Asian country for which the average daily change in its stock market was not negative (see
also Radelet and Sachs, 1998 and Nixson and Walters, 1999). 6 To identify the pre crisis and crisis periods we follow earlier studies on the subject (see e.g., Claessens, Fan
and Lang, 2006, Lemmon and Lins, 2003). For robustness purposes we also adjust the pre crisis and crisis
periods to 1995-1997 and 1998-1999, respectively, for Hong Kong. This helps control for the fact that the crisis
occurred in Hong Kong with some delay (see e.g. Radelet and Sachs, 1998 and Nixson and Walters, 1999). The
results are not affected significantly from such an adjustment.

7
firms, we drop financial firms and delete firm year observations with missing data and
extreme values for our regression variables (on the basis of the top and bottom 1%). Finally,
we keep in the sample only those firms that are traceable during both the pre crisis and crisis
periods. These criteria led to a final sample of 1,068 firms. We match firms in this sample
with those from the study of Claessens, Djankov and Lang (2000) to obtain information on
business group affiliation, the magnitude of separation between cash flow and control rights,
the identity of the largest shareholder, and the role of CEOs and other senior managers as
controlling shareholders of the company. These data are of either December 1996 or the end
of the fiscal year 1996, which is just before the start of the crisis in East Asia.7 Finally, given
the cross country nature of our study, we also consider a country based rule of law measure
that ranges from 0 to 10, with lower scores corresponding to less tradition for law and order.
This measure is based on an assessment of the law and order tradition in a country as
produced by the country risk taking agency International Country Risk (ICR).8
Table 1 summarizes basic descriptive statistics for the key variables of the study using
the whole sample, reported separately for the pre crisis and crisis periods. In general, the
statistics differ significantly across the two subperiods. For example, the mean value of
investment expenditures of firms drops from 8.1 percent in the pre crisis period to about 4.15
percent during the crisis, which represents 48 percent decrease. Not surprisingly, the average
cash flow ratio also drops by about 31 percent, from 9.99 to 6.91 percent. Furthermore, both
growth opportunities, measured by the market to book ratio, and firm size get smaller during
the crisis period, with the average values of the market to book ratio and the logarithm of
total assets (expressed in US dollars) dropping from 1.57 to 1.19, and 12.44 to 12.33,
respectively. Additionally, the crisis leads firms to significantly reduce their dividend payout
ratios by about 37 percent (from 2.01 to 1.27 percent). Turning to the changes in the cash
7 Ownership data cannot be obtained for a small number of our 1,068 firms. This should not bias, however, our
data in a particular manner. This is because there are no statistically significant differences, with respect to their
key characteristics, between East Asian firms with and without ownership data at a particular point of time (see
Lins, 2003 and Lemmon and Lins, 2003). 8 See also La Porta et al. (1998).

8
holding and leverage ratios of firms, we find that the cash holdings ratio of the average firm
in our sample remains almost unchanged during the crisis period at about 11 percent.
However, the change in the average value of leverage is significant, increasing from 29.25
percent in the pre crisis period to 34.67 percent in the crisis period, corresponding to an 18.5
percent increase. In Table 1 we also report the changes in the net debt ratio, defined as total
debt minus cash holdings, divided by total assets. In line with the findings regarding
leverage and cash holdings, there is an increase in net debt during the crisis, which is mainly
driven by the increase in leverage.
The findings regarding leverage and net debt ratios are at odds with the view that the
average debt level usually drops during a crisis period as a response to the increase in
uncertainty and asymmetric information between borrowers and lenders. As we discuss later
in Section 3, however, on closer inspection it appears that there are two groups of firms in
our sample that behave differently with respect to their capital structure decision. On the one
hand, a large proportion of firms, mainly those that adopt aggressive leverage policies in the
pre crisis period, experience difficulties to increase their leverage during the crisis period.
On the other hand, consistent with our expectations, firms that adopt conservative policies in
normal times (e.g. by retaining leverage at relatively low levels) indicate a higher ability to
raise external financing in abnormal times.
3. Financial Flexibility and Corporate Investment
This section provides more detailed descriptive statistics by dividing firms into sub samples
on the basis of their cash and leverage positions in the pre crisis period. Initially, by using
the median values of cash holdings and leverage ratios of firms during the pre crisis period,
we generate four sub samples of firms, (1) low leverage (LL); (2) high leverage (HL); (3)
low cash (LC); and (4) high cash (HC) firms.9 Additionally, we identify two further groups
9 In a series of robustness checks that are analytically discussed in Section 5, we use industry-adjusted median
values for cash and leverage as well as different cut-off points (e.g. the 25th
and the 75th percentiles) for
classifying firms into different categories. Our results, which are discussed analytically in Section 5, remain
robust across the different classifications.

9
of firms, (5) low leverage and high cash (LL-HC); and (6) high leverage and low cash (HL-
LC) firms, by considering both policies simultaneously. We then provide the mean values of
the main variables of interest in each sub-sample and compare them across the pre crisis and
the crisis periods.
3.1 Financial flexibility by low leverage
Panel A.1 of Table 2 presents the average values of several firm characteristics of the
leverage subgroups of firms in the pre crisis period. There are several important observations
that are of particular interest. First, in line with earlier findings in the literature, HL firms
have lower cash holdings than LL firms. Second, the average HL firm invests more than the
average LL firm in the pre crisis period, which may look surprising given that growth
opportunities, proxied by the market to book ratio, and the cash flow ratio of HL firms are
lower than the corresponding values for LL firms. Third, we find that HL firms are on
average larger than LL firms. Overall, the firm characteristics during the pre crisis period
suggest that HL firms are on average larger and highly indebted (by construction), their
growth opportunities, cash holdings and cash flows are lower, but their investment
expenditures are higher than those of the LL firms.
In Panel B.1 of Table 2 we present the summary statistics of the key variables during
the crisis period. In line with the argument that financially flexible firms have greater
capacity to invest, LL firms seem to be more flexible than HL firms, suggested by their
higher investment to assets ratio in the crisis period than that of the latter firms. The
investment ratio for the average LL firm is about 4.56 percent whereas it is 3.73 percent for
the average HL firm. As explained above, the pre crisis results suggest an opposite pattern.
The corresponding percentage decreases in the investment ratio from the pre crisis to the
crisis period, presented in Table 3, are about 56 and 40 percent for HL and LL firms
respectively.
10
Comparing the mean values of other variables also leads to interesting inferences. HL
firms are on average larger, have much more debt with lower growth opportunities and cash
flows, and hold lower cash balances than LL firms. However, a closer inspection of the
changes in the average values in the crisis period reveals a more striking picture. We observe
that the changes in the cash holdings ratio of both HL and LL firms are negligible. However,
the changes in the leverage ratio in the crisis period are significant where LL firms increase
their leverage ratio during the crisis by about 44 percent whereas the increase in leverage by
HL firms is limited to only about 9 percent. These findings imply that the net debt ratio of
LL (HL) firms increases by 351 (10.5) percent from about 2.3 (33.97) percent to 10.2 (37.54)
percent. There is strong evidence that LL firms of the pre crisis period are able to increase
their leverage significantly in the crisis period and this probably enables them to maintain a
higher level of investment expenditures than those of HL firms. We also check the debt
maturity structure of HL and LL firms. The results indicate that the ratio of short term debt
to total debt increases (decreases) for HL (LL) firms, suggesting that the increase in the
leverage ratio of HL firms during the crisis is mainly maintained through short term debt. On
the contrary, LL firms, despite the increase in their leverage ratio by almost 44 percent, are
able to slightly reduce the share of short term debt in total debt by 1.26 percent (from 63.55
to 62.75).
Overall, the descriptive statistics discussed in this section provide preliminary
evidence consistent with the view that maintaining debt at low levels enables firms to
preserve debt capacity to fund investment opportunities in the face of unanticipated adverse
shocks.
3.2 Financial flexibility by high cash balances
In this section we examine firm characteristics of the two subgroups of firms, grouped on the
basis of their cash balances in the pre crisis period. We start by comparing high cash (HC)
11
and low cash (LC) firms in the pre crisis period, presented in Panel A.2 of Table 2. The
results suggest that the average net debt ratio of HC firms is only about 7.14 percent
compared with 29.01 percent net debt ratio for LC firms. HC and the LC firms also differ
significantly in several other characteristics in this period. For example, HC firms have
greater cash flow to assets and market to book ratios. The differences are also statistically
significant. Nevertheless, the investment ratio does not differ significantly across the two
groups, and HC and LC firms are similar in size. Furthermore, the difference between the
maturity structures of debt holdings of each group of firms is not statistically significant and
about 60 percent of total debt for the average firm in both groups matures within one year.
In Panel B.2 of Table 2 we present the summary statistics of the two groups in the
crisis period. The findings are very similar to those reported above for the pre crisis period.
That is, compared to LC firms, HC firms have higher cash flow and market to book ratios,
hold less debt in their capital structures, and pay more dividends. Moreover, the investment
expenditures, size and the debt maturity structure of debt are similar for both groups. It is,
however, important to note that although the difference is not statistically significant and
both groups drop their investment expenditures substantially, the average investment ratio of
HC firms is now greater than that of LC firms in the crisis period.
Moving to Table 3, the results suggest that both HC and LC firms increase their
leverage ratio during the crisis, by 21.59 and 16.45 percent respectively. However, HC firms
reduce the cash to assets ratio by 18.13 percent whereas LC firms increase it by 84.33
percent. These changes result in a significant increase in the net debt ratio of HC firms by
nearly 125 percent and a small change of 7.4 percent for LC firms. Finally, both groups of
firms reduce their investment expenditures substantially in the crisis period. The percentage
drop in the investment to assets ratios for HC and LC firms are 46.08 and 51.47 percent
respectively. Overall, the results reported in this subsection provide little evidence
supporting the view that large cash balances provide firms with greater financial flexibility.
12
3.3 Financial flexibility by low leverage and high cash balances
Despite its useful insights, the analysis in the previous two subsections can be misleading
given that it is based on a univariate setting and considers cash and leverage positions of
firms separately while grouping firms into different groups. Corporate cash and leverage
decisions, however, are strongly interrelated in the sense that an adjustment in one policy
variable implies that other policy variables must also adjust (see Gatchev et al., 2010). As a
result, firms may choose to attain financial flexibility by simultaneously maintaining low
leverage and high cash policies. We take this view into consideration by regrouping firms in
Tables 2 and 3 on the basis of both policies. In this respect, we compare firm characteristics
of low leverage-high cash (LL-HC) vs. high leverage-low cash (HL-LC) firms. We expect
LL-HC firms to be more financially flexible than HL-LC firms in funding investment
expenditures during the crisis period.
We start by assessing the differences in firm characteristics in the pre crisis period,
shown in Panel A.3. By construction, HL-LC firms have higher leverage and lower cash
holdings than LL-HC firms. However, their cash flow to assets and market to book ratios are
lower than those of LL-HC firms. Additionally, compared to LL-HC firms, they are smaller,
hold less short term debt in their capital structures, and pay out lower dividends relative to
their total assets. More importantly, the average HL-LC firm invests more than the average
LL-HC firm in the pre crisis period, though the difference is statistically significant only at
the 10 percent level.
We now turn to the statistics in the crisis period and the percentage changes in the
mean values across the two periods, reported in Panel B.3 of Table 2 and in Table 3
respectively. The comparative characteristics of firms in the two groups are very similar to
those reported above for the pre crisis period. The only striking exception relates to the
investment to assets ratio. In the crisis period, LL-HC firms have a greater investment ratio
than that of HL-LC firms, given by 4.67 and 3.65 percent respectively. The corresponding
figures for the pre crisis period are 7.52 and 8.42 percent. That is, the findings imply that –

13
as reported in Table 3 – the investment ratio of LL-HC firms dropped by 37.9 percent
whereas the decrease for HL-LC firms is 56.65 percent. Interestingly, the 56.65 percent drop
in investment is the highest across all the subgroups in our sample.
Furthermore, HL-LC firms display the lowest increase in the net debt ratio, which
increases in the crisis period only by 1.64 percent. Table 3 also reveals that HL-LC firms
drop their dividend payout ratio by 55.75 percent and increase their leverage ratio by only
7.32 percent. Besides, LL-HC firms during the same period reduce their dividend payouts
and cash holdings by 26.55 and 16.69 percent respectively, and increase their leverage ratio
by 41.76 percent. The net debt ratio hence increases significantly, by more than 150 percent.
The resulting drop of 37.9 percent in the investment ratio of LL-HC firms is the lowest
among the subgroups included in Table 3. Overall, there is strong evidence that firms
combining low leverage with high cash balances in the pre crisis period are better positioned
to maintain their investment expenditures during the crisis period.
3.4 Financial flexibility and the cash flow sensitivity of investment
The evidence provided so far suggests that the investment expenditures of firms with low
levels of debt and large cash balances are less sensitive to unanticipated negative shocks to
earnings. In this section, we examine this issue further by using a multivariate framework.
Our empirical strategy is to estimate an investment model for different subgroups of firms,
where the subgroups are determined on the basis of the each firms’ leverage and cash
positions before the crisis. Our main objective in this section is to examine the extent to
which the cash flow sensitivity of investment varies across the subgroups both in the pre
crisis and crisis periods. Based on the evidence reported in the previous section we argue that
LL firms are more financially flexible in funding investment than HL firms. Similarly, LL-
HC firms are believed to be more flexible than HL-LC firms in the sample. Thus, we use the

14
terms LL, LL-HC and flexible, and the terms HL, HL-LC and less flexible interchangeably
throughout our empirical analysis.10
In line with prior research, the cash flow ratio is used as a proxy for the availability
of internal sources for investment.11
We expect that less flexible firms are more dependent
on the level of cash flows for funding investment because of their limited ability to raise
further debt and relatively low levels of cash balances. We estimate the cash flow sensitivity
of investment using the following model:
it
r
it
f
ititit uMTBMTBCFLOWaI 131211 , (1)
In equation (1), I is the ratio of capital expenditures to total assets, CFLOW is the sum of
earnings before interest, tax and depreciation over total assets and MTB represents the firm’s
growth opportunities, measured by the market to book ratio. In an attempt to use a proxy that
properly controls for growth opportunities, we decompose the market to book ratio into two
parts - a fundamental component (MTBf) and a residual component (MTB
r) - and then
examine how investment responds to changes in these two components. We consider that
such decomposition is necessary because stock valuations tend to deviate significantly from
fundamentals in periods characterized by asset price shocks.12
In estimating equation (1), we
10
The results presented in Section 3.2 indicate remarkable similarities across the HC and the LC groups with
respect to their investment ratio across the pre crisis and crisis periods. Based on these findings, the subsequent
analysis does not consider cash holdings as the main criterion for assigning firms into different groups
according to their flexibility status. 11
See Fazzari, Hubbard and Petersen, 1988; Hubbard, Kashyap and Whited, 1995; and Gilchrist and
Himmelberg, 1998 for a discussion on the use of the investment cash flow sensitivity as a proxy for financial
constraints. 12
To decompose the market to book ratio we follow a similar approach to that of Goyal and Yamada’s (2004).
Specifically, we regress the MTB ratio against contemporary and lagged sales growth, squared sales growth and
industry dummies. The fitted values of this regression are used as a proxy for the fundamental component of
stock valuations (MTBf), while the residual component is used as a proxy for the residual values (MTB
r). The
inclusion of both components of MTB in the regressions helps capture not only outsiders’ but also insiders’
evaluation of growth opportunities. Alternative ways to avoid the mis-measurement of the proxy of growth
opportunities include: i) the use of contracted capital expenditures alongside MTB in the model (see Carpenter
and Guariglia, 2008) and ii) the use of an error-correction specification (see Guariglia, 2008). Notwithstanding
their merit, these methods cannot be utilized in our study due to the nature of our data (e.g. a short-panel) and
the lack of availability of information on contracted expenditures. We therefore stick to Goyal and Yamada’s
(2004) method to tackle the measurement issue of growth opportunities. Other more straightforward variables
that have been suggested as proxies for growth opportunities (e.g. ratio of R&D expenses to total sales) cannot
be implemented in our analysis given the limited data availability (e.g. for the case of Korea, only 10% of the
companies included in our sample disclosed to their R&D expenditures for the year 1998).

15
initially use a random effects GLS regression approach in which independent variables are
lagged one year to control for potential endogeneity problems (see Duchin, Ozbas and
Sensoy, 2010). For completeness, we also obtain results by estimating a fixed effects model.
The rationale behind the implementation of the latter method is that better companies may
anticipate a downturn in conditions and, as a result, prepare for it. To this end, firm fixed
effects may be important in our investment framework.13
Equation (1) is estimated for
flexible and less flexible firms in both the pre crisis and crisis periods.
3.4.1 Baseline Investment Results
We start by estimating equation (1) using the whole sample without distinguishing between
flexible and less flexible firms. As shown in Table 4, the estimated coefficient of cash flow
is positive and statistically significant in both periods. The cash flow sensitivity of
investment, however, is much lower during the crisis period than the pre crisis period (0.289
vs. 0.087). This finding is possibly attributable to the fact that while cash flow drops
substantially during the crisis for almost all firms, a specific group of firms seem to manage
to retain their investment at satisfactory levels by raising external financing (e.g. committing
pre-arranged lines of credit).14
Still, the finding that the estimated coefficients are significant
in both periods is slightly puzzling as it suggests that firms in both periods behave as though
they are financially constrained.
It is equally surprising to observe during the pre crisis period that the estimated
coefficients of both components (fundamental MTBf and residual MTB
r) of the market to
book ratio are economically and statistically insignificant, though they become significant
13 The results of the fixed effects model are almost identical to the ones obtained using the random effects
estimator. We therefore decide to report only those results that are based on the random-effects estimator (all
unreported results are available upon request by the authors). 14
Another potential explanation for the declining cash flow sensitivity of investment across time relates to the
life cycle hypothesis (see Hovakimian, 2009). According to the lifecycle hypothesis, young firms usually have
low cash flows but relatively high investment due to the existence of abundant investment opportunities. As
they become more mature, however, these firms experience increasing cash flow with simultaneously
decreasing investment rates, leading to a lower cash flow sensitivity of investment. This explanation can only
be a partially valid for our sample given the nature of our data (i.e. a relatively short time-series).
16
during the crisis period. Although we do not investigate this further, the preliminary
explanation we can offer on these findings relates to the overinvestment tendency of firms
during economic booms (Hadlock, 1998; and Wei and Zhang, 2008), which possibly
weakens the link between growth opportunities and investment. This is also consistent with
our earlier descriptive analysis reporting that the investment expenditures and cash flows of
firms are at record high levels in the pre crisis period despite a modest average market to
book ratio of 1.57.
We next estimate the investment model through grouping firms into flexible and less
flexible sub-samples on the basis of their leverage behaviour in the pre crisis period. The
results are reported in Models 2 and 3. The most striking finding from these estimations
relates to the investment cash flow sensitivity coefficient. For high leverage (HL) and hence
less flexible firms, the estimated coefficient on CFLOW is positive and statistically
significant in both periods. However, in Model 3, which refers to flexible firms (i.e. LL), the
coefficient on CFLOW becomes insignificant in the crisis period, though it remains highly
statistically significant in the pre crisis period. In terms of economic significance, while the
coefficient for HL firms drops from 0.273 in the pre crisis period to 0.114 during the crisis
period, the drop in the economic significance for LL firms is much bigger, from 0.369 in the
pre crisis to 0.038 during the crisis period. Our results also indicate that despite the
irrelevance of the market to book ratio in determining the investment expenditures of LL
firms in the pre crisis period, the coefficients on the market to book variables in the crisis
period switch signs and become positive and significant at the 1 percent level. In summary,
these findings are consistent with the view that financial flexibility can be attained through a
low leverage policy. Importantly, it seems that flexible firms rely less on internal resources
(i.e. cash flow) for investing. Moreover, such firms are better equipped to meet financing
needs though external financing and hence have a greater ability to undertake valuable
growth opportunities that arise during the crisis.

17
We next carry out the same analysis using firms’ cash holdings in the pre crisis period
to distinguish the financially flexible firms from the less flexible ones. Specifically, as
shown in Models 4 and 5, the cash flow sensitivity of investment for both flexible (HC) and
less flexible (LC) firms is positive and significant during both periods. The values of the
estimated coefficients on CFLOW, however, drop significantly during the crisis, whereas the
economic significance of the market to book variables improves significantly especially for
the flexible firms. More importantly, in contrast to leverage, cash does not seem to
significantly affect the cash flow sensitivity of investment during the crisis period.
In models (6) and (7) we estimate the investment equation after combining both cash
and leverage through assigning firms into flexible (LL-HC) and less flexible (HL-LC)
categories. The results are similar to those reported in Models 2 and 3 where low leverage is
used to construct our flexibility proxy. The investment of flexible firms during the crisis
does not depend on the level of cash flow and, as expected, is determined by the availability
of valuable investment opportunities. However, this is not the case for less flexible firms as
indicated by the positive and significant coefficient on CFLOW. It is interesting to note that
adding cash holdings as an additional criterion (to leverage) in identifying financially
flexible firms does not change the results significantly in either periods, where the results
seem to be driven mostly by the leverage positions of firms prior to the crisis.
In Models (8) and (9), we re-estimate Models (6) and (7) after excluding negative cash
flow observations from the sample. As Allayannis and Mozumdar (2004) and Bhagat,
Moyen and Suh (2005) suggest, negative cash flow observations may bias the results of an
investment model. This is because investment expenditures are unlikely to respond to cash
flow changes when companies are in sufficiently bad shape. To address this issue, we
identify and delete 30 firm year observations as a result of this check. However, our results,

18
reported in Models 8 and 9, remain very similar, suggesting that they are not biased by the
presence of negative cash flow firm year observations in our sample.15
Overall, the results presented in Table 4 are consistent with the hypothesis that
financial flexibility is desirable to fund future growth opportunities when firms find external
finance more costly and/or experience cash flow shortfalls.16
Prior to the crisis it is difficult
to distinguish between the investment behaviour of flexible and inflexible firms but their
behaviour becomes distinct during the crisis. More specifically, firms attaining financial
flexibility through low leverage in the pre crisis period do not rely on the availability of
internal funds to finance their capital expenditures during the crisis. The main determinant of
investment of flexible firms in this period is their growth opportunities. On the contrary,
high leverage firms seem to make relatively greater use of cash flows as a source of finance
during the crisis. Furthermore, our findings suggest that in contrast to leverage, cash
holdings do not seem to be important for funding future investment opportunities (i.e. the
cash flow sensitivity of investment does not differ substantially across HC and LC groups).
This finding is consistent with recent qualitative evidence by Lins et al. (2008) suggesting
that excess cash is usually held as a form of insurance against financial distress while lines of
credit are held to fund future growth.
3.4.2 Interactions between Financial Flexibility and Business Group Affiliation
Business groups are diversifying organizations with a significant amount of ownership and
control. Such groups can provide benefits to their affiliate firms through capital and product
markets, contract enforcement, and government influence (see Khanna & Palepu, 2000;
Rousseau and Kim, 2008). Recent evidence for East Asian (Korean) corporations, for
example, supports a significant association between the existence of a business group and
corporate debt policies (see Kang and Kim, 2006; Gul and Kealey, 1999). The questions that
15
Though we do not report the results in Table 4, we also repeat the same exercise for each of the HL, LL, HC,
and LC sub groups by dropping the negative cash flow observations. Our findings prevail for all specifications. 16
Ding, Domac and Ferri (1998), for example, provide evidence on the existence of a credit crunch during the
East Asian crisis.

19
we try to address in this section are the following: i) Does the investment expenditure of
firms that belong to a business group (BG) exhibit a lower sensitivity to the availability of
internal funds than that of firms that do not belong to a business group (non-BG), ii) Does
business group affiliation work as substitute to financial flexibility, as attained through cash
and leverage, during the crisis?
To address the first question, we estimate equation (1) after splitting the sample into
two subsamples based on their business group affiliation. The results from this estimation
are reported in Panel A of Table 5. To address the second question, we estimate the
investment model again by focusing on the subgroups based on a combination of the group
affiliation and financial flexibility features of firms. For example, in Panel B of Table 6,
Model 3 reports the estimation results using a sub sample of firms that are defined as
financially flexible and are also affiliated with a business group. On the other hand, Model 5
in Panel C considers firms that are financially inflexible (HL-LC firms) and affiliated with a
business group.
The results presented in Panel A show that the cash flow sensitivity of investment is
positive and statistically significant for both groups of firms, though the economic
significance of the coefficient on cash flow is greater for the non BG firms (0.142 vs. 0.073).
This finding is consistent with the view that the investment of firms that belong to a business
group is less dependent on the availability of cash flow. Another interesting finding, which is
in line with our expectations, relates to the coefficient of the market to book ratio, which also
plays a significant role for the BG firms in determining investment during the crisis period.17
The estimation results in Panel B, where we estimate the investment model for the BG
and non BG firms with financial flexibility, reveal that the cash flow sensitivity of
investment becomes insignificant when we consider only those BG firms with financial
17
These findings, however, may be mainly driven by the economic conditions that characterized East Asian
countries during the crisis period. To this end, an interesting avenue for future research would be the
examination of the role of business groups in East Asia within a dynamic setting (i.e. before, during and after
the crisis). Indeed, two recent studies that focus on Korean firms view the crisis of 1997/1998 as a structural
break with respect to the investment behaviour and a shift towards stronger market orientation (see Rousseau
and Kim, 2008).

20
flexibility (Model 3). However, there is some evidence that the availability of internal funds
may still be important in determining the ability of firms to invest even though they have
financial flexibility through low leverage and high cash balances (Model 4). The economic
significance of the estimated coefficient on cash flow is similar to that of Model 2 but the
coefficient is only marginally significant. Although the findings in Panel B may suggest that
establishing financial flexibility may not be sufficient on its own to eliminate the adverse
effects of the crisis on investment, it is more important to analyze the impact of business
group affiliation among the less flexible firms in order to draw more definite conclusions.
We conduct this analysis in Models 5 and 6 in Panel C and find that the cash flow sensitivity
of investment is positive and significant for the less flexible firms regardless of whether they
are affiliated with a business group. Thus, in line with our earlier findings, financial
flexibility appears to be the main determinant of whether the investment expenditures of
firms are cash flow dependent during the crisis period. The economic significance of the
estimated coefficients in both sub samples is also very similar.
Overall, the results of Table 5 suggest that companies cannot count solely on a
business group affiliation to hedge against uncertain future contingencies, such as low
profitability, low cash flow and/or high cost of external financing. Also, it seems that a
sufficient level of financial flexibility can be attained through conservative leverage policies,
even for firms that do not belong to a business group.18
4. Financial Flexibility and Corporate Performance
Our analysis so far provides evidence that financial flexibility plays a crucial role in easing
firms’ cash flow shortfalls and their adverse effects on investment. In this section we directly
examine the performance consequences of establishing financial flexibility. The question
18
These results hold in models that use different proxies for flexibility (e.g. LL) and/or samples that exclude
companies with negative cash flow observations (the results are available upon request).

21
that we aim to address is whether establishing financial flexibility in the pre crisis period
enhances the relative performance of firms during the crisis period.
In addressing this question we use three performance measures, namely Tobin’s Q,
interest coverage ratio, and operating margin, as our dependent variables. These variables,
which have been extensively used in studies that analyze the performance of East Asian
firms prior and during the 1998 crisis (see Claessens et al., 2002; Allayannis, Brown and
Klapper, 2003; Lemmon and Lins, 2003; Lins, 2003), are regressed on a number of
independent variables including our main variable of interest, a dummy variable defining the
flexibility status of firms in the pre crisis period. To control for the impact of corporate
governance on performance, we follow Claessens et al. (2000) and include a set of dummy
variables as explanatory variables in our performance equation. More specifically, these
variables indicate whether: (i) ownership control rights of the largest owner exceed
ownership cash flow rights (Control vs. C.F. Rights); (ii) a company is controlled through a
pyramid structure (Pyramid); (iii) the largest shareholder is a widely held financial
institution (Financial Owner); and (iv) the CEO, the board chairman or vice chairman are
part of the controlling owner (Managerial Ownership). To control for the important role that
a business group affiliation can play on the performance of a company, we also include a
dummy variable that takes the value of unity if a firm belongs to a business group and zero
otherwise (Business Group). Finally, we also include the natural logarithm of total assets
(Size), the ratio of capital expenditures to total assets (Investment), and the country’s rule of
law score (Rule of Law) as control variables in the regression.
Following Claessens et al. (2002), the estimation is conducted using a random effects
GLS regression approach.19
To control for endogeneity problems, the dependent variable is
measured at time t while for the independent variables lagged values are used. Specifically,
business group affiliation, ownership dummies, rule of law measures and financial flexibility
19
The utilization of a fixed estimator is not possible given the static nature of some of the variables included in
our performance model. For completeness, however, we have also carried out the estimation using a maximum
likelihood estimator and obtained similar findings to the ones by the random effects estimator.
22
are measured at their pre crisis levels. For the remaining independent variables, namely size
and investment, one year lagged values are used. The results of the performance model
estimations are reported in Table 6. In Models 1, 3 and 5 financial flexibility is defined by
using the low leverage criterion (LL), whereas in Models 2, 4 and 6 the flexibility definition
is based on the low leverage and high cash criterion (LLHC).
Starting with Models 1 and 2, where firm performance is measured by Tobin’s Q, the
results show a positive and statistically significant relationship between financial flexibility
and performance under both definitions of flexibility. In economic terms, flexible firms
indicate a much higher Tobin’s Q (i.e. 14 percent higher according to Model 1 and 25.3
percent higher according to Model 2) than that of less flexible firms. We also find that firms
that are affiliated with a business group are more likely to have a greater Tobin’s Q ratio
than those firms without an affiliation. The results also reveal that the rule of law variable is
positive and statistically significant in Models 1 and 2, suggesting that firms in countries
with strong legal protection perform better than those firms in countries with weak legal
protection of minority shareholders. This finding is consistent with La Porta et al. (2002),
who also report a strong association between legal protection and firm performance in their
sample of 539 firms from 27 countries. The rest of the independent variables do not appear
to have a statistically significant impact on the performance of firms during the crisis period.
The results presented in Models 3 to 4 (for interest coverage ratio) and Models 5 to 6
(for operating margin) are generally similar to the ones reported so far. Specifically,
financial flexibility, business group and rule of law dummies affect performance positively.20
However, there are also important differences. For example, the coefficient on the variable
20
We note that some caution should be taken when interpreting the coefficients on flexibility proxies in Models
3 and 4. We are aware that the positive relationship between the interest coverage ratio and the (leverage)
financial flexibility dummy is generated by construction. However, there are reasons why the endogeneity
problem should not be as serious as one would suspect initially. First, notice that the flexibility measure is
based on firms’ leverage positions in the pre crisis period and performance is observed during the crisis.
Second, as reported earlier, low leverage, and hence flexible, firms of the pre crisis period increase their
leverage substantially, by about 44 percent, in the crisis period. Finally, the positive finding is also in line with
the summary statistics regarding the cash flow ratio given that the LL and LL-HC firms have the lowest drops
in their cash flows among all the sub groups of firms (see Table 3).
23
Pyramid is negative and statistically significant, possibly suggesting that firms controlled
through a pyramid structure do not perform as well as the others during the crisis. Also, the
results regarding the firm size are mixed. When we use the interest coverage ratio as the
dependent variable the relationship between size and performance is negative and
significant, whereas the relation becomes positive when performance is measured using the
firm’s operating margin. Using the latter definition, we also observe that managerial
ownership exerts a negative effect on firm performance, which is consistent with the view
that firms with senior managers being part of the controlling owners exhibit inferior
performance compared to firms that are run by independent senior managers. This implies
that the entrenchment effects of large shareholdings by the CEO or Chairman may dominate
the alignment incentive effect (see Claessens et al. 2002). Finally, in contrast to the results
reported in Models 1 and 2, the findings indicate that firms with greater investment
expenditures are also likely to perform better.
Among the remaining findings, it seems that the ownership variables, except for
managerial ownership, do not appear to play a significant role in affecting firm performance
of firms in the crisis period. Specifically, the estimated coefficients on Pyramid, Financial
Owner and Control vs. C.F rights in models 5 and 6 are statistically insignificant, leading to
the conclusion that agency problems between large and minority shareholders may not be
among the key drivers of performance in the crisis period. This finding is in line with the
results of Leung and Horwitz’s (2010) study, which focuses on the East Asian crisis and
presents supportive evidence for the alignment theory of large managerial shareholdings.
This evidence, however, is at odds with the findings of Claessens et al. (2002) who study the
relationship between equity ownership and firm value in eight East Asian markets and find
that the divergence between cash-flow ownership and control rights leads to a decrease in
performance. The difference in findings may be partly attributed to the different samples and
time-periods utilized across the two studies. For example, while Claessens et al. (2002)
study the performance of firms in the pre crisis period, our analysis focuses on the

24
performance of firms during the crisis period. This explanation seems reasonable given the
recent evidence by Wei and Zhang (2008) that the crisis altered the nature of agency
problems in which Asian corporations are exposed to. It is then likely that the effectiveness
of certain governance mechanisms/devices differs across different phases of the economic
cycle (see Wei and Zhang, 2008; Leung and Horwitz, 2010).
Overall, the findings reported in Table 6 suggest that a firm’s choice to establish
financial flexibility and participate in a business group in the pre crisis period affects its
performance positively during the crisis. However, flexibility through relatively high cash
and low leverage policies, and group affiliation does not necessarily work as substitutes in
helping firms to hedge against unexpected future contingencies. When we interact the
financial flexibility proxies with the business group dummy and include the underlying
interaction terms in the performance equation, the results indicate that the estimated
coefficient on the interaction terms are statistically insignificant in most of the regressions
(the results are available upon request). Our findings reiterate earlier findings regarding the
crucial role that financial flexibility can play during economic downturns. Also, the results
emphasize the benefits of participating in a business group, which seem to materialize for all
firms during a crisis period. In this respect, our study builds on the study of Claessens et al.
(2006), which indicates that a group membership in the pre crisis period is beneficial only
for mature firms with sluggish growth.
5. Further Checks
In the results reported so far we take financial flexibility as given without investigating
explicitly whether low leverage and high cash policies in the pre crisis period are optimal or
due to constraints arising from capital market imperfections. For example, we are aware of
the possibility that firms hold large cash balances and/or low levels of debt in their capital
structure because the cost of external finance is prohibitively high. Put differently, by using
low leverage and high cash holdings ratios as our classification criteria, we may be picking

25
up financially constrained firms and wrongly describing them as financially flexible. For
example, recent studies by Lins et al. (2008) and Hadlock and Pierce (2010), suggest that a
high level of cash holdings may relate to financial constraints in the sense that firms hold
elevated levels of cash for precautionary reasons. It is also possible that the observed flexible
policies prior to the crisis are simply random despite the performance enhancing effects of
such policies we observe during the crisis. To explore these possibilities we run several
important checks.
First, though we do not report the results in the paper, we estimate our baseline
investment equation in the pre crisis period for constrained and unconstrained groups using
firm characteristics such as size, age and dividend payout ratio. We find that, across all
measures, the cash flow ratio of firms has a positive and significant impact on investment for
both constrained and unconstrained firms, while the relationship between investment and the
market to book ratio is weak. The extent to which the cash flow sensitivity of investment can
be used to determine financially constrained firms, we cannot find any firm characteristics
which would enable us to distinguish between financially constrained and unconstrained
firms in the pre crisis period. Our analyses suggest that neither the flexible nor the less
flexible firms in our sample are likely to be constrained in the pre crisis period. The
summary statistics we report in Sections 2 and 3 mostly support this view. Specifically, as
noted earlier, the characteristics of the flexible firms in the crisis period are such that they
have greater growth opportunities, are smaller, and have higher dividend payout, cash flow
and investment ratios than the less flexible ones. The significant and persistent differences
between the characteristics of flexible and inflexible firms in both periods also rule out the
possibility that our classification of flexibility is driven by random behaviour of firms.
As a second robustness check, we put forward an additional measure of flexibility in
our analysis. Specifically, instead of simply looking at their cash and leverage policies at the
onset of the crisis, we also look at the changes in cash holdings in order to classify firms into
flexible and inflexible groups. Firms are classified as flexible ones if they have a low

26
leverage and high cash holdings at the onset of the crisis and, additionally, if their cash
holdings ratio does not drop during the crisis. An appealing feature of such classification
criterion is that it helps us distinguish because financially flexibility from financial
constraints. This is because financially constrained firms usually burn through their cash
reserves to meet their liquidity needs during a crisis (see Campello et al., 2010). Clearly, our
groups of flexible firms (as defined above) are not likely to include any constrained firms as
none of these groups includes firms that burn through their cash reserves. The results of our
empirical analysis remain qualitatively similar when the new flexibility proxy is used.
Another potential issue with our proxies for financial flexibility relates to the use of
median values for classifying firms into flexible and less flexible categories. For robustness
purposes, we estimate our investment and performance models again after using the 25% cut
off point for the classification. Specifically, a firm is classified as flexible (less flexible)
under the leverage criterion if its leverage ratio lies in the first (fourth) quartile of the
leverage distribution in the pre crisis period. Similarly, under the criterion that combines
both leverage and cash holdings, a firm is characterized as flexible (less flexible) if its
leverage ratio lies in the first (fourth) quartile of the leverage distribution and, also, its cash
ratio lies in the fourth (first) quartile of the cash distribution in the pre crisis period. Once
more the results are qualitatively similar to the ones reported so far. Specifically, flexible
firms seem to be less dependent on internal resources during the crisis and, also, exhibit
better performance than the others (see Panel A in Table 7 and Models 1, 4 and 7 in Table
8).
A further issue that needs investigation is the substitutability between cash and
leverage when they are considered as attributes of financial flexibility. Our analysis so far
provides some insights into the substitutability between the two variables by providing
separate results for the cases when only cash, only leverage and both cash and leverage are
used as classification criteria. Given the recent evidence by Acharya et al. (2007), which
suggests that cash should not be viewed as negative debt in the presence of financing

27
frictions, there is some scope for tackling the substitutability between cash and leverage in a
more formal way. To do so, we use the KZ-Index to classify firms into flexible and less
flexible groups. The main advantage of the KZ-Index is that it assigns different weights to
the cash and leverage variables. Firms are classified as flexible (less flexible) if they exhibit
a small (large) KZ-Score based on median values.21
Such classification scheme seems
reasonable given that firms assigned to the flexible group (low KZ firms) exhibit a lower
leverage ratio, a higher cash holdings ratio and, also, pay higher dividends and generate
more earnings (cash flow). These are among the main characteristics of flexible firms as
classified by our earlier criteria (see descriptive analysis in Table 2). Based on such
classifications, we repeat the estimation of the investment and performance equations. As
shown in Panel B of Table 7, the cash flow sensitivity of investment is positive and
statistically significant only in the case of less flexible firms. Also, consistent with our
previous findings, the proxy for financial flexibility retains a positive and statistically
significant coefficient in Models 2, 5 and 8 of Table 8.
A final issue that we tackle in our analysis is that of persistence. The financial
flexibility proxies used so far are based on average firm level information for cash and
leverage over the period 1994-1996 (pre crisis period). However, it is possible that cash and
leverage distributions evolve over time in a way that firms may be erroneously assigned to a
specific group. For example, a particularly high leverage ratio for a firm in 1994 may
contribute to a retentively high average leverage ratio for the 1994-1996 period,
independently of whether the firm may have significantly dropped its leverage ratio close to
the industry average in years 1995 and 1996 (just before the crisis). Although we partially
control for this problem by using different cut off points (i.e. median values vs. 25% cut off
points), an additional task is put forward to take into account the issue of persistence.
Specifically, we classify firms into flexible (less flexible) if they display both low (high)
21
Following Almeida et al. (2004) the KZ index is calculated using the following equation:
gsCashHoldinDividendsLeverageQCashFlowIndexKZ *315.1*368.39*139.3*283.0*002.1

28
leverage and high (low) cash for three consecutive years over the period 1994-1996. We then
estimate the investment and performance equations again. Similar to the previous cases, the
investment results do not differ materially from those reported so far. The performance
results, however, are clearly weaker with the flexibility proxy being statistically significant
only in Model 6 of Table 8. This finding is partly explained by the fact that the classification
criterion that is based on persistence is a rather strict criterion for classifying firms into
different groups, leading most of them to be assigned to the less flexible group.
6. Conclusions
Using a large sample of firms from five East Asian countries, we investigate the impact of
financial flexibility on corporate investment and performance during the 1997-1998 crisis.
We identify financially flexible firms on the basis of their cash and leverage policies using
several ranking criteria. Financial flexibility is measured using the pre crisis firm
characteristics, whereas the consequences of flexibility are tested following the investment
behaviour and the performance of firms during the crisis period.
The findings of our analysis suggest that leverage is the most important component
of flexibility. Specifically, while a low leverage policy at the onset of the crisis appears to be
particularly useful in financing investment expenditures during the crisis, it seems that most
of our firms in our sample do not spend cash reserves to fund future growth but, rather, use it
as a form of insurance against financial distress. We find that financially flexible firms invest
more than less flexible firms during the crisis. Moreover, the sensitivity of the investment
expenditures of flexible firms to the availability of internal funds is lower than that of the
less flexible firms. The current analysis also suggests that traditional measures of financial
constraints (e.g. business group affiliation, size, age and dividend payouts) are less useful
predictors of corporate investment behavior than the simple flexibility proxies utilized in this
study.

29
Overall, our results complement and extend those of previous studies on corporate
investment and performance. In particular, we present strong evidence that less flexible firms
are more vulnerable to sudden drops in their cash flows. More importantly, we find that
while the leverage policy and to a lesser extent the cash holding policy of firms are decisive
determinants of financial flexibility, business group affiliation of firms play a modest role in
maintaining corporate investment at a satisfactory level during the crisis period. These
findings reduce the ambiguity in the use of the term financial flexibility in the literature, as
mentioned in a recent survey by Byoun (2008b). In particular, if financial flexibility is
defined as the ability of a firm to access and restructure its financing to cope with uncertain
future contingencies, the group of firms with the highest ability to do so is that of relatively
low leverage and high cash. Additionally, our findings complement the ones of Duchin,
Ozbas and Sensoy (2010), who focus on the subprime mortgage credit crisis and observe
substantial declines in the investment of firms with low cash reserves and high short-term
debt. Finally, our analysis builds on existing studies that analyze the factors that affect
corporate performance during the East Asian crisis (see, e.g., Johnson et. al, 2000; Mitton,
2002; Fisman, 2002; Lemmon and Lins, 2003; Lins, 2003). In particular, it presents
overwhelming evidence that in addition to several corporate governance characteristics,
financial flexibility constitutes an important driver of performance during economic
downturns.
30
References
Acharya V, Almeida H, Campello M (2007) Is cash negative debt? A hedging perspective on
corporate financial policies. Journal of Financial Intermediation 16: 515-554.
Allayannis G, Mozumdar, A (2004) The impact of negative cash flow and influential
observations on investment-cash flow sensitivity estimates. Journal of Banking and
Finance 28: 901–930.
Allayannis G, Brown GW, Klapper LF (2003) Capital structure and financial risk: evidence
from foreign debt use in East Asia. Journal of Finance 57: 2667-2710.
Almeida H, Campello M, Weisbach MS (2004) The cash flow sensitivity of cash. Journal of
Finance 59: 1777–1804.
Bancel F, Mittoo UR (2004) Cross-country determinants of capital structure choice: a survey
of European firms. Financial Management 33: 103-132.
Bates TW, Kahle KM, Stulz RM (2008) Why do US firms hold so much more cash than they
used to? Journal of Finance 64: 1985-2021.
Berrospide JM, Purnanandam A, Rajan, U (2008) Corporate hedging, investment and value.
FEDS Working Paper 16.
Bhagat S, Moyen N, Suh I (2005) Investment and internal funds of distressed firms. Journal
of Corporate Finance 11: 449-472.
Billet MT, Garfinkel JA (2004) Financial flexibility and the cost of external finance for US
bank holding companies. Journal of Money, Credit and Banking 36: 827-852.
Billet MT, King TD, Mauer DC (2007) Growth opportunities and the choice of leverage,
debt maturity, and covenants. Journal of Finance 62: 697-730.
Brounen D, De Jong A, Koedijk K (2006) Capital structure policies in Europe: survey
evidence. Journal of Banking and Finance 30: 1409-1442.
Byoun S (2008a) How and when do firms adjust their capital structures toward targets?
Journal of Finance 63: 3069-3096.
Byoun S (2008b) Financial flexibility and capital structure decision. Baylor University,
Working Paper.
Campello M, Graham JR, Harvey CR (2010) The real effects of financial constraints:
evidence from a financial crisis. Journal of Financial Economics 97: 470-487
Carpenter RE, Guariglia A (2008) Cash flow, investment and investment opportunities: new
tests using UK panel data. Journal of Banking and Finance 32: 1894-1906.
Claessens S, Fan JPH, Lang LHP (2006) The benefits and costs of group affiliation:
evidence from East Asia. Emerging Markets Review 7: 1-26.
31
Claessens S, Djankov S, Lang LHP (2000) The separation of ownership and control in east
Asian corporations. Journal of Financial Economics 58: 81-112.
Claessens S, Djankov S, Fan JPH, Lang LHP (2002) Disentangling the incentive and
entrenchment of large shareholdings. Journal of Finance 57: 2741-2771.
Cleary S (1999) The relationship between firm investment and financial status. Journal of
Finance 54: 673-692
Cleary S (2006) International corporate investment and the relationships between financial
constraint measures. Journal of Banking and Finance 30: 1559-1580.
DeAngelo H, DeAngelo L (2007) Capital structure, payout policy, and financial flexibility.
Marshall School of Business Working Paper.
Ding W, Domac I, Ferri G (1998) Is there a credit crunch in East Asia? The World Bank
Policy Research Working Paper: No 1959.
Dittmar A, Mahrt-Smith J (2007) Corporate governance and the value of cash holdings.
Journal of Financial Economics 83: 599-634
Duchin R, Ozbas O, Sensoy BA (2010) Costly external finance, corporate investment and
the subprime mortgage crisis. Journal of Financial Economics 97: 418-435.
Faulkender M, Wang R (2006) Corporate financial policy and the value of cash. Journal of
Finance 61, 1957-1990.
Fazzari SM, Hubbard RG, Petersen BC (1988) Financing constraints and corporate
investment. Brookings Papers on Economic Activity 1: 141-206.
Fisman R (2002) Estimating the value of political connections. American Economic Review
91: 1095-1102.
Froot KA, Scharfstein DS, Stein JC (1993) Risk management: coordinating corporate
investment and financing policies. Journal of Finance 48: 1629–1658
Gamba A, Triantis A (2008) The value of financial flexibility. Journal of Finance 63: 2263 -
2296.
Gatchev VA, Pulvino T, Tarhan V (2010) The interdependent and intertemporal nature of
financial decisions: an application to cash flow sensitivities. Journal of Finance 65: 725-
763.
Gilchrist S, Himmelberg CP (1998) Investment, fundamentals, and finance, in B Bernanke,
JJ Rotemberg, Eds, NBER Macroeconomics Annual. Cambridge. MIT Press.
Goldstein R, Ju N, Leland H (2001) An EBIT-based model of optimal capital structure.
Journal of Business 74: 483–512.
32
Goyal VK, Yamada T (2004) Asset price shocks, financial constraints, and investment:
evidence from Japan. Journal of Business 77: 175-199.
Graham JR, Harvey CR (2001) The theory and practice of corporate finance: evidence from
the field. Journal of Financial Economics 61: 187-243.
Guariglia A (2008) Internal financial constraints, external financial constraints and
investment choice: evidence from a panel of UK firms. Journal of Banking and Finance
32: 1795-1809.
Gul FA, Kealey BT (1999) Chaebol, investment opportunity set and corporate debt and
dividend policies of Korean companies. Review of Quantitative Finance and Accounting
13: 401-416.
Hadlock CJ (1998) Ownership, liquidity, and investment. RAND Journal of Economics 29:
487–508.
Hadlock CJ, Pierce JR (2010) Does the KZ index provide a useful measure of financial
constraints. Review of Financial Studies 23: 1909-1940.
Harford J, Mansi S, Maxwell W (2008) Corporate governance and firm cash holdings in the
US. Journal of Financial Economics 87: 535-555.
Hovakimian G (2009) Determinants of investment cash flow sensitivity. Financial
Management 38: 196-183.
Hubbard RG, Kashyap AK, Whited TM (1995) Internal finance and firm investment. Journal
of Money, Credit and Banking 27: 683-701.
Johnson S, Boone P, Breach A, Friedman E (2000) Corporate governance in the Asian
financial crisis. Journal of Financial Economics 58: 141-186.
Kalcheva I, Lins KV (2007) International evidence on cash holdings and expected
managerial agency problems. Review of Financial Studies 20: 1087-1112.
Kang J, Kim J-S (2006) Private benefits of control and firm leverage: An analysis of Korean
firms. Review of Quantitative Finance and Accounting 27: 439-463.
Kaplan SN, Zingales L (1997) Do investment-cash flow sensitivities provide useful
measures of financing constraints? Quarterly Journal of Economics 112: 169-215.
Khanna T, Palepu K (2000) Is group affiliations profitable in emerging markets? An analysis
of diversified Indian business groups. Journal of Finance 55: 867-891.
La Porta R, Lopez-de-Silanes F, Shleifer A, Vishny RW (1998) Law and finance. Journal of
Political Economy 106: 1113-1155.
La Porta R, Lopez-de-Silanes F, Shleifer A, Vishny RW (2002) Investor protection and
corporate valuation. Journal of Finance 57: 1147-1170.

33
Lemmon ML, Lins KV (2003) Ownership structure, corporate governance, and firm value:
evidence from the East Asian financial crisis. Journal of Finance 58: 1445–1468.
Leung S, Horwitz B (2010) Corporate governance and firm value during a financial crisis.
Review of Quantitative Finance and Accounting 34: 459-481.
Lins KV (2003) Equity ownership and firm value in emerging markets. Journal of Financial
and Quantitative Analysis 38: 159-184.
Lins KV, Servaes H, Tufano P (2010) What drives corporate liquidity? An international
survey of cash holdings and lines of credit. Journal of Financial Economics 98: 160-196.
Mitton T (2002) A cross-firm analysis of the impact of corporate governance on the East
Asian financial crisis. Journal of Financial Economics 64: 215-241.
Myers SC (1984) The capital structure puzzle. Journal of Finance 39: 575-592
Myers SC, Majluf NS (1984) Corporate financing and investment decisions when firms have
information that investors do not have. Journal of Financial Economics 13, 187-221.
Nixson FI, Walters B (1999) The Asian crisis: causes and consequences. The Manchester
School 67: 496-523.
Opler T, Pinkowitz L, Stulz R, Williamson R (1999) The determinants and implications of
corporate cash holdings. Journal of Financial Economics
52: 3-46.
Radelet S, Sachs J (1998) The onset of the east Asian financial crisis, in P Krugman, Ed,
Currency crises National Bureau of Economic Research, Chicago University of Chicago
Press.
Riddick LA, Whited TM (2008) The corporate propensity to save. Journal of Finance 64:
1729-1766
Rousseau PL, Kim JH (2008) A flight to Q? Firm investment and financing in Korea before
and after the 1997 financial crisis. Journal of Banking and Finance 32: 1416-1429.
Wei JKC, Zhang Y (2008) Ownership structure, cash flow, and capital investment: evidence
from East Asian economies before the financial crisis. Journal of Corporate Finance 14:
118-132.
Winters J A (1999) The determinant of financial crisis in Asia, in TJ Pempel, Ed, The
politics of the Asian economic crisis, Ithaca, NY, Cornell University Press.
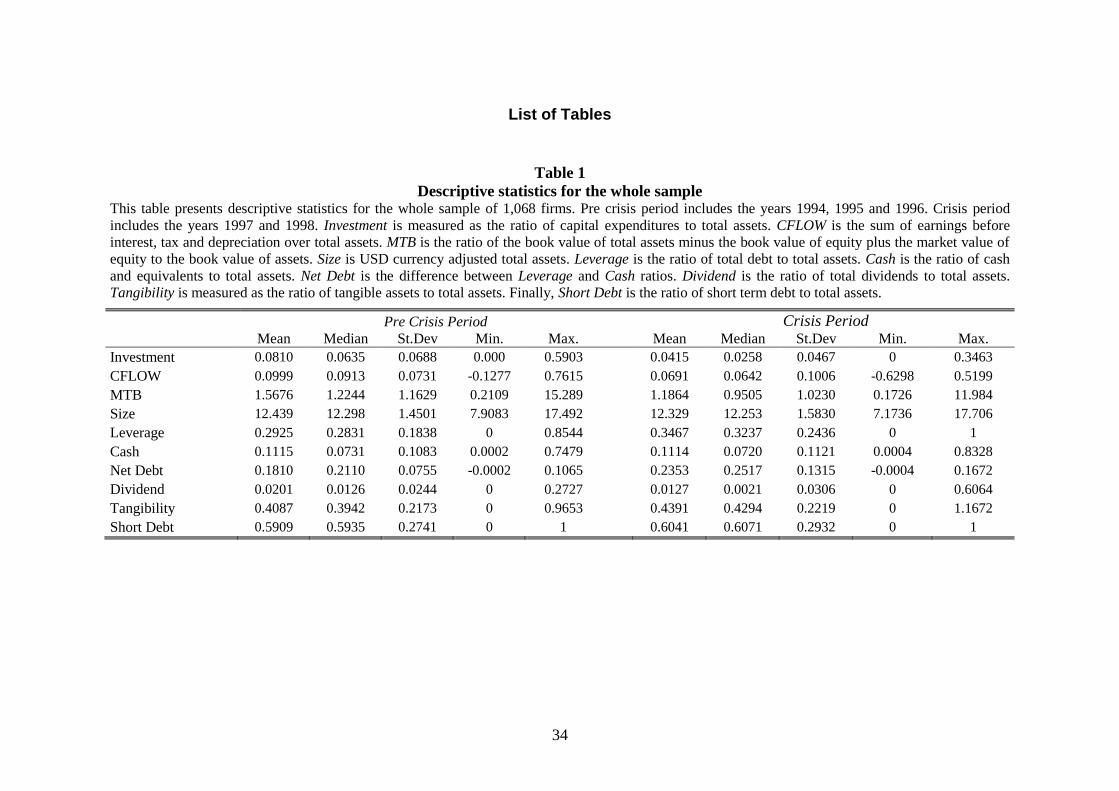
34
List of Tables
Table 1
Descriptive statistics for the whole sample This table presents descriptive statistics for the whole sample of 1,068 firms. Pre crisis period includes the years 1994, 1995 and 1996. Crisis period
includes the years 1997 and 1998. Investment is measured as the ratio of capital expenditures to total assets. CFLOW is the sum of earnings before
interest, tax and depreciation over total assets. MTB is the ratio of the book value of total assets minus the book value of equity plus the market value of
equity to the book value of assets. Size is USD currency adjusted total assets. Leverage is the ratio of total debt to total assets. Cash is the ratio of cash
and equivalents to total assets. Net Debt is the difference between Leverage and Cash ratios. Dividend is the ratio of total dividends to total assets.
Tangibility is measured as the ratio of tangible assets to total assets. Finally, Short Debt is the ratio of short term debt to total assets.
Pre Crisis Period Crisis Period Mean Median St.Dev Min. Max. Mean Median St.Dev Min. Max.
Investment 0.0810 0.0635 0.0688 0.000 0.5903 0.0415 0.0258 0.0467 0 0.3463
CFLOW 0.0999 0.0913 0.0731 -0.1277 0.7615 0.0691 0.0642 0.1006 -0.6298 0.5199
MTB 1.5676 1.2244 1.1629 0.2109 15.289 1.1864 0.9505 1.0230 0.1726 11.984
Size 12.439 12.298 1.4501 7.9083 17.492 12.329 12.253 1.5830 7.1736 17.706
Leverage 0.2925 0.2831 0.1838 0 0.8544 0.3467 0.3237 0.2436 0 1
Cash 0.1115 0.0731 0.1083 0.0002 0.7479 0.1114 0.0720 0.1121 0.0004 0.8328
Net Debt 0.1810 0.2110 0.0755 -0.0002 0.1065 0.2353 0.2517 0.1315 -0.0004 0.1672
Dividend 0.0201 0.0126 0.0244 0 0.2727 0.0127 0.0021 0.0306 0 0.6064
Tangibility 0.4087 0.3942 0.2173 0 0.9653 0.4391 0.4294 0.2219 0 1.1672
Short Debt 0.5909 0.5935 0.2741 0 1 0.6041 0.6071 0.2932 0 1

35
Table 2
Descriptive statistics for different subgroups of firms This table presents descriptive statistics for the following subgroups of firms (all classifications are based on
median values): high leverage (HL) firms; low leverage (LL) firms; high cash (HC) firms; low cash (LC) firms;
low leverage and high cash (LL-HC) firms; high leverage and low cash (HL-LC) firms. Pre Crisis Period includes
the years 1994, 1995 and 1996. Crisis Period includes the years 1997 and 1998. Investment is measured as the
ratio of capital expenditures to total assets. CFLOW is sum of earnings before interest, tax and depreciation over
total assets. MTB is the ratio of book value of total assets minus the book value of equity plus the market value of
equity to book value of assets. Size is USD currency adjusted total assets. Leverage is the ratio of total debt to
total assets. Cash is the ratio of cash and equivalents to total assets. Net Debt is the difference between Leverage
and Cash ratios. Dividend is the ratio of total dividends to total assets. Tangibility is measured as the ratio of
tangible assets to total assets. Finally, Short Debt is ratio of short term debt to total assets.
Panel A: Pre Crisis Period
(A.1) (A.2) (A.3)
HL firms
LL firms
t-test HC
firms LC
firms t-test
LL-HC
firms HL-LC firms
t-test
Investment 0.0856 0.0764 -2.17** 0.0803 0.0818 -0.31 0.0752 0.0842 -1.71*
CFLOW 0.0834 0.1160 7.45*** 0.1081 0.0916 3.70*** 0.1230 0.0808 6.92***
MTB 1.4358 1.6998 3.73*** 1.6885 1.4488 3.37*** 1.8486 1.4182 4.39***
Size 12.656 12.227 -4.88*** 12.432 12.442 -0.11 12.190 12.572 -3.29***
Leverage 0.4249 0.1605 -33.76*** 0.2562 0.3283 -6.52*** 0.1451 0.4332 -27.57***
Cash 0.0852 0.1379 8.18*** 0.1848 0.0383 29.96*** 0.2079 0.0374 24.73***
Net Debt 0.3397 0.0226 -28.02*** 0.0714 0.2901 -16.40*** -0.0628 0.3958 -32.45***
Dividend 0.0127 0.0272 10.17*** 0.0230 0.0170 4.09*** 0.0290 0.0113 9.09***
Tangibility 0.4137 0.4040 -0.72 0.3574 0.4609 -8.00*** 0.3501 0.4474 -5.98***
Short Debt 0.5483 0.6355 5.18*** 0.5859 0.5961 -0.60 0.6328 0.5652 3.11***
Panel B: Crisis Period
(B.1) (B.2) (B.3)
HL firms
LL firms
t-test HC
firms LC
firms t-test
LL-HC
firms HL-LC Firms
t-test
Investment 0.0373 0.0456 2.89** 0.0433 0.0397 1.26 0.0467 0.0365 2.70***
CFLOW 0.0553 0.0831 4.54*** 0.0765 0.0617 2.40** 0.0871 0.0513 4.57***
MTB 1.1621 1.2033 0.66 1.2495 1.1228 2.02** 1.3091 1.1580 1.65
Size 12.530 12.139 -4.05*** 12.370 12.287 0.85 12.167 12.441 -2.17**
Leverage 0.4630 0.2307 -17.65*** 0.3115 0.3823 -4.77*** 0.2057 0.4649 -15.44**
Cash 0.0876 0.1350 7.05*** 0.1513 0.0706 12.64*** 0.1732 0.0626 13.14***
Net Debt 0.3754 0.1020 -16.90*** 0.1602 0.3117 -8.29*** 0.0325 0.4023 -17.47***
Dividend 0.0059 0.0194 7.34*** 0.0155 0.0098 3.03*** 0.0213 0.0050 7.95***
Tangibility 0.4456 0.4323 -0.98 0.4032 0.4764 -5.44 0.3925 0.4666 -4.25***
Short Debt 0.5803 0.6275 2.58** 0.6110 0.5975 0.73 0.6298 0.5756 2.23**

36
Table 3
Percentage changes of key variables from pre crisis to crisis period for different
subgroups of firms This table presents percentage changes of key variables from pre crisis to crisis period for the
following subgroups of firms (all classifications are based on median values): high leverage (HL)
firms; low leverage (LL) firms; high cash (HC) firms; low cash (LC) firms; low leverage and high
cash (LL-HC) firms; high leverage and low cash (HL-LC) firms. Pre Crisis Period includes the years
1994, 1995 and 1996. Crisis Period includes the years 1997 and 1998. Investment is measured as the
ratio of capital expenditures to total assets. CFLOW is the sum of earnings before interest, tax and
depreciation over total assets. MTB is the ratio of book value of total assets minus the book value of
equity plus the market value of equity to book value of assets. Size is USD currency adjusted total
assets. Leverage is the ratio of total debt to total assets. Cash is the ratio of cash and equivalents to
total assets. Net Debt is the difference between Leverage and Cash ratios. Dividend is the ratio of
dividends to total assets. Tangibility is measured as the ratio of tangible assets to total assets. Short
Debt is ratio of short term debt to total assets. Finally, Δ symbolises the change, while and denote
increase and decrease respectively.
HL
firms LL
firms HC
firms LC
firms LL-HC firms
HL-LC firms
Δ in Investment 56.43 40.31 46.08 51.47 37.90 56.65
Δ in CFLOW 33.69 28.36 29.23 32.64 29.19 36.51
Δ in MTB 19.06 29.21 26.00 13.76 29.18 18.35
Δ in Size 1.00 0.72 0.50 1.25 0.19 1.04
Δ in Leverage 8.97 43.74 21.59 16.45 41.76 7.32
Δ in Cash 2.82 2.10 18.13 84.33 16.69 67.38
Δ in Net Debt 10.51 351.3 124.4 7.41 152.8 1.64
Δ in Dividend 53.54 28.68 32.61 42.35 26.55 55.75
Δ in Tangibility 7.71 7.00 12.81 3.36 12.11 4.29
Δ in Short Debt 5.84 1.26 4.28 0.23 0.47 1.84
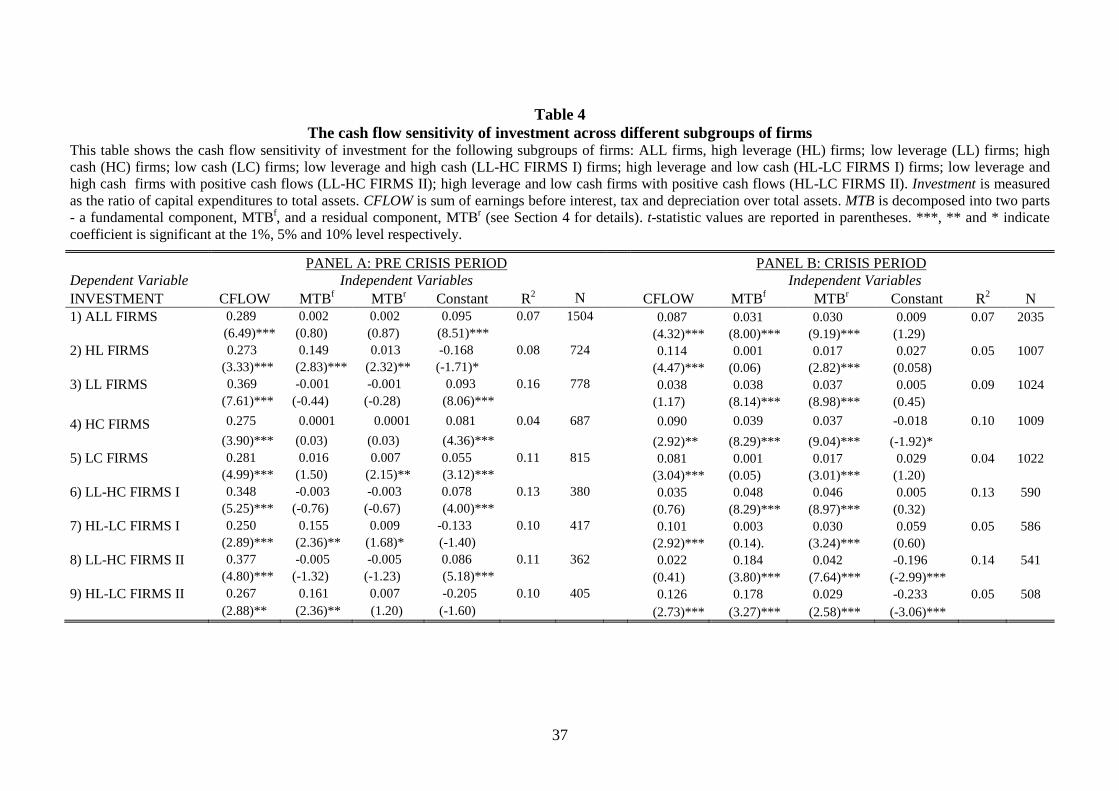
37
Table 4
The cash flow sensitivity of investment across different subgroups of firms This table shows the cash flow sensitivity of investment for the following subgroups of firms: ALL firms, high leverage (HL) firms; low leverage (LL) firms; high
cash (HC) firms; low cash (LC) firms; low leverage and high cash (LL-HC FIRMS I) firms; high leverage and low cash (HL-LC FIRMS I) firms; low leverage and
high cash firms with positive cash flows (LL-HC FIRMS II); high leverage and low cash firms with positive cash flows (HL-LC FIRMS II). Investment is measured
as the ratio of capital expenditures to total assets. CFLOW is sum of earnings before interest, tax and depreciation over total assets. MTB is decomposed into two parts
- a fundamental component, MTBf, and a residual component, MTB
r (see Section 4 for details). t-statistic values are reported in parentheses. ***, ** and * indicate
coefficient is significant at the 1%, 5% and 10% level respectively.
PANEL A: PRE CRISIS PERIOD PANEL B: CRISIS PERIOD Dependent Variable Independent Variables Independent Variables
INVESTMENT CFLOW MTBf
MTBr
Constant R2 N CFLOW MTB
f MTB
r Constant R
2 N 1) ALL FIRMS 0.289 0.002 0.002 0.095 0.07 1504 0.087 0.031 0.030 0.009 0.07 2035
(6.49)*** (0.80) (0.87) (8.51)*** (4.32)*** (8.00)*** (9.19)*** (1.29)
2) HL FIRMS 0.273 0.149 0.013 -0.168 0.08 724 0.114 0.001 0.017 0.027 0.05 1007
(3.33)*** (2.83)*** (2.32)** (-1.71)* (4.47)*** (0.06) (2.82)*** (0.058)
3) LL FIRMS 0.369 -0.001 -0.001 0.093 0.16 778 0.038 0.038 0.037 0.005 0.09 1024
(7.61)*** (-0.44) (-0.28) (8.06)*** (1.17) (8.14)*** (8.98)*** (0.45)
4) HC FIRMS 0.275 0.0001 0.0001 0.081 0.04 687 0.090 0.039 0.037 -0.018 0.10 1009
(3.90)*** (0.03) (0.03) (4.36)*** (2.92)** (8.29)*** (9.04)*** (-1.92)*
5) LC FIRMS 0.281 0.016 0.007 0.055 0.11 815 0.081 0.001 0.017 0.029 0.04 1022
(4.99)*** (1.50) (2.15)** (3.12)*** (3.04)*** (0.05) (3.01)*** (1.20)
6) LL-HC FIRMS I 0.348 -0.003 -0.003 0.078 0.13 380 0.035 0.048 0.046 0.005 0.13 590
(5.25)*** (-0.76) (-0.67) (4.00)*** (0.76) (8.29)*** (8.97)*** (0.32)
7) HL-LC FIRMS I 0.250 0.155 0.009 -0.133 0.10 417 0.101 0.003 0.030 0.059 0.05 586
(2.89)*** (2.36)** (1.68)* (-1.40) (2.92)*** (0.14). (3.24)*** (0.60)
8) LL-HC FIRMS II 0.377 -0.005 -0.005 0.086 0.11 362 0.022 0.184 0.042 -0.196 0.14 541
(4.80)*** (-1.32) (-1.23) (5.18)*** (0.41) (3.80)*** (7.64)*** (-2.99)***
9) HL-LC FIRMS II 0.267 0.161 0.007 -0.205 0.10 405 0.126 0.178 0.029 -0.233 0.05 508
(2.88)** (2.36)** (1.20) (-1.60) (2.73)*** (3.27)*** (2.58)*** (-3.06)***
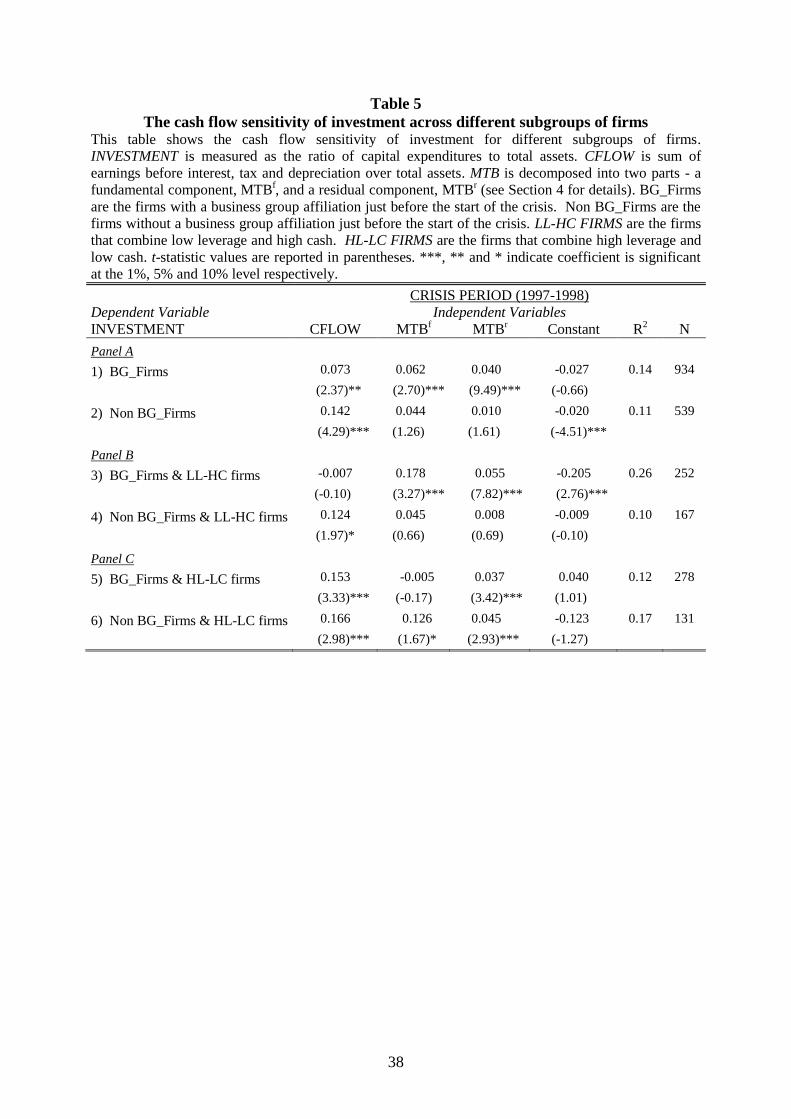
38
Table 5
The cash flow sensitivity of investment across different subgroups of firms This table shows the cash flow sensitivity of investment for different subgroups of firms.
INVESTMENT is measured as the ratio of capital expenditures to total assets. CFLOW is sum of
earnings before interest, tax and depreciation over total assets. MTB is decomposed into two parts - a
fundamental component, MTBf, and a residual component, MTB
r (see Section 4 for details). BG_Firms
are the firms with a business group affiliation just before the start of the crisis. Non BG_Firms are the
firms without a business group affiliation just before the start of the crisis. LL-HC FIRMS are the firms
that combine low leverage and high cash. HL-LC FIRMS are the firms that combine high leverage and
low cash. t-statistic values are reported in parentheses. ***, ** and * indicate coefficient is significant
at the 1%, 5% and 10% level respectively.
CRISIS PERIOD (1997-1998) Dependent Variable Independent Variables INVESTMENT CFLOW MTB
f MTB
r Constant R
2 N
Panel A
1) BG_Firms 0.073 0.062 0.040 -0.027 0.14 934
(2.37)** (2.70)*** (9.49)*** (-0.66)
2) Non BG_Firms 0.142 0.044 0.010 -0.020 0.11 539
(4.29)*** (1.26) (1.61) (-4.51)***
Panel B
3) BG_Firms & LL-HC firms -0.007 0.178 0.055 -0.205 0.26 252
(-0.10) (3.27)*** (7.82)*** (2.76)***
4) Non BG_Firms & LL-HC firms 0.124 0.045 0.008 -0.009 0.10 167
(1.97)* (0.66) (0.69) (-0.10)
Panel C
5) BG_Firms & HL-LC firms 0.153 -0.005 0.037 0.040 0.12 278
(3.33)*** (-0.17) (3.42)*** (1.01)
6) Non BG_Firms & HL-LC firms 0.166 0.126 0.045 -0.123 0.17 131
(2.98)*** (1.67)* (2.93)*** (-1.27)

39
Table 6
Performance of firms during the crisis period
This table presents the results from our performance models. Tobin’s Q is measured as the ratio of book value of
total assets minus the book value of equity plus the market value of equity to book value of assets. Interest
Coverage Ratio is measured as earnings before interest and tax dividend by interest expense. Operating Margin
is obtained by dividing operating income to sales. In models 1, 3 and 5 (2, 4 and 6) Flexibility is a dummy
variable that takes the value of 1 if the firms belongs to the LL (or LL-HC) group and zero otherwise at the onset
of the crisis. Investment is measured as the ratio of investment in fixed assets to total assets. Business Group is a
dummy variable that takes the value of unity if the firm belongs to a business group and zero otherwise. Pyramid
is a dummy variable indicating whether the firm is controlled through a pyramid structure. Financial Owner is a
dummy variable indicating whether the largest shareholder is a widely held financial institution or not. Control
vs. C.F. Rights is a dummy variable that takes the value of unity if control rights of the largest owner exceed cash
flow rights and zero otherwise. Managerial Ownership is a dummy variable if the CEO, the board chairman or
vice chairman are part of the controlling owner. Rule of Law is a score that ranges from 0 to 11, lower scores
corresponding to less tradition to law and order. Finally, Size is the USD currency adjusted total assets. t-statistic
values are reported in parentheses. ***, ** and * indicate coefficient is significant at the 1%, 5% and 10% level
respectively.
Dependent Variable=
Tobin’Q
Dependent Variable=
Interest Coverage Ratio
Dependent Variable=
Operating Margin
Independent Variables Model
(1)
Model
(2)
Model
(3)
Model
(4)
Model
(5)
Model
(6)
Flexibility (LL)
0.140
(2.13)**
-
2.123
(8.02)***
-
0.023
(2.43)**
-
Flexibility (LL-HC) - 0.253
(3.47)*** -
2.369
(8.00)*** -
0.018
(1.68)*
Investment 0.566
(1.13)
0.549
(1.10)
5.195
(2.89)***
5.266
(2.93)***
0.134
(2.28)**
0.136
(2.31)**
Business Group 0.159
(2.05)**
0.167
(2.17)**
0.718
(2.30)**
0.822
(2.63)***
0.022
(1.95)*
0.024
(2.04)**
Pyramid -0.012
(-0.10)
-0.010
(-0.08)
-1.181
(-2.24)**
-1.208
(-2.29)**
-0.033
(-1.69)*
-0.033
(-1.72)*
Financial Owner 0.025
(0.15)
0.022
(0.13)
0.216
(0.32)
0.161
(0.24)
-0.013
(-0.55)
-0.014
(-0.58)
Control vs. C.F. Rights -0.093
(-0.74)
-0.104
(-0.84)
0.511
(1.01)
0.456
(0.90)
0.018
(0.98)
0.018
(0.98)
Managerial Ownership -0.524
(-0.74)
0.009
(0.11)
-0.481
(-1.45)
-0.524
(-1.59)
-0.026
(-2.17)**
-0.007
(-2.17)**
Rule of Law 0.104
(2.77)***
0.106
(2.93)***
0.785
(5.22)***
0.944
(6.48)***
-0.010
(-1.46)
-0.008
(-1.45)
Size 0.003
(0.16)
0.003
(0.14)
-0.327
(-3.65)***
-0.327
(-3.65)***
0.015
(4.52)***
0.014
(4.27)***
Number of Observations 1,010 1,010 1,010 1,010 1,010 1,010
Adjusted R2 0.037 0.048 0.1935 0.1935 0.103 0.098

40
Table 7
The cash flow sensitivity of investment across different flexibility subgroups
This table shows the cash flow sensitivity of investment for different flexibility subgroups of firms. In Panel A, a
firm is characterized as LL-HC (HL-LC) if its leverage ratio lies in the first (fourth) quartile of the leverage
distribution, and, also its cash ratio lies in the fourth (first) quartile of the cash distribution. In Panel B, the
classification of the firms is based on the median values of the KZ-Index which is calculated as 1.002* CashFlow
0.283*Q 3.139 *Leverage 39.368*Dividends 1.315*CashHolding. Flexible Firms (Inflexible Firms) are the
ones that exhibit a small (large) KZ-score (based on median values). Panel C focuses on the persistency of firms in
adopting and retaining a specific policy. Specifically, a firm is called as LL-HC (HL-LC) if it displays both low
(high) leverage and high (low) cash for the three consecutive years of 1994, 1995 and 1996. INVESTMENT is
measured as the ratio of capital expenditures to total assets. CFLOW is sum of earnings before interest, tax and
depreciation over total assets. MTB is decomposed into two parts - a fundamental component, MTBf, and a residual
component, MTBr (see Section 4 for details). t-statistic values are reported in parentheses. ***, ** and * indicate
coefficient is significant at the 1%, 5% and 10% level respectively.
Dependent Variable Independent Variables
INVESTMENT CFLOW MTBf MTB
r Constant R
2 N
Panel A: 25th
& 75th
Percentiles
1) LL-HC FIRMS -0.072 0.178 0.058 -0.119 0.25 218
(-0.88) (2.89)*** (7.45)*** (-1.79)*
2) HL-LC FIRMS 0.157 0.154 0.009 -0.129 0.08 177
(2.37)** (1.66)* (0.47) (-1.35)
Panel B: KZ-Index
1) FLEXIBLE FIRMS 0.050 0.040 0.038 0.014 0.09 988
(1.40) (7.86)*** (8.58)*** (1.02)
2) LESS FLEXIBLE FIRMS 0.095 0.003 0.020 0.047 0.05 967
(3.80)*** (0.16) (3.24)*** (2.77)***
PanelC: Persistency
1) LL-HC FIRMS 0.079 0.031 0.031 0.029 0.25 139
(1.33) (4.05)*** (4.05)*** (2.08)**
2) HL-LC FIRMS 0.081 0.055 0.004 0.002 0.06 876
(3.00)*** (2.00)** (0.75) (0.07)

41
Table 8
Performance of firms during the crisis period across different flexibility subgroups This table presents the results from the performance models as estimated across the different flexibility subgroups of firms. In models 1, 4, 7; LL-HC (25
th & 75
th
Percentiles) is a dummy variable that takes the value of 1 for firms that have their leverage ratio lying in the first quartile of the leverage distribution, and, also their cash ratio lying
in the fourth quartile of the cash distribution, and zero otherwise. In models 2, 5, 8; LL- HC (Persistence) is a dummy variable that takes the value of 1 for firms that fit into the
category of low leverage and high cash for the three consecutive years of 1994, 1995 and 1996, and zero otherwise. In models 3, 6, 9; Flexibility (KZ-Index) is a dummy variable that
takes the value of 1 for firms that exhibit a below median KZ-score, which is measured as 1.002* CFLOW 0.283*Q 3.139 *Leverage 39.368*Dividends
1.315*CashHolding, and zero otherwise. Analytical definitions for the variables Tobin’s Q, Interest Coverage Ratio, Operating Margin, Investment, Business Group, Financial
Owner, Control vs. C.F. Rights, Managerial Ownership, Rule of Law and Size are provided in Table 6. t-statistic values are reported in parentheses. ***, ** and * indicate coefficient
is significant at the 1%, 5% and 10% level respectively.
Dependent Variable:
Tobin’s Q
Dependent Variable:
Interest Coverage Ratio
Dependent Variable:
Operating Margin
Independent Variables Model (1) Model (2) Model (3) Model (4) Model (5) Model (6) Model (7) Model (8) Model (9)
LL- HC (25th
& 75th
Percentiles) 0.432 - - 3.417 - - 0.042 - -
(4.01)*** (7.76)*** (2.62)***
LL- HC (Persistence) - - 0.187 - - 2.142 - - -0.006
(1.48) (4.03)*** (-0.31)
Flexibility (KZ-Index) - 0.121 - - 2.882 - - 0.045 -
(1.75)* (10.40)*** (4.25)***
Investment 0.564 0.600 0.605 5.408 5.130 5.375 0.136 0.133 0.140
(1.13) (1.21) (1.20) (3.00)*** (2.89)*** (2.94)*** (2.31)** (2.22)** (2.38)**
Business Group 0.151 0.147 0.160 0.698 0.864 0.746 0.022 0.024 0.023
(1.97)** (1.98)** (2.05)** (2.23)** (2.88)*** (2.28)** (1.92)* (2.11)** (2.03)**
Pyramid -0.018 0.014 -0.030 -1.289 -1.264 -1.417 -0.034 -0.034 -0.034
(-0.14) (0.11) (-0.23) (-2.44)** (-2.53)** (-2.57)** (-1.75)* (-1.77)* (-1.75)*
Financial Owner 0.047 0.043 0.008 0.358 0.439 0.002 -0.012 -0.011 -0.014
(0.29) (0.27) (0.05) (0.53) (0.69) (0.00) (-0.48) (-0.45) (-0.56)
Control vs. C.F. Rights -0.062 -0.075 -0.081 0.826 0.636 0.691 0.022 0.018 0.020
(-0.50) (-0.63) (-0.64) (1.62) (1.32) (1.30) (1.18) (0.99) (1.06)
Managerial Ownership 0.001 -0.045 -0.012 -0.632 -0.542 -0.705 -0.028 -0.028 -0.030
(0.01) (-0.58) (-0.15) (-1.91)* (-1.72)* (-2.05)** (-2.30)** (-2.35)** (-2.47)**
Rule of Law 0.102 0.123 0.128 0.947 1.008 1.149 -0.009 -0.008 -0.006
(2.83)*** (3.56)*** (3.54)*** (6.48)*** (7.32)*** (7.69)*** (-1.64) (-1.48) (-1.15)
Size 0.008 0.001 -0.006 -0.365 -0.335 -0.476 0.014 0.015 0.013
(0.35) (0.04) (-0.27) (-4.10)*** (-3.94)*** (-5.20)*** (4.48)*** (4.65)*** (4.08)***
Number of Observations 1,010 986 1,010 1,010 986 1,010 1,010 986 1,010
Adjusted R2 0.053 0.037 0.034 0.190 0.250 0.130 0.104 0.127 0.094