financial analysis of j sainsbury plc
TRANSCRIPT

This report is all about financial and non-
financial analysis of J Sainsbury Plc. It was
established in 1869 and today it is one of
the leading players in supermarket having
537 supermarkets and 335 convenience
stores. In recent years, Company has
improved its financial and non-financial
performance. Its ROE and ROC are better
than its competitors.
Managing Financial Resources 2010/11 Assignment Module: Managing Financial
Resources Jitender Singh

2 | P a g e
Managing Financial Resources Leeds Metropolitan University
Table of Content
S.No Contents Page
No.
1 Executive Summary 3
2 Introduction to Company 3
3 Aim and Objectives 3
4 Financial Accounting Concepts and Principles and Their Uses to Evaluate
Business Performance
4
5 Impact of Financial Accounting Concepts upon Corporate Reporting on
the Financial and Non-financial Performance of an Organisation
4
6 UK GAAP and Changes in Accounting Standards 5
7 Accounting Policies Adopted by the Company 5
8 Ratio Analysis 6-10
9 Comparison between J Sainsbury Plc and WM Morrison Supermarket Plc 10-12
10 Limitation of Ratio Analysis 12-13
11 The Role of Management Accounting in Evaluating the Business
Performance
13
12 Non-financial evaluation using management strategic techniques 13-14
13 Conclusion 14
Referencing
Bibliography
3 | P a g e
Managing Financial Resources Leeds Metropolitan University
Executive summary
This report is all about financial and non-financial analysis of J Sainsbury Plc. This report is
containing the accounting concepts and principles, ratio analysis limitations, role of
management accounting in performance evaluation, changes in accounting standards from
UK GAAP to IFRS (International Financial Reporting Standards). This report is also focused on
the accounting policies adopted by the company. Comparative analysis is done with WM
Morrison, the comparison shows that WM Morrison out performed J Sainsbury. The
company’s present financial and non-financial performance is much better than its previous
performances. At the end report also contains the non-financial evaluation using other
management strategic techniques. By analysing the company’s financial and non-financial
performance, it is clear that company has performed better than its previous performances,
but still company need to work hard to compete its competitors, as in this report WM
Morrison has outperformed the company in comparative analysis.
Introduction to Company
J Sainsbury plc was established in 1869 and today it is one of the leading players in
supermarket having 537 supermarkets and 335 convenience stores. It has diversified its
business in banking with Lloyds Banking Group and in real estate sector by two joint
ventures with Land Securities Group PLC and The British Land Company PLC. (J Sainsbury
Annual Report 2010, p.1)
“The corporate strategy of J Sainsbury is to improve its profitability through universal
customer appeal and increase reach throughout UK” (J Sainsbury Annual Report 2010, p.6).
The Company is focusing on five main areas. J Sainsbury has good brand name and
reputation for providing quality food and services. The five areas of focus are:
Quality food at fair price.
Accelerating the growth of complementary non-food ranges and services.
Reaching more customers through additional channels.
Increasing supermarket space.
Active property management.
(J Sainsbury Annual Report 2010, pp.8-10)
Aim and Objectives:
The paramount aim of this report is to interpret and analysis the financial position of the
company using ratio analysis and by comparing with some other company. The other
objectives are to evaluate business performance by using financial accounting concepts and

4 | P a g e
Managing Financial Resources Leeds Metropolitan University
principals, evaluating the limitations of ratio analysis, UK GAAP and changes in accounting
standards and role of management accounting in evaluating business performance.
Financial Accounting Concepts and Principles and Their uses to Evaluate Business
Performance
Accounting concepts and principles are the basics of the accounting, without them,
preparation and understanding of accounts is not feasible thus it is significant that
accountants and users of financial statements should clear about the concepts. More the
concepts and principles are clear, easy the evaluation of the business performance.
Britton and Waterston pointed that (2010, p.55), “they have usually been implicit and
understood as a common culture of accounting......”
John R. Dyson (2007, p.4) says, “Accounting is a service provided for those who need
information about an entity’s financial performance, its assets and its liabilities.”
Impact of Financial Accounting Concepts upon Corporate Reporting on the Financial and
Non-financial Performance of an Organisation
As it is common assumption that all businesses follow the concepts, then it’s very hard to
say whether they are following the identical concepts. By the following statement we can
state that companies act of UK is quite vague.
“These five principles were also contained within company law in UK but they have
now been removed from the company act and we are now required to prepare
financial statement in accordance with a true and fair view and the IASs.”( Britton
and Waterston, 2010, p. 221)
By above statement we can state that it is not necessary that all the companies follow the
identical concepts as they are not specified in the companies act. This means that their
records may differ because they can record and organise the accounts, they think is best.
This ultimately affects the corporate reporting.
To ensure and regulate the accounting and financial reporting standards, currently there
are two regulatory bodies, first is financial Reporting Council which is independent and
responsible for promoting high quality corporate governance and reporting to nurture
investment (Financial Reporting Standard, 2010) and the second is ,”Accounting Standard
Board which issues accounting standards, moreover it is collaborated with International
standards and in order to ensure that its standards are developed with due regard to
international developments”(Accounting Standard Board, 2010).
Identical accounting and financial reporting standards can provide users a fair and true view
of financial position and performance of companies.

5 | P a g e
Managing Financial Resources Leeds Metropolitan University
UK GAAP and Changes in Accounting Standards:
UK GAAP stands for UK General Accepted Accounting Practices, till 2005 all public
companies had followed UK GAAP. All companies listed in London stock exchange and
Alternative Investment Market (AIM) need to adopt the International Financial Reporting
Standard. Under UK GAAP, companies need to publish four financial statements that are:
Income statement
Statement of total recognised gain and losses
Position Statement (Balance Sheet)
Cash Flow Statement
(Halmes, et al., 2008, p.1-2)
In 2005, fully listed companies needed to adopt IFRS on or after 1 January, 2005; after or on
1 January 2007, all companies listed in Alternative investment market adopted IFRS.
Accounting Policies Adopted by the Company
The Group’s financial statements have been prepared according to International
Financial Reporting Standards (“IFRSs”) as adopted by all public limited companies.
(J Sainsbury Annual Report 2010, p. 51)
Company use historical cost convention for preparing financial statements;
derivative financial instruments, investment properties, available-for-sale financial
assets, share-based payments and retirement benefit plan assets have been
measured at fair value. ( J Sainsbury Annual Report 2010, p.51)
Effective interest methods have been used in calculating interest income in income
statement for all instruments that are measured at amortised cost. (J Sainsbury
Annual Report 2010, p. 52)
“Depreciation is calculated to write down the cost of the assets to their residual
values by using straight-line method on the following bases:
o Freehold buildings and leasehold properties – 50 years, or the lease term if
shorter
o Fixtures, equipment and vehicles – 3 to 15 years
o Freehold land is not depreciated
Land and buildings under construction and non-current assets held for sale are
not depreciated” (J Sainsbury Annual Report 2010, p. 53).

6 | P a g e
Managing Financial Resources Leeds Metropolitan University
Inventories are valued at the lower of cost and net realisable value. Inventories at
warehouses are valued on a first-in, first-out basis. Inventories at retail outlets are
valued at calculated average cost prices.(J Sainsbury Annual Report 2010, p. 54)
Ratio Analysis:
Ratio analysis is one of the potent tools of the financial analysis and easy to calculate. A
ratio can be used as yard measure for evaluating the financial position and performance of a
business because the absolute accounting cannot provide the reasons behind it. Ratios give
us a common scale to measure which is helpful in appropriate evaluations because it’s very
difficult to analysis absolute figures. By calculating few ratios, it’s possible to find out the
strengths and weaknesses of the business but they do not explain the reason behind it.
There are number of ratios classified into different categories; Black (2009, pp.211-212) has
classified ratios in five groups:
Profitability ratios
Efficiency ratios
Short-term solvency and liquidity ratios
Long-term solvency and liquidity ratios
Investment ratios
Profitability ratios:
Return on capital employed:
(FAME 2010a)
9.09
6.55 6.83 6.96
1.31
0.23
7.94
9.19 8.97
7.18
2010 2009 2008 2007 2006 2005 2004 2003 2002 2001
ROCE
ROCE
7 | P a g e
Managing Financial Resources Leeds Metropolitan University
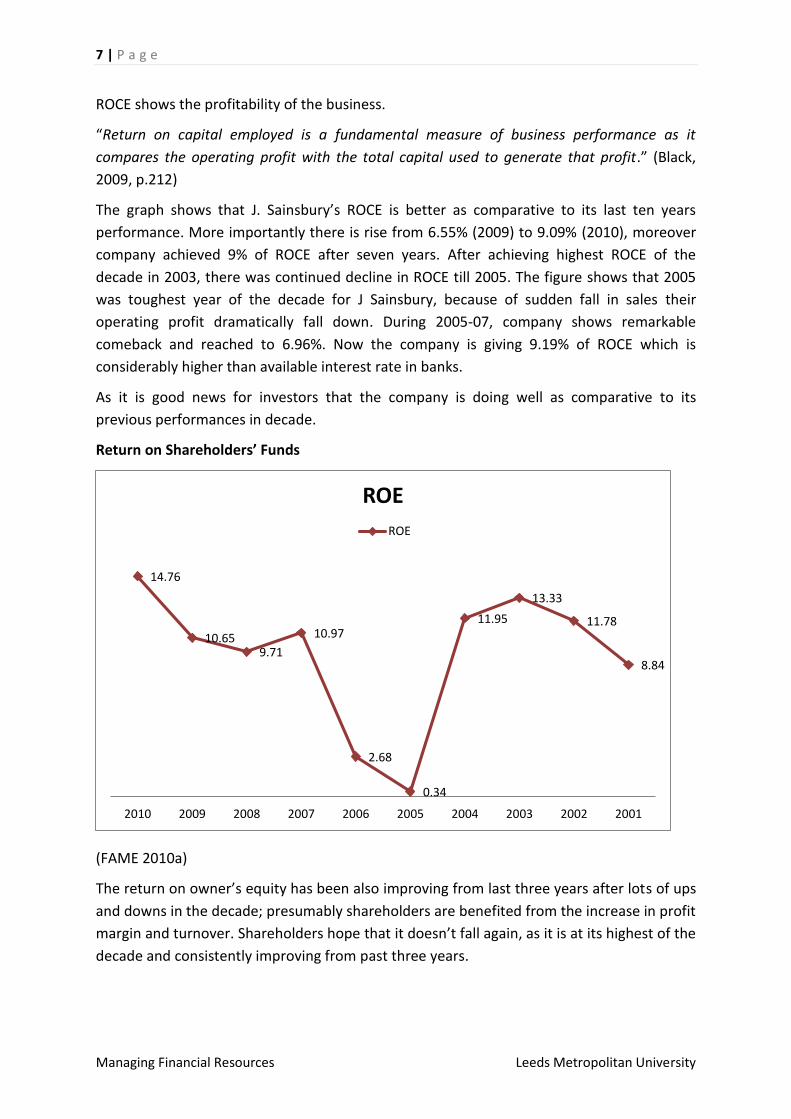
ROCE shows the profitability of the business.
“Return on capital employed is a fundamental measure of business performance as it
compares the operating profit with the total capital used to generate that profit.” (Black,
2009, p.212)
The graph shows that J. Sainsbury’s ROCE is better as comparative to its last ten years
performance. More importantly there is rise from 6.55% (2009) to 9.09% (2010), moreover
company achieved 9% of ROCE after seven years. After achieving highest ROCE of the
decade in 2003, there was continued decline in ROCE till 2005. The figure shows that 2005
was toughest year of the decade for J Sainsbury, because of sudden fall in sales their
operating profit dramatically fall down. During 2005-07, company shows remarkable
comeback and reached to 6.96%. Now the company is giving 9.19% of ROCE which is
considerably higher than available interest rate in banks.
As it is good news for investors that the company is doing well as comparative to its
previous performances in decade.
Return on Shareholders’ Funds
(FAME 2010a)
The return on owner’s equity has been also improving from last three years after lots of ups
and downs in the decade; presumably shareholders are benefited from the increase in profit
margin and turnover. Shareholders hope that it doesn’t fall again, as it is at its highest of the
decade and consistently improving from past three years.
14.76
10.659.71
10.97
2.68
0.34
11.95
13.33
11.78
8.84
2010 2009 2008 2007 2006 2005 2004 2003 2002 2001
ROE
ROE

8 | P a g e
Managing Financial Resources Leeds Metropolitan University
Gross margin %
(FAME 2010a)
“The Gross profit margin ratio relates the gross profit of the business to the sales revenue
generated for the same period” (Atrill and McLaney, 2008,p.192)
The graph shows that J Sainsbury has slight downturn for consecutive three years which
indicate that cost of sale has increased as a percentage of sales. It is quite unusual to
observe that gross margin of the company was consistently rising for consecutive three
years from 2001; after reaching its highest in the decade in 2004, next year it suddenly slip
to its lowest in the decade.
This is the area where company really need to think because if they want to sustain or
improve their position in the market they need to be cost efficient.
Profit margin %
(FAME 2010a)
5.42 5.48 5.62
6.83 6.64
4.43
8.657.98
7.326.74
2010 2009 2008 2007 2006 2005 2004 2003 2002 2001
gross margin %
gross margin %
3.67
2.46 2.69 2.78
0.650.1
3.563.83
3.33
2.52
2010 2009 2008 2007 2006 2005 2004 2003 2002 2001
Profit margin
profit margin %

9 | P a g e
Managing Financial Resources Leeds Metropolitan University
“Net margin shows the proportion of sales which resulted in a profit after all overheads
(other than finance charges) had been deducted.”(Black, 2009, p 213)
Company has good profit margin as comparative to its performances in last ten years,
expect year 2003,this rise in profit margin is due to increase in turnover and decrease in
operating expenses.
Efficiency ratios:
Return on total asset
(FAME 2010a)
Return on asset is the efficiency ratio which shows how efficient company is using its assets.
(Black, 2009, p.214)
It’s good to see that company has used its assets more efficiently as compared to its past
because of increase in sale. After decline in turnover in 2005 company has managed to
come back very well in just 5 years, moreover from 2009 to 2010 company has enormously
become more efficient.
Short- term solvency and liquidity ratios:
Current ratio
(FAME 2010a)
6.75
4.64 4.98 4.98
0.820.13
4.845.54 5.16
4.19
2010 2009 2008 2007 2006 2005 2004 2003 2002 2001
return on total asset
return on total asset
0.660.54
0.66 0.71 0.8 0.85 0.83 0.87 0.79 0.86
2010 2009 2008 2007 2006 2005 2004 2003 2002 2001
current ratio
current ratio
10 | P a g e
Managing Financial Resources Leeds Metropolitan University
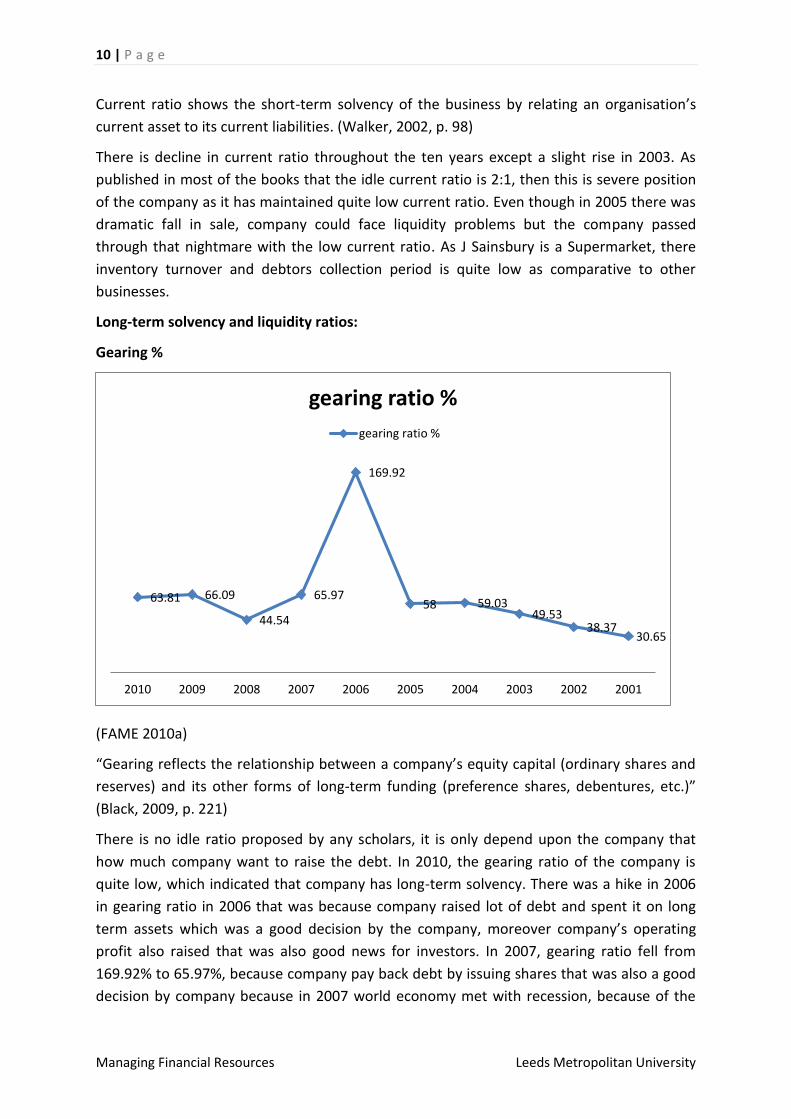
Current ratio shows the short-term solvency of the business by relating an organisation’s
current asset to its current liabilities. (Walker, 2002, p. 98)
There is decline in current ratio throughout the ten years except a slight rise in 2003. As
published in most of the books that the idle current ratio is 2:1, then this is severe position
of the company as it has maintained quite low current ratio. Even though in 2005 there was
dramatic fall in sale, company could face liquidity problems but the company passed
through that nightmare with the low current ratio. As J Sainsbury is a Supermarket, there
inventory turnover and debtors collection period is quite low as comparative to other
businesses.
Long-term solvency and liquidity ratios:
Gearing %
(FAME 2010a)
“Gearing reflects the relationship between a company’s equity capital (ordinary shares and
reserves) and its other forms of long-term funding (preference shares, debentures, etc.)”
(Black, 2009, p. 221)
There is no idle ratio proposed by any scholars, it is only depend upon the company that
how much company want to raise the debt. In 2010, the gearing ratio of the company is
quite low, which indicated that company has long-term solvency. There was a hike in 2006
in gearing ratio in 2006 that was because company raised lot of debt and spent it on long
term assets which was a good decision by the company, moreover company’s operating
profit also raised that was also good news for investors. In 2007, gearing ratio fell from
169.92% to 65.97%, because company pay back debt by issuing shares that was also a good
decision by company because in 2007 world economy met with recession, because of the
63.81 66.09
44.54
65.97
169.92
58 59.0349.53
38.3730.65
2010 2009 2008 2007 2006 2005 2004 2003 2002 2001
gearing ratio %
gearing ratio %
11 | P a g e
Managing Financial Resources Leeds Metropolitan University
low debt company needed to pay low interest; next year company again reduced its debt,
the low gearing ratio helped the company in surviving through the recession. Company still
maintain a low gearing ratio because UK economy still has not out of the recession.
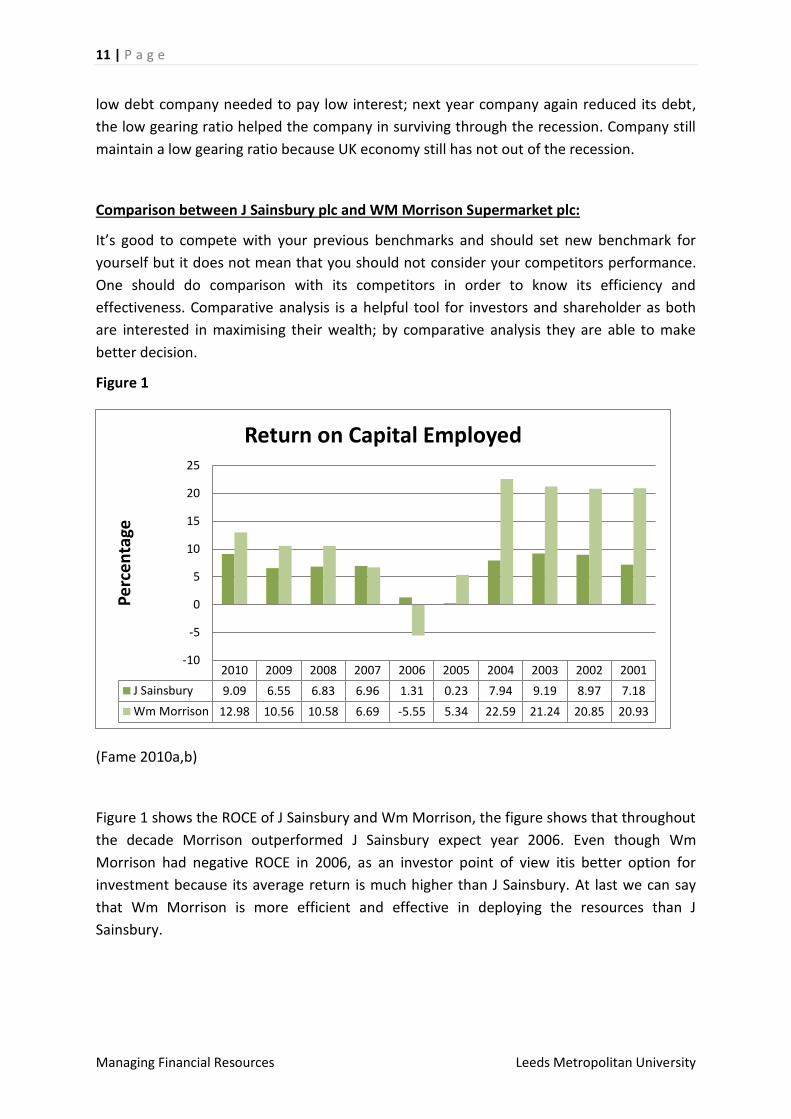
Comparison between J Sainsbury plc and WM Morrison Supermarket plc:
It’s good to compete with your previous benchmarks and should set new benchmark for
yourself but it does not mean that you should not consider your competitors performance.
One should do comparison with its competitors in order to know its efficiency and
effectiveness. Comparative analysis is a helpful tool for investors and shareholder as both
are interested in maximising their wealth; by comparative analysis they are able to make
better decision.
Figure 1
(Fame 2010a,b)
Figure 1 shows the ROCE of J Sainsbury and Wm Morrison, the figure shows that throughout
the decade Morrison outperformed J Sainsbury expect year 2006. Even though Wm
Morrison had negative ROCE in 2006, as an investor point of view itis better option for
investment because its average return is much higher than J Sainsbury. At last we can say
that Wm Morrison is more efficient and effective in deploying the resources than J
Sainsbury.
2010 2009 2008 2007 2006 2005 2004 2003 2002 2001
J Sainsbury 9.09 6.55 6.83 6.96 1.31 0.23 7.94 9.19 8.97 7.18
Wm Morrison 12.98 10.56 10.58 6.69 -5.55 5.34 22.59 21.24 20.85 20.93
-10
-5
0
5
10
15
20
25
Pe
rce
nta
ge
Return on Capital Employed

12 | P a g e
Managing Financial Resources Leeds Metropolitan University
Figure 2
(FAME 2010a,b)
Figure 2 shows that Wm Morrison is more profitable for shareholders than J Sainsbury
expect year 2006; but J Sainsbury has provided its highest return on equity of the decade
which is also good news for its shareholders.
In both the profitability ratios Wm Morrison outperformed J Sainsbury as in both the cases
the Wm Morrison’s average return of the decade is better than J Sainsbury’s. But now J
Sainsbury is more profitable and providing its best return of the decade.
Figure 3
(FAME 2010a,b)
2010 2009 2008 2007 2006 2005 2004 2003 2002 2001
J Sainsbury 14.76 10.65 9.71 10.97 2.68 0.34 11.95 13.33 11.78 8.84
Wm Morrison 17.34 14.49 13.98 9.4 -8.58 7.39 24.28 22.07 21.82 22.07
-15
-10
-5
0
5
10
15
20
25
30
Pe
rce
nta
geReturn on Equity
2010 2009 2008 2007 2006 2005 2004 2003 2002 2001
J Sainsbury 0.66 0.54 0.66 0.71 0.8 0.85 0.83 0.87 0.79 0.86
Wm Morrison 0.51 0.53 0.49 0.41 0.45 0.41 0.6 0.56 0.53 0.41
0
0.1
0.2
0.3
0.4
0.5
0.6
0.7
0.8
0.9
1
Rat
io
Current Ratio
13 | P a g e
Managing Financial Resources Leeds Metropolitan University
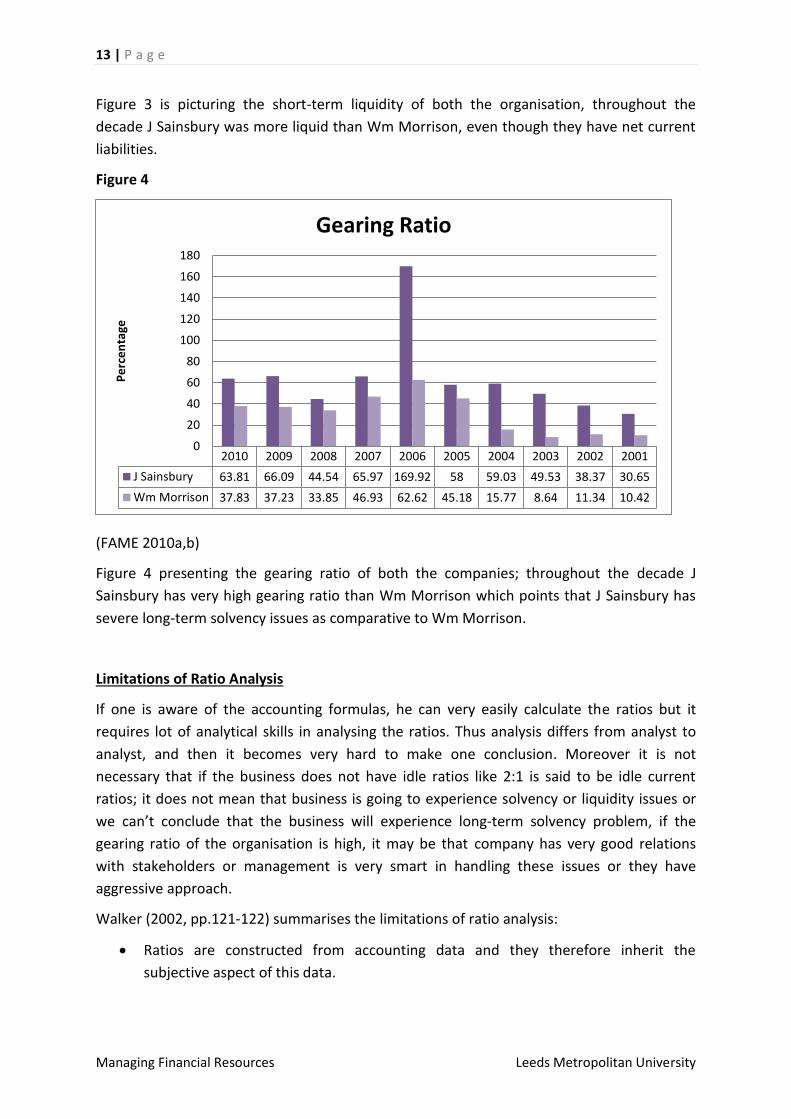
Figure 3 is picturing the short-term liquidity of both the organisation, throughout the
decade J Sainsbury was more liquid than Wm Morrison, even though they have net current
liabilities.
Figure 4
(FAME 2010a,b)
Figure 4 presenting the gearing ratio of both the companies; throughout the decade J
Sainsbury has very high gearing ratio than Wm Morrison which points that J Sainsbury has
severe long-term solvency issues as comparative to Wm Morrison.
Limitations of Ratio Analysis
If one is aware of the accounting formulas, he can very easily calculate the ratios but it
requires lot of analytical skills in analysing the ratios. Thus analysis differs from analyst to
analyst, and then it becomes very hard to make one conclusion. Moreover it is not
necessary that if the business does not have idle ratios like 2:1 is said to be idle current
ratios; it does not mean that business is going to experience solvency or liquidity issues or
we can’t conclude that the business will experience long-term solvency problem, if the
gearing ratio of the organisation is high, it may be that company has very good relations
with stakeholders or management is very smart in handling these issues or they have
aggressive approach.
Walker (2002, pp.121-122) summarises the limitations of ratio analysis:
Ratios are constructed from accounting data and they therefore inherit the
subjective aspect of this data.
2010 2009 2008 2007 2006 2005 2004 2003 2002 2001
J Sainsbury 63.81 66.09 44.54 65.97 169.92 58 59.03 49.53 38.37 30.65
Wm Morrison 37.83 37.23 33.85 46.93 62.62 45.18 15.77 8.64 11.34 10.42
0
20
40
60
80
100
120
140
160
180
Pe
rce
nta
ge
Gearing Ratio

14 | P a g e
Managing Financial Resources Leeds Metropolitan University
If the accounts are made up to different dates, then different external factors may
have influenced the figures.
The results of ratios may be interpreted indifferent ways.
If only one or two year’s figures are available then there is no reference to trends
over recent years.
There is no reference to future prospective or plans.
The focus tends to be on relative rather than absolute values
The ratios are based on balance sheet data, which may not be representative of the
year as a whole.
The Role of Management Accounting in Evaluating the Business Performance
Till now I have analysed and interpreted the data by using the financial accounting tool i.e.
ratio analysis. Now it’s time to through some light on the management accounting and its
role in evaluating business performance.
Management accounting has significant role in evaluating business performances, though
financial accounting measures the performance of businesses but it provides overview of
the performance that is not adequate for managers to make any decision, they need in-
depth analysis of the business.
According to National Association of Accountants (n.d., quoted in Shim and Siegel, 1999,
p.1) management accounting is,
“The process of identification, measurement, accumulation, analysis, preparation,
interpretation and communication of financial information, which is used by management to
plan, evaluate and control within an organisation.”
With the increase in competition, every organisation wants optimum utilisation of resources
available to them. According to Atrill and McLaney (2009, p.23), it is possible to identify four
broad areas of decision making where management accounting information is required.
Developing objectives and plans
Performance evaluation and control
Allocating resources
Determining costs and benefits
Non-financial Evaluation Using Other Management Strategic Techniques
J Sainsbury has diversified business in Banking with Lloyds Banking Group and has two
property joint ventures with Land Securities Group PLC and The British Land Company PLC.
In 2007, they identified following five areas of focus for developing their business:
“Great food at fair price.
15 | P a g e
Managing Financial Resources Leeds Metropolitan University
Accelerating the growth of complementary non-food and services.
Reaching more customers through additional channels.
Growing supermarket space.
Active property management.”
(J Sainsbury Annual Report 2010, pp.8-10)
J Sainsbury has shown significant progress in each area that has contributed to their good
performance. During 2009/10 they have accelerated their growth in these areas by
allocating additional capital and resources.
(J Sainsbury Annual Report 2010, p.8)
J Sainsbury has won number of corporate responsibility awards like
“Dow Jones Sustainability Index 2009/10 for sustainable in market.
IGD Food Industry Award for environmental sustainability.
CBI Human Capital Award for broad-ranging HR and people-management excellence.
Carbon Trust Standard for supermarket division’s reduction of CO2 year-on-year.
FTSE4Good Index for management of environmental, social and ethical issues.”
(J Sainsbury Annual Report 2010, p. 12)
Conclusion
J Sainsbury is one of the finest supermarkets in the market and known for providing quality
of food and services. In recent years company has made many changes in its operations and
diversified in banking and real estate sector. Company has improved its performance in
financial and non-financial field. Its increasing return on capital, operating profit and low
gearing ratio is good sign of its future growth. After 2005, company has shown continuous
improvement almost in all areas. Company’s return on capital and equity is better than
many other companies in the current recession scenario, moreover company able to
maintain its good relationship with customers by providing quality food and services.
Company has won many awards in corporate social responsibility moreover company has
won Dow Jones Sustainability index award for year 2009-10 for sustainable in market which
is good news for shareholders. In 2010, the profit before taxation of the company is raised
from 466 million pounds by 57.3% to 733 million pounds; moreover current assets of the
company have increased from 1,570 million pounds by 18.03% to 1,853 million pounds,
which shows that the profitability and liquidity position of the company has increased. It’s
good that company has performed well from its previous performances but it is still
underperform as comparative to its top competitors like WM Morrison. But still there is lot
of opportunities in non-food service sector.

16 | P a g e
Managing Financial Resources Leeds Metropolitan University
REFERENCING
Book
Atrill, P. and McLaney, E. (2008) Accounting and Finance for Non-Specialists. 6th ed. Harlow:
FT Prentice Hall
Atrill, P. and McLaney, E. (2004) Management Accounting- An Active Learning Approach.
6th ed. Oxford: Blackwell Publications.
Atrill, P. and McLaney, E. (2009) Management Accounting for Decision Makers. 6th ed.
Harlow: FT Prentice Hall.
Britton, A. and Waterston, C. (2010) Financial Accounting. 4th ed. Harlow: Pearson
Education Limited.
Dodge, R. (1997) Foundation of Business Accounting. 2nd ed. London: International
Thomson Business Press.
Dyson, John R. (2007) Accounting for Non-Accounting Students. 7th ed. Harlow: Pearson
Education.
Geoff, B. (2009) Introduction to Accounting and Finance.2nd ed. Harlow:FT Prentice Hall
Holmes, G., et al. (2008) Interpreting Company Reports and Accounts. 10th ed. Harlow: FT
Prentice Hall
Shickney, Clycle P., et al. (2010) Financial Accounting: An Introduction to Concepts,
Methods and Uses. 2nd ed. USA: South – Western Congage Learning.
Shim, Jae K., et al. (1999) Management Accounting. 2nd ed. USA: The McGraw-Hill.
Walker, J. (2002) Accounting in Nutshell - Finance for the Non-Specialist. 1st ed. India: Viva
Books.
Online sources
Chadwick, L (1993) Management Accounting. [Internet] London: Routledge. Accessed from:
Google Books<http://books.google.co.in/books?id=q9kNAAAAQAAJ&printsec =frontcover&dq =
management+accounting&hl=en&ei=9LHuTMX3AsrQcYKcpcIK&sa=X&oi=book_result&ct=result&res
num=1&ved=0CDQQ6AEwAA#v=onepage&q&f=false> [Accessed 25 November 2010]
17 | P a g e
Managing Financial Resources Leeds Metropolitan University
J Sainsbury Plc.(2010) Annual Report. [Internet], UK, J Sainsbury Plc. Available from:
<http://www.j-sainsbury.co.uk/files/reports/ar2010_report.pdf> [Accessed 1st November
2010]
Fame (2010a) J Sainsbury plc [ONLINE] Bureau Van Dijk Electronic Publishing, Accessed
from: <https://fame.bvdep.com.ezproxy.leedsmet.ac.uk/version-2010823/cgi/template.dll?
product=1&user=ipaddress> [Accessed 28th September 2010]
Fame (2010b) Wm Morrison supermarket plc[ONLINE] Bureau Van Dijk Electronic
Publishing, Accessed from: Bureau Van Dijk Electronic Publishing<https://fame.bvdep.com.
ezproxy.leedsmet.ac.uk/version 2010823/cgi/template.dll> [Accessed 28th September 2010]

18 | P a g e
Managing Financial Resources Leeds Metropolitan University
BIBLIOGRAPHY:
Book
Atrill, P. and McLaney, E. (2008) Accounting and Finance for Non-Specialists. 6th ed. Harlow:
FT Prentice Hall
Atrill, P. and McLaney, E. (2004) Management Accounting- An Active Learning Approach.
6th ed. Oxford: Blackwell Publications.
Atrill, P. and McLaney, E. (2009) Management Accounting for Decision Makers. 6th ed.
Harlow: FT Prentice Hall.
Britton, A. and Waterston, C. (2010)Financial Accounting. 4th ed. Harlow: Pearson Education
Limited.
Dodge, R. (1997) Foundation of Business Accounting. 2nd ed. London: International
Thomson Business Press.
Dyson, John R. (2007) Accounting for Non-Accounting Students. 7th ed. Harlow: Pearson
Education.
Geoff, B. (2009) Introduction to Accounting and Finance.2nd ed. Harlow:FT Prentice Hall
Holmes, G., et al. (2008) Interpreting Company Reports and Accounts. 10th ed. Harlow: FT
Prentice Hall
Shickney, Clycle P., et al. (2010) Financial Accounting: An Introduction to Concepts,
Methods and Uses. 2nd ed. USA: South – Western Congage Learning.
Shim, Jae K., et al. (1999) Management Accounting. 2nd ed. USA: The McGraw-Hill.
Walker, J. (2002) Accounting in Nutshell - Finance for the Non-Specialist. 1st ed. India: Viva
Books.
Online sources
Chadwick, L (1993) Management Accounting. [Internet] London: Routledge. Accessed from:
Google Books<http://books.google.co.in/books?id=q9kNAAAAQAAJ&printsec =frontcover& dq =
management+accounting&hl=en&ei=9LHuTMX3AsrQcYKcpcIK&sa=X&oi=book_result&ct=result&res
num=1&ved=0CDQQ6AEwAA#v=onepage&q&f=false> [Accessed 25 November 2010]
19 | P a g e
Managing Financial Resources Leeds Metropolitan University
J Sainsbury Plc.(2010)Annual Report.[Internet], UK, J Sainsbury Plc. Available from:
<http://www.j-sainsbury.co.uk/files/reports/ar2010_report.pdf> [Accessed 1st November
2010]
Fame (2010a)J Sainsbury plc [ONLINE] Bureau Van Dijk Electronic Publishing, Accessed from:
<https://fame.bvdep.com.ezproxy.leedsmet.ac.uk/version-2010823/cgi/template.dll?
product=1&user=ipaddress> [Accessed 28th September 2010]
Fame (2010b) Wm Morrison supermarket plc [ONLINE] Bureau Van Dijk Electronic
Publishing, Accessed from: <https://fame.bvdep.com.ezproxy.leedsmet.ac.uk/
version2010823/cgi/template.dll> [Accessed 28th September 2010]