measuring and monitoring absence from work · marks & spencer plc national westminster bank plc...
TRANSCRIPT

MEASURING AND MONITORING ABSENCE FROM WORK
Other titles from IES:
Team Working and PayMarc ThompsonReport 281, 1995. ISBN 1-85184-207-1
Measuring the Personnel Function: Future IssuesW Hirsh, S Bevan, L BarberReport 286, 1995. ISBN 1-85184-212-8
Towing the Line: Helping Managers Manage PeopleS Bevan, S HaydayReport 254, 1994. ISBN 1-85184-177-6

MEASURING ANDMONITORING
ABSENCE FROM WORK
Ian Seccombe
THE INSTITUTE FOR EMPLOYMENT STUDIES Report 288
A study supported by the IES Co-operative Research Programme

Published by:
THE INSTITUTE FOR EMPLOYMENT STUDIESMantell BuildingUniversity of SussexBrighton BN1 9RFUK
Tel. + 44 (0) 1273 686751Fax + 44 (0) 1273 690430
Copyright © 1995 The Institute for Employment Studies
No part of this publication may be reproduced or used in any form by any means — graphic, electronicor mechanical including photocopying, recording, taping or information storage or retrieval systems —without prior permission in writing from the Institute for Employment Studies.
A catalogue record for this publication is available from the British Library
ISBN 1-85184-214-4

v
The Institute for Employment Studies
The Institute for Employment Studies is an independent,international centre of research and consultancy in humanresource issues. It has close working contacts with employers inthe manufacturing, service and public sectors, governmentdepartments, agencies, professional and employee bodies, andfoundations. Since it was established 25 years ago the Institute hasbeen a focus of knowledge and practical experience inemployment and training policy, the operation of labour marketsand human resource planning and development. IES is a not-for-profit organisation which has a multidisciplinary staff of over 50.IES expertise is available to all organisations through research,consultancy, training and publications.
IES aims to help bring about sustainable improvements inemployment policy and human resource management. IESachieves this by increasing the understanding and improving thepractice of key decision makers in policy bodies and employingorganisations.
Formerly titled the Institute of Manpower Studies (IMS), theInstitute changed its name to the Institute for Employment Studies(IES) in Autumn 1994, this name better reflecting the full range ofthe Institute’s activities and involvement.
The IES Co-operative Research Programme
This report is the product of a study supported by the IES Co-operative Research Programme, through which a group of IESSubscribers finance, and often participate in, applied research onemployment issues. The members of the CRP are:
Abbey National plcBarclays Bank plcBritish Airport AuthorityBritish Steel plcBritish Telecommunications plcThe Cabinet OfficeDepartment of Social SecurityElectricity Association Services LtdHM Customs and ExciseHM TreasuryLloyds Bank plc
Marks & Spencer plcNational Westminster Bank plcThe Post OfficePrudential Corporation plcRolls Royce plcJ Sainsbury plcShell (UK) LtdThe Wellcome FoundationW H SmithWoolwich Building Society

vi

vii
Contents
Introduction 1
1. Measuring Absence 31.1 Absence Rates 3
1.1.1 Partial absences 41.1.2 Defining working days 41.1.3 Part-time staff absences 41.1.4 Issues and Limitations 5
1.2 Frequency 61.2.1 Inception measures 71.2.2 Definitions 8
1.3 Duration 81.4 ‘Bradford Scores’ 91.5 Summary 10
2. Monitoring Absence 122.1 Presentation 122.2 Trigger Points 122.3 Time Series 142.4 Morbidity 152.5 Benchmarking 16
3. Costing Absence 183.1 Top-down costing 193.2 Bottom-up Costing 193.3 Summary 19
4. Using Absence Data to Manage Attendance 204.1 Senior managers 204.2 HR professionals 214.3 Line managers 214.4 Employees 224.5 Other good practice points 22
5. Sources of Information 24a. Confederation of British Industry 24b. The Labour Force Survey 24c. Industrial Relations Services 26d. The Industrial Society 26

viii

Measuring and Monitoring Absence from Work 1
Introduction
In the mid 1990s, controlling sickness absence has become apriority on many management agendas. One of the main reasonsfor this is the recent change in Statutory Sick Pay (SSP)arrangements. From April 1994, organisations who pay over£20,000 in National Insurance are no longer reimbursed for anypart of SSP. It has been estimated that this change will costemployers an extra £11 billion annually.
In addition to the emphasis on cost control, there is increasingevidence, particularly from employers in North America, whichsuggests that significant benefits can come from workplace healthpromotion. These benefits are in the form of cost savings, tangiblehealth promotion outcomes, and other organisational benefits (egimproved reputation as an employer etc.).
Research also suggests that, in tackling sickness absence, a numberof success factors can be identified. These include:
high level management commitment
clear responsibilities
appropriate information
suitably trained line managers
attention to staff welfare
This report is concerned with the third of these success factors: theprovision of accurate, timely and accessible information. Withoutthis, the other success factors are likely to be ineffective.
Respondents to a number of recent surveys have rated improvedmonitoring and the provision of absence statistics to line managersas two of the three most important factors which they thoughtwould, or had actually, helped to reduce sickness absence in theirbusinesses. Research has also shown that active monitoring canhave the effect of reducing sickness absence, by demonstrating thatmanagers are taking the issue seriously, and by enabling them tounderstand better the characteristics and causes of absence.
However, there is a wide range of sickness absence measures (wenote more than 40) and weak correlation between the variousmeasures. These problems are compounded by a confusedterminology which uses different terms for similar measures. As a

The Institute for Employment Studies2
result, few organisations actually make best use of the sicknessabsence information which they have available, and benchmarkingcould have only dubious value.
The aim of this report is to provide line and HR managers withsome tools and techniques which will help them to quantify,monitor and ultimately manage this problem better.

Measuring and Monitoring Absence from Work 3
1. Measuring Absence
There are many ways of measuring sickness absence, each ofwhich provides a different information set. Their value lies inproviding a series of indices to detect trends, identify variationsfrom the norm and to diagnose causes. In this section we will lookat a number of broad measures including:
measures of time lost
measures of absence frequency
measures of absence duration
Conclusions drawn from the uninformed use of sickness absencemeasures can be misleading. We will also therefore discuss someof the limitations of these measures.
1.1 Absence rates
The most commonly used method of expressing the level ofsickness absence is the crude absence rate (sometimes called theinactivity or time lost rate) This is usually calculated as the time lostdue to, or ascribed to, sickness absence as a percentage ofcontracted working time in a defined period.
The absence rate can be measured in days or, more accurately , inhours. It is calculated as follows:
total duration of all spells of absence during period
total contracted time during that period× 100%
Box 1 shows an example:
Box 1: Crude absence rate
A finance department has 20 staff working full time for 37 hours perweek and 10 part-time staff working 18 hours a week. This groupwould normally work 3,680 contracted hours in a four week period. If,during that period, four of the full-time staff were each absent oneweek, and two of the part-time staff were also absent for one weekeach, the total lost time would be 184 hours (ie (4 × 37) + (2 × 18) =184 hours). The absence rate would therefore be 184 ÷ 3,680 = 5%.

The Institute for Employment Studies4
However, many organisations measure absence in terms of dayslost. This raises a number of problems which are dealt with in thefollowing paragraphs.
1.1.1 Partial absences
One of the definitional issues, which affects absence recordingwhether it is by hours or days, is whether absences which startpart way through a shift or day, should be included or excluded inthe absence figures. Measurement by days either excludes part dayabsences, so underestimating absence, or includes them as a wholeday lost therefore overestimating absence. Experience suggeststhat most private sector organisations ignore partial days lost andthat this can be a source of significant under-recording.
1.1.2 Defining working days
A second problem of definition concerns the determination of thenumber of days to be worked. Again, practice varies. For example,some count all days except Sundays, (giving 312 or 313 ‘working’days) while others exclude weekends, Bank holidays, otherstatutory days and average annual leave (usually giving between225 and 228 ‘working’ days). The effect on the absence rate can bevery significant (see box 2).
Box 2: Working days
An organisation with 8 days sickness absence per head would have anannual absence rate of 3.5% based on 225 days but only 2.6% basedon 312 days.
Good practice is to count only those days on which an employeewould normally be expected to work. Thus, a clerical officerworking a ‘normal’ five day week (Monday to Friday) who isabsent on Friday and the following Monday should be counted asabsent on two of five working days, not four of seven calendardays.
The only caveat to this is that, for epidemiological purposes wemay actually be interested in the ‘real’ duration of any sicknessabsence episode which would mean including the scheduled daysoff.
1.1.3 Part-time staff absences
Calculating the absence rates for part-time staff is more difficultbecause of their irregular work patterns (Box 3).

Measuring and Monitoring Absence from Work 5
Box 3: Part-time absence
A personnel department has 15 full-time equivalent (FTE) staff; 10working full time, 37 hours a week and 10 working part time for 18.5hours a week spread evenly over five days.
The full time staff record 40 days sickness absence in a 50 day period;the part-time staff record 20 days absence in the same period.Therefore the full-time staff lose 4 days per head and the part-time stafflose 1 FTE day per head. Overall, 50 FTE days are lost (40 by full-timeand 10 by part-time staff) at an average of 3.33 days per FTE (ie 50 ÷15). The absence rate is 3.33 ÷ 50 × 100 = 6.7%.
If the same group of part-timers worked their 18.5 hours on threerather than five days, then their FTE days lost is 20 × 0.5 × 5 ÷ 3 = 1.67.Overall, 56.67 FTE days of absence are recorded (40 by full-time and16.67 by part-time staff) and the department’s overall absence rate is3.78 ÷ 50 × 100 = 7.6%.
In general, if you must calculate absence rates using whole days,rather than hours, then ensure that the part-time element isexpressed in FTEs, otherwise the amount of time lost will beexaggerated. The easiest way to calculate an overall absence rate isto divide the FTE days lost per head by the number of days in theperiod.
1.1.4 Issues and limitations
The advantage of this measure is that it answers a basic questionwhich all mangers should be asking: what proportion of time do Iget from my staff? It is comparatively simple to calculate and canbe used for costing purposes (see below). Calculating absence ratesby staff group, department or function can help to identifyparticular problem areas. The sub-populations and othercharacteristics which need to be analysed separately may include:
main occupations or functions
men and women
full-time and part-time
broad age groups
broad length of service groups
department/location
manager
shifts
certified and self-certified/un-certified absence.
day of the week of absence
The latter recognises that there may be distinct patterns of absencerelated to, for example, absence just before or after weekends ordays of planned leave, etc. There are specific measures which can

The Institute for Employment Studies6
be used to monitor such patterns. Perhaps the best known of theseis the Blue Monday index which is calculated as: the differencebetween total of Fridays’ and Mondays’ absentees for the period,divided by the average number employed.
Some organisations want to analyse absence by department or bymanager. Variations in absence may reflect differences incomposition, culture or management style.
The main limitation of crude absence rates is well known. The timelost may consist of a small number of people absent for longperiods or a large number absent for short periods. Since absencerates tend to exaggerate the effect of long-term absence, they cangive rise to misleading information. For example, absence ratesmay be relatively stable over time even though the number of staffabsent may be increasing and the duration of absence falling, andvice versa.
Other limitations of absence rates are that:
they give no information about the distribution of absenceswithin a staff group (eg by grade or age) unless broken down inthis way
they provide no information on the number of staff having noabsences
they tell us nothing about those who might be frequently absent
absence rates calculated for small staff numbers (< 20) tend tobe unstable over short time periods.
Comparison of absence rates can give rise to false conclusions ifother elementary indices such as number of absences andduration, are not also provided. In the next section we willexamine absence frequency measures.
1.2 Frequency
In order to avoid the principal problem with absence rates,managers require a measure of the spread of absence across theworkforce.
Measures of absence frequency provide a better indicator of short-term absence than the absence rate and may be a more valuablemeasure in planning absence control. However, frequencymeasures tend to discount long term sickness absence.
The absence frequency rate is given by:
number of absences
average number of staff× 100%

Measuring and Monitoring Absence from Work 7
This is a measure of the average frequency with which staff areabsent but says nothing about actual time lost. An absence of 20days carries the same weight as an absence of only one day.
An individual frequency rate can also be calculated:
the number of staff with one or more absences
the average number of staff employed× 100%
The latter is a useful measure of the extent to which absences canbe attributed to a small number of staff. Although, in practice theindividual frequency rate becomes less valuable over time since itis increasingly likely that an employee will have at least one spellof absence.
Box 4: illustrates these two measures.
Box 4: Absence frequency measures
In one month an organisation’s distribution department employed, onaverage, 40 staff. During this time 12 employees had periods ofabsence: one was away three times, two were away twice and ninewere away once. A total of 16 spells of absence were recorded.
The absence frequency rate is therefore:
16 ÷ 40 × 100 = 40%
The individual frequency rate is:
12 ÷ 40 × 100 = 30%
Each absence should be calculated separately, not only when it isfollowed by return to work, but also when the reason for sicknessabsence changes.
A third frequency measure used by some organisations is theincidence (or prevalence) rate. This is calculated at a point in time(ie a specific day or reference week), and is given by:
the number of staff absent
average number employed× 100%
1.2.1 Inception measures
Measures of absence inception, that is measures of the start of asickness absence period, are similar to those of absence frequency.Inception measures can be used in monitoring and forecastingabsence levels and can be used as ‘triggers’ for managementintervention (eg formal review or reference to occupational health).
Comparison of inception rates over time can be used to showwhether patterns of absence are stable or not and to establish

The Institute for Employment Studies8
whether more spells of absence have been started, or whethermore staff have started spells of absence.
There are two main measures: inception rate for spells of absenceand the inception rate for persons absent. These are calculated asfollows.
The inception rate for spells equals:
the no. of spells of absence which start during a period
the average number of staff employed in that period× 100%
The inception rate for individuals equals:
number of persons who start at least one spell of absence
the average number of staff employed× 100%
Some organisations prefer to use termination rates (ie measures ofthe number of absences ending in a period). Clearly, inception andtermination rates are closely related. The advantage of measuringtermination rates is that the reason for absence is more likely to beknown.
1.2.2 Definitions
The definition of absence spells is not always straightforward. Forexample, do you consider two consecutive absences for differentreasons (eg a day off with backache followed by three days offwith flu symptoms) to be a single or multiple event? Similarly, doyou consider runs interrupted by scheduled days off, or runningover the month end, as a single run? A clerical officer working afive day week (Monday to Friday) who is absent on Friday and thefollowing Monday should (unless the reason for absence changes)record one absence spell even if the Monday is the first day of anew month.
The decision as to how these situations are treated must bedetermined by the user’s needs. It is essential however that basicrules should be established and understood, and that they shouldbe clearly and consistently applied.
1.3 Duration
There are a number of measures of absence duration. The mainones are: the average duration per spell and the average durationper person. They are calculated as follows.
The average duration per spell is given by:
total duration of all spells ending during period
number of spells ending in period

Measuring and Monitoring Absence from Work 9
If calculated separately for different types of absence, this can beused to give some indication of the likely return date of absentees.
The average duration per person is calculated by:
total time lost from spells ending in the period
number of staff having an absence in the period
Box 5: Means and medians
The average duration, and other rates quoted here, usually refer toarithmetic means. The limitation of the mean value is that weight isgiven to each occurrence according to its magnitude. Thus, extremevalues are emphasised over middle values. This is particularlyimportant in absence data since these tend to be skewed, that is, largenumbers of people have only a few days absence while small numbershave very long absences.
Some observers recommend the use of the median to summariseabsence data sets. The median is obtained by placing the observedvalues in ascending or descending order of magnitude and thenfinding the central value of these.
Consider the following distribution of days off among a group of tenstaff in a two month period:
0 0 0 1 1 1 2 4 7 40
The mean duration per person is 5.6 days (ie 56 ÷ 10) while themedian value is 1 day. Which measure best characterises the sicknessabsence pattern?
Similarly, median values can also be calculated for other measuressuch as the frequency of absence spells.
The main definitional problem with duration measures is that thetotal duration of some absence spells will be unknown in anyperiod simply because they are incomplete.
1.4 ‘Bradford’ Scores
In organisations where the majority of staff work shifts and rotas,the disruption caused by frequent short term absences is oftengreater than that caused by occasional long term absences.
The Bradford factor measures an employee’s irregularity ofattendance by combining measures of absence frequency andduration. These scores indicate whether the composition of anindividual’s sickness absence record comprises a few, or many,spells of short or long duration. They can be used to monitortrends in sickness absence, to provide ‘trigger’ points (see below),and for comparison with absence rates.

The Institute for Employment Studies10
The basic formula is :
S × S × D
S = the number of spells of absence in a specified periodD = the number of days (or hours) of absence in that period
Box 6 illustrates the Bradford scores for three employees each withthe same annual absence rate (based on 12 days absence).
Box 6: Bradford Scores
one absence of 12 days: Bradford score = 1 x 1 x 12 = 12 points
six absences of 2 days each: Bradford score = 6 x 6 x 12 = 432 points
12 absences of one day each: scores 12 × 12 × 12 = 1,728 points
Box 7 shows how one NHS Trust is using Bradford scores:
Box 7: Using Bradford Scores
South Devon Healthcare Trust produces a quarterly manpower reportfor each clinical directorate, locality and staff group. In each case thereport shows:
% of staff with less than 300 points
% of staff with 300 to 499 points
% of staff with 500 or more points
% of staff with 5 or more spells of sickness absence in a rolling 52week period
Comparison between sickness absence rates and average Bradfordscore can be revealing and can help to target action appropriately.Compare, for example, the contrasting position of speechtherapists and physiotherapists in the example below (see Box 8).
A high absence rate and a low Bradford score clearly indicates thatabsence is due to a small number of staff with long absences. Incontrast, low absence and a high Bradford score shows that thereis a small number of staff with frequent short absences.
1.5 Summary
Any absence measure must be used with discretion. Best practiceis to use a variety of absence indices providing information ondifferent aspects of absence. Calculating the various measures fordifferent sub-groups will provide important diagnosticinformation, helping managers to understand absence behaviourbetter and to target action appropriately.

Measuring and Monitoring Absence from Work 11
Box 8: Comparing sicknes absence rates and Bradford scores
Source: IES, 1995
Our recommended minimum data set for employingorganisations who want to manage attendance better is:
absence rate
absence frequency rate
average duration.
0 100 200 300 400 500
Average Bradford Score
0 0.5 1 1.5 2 2.5 3 3.5
Speech Therapist
Chiropodist
ClinicalPsychologist
Physiotherapist
OccupationalTherapist
Sickness Absence Rate (%)

The Institute for Employment Studies12
2. Monitoring Absence
This chapter considers five aspects of using measures to monitorsickness absence:
presentation
trigger points
time series
morbidity
benchmarking.
2.1 Presentation
The presentation of absence information is as important as itsmeasurement. Without clearly presented data, it is more difficultfor busy line managers to identify key problems quickly andaccurately. Frequently, managers seem to be provided with toomuch, rather than too little information.
Graphs and bar charts can be used to great effect in presentingaggregate sickness absence data. A less familiar way of presentingabsence data is the ‘logic tree’ as shown in Box 9. The exampleshows sickness absence levels among officers in an inner LondonBorough’s Social Services Department. By presenting figures inpairs it is a simple matter to compare the department (left-handbox) with the average (right-hand box figures shown in italics)across the whole authority. The tree presents days absent peremployee, sub-divided into certified, uncertified and self-certified.Each of these categories is further sub-divided into duration andfrequency measures. For example, the average days absent peremployee are 19.4 in Social services compared with 16.5 across theBorough.
2.2 Trigger Points
One of the main uses of sickness absence information is tohighlight those staff on whom the line manager should focusattention. An increasingly common way of doing this is to setparameters or ‘triggers’ which can help to determine where andwhen action is needed. The attendance record of individualemployees may then be monitored against set criteria.

Measuring and Monitoring Absence from Work 13
Triggers fall into two broad categories:
informal arrangements where reviews of an employee’ssickness absence pattern are undertaken either periodically oron return from each absence episode. In these cases it is usuallyleft to managers to determine whether any action is required.
more tightly specified absence thresholds, used by someemployers to identify when managers should introduce aformal review, counselling, reference to occupational health, ortaking disciplinary action.
Trigger points may take a number of forms, for example:
cumulative days of absence in a set period
number of spells in a set period
combinations of days and spells (eg by using Bradford scores)
pattern related (eg number of absences preceding or followingscheduled time-off).
In setting these thresholds, account has to be taken of the nature ofeach staff group and the organisation of its work. It may benecessary to set comparatively low thresholds for key groups, orwhere disruption and costs are higher.
Given that the main problem for managers is likely to be shortterm frequent absences, it may be best to set trigger points in termsof episodes, rather than days. It is also important that the timeperiod is comparatively short, typically three months, so thataction is timely.
Box 9: Logic Tree
8.08.8
Uncertificated andself certificated
8.510.6
Certificated
2.02.0
Days per spell
3.94.4
Spells per employee
22.419.7
Days per spell
0.40.5
Spells peremployee
16.519.4
Days absent peremployee
Source: Audit Commission (1990) Managing Sickness Absence in London, Occasional Papers no. 12

The Institute for Employment Studies14
There is a danger that the use of trigger points could be seen asinstitutionalising ‘acceptable’ levels of absence. Someorganisations get round this by resorting to unpublished triggers,set by individual departments and varied periodically.
2.3 Time Series
Many employers collect and report absence data in the form oftime series. Box 10 shows an example of sickness absence among agroup of staff over a 22 month period:
Reporting of a long run of data should enable users to examinehow absence has changed over time. However, there are a numberof influences on the behaviour of sickness absence over time whichneed to be considered in interpreting such series. The three maincomponents of variation are:
seasonal component: regular movements which influenceabsence at particular times of the year
trend or cyclical component: a tendency which continues in onedirection, or as a regular pattern, for a comparatively longperiod
random component: irregular fluctuations in absence whichcannot be explained by any of the previous components.
The chart in Box 10 displays a complex pattern in which valuesincrease and decrease with apparent irregularity, making itdifficult to identify any seasonal pattern or to judge the effects ofany policy intervention. By smoothing out the markedirregularities using a running mean we can gain a betterunderstanding of underlying trends.
Box 10: Sickness absence rate October 1992 to July 1994
0
1
2
3
4
5
6
7
8
Oct
obe
r
No
vem
ber
Dec
embe
r
Janu
ary
Febr
uary
Mar
ch
Apr
il
May
June July
Aug
ust
Sept
embe
r
Oct
obe
r
No
vem
ber
Dec
embe
r
Janu
ary
Febr
uary
Mar
ch
Apr
il
May
June July
Sick
ness
Abs
ence
Rat
e
Source: IES, 1995

Measuring and Monitoring Absence from Work 15
Box 11 shows the three month running mean sickness absence rate(that is, the first value is the average of months 1 to 3, the secondvalue is the average of months 2 to 4 etc.).
2.4 Morbidity
Few employers make use of information on the reasons for staffsickness absence. And yet, such information could be invaluable inenabling occupational health services to identify appropriateworkplace interventions and to focus health promotion activities.
In order to obtain sick pay for absences in excess of seven days,employees must provide a doctor’s certificate stating their reasonfor absence. For shorter absences (in excess of three days)employees should provide self-certificates. Although theinformation contained in the latter tends to be vague, feworganisations make use of this morbidity data.
One of the reasons for the lack of attention to morbidity data is thecurrent lack of an appropriate coding system for medicalcertificates. The International Classification of Diseases (ICD 9 &10) and the Read Codes, have been found too complicated andunwieldy for routine collation of sickness absence data. Most ofthe organisation specific classifications used are simply too crudeto reveal occupational or workplace links.
Self-reported illness is liable to a variety of inaccuracies arisingfrom misdiagnosis, and misrepresentation. Trying to code such‘diagnoses’ is difficult without an agreed classification systemwhich can be used in an occupational health setting. However,even taking into account self-reporting ‘diagnosis’ errors and
Box 11: Three month running mean sickness absence rate
0
1
2
3
4
5
6
7
8
Oct
obe
r
No
vem
ber
Dec
embe
r
Janu
ary
Febr
uary
Mar
ch
Apr
il
May
June July
Aug
ust
Sept
embe
r
Oct
obe
r
No
vem
ber
Dec
embe
r
Janu
ary
Febr
uary
Mar
ch
Apr
il
May
June
Sick
ness
Abs
ence
Rat
e
0
1
2
3
4
5
6
7
Run
ning
Mea
n
Sickness Absence Rate Running Mean
Source: IES, 1995

The Institute for Employment Studies16
misrepresentations, the quantity and spread of the data maydisplay underlying patterns or trends.
A prototype coding system, with something under 100 codes, iscurrently being developed by a major engineering company. If thissystem proves successful it could lead to a standardisedinstrument for use by occupational health services.
2.5 Benchmarking
Clearly, benchmarking absence levels must be done with greatcare, given the number of different absence measures which areavailable and the variety of definitions which can be applied.
However, attendance management is an area where comparativeperformance measurement can be used to identify best practiceand improve performance. Box 12 suggests key attendancemanagement processes for benchmarking.
Box 12: Sickness Absence Benchmarking Criteria
organisational culture & management
management responsibility & commitment
induction, training & development
operational procedures policies, guidelines & understanding
information management
counselling services
occupational health
health & safety
family friendly policies
The characteristics of low, medium and high performers for each
Box 13: Sickness absence benchmarking: management responsibility and commitment
LOW MEDIUM HIGHIssue of sickness absence is notaddressed
Need for reduction in absence isrecognised but few formal policies arein place
The reduction of absence is a businessobjective at board level with formalpolicies in place
Few managers accept responsibilityand expect the personnel function todeal with absence
Some managers accept partialresponsibility but expect personnel tolead
Line managers accept responsibility fortheir role, with personnel advising andmonitoring
No resources allocated to practicesdesigned to reduce absence
Some constraint on commitment ofresources
Willing to commit resources to reducesickness absence
Management uncommitted andunaware of implications of bad workingpractices
Some commitment to putting goodworking practices in place
Commitment to good workingpractices
Source: Oxford Consulting (unpublished)
Measuring and Monitoring Absence from Work 17
of these key factors are then identified and an organisation can rateits performance against the criteria, establish differences in processagainst the benchmark and target future performance.
Box 13 shows possible criteria for one of these key factors:management responsibility and commitment.
The Institute for Employment Studies18
3. Costing Absence
Costing sickness absence and communicating that cost toemployees, is a powerful way of emphasising the importance tothe business of attendance. However, few organisations havemechanisms to identify absence costs and fewer still actuallyexamine them systematically. Nearly three-quarters of therespondents to a 1994 Industrial Society survey were unable tostate a figure for annual sickness absence costs.
Some of these are direct costs, and comparatively easy to assess,others are indirect and more difficult to quantify. Nonetheless,sickness absence is costly, and one way of deciding how serious anabsence problem is might be to ascribe some costs to its majorcomponents.
The main direct cost components are:
occupational sick pay
statutory sick pay
temporary cover
additional overtime costs
lost production or service provision.
Indirect costs of sickness absence include:
increased management time (eg dealing with attendance issues,revising schedules etc.)
increased administrative and clerical time (eg administeringsick pay, arranging cover)
interrupted work flow
lower productivity from temporary staff and from returningstaff
reduced quality and costs of lost materials
added costs of meeting slipped deadlines
loss of customers
occupational health provision
reduced staff morale

Measuring and Monitoring Absence from Work 19
3.1 Top-down costing
The top-down approach provides an estimate of direct sicknessabsence costs to the organisation based on broad assumptions.This approach can give an indication of the magnitude of sicknessabsence costs and can assist in justifying expenditure on measuresdesigned to reduce it.
Top-down costs can be derived in a number of ways. For example:
average absence rate multiplied by average earnings
costs of occupational and statutory sick pay
costs of temporary sickness absence cover or overtime.
3.2 Bottom-up costing
The bottom-up approach concentrates on estimating in greaterdetail the costs of a single occurrence of sickness absence using thechecklist of cost headings above. The checklist acts as an aide-memoire to managers in raising awareness of the various costsincurred by absence and allowing them an insight into thecomparative costs of different absence cover options.
The checklist approach can be used to assess overall costs, byaggregating up notional average costs of one occurrence of shortterm absence.
3.3 Summary
Costing sickness absence in these ways can assist managers indetermining the scale of the problem and can put into context thecosts of introducing new methods of managing attendance.
The Institute for Employment Studies20
4. Using Absence Data to Manage Attendance
Collecting and analysing absence data cannot, by itself, reducelevels of absence. It is just as important to have an approach tomanaging attendance as it is to gathering absence statistics. Thisfinal chapter will briefly highlight how data on absence can beused to help improve attendance at an organisational level.
There are, potentially, four audiences for absence data:
Senior managers
HR professionals
Line managers
Employees.
Each is discussed below.
4.1 Senior managers
A good deal of the research and consultancy work which IES hasconducted in the field of attendance has shown that seniormanagement commitment is seen as crucial to the success of anyattendance management strategy.
Senior managers are important because:
They can influence the culture within which absence statisticsare used. They can send clear messages to employees thatsickness absence is going to be monitored and managed. Thereis evidence that employees who believe that managers areindifferent to absence will have more days sick. Seniormanagers have a key role, therefore, in combating any‘leniency’ effect which might exist in the organisation.
They can ‘sign off’ expenditure on initiatives to improveattendance. This might include IT to help collect and analysedata, training for line managers, or more significantexpenditure on health promotion activities or occupationalhealth services.
Clearly, providing senior managers with data which helps themanswer questions about the extent, nature and costs of employeesickness absence will help them make decisions about prioritiesand resources. Many will already be aware that sickness absence

Measuring and Monitoring Absence from Work 21
may have serious financial implications. Well-presented data canhelp them to understand where cost-effective improvements canbe made.
4.2 HR professionals
In most organisations it will be personnel specialists who are mostfamiliar with absence data. They have several roles:
Designing, setting-up and running systems to collect, analyseand report absence data. While some advanced IT systemsallow for line managers to input and access these data, themajority of organisations have yet to grapple with this level ofsophistication. This places more responsibility on HRprofessionals to ensure that measurement and monitoringsystems are effective.
Advising senior managers on absence trends and costs. Thismight also include recommending strategies for reducingabsence levels.
Advising line managers not just on trends and costs in absence,but on those factors which might influence absence. Thesemight include things directly under the control or influence ofline managers such as workloads, flexibility of working hours,health and safety issues, stress etc. Often, HR professionals havea role in designing and delivering training support for linemanagers on these issues.
Formulating attendance management policies. This will meanensuring that procedures are in place to deal with individualswith high absence levels (eg identifying them, the use ofinterviews, the role of disciplinary procedures etc.), and actingas internal support for line managers with particular problems.
However their role evolves, HR professionals are frequentlycentral to an organisation’s capacity to manage attendance.
4.3 Line managers
If, as is increasingly common, line managers have taken ondevolved responsibility for aspects of finance, businessdevelopment and people management, an avalanche of statisticson absence will be as unwelcome as they are unread. It is one ofthe paradoxes of attendance management that the group withprobably most influence over attendance is the least likely to seeits control as one of its primary roles.
Despite this, there are ways that absence data can be madeaccessible to line managers in a manner which is alsodemonstrably relevant, for example:
Departmental/location breakdowns of absence data and costscan, if brief, graphical and accessible (ie with a brief
The Institute for Employment Studies22
commentary), help line managers make internal comparisonsand monitor change over time.
Providing summary data from individuals’ absence records canhelp managers keep tabs on their own staff, and decide when tomake use of existing attendance procedures.
In addition, if staff attendance finds its way into the criteria whichare used to manage the performance of line managers themselves,their interest in absence data will almost certainly be increased.
4.4 Employees
In a company in the service sector recently visited by IESresearchers, the only data available to employees were individualabsence records, presented as ‘league tables’. This was a ‘data-rich’company which could have made accessible a range of otherperformance indicators, yet it chose only to display absence data.Not surprisingly, employees felt untrusted and patronised.
From this extreme example it is clear that absence data can easilybe abused and used inappropriately, especially in staffcommunication. There are, of course, more constructive uses forthese data:
Organisation wide or departmental absence data, in aggregatedform, can show levels of absence and trends over time. It isbetter that these data are presented among a range of otherindicators, or are communicated as part of regular briefings, toensure that absence is not isolated as the only importantindicator.
Individual absence data can be helpful in ensuring thatemployees know about their level of absence, on a confidentialbasis. This, if set in the context of an organisation with clearattendance procedures, can encourage a degree of self-regulation.
Stories still abound of employees believing they have a sicknessabsence entitlement, and it is important that staff are clear that anyabsence data they see is intended to help monitor and encourageattendance rather than to punish absence.
4.5 Other good practice points
Aside from targeting absence data on particular audiences, severalother uses of absence data might be attempted:
Having differential trigger points. In essence, this meanstriggering absence as an issue once it reaches a pre-determinedlevel. Rather than using the same point for all staff, someorganisations set different triggers for different staff groups. Forexample, interviewing manual workers in occupations

Measuring and Monitoring Absence from Work 23
susceptible to back injury when their sickness levels reach theaverage for all staff is time-consuming and wasteful. Setting atrigger point for each main staff group can facilitate a better andmore targeted monitoring process.
Enhancing data by collecting information on the reasons forabsence can help improve levels of understanding about theunderlying causes of absence. It also helps to focus measureswhich are most likely to lead to reductions (such as changes inworking conditions, flexible working, or the use of occupationalhealth services etc.).
Whatever use absence data is put to, it is essential that theircollection and analysis does not remain an end in itself. Such dataprovide a powerful insight into the nature of any attendanceproblem, and represent a vehicle through which practical solutionscan be targeted and delivered.
The Institute for Employment Studies24
5. Sources of Information
Employers frequently contact the Institute to enquire whethercomparative data are available which can help them to assess thelevels of sickness absence in their organisation. This sectionoutlines some of the main sources of information and help whichare currently available. These include:
Confederation of British Industry
Labour Force Survey
Industrial Relations Service
Industrial Society
a. Confederation of British Industry
The CBI first conducted a survey on absence from work among itsmembers in 1987. A follow-up survey in February 1993 contacted1,200 CBI members and local authorities, of which 300 responded.
The report Too much time out? (CBI/Percom, 1993) includesinformation on:
average days lost and % sickness absence by industrial sector
average days lost by manual and non-manual employees
average days lost for full-time and part-time employees
% sickness absence by size (number of employees) oforganisation
% sickness absence by CBI regions (for full-time manual andnon-manual employees)
average number of days of authorised absence
reported use of various absence policies.
The survey of CBI members is now repeated on an annual basis(see Managing absence — in sickness and in health, CBI, 1994).
b. The Labour Force Survey
The Labour Force Survey (LFS) is a survey of 60,000 householdsconducted annually (since 1984) (and quarterly since 1992) byOPCS on behalf of the Employment Department. Results from
Measuring and Monitoring Absence from Work 25
each quarterly survey are available on-line via the Quantimesystem around six months after the survey closes.
The LFS includes four questions concerning sickness absence.These are:
any days off work sick or injured in the reference week
number of days off work sick or injured in the reference week
whether days off sick or injured includes Sundays
period of sickness or injury.
Using combinations of occupation, employment sector andqualification, the LFS can be used to track sickness absence amongparticular industries (coded by the Standard IndustrialClassification), occupations (using the Standard OccupationalClassification). Data is also available by employment pattern (egfull and part-time) working hours and various demographiccharacteristics such as age, gender and marital status. However,there are constraints arising from the sample sizes for some ofthese sub-populations.
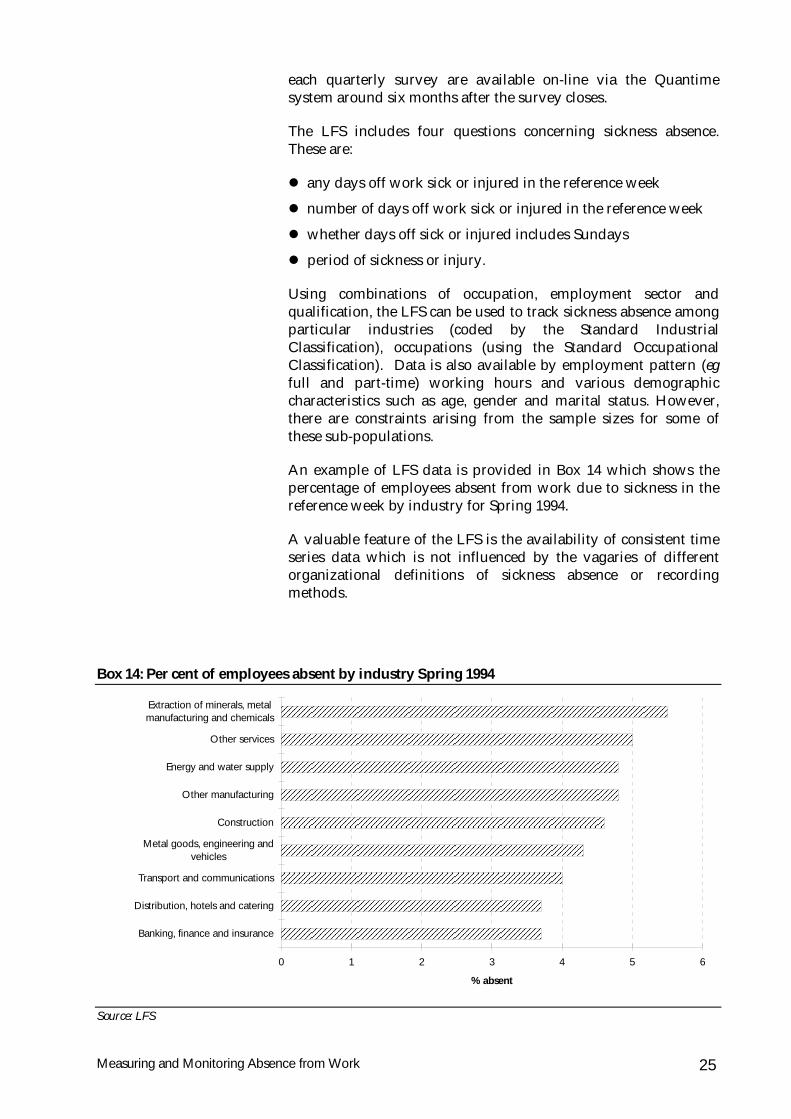
An example of LFS data is provided in Box 14 which shows thepercentage of employees absent from work due to sickness in thereference week by industry for Spring 1994.
A valuable feature of the LFS is the availability of consistent timeseries data which is not influenced by the vagaries of differentorganizational definitions of sickness absence or recordingmethods.
Box 14: Per cent of employees absent by industry Spring 1994
0 1 2 3 4 5 6
Extraction of minerals, metalmanufacturing and chemicals
Other services
Energy and water supply
Other manufacturing
Construction
Metal goods, engineering andvehicles
Transport and communications
Distribution, hotels and catering
Banking, finance and insurance
% absent
Source: LFS

The Institute for Employment Studies26
c. Industrial Relations Services (IRS)
IRS conducts periodic surveys of sickness absence, sick payschemes and sickness monitoring. The most recent surveys wereconducted in 1991 and 1994. Results from the 1994 survey appearin Issue 568 of IRS Employment Trends (September 1994).
d. The Industrial Society
The Industrial Society conducts periodic surveys of absence fromwork and attendance management practices. Wish you were here(1993) compares attendance management practices in UK andJapanese-owned organisations.
The most recent report (November 1994) in their Managing BestPractice series (Managing Best Practice: 6. Managing Attendance) isdevoted to attendance management and presents results from asurvey of nearly 500 personnel professionals.