financial analysis issues impacting title insurance professionals joseph l. petrelli, acas, maaa,...
TRANSCRIPT

Financial Analysis Issues Impacting Title Insurance
Professionals
Joseph L. Petrelli, ACAS, MAAA, FCA

1996 Market ShareCompany DPW Share
1 First American Title Insurance Company 41,590,205$ 26.9%2 Old Republic National Title Insurance Company 17,917,727$ 11.6%3 Chicago Title Insurance Company 15,401,585$ 10.0%4 Stewart Title Guaranty Company 14,535,366$ 9.4%5 Transnation Title Insurance Company 10,399,795$ 6.7%6 Lawyers Title Insurance Corporation 10,088,488$ 6.5%7 Land Title Insurance Corporation 9,974,839$ 6.4%8 Commonwealth Land Title Insurance Company 8,401,000$ 5.4%9 United General Title Insurance Company 7,196,763$ 4.7%
10 North American Title Insurance Company 6,482,600$ 4.2%11 Fidelity National Title Insurance Company 4,425,515$ 2.9%12 Attorneys' Title Guaranty Fund, Inc. (CO) 3,007,389$ 1.9%13 Ticor Title Insurance Company 2,765,259$ 1.8%14 Nations Title Insurance Company 1,273,068$ 0.8%15 Security Union Title Insurance Company 1,243,747$ 0.8%
Colorado Total: 154,703,346$ Source: Performance of Title Insurance Companies, 1997 Edition

2006 Market ShareCompany DPW Share
1 First American Title Insurance Company 122,365,889$ 36.6%2 Stewart Title Guaranty Company 36,977,148$ 11.1%3 Old Republic National Title Insurance Company 27,137,543$ 8.1%4 Chicago Title Insurance Company 25,946,301$ 7.8%5 Land Title Insurance Corporation 23,128,736$ 6.9%6 Lawyers Title Insurance Corporation 16,875,213$ 5.1%7 Fidelity National Title Insurance Company 12,346,815$ 3.7%8 United General Title Insurance Company 10,847,387$ 3.2%9 Transnation Title Insurance Company 10,374,036$ 3.1%
10 Attorneys' Title Guaranty Fund, Inc. (CO) 9,308,433$ 2.8%11 Commonwealth Land Title Insurance Company 8,826,688$ 2.6%12 North American Title Insurance Company 7,275,224$ 2.2%13 Southern Title Insurance Corporation 4,149,460$ 1.2%14 Censtar Title Insurance Company 2,892,148$ 0.9%15 Dakota Homestead Title Insurance Company 2,804,882$ 0.8%16 Security Union Title Insurance Company 2,563,030$ 0.8%17 Alliant National Title Insurance Company 2,232,590$ 0.7%18 Ticor Title Insurance Company of Florida 1,948,098$ 0.6%19 Title Resources Guaranty Company 1,921,584$ 0.6%20 Title Insurance Company of America 1,805,768$ 0.5%21 Ticor Title Insurance Company 1,781,680$ 0.5%22 Commerce Title Insurance Company 494,890$ 0.1%
Colorado Total: 334,003,543$ Source: Performance of Title Insurance Companies, 2007 Edition

Direct Premiums Written
Source: Performance of Title Insurance Companies

Loss Ratio
Source: Performance of Title Insurance Companies, 1997 Edition

Colorado DPW By Channel
Source: Performance of Title Insurance Companies

Colorado DPW By Quarter
Source: Performance of Title Insurance Companies

2006 Countrywide Net Operating Gain
Revenue
1. Total Operating Income $17,571,308,506
Operating Expense
2. Amounts Retained by Agents $11,366,461,601
3. Other Operating Expenses Incurred $4,616,290,509
4. Total Expenses $15,982,662,820
5. Losses & Loss Adjustment Expenses Incurred $869,276,117
Net Operating Gain (Loss) [1 - 2 - 3 - 5] $719,280,279
Source: Performance of Title Insurance Companies

Financial Review of the Title Industry
• “Understanding replaces imaginary fears with real ones.”
– Mason Cooley

GAO: Title Insurance• In particular, the GAO questioned title premium pricing in risk-
rate states. “In risk-rate states, it wasn’t exactly clear that the amounts paid to the agents outside of the premium were fully supported by the underlying costs,” Ward said. “In all-inclusive states, the agents’ splits were intended to cover their commissions and the search and exam costs. It’s our understanding that search and exam costs of the agents are the bulk of their costs. But in risk-rate states, the agents charged outside of the premium for the search and exam costs. So what we expected was that in risk-rate states, the agents’ split would be quite a bit lower, because they don’t have to recover their search and exam costs through the premium rate charge outside of that…”
Source: Recent GAO report on Title Insurance Industry

GAO: Title Insurance
• While the amount of premium paid to or retained by title agents – generally to pay for title search and examination costs and agents’ commissions – is commonly title insurers’ largest expense, most states do not take these costs into account during premium rate reviews.
Source: Recent GAO report on Title Insurance Industry
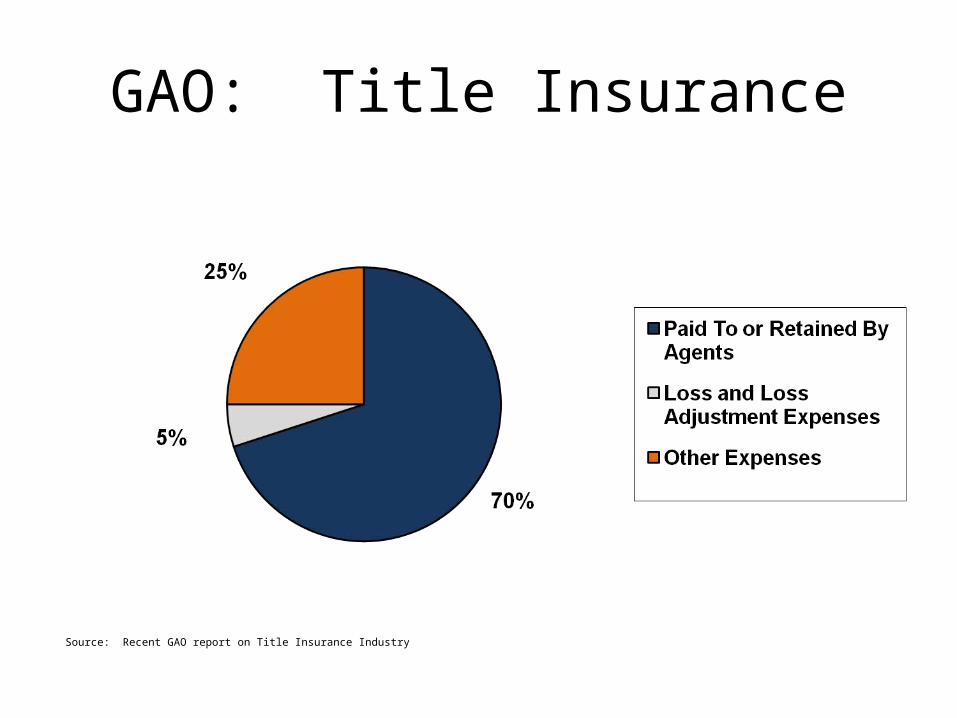
GAO: Title Insurance
Source: Recent GAO report on Title Insurance Industry

GAO: Potential Approach to Better Understand Title Agents’ Costs and How These Costs Relate to Insurance Premiums
1. A complete list of underwriters’ affiliated title agents and title service companies that would include the company name and address and the year acquired or established by the underwriter.
2. Financial data on each affiliate that would include balance sheets and statements of changes in owners’ equity.
3. Revenue data that would include title premium revenues and production fees earned from search and examination, closing, and recording.
Source: Recent GAO report on Title Insurance Industry

GAO (Cont.)
4. Title premium revenues and policies written that would be broken out between residential and commercial. (Communication issue in waiting! 1996 - Recommendation by Demotech)
5. Personnel cost data that would include salaries, commissions, bonuses, benefits, and full-time equivalent employees, by function.
6. Other personnel data that would include average salaries, bonuses and benefits, and brief descriptions of any incentive pay systems, by job type and function.
Source: Recent GAO report on Title Insurance Industry

GAO (Cont.)
7. Five years of expense data that would include search and examination fees paid to contractors, advertising, entertainment, plant maintenance, rent, office supplies, and legal fees and settlements.
8. Expenses allocated to/from an underwriter.
9. For each affiliated title service company, the names of the 10 largest clients.

GAO (Cont.)
10. For each subsidiary of the underwriter, the names of any other underwriters, escrow companies, realtors, builders, developers, mortgage brokers, lenders, or other entities in the title, real estate or mortgage industry– That have ownership interests in the subsidiary,– In which the subsidiary has an ownership interest, or– That are vendors of the subsidiary and owned by subsidiary
management.

An Analysis of Florida’s Title Insurance Market
• Three Studies that Provide a Comprehensive, Multi-Faceted Review of the Florida Title Insurance Industry (July 2006)
1. G. Stacy Sirmans, Kenneth G. Bacheller Professor of Real Estate at Florida State University
2. Randy E. Dumm, Associate Professor of Risk Management and Insurance at Florida State University College of Business and David A. Macpherson, Rod and Hope Brim Eminent Scholar in Economics at Florida State University.
3. Stephen A. Alexander, Actuary, Florida Department of Financial Services’ Office of the Consumer Advocate.

Study Information
• Sirmans Study
• Florida dominated by five title insurance groups• Compared Florida rates to three other all-inclusive rate states• Referenced HUD-1s from Office of Insurance Regulation (OIR)
Dumm-Macpherson Study
• How loss ratio means high profit• Sample of HUD–1s from OIR
Alexander
• Referenced HUD–1s from OIR• Rates should be tied to loss ratio

Excerpt from Sirmans Study
• The cost of title insurance in Florida is determined by examining HUD–1 settlement forms. A sample of 48 Florida HUD–1 forms is used to perform a preliminary analysis of premium costs and related service charges. Along with the premium, consumers also pay related charges such as title search, settlement fees, and document preparation. The total cost of title insurance in Florida averaged about 14 percent of total settlement costs.

Compilation of HUD-1 Information Underlying White Papers on Florida’s Title Insurance Market

What We’ve Got Here is a Failure to Communicate
• While Title insurance coverage looks backward from a certain date, P&C insurance coverage looks forward, utilizing a finite future period, to evaluate liability. The timeframe of coverage and cost containment activities is a fundamental difference between Title and P&C coverages.
• This distinction for Title underwriters has not been properly reflected in at least one aspect of the financial reporting requirements.
Loss Ratio
• Loss adjustment expenses include allocated loss adjustment expenses and unallocated loss adjustment expenses.
• Allocated loss adjustment expenses are those expenses, such as attorneys’ fees and other legal costs, that are incurred in connection with and are assigned to specific claims.
• Unallocated loss adjustment expenses are all other claim adjustment expenses and include salaries, utilities and rent apportioned to the claim adjustment function but not readily assignable to specific claims.

Unallocated Loss Adjustment Expense (ULAE)
• An expense pertaining to handling claims that cannot be specifically attributable to a specific claim.
• Your entire preliminary investigation?

Allocated Loss Adjustment Expense
• An expense directly allocated to a particular claim.
• Addressing specific defects and everything in Schedule B?

Pro Forma 2006 Net Operating Gain
Revenue
1. Total Operating Income $17,571,308,506
Operating Expense
2. Amounts Retained by Agents less Agency LAE (50%) $5,683,230,801
3. Other Operating Expenses Incurred $4,616,290,509
4. Total Expenses $10,299,521,310
5. Losses & Loss Adjustment Expenses Incurred
including Agency LAE (50%) $6,552,506,918
Net Operating Gain (Loss) [1 - 2 - 3 - 5] $719,280,279

The Truth Will Set You Free!
Source: Recent GAO report on Title Insurance Industry

Wish List• Select 12 files, using a random process• Identify TOTAL cost of Title insurance policy to the consumer
– Premium $– Fees or charges $
________ Total $
• Unallocated Loss Adjustment Expenses % - $• Allocated Loss Adjustment Expenses % - $• Types of activity
– Mechanic lien– Missed tax payment– Review easement