final results - dillistone group plc
TRANSCRIPT

29 April 2021
Dillistone Group Plc ("Dillistone", the "Company" or the "Group")
Final Results
Dillistone Group Plc ("Dillistone", the “Company” or the "Group"), the AIM quoted supplier of software for the international recruitment industry, is pleased to announce its audited final results for the 12 months ended 31 December 2020. Highlights:
• New operating structure delivers excellent customer service from reduced cost base
• Recurring revenues1 represent 91% (2019: 82%) of Group revenue
• Recurring revenue covered 97% (2019: 89%) of administrative expenses before acquisition related and other costs2
• Improved adjusted operating loss2 of £0.166m (2019: loss £0.207m) before acquisition related and other costs
• Reduced loss for the year of £0.663m (2019: loss £0.842m) despite the impact of Covid-19 on the business in 2020
• Granted CBIL loan of £1.5m
• Cash at year end was £1.3m
• Successful launch of Talentis executive search software (https://www.talentis.global/recruitment-software/insights/) after year end. First revenue now generated.
Definitions: 1The component elements of recurring revenues are detailed in note 5.
2.Percentages and amounts based on adjusted profits figures - see note 4.
Commenting on the results and prospects, Giles Fearnley, Non-Executive Chairman, said: “The pandemic had a significant impact on the recruitment sector from which the Group derives the vast majority of its revenue. As a result, the business enters 2021 with lower recurring revenues than it entered the preceding year. However, the Board is pleased to report that the new operating structure implemented in 2019, and the further cost reductions implemented as a result of the pandemic, means that the Group is now operating with a much lower cost base. Furthermore, the Board believes that as revenues recover, the efficiencies realised will allow for improved operational leverage. “The Group has had a positive start to the year in terms of trading, with incoming contracts ahead of management’s expectations. Furthermore, the Board believes that Talentis (https://www.talentis.global/recruitment-software/executive-search-software), the new product we announced in January 2021, will have a significant impact on the Group’s long-term performance. While the subscription nature of its revenue model means that realised revenue in 2021 will not be material, we are pleased to report that we have now generated our first revenue from the platform, with initial user feedback being almost universally excellent. Furthermore, we are pleased to report a rapidly developing sales pipeline. “The Group has emerged from a challenging year in a strong position. Better than expected incoming orders in Q1 2021, improved operational leverage, a robust balance sheet and an enhanced product range gives the Board optimism for the future. The Board expects to issue a further update at the time of the AGM.”

Annual Report and Accounts - The final results announcement can be downloaded from the Company's website (www.dillistonegroup.com). Copies of the Annual Report and Accounts (in addition to the notice of the Annual General Meeting) will be sent to shareholders by 22 May 2021 for approval at the Annual General Meeting to be held on 16 June 2021.
This announcement contains inside information for the purposes of Article 7 of EU Regulation 596/2014.
Enquiries:
Dillistone Group Plc Giles Fearnley Chairman Via Walbrook PR Jason Starr Chief Executive Julie Pomeroy Finance Director WH Ireland Limited (Nominated adviser) Chris Fielding Head of Corporate
Finance 020 7220 1650
Walbrook PR Tom Cooper / Paul Vann 020 7933 8780 0797 122 1972 [email protected]
Notes to Editors:
Dillistone Group Plc (www.dillistonegroup.com) is a leader in the supply and support of software
and services to the recruitment industry. Dillistone operates through the Ikiru People brand
(www.IkiruPeople.com).
The Group develops, markets and supports the FileFinder, Infinity, Mid-Office, ISV and
GatedTalent products.
Dillistone was admitted to AIM, a market operated by the London Stock Exchange plc, in June
2006. The Group employs around 100 people globally with offices in Basingstoke, Southampton,
Frankfurt, New Jersey and Sydney. ISV Skills Testing: https://www.isv.online Recruitment Software: https://www.voyagersoftware.com/recruitment-software-blog/best-recruitment-software-agencies/ Software for Temps: https://www.voyagersoftware.com/temporary-recruitment-agency-software/ GatedTalent: https://www.Talentis.global

CHAIRMAN’S STATEMENT 2020 started well for the Group with our early months delivering results ahead of internal expectations. However, the impact of the Covid-19 pandemic on our target market – the recruitment sector – is clear. We have seen many of our clients shrink, with some clients closing. We have additionally supported many clients through agreeing discounted periods, contract variations and deferred terms. The Board reacted swiftly, taking advantage of various government schemes, including furloughing, and staff unanimously supporting a temporary pay-cut (April to September), including all executive and non-executive directors. In June 2020, the Company secured a loan of £1.5m under the UK Government's Business Interruption Loan scheme enabling us to continue to deliver and develop products with confidence. Development remains key to the Group’s future success and we have continued to invest in our main products as well as actively developing our first new product for a number of years - Talentis. Talentis was announced in January 2021 and has been well received by the market. It utilises AI and big data advances to deliver, what the Board believes to be, a highly competitive solution for the needs of recruiters globally. Looking back at 2020 the pandemic had a significant impact on revenue with the total falling 21% to £6.332m, and recurring revenue falling 13% to £5.745m. There was an adjusted operating loss in 2020 of £0.166m (2019: loss £0.207m), mainly due to the fall in revenue being offset with the full benefits of the reorganisation carried out in 2019, the benefit of costs savings measures introduced in 2020 and UK Government support through the furlough scheme and Australian grants. The operating loss, including reorganisation and acquisition related items, was £0.821m (2019: loss £1.090m). Dividends
The Group is not recommending a final dividend in respect of the year to 31 December 2020 (2019:
nil).
Staff
2020 has been a challenging year for everyone and on behalf of the Board I would like to take this
opportunity to sincerely thank every one of our staff for their individual and collective contributions
and for the professional way they have all risen to the challenges of the pandemic, continuing to
deliver for our clients.
Corporate governance
It is the Board’s duty to ensure that the Group is managed for the long-term benefit of all stakeholders. Mike Love stepped down as a non-executive director in September 2020. I would like to sincerely thank him, for his outstanding contribution to the Group over many years. We also welcomed Steve Hammond to the Group Board in January 2021. Steve is the Chief Engineering Officer for the Group and oversees and is responsible for the development for all group products. Details of our governance processes and my role as Chairman of the Board are included in the corporate governance section that follows the Strategic Report. Outlook
The pandemic had a significant impact on the recruitment sector from which the Group derives the vast majority of its revenue. As a result, the business enters 2021 with lower recurring revenues than it entered the preceding year. However, the Board is pleased to report that the new operating structure implemented in 2019, and the further cost reductions implemented as a result of the pandemic, means that the Group is now operating with a much lower cost base. Furthermore, the

Board believes that as revenues recover, the efficiencies realised will allow for improved operational leverage. The Group has had a positive start to the year in terms of trading, with incoming contracts ahead of management’s expectations. Furthermore, the Board believes that Talentis (https://www.talentis.global/recruitment-software/executive-search-software) the new product we announced in January 2021, will have a significant impact on the Group’s long-term performance. While the subscription nature of its revenue model means that realised revenue in 2021 will not be material, we are pleased to report that we have now generated our first revenue from the platform, with initial user feedback being almost universally excellent. Furthermore, we are pleased to report a rapidly developing sales pipeline. The Group has emerged from a challenging year in a strong position. Better than expected incoming orders in Q1 2021, improved operational leverage, a robust balance sheet and an enhanced product range gives the Board optimism for the future. The Board expects to issue a further update at the time of the AGM.
Giles Fearnley Non-Executive Chairman

CEO’s Review
Our Group generates the vast majority of its revenue from the recruitment sector and, with an
estimated 250 million jobs lost globally in 2020 as a result of the pandemic, it has been a
challenging year, and I’d like to begin my review by thanking my colleagues across the World for
the resilience and efforts they demonstrated during this exceptional period.
Across our product range, we provide solutions to facilitate everything from the scheduling of fast
moving volume temporary placements through to the headhunting of CEOs, and from pre-
employment testing of skills through to support with executive career branding.
Strategy and objectives
For any business dependent on recruitment-based revenues, Covid-19 constituted an existential risk. As a result, the Board has taken the view that our overriding objectives need to reflect our new environment and are consequently:
• Ensuring our staff and their families stay safe, engaged and effective;
• Taking appropriate action to maintain a strong and stable financial position, throughout this period and for the future.
• Protecting and prioritising our product and development efforts around solutions that reflect the needs of a post Covid world; and
• Taking all reasonable steps we can to help our clients through a challenging period for the recruitment sector;
While many of our markets remain challenging, it is the current view of the Board that the existential risk to the business has now passed and that 2021 will see a return towards normality. As a result, while we will continue to respond to extraneous factors, management is now focussed on returning the business to growth. Key Performance Indicators (KPIs) As stated above, objectives changed in 2020 and were based around dealing with the Covid
pandemic. Accordingly, the key KPIs for 2020 were:
KPI 2020 outcome Maintain a strong and stable financial position
£1.291m cash at year end
Protect and prioritise our product and development efforts
Development on key products continued and Talentis was launched in January 2021
Our business model Following the reorganisation in 2019, the business is now organised as one trading division - Ikiru
People rather than 3 divisions: Dillistone Systems, Voyager Software and GatedTalent. The
reorganisation brought all of these businesses together with a strong focus on the products we sell.
The majority of our products are commercialised through one or more of the following: 1. Software as a Service (SaaS) subscription basis; or 2. an upfront licence fee plus a recurring support fee; or 3. a hybrid model incorporating an upfront payment and recurring support and cloud hosting
fees.
There is a continuing move away from the upfront licence fee towards cloud delivery (SaaS)
services.

The business operates out of Europe, the US and Australia but services clients globally. As well
as supplying and supporting our software we also host the software for a significant proportion of
our clients. This is done through Microsoft Azure and AWS cloud data centres in Europe, the
Americas, Singapore and Australia.
Group review of the business
2020 saw recurring revenues fall 13% to £5.745m (2019: £6.593m) reflecting the impact of Covid-
19. Attrition exceeded new contract wins in the year. Non-recurring revenues were also impacted
by Covid-19 and fell 58% to £0.485m (2019: £1.160m). As a result, overall revenues decreased
by 21% to £6.332m (2019: £8.027m) with recurring revenues representing 91% of Group revenues
(2019: 82%). Cost of sales reduced 31% to £0.584m (2019: £0.849m).
Adjusted EBITDA1 was down 9% to £1.168m (2019: £1.282m). There was an adjusted operating
loss of £0.166m (2019: loss £0.207m) and there was a pre-tax loss before acquisition related items
and reorganisation and other adjustments of £0.259m (2019: loss £0.298m). The operating loss
for the year reduced to £0.821m (2019: loss £1.090m) with reorganisation and other costs totalling
£0.442m (2019: £0.578m) and acquisition related amortisation of £0.213m (2019: £0.305m). The
loss for the year was £0.663m (2019: loss £0.842m). Net cash at the year end was £1.291m (2019:
£0.402m).
1Adjusted EBITDA is adjusted operating profit with depreciation and amortisation added back. See
note 5.
Covid-19 The Covid-19 pandemic has had a major impact on the world economy and in our target market – recruitment. This has affected our business with many of our clients shrinking and with other clients ceasing to trade, directly impacting our revenue. We reacted swiftly to control the impact of Covid-19 on our business, taking the following actions:
• Taking advantage of the UK Government furlough scheme
• Implementing a temporary pay cut (April to October)
• Switching to home working for the vast majority of staff
• Offering support packages to our clients to help them survive the period and, hopefully, remain as customers
• Using Government support in other jurisdictions where appropriate
• Agreeing the postponement of repayments on our £500,000 bank loan for 6 months. We are on track to repay this loan in full by 30 June 2021
• Obtaining a £1.5m loan under the Government’s Business Interruption Loan scheme
• Making necessary redundancies in light of the reduced trading activity. While we believe the existential threat to the business has passed, uncertainty still remains around the impact of the pandemic. We have performed stress testing on our cashflows, to determine what is the maximum strain that the business could bear over the next 12 months. Further details of this work are contained in Note 2 on Basis of Preparation. We are pleased to note that, with the funding support in place, our Balance Sheet remains strong. Financial Review Total revenues decreased by 21% to £6.332m (2019: £8.027m) with recurring revenues decreasing by 13% to £5.745m (2019: £6.593m) and non-recurring revenues by 58% to £0.485m (2019: £1.160m). Third party resell revenue amounted to £0.102m in the period (2019: £0.274m). Cost of sales decreased to £0.584m (2019: £0.849m). Administrative costs, excluding acquisition related items and other costs and excluding depreciation and amortisation, fell 22% to £4.580m (2019: £5.896m). This was in part due to the full year impact of the reorganisation carried out in

2019 and the additional measures that were taken in 2020 to reduce the cost base. Depreciation and amortisation (excluding acquisition related amortisation and one-off write-offs) decreased to £1.334m (2019: £1.489m). Acquisition related and other costs totalled £0.655m (2019: £0. 883m) and were in respect of:
• the amortisation of intangibles arising from acquisitions £0.213m (2019: £0.305m).
• other costs of £0.442m (2019: £0.578m) which included the write-off of intangibles discussed below.
Recurring revenues covered 97% of administrative expenses before acquisition related and reorganisation and other costs (2019: 89%). The administrative costs, excluding depreciation and amortisation of our own internal development and before acquisition related and reorganisation and other costs, are covered 125% (2019: 112%) by recurring revenues. The Group benefitted from an income tax credit in 2020 of £0.251m (2019: credit £0.339m). The 2020 credit reflects the R&D tax credits available in the UK with the assumption that tax losses will be surrendered for the R&D tax credit payment where possible. It also reflects a prior year adjustment of a credit of £0.108m as the tax computations in respect of prior years were finalised and agreed. The acquisition related items tax credit of £0.041m (2019: £0.058m) reflects the reduction in deferred tax that arises as amortisation is charged in the income statement. The deferred tax charge also reflects the change in deferred tax rate to 19% (from 17%) and has been reflected through the prior year adjustment. Loss for the year before acquisition related and reorganisation and other costs amounted to £0.116m (2019: loss £0.030m). The 2020 adjusted loss benefitted from tax income of £0.143m (2019: tax income of £0.268m). The statutory loss for the year was £0.663m (2019: loss £0.842m). Basic loss per share (EPS) was (3.37)p (2019: (4.28)p). Fully diluted EPS was to (3.37)p (2019: (4.28p)). Adjusted basic EPS fell to (0.59)p (2019: (0.15p)). Dillistone Group Plc company results show a loss of £0.098m (2019: loss £1.843m). Capital expenditure The Group invested £0.971m in property, plant and equipment and product development during the year (2019: £1.100m). This expenditure included £0.969m (2019: £1.067m) spent on capitalised development related costs. The Group also wrote off intangibles assets with a net book value of £0.435m and included these costs in reorganisation and other costs. Trade and other payables As with previous years, the trade and other payables includes deferred income of £2.029m (2019: £2.873m), i.e. income which has been billed in advance but is not recognised as income at that time. This principally relates to support, SaaS, cloud hosting renewals and other subscriptions, which are billed in 2020 but are in respect of services to be delivered in 2021. It also includes licence revenue for which a support contract is required, and which is spread over 5 years under IFRS15. Contractual income is recognised monthly over the period to which it relates. It also includes deposits taken for work which has not yet been completed; as such income is only recognised when the work is substantially complete, or the client software goes “live”. Cash and debt The Group finished the year with cash funds of £1.291m (2019: £0.402m). The Group obtained a loan of £1.5m in June 2020 under the Government CBIL scheme, which is repayable over 6 years with no repayment in the first year. The Group also received a six month payment holiday in respect of its June 2019 loan with repayments totalling £0.166m (2019: £0.126m). The Group expects to complete repayment of this loan in June 2021.

Bank borrowings at 31 December 2020 were £1.802m (2019: £0.374m). The Group also had a convertible loan of £0.408m (2019: £0.412m). It was agreed in the year that the convertible loan notes held by the Directors, would not be repaid until the bank loan was repaid. Jason Starr Chief Executive Officer

CONSOLIDATED STATEMENT OF COMPREHENSIVE INCOME FOR THE YEAR ENDED 31 DECEMBER 2020 2020 2019
Note £’000 £’000
Revenue 5 6,332 8,027
Cost of sales (584) (849)
Gross profit 5,748 7,178
Administrative expenses (6,569) (8,268)
Operating loss (821) (1,090)
Adjusted operating loss before acquisition related, reorganisation and other items
4 (166) (207)
Acquisition related, reorganisation and other items
7 (655) (883)
Operating (loss) (821) (1,090)
Financial cost (93) (91)
Loss before tax (914) (1,181)
Tax income 8 251 339
(Loss) for the year (663) (842)
Other comprehensive income/(loss)
Items that will be reclassified subsequently to profit and loss:
Currency translation differences 12 (16)
Total comprehensive (loss) for the year (651) (858)
Earnings per share
Basic 9 (3.37)p (4.28)p
Diluted 9 (3.37)p (4.28)p

CONSOLIDATED STATEMENT OF CHANGES IN EQUITY FOR THE YEAR ENDED 31 DECEMBER 2020
Share Share Merger Retained Convertible Share Foreign Total
capital premium reserve earnings loan option
exchange
reserve
£’000 £’000 £’000 £’000 £’000 £’000 £’000 £’000
Balance at 1 January 2019
983 1,631 365 1,687 14 106 63 4,849
Comprehensive income
Loss for the year - - - (842) - - - (842)
Other comprehensive income
Exchange differences on translation of overseas operations
- - - - - - (16) (16)
Total comprehensive loss
- - - (842) - - (16) (858)
Transactions with owners
Share option charge
- - - 26 - (12) - 14
Total transactions with owners
- - - 26 - (12) - 14
Balance at 31 December 2019
983 1,631 365 871 14 94 47 4,005
Comprehensive income
Loss for the year ended 31 December 2020
- - - (663) - - - (663)
Other comprehensive income/(loss)
Exchange differences on translation of overseas operations
- - - - - - 12 12
Total comprehensive loss
- - - (663) - - 12 (651)
Transactions with owners
Share option charges
- - - - - 16 - 16
Total transactions with owners
- - - - - 16 - 16
Balance at 31 December 2020
983 1,631 365 208 14 110 59 3,370

CONSOLIDATED STATEMENT OF FINANCIAL POSITION AS AT 31 DECEMBER 2020
Group 2020 2019
ASSETS £’000 £’000
Non-current assets
Goodwill 3,415 3,415
Other intangible assets 3,362 4,234
Property, plant and equipment 24 54
Right to use assets 680 754
Investments - -
Total non-current assets 7,481 8,457
Current assets
Trade and other receivables 883 1,222
Current tax receivable 186 293
Cash and cash equivalents 1,291 690
Total current assets 2,360 2,205
Total assets 9,841 10,662
EQUITY AND LIABILITIES
Equity attributable to owners of the parent
Share capital 983 983
Share premium 1,631 1,631
Merger reserve 365 365
Convertible loan reserve 14 14
Retained earnings 208 871
Share option reserve 110 94
Translation reserve 59 47
Total equity 3,370 4,005
Liabilities
Non-current liabilities
Trade and other payables 271 443
Lease liabilities 638 741
Borrowings 1,749 523
Deferred tax liability 296 340
Total non-current liabilities 2,954 2,047
Current liabilities
Trade and other payables 2,953 3,977
Lease liabilities 103 82
Borrowings 461 551
Total current liabilities 3,517 4,610
Total liabilities 6,471 6,657
Total liabilities and equity 9,841 10,662

CONSOLIDATED CASH FLOW STATEMENT FOR THE YEAR ENDED 31 DECEMBER 2020
For the year
ended 31 December
2020
For the year
ended 31 December
2020
For the year
ended 31 December
2019
For the year
ended 31 December
2019
Operating activities £’000 £’000 £’000 £’000 (Loss) before tax (914) (1,181)
Adjustment for
Financial cost 93 91
Depreciation and amortisation 1,984 1,794
Share option expense 16 14
Foreign exchange adjustments arising from operations (28) (33)
Operating cash flows before 1,151 685
movement in working capital:
Decrease in receivables 360 282
Decrease in inventories - 3
Decrease in payables (1,120) (603)
Taxation refunded 314 167
Net cash generated from operating activities 705 534
Investing activities Purchases of property, plant and
equipment (2) (29)
Sale of Fixed assets - 2
Investment in development costs (969) (1,070)
Net cash used in investing activities (971) (1,097)
Financing activities Interest paid (84) (83)
Proceeds from bank loan 1,500 500
Bank loan repayments made (166) (126)
Lease payments made (114) (49)
(Repayment)/utilisation of banking facility (288) 288
Net cash generated from financing activities 848 530
Net increase/(decrease) in cash and cash equivalents 582 (33)
Cash and cash equivalents at 690 725
beginning of year
Effect of foreign exchange rate changes 19 (2)
Cash and cash equivalents at end of year 1,291 690

NOTES TO THE FINANCIAL STATEMENTS FOR THE YEAR ENDED 31 DECEMBER 2020 1. Publication of non-statutory accounts In accordance with section 435 of the Companies Act 2006, the Directors advise that the financial information set out in this announcement does not constitute the Group's statutory financial statements for the year ended 31 December 2020 or 2019, but is derived from these financial statements. The financial statements for the year ended 31 December 2019 have been audited and filed with the Registrar of Companies. The financial statements for the year ended 31 December 2020 have been prepared in accordance with International Financial Reporting Standards as adopted by the European Union. The financial statements for the year ended 31 December 2020 have been audited and will be filed with the Registrar of Companies following the Company's Annual General Meeting. The Independent Auditors Report on the Group’s statutory financial statements for the years ended 31 December 2020 and 2019 were unqualified and did not draw attention to any matters by way of emphasis and did not contain statements under Section 498(2) or (3) of the Companies Act 2006. 2. Basis of preparation The preliminary announcement is extracted from the consolidated financial statements of the Group. The financial statements of the subsidiaries are prepared for the same reporting date as the parent company. Consistent accounting policies are applied for like transactions and events in similar circumstances. All intra-group balances, transactions, income and expenses and profits and losses resulting from intra-group transactions that are recognised in assets or liabilities are eliminated in full. A degree of doubt still remains with regard to the impact on the Group of the COVID-19 outbreak and the continuing lockdown into 2021 and this has been taken into account in considering the Group's adoption of the going concern basis. The Group has seen many of its clients shrink and with some clients closing and this has been built into the 2021 budgets and subsequent years forecasts. The Group continues to take advantage of the flexible furlough scheme and has secured a second payroll protection loan in the US. A stress test scenario has been modelled that took £70,000 per month off Revenue from May 2021 has been considered. If revenue were to fall in line with the stress test model, the Company would take further remedial action to counter the reduction in profit and cash through a cost cutting exercise that would include staff redundancies and general cost control measures. On this basis, the Group’s cash reserves would be reduced to an overdrawn £212,000 position in November 2021. This would slightly exceed the Group’s overdraft of £200,000. Based on current trading, the stress test scenario is considered remote. However, it is difficult to predict the overall impact and outcome of COVID-19 at this stage, particularly if further lockdowns are required towards the end of 2021. Nevertheless, after making enquiries, and considering the uncertainties described above, the directors have a reasonable expectation that the company has adequate resources to continue in operational existence for the foreseeable future. For these reasons, they continue to adopt the going concern basis in preparing the annual report and accounts. 3. Accounting policies This preliminary announcement has been prepared in accordance with the accounting policies adopted in the last annual financial statements for the year to 31 December 2019.
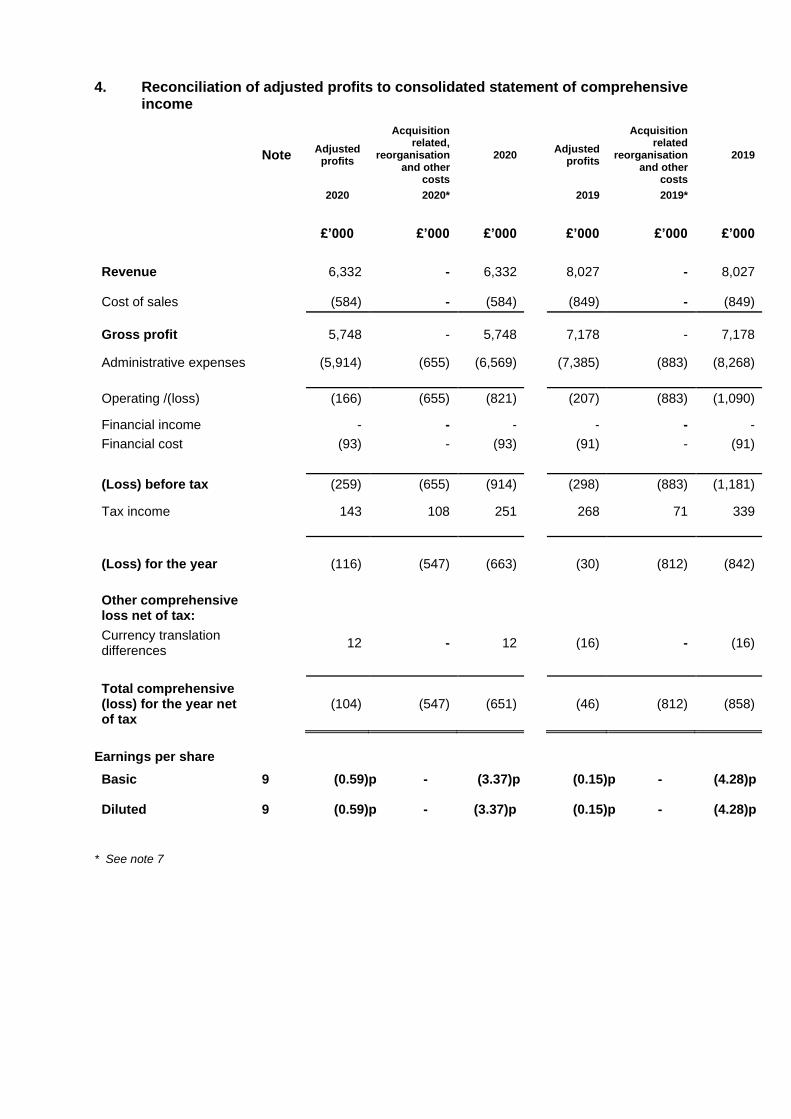
4. Reconciliation of adjusted profits to consolidated statement of comprehensive
income
Note
Adjusted profits
Acquisition related,
reorganisation and other
costs
2020 Adjusted profits
Acquisition related
reorganisation and other
costs
2019
2020 2020* 2019 2019*
£’000 £’000 £’000 £’000 £’000 £’000
Revenue 6,332 - 6,332 8,027 - 8,027
Cost of sales (584) - (584) (849) - (849)
Gross profit 5,748 - 5,748 7,178 - 7,178
Administrative expenses (5,914) (655) (6,569) (7,385) (883) (8,268)
Operating /(loss) (166) (655) (821) (207) (883) (1,090)
Financial income - - - - - -
Financial cost (93) - (93) (91) - (91)
(Loss) before tax (259) (655) (914) (298) (883) (1,181)
Tax income 143 108 251 268 71 339
(Loss) for the year (116) (547) (663) (30) (812) (842)
Other comprehensive loss net of tax:
Currency translation differences
12 - 12 (16) - (16)
Total comprehensive (loss) for the year net of tax
(104) (547) (651) (46) (812) (858)
Earnings per share
Basic 9 (0.59)p - (3.37)p (0.15)p - (4.28)p
Diluted 9 (0.59)p - (3.37)p (0.15)p - (4.28)p
* See note 7

5. Segment reporting In 2019, the Group streamlined its corporate structures and operations to achieve efficiencies
across the business. This resulted in the five UK businesses being combined into one trading
entity subsequently renamed Ikiru People Limited. A similar reorganisation has occurred in
Australia combining our two companies into one and renamed as Ikiru People Pty Limited. The
US business was renamed Ikiru People Inc. These changes came into effect on 31 December
2019. Accordingly, for 2020 onwards, the group is only reporting one trading segment.
Divisional segments
For the year ended 31 December 2020 Ikiru People Central Total
£’000 £’000 £’000
Segment revenue 6,332 - 6,332
Segment EBITDA pre exceptional 1,211
(43) 1,168
Depreciation and amortisation expense
(1,334) -
(1,334)
Segment result before reorganisation and other costs
(123) (43) (166)
Reorganisation and other costs (442) - (442)
Segment result (565) (43) (608)
Acquisition related amortisation (213) (213)
Operating (loss) (565) (256) (821)
Loan interest/ lease interest (39) (54) (93)
Loss before tax (914)
Income tax income 251
Loss for the year (663)
Additions of non-current assets 1,006 1,006
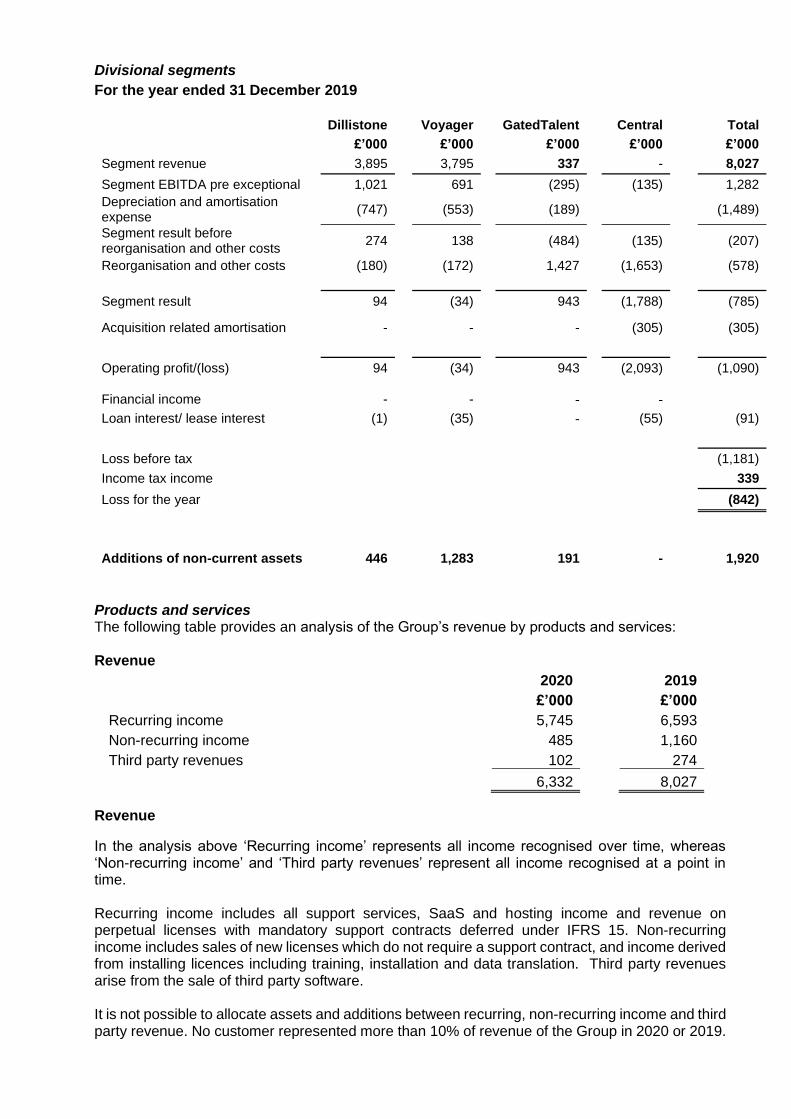
Divisional segments
For the year ended 31 December 2019 Dillistone Voyager GatedTalent Central Total
£’000 £’000 £’000 £’000 £’000
Segment revenue 3,895 3,795 337 - 8,027
Segment EBITDA pre exceptional 1,021 691 (295) (135) 1,282
Depreciation and amortisation expense
(747) (553) (189) (1,489)
Segment result before reorganisation and other costs
274 138 (484) (135) (207)
Reorganisation and other costs (180) (172) 1,427 (1,653) (578)
Segment result 94 (34) 943 (1,788) (785)
Acquisition related amortisation - - - (305) (305)
Operating profit/(loss) 94 (34) 943 (2,093) (1,090)
Financial income - - - -
Loan interest/ lease interest (1) (35) - (55) (91)
Loss before tax (1,181)
Income tax income 339
Loss for the year (842)
Additions of non-current assets 446 1,283 191 - 1,920
Products and services The following table provides an analysis of the Group’s revenue by products and services: Revenue
2020 2019
£’000 £’000
Recurring income 5,745 6,593
Non-recurring income 485 1,160
Third party revenues 102 274
6,332 8,027
Revenue
In the analysis above ‘Recurring income’ represents all income recognised over time, whereas ‘Non-recurring income’ and ‘Third party revenues’ represent all income recognised at a point in time. Recurring income includes all support services, SaaS and hosting income and revenue on perpetual licenses with mandatory support contracts deferred under IFRS 15. Non-recurring income includes sales of new licenses which do not require a support contract, and income derived from installing licences including training, installation and data translation. Third party revenues arise from the sale of third party software. It is not possible to allocate assets and additions between recurring, non-recurring income and third party revenue. No customer represented more than 10% of revenue of the Group in 2020 or 2019.

6. Geographical analysis The following table provides an estimated analysis of the Group’s revenue by geographic market. The Board does not review the business from a geographical performance viewpoint and this analysis is provided for information only. Previously the revenue was based on billing entity and in 2020 on country of customer.
Revenue
2020 2019
£’000 £’000
UK 3,717 5,700
Europe 877 928
Americas 1,074 1,034
Australia 295 365
ROW 369 -
6,332 8,027
Non-current assets by geographical location
2020 2019
£’000 £’000
UK 7,460 8,445
US 20 6
Australia 1 6
7,481 8,457
7. Acquisition related, reorganisation and other costs
2020 2019
£’000 £’000
Included within administrative expenses:
Reorganisation and other costs 78 578
Grants received from overseas jurisdictions (71) -
Amortisation of acquisition intangibles 213 305
Write-off of capitalised development 435 -
655 883
Reorganisation and other costs include severance payments and loss of office payments. The Write-off of capitalised development relates to a product that is no longer actively sold. 8. Tax income
2020 2019
£’000 £’000
Current tax (99) (50)
Prior year adjustment – current tax (108) (140)
Total current tax (207) (190)
Deferred tax (123) (67) Prior year adjustment – deferred tax 80 (24) Deferred tax rate change to 19% 40 - Deferred tax re acquisition intangibles (41) (58)
Total deferred tax (44) (149)
Tax (income) for the year (251) (339)

Factors affecting the tax credit for the year
Loss before tax (914) (1,181)
UK rate of taxation 19.00% 19.00%
Loss before tax multiplied by the UK rate of taxation (174) (224)
Effects of:
Overseas tax rates 1 1
Impact of deferred tax not provided 8 108
Enhanced R&D relief (143) (129)
Disallowed expenses 14 43
Deferred tax rate change to 19% 40 8 Rate difference between CT rate and rate of R&D repayment 31 18
Prior year adjustments (28) (164)
Tax (income) (251) (339)
9. Earnings per share
2020 2020 2019 2019 Using
adjusted profit
Using adjusted
profit
(Loss)/ attributable to ordinary shareholders (note 4)
£(116,000) £(663,000) £(30,000) £(842,000)
Weighted average number of shares 19,668,021 19,668,021 19,668,021 19,668,021
Basic (loss) per share (0.59) pence (3.37) pence (0.15) pence (4.28) pence
Weighted average number of shares after dilution
19,670,013 19,670,013 19,668,021 19,668,021
Fully diluted (loss) per share (0.59) pence (3.37) pence (0.15) pence (4.28) pence
Reconciliation of basic to diluted average number of shares:
2020 2019
Weighted average number of shares (basic) 19,668,021 19,668,021 Effect of dilutive potential ordinary shares – employee share plans 1,992 -
Weighted average number of shares after dilution 19,670,013 19,668,021
There are 953,337 (2019: 1,970,005) share options not included in the above calculations, as they are underwater or have not yet vested. The impact of the convertible loan notes in the period is not dilutive and therefore does not impact the calculation of the fully diluted earnings per share.