final report - university transportation center for mobility … · 2012-01-10 · hiawatha service...
TRANSCRIPT
Benjamin R. Sperry and Curtis A. Morgan
DOT Grant No. DTRT06-G-0044
Intercity Passenger Rail: Implications for Urban, Regional, and National Mobility
Final Report
Performing OrganizationUniversity Transportation Center for Mobility™Texas Transportation InstituteThe Texas A&M University SystemCollege Station, TX
Sponsoring AgencyDepartment of TransportationResearch and Innovative Technology AdministrationWashington, DC
Improving the Quality of Life by Enhancing Mobility
University Transportation Center for Mobility
UTCM Project #11-10-75December 2011


Technical Report Documentation Page 1. Report No.
UTCM 11-10-75
2. Government Accession No.
3. Recipient's Catalog No.
4. Title and Subtitle Intercity Passenger Rail: Implications for Urban, Regional, and
National Mobility
5. Report Date
December 2011 6. Performing Organization Code
Texas Transportation Institute 7. Author(s)
Benjamin R. Sperry and Curtis A. Morgan
8. Performing Organization Report No.
UTCM 11-10-75 9. Performing Organization Name and Address
University Transportation Center for Mobility™
Texas Transportation Institute
The Texas A&M University System
3135 TAMU
College Station, Texas 77843-3135
10. Work Unit No. (TRAIS)
11. Contract or Grant No.
DTRT06-G-0044
12. Sponsoring Agency Name and Address
Department of Transportation
Research and Innovative Technology Administration
400 7th
Street, SW
Washington, D.C. 20590
13. Type of Report and Period Covered
Final Report
January 2011-October 2011 14. Sponsoring Agency Code
15. Supplementary Notes
Supported by a grant from the U.S. Department of Transportation, University Transportation Centers
Program 16. Abstract
Recent policy and regulatory actions by the U.S. government have revived interest in intercity passenger
rail among transportation planners, policymakers, and the general public. As part of a fully integrated
multimodal intercity corridor, passenger rail can provide a number of measurable impacts on urban,
regional, and national mobility. This research examines these impacts using the Milwaukee-Chicago
Hiawatha Service intercity passenger rail route as a case study. In addition to providing competitive
travel times with automobile travel and frequent daily service, rail passengers can also seamlessly
connect to airline service via a station at the Milwaukee airport. Two data sources—an on-board survey
of Hiawatha Service passengers and a more detailed survey of air-rail transfer passengers at the
Milwaukee airport—were used to identify the mobility impacts of rail service. If the rail service did not
exist, most Hiawatha Service passengers would travel via personal vehicle, which indicates that the
Hiawatha Service is providing congestion relief for the highways parallel to the route. The airport link
allows for sustainable ground access to the Milwaukee airport and also extends the market area for the
airport into the Chicago region, providing those residents with greater choices in air travel. The findings
of this project provide unique insight into the mobility impacts of intercity passenger rail and can be used
by state department of transportation rail planners and other public agency staff to develop rail service
plans and administer state passenger rail programs throughout the U.S.
17. Key Words
Public Transit, Mobility, Intercity Passenger Rail,
Intercity Transportation, Policymaking, Railroad
Transportation, Multimodal Transportation,
Passenger Transportation, Gary-Chicago-Milwaukee
Corridor
18. Distribution Statement
Public Distribution
19. Security Classif.(of this report)
Unclassified
20. Security Classif.(of this page)
Unclassified
21. No. of Pages
96
22. Price
N/A
Form DOT F 1700.7 (8-72) Reproduction of completed page authorized.

Intercity Passenger Rail: Implications for Urban, Regional,
and National Mobility
by:
Benjamin R. Sperry
Graduate Assistant Researcher
Multimodal Freight Transportation Program
Texas Transportation Institute
and
Curtis A. Morgan
Program Manager
Multimodal Freight Transportation Program
Texas Transportation Institute
Prepared for:
University Transportation Center for Mobility™
Project #11-10-75
University Transportation Center for Mobility™
Texas Transportation Institute
The Texas A&M University System
College Station, TX 77843-3135
December 2011

2
DISCLAIMER
The contents of this report reflect the views of the authors, who are responsible for the
facts and the accuracy of the information presented herein. This document is disseminated under
the sponsorship of the United States Department of Transportation, University Transportation
Centers Program in the interest of information exchange. The U.S. Government assumes no
liability for the contents or use thereof. Mention of trade names or commercial products does not
constitute endorsement or recommendation for use. Hiawatha Service is a registered service
mark of the National Railroad Passenger Corporation.
ACKNOWLEDGMENT
Support for this research was provided in part by a grant from the U.S. Department of
Transportation, University Transportation Centers Program to the University Transportation
Center for Mobility (DTRT06-G-0044). Additional in-kind support provided by the Wisconsin
Department of Transportation is also gratefully acknowledged.
The authors would like to acknowledge the following individuals for their contributions
to this research project. Wisconsin Department of Transportation employees that contributed to
this project included Ron Adams, Maria Hart, Ethan Johnson, Joe Kapper, David Leucinger, and
Arun Rao. Scott Janowiak of the Wisconsin Transportation Center also assisted with the airport
shuttle passenger survey. The authors wish to thank Amtrak, the Milwaukee General Mitchell
International Airport Landside Operations, and CPS Parking for accommodating the data
collection efforts associated with this project. The authors would also like to thank Texas
Transportation Institute employees Trey Baker, Shawn Larson, and Jeff Warner for their
contributions to this project and report. Finally, the authors wish to thank Todd Popish, rail
passenger section chief at the Illinois Department of Transportation, for serving as the project
monitor for this project.
The research team also wishes to acknowledge the contribution of the Texas
Transportation Institute’s administrative staff that provided editing assistance in the production
of this report and other invaluable assistance throughout the duration of the study.

3
TABLE OF CONTENTS
Page
List of Figures ----------------------------------------------------------------------------------------------- 5
List of Tables ------------------------------------------------------------------------------------------------- 5
Executive Summary ---------------------------------------------------------------------------------------- 7
Chapter 1: Introduction ---------------------------------------------------------------------------------- 13
Research Overview ------------------------------------------------------------------------------------- 13
Project Tasks -------------------------------------------------------------------------------------------- 14
Report Organization ------------------------------------------------------------------------------------ 14
Chapter 2: Background Literature -------------------------------------------------------------------- 15
Overview of Intercity Passenger Rail in the U.S. -------------------------------------------------- 15
Intercity Passenger Rail Access to Airports --------------------------------------------------------- 17
Chapter 3: Research Setting ----------------------------------------------------------------------------- 20
Hiawatha Service Intercity Passenger Rail Route ------------------------------------------------- 21
Milwaukee Airport Rail Station ---------------------------------------------------------------------- 24
Chapter 4: Data Collection ------------------------------------------------------------------------------ 29
Rail Passenger On-Board Survey --------------------------------------------------------------------- 29
Milwaukee Airport Shuttle Passenger Survey ------------------------------------------------------ 30
Institutional Review Board Approval ---------------------------------------------------------------- 38
Chapter 5: On-Board Passenger Survey Analysis -------------------------------------------------- 39
Rail Passenger Trip Information ---------------------------------------------------------------------- 39
Rail Passenger Behavior and Decision-Making ---------------------------------------------------- 44
Rail Passenger Demographic Profile ----------------------------------------------------------------- 53
Chapter 6: Airport Rail Station Shuttle Survey Analysis ----------------------------------------- 59
Shuttle Passenger Trip Information ------------------------------------------------------------------ 61
Shuttle Passenger Behavior and Decision-Making ------------------------------------------------ 64
Shuttle Passenger Demographic Profile ------------------------------------------------------------- 67
Chapter 7: Conclusions ----------------------------------------------------------------------------------- 72
Summary of Findings ---------------------------------------------------------------------------------- 72
Mobility Impacts ---------------------------------------------------------------------------------------- 74
Potential Applications ---------------------------------------------------------------------------------- 77
Future Research ----------------------------------------------------------------------------------------- 78
References --------------------------------------------------------------------------------------------------- 79
Appendix A: On-Board Survey Questionnaire ------------------------------------------------------ 83
Appendix B: Airport Rail Station Data Collection Forms ---------------------------------------- 87
Appendix C: Shuttle Passenger Survey Questionnaire -------------------------------------------- 89
Appendix D: IRB Documentation ---------------------------------------------------------------------- 95

4

5
LIST OF FIGURES
Page
Figure ES-1: Hiawatha Service Passenger Trip Purpose by Day Type ------------------------------ 8
Figure ES-2: Hiawatha Service Passenger Alternative Travel Mode --------------------------------- 9
Figure ES-3: Home Residence of All Rail Passengers and Airport Shuttle Passengers ---------- 10
Figure ES-4: Milwaukee Airport Shuttle Passenger Alternative Travel Mode --------------------- 11
Figure 2-1: Four-Cell Matrix of Airport Ground Access Passengers -------------------------------- 18
Figure 3-1: Location of the Hiawatha Service Intercity Passenger Rail Route -------------------- 21
Figure 3-2: Hiawatha Service Operating Schedule ----------------------------------------------------- 22
Figure 3-3: Hiawatha Service Monthly Ridership, 1989-2011 --------------------------------------- 24
Figure 3-4: Location of Milwaukee Airport Rail Station Facility ------------------------------------ 25
Figure 3-5: Milwaukee Airport Rail Station and Airport Terminal Shuttle Photos---------------- 27
Figure 3-6: Historical Milwaukee Airport Shuttle Ridership Data ----------------------------------- 28
Figure 4-1: Screen Shot of Survey Question Showing Customized Wording ---------------------- 34
Figure 4-2: Frequency Histogram of Response Time for Follow-Up Internet Survey ------------ 38
NOTE: Color figures in this report may not be legible if printed in black and white. A color PDF
copy of this report may be accessed via the UTCM website at http://utcm.tamu.edu or on the
Transportation Research Board’s TRID database at http://trid.trb.org.
LIST OF TABLES
Page
Table 2-1: U.S. Intercity Passenger Rail Ridership, 2011 --------------------------------------------- 16
Table 2-2: Passenger Alternatives to Intercity Rail Service: Past Survey Findings --------------- 16
Table 4-1: On-Board Passenger Survey Data Collection Summary --------------------------------- 30
Table 4-2: Milwaukee Airport Rail Station Shuttle Survey Data Collection Summary ---------- 35
Table 4-3: Comparison of Response Rate and Response Time for Follow-Up Survey ----------- 36
Table 5-1: Rail Passenger Boarding and Alighting Stations ------------------------------------------ 39
Table 5-2: Rail Passenger Mode of Access to Boarding Station ------------------------------------- 40
Table 5-3: Rail Passenger Mode of Egress from Alighting Station ---------------------------------- 40
Table 5-4: Origin of Trip Prior to Boarding Hiawatha Service--------------------------------------- 41
Table 5-5: Destination of Trip after Alighting Hiawatha Service ----------------------------------- 42
Table 5-6: Rail Passenger Trip Purpose by Day Type ------------------------------------------------ 42
Table 5-7: Rail Passenger Round Trip Today and Party Information by Day Type --------------- 43
Table 5-8: Rail Passenger Round Trip Today and Party Information by Trip Purpose ----------- 44
Table 5-9: Rail Passenger Hiawatha Service Trip Frequency by Day Type ------------------------ 44
Table 5-10: Rail Passenger Hiawatha Service Trip Frequency by Trip Purpose ------------------ 45
Table 5-11: Rail Passenger Alternative Travel Mode by Day Type --------------------------------- 46

6
Page
Table 5-12: Rail Passenger Alternative Travel Mode by Trip Purpose ----------------------------- 46
Table 5-13: Rail Passenger Reasons for Choosing Hiawatha Service by Day Type -------------- 47
Table 5-14: Rail Passenger Reasons for Choosing Hiawatha Service by Trip Purpose ---------- 48
Table 5-15: Rail Passenger Service Changes to Increase Ridership by Day Type ---------------- 49
Table 5-16: Rail Passenger Service Changes to Increase Ridership by Trip Purpose ------------- 50
Table 5-17: Rail Passenger Use of Milwaukee Airport Rail Station by Day Type ---------------- 52
Table 5-18: Rail Passenger Use of Milwaukee Airport Rail Station by Trip Purpose ------------ 53
Table 5-19: Rail Passenger Residential Location by Day Type -------------------------------------- 54
Table 5-20: Rail Passenger Residential Location by Trip Purpose ---------------------------------- 55
Table 5-21: Rail Passenger Demographic Characteristics by Day Type ---------------------------- 56
Table 5-22: Rail Passenger Demographic Characteristics by Trip Purpose ------------------------ 58
Table 6-1: Comparison of Traveler Gender, Trip Purpose, Residence, and Market Segment --- 60
Table 6-2: Shuttle Passenger Boarding and Alighting Stations--------------------------------------- 61
Table 6-3: Shuttle Passenger Origin/Destination Before/After Rail Trip --------------------------- 62
Table 6-4: Shuttle Passenger Air Carrier/Other Reason for Accessing MKE ---------------------- 63
Table 6-5: Air Carrier/Other Reason for Accessing MKE by Market Segment -------------------- 64
Table 6-6: Top Origin/Destination Cities to/from MKE among Shuttle Passengers -------------- 64
Table 6-7: Shuttle Passenger Travel Alternatives by Market Segment ------------------------------ 65
Table 6-8: Shuttle Passenger Motivations for Choosing Hiawatha Service for Airport Trip ---- 66
Table 6-9: Shuttle Passenger Residential Location ----------------------------------------------------- 68
Table 6-10: Comparison of Hiawatha Service and Shuttle Passenger Demographics ------------ 70
Table 6-11: Shuttle Passenger Demographic Characteristics by Market Segment ---------------- 71
Table 7-1: Estimate of Diverted and Induced Trips on Hiawatha Service, FFY 2011 ------------ 75
Table 7-2: Passenger Alternatives by Household Vehicles, Age, and Income --------------------- 77

7
EXECUTIVE SUMMARY
Recent policy and regulatory actions by the U.S. government have signaled a new role for
high-speed and other forms of passenger rail as a mobility solution for congested intercity travel
corridors across the country. In high-demand intercity corridors, frequent, high-capacity
intercity rail is thought to have a profound impact on personal mobility on all geographic levels.
Intercity passenger rail can support urban and regional mobility by offering an alternative to
automobile travel for long-distance commuting trips and inter-regional trips (out-of-town day
trips for business as an example). Moving forward, a better understanding of how existing
intercity rail services are being used to enhance mobility and implications for regional travel
patterns if investments in passenger rail are not made is desired to support planning and decision-
making. To expand the body of knowledge for high-speed intercity passenger rail planning in
the U.S., researchers at the Texas Transportation Institute (TTI), with financial support from the
University Transportation Center for Mobility (UTCM) and in-kind assistance from the
Wisconsin Department of Transportation (WisDOT), initiated this research project to examine
the urban, regional, and national mobility impacts of passenger rail in intercity corridors.
RESEARCH SETTING
The setting for this research project was the Hiawatha Service, an Amtrak intercity
passenger rail route operating in the 86-mile corridor between Milwaukee, Wisconsin, and
Chicago, Illinois. The endpoint-to-endpoint travel time is approximately 89 minutes, and there
are seven round trips Monday through Saturday (six on Sundays). Ridership on the route has
grown more than 40 percent over the last five years and exceeded 819,000 passengers over the
12-month period ending September 2011. The route had the highest ridership of any Amtrak
route outside of the Northeast and West Coast. Both Wisconsin and Illinois contribute funds to
support Hiawatha Service operations, and additional targeted investment by the State of
Wisconsin has improved facilities and increased awareness of the route. The Milwaukee Airport
Rail Station, one of the station stops along the route, allows Hiawatha Service passengers to
connect from the rail service to commercial airline flights at Milwaukee General Mitchell
International Airport. A circulating shuttle bus transports connecting passengers between the rail
station and the airport terminal. This connection is unique in that it is one of only four such
direct connections between passenger rail and airports in the U.S. Owing to the route’s trip-time
competitiveness with the automobile, frequent daily service, and an intermodal connection with
the airport in Milwaukee, the Hiawatha Service was the ideal setting for this research project
studying the impacts of intercity passenger rail on urban, regional, and national mobility.
DATA COLLECTION
To examine the mobility impacts of the Hiawatha Service, two separate data collection
efforts were undertaken in this project. The first was an on-board survey of Hiawatha Service
passengers conducted in the spring of 2011. The four-page survey, which consisted of 25
questions, identified information about the passenger’s trip purpose on the day of the survey,
alternatives to the Hiawatha Service, motivations for using the train instead of other modes, and
demographic profile information. Across two days of data collection (a weekday and a weekend

8
day), a total of 2,298 completed surveys were obtained from Hiawatha Service passengers,
achieving a participation rate of 58 percent. The second data collection effort was a more
detailed study of passengers utilizing the shuttle bus connection between the Milwaukee Airport
Rail Station and the airport terminal at Milwaukee General Mitchell International Airport. The
shuttle passenger survey employed an innovative two-part data collection procedure consisting
of an initial field interview conducted with shuttle passengers at the rail station and a follow-up
Internet survey questionnaire. Using a two-part data collection procedure for this survey was
inspired by past research on a survey technique known as “Foot in the Door,” whereby
compliance with a smaller task (in this case, shuttle passenger participation in the initial
interview) results in greater compliance with a larger task (the follow-up Internet survey
questionnaire). The follow-up survey contained 22 questions about the shuttle passenger’s trip
purpose, motivations for using the shuttle connection to access the Milwaukee airport,
alternatives to rail access, and demographic profile information. A total of 848 initial interviews
were conducted with passengers at the Milwaukee Airport Rail Station over a 15-day period in
May and June 2011. From these initial interviews, a total of 155 follow-up Internet survey
responses were obtained, resulting in a response rate of approximately 18 percent.
ON-BOARD PASSENGER SURVEY FINDINGS
The Hiawatha Service on-board passenger survey data revealed valuable insight into the
travel behavior, decision-making, and demographic profile of the rail passengers. There were
clear trends observed between the weekday and weekend passengers in terms of trip purpose.
Figure ES-1 shows the Hiawatha Service passenger trip purpose by day type (see Table 5-6).
Figure ES-1: Hiawatha Service Passenger Trip Purpose by Day Type

9
On weekdays, a majority of passengers were traveling on the Hiawatha Service for business-
related or work commute purposes. This included travelers commuting to or from work on a
daily basis or on a less-than-daily basis. Conversely, almost 80 percent of weekend passengers
were traveling for personal reasons, such as for visiting family or friends, for leisure or
entertainment, as part of vacation, or for shopping. This contrast in trip purpose between
weekday and weekend passengers was also evident in the demographic profile analysis, which
reflected trends in age, employment status, educational attainment, and annual household income
that would be expected between the business/work commute groups and the personal traveler
groups. Another contrast between weekday and weekend passengers was noted in the
passengers’ reasons for choosing the Hiawatha Service for the trip. Weekday passengers tended
to view the convenience aspects of the rail service as a greater influence on why they used the
rail service instead of other modes, while weekend passengers rated the connections between the
rail service and other Amtrak trains, intercity buses, or airlines as more influential.
One key finding from the on-board survey was that 86 percent of passengers would use
other modes of travel if the Hiawatha Service were not available. Figure ES-2 reports the
percentage of Hiawatha Service passengers that would select each alternative travel mode if the
rail service were not available (see Table 5-11).
Figure ES-2: Hiawatha Service Passenger Alternative Travel Mode
Automobile was the primary alternative to rail service, with nearly 70 percent of
passengers reporting that they would use an automobile if the rail service was not available.
Other alternatives to the Hiawatha Service included intercity bus, METRA commuter rail,
airplane, and local transit bus. The option “I Would Not Have Made This Trip” was selected by
14 percent of passengers, indicating a small amount of “induced” travel among the Hiawatha
Service passengers. Commuter rail as an alternative to the Hiawatha Service was slightly higher

10
for weekday travelers, while intercity bus as an alternative to the rail service was higher for
weekend travelers. Applying these findings to the overall Hiawatha Service ridership,
researchers estimated that more than 521,000 annual vehicle trips are shifted from the region’s
highways onto the Hiawatha Service, resulting in an annual vehicle-miles traveled (VMT)
savings in excess of 41.7 million miles. Diversion from other surface and air transportation
modes also provides congestion relief in those networks, thus improving mobility for all travelers
on the urban, regional, and national levels.
AIRPORT RAIL STATION SHUTTLE SURVEY FINDINGS
The Milwaukee airport shuttle passenger survey conducted in this project was unique in
that it specifically focused on passengers utilizing an airport-intercity passenger rail connection
in the U.S. Previous research on airport ground access mode choice defines four segments of
airport ground access travelers based on trip purpose (business or non-business) and the
residential status of the traveler (resident or non-resident of the airport’s market area). The
distribution of Milwaukee General Mitchell International Airport shuttle passengers in each
market segment was as follows:
Resident/Business (17 percent of shuttle passengers);
Resident/Non-Business (24 percent);
Non-Resident/Business (18 percent); and
Non-Resident/Non-Business (41 percent).
Figure ES-3 shows the distribution of home residence location for all Hiawatha Service
passengers and for the Milwaukee airport shuttle passengers (see Tables 5-19 and 6-9).
Figure ES-3: Home Residence of All Rail Passengers and Airport Shuttle Passengers

11
A majority of all Hiawatha Service passengers were from the Milwaukee area. However,
Milwaukee-area residents comprised only 7 percent of the airport shuttle ridership. This was not
surprising, as residents of the Milwaukee area were more likely than non-residents to have other
options available for accessing the Milwaukee airport. Chicago-area residents accounted for
32 percent of shuttle passengers and 23 percent of the overall Hiawatha Service ridership. A
majority of passengers on the Milwaukee airport shuttle (55 percent) were from U.S. states other
than Wisconsin or Illinois. By contrast, only 9 percent of all Hiawatha Service passengers
reported a home residence outside of Wisconsin or Illinois.
Convenience of schedule and train destinations and the desire to avoid highway
congestion were among the key motivations for passengers to use the Hiawatha Service to access
the Milwaukee airport instead of other options. One interesting finding from the shuttle survey
was that not all passengers riding the shuttle were connecting between the Hiawatha Service and
a flight at the Milwaukee airport. Rather, using the shuttle to “Connect to Other Transportation
Options” was reported by 19 percent of shuttle passengers. Such transportation options included
airport-based rental car facilities, which tend to be open longer and have more vehicle choices
than off-airport offices.
Another interesting finding from the shuttle passenger survey was that if the airport-
intercity passenger rail connection were not available, one-third of shuttle passengers would have
used one of the two Chicago-area airports instead of Milwaukee for their flight. Figure ES-4
shows the alternative travel mode for the Milwaukee airport shuttle passengers (see Table 6-7).
The success of the Hiawatha Service as an access mode for the Milwaukee airport is due, in large
part, to the improved accessibility and convenience offered by the service. In turn, synergy
between the Milwaukee airport and larger travel markets in the Chicago central business district
is strengthened by the rail service, potentially allowing for the Milwaukee airport to evolve into a
de facto third airport for the larger region as the connection becomes more fully integrated.
Figure ES-4: Milwaukee Airport Shuttle Passenger Alternative Travel Mode

12

13
CHAPTER 1: INTRODUCTION
Recent policy and regulatory directions by the U.S. government have signaled a new role
for high-speed and other forms of passenger rail as a mobility solution for congested intercity
travel corridors across the country. In April 2009, the Federal Railroad Administration (FRA)
released its Vision for High-Speed Rail in America, which outlined the use of $8 billion in
funding from the American Recovery and Reinvestment Act of 2009 (ARRA, which was signed
into law February 2009) to stimulate job growth by investing in the nation’s passenger rail
infrastructure (1). The funding provided in ARRA was appropriated to funding programs that
were established in the Passenger Rail Investment and Improvement Act of 2008 (PRIIA), which
allowed for a substantial federal match for state investments in intercity passenger rail
infrastructure (2). In January 2010, initial distribution of the $8 billion of ARRA funding for
intercity passenger rail investment was announced, with 31 states receiving funds (3). As of
November 2011, more than $8.1 billion had been awarded to 131 unique intercity passenger rail
infrastructure, equipment, and planning projects across the U.S. (4). Collectively, these events
have raised interest in intercity passenger rail as a mobility solution among transportation
planners, policymakers, and the general public.
RESEARCH OVERVIEW
In high-demand intercity corridors, frequent, high-capacity intercity rail is thought to
have a profound impact on personal mobility on all geographic levels. Intercity passenger rail
can support urban and regional mobility by offering an alternative to automobile travel for long-
distance commuting trips and inter-regional trips (out-of-town day trips for business as an
example). For the latter, intercity passenger rail also offers an alternative to short-haul regional
air carrier flights. In the context of national mobility, high-capacity intercity passenger rail
service can serve to increase the efficiency of airport operations by reducing the number of
regional flights and increasing airport capacity for longer-distance flights. Airport rail stations
also help increase accessibility to intercity rail services for passengers living in the areas
surrounding the airport, providing additional mobility options for these populations. Moving
forward, a better understanding of how existing intercity rail services are being used to enhance
mobility and implications for regional travel patterns if investments in passenger rail are not
made is desired to support planning and decision-making.
To expand the body of knowledge for high-speed intercity passenger rail planning in the
U.S., passenger rail researchers at the Texas Transportation Institute (TTI), with financial
support from the University Transportation Center for Mobility (UTCM) and in-kind assistance
from the Wisconsin Department of Transportation (WisDOT), initiated this research project to
examine the urban, regional, and national mobility impacts of passenger rail as a travel
alternative in intercity corridors. Due to a general lack of investment in passenger rail in the U.S.
over the last several decades, however, there are very few corridors around the country where
intercity passenger rail could truly be considered well-integrated into the multimodal
transportation system. One such intercity corridor is between Milwaukee, Wisconsin, and
Chicago, Illinois. Operating between the two cities (a distance of approximately 90 miles) is an
intercity passenger rail route named the Hiawatha Service. Owing to the route’s trip-time

14
competitiveness with the automobile, frequent daily service, and an intermodal connection with
the airport in Milwaukee, the Hiawatha Service is the ideal setting for a research project studying
the impacts of intercity passenger rail on urban, regional, and national mobility.
PROJECT TASKS
The primary objective of this research was to understand the impacts of intercity
passenger rail connectivity on urban, regional, and national mobility, using the Milwaukee-
Chicago Hiawatha Service rail corridor as a case study. To accomplish the research objective,
seven tasks were proposed. A brief description of the project tasks is as follows:
Task 1, Literature Review: The focus of the literature review included identifying
existing research on the mobility impacts of passenger rail service and a review of
research on the intermodal interface between intercity passenger rail and air travel.
Task 2, Survey Design: This research project examined the mobility impacts of intercity
passenger rail using two separate surveys of rail passengers. The first survey was an on-
board survey of rail passengers on the Hiawatha Service, and the second was a survey
targeted specifically to passengers transferring between the rail service and the airport
terminal at the Milwaukee airport. This task consisted of the design of each survey.
Task 3, On-Board Passenger Survey: This task consisted of the first wave of data
collection, an on-board survey of Hiawatha Service passengers. TTI researchers
collaborated with WisDOT staff members to collect data for this task.
Task 4, Airport Transfer Shuttle Survey: This task consisted of the second wave of
data collection, a survey of passengers riding a shuttle bus connecting the Milwaukee
Airport Rail Station with the Milwaukee airport terminal. An innovative two-part data
collection process that consisted of field interviews and a follow-up survey conducted via
the Internet was developed and implemented for this task.
Task 5, Data Entry and Review: This task consisted of entering the data obtained from
the surveys in Tasks 3 and 4 into a database suitable for more detailed analysis and a
thorough quality control process to check for invalid data. For the on-board passenger
survey data from Task 3, data entry and quality control were led by WisDOT. TTI
researchers oversaw the data entry and quality control process for the Task 4 data.
Task 6, Data Analysis: This task consisted of a full analysis of the survey data obtained
from the data collection efforts in Tasks 3 and 4.
Task 7, Final Report: This task consisted of the development of this report.
REPORT ORGANIZATION
This report describes the study activities, findings, and recommendations. The remainder
of this report is organized into six chapters, as follows. Chapter 2 reports the findings of the
literature review task (Task 1) of the study. The literature review includes a brief overview of
the U.S. intercity passenger rail network and the impacts of intercity passenger rail on personal
mobility. The literature review also provides background information on airport ground access
mode research and identifies the four U.S. airports where direct ground access via intercity
passenger rail is provided. Chapter 3 describes the setting of the research, the Hiawatha Service
intercity passenger rail route. The Hiawatha Service is operated by Amtrak and travels the

15
86-mile corridor between Milwaukee, Wisconsin, and Chicago, Illinois. Specific details on the
Milwaukee Airport Rail Station and the intermodal interface between the rail service and the
Milwaukee General Mitchell International Airport are also given. Chapter 4 provides the details
of the data collection efforts for the Hiawatha Service on-board passenger survey and the
Milwaukee airport shuttle passenger survey. Chapter 5 reports detailed analysis of the Hiawatha
Service on-board passenger survey responses, including trip information, passenger behavior and
decision-making, and demographic profile information. Chapter 6 reports similar analysis for
the Milwaukee airport shuttle passenger survey. The final chapter, Chapter 7, summarizes the
project findings, identifies the key mobility impacts of the rail service, discusses potential
applications for planning and policy, and provides suggestions for future research.
CHAPTER 2: BACKGROUND LITERATURE
This chapter reports the findings of the literature review task of the study. A brief
overview of intercity passenger rail service in the U.S. is provided for the purpose of background
information. The overview also includes a summary of past research findings on the mobility
impacts of passenger rail service in intercity corridors. The chapter also reports background
literature on intercity passenger rail as a ground access mode for airport trips, including profiles
of the four airports in the U.S. where a link between the airport and the Amtrak national intercity
passenger rail network is provided.
OVERVIEW OF INTERCITY PASSENGER RAIL IN THE U.S.
Current U.S. Intercity Passenger Rail Network
Since 1971, intercity passenger rail in the U.S. has been operated by the National
Railroad Passenger Corporation, better known as Amtrak. The Amtrak national intercity
passenger rail network serves more than 500 destinations in 46 U.S. states and 3 Canadian
provinces (5). The Amtrak system consists of three basic components: the Northeast Corridor
component, which includes Acela Express premium high-speed service and Northeast Regional
service; the state-supported and other short-distance component; and the long-distance routes
component. Table 2-1 lists the components of the Amtrak national intercity passenger rail
network and the federal fiscal year (FFY) 2011 ridership and ridership change from FFY 2010
for each. In FFY 2011, Amtrak’s total system ridership exceeded 30 million passengers for the
first time in history, realizing a 5.1 percent growth in ridership from FFY 2010 (6).
In terms of ridership volume, the largest segment of Amtrak’s system is the state-
supported short-distance routes segment. This segment of Amtrak’s system consists of routes
where an individual state (or group of states) contracts with Amtrak to operate passenger rail
service in an intercity corridor in which Amtrak would not otherwise operate. Currently, 15
states contract with Amtrak to operate 21 separate routes. In FFY 2011, these 21 routes
accounted for more than 12 million passengers, or more than 40 percent, of the total Amtrak

16
ridership. Ridership growth on these routes between FFY 2010 and FFY 2011 was 6.9 percent,
higher than the Amtrak system-wide average of 5.1 percent growth.
Table 2-1: U.S. Intercity Passenger Rail Ridership, 2011
Amtrak System Component FFY 2011 Ridership Percent Change
vs. FFY 2010
Northeast Corridor 10,899,889 +5.1
State-Supported Short Distance 12,167,617 +6.9
Other Short Distance 2,597,394 +4.6
Long Distance 4,524,833 +1.1
Total Amtrak System 30,186,733 +5.1
Source (6)
Mobility Impacts of Intercity Passenger Rail
The availability of passenger rail service as a transportation alternative for intercity travel
can support personal mobility in many different ways. By providing travelers with another
option for intercity travel, passenger rail supplements highway, intercity bus, and airplane modes
as available mode choices for city-to-city trips. In this context, rail service helps to relieve
congestion on parallel surface and air transportation networks while also improving travel
conditions for those travelers who remain on those networks. Some travelers, on the other hand,
may not have any other transportation options. This could be because other modes are not
available due to cost or convenience or because the community has no other options for travel.
One measure of the mobility impacts of intercity passenger rail is an evaluation of how
current intercity rail passengers might travel if the rail service did not exist or were otherwise not
available. Such information is typically obtained from passenger surveys. Table 2-2
summarizes passenger alternatives to rail service findings from passenger surveys conducted on
six state-supported Amtrak routes in the last decade.
Table 2-2: Passenger Alternatives to Intercity Rail Service: Past Survey Findings
Corridor/Route Date Automobile (%) Intercity Bus (%) Airplane (%) Would Not
Make Trip (%) Source
Heartland Flyer 2009 63 3 6 28 (7)
Capitol Corridor 2008 77 17 3 10 (8)
Downeaster 2005 51 26 4 18 (9)
Hiawatha Service 2005 70 12 5 14 (10)
Carolinian 2001 43 7 35 14 (11)
Piedmont 2001 59 7 12 20 (11)
Note: Columns may not sum to 100 percent due to rounding
From the survey findings presented in Table 2-2, it is evident that the congestion-
relieving effects of intercity passenger rail are felt most strongly on the highways adjacent to the
rail corridor. Automobile as an alternative to rail service was the most frequently cited
alternative for passengers in the six surveys reported in Table 2-2, ranging from 43 percent
(Carolinian) to 77 percent (Capitol Corridor). The high percentage of rail passengers that would
use an automobile if the rail service were not an option suggests that the availability of rail

17
service plays a critical role in relieving highway congestion in the corridors it serves. A study of
the Oklahoma City, Oklahoma, to Fort Worth, Texas, Heartland Flyer route estimated that
approximately 7.9 million annual vehicle-miles traveled (VMT) were diverted from the parallel
highway (Interstate 35) onto the rail service.
The Carolinian is the longest state-supported Amtrak route, connecting New York City,
New York, with Charlotte, North Carolina, a distance of 704 miles (5). It is not surprising,
therefore, that 35 percent of Carolinian passengers surveyed would have used an airplane if the
rail service were not available. The availability of rail service in an intercity corridor also has the
effect of “inducing” some new intercity trips. The percentage of passengers that “Would Not
Make Trip” in the absence of the rail service ranged from 10 percent (Capitol Corridor) to
28 percent (Heartland Flyer). While such trips do not have a direct effect on relieving
congestion in the parallel transportation networks, they may have other economic and social (i.e.,
non-transportation) benefits.
INTERCITY PASSENGER RAIL ACCESS TO AIRPORTS
Intercity passenger rail provides several opportunities to support a seamless intermodal
airport-surface travel interface. First, at a minimum, intercity rail complements other transit
modes as part of a strategy to increase the overall share of public transportation in airport ground
access trips while reducing the share of such trips made by private automobiles. Second,
depending upon the distance, travel times, and frequencies of the service, intercity passenger rail
can also expand the market area and improve the attractiveness of public transportation access to
airports by increasing accessibility to the airport beyond traditional service areas. Finally, a fully
mature relationship between an airport and intercity passenger rail incorporates the rail service as
a feeder service to the airport, in conjunction with a major airline tenant, to replace certain short-
haul flights and increase airport capacity.
Airport Ground Access by Public Transportation
While the focus of this research project was on intercity passenger rail as an airport
ground access mode, an overview of the research on ground access by all public transportation
modes is helpful to understand the context and factors that may influence the use of intercity
passenger rail for airport ground access. Ground access to airport facilities via public
transportation encompasses a variety of travel modes, ranging from public modes such as rail or
bus transit to privately operated motorcoach bus or shared-ride vans that are available for public
travel. The importance of increasing the share of airport ground access trips by public
transportation is evident in the recent major research studies on the topic (12-14). Collectively,
these studies provide a comprehensive examination of public transportation access to major U.S.
airports and have established best practices for designing and implementing access strategies,
gleaning insight from domestic and international experiences.
Ground access mode share data from the 27 most transit-oriented airports in the U.S.
indicate that approximately 60 million access trips are made using public transportation annually
(14). The highest share of rail transit access to U.S. airports is at Washington National Airport
(13 percent) with San Francisco realizing the highest share for bus and van services (16 percent).

18
Attributes of successful rail transit service to U.S. airports include the proportion of air travelers
with destinations along the rail line, travel times, overall accessibility, and service frequency.
Market Segmentation
One technique used by transit planners to better understand ridership and develop
marketing strategies is known as market segmentation (15). Market segmentation is the
identification of groups of customers, known as market segments, which have similar
characteristics and are likely to exhibit similar purchase behavior and preferences. Market
segmentation can be performed over a wide range of variable types including demographics,
geography, attitudes, and other behavioral factors. The concepts of market segmentation can
also be applied to understanding the market for airport ground access trips. Another major
finding from the previously mentioned studies on public transportation access to airports was
that two variables, trip purpose and the residential status of the traveler (resident or non-resident
of the airport’s market area), exerted the greatest influence on airport ground access mode
choice. Four segments of the airport ground access market for air travelers are defined by the
four-cell matrix shown in Figure 2-1.
Tri
p P
urp
ose
Resident
Business
Non-Resident
Business
Resident
Non-Business
Non-Resident
Non-Business
Residential Status
Figure 2-1: Four-Cell Matrix of Airport Ground Access Passengers (14)
Trends and patterns in the airport ground access mode choice behavior for each of the
four market segments are as follows (14):
Resident Business: Frequent air travelers who are likely to know the most efficient,
reliable, and cost-effective access options. Typically have less baggage than other
travelers. Would utilize public transportation if the services were extremely reliable.
Resident Non-Business: Relatively infrequent air travelers who tend to select the least-
expensive access mode. Likely to use options such as drop-off from friends or family
and likely to have more baggage. Would utilize public transportation if the boarding
location were along their normal route to the airport.
Non-Resident Business: Typically begin their trips at a place of business or hotel.
Likely to utilize access modes that deliver them as closely as possible to their desired
destination with little sensitivity to cost. Would utilize public transportation if it provided
convenient access to their final destination.
Non-Resident Non-Business: Infrequent travelers from outside the airport’s market area,
meaning they are the least informed and most unfamiliar with the access options

19
available at a particular airport. Typically use the most readily available mode of ground
access such as taxi or shuttle, or will be transported by local hosts (family, friends, or
colleagues). Utilize public transportation only if their local hosts assure them it is
convenient and reliable.
Current Intercity Rail Access to U.S. Airports
Linking intercity passenger rail systems with airports creates opportunities for seamless
multimodal travel and improved efficiencies in the surface transportation network. The Amtrak
national intercity passenger rail network includes more than 500 destinations across the U.S. (5).
Many of these stations provide a link to local rail transit or bus services, allowing for an indirect
connection between Amtrak services and airports (5). However, the focus of this research was
on passengers transferring directly from Amtrak rail services to an airport. The following four
U.S. airports currently have a direct link to the Amtrak intercity rail network:
Baltimore/Washington International Thurgood Marshall Airport, Maryland (BWI);
Bob Hope Airport, Burbank, California (BUR);
Milwaukee General Mitchell International Airport, Wisconsin (MKE); and
Newark Liberty International Airport, New Jersey (EWR).
The following sections provide an overview of the current status of intercity rail access to three
of these four airports. Since the focus of this research was the Milwaukee General Mitchell
International Airport, a more detailed description of this facility is provided in the next chapter.
Baltimore/Washington International Thurgood Marshall Airport, Maryland
The Baltimore/Washington International Thurgood Marshall Airport Rail Station
connects the BWI airport to Amtrak’s Northeast Corridor between Baltimore and Washington,
D.C. Passengers can transfer between the rail station and the airport terminal using a dedicated
shuttle bus that runs on a fixed schedule throughout the day (16). Amtrak services at the station
include selected Acela Express high-speed trains, Northeast Regional service, and the Vermonter
(5). The station is also served by the MARC commuter rail. A 2009 passenger survey (17)
estimated that 191,000 originating passengers at BWI accessed the airport using Amtrak or
MARC services, accounting for 2 percent of originating passengers at the airport. The mode
share of rail was slightly higher among non-residents (3 percent) than residents (2 percent).
Bob Hope Airport, Burbank, California
The Bob Hope Airport Train Station is located in Burbank, California, adjacent to the
Bob Hope Airport. The station is within walking distance of the airport terminal or accessible
via the airport parking shuttle. Intercity passenger rail service is provided by Amtrak’s Pacific
Surfliner, which connects San Luis Obispo, Santa Barbara, Los Angeles, Orange County, and
San Diego. Pacific Surfliner trains stop at the station five times daily in each direction. The
once-daily Coast Starlight long-distance train and Metrolink commuter rail also serve the station
(5). A Burbank airport customer service survey (18) found that rail accounted for a minor

20
(0.8 percent) share of ground access trips. The rail mode share among visitors to the region
(1.1 percent) was higher than that of residents (0.4 percent).
Newark Liberty International Airport, New Jersey
The Newark Liberty International Airport Station connects the Newark airport with
Amtrak intercity rail service along the Northeast Corridor between Newark and Trenton, New
Jersey. Passengers wishing to transfer between the rail service and the airport terminals utilize
the AirTrain people-mover system. Amtrak Northeast Regional trains stop at the station on an
hourly basis throughout the day, but no Acela Express high-speed passenger trains stop (5). Two
NJ Transit commuter routes also serve the station. A passenger survey conducted in 2005 (19)
found that rail (Amtrak and NJ Transit) accounted for 3 percent of the overall mode split at
EWR. Rail was the access mode for 3 percent of business travelers and 2 percent of personal
travelers. Among international travelers, the share for rail services was 6 percent, higher than the
3 percent share among U.S. residents.
Airport-Intercity Rail Link: International Experience
At major airports in Europe and Asia, the share of public transportation in the overall
ground access market is much higher than at U.S. airports (14). This is particularly true for rail,
as nearly every major airport in Europe and Asia is served by urban, regional, and/or national rail
systems. Rail systems serving certain European airports have matured to the point where trips on
certain short-haul feeder flights are being replaced with trips on high-speed intercity passenger
rail services to major hubs. In Germany, flights connecting Cologne and Stuttgart with the hub
in Frankfurt have been reduced and substituted with an intercity rail segment (14). This program
was implemented after the airport found that the costs of such feeder flights could not be justified
from a capacity standpoint (20). Air passengers in Cologne and Stuttgart can purchase airline
tickets originating at the rail station and connect through Frankfurt to their final destination on a
single itinerary. A similar program implemented between Brussels and Paris-Charles de Gaulle
Airport has eliminated all flights between the two cities (14). The substitution of short-haul
flights with rail service has been found to result in an overall economic benefit, even if only a
small number of flights are replaced (21). By contrast, experiences in Japan (22) and Spain (23)
suggest that high-speed passenger rail lines are competitive, rather than complementary, with air
travel in those countries.
CHAPTER 3: RESEARCH SETTING
The setting for this research was the Hiawatha Service, an 86-mile intercity passenger rail
route between Milwaukee, Wisconsin, and Chicago, Illinois. The first section of this chapter
describes the location and operational details of the Hiawatha Service route. One of the unique
aspects of this route is that one of the station stops between Milwaukee and Chicago is the
Milwaukee Airport Rail Station, adjacent to the Milwaukee General Mitchell International
Airport. This station is one of only four such stations in the Amtrak national intercity passenger

21
rail system where a link between intercity passenger rail service and an airport is provided. The
second section of this chapter provides more details of the Milwaukee Airport Rail Station.
HIAWATHA SERVICE INTERCITY PASSENGER RAIL ROUTE
Figure 3-1 shows a map of the Hiawatha Service route. Between the Milwaukee
Downtown Intermodal Station and Chicago Union Station, intermediate stops include the
Milwaukee Airport Rail Station and Sturtevant in Wisconsin and Glenview in Illinois.
Figure 3-1: Location of the Hiawatha Service Intercity Passenger Rail Route
Figure 3-2 shows the operating schedule for the Hiawatha Service. Travel time across
the entire length of the route is approximately 90 minutes. Service frequencies Monday through
Saturday are seven trains in each direction, and there are six trains in each direction on Sundays.
In Chicago, passengers can connect with other routes in the Amtrak national network, which

22
includes other short-distance routes to regional destinations including St. Louis, Missouri, or
Detroit, Michigan, as well as long-distance routes to points in the east and west. In Milwaukee,
passengers can connect via Amtrak’s Thruway bus service to communities in western, central,
and eastern Wisconsin, as well as communities in the upper peninsula of Michigan. Similar to
most Amtrak routes outside of the northeast U.S., the Hiawatha Service operates over trackage
that is not owned by Amtrak. Between Milwaukee and Rondout, Illinois, the Hiawatha Service
operates over tracks owned by the Canadian Pacific Railway (CPR), while most of the remainder
of the route is owned by METRA, the Chicago-area commuter rail service. Amtrak owns a short
segment of track leading into Chicago Union Station (7).
Figure 3-2: Hiawatha Service Operating Schedule (5)
The Hiawatha Service is one of more than 20 routes across the Amtrak system that are
supported primarily through funding provided by states, which contract with Amtrak to operate
the service. The Hiawatha Service is jointly funded by the states of Illinois and Wisconsin (5).
WisDOT reports that the total amount of state support for the Hiawatha Service for the state
fiscal year ending June 30, 2011, was approximately $6.9 million. The state support was split
75/25 between the two states, with Wisconsin contributing $5.2 million and Illinois contributing
$1.7 million. In addition to supporting the Hiawatha Service, the State of Illinois also supports
other routes extending south from Chicago to St. Louis, Carbondale, and Quincy (5). The
Hiawatha Service is unique among Amtrak’s state-supported routes segment in that the funding
support for the route is provided by two states. Only one other Amtrak state-supported route, the
Heartland Flyer (funding provided by Oklahoma and Texas), is supported by two states (5).

23
Recent Hiawatha Service Improvements
In recent years, WisDOT has completed or helped to fund a number of projects intended
to improve the Hiawatha Service. In 2004, an advertising campaign promoting the service was
initiated. Leveraging an 80 percent federal CMAQ program grant with a 20 percent local match,
more than $1.1 million has been spent on this campaign to date. Two new station facilities were
constructed in 2005, one at Milwaukee’s General Mitchell International Airport (new station
stop) and another in the Village of Sturtevant (replacement of the existing station). In 2007, the
station in downtown Milwaukee was remodeled from a rail-only facility into an intermodal
terminal. The new Milwaukee Intermodal Station was completed as a public-private venture at a
total cost of $15.8 million. In 2009, the last sections of jointed rail were replaced with
continuously welded rail along CPR right-of-way at a cost of more than $10 million (split 50/50
between an FRA grant and the CPR. Additionally, the state funded the addition of two coach
cars to each train set to accommodate growing ridership.
Planned Hiawatha Service Improvements
The Chicago-Milwaukee corridor is a segment of the Chicago-Minneapolis/St. Paul
spoke on the Chicago Hub Network’s emerging high-speed passenger rail corridor (1). This
corridor, along with other corridors in the Midwestern U.S., is being developed as part of a
proposed multi-state rail system known as the Midwest Regional Rail System (MWRRS). The
first implementation phase of the MWRRS called for the Hiawatha Service to increase to 10
round trips daily between Milwaukee and Chicago, with 6 round trips extending to the state
capital of Madison, Wisconsin, at speeds up to 110 miles per hour on the Madison-Milwaukee
route segment. When the MWRRS is fully implemented, service plans call for 17 daily high-
speed passenger trains in each direction on the Chicago-Milwaukee corridor segment with
projected top speeds of 110 miles per hour (24). An extension of the Hiawatha Service to
Madison was included as part of the ARRA-funded grants for high-speed and intercity passenger
rail service. The grant awarded more than $800 million for investments in the Chicago-
Milwaukee-Madison route, including funds to prepare the corridor for service speeds of up to
110 miles per hour along with some funds granted to Minnesota to complete an environmental
and engineering study of extending the route to Minneapolis/St. Paul. However, the FRA
withdrew most of the ARRA funds designated for the extension to Madison following the
election of a new governor in Wisconsin in November of 2010 and the announcement that the
funds would be rejected and the project stopped. The FRA then redistributed the funds to other
states (25). ARRA grant awards for improvements to the existing Hiawatha Service route were
retained by the state. These grants included more than $11 million to construct a crossover on
the CPR near Truesdell, Wisconsin, and more than $675,000 to lengthen the existing passenger
platform at the Milwaukee Airport Rail Station to accommodate longer Hiawatha Service trains
(4). Forthcoming state-funded improvements to the Hiawatha Service also include two new train
sets to be used on the route and construction of a new train concourse and platforms at the
Milwaukee Intermodal Station. The train sets, which will enter service in 2012, will be
manufactured by Talgo, Inc. in Spain, with final assembly to take place in Milwaukee.
Construction of the train concourse will commence in 2012 and be completed in 2013.

24
Hiawatha Service Ridership
During FFY 2011 (October 1, 2010, through September 30, 2011), a total of 819,493
passenger trips were taken on the Hiawatha Service. In FFY 2011, ridership on the Hiawatha
Service was the sixth highest among Amtrak’s 21 state-supported routes segment (6). FFY 2011,
ridership on the Hiawatha Service represented a 4.7 percent increase in ridership over FFY 2010,
slightly lower than the Amtrak system-wide growth in ridership (5.1 percent). Figure 3-3 shows
the growth in monthly ridership on the Hiawatha Service between April 1989 and September
2011. Also shown in Figure 3-3 is the total number of daily train frequencies for the service
during the same time period. Since FFY 2006, ridership on the Hiawatha Service has grown
more than 40 percent. On-time performance for the Hiawatha Service during FFY 2011 was
88.3 percent, higher than the Amtrak system average of approximately 78 percent (26).
Figure 3-3: Hiawatha Service Monthly Ridership, 1989-2011
MILWAUKEE AIRPORT RAIL STATION
One of the five stations served by the Hiawatha Service is the Milwaukee Airport Rail
Station. This station, which opened in January 2005, has the distinction of being one of four
stations in the Amtrak national intercity passenger rail network where direct access to an airport
is provided. Figure 3-4 shows the location of the Milwaukee Airport Rail Station facility on the
western edge of the Milwaukee General Mitchell International Airport, adjacent to the airport’s
long-term parking lots and aircraft maintenance facilities.

25
(a)
(b)
Figure 3-4: Location of Milwaukee Airport Rail Station Facility
(a) Location of rail station relative to airport terminal
(b) Detailed view of station building, platform, and parking area
Aerial photos from Google Earth

26
Figure 3-5(a) shows an exterior view of the Milwaukee Airport Rail Station building.
The station facilities include a long driveway for passenger pick-up/drop-off and a parking lot
containing 282 parking spaces. The daily cost for parking is $5 per vehicle. The station is not
staffed with an Amtrak ticket agent but does have two automated ticket vending machines for
purchasing tickets. The station building also includes limited indoor seating, drink and snack
vending machines, and restrooms. Two television screens display arrival and departure
information for airline flights as well as the Hiawatha Service train arrivals and departures.
Monitors inside the airport terminal also report the train information. The train platform is
accessible from the parking area either through the station building or via exterior sidewalks.
The train platform is fully compliant with current Americans with Disabilities Act (ADA)
accessibility requirements, including a manually operated wheelchair lift.
Passengers wishing to connect between the rail station and the airport terminal do so by
way of a circulating shuttle bus. This arrangement is similar in nature to the rail-air interfaces at
Baltimore/Washington International Thurgood Marshall Airport in Maryland and Bob Hope
Airport in Burbank, California. A typical shuttle bus is shown in Figure 3-5(b). Since there are
only seven daily trains in each direction, the rail station is not included on the normal circulating
route between the remote parking lots and the airport terminal. Instead, a shuttle is scheduled to
meet each arriving train and take passengers directly to the airport terminal. Passengers arriving
at the station when the shuttle is not present can use a courtesy phone located near the main
entrance to call for the shuttle (Figure 3-5[c]). Since the daily parking rate at the station is lower
than the nearby airport lots, passengers boarding the shuttle at the station are required to present
their Amtrak ticket stub to ensure that the parking lot is utilized only for Amtrak passengers. Air
passengers arriving at the airport terminal and desiring to transfer to the rail station follow
overhead wayfinding signs inside the terminal (Figure 3-5[d]) to a boarding area in the airport
driveway. This arrangement is different from the connections available at the other three airport
rail stations on the Amtrak system, which are served on a fixed schedule. However, at those
airports, a fixed schedule for the connection between the rail station and the airport terminal
makes more sense, as those stations are served by more Amtrak trains and also local commuter
rail services.
27
(a) (b)
(c) (d)
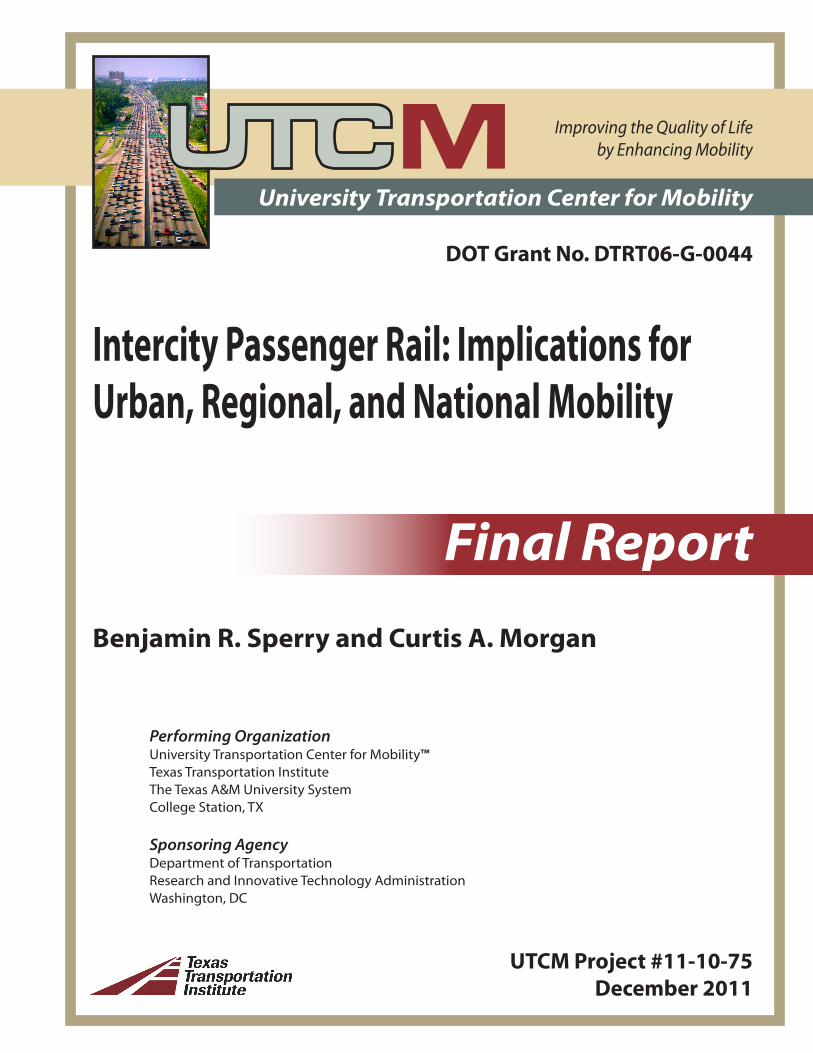
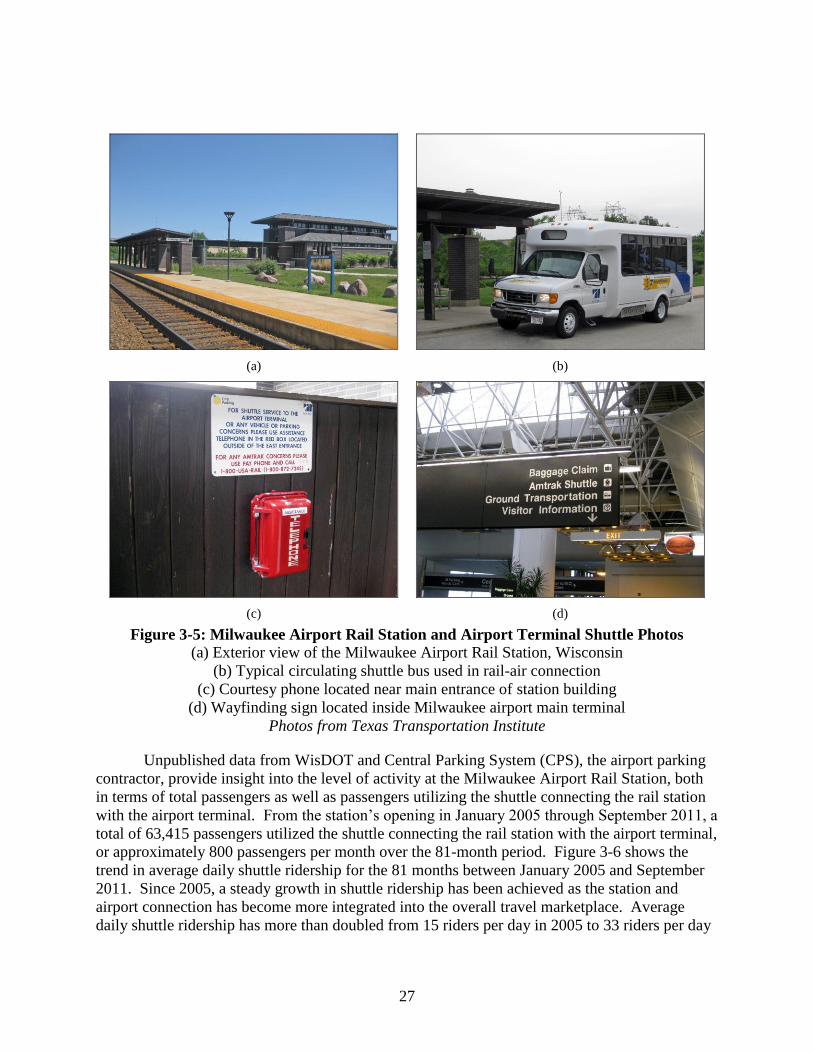
Figure 3-5: Milwaukee Airport Rail Station and Airport Terminal Shuttle Photos
(a) Exterior view of the Milwaukee Airport Rail Station, Wisconsin
(b) Typical circulating shuttle bus used in rail-air connection
(c) Courtesy phone located near main entrance of station building
(d) Wayfinding sign located inside Milwaukee airport main terminal
Photos from Texas Transportation Institute
Unpublished data from WisDOT and Central Parking System (CPS), the airport parking
contractor, provide insight into the level of activity at the Milwaukee Airport Rail Station, both
in terms of total passengers as well as passengers utilizing the shuttle connecting the rail station
with the airport terminal. From the station’s opening in January 2005 through September 2011, a
total of 63,415 passengers utilized the shuttle connecting the rail station with the airport terminal,
or approximately 800 passengers per month over the 81-month period. Figure 3-6 shows the
trend in average daily shuttle ridership for the 81 months between January 2005 and September
2011. Since 2005, a steady growth in shuttle ridership has been achieved as the station and
airport connection has become more integrated into the overall travel marketplace. Average
daily shuttle ridership has more than doubled from 15 riders per day in 2005 to 33 riders per day

28
in 2011. Shuttle ridership is generally higher during the summer months (June, July, and
August) and is lower during the months of January and February.
Also shown in Figure 3-6 is the percentage of all train passengers at the Milwaukee
Airport Rail Station that used the parking shuttle to connect between the rail station and the
MKE airport terminal, by month, from January 2005 through September 2011. In FFY 2011,
total passenger activity (boarding plus alighting) at the Milwaukee Airport Rail Station was
162,825 passengers, representing an increase of 4.6 percent over FFY 2010 passenger activity at
the station. Shuttle activity during the same time period (FFY 2011) showed that 12,091
passengers, or 7.4 percent of all station passengers, transferred between the rail station and the
airport terminal on the shuttle. The total shuttle passenger activity in FFY 2011 represented a
decrease from FFY 2010, both in total passengers (-10.4 percent) as well as in the percentage of
station passengers using the shuttle (-14.3 percent). In the first nine months that the station was
open (January through September 2005), the percentage of station passengers using the shuttle
connection was relatively high, as the overall station ridership was starting to grow. During the
six-year period between October 2005 and September 2011, patronage of both the shuttle and the
station as a whole grew more than 20 percent annually. Consequently, the percentage of station
passengers using the shuttle ranged between 7 and 8 percent of total station ridership during this
same period. It is noted that Milwaukee Airport Rail Station activity includes passengers that are
drawn from the surrounding area in addition to airport travelers.
Figure 3-6: Historical Milwaukee Airport Shuttle Ridership Data

29
CHAPTER 4: DATA COLLECTION
The primary objective of this research was to better understand the impacts of intercity
passenger rail on urban, regional, and national mobility. The Hiawatha Service intercity
passenger rail route and the Milwaukee Airport Rail Station, described in the previous chapter,
provided the ideal setting for this research project. This chapter describes the design and
implementation of the data collection activities associated with this project. Data collection
activities for this project were divided into two separate tasks. The first, Task 3, was an on-board
survey of Hiawatha Service passengers. The second, Task 4, was a two-part survey of
passengers utilizing the transfer shuttle connecting the Milwaukee Airport Rail Station and the
Milwaukee General Mitchell International Airport terminal.
RAIL PASSENGER ON-BOARD SURVEY
Task 3 of the project was an on-board survey of Hiawatha Service passengers. The
purpose of the on-board survey was to assess how current Hiawatha Service passengers use the
rail service for personal mobility. The questions and content of the survey questionnaire were
developed by the project researchers with input from WisDOT, the Illinois Department of
Transportation (IDOT), and a form that was used for a similar survey of Hiawatha Service
passengers in 2005. The final survey questionnaire, which was designed in the paper and pencil
survey format, consisted of 25 questions across 4 letter-sized pages. Questions on the survey
included detailed trip origin and destination information, passenger trip purpose, passenger
alternative travel mode if the Hiawatha Service were not available, passenger motivation for
choosing the rail service, evaluation of on-board services and amenities, potential service
changes that would increase the passengers’ rail trip frequency, and passenger demographics.
The survey also included two questions that assessed the passengers’ use of the Milwaukee
Airport Rail Station. Appendix A contains a copy of the on-board passenger survey
questionnaire used in this task.
Surveys were distributed to passengers on all 14 Hiawatha Service trains on a weekday
(Thursday, March 31, 2011) and a weekend day (Saturday, April 2, 2011). An announcement
was made by participating WisDOT staff on the train’s public address (PA) system informing
passengers of the survey as the trains were departing the origin station (Milwaukee or Chicago).
Survey staff (consisting of TTI researchers and WisDOT staff) then passed through the train and
distributed blank survey forms and pencils (if needed) to adult passengers shortly after the PA
announcement. Survey staff offered each adult passenger the opportunity to participate in the
study. Passengers boarding at intermediate stations were asked to participate as well.
Completed surveys were collected by the survey staff directly from the passenger; after the train
reached its final destination, staff passed through the train to collect any completed surveys that
were left around the seating areas.
Table 4-1 reports the total number of surveys, the total passengers, and the percent
surveyed for each train and survey date (March 31, April 2, and both days combined). A total of
2,298 valid and completed survey questionnaires were obtained from passengers during the two
days of data collection. For Thursday, March 31, 2011, a total of 1,251 valid surveys were
obtained from 2,100 passengers riding the Hiawatha Service that day, resulting in a participation

30
rate of approximately 60 percent. For Saturday, April 2, 2011, a total of 1,047 valid surveys
were obtained from 1,892 passengers, resulting in a participation rate of approximately
55 percent. On a per-train basis, the participation rates varied from as low as 25 percent to as
high as 86 percent of all passengers. The overall participation rate, 58 percent, was slightly
lower than the 62 percent participation rate achieved for a similar survey conducted by WisDOT
in 2005 (10) and lower than the participation rates achieved in surveys on other routes (7). It
should be noted that no tabulations of ineligible passengers (i.e., passengers under age 18) were
maintained during the data collection. Since both eligible and ineligible passengers are included
in the total passenger count for a particular train (as reported in Table 4-1), the participation rate
among eligible passengers would be higher than what is reported here.
Table 4-1: On-Board Passenger Survey Data Collection Summary
Train
Number
March 31, 2011 April 2, 2011 Total 2 Days
Su
rvey
s
Pa
ssen
ger
s
Per
cen
t
Su
rvey
ed
Su
rvey
s
Pa
ssen
ger
s
Per
cen
t
Su
rvey
ed
Su
rvey
s
Pa
ssen
ger
s
Per
cen
t
Su
rvey
ed
329 54 65 83 18 21 86 72 86 84
330 217 251 86 43 68 63 260 319 82
331 17 51 33 29 54 54 46 105 44
332 190 268 71 171 229 75 361 497 73
333 54 79 68 96 143 67 150 222 68
334 96 154 62 114 238 48 210 392 54
335 85 149 57 99 232 43 184 381 48
336 58 85 68 135 207 65 193 292 66
337 69 211 33 79 147 54 148 358 41
338 142 201 71 79 108 73 221 309 72
339 154 279 55 71 201 35 225 480 47
340 52 139 37 48 95 51 100 234 43
341 33 131 25 41 99 41 74 230 32
342 30 37 81 24 50 48 54 87 62
Total 1,251 2,100 60 1,047 1,892 55 2,298 3,992 58
While no formal tabulations on passenger non-participation were maintained, survey staff
noted that many passengers on afternoon or evening train runs declined to participate in the
survey, frequently citing that they had already completed the survey on a morning train. Other
barriers to participation included passengers that were sleeping or working during the train ride.
MILWAUKEE AIRPORT SHUTTLE PASSENGER SURVEY
Task 4 of the project was a survey of passengers utilizing the shuttle connecting the
Milwaukee Airport Rail Station with the airport terminal of Milwaukee General Mitchell
International Airport. This section describes the challenges encountered by researchers in the
process of developing this survey and provides the details of a two-part data collection procedure
that was ultimately used in this task.

31
Data Collection Design
The target population for this survey was shuttle passengers connecting between the rail
station and the airport terminal. The goal of the survey was to better understand the decision-
making process and other characteristics of these passengers. The target population and the
setting of the research presented researchers with three unique challenges for the design of this
survey. First and foremost, the target population was not easily isolated. Shuttle bus passengers
were not exclusive users of the Milwaukee Airport Rail Station (there is an adjacent parking lot
with ridership drawn from the surrounding community), nor were they necessarily exclusive
users of the shuttle bus (shuttle buses also circulated between the airport terminal and the long-
term parking lots around the airport). This ruled out the possibility of a static advertising display
promoting the study located in the station (shuttle passengers accounted for approximately
10 percent of station activity) or an interview taking place on board the shuttle. Second, the
target population included passengers that were connecting from the rail service to the airport
(probably trying to catch a flight) as well as passengers that were connecting from the airport to
the rail station. This presented a challenge, as the survey design needed to be adaptable to trips
in both directions. Finally, the survey design needed to be flexible enough to account for
passengers with a limited amount of time (alighting the rail service with a shuttle waiting
approximately 200 feet away) or passengers with a greater amount of time (e.g., arriving at the
rail station an hour before the next scheduled train departure).
Given these issues, it was determined that an Internet-based traveler survey questionnaire
containing the questions of interest was the most optimal choice for the shuttle passenger survey.
An Internet survey was preferred over other survey options (paper survey), as it would not
systematically exclude shuttle riders who did not have the time to respond to a paper survey. As
such, the objective for the research design was to develop a data collection procedure that
recruited shuttle passengers to visit a website and provide responses to various questions related
to their travel behavior and personal characteristics. Initially, the data collection design called
for a researcher to identify and distribute postcards to adult shuttle passengers inviting them to
visit a website and provide responses to the survey. Ultimately, the data collection plan
consisted of two parts: an initial interview of shuttle passengers, conducted at the Milwaukee
Airport Rail Station, and a follow-up Internet survey, which included all of the questions of
interest to the underlying research project.
Foot-in-the-Door Compliance Technique
The impetus for adding the initial interview portion of the data collection plan was
motivated by two factors. First, given that the response rate for the Internet survey as a
standalone product was unknown, the use of an initial interview would allow for the collection of
a minimal amount of data in the field, in turn providing some information about shuttle
passengers in the event that response to the Internet survey was low. Second, researchers felt
that the use of the initial interview in conjunction with the request to complete the Internet
survey (request via postcard invitation) would serve to improve response to the Internet survey
by establishing the legitimacy of the Internet survey in the mind of the shuttle passenger being
interviewed.

32
The second factor mentioned above resembles a concept known as the foot-in-the-door
compliance technique for surveys. The foot-in-the-door technique, which can trace its roots to
Freedman and Fraser’s 1966 study of Palo Alto, California, housewives (27), is a survey method
whereby an individual who has agreed to comply with a smaller request is more likely to comply
with a larger request (which also happens to be the request of interest to the researcher). In the
decades following Freedman and Fraser’s study, a number of meta-analyses (28-31) have
consistently proven this, demonstrating higher compliance rates with the larger request given
compliance with a smaller request. For the purposes of the present study, researchers felt that
shuttle passengers’ compliance with a smaller request (agreeing to provide responses to a short
interview) would improve overall response to the larger request, the Internet survey.
While the foot-in-the-door technique appears to have been used extensively in other
subject areas, instances of its use are surprisingly rare in the transportation literature. A 1982
article by Sheskin and Stopher (32) describes the design and implementation of a two-part on-
board transit passenger survey. The survey featured a shorter portion to be completed by the
passenger during the bus ride and a longer questionnaire to be detached from the shorter portion,
completed by the passenger at a later time, and returned via mail. They noted that using the short
form made it easier for the respondent to recall the bus ride and thus made it easier to complete
the longer form. However, case studies provided no comparison between the response rates of
the two-part form and response rates with the mail-back portion used as a standalone approach.
Other examples of the use of the foot-in-the-door technique in transportation include the use of a
pre-intervention gift of a “green” bag prior to requests to participate in a voluntary travel
behavior change program (33), public commitment to comply with speed limits in the
rehabilitation of the most serious speed violators (34), and the use of safe ride home programs
for intoxicated bar patrons who had previously signed a petition against drunk driving (35).
Initial Field Interviews
Given the evidence in support of a greater compliance rate for the desired activity (in this
case, shuttle passengers participating in an Internet survey about their travel), a short interview
(called the initial interview throughout this report) was designed to accompany the request for
participation in the Internet survey. In addition to effectively placing a “foot in the door” with
the target population, the initial interview also allowed for the collection of basic data about the
shuttle passengers. The initial interview contained observational elements as well as two
interview questions and the request to participate in the Internet survey (referred to here as the
follow-up Internet survey to distinguish it as coming after the initial interview). For each adult
traveler passing through the Milwaukee Airport Rail Station identified as either boarding or
alighting the airport terminal shuttle, the following items were observed: direction of travel (to
airport or to rail station), train number, party size (adults and children), and gender. Researchers
approached as many shuttle passengers as possible, identified themselves and the purpose of the
study, and asked two interview questions. The two interview questions asked the shuttle
passenger about the purpose of his or her travels (business or personal) and for the zip code of
his or her home residence. These two questions were selected based on prior research on airport
ground access mode choice, which found that trip purpose and residential status (resident or non-
resident of the airport’s market area) exert the greatest influence on ground access mode choice
(14). The two interview questions were fairly quick, taking a maximum of 15-20 seconds per

33
passenger, and of a discreet nature, allowing for the passenger to be more comfortable answering
in a public setting. Due to the overall smaller size of the target population (expected average of
40 to 50 passengers per day spread out across 14 hours of train activity), sampling was not used
to select passengers for the initial interview. Rather, researchers attempted to gather initial
interviews from as many shuttle passengers as possible during a given day of data collection.
Following the two interview questions, the researcher provided the passenger with a
recruitment postcard describing the study and prominently displaying the survey website URL,
requesting that he or she visit the website and complete a short follow-up survey containing more
details about the trip. The postcard included a heading title, logos of the sponsoring agencies, a
short description of the research study, the survey URL, a unique access code, a reminder about
an incentive for participation, and the deadline for completion. Shuttle passengers traveling from
the rail station to the airport received a recruitment postcard printed on yellow card stock paper,
while passengers traveling from the airport to the rail station received a blue-colored card. The
rationale for having different colors was two-fold. First, researchers believed that distributing
the brighter color card to passengers going to the airport would improve the visibility of the
postcard among other travel documents (many more documents are associated with air travel
than rail travel) after having been shuffled amongst these documents during a multiple-hour
airplane flight. Second, having two different color cards made the distribution of postcards
easier for researchers; the importance of giving the proper card to a passenger traveling in a
certain direction is discussed in the next section. Appendix B contains materials used in the
initial field interviews of passengers at the Milwaukee Airport Rail Station, including the
interview form and a sample follow-up Internet survey recruitment postcard.
Follow-Up Internet Survey Questionnaire
After the initial interview, researchers recruited shuttle passengers to visit a website and
complete a follow-up Internet survey, which was the original objective of the task. The follow-
up survey, which contained 22 questions across 7 website pages, included the following topics:
More detailed classification of the passenger’s purpose of travel;
Details of the rail segment of the passenger’s trip;
Passenger’s preferred airport ground access mode if the rail service were not an option;
Passenger’s motivations for using the rail service to access the Milwaukee airport;
How the passenger heard that rail service was an option for airport access;
Details of the airline flight segment related to the passenger’s rail trip; and
Demographics of the passenger.
Appendix C contains a copy of the follow-up Internet survey questionnaire. The use of a unique
access code on each postcard allowed for this survey to benefit from two unique features of
Internet surveys. First, the survey software used by the researchers allowed for a closed-access
survey, that is to say, only individuals with a valid access code could enter the survey and
provide responses. This allowed researchers to control access to the survey and limit access only
to passengers who received a recruitment postcard. Second, the structure of the access code
allowed for certain aspects of questions to be customized to the passenger’s experiences. Each
unique access code was associated with a particular date of travel and travel either to the airport

34
or to the rail station. Questions were then customized with the date of travel, and the to/from
element of the question wording was automatically selected. Figure 4-1 shows an example of a
question that was customized using information associated with each access code, with
customized wording circled. Customization of the questions aided respondent recall by
reminding the respondent which day the interview took place and that the questions on the
survey were about the trip that he or she made on that day.
Figure 4-1: Screen Shot of Survey Question Showing Customized Wording
Shuttle Survey Administration
Prior to implementing the shuttle passenger survey, researchers coordinated with
Milwaukee County (airport owner) and CPS Parking (shuttle operator) to obtain assistance and
cooperation during the field work, including the appropriate security clearances. Initial field
interviews of shuttle passengers were conducted at the Milwaukee Airport Rail Station on
15 days, specifically on May 25 and June 13 through June 26, 2011. Table 4-2 summarizes the
results of the data collection activities. During the 15-day effort, a total of 961 shuttle passengers
were observed, of which 848 (88 percent) participated in the initial interview and received the
postcard invitation to participate in the follow-up Internet survey. Following the field data
collection, the follow-up Internet survey remained open for responses until July 17, 2011,
providing approximately three weeks from the distribution of the final recruitment postcard for
shuttle passengers to visit the website and participate in the survey.
To increase passenger response to the follow-up Internet survey, participants were given
the opportunity to enter into a random drawing for a gift card valued at $250. Upon completion
of the survey questionnaire, participants were provided with a link to a separate Internet survey
for the entry into the gift card drawing. Entry into this drawing was optional, and the
information collected included the respondent’s name and telephone number. Collecting the
information for the gift card drawing as a separate survey allowed the respondents’ identities to
remain separate from their responses to the survey questionnaire. On July 28, 2011, study
researchers randomly selected a name from the list of entries into the gift card drawing and
mailed the $250 Visa gift card to the selected individual.
Out of 848 recruitment postcards distributed to shuttle passengers during the 15 days of
initial interviews, a total of 155 valid follow-up survey responses were collected, resulting in an

35
overall survey response rate of 18.3 percent (see Table 4-2). The survey response rates by day
ranged from 7 percent to 28 percent.
Table 4-2: Milwaukee Airport Rail Station Shuttle Survey Data Collection Summary
Date Shuttle Riders
Observed
Cards
Distributed
Percent
Contacted
Follow-Up
Completed
Percent
Follow-Up
May 25 114 109 96 16 14.7
June 13 98 98 100 13 13.3
June 14 60 54 90 13 24.1
June 15 71 57 80 14 24.6
June 16 66 59 89 13 22.0
June 17 65 61 94 13 21.3
June 18 38 35 92 4 11.4
June 19 50 48 96 11 22.9
June 20 45 43 96 12 27.9
June 21 47 40 85 8 20.0
June 22 71 66 93 8 12.1
June 23 53 43 81 3 7.0
June 24 73 57 78 12 21.1
June 25 56 43 77 9 20.9
June 26 54 35 65 6 17.1
Total 15 Days 961 848 88 155 18.3
Shuttle Survey Response Analysis
Given the innovative design of the two-part data collection procedure used in the
Milwaukee airport shuttle passenger survey, researchers conducted a more in-depth analysis of
the survey response patterns. It is possible, for example, to implement a similar two-part data
collection approach in a variety of applications where the goal is to intercept travelers while they
are traveling and recruit them to participate in a survey. Therefore, to guide future studies, a
more detailed analysis of the approach used in this project is given in this section. As previously
reported, the overall response rate for the follow-up Internet survey was 18.3 percent. A second
metric used to evaluate the response to the follow-up Internet survey is the response time,
defined here as the time (in days) between the initial interview and the completion of the follow-
up survey. For the 155 completed follow-up surveys, the average response time was 6.75 days,
or nearly one full week, between the time the respondent received the recruitment postcard and
completed the survey.
From the initial interview, researchers examined several variables to determine if any
trends in the response characteristics of the follow-up survey were present. Table 4-3 shows the
follow-up survey response rate and response times by day type (travel on weekday or weekend),
time of day (morning, afternoon, or evening), travel direction (to the airport or to the rail station),
gender, trip purpose (business or personal), residential status (Milwaukee metropolitan statistical
area [MSA], Chicago MSA, or Non-Resident). Also shown in Table 4-3 is the response rate and
response times by the four air traveler market segments, which are defined by a combination of
residential status and trip purpose—the two variables that are most influential in airport ground
access mode choice (14).

36
Table 4-3: Comparison of Response Rate and Response Time for Follow-Up Survey
Initial Interview Variables Response
Rate (%)
Response
Time (Days)
Overall All Responses 18.3 6.75
Day Type Weekday 18.2 7.06
Weekend 18.6 5.50
Time of Day
Morning (7:00 AM to 11:00 AM) 20.7 5.66
Afternoon (11:00 AM to 3:00 PM) 18.3 6.35
Evening (3:00 PM to 8:00 PM) 17.3 7.64
Travel Direction1
To Airport 15.9 7.13
To Rail Station 21.8 6.36
Gender2
Male 19.0 5.84
Female 19.4 8.14
Trip Purpose Business 20.1 6.63
Personal 18.3 6.83
Home Residence1
Milwaukee MSA 18.2 7.33
Chicago MSA 24.4 6.53
Non-Resident (All Others) 15.5 6.95
Market Segment1
Resident/Business 24.6 7.36
Resident/Non-Business 22.7 6.13
Non-Resident/Business 16.2 5.63
Non-Resident/Non-Business 15.5 7.56 1Pearson’s chi-square test for equal response rates rejected for α = 0.05
2Analysis of Variance (ANOVA) test for equality of mean response time rejected for α = 0.10
Examining the response rates reported in Table 4-3 reveals that the response rates for four
out of seven initial interview variables considered (day type, time of day, gender, and trip
purpose) did not significantly vary from the average response rate of 18.3 percent. While not
significant, it is interesting to note that the response rate among business travelers (20.1 percent)
was higher than the rate for personal or non-business travelers (18.3 percent). This is a
surprising finding, as one may not expect business travelers to have sufficient time to comply
with a follow-up request resulting from an intercept interview during the course of a business-
related trip. The response rates for three variables (travel direction, home residence, and market
segment) were significantly different than average. Specifically, a significantly lower percentage
of shuttle passengers that were interviewed going to the airport from the rail station complied
with the follow-up survey request (15.9 percent), as compared to 21.8 percent of shuttle
passengers interviewed going to the rail station from the airport (χ2
= 4.81, p = 0.0283). The low
response rate among travelers going to the airport is not surprising, as one might expect that the
process of air travel (ticketing/check-in, security screening, boarding, flight time, and collection
of baggage once arrived at the destination) presents a number of opportunities to lose or misplace
the follow-up survey recruitment postcard. In anticipation of this possibility, a brighter color for
the recruitment postcard (yellow) was used for shuttle passengers connecting to the airport.
However, even with the brighter-colored postcard, a significantly lower response rate was
realized among these passengers.
The follow-up survey response rate also varied with the residential location of the
traveler. Response rates among shuttle passengers from the Chicago MSA (24.4 percent) was
significantly higher than average, while the response from non-residents was lower than average

37
at 15.5 percent (χ2
= 9.02, p = 0.0110). The response rate among Milwaukee-area residents was
approximately average. The high response among Chicago-area residents may be indicative of
how highly these residents value the rail service and its accessibility to the Milwaukee airport—
they have the most to gain by providing responses to the follow-up survey and any
improvements to the service that may result. Conversely, it is not surprising that non-residents
of the area had a low response, as their collective stake is much lower. The difference in
response rate among the three residential groups is reflected in the response rate by market
segment, which was significantly higher for the two residential segments (χ2
= 8.03, p = 0.0453).
Also given in Table 4-3 is the response time to the follow-up survey, measured as the
number of days between the initial interview and completion of the follow-up survey. The
average response time for all responses was slightly less than one week (6.75 days). ANOVA
tests for differences in average response time among the seven initial interview variables were
not significant for all variables except for gender (F = 3.0407, p = 0.0832). The response time
for females (8.13 days) was significantly longer than the response time for males (5.84 days).
Figure 4-2 shows a frequency histogram of the response time for the 155 follow-up
surveys. As expected, the general shape of the frequency histogram reflects diminishing
participation in the survey as the number of days after the initial interview increases.
Interestingly, exactly 20 percent of the completed surveys (31 out of 155) were taken on the
same day the respondent received the postcard. In some respects, this finding is somewhat
surprising, given that respondents were in the process of connecting between two intercity travel
modes when the initial interview and follow-up survey request occurred. However, with the
rapid adoption of handheld devices capable of running Internet-based survey questionnaires, it is
not surprising that some respondents completed the survey within hours of receiving the
invitation to participate. It is also reasonable to assume that the interaction with the researchers
during the initial interview made the follow-up request more relevant in the mind of the traveler,
and in turn the traveler may have prioritized taking the follow-up survey as soon as practical.
Figure 4-2 also shows a cumulative frequency curve relating the cumulative percentage
of valid follow-up surveys received in each successive day after the initial interviews and
postcard distribution. More than half of the surveys (54.8 percent) were completed within five
days of the respondent’s initial interview. After three weeks, approximately 95 percent of all
responses had been obtained. A trendline describing the cumulative frequency curve is given as
follows:
Cumulative Response (%) = 0.265 * ln (Number of Days) + 0.132
The R-squared value for this equation is 0.985, indicating that the equation is an excellent
predictor of the cumulative response after a certain number of days.

38
0%
10%
20%
30%
40%
50%
60%
70%
80%
90%
100%
0
5
10
15
20
25
30
35
0 1 2 3 4 5 6 7 8 9 10 11 12 13 14 15 16 17 18 19 20 21 More
Cu
mu
lati
ve P
erc
en
tage
of
Follo
w-U
p S
urv
eys
Re
ceiv
ed
Tota
l Nu
mb
er
of
Follo
w-U
p S
urv
eys
Number of Days Following Initial Interview
Figure 4-2: Frequency Histogram of Response Time for Follow-Up Internet Survey
INSTITUTIONAL REVIEW BOARD APPROVAL
Since this research project involved interaction with human subjects, researchers were
required to receive approval from the Texas A&M University Office of Research Compliance’s
Institutional Review Board (IRB) before undertaking any data collection. Due to limitations
with the project schedule, it was necessary for researchers to develop and submit for approval
separate IRB protocol for each data collection task. For Task 3, the Hiawatha Service on-board
passenger survey, researchers submitted an initial protocol application to the IRB on
December 20, 2010. The IRB protocol (#2010-1016) was ruled “Exempt from IRB Review” and
approved on January 11, 2011. For Task 4, the Milwaukee airport shuttle passenger survey,
researchers submitted an initial protocol application to the IRB on April 20, 2011. The IRB
protocol (#2011-0312) was also ruled “Exempt from IRB Review” and approved on May 5,
2011. Appendix D of this report contains documentation of IRB approval for the initial protocol
and amendment.

39
CHAPTER 5: ON-BOARD PASSENGER SURVEY ANALYSIS
This chapter reports the findings from the analysis of the Hiawatha Service on-board
passenger survey data collected in Task 3 of this research project. Nearly 2,300 valid and
completed surveys were obtained over two days, a Thursday (weekday) and a Saturday
(weekend). The analysis will be divided into three sections, as follows:
Rail passenger trip information;
Rail passenger behavior and decision-making; and
Rail passenger demographic profile.
In order to capture the differences between the two days of survey data, each analysis presented
in this chapter will provide a comparison between weekday and weekend survey responses.
Furthermore, selected analyses provide a segmentation of the data by three passenger trip
purposes: business, commute, and personal trips.
RAIL PASSENGER TRIP INFORMATION
Boarding and Alighting Station
Table 5-1 shows the station boarding (i.e., getting on the train) and alighting (i.e., getting
off the train) percentages for the Hiawatha Service passengers. Unsurprisingly, Chicago Union
Station and Milwaukee Downtown Intermodal Station were the two most active stations during
the time of the survey. More passengers reported boarding at Milwaukee Downtown Intermodal
Station than Chicago Union Station, while more alighting was reported at Chicago Union Station
than in Milwaukee Downtown Intermodal Station. Both Milwaukee airport and Sturtevant
stations reported slightly greater boarding activity on the weekday as opposed to the weekend,
but the alighting patterns were similar. Beyond those two stations, few differences in boarding
and alighting patterns were detected between the weekday and weekend passengers.
Table 5-1: Rail Passenger Boarding and Alighting Stations
Station Weekday Weekend
Boarding Alighting Boarding Alighting
Milwaukee (Downtown, %) 44 27 46 33
Milwaukee (Airport, %) 14 7 11 7
Sturtevant (%) 6 4 3 3
Glenview (%) 4 4 2 4
Chicago (Union Station, %) 33 58 37 53
Note: Columns may not sum to 100 percent due to rounding
Source: 2011 TTI/WisDOT Hiawatha Service On-Board Passenger Survey
Travel Mode to/from Rail Station
Table 5-2 shows mode split for passenger trips from the passengers’ point of origin to the
boarding station, segmented by boarding station. Table 5-3 shows the mode split for passenger

40
trips from the alighting station to the passengers’ final destination, segmented by alighting
station. In general, the mode split for access and egress trips for a particular station is a function
of the availability of a certain mode as an option for that station, as well as the various attributes
of each available mode, such as the cost and frequency, in the case of public transit options.
Table 5-2: Rail Passenger Mode of Access to Boarding Station Travel Mode
(Weekday/Weekend)
Milwaukee
(Downtown)
Milwaukee
(Airport) Sturtevant Glenview Chicago
Drive Car/Truck (%) 46/39 73/60 73/72 51/33 5/3
Be Dropped Off in Car/Truck (%) 30/36 14/17 21/24 38/50 7/14
Local Transit (Bus, %) 5/8 0/0 0/0 4/0 6/6
CTA Rapid Transit (%) <1/0 0/0 0/0 0/0 10/17
Commuter Train METRA (%) <1/0 0/0 0/0 4/4 3/3
Hotel Courtesy Car/Shuttle (%) 1/<1 5/6 0/3 0/0 1/<1
Taxi (%) 5/5 1/2 0/0 2/13 22/35
Walk/Bicycle (%) 8/9 1/1 3/0 0/0 34/11
Transfer from Amtrak Train (%) 1/<1 0/0 1/0 0/0 14/12
Transfer from Intercity Bus (%) 2/2 0/0 1/0 0/0 1/1
Transfer from Plane (%) 1/1 7/14 0/0 0/0 <1/0
Note: Columns may not sum to 100 percent due to rounding
Source: 2011 TTI/WisDOT Hiawatha Service On-Board Passenger Survey
Table 5-3: Rail Passenger Mode of Egress from Alighting Station Travel Mode
(Weekday/Weekend)
Milwaukee
(Downtown)
Milwaukee
(Airport) Sturtevant Glenview Chicago
Drive Car/Truck (%) 47/34 68/57 71/64 49/33 4/7
Be Dropped Off in Car/Truck (%) 22/35 14/28 21/21 31/45 3/11
Local Transit (Bus, %) 3/8 1/1 2/0 0/0 4/3
CTA Rapid Transit (%) 0/1 0/0 0/0 0/0 7/10
Commuter Train METRA (%) 0/<1 0/0 0/0 2/3 3/6
Hotel Courtesy Car/Shuttle (%) 0/<1 1/3 0/11 4/0 1/<1
Taxi (%) 12/8 2/4 5/4 9/18 30/37
Walk/Bicycle (%) 14/10 2/1 0/0 4/3 36/16
Transfer to Amtrak Train (%) 0/<1 0/0 0/0 0/0 10/9
Transfer to Intercity Bus (%) 1/4 0/0 0/0 0/0 1/1
Transfer to Plane (%) 0/0 11/4 0/0 0/0 <1/0
Note: Columns may not sum to 100 percent due to rounding
Source: 2011 TTI/WisDOT Hiawatha Service On-Board Passenger Survey
Closer examination of Tables 5-2 and 5-3 reveals several notable patterns of passenger
mode choice for the trip to or from the station. In general, the mode split was consistent for
access and egress by station and day type (weekday or weekend). With the exception of
passenger boarding or alighting at Chicago Union Station, the primary mode of transportation to
or from the station was an automobile, either driving/parking at the station or being dropped
off/picked up at the station. Automobile as the access/egress mode was highest at Sturtevant,
where other modal options are limited.

41
In terms of non-personal vehicle access or egress modes, Chicago Union Station was the
most diverse. In contrast to the other four stations, taxi or walk/bicycle was the preferred option
for station access or egress. The high share for walking/bicycling and corresponding low share
of personal vehicle access or egress at Chicago Union Station was probably due to a combination
of high parking costs in garages around the station and an extremely dense and diverse urban
form that is found in the proximity of Chicago Union Station. Other noteworthy patterns in
station access and egress mode choices were detected. Approximately 10 to 15 percent of
passengers boarding or departing the Hiawatha Service at Chicago Union Station were
transferring to or from one of the many other Amtrak trains that were available at that station.
The Milwaukee Airport Rail Station had a higher percentage of “Transfer to/from Plane” and
“Hotel Courtesy Car/Shuttle” than the other four stations. Finally, the highest share of
passengers transferring between the Hiawatha Service and an intercity bus service was reported
at the Milwaukee Downtown Intermodal Station. This finding was not surprising, given that
Amtrak shares the Milwaukee Downtown Intermodal Station with several intercity bus
companies that provide connections from Milwaukee to areas across Wisconsin and beyond.
Origin and Destination Location Type
Table 5-4 reports the location type of the origin of the passenger’s trip prior to boarding
the Hiawatha Service. For both weekday and weekend trips, approximately 60 percent of
passengers reported originating at the passenger’s home prior to boarding the train. Differences
between weekday and weekend trips did not yield surprising results. More passengers originated
from a “Place of Work” on the weekday (17 percent) than on the weekend (3 percent), while the
home of a friend or relative and a tourist/entertainment site were more common on weekends
than on weekdays. “School/University” was a trip origin for approximately 5 percent of both
weekday and weekend trips.
Table 5-4: Origin of Trip Prior to Boarding Hiawatha Service Location Type Weekday Weekend
Home (Yours, %) 61 62
Home (Friend or Relative’s, %) 8 14
Hotel (%) 2 3
Meeting/Conference Site (%) 3 3
Place of Personal Business (%) 2 1
Place of Work (%) 17 3
School/University (%) 5 6
Shopping Center/Store (%) <1 1
Tourist/Entertainment Site (%) 2 7
Note: Columns may not sum to 100 percent due to rounding
Source: 2011 TTI/WisDOT Hiawatha Service On-Board Passenger Survey
Table 5-5 reports the location type of the destination of the passenger’s trip after
departing the Hiawatha Service. In general, the destination location type patterns were similar to
the origin location type patterns. Similar to the trip origin information, the passenger’s home
was the most frequently cited destination for both weekday and weekend passengers, although
the percentage was lower than for trip origin. Common destinations for weekday passengers

42
were primarily business related, including “Place of Work” (24 percent) and
“Meeting/Conference Site” (10 percent). For weekend passengers, frequent destinations
included the home of a friend/relative (30 percent) or a tourist/entertainment site (16 percent).
Table 5-5: Destination of Trip after Alighting Hiawatha Service Location Type Weekday Weekend
Home (Yours, %) 33 33
Home (Friend or Relative’s, %) 15 30
Hotel (%) 2 6
Meeting/Conference Site (%) 10 5
Place of Personal Business (%) 3 3
Place of Work (%) 24 2
School/University (%) 4 4
Shopping Center/Store (%) 1 2
Tourist/Entertainment Site (%) 7 16
Note: Columns may not sum to 100 percent due to rounding
Source: 2011 TTI/WisDOT Hiawatha Service On-Board Passenger Survey
Trip Purpose
Table 5-6 reports the passengers’ trip purpose by day type and also for the two days
combined. Examining passenger trip purpose data provides insight into how the Hiawatha
Service supports personal mobility by revealing the types of activities the passengers are
participating in before or after the train trip. There was a clear delineation of passenger trip
purposes across weekday and weekend trains. Specifically, trips for work commuting or
business-related matters were more prevalent on weekdays, while personal trips, such as visiting
family or friends, riding for leisure/entertainment, or going shopping, were more common on
weekends.
Table 5-6: Rail Passenger Trip Purpose by Day Type Trip Purpose Weekday Weekend All Passengers
Daily Commute to/from Work (%) 20 1 12
Commute to/from Work (Less than Daily, %) 13 2 8
Going to/from a Business Trip/Meeting 21 10 16
Going to/from School (University/College, %) 5 3 4
Personal Business (%) 5 5 5
Visiting Family or Friends (%) 20 43 30
Shopping (%) 2 4 3
Leisure/Entertainment (%) 9 25 17
Vacation (%) 5 7 6
Note: Columns may not sum to 100 percent due to rounding
Source: 2011 TTI/WisDOT Hiawatha Service On-Board Passenger Survey
Business or commute trips accounted for a majority (54 percent) of weekday trips. One
interesting finding was that among weekday trips, 33 percent of passengers reported a purpose of
work commute. Of those, almost 40 percent reported that the work commute was on a less-than-

43
daily basis. This finding suggests that these passengers might be telecommuters that work from
their residence for a portion of the week and commute to an office location, using the Hiawatha
Service, for the remaining portion of the week. Personal trips accounted for a large majority (72
percent) of weekend trips, as compared to 31 percent of weekday trips.
The remainder of this chapter will continue to analyze the Hiawatha Service on-board
passenger survey data by day type (weekday or weekend trips). Additionally, parallel analyses
will be reported with the passengers segmented into three categories of trip purpose as follows:
Business trips (going to/from a Business Trip/Meeting, 16 percent of all passengers).
Commute trips (daily/less-than-daily work commute, 20 percent).
Personal trips (all other purposes, 64 percent).
Segmentation of passenger survey data by these trip purpose categories may offer additional
insight into the mobility impacts of the rail service beyond the day type analysis.
Additional Rail Trip Information
Table 5-7 summarizes the round-trip today status and the details of the passengers’ travel
party by day type. The percentage of passengers making a round trip on the day of the survey
was higher on the weekday than on the weekend, as was the percentage of passengers that
reported traveling alone. A majority of weekend passengers also reported traveling alone,
although the percentage of families and groups was higher on the weekend than on the weekday.
Table 5-7: Rail Passenger Round Trip Today and Party Information by Day Type Trip Characteristic Weekday Weekend All Passengers
Round Trip Today (%) 53 33 44
Traveling Alone (%) 73 53 64
Traveling with Family (%) 18 33 25
Traveling with Group (%) 9 14 11
Average Party Size (Families) 2.4 2.2 2.3
Average Party Size (Groups) 3.0 3.6 3.3
Average Party Size (All) 1.4 1.7 1.6
Note: Columns may not sum to 100 percent due to rounding
Source: 2011 TTI/WisDOT Hiawatha Service On-Board Passenger Survey
Table 5-8 reports the round-trip today status and party information by passenger trip
purpose. Among work commuters, 80 percent reported making a round trip on the day of the
survey, and 92 percent reported traveling alone. Approximately half of business travelers were
making a day trip, and more than one-quarter (26 percent) were traveling with a group. The
percentage of personal travelers that were traveling with family was highest among the three trip
purposes at 35 percent.

44
Table 5-8: Rail Passenger Round Trip Today and Party Information by Trip Purpose Trip Characteristic Business Commute Personal
Round Trip Today (%) 48 80 32
Traveling Alone (%) 67 92 55
Traveling With Family (%) 8 4 35
Traveling With Group (%) 26 4 10
Average Party Size (Families) 1.9 2.2 2.3
Average Party Size (Groups) 3.0 3.1 3.5
Average Party Size (All) 1.6 1.1 1.7
Note: Columns may not sum to 100 percent due to rounding
Source: 2011 TTI/WisDOT Hiawatha Service On-Board Passenger Survey
RAIL PASSENGER BEHAVIOR AND DECISION-MAKING
The first phase of the Hiawatha Service on-board passenger survey analysis examined the
rail passengers’ trip details, such as origin and destination information, station access/egress
mode choice, and trip purpose. In this section, the focus of the analysis shifts from examining
the trip at the time of the survey to overall passenger behavior and decision-making.
Rail Travel Frequency
Table 5-9 reports the frequency of travel on the Hiawatha Service by day type. Trip
frequency was divided into seven categories ranging from “First Time Riding” to “20 or More
Times Each Month” as options. Note that while the categories were not mutually exclusive,
researchers felt that the categories with varying time units were more relevant to the respondent.
Table 5-9: Rail Passenger Hiawatha Service Trip Frequency by Day Type Trip Frequency Weekday Weekend Total
First Time Riding (%) 19 28 23
Once per Year or Less (%) 11 18 14
Once Every Few Months (%) 23 33 27
1-4 Times Each Month (%) 16 17 16
5-9 Times Each Month (%) 7 3 5
10-19 Times Each Month (%) 6 1 4
20 or More Times Each Month (%) 18 1 10
Note: Columns may not sum to 100 percent due to rounding
Source: 2011 TTI/WisDOT Hiawatha Service On-Board Passenger Survey
On both weekday and weekend trains, the most commonly reported trip frequency was
“Once Every Few Months,” accounting for 23 percent of weekday passengers and 33 percent of
weekend passengers. On weekdays, the distribution of rail passenger trip frequency was fairly
uniform, with a mix of infrequent and regular riders observed. For 19 percent of weekday
passengers, the surveyed trip was the first time riding the Hiawatha Service, while 18 percent of
weekday passengers reported riding 20 or more times each month. More than 30 percent of
weekday passengers rode the Hiawatha Service “5-9 Times Each Month” or more. On the other
hand, the distribution of rail trip frequency among weekend passengers was skewed toward the
more infrequent end of the scale. On weekend trains, 28 percent of passengers reported that the

45
surveyed trip was the first time riding the train. Nearly 80 percent of weekend passengers
reported a trip frequency of “Once Every Few Months” or less.
Table 5-10 reports the passengers’ rail trip frequency by trip purpose. Not surprisingly,
passengers reporting a trip purpose of “Commute” patronized the Hiawatha Service more
frequently than the other two purposes, with 50 percent of such passengers riding the train 20 or
more times each month. Among business travelers, 40 percent reported riding the Hiawatha
Service once every few months. Additionally, 21 percent of business travelers reported riding
the Hiawatha Service for the first time on the trip when the surveys were conducted. A similar
pattern was noted for personal travelers, of which approximately 30 percent reported riding the
Hiawatha Service once every few months or were riding the Hiawatha Service for the first time
when the on-board passenger surveys were being conducted.
Table 5-10: Rail Passenger Hiawatha Service Trip Frequency by Trip Purpose Trip Frequency Business Commute Personal
First Time Riding (%) 21 2 30
Once per Year or Less (%) 17 <1 18
Once Every Few Months (%) 40 5 31
1-4 Times Each Month (%) 16 13 17
5-9 Times Each Month (%) 4 13 3
10-19 Times Each Month (%) 1 17 <1
20 or More Times Each Month (%) <1 50 1
Note: Columns may not sum to 100 percent due to rounding
Source: 2011 TTI/WisDOT Hiawatha Service On-Board Passenger Survey
Alternative Travel Mode
One of the key mobility impacts of the rail service that was measured by the Hiawatha
Service on-board passenger survey was the passengers’ self-reported alternative travel option if
the rail service were not available. These data provide insight into how the rail service supports
personal mobility and offer a look at how regional travel patterns might be affected if
investments in intercity passenger rail services are not made. The intercity corridor in which the
Hiawatha Service operates, the Milwaukee-Chicago corridor, is a diverse and almost fully
integrated multimodal corridor with many travel alternatives available. In addition to the
Hiawatha Service intercity rail route, travelers can drive an automobile, ride an intercity bus, or
fly on a commercial airline to connect between Milwaukee and Chicago. For certain trips
between intermediate stations, local transit bus or METRA (the Chicago-area commuter rail
service) are also options. Finally, a non-mode alternative to the rail service would be that, in the
absence of the rail service, passengers might simply forgo the trip.
Table 5-11 reports the percentage of Hiawatha Service passengers that would select each
alternative travel mode if the rail service were not available. The most frequently cited
alternative to the rail service among both weekday and weekend passengers was the automobile.
Driving or riding as a passenger in a personal or rental/company vehicle was the reported
alternative for almost 70 percent of Hiawatha Service passengers.

46
Table 5-11: Rail Passenger Alternative Travel Mode by Day Type Alternative Travel Mode Weekday Weekend Total
Drive Car/Truck (%) 61 61 61
Passenger in Car/Truck (%) 4 5 5
Rental Car/Company Vehicle (%) 3 3 3
Intercity Bus (%) 6 9 7
Local Transit Bus (%) 1 2 2
METRA Commuter Rail (%) 6 4 5
Airplane (%) 4 3 3
I Would Not Have Made This Trip (%) 15 13 14
Note: Columns may not sum to 100 percent due to rounding
Source: 2011 TTI/WisDOT Hiawatha Service On-Board Passenger Survey
The second most frequently cited passenger alternative to the rail service was the “I
Would Not Have Made This Trip” option, reported by 14 percent of all passengers. Local transit
as an alternative to the rail service, either bus or commuter rail, was cited by 7 percent of
respondents, as was the intercity motorcoach bus alternative. Airplane was the preferred
alternative for 3 percent of passengers. Few differences were detected in alternative travel mode
between the weekday and weekend passenger groups. Commuter rail as an alternative to the
Hiawatha Service was slightly higher for weekday travelers, while intercity bus as an alternative
to the rail service was higher for weekend travelers.
Table 5-12 displays the passenger alternative travel mode responses by trip purpose.
Among business travelers, more than 80 percent reported the use of an automobile (personal or
company vehicle) as an alternative to the rail service. The finding that just 5 percent of business
travelers would have not made the trip (and thus 95 percent of such travelers would have used
alternative modes) in the absence of the rail service confirms the high utility nature of business
travel. METRA commuter rail was reported as an alternative more frequently by commute
travelers (12 percent) than the other two purposes. Interestingly, the most commonly cited
alternative to the Hiawatha Service among commute travelers was the “I Would Not Have Made
This Trip” alternative, at 24 percent. This is an interesting finding because one might expect, a
priori, that commute trips would have a high utility and thus other modes would be used if the
rail service were not an option. Among personal travelers, a higher percentage of intercity bus as
an alternative was detected (9 percent) as compared with the other two purposes.
Table 5-12: Rail Passenger Alternative Travel Mode by Trip Purpose Alternative Travel Mode Business Commute Personal
Drive Car/Truck (%) 74 56 59
Passenger in Car/Truck (%) 5 1 6
Rental Car/Company Vehicle (%) 3 3 3
Intercity Bus (%) 4 2 9
Local Transit Bus (%) 1 0 2
METRA Commuter Rail (%) 5 12 3
Airplane (%) 3 2 4
I Would Not Have Made This Trip (%) 5 24 13
Note: Columns may not sum to 100 percent due to rounding
Source: 2011 TTI/WisDOT Hiawatha Service On-Board Passenger Survey

47
Reasons for Choosing the Hiawatha Service
On the survey, passengers were asked to respond to a series of statements on the reasons
why they chose to use the Hiawatha Service for their trip instead of another mode. A total of 25
reasons for choosing the rail service were provided, and the respondent was asked to rate his or
her level of agreement with each statement using a five-point Likert item ranging from strongly
disagree (1) to strongly agree (5). Table 5-13 reports the average scores for each of the 25 items
by weekday and weekend passengers, as well as the average score and the standard deviation
from the average for all passengers. A higher score for a particular item, therefore, indicates that
the item was more important in the decision to use the Hiawatha Service.
Table 5-13: Rail Passenger Reasons for Choosing Hiawatha Service by Day Type Reason for Choosing Hiawatha Service Weekday Weekend All Passengers
Convenient to My Final Destination 4.38 4.24 4.32 (0.83)
Avoid Highway Congestion 4.35 4.18 4.28 (0.95)
More Comfortable than Other Options 4.05 4.00 4.03 (0.91)
More Reliable than Other Options 3.90 3.89 3.89 (0.93)
Avoid Snow/Winter Driving 3.86 3.76 3.81 (1.09)
Faster than Other Options 3.83 3.76 3.80 (0.99)
Schedule Matched My Schedule Needs 3.79 3.74 3.77 (0.98)
Opportunity to Sleep/Relax while Traveling 3.63 3.69 3.66 (1.04)
More Environmentally Friendly than Other Options 3.60 3.60 3.60 (1.08)
Convenient to My Residence 3.48 3.54 3.51 (1.03)
Less Expensive than Other Options 3.51 3.48 3.49 (1.08)
Safer than Other Options 3.47 3.47 3.47 (1.04)
Price of Gasoline 3.41 3.50 3.45 (1.14)
Avoid Parking Problems at Destination 3.43 3.42 3.43 (1.30)
Opportunity to Work while Traveling 3.62 3.15 3.41 (1.23)
I Would Rather Not Drive 3.37 3.32 3.35 (1.29)
Opportunity to Read or Socialize 3.27 3.27 3.28 (1.19)
Parking Availability at Station 3.30 3.11 3.22 (1.27)
Connections with Other Amtrak Trains 2.64 2.81 2.71 (1.29)
No Other Form of Transportation Available 2.66 2.65 2.66 (1.25)
Drink/Snack Cart Service on-board Train 2.62 2.68 2.65 (1.20)
Connections with Intercity Buses 2.58 2.71 2.64 (1.26)
Connections with Airline Service 2.49 2.65 2.56 (1.24)
I Would Rather Not Fly 2.49 2.63 2.55 (1.26)
I Cannot Drive 1.95 2.13 2.03 (1.27)
Scale: (1) Strongly Disagree to (5) Strongly Agree
Rows in italics indicate items with ANOVA test for equality of mean scores rejected for α = 0.05
Source: 2011 TTI/WisDOT Hiawatha Service On-Board Passenger Survey
Three reasons—“Convenient to My Final Destination,” “Avoid Highway Congestion,”
and “More Comfortable than Other Options”—were the three highest-rated items for both
weekday and weekend travelers, each having an average score greater than 4.0/5. These items
also had three of the four lowest standard deviations among the 25 items considered, suggesting
that there was a strong level of agreement among passengers as to the importance of those items
in the decision to use the rail service. By contrast, the items with the least amount of agreement

48
among passengers (i.e., highest standard deviation) were “Avoid Parking Problems at
Destination,” “I Would Rather Not Drive,” and “Connections with Other Amtrak Trains.”
Among the 25 items reported in Table 5-13, the average scores between weekday and weekend
passengers were significantly different (α = 0.05) for 10 items. These items are noted in italics in
Table 5-13. Weekday travelers rated the convenience items related to rail travel—“Convenient
to My Final Destination,” “Avoid Highway Congestion,” “Avoid Snow/Winter Driving,”
“Opportunity to Work while Traveling,” and “Parking Availability at the Station”—significantly
higher than weekend travelers. Conversely, weekend passengers rated the connections between
the Hiawatha Service and other Amtrak trains, intercity buses, and airlines, as well as “I Would
Rather Not Fly” and “I Cannot Drive,” significantly higher than weekday passengers.
Table 5-14 shows the average scores for the 25 reasons why passengers chose the
Hiawatha Service for their trip, segmented into three trip purpose categories.
Table 5-14: Rail Passenger Reasons for Choosing Hiawatha Service by Trip Purpose Reason for Choosing Hiawatha Service Business Commute Personal
Avoid Highway Congestion 4.38 4.58 4.17
Avoid Parking Problems at Destination 3.64 3.42 3.37
Avoid Snow/Winter Driving 3.61 4.20 3.75
Connections with Airline Service 2.32 2.30 2.69
Connections with Intercity Buses 2.31 2.40 2.79
Connections with Other Amtrak Trains 2.40 2.22 2.94
Convenient to My Final Destination 4.35 4.53 4.25
Convenient to My Residence 3.21 3.74 3.51
Drink/Snack Cart Service onboard Train 2.40 2.72 2.69
Faster than Other Options 3.80 3.97 3.75
I Cannot Drive 1.70 1.85 2.16
I Would Rather Not Drive 3.18 3.59 3.32
I Would Rather Not Fly 2.29 2.35 2.68
Less Expensive than Other Options 3.39 3.56 3.50
More Comfortable than Other Options 3.98 4.14 4.01
More Environmentally Friendly than Other Options 3.41 3.63 3.63
More Reliable than Other Options 3.90 3.98 3.88
No Other Form of Transportation Available 2.29 2.82 2.70
Opportunity to Read or Socialize 3.17 3.37 3.28
Opportunity to Sleep/Relax while Traveling 3.37 3.77 3.70
Opportunity to Work while Traveling 3.69 4.08 3.13
Parking Availability at Station 3.27 3.51 3.11
Price of Gasoline 3.19 3.49 3.50
Safer than Other Options 3.29 3.60 3.48
Schedule Matched My Schedule Needs 3.85 3.83 3.72
Scale: (1) Strongly Disagree to (5) Strongly Agree
Rows in italics indicate items with ANOVA test for equality of mean scores rejected for α = 0.05
Source: 2011 TTI/WisDOT Hiawatha Service On-Board Passenger Survey
Avoiding highway congestion and convenience of the Hiawatha Service to the passengers’ final
destination were rated as the two highest reasons across the three trip purposes. Comfort was the

49
third most important reason for choosing rail among business and personal travelers, while
avoiding snow or winter driving was the third most important among commuters.
Potential Service Changes to Increase Rail Travel Frequency
Passengers were also asked to respond to a series of 17 statements related to changes or
improvements that could be made to the Hiawatha Service and if such changes would encourage
the passenger to ride more often. The types of changes considered ranged from new on-board
amenities to operational changes such as new service frequencies or expanded destination
choices. A five-point Likert item similar to the one used in the previous questions on reasons
why the passenger chose the Hiawatha Service was used in these questions.
Table 5-15 shows the average scores for each of the 17 service changes to increase
ridership by day type as well as the average and standard deviation for both days combined.
Two items, Wi-Fi Internet access and lower fares, had an average score higher than 4.0/5 for
both weekday and weekend passengers. Significant differences in the average scores between
weekday and weekend travelers, noted in italics in Table 5-15, did not demonstrate a clear
pattern of passenger preferences between the two days. Weekday travelers rated amenities such
as on-board Wi-Fi Internet access and new passenger coach cars significantly higher than
weekend travelers, while weekend travelers rated amenities such as on-board café service,
expanded quiet car seating, on-board bicycle racks, and coordinated baggage service from the
rail boarding station to airline higher than weekday travelers. Operationally, weekday travelers
rated faster travel times and more departures higher, while weekend travelers rated expansion to
other cities and coordinated schedules with flights at the Milwaukee airport more favorably.
Table 5-15: Rail Passenger Service Changes to Increase Ridership by Day Type Potential Service Change Weekday Weekend All Passengers
Wi-Fi Internet Access 4.22 3.98 4.11 (0.93)
Lower Fares 4.06 4.05 4.06 (0.89)
More Daily Departures/Arrivals 4.09 3.86 3.99 (0.90)
Faster Travel Times 4.05 3.80 3.94 (0.94)
Additional Early Evening Departure from Chicago 3.95 3.75 3.86 (0.94)
Additional Late Evening Departure from Chicago 3.83 3.83 3.83 (0.97)
Additional Morning Departure from Milwaukee 3.87 3.68 3.78 (0.96)
New, Modern Passenger Coach Cars 3.80 3.70 3.75 (0.95)
Extend Passenger Rail Service to Other Cities 3.65 3.81 3.72 (1.02)
Increasing Gasoline Prices 3.63 3.61 3.62 (1.02)
Full On-Board Café Car Service 3.17 3.33 3.24 (0.94)
Expanded Quiet Car Seating 3.20 3.29 3.24 (0.91)
Coordinated Schedules with Flights from Milwaukee Airport 3.15 3.31 3.22 (0.91)
Improved Parking at Stations 3.20 3.22 3.21 (0.81)
Reserved Seating Availability 3.15 3.20 3.17 (0.96)
Racks for Carry-On Bicycles Inside Train 3.03 3.19 3.10 (0.94)
Checked Bag Service from Boarding Station to Airline 2.99 3.12 3.04 (0.88)
Scale: (1) Strongly Disagree to (5) Strongly Agree
Rows in italics indicate items with ANOVA test for equality of mean scores rejected for α = 0.05
Source: 2011 TTI/WisDOT Hiawatha Service On-Board Passenger Survey

50
Two other items from Table 5-15 are worth additional discussion. The Hiawatha Service
is somewhat unique among its peers (that is, other state-supported Amtrak routes) in that the
service operates without requiring passengers to obtain advance reservations (seating is provided
on a first come, first served basis) and that no full on-board café service is available. Neither of
these items was scored in the upper half of the 17 items analyzed in Table 5-15. The item “Full
On-Board Café Service” had an average score of (3.24/5) and was ranked 11 out of 17 items,
while “Reserved Seating Availability” was ranked 15 out of 17 items with an average score of
(3.17/5). Based on the data presented in Table 5-15, there is limited evidence to suggest that
changes to these two areas of operation would substantially increase the frequency of rail travel,
at least among current Hiawatha Service passengers.
Table 5-16 shows the average scores for the potential service changes to increase
ridership by trip purpose. The potential service change with the highest average score was
different for each of the three trip purpose categories.
Table 5-16: Rail Passenger Service Changes to Increase Ridership by Trip Purpose Potential Service Change Business Commute Personal
Additional Early Evening Departure from Chicago 3.79 4.28 3.74
Additional Late Evening Departure from Chicago 3.75 4.01 3.78
Additional Morning Departure from Milwaukee 3.72 4.17 3.67
Checked Bag Service from Boarding Station to Airline 3.03 2.74 3.14
Coordinated Schedules with Flights from Milwaukee Airport 3.18 2.90 3.32
Expanded Quiet Car Seating 3.09 3.27 3.27
Extend Passenger Rail Service to Other Cities 3.68 3.44 3.82
Faster Travel Times 3.79 4.49 3.81
Full On-Board Café Car Service 3.14 3.11 3.31
Improved Parking at Stations 3.13 3.26 3.22
Increasing Gasoline Prices 3.63 3.67 3.61
Lower Fares 3.82 4.19 4.08
More Daily Departures/Arrivals 3.85 4.52 3.85
New, Modern Passenger Coach Cars 3.63 4.00 3.70
Racks for Carry-On Bicycles Inside Train 2.92 2.94 3.19
Reserved Seating Availability 3.04 3.16 3.21
Wi-Fi Internet Access 4.16 4.50 3.98
Scale: (1) Strongly Disagree to (5) Strongly Agree
Rows in italics indicate items with ANOVA test for equality of mean scores rejected for α = 0.05
Source: 2011 TTI/WisDOT Hiawatha Service On-Board Passenger Survey
Among business travelers, “Wi-Fi Internet Access” had the highest average score
(4.16/5). Among commuters, “More Daily Departures or Arrivals” had the highest average score
(4.52/5). However, “Wi-Fi Internet Access” also scored high among commuters (4.5/5). Among
personal travelers, “Lower Fares” had the highest average score (4.08/5). In general, these
findings reflected the priorities of the various trip purpose groups. Wi-Fi Internet access is a
high priority among business travelers and work commuters likely because those travelers would
desire the productivity gains that would be realized with available on-board Internet access.
Personal travelers, on the other hand, are likely more cost-sensitive and value the possibility of
lower fares more than other potential changes.

51
Another aspect of the Hiawatha Service that makes the route unique in the Amtrak
national intercity passenger rail system is the route’s direct connection to an airport, in this case,
the Milwaukee General Mitchell International Airport via the Milwaukee Airport Rail Station.
Additional service frequencies notwithstanding, enhancing the connectivity between the
Hiawatha Service and the Milwaukee airport would not appear to motivate additional rail travel
by current Hiawatha Service passengers. Two items in Table 5-15, “Coordinated Schedules with
Flights from Milwaukee Airport” and “Checked Bag Service from Boarding Station to Airline,”
received relatively low scores among the passengers (3.22/5 and 3.04/5, respectively).
Use of Milwaukee Airport Rail Station
In FFY 2011, more than 160,000 passengers boarded or departed the Hiawatha Service at
the Milwaukee Airport Rail Station. Although this figure represents approximately 10 percent of
the total Hiawatha Service ridership, the station is the third busiest station on the route, behind
Chicago Union Station and the Milwaukee Downtown Intermodal Station. In addition to
facilitating a nearly seamless connection between the Amtrak rail network and the Milwaukee
airport, the Milwaukee Airport Rail Station provides more convenient access to the Hiawatha
Service for residents of the south Milwaukee city and immediate suburbs. To capture the
influence of the Milwaukee Airport Rail Station on the behavior of current Hiawatha Service
passengers, the on-board survey included two questions about the passengers’ current use of the
station. The first question asked the passenger to “check all that apply” to a series of five items
related to his or her use of the station. The second question listed five potential uses of the
station and asked the passenger how often he or she used the station for each activity. Table 5-
17 shows the results of these two questions by day type and for all passengers. A majority of
passengers surveyed (60 percent) reported that they do not use the airport rail station.
Approximately 13 percent of passengers reported that they started using the Hiawatha Service
after the station’s opening in January 2005 primarily because of the station. This finding
suggests that there was a small induced travel effect of the new station opening. Use of the
airport rail station instead of the Milwaukee Downtown Intermodal Station was reported by
approximately 11 percent of passengers, with this percentage being higher for weekday
passengers than weekend passengers. Use of the airport rail station to transfer to airline service
was minimal, reported by 6 percent of current Hiawatha Service passengers.
Passengers were also asked to rate their frequency of use of the Milwaukee Airport Rail
Station for five possible uses of the station. The five uses included three related to airport access
and two related to the use of the station in general. A vast majority of Hiawatha Service
passengers do not use the airport rail station to access the Milwaukee General Mitchell
International Airport, or use the airport instead of the two Chicago-area airports (O’Hare and
Midway). Approximately 10 percent of passengers reported using the rail service occasionally
for these activities, while a minor percentage (2 to 3 percent) of passengers reported using the
Hiawatha Service frequently for these activities. These percentages did not differ markedly
between weekday and weekend passengers. On the other hand, the use of the Milwaukee Airport
Rail Station for park and ride or for drop-off/pick-up from the Hiawatha Service was more
frequent than for airport access among rail passengers. Notably, weekday passengers reported
using the airport rail station frequently to park and ride the Hiawatha Service more than weekend
passengers (11 versus 4 percent).

52
Table 5-17: Rail Passenger Use of Milwaukee Airport Rail Station by Day Type Passenger Use of Milwaukee Airport Rail Station Weekday Weekend All Passengers
Use to Transfer to/from Airline Service (%) 6 6 6
Use Instead of Milwaukee Intermodal Station (%) 13 9 11
Use Instead of Sturtevant Station (%) 2 1 2
Starting Using Hiawatha Service Because of MARS (%) 13 12 13
I Do Not Use the Milwaukee Airport Rail Station (%) 59 62 60
Use to Access Milwaukee Airport
Instead of Driving
Never (%) 88 88 88
Occasionally (%) 10 10 10
Frequently (%) 2 3 2
Use to Fly to Milwaukee Airport
Instead of Chicago O’Hare (ORD)
Never (%) 86 85 85
Occasionally (%) 12 12 12
Frequently (%) 3 3 3
Use to Fly to Milwaukee Airport
Instead of Chicago Midway (MDW)
Never (%) 90 88 89
Occasionally (%) 8 9 8
Frequently (%) 2 2 2
Use to Park and Ride
Amtrak Hiawatha Service
Never (%) 72 79 75
Occasionally (%) 17 17 17
Frequently (%) 11 4 8
Use to Be Dropped Off/Picked Up
to/from Amtrak Hiawatha Service
Never (%) 74 73 74
Occasionally (%) 19 19 19
Frequently (%) 7 8 7
Note: Columns may not sum to 100 percent due to rounding
Source: 2011 TTI/WisDOT Hiawatha Service On-Board Passenger Survey
Table 5-18 reports similar data on the use of the Milwaukee Airport Rail Station by
Hiawatha Service passengers by trip purpose. Business and commute passengers reported using
the airport rail station instead of the Milwaukee Downtown Intermodal Station more than
personal travelers. Passengers that reported a trip purpose of commuting reported using the
airport rail station to access the Milwaukee airport more often than passengers in the other two
trip purpose groups. Not surprisingly, commuters had the highest percentage of frequent park
and ride use of the rail station among the three trip purpose groups at 19 percent. Almost one-
quarter of Hiawatha Service passengers traveling for business purposes reported using the airport
rail station occasionally to park and ride. It is important to note when interpreting the analysis
presented in Tables 5-17 and 5-18 that the responses were provided by passengers based upon
the passengers’ overall experiences and use of the Milwaukee Airport Rail Station, and not
necessarily use of the rail station during the surveyed trip. For example, it is unlikely that
10 percent of Hiawatha Service passengers who reported “Commute” as a trip purpose
transferred from airline service at the Milwaukee Airport Rail Station as part of a commute trip.
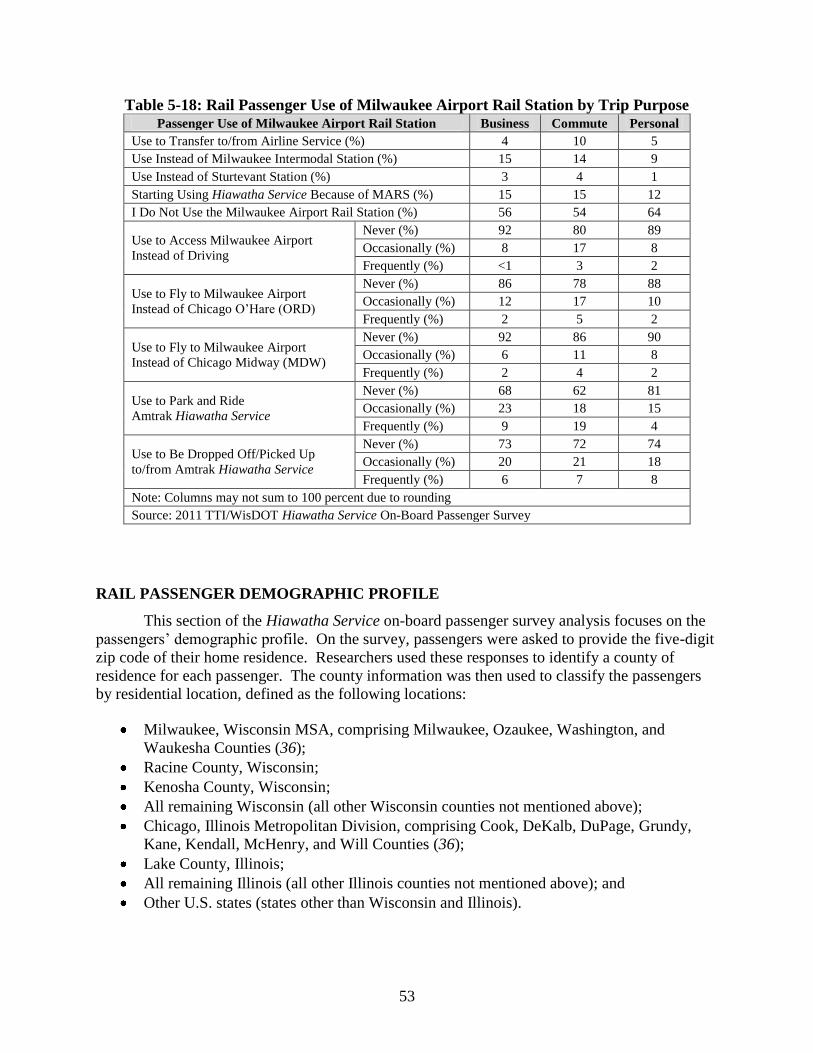
53
Table 5-18: Rail Passenger Use of Milwaukee Airport Rail Station by Trip Purpose Passenger Use of Milwaukee Airport Rail Station Business Commute Personal
Use to Transfer to/from Airline Service (%) 4 10 5
Use Instead of Milwaukee Intermodal Station (%) 15 14 9
Use Instead of Sturtevant Station (%) 3 4 1
Starting Using Hiawatha Service Because of MARS (%) 15 15 12
I Do Not Use the Milwaukee Airport Rail Station (%) 56 54 64
Use to Access Milwaukee Airport
Instead of Driving
Never (%) 92 80 89
Occasionally (%) 8 17 8
Frequently (%) <1 3 2
Use to Fly to Milwaukee Airport
Instead of Chicago O’Hare (ORD)
Never (%) 86 78 88
Occasionally (%) 12 17 10
Frequently (%) 2 5 2
Use to Fly to Milwaukee Airport
Instead of Chicago Midway (MDW)
Never (%) 92 86 90
Occasionally (%) 6 11 8
Frequently (%) 2 4 2
Use to Park and Ride
Amtrak Hiawatha Service
Never (%) 68 62 81
Occasionally (%) 23 18 15
Frequently (%) 9 19 4
Use to Be Dropped Off/Picked Up
to/from Amtrak Hiawatha Service
Never (%) 73 72 74
Occasionally (%) 20 21 18
Frequently (%) 6 7 8
Note: Columns may not sum to 100 percent due to rounding
Source: 2011 TTI/WisDOT Hiawatha Service On-Board Passenger Survey
RAIL PASSENGER DEMOGRAPHIC PROFILE
This section of the Hiawatha Service on-board passenger survey analysis focuses on the
passengers’ demographic profile. On the survey, passengers were asked to provide the five-digit
zip code of their home residence. Researchers used these responses to identify a county of
residence for each passenger. The county information was then used to classify the passengers
by residential location, defined as the following locations:
Milwaukee, Wisconsin MSA, comprising Milwaukee, Ozaukee, Washington, and
Waukesha Counties (36);
Racine County, Wisconsin;
Kenosha County, Wisconsin;
All remaining Wisconsin (all other Wisconsin counties not mentioned above);
Chicago, Illinois Metropolitan Division, comprising Cook, DeKalb, DuPage, Grundy,
Kane, Kendall, McHenry, and Will Counties (36);
Lake County, Illinois;
All remaining Illinois (all other Illinois counties not mentioned above); and
Other U.S. states (states other than Wisconsin and Illinois).

54
Racine County, Kenosha County, and Lake County are the three intermediate counties between
Milwaukee County and Cook County through which the Hiawatha Service route operates.
Table 5-19 displays the percentage of passengers from each residential location by day type and
total for all passengers. A majority of Hiawatha Service passengers (52 percent) were from the
Milwaukee MSA. Residents from other areas of Wisconsin comprised 9 percent of the overall
ridership. Racine County residents comprised 5 percent of the ridership, and Kenosha County
residents were a very small percentage. Chicago-area residents represented approximately
23 percent of the ridership, while a small percentage of Hiawatha Service passengers were from
Lake County or other areas of Illinois.
Table 5-19: Rail Passenger Residential Location by Day Type Residential Location Weekday Weekend All Passengers
Wisconsin (%) 70 64 67
Milwaukee MSA (%) 54 50 52
Racine County (%) 6 4 5
Kenosha County (%) 1 <1 <1
All Remaining Wisconsin (%) 9 10 9
Illinois (%) 22 26 24
Chicago Metropolitan Division (%) 20 25 23
Lake County (%) <1 <1 <1
All Remaining Illinois (%) 1 1 1
Other U.S. States (%) 8 10 9
Note: Columns may not sum to 100 percent due to rounding
Source: 2011 TTI/WisDOT Hiawatha Service On-Board Passenger Survey
Also shown in Table 5-19 is the percentage of residents from Wisconsin, Illinois, and
other U.S. states obtained from a sum of the appropriate categories. Approximately two-thirds of
Hiawatha Service passengers were from Wisconsin, one-quarter were from Illinois, and the rest
were from other U.S. states. Wisconsin residents comprised a slightly greater share of weekday
passengers, while Illinois and other U.S. states were higher on weekends.
Table 5-20 reports the percentage of Hiawatha Service passengers from each residential
location by trip purpose. For comparison, the distribution of residential location for all surveyed
passengers is also given in Table 5-20. Several trends in passenger residential location by trip
purpose are evident. The primary residential location for business travelers was the Milwaukee
area (63 percent as compared with 52 percent of all passengers). Among commute travelers,
11 percent reported a residence in Racine County, but only 1 percent reported a residence in
Kenosha County. The substantial difference between the two counties is due to the location of
the Sturtevant station in Racine County and also the availability of frequent METRA commuter
rail service from Kenosha to Chicago. The distribution of residential location for passengers
traveling for personal reasons varied slightly from the residential location for all Hiawatha
Service passengers, with more personal travelers having residential locations in other areas of
Wisconsin, the Chicago area, and other U.S. states than average.

55
Table 5-20: Rail Passenger Residential Location by Trip Purpose Residential Location Business Commute Personal All Passengers
Wisconsin (%) 78 77 61 67
Milwaukee MSA (%) 63 64 46 52
Racine County (%) 5 11 3 5
Kenosha County (%) 0 1 <1 <1
All Remaining Wisconsin (%) 10 2 12 9
Illinois (%) 14 20 27 24
Chicago Metropolitan Division (%) 13 20 26 23
Lake County (%) 0 0 <1 <1
All Remaining Illinois (%) 1 0 1 1
Other U.S. States (%) 9 1 12 9
Note: Columns may not sum to 100 percent due to rounding
Source: 2011 TTI/WisDOT Hiawatha Service On-Board Passenger Survey
The final section of the Hiawatha Service on-board passenger survey form gathered
typical demographic profile information about the passenger. Demographic profile information
gathered included gender, number of vehicles in household, age group, employment status,
highest level of education, and total annual household income.
Table 5-21 reports the demographic profile characteristics for Hiawatha Service
passengers by day type and both day types combined. Females comprised a majority of
passengers across both days (54 percent), with a higher percentage of females on weekends
(56 percent) than weekdays (52 percent). Vehicle access did not appear to be an issue for
Hiawatha Service passengers, as only 9 percent of passengers surveyed reported having zero
vehicles in their household. The average number of vehicles per household was slightly less than
two vehicles per household. Weekday passengers were older than weekend passengers by
approximately 3 years, with the median age for weekday passenger estimated at 40.9 and for
weekend passengers at 37.6 years old. The proportion of younger passengers (ages 18 to 24
years) was higher on weekends (21 percent) than on weekdays (13 percent). The proportion of
elderly passengers aged 65 years or older was consistent across the two days, covering
approximately 6 percent of all passengers. A majority of passengers surveyed reported full-time
employment status. The share of passengers reporting full-time employment was higher on
weekdays (71 percent) than on weekends (60 percent). Conversely, the weekend passenger
profile was comprised of larger percentages of part-time employees, retired individuals, and
university/college students. In general, the passengers on the Hiawatha Service were well
educated. A majority of passengers (65 percent) reported possession of a bachelor’s degree or
more advanced graduate degree. The median income among Hiawatha Service passengers was
estimated at $84,000, suggesting a relative level of affluence among the ridership. Estimated
median income on weekday trains was higher than weekend trains, likely a reflection of the
business and work commute passengers, which represented a majority of weekday passengers.

56
Table 5-21: Rail Passenger Demographic Characteristics by Day Type Characteristic Weekday Weekend All Passengers
Gender (% Female) 52 56 54
Household Vehicles
Average Vehicles per Household 2.0 1.8 1.9
None (%) 7 13 9
One (%) 25 28 26
Two (%) 47 37 42
Three (%) 14 13 14
Four or More (%) 8 10 9
Age Group
Median Age 40.9 37.6 39.7
18 to 24 years (%) 13 21 17
25 to 34 years (%) 23 25 24
35 to 44 years (%) 23 17 20
45 to 54 years (%) 21 17 19
55 to 64 years (%) 14 14 14
65 years and over (%) 6 6 6
Current Employment Status
Employed Full-Time (%) 71 60 66
Employed Part-Time (%) 6 11 9
Unemployed (%) 3 4 3
Retired (%) 7 9 8
University/College Student (%) 10 14 12
Homemaker (%) 2 2 2
Educational Attainment
Some High School or Less (%) 2 2 2
High School Graduate or GED (%) 8 12 10
Some College (%) 14 18 16
Associate or Technical Degree (%) 5 8 7
Bachelor’s Degree (%) 36 33 35
Graduate Degree (%) 34 26 30
Annual Household Income
Median Household Income $95,000 $70,900 $84,000
Less than $10,000 (%) 4 7 6
$10,000 to $19,999 (%) 4 4 4
$20,000 to $29,999 (%) 3 6 4
$30,000 to $39,999 (%) 5 8 7
$40,000 to $49,999 (%) 7 9 8
$50,000 to $74,999 (%) 14 18 16
$75,000 to $99,999 (%) 15 15 15
$100,000 to $149,999 (%) 19 14 17
$150,000 to $199,999 (%) 11 8 10
$200,000 or More (%) 17 10 14
Note: Columns may not sum to 100 percent due to rounding
Source: 2011 TTI/WisDOT Hiawatha Service On-Board Passenger Survey

57
Table 5-22 reports the demographic profile information for Hiawatha Service passengers
by the three trip purpose categories. A majority of commute passengers were male (58 percent),
while passengers traveling for personal reasons were mostly female (59 percent). The
female/male split among business travelers was nearly equal. The proportion of zero-vehicle
households was higher among personal travelers (12 percent) than the other two purposes. The
estimated median age was oldest for business travelers (44.2 years) and youngest for personal
travelers (37.8 years). The personal trip purpose segment had the highest percentage of younger
passengers (23 percent reported age 18 to 24 years) and elderly passengers (8 percent reported
age 65 and older). Not surprisingly, very high percentages of business and commute travelers
reported full-time employment status. Conversely, slightly more than half of personal travelers
reported full-time employment status. The second-largest group of personal travelers consisted
of university/college students, representing 17 percent of such travelers. Educational attainment
reported among business and commute passengers also followed an expected pattern, with the
percentage of passengers holding a graduate degree nearly twice as high as the same percentage
for personal travelers. However, the share of passengers with possession of a bachelor’s degree
was approximately equal across the three trip purpose categories. Across the three trip purpose
segments, the work commuter segment had the highest estimated median household income at
$125,500 annually. This was almost twice the estimated median income of personal travelers
($66,700) and approximately 10 percent more than the median income for business travelers
($113,700). In addition to having the lowest median income among the three trip purpose
groups, the personal traveler segment had the highest percentage of low-income passengers
(defined as income less than $20,000), with 13 percent of passengers falling into this group.

58
Table 5-22: Rail Passenger Demographic Characteristics by Trip Purpose Characteristic Business Commute Personal
Gender (% Female) 49 42 59
Household Vehicles
Average Vehicles per Household 2.0 2.0 1.8
None (%) 5 3 12
One (%) 23 25 28
Two (%) 49 54 37
Three (%) 17 10 14
Four or More (%) 6 9 10
Age Group
Median Age 44.2 41.1 37.8
18 to 24 years (%) 6 4 23
25 to 34 years (%) 28 27 22
35 to 44 years (%) 18 31 18
45 to 54 years (%) 29 24 15
55 to 64 years (%) 17 12 14
65 years and over (%) 3 1 8
Current Employment Status
Employed Full-Time (%) 87 94 52
Employed Part-Time (%) 7 3 11
Unemployed (%) <1 <1 5
Retired (%) 3 <1 11
University/College Student (%) 3 2 17
Homemaker (%) 1 0 3
Educational Attainment
Some High School or Less (%) 0 <1 3
High School Graduate or GED (%) 3 4 14
Some College (%) 11 9 20
Associate or Technical Degree (%) 5 3 8
Bachelor’s Degree (%) 39 40 33
Graduate Degree (%) 42 45 23
Annual Household Income
Median Household Income $113,700 $125,500 $66,700
Less than $10,000 (%) <1 1 8
$10,000 to $19,999 (%) 2 1 5
$20,000 to $29,999 (%) 1 <1 6
$30,000 to $39,999 (%) 3 3 9
$40,000 to $49,999 (%) 5 6 9
$50,000 to $74,999 (%) 15 11 18
$75,000 to $99,999 (%) 16 16 14
$100,000 to $149,999 (%) 24 24 13
$150,000 to $199,999 (%) 13 15 7
$200,000 or More (%) 19 23 9
Note: Columns may not sum to 100 percent due to rounding
Source: 2011 TTI/WisDOT Hiawatha Service On-Board Passenger Survey
59
CHAPTER 6: AIRPORT RAIL STATION SHUTTLE SURVEY ANALYSIS
This chapter reports the findings from the analysis of the Milwaukee airport shuttle
passenger survey data collected in Task 4 of this research project. An innovative two-part data
collection procedure was implemented to collect 961 initial interviews and 155 follow-up
Internet survey responses from passengers using the circulating shuttle to connect between the
Milwaukee Airport Rail Station and the Milwaukee General Mitchell International Airport main
terminal. Following a similar format as the analysis of the Hiawatha Service on-board passenger
survey analysis presented in the previous chapter, this analysis is divided into three sections:
Shuttle passenger trip information;
Shuttle passenger behavior and decision-making; and
Shuttle passenger demographic profile.
The initial interview collected information including the shuttle passenger’s gender, trip purpose
(business or personal), and home residential zip code. Similar information was also obtained
from the questions presented in the follow-up Internet survey. From the trip purpose and
residential zip code information, researchers assigned each initial interview and follow-up
Internet survey participant into one of the four airport ground access market segments previously
discussed (see Figure 2-1). The four market segments were as follows:
Resident/Business;
Resident/Non-Business;
Non-Resident/Business; and
Non-Resident/Non-Business.
Passengers with a home residence in the Milwaukee Combined Statistical Area (CSA), which
includes the four counties in the Milwaukee MSA plus Racine County, were considered residents
of the Milwaukee airport market area. Residents of the Chicago area (as defined by the Chicago
Metropolitan Division) were also considered residents of the Milwaukee airport market area
because the Hiawatha Service rail line offers a cost-competitive and convenient way to travel
from the Chicago area to the Milwaukee airport. The remaining passengers were considered
non-residents of the Milwaukee airport market area.
Table 6-1 shows the gender, trip purpose, residential status, and market segment for the
initial interview and the follow-up Internet survey. For the purposes of comparison, Table 6-1
also presents similar data from the Hiawatha Service on-board passenger survey described in the
previous chapter. Analysis of the initial interview data provides insight into the general
characteristics of the Milwaukee airport air-rail transfer shuttle passengers. A majority of shuttle
riders were male, representing approximately 58 percent of all riders. Most shuttle trips were by
passengers that were traveling for personal reasons (65 percent), while 35 percent were for
business purposes. A majority (59 percent) of shuttle passengers identified a residence outside
of the Milwaukee and Chicago region. One-third of the passengers interviewed reported a
residence in the Chicago area, and a small proportion of travelers (8 percent) were from
Milwaukee. It was not surprising that a small proportion of shuttle riders were Milwaukee-area
residents, as these travelers were likely to have other options for accessing the Milwaukee airport

60
readily available. Combining the trip purpose and residential status data, the largest market
segment was non-resident/non-business, accounting for 41 percent of shuttle passengers. Market
segmentation of the remaining shuttle passengers was as follows: resident/business, 17 percent;
resident/non-business, 24 percent; and non-resident/business, 18 percent.
Table 6-1: Comparison of Traveler Gender, Trip Purpose, Residence, and Market Segment
Characteristic
Initial
Interview
(n = 961)
Follow-Up
Survey
(n = 155)
On-Board
Survey
(n = 2,298)
Gender (% Female) 42 43 54
Trip Purpose (Business, %) 35 37 35
Commute to/from Work (%) N/A N/A 20
Going to/from a Business Trip (%) N/A 31 16
Going to/from a Meeting/Conference (%) N/A 6 N/A
Trip Purpose (Personal, %) 65 63 65
Going to/from School (University/College, %) N/A 0 4
Leisure/Vacation (%) N/A 20 26
Personal Business (%) N/A 7 5
Visiting Family or Friends (%) N/A 36 30
Residential Status
Milwaukee CSA (%) 8 8 57
Chicago MSA (%) 33 43 24
Non-Resident (All Others, %) 59 49 19
Market Segment
Resident Business (%) 17 21 32
Resident Non-Business (%) 24 29 49
Non-Resident Business (%) 18 16 4
Non-Resident Non-Business (%) 41 34 15
Note: Columns may not sum to 100 percent due to rounding
N/A indicates item not included on survey
Source: 2011 TTI/WisDOT Milwaukee Airport Shuttle Passenger Survey
Comparison between the initial interview data and the follow-up Internet survey data
revealed additional details about the travel purpose of shuttle riders. A majority of shuttle riders
were traveling to visit family or friends (36 percent) or for leisure or vacation (20 percent).
Among business travelers, most were traveling to or from a business trip with a small group or
going to or from a meeting or conference. Comparing the initial interview and follow-up survey
data showed that, in general, the follow-up survey respondents were sufficiently representative of
the shuttle riders observed during the initial interview. Chicago-area residents were a larger
proportion of the follow-up survey, as compared to the initial interview. Non-residents
accounted for this difference and were a smaller proportion of the follow-up survey group. This
was not surprising, as Chicago-area residents have more opportunities to use the Hiawatha
Service for a variety of trips and might have felt that their participation in the follow-up survey
would help bring improvements to the rail service in the future. Chi-square tests comparing the
distribution of market segment between the initial interview data and the follow-up survey data
showed that the follow-up survey was sufficiently representative of the initial interview
passengers for the four segments of the airport ground access travel market.

61
Comparison between the follow-up Internet survey data and the on-board passenger
survey data offers a look at how the Milwaukee airport shuttle passengers differed from the
overall Hiawatha Service ridership. The airport shuttle appeared to be attracting more male
travelers than the overall ridership, with females accounting for 54 percent of the overall
ridership but just 42 percent of the airport shuttle passengers. Interestingly, the percentage split
between business and personal travel among both groups was equal, although the overall
Hiawatha Service ridership consisted of a substantial percentage of travelers commuting to or
from work. This category of trip purpose was not included on the follow-up shuttle passenger
survey. The distribution of personal travel categories was also fairly consistent between the two
surveys. However, the distribution of passenger residential status was not consistent.
Specifically, the proportion of travelers from Milwaukee among the general Hiawatha Service
ridership was significantly higher than the airport shuttle riders. This finding was not surprising,
as residents of Milwaukee are likely to have several other travel options for accessing the airport
and do not need to utilize the Hiawatha Service for that purpose.
SHUTTLE PASSENGER TRIP INFORMATION
Boarding and Alighting Station
The remainder of this chapter focuses on the analysis of the data obtained from the
follow-up Internet survey of Milwaukee airport shuttle passengers. Trip information obtained
from this survey included the passengers’ boarding or alighting station and the location type of
the shuttle passengers’ origin or destination before or after the Hiawatha Service rail trip.
Table 6-2 shows the boarding and alighting station for Milwaukee airport shuttle passengers. In
the context of Table 6-2, the boarding and alighting stations are defined as the station where the
passenger boarded (or alighted) the Hiawatha Service with the Milwaukee Airport Rail Station
as the opposite end of the trip. For example, 9 percent of shuttle passengers boarded the
Hiawatha Service at the Milwaukee Downtown Intermodal Station and departed the Hiawatha
Service at the Milwaukee Airport Rail Station.
Table 6-2: Shuttle Passenger Boarding and Alighting Stations
Station Boarding
(To Airport)
Alighting
(From Airport)
Milwaukee (Downtown, %) 9 28
Sturtevant (%) 1 1
Glenview (%) 19 9
Chicago (Union Station, %) 71 61
Note: Columns may not sum to 100 percent due to rounding
Source: 2011 TTI/WisDOT Milwaukee Airport Shuttle Passenger Survey
Not surprisingly, a majority of shuttle passengers started or ended their rail trip on the
Hiawatha Service at Chicago Union Station. For passengers connecting to the airport station,
19 percent boarded the train in Glenview. Interestingly, 28 percent of passengers that boarded
the Hiawatha Service at the airport station departed the train at the Milwaukee Downtown
Intermodal Station. This is surprising because one might assume that passengers traveling to

62
downtown Milwaukee would have more convenient options than using the Hiawatha Service for
such a relatively short trip.
Origin and Destination Location Type
Table 6-3 shows the location type of the shuttle passengers’ origin or destination before
or after the rail trip to the Milwaukee airport. Approximately half of shuttle passengers
originated from or were destined to their home. Place of work or another employment-related
location was the origin of the trip for 11 percent of passengers going toward the airport but was
the destination for 7 percent of passengers coming from the airport. By contrast, 7 percent of
passengers coming from the airport reported a tourist or vacation site as their destination,
whereas only 1 percent of passengers traveling to the airport originated at such a location.
Table 6-3: Shuttle Passenger Origin/Destination Before/After Rail Trip
Location Type Origin
(To Airport)
Destination
(From Airport)
Home (Yours, %) 47 49
Home (Friend or Relative’s, %) 21 19
Hotel (%) 14 13
Meeting/Conference Site (%) 4 6
Place of Work or Other Employment-Related Location (%) 11 7
School/University (%) 1 0
Tourist or Vacation Site (%) 1 7
Note: Columns may not sum to 100 percent due to rounding
Source: 2011 TTI/WisDOT Milwaukee Airport Shuttle Passenger Survey
Air Carrier and Flight Destinations
Table 6-4 shows the air carrier used by shuttle passengers on their flight to or from
Milwaukee. This question on the survey also included an option for passengers to select that
they “Did Not Connect to/from Flight” and provided a series of non-flight activities as options
from which to select. Table 6-4 also shows the responses to this question.
Among shuttle passengers, popular air carriers included AirTran Airways, Frontier
Airlines, and Delta Airlines. It is not surprising that AirTran and Frontier were commonly used,
as both airlines have a strong presence at Milwaukee General Mitchell International Airport.
Interestingly, more than one-quarter of shuttle passengers were not traveling between the
Hiawatha Service and the Milwaukee airport for the purposes of connecting to a flight. Using
the shuttle to “Connect with Other Transportation Options” was reported by 19 percent of shuttle
passengers surveyed. Such transportation options included airport-based rental car facilities,
which tend to be open longer and have more vehicle choices than off-airport offices. Informal
discussion with passengers during the initial interviews confirmed that connecting from the
Hiawatha Service to airport rental car facilities is advised by rental agencies as a way to avoid a
one-way rental car drop fee (the Hiawatha Service fare is cheaper than the fee). Passengers
using the rail-air transfer at the Milwaukee Airport Rail Station also reported meeting/sending-
off a family member, friend, or colleague or connecting to work at or near the airport as other
non-flight-related uses of the shuttle connection.

63
Table 6-4: Shuttle Passenger Air Carrier/Other Reason for Accessing MKE
Air Carrier/Other Reason for Traveling All Shuttle
Passengers
Air Travelers Only
All Shuttle
Passengers
All MKE
Passengers
Air Canada (%) 0 0 <1
AirTran Airways (%) 25 33 29
American Airlines (%) 3 4 5
Continental Express (%) 2 3 4
Delta Airlines (%) 13 17 20
Frontier Airlines (%) 19 26 23
Southwest Airlines (%) 2 3 10
United Express (%) 8 10 4
U.S. Airways Express (%) 3 3 5
I Did Not Connect to/from Flight (%) 26 N/A N/A
Connect with Other Transportation Options (%) 19 N/A N/A
Meet/Send-Off Family/Friend/Colleague (%) 3 N/A N/A
Work at/near Airport (%) 3 N/A N/A
Unspecified Other (%) 1 N/A N/A
Note: Columns may not sum to 100 percent due to rounding
MKE airline passenger data source: (37)
Source: 2011 TTI/WisDOT Milwaukee Airport Shuttle Passenger Survey
Table 6-4 also displays the distribution of airlines used by shuttle passengers (as a
percentage of survey respondents that were connecting to airlines) compared with the
distribution of all airline passenger activity at the Milwaukee airport. Total passenger activity at
the airport is given as the percentage of passengers screened at security by each airline for the
month of June 2011. In general, the shuttle passengers’ airline preferences reflected the airline
preferences of all airport passengers. The share of passengers using United Express was higher
among shuttle passengers, while Southwest Airlines was under-represented in the survey.
Table 6-5 reports the air carrier or other reason for accessing the Milwaukee airport for
shuttle passengers by market segment. Three low-cost carriers serve Milwaukee General
Mitchell International Airport: AirTran Airways, Frontier Airlines, and Southwest Airlines. The
remaining six airlines that serve Milwaukee are grouped as “legacy carriers” in Table 6-5. Most
shuttle passengers (46 percent) were connecting to one of the three low-cost carriers. The use of
low-cost airlines was high among non-business travelers, particularly resident/non-business
travelers (58 percent). Legacy carriers were utilized by approximately 30 percent of shuttle
riders, with a majority of the non-resident/business segment connecting to flights operated by
these air carriers. Connecting with other transportation options was greatest among
resident/business travelers with 27 percent of those travelers specifying that option.

64
Table 6-5: Air Carrier/Other Reason for Accessing MKE by Market Segment
Air Carrier/Other
Reason for Traveling
Resident/
Business
Resident/
Non-
Business
Non-
Resident/
Business
Non-
Resident/
Non-
Business
All
Shuttle
Riders
Low-Cost Carriers (%) 33 58 38 48 46
Legacy Carriers (%) 24 22 54 25 29
Connect to Other Transportation (%) 27 11 8 25 19
Other Reason (%) 15 9 0 2 6
Note: Columns may not sum to 100 percent due to rounding
Source: 2011 TTI/WisDOT Milwaukee Airport Shuttle Passenger Survey
Table 6-6 reports the top origin or destination cities for shuttle passengers connecting to
or from flights at the Milwaukee airport. A total of 48 separate cities were reported, of which 12
cities (listed in Table 6-6) were listed by approximately half of the passengers. Top origin or
destination cities included major cities like New York, Washington, D.C., Boston, Los Angeles,
Denver, and San Francisco as well as regional destinations such as Rhinelander, Wisconsin.
Table 6-6: Top Origin/Destination Cities to/from MKE among Shuttle Passengers Rank Origin/Destination City Shuttle Passengers
1 New York, NY (%) 13
2 Washington, D.C. (%) 11
3 Boston, MA (%) 6
4 Los Angeles, CA (%) 5
5 Denver, CO (%) 4
6 San Francisco, CA (%) 4
7 Akron/Canton, OH (%) 3
8 Atlanta, GA (%) 3
9 Kansas City, MO (%) 3
10 Las Vegas, NV (%) 3
11 Rhinelander, WI (%) 3
12 St. Louis, MO (%) 3
All 36 Other Cities (%) 49
Note: Columns may not sum to 100 percent due to rounding
Source: 2011 TTI/WisDOT Milwaukee Airport Shuttle Passenger Survey
SHUTTLE PASSENGER BEHAVIOR AND DECISION-MAKING
The first section of this chapter examined various data items related to the Milwaukee
airport shuttle passengers’ trips. This section examines two aspects of shuttle passenger behavior
and decision-making that were included on the Milwaukee airport shuttle passenger survey: the
passengers’ alternatives for accessing the Milwaukee airport and passenger motivations for using
the Hiawatha Service to access the Milwaukee airport, instead of other options.
Alternative Travel Mode
In the case of the Milwaukee airport, travelers have a variety of private or public options
for the ground access trip, including private automobile (parked or drop-off/pick-up),

65
motorcoach bus or taxi, local transit, or rental car. Additionally, since the Hiawatha Service
provides convenient access between the Chicago region and the Milwaukee airport, the two
Chicago-area airports, O’Hare International Airport and Midway Airport, are feasible
alternatives for certain travelers. Due to the heavy presence of low-fare airlines and the
convenient access to the airport (provided in part by the Hiawatha Service connection), the
Milwaukee airport staff has marketed heavily to travelers in northeast Illinois and north Chicago
suburbs as the low-fare alternative to Chicago O’Hare International Airport (38).
Table 6-7 shows the percentage of shuttle riders that would have utilized each alternative
access mode or airport if the Hiawatha Service were not available. The most frequently reported
alternative among shuttle riders was the use of one of the two Chicago-area airports, with
approximately one-third of travelers selecting that option. Of these travelers, a majority would
have used Chicago O’Hare International Airport. One-quarter of shuttle riders would have
driven to the Milwaukee airport in a personal vehicle and parked at one of the adjacent parking
facilities. Other popular alternatives to the Hiawatha Service for airport access included motor
coach bus or shuttle, taxi, or drop-off/pick-up by a relative, friend, or colleague
Table 6-7: Shuttle Passenger Travel Alternatives by Market Segment
Alternative to Hiawatha Service Resident/
Business
Resident/
Non-
Business
Non-
Resident/
Business
Non-
Resident/
Non-
Business
All
Shuttle
Riders
I Would Use a Different Airport (%) 12 60 35 24 33
Chicago O’Hare (%) 3 51 22 22 26
Chicago Midway (%) 9 9 13 2 7
Drove Myself and Parked (%) 56 20 13 16 25
Motorcoach Bus/Shuttle Service (%) 16 11 17 4 11
Taxi/Car Service (%) 6 2 9 22 11
Driven by Relative/Friend/Colleague (%) 3 4 13 16 9
Other Travel Modes (%) 6 0 9 6 5
Local Transit Service (%) 0 2 0 6 3
Rental Car (%) 0 0 4 8 3
Note: Columns may not sum to 100 percent due to rounding
Source: 2011 TTI/WisDOT Milwaukee Airport Shuttle Passenger Survey
Upon examining the travel alternatives for each of the four market segments reported in
Table 6-7, some trends were immediately evident. Among the resident/business segment,
driving to the Milwaukee airport and parking was the preferred alternative for the ground access
trip. This group also had the lowest share of “Use a Different Airport” among the segments.
Conversely, a majority of travelers in the resident/non-business segment (60 percent) would have
used a different airport (mostly Chicago O’Hare) as an alternative to using the Hiawatha Service
to travel to the Milwaukee airport. In the case of the resident/non-business segment, the
Hiawatha Service appears to be not only facilitating ground access trips but also diverting air
passengers from the two Chicago airports to the Milwaukee airport. Among non-residents,
accessing the Milwaukee airport via a taxi or car service, transportation provided by a relative,
friend, or colleague, or the use of a rental car was higher as compared with the two resident
market segments. The use of a taxi or car service as an alternative was particularly high among

66
the non-resident/non-business market segment, a finding that was not surprising given that this
segment of travelers was probably the least informed and most unfamiliar with the various access
options that may be available at a particular airport (14).
Reasons for Using Rail to Access MKE
On the follow-up Internet survey, shuttle passengers were asked to consider the
importance of 16 items on their decision to use the Hiawatha Service to access the Milwaukee
airport instead of other options. Respondents rated each of the 16 items on a five-point scale
ranging from extremely unimportant (1) to extremely important (5). Table 6-8 shows the
average scores for each item for the four market segments and the average and standard
deviation for each item for the overall shuttle ridership.
Table 6-8: Shuttle Passenger Motivations for Choosing Hiawatha Service for Airport Trip
Motivation Resident/
Business
Resident/
Non-
Business
Non-
Resident/
Business
Non-
Resident/
Non-
Business
All
Shuttle
Riders
Convenient to My Final Destination 4.00 4.09 4.42 4.37 4.22 (0.99)
More Convenient than Other Options 4.24 4.11 3.71 4.20 4.10 (0.97)
Schedule Matched My Schedule 4.00 3.89 3.71 4.16 3.97 (1.11)
Avoid Highway Congestion 4.00 3.93 3.88 4.00 3.96 (1.21)
Less Expensive than Other Options 3.85 3.98 4.25 3.72 3.91 (1.11)
Faster than Other Options 3.97 3.78 3.54 3.73 3.77 (1.08)
More Comfortable than Other Options 3.76 3.89 3.50 3.57 3.69 (1.15)
More Reliable than Other Options 3.61 3.76 3.42 3.56 3.61 (1.06)
Opportunity to Sleep/Relax 4.00 3.76 3.25 3.25 3.56 (1.14)
Convenient to My Residence 3.84 3.86 2.46 3.09 3.38 (1.25)
Opportunity to Work while Traveling 3.64 3.42 3.50 2.82 3.28 (1.13)
Safer than Other Options 3.24 3.44 2.88 3.22 3.24 (1.17)
Avoid Airport Parking 3.12 3.27 2.54 3.06 3.05 (1.28)
No Other Transportation Available 3.03 3.09 2.79 2.72 2.91 (1.27)
Family/Friend/Colleague 2.48 3.13 2.96 2.94 2.90 (1.09)
Usual Option Not Available 2.66 2.40 2.42 2.69 2.55 (1.09)
Scale: (1) Strongly Unimportant to (5) Strongly Important
Rows in italics indicate items with ANOVA test for equality of mean scores rejected for α = 0.05
Source: 2011 TTI/WisDOT Milwaukee Airport Shuttle Passenger Survey
Among all shuttle riders and across market segments, convenience appeared to be a major
consideration when choosing the Hiawatha Service. This was reflected in the average scores for
the “Convenient to My Final Destination” and “More Convenient than Other Options” items,
which were scored as the two highest among all the items (average scores of 4.22/5 and 4.10/5,
respectively). In addition to being the two most important items, these two items also had the
lowest standard deviation among all the items, suggesting that there was a high level of
consensus among the ridership about the importance of these items. Other items that were rated
to be important factors in choosing the rail service included the rail schedule matching the
traveler’s schedule needs (average score 3.97/5), desire to avoid highway congestion (3.96/5),

67
and the lower cost of the train relative to other options (3.91/5). Two of the three lowest-rated
scores were associated with the availability of alternative travel modes. Low importance ratings
for the items “Usual Option Not Available” (2.55/5) and “No Other Transportation Available”
(2.91/5) indicated readily available alternatives to the rail service among shuttle riders.
Comparing the mean scores on each of the items across the four market segments
revealed some important differences in the traveler decision-making process among each
segment. ANOVA tests for the equality of means were rejected for the factors “Convenient to
My Residence” (F = 10.73, p < 0.0001), “Opportunity to Sleep/Relax while Traveling” (F =
4.13, p = 0.0076), and “Opportunity to Work while Traveling” (F = 4.71, p = 0.0036),
indicating some differences across the segment means for each of those items. Under the
“Convenient to My Residence” item, the mean importance scores for each of the two non-
resident market segments were significantly lower than the two resident market segments. This
was not surprising, considering the Hiawatha Service rail line was probably not conveniently
located near the residential location of a passenger who did not live in the Milwaukee or Chicago
region. The importance of the “Opportunity to Sleep or Relax” during the airport ground access
trip via rail was also different among the market segments. Non-resident travelers in both
business and non-business market segments rated this item lower than their resident counterparts.
The importance of the “Opportunity to Work” item was significantly lower for the non-
resident/non-business segment as compared to the other three segments—not surprising, as this
segment probably has less to be working on while traveling (as compared to the other segments).
Significant pairwise means comparisons across market segments for items without a
significant ANOVA rejection were also detected. Specifically, the mean score on the item
“Avoid Airport Parking” for the non-resident/business segment was significantly lower than the
resident/non-business segment, which was not surprising given that the non-resident/business
segment does not have to worry about airport parking at the Milwaukee airport if they are using
the Hiawatha Service for ground access. The mean score for the item “Recommended by
Family/Friend/Colleague” for the resident/business segment was significantly lower than the
score for the resident/non-business segment, not surprising because business travelers in the
market area of an airport are the most likely to know the menu of travel options for airport
ground access trips and therefore the least likely to need a recommendation or assurance from a
local contact person about the viability of a particular travel mode (14). While not statistically
significant, it is noted that the non-resident/business segment rated the importance of “Less
Expensive than Other Options” very high, with a mean score of 4.25. This was surprising, as
one might expect this segment to be the least cost-sensitive of the four. However, the importance
of cost when selecting the Hiawatha Service for the access trip suggests that the rail service
provides value to business travelers who may be trying to reduce expenses in an era of economic
uncertainty and tight company travel budgets.
SHUTTLE PASSENGER DEMOGRAPHIC PROFILE
The final section of this chapter examines the demographic profile characteristics of the
Milwaukee airport shuttle passengers. This examination includes the residential location of
shuttle passengers and other demographic profile information. Comparisons between the shuttle
passengers and the general Hiawatha Service ridership are also provided.

68
Table 6-9 shows the residential location of the shuttle passengers, as identified from the
initial interview responses and the responses provided to the follow-up Internet survey. Similar
data from the on-board survey (Table 5-19) are repeated here for comparison. Previous
discussion (Table 6-1) identified several of the key differences between the initial interview data
and the follow-up survey data. Specifically, Illinois residents were over-represented in the
follow-up survey, and residents of other U.S. states were under-represented. Most of this
difference was detected among residents of the Chicago Metropolitan Division. It is worth
pointing out again the significant difference between the general Hiawatha Service ridership and
the Milwaukee airport shuttle ridership in terms of the percentage of Milwaukee MSA and
Racine County residents that comprised each. The percentage of residents from other areas of
Wisconsin was also lower among shuttle passengers than among the overall Hiawatha Service
ridership. Conversely, the percentage of residents from other U.S. states was significantly higher
among shuttle passengers as compared with the overall Hiawatha Service ridership.
Table 6-9: Shuttle Passenger Residential Location
Residential Location
Initial
Interview
(n = 961)
Follow-Up
Survey
(n = 155)
On-Board
Survey
(n = 2,298)
Wisconsin (%) 11 10 67
Milwaukee MSA (%) 7 7 52
Racine County (%) 1 1 5
Kenosha County (%) <1 0 <1
All Remaining Wisconsin (%) 3 2 9
Illinois (%) 35 43 24
Chicago Metropolitan Division (%) 32 42 23
Lake County (%) 2 1 <1
All Remaining Illinois (%) 1 0 1
Other U.S. States (%) 55 47 9
Note: Columns may not sum to 100 percent due to rounding
Source: 2011 TTI/WisDOT Milwaukee Airport Shuttle Passenger Survey
Table 6-10 shows the demographic profile of all shuttle passengers compared to the
demographic profile of all Hiawatha Service passengers (Table 5-21). Table 6-11 shows the
demographic profile of the four market segments. As previously noted, male travelers accounted
for a majority of shuttle riders, but the overall Hiawatha Service ridership was majority female.
This was the case across the four market segments with the exception of the non-resident/non-
business segment, which was 54 percent female. In general, access to vehicles did not appear to
be an issue for most shuttle riders and the Hiawatha Service ridership as a whole, as most
surveys reported at least one household vehicle available for use. The only exception to this was
among the resident/non-business shuttle passenger segment, of which 36 percent reported living
in a household with no vehicles owned or leased among household members.
In general, the median age of the shuttle passengers was approximately equal to the
median age of the overall Hiawatha Service ridership. The exception was the non-resident/non-
business segment, with a median age of 48.3 years. A majority of shuttle passengers and all
Hiawatha Service passengers reported full-time employment status. Not surprisingly, the two

69
business traveler segments had a higher percentage of full-time employees than the non-business
segments, while retirees were only reported in the non-business segments.
Shuttle passengers reported higher levels of educational attainment than the overall
Hiawatha Service ridership. A large majority of shuttle passengers (88 percent) reported
possession of a bachelor’s or graduate degree, while only 65 percent of all rail passengers had
attained similar levels of education. Among shuttle passengers, the non-resident/non-business
market segment reported the most diverse educational background. Median annual household
income among shuttle passengers was slightly higher than the overall ridership ($92,900 versus
$84,000). Median household incomes were highest among the non-resident/business segment,
estimated at approximately $125,000 annually. Low-income passengers (annual household
incomes less than $20,000) were only present in the non-business segments, with 7 percent of the
resident/non-business segment and 18 percent of the non-resident/non-business segment
reporting annual household incomes in this range.

70
Table 6-10: Comparison of Hiawatha Service and Shuttle Passenger Demographics
Characteristic Airport Shuttle
Passengers
Hiawatha Service
Passengers
Gender (% Female) 43 54
Household Vehicles
Average Vehicles per Household 1.5 1.9
None (%) 16 9
One (%) 38 26
Two (%) 30 42
Three (%) 14 14
Four or More (%) 2 9
Age Group
Median Age 42.9 39.7
18 to 24 years (%) 8 17
25 to 34 years (%) 30 24
35 to 44 years (%) 16 20
45 to 54 years (%) 22 19
55 to 64 years (%) 17 14
65 years and over (%) 7 6
Current Employment Status
Employed Full-Time (%) 72 66
Employed Part-Time (%) 9 9
Unemployed (%) 4 3
Retired (%) 10 8
University/College Student (%) 5 12
Homemaker (%) 0 2
Educational Attainment
Some High School or Less (%) 1 2
High School Graduate or GED (%) 2 10
Some College (%) 6 16
Associate or Technical Degree (%) 3 7
Bachelor’s Degree (%) 44 35
Graduate Degree (%) 44 30
Annual Household Income
Median Household Income $92,900 $84,000
Less than $10,000 (%) 2 6
$10,000 to $19,999 (%) 6 4
$20,000 to $29,999 (%) 6 4
$30,000 to $39,999 (%) 1 7
$40,000 to $49,999 (%) 5 8
$50,000 to $74,999 (%) 15 16
$75,000 to $99,999 (%) 19 15
$100,000 to $149,999 (%) 21 17
$150,000 to $199,999 (%) 11 10
$200,000 or More (%) 13 14
Note: Columns may not sum to 100 percent due to rounding
Source: 2011 TTI/WisDOT Milwaukee Airport Shuttle Passenger Survey

71
Table 6-11: Shuttle Passenger Demographic Characteristics by Market Segment
Characteristic Resident/
Business
Resident/
Non-Business
Non-Resident/
Business
Non-Resident/
Non-Business
Gender (% Female) 38 40 33 54
Household Vehicles
Average Vehicles per Household 1.4 1.1 2.0 1.7
None (%) 9 36 0 10
One (%) 50 31 25 42
Two (%) 28 27 54 23
Three (%) 13 4 17 23
Four or More (%) 0 2 4 2
Age Group
Median Age 40.5 38.3 41.7 48.3
18 to 24 years (%) 0 9 17 8
25 to 34 years (%) 31 36 25 25
35 to 44 years (%) 34 14 13 8
45 to 54 years (%) 13 16 33 29
55 to 64 years (%) 16 14 13 23
65 years and over (%) 6 11 0 8
Current Employment Status
Employed Full-Time (%) 77 59 83 73
Employed Part-Time (%) 19 11 0 6
Unemployed (%) 3 5 8 2
Retired (%) 0 18 0 13
University/College Student (%) 0 7 8 6
Homemaker (%) 0 0 0 0
Educational Attainment
Some High School or Less (%) 0 0 0 4
High School Graduate or GED (%) 0 0 0 6
Some College (%) 0 14 8 2
Associate or Technical Degree (%) 0 0 4 6
Bachelor’s Degree (%) 44 47 54 38
Graduate Degree (%) 56 40 33 44
Annual Household Income
Median Household Income $96,900 $89,300 $125,000 $82,300
Less than $10,000 (%) 0 2 0 4
$10,000 to $19,999 (%) 0 5 0 14
$20,000 to $29,999 (%) 10 10 9 0
$30,000 to $39,999 (%) 0 0 0 4
$40,000 to $49,999 (%) 0 5 9 8
$50,000 to $74,999 (%) 17 19 9 14
$75,000 to $99,999 (%) 27 17 4 24
$100,000 to $149,999 (%) 17 12 39 22
$150,000 to $199,999 (%) 10 17 17 4
$200,000 or More (%) 20 14 13 8
Note: Columns may not sum to 100 percent due to rounding
Source: 2011 TTI/WisDOT Milwaukee Airport Shuttle Passenger Survey

72
CHAPTER 7: CONCLUSIONS
The overall objective of this research was to examine the impacts of intercity passenger
rail on urban, regional, and national mobility using the Milwaukee-Chicago Hiawatha Service
intercity passenger rail route as a case study. This chapter summarizes the key findings from the
two surveys conducted as a part of this project—the Hiawatha Service on-board passenger
survey and the two-part Milwaukee airport shuttle passenger survey. The findings from the two
surveys are then synthesized to characterize the impacts of intercity passenger rail on urban,
regional, and national mobility. Potential applications of the research findings are also
discussed. The chapter concludes by identifying potential avenues for future research.
SUMMARY OF FINDINGS
The setting for this research project was the Hiawatha Service, an Amtrak intercity
passenger rail route operating in the 86-mile corridor between Milwaukee, Wisconsin, and
Chicago, Illinois. In many respects, the Hiawatha Service serves as a model of successful
implementation of intercity passenger rail. The service operates in a relatively short-distance
multi-state corridor with travel times that are competitive with automobile travel. Multiple daily
frequencies are provided with departure times throughout the day, providing travelers with a
variety of choices. Both Wisconsin and Illinois contribute funds to support Hiawatha Service
operations, and additional targeted investment by the State of Wisconsin has improved facilities
and increased awareness of the route. In Chicago, passengers can connect from the service to
other Amtrak routes. In Milwaukee, passengers can make direct connections with Amtrak’s
Thruway bus service. Additionally, passengers have the option of directly connecting to
commercial air carrier flights at Milwaukee’s General Mitchell International Airport. Ridership
on the route has grown more than 40 percent over the last five years and exceeded 819,000
passengers in FFY 2011. Consequently, the lessons learned from examining the roles of the
Hiawatha Service may have broad application for planning activities related to current or
proposed passenger rail routes in other regions, to the extent that such routes share similar
characteristics as the Hiawatha Service.
To examine the mobility impacts of the Hiawatha Service, two separate data collection
efforts were undertaken in this project. The first was an on-board survey of Hiawatha Service
passengers conducted in March and April 2011. The four-page survey, which consisted of 25
questions, identified information about the passenger’s trip purpose on the day of the survey,
alternatives to the Hiawatha Service, motivations for using the train instead of other modes, and
demographic profile information. Across two days of data collection (a weekday and a weekend
day), a total of 2,298 completed surveys were obtained from Hiawatha Service passengers,
achieving a participation rate of approximately 58 percent. The second data collection effort was
a more detailed study of passengers utilizing the shuttle connecting the Milwaukee Airport Rail
Station and the airport terminal at Milwaukee General Mitchell International Airport. The
shuttle passenger survey employed an innovative two-part data collection procedure consisting
of an initial field interview conducted with shuttle passengers at the rail station and a follow-up
Internet survey questionnaire. A total of 848 initial interviews were conducted with passengers
at the Milwaukee Airport Rail Station over a 15-day period in May and June 2011. From these

73
initial interviews, a total of 155 follow-up Internet survey responses were obtained, resulting in a
response rate of approximately 18 percent.
The Hiawatha Service on-board passenger survey data revealed valuable insight into the
travel behavior, decision-making, and demographic profile of the rail passengers. There were
clear trends observed between the weekday and the weekend survey data in terms of passenger
trip purpose. On weekdays, a majority of passengers were traveling on the Hiawatha Service for
business-related or work commute purposes. This included 21 percent traveling to/from a
business trip, 20 percent commuting on a daily basis, and 13 percent of passengers commuting
to/from work on a less-than-daily basis. Conversely, almost 80 percent of weekend passengers
were traveling for personal reasons, including 43 percent for visiting family or friends,
25 percent for leisure or entertainment, 7 percent for vacation, and 4 percent for shopping. This
contrast in trip purpose between weekday and weekend passengers was evident in the
demographic profile analysis, which reflected trends in age, employment status, educational
attainment, and annual household income that would be expected between the business/work
commute groups and the personal traveler groups. Another contrast between weekday and
weekend passengers was noted in the passengers’ reasons for choosing the Hiawatha Service for
the trip. Weekday passengers tended to view the convenience aspects of the rail service as more
attractive, while weekend passengers rated the connections between the rail service and other
Amtrak trains, intercity buses, or airline services more favorably. One finding from the on-board
survey that was consistent across both days was that the automobile was the primary alternative
to rail service, with nearly 70 percent of passengers preferring the automobile over other options.
More detailed analysis of this finding will be provided in the next section. Two-thirds of
Hiawatha Service passengers reported a home residence in Wisconsin (a majority from the
Milwaukee MSA), while approximately 25 percent were from Chicago or other areas of Illinois.
The Milwaukee Airport Rail Station is one of only four stations in the Amtrak national
intercity passenger rail network where direct access to an airport is provided. The Milwaukee
airport shuttle passenger survey conducted in this project was unique in that it specifically
focused on passengers utilizing an airport-intercity passenger rail connection in the U.S. A
majority of shuttle passengers were traveling for personal reasons and were non-residents of the
Milwaukee airport market area. Four segments of the airport ground access travel market, as
defined by previous research on public transportation access to airports (14), were identified
from this survey as follows:
Resident/Business (17 percent of shuttle passengers);
Resident/Non-Business (24 percent);
Non-Resident/Business (18 percent); and
Non-Resident/Non-Business (41 percent).
Milwaukee-area residents comprised just 8 percent of the shuttle ridership, as compared to
59 percent of the overall Hiawatha Service ridership. This was not a surprising finding, as
residents of the Milwaukee area were more likely to have other options for accessing the
Milwaukee airport readily available than non-residents. One of the most interesting findings
from the shuttle survey was that not all passengers riding the shuttle were connecting between
the Hiawatha Service and a flight at MKE. Rather, 19 percent of shuttle passengers were
connecting between the rail station and the airport to connect with other transportation options
74
available at the airport, such as rental car services. If the airport-intercity passenger rail
connection at MKE were not available, one-third of shuttle passengers would have used one of
the two Chicago-area airports instead of MKE for their flight. Other alternatives to rail access
included driving and parking at MKE, using motorcoach bus or shuttle service, and using taxi or
car service. Convenience of schedule and train destinations and the desire to avoid highway
congestion were among the key motivations for shuttle passengers to use the Hiawatha Service
to access the Milwaukee airport instead of other options. Consequently, synergy between the
Milwaukee airport and larger travel markets in the Chicago central business district is
strengthened by the rail service, potentially allowing for the Milwaukee airport to evolve into a
de facto third airport for the larger region as the connection becomes more fully integrated.
MOBILITY IMPACTS
The primary goal of this research was to examine the impacts of the Hiawatha Service on
urban, regional, and national mobility. The data obtained from the two user surveys conducted
in this project provided a great deal of insight into how the Hiawatha Service supports personal
mobility. The data also provide a starting point to develop a more quantitative estimate of the
mobility impacts of the rail service on urban, regional, and national levels. Broadly, intercity
passenger rail lines support personal mobility on all geographic levels in two distinct ways.
First, by providing another modal option for intercity travel, passenger rail service in major
intercity corridors provides congestion relief for travelers in parallel surface and air transport
networks and helps to support a more balanced transportation system. Second, for certain groups
of travelers, passenger rail may be the only feasible option for intercity travel.
To examine the influence of the Hiawatha Service on congestion relief, researchers
developed an estimate of the number of diverted and induced trips that comprised the total
Hiawatha Service ridership. Passenger responses to the question about alternative travel modes
if the Hiawatha Service were not available were used in this estimate (see Tables 5-11 and 5-12).
A trip was considered “diverted” if the passenger responded that he or she would use an
alternative mode in the absence of the rail service. A trip was classified as “induced” if the
passenger would have not made the trip if the rail service were not available. In FFY 2011, a
total of 819,493 passengers rode the Hiawatha Service. Unpublished data from WisDOT
showed that the split of ridership between weekday and weekend trains was 76 percent weekday,
24 percent weekend. Researchers estimated the number of trips that were diverted or induced by
multiplying the percentage of weekday or weekend passengers that would use each alternative
mode (Table 5-11) by the estimated FFY 2011 weekday or weekend ridership. Table 7-1 shows
an estimate of the number of diverted and induced trips on the Hiawatha Service in FFY 2011.
If the rail service did not exist, nearly 70 percent of Hiawatha Service passengers would
travel via automobile. The estimates in Table 7-1 show that, in FFY 2011, the Hiawatha Service
diverted more than 521,000 vehicle trips from adjacent roadways. This includes rail passengers
that would drive a car or truck or would drive a rental car or company vehicle. Rail passengers
that reported they would travel as a passenger in a car or truck if the rail service were not
available were not included in this estimate. Assuming an average trip length of 80 miles, the
automobile trips diverted onto the Hiawatha Service result in an estimated 41.7 million annual
VMT that are eliminated from adjacent highways. Accompanying this reduction in VMT are

75
improvements in safety, fuel consumption, and vehicular emissions that generally accompany
reductions in vehicle travel.
Table 7-1: Estimate of Diverted and Induced Trips on Hiawatha Service, FFY 2011 Alternative Travel Mode Weekday Weekend Total
Drive Car/Truck 378,628 119,633 498,261
Passenger in Car/Truck 26,745 10,699 37,444
Rental Car/Company Vehicle 18,355 5,252 23,607
Intercity Bus 38,282 16,729 55,011
Local Transit Bus 8,391 4,280 12,670
METRA Commuter Rail 40,380 6,808 47,188
Airplane 23,074 6,614 29,688
I Would Not Have Made This Trip 90,724 24,899 115,623
Total FFY 2011 624,579 194,914 819,493
Table 7-1 also shows the estimated diversion from other non-personal vehicle modes to
the Hiawatha Service. In FFY 2011, more than 55,000 intercity bus trips were estimated to be
diverted onto the rail service. Researchers estimated that the rail service diverts more than
47,000 commuter rail trips and 12,000 local transit bus trips annually. Nearly 30,000 trips on the
Hiawatha Service, or more than 80 trips per day, were estimated to be diverted from a
commercial air carrier flight.
By diverting trips from other surface transportation modes (highway, intercity bus, local
rail and bus), the Hiawatha Service supports personal mobility in the major urban areas of the
corridor (Milwaukee and Chicago) as well as throughout the entire two-state region. Diversion
from private vehicles to the rail service reduces congestion on major regional highways, in turn
allowing for existing highway capacity to be used more efficiently. In a similar manner,
diverting regional and local transit trips to the Hiawatha Service increases capacity on those
modes. In particular, the diversion from local commuter rail and transit bus service to the rail
line improves the quality of service for passengers traveling within a single urban area by
providing alternatives for those passengers that are traveling longer distances, thus allowing
additional capacity to be used by intra-urban travelers. On a regional basis, the Hiawatha
Service provides a high-capacity alternative to regional intercity bus service. In the Milwaukee
urban area, the link between the Hiawatha Service and the Milwaukee General Mitchell
International Airport at the Milwaukee Airport Rail Station provides a sustainable alternative
mode for airport access, in turn providing additional congestion relief for the local roadways
surrounding the airport.
On a national level, the contribution of the Hiawatha Service to personal mobility is
centered on the relationship between the rail service and commercial airline service.
Approximately 4 percent of Hiawatha Service passengers, or about 80 passengers per day,
reported that they would have used an airplane to travel if the rail service were not available. In
addition to diverting airplane flights between Milwaukee and Chicago onto the rail service, the
Hiawatha Service also allows for residents of the Chicago region to conveniently access the
Milwaukee airport for airline trips. The shuttle passenger survey showed that approximately
one-third of the more than 12,000 annual shuttle passengers would have used one of the two
Chicago-region airports (O’Hare or Midway) if the connection between the rail service and the

76
airport were not available. While the contribution of the Hiawatha Service to reducing airline
flights is relatively small on a daily basis, it is noted that the Chicago-region airspace is one of
the busiest in the world. As such, any opportunity to reduce the number of short-haul flights and
increase airport capacity for longer flights at the two Chicago airports represents an improvement
in the overall efficiency of the national air transportation system.
The Hiawatha Service also contributes to personal mobility by providing a transportation
alternative for certain segments of the population that may have limited or no access to other
transportation options. In particular, three groups of rail passengers are identified:
Passengers from zero-vehicle households—approximately 9 percent of passengers;
Elderly passengers (age 65 and over)—approximately 6 percent of passengers; and
Low-income passengers (annual household incomes less than $20,000)—approximately
10 percent of passengers.
For all three groups of passengers, access to a personal vehicle, a key alternative to the rail
service, may be limited due to financial or physical constraints affecting these passengers.
Examining the alternatives to the Hiawatha Service reported in the on-board survey from this
research provides a look at how the rail service supports mobility among these passengers.
Table 7-2 shows the passengers’ self-reported alternatives to the Hiawatha Service by
number of household vehicles, passenger age, and annual household income. From the
passenger survey, the three automobile alternatives (drive vehicle, be a vehicle passenger, and
drive rental car) and the two local transit alternatives (transit bus and commuter rail) were
collapsed into auto and local transit, respectively, in Table 7-2. Also shown in Table 7-2 for the
purposes of comparison is the response distribution across the five alternatives for all passengers.
If the rail service were not available, passengers from zero-vehicle households would be more
likely to use intercity bus or not make the trip and less likely to use an automobile for their trip.
Elderly passengers, on the other hand, did not vary substantially from the overall ridership in
terms of alternatives to the rail service. These passengers would be less likely to drive and more
likely to use an airplane, although these differences were minor. Low-income passengers
exhibited similar behavior as passengers from zero-vehicle households in terms of alternatives to
the rail service. Low-income passengers would be less likely to drive and more likely to use
intercity bus or not make the trip if the rail service were not available. The propensity to use an
automobile as an alternative increased and the propensity to use an intercity bus decreased with
increasing income.

77
Table 7-2: Passenger Alternatives by Household Vehicles, Age, and Income
Passenger Segment Auto (%) Intercity
Bus (%)
Local
Transit (%) Airplane (%)
Would Not
Make Trip (%)
All Passengers 69 7 7 4 13
Household Vehicles
None 33 25 9 5 28
One 67 8 7 4 14
Two 77 4 7 3 10
Three or More 73 5 6 4 12
Age Group
18 to 24 years 63 13 8 3 13
25 to 34 years 71 7 4 3 15
35 to 44 years 71 5 10 2 13
45 to 54 years 70 5 7 3 15
55 to 64 years 70 6 6 4 14
65 years and over 60 10 6 10 14
Annual Household Income
Less than $20,000 47 18 6 8 22
$20,000 to $49,999 63 14 6 2 14
$50,000 to $99,999 70 6 8 3 12
$100,000 to $199,999 73 4 7 3 13
$200,000 or More 78 2 6 3 12
Note: Rows may not sum to 100 percent due to rounding
Source: 2011 TTI/WisDOT Hiawatha Service On-Board Passenger Survey
POTENTIAL APPLICATIONS
The synthesis presented in the previous section demonstrated how the Hiawatha Service
intercity passenger rail route impacts mobility on the urban, regional, and national levels. The
findings from this research project have a variety of applications for intercity passenger rail
planning practice and the development of transportation policy. For passenger rail planning, the
findings of this research can be used in formulating service development plans for future
intercity passenger rail routes, to the extent that the corridors being considered are similar to the
Hiawatha Service corridor. For example, the alternative travel mode findings from this study
(Tables 5-11 and 7-1) can be used to estimate the impact of new rail services on congestion in
parallel surface and air transportation networks. Findings on the mode split of passenger station
access and egress (Tables 5-2 and 5-3) can be used to aid planners in developing site layout and
parking plans for new or renovated stations along a rail corridor. Understanding which service
features attract passengers to the Hiawatha Service (Tables 5-13 and 5-14) or would increase the
frequency of rail travel among current passengers (Table 5-15 and 5-16) provides planners with
guidance on the selection of amenities for rail lines in development. The findings could also be
used by planners to support funding applications for federal grant programs for intercity
passenger rail investments.
One unique aspect of the Hiawatha Service is the airport-intercity passenger rail
connection provided at the Milwaukee Airport Rail Station. The findings of this project
pertaining to the Milwaukee Airport Rail Station can be used by rail planners to guide the

78
development of future airport rail stations on existing or new rail corridors. The two surveys—
the on-board passenger survey and the shuttle passenger survey—revealed that the airport rail
station serves two important roles. First, the airport rail station allows for intercity passenger rail
to serve as a ground access mode for the Milwaukee airport. In this role, rail passengers are not
only connecting to airline flights at the airport but also to other transportation services at the
airport, such as rental car facilities. The Hiawatha Service also has the effect of expanding the
market area for an airport in a smaller city (Milwaukee) by improving the accessibility of the
airport to residents of a large population center (Chicago), in turn providing these residents with
improved access to greater choices for air travel. Second, the airport rail station provides a more
convenient location for residents from the area around the airport to access the rail service. After
the airport rail station opened in 2005, some passengers shifted from the Milwaukee downtown
station to the airport station, while others reported that they starting using the Hiawatha Service
because of the airport rail station. Intercity passenger rail planners are encouraged to consider
the findings from this project when undertaking planning activities for new intercity passenger
rail stations to be built near airports.
For statewide rail planning and policy development, the findings from this research
project offer assistance to both public agency planning staff and policymakers. In the
development of state rail plans, the findings of this project can be used by rail planners to
quantify the impacts of intercity passenger rail service on statewide mobility and to identify rail
infrastructure or equipment investments to support a desired level of rail service across a state.
Legislators and their staff can use the findings from this research to support policy formation and
decision-making on transportation investments.
FUTURE RESEARCH
The findings from this research project raise several interesting questions and topics for
future research. As interest in developing the nation’s intercity passenger rail system grows
among planners, policymakers, and the general public, a greater understanding of the impacts of
rail lines on urban, regional, and national mobility is desired. Moving forward, new on-board
surveys of passengers on other Amtrak routes across the U.S. would be helpful to this
understanding. With the new train sets scheduled to begin service on the Hiawatha Service route
in 2012, a future on-board survey of Hiawatha Service passengers will help understand the
impacts of new equipment on the characteristics of the ridership. The airport shuttle passenger
survey conducted as part of this project examined the characteristics of the passengers
connecting between intercity passenger rail and airports at one of the four U.S. airports where
such a connection is provided. Surveys of connecting passengers at the other three airports
would yield additional insights into how the air-rail intermodal connection supports personal
mobility. Future studies could also seek to improve the innovative two-part data collection
procedure used in the shuttle passenger survey. Possible future research efforts could include the
deployment of the procedure in a setting with a larger population or elimination of the initial
interview portion to determine the true effect of the foot-in-the-door technique on survey
response.
79
REFERENCES
1. U.S. Department of Transportation, Federal Railroad Administration. Vision for High-Speed
Rail in America: High-Speed Rail Strategic Plan, FRA, Washington, D.C., April 2009.
2. Passenger Rail Investment and Improvement Act of 2008. Public Law No. 110-432 (Division
B-Amtrak), 122 STAT. 4907, October 2008.
3. U.S. Department of Transportation, Office of Public Affairs. “President Obama, Vice
President Biden to Announce $8 Billion for High-Speed Rail Projects across the Country.”
News Release No. DOT 18-10, Washington, D.C., January 28, 2010.
4. Federal Railroad Administration. HSIPR Project Funding. U.S. Department of
Transportation. URL: http://www.fra.dot.gov/rpd/hsipr/ProjectFunding.aspx. Accessed
10 November 2011.
5. National Railroad Passenger Corporation. Amtrak System Timetable Spring/Summer 2011.
NRPC, Washington, D.C., Effective May 9, 2011.
6. National Railroad Passenger Corporation. “Amtrak Ridership Rolls Up Best-Ever Records.”
Amtrak Media Relations, Release No. ATK-11-133, Washington, D.C., October 13, 2011.
7. Sperry, B.R., and C.A. Morgan. Measuring the Benefits of Intercity Passenger Rail: A Case
Study of the Heartland Flyer Corridor. Southwest University Transportation Center, Texas
Transportation Institute, College Station, Texas, 2010.
8. Corey, Canapary & Galanis Research. Capitol Corridor Satisfaction Survey—Wave#17
Final Report. Prepared for the Capitol Corridor Joint Powers Authority. Oakland,
California, January 2008.
9. Economic Development Research Group, Inc. and KKO and Associates. Final Report:
Economic Benefits of Amtrak Downeaster Service. Prepared for Maine Department of
Transportation, Office of Passenger Transportation. Augusta, Maine, February 2005.
10. Sperry, B., and E. Johnson. Examining the Role of the Hiawatha Service in the Milwaukee-
Chicago Corridor. In Proceedings of the 2010 Joint Rail Conference. CD-ROM. Paper No.
JRC2010-36223, April 2010.
11. North Carolina Department of Transportation, Office of Productivity Services. Piedmont and
Carolinian Passenger Survey Summary. Raleigh, North Carolina, 2001.
12. Leigh Fisher Associates. Improving Public Transportation Access to Large Airports. Report
62, Transit Cooperative Research Program, Transportation Research Board, National
Research Council, Washington D.C., 2000.
13. Leigh Fisher Associates. Strategies for Improving Public Transportation Access to Large
Airports. Report 83, Transit Cooperative Research Program, Transportation Research Board,
National Research Council, Washington D.C., 2002.
14. Coogan, M.A. Ground Access to Major Airports by Public Transportation. Report 4,
Airport Cooperative Research Program, Transportation Research Board, National Research
Council, Washington D.C., 2008.
15. Elmore-Yalch, R. A Handbook: Using Market Segmentation to Increase Transit Ridership.
Report 36, Transit Cooperative Research Program, Transportation Research Board, National
Research Council, Washington D.C., 1998.
16. BWI Airport. Amtrak—BWI Airport. URL: http://www.bwiairport.com/en/travel/ground-
transportation/trans/amtrak. Accessed 20 November 2011.
17. Canan, T. and A. Mohammed. 2009 Washington-Baltimore Regional Air Passenger Study.
Metropolitan Washington Council of Governments, Washington, D.C., 2010.

80
18. Unison-Maximus Consulting. Bob Hope Airport—Customer Satisfaction Assessment Report.
Prepared for the Burbank-Glendale-Pasadena Airport Authority, 2008.
19. Parsons Brinkerhoff, Landrum & Brown, and Airport Interviewing and Research. FAA
Regional Air Service Demand Study Task A—Survey of Passengers. Prepared for the Federal
Aviation Administration and the Port Authority of New York and New Jersey, 2007.
20. López-Pita, A. and F. Robusté. High-Speed Line Airport Connections in Europe: State-of-
the-Art Study. Transportation Research Record: Journal of the Transportation Research
Board, No. 1863, Transportation Research Board, Washington, D.C., 2004, pp. 9-18.
21. Janic, M. True Multimodalism for Mitigating Airport Congestion: Substitution of Air
Passenger Transport by High-Speed Rail. Transportation Research Record: Journal of the
Transportation Research Board, No. 2177, Transportation Research Board, Washington,
D.C., 2010, pp. 78-87.
22. Clever, R. and M.M. Hansen. Interaction of Air and High-Speed Rail in Japan.
Transportation Research Record: Journal of the Transportation Research Board, No. 2043,
Transportation Research Board, Washington, D.C., 2008, pp. 1-12.
23. Román, C., Espino, R, and J.C. Martín. Competition of High-Speed Train with Air
Transport: The Case of Madrid-Barcelona. Journal of Air Transport Management, Vol. 13,
2007, pp. 277-284.
24. Transportation Economics & Management Systems, Inc. and HNTB Corporation. MWRRS
Executive Summary Report 2004. Prepared for the Midwest Regional Rail Initiative. URL:
http://www.dot.state.wi.us/projects/state/docs/railmidwest.pdf. Accessed 23 July 2010.
25. U.S. Department of Transportation, Office of Public Affairs. “U.S. Department of
Transportation Redirects $1.195 Billion in High-Speed Rail Funds.” News Release No. DOT
208-10, Washington, D.C., December 9, 2010.
26. National Railroad Passenger Corporation. “Monthly Performance Report—September 2011,”
National Railroad Passenger Corporation, Washington, D.C., 2011.
27. Freedman, J. L. and S. C. Fraser. Compliance Without Pressure: The Foot-in-the-Door
Technique. Journal of Personality and Social Psychology, Vol. 4, No. 2, 1966, pp.195-202.
28. Beanman, A.L., C.M. Cole, M. Preston, B. Klentz and N.M. Steblay. Fifteen Years of Foot-
in-the Door Research: A Meta-Analysis. Personality and Social Psychology Bulletin, Vol. 9,
No. 2, 1983, pp. 181-196.
29. Dillard, J. P., J. E. Hunter, and M. Burgoon. Sequential-Request Persuasive Strategies: Meta-
Analysis of Foot-in-the-Door and Door-in-the-Face. Human Communication Research, Vol.
10, No. 4, 1984, pp. 461-488.
30. Burger, J.M. The Foot-in-the-Door Compliance Procedure: A Multiple-Process Analysis and
Review. Personality and Social Psychology Review, Vol. 3, No. 4, 1999, pp. 303-325.
31. Pascaul, A. and N. Gueguen. Foot-In-The-Door and Door-In-The-Face: A Comparative
Meta-Analytic Study. Psychological Reports, Vol. 96, 2005, pp. 122-128.
32. Sheskin, I.M. and P.R. Stopher. Surveillance and Monitoring of a Bus System.
Transportation Research Record: Journal of the Transportation Research Board, No. 862,
Transportation Research Board, Washington, D.C., 1982, pp. 9-15.
33. Seethaler, R. K. and G. Rose. Six Principles of Persuasion to Promote Community-Based
Travel Behavior Change. Transportation Research Record: Journal of the Transportation
Research Board, No. 1956, Transportation Research Board, Washington, D.C., 2006, pp. 42-
51.

81
34. Delhomme, P., K. Grenier, and V. Kreel. Replication and Extension: The Effect of the
Commitment to Comply with Speed Limits in Rehabilitation Training Courses for Traffic
Regulation Offenders in France. Transportation Research Part F, Vol. 11, 2007, pp. 192-
206.
35. Taylor, T. and S. Booth-Butterfield. Getting a Foot in the Door with Drinking and Driving: A
Field Study of Healthy Influence. Communication Research Reports, Vol. 10, No. 1, 1993,
pp. 95-101.
36. Office of Management and Budget. Update of Statistical Area Definitions and Guidance on
Their Uses. OMB Bulletin No. 10-02, December 1, 2009.
37. General Mitchell International Airport. Monthly Data: June 2011. URL: http://www.
mitchellairport.com/airport-information/facts-and-stats/monthly-data-report/2011-monthly-
data/. Accessed 27 October 2011.
38. Barrett, R. and Durhams, S. “Mitchell International Airport Celebrates Its 8 Millionth
Customer.” Milwaukee Journal Sentinel, October 29, 2010.

82

83
APPENDIX A: ON-BOARD SURVEY QUESTIONNAIRE

84

85

86

87
APPENDIX B: AIRPORT RAIL STATION DATA COLLECTION FORMS

88

89
APPENDIX C: SHUTTLE PASSENGER SURVEY QUESTIONNAIRE
Participants were provided with an access code on the recruitment postcard that was entered
before starting the survey. This code was used to customize the survey questions to the
participant’s experience. Items marked in <> with <italic> face indicate customized content.
Welcome Screen
Dear Traveler:
The Texas Transportation Institute, in conjunction with the Wisconsin Department of
Transportation, is conducting a research study to better understand how travelers use Amtrak’s
Hiawatha Service to access Milwaukee General Mitchell International Airport. As part of this
study, we are asking travelers like you to participate in a short survey of your travel experiences.
This is a short survey and should take you no more than 15 minutes to complete. Your
participation in this research study is voluntary, and your responses will remain confidential. A
randomly-selected survey participant will receive a $250 Visa gift card. Your contact
information will be stored separately from your survey responses and cannot be linked to your
responses to these questions.
Thank you for your participation. If you have any questions regarding this survey, please contact
me at (979) 458-1683 or [email protected].
Sincerely,
Curtis Morgan, Principal Investigator
Passenger Rail Research Program
Texas Transportation Institute
This research study has been reviewed by the Human Subjects' Protection Program and/or the
Institutional Review Board at Texas A&M University. For research-related problems or
questions regarding your rights as a research participant, Click Here for more information or you
may contact these offices at (979) 458-4067 or [email protected].
Please click the “Next” button below to start the survey.
Introduction
In this survey, we will be asking you some questions about the trip you made on <trip date>
where you used the Amtrak Shuttle to connect between the Milwaukee Airport Rail Station and
the Milwaukee General Mitchell International Airport terminal.
1. Which one of the following best describes the main purpose of your trip that day?
Choose one of the following answers.

90
o Going to/from a business trip
o Going to/from a meeting or conference
o Going to/from school
(university/college)
o Personal business
o Visiting family or friends
o Leisure/Vacation
o Other (Please Specify)
Amtrak Hiawatha Service Trip Information
In this section, we are going to ask you about the rail portion of your trip on <trip date>.
2. At what station did you <board/depart> the Hiawatha Service?
Choose one of the following answers.
o Milwaukee, Wisconsin (Milwaukee Intermodal Station)
o Sturtevant, Wisconsin
o Glenview, Illinois
o Chicago, Illinois (Chicago Union Station)
3. How did you get to that train station?
Choose one of the following answers.
o Drive car/truck
o Dropped off in car/truck
o Local Transit (Bus)
o CTA Rapid Transit (“EL” Train)
o Walked
o Bicycled
o Commuter Train (METRA)
o Taxi
o Hotel courtesy car / Shuttle
o Transfer from another Amtrak train
o Transfer from intercity bus
o Other (Please Specify)
4. <Before/After> you <boarded/departed> the Hiawatha Service where did your trip
<start/end>? (Building, Address, or Community Name) [Text Box]
5. What type of location was this?
Choose one of the following answers.
o Home (Yours)
o Home (Friend’s or Relative’s)
o Meeting or Conference Site
o Place of Personal Business
o Place of Work or Other
Employment-Related Location
o School or University
o Tourist or Vacation Site
o Hotel
o Other (Please Specify)
Alternatives to the Hiawatha Service
6. If the Hiawatha Service was not available for you to use to travel <to/from> the
Milwaukee Airport, how might you have traveled <to/from> the Milwaukee Airport for
your trip on <trip date>?

91
Choose one of the following answers.
o Drive Myself and Park
o Driven by Relative, Friend, or
Colleague
o Taxi/Car Service
o Motorcoach Bus/Shuttle Service
o Local Transit Service
o I Would Use a Different Airport
o Other (Please Specify)
7. Which airport might you have used instead of the Milwaukee Airport?
Choose one of the following answers.
Only shown if question #6 response was “I Would Use a Different Airport”
o Chicago – O’Hare Airport
o Chicago – Midway Airport
o Other (Please Specify)
Motivations for Using the Hiawatha Service to Access Milwaukee Airport
8. When you decided to use the Hiawatha Service to travel <to/from> the Milwaukee
Airport instead of other options, how important were the following considerations in
making your choice?
Note: Responses for each item given on a five-point scale as follows: Extremely Unimportant,
Unimportant, Neutral, Important, Extremely Important. Items displayed in random order on
respondent’s screen.
o Avoid Airport Parking
o Avoid Highway Congestion
o Convenient to My Final Destination
o Convenient to My Residence
o Faster than Other Options
o Less Expensive than Other Options
o More Comfortable than Other Options
o More Convenient than Other Options
o More Reliable than Other Options
o No Other Form of Transportation
Available
o Opportunity to Sleep/Relax
o Opportunity to Work While Traveling
o Recommended by
Family/Friend/Colleague
o Safer than Other Options
o Schedule Matched My Schedule Needs
o Usual Option Not Available
Knowledge of Hiawatha Service to the Milwaukee Airport
9. How did you learn that the Hiawatha Service was an option to access the Milwaukee
Airport?
Please check any that apply.
o Newspaper Ad
o Sign/Billboard
o Travel Agency
o 1-800-USA-RAIL
o Word of Mouth
o Friend/Relative/Colleague
o Organization Newsletter/Flyer
o Airport Display Advertising
o Television Ad
o Direct Mail/E-Mail
o Radio Ad
o Milwaukee Airport Website

92
o Hiawatha Service Website
o Amtrak Website
o Other (Please Specify)
Flight Information
In this section, we are going to ask you about the airline portion of your trip on <trip date>.
10. What airline did you use for your flight <from/to> Milwaukee?
Choose one of the following answers.
o Air Canada
o AirTran Airways
o American Airlines
o Continental Express
o Delta Airlines
o Frontier Airlines
o Southwest Airlines
o United Express
o US Airways Express
o I Did Not Connect To/From Flight
o Other (Please Specify)
11. In what city or airport did your flight <end/start>? [Text Box]
12. Was this flight part of a round-trip flight out of the Milwaukee Airport?
Choose one of the following answers.
o Yes o No
13. Did you use the Hiawatha Service to connect <from/to> the Milwaukee Airport for the
other flight?
Choose one of the following answers. Only shown if question #12 response was “Yes”
o Yes
o No
14. Why did you not use the Hiawatha Service on that trip?
Choose one of the following answers. Only shown if question #13 response was “No”
o Schedule did not Match My Flight Time
o Not Enough Connection Time
o Other Connecting Options Available
o Changed Plans Last-Minute
o Luggage Limitations
o Other (Please Specify)
About Yourself
Finally, we would like to know a little about yourself and your household. Your responses to the
questions in this section will be used to help us better understand who is using the Milwaukee
Airport Amtrak Shuttle. Your responses to these questions will remain confidential.
15. What is your home ZIP code? [Text Box]

93
16. What is your age?
Choose one of the following answers.
o 18 to 24 years
o 25 to 34 years
o 35 to 44 years
o 45 to 54 years
o 55 to 64 years
o 65 years and over
17. What is your gender?
Choose one of the following answers.
o Female o Male
18. How many vehicles does your household own or lease?
Choose one of the following answers.
o None
o One
o Two
o Three
o Four or More
19. Which of the following best describes your current employment status?
Choose one of the following answers.
o Employed full-time
o Employed part-time
o Unemployed
o Retired
o University/College Student
o Homemaker
20. What is your highest completed level of education?
Choose one of the following answers.
o Some high school or less
o High school graduate or GED
o Some college
o Associate or technical degree
o Bachelor's degree
o Graduate degree
21. What is your current annual household income (total for all people who live in your
household)?
Choose one of the following answers.
o Less than $10,000
o $10,000 to $19,999
o $20,000 to $29,999
o $30,000 to $39,999
o $40,000 to $49,999
o $50,000 to $74,999
o $75,000 to $99,999
o $100,000 to $149,999
o $150,000 to $199,999
o $200,000 or More
22. Please enter any additional comments you might have about your Milwaukee Airport
Amtrak Shuttle experiences or this study in the box below. [Text Box]

94
95
APPENDIX D: IRB DOCUMENTATION
96


University Transportation Center for Mobility™
Texas Transportation Institute
The Texas A&M University System
College Station, TX 77843-3135
Tel: 979.845.2538 Fax: 979.845.9761
utcm.tamu.edu
TexasTransportationInstitute