authors - depaul university, chicago · authors data collection ... a review of the status of...
TRANSCRIPT

AUTHORS
DATA COLLECTION
JOSEPH P. SCHWIETERMAN*, C. SCOTT SMITH** AND RILEY O’NEIL
RILEY O’NEIL AND DANA YANOCHA
GRAPHICS RACHAEL SMITH AND DANA YANOCHA
PHOTOGRAPHY CLOCKWISE FROM TOP LEFT: CHADDICK INSTITUTE, TOMAS DEL CORO (CREATIVE COMMONS), CHADDICK INSTITUTE, AND MACKENSEN (USERNAME)
*CORRESPONDING AUTHOR & DIRECTOR, CHADDICK INSTITUTE
** ASSISTANT DIRECTOR, CHADDICK INSTITUTE
CHADDICK INSTITUTE FOR METROPOLITAN DEVELOPMENT AT DEPAUL UNIVERSITY CONTACT: JOSEPH SCHWIETERMAN, PH.D. | PHONE: 312.362.5732 | EMAIL: [email protected]
Transportation Working Paper Series No. 82317
THE STUDY TEAM
0
ABSTRACT
Gradual expansions to the express coach and rail system between 2006 and 2015 provided millions of Americans new alternatives to private automobile travel in intercity trips. These services, provided by Amtrak, BoltBus, Megabus, and other carriers, along with ambitious plans for high-speed rail service, raised hopes that the country was on the cusp of creating a more balanced transportation system.
However, these travel modes have, as this study shows, experienced setbacks in recent years. Through a review of the status of express coach and Amtrak service, this study shows:
Lower gasoline prices and discounted airfares induced by low-cost fuel have weakened demand for Amtrak and
intercity bus carriers over the past three years. Despite a recent upturn in traffic, new serviceofferings have lagged and not kept pace with the country’s rising population.
Travelers face “Ground Transportation Gaps” that make efforts to avoid driving between some cities more
difficult than just a few years ago. Slowed investment in new routes as well as coach lines trimmingschedules has made it more difficult to avoid using personal vehicle on many routes outside ofheavily traveled Northeast region.
Among the short- and mid-distance routes without rail or express coach service generating more than onemillion trips per year are Los Angeles – Phoenix, Cleveland – Detroit, Columbus, OH – Detroit,Chicago – Columbus, OH, and Phoenix – San Diego. Eight of the 50 most heavily traveled routesin the 120 – 400 mile range without either express coach or Amtrak service have lost this servicesince 2014.
Nine metropolitan areas with populations of 700,000 or more lack any service by Amtrak or express coach
lines. These “Pockets of Pain,” such as Phoenix, Columbus (OH) and Dayton, Tulsa, and Ft. Myers
and Sarasota, are largely inaccessible to intercity travelers who seek to avoid flying or driving butare unwilling to use conventional bus lines.
The study calls for practical steps to restore momentum to bus and rail travel that require a relatively small amount of public investment, including ways to cultivate new express coach service and promote greater rail/bus integration. It also calls for initiatives to overcome the lack of institutional planning and investment that is thwarting planning for rail services that cross state lines and thus require a great deal of interjurisdictional coordination. Such efforts, the study shows, would help foster more fuel-efficient and comparatively safe forms of travel.
Click here for an interactive map of the most heavily traveled routes without express coach or railservice, or visit the Chaddick research and publications page for a link to this and other documents.
1
etween 2005 and 2015, optimism ran high that expansions to the intercity bus and rail system would provide travelers in the United States with increasingly viable alternatives to driving, particularly on short- and middle-distance routes. Amtrak added frequency to numerous
corridors while enjoying steady gains in passenger traffic. Billions of dollars in federal investment were directed toward high-speed rail, suggesting that breakthroughs in train travel may be around the corner. Express coach operators such as BoltBus and Megabus, as well as a bevy of specialty lines, burst onto the scene, pushing intercity bus ridership to its highest levels in decades (16). Nevertheless, the pace of transformation of this intercity travel market has subsided. By 2015, bus and train traffic had fallen from its peak, buffeted by low fuel prices, heightened competition from airlines, and barriers to planned service improvements. The rollout of new trains slowed and federal funds for high-speed rail largely dried up. Express coach lines began cutting frequency on some routes and ended service to several major cities altogether. This study explores the dynamics of this setback in improvements to intercity travel by:
I. Evaluating the factors that slowed the expansion of intercity bus and train service and traffic levels over the past several years;
II. Illustrating how slowed investment and route elimination by express coach lines leaves many travelers without access to service on heavily traveled routes in the 120–400 mile range that most would consider a suitable alternative to driving;
III. Identifying the largest metropolitan areas without either Amtrak or express coach service, making them difficult to reach by those seeking to avoid driving and flying but are unwilling to travel on Greyhound or another conventional bus line.
Drawing upon these findings, the study outlines practical steps that public entities can take to cultivate a more attractive market for ground-based intercity services.
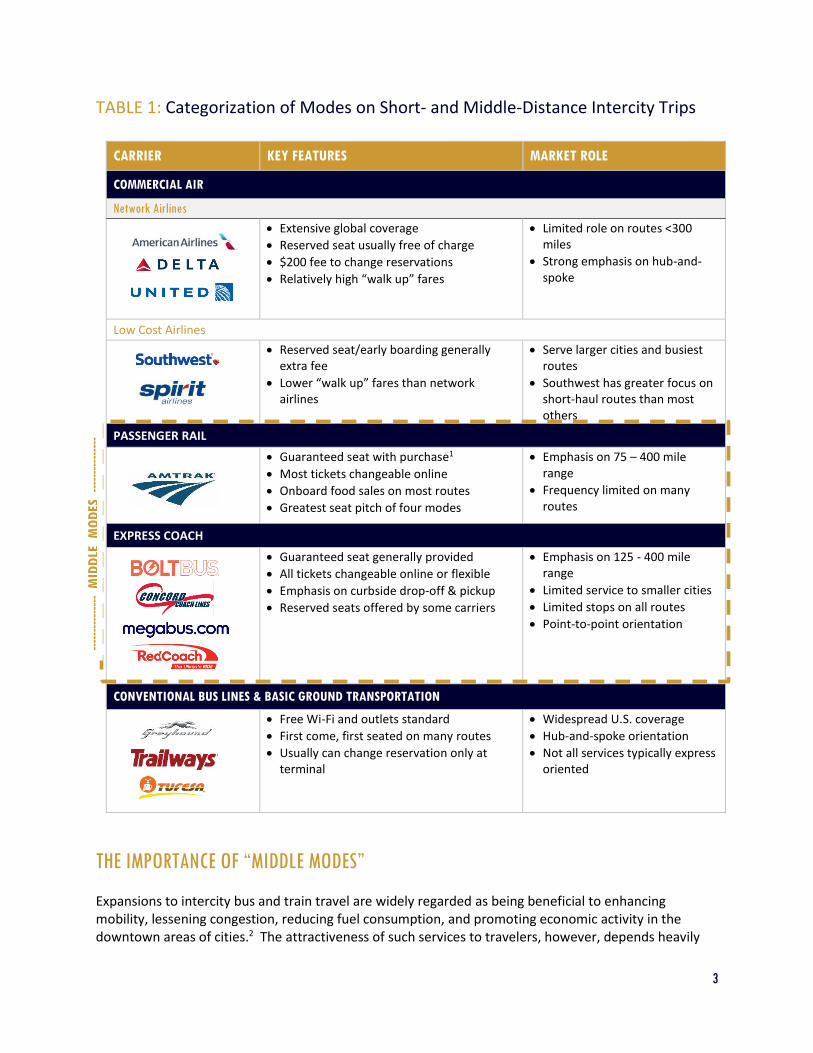
BACKGROUND: DEFINING THE MODES Travelers often consider a wide range of options when making intercity trips. On many routes, travelers can choose among at least four types of services. This study uses a simple typology (Table 1) to categorize these options. Commercial air service: This service is often the fastest option when distances are more than 250 miles, but is generally more costly than driving or taking a bus or train. On shorter trips, time spent traveling to and from the airport, navigating security, and arriving at the gate comfortably before departures can nullify air travel’s otherwise timesaving benefits. Commercial air service encompasses both network airlines and low-cost airlines, which primarily focus on relatively long-haul routes, with Southwest Airlines also having an extensive presence on short-hop routes. Passenger rail service: Provided exclusively by Amtrak on most of the U.S. mainland, this intercity service tends to be considerably less costly than flying but is generally more expensive than a bus (Schwieterman, 2012). Travelers enjoy a roomier on-board environment than buses and most airplanes,
B
2
although the frequency of service is often limited. Express oriented carriers (“express coach”): This service, provided by such carriers as BoltBus, Go Buses, Megabus, and Red Coach, appeals to a somewhat more affluent and tech-savvy market segment than conventional bus lines. These scheduled bus lines:
I. Specialize in express service between the downtowns of relatively large population centers with an emphasis on point-to-point travel rather than connections through centralized hubs;
II. Offer guaranteed seating for all reservation holders on their chosen departure, which eliminates the need for passengers to wait in line to assure they get a seat;
III. Extensively utilize curbside drop-off and pickup in place of conventional terminals, except when required by municipal regulation, or maintain small station facilities that are not shared with conventional bus lines, and;
IV. Emphasize online ticketing directly on the carrier’s website to eliminate the need for dedicated ticketing facilities at most pickup locations.
Several other characteristics commonly associated with express coach lines also distinguish them from conventional lines. For example, most express lines lack “interline agreements” with other bus lines, thus requiring passengers traveling to destinations that require the use of connecting carriers to purchase – on their own – a separate ticket for that leg of the journey. Almost all large conventional bus lines, by comparison, sell interlined tickets to offline destinations, with a significant share of these interline tickets sold through Greyhound’s website (greyhound.com). Express lines also generally allow passengers to change their reservation online at a modest cost (generally $7.50 or less), plus any difference in fare – a convenience not yet offered by Greyhound or most other conventional bus lines. Conventional bus service: This category includes Greyhound Lines, various Trailways affiliates, and many smaller lines that operate from centralized terminals. Conventional bus lines serve a vital role providing reliable transportation in both heavily used and lightly trafficked corridors. These providers cumulatively have near-universal coverage across the country. Many are part of a vast web of connecting services sold on greyhound.com. Passengers can arrive at the terminal only a few minutes before departure, but seating is generally not guaranteed, which encourages some to arrive early. Conventional bus lines typically require travelers to go to a bus station to change a ticket, and pay a $20 change fee. The distinction between express coach operators and conventional bus lines has been partially blurred by the creation of Greyhound Express, which has some of the qualities of express coach lines (such as guaranteed seating) but not others (such as emphasis on curbside drop-off and pickup as well as the ability to change reservations online). There are, of course, many different kinds of bus lines, including ethnically oriented lines (such as Chinatown bus companies) and campus-shuttle providers. For the purposes of this study, they are included in the conventional bus service category. Express coach and rail service are described in this study as “Middle Modes” as they have qualities that attract a broader demographic base than most conventional bus services but are less costly than airlines—a concept discussed in greater detail below.
3
TABLE 1: Categorization of Modes on Short- and Middle-Distance Intercity Trips
CARRIER KEY FEATURES MARKET ROLE
COMMERCIAL AIR
Network Airlines
Extensive global coverage
Reserved seat usually free of charge
$200 fee to change reservations
Relatively high “walk up” fares
Limited role on routes <300 miles
Strong emphasis on hub-and-spoke
Low Cost Airlines
Reserved seat/early boarding generally extra fee
Lower “walk up” fares than network airlines
Serve larger cities and busiest routes
Southwest has greater focus on short-haul routes than most others
PASSENGER RAIL
Guaranteed seat with purchase1
Most tickets changeable online
Onboard food sales on most routes
Greatest seat pitch of four modes
Emphasis on 75 – 400 mile range
Frequency limited on many routes
EXPRESS COACH
Guaranteed seat generally provided
All tickets changeable online or flexible
Emphasis on curbside drop-off & pickup
Reserved seats offered by some carriers
Emphasis on 125 - 400 mile range
Limited service to smaller cities
Limited stops on all routes
Point-to-point orientation
CONVENTIONAL BUS LINES & BASIC GROUND TRANSPORTATION
Free Wi-Fi and outlets standard
First come, first seated on many routes
Usually can change reservation only at terminal
Widespread U.S. coverage
Hub-and-spoke orientation
Not all services typically express oriented
THE IMPORTANCE OF “MIDDLE MODES”
Expansions to intercity bus and train travel are widely regarded as being beneficial to enhancing mobility, lessening congestion, reducing fuel consumption, and promoting economic activity in the downtown areas of cities.2 The attractiveness of such services to travelers, however, depends heavily
----
----
----
---
MID
DLE
M
OD
ES
----
----
----
---
4
on the characteristics of the traveler and the journey undertaken. Although federal agencies have not collected recent data on the choice of modes at various distances across the United States, the available data shows that intercity trips less than 100 miles are overwhelmingly taken by car.3 Flying is rare for trips less than 200 miles and accounts for only about 11% of trips in the 200 – 299 mile range. The share who flies jumps to 23% of trips between 300 to 399 miles, and to 33% from 400-499 miles. Well over half fly for trips of 600 miles of more.4 Intercity bus and rail travel is most viable on trips in the 100-400 mile range. These trips can generally be traversed on a ground-travel mode in about two to eight hours, a distance which can be uncomfortable when driving, particularly with heavy traffic. Longer trips, however, can be tedious on a ground-transportation mode, especially on a bus. Bus and rail combined account for about 4% of trips in the 200 -299 mile range, but less than 3% of trips between 400-409 miles, and below 2% of longer trips. Prior research by the Chaddick Institute shows that express coach service is particularly competitive in the 120 – 400 mile range. More than 90% of BoltBus and Megabus schedules fall within this distance interval.5 Express carriers have experienced great difficulty providing service on routes less than 120 miles, being only a weak player in most such markets and withdrawing from some others.6 At the same time, many travelers are categorically unwilling to consider using conventional bus lines on trips of any length, perhaps due to apprehension over the station environment and the onboard experience. Our prior research shows, for example, that just 14% of those riding Megabus would have used Greyhound or another conventional bus line if this express coach line’s service were unavailable.7 Perceptions appear to be changing, but many passengers still exclude conventional bus lines from their “choice set,” even when schedules are convenient and their other options are limited. The results of surveys of intercity bus passengers by state governments show a similar pattern. 8 Rightly or wrongly, many travelers with higher incomes avoid using conventional bus lines. The avoidance of conventional bus lines by certain travelers, of course, varies widely between regions and the carriers involved. Conventional bus service attracts a much broader swath of the population in densely population regions, particularly in the Northeast Corridor (NEC). As such, there is a wider range of services emanating from Boston, New York, and other major Eastern cities than in other parts of the country. These bus lines are more part of the travel mainstream in that region due in part to their extensive presence, the difficulty of automobile travel, and familiarity with public transit.9 In most of the country, however, having service provided by a middle mode (i.e., rail or express coach service) is essential if certain demographic segments are to be attracted from private vehicle travel. Without such service, many consider themselves as having a binary choice of driving or flying—if they decide to travel at all. Since flying is often impractical, they default to driving in these situations. As such, the expansion of middle modes appears important to reducing dependence on private vehicles, enhancing mobility for those who do not drive, and achieving environmental goals.10
KEY FINDINGS
To generate insights about how recent changes to bus and train service are affecting the ability of travelers to avoid using private vehicles, our analysis considered changes in supply and demand for
5
these services between U.S. metropolitan regions since 2005. Five findings were particularly noteworthy:
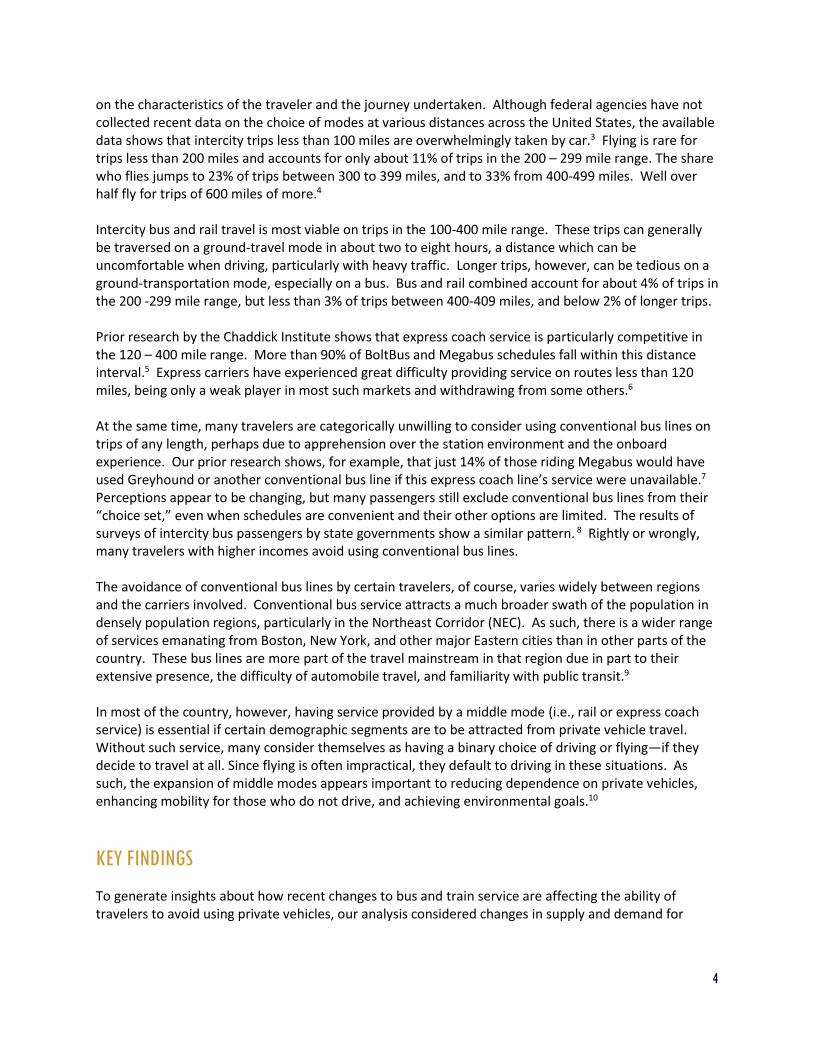
FINDING 1: The expansion of rail and intercity bus service between 2006 and 2014 provided millions of Americans new alternatives to driving and flying on short- and middle-distance routes. Both Amtrak and express coach lines such as BoltBus and Megabus attracted many travelers who otherwise would have used a private vehicle. The eight-year period beginning in 2006 was a bullish time for bus and rail operators. Amtrak posted gradual gains in passenger traffic, which pushed passenger-miles of travel from 5.4 billion at the start of the period to 7.3 billion in 2013.11 During that time, Amtrak added an extensive amount of new service, often in cooperation with state governments eager to enhance the vitality of short- and medium-distance corridors. Amtrak boosted frequency on numerous routes (Table 2) while also investing in improvements in speed and reliability.
TABLE 2: Notable new Amtrak Routes Added 2006 – 2012 vs. 2013 - 2017
CORRIDOR SERVICE ADDITIONS
2006 – 2012
SERVICE ADDITIONS
2013 – 2017
BOSTON – PORTLAND/BRUNSWICK, ME 5th train added. Speeds raised (2007)
CHICAGO – CARBONDALE 3rd train added (2006)
CHICAGO – MILWAUKEE 5th and 6th cars added to all trains (2007, 2009)
CHICAGO – ST. LOUIS 4th and 5th daily trains added (2006)
CHICAGO – WEST QUINCY, IA 2nd daily train added (2006)
NORFOLK – RICHMOND, VA Service launched (2012)
OAKLAND – BAKERSFIELD 7th daily train added (2016)
PORTLAND – SEATTLE 4th train added (2006)
OAKLAND – SACRAMENTO Frequency increased from 12 to 16, later reduced
by one (2006)
RICHMOND – WASHINGTON Frequency increased from 6 to 9 trains (2008-12).
WASHINGTON – LYNCHBURG Service launched 2009 Extension to Roanoke
scheduled for October 2017
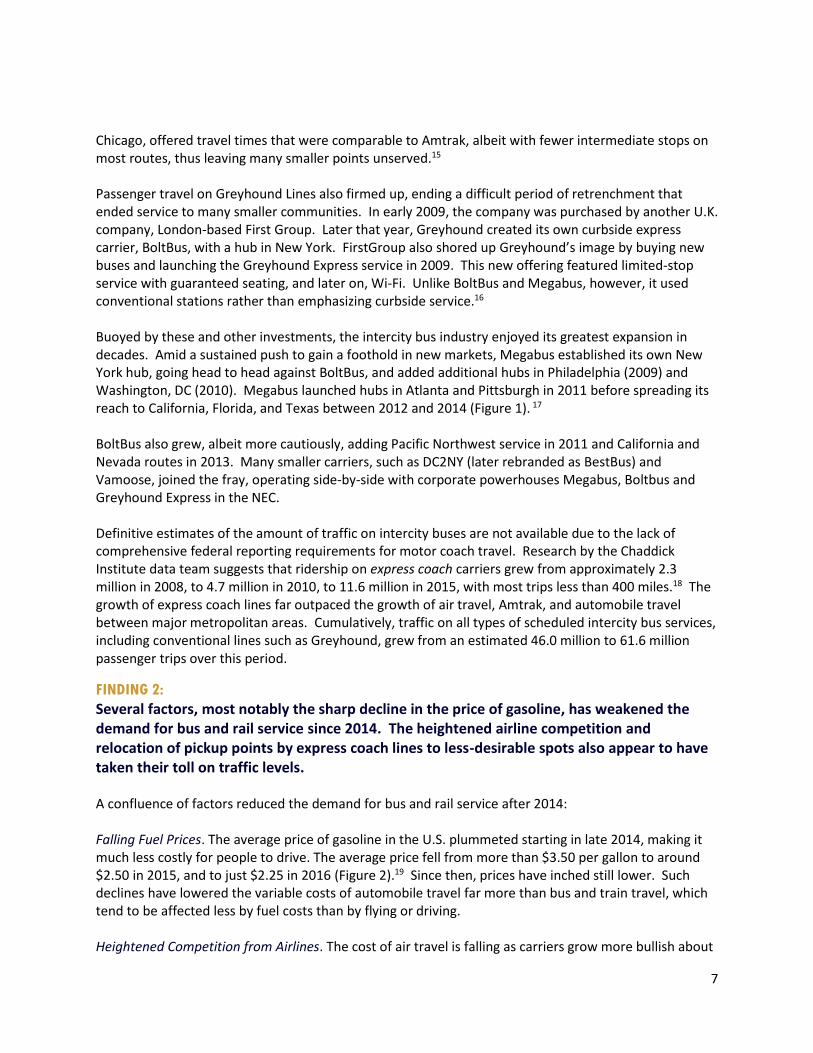
Although the passenger railroad still accounted for less than one percent of intercity passenger miles of travel in the U.S., there was optimism that a new era of rail travel was around the corner. Ambitious plans announced in 2011 by the Obama administration called for $53 billion over six years to support a high-speed rail (HSR) program with the expressed desire to bring 80% of the country’s population within 25 miles of a high-speed rail line within 25 years.12 In that year’s State of the Union Address, President Obama called for HSR to “allow you to go places in half the time it takes to travel by car. For some trips, it will be faster than flying.”13 Although the ambitious funding target was never achieved, roughly $12 billion was eventually awarded to state governments that matched the funds.14 Since 2013, the number of service expansion has dropped considerably. Although Table 2 is not a comprehensive list of all service changes, it shows how momentum for new offerings has been sharply reduced. The intercity bus sector, meanwhile, grew dramatically. In 2006, Scotland-based Stagecoach, Ltd., the owner of Coach USA, a set of established bus lines operating mostly in the eastern U.S., introduced its Megabus brand to the U.S. market. The carrier, relying on curbside drop-off and pickup from a hub in
6
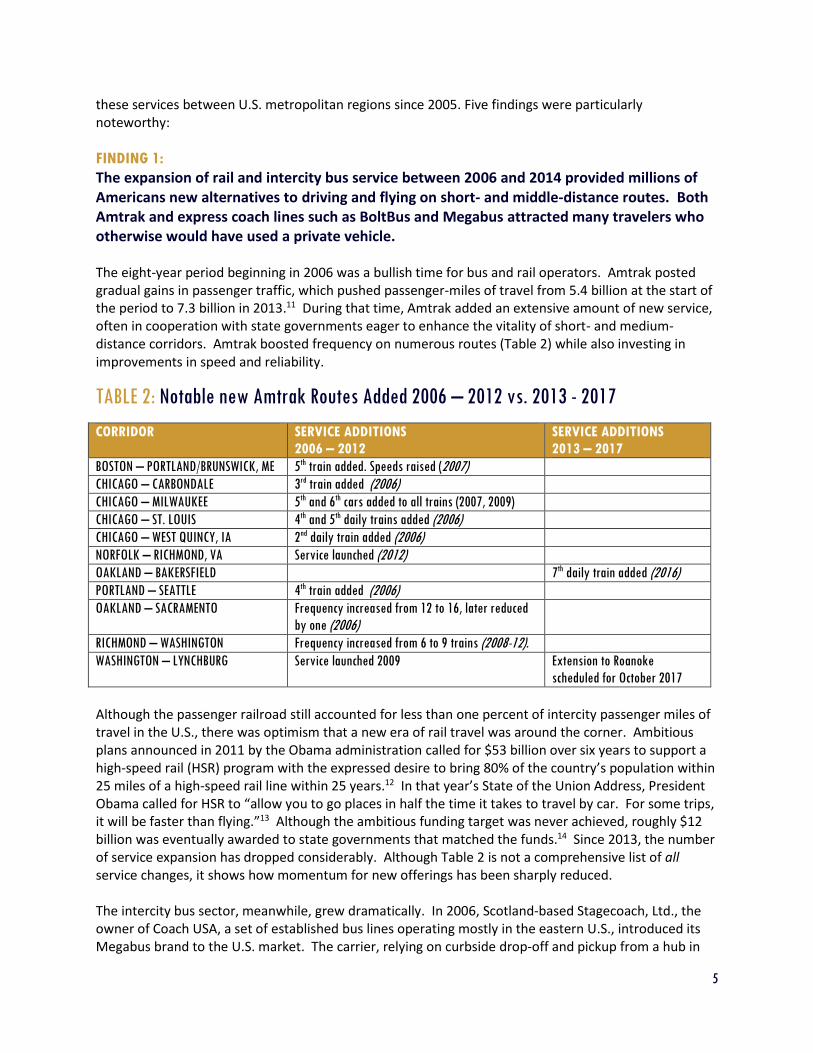
FIGURE 1: Expansion of Express Coach Lines in U.S. Market Approximate Service Range and Year Regional Service Started
7
Chicago, offered travel times that were comparable to Amtrak, albeit with fewer intermediate stops on most routes, thus leaving many smaller points unserved.15 Passenger travel on Greyhound Lines also firmed up, ending a difficult period of retrenchment that ended service to many smaller communities. In early 2009, the company was purchased by another U.K. company, London-based First Group. Later that year, Greyhound created its own curbside express carrier, BoltBus, with a hub in New York. FirstGroup also shored up Greyhound’s image by buying new buses and launching the Greyhound Express service in 2009. This new offering featured limited-stop service with guaranteed seating, and later on, Wi-Fi. Unlike BoltBus and Megabus, however, it used conventional stations rather than emphasizing curbside service.16 Buoyed by these and other investments, the intercity bus industry enjoyed its greatest expansion in decades. Amid a sustained push to gain a foothold in new markets, Megabus established its own New York hub, going head to head against BoltBus, and added additional hubs in Philadelphia (2009) and Washington, DC (2010). Megabus launched hubs in Atlanta and Pittsburgh in 2011 before spreading its reach to California, Florida, and Texas between 2012 and 2014 (Figure 1). 17 BoltBus also grew, albeit more cautiously, adding Pacific Northwest service in 2011 and California and Nevada routes in 2013. Many smaller carriers, such as DC2NY (later rebranded as BestBus) and Vamoose, joined the fray, operating side-by-side with corporate powerhouses Megabus, Boltbus and Greyhound Express in the NEC. Definitive estimates of the amount of traffic on intercity buses are not available due to the lack of comprehensive federal reporting requirements for motor coach travel. Research by the Chaddick Institute data team suggests that ridership on express coach carriers grew from approximately 2.3 million in 2008, to 4.7 million in 2010, to 11.6 million in 2015, with most trips less than 400 miles.18 The growth of express coach lines far outpaced the growth of air travel, Amtrak, and automobile travel between major metropolitan areas. Cumulatively, traffic on all types of scheduled intercity bus services, including conventional lines such as Greyhound, grew from an estimated 46.0 million to 61.6 million passenger trips over this period.
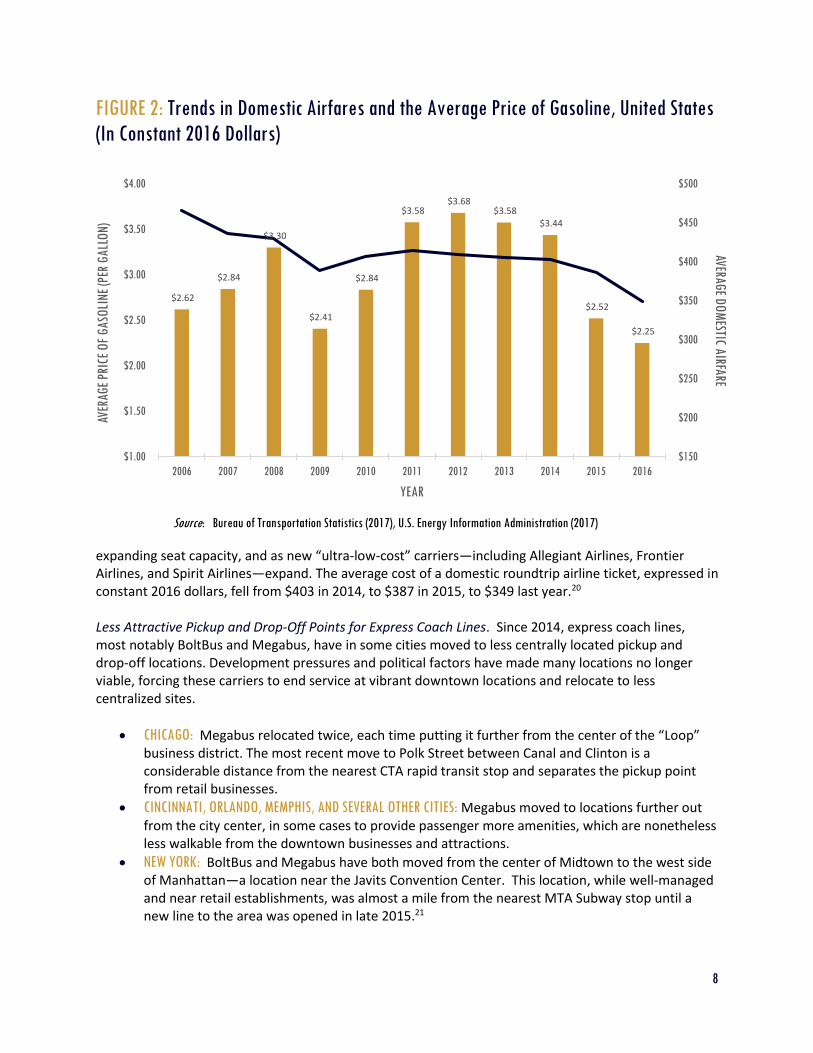
FINDING 2: Several factors, most notably the sharp decline in the price of gasoline, has weakened the demand for bus and rail service since 2014. The heightened airline competition and relocation of pickup points by express coach lines to less-desirable spots also appear to have taken their toll on traffic levels. A confluence of factors reduced the demand for bus and rail service after 2014: Falling Fuel Prices. The average price of gasoline in the U.S. plummeted starting in late 2014, making it much less costly for people to drive. The average price fell from more than $3.50 per gallon to around $2.50 in 2015, and to just $2.25 in 2016 (Figure 2).19 Since then, prices have inched still lower. Such declines have lowered the variable costs of automobile travel far more than bus and train travel, which tend to be affected less by fuel costs than by flying or driving. Heightened Competition from Airlines. The cost of air travel is falling as carriers grow more bullish about
8
FIGURE 2: Trends in Domestic Airfares and the Average Price of Gasoline, United States
(In Constant 2016 Dollars) Source: Bureau of Transportation Statistics (2017), U.S. Energy Information Administration (2017)
expanding seat capacity, and as new “ultra-low-cost” carriers—including Allegiant Airlines, Frontier Airlines, and Spirit Airlines—expand. The average cost of a domestic roundtrip airline ticket, expressed in constant 2016 dollars, fell from $403 in 2014, to $387 in 2015, to $349 last year.20 Less Attractive Pickup and Drop-Off Points for Express Coach Lines. Since 2014, express coach lines, most notably BoltBus and Megabus, have in some cities moved to less centrally located pickup and drop-off locations. Development pressures and political factors have made many locations no longer viable, forcing these carriers to end service at vibrant downtown locations and relocate to less centralized sites.
CHICAGO: Megabus relocated twice, each time putting it further from the center of the “Loop” business district. The most recent move to Polk Street between Canal and Clinton is a considerable distance from the nearest CTA rapid transit stop and separates the pickup point from retail businesses.
CINCINNATI, ORLANDO, MEMPHIS, AND SEVERAL OTHER CITIES: Megabus moved to locations further out from the city center, in some cases to provide passenger more amenities, which are nonetheless less walkable from the downtown businesses and attractions.
NEW YORK: BoltBus and Megabus have both moved from the center of Midtown to the west side of Manhattan—a location near the Javits Convention Center. This location, while well-managed and near retail establishments, was almost a mile from the nearest MTA Subway stop until a new line to the area was opened in late 2015.21
$2.62
$2.84
$3.30
$2.41
$2.84
$3.58 $3.68
$3.58 $3.44
$2.52
$2.25
$150
$200
$250
$300
$350
$400
$450
$500
$1.00
$1.50
$2.00
$2.50
$3.00
$3.50
$4.00
2006 2007 2008 2009 2010 2011 2012 2013 2014 2015 2016
AVERAGE DOM
ESTIC AIRFARE
AVER
AGE
PRIC
E O
F GA
SOLI
NE (P
ER G
ALL
ON
)
YEAR
9
These moves, in addition to reducing convenience, may have lessened customer awareness of the availability of express coach service. Other factors may also be at play.22
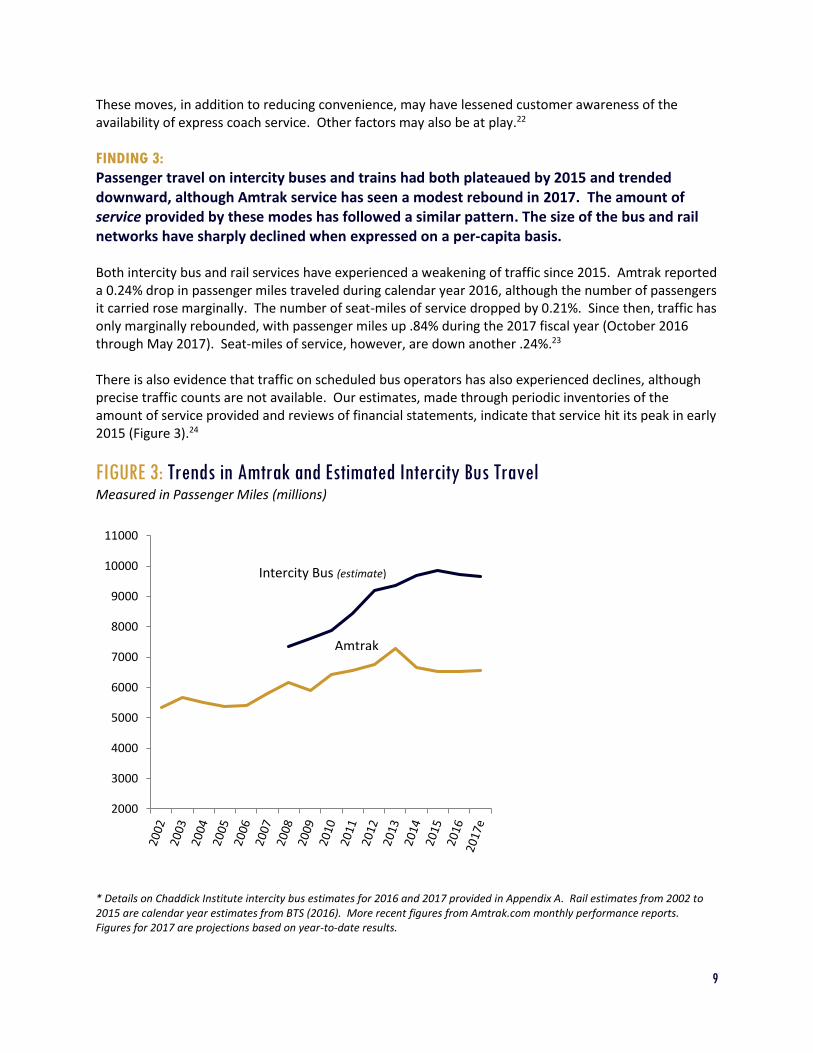
FINDING 3: Passenger travel on intercity buses and trains had both plateaued by 2015 and trended downward, although Amtrak service has seen a modest rebound in 2017. The amount of service provided by these modes has followed a similar pattern. The size of the bus and rail networks have sharply declined when expressed on a per-capita basis. Both intercity bus and rail services have experienced a weakening of traffic since 2015. Amtrak reported a 0.24% drop in passenger miles traveled during calendar year 2016, although the number of passengers it carried rose marginally. The number of seat-miles of service dropped by 0.21%. Since then, traffic has only marginally rebounded, with passenger miles up .84% during the 2017 fiscal year (October 2016 through May 2017). Seat-miles of service, however, are down another .24%.23 There is also evidence that traffic on scheduled bus operators has also experienced declines, although precise traffic counts are not available. Our estimates, made through periodic inventories of the amount of service provided and reviews of financial statements, indicate that service hit its peak in early 2015 (Figure 3).24
FIGURE 3: Trends in Amtrak and Estimated Intercity Bus Travel Measured in Passenger Miles (millions)
* Details on Chaddick Institute intercity bus estimates for 2016 and 2017 provided in Appendix A. Rail estimates from 2002 to 2015 are calendar year estimates from BTS (2016). More recent figures from Amtrak.com monthly performance reports. Figures for 2017 are projections based on year-to-date results.
2000
3000
4000
5000
6000
7000
8000
9000
10000
11000
Amtrak
Intercity Bus (estimate)
10
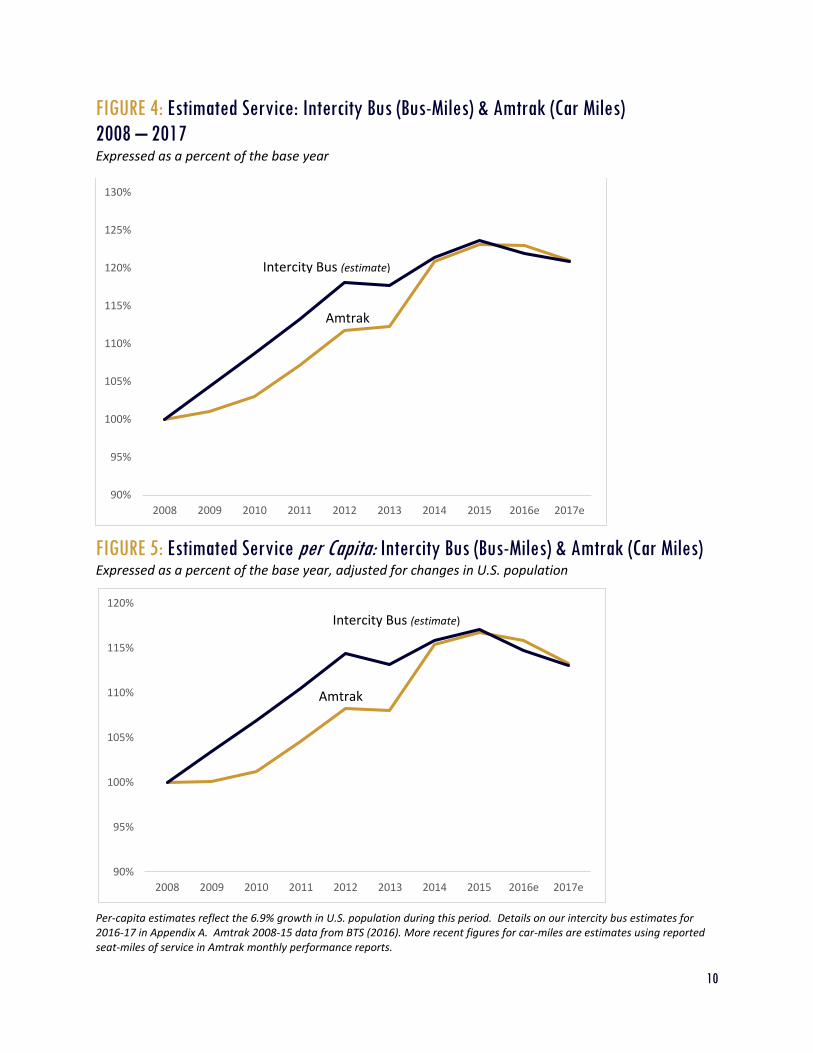
FIGURE 4: Estimated Service: Intercity Bus (Bus-Miles) & Amtrak (Car Miles)
2008 – 2017 Expressed as a percent of the base year
FIGURE 5: Estimated Service per Capita: Intercity Bus (Bus-Miles) & Amtrak (Car Miles) Expressed as a percent of the base year, adjusted for changes in U.S. population
Per-capita estimates reflect the 6.9% growth in U.S. population during this period. Details on our intercity bus estimates for 2016-17 in Appendix A. Amtrak 2008-15 data from BTS (2016). More recent figures for car-miles are estimates using reported seat-miles of service in Amtrak monthly performance reports.
90%
95%
100%
105%
110%
115%
120%
125%
130%
2008 2009 2010 2011 2012 2013 2014 2015 2016e 2017e
90%
95%
100%
105%
110%
115%
120%
2008 2009 2010 2011 2012 2013 2014 2015 2016e 2017e
Intercity Bus (estimate)
Intercity Bus (estimate)
Amtrak
Amtrak
11
Results published by FirstGroup, converted from pounds sterling to U.S. dollars, indicate that its subsidiary, Greyhound Lines (which operates BoltBus), had about a 4% drop in revenues during its 2016 fiscal year (which ended in April 2016). Scotland-based Stagecoach Group had about a 4.8% drop in revenue from its North American operations during this fiscal year (which also ended in April 2016). During this period, its Megabus revenues were down much more, by 7.1%. Other schedule services were down just 3%, although greater support from local authorities offset some of the later decline.
More recent numbers show that this downturn has continued. Greyhound revenues were down by 2.4% (measured in U.S. dollars) during its 2017 fiscal year, which ended this April, while Megabus revenues were down 7.8% during its fiscal year. During this period, Megabus withdrew from Columbus, OH, Grand Rapids and Lansing, MI, and Kansas City, MO.
Exactly how much traffic has dropped remains a matter of speculation. Much of the revenue decline appears to be due to falling fares. Our analysis of the financial results from the above companies as well as an evaluation of newly collected schedule information, summarized in Appendix A, led us to conclude that intercity bus traffic is down much less on short-haul routes (dominated by conventional bus lines) than longer-haul routes (heavily served by express coach lines). We estimate, conservatively, based on reviews of financial results and analysis of service changes, that intercity bus traffic nationally dropped by approximately 1.3% in 2016 and another 0.8% in the first half of 2017.25
As a result, the amount of bus and rail service supplied has fallen slightly in absolute terms since 2015, but has dropped considerably when expressed on a per-capita basis, owing to the fact the U.S. has had an estimated 6.9% increase in population over the period. (As noted in Appendix A, estimates for changes in car-miles of rail service for 2016 and 2017 are extrapolations based on our analysis changes in the numbers seat-miles of service reported in official Amtrak documents). The amount of service provided (measured in estimated car-miles for Amtrak and bus-miles for intercity bus lines) per capita has fallen sharply for both modes, although both remain well above levels from 2008.
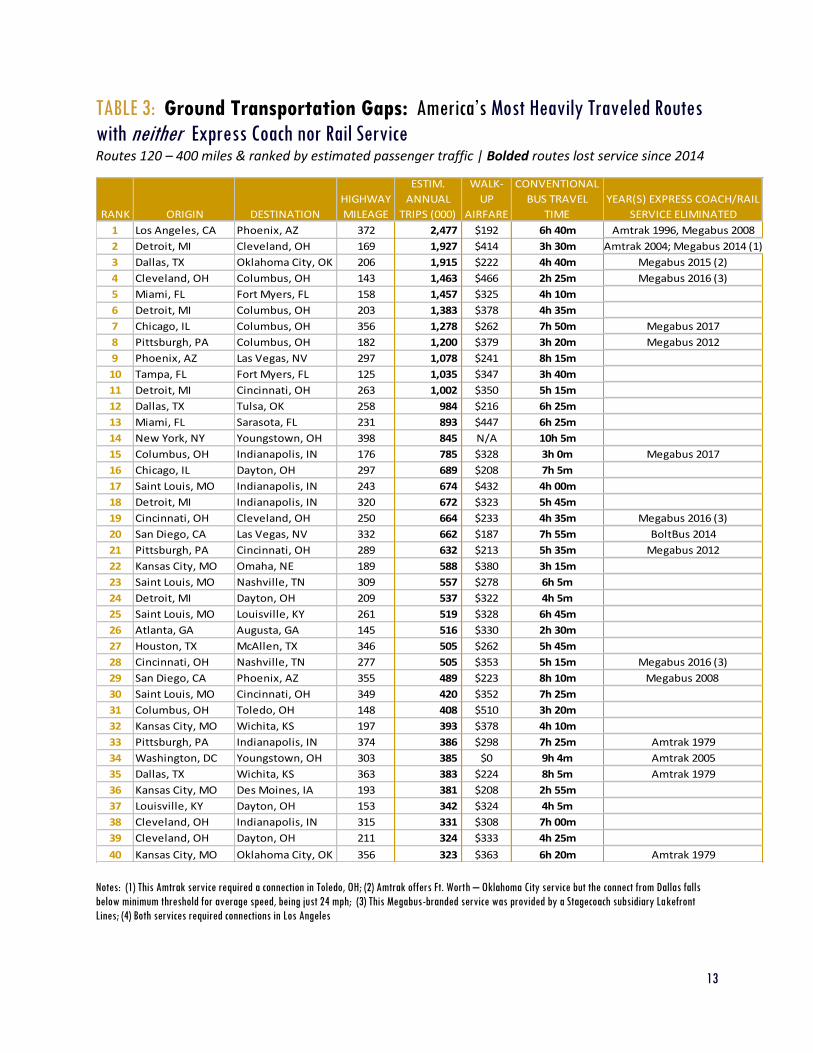
FINDING 4: Twenty-eight routes without viable rail or express coach service have annual traffic estimated to exceed a half million passengers/year. Eight of these “Ground Transportation Gaps” have lost their middle-mode service since 2013, with Los Angeles – Phoenix easily being the most heavily traveled route without a middle mode.
The study team used the typology of transportation modes discussed above to measure the availability of four types of services linking large cities (defined as metropolitan areas with populations of one million or more) to large and mid-size cities (defined as have metropolitan populations of 500,000 or more). In other words, the analysis considered all routes linking major metropolitan regions with at least one million residents to ones at least half of this size. The study team also developed a statistical model to estimate the annual traffic between cities, which is discussed in greater detail in Appendix B, and used populations based on 2016 U.S. Census estimates.
The analysis included express coach and train services that involve transfer, so long as the total elapsed travel time met a minimum standard. Services that involved multiple stops or transfers that reduced the average speed to less than 25 mph were excluded because they would not be considered viable by most travelers. Connections involving Amtrak trains and Amtrak Thruway buses were included unless they involved transfers between 11:30 p.m. - 6 a.m., which were deemed to be of insufficient quality to be
12
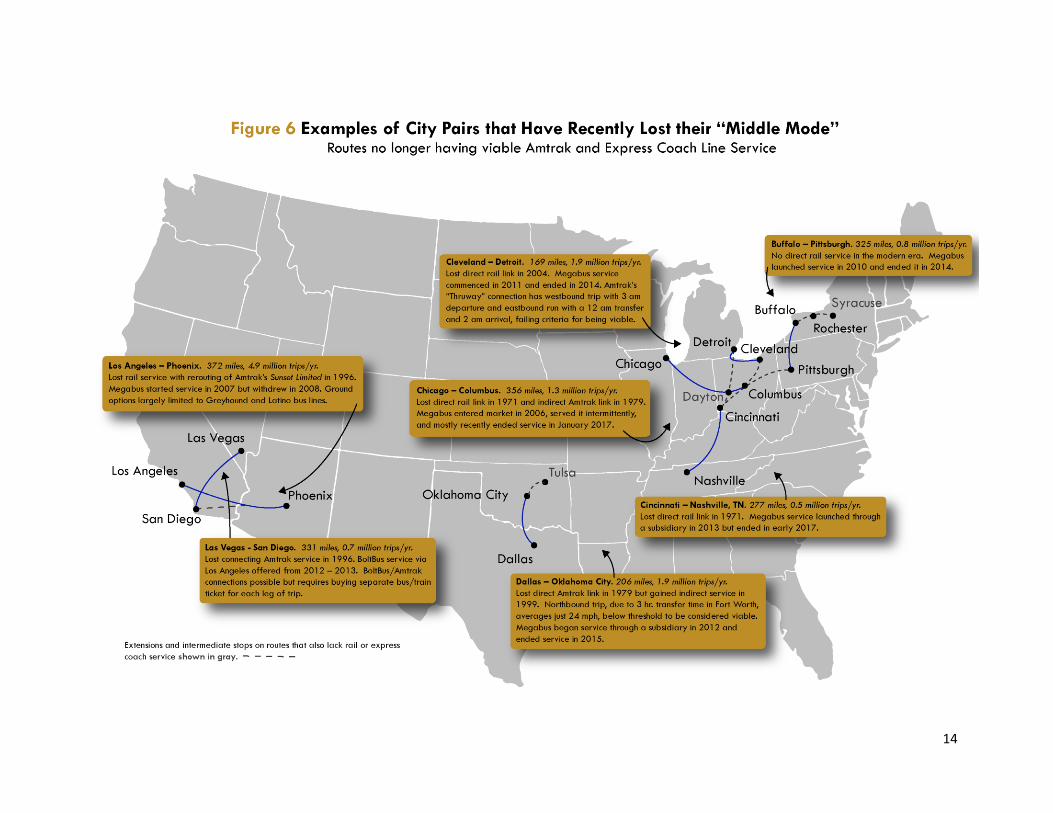
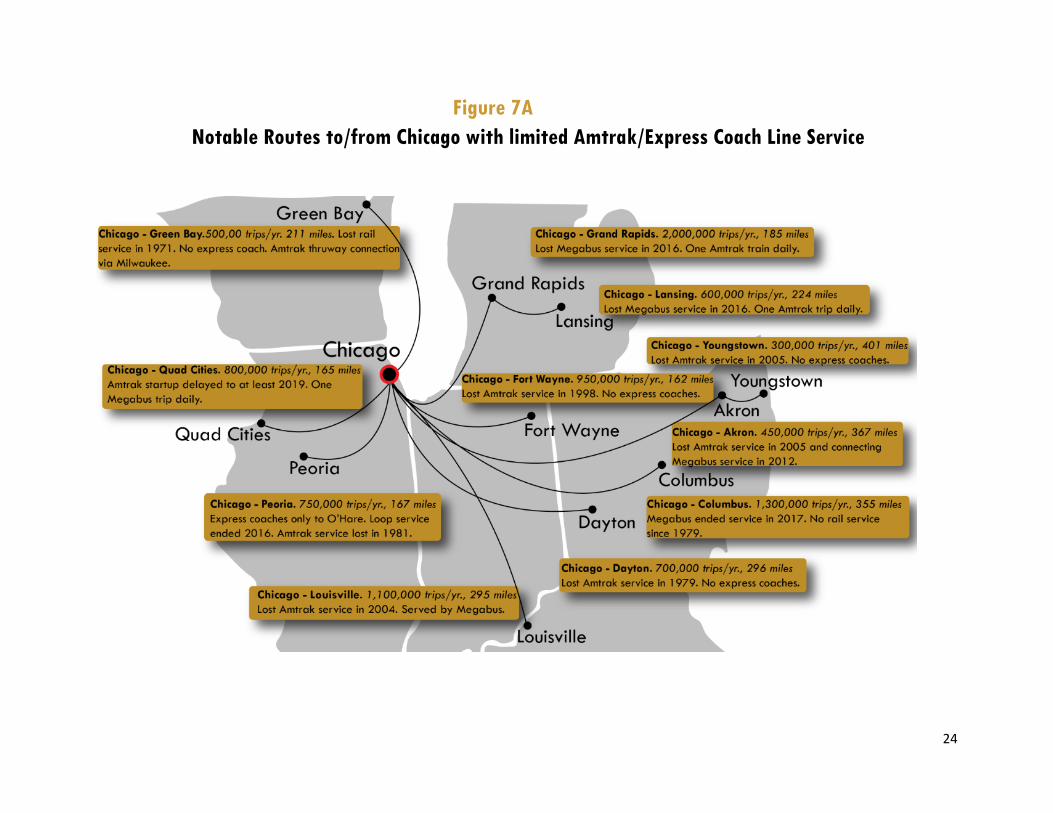
viable to most. Trips that involved traveling overnight on a bus or train, including those with middle-of-the-night originating times and arrival times are included. More details of the criteria used are discussed in Appendix C. The analysis identified 152 routes in the 120 - 400 mile range linking metropolitan regions with populations of more than one million that lack a viable “middle mode” in August 2017. This represents about one-fifth of all routes in this mileage range. The most heavily traveled routes are Los Angeles – Phoenix (estimated to have 2.5 million trips annually); Cleveland – Detroit (1.9 million); Dallas to Oklahoma City (1.9 million); Cleveland – Columbus, OH (1.5 million); Miami – Ft. Myers (1.5 million); and Detroit – Columbus (1.4 million) (Table 3). Recent service cuts by express coach lines are responsible for some of these “Ground Transportation Gaps.” Of the 50 most heavily traveled routes without a middle mode, seven of those routes (Chicago – Columbus, Cincinnati – Nashville, Cleveland – Columbus, Cincinnati – Cleveland, Dallas – Oklahoma City, Detroit – Cleveland, Columbus – Indianapolis, and San Diego – Las Vegas) have lost service since 2014 (all shown in bold on Table 3). Thirteen have lost service since 2005. Except for the Las Vegas – San Diego route, previously served by BoltBus, the most recent middle-mode carrier withdrawing from these routes was Megabus, although Amtrak pulled out of several routes earlier. A summary of the service history on several notable routes appears in Figure 6. Our estimates of traffic volume should be regarded as a relatively rudimentary estimate because it is based on only a few variables. Nevertheless, several of these corridors rank among the largest in the United States in mileage range considered, according to a Federal Highway Administration data set. This data set indicates that Los Angeles – Phoenix is among the 25 most heavily traveled routes in the 120 – 400 mile range, while several others rank in the top 100.26 Even consumers traveling to and from major markets such as Chicago face the prospect of diminished ground transportation options, as is evident in the map on Page 23 in Appendix. Travelers in these Ground Transportation Gaps unwilling to take Greyhound or another legacy line will find it highly difficult to avoid driving on these routes, particularly if they cannot meet advance-purchase airfare conditions. Although air service is available in all but two of the routes on Table 3, “walk-up” airfares are more than $200 on all but four of the routes, and more than $300 on most, with several topping $400.
13
TABLE 3: Ground Transportation Gaps: America’s Most Heavily Traveled Routes
with neither Express Coach nor Rail Service Routes 120 – 400 miles & ranked by estimated passenger traffic | Bolded routes lost service since 2014
RANK ORIGIN DESTINATION
HIGHWAY
MILEAGE
ESTIM.
ANNUAL
TRIPS (000)
WALK-
UP
AIRFARE
CONVENTIONAL
BUS TRAVEL
TIME
YEAR(S) EXPRESS COACH/RAIL
SERVICE ELIMINATED
1 Los Angeles, CA Phoenix, AZ 372 2,477 $192 6h 40m Amtrak 1996, Megabus 2008
2 Detroit, MI Cleveland, OH 169 1,927 $414 3h 30m Amtrak 2004; Megabus 2014 (1)
3 Dallas, TX Oklahoma City, OK 206 1,915 $222 4h 40m Megabus 2015 (2)
4 Cleveland, OH Columbus, OH 143 1,463 $466 2h 25m Megabus 2016 (3)
5 Miami, FL Fort Myers, FL 158 1,457 $325 4h 10m
6 Detroit, MI Columbus, OH 203 1,383 $378 4h 35m
7 Chicago, IL Columbus, OH 356 1,278 $262 7h 50m Megabus 2017
8 Pittsburgh, PA Columbus, OH 182 1,200 $379 3h 20m Megabus 2012
9 Phoenix, AZ Las Vegas, NV 297 1,078 $241 8h 15m
10 Tampa, FL Fort Myers, FL 125 1,035 $347 3h 40m
11 Detroit, MI Cincinnati, OH 263 1,002 $350 5h 15m
12 Dallas, TX Tulsa, OK 258 984 $216 6h 25m
13 Miami, FL Sarasota, FL 231 893 $447 6h 25m
14 New York, NY Youngstown, OH 398 845 N/A 10h 5m
15 Columbus, OH Indianapolis, IN 176 785 $328 3h 0m Megabus 2017
16 Chicago, IL Dayton, OH 297 689 $208 7h 5m
17 Saint Louis, MO Indianapolis, IN 243 674 $432 4h 00m
18 Detroit, MI Indianapolis, IN 320 672 $323 5h 45m
19 Cincinnati, OH Cleveland, OH 250 664 $233 4h 35m Megabus 2016 (3)
20 San Diego, CA Las Vegas, NV 332 662 $187 7h 55m BoltBus 2014
21 Pittsburgh, PA Cincinnati, OH 289 632 $213 5h 35m Megabus 2012
22 Kansas City, MO Omaha, NE 189 588 $380 3h 15m
23 Saint Louis, MO Nashville, TN 309 557 $278 6h 5m
24 Detroit, MI Dayton, OH 209 537 $322 4h 5m
25 Saint Louis, MO Louisville, KY 261 519 $328 6h 45m
26 Atlanta, GA Augusta, GA 145 516 $330 2h 30m
27 Houston, TX McAllen, TX 346 505 $262 5h 45m
28 Cincinnati, OH Nashville, TN 277 505 $353 5h 15m Megabus 2016 (3)
29 San Diego, CA Phoenix, AZ 355 489 $223 8h 10m Megabus 2008
30 Saint Louis, MO Cincinnati, OH 349 420 $352 7h 25m
31 Columbus, OH Toledo, OH 148 408 $510 3h 20m
32 Kansas City, MO Wichita, KS 197 393 $378 4h 10m
33 Pittsburgh, PA Indianapolis, IN 374 386 $298 7h 25m Amtrak 1979
34 Washington, DC Youngstown, OH 303 385 $0 9h 4m Amtrak 2005
35 Dallas, TX Wichita, KS 363 383 $224 8h 5m Amtrak 1979
36 Kansas City, MO Des Moines, IA 193 381 $208 2h 55m
37 Louisville, KY Dayton, OH 153 342 $324 4h 5m
38 Cleveland, OH Indianapolis, IN 315 331 $308 7h 00m
39 Cleveland, OH Dayton, OH 211 324 $333 4h 25m
40 Kansas City, MO Oklahoma City, OK 356 323 $363 6h 20m Amtrak 1979
Notes: (1) This Amtrak service required a connection in Toledo, OH; (2) Amtrak offers Ft. Worth – Oklahoma City service but the connect from Dallas falls
below minimum threshold for average speed, being just 24 mph; (3) This Megabus-branded service was provided by a Stagecoach subsidiary Lakefront
Lines; (4) Both services required connections in Los Angeles
14
15
To appreciate why these fares are unaffordable to many, consider the Cleveland – Detroit route as an example. A family of three that is unable to meet a seven-day advance purchase requirement can expect to pay more than $2,400 to fly roundtrip. Even when buying two weeks ahead, the cost will generally be more than $1,000. When express coach service was available, the cost was likely around $120 - $180 (or less) when with a booking two weeks ahead.
FINDING 5: Between 2006 and late 2014, new services added by Amtrak and express coach lines more than offset any cutbacks in service that occurred. Since then, however, no new services have filled the gaps identified by our study, resulting in net reduction in access to middle modes between large and mid-size cities. The rapid expansion of express coach service between 2006 and 2014 resulted in a sharp net gain in available service. Since then, however, no new service has emerged to fill any Ground Transportation Gaps we identified as having existed in 2014.
Express coach lines have made targeted expansions. New frequencies have been added in the NEC and small communities. Megabus added service to major cities in Florida (in 2015 and 2017), eastern Virginia (2016), and several other areas. These new routes, however, are primarily in corridors already served by Amtrak, and none filled “gaps” based on the population/distance criteria used in this study. (The analysis, as previously noted, considered only routes linking metropolitan areas with at least one million residents to those with populations of at least one-half million.) Several hoped-for expansions by Amtrak that could have filled Ground Transportation Gaps have failed to materialize. Amtrak has dropped plans to launch a Cincinnati – Cleveland via Columbus route, which was slated to be part of the federal HSR program. Plans to extend Amtrak’s Fort Worth – Oklahoma City train to Tulsa and Kansas City also have not yet moved forward, and no new segments of HSR at speeds above 110 mph are slated for service within the next two years. In short, if fuel prices remain low, it appears more likely that the number of Ground Transportation Gaps will grow rather than diminish.
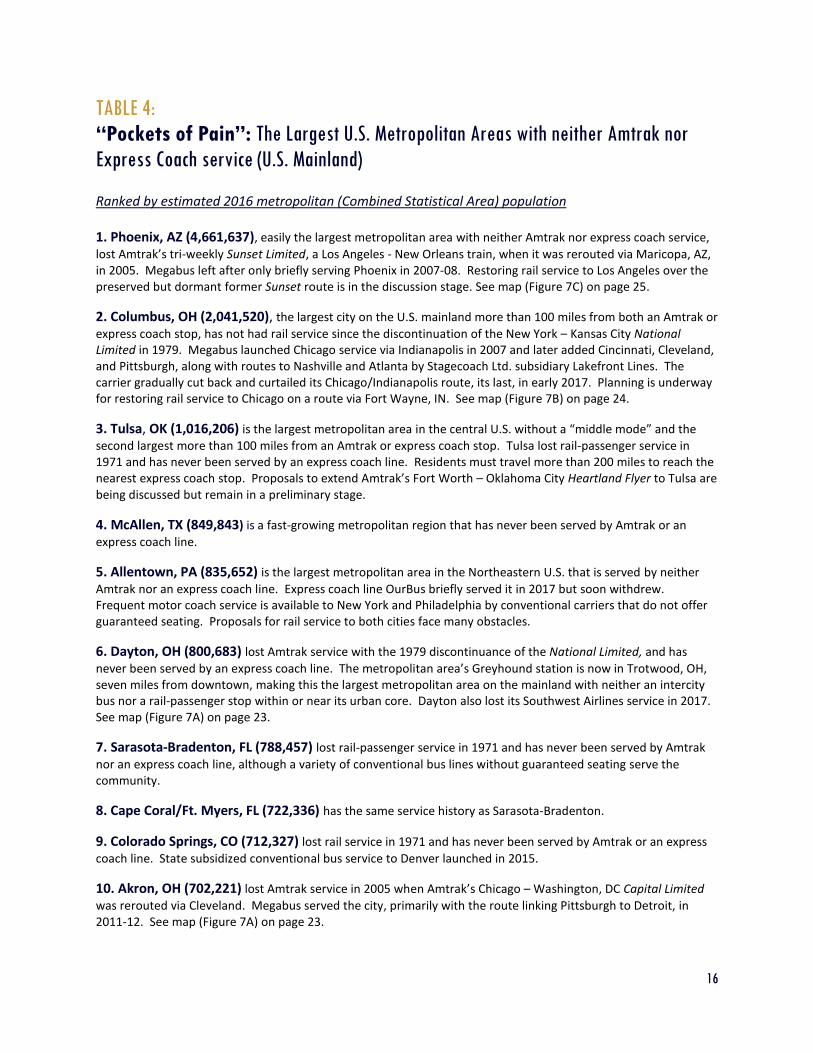
FINDING 6: Nine metropolitan areas with populations of more than 700,000 stand out for having neither service by Amtrak nor express coach lines to any destination. In these so called “Pockets of Pain,” an overwhelming share of population likely never contemplates anything but driving or flying on intercity trips to and from their home region.
Despite the expansion of the rail and express coach network, many cities remain without either of these modes. As a result, travelers who, rightly or wrongly, are unwilling to take Greyhound or another conventional bus line (which, as noted earlier, accounts for an appreciable share of the population, particularly outside of the Northeast Corridor), may regard themselves as having no viable options besides driving or flying, if their budget allows it on longer trips (Table 4). Of course, for those without automobiles, mobility may be impaired. Phoenix, AZ, Columbus, OH, and Tulsa, OK, are easily the largest, having metropolitan populations of more than one million. (Please refer to pages 24-25 for maps depicting notable routes to and from Columbus and Phoenix lacking service). Other notable metropolitan areas that have less-than-daily
16
TABLE 4:
“Pockets of Pain”: The Largest U.S. Metropolitan Areas with neither Amtrak nor
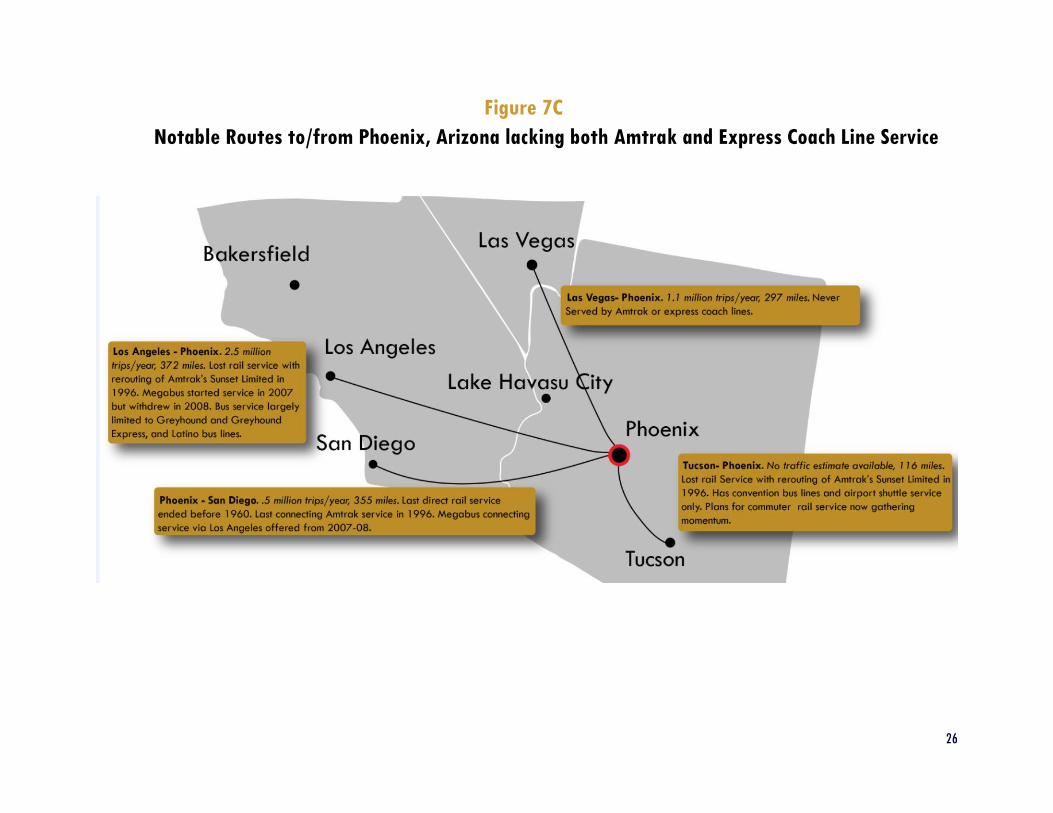
Express Coach service (U.S. Mainland) Ranked by estimated 2016 metropolitan (Combined Statistical Area) population 1. Phoenix, AZ (4,661,637), easily the largest metropolitan area with neither Amtrak nor express coach service,
lost Amtrak’s tri-weekly Sunset Limited, a Los Angeles - New Orleans train, when it was rerouted via Maricopa, AZ, in 2005. Megabus left after only briefly serving Phoenix in 2007-08. Restoring rail service to Los Angeles over the preserved but dormant former Sunset route is in the discussion stage. See map (Figure 7C) on page 25.
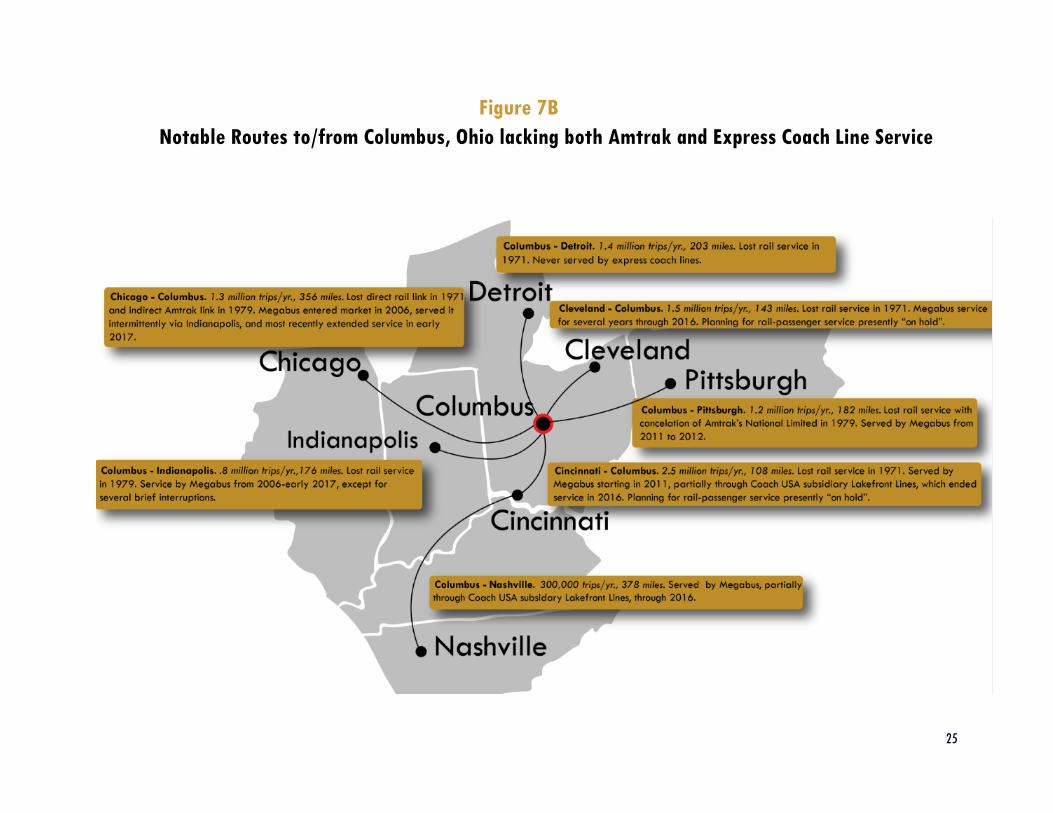
2. Columbus, OH (2,041,520), the largest city on the U.S. mainland more than 100 miles from both an Amtrak or
express coach stop, has not had rail service since the discontinuation of the New York – Kansas City National Limited in 1979. Megabus launched Chicago service via Indianapolis in 2007 and later added Cincinnati, Cleveland, and Pittsburgh, along with routes to Nashville and Atlanta by Stagecoach Ltd. subsidiary Lakefront Lines. The carrier gradually cut back and curtailed its Chicago/Indianapolis route, its last, in early 2017. Planning is underway for restoring rail service to Chicago on a route via Fort Wayne, IN. See map (Figure 7B) on page 24.
3. Tulsa, OK (1,016,206) is the largest metropolitan area in the central U.S. without a “middle mode” and the
second largest more than 100 miles from an Amtrak or express coach stop. Tulsa lost rail-passenger service in 1971 and has never been served by an express coach line. Residents must travel more than 200 miles to reach the nearest express coach stop. Proposals to extend Amtrak’s Fort Worth – Oklahoma City Heartland Flyer to Tulsa are being discussed but remain in a preliminary stage.
4. McAllen, TX (849,843) is a fast-growing metropolitan region that has never been served by Amtrak or an
express coach line.
5. Allentown, PA (835,652) is the largest metropolitan area in the Northeastern U.S. that is served by neither
Amtrak nor an express coach line. Express coach line OurBus briefly served it in 2017 but soon withdrew. Frequent motor coach service is available to New York and Philadelphia by conventional carriers that do not offer guaranteed seating. Proposals for rail service to both cities face many obstacles.
6. Dayton, OH (800,683) lost Amtrak service with the 1979 discontinuance of the National Limited, and has
never been served by an express coach line. The metropolitan area’s Greyhound station is now in Trotwood, OH, seven miles from downtown, making this the largest metropolitan area on the mainland with neither an intercity bus nor a rail-passenger stop within or near its urban core. Dayton also lost its Southwest Airlines service in 2017. See map (Figure 7A) on page 23.
7. Sarasota-Bradenton, FL (788,457) lost rail-passenger service in 1971 and has never been served by Amtrak
nor an express coach line, although a variety of conventional bus lines without guaranteed seating serve the community.
8. Cape Coral/Ft. Myers, FL (722,336) has the same service history as Sarasota-Bradenton.
9. Colorado Springs, CO (712,327) lost rail service in 1971 and has never been served by Amtrak or an express
coach line. State subsidized conventional bus service to Denver launched in 2015.
10. Akron, OH (702,221) lost Amtrak service in 2005 when Amtrak’s Chicago – Washington, DC Capital Limited
was rerouted via Cleveland. Megabus served the city, primarily with the route linking Pittsburgh to Detroit, in 2011-12. See map (Figure 7A) on page 23.
17
Amtrak service and no express coach lines include Charleston, WV (217,916) El Paso ,TX (841,971) and Tucson, AZ (population). Denver, CO (2,853,077) and Salt Lake City, UT (1,186,187) see only one Amtrak train in each direction daily, and have no express coach lines, while Kansas City, MO (2,104,509) is the largest metropolitan area that has lost express coach service in the past five years.
CONCLUSIONS AND RECOMMENDATIONS
The expansion of intercity bus and rail service between 2006 and 2014 gave travelers many new alternatives to privately owned vehicles or airline travel on relatively short-distance intercity trips. The interruption of this trend, however, constitutes a step backward in the effort to promote a more balanced transportation system that provides travelers a wide range of options.
Five strategies that can be undertaken without extensive capital investment can help address the shortfalls:
I. Take advantage of the slowdown in route expansion and traffic growth to experiment with new marketing strategies and technological innovation in anticipation of the rebound that appears likely in the next several years.
Without pressure to add a great deal of capacity in the short term, Amtrak, intercity bus lines, and the carriers are able to more freely experiment with strategies to attract new customers than would have been possible under the more frenetic conditions that existed a few years ago. Amtrak and most major bus lines have already taken the positive step of making schedules available as General Transit Feed Specification (GTFS) feeds, which are used in Google Maps and other trip planners, setting an example for smaller bus lines to follow. Rail and bus lines can also leverage the dramatic innovations underway in “shared mobility,” including working with ridesharing and “microtransit” providers to make doorstep-to-doorstep travel on a single ticket more widely available. Such innovations can help foster creative solutions to gaps in service explored in this paper without major capital investment.
Amtrak’s ambitious plans for its major terminals, most notably at Chicago Union Station and New York Penn Station, and its longstanding partnerships with state governments, create opportunities to expand corridor development with an emphasis on intermodal connections. Momentum behind Florida's Brightline rail service suggests that opportunities exist for using prospect real estate development around major stations to attract private capital. Lastly, intercity bus lines can build on past success by rolling out business-class services, dynamic schedules created in response to crowdsourcing apps, and more sophisticated pricing strategies akin to those of airlines.
II. Prioritize public resources and technical support to find or create suitable pickup and drop-off locations for express coach operators.
City and state transportation planners have often been agnostic about the problems facing express coach lines with respect to finding attractive locations from which to pick up and drop off passengers. Such a noncommittal stance posed little risk of service cuts when these carriers were rapidly expanding, but this is no longer the case. More assertive steps are now warranted, including planning initiatives to make local transit facilities available, or finding vacant parcels that could be used for off street pickup
18
and drop-off. Cleveland and Detroit serve as role models for other cities. Both have forged agreements that allow express coach carriers to use well-located city bus facilities with basic amenities for travelers.27
III. Follow the examples of Boston, Denver, Washington, DC, and other cities by creating dedicated
terminals for intercity bus lines that are centrally located and well suited for connections to public
transit services and intercity rail.
Boston, Denver, and Washington have gone a step further than most other cities, creating conveniently located stations that are equipped with waiting rooms and ticket-counter facilities; are connected to their main downtown rail systems; and are used by both conventional and express-coach operators.28 Fees paid by bus lines using these facilities can offset much of the cost. Facilities with the support of public institutions can help alleviate curbside congestion, are visible, and easy to reach. More cities should follow this approach. Boston actually requires bus lines to depart from a geographic zone in the downtown area. Philadelphia is planning to build a facility near its main Amtrak station, but construction is still years away.
IV. Improve the potential to provide connections between trains and buses by pushing for
improvements to Amtrak’s Thruway bus network.
Among the most notable “missed opportunities” for improving short- and middle-distance travel has been the failure to undertake a comprehensive expansion of the Amtrak Thruway network and other bus-rail connecting services. The lost opportunities to build synergy between the country’s bus and train systems appear particularly substantial along the NEC and other routes with significant Amtrak schedule frequency. There has nonetheless recently been some positive momentum in this area:
CALIFORNIA remains the “gold standard” for bus-train integration, focusing primarily on routes that connect with corridor trains to fill in gaps in the system. The faster route from the Los Angeles to San Francisco metropolitan areas, for example, involves train/bus Thruway connections.
MICHIGAN launched a program with Indian Trails bus lines in 2016 to coordinate that carrier’s schedules with Amtrak, which includes bus-train connections that cover missing links in direct train service, such as Detroit – Grand Rapids, MI, and lightly served routes, such as Chicago –Grand Rapids.29
OREGON has six daily Thruway buses to complement its three trains between Eugene and Portland. These buses give travelers a wider choice of pickup points and are timed to provide efficient connections to Amtrak’s Portland – Seattle trains.
Many more opportunities remain untapped. Many of the largest cities without Amtrak or express coach service, such as Columbus and Dayton, OH, and Phoenix, AZ, lack Thruway bus connections. Although regulation prevents Amtrak from selling bus tickets for trips that do not involve train connections, many opportunities exists for greater bus/rail integration, which can allow rail corridors to expand their geographic reach at only a modest cost. The above examples show how strategically placed bus service can give passengers on corridors with limited frequency greater range options.
V. Push federal officials to develop new strategies to manage the multijurisdictional complexities that
prevent coordinated planning between states and regions around the development of intercity rail
corridors.
19
In sharp contrast to planning for travel within metropolitan regions, there are few polices in place to support institutions working to enhance transportation services between metro regions, particularly on routes that require numerous states to work together. This problem is a central theme of the Transportation Research Board’s recently published Interregional Travel: A New Perspective for Policy Making (Special Report 320), which calls for “state-of-the-art analytical tools for planning and prioritizing interregional transportation investments to support effective decisions.”30 Such tools could include programs for coordinated, multi-state planning initiatives for service expansion, eliminating choke points in the rail system that affect large geographic regions, and integrating bus and rail service to maximum advantage. The Northeast Corridor Coalition and the Northern New England Passenger Rail Authority serve as examples of how such multijurisdictional planning can work to enhance service between states. Strengthening federal policies to support the work of such coalitions could help with new corridor development throughout the country, Amtrak’s capital plan for the Midwest, the ambitious CrossRail plan proposed by the Midwest High Speed Rail Association to enhance traffic flow in Chicago, and other initiatives. Similarly, federal officials should make collecting accurate data on intercity traffic levels—including intercity bus traffic—a priority, another recommendation of the TRB report. Such data are needed for effective investment and policymaking—and to give the intercity bus greater visibility in long-range planning initiatives.
20
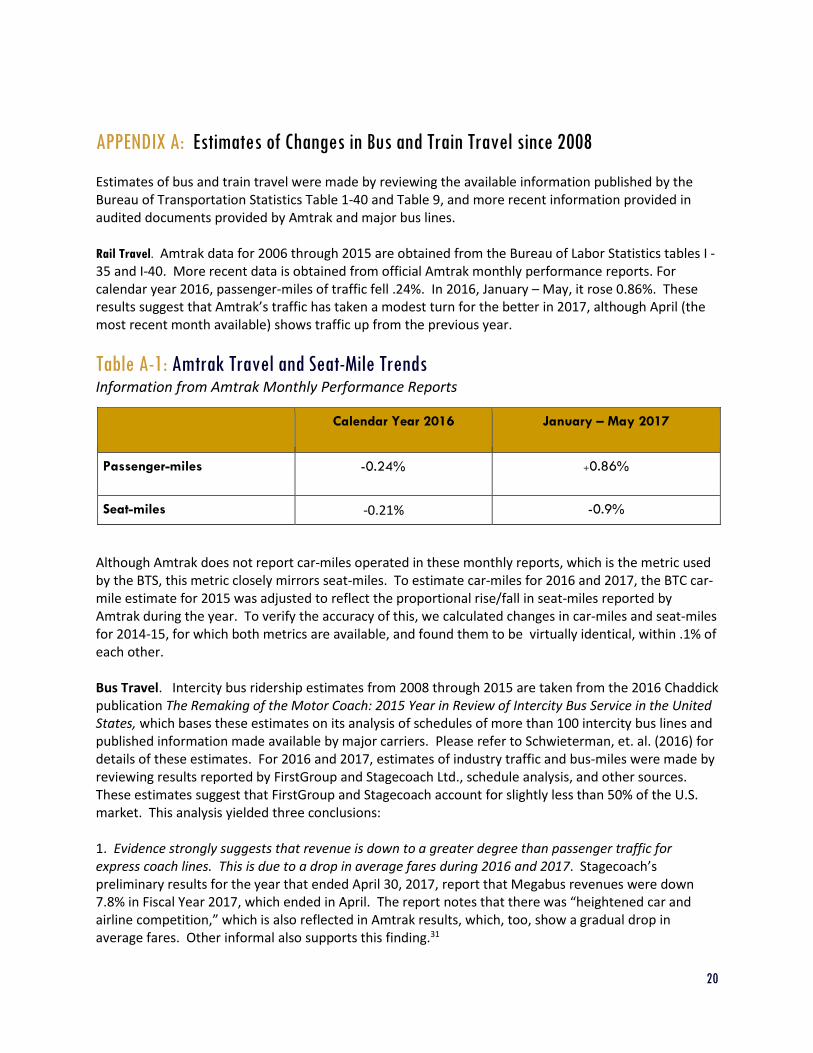
APPENDIX A: Estimates of Changes in Bus and Train Travel since 2008 Estimates of bus and train travel were made by reviewing the available information published by the Bureau of Transportation Statistics Table 1-40 and Table 9, and more recent information provided in audited documents provided by Amtrak and major bus lines. Rail Travel. Amtrak data for 2006 through 2015 are obtained from the Bureau of Labor Statistics tables I -35 and I-40. More recent data is obtained from official Amtrak monthly performance reports. For calendar year 2016, passenger-miles of traffic fell .24%. In 2016, January – May, it rose 0.86%. These results suggest that Amtrak’s traffic has taken a modest turn for the better in 2017, although April (the most recent month available) shows traffic up from the previous year.
Table A-1: Amtrak Travel and Seat-Mile Trends Information from Amtrak Monthly Performance Reports
Calendar Year 2016
January – May 2017
Passenger-miles -0.24% +0.86%
Seat-miles -0.21% -0.9%
Although Amtrak does not report car-miles operated in these monthly reports, which is the metric used by the BTS, this metric closely mirrors seat-miles. To estimate car-miles for 2016 and 2017, the BTC car-mile estimate for 2015 was adjusted to reflect the proportional rise/fall in seat-miles reported by Amtrak during the year. To verify the accuracy of this, we calculated changes in car-miles and seat-miles for 2014-15, for which both metrics are available, and found them to be virtually identical, within .1% of each other. Bus Travel. Intercity bus ridership estimates from 2008 through 2015 are taken from the 2016 Chaddick publication The Remaking of the Motor Coach: 2015 Year in Review of Intercity Bus Service in the United States, which bases these estimates on its analysis of schedules of more than 100 intercity bus lines and published information made available by major carriers. Please refer to Schwieterman, et. al. (2016) for details of these estimates. For 2016 and 2017, estimates of industry traffic and bus-miles were made by reviewing results reported by FirstGroup and Stagecoach Ltd., schedule analysis, and other sources. These estimates suggest that FirstGroup and Stagecoach account for slightly less than 50% of the U.S. market. This analysis yielded three conclusions: 1. Evidence strongly suggests that revenue is down to a greater degree than passenger traffic for express coach lines. This is due to a drop in average fares during 2016 and 2017. Stagecoach’s preliminary results for the year that ended April 30, 2017, report that Megabus revenues were down 7.8% in Fiscal Year 2017, which ended in April. The report notes that there was “heightened car and airline competition,” which is also reflected in Amtrak results, which, too, show a gradual drop in average fares. Other informal also supports this finding.31
21
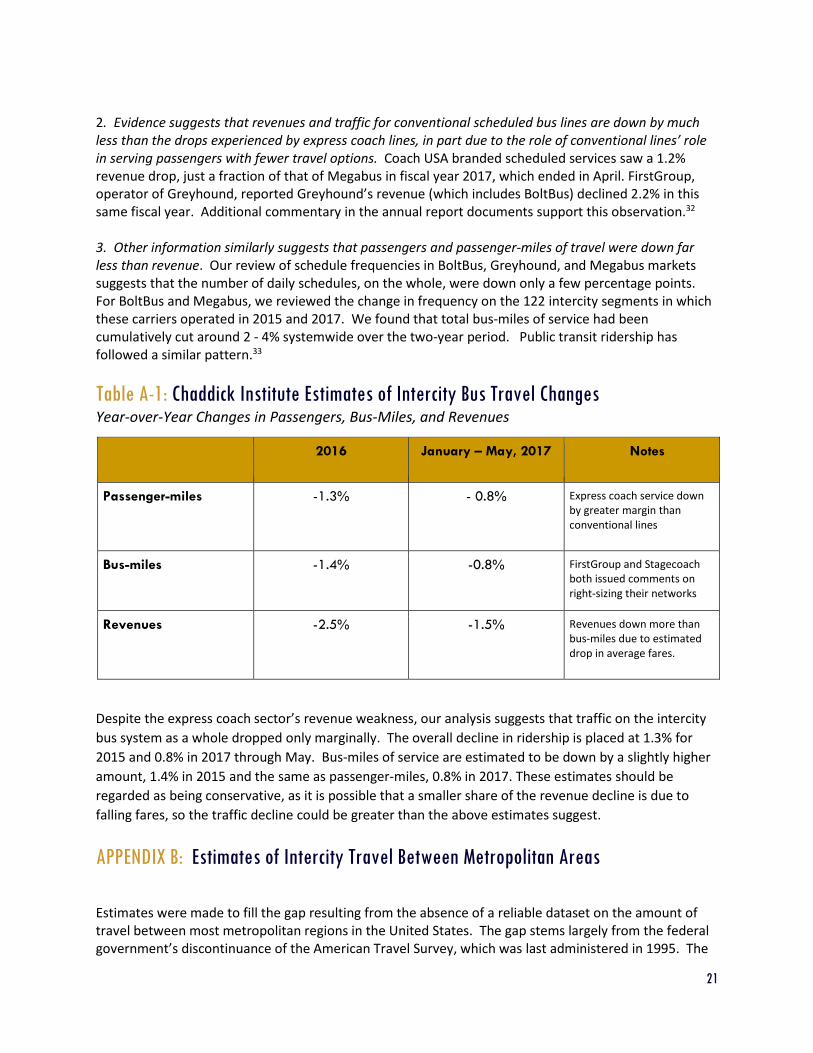
2. Evidence suggests that revenues and traffic for conventional scheduled bus lines are down by much less than the drops experienced by express coach lines, in part due to the role of conventional lines’ role in serving passengers with fewer travel options. Coach USA branded scheduled services saw a 1.2% revenue drop, just a fraction of that of Megabus in fiscal year 2017, which ended in April. FirstGroup, operator of Greyhound, reported Greyhound’s revenue (which includes BoltBus) declined 2.2% in this same fiscal year. Additional commentary in the annual report documents support this observation.32 3. Other information similarly suggests that passengers and passenger-miles of travel were down far less than revenue. Our review of schedule frequencies in BoltBus, Greyhound, and Megabus markets suggests that the number of daily schedules, on the whole, were down only a few percentage points. For BoltBus and Megabus, we reviewed the change in frequency on the 122 intercity segments in which these carriers operated in 2015 and 2017. We found that total bus-miles of service had been cumulatively cut around 2 - 4% systemwide over the two-year period. Public transit ridership has followed a similar pattern.33
Table A-1: Chaddick Institute Estimates of Intercity Bus Travel Changes Year-over-Year Changes in Passengers, Bus-Miles, and Revenues
2016 January – May, 2017 Notes
Passenger-miles -1.3% - 0.8% Express coach service down by greater margin than conventional lines
Bus-miles -1.4% -0.8% FirstGroup and Stagecoach both issued comments on right-sizing their networks
Revenues -2.5% -1.5% Revenues down more than bus-miles due to estimated drop in average fares.
Despite the express coach sector’s revenue weakness, our analysis suggests that traffic on the intercity
bus system as a whole dropped only marginally. The overall decline in ridership is placed at 1.3% for
2015 and 0.8% in 2017 through May. Bus-miles of service are estimated to be down by a slightly higher
amount, 1.4% in 2015 and the same as passenger-miles, 0.8% in 2017. These estimates should be
regarded as being conservative, as it is possible that a smaller share of the revenue decline is due to
falling fares, so the traffic decline could be greater than the above estimates suggest.
APPENDIX B: Estimates of Intercity Travel Between Metropolitan Areas
Estimates were made to fill the gap resulting from the absence of a reliable dataset on the amount of travel between most metropolitan regions in the United States. The gap stems largely from the federal government’s discontinuance of the American Travel Survey, which was last administered in 1995. The
22
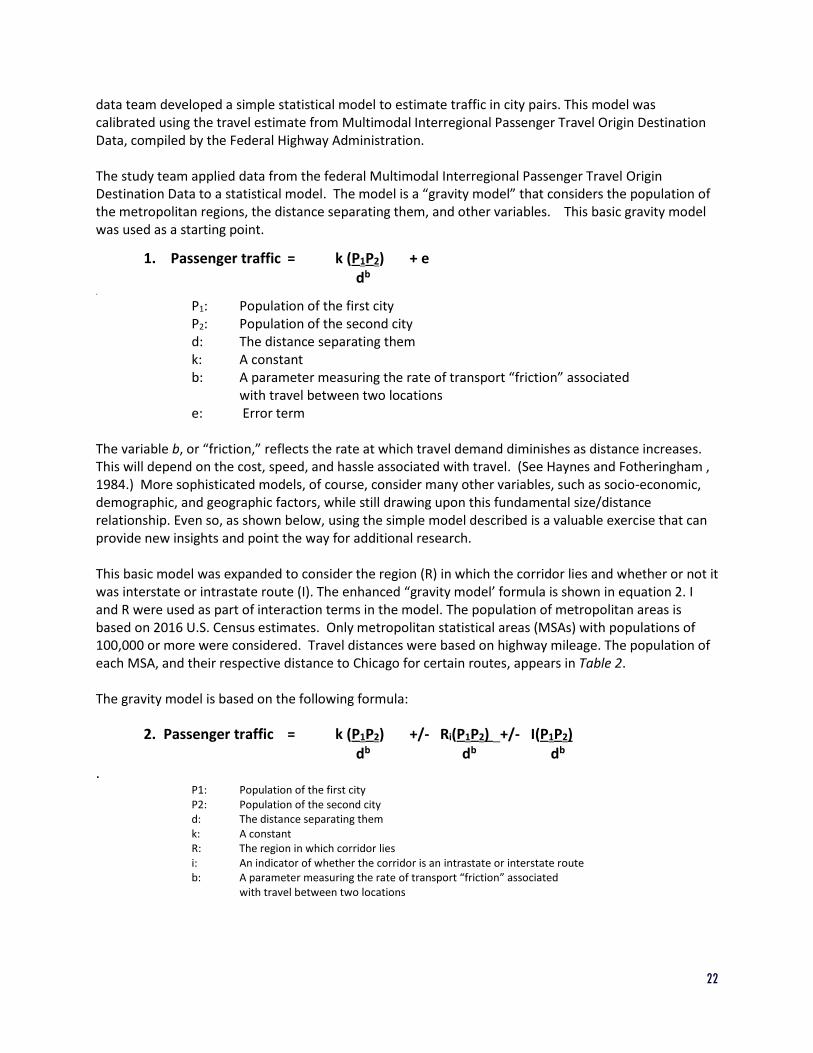
data team developed a simple statistical model to estimate traffic in city pairs. This model was calibrated using the travel estimate from Multimodal Interregional Passenger Travel Origin Destination Data, compiled by the Federal Highway Administration. The study team applied data from the federal Multimodal Interregional Passenger Travel Origin Destination Data to a statistical model. The model is a “gravity model” that considers the population of the metropolitan regions, the distance separating them, and other variables. This basic gravity model was used as a starting point.
1. Passenger traffic = k (P1P2) + e db .
P1: Population of the first city P2: Population of the second city d: The distance separating them k: A constant b: A parameter measuring the rate of transport “friction” associated with travel between two locations e: Error term
The variable b, or “friction,” reflects the rate at which travel demand diminishes as distance increases. This will depend on the cost, speed, and hassle associated with travel. (See Haynes and Fotheringham , 1984.) More sophisticated models, of course, consider many other variables, such as socio-economic, demographic, and geographic factors, while still drawing upon this fundamental size/distance relationship. Even so, as shown below, using the simple model described is a valuable exercise that can provide new insights and point the way for additional research. This basic model was expanded to consider the region (R) in which the corridor lies and whether or not it was interstate or intrastate route (I). The enhanced “gravity model’ formula is shown in equation 2. I and R were used as part of interaction terms in the model. The population of metropolitan areas is based on 2016 U.S. Census estimates. Only metropolitan statistical areas (MSAs) with populations of 100,000 or more were considered. Travel distances were based on highway mileage. The population of each MSA, and their respective distance to Chicago for certain routes, appears in Table 2. The gravity model is based on the following formula:
2. Passenger traffic = k (P1P2) +/- Ri(P1P2) +/- I(P1P2) db db db . P1: Population of the first city
P2: Population of the second city d: The distance separating them k: A constant R: The region in which corridor lies i: An indicator of whether the corridor is an intrastate or interstate route b: A parameter measuring the rate of transport “friction” associated with travel between two locations
23
Regression analysis (R2 = .83) revealed a coefficient of b of 1.56. Regional differences and adjustments to account for differences in intrastate and interstate trips were also determined through regression. The model suggests a reasonably good estimate of the variability of traffic in the corridors.
Perhaps the greatest weakness of using this approach to compare corridors is that it utilizes only the second step of what is traditionally a two-step travel estimation process. Similarly, the model ignores the local-specific effects of income levels, population growth, and affinity factors that will affect travel, such as the presence of colleges and universities, patterns of commerce, and the ethnic settlement patterns of years ago. Although the region (R) variable accounts for some of these differences, additional variables would likely increase the accuracy of the model. The simplicity of this approach nonetheless offers two important advantages: i) it avoids mixing data from different sources, which can introduce biases related to timing issues and differences in the way information is collected; ii) it allows for comparisons in way that is transparent and has results that are easy to replicate. At a minimum, the gravity model approach can be a jumping-off point for future analysis and can serve as a useful tool to illustrate complex demand-forecasting concepts to policymakers.
APPENDIX C: Criteria Used to Assess Service Availability Amtrak and express coach service were considered as being viable unless they failed some minimal criteria. Trips involving middle-of-the-night arrivals and departures were included. Those with only one daily train or bus, as well as those requiring two transfers were included, as were Amtrak Thruway services. Four types of routes and schedules, however, were deemed non-viable and excluded: 1. Those with an average speed of less than 25 mph, based on the mileage of the highway route recommended by Google Maps. 2. Amtrak Thruway connections that involved middle-of-the night transfers, defined as those involving waits during the interval between 11:30 p.m. and 5:30 a.m., or those involving waits of four hours or more. 3. Trips that required travelers to buy separate tickets for different legs of the journey. For example, the Las Vegas – San Diego trip, which requires using Amtrak on one leg and BoltBus on the other, each requiring a separate reservation, was not included. The travel times are based on bus schedules between the larger of the two metropolitan areas, by definition having a population of at least one million, to the small one, having a population of 500,000 or more. Akron, OH, is excluded from the results shown on Table 3 due to its close proximity to Cleveland (39 miles). Similarly, Worcester, MA, is excluded due to its proximity to Boston (49 miles).
APPENDIX D: ANNOTATED MAPs ILLUSTRATING GROUND TRANSPORTATION GAPS a. Notable underserved routes to/from Chicago b.. Notable routes from Columbus, Ohio, lacking both Amtrak and express coach service c. Notable routes from Phoenix, Arizona, lacking both Amtrak and express coach service
24
Figure 7A
Notable Routes to/from Chicago with limited Amtrak/Express Coach Line Service
25
Figure 7B
Notable Routes to/from Columbus, Ohio lacking both Amtrak and Express Coach Line Service
26
Figure 7C
Notable Routes to/from Phoenix, Arizona lacking both Amtrak and Express Coach Line Service
27
REFERENCES 1. Amtrak. (2016). Monthly Performance Reports. Retrieved from https://www.amtrak.com/ccurl/188/327/Amtrak-Monthly-Performance-Report-September-2016-Final-Audited,0.pdf 2. Bureau of Transportation Statistics (2017), various tables as noted in report, Retrieved from www.rita.dot.gov/bts/sites/rita.dot.gov.bts/files/publications/national_transportation_statistics/index.html 3. FirstGroup Ltd, Annual Report and Accounts 2017. 4. Florida Department of Transportation. (2009). Florida Intercity Bus Service Needs Assessment and Action Plan. Florida Intercity Bus Service Tech Memo One: Baseline Conditions. Retrieved from www.fdot.gov/transit/Pages/FloridaIntercityBusBaselineConditions.pdf 5 Grengs, Joe. (2009). Intercity Bus and Passenger Rail Study: Prepared for the Michigan Department of Transportation. University of Michigan Department of Architecture and Urban Planning. 6. Hall, David. (2013). The Intercity Bus Renaissance: One Company’s Experiences, TR News: A Publication of the Transportation Research Board, 303 (May/June 2013, pp. 11–16). 7. Higgins, Laura, Jeff Warner, Curtis Morgan, and Philip Dunham. (2011). Examining Long-Distance Express Buses as an Extension of and Feeder to Passenger Rail Systems. University Transportation Center for Mobility, Texas Transportation Institute, The Texas A&M University System. 8. Klein, Nicholas J. (2009). Emergent Curbside Intercity Bus Industry: Chinatown and Beyond. Transportation Research Record: Journal of the Transportation Research Board, 2111 (pp. 83–89). 9. Klein, Nicholas J. (2015). Get on the (curbside) bus: The new Intercity Bus. Journal of Transport and Land use, 8(1), (p. 155). 10. McGuckin, N. (2013). Intercity Travel Market Analysis. Prepared for Committee for a Study of Intercity Passenger Travel Issues and Opportunities in Short-Haul Markets. Retrieved from http://www.travelbehavior.us/Nancy--ppt/Intercity%20Travel%20Market%20Analysis.pdf
11. Scott, Marcia, Eileen Collins, Arthur Wicks. (2013). Curbside Intercity Bus Industry: Research of Transportation Policy Opportunities and Challenges. University of Delaware, University Transportation Center. 12. Schwieterman, Joseph and Lauren Fischer. (2012a). Competition from the Curb: Survey of Passengers on Discount Curbside Bus Operators in Eastern and Midwestern Cities. Transportation Research Record, 227 (pp. 49–56). 13. Schwieterman, Joseph, Frederick J. Klein, and Alexander Levin, Direct to Your Destination: The Size,
28
Scope and Competitive Status of Express Coach Carriers in the United States, DePaul University working paper, 2017. 14. Schwieterman, Joseph, Scott Smith, and Riley O’Neil, Stuck in the Middle: Setbacks in Intercity Bus and Rail Service in an era of Lower Cost Fuel, Chaddick Institute working paper, 2017. 15. Schwieterman, Joseph and Lauren Fischer. (2012b). The Decline and Recovery of Intercity Bus Service in the United States: A Comeback for an Environmentally Friendly Transportation Mode. Environmental Practice, 13 (pp. 7–15).
16. Schwieterman, Joseph, Brian Antolin, Alexander Levin, Matthew Michel, and Heather Spray. (2016). The Remaking of the Motor Coach: 2015 Year in Review of Intercity Bus Service in the United States. Chaddick Institute for Metropolitan Development, DePaul University. 17. SRF Consulting Group, Inc. (2010). Intercity Bus Network Study, Final Report. Prepared for Minnesota Department of Transportation.
18. Stagecoach Group Ltd., Preliminary results for the year ended 29 April 2017.
19. Transportation Research Board. (2016). Interregional Travel: A New Perspective for Policy Making. Transportation Research Board Special Report 320. 20. Woldeamanuel, Mintesnot, Evaluating the Competitiveness of Intercity Buses in Terms of Sustainability Indicators, Journal of Public Transportation, 15, No. 3, 2012 (pp. 77–96),
21. U.S. Energy Information Administration. www.eia.gov/dnav/pet/pet_pri_gnd_a_epm0_pte_dpgal_a.htm
1 In some routes, such as the Chicago – Milwaukee “Hiawatha Corridor”, Amtrak does not offer guaranteed seating but does offer guaranteed boarding for passengers with a ticket on a particular train. In rare circumstances, some passengers are required to stand. 2 The higher fuel consumption of bus and train travel compared to other modes can be found in Woldeamanuel (2012). 3 Estimates of mode-share by trip distance are relatively dated due to fact that the American Travel Survey has not been conducted in many years. Among the most detailed breakouts available are by Nancy McGuckin (2013), whose analysis shows that around 95% of trips less than 200 miles were made with private vehicles. These estimates are based on the American Travel Survey from 1995. For an analysis this data, see Interregional Travel: A New Perspective for Policy Making (2016), p. 27. 4 See Interregional Travel, pg. 27. Estimates by the Bureau of Transportation Statistics for travel in 2001 are also available, although these figures have less-precise breakouts for distance than McGuckin and are reported on a roundtrip, rather than one-way, basis. www.rita.dot.gov/bts/sites/rita.dot.gov.bts/files/publications/highlights_of_the_2001_national_household_travel_survey/html/table_04.html
29
5 The Chaddick Institute collected a data set of all schedules operated by BoltBus and Megabus in early 2015. This showed that more than 90% of routes (which often consist of several intercity segments) are in the 120 – 400 mile range. Please contact the study authors for details. 6 Several examples suggest express coach lines often do poorly on routes less than 120 miles. Amtrak has no express coach bus competition on the Los Angeles – San Diego route (119 miles); both Megabus and BoltBus withdrew from this route after serving it for relatively brief periods. The Oakland – Sacramento “Capitol Corridor” (82 miles) has nine Amtrak trains each way daily but just one Megabus. On the Chicago – Milwaukee corridor (90 miles), the pair of Megabus daily trips (although as many as four in summer) compete with Amtrak’s seven. Megabus typically has three departures in each direction between Harrisburg and Philadelphia, whereas Amtrak has 14. New York – Philadelphia (90 miles) has much more competition owing to the fact that train fares for same-day travel often exceed $50, far more than most other comparable routes. Even on this route, however, express coach bus lines run less frequently than on less-densely traveled (but longer) routes, such as Washington, DC – New York to Boston. 7 See Schwieterman and Fischer (2012a), p. 53. This study finds that just 14.1% of Megabus travelers would take a conventional bus line such as Greyhound if Megabus service were not available. This result is based on a survey administered to 750 Megabus travelers at pickup points in six cities. 8Survey results consistently show a tendency for intercity bus lines to serve lower-income travelers and those without employment. See especially Grengo (2009) and Florida Department of Transportation (2009). Schwieterman and Fischer (2012b) also find that express coach lines serve younger passengers than conventional bus lines such as Greyhound. 9 The survey in Schwieterman and Fischer (2012a) indicates that 17.9% of Megabus travelers in the Northeast would switch to Greyhound if Megabus service were not available, versus 10.2% in the Midwest. This difference is notable considering that Amtrak is much more prevalent in the Northeast, giving passengers more options to conventional bus service. Despite this rail competition, more express coach riders in the Northeast consider conventional buses to be their next-best option. 10 See Woldeamanuel (2012) for a summary of some of the research illustrating the mobility and sustainability benefits of intercity bus travel. 11 This information is obtained from Bureau of Transportation Statistics, Table 1-40: U.S. Passenger-Miles (Millions) 12 “Delays Persist for U.S. High Speed Rail,” New York Times, August 8, 2014. https://www.nytimes.com/2014/08/07/us/delays-persist-for-us-high-speed-rail.html 13 Ibid. 14“Has High Speed Rail Been Derailed?” Govtech.com. May 13, 2013. http://www.govtech.com/transportation/Has-High-Speed-Rail-Been-Derailed.html 15 For a chronology of the industry’s development, see Joseph Schwieterman, The Decline and Revival of Intercity Bus Service, TR News: A Publication of the Transportation Research Board, 303 (May/June 2013), 4–15. 16 See Hall (2013). 17 See Schwieterman (2013). 18 This data is summarized in Schwieterman, Joseph, et. al. (2016). The Remaking of the Motor Coach: 2015 Year in Review of Intercity Bus Service in the United States, pgs. 13–19. 19 U.S. Energy Information Administration. www.eia.gov/dnav/pet/pet_pri_gnd_a_epm0_pte_dpgal_a.htm 20 Data from Bureau of Transportation Statistics: Annual U.S. Domestic Average Itinerary Fare in Current and Constant Dollars: https://www.rita.dot.gov/bts/airfares/programs/economics_and_finance/air_travel_price_index/html/AnnualFares.html 21 The difficulty of finding pickup/drop-off locations in New York City is described in a New York Times article on March 11, 2013. www.nytimes.com/2013/03/11/nyregion/critics-seek-city-action-to-rein-in-discount-bus-lines.html 22 The decline could also be precipitated by changing preferences due to rising discretionary income. To the extent that bus and train service are inferior goods – meaning they are used less frequently as income rises – rising disposable incomes may be having an adverse effect, although this observation is speculative.
30
23 Information compiled from Amtrak Monthly Performance Reports, available in the “About Amtrak” section of Amtrak.com 24 Historical data through 2015 obtained from the Bureau of Transportation Statistics Table 9: Vehicle Miles. https://apps.bts.gov/publications/pocket_guide_to_transportation/2002/html/table09_vehicle_miles.html 25 Revenue estimates are derived partially from these annual reports: Stagecoach Group Ltd., Preliminary results for the year ended 29 April 2017. http://www.stagecoach.com/~/media/Files/S/Stagecoach-Group/Attachments/media/press/pr2017/2017-06-28.pdf and FirstGroup, Annual Report and Accounts 2017 http://www.firstgroupplc.com/~/media/Files/F/Firstgroup-Plc/indexed-pdfs/2017%20ARA/2017%20FirstGroup%20plc%20Annual%20Report%20and%20Accounts.pdf 26 Based on analysis of data in Federal Highway Administration. Multimodal Interregional Passenger Travel Origin Destination Data, compiled by the Federal Highway Administration. Consult the authors for details. Available at https://www.fhwa.dot.gov/policyinformation/analysisframework/03.cfm 27 For a discussion of the benefits of operating out of a transit center in Cleveland, see Cleveland Plain Dealer, August 1, 2013. www.cleveland.com/metro/index.ssf/2013/08/megabus_now_operates_out_of_rt.html 28 Denver presently does not have express-coach service based on the criteria used in this study. 29 Michigan’s expansion of the Amtrak Thruway network is described in the Indian Trails press release by Indian Bus Lines, “Trails' Entire Bus Network Now Connects with Amtrak”, issued on March 1, 2016. www.prlog.org/12623505-indian-trails-entire-bus-network-now-connects-with-amtrak.html 30 Interrregional Travel, p. 8 Publication note: KH edited version 31 Megabus has also been aggressive in reducing the amount of service provided, having dropped several cities during this period, which is reflected in the remark that it “matched our services to changes in demand.” Stagecoach reported that Megabus’ revenue per bus-mile was up 2.4%, which suggests that service cuts have more than offset the decline in average fares and the number of passengers handled. 32 The FirstGroup report also points to capacity cuts, including a remark that it was able to “flex mileage operated in response to demand trends”. Although Greyhound has not announced any service cuts, frequency reductions were observed on some routes, and the number of employees between the 2016 and 2017 fiscal years fell from 7,000 to 6,500. Greyhound, too, appears to have faced a slight drop in average fare, which suggests passenger traffic is likely down much less than 2.2%. Greyhound also reported modest gains in revenue per bus-mile operated. 33 The analysis also considered American Public Transit Association data, which indicates that U.S. public transit ridership in calendar year 2016 fell by 2.3%, and city bus traffic was off 4.1%. Nevertheless, commuter rail, which has many similarities with relatively short-distance intercity bus routes, was up 1.2%. This reaffirms the view that relatively short-haul service have outperformed longer-haul routes.