final report survey of active solar thermal collectors
TRANSCRIPT

SAIC Canada Project Number: 13031.B.01
CM Number: CM002056
Final Report
Survey of Active Solar Thermal Collectors,
Industry and Markets in Canada (2005)
Science Applications International Corporation (SAIC Canada)
Renewable Energy and Climate Change Program
Report presented to: Riad Younes
Natural Resources Canada
December 2006

Solar Thermal Industry Survey 2005 SAIC Canada (13031.B.01) NRCan-06-01019 December 2006 _________________________________________________________________________________________
Science Applications International Corporation (SAIC Canada)
i

Solar Thermal Industry Survey 2005 SAIC Canada (13031.B.01) NRCan-06-01019 December 2006 _________________________________________________________________________________________
Science Applications International Corporation (SAIC Canada)
ii
ACKNOWLEDGEMENTS
The funding for this report was provided by Natural Resources Canada. Riad Younes was the technical authority for this work.
We gratefully acknowledge the contributions of Doug McClenahan and Bruce Sibbitt, both of Natural Resources Canada, who provided invaluable assistance to this project.
We acknowledge contributions of the following members of our team: Vasantha Narasimhan of Simhan Research Associates and Rob McMonagle of the Canadian Solar Industries Association.
Any reference to trade names or commercial products in this document does not constitute a recommendation or endorsement for use by Natural Resources Canada.
For more information on this survey report and related inquiries, please contact:
Riad Younes Renewable and Electrical Energy Division Natural Resources Canada 580 Booth Street Ottawa, Ontario K1A 0E4 Tel: (613) 995-3825 Email: [email protected]

Solar Thermal Industry Survey 2005 SAIC Canada (13031.B.01) NRCan-06-01019 December 2006 _________________________________________________________________________________________
Science Applications International Corporation (SAIC Canada)
iii
EXECUTIVE SUMMARY The Canadian solar thermal industry continued to show strong growth in 2005, with all three major product categories (air collectors, unglazed pool collectors and glazed collectors) showing growth annual rates ranging from 12% to 130%. The chart shows the growth of solar collector sales (m2) over the past ten years.
18
,013
20,3
68 27,2
46
31,
153
28,2
75 34,5
36
37,7
57
53,
571
20,3
64
61,5
59
0
10,000
20,000
30,000
40,000
50,000
60,000
70,000
1996 1997 1998 1999 2000 2001 2002 2003 2004 2005
Ann
ual D
omes
tic C
olle
ctor
Sal
es (m
²)
Air Glazed Unglazed Total
Optimism within the solar industry continues, with every company surveyed predicting further growth in 2006 and 2007. Actual domestic sales in 2005 totalled 61,558 m², as detailed below.
Domestic Sales Collector Area (m²)
Collector Type 2005
Air 18,061
Liquid Glazed/Evac. 3,043
Liquid Unglazed 40,455
Total 61,559
Solar thermal systems in Canada continue to substantially decrease the amount of greenhouse gases generated in Canada. The estimated 418,897 m² of solar collectors operating in Canada during 2005 avoided the release of 27,383 tonnes of CO2 into the Canadian atmosphere during 2005. This is an increase of 18% over the 23,208 tonnes avoided in 2004. Furthermore, the 61,558 m² of solar thermal collectors that were installed in 2005 will reduce Canada’s GHG emissions by 112,849 tonnes over their predicted 20 – 30 year life.

Solar Thermal Industry Survey 2005 SAIC Canada (13031.B.01) NRCan-06-01019 December 2006 _________________________________________________________________________________________
Science Applications International Corporation (SAIC Canada)
iv
TABLE OF CONTENTS
ACKNOWLEDGEMENTS...................................................................................................... ii
EXECUTIVE SUMMARY...................................................................................................... iii
LIST OF TABLES..................................................................................................................v
LIST OF FIGURES................................................................................................................v
1 Introduction ................................................................................................................... 1
2 Survey Process ............................................................................................................. 3
2.1 Survey Development and Distribution .................................................................... 3
2.2 Survey Response Rate .......................................................................................... 3
2.3 External Data Sources ........................................................................................... 4
2.4 Estimated Data Capture Rate ................................................................................ 4
3 Survey Results .............................................................................................................. 7
3.1 Industry Characterization ....................................................................................... 7
3.2 Industry Size and Growth ....................................................................................... 9
3.3 Applications of Solar Thermal Technology ............................................................11
3.4 Geographic Distribution.........................................................................................12
3.4.1 Exports and Imports .......................................................................................13
3.5 Anticipated Sales Growth ......................................................................................14
4 Estimate of Avoided Greenhouse Gas Emissions ........................................................15
4.1 Background...........................................................................................................15
4.2 Reference System Definitions ...............................................................................15
4.3 GHG Emission Avoidance Calculations.................................................................16
4.4 Forecast GHG Emission Avoidance from Collectors sold in 2005 .........................17
5 References...................................................................................................................18
APPENDIX A – Survey Questionnaire.................................................................................48

Solar Thermal Industry Survey 2005 SAIC Canada (13031.B.01) NRCan-06-01019 December 2006 _________________________________________________________________________________________
Science Applications International Corporation (SAIC Canada)
v
LIST OF TABLES Table 1: Estimated data capture rates by business segment/collector type .......................... 5
Table 2: Solar collector sales by type, 2004 and 2005.......................................................... 9
Table 4: Major solar heating applications (by revenue), by sector and collector type...........12
Table 5: Distribution of sales within Canada........................................................................13
Table 6: Annual exports - collector area and value..............................................................14
Table 7: Analysis of avoided GHG emissions, using four reference systems, 2005.............16
LIST OF FIGURES Figure 1: Collector sales from independent sources (m²) ..................................................... 4
Figure 2: Sector involvement within the solar thermal industry ............................................. 7
Figure 3: Solar thermal revenue as a percent of total corporate revenue.............................. 8
Figure 4: Number of ST employees per company ................................................................ 8
Figure 5: Annual domestic sales growth by collector type (m²) ............................................10
Figure 6: Ten-year history of domestic collector sales .........................................................11
Figure 7: 2004 solar collector sales, by population ..............................................................13
Figure 8: Anticipated sales growth in 2006 and 2007 ..........................................................14
Figure 9: History of Operating Solar Collectors in Canada ..................................................15

Solar Thermal Industry Survey 2005 SAIC Canada (13031.B.01) NRCan-06-01019 December 2006 _________________________________________________________________________________________
Science Applications International Corporation (SAIC Canada)
1
1 INTRODUCTION
This report provides results of a survey of active solar thermal collectors, industry and markets in Canada. The survey was commissioned by Natural Resources Canada (NRCan), in early 2006 and was undertaken by a consortium led by SAIC Canada and including the Canadian Solar Industries Association (CanSIA) and Simhan Research Associates (SRA). The survey covered the 2005 calendar year, building on a previous survey that covered 2002 through 2004.
NRCan’s Renewable Energy Deployment Initiative (REDI) was launched in April 1998 to stimulate the demand for cost-effective renewable energy heating and cooling systems and help create a sustainable market for those systems. Active solar thermal systems (ASTSs), including air and water heating, represent two of the types of renewable energy technologies (RETs) presently supported by Natural Resources Canada’s REDI program. These ASTSs can play a considerable role in the implementation of the climate change plan for Canada.
In part, this survey was undertaken in support of Canadian contributions to the solar heating market survey of the Solar Heating and Cooling Program of the International Energy Agency (IEA).
Solar thermal collectors are the key component of active solar energy systems. These collectors absorb energy from the sun’s rays and convert it into thermal energy that can be used for water and space heating and cooling. Collectors are designed to meet the specific temperature requirements and climate conditions of each use.
The purpose of this study was to survey the Canadian active solar thermal collector industry to obtain data for the 2005 calendar year. The main objectives of the study were:
• To capture comprehensive and reliable information on market size and industry trends, including Canadian sales and revenues, import and export, and employment figures.
• To estimate delivered thermal energy and displaced CO2 emissions of all active solar thermal systems operating in Canada.
• To analyze and report obtained data for publication and wider dissemination.
The Canadian solar thermal industry is a diverse, growing industry active across Canada, with roots going back to the mid-1970’s. Five distinct types of solar collectors were sold in Canada in 2005:
1. Unglazed, liquid plastic collectors;
2. Unglazed, air collectors;
3. Glazed, liquid collectors;
4. Evacuated tube liquid collectors, and;
5. Glazed, air collectors.

Solar Thermal Industry Survey 2005 SAIC Canada (13031.B.01) NRCan-06-01019 December 2006 _________________________________________________________________________________________
Science Applications International Corporation (SAIC Canada)
2
Of these, evacuated tube collectors and glazed air collectors both had sales sufficiently small that releasing their sales figures risks the confidentiality of the survey data. For this reason, their sales data was combined with glazed liquid and unglazed air collectors, respectively.
As the solar collector designs are diverse, so are the applications. The latter include residential and commercial swimming pool heating, heating of ventilation and makeup air in industrial buildings, commercial buildings and livestock barns, heating of potable hot water in any style of building, from single family homes to large office complexes. Newer applications are coming into use, including residential space heating via radiant floor heating systems.
Solar Thermal Industry Survey 2005 SAIC Canada (13031.B.01) NRCan-06-01019 December 2006 _________________________________________________________________________________________
Science Applications International Corporation (SAIC Canada)
3
2 SURVEY PROCESS
2.1 Survey Development and Distribution
The survey questionnaire used for 2005 was very similar to the one used for the 2002 – 2004. Several questions were dropped, as they did not need to be repeated annually, and questions were adjusted to cover only a one year period. This resulted in a considerable simplification of the survey, with the number of questions being reduced from fifteen to eleven. Most of the remaining questions were exact duplicates of the earlier questionnaire, although minor adjustments were made to a few questions. The deletion of questions did result in a change to the numbering of the questions. (In this report, the question numbers used will be those from the 2005 survey.)
The 2004 survey was the first survey of its type in many years, and was thus distributed widely, to 268 recipients, including many small retailers, and some companies no longer in the solar thermal business. The 2005 survey was mailed out to 188 recipients, consisting of all those companies which were contacted during the 2004 survey, and indicated that they did have an interest in the solar thermal industry. Both to focus the survey effort, and to reduce the cost, a shorter list of recipients was developed for follow up. This more select group consisted of all companies that completed the 2004 survey, as well as any company thought to be involved in manufacturing or distribution. There was no follow up with the bulk of the 188 survey recipients, most of who were thought to be smaller retailers.
A copy of the questionnaire can be found in Appendix A.
2.2 Survey Response Rate
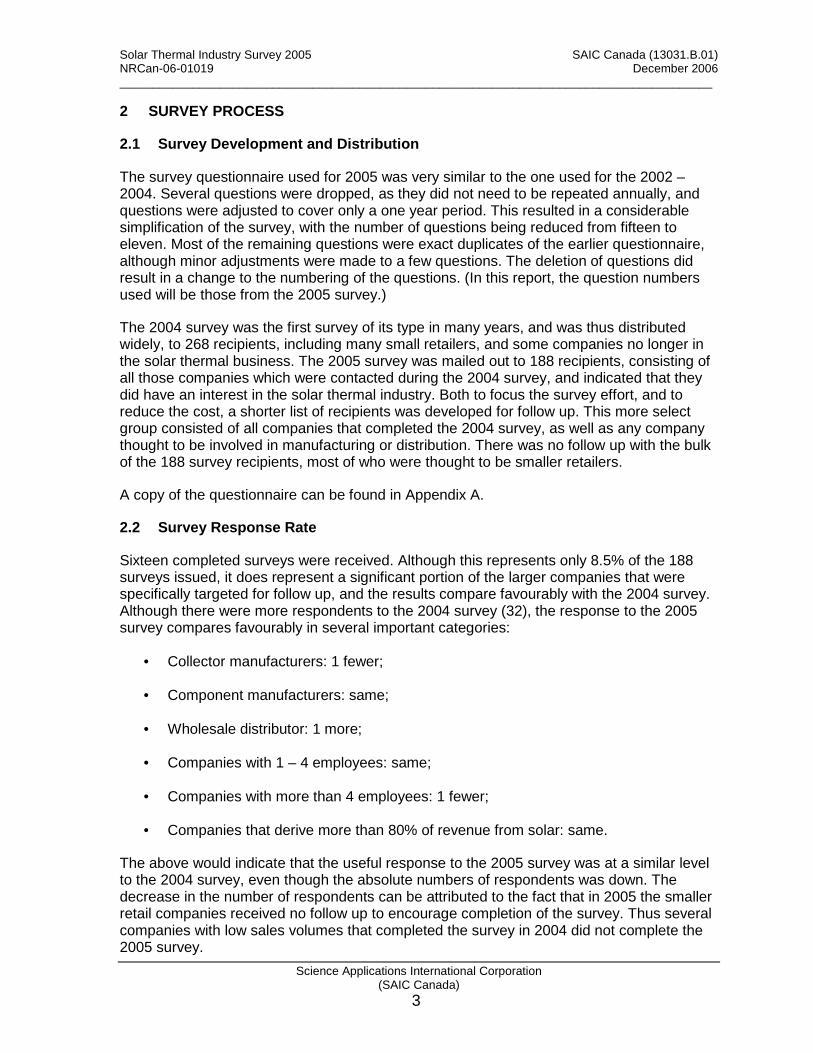
Sixteen completed surveys were received. Although this represents only 8.5% of the 188 surveys issued, it does represent a significant portion of the larger companies that were specifically targeted for follow up, and the results compare favourably with the 2004 survey. Although there were more respondents to the 2004 survey (32), the response to the 2005 survey compares favourably in several important categories:
• Collector manufacturers: 1 fewer;
• Component manufacturers: same;
• Wholesale distributor: 1 more;
• Companies with 1 – 4 employees: same;
• Companies with more than 4 employees: 1 fewer;
• Companies that derive more than 80% of revenue from solar: same.
The above would indicate that the useful response to the 2005 survey was at a similar level to the 2004 survey, even though the absolute numbers of respondents was down. The decrease in the number of respondents can be attributed to the fact that in 2005 the smaller retail companies received no follow up to encourage completion of the survey. Thus several companies with low sales volumes that completed the survey in 2004 did not complete the 2005 survey.

Solar Thermal Industry Survey 2005 SAIC Canada (13031.B.01) NRCan-06-01019 December 2006 _________________________________________________________________________________________
Science Applications International Corporation (SAIC Canada)
4
Of the sixteen companies that completed this survey, eleven also completed the previous survey. This allows for direct year-to-year comparison of a significant sample.
2.3 External Data Sources
In addition to the data received from survey respondents, data from external sources was sought, either to supplement or verify the survey data.
Both the U.S Energy Information Agency (EIA) and Canadian Spool & Spa Marketing (PSM) magazine have reported regular growth in Canadian sales of solar collectors over the past few years, including annual growth rates of 77% and 10%, respectively, in 2005. The EIA data includes all types of solar collectors exported to Canada; traditionally, the vast majority has been unglazed collectors. The PSM data includes only unglazed collectors used for pool heating, and has been calculated based on PSM’s report of retail sales revenue.
0
5,000
10,000
15,000
20,000
25,000
30,000
35,000
40,000
45,000
50,000
2003 2004 2005
Can
adia
n C
olle
ctor
Sal
es (
m²)
EIA
PSM
PSM data converted from retail values at $137.40 per m²
Figure 1: Collector sales from independent sources (m²)
2.4 Estimated Data Capture Rate
To properly estimate the size of the total solar thermal industry in Canada from the survey results, it is necessary to estimate the data capture rate of the survey. The data capture rate is separate from the survey response rate discussed in the preceding section. The survey response rate is based on the number of forms completed, with all businesses given equal weight, and can be accurately counted. The data capture rate is an estimate – never a count – of the fraction of the available data which was captured by the survey process. In effect, it is a weighted average of the survey response rate, where each business receives a weighting in accordance with its volume of business. The procedure of estimating the data

Solar Thermal Industry Survey 2005 SAIC Canada (13031.B.01) NRCan-06-01019 December 2006 _________________________________________________________________________________________
Science Applications International Corporation (SAIC Canada)
5
capture rate in this survey is complicated by the fact that there are at least three distinct market segments – and specialized businesses to serve them – within the solar thermal industry. Table 1 lists the three business segments, and the estimated data capture rate for each.
Table 1: Estimated data capture rates by business s egment/collector type
Business Segment Description Collector Types
Estimated Data
Capture Rate
Solar air heating Heating of ventilation air. Primarily for commercial applications, with some residential.
Unglazed & glazed
air 100%
Outdoor pool heating
Heating of seasonal use, outdoor pools. Primarily residential, but including some seasonal use commercial facilities.
Unglazed liquid <10%
General water heating
A wide range of applications including residential domestic hot water, indoor pool heating, and commercial water heating applications
Glazed liquid,
Evacuated 80%
In estimating the above data capture rates, the survey team reviewed historical data on the Canadian solar thermal industry, as well as current data from other sources, along with the survey completion rate. The justification for these data capture rates can be summarized as follows:
• Solar air heating: This segment of the industry is uniquely strong in Canada, compared to other nations, so most collectors installed in Canada are manufactured and sold by a very small number of Canadian-based companies. A review of the 2005 data reveals that it is likely that all major companies active in this sector completed the survey.
• Outdoor pool heating: This segment of the industry is very diverse, with much of the product distribution going through pool industry channels. There are several major manufacturers in both the U.S. and Canada, with shipments going both ways across the border. Our response rate from this industry appears very low, so for this segment of the industry we have relied heavily on sources of information outside of this formal survey process (U.S. EIA survey of solar exports, PSM magazine), using the survey responses to supplement this other data.
• General water heating: This segment of the industry uses a mix of Canadian-made collectors, from a handful of manufacturers, and imported collectors from several sources. Distribution is primarily through specialty “solar” channels. Comparing the

Solar Thermal Industry Survey 2005 SAIC Canada (13031.B.01) NRCan-06-01019 December 2006 _________________________________________________________________________________________
Science Applications International Corporation (SAIC Canada)
6
survey data to other information sources (e.g. knowledge of larger installations) leads us to believe that we have captured the majority – but by no means all – of this sector.
Important Note
In the body of this report, all quantified information (e.g. area of collector shipments; value of sales) have had the estimated data capture rates from Table 1 applied, to correct from the raw survey data.

Solar Thermal Industry Survey 2005 SAIC Canada (13031.B.01) NRCan-06-01019 December 2006 _________________________________________________________________________________________
Science Applications International Corporation (SAIC Canada)
7
3 SURVEY RESULTS
3.1 Industry Characterization
Figure 2: Sector involvement within the solar therm al industry 20
%
13%
20% 23
%
20%
43%
37%
31%
25%
19%
31%
44%
50%
31%
0%
10%
20%
30%
40%
50%
60%
Collectormanufact.
Componentmanufact.
Collectorimporter
Componentimporter
Wholesaler Retail Other
Per
cent
of R
espo
nden
ts A
ctiv
e in
eac
h S
ecto
r
2004 2005

Solar Thermal Industry Survey 2005 SAIC Canada (13031.B.01) NRCan-06-01019 December 2006 _________________________________________________________________________________________
Science Applications International Corporation (SAIC Canada)
8
Figure 3: Solar thermal revenue as a percent of tot al corporate revenue
0%
10%
20%
30%
40%
50%
60%
<1% 1 - 2% 2 - 20% 20 - 50% 50 - 80% 80 - 100%
Per
cent
of R
even
ue fr
om S
olar
The
rmal
2004 2005
Figure 4: Number of ST employees per company
5
10
8
5
1
3
8
4
0
2
4
6
8
10
12
0 - 0.2 0.2 - 1 1 - 4 >4
Full-time Equivalent Employees
Em
ploy
ees
per C
ompa
ny
2004
2005

Solar Thermal Industry Survey 2005 SAIC Canada (13031.B.01) NRCan-06-01019 December 2006 _________________________________________________________________________________________
Science Applications International Corporation (SAIC Canada)
9
3.2 Industry Size and Growth
The pace of solar collector sales in Canada – of all types of collectors - continues to grow. Table 2 provides summary of solar collector sales, both for domestic and export sales, for 2004 and 2005. Figure 5 shows year-over-year growth rates, by collector area, for 2005.
The 2005 growth continues a trend that has been developing over the past several years. Refer to Figure 6 for a summary of industry growth over the past ten years.
Table 2: Solar collector sales by type, 2004 and 20 05
Domestic Sales Thermal Capacity (MW) Collector Area (m²) Revenue ($1,000's)
Collector Type 2004 2005 2004 2005 2004 2005
Air 11.3 12.6 16,196 18,061 $2,354 $1,316
Liquid Glazed/Evac. 0.9 2.1 1,325 3,043 $1,568 $1,812
Liquid Unglazed 25.2 28.3 36,050 40,455 $2,199 $3,845
Total 37.5 58.5 53,571 61,559 $6,121 $6,973
Export Sales Thermal Capacity
(MW) Collector Area (m²) Revenue ($1,000's)
Collector Type 2004 2005 2004 2005 2004 2005
Air 1.2 2.1 1,698 3,054 $117 $421
Liquid Glazed/Evac. 0.5 1.0 749 1,428 $345 $658
Liquid Unglazed 14.0 7.1 20,024 10,010 $665 $333
Total 15.7 18.2 22,471 17,822 $1,127 $1,412
Total Sales Thermal Capacity
(MW) Collector Area (m²) Revenue ($1,000's)
Collector Type 2004 2005 2004 2005 2004 2005
Air 12.5 14.8 17,894 21,115 $2,471 $1,737
Liquid Glazed/Evac. 1.5 3.1 2,074 4,471 $1,914 $2,469
Liquid Unglazed 39.3 35.4 56,074 50,556 $2,864 $4,179
Total 53.2 76.6 76,042 109,840 $7,249 $8,385
There are several distinct differences between the 2004 and 2005 data reported in Table 2. While some of these may result from changes in the market, it is likely that some are simply a result of the relatively small sample size in both 2004 and 2005. This is particularly true of data related to unglazed, pool-type collectors, for which the survey’s data capture rate was low in 2004, and even lower in 2005. Specific incidences include:

Solar Thermal Industry Survey 2005 SAIC Canada (13031.B.01) NRCan-06-01019 December 2006 _________________________________________________________________________________________
Science Applications International Corporation (SAIC Canada)
10
• Domestic shipments of air collectors, by area, increased, but the revenue dropped substantially.
• Domestic shipments of glazed liquid collectors more than doubled, but revenue increased by only ~40%.
• The level of unglazed liquid (pool) collector sales was determined indirectly from independent sources, rather than from the survey responses, as too few responses were received.
Figure 5: Annual domestic sales growth by collector type (m²)
12%
130%
12% 15%
0%
30%
60%
90%
120%
150%
Air Glazed Pool Combined
Yea
r ove
r yea
r gro
wth
rate

Solar Thermal Industry Survey 2005 SAIC Canada (13031.B.01) NRCan-06-01019 December 2006 _________________________________________________________________________________________
Science Applications International Corporation (SAIC Canada)
11
Figure 6: Ten-year history of domestic collector sa les (m 2)
18,0
13
20,3
68 27,2
46
31,
153
28,2
75 34,5
36
37,7
57
53,
571
20,3
64
61,5
59
0
10,000
20,000
30,000
40,000
50,000
60,000
70,000
1996 1997 1998 1999 2000 2001 2002 2003 2004 2005
Ann
ual D
omes
tic C
olle
ctor
Sal
es (m
²)
Air Glazed Unglazed Total
3.3 Applications of Solar Thermal Technology
Respondents were asked to provide details of the types of systems where solar collectors were being employed. Table 3 provides the breakdown by sector and by application. Only major applications are listed; namely, those that were responsible for more than 10% of the reported revenue (in either 2004 or 2005), for that particular collector type.
The data show, unglazed liquid collectors have a very clear market focus – residential swimming pool heating – while the air collector market is concentrated on ICI space heating. For glazed and evacuated tube collectors, the market focus is on domestic water heating (72%, combined residential and ICI), with most of the balance being sold into residential space heating applications.

Solar Thermal Industry Survey 2005 SAIC Canada (13031.B.01) NRCan-06-01019 December 2006 _________________________________________________________________________________________
Science Applications International Corporation (SAIC Canada)
12
Table 3: Major solar heating applications (by reven ue), by sector and collector type
Unglazed Glazed/Evac. Air Revenue by Sector
2004 2005 2004 2005 2004 2005
Residential 98% 100% 86% 64% 8% 8%
Industrial/Commercial/Institutional (ICI) 2% 0% 14% 36% 92% 92%
Unglazed Glazed/Evac. Air Revenue by Solar Heating Application
2004 2005 2004 2005 2004 2005
Residential pool heating 97% 100%
Residential domestic water heating 62% 56%
Residential space heating 5% 21%
Residential combined space and water heating 19% 2%
ICI domestic water heating 13% 16%
ICI space heating 77% 91%
3.4 Geographic Distribution
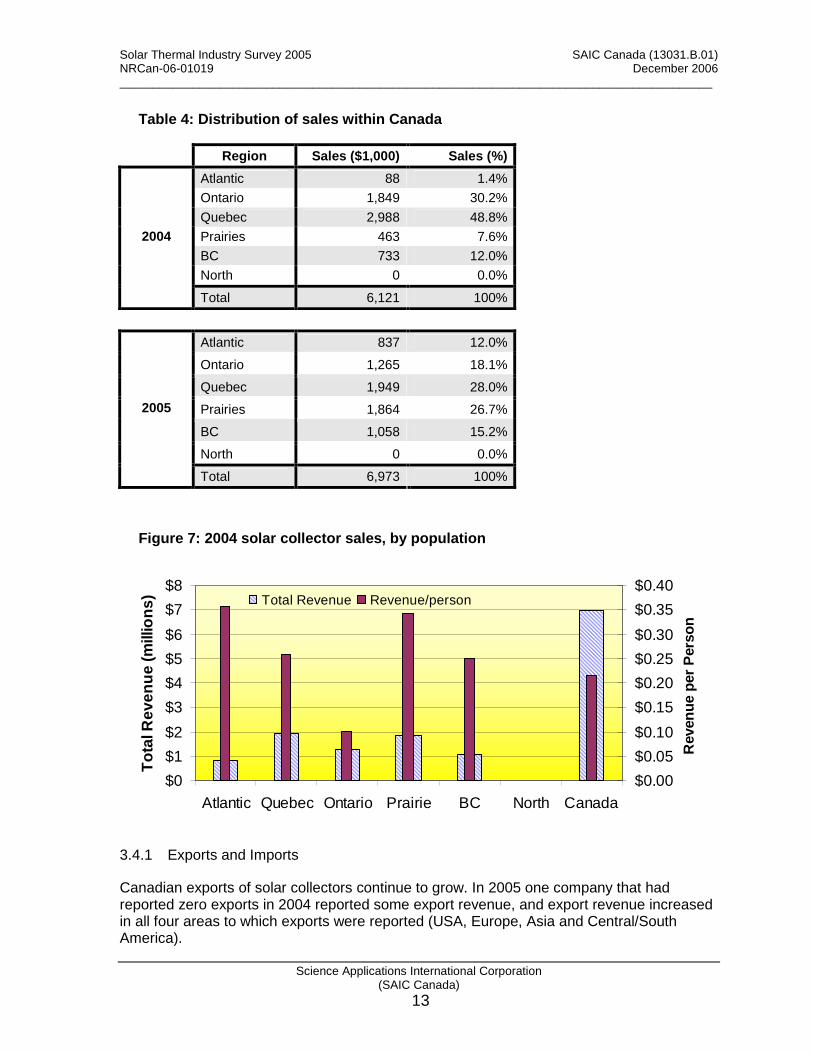
Table 4 shows the distribution of solar collector sales within Canada, by revenue. Figure 7 shows the same data, also expressed on a population basis. This data reveals substantial markets in all regions of Canada, except the north. Since no northern companies completed the survey, this should not be taken as conclusive evidence that there is no market in Canada’s northern territories. It is also noteworthy that while there is a substantial market for solar collectors in Ontario, on a population basis they spend substantially less than people in other regions.
On average, each Canadian spent 22¢ on solar thermal collectors in 2005, up from less than 20¢ in 2004. This is a clear indication that the solar thermal market in Canada is not yet well developed.
Solar Thermal Industry Survey 2005 SAIC Canada (13031.B.01) NRCan-06-01019 December 2006 _________________________________________________________________________________________
Science Applications International Corporation (SAIC Canada)
13
Table 4: Distribution of sales within Canada
Region Sales ($1,000) Sales (%)
Atlantic 88 1.4%
Ontario 1,849 30.2%
Quebec 2,988 48.8%
Prairies 463 7.6%
BC 733 12.0%
North 0 0.0%
2004
Total 6,121 100%
Atlantic 837 12.0%
Ontario 1,265 18.1%
Quebec 1,949 28.0%
Prairies 1,864 26.7%
BC 1,058 15.2%
North 0 0.0%
2005
Total 6,973 100%
Figure 7: 2004 solar collector sales, by population
$0
$1
$2
$3
$4
$5
$6
$7
$8
Atlantic Quebec Ontario Prairie BC North Canada
Tot
al R
even
ue (m
illion
s)
$0.00
$0.05
$0.10
$0.15
$0.20
$0.25
$0.30
$0.35
$0.40
Rev
enue
per
Per
son
Total Revenue Revenue/person
3.4.1 Exports and Imports
Canadian exports of solar collectors continue to grow. In 2005 one company that had reported zero exports in 2004 reported some export revenue, and export revenue increased in all four areas to which exports were reported (USA, Europe, Asia and Central/South America).

Solar Thermal Industry Survey 2005 SAIC Canada (13031.B.01) NRCan-06-01019 December 2006 _________________________________________________________________________________________
Science Applications International Corporation (SAIC Canada)
14
Comparative data for 2004 and 2005 is presented in Table 5. It should be noted that the survey questions regarding exports were simplified in the 2005 survey; thus there may be systemic differences in how the respondents reported, and direct year-to-year comparisons may not be appropriate. Also, the number of respondents replying to questions on exports, so the small sample size may introduce errors in this data.
Table 5: Annual exports - collector area and value
3.5 Anticipated Sales Growth
Optimism continues within the solar thermal industry, with a weighted average expectation for 60% annual growth rates, and all respondents expecting annual growth in excess of 10%. Figure 8 shows the range of survey responses, indicating a strong expectation of growth over the next two years.
Figure 8: Anticipated sales growth in 2006 and 2007
Collector Area Exported (m²) 2004 2005 Air 1,698 3,054 Liquid Glazed & Evacuated 749 1,428 Liquid Unglazed 20,024 10,101
Total 22,471 14,583
Value of Solar Thermal Exports 2004 2005 Air $117,000 $421,000 Liquid Glazed & Evacuated $345,000 $658,000 Liquid Unglazed $665,000 $333,000
Total $1,127,000 $1,412,000
0%
5%
10%
15%
20%
25%
30%
35%
40%
45%
>-60 -40-60 -20-40 -10-20 0-10 0 0-10 10-20 20-40 40-60 >60
Predicted Growth Rate of Annual Sales (%)
Per
cent
of R
espo
nden
ts
2004 2005
Negative Growth Stable Positive Growth
Solar Thermal Industry Survey 2005 SAIC Canada (13031.B.01) NRCan-06-01019 December 2006 _________________________________________________________________________________________
Science Applications International Corporation (SAIC Canada)
15
4 ESTIMATE OF AVOIDED GREENHOUSE GAS EMISSIONS
4.1 Background
Estimating GHG emissions avoided due to solar thermal installations in Canada is a complex issue that involves estimating the operational effectiveness of all solar heating systems in Canada, the fuel that they displace, and the location of the systems within Canada, among other variables. These variables cannot all be known with precision. With the sponsorship of the IEA, Weiss et al developed a methodology for estimated GHG avoidance, using a system of reference solar heating systems. This methodology was adopted, with some modifications, for use on earlier Canadian data, and is described in detail in last year’s report (ref 1). A summary of the reference system definitions follows.
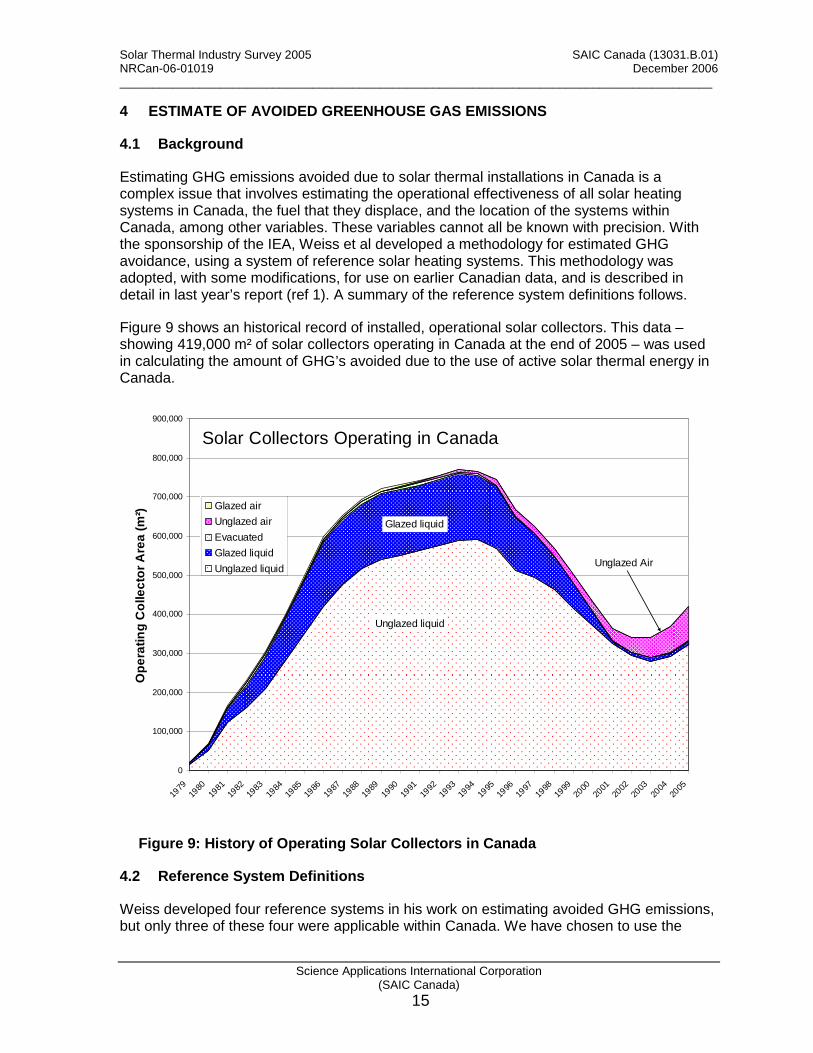
Figure 9 shows an historical record of installed, operational solar collectors. This data – showing 419,000 m² of solar collectors operating in Canada at the end of 2005 – was used in calculating the amount of GHG’s avoided due to the use of active solar thermal energy in Canada.
0
100,000
200,000
300,000
400,000
500,000
600,000
700,000
800,000
900,000
1979
1980
1981
1982
1983
1984
1985
1986
1987
1988
1989
1990
1991
1992
1993
1994
1995
1996
1997
1998
1999
2000
2001
2002
2003
2004
2005
Ope
ratin
g C
olle
ctor
Are
a (m
²)
Glazed air
Unglazed air
Evacuated
Glazed liquid
Unglazed liquid
Unglazed liquid
Glazed liquid
Unglazed Air
Solar Collectors Operating in Canada
Figure 9: History of Operating Solar Collectors in Canada
4.2 Reference System Definitions
Weiss developed four reference systems in his work on estimating avoided GHG emissions, but only three of these four were applicable within Canada. We have chosen to use the

Solar Thermal Industry Survey 2005 SAIC Canada (13031.B.01) NRCan-06-01019 December 2006 _________________________________________________________________________________________
Science Applications International Corporation (SAIC Canada)
16
same three systems, albeit with some adjustments to reflect the Canadian market, plus a fourth – commercial air.
Residential DHW – This system is identical to Weiss’ solar domestic hot water systems for single family houses in Canada. It represents a typical solar DHW preheat system consisting of two 4’ x 8’ (6 m²) glazed solar collectors, 150 L/d hot water usage*, with a 300 L hot water storage tank. Commercial marketing material indicates that each system will produce about 50% of the energy required for hot water in a home, on an annual basis.
Commercial Water – This system is essentially a new name for Weiss’ solar domestic hot water systems for multi-family houses and district heating, retaining many of its features. This incorporates all larger scale systems with glazed, liquid collectors, covering applications from institutional or multi-residential DHW, to municipal indoor pool heating, to process water at car washes, laundries or other facilities. As with Weiss, the reference system consists of 50 m² of collectors, 2,000 L/d hot water draw and a 2,500 L storage tank.
Residential Pool – This system is identical to Weiss, except that the collector area has been reduced from 200 m² to 25 m², to more closely reflect the Canadian market (5-6 nominal 4’ x 12’ collectors per system). This reduction in size has little impact on the GHG analysis, but it does affect the calculation of the number of systems. Note that this reference system covers all unglazed, liquid-type collectors, and thus does include seasonal municipal or resort pools, which may have collector areas of 50 – 300 m². However, these commercial pools constitute well below 5% of the Canadian market, and they do perform similarly to the more common residential pools.
Commercial Air – This is a new reference system, based on the successful use of unglazed air collectors for preheating ventilation and makeup air in industrial, commercial and agricultural (livestock barns) applications. Within Canada, this is a strong market sector, and cannot be ignored. System sizes vary widely from below 50 m² to 10,000 m². For a reference system we have selected 200 m², because it is within the size range for both agricultural and industrial/commercial/institutional sectors, and should provide a reasonable estimate of the mean size of all systems.
4.3 GHG Emission Avoidance Calculations
Table 6 shows the calculations used to estimate the GHG emissions avoided due to all solar thermal systems operating in Canada at the end of 2005.
Table 6: Analysis of avoided GHG emissions, using f our reference systems, 2005
Parameter Residential DHW
Commercial Water
Residential Pool
Commercial Air
Collector type glazed glazed unglazed unglazed air
* The 150 L/d hot water usage used by Weiss is probably low for Canadian practice, but we chose to keep this value for consistency with international reports. Using a larger hot water draw (~225 L/d is more typical of actual hot water usage in Canada) would have increased the estimate of GHG avoided, but since DHW heating systems are a small segment of the Canadian market, the overall effect would be negligible.

Solar Thermal Industry Survey 2005 SAIC Canada (13031.B.01) NRCan-06-01019 December 2006 _________________________________________________________________________________________
Science Applications International Corporation (SAIC Canada)
17
Collector area (m²) 6 50 25 200
Annual yield per system (GJ/a) 9.9 82.1 19.4 422
Specific annual yield (GJ/a-m²) 1.65 1.64 0.78 2.11
Displaced fuel mix (%) • Oil (73 kg of CO2/GJ) 4% 15% 1% 5% • Natural gas (50 kg of CO2/GJ) 50% 75% 63% 50% • Propane (60 kg of CO2/GJ) -- 5% -- 40% • Electricity (151 kg of CO2/GJ) 46% 5% 12% 5% • Heat pump (38 kg of CO2/GJ) -- -- 24% -- • No fuel -- -- -- --
Blended CO2 avoided (kg of CO2/GJ) 97 59 59 60
Annual CO2 avoided (t/a-system) 0.96 4.84 1.14 25.3
Annual specific CO2 avoided (kg/a-m²) 160 97 46 127
Estimated system life (years) 20 20 20 30
Total operating collector area (m²) 9,236 3,000 321,381 85,280
Calculated number of systems 1,539 60 12,855 426
Total annual CO2 avoided (t/a) 1,478 291 14,784 10,831
Total annual CO2 avoided, all types (t/a) 27,383
4.4 Forecast GHG Emission Avoidance from Collectors sold in 2005
An alternative view of GHG emission avoidance - and one that is more representative of the current sales rate of solar thermal systems, rather than past sales - is to estimate the total GHG’s that will be avoided over the operating life of systems installed in the current year. Applying the same calculations in the previous section to the 61,558 m² of collectors installed in Canada during 2005, leads to the conclusion that 112,849 tonnes of CO2 equivalent will be saved over the lifetime of these systems (using a 20 year expected life for all water systems and a 30 year life for commercial air systems). Since the solar industry earned almost seven million dollars in revenue from domestic sales in 2005, this means that one tonne of CO2 is saved for every $60 of revenue (neglecting any service and repair revenue that may be earned over the life of the systems). Depending upon climatic conditions and displaced fuel data in the country of use, it is likely that the solar collectors exported from Canada during 2005 will be responsible for avoiding another 30,000 tonnes of CO2 equivalent, during their operating life.

Solar Thermal Industry Survey 2005 SAIC Canada (13031.B.01) NRCan-06-01019 December 2006 _________________________________________________________________________________________
Science Applications International Corporation (SAIC Canada)
18
5 REFERENCES
1) McClung, Larry et al, August 2005, Final Report Survey of Active Solar Thermal Collectors, Industry and Markets in Canada , SAIC Canada report no. CM001743.
2) Mayes, Fred et al, July 2005. Renewable Energy Trends 2004: With Preliminary Data for 2004 . Energy Information Administration, Office of Coal, Nuclear, Electric and Alternate Fuels, U.S. Department of Energy.
3) Mayes, Fred et al, July 2005. Renewable Energy Trends 2005: With Preliminary Data for 2005 . Energy Information Administration, Office of Coal, Nuclear, Electric and Alternate Fuels, U.S. Department of Energy.
4) Omboli, Eugène and McClenahan, Doug, 2002, NRCan In-house Survey of Solar Collectors for 1995 – 2001 , Natural Resources Canada.
5) Weiss, Werner; Bergmann, Irene and Faninger, Gerhard, February 2004. Solar Heating Worldwide: Markets and Contribution to the Energy Supply 2001 . IEA Solar Heating & Cooling Program.
6) Hubbard, Richard, 2005, Canadian Swimming Pool Industry: 2004 Market Report , Pool & Spa Marketing, spring 2005.
7) Hubbard, Richard, 2006, Canadian Swimming Pool Industry: 2005 Market Report , Pool & Spa Marketing, spring 2006.
8) Energy, Mines and Resources Canada, Energy in Canada 1986 Handbook
9) Sibbitt, Bruce, 2006, a summary of recent REDI-supported solar thermal installations in Canada, private communication

Science Applications International Corporation (SAIC Canada)
48
APPENDIX A – Survey Questionnaire

Canadian Solar Industries Association
L’Association des Industries Solaires du Canada
Suite 208 – 2378 Holly Lane
Ottawa, Ontario CANADA K1V 7P2
téléphone : 1-613-736-9077
1-866-522-6742
télécopie : 1-613-736-8938
courriel : [email protected]
www.cansia.ca
SURVEY OF THE COMMERCIAL ACTIVITIES IN THE
ACTIVE SOLAR THERMAL INDUSTRY IN CANADA
February 14, 2006
Dear solar industry colleague,
Last year at this time, the Canadian Solar Industries Association (CanSIA) assisted in an industry survey
sponsored by Natural Resources Canada. Many of you completed the survey forms, and for this we thank
you. The results of this effort were presented at the CanSIA conference in November 2005 and a summary
is included in this mailing. Among the findings of this survey:
In 2004, the Canadian solar thermal market grew by over 40%, almost double the 22% increase in
the U.S. market, and well above most other IEA member countries.
In the past three years, the total capacity of solar thermal collectors operating in Canada increased
by over 50%, from 170 MWTH in 2001 to 258 MWTH in 2004.
The revenue earned by the solar industry in Quebec is now more than double the Canadian
average, on a per capita basis, due to the recent growth in systems using air collectors.
For those of you who wish to review last year’s survey results in more detail, the complete report is
available for download from the REDI website:
English: http://www2.nrcan.gc.ca/es/erb/erb/english/View.asp?x=469&oid=1183
The questionnaire for this year’s survey is enclosed. CanSIA believes that a sound information base is one
of our most effective tools for influencing government actions and public opinion and I would encourage
you to complete this form before the due date of March 31. I realize that this survey is arriving at a busy
time of year, but it is important to provide timely information to Canada’s public policy makers. The
questionnaire has been shortened and simplified from last year’s survey.
CanSIA has carefully reviewed the process of data collection to insure that strict confidentiality is
maintained. NRCan, CanSIA and the survey analysis only receive aggregated total results and your
individual firm’s data will not be released to anyone. SAIC has developed a confidentiality protocol
(available on request) which I feel will insure the confidentiality of your information.
I thank you for your participation in this important initiative and I believe it will be an invaluable tool for
the industry in developing long term plans for its growth in the future.
Yours truly,
Rob McMonagle
Executive Director

ID No. To be assigned during processing
Confidential when completed Solar Thermal Collector Survey 2005, Page 1
Questionnaire
Solar Thermal Collector Survey
Calendar Year 2005
Please note that, for the purpose of this survey, active Solar Thermal (ST) includes
activity pertaining to solar collector-based systems only. Any solar technology that
does not incorporate manufactured solar collectors – such as most passive solar
applications – is beyond the scope of this survey.
Please enter company contact information:
COMPANY
ADDRESS
NAME
TITLE
TELEPHONE
FAX
DEADLINE FOR COMPLETION IS MARCH 31, 2006
Completed surveys should be returned to:
Sandi Mish SAIC Canada Suite 1516, 60 Queen Street Ottawa, Ontario K1P 5Y7 Tel: (613) 563-7242 Fax:(613) 563-3399 toll-free number: 1-888-SAIC-CAN e-mail: [email protected]

ID No. To be assigned during processing
Confidential when completed Solar Thermal Collector Survey 2005, Page 2
1. Please provide some profile information pertaining to your Solar Thermal business. Which of the
following business segments were/are applicable to your organization for the calendar years 2004 and
2005?
Business Segments 2004 2005
a. ST Collector Manufacturer
b. ST System Component Manufacturer
c. ST Collector Importer
d. ST System Components Importer
e. Wholesale Distributor
f. Retailer/installer
g. Other: Design/consulting services: Please describe:
2. a) Please estimate the time spent on ST activities of all employees (full and part-time), and contractors,
to provide the number of full-time employee equivalents.
Person-years in 2005
b) Including full-time, part-time and seasonal staff, but excluding contractors, what was the peak
number of persons employed at any single time during 2005? ____________
3. In 2005, what proportion of your organization’s total revenue was from active solar thermal business?
_________%

ID No. To be assigned during processing
Confidential when completed Solar Thermal Collector Survey 2005, Page 3
4. In addition to solar thermal, please indicate if your business was involved in any of the following
business segments in 2005. Check all that apply in the left column; in the right column, check only
one, and only if you would describe one of these as your primary area of business.
Business Segments Some
Involvement
Primary
Business
Other renewable energy (e.g. PV, wind, wood stoves, etc.)
Swimming pool sales and installation
Plumbing contractor
HVAC contractor
HVAC equipment manufacturer or distributor
Building contractor
Other building trades
Other
5. Please report your total revenue earned from solar thermal activities, and then provide the percentage
of this revenue that was earned from various types of sales. For this table, please include all types of
revenue related to ST activities (e.g. product sales, service contracts, installation fees, consulting
revenues).
Total Sales Revenue
from Solar Thermal
Activities
$
Revenue from
All Export Sales
Revenue from Sales to
Domestic Re-sellers
Revenue from Sales
Direct to
Domestic End Users
Revenue from
Other Sales
% % % %
6. Compared to this year, does your organization expect more, less or about the same revenues in the ST
collector and components sales and services area over the next 2 years?
Remain the same
Increase by ___________% average per year
Decrease by __________% average per year

ID No. To be assigned during processing
Confidential when completed Solar Thermal Collector Survey 2005, Page 4
7. Please report collector sales in two units, square metres and dollars. If your business involved the sale
of complete systems, or related services or components along with solar collectors, please report the
total revenue earned for the sale, in the most appropriate column.
Collector Type
Air Liquid Sales
Glazed Unglazed Evacuated Glazed Unglazed
Collector area
(m²)
Revenue
($)

ID No. To be assigned during processing
Confidential when completed Solar Thermal Collector Survey 2005, Page 5
8. Please provide a percentage distribution, by collector type, of dollar sales by application. If you
where wholesaling the product to re-sellers, and are unaware of the final application, please report
these shipments in the “unknown” category.
Collector Type
Air Liquid Sector Application
Glazed Unglazed Evacuated Glazed Unglazed
Pool % % % % %
DHW % % % % %
Space % % % % %
Res
iden
tia
l
Combined/other (includes hot tubs)
% % % % %
Pool % % % % %
DHW % % % % %
Process heat % % % % %
Space heat % % % % %
Ind
ust
rial/
C
om
mer
cial/
Inst
itu
tion
al
Combined/other % % % % %
Unknown/Wholesale % % % % %
Total 100% 100% 100% 100% 100%

ID No. To be assigned during processing
Confidential when completed Solar Thermal Collector Survey 2005, Page 6
9. Please provide details on the geographic area to which the ST Collectors were shipped/sold. Within
each region, please report the distribution of collector types, by percentage. Example: If you sold
$40,000 of liquid unglazed collectors plus $10,000 of liquid glazed collectors into the Atlantic region,
report regional sales as $50,000, and then write 80% beside “liq-UNGL” and 20% beside “liq-
GLAZ”.
Domestic Sales Export Sales
Region Revenue
($)
Type
(%) Region
Revenue
($)
Type
(%)
air-GLAZ air-GLAZ
air-UNGL air-UNGL
liq-EVAC liq-EVAC
liq-GLAZ liq-GLAZ
Atlantic Provinces
lig-UNGL
United States
liq-UNGL
air-GLAZ air-GLAZ
air-UNGL air-UNGL
liq-EVAC liq-EVAC
liq-GLAZ liq-GLAZ
Ontario
liq-UNGL
Central & South
America, Mexico,
Caribbean
liq-UNGL
air-GLAZ air-GLAZ
air-UNGL air-UNGL
liq-EVAC liq-EVAC
liq-GLAZ liq-GLAZ
Quebec
liq-UNGL
Europe
liq-UNGL
air-GLAZ air-GLAZ
air-UNGL air-UNGL
liq-EVAC liq-EVAC
liq-GLAZ liq-GLAZ
Prairie Provinces
liq-UNGL
Asia, Middle East
liq-UNGL
air-GLAZ air-GLAZ
air-UNGL air-UNGL
liq-EVAC liq-EVAC
liq-GLAZ liq-GLAZ
British Columbia
liq-UNGL
Africa
liq-UNGL
air-GLAZ air-GLAZ
air-UNGL air-UNGL
liq-EVAC liq-EVAC
liq-GLAZ liq-GLAZ
Northern
liq-UNGL
Australia, New
Zealand, Oceania
liq-UNGL

ID No. To be assigned during processing
Confidential when completed Solar Thermal Collector Survey 2005, Page 7
10. Please list your sources of ST collectors, including in-house manufacturing. For calculation purposes,
use dollar value of ST collectors from all sources for the year as 100%. Use an additional sheet, if
needed.
11. Have there been any changes in your business during 2005 (e.g. merger, acquisition, etc.) that have
had a significant impact on solar thermal sales from previous years? If so, please describe the change
briefly.
Collector Source Collector
Type(s)† Supplier Name Supplier Location*
% of total
supply
Manufactured
In-house n/a n/a
Purchased
Within Canada
Purchased
Outside Canada
Total 100%
† Please use the five collector types used in questions 7, 8 and 9.
* Please use a Canadian or global region from the table in question 9 (e.g. Atlantic provinces).

Instructions Solar Thermal Collector Survey
Calendar Year 2005
General Instructions and Explanations
1. If your firm earns no revenue from solar thermal activities, please complete the company
details section on page 1, write “no ST business” on it, and fax page 1 to SAIC Canada.
Your company name will be removed from the survey distribution list for future years.
2. All responses should be by calendar year, not fiscal year.
3. All dollar values should exclude sales taxes.
4. All dollar values may be rounded off to the nearest thousand.
5. To determine the date a sale occurred, please use the date that you booked the revenue for
the sale (e.g., the invoice date).
.
Instructions and Explanations Relating to Individual Questions
Q4 If you check the “other” category for either “some involvement” or “primary business”,
it is not necessary to indicate the nature of this business.
Q5 This is the only question that requests revenue data for purely service or other non-
collector related sales.
Q7-10 If your business does not sell solar collectors, you may skip questions 7 through 10.
Q7 The revenue figures in this table should exclude any revenue that is not associated with
a particular collector type (e.g. a study of various solar heating projects). Thus the total
of all revenue values in this table may be lower than the total revenue reported in Q5.
Q8 Note that the values in each column must add to 100%, which should equate to the
revenue reported by collector type in Q7.
If you sold collectors to a re-seller, please report by the location of the re-seller, not the
ultimate destination of the products.
Q9 Atlantic – Newfoundland, Nova Scotia, Prince Edward Island & New
Brunswick
Prairie – Manitoba, Saskatchewan & Alberta
Northern – Yukon, North West Territories & Nunavut
Q10 Please note that this question is asking for the source of purchased, completed solar
collectors, whether imported or purchased domestically. If you manufacture solar
collectors, it is not necessary to report the source of the various materials.
Inquiries
If you have questions about any facet of this survey, please direct them to the SAIC Canada
employee identified on page 1 of the survey document.

Confidentiality Protocol:
Project Name: Solar Thermal Industry Survey
Version #: 2
Plan Date: January 7, 2005
SAIC Project Number: 10806.B.01
CM Number: 001712
Plan Sign-Off
Protocol Review by: _______________________ Date: __________________
Larry McClung
Protocol Audit by: _______________________ Date: __________________
Ken Donovan
Project Manager: _______________________ Date:___________________
Bill Wong
A. Protocol management plan
A-1 Project scope and requirements
This document defines the procedure for handling completed surveys and the data that they contain, after
they are received by SAIC Canada (in paper form), and of any electronic or hardcopy documents derived
from the survey documents. The primary purpose of this protocol is to ensure confidentiality of the data
supplied by individual respondents.
A-2 Approach
Natural Resources Canada (as the commissioning agent), SAIC Canada (as the prime contractor), and
Simhan Research Associates and CanSIA (as subcontractors) all recognize the absolute necessity of
maintaining the confidentiality of data submitted by respondents to the solar thermal collector survey. This
protocol, detailing how the data will be handled, has been developed to ensure that the strictest
confidentiality is maintained throughout the data gathering and reporting process.
An essential element for ensuring confidentiality is the physical arrangement of the Ottawa area offices of
SAIC Canada. SAIC Canada maintains two widely separated offices in the Ottawa area, at 335 River Road
South and at 60 Queen Street. The River Road facility houses the staff of the Renewable Energy and
Climate Change Program, who oversaw the development of the survey, and who will be involved in
analysis and reporting of aggregate data, but who will have no access to sensitive data such as individual
survey responses. The survey responses are to be sent directly to our Queen Street facility, where a small
number of the staff have been specifically trained to handle the sensitive survey data, and deliver it to
authorized staff of Simhan Research, an independent subcontractor who will analyze and aggregate the data
into reports that contain no sensitive information. These reports will be the only survey data available to the
staff of SAIC’s Renewable Energy and Climate Change Program, to CanSIA staff, and to NRCan.

A-3 Definitions
A “completed survey” shall be considered any survey document (paper) received from a respondent that
contains one or more answers, complete or partial, to any of the survey questions.
The “survey log” is a password-protected, electronic file that cross-references the survey respondent’s
administrative information with their assigned ID number. It resides on a computer at SAIC Canada’s 60
Queen Street facility, and is backed up following standard procedures.
The “survey database” is a password-protected, electronic file containing all survey data. It resides on a
computer at the offices of Simhan Research Associates, and is backed up following standard procedures.
The “secure file area” refers to a locked, restricted access filing facility located at SAIC Canada’s 60
Queen Street facility.
A-4 Project team structure.
Completed surveys are to be handled only by persons specifically authorized in the following table
(“authorized personnel”), and only for the purposes outlined within this document. No other person shall be
permitted to handle or view any portion of the completed surveys.
Role Personnel
Survey administrator Sandi Mish, SAIC Canada
Gerry Clermont, SAIC Canada
Survey assistant analyst Anna Mastilovic, SAIC Canada
Monica Hornof, SAIC Canada
Survey chief analyst Vasantha Narasimhan, Simhan Research Associates
Perfecto Vélez Macho, Simhan Research Associates
Protocol Auditor Ken Donovan, SAIC Canada
B. Permissions and Restrictions
1. Only the listed administrators and assistant analysts have permission to access or view the
originals of the completed surveys.
2. Only the listed administrators and assistant analysts have permission to produce a photocopy of a
completed survey, and only one photocopy of a completed survey shall exist at any time.
3. Only the listed administrators and assistant analysts have permission to access or view the survey
log.
4. No hardcopy of the survey log shall be permitted, unless it is either filed in the secure area, or
destroyed by the individual who created it, prior to the close of business on the day it was created.
5. Only listed administrators, assistant analysts and chief analysts are permitted to access or view any
data from a single respondent, or any aggregate data that is from a sufficiently small sample that
identification of data from individual respondents becomes a risk.
6. Only the listed chief analysts shall access the survey database.
7. All SAIC Canada employees who are members of the Renewable Energy and Climate Change
Program are specifically prohibited from any access to sensitive survey data.
8. Similarly, all NRCan staff and all CanSIA staff are specifically prohibited from any access to
sensitive survey data.
9. Notwithstanding any of the above, the auditor is permitted to access any and all documents judged
necessary to verify compliance with this protocol.

C. Project operations plan.
C-1 Procedures during the survey process.
Step Task Description Responsibility
1 Receive and open completed surveys. Assign respondent ID number, and enter on
every page of the survey original. Enter respondent’s data into the survey log.
Administrator
2 Ensure that respondent’s name and contact info appear only on page 1 of the
original. Produce a single photocopy, omitting page 1. File the original document
in the secure file area.
Administrator
3 Review the photocopy for completeness and readability. Assistant Analyst
4 Issue acknowledgement of receipt to the respondent, requesting clarifications or
additions, if necessary.
Assistant Analyst
5 Enter data into the database; produce and analyze preliminary reports. Chief Analyst
6 Review data for consistency. Request assistant analysts to perform additional
follow up with respondents, as necessary.
Chief Analyst
7 Request clarifications and/or additional data from respondents, as necessary. Assistant Analyst
8 Once sufficient data is entered to ensure the confidentiality of individual
respondents, produce consolidated reports to share with the full survey team.
Chief Analyst
9 Verify compliance with this protocol. Auditor
C-2 Survey Wrap-up Procedures.
Step Task Description Responsibility
1 Make two electronic copies of the survey database (on CD or other suitable
media) and delete all electronic versions of the survey database.
Chief Analyst
2 Return both copies of the survey database, along with all copies of completed
surveys, to SAIC Canada’s facility at 60 Queen Street.
Chief Analyst
3 Destroy the photocopies of all completed surveys. Record destruction in the
survey log.
Assistant Analyst
4 Make two electronic copies (on CD or other suitable media), plus one hardcopy,
of the survey log.
Administrator
5 File the copies of the survey database and the survey log in the secure filing area Administrator
6 The survey auditor is to issue a report evaluating compliance with this protocol.
This report will be included with the final project report.
Auditor
7 The original copies of the completed surveys, and the copies of the survey log and
the survey database, are to be kept for two years after project completion, after
which they will be destroyed. Originators to be informed of destruction of
material.
Administrator