final report flood data analysis lincoln county, … report flood data analysis lincoln county, new...
TRANSCRIPT
Final Report
Flood Data Analysis Lincoln County, New Mexico FEMA-1783-DR-NM July 2009
Federal Emergency Management Agency Department of Homeland Security 500 C Street, SW Washington, DC 20472
This document was prepared by URS Group, Inc. One Park Square 6501 Americas Parkway NE. Albuquerque, NM 87110 and 200 Orchard Ridge Drive, Suite 101 Gaithersburg, MD 20878 Contract No. HSFEHQ-06-D-0162 Task Order No. HSFEHQ-09-J-0005 15707405 Prepared for Federal Emergency Management Agency Washington, DC

TABLE OF CONTENTS
i
ACRONYMS AND ABBREVIATIONS ......................................................................................................... iii
SECTION ONE INTRODUCTION ....................................................................................................... 1-1 1.1 Standards and Deliverables...................................................................... 1-5 1.2 Quality Assurance and Control................................................................ 1-5
SECTION TWO DATA COLLECTION................................................................................................. 2-1
SECTION THREE FIELD SURVEY AND RECONNAISSANCE ............................................................. 3-1 3.1 Cross-Section Surveys ............................................................................. 3-1 3.2 Culvert Surveys........................................................................................ 3-3 3.3 Bridge Surveys......................................................................................... 3-4 3.4 Drop Structure Surveys.......................................................................... 3-10 3.5 Dam Surveys.......................................................................................... 3-11 3.6 Elevation Reference Marks.................................................................... 3-11
SECTION FOUR TOPOGRAPHIC DATA DEVELOPMENT ................................................................. 4-1 4.1 Acquisition............................................................................................... 4-1 4.2 Processing ................................................................................................ 4-1 4.3 Data Evaluation........................................................................................ 4-2
SECTION FIVE HYDROLOGIC ANALYSES ...................................................................................... 5-1 5.1 Modeling Methodology ........................................................................... 5-2 5.2 Drainage Basin Area Delineation ............................................................ 5-2 5.3 Parameters................................................................................................ 5-3 5.4 Discharges................................................................................................ 5-4
SECTION SIX HYDRAULIC ANALYSES ......................................................................................... 6-1 6.1 Modeling Methodology ........................................................................... 6-1 6.2 Cross-Section Development..................................................................... 6-1 6.3 Floodway Analysis................................................................................... 6-1 6.4 Manning’s Roughness Coefficient Calculations...................................... 6-2 6.5 Modeling Considerations and Other Model Parameters.......................... 6-2
SECTION SEVEN RESULTS .................................................................................................................. 7-1 7.1 Exceptions................................................................................................ 7-1 7.2 Floodplain Mapping................................................................................. 7-1 7.3 Flood Profiles........................................................................................... 7-1
SECTION EIGHT REFERENCES .......................................................................................................... 8-1

TABLE OF CONTENTS
ii
Tables Table 1-1: Study Streams............................................................................................................. 1-1
Table 3-1: List of Surveyed Cross-Sections for the Study Reaches ............................................ 3-1
Table 3-2: List of Limited Detail Structures................................................................................ 3-5
Table 3-3: List of Detailed Structures.......................................................................................... 3-7
Table 3-4: List of Drop Structures ............................................................................................. 3-10
Table 3-5: List of Elevation Reference Marks for Detailed Surveys......................................... 3-11
Table 5-1: Flow Calculation Methodology Comparison for Rio Ruidoso .................................. 5-2
Table 5-2: Hydrology Parameters................................................................................................ 5-3
Table 5-3: Summary of Discharges ............................................................................................. 5-4
Table 6-1: Manning’s n-Values ................................................................................................... 6-2
Figures Figure 1-1: Lincoln County Study Area ...................................................................................... 1-3
Figure 1-2: Panel Layout ............................................................................................................. 1-4
Appendices Appendix A Quality Assurance Procedures
Appendix B Topographic Data
Appendix C Field Survey and Reconnaissance
Appendix D Hydrology
Appendix E Hydraulics
Appendix F Flood Recovery Maps and Profiles
Appendix G Supplementary Data

Acronyms and Abbreviations
iii
CBC Concrete Box Culvert
cfs Cubic Feet per Second
CMP Corrugated Metal Pipe
DEM Digital Elevation Model
DFIRM Digital Flood Insurance Rate Map
DTM Digital Terrain Model
ERM Elevation Reference Mark
FEMA Federal Emergency Management Agency
FIPS Federal Information Processing Standards
FIRM Flood Insurance Rate Map
FIS Flood Insurance Study
GIS Geographic Information Systems
G&S FEMA’s Guidelines and Specifications for Flood Hazard Mapping Partners
HARN High-Accuracy Reference Network
HEC-HMS Hydrologic Engineering Center Hydrologic Modeling System
HEC-RAS Hydrologic Engineering Center River Analysis System
HMTAP Hazard Mitigation Technical Assistance Program
IDIQ Indefinite Delivery Indefinite Quantity
ITR Independent Technical Review
LDS Limited Detail Study
MAPVI Mapping Alliance Partnership VI
NAD83 North American Datum of 1983
NAVD88 North American Vertical Datum of 1988
NGVD29 National Geodetic Vertical Datum of 1929
NRCS Natural Resources Conservation Service
SCS Soil Conservation Service
SIR Scientific Investigations Report
TIN Triangulated Irregular Network
TOC Task Order Coordinator
TOM Task Order Monitor
USACE U.S. Army Corps of Engineers
USGS U.S. Geological Survey
WISE Watershed Information System
Introduction
1-1
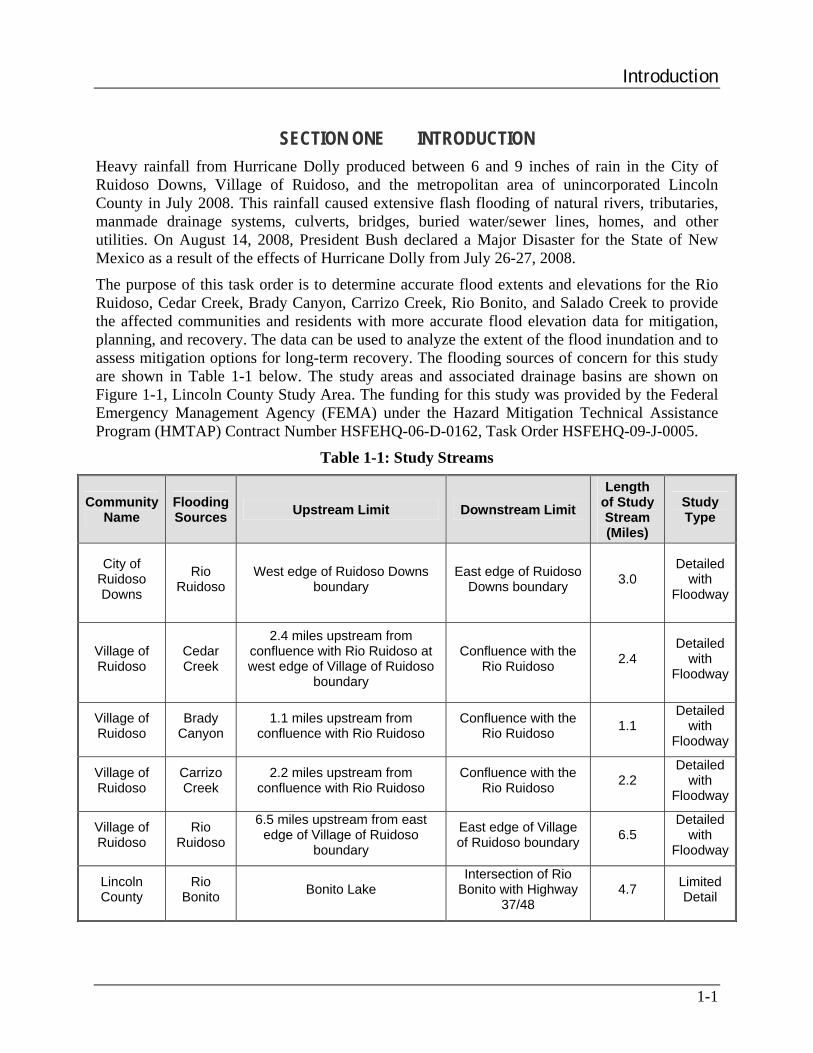
SECTION ONE INTRODUCTION Heavy rainfall from Hurricane Dolly produced between 6 and 9 inches of rain in the City of Ruidoso Downs, Village of Ruidoso, and the metropolitan area of unincorporated Lincoln County in July 2008. This rainfall caused extensive flash flooding of natural rivers, tributaries, manmade drainage systems, culverts, bridges, buried water/sewer lines, homes, and other utilities. On August 14, 2008, President Bush declared a Major Disaster for the State of New Mexico as a result of the effects of Hurricane Dolly from July 26-27, 2008.
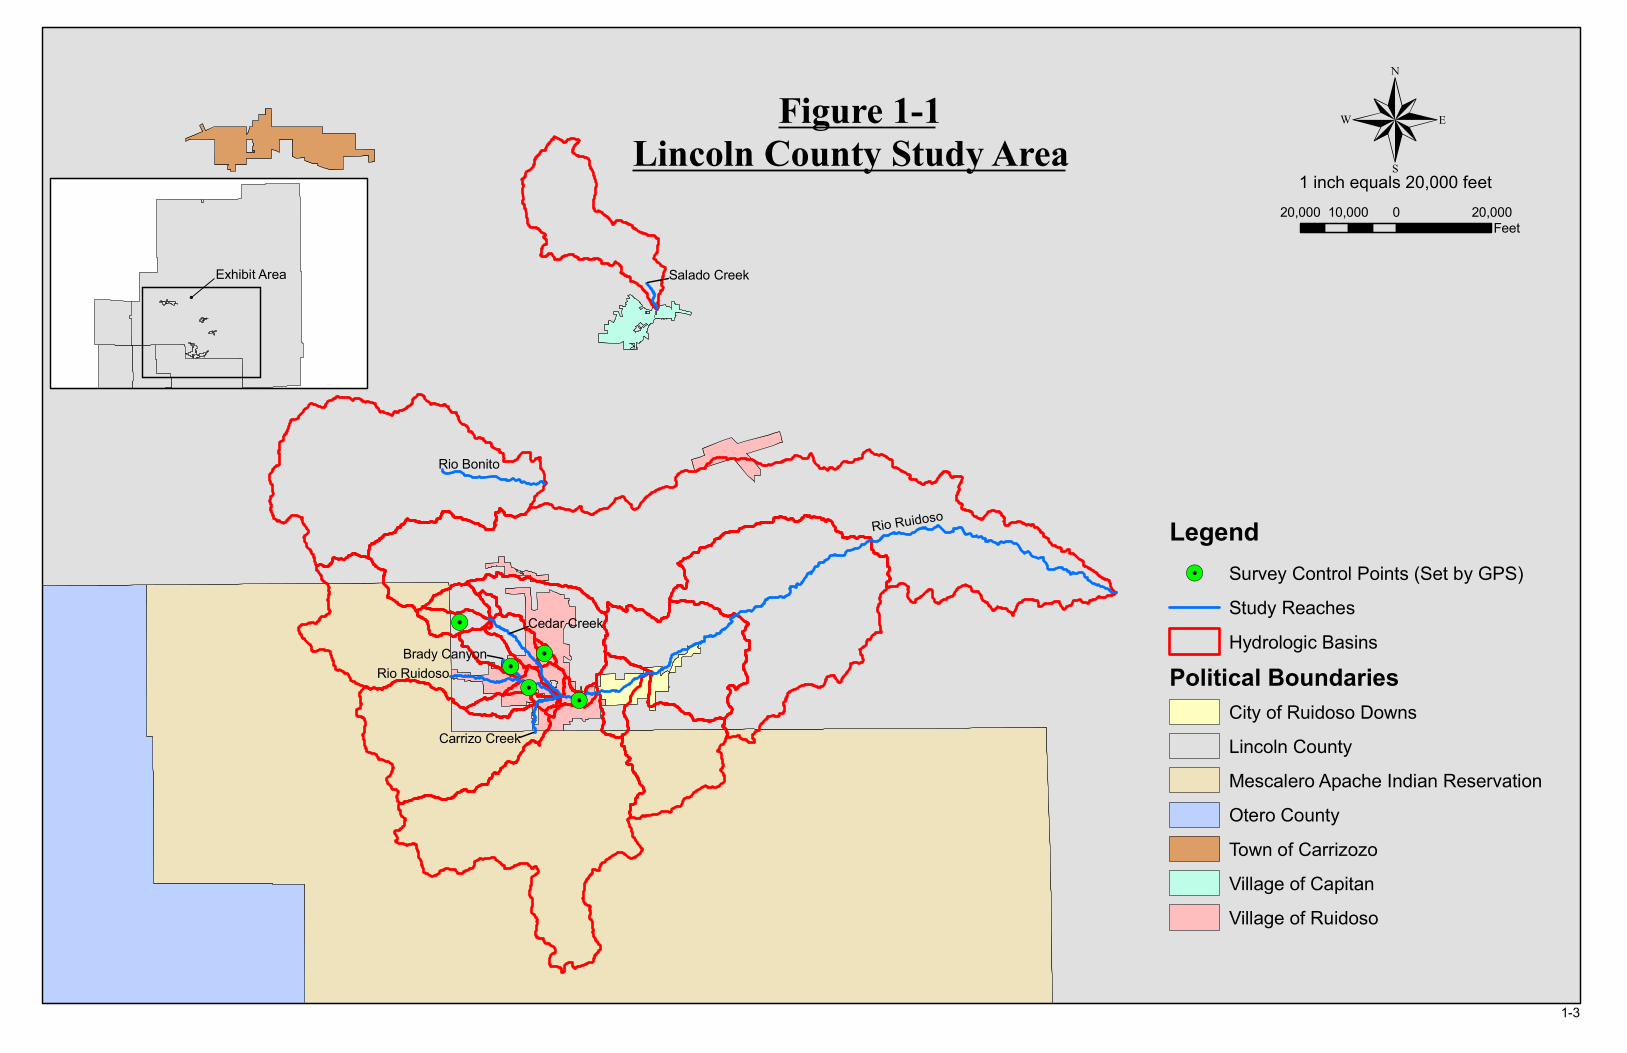
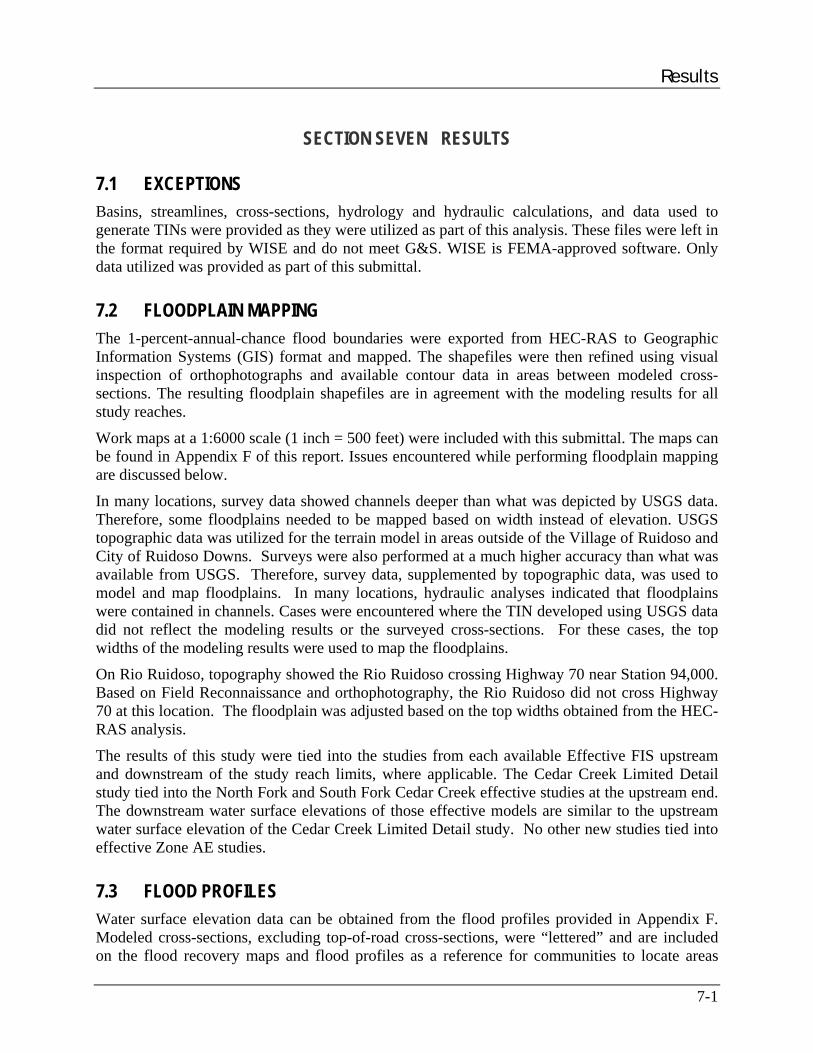
The purpose of this task order is to determine accurate flood extents and elevations for the Rio Ruidoso, Cedar Creek, Brady Canyon, Carrizo Creek, Rio Bonito, and Salado Creek to provide the affected communities and residents with more accurate flood elevation data for mitigation, planning, and recovery. The data can be used to analyze the extent of the flood inundation and to assess mitigation options for long-term recovery. The flooding sources of concern for this study are shown in Table 1-1 below. The study areas and associated drainage basins are shown on Figure 1-1, Lincoln County Study Area. The funding for this study was provided by the Federal Emergency Management Agency (FEMA) under the Hazard Mitigation Technical Assistance Program (HMTAP) Contract Number HSFEHQ-06-D-0162, Task Order HSFEHQ-09-J-0005.
Table 1-1: Study Streams
Community Name
Flooding Sources Upstream Limit Downstream Limit
Length of Study Stream (Miles)
Study Type
City of Ruidoso Downs
Rio Ruidoso
West edge of Ruidoso Downs boundary
East edge of Ruidoso Downs boundary 3.0
Detailed with
Floodway
Village of Ruidoso
Cedar Creek
2.4 miles upstream from confluence with Rio Ruidoso at west edge of Village of Ruidoso
boundary
Confluence with the Rio Ruidoso 2.4
Detailed with
Floodway
Village of Ruidoso
Brady Canyon
1.1 miles upstream from confluence with Rio Ruidoso
Confluence with the Rio Ruidoso 1.1
Detailed with
Floodway
Village of Ruidoso
Carrizo Creek
2.2 miles upstream from confluence with Rio Ruidoso
Confluence with the Rio Ruidoso 2.2
Detailed with
Floodway
Village of Ruidoso
Rio Ruidoso
6.5 miles upstream from east edge of Village of Ruidoso
boundary
East edge of Village of Ruidoso boundary 6.5
Detailed with
Floodway
Lincoln County
Rio Bonito Bonito Lake
Intersection of Rio Bonito with Highway
37/48 4.7 Limited
Detail
Introduction
1-2
Community Name
Flooding Sources Upstream Limit Downstream Limit
Length of Study Stream (Miles)
Study Type
Lincoln County
Cedar Creek
2.0 miles upstream from Village of Ruidoso boundary
West edge of Village of Ruidoso boundary 2.0 Limited
Detail
Lincoln County
Rio Ruidoso
East Edge of Ruidoso Downs boundary
Confluence with the Rio Hondo 22.8 Limited
Detail
Lincoln County
Salado Creek
0.9 mile upstream from confluence with Oso Creek
Confluence with Oso Creek 1.3 Limited
Detail
Collecting and assessing flood data and preparing flood recovery maps are activities outside of FEMA’s regular flood hazard mapping operations. However, these activities must take place in the immediate aftermath of a disaster. When a flood occurs, valuable data become available that enable FEMA and its contractors to reassess the estimates of flood risk. Also, rebuilding efforts begin within a short period after a disaster, and timely, updated flood risk data are necessary to ensure that the rebuilding will protect properties from future flooding disasters. The new data need to be evaluated and, if necessary, incorporated into new engineering analyses. Appropriate hazard identification tools (such as flood recovery maps) must be produced quickly. In some cases, there may not be any existing detailed flood mapping at all, and flood recovery maps may be the only detailed guidance to assist the State and community in planning and managing rebuilding efforts. The results of this study are flood recovery maps showing the extent of the flood hazards, and flood profiles with elevation data. Study information for each task is included in Appendices A-F. The flood recovery maps and flood profiles are included in Appendix F. The flood recovery map panel layout is shown on Figure 1-2, Panel Layout.
!.
!.
!.!.
!.Brady Canyon
Carrizo Creek
Rio Ruidoso
Rio Ruidoso
Rio Bonito
Cedar Creek
Salado Creek
1 inch equals 20,000 feet
Figure 1-1Lincoln County Study Area ®
20,000 0 20,00010,000Feet
Legend!. Survey Control Points (Set by GPS)
Study ReachesHydrologic Basins
Political BoundariesCity of Ruidoso DownsLincoln CountyMescalero Apache Indian ReservationOtero CountyTown of CarrizozoVillage of CapitanVillage of Ruidoso
Exhibit Area
!
1-3

Rio Ruidoso
Rio Ruidoso
Rio Bonito
Cedar Creek
Carrizo Creek
Salado Creek
Brady Canyon
2
9
6
8
1
4
3
7
5
11 13
1415
12
10
1 inch equals 12,000 feet
Figure 1-2Panel Layout ®
12,000 0 12,0006,000Feet
LegendStudy ReachesLincoln County Flood Recovery Panels
Political BoundariesCity of Ruidoso DownsLincoln CountyMescalero Apache Indian ReservationVillage of CapitanVillage of Ruidoso
Exhibit Area
!
1-4

Introduction
1-5
1.1 STANDARDS AND DELIVERABLES All tasks were performed in accordance with the standards specified in FEMA’s Guidelines and Specifications for Flood Hazard Mapping Partners (G&S).
URS makes the following products available to FEMA:
• Digital copies of all hydrologic and hydraulic modeling (input and output) files for the 1-percent-annual-chance storm event.
• Digital and hardcopy versions of the Summary of Discharge Table presenting discharge data for the flooding sources for which hydrologic analysis were performed.
• Digital profiles of the applicable water surface elevations representing the existing conditions.
• Digital and hardcopy flood data analysis (work maps) at a scale of 1 inch = 500 feet on base maps readily available, showing the recommended flood recovery boundaries and flood elevations.
• Other materials, as specified in the national standards, including all notes, work maps, assumptions, and modeling performed by URS, with appropriate certifications.
1.2 QUALITY ASSURANCE AND CONTROL All tasks were performed in accordance with the URS quality procedures. A detailed explanation of these procedures is listed in Appendix A.
Data Collection
2-1
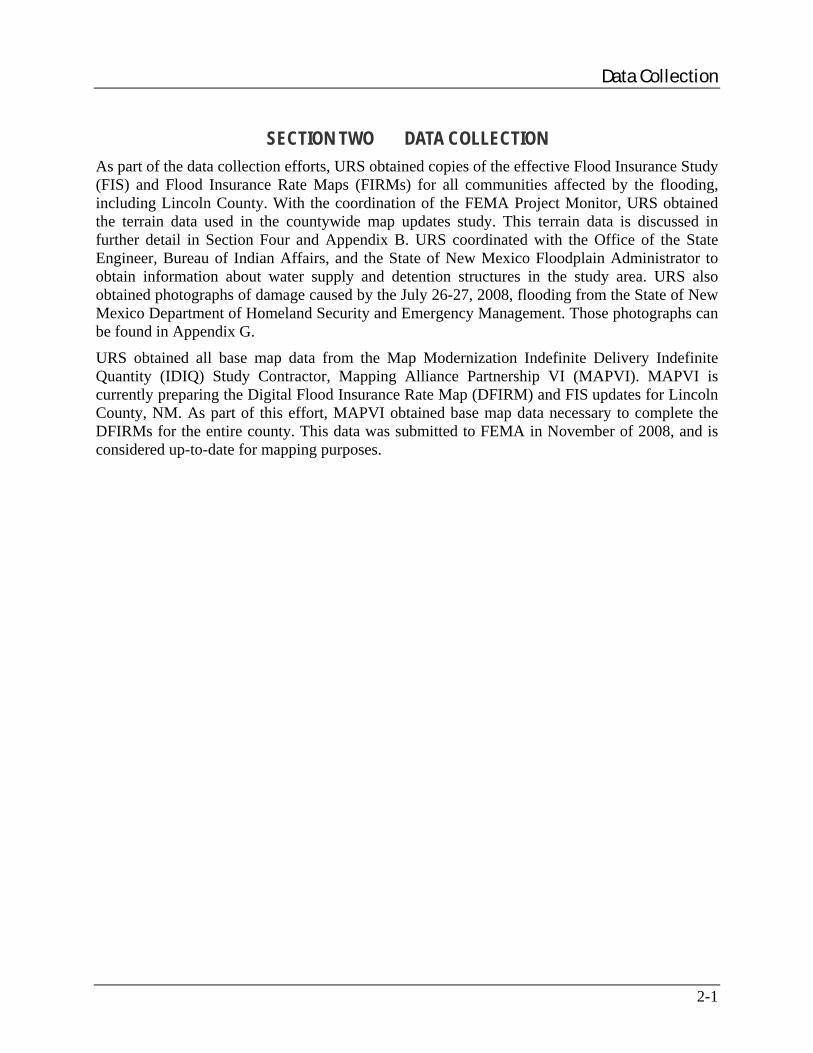
SECTION TWO DATA COLLECTION As part of the data collection efforts, URS obtained copies of the effective Flood Insurance Study (FIS) and Flood Insurance Rate Maps (FIRMs) for all communities affected by the flooding, including Lincoln County. With the coordination of the FEMA Project Monitor, URS obtained the terrain data used in the countywide map updates study. This terrain data is discussed in further detail in Section Four and Appendix B. URS coordinated with the Office of the State Engineer, Bureau of Indian Affairs, and the State of New Mexico Floodplain Administrator to obtain information about water supply and detention structures in the study area. URS also obtained photographs of damage caused by the July 26-27, 2008, flooding from the State of New Mexico Department of Homeland Security and Emergency Management. Those photographs can be found in Appendix G.
URS obtained all base map data from the Map Modernization Indefinite Delivery Indefinite Quantity (IDIQ) Study Contractor, Mapping Alliance Partnership VI (MAPVI). MAPVI is currently preparing the Digital Flood Insurance Rate Map (DFIRM) and FIS updates for Lincoln County, NM. As part of this effort, MAPVI obtained base map data necessary to complete the DFIRMs for the entire county. This data was submitted to FEMA in November of 2008, and is considered up-to-date for mapping purposes.
Field Survey and Reconnaissance
3-1
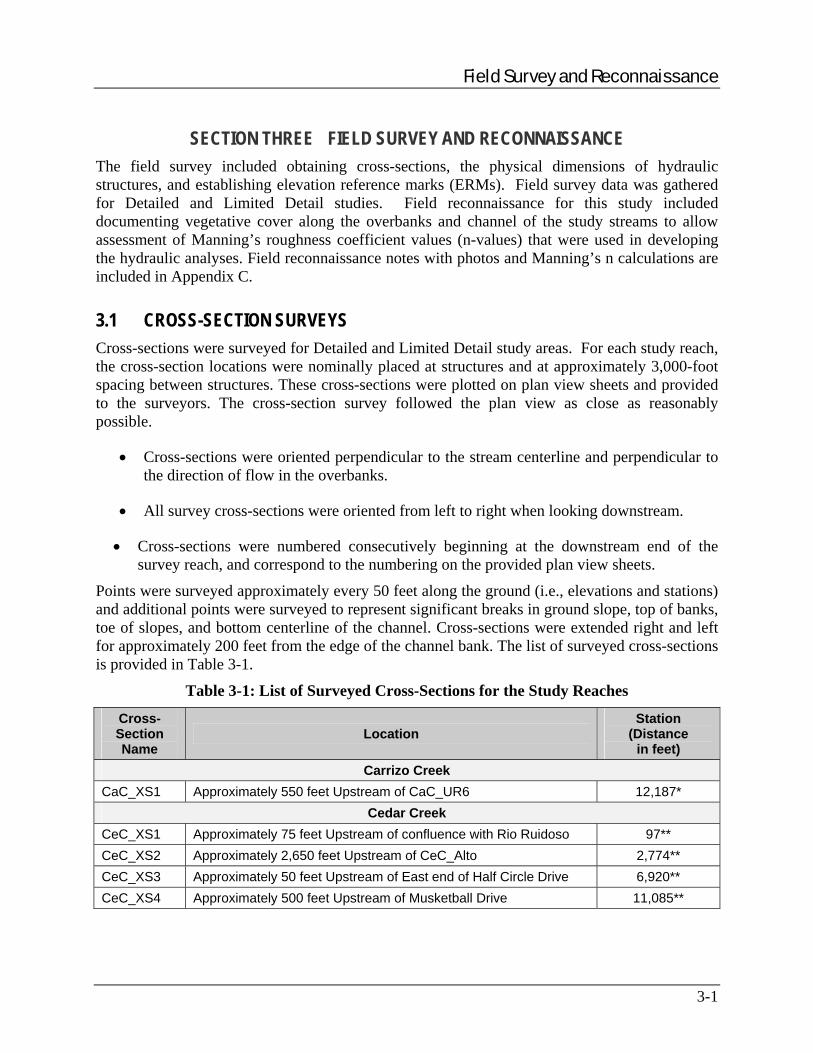
SECTION THREE FIELD SURVEY AND RECONNAISSANCE The field survey included obtaining cross-sections, the physical dimensions of hydraulic structures, and establishing elevation reference marks (ERMs). Field survey data was gathered for Detailed and Limited Detail studies. Field reconnaissance for this study included documenting vegetative cover along the overbanks and channel of the study streams to allow assessment of Manning’s roughness coefficient values (n-values) that were used in developing the hydraulic analyses. Field reconnaissance notes with photos and Manning’s n calculations are included in Appendix C.
3.1 CROSS-SECTION SURVEYS Cross-sections were surveyed for Detailed and Limited Detail study areas. For each study reach, the cross-section locations were nominally placed at structures and at approximately 3,000-foot spacing between structures. These cross-sections were plotted on plan view sheets and provided to the surveyors. The cross-section survey followed the plan view as close as reasonably possible.
• Cross-sections were oriented perpendicular to the stream centerline and perpendicular to the direction of flow in the overbanks.
• All survey cross-sections were oriented from left to right when looking downstream.
• Cross-sections were numbered consecutively beginning at the downstream end of the survey reach, and correspond to the numbering on the provided plan view sheets.
Points were surveyed approximately every 50 feet along the ground (i.e., elevations and stations) and additional points were surveyed to represent significant breaks in ground slope, top of banks, toe of slopes, and bottom centerline of the channel. Cross-sections were extended right and left for approximately 200 feet from the edge of the channel bank. The list of surveyed cross-sections is provided in Table 3-1.
Table 3-1: List of Surveyed Cross-Sections for the Study Reaches
Cross-Section Name
Location Station
(Distance in feet)
Carrizo Creek CaC_XS1 Approximately 550 feet Upstream of CaC_UR6 12,187*
Cedar Creek CeC_XS1 Approximately 75 feet Upstream of confluence with Rio Ruidoso 97** CeC_XS2 Approximately 2,650 feet Upstream of CeC_Alto 2,774** CeC_XS3 Approximately 50 feet Upstream of East end of Half Circle Drive 6,920** CeC_XS4 Approximately 500 feet Upstream of Musketball Drive 11,085**
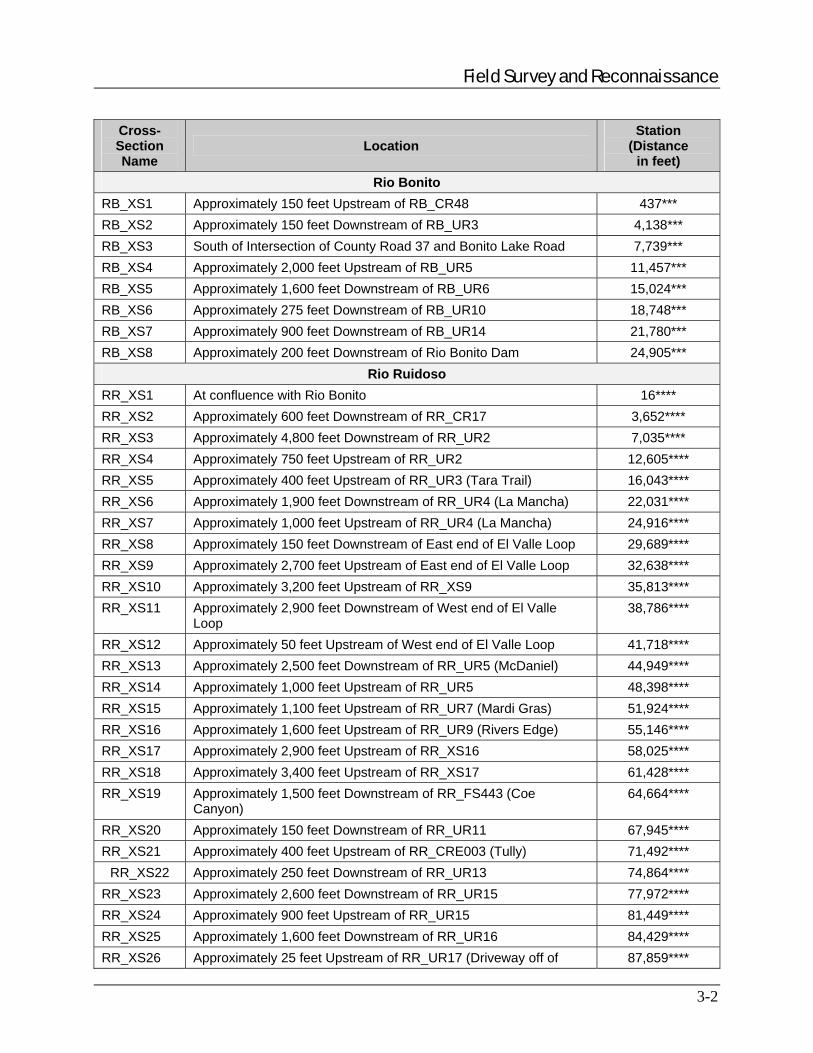
Field Survey and Reconnaissance
3-2
Cross-Section Name
Location Station
(Distance in feet)
Rio Bonito RB_XS1 Approximately 150 feet Upstream of RB_CR48 437*** RB_XS2 Approximately 150 feet Downstream of RB_UR3 4,138*** RB_XS3 South of Intersection of County Road 37 and Bonito Lake Road 7,739*** RB_XS4 Approximately 2,000 feet Upstream of RB_UR5 11,457*** RB_XS5 Approximately 1,600 feet Downstream of RB_UR6 15,024*** RB_XS6 Approximately 275 feet Downstream of RB_UR10 18,748*** RB_XS7 Approximately 900 feet Downstream of RB_UR14 21,780*** RB_XS8 Approximately 200 feet Downstream of Rio Bonito Dam 24,905***
Rio Ruidoso RR_XS1 At confluence with Rio Bonito 16**** RR_XS2 Approximately 600 feet Downstream of RR_CR17 3,652**** RR_XS3 Approximately 4,800 feet Downstream of RR_UR2 7,035**** RR_XS4 Approximately 750 feet Upstream of RR_UR2 12,605**** RR_XS5 Approximately 400 feet Upstream of RR_UR3 (Tara Trail) 16,043**** RR_XS6 Approximately 1,900 feet Downstream of RR_UR4 (La Mancha) 22,031**** RR_XS7 Approximately 1,000 feet Upstream of RR_UR4 (La Mancha) 24,916**** RR_XS8 Approximately 150 feet Downstream of East end of El Valle Loop 29,689**** RR_XS9 Approximately 2,700 feet Upstream of East end of El Valle Loop 32,638**** RR_XS10 Approximately 3,200 feet Upstream of RR_XS9 35,813**** RR_XS11 Approximately 2,900 feet Downstream of West end of El Valle
Loop 38,786****
RR_XS12 Approximately 50 feet Upstream of West end of El Valle Loop 41,718**** RR_XS13 Approximately 2,500 feet Downstream of RR_UR5 (McDaniel) 44,949**** RR_XS14 Approximately 1,000 feet Upstream of RR_UR5 48,398**** RR_XS15 Approximately 1,100 feet Upstream of RR_UR7 (Mardi Gras) 51,924**** RR_XS16 Approximately 1,600 feet Upstream of RR_UR9 (Rivers Edge) 55,146**** RR_XS17 Approximately 2,900 feet Upstream of RR_XS16 58,025**** RR_XS18 Approximately 3,400 feet Upstream of RR_XS17 61,428**** RR_XS19 Approximately 1,500 feet Downstream of RR_FS443 (Coe
Canyon) 64,664****
RR_XS20 Approximately 150 feet Downstream of RR_UR11 67,945**** RR_XS21 Approximately 400 feet Upstream of RR_CRE003 (Tully) 71,492****
RR_XS22 Approximately 250 feet Downstream of RR_UR13 74,864**** RR_XS23 Approximately 2,600 feet Downstream of RR_UR15 77,972**** RR_XS24 Approximately 900 feet Upstream of RR_UR15 81,449**** RR_XS25 Approximately 1,600 feet Downstream of RR_UR16 84,429**** RR_XS26 Approximately 25 feet Upstream of RR_UR17 (Driveway off of 87,859****

Field Survey and Reconnaissance
3-3
Cross-Section Name
Location Station
(Distance in feet)
Buckhorn Loop) RR_XS27 Approximately 300 feet Downstream of RR_UR19A 91,247**** RR_XS28 Approximately 75 feet Downstream of RR_UR19A 91,454**** RR_XS29 Approximately 50 feet Upstream of RR_UR22 94,965**** RR_XS30 Approximately 1,700 feet Upstream of RR_UR25 98,322**** RR_XS31 Approximately 1,400 feet Downstream of RR_UR27 101,082**** RR_XS32 Approximately 550 feet Upstream of RR_UR28 104,050**** RR_XS33 Approximately 1,700 feet Downstream of RR_US70 107,069**** RR_XS34 Approximately 1,600 feet Upstream of RR_US70 110,346**** RR_XS35 Approximately 3,500 feet Upstream of RR_XS34 113,860**** RR_XS36 Approximately 200 feet Downstream of RR_UR33 117,013**** RR_XS37 Approximately 3,000 feet Downstream of Parker Road 121,074**** RR_XS38 Approximately 2,800 feet Downstream of RR_JW (Joe Welch
Drive) 127,032****
RR_XS40 Approximately 1,700 feet Upstream of RR_REESE 144,589**** RR_XS41 Approximately 1,400 feet Upstream of RR_MALONE (Malone
Road) 175,886**** Salado Creek
SC_XS1 Downstream of SC_Salado 31***** SC_XS2 Approximately 1,700 feet Upstream of Canyon Road 3,131***** SC_XS3 Upstream of SC_ La Cumbre 6,616*****
* Stream Distance in Feet Above Confluence with Rio Ruidoso ** Stream Distance in Feet Above Confluence with Rio Ruidoso *** Stream Distance in Feet Above 297 Feet Downstream of County Road 48 **** Stream Distance in Feet Above Confluence with Rio Hondo ***** Stream Distance in Feet Above Confluence with Oso Creek
3.2 CULVERT SURVEYS For Limited Detail Studies, culvert measurements include the following:
• Height, width, length, number, and type of culverts.
• Relative elevations of the culvert invert, the roadway, and the right and left channel banks.
• Top and bottom widths of the channel.
For culverts within Detailed Study areas, the required field survey information includes the following:
• Locate or establish an ERM.
• Sketch of the plan view and upstream face of the structure.

Field Survey and Reconnaissance
3-4
• Upstream and downstream culvert invert elevations.
• Longitudinal length of culvert.
• Diameter or rise and span of culverts.
• Top of road cross-section with survey points every 50 feet along the roadway and extend the cross-section right and left for 200 feet from the edge of the structure.
• Channel cross-section directly upstream of the structure with survey points every 50 feet along the ground and additional survey points to represent significant breaks in ground slope, top of banks, toe of slopes, and bottom centerline of the channel. Cross-section extended right and left for approximately 200 feet from the edge of the channel bank.
• Top of rail survey points.
• All other survey points required by Watershed Information System (WISE).
3.3 BRIDGE SURVEYS For Limited Detail Studies, bridge measurements include the following:
• Height, length, and deck thickness of the bridge.
• At the bridge, the width at the top of the channel and the toe of the slope.
• Number of piers and the diameter of each pier.
• Relative elevations of the channel invert, the roadway, and the right and left channel banks.
• Channel top and bottom widths at a representative location outside any transition due to the bridge.
For bridges within Detailed Study areas, the required field survey information includes the following:
• Locate or establish an ERM.
• Sketch of the plan view and upstream face of the structure.
• Location of each pier.
• Upstream invert elevations for each bridge segment between piers.
• Downstream invert elevation.
• Low chord, top of bridge, and top of rail elevations.
• Longitudinal length of bridge.
• Top of road cross-section with survey points every 50 feet along the roadway and additional points at the edge of the structure. Cross-section extended right and left for approximately 200 feet from the edge of the structure.
• Channel cross-section directly upstream of the structure with survey points every 50 feet along the ground and additional survey points to represent significant breaks in ground slope,
Field Survey and Reconnaissance
3-5
top of banks, toe of slopes, and bottom centerline of the channel. Cross-section extended right and left for approximately 200 feet from the edge of the channel bank.
All other survey points required by WISE.
Table 3-2 lists the structures surveyed by the Limited Detail method.
Table 3-2: List of Limited Detail Structures
Structure Name Location Type Station
(Distance in feet)
Cedar Creek CEC_A Driveway North of Musketball Drive 1-2-foot and 2-3-foot
Round CMP 10,790*
CEC_B In Cedar Creek Downstream of CEC_A
2.5-foot Round CMP 10,639*
CEC_CROSS Driveway North of Cross Drive 3-foot x 5-foot Elliptical CMP
7,671*
CEC_DW106 106 Cedar Creek Dr. 5-foot Round CMP 6,574* CEC_DW112 112 Cedar Creek Drive 4-foot Round CMP 7,339* CEC_DW206 206 Cedar Creek Drive 3-foot Round CMP 8,568* CEC_DW210 210 Cedar Creek Drive, Driveway with
Gate 3-foot Round CMP
2-1.5-foot x 1.15-foot CBC 8,874*
CEC_HC1 Half Circle Drive 5-foot Round CMP 6,867* CEC_HC1A 50 feet East of CEC_HC1 5-foot Round CMP 6,817* CEC_HC1A Bridge
Upstream of HC2 Bridge 8,368*
CEC_HC2 Half Circle Drive 2-foot Round CMP 8,267* CEC_K Downstream of CEC_DW106 Bridge 6,210* CEC_MB Musketball Drive 4.15-foot x 4.83-foot
Elliptical CMP 10,520*
CEC_RETREAT 300 Cedar Creek Drive 4-foot Round CMP 9,621* CEC_UR1 Forest Road 3.25-foot x 6.40
Elliptical CMP 3,701*
CEC_UR2 Forest Road 2-6-foot Round CMP 4,850* CEC_UR3 Forest Road 2-6-foot Round CMP 5,620* CEC_UR4 Unnamed Road 4 2-3-foot Round CMP 9,118* CEC_UR5 Road to Dickinson Ranch 3-foot Round CMP 9,398*
Rio Bonito RB_CR48 County Road 48 Bridge 297** RB_PED Bridge is Upstream of County Road
48 Bridge 618**
RB_UR10 Unnamed Road 10 (Bonito Stables) Bridge 19,020** RB_UR10A Unnamed Road 10A (Bonito Stables) Bridge 19,173** RB_UR11 Unnamed Road 11 Bridge 19,598**
Field Survey and Reconnaissance
3-6
Structure Name Location Type Station
(Distance in feet)
RB_UR13 Unnamed Road 13 4-foot Round CMP 20,310** RB_UR14 Unnamed Road 14 4-3-foot Round CMP 22,629** RB_UR2 Unnamed Road 2 Bridge 1,426** RB_UR3 Unnamed Road 3 3-10-foot x 8-foot
Box CBC 4,311**
RB_UR3A Unnamed Road 3 Bridge 5,181** RB_UR4 Unnamed Road 4 Bridge 7,420** RB_UR5 Unnamed Road 5 Bridge 9,379** RB_UR6 Unnamed Road 6 Bridge 16,699** RB_UR7 Unnamed Road 7 (Bonito Lou’s Café) 2-10-foot x 8-foot
Box CBC 16,893**
RB_UR8 Unnamed Road 8 (Bonito Falls Café) Bridge 17,789** RB_UR8A Unnamed Road 8A (Bonito Falls Café) Bridge 17,674** RB_UR9 Unnamed Road 9 Bridge 18,284**
Rio Ruidoso RR_CR17 County Road 17 (El Ojito) Bridge 4,267*** RR_CRE002 County Road E002 5-foot x 3.5-foot
Elliptical CMP 105,523***
RR_CRE003 County Road E003 (Tully) Bridge 71,113*** RR_CRE005 County Road E005 (Perry Spring) Bridge 68,538*** RR_CRE008 County Road E008 (El Valle Loop) Bridge 41,672*** RR_CRE008A County Road E008 (El Valle Loop) Bridge 29,876*** RR_FS443 Coe Canyon Bridge 66,187*** RR_UR11 Off of Frontage Road near FS 443 Bridge 68,078*** RR_UR13 Unnamed Road 13 West of CRE003 Bridge 75,105*** RR_UR15 Off of Frontage Road West of FS 120 Bridge 80,556*** RR_UR16 Off of Frontage Road West of FS 120 Bridge 86,035*** RR_UR16A Pedestrian Bridge on Private
Property Bridge 85,694***
RR_UR17 Driveway off of Buckhorn Loop Bridge 87,841*** RR_UR19 San Ysidro Bridge 93,179*** RR_UR19A Pedestrian Bridge on Private
Property Bridge 91,541***
RR_UR2 Unnamed Road 2 Bridge 11,874*** RR_UR21 Driveway West of San Ysidro Bridge 94,316*** RR_UR22 Driveway West of RR_UR21 Bridge 94,932*** RR_UR25 East end of Trailer Park East of FS
120B Bridge 96,593***
RR_UR27 Unnamed Road 27 East of Cemetery Bridge 102,471***
Field Survey and Reconnaissance
3-7
Structure Name Location Type Station
(Distance in feet)
RR_UR28 Unnamed Road 28 West of Cemetery Bridge 103,530*** RR_UR3 Tara Trail Bridge 15,633*** RR_UR33 Unnamed Road 33 North of Canyon
Road Bridge 117,239***
RR_UR4 La Mancha Bridge 23,913*** RR_UR5 McDaniel Bridge 47,412*** RR_UR7 Mardi Gras Bridge 50,872*** RR_UR9 Rivers Edge Bridge 53,585*** RR_US70 US 70 Highway Bridge 108,759***
Salado Creek SC_LA CUMBRE Salado Road 8-foot Round CMP 6,546**** SC_SALADO Salado Road 2-2-foot Round CMP 475**** SC_UR1 Salado Road 2-6-foot Round CMP 1,398****
* Stream Distance in Feet Above Confluence with Rio Ruidoso ** Stream Distance in Feet Above 297 Feet Downstream of County Road 48 *** Stream Distance in Feet Above Confluence with Rio Hondo **** Stream Distance in Feet Above Confluence with Oso Creek
Table 3-3 provides a list of structures surveyed by the Detailed method.
Table 3-3: List of Detailed Structures
Structure Name Location Type Station
(Distance in feet)
Brady Canyon BC_ALONZO3 Alonzo Way 4-foot Round CMP 869* BC_ALTO Mechem Drive 2-5-foot Round CMP Inlet
1-3.7-foot x 4.1-foot Concrete Block Outlet
437*
BC_ASH Ash Drive 3-foot Round CMP 5,316* BC_BC1 Brady Canyon Road 3-foot Round CMP 2,735* BC_BC2 Brady Canyon Road 3-foot Round CMP 2,942* BC_BC3 Umbrella Drive 3-foot Round CMP 6,216* BC_OAK South Oak Drive 3-foot Round CMP 4,363* BC_PORR Porr Drive 4-foot Round CMP 1,450* BC_UR10 Driveway off Brady Canyon Road 2-foot Round CMP 2,335* BC_UR4 Road Southwest off of Oak Drive 3-foot Round CMP 4,452* BC_UR6 Driveway off Ponderosa Drive 2-foot Round CMP 3,636*
Field Survey and Reconnaissance
3-8
Structure Name Location Type Station
(Distance in feet)
BC_UR7 Driveway off Ponderosa Drive 2-foot Round CMP Inlet Bolted
1.5-foot Round Pipe Outlet
3,222*
BC_UR8 Driveway off Ponderosa Drive 2-1.5-foot Round CMP 3,129* BC_UR9 Driveway off Ponderosa Drive 1.8-foot Round
Metal Drum 3,099*
BC_VALONIA Valonia Lane 2-3-foot Round CMP 3,834* Carrizo Creek
CAC_CC Carrizo Canyon Road 8-foot Round CMP 8,419** CAC_GK1 Go-Kart Track Near Sudderth
Drive Bridge 653**
CAC_GK3 Go-Kart Track Near Sudderth Drive
Bridge 891**
CAC_GK4 Go-Kart Track Near Sudderth Drive
Bridge 1,134**
CAC_MASSINGILL Massingill Lane 2-3-foot Round CMP 5,682** CAC_MC Next to Rainbow Lake in RV Park Bridge 8,957** CAC_MC2 Bridge located within RV Park Bridge 9,241** CAC_SUDDERTH Sudderth Drive 2-10-foot x 14-foot CBC 296** CAC_TOMAHAWK1 Tomahawk Trail 3-3-foot Round CMP 2,733** CAC_TOMAHAWK2 Tomahawk Trail 7.5-foot Round CMP 4,152** CAC_UR1 Hickory Road 2-5-foot Round CMP 1,680** CAC_UR2 Mort 818 6-foot Round CMP and 3-
foot Round CMP 9,744**
CAC_UR2A Gravel Road 2-5-foot Round CMP 9,889** CAC_UR3 Canyon Creek Lodge 8-foot Round CMP 10,531** CAC_UR4 Pedestrian Bridge Bridge 11,013** CAC_UR5 Driveway Downstream of
CAC_UR6 5-foot Round CMP 11,096**
CAC_UR6 Mescalero Inn Bridge 11,329** Cedar Creek
CEC_ALTO Mechem Drive 2-9-foot x 8-foot CBC 13,318*** CEC_CM Cree Meadows Drive 4-foot Round CMP
2.5-foot Round CMP 11,843***
CEC_HART Hart Avenue 10-foot x 5-foot CBC 3,329*** CEC_HULL Hull Road 3-foot Round CMP 8,186*** CEC_PC3 Paradise Canyon Drive 3-foot Round CMP 7,448*** CEC_PED_BR2 300 feet Upstream of PED_BR1
(Golf Course) 1-foot Round Pipe 12,413***
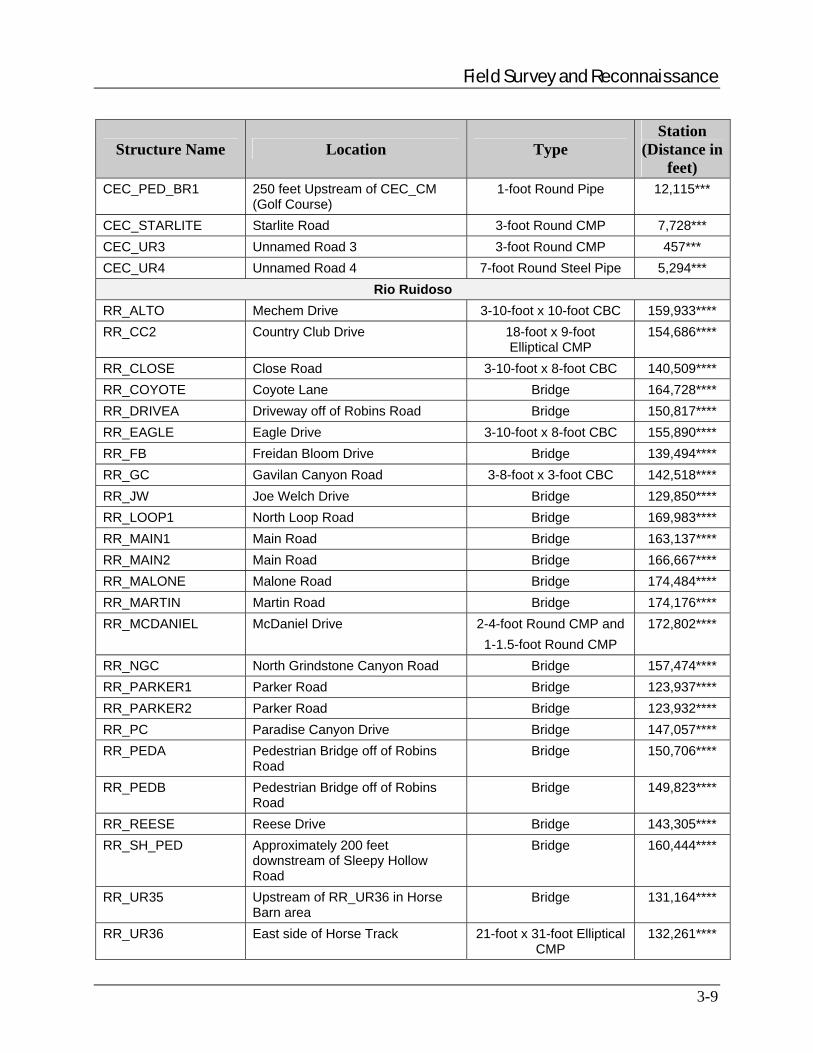
Field Survey and Reconnaissance
3-9
Structure Name Location Type Station
(Distance in feet)
CEC_PED_BR1 250 feet Upstream of CEC_CM (Golf Course)
1-foot Round Pipe 12,115***
CEC_STARLITE Starlite Road 3-foot Round CMP 7,728*** CEC_UR3 Unnamed Road 3 3-foot Round CMP 457*** CEC_UR4 Unnamed Road 4 7-foot Round Steel Pipe 5,294***
Rio Ruidoso RR_ALTO Mechem Drive 3-10-foot x 10-foot CBC 159,933**** RR_CC2 Country Club Drive 18-foot x 9-foot
Elliptical CMP 154,686****
RR_CLOSE Close Road 3-10-foot x 8-foot CBC 140,509**** RR_COYOTE Coyote Lane Bridge 164,728**** RR_DRIVEA Driveway off of Robins Road Bridge 150,817**** RR_EAGLE Eagle Drive 3-10-foot x 8-foot CBC 155,890**** RR_FB Freidan Bloom Drive Bridge 139,494**** RR_GC Gavilan Canyon Road 3-8-foot x 3-foot CBC 142,518**** RR_JW Joe Welch Drive Bridge 129,850**** RR_LOOP1 North Loop Road Bridge 169,983**** RR_MAIN1 Main Road Bridge 163,137**** RR_MAIN2 Main Road Bridge 166,667**** RR_MALONE Malone Road Bridge 174,484**** RR_MARTIN Martin Road Bridge 174,176**** RR_MCDANIEL McDaniel Drive 2-4-foot Round CMP and
1-1.5-foot Round CMP 172,802****
RR_NGC North Grindstone Canyon Road Bridge 157,474**** RR_PARKER1 Parker Road Bridge 123,937**** RR_PARKER2 Parker Road Bridge 123,932**** RR_PC Paradise Canyon Drive Bridge 147,057**** RR_PEDA Pedestrian Bridge off of Robins
Road Bridge 150,706****
RR_PEDB Pedestrian Bridge off of Robins Road
Bridge 149,823****
RR_REESE Reese Drive Bridge 143,305**** RR_SH_PED Approximately 200 feet
downstream of Sleepy Hollow Road
Bridge 160,444****
RR_UR35 Upstream of RR_UR36 in Horse Barn area
Bridge 131,164****
RR_UR36 East side of Horse Track 21-foot x 31-foot Elliptical CMP
132,261****
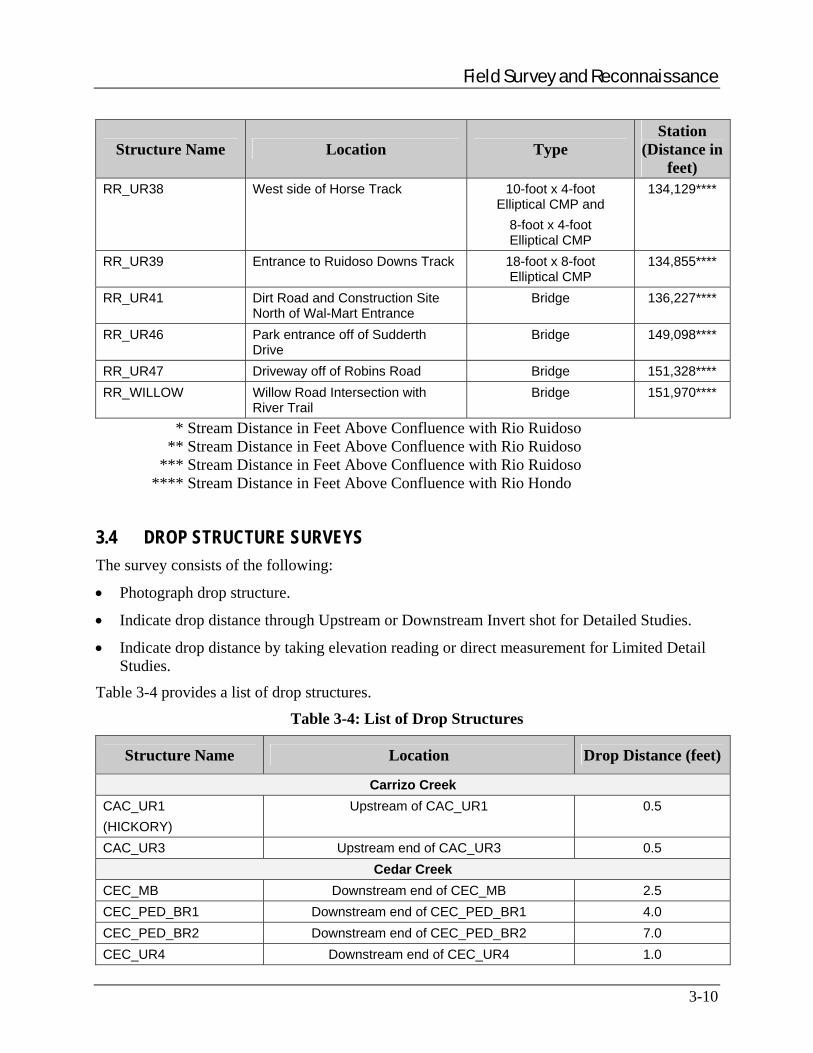
Field Survey and Reconnaissance
3-10
Structure Name Location Type Station
(Distance in feet)
RR_UR38 West side of Horse Track 10-foot x 4-foot Elliptical CMP and
8-foot x 4-foot Elliptical CMP
134,129****
RR_UR39 Entrance to Ruidoso Downs Track 18-foot x 8-foot Elliptical CMP
134,855****
RR_UR41 Dirt Road and Construction Site North of Wal-Mart Entrance
Bridge 136,227****
RR_UR46 Park entrance off of Sudderth Drive
Bridge 149,098****
RR_UR47 Driveway off of Robins Road Bridge 151,328**** RR_WILLOW Willow Road Intersection with
River Trail Bridge 151,970****
* Stream Distance in Feet Above Confluence with Rio Ruidoso ** Stream Distance in Feet Above Confluence with Rio Ruidoso *** Stream Distance in Feet Above Confluence with Rio Ruidoso **** Stream Distance in Feet Above Confluence with Rio Hondo
3.4 DROP STRUCTURE SURVEYS The survey consists of the following:
• Photograph drop structure.
• Indicate drop distance through Upstream or Downstream Invert shot for Detailed Studies.
• Indicate drop distance by taking elevation reading or direct measurement for Limited Detail Studies.
Table 3-4 provides a list of drop structures.
Table 3-4: List of Drop Structures
Structure Name Location Drop Distance (feet)
Carrizo Creek CAC_UR1 (HICKORY)
Upstream of CAC_UR1 0.5
CAC_UR3 Upstream end of CAC_UR3 0.5 Cedar Creek
CEC_MB Downstream end of CEC_MB 2.5 CEC_PED_BR1 Downstream end of CEC_PED_BR1 4.0 CEC_PED_BR2 Downstream end of CEC_PED_BR2 7.0 CEC_UR4 Downstream end of CEC_UR4 1.0

Field Survey and Reconnaissance
3-11
Rio Ruidoso RR_DROP 1 Downstream of RR_MALONE 3.0 RR_CR17 EL OJITO Upstream of RR_CR17 2.0 RR_CR17 EL OJITO Upstream of RR_CR17 3.0 RR_GC Downstream of RR_GC 4.0 RR_PARKER Downstream of RR_PARKER 2.5 RR_UR29 Trailer Park Downstream of RR_US70 1.5 RR_UR19 Downstream of RR_UR19 1.0
3.5 DAM SURVEYS Dam and weir surveys were not performed, as there are no dams or weirs present along the study reaches. Information regarding dam outlets at the upper reaches of streams where they existed was collected and utilized in the analysis where necessary.
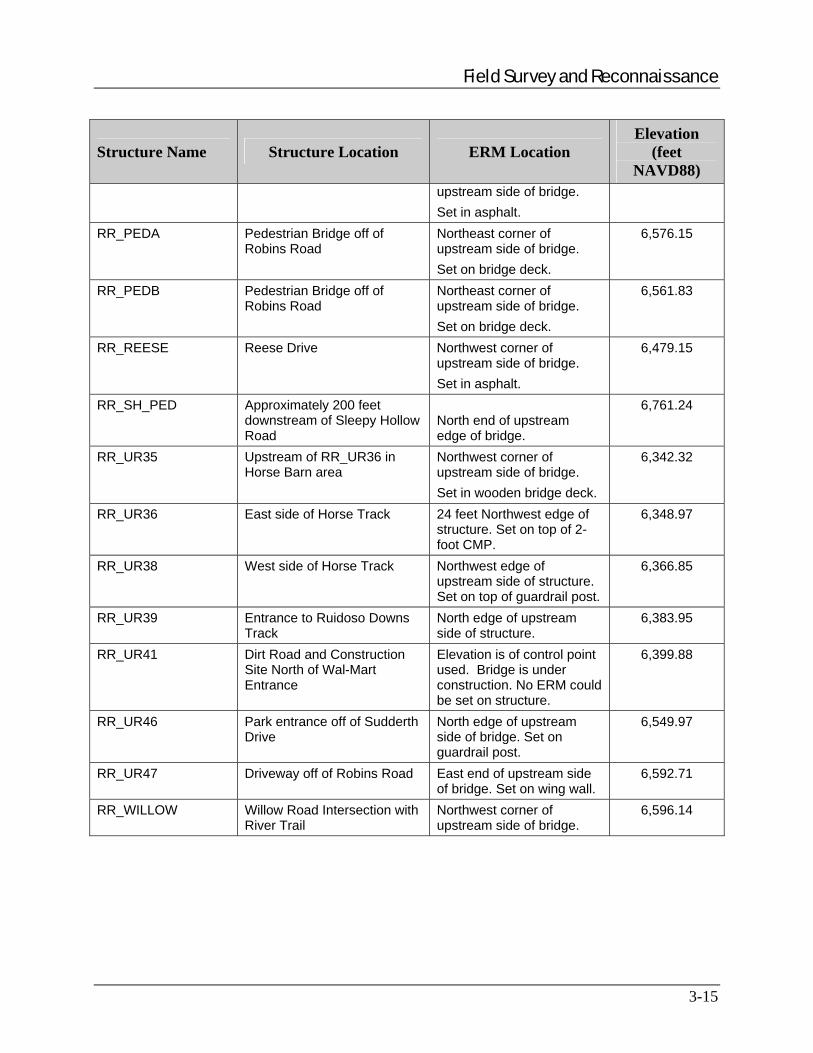
3.6 ELEVATION REFERENCE MARKS These ERMs include existing elevation references if they exist. An ERM was located or established for each structure surveyed.
Acceptable ERMs can consist of any solid object set in a stable structure or ground. As a general rule, ERM density should be approximately one every mile of stream length or four per square mile of floodplain, as appropriate. Surveys should not be taken for the sole purpose of establishing ERMs. The ERMs set during the course of the field survey are listed in Table 3-5.
Table 3-5: List of Elevation Reference Marks for Detailed Surveys
Structure Name Structure Location ERM Location Elevation
(feet NAVD88)
Brady Canyon BC_ALTO Mechem Drive 25 feet Northeast of edge of
structure. 6,761.94
BC_ALONZO3 Alonzo Way Upstream edge of structure on top of wall.
6,773.17
BC_ASH Ash Drive Control Point set in road. 6,912.26 BC_BC1 Brady Canyon Road 9 feet Northwest of
upstream edge of structure set in asphalt.
6,837.43
BC_BC2 Brady Canyon Road 17 feet Southeast of upstream edge of structure set in asphalt.
6,843.38
BC_BC3 Umbrella Drive 2 feet North of South edge of upstream guardrail.
6,938.14
BC_OAK South Oak Drive 10 feet East of structure. 6,883.97 BC_PORR Porr Drive 10 feet North of upstream
edge of structure at edge of 6,793.38
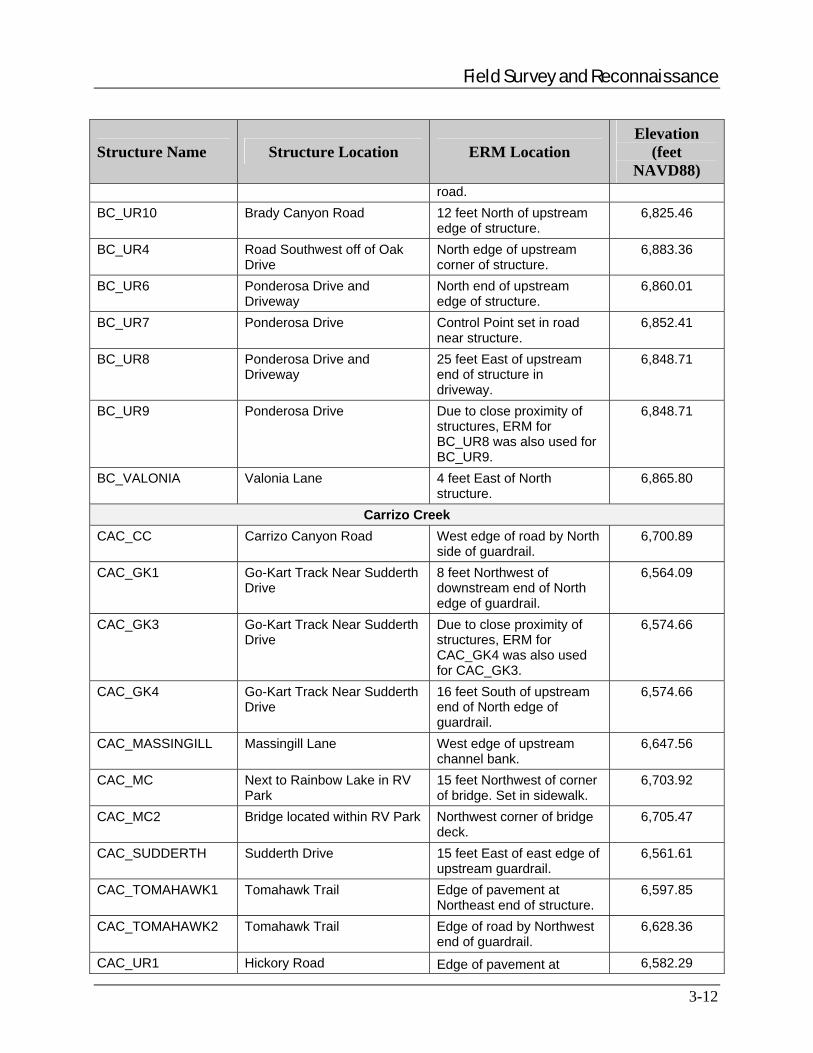
Field Survey and Reconnaissance
3-12
Structure Name Structure Location ERM Location Elevation
(feet NAVD88)
road. BC_UR10 Brady Canyon Road 12 feet North of upstream
edge of structure. 6,825.46
BC_UR4 Road Southwest off of Oak Drive
North edge of upstream corner of structure.
6,883.36
BC_UR6 Ponderosa Drive and Driveway
North end of upstream edge of structure.
6,860.01
BC_UR7 Ponderosa Drive Control Point set in road near structure.
6,852.41
BC_UR8 Ponderosa Drive and Driveway
25 feet East of upstream end of structure in driveway.
6,848.71
BC_UR9 Ponderosa Drive Due to close proximity of structures, ERM for BC_UR8 was also used for BC_UR9.
6,848.71
BC_VALONIA Valonia Lane 4 feet East of North structure.
6,865.80
Carrizo Creek CAC_CC Carrizo Canyon Road West edge of road by North
side of guardrail. 6,700.89
CAC_GK1 Go-Kart Track Near Sudderth Drive
8 feet Northwest of downstream end of North edge of guardrail.
6,564.09
CAC_GK3 Go-Kart Track Near Sudderth Drive
Due to close proximity of structures, ERM for CAC_GK4 was also used for CAC_GK3.
6,574.66
CAC_GK4 Go-Kart Track Near Sudderth Drive
16 feet South of upstream end of North edge of guardrail.
6,574.66
CAC_MASSINGILL Massingill Lane West edge of upstream channel bank.
6,647.56
CAC_MC Next to Rainbow Lake in RV Park
15 feet Northwest of corner of bridge. Set in sidewalk.
6,703.92
CAC_MC2 Bridge located within RV Park Northwest corner of bridge deck.
6,705.47
CAC_SUDDERTH Sudderth Drive 15 feet East of east edge of upstream guardrail.
6,561.61
CAC_TOMAHAWK1 Tomahawk Trail Edge of pavement at Northeast end of structure.
6,597.85
CAC_TOMAHAWK2 Tomahawk Trail Edge of road by Northwest end of guardrail.
6,628.36
CAC_UR1 Hickory Road Edge of pavement at 6,582.29
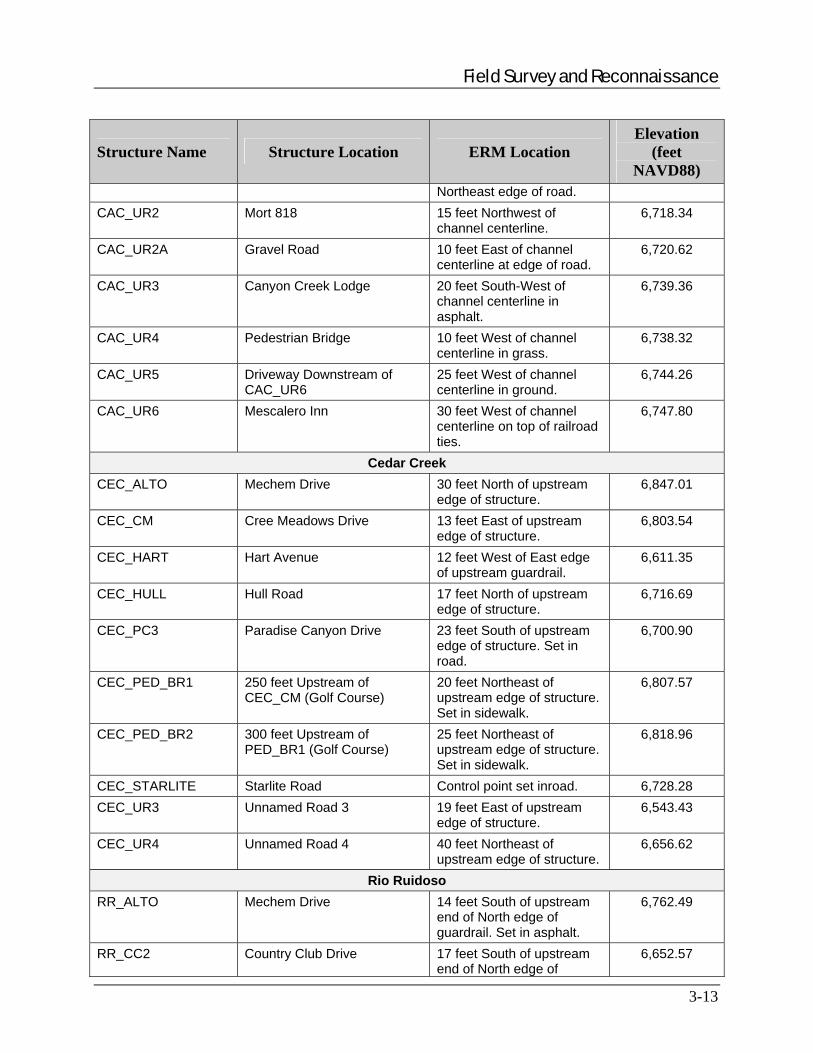
Field Survey and Reconnaissance
3-13
Structure Name Structure Location ERM Location Elevation
(feet NAVD88)
Northeast edge of road. CAC_UR2 Mort 818 15 feet Northwest of
channel centerline. 6,718.34
CAC_UR2A Gravel Road 10 feet East of channel centerline at edge of road.
6,720.62
CAC_UR3 Canyon Creek Lodge 20 feet South-West of channel centerline in asphalt.
6,739.36
CAC_UR4 Pedestrian Bridge 10 feet West of channel centerline in grass.
6,738.32
CAC_UR5 Driveway Downstream of CAC_UR6
25 feet West of channel centerline in ground.
6,744.26
CAC_UR6 Mescalero Inn 30 feet West of channel centerline on top of railroad ties.
6,747.80
Cedar Creek CEC_ALTO Mechem Drive 30 feet North of upstream
edge of structure. 6,847.01
CEC_CM Cree Meadows Drive 13 feet East of upstream edge of structure.
6,803.54
CEC_HART Hart Avenue 12 feet West of East edge of upstream guardrail.
6,611.35
CEC_HULL Hull Road 17 feet North of upstream edge of structure.
6,716.69
CEC_PC3 Paradise Canyon Drive 23 feet South of upstream edge of structure. Set in road.
6,700.90
CEC_PED_BR1 250 feet Upstream of CEC_CM (Golf Course)
20 feet Northeast of upstream edge of structure. Set in sidewalk.
6,807.57
CEC_PED_BR2 300 feet Upstream of PED_BR1 (Golf Course)
25 feet Northeast of upstream edge of structure. Set in sidewalk.
6,818.96
CEC_STARLITE Starlite Road Control point set inroad. 6,728.28 CEC_UR3 Unnamed Road 3 19 feet East of upstream
edge of structure. 6,543.43
CEC_UR4 Unnamed Road 4 40 feet Northeast of upstream edge of structure.
6,656.62
Rio Ruidoso RR_ALTO Mechem Drive 14 feet South of upstream
end of North edge of guardrail. Set in asphalt.
6,762.49
RR_CC2 Country Club Drive 17 feet South of upstream end of North edge of
6,652.57

Field Survey and Reconnaissance
3-14
Structure Name Structure Location ERM Location Elevation
(feet NAVD88)
guardrail. Set in asphalt. RR_CLOSE Close Road North edge of downstream
side of bridge. 6,447.36
RR_COYOTE Coyote Lane East edge of guardrail on upstream side.
6,861.10
RR_DRIVEA Driveway off of Robins Road Northeast corner of upstream side of bridge. Set on railroad tie.
6,580.03
RR_EAGLE Eagle Drive 52 feet North of upstream end of North edge of guardrail.
6,673.32
RR_FB Freidan Bloom Drive South edge of downstream side of bridge.
6,433.01
RR_GC Gavilan Canyon Road Northwest corner of upstream side of bridge
6,467.96
RR_JW Joe Welch Drive South-East corner of downstream side of bridge. Set in asphalt.
6,334.32
RR_LOOP1 North Loop Road Asphalt on upstream side North of bridge.
6,995.17
RR_MAIN1 Main Road Northwest corner of upstream side of bridge.
6,821.38
RR_MAIN2 Main Road North edge of road on upstream side. 15 feet from bridge. Control Point.
6,909.00
RR_MALONE Malone Road North edge of upstream side of bridge deck.
7,126.55
RR_MARTIN Martin Road North corner of upstream side of wooden bridge deck.
7,117.51
RR_MCDANIEL McDaniel Drive North edge of upstream guardrail.
7,072.15
RR_NGC North Grindstone Canyon Road
4 feet South of upstream end of North edge of guardrail. Set in asphalt.
6,699.98
RR_PARKER1 Parker Road Due to close proximity, ERM for RR_PARKER2 was also used for RR_PARKER1.
6,270.21
RR_PARKER2 Parker Road North edge of upstream side of concrete bridge deck. Control Point.
6,270.21
RR_PC Paradise Canyon Drive Northwest corner of 6,523.10
Field Survey and Reconnaissance
3-15
Structure Name Structure Location ERM Location Elevation
(feet NAVD88)
upstream side of bridge. Set in asphalt.
RR_PEDA Pedestrian Bridge off of Robins Road
Northeast corner of upstream side of bridge. Set on bridge deck.
6,576.15
RR_PEDB Pedestrian Bridge off of Robins Road
Northeast corner of upstream side of bridge. Set on bridge deck.
6,561.83
RR_REESE Reese Drive Northwest corner of upstream side of bridge. Set in asphalt.
6,479.15
RR_SH_PED Approximately 200 feet downstream of Sleepy Hollow Road
North end of upstream edge of bridge.
6,761.24
RR_UR35 Upstream of RR_UR36 in Horse Barn area
Northwest corner of upstream side of bridge. Set in wooden bridge deck.
6,342.32
RR_UR36 East side of Horse Track 24 feet Northwest edge of structure. Set on top of 2-foot CMP.
6,348.97
RR_UR38 West side of Horse Track Northwest edge of upstream side of structure. Set on top of guardrail post.
6,366.85
RR_UR39 Entrance to Ruidoso Downs Track
North edge of upstream side of structure.
6,383.95
RR_UR41 Dirt Road and Construction Site North of Wal-Mart Entrance
Elevation is of control point used. Bridge is under construction. No ERM could be set on structure.
6,399.88
RR_UR46 Park entrance off of Sudderth Drive
North edge of upstream side of bridge. Set on guardrail post.
6,549.97
RR_UR47 Driveway off of Robins Road East end of upstream side of bridge. Set on wing wall.
6,592.71
RR_WILLOW Willow Road Intersection with River Trail
Northwest corner of upstream side of bridge.
6,596.14

Topographic Data Development
4-1
SECTION FOUR TOPOGRAPHIC DATA DEVELOPMENT
4.1 ACQUISITION The topographic data for this analysis consisted of two different datasets. Thomas R. Mann & Associates, using orthophotogrammetric methods, compiled and provided 5-foot contours that covered the Village of Ruidoso and the City of Ruidoso Downs. This data was considered the best available in the area by the communities. For regions outside of the contour dataset coverage area, the best topographic data available were 10-meter Digital Elevation Models (DEMs) obtained from the U.S. Geological Survey (USGS) National Map Seamless Server. All data was processed together to make one seamless terrain model.
4.2 PROCESSING To provide complete coverage of the study reaches area, the 10-meter DEMs were pre-processed to be compatible with WISE Terrain Analyst software from Watershed Concepts, and then input into the terrain model for processing of the county areas. A total of four 10-meter DEMs were obtained from the USGS National Map Seamless Web site to provide adequate coverage of the study streams and all contributing drainage areas.
In their native download format, the DEMs were referenced to a Geographic North American Datum of 1983 (NAD83) horizontal datum and a North American Vertical Datum of 1988 (NAVD88) vertical datum with vertical units expressed in meters. In order to generate Triangulated Irregular Networks (TINs) in WISE Terrain Analyst, the DEMs vertical units were converted from meters to feet, and the DEMs were projected to NAD83 New Mexico State Plane Central Federal Information Processing Standards (FIPS) 3002 projection. In order to be imported into WISE Terrain Analyst, the DEMs were finally exported to ASCII text file format.
In the regions for which there was contour coverage, the contours were considered the best available data. Some additional processing was required in order to use the contours provided by Thomas Mann. Contours were provided in a ground coordinate system (NAD83 New Mexico Central High Accuracy Reference Network (HARN), and needed to be converted to a grid coordinate system (NAD83 New Mexico Central Feet). This was accomplished by applying a “ground to grid” conversion factor of 0.999596756. The vertical datum of the data was also provided in National Geodetic Vertical Datum of 1929 (NGVD29), and needed to be converted to the NAVD88. This could not be accomplished by computing a general conversion factor that covered the area of the contours, as it would not meet FEMA standards. Therefore, each contour vertex was converted separately, and then input into the terrain model. After these conversions were performed, all data was consistent with the terrain model.
In areas in which DEM and contour data were both available, the contours were prioritized higher for TIN creation in the WISE Terrain Analyst. The TINs provided complete coverage of areas that included the study streams. The WISE Digital Terrain Model (DTM) was exported and is included in this submittal.
Digital terrain information can be found in Appendix B of this document.

Topographic Data Development
4-2
4.3 DATA EVALUATION Because the USGS DEMs were provided from a Federal agency, URS did not perform a detailed evaluation of the data accuracy. It was not necessary to produce a hydro-correct DEM for this study because the hydrology was completed without the use of TINs or DEMs.

Hydrologic Analyses
5-1
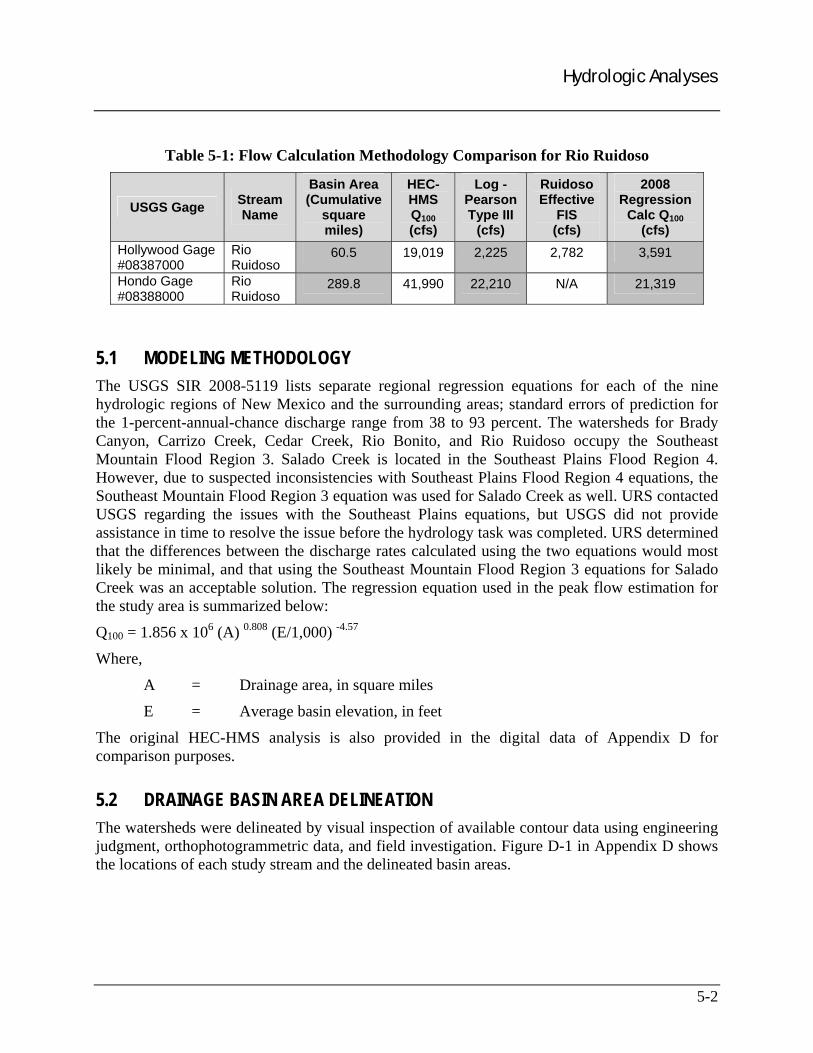
SECTION FIVE HYDROLOGIC ANALYSES The original scope of this project specified the use of a FEMA-approved rainfall runoff model such as the Hydrologic Engineering Center – Hydrologic Modeling System (HEC-HMS) to estimate peak flow discharges. A HEC-HMS rainfall runoff model based on the Soil Conservation Service (SCS) method was developed to estimate the 10- to 1-percent-annual-chance discharges within the watershed. The model assumed a Natural Resource Conservation Service (NRCS) Type II-65 rainfall distribution for the design storms, a typical rainfall distribution for the area. Meanwhile, URS also performed a Log Pearson Type III analysis of recorded annual peak flows at two available USGS gaging stations (#08387000 and #08388000) along the Rio Ruidoso to compare with the results from the HEC-HMS models. These two gauges both have relatively long terms of record of 54 and 40 years, respectively, which would imply a high degree of confidence in the statistical analysis results. The gages are also located in the study area and in the Southeast Mountain Flood Region for the regional regression equations, which is the same region as the study streams. A comparison between the results of the two analyses indicated that the rainfall runoff model was significantly over-predicting flows.
A reasonable effort was made at calibrating the HEC-HMS model to the Log Pearson analysis Type-III analysis, including adjusting the initial abstraction, using an area reduction factor, and considering the water supply reservoir in the study area. Unfortunately, the HEC-HMS model was still significantly over-predicting flows in the area as compared to the gauge analysis, hence another methodology was sought.
In addition to the Log Pearson Type III analysis, URS also used the regression equations outlined in the USGS Scientific Investigations Report (SIR) 2008-5119, Analysis of the Magnitude and Frequency of Peak Discharge and Maximum Observed Peak Discharge in New Mexico and Surrounding Areas (2008) to estimate peak flow discharges. Flows estimated based on the recently released, USGS SIR 2008-5119 regression equations were very similar in comparison to the Log Pearson Type III analysis, and were also much closer to the values published in the effective FIS. This comparison indicated that the new regression equations were reporting correctly, because both analyses were based off of actual stream flow data and were similar in comparison. It was also considered more reasonable to use the regression equations because they are based off of actual flow data, and not a hypothetical storm.
As indicated in Table 5-1, based on the Log Pearson Type III analysis for the Hondo Gage record, the 1-percent-annual-chance discharge was estimated to be 22,210 cubic feet per second (cfs) compared with the 21,319 cfs estimated based on the USGS SIR 2008-5119 regression equation. The discharge estimated based on the USGS SIR 2008-5119 regression equation is also reasonable when compared to the discharge shown in the effective FIS.
Hydrologic Analyses
5-2
Table 5-1: Flow Calculation Methodology Comparison for Rio Ruidoso
USGS Gage Stream Name
Basin Area (Cumulative
square miles)
HEC-HMS Q100 (cfs)
Log - Pearson Type III
(cfs)
Ruidoso Effective
FIS (cfs)
2008 Regression
Calc Q100 (cfs)
Hollywood Gage #08387000
Rio Ruidoso
60.5 19,019 2,225 2,782 3,591
Hondo Gage #08388000
Rio Ruidoso
289.8 41,990 22,210 N/A 21,319
5.1 MODELING METHODOLOGY The USGS SIR 2008-5119 lists separate regional regression equations for each of the nine hydrologic regions of New Mexico and the surrounding areas; standard errors of prediction for the 1-percent-annual-chance discharge range from 38 to 93 percent. The watersheds for Brady Canyon, Carrizo Creek, Cedar Creek, Rio Bonito, and Rio Ruidoso occupy the Southeast Mountain Flood Region 3. Salado Creek is located in the Southeast Plains Flood Region 4. However, due to suspected inconsistencies with Southeast Plains Flood Region 4 equations, the Southeast Mountain Flood Region 3 equation was used for Salado Creek as well. URS contacted USGS regarding the issues with the Southeast Plains equations, but USGS did not provide assistance in time to resolve the issue before the hydrology task was completed. URS determined that the differences between the discharge rates calculated using the two equations would most likely be minimal, and that using the Southeast Mountain Flood Region 3 equations for Salado Creek was an acceptable solution. The regression equation used in the peak flow estimation for the study area is summarized below:
Q100 = 1.856 x 10⁶ (A) 0.808 (E/1,000) -4.57
Where,
A = Drainage area, in square miles
E = Average basin elevation, in feet
The original HEC-HMS analysis is also provided in the digital data of Appendix D for comparison purposes.
5.2 DRAINAGE BASIN AREA DELINEATION The watersheds were delineated by visual inspection of available contour data using engineering judgment, orthophotogrammetric data, and field investigation. Figure D-1 in Appendix D shows the locations of each study stream and the delineated basin areas.

Hydrologic Analyses
5-3
5.3 PARAMETERS
5.3.1 Watershed Parameters Table 5-1 lists the parameters used for the regression analysis.
Table 5-2: Hydrology Parameters
Watershed Basin ID Cumulative Basin
Area (square miles)
Basin Elevation
(feet) Brady Canyon BASIN6 2.5 7,301
Carrizo Creek BASIN9 22.5 7,747
Carrizo Creek BASIN22 24.6 7,693
Cedar Creek BASIN19 8.3 7,497
Cedar Creek LDS BASIN23 2.1 7,991
Cedar Creek LDS BASIN14 4.1 7,950
Cedar Creek LDS BASIN24 6.9 7,623
Cedar Creek Tributary BASIN13 0.5 6,891
Cherokee Bill Canyon BASIN4 47.3 7,664
Grindstone Canyon BASIN21 1.7 7,709
Musketball Canyon BASIN5 0.4 7,553
North Fork BASIN15 2.0 7,923
Rio Bonito BASIN0 45.8 8,396
Rio Ruidoso BASIN7 23.1 8,954
Rio Ruidoso BASIN8 26.7 8,707
Rio Ruidoso BASIN10 51.6 8,217
Rio Ruidoso BASIN2 60.5 8,104
Rio Ruidoso BASIN18 72.9 7,949
Rio Ruidoso BASIN17 124.0 7,804
Rio Ruidoso BASIN12 156.6 7,657
Rio Ruidoso BASIN16 199.0 7,441
Rio Ruidoso BASIN20 289.8 7,241
Salado Creek BASIN3 16.1 7,068
Turkey Spring Canyon Creek
BASIN11 14.1 7,513
Unnamed Tributary 1 BASIN1 12.0 7,209
Hydrologic Analyses
5-4
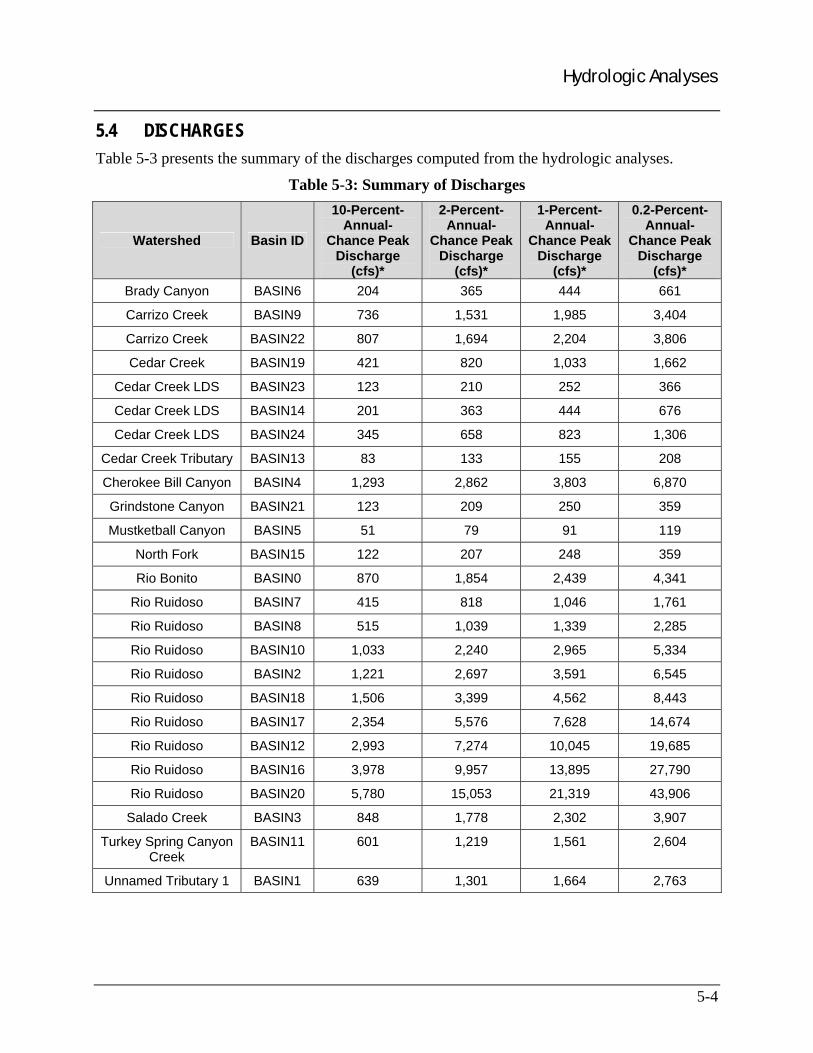
5.4 DISCHARGES Table 5-3 presents the summary of the discharges computed from the hydrologic analyses.
Table 5-3: Summary of Discharges
Watershed Basin ID
10-Percent-Annual-
Chance Peak Discharge
(cfs)*
2-Percent-Annual-
Chance Peak Discharge
(cfs)*
1-Percent-Annual-
Chance Peak Discharge
(cfs)*
0.2-Percent-Annual-
Chance Peak Discharge
(cfs)* Brady Canyon BASIN6 204 365 444 661
Carrizo Creek BASIN9 736 1,531 1,985 3,404
Carrizo Creek BASIN22 807 1,694 2,204 3,806
Cedar Creek BASIN19 421 820 1,033 1,662
Cedar Creek LDS BASIN23 123 210 252 366
Cedar Creek LDS BASIN14 201 363 444 676
Cedar Creek LDS BASIN24 345 658 823 1,306
Cedar Creek Tributary BASIN13 83 133 155 208
Cherokee Bill Canyon BASIN4 1,293 2,862 3,803 6,870
Grindstone Canyon BASIN21 123 209 250 359
Mustketball Canyon BASIN5 51 79 91 119
North Fork BASIN15 122 207 248 359
Rio Bonito BASIN0 870 1,854 2,439 4,341
Rio Ruidoso BASIN7 415 818 1,046 1,761
Rio Ruidoso BASIN8 515 1,039 1,339 2,285
Rio Ruidoso BASIN10 1,033 2,240 2,965 5,334
Rio Ruidoso BASIN2 1,221 2,697 3,591 6,545
Rio Ruidoso BASIN18 1,506 3,399 4,562 8,443
Rio Ruidoso BASIN17 2,354 5,576 7,628 14,674
Rio Ruidoso BASIN12 2,993 7,274 10,045 19,685
Rio Ruidoso BASIN16 3,978 9,957 13,895 27,790
Rio Ruidoso BASIN20 5,780 15,053 21,319 43,906
Salado Creek BASIN3 848 1,778 2,302 3,907
Turkey Spring Canyon Creek
BASIN11 601 1,219 1,561 2,604
Unnamed Tributary 1 BASIN1 639 1,301 1,664 2,763
Hydraulic Analyses
6-1
SECTION SIX HYDRAULIC ANALYSES The U.S. Army Corps of Engineers (USACE) Hydrologic Engineering Center – River Analysis System (HEC-RAS), Version 4.0, was used to perform the hydraulic analyses (USACE 2005). WISE was used as a pre-processor for inputs to the hydraulic models and as a post-processor for delineation of the resulting floodplains. The study was conducted in accordance with the requirements of Appendix C of FEMA’s G&S (FEMA 2003).
6.1 MODELING METHODOLOGY The scope of work for Rio Bonito and Salado Creek, and portions of Cedar Creek and the Rio Ruidoso specified the use of the Limited Detail study methodology. The remainder of the streams were studied using detailed methodology. A floodway analysis was also conducted on the detailed portions of Brady Canyon, Carrizo Creek, Cedar Creek and the Rio Ruidoso. The discharges presented in Table 5-3 were used for the hydraulic analyses.
6.2 CROSS-SECTION DEVELOPMENT The WISE software was used to place cross-sections at 500-foot intervals. Additional cross-sections were placed along the reach in areas where the channel slope or geometry abruptly changed. WISE also automatically named and numbered the cross-sections sequentially from downstream to upstream. The cross-sections placed by WISE were then checked for reasonableness during a quality control phase of the hydraulic modeling. They were adjusted to extend across the entire anticipated floodplain width and were placed perpendicularly to the anticipated direction of flow in both the main channel and the overbank areas. The cross-sections were also realigned manually to avoid swales, to tie them into the high points, and to make sure the cross-sections were not intersecting with each other.
Besides the natural cross-sections drawn automatically by WISE, the additional five cross-sections required for the subsequent HEC-RAS hydraulic model were manually added at structures such as bridges and culverts. These five cross-sections include a downstream cross-section where flow is fully expanded, a cross-section at the downstream face of the structure, a cross-section representing the top of the structure, a cross-section at the upstream face of the structure, and an upstream cross-section prior to flow contraction.
The channel portion was surveyed at cross-sections identified in Section 3 of this report and this data was blended with the digital overbank topographic data in WISE at these cross-sections. For non-surveyed natural cross-sections, the channel geometry was copied from the nearest surveyed cross-section if applicable, and the overbank geometry was derived from the topographic data in WISE.
6.3 FLOODWAY ANALYSIS Floodway analyses were conducted on Brady Canyon, Carrizo Creek, the detailed portion of Cedar Creek and the detailed portion of the Rio Ruidoso. Encroachments were calculated with a goal of a 1-foot water surface elevation rise, and a 1:1 width change. Given the steep nature each channel, this goal was not always reached. Many locations along the stream had no encroachments and no rise because the flow was near critical, or critical. Any encroachments in
Hydraulic Analyses
6-2
these areas would result in negative changes in water surface elevations indicating higher velocities. These high velocities would cause excess degradation of channels and their banks.
Floodway data tables are provided in Appendix E.
6.4 MANNING’S ROUGHNESS COEFFICIENT CALCULATIONS Qualified field personnel were dispatched to inspect each study stream in order to make determinations regarding the Manning’s n-values and other hydraulic characteristics. Photographs were also taken to document the floodplain condition at the time of field reconnaissance (see digital data). The Manning’s n-values were determined taking into consideration several factors, such as channel bed materials (type and density), height of existing vegetation, and existing structures in the overbanks. Determinations were also made by inspecting the stream and the surrounding floodplain, and comparing it to characteristics listed in the HEC-RAS User’s Manual, Table 3-1, Manning’s n-values (USACE 2005; see Appendix C, Field Survey and Reconnaissance). These determinations were listed on Field Reconnaissance Data Sheets. The Manning’s n-values used in the hydraulics models were based on the Field Reconnaissance Data Sheets and examination of aerial imagery, and engineering judgment was exercised to develop the values for the model. Channel banks were placed to reflect the roughness coefficient changes along each cross-section in the hydraulic model.
Table 6-1 provides the Manning’s n-values that were used in the HEC-RAS model for each study reach.
Table 6-1: Manning’s n-Values
Flooding Sources Left
Overbank N-Value
Main Channel N-Value
Right Overbank N-Value
Brady Canyon 0.08–0.2 0.035–0.05 0.08–0.2 Carrizo Creek 0.1–0.13 0.026–0.055 0.02–0.14 Cedar Creek 0.04–0.12 0.035–0.07 0.04–0.12
Rio Bonito Creek 0.08–0.12 0.05 0.07–0.12 Rio Ruidoso 0.1–0.2 0.035–0.05 0.1–0.2
Salado Creek 0.06–0.07 0.045–0.05 0.06–0.07
During the June 18, 2009 Community Review Meeting, the Village of Ruidoso indicated that many of the streams in the Village of Ruidoso were full of debris from the flooding that occurred in July 2008. It was noted during this meeting that obstructed structure and channel situations are not modeled during hydraulic modeling. The analyses performed assumed unobstructed structure and channel conditions.
6.5 MODELING CONSIDERATIONS AND OTHER MODEL PARAMETERS Typical expansion and contraction coefficients of 0.1 and 0.3, respectively, were used for all channel cross-sections to account for losses due to the changing width of the study stream. Expansion and contraction loss coefficients were also applied to all crossing structures within the HEC-RAS model to account for the additional energy losses. For normal culverts and bridges,

Hydraulic Analyses
6-3
the expansion and contraction coefficients were set to 0.3 and 0.5, respectively. For locations where larger losses were expected, such as at a very small culvert, the expansion and contraction coefficients were set to 0.6 and 0.8, respectively. Ineffective flow areas were also used to describe portions of a cross-section where water is not active (i.e., at the abutments of a structure).
Due to minor bends in each stream, some survey data did not always line up with structures in the floodplain. Engineering judgment was used to more accurately refine data from the model.
Based on aerial imagery, there appears to be a dam on Rio Bonito, just upstream of structure RB_UR9 (Unnamed Road 9). No structure was surveyed at this location, but an approximate structure (DAM1) was added in the hydraulic model using the topographic information and aerial imagery.
On the Cedar Creek Limited Detail study reach, two culverts were added at Stations 12658 and 12852 based on field reconnaissance. The structures were not surveyed, but the dimensions were estimated based on photographs, topographic data, and similar structures surveyed.
All models were run at subcritical depth as per the G&S (FEMA 2003). For Brady Canyon, Cedar Creek, Salado Creek, Rio Bonito, and the Rio Ruidoso Limited Detail study, per C.3.4.3 of G&S Appendix C, normal depth was used as the starting downstream boundary condition for these streams. The Rio Ruidoso Detailed study ties into the Rio Ruidoso Limited Detail model and the Cedar Creek Limited Detail study ties into the Cedar Creek Detailed study. Therefore, a known water surface elevation was used as the starting downstream boundary condition for those models. Models and other hydraulic calculations were provided in Appendix E of this report.
Results
7-1
SECTION SEVEN RESULTS
7.1 EXCEPTIONS Basins, streamlines, cross-sections, hydrology and hydraulic calculations, and data used to generate TINs were provided as they were utilized as part of this analysis. These files were left in the format required by WISE and do not meet G&S. WISE is FEMA-approved software. Only data utilized was provided as part of this submittal.
7.2 FLOODPLAIN MAPPING The 1-percent-annual-chance flood boundaries were exported from HEC-RAS to Geographic Information Systems (GIS) format and mapped. The shapefiles were then refined using visual inspection of orthophotographs and available contour data in areas between modeled cross-sections. The resulting floodplain shapefiles are in agreement with the modeling results for all study reaches.
Work maps at a 1:6000 scale (1 inch = 500 feet) were included with this submittal. The maps can be found in Appendix F of this report. Issues encountered while performing floodplain mapping are discussed below.
In many locations, survey data showed channels deeper than what was depicted by USGS data. Therefore, some floodplains needed to be mapped based on width instead of elevation. USGS topographic data was utilized for the terrain model in areas outside of the Village of Ruidoso and City of Ruidoso Downs. Surveys were also performed at a much higher accuracy than what was available from USGS. Therefore, survey data, supplemented by topographic data, was used to model and map floodplains. In many locations, hydraulic analyses indicated that floodplains were contained in channels. Cases were encountered where the TIN developed using USGS data did not reflect the modeling results or the surveyed cross-sections. For these cases, the top widths of the modeling results were used to map the floodplains.
On Rio Ruidoso, topography showed the Rio Ruidoso crossing Highway 70 near Station 94,000. Based on Field Reconnaissance and orthophotography, the Rio Ruidoso did not cross Highway 70 at this location. The floodplain was adjusted based on the top widths obtained from the HEC-RAS analysis.
The results of this study were tied into the studies from each available Effective FIS upstream and downstream of the study reach limits, where applicable. The Cedar Creek Limited Detail study tied into the North Fork and South Fork Cedar Creek effective studies at the upstream end. The downstream water surface elevations of those effective models are similar to the upstream water surface elevation of the Cedar Creek Limited Detail study. No other new studies tied into effective Zone AE studies.
7.3 FLOOD PROFILES Water surface elevation data can be obtained from the flood profiles provided in Appendix F. Modeled cross-sections, excluding top-of-road cross-sections, were “lettered” and are included on the flood recovery maps and flood profiles as a reference for communities to locate areas

Results
7-2
along the study streams. Lettered cross-sections are shown on the profiles along with road crossing information for reference purposes only. These cross-sections are not the standard lettered cross-sections such as those found in an Effective FIS, which typically indicate that a detailed study has been performed.

References
8-1
SECTION EIGHT REFERENCES ESRI, 2006. ArcGIS, version 9.2, Redlands, CA, November 2006.
FEMA, 2003. Guidelines and Specifications for Flood Hazard Mapping Partners, Appendix C – Guidance for Riverine Flooding Analyses and Mapping, Washington, DC, April 2003.
FEMA, 1994, Flood Insurance Study and Flood Insurance Rate Maps, Village of Ruidoso, New Mexico, March 15, 1994.
FEMA, 1982, Flood Insurance Study and Flood Insurance Rate Maps, Village of Ruidoso Downs, New Mexico, January 5, 1982.
National Hydrography Dataset Plus (NHDPlus). http://www.horizon systems.com/nhdplus/data.php. NHDPlus 10 meter DEM data from the National Elevation Dataset (NED) for Lincoln County. 2005.
Thomas R. Mann and Associates, Inc., 1996. Topographic Base Mapping and Digital Files, Albuquerque, NM. (Date of Files is 1996).
USACE, 2005. Hydrologic Engineering Center River Analysis System (HEC-RAS) User’s Manual and software version 4.0, Davis, CA, March 2008.
USACE, 2000. Hydrologic Engineering Center Hydrologic Modeling System (HEC-HMS) Technical Reference Manual and software version 3.3, Hydrologic Engineering Center, Davis, CA, March 2000.
USGS, 1981. Guidelines for Determining Flood Flow Frequency, Bulletin 17B of the Hydrology Subcommittee, revised September 1981, editorial corrections March 1982.
USGS, 2008. Analysis of the Magnitude and Frequency of Peak Discharge and Maximum Observed Peak Discharge in New Mexico and Surrounding Areas, Scientific Investigations Report 2008-5119.
Watershed Concepts, WISE Version 3.1.0.02, Charlotte, NC.

Appendix A
Quality Assurance Procedures

Appendix A Quality Assurance Procedures
A-1
To ensure quality of documents prepared for FEMA under the HMTAP contract, URS has implemented procedures so that all phases of this study were verified for correctness, completeness, and technical accuracy by a senior professional independent from the originator of the document to be checked, but part of the project team as assigned by the Task Order Monitor (TOM).
The FEMA HMTAP Quality Assurance Process consists of the detailed check, the Independent Technical Review (ITR), and the technical edit. Each phase of this process is discussed in greater detail below.
Detailed Check When calculations have been completed, the Task Order Coordinator (TOC) assigns a competent, qualified person from the project team to check them. Calculations are normally checked immediately after completion to limit the possibility of perpetuating errors in subsequent calculations, drawings, or specifications but, in every event, before final project documents are released to the client.
For this study, all hydrologic and hydraulic model calculations were checked in detail during this phase of quality assurance.
ITR The ITR includes a critical evaluation of the basis and validity of significant conclusions, opinions, assumptions, evaluations, recommendations, designs, and other items required as an end result of the project services. It emphasizes establishing the validity of the technical approach and other procedures used to form an opinion of the suitability of the end result. The review does not include a complete detail check of calculations or a detail check of plans, but does include verification that the required detail plan and calculation checking has been performed prior to the review.
At the completion of this study, the hydrologic and hydraulic analyses, the resulting flood recovery maps and flood profiles, and the final report were reviewed as part of this phase of quality assurance.
Technical Edit Once the ITR has been completed, the deliverable is submitted to a Document Control Supervisor for formatting and technical editing. The editor ensures coherence of parts, subordination, proper referencing, and completeness of the document. The Document Control Supervisor will also ensure that the formatting and word usage adheres to the FEMA-specific style guide.
As this is the final stage of the quality assurance process prior to submittal, all documentation for earlier phases of quality assurance is provided to the Document Control Supervisor and the HMTAP Quality Assurance Officer to verify that all quality assurance procedures have been met. Once the technical edit has been completed, the final document is reviewed by the HMTAP Quality Assurance Officer, the URS-Program Manager, or the URS-Assistant Program Manager prior to submittal to FEMA.

Appendix B
Topographic Data

See Digital Data for Topographic Data
Appendix B - Topographic Data
Appendix C
Field Survey and Reconnaissance

See Digital Data for Field Survey
and Reconnaissance
Appendix C - Field Survey

Appendix D
Hydrology
Brady Canyon
Carrizo Creek
Cedar Creek
Rio Ruidoso
Rio Ruidoso
Rio Bonito
Salado Creek
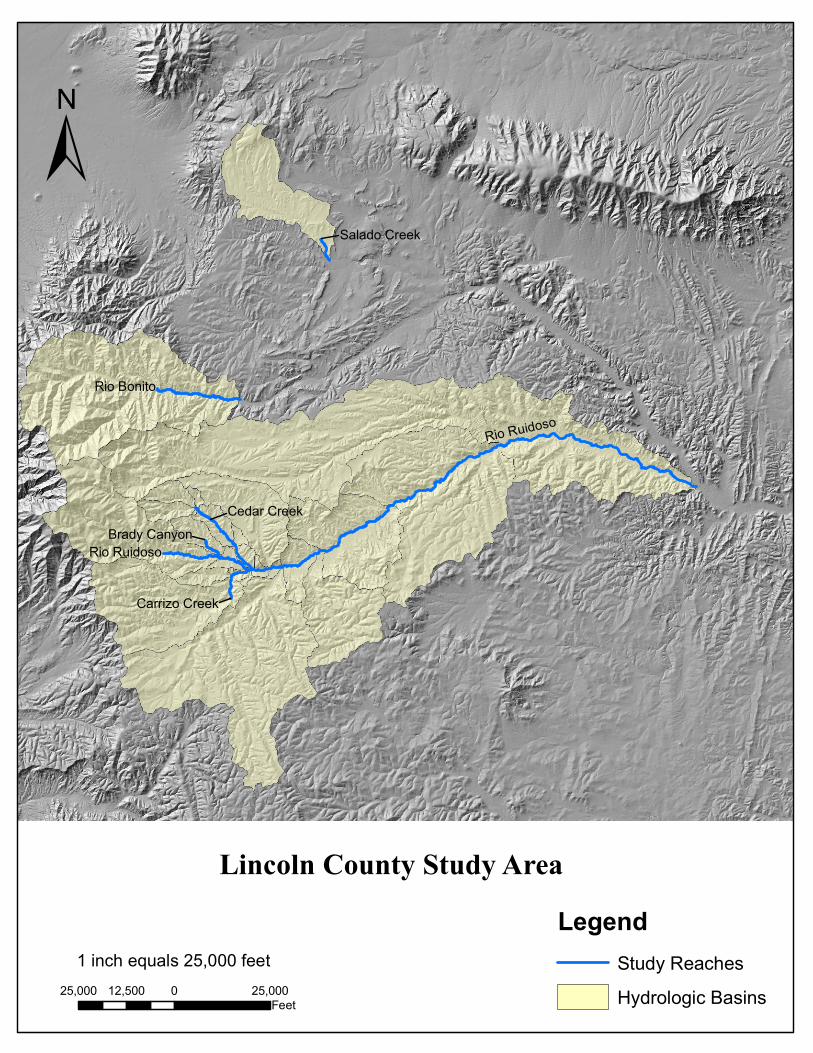
1 inch equals 25,000 feet
Lincoln County Study Area
±
25,000 0 25,00012,500Feet
LegendStudy ReachesHydrologic Basins
See Digital Data for Hydrology
Appendix D - Hydrology

Appendix E
Hydraulics

FLOODING SOURCE FLOODWAY BASE FLOOD WATER SURFACE ELEVATION
CROSS SECTION DISTANCE1 WIDTH
(FEET) SECTION AREA (SQUARE FEET)
MEAN VELOCITY (FEET PER SECOND)
REGULATORY(NAVD)
WITHOUT FLOODWAY
(NAVD)
WITH FLOODWAY
(NAVD) INCREASE
Brady Canyon
A 573 38 275 1.6 6,761.7 6,761.7 6,762.5 0.8 B 824 20 50 8.9 6,767.3 6,767.3 6,767.3 0.0 C 901 52 201 2.2 6,772.5 6,772.5 6,773.5 1.0 D 1,062 24 54 8.2 6,775.2 6,775.2 6,775.2 0.0 E 1,415 9 38 11.6 6,790.0 6,790.0 6,790.2 0.2 F 1,492 31 195 2.3 6,795.3 6,795.3 6,795.5 0.2 G 1,617 16 50 8.8 6,795.1 6,795.1 6,795.1 0.0 H 2,036 34 61 7.3 6,810.1 6,810.1 6,810.1 0.0 I 2,311 22 52 8.5 6,821.6 6,821.6 6,821.7 0.1 J 2,367 35 254 1.8 6,827.5 6,827.5 6,827.9 0.4 K 2,424 30 160 2.8 6,827.5 6,827.5 6,827.9 0.4 L 2,676 10 39 11.3 6,832.0 6,832.0 6,832.2 0.2 M 2,775 29 127 3.5 6,839.3 6,839.3 6,840.1 0.8 N 2,904 20 58 7.6 6,843.9 6,843.9 6,844.1 0.2 O 2,988 24 93 4.8 6,845.4 6,845.4 6,846.2 0.8 P 3,079 41 145 3.1 6,846.1 6,846.1 6,847.1 1.0 Q 3,105 40 224 2.0 6,848.8 6,848.8 6,849.4 0.6 R 3,112 24 106 4.2 6,848.8 6,848.8 6,849.3 0.5 S 3,149 29 139 3.2 6,849.7 6,849.7 6,850.7 1.0 T 3,160 41 259 1.7 6,849.9 6,849.9 6,850.9 1.0 U 3,278 30 162 2.7 6,851.2 6,851.2 6,852.1 0.9 V 3,353 27 92 4.8 6,851.2 6,851.2 6,852.1 0.9 W 3,605 18 49 9.0 6,859.9 6,859.9 6,859.9 0.0 X 3,678 27 126 3.5 6,862.2 6,862.2 6,863.2 1.0
1 Feet above confluence with Rio Ruidoso
TAB
LE 1
6
FEDERAL EMERGENCY MANAGEMENT AGENCY
BRADY CANYON
FLOODWAY DATA
AND INCORPORATED AREAS LINCOLN COUNTY, NM

FLOODING SOURCE FLOODWAY BASE FLOOD WATER SURFACE ELEVATION
CROSS SECTION DISTANCE1 WIDTH
(FEET) SECTION AREA (SQUARE FEET)
MEAN VELOCITY (FEET PER SECOND)
REGULATORY(NAVD)
WITHOUT FLOODWAY
(NAVD)
WITH FLOODWAY
(NAVD) INCREASE
Brady Canyon (Continued)
Y 3,729 21 58 7.7 6,862.7 6,862.7 6,862.9 0.2 Z 3,786 38 72 6.2 6,865.9 6,865.9 6,865.9 0.0
AA 3,862 54 158 2.8 6,866.8 6,866.8 6,867.7 0.9 AB 3,959 9 38 11.5 6,870.1 6,870.1 6,870.1 0.0 AC 4,327 20 53 8.4 6,878.8 6,878.8 6,878.9 0.1 AD 4,393 26 124 3.6 6,885.8 6,885.8 6,886.8 1.0 AE 4,427 19 94 4.8 6,885.8 6,885.8 6,886.8 1.0 AF 4,468 26 118 3.8 6,886.3 6,886.3 6,887.1 0.8 AG 4,838 24 53 8.4 6,896.3 6,896.3 6,896.3 0.0 AH 5,222 60 77 5.8 6,907.1 6,907.1 6,907.1 0.0 AI 5,394 46 141 3.2 6,914.2 6,914.2 6,914.9 0.7 AJ 5,508 68 75 5.9 6,917.3 6,917.3 6,917.4 0.1 AK 6,177 45 80 5.6 6,935.2 6,935.2 6,935.2 0.0 AL 6,259 26 140 3.2 6,939.3 6,939.3 6,940.3 1.0 AM 6,456 18 51 8.6 6,948.5 6,948.5 6,949.4 0.9
1 Feet above confluence with Rio Ruidoso
TAB
LE 1
6
FEDERAL EMERGENCY MANAGEMENT AGENCY
BRADY CANYON
FLOODWAY DATA
AND INCORPORATED AREAS LINCOLN COUNTY, NM
FLOODING SOURCE FLOODWAY BASE FLOOD WATER SURFACE ELEVATION
CROSS SECTION DISTANCE1 WIDTH
(FEET) SECTION AREA (SQUARE FEET)
MEAN VELOCITY (FEET PER SECOND)
REGULATORY(NAVD88)
WITHOUT FLOODWAY
(NAVD88)
WITH FLOODWAY
(NAVD88) INCREASE
Carrizo Creek
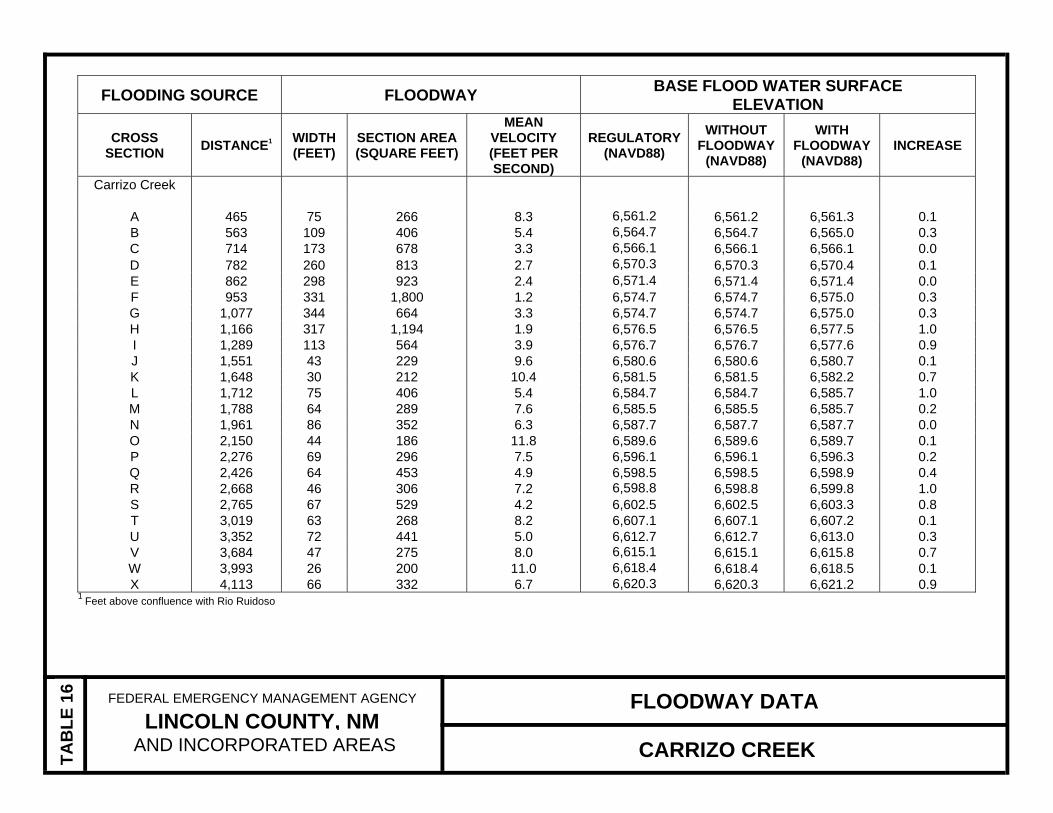
A 465 75 266 8.3 6,561.2 6,561.2 6,561.3 0.1 B 563 109 406 5.4 6,564.7 6,564.7 6,565.0 0.3 C 714 173 678 3.3 6,566.1 6,566.1 6,566.1 0.0 D 782 260 813 2.7 6,570.3 6,570.3 6,570.4 0.1 E 862 298 923 2.4 6,571.4 6,571.4 6,571.4 0.0 F 953 331 1,800 1.2 6,574.7 6,574.7 6,575.0 0.3 G 1,077 344 664 3.3 6,574.7 6,574.7 6,575.0 0.3 H 1,166 317 1,194 1.9 6,576.5 6,576.5 6,577.5 1.0 I 1,289 113 564 3.9 6,576.7 6,576.7 6,577.6 0.9 J 1,551 43 229 9.6 6,580.6 6,580.6 6,580.7 0.1 K 1,648 30 212 10.4 6,581.5 6,581.5 6,582.2 0.7 L 1,712 75 406 5.4 6,584.7 6,584.7 6,585.7 1.0 M 1,788 64 289 7.6 6,585.5 6,585.5 6,585.7 0.2 N 1,961 86 352 6.3 6,587.7 6,587.7 6,587.7 0.0 O 2,150 44 186 11.8 6,589.6 6,589.6 6,589.7 0.1 P 2,276 69 296 7.5 6,596.1 6,596.1 6,596.3 0.2 Q 2,426 64 453 4.9 6,598.5 6,598.5 6,598.9 0.4 R 2,668 46 306 7.2 6,598.8 6,598.8 6,599.8 1.0 S 2,765 67 529 4.2 6,602.5 6,602.5 6,603.3 0.8 T 3,019 63 268 8.2 6,607.1 6,607.1 6,607.2 0.1 U 3,352 72 441 5.0 6,612.7 6,612.7 6,613.0 0.3 V 3,684 47 275 8.0 6,615.1 6,615.1 6,615.8 0.7 W 3,993 26 200 11.0 6,618.4 6,618.4 6,618.5 0.1 X 4,113 66 332 6.7 6,620.3 6,620.3 6,621.2 0.9
1 Feet above confluence with Rio Ruidoso
TAB
LE 1
6
FEDERAL EMERGENCY MANAGEMENT AGENCY
AND INCORPORATED AREAS LINCOLN COUNTY, NM
FLOODWAY DATA
CARRIZO CREEK
FLOODING SOURCE FLOODWAY BASE FLOOD WATER SURFACE ELEVATION
CROSS SECTION DISTANCE1 WIDTH
(FEET) SECTION AREA (SQUARE FEET)
MEAN VELOCITY (FEET PER SECOND)
REGULATORY(NAVD88)
WITHOUT FLOODWAY
(NAVD88)
WITH FLOODWAY
(NAVD88) INCREASE
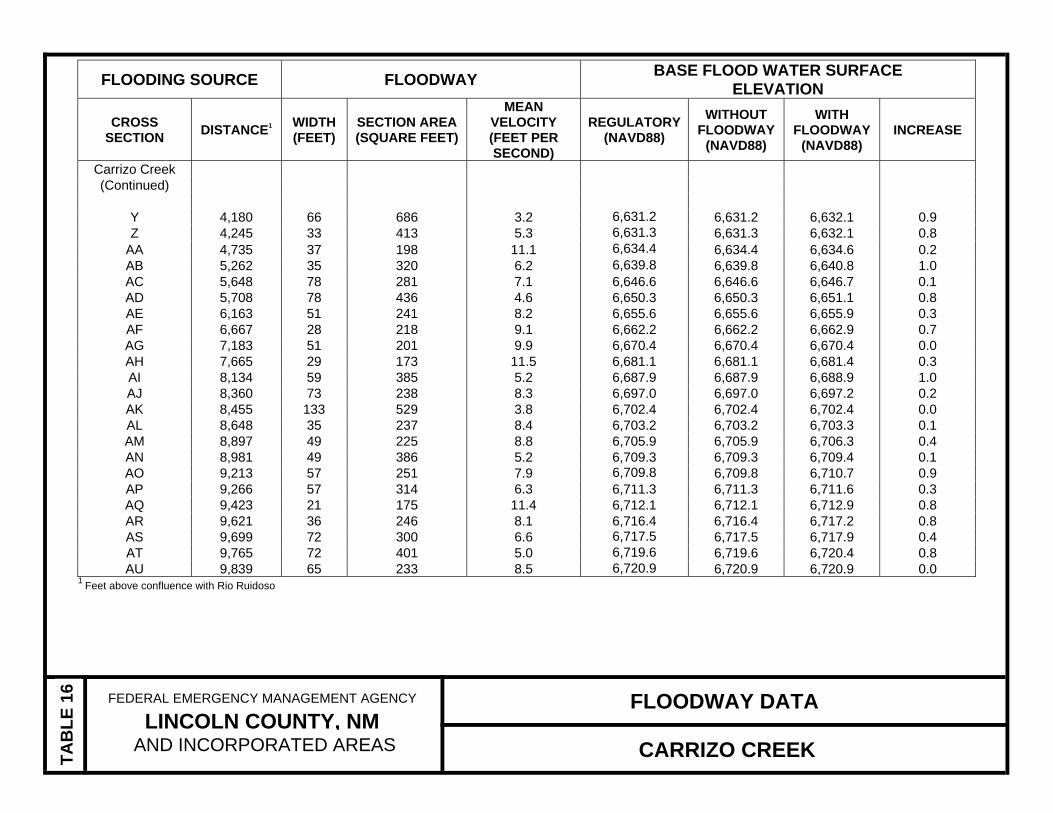
Carrizo Creek (Continued)
Y 4,180 66 686 3.2 6,631.2 6,631.2 6,632.1 0.9 Z 4,245 33 413 5.3 6,631.3 6,631.3 6,632.1 0.8
AA 4,735 37 198 11.1 6,634.4 6,634.4 6,634.6 0.2 AB 5,262 35 320 6.2 6,639.8 6,639.8 6,640.8 1.0 AC 5,648 78 281 7.1 6,646.6 6,646.6 6,646.7 0.1 AD 5,708 78 436 4.6 6,650.3 6,650.3 6,651.1 0.8 AE 6,163 51 241 8.2 6,655.6 6,655.6 6,655.9 0.3 AF 6,667 28 218 9.1 6,662.2 6,662.2 6,662.9 0.7 AG 7,183 51 201 9.9 6,670.4 6,670.4 6,670.4 0.0 AH 7,665 29 173 11.5 6,681.1 6,681.1 6,681.4 0.3 AI 8,134 59 385 5.2 6,687.9 6,687.9 6,688.9 1.0 AJ 8,360 73 238 8.3 6,697.0 6,697.0 6,697.2 0.2 AK 8,455 133 529 3.8 6,702.4 6,702.4 6,702.4 0.0 AL 8,648 35 237 8.4 6,703.2 6,703.2 6,703.3 0.1 AM 8,897 49 225 8.8 6,705.9 6,705.9 6,706.3 0.4 AN 8,981 49 386 5.2 6,709.3 6,709.3 6,709.4 0.1 AO 9,213 57 251 7.9 6,709.8 6,709.8 6,710.7 0.9 AP 9,266 57 314 6.3 6,711.3 6,711.3 6,711.6 0.3 AQ 9,423 21 175 11.4 6,712.1 6,712.1 6,712.9 0.8 AR 9,621 36 246 8.1 6,716.4 6,716.4 6,717.2 0.8 AS 9,699 72 300 6.6 6,717.5 6,717.5 6,717.9 0.4 AT 9,765 72 401 5.0 6,719.6 6,719.6 6,720.4 0.8 AU 9,839 65 233 8.5 6,720.9 6,720.9 6,720.9 0.0
1 Feet above confluence with Rio Ruidoso
TAB
LE 1
6
FEDERAL EMERGENCY MANAGEMENT AGENCY
AND INCORPORATED AREAS LINCOLN COUNTY, NM
FLOODWAY DATA
CARRIZO CREEK
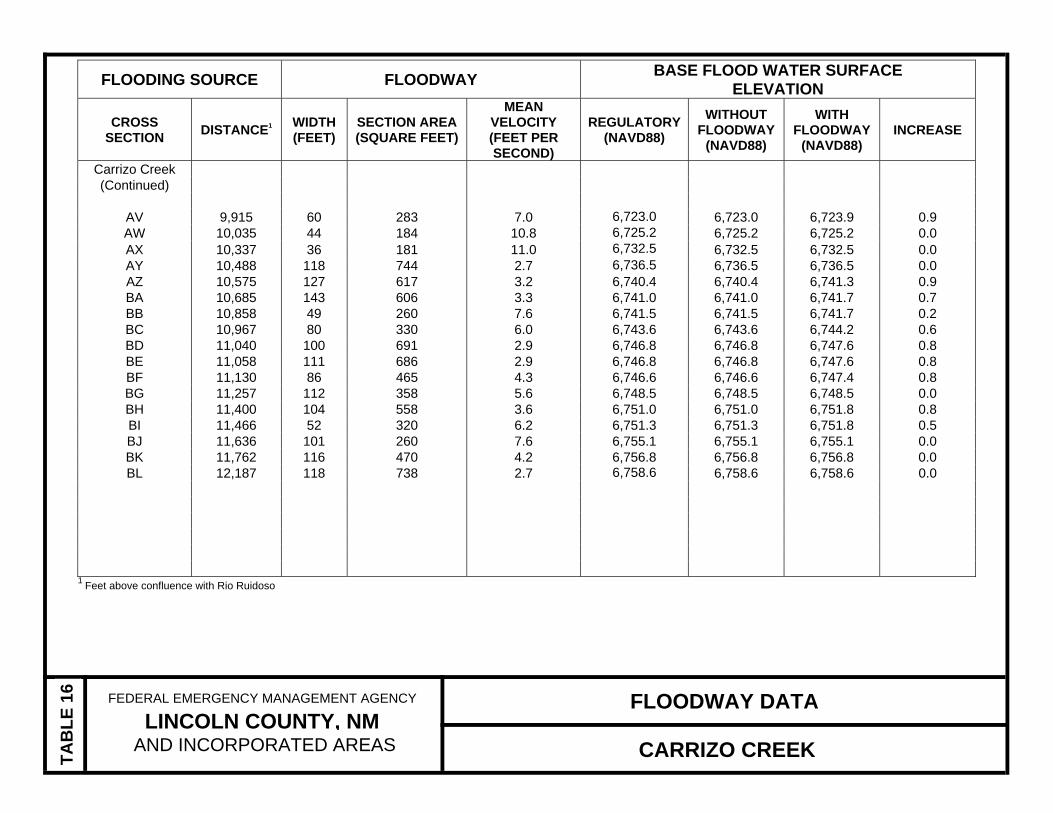
FLOODING SOURCE FLOODWAY BASE FLOOD WATER SURFACE ELEVATION
CROSS SECTION DISTANCE1 WIDTH
(FEET) SECTION AREA (SQUARE FEET)
MEAN VELOCITY (FEET PER SECOND)
REGULATORY(NAVD88)
WITHOUT FLOODWAY
(NAVD88)
WITH FLOODWAY
(NAVD88) INCREASE
Carrizo Creek (Continued)
AV 9,915 60 283 7.0 6,723.0 6,723.0 6,723.9 0.9 AW 10,035 44 184 10.8 6,725.2 6,725.2 6,725.2 0.0 AX 10,337 36 181 11.0 6,732.5 6,732.5 6,732.5 0.0 AY 10,488 118 744 2.7 6,736.5 6,736.5 6,736.5 0.0 AZ 10,575 127 617 3.2 6,740.4 6,740.4 6,741.3 0.9 BA 10,685 143 606 3.3 6,741.0 6,741.0 6,741.7 0.7 BB 10,858 49 260 7.6 6,741.5 6,741.5 6,741.7 0.2 BC 10,967 80 330 6.0 6,743.6 6,743.6 6,744.2 0.6 BD 11,040 100 691 2.9 6,746.8 6,746.8 6,747.6 0.8 BE 11,058 111 686 2.9 6,746.8 6,746.8 6,747.6 0.8 BF 11,130 86 465 4.3 6,746.6 6,746.6 6,747.4 0.8 BG 11,257 112 358 5.6 6,748.5 6,748.5 6,748.5 0.0 BH 11,400 104 558 3.6 6,751.0 6,751.0 6,751.8 0.8 BI 11,466 52 320 6.2 6,751.3 6,751.3 6,751.8 0.5 BJ 11,636 101 260 7.6 6,755.1 6,755.1 6,755.1 0.0 BK 11,762 116 470 4.2 6,756.8 6,756.8 6,756.8 0.0 BL 12,187 118 738 2.7 6,758.6 6,758.6 6,758.6 0.0
FEDERAL EMERGENCY MANAGEMENT AGENCY
AND INCORPORATED AREAS LINCOLN COUNTY, NM
FLOODWAY DATA
CARRIZO CREEK
1 Feet above confluence with Rio Ruidoso
TAB
LE 1
6
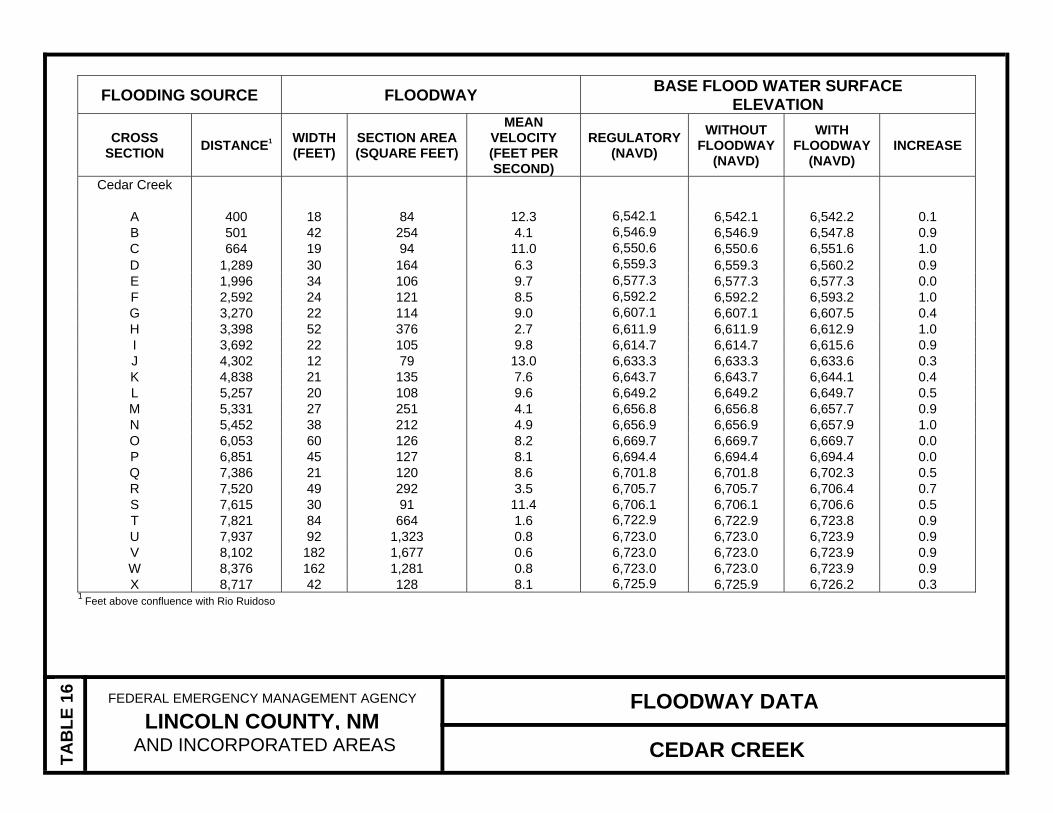
FLOODING SOURCE FLOODWAY BASE FLOOD WATER SURFACE ELEVATION
CROSS SECTION DISTANCE1 WIDTH
(FEET) SECTION AREA (SQUARE FEET)
MEAN VELOCITY (FEET PER SECOND)
REGULATORY(NAVD)
WITHOUT FLOODWAY
(NAVD)
WITH FLOODWAY
(NAVD) INCREASE
Cedar Creek
A 400 18 84 12.3 6,542.1 6,542.1 6,542.2 0.1 B 501 42 254 4.1 6,546.9 6,546.9 6,547.8 0.9 C 664 19 94 11.0 6,550.6 6,550.6 6,551.6 1.0 D 1,289 30 164 6.3 6,559.3 6,559.3 6,560.2 0.9 E 1,996 34 106 9.7 6,577.3 6,577.3 6,577.3 0.0 F 2,592 24 121 8.5 6,592.2 6,592.2 6,593.2 1.0 G 3,270 22 114 9.0 6,607.1 6,607.1 6,607.5 0.4 H 3,398 52 376 2.7 6,611.9 6,611.9 6,612.9 1.0 I 3,692 22 105 9.8 6,614.7 6,614.7 6,615.6 0.9 J 4,302 12 79 13.0 6,633.3 6,633.3 6,633.6 0.3 K 4,838 21 135 7.6 6,643.7 6,643.7 6,644.1 0.4 L 5,257 20 108 9.6 6,649.2 6,649.2 6,649.7 0.5 M 5,331 27 251 4.1 6,656.8 6,656.8 6,657.7 0.9 N 5,452 38 212 4.9 6,656.9 6,656.9 6,657.9 1.0 O 6,053 60 126 8.2 6,669.7 6,669.7 6,669.7 0.0 P 6,851 45 127 8.1 6,694.4 6,694.4 6,694.4 0.0 Q 7,386 21 120 8.6 6,701.8 6,701.8 6,702.3 0.5 R 7,520 49 292 3.5 6,705.7 6,705.7 6,706.4 0.7 S 7,615 30 91 11.4 6,706.1 6,706.1 6,706.6 0.5 T 7,821 84 664 1.6 6,722.9 6,722.9 6,723.8 0.9 U 7,937 92 1,323 0.8 6,723.0 6,723.0 6,723.9 0.9 V 8,102 182 1,677 0.6 6,723.0 6,723.0 6,723.9 0.9 W 8,376 162 1,281 0.8 6,723.0 6,723.0 6,723.9 0.9 X 8,717 42 128 8.1 6,725.9 6,725.9 6,726.2 0.3
1 Feet above confluence with Rio Ruidoso
TAB
LE 1
6
FEDERAL EMERGENCY MANAGEMENT AGENCY
AND INCORPORATED AREAS LINCOLN COUNTY, NM
FLOODWAY DATA
CEDAR CREEK
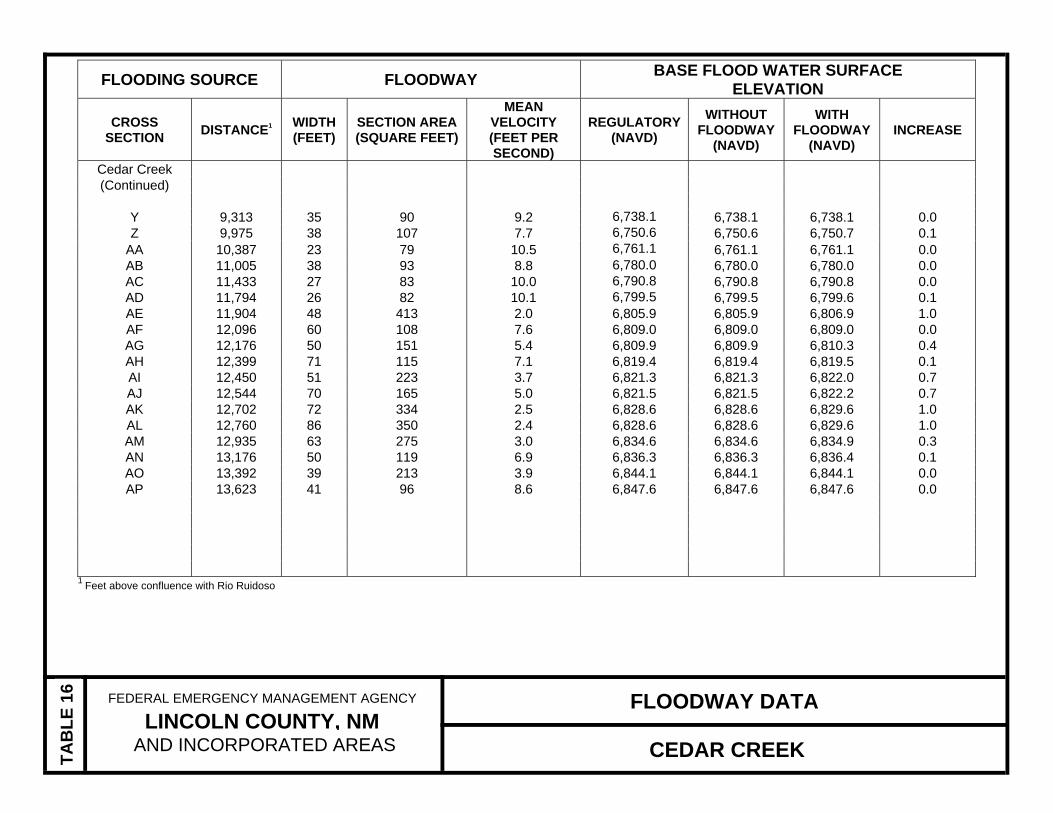
FLOODING SOURCE FLOODWAY BASE FLOOD WATER SURFACE ELEVATION
CROSS SECTION DISTANCE1 WIDTH
(FEET) SECTION AREA (SQUARE FEET)
MEAN VELOCITY (FEET PER SECOND)
REGULATORY(NAVD)
WITHOUT FLOODWAY
(NAVD)
WITH FLOODWAY
(NAVD) INCREASE
Cedar Creek (Continued)
Y 9,313 35 90 9.2 6,738.1 6,738.1 6,738.1 0.0 Z 9,975 38 107 7.7 6,750.6 6,750.6 6,750.7 0.1
AA 10,387 23 79 10.5 6,761.1 6,761.1 6,761.1 0.0 AB 11,005 38 93 8.8 6,780.0 6,780.0 6,780.0 0.0 AC 11,433 27 83 10.0 6,790.8 6,790.8 6,790.8 0.0 AD 11,794 26 82 10.1 6,799.5 6,799.5 6,799.6 0.1 AE 11,904 48 413 2.0 6,805.9 6,805.9 6,806.9 1.0 AF 12,096 60 108 7.6 6,809.0 6,809.0 6,809.0 0.0 AG 12,176 50 151 5.4 6,809.9 6,809.9 6,810.3 0.4 AH 12,399 71 115 7.1 6,819.4 6,819.4 6,819.5 0.1 AI 12,450 51 223 3.7 6,821.3 6,821.3 6,822.0 0.7 AJ 12,544 70 165 5.0 6,821.5 6,821.5 6,822.2 0.7 AK 12,702 72 334 2.5 6,828.6 6,828.6 6,829.6 1.0 AL 12,760 86 350 2.4 6,828.6 6,828.6 6,829.6 1.0 AM 12,935 63 275 3.0 6,834.6 6,834.6 6,834.9 0.3 AN 13,176 50 119 6.9 6,836.3 6,836.3 6,836.4 0.1 AO 13,392 39 213 3.9 6,844.1 6,844.1 6,844.1 0.0 AP 13,623 41 96 8.6 6,847.6 6,847.6 6,847.6 0.0
FEDERAL EMERGENCY MANAGEMENT AGENCY
AND INCORPORATED AREAS LINCOLN COUNTY, NM
FLOODWAY DATA
CEDAR CREEK
1 Feet above confluence with Rio Ruidoso
TAB
LE 1
6

FLOODING SOURCE FLOODWAY BASE FLOOD WATER SURFACE ELEVATION
CROSS SECTION DISTANCE1 WIDTH
(FEET) SECTION AREA (SQUARE FEET)
MEAN VELOCITY (FEET PER SECOND)
REGULATORY(NAVD88)
WITHOUT FLOODWAY
(NAVD88)
WITH FLOODWAY
(NAVD88) INCREASE
Rio Ruidoso
JZ 123,429 76 932 10.8 6,274.8 6,274.8 6,275.4 0.6 KA 123,907 178 2,416 4.4 6,278.8 6,278.8 6,278.9 0.1 KB 123,964 215 2,822 4.0 6,278.9 6,278.9 6,279.5 0.6 KC 124,217 84 1,176 8.5 6,279.0 6,279.0 6,279.9 0.9 KD 124,752 65 1,029 9.8 6,280.7 6,280.7 6,281.4 0.7 KE 125,236 84 1,028 9.8 6,282.3 6,282.3 6,283.2 0.9 KF 125,758 343 1,203 8.4 6,309.6 6,309.6 6,309.6 0.0 KG 126,295 56 468 16.3 6,316.4 6,316.4 6,316.5 0.1 KH 127,032 164 2,108 3.6 6,322.6 6,322.6 6,323.1 0.5 KI 127,432 204 1,654 4.6 6,322.7 6,322.7 6,323.6 0.9 KJ 127,932 110 821 9.3 6,323.9 6,323.9 6,324.9 1.0 KK 128,432 124 1,260 6.1 6,327.8 6,327.8 6,328.7 0.9 KL 128,932 120 1,214 6.3 6,329.2 6,329.2 6,330.1 0.9 KM 129,556 150 1,107 6.9 6,331.5 6,331.5 6,332.3 0.8 KN 129,798 380 1,475 6.4 6,334.6 6,334.6 6,334.6 0.0 KO 129,878 185 1,504 5.1 6,335.9 6,335.9 6,336.9 1.0 KP 129,951 185 1,236 6.2 6,336.0 6,336.0 6,337.0 1.0 KQ 130,702 159 721 10.6 6,340.9 6,340.9 6,340.9 0.0 KR 131,152 325 1,432 5.3 6,347.4 6,347.4 6,347.4 0.0 KS 131,172 140 1,188 6.4 6,347.7 6,347.7 6,348.7 1.0 KT 131,311 121 827 9.2 6,348.4 6,348.4 6,349.3 0.9 KU 131,596 150 1,016 7.5 6,351.3 6,351.3 6,352.1 0.8 KV 132,129 261 1,911 7.7 6,355.7 6,355.7 6,356.3 0.6 KW 132,372 454 3,930 1.9 6,362.3 6,362.3 6,363.3 1.0
1 Feet above confluence with Rio Hondo
TAB
LE 1
6
FEDERAL EMERGENCY MANAGEMENT AGENCY
RIO RUIDOSO
FLOODWAY DATA
AND INCORPORATED AREAS LINCOLN COUNTY, NM

FLOODING SOURCE FLOODWAY BASE FLOOD WATER SURFACE ELEVATION
CROSS SECTION DISTANCE1 WIDTH
(FEET) SECTION AREA (SQUARE FEET)
MEAN VELOCITY (FEET PER SECOND)
REGULATORY(NAVD88)
WITHOUT FLOODWAY
(NAVD88)
WITH FLOODWAY
(NAVD88) INCREASE
Rio Ruidoso (Continued)
KX 132,576 302 2,158 3.5 6,362.3 6,362.3 6,363.3 1.0 KY 132,946 154 747 10.2 6,362.8 6,362.8 6,363.3 0.5 KZ 133,446 58 499 15.3 6,365.5 6,365.5 6,365.8 0.3 LA 133,807 263 1,230 6.2 6,369.8 6,369.8 6,369.8 0.0 LB 134,040 200 1,681 5.7 6,370.0 6,370.0 6,370.4 0.4 LC 134,231 290 2,672 3.8 6,371.9 6,371.9 6,372.8 0.9 LD 134,328 149 970 7.9 6,371.8 6,371.8 6,372.8 1.0 LE 134,575 89 723 10.6 6,372.6 6,372.6 6,373.3 0.7 LF 134,730 88 754 13.2 6,373.5 6,373.5 6,374.1 0.6 LG 134,937 197 3,285 3.6 6,389.9 6,389.9 6,390.4 0.5 LH 135,138 124 1,808 4.2 6,390.0 6,390.0 6,390.6 0.6 LI 135,446 67 717 10.6 6,389.6 6,389.6 6,390.6 1.0 LJ 135,734 145 1,135 6.7 6,392.4 6,392.4 6,392.6 0.2 LK 136,193 71 794 9.6 6,394.3 6,394.3 6,394.8 0.5 LL 136,266 71 999 7.6 6,397.2 6,397.2 6,398.2 1.0 LM 136,356 87 833 9.2 6,397.4 6,397.4 6,398.4 1.0 LN 136,946 133 673 11.3 6,403.0 6,403.0 6,403.2 0.2 LO 137,422 122 806 9.5 6,409.8 6,409.8 6,409.9 0.1 LP 138,046 149 893 8.5 6,415.1 6,415.1 6,415.5 0.4 LQ 138,543 247 954 8.0 6,424.0 6,424.0 6,424.7 0.7 LR 138,946 169 928 8.2 6,430.0 6,430.0 6,430.3 0.3 LS 139,455 368 864 8.8 6,435.0 6,435.0 6,435.0 0.0 LT 139,524 484 1,474 5.2 6,436.6 6,436.6 6,436.6 0.0
1 Feet above confluence with Rio Hondo
TAB
LE 1
6
FEDERAL EMERGENCY MANAGEMENT AGENCY
RIO RUIDOSO
FLOODWAY DATA
AND INCORPORATED AREAS LINCOLN COUNTY, NM

FLOODING SOURCE FLOODWAY BASE FLOOD WATER SURFACE ELEVATION
CROSS SECTION DISTANCE1 WIDTH
(FEET) SECTION AREA (SQUARE FEET)
MEAN VELOCITY (FEET PER SECOND)
REGULATORY(NAVD88)
WITHOUT FLOODWAY
(NAVD88)
WITH FLOODWAY
(NAVD88) INCREASE
Rio Ruidoso (Continued)
LU 139,711 206 518 8.8 6,437.6 6,437.6 6,437.6 0.0 LV 140,110 63 456 10.0 6,441.3 6,441.3 6,441.3 0.0 LW 140,474 244 331 13.8 6,445.5 6,445.5 6,445.5 0.0 LX 140,529 180 911 5.0 6,448.1 6,448.1 6,448.7 0.6 LY 140,946 216 820 5.6 6,450.6 6,450.6 6,451.3 0.7 LZ 141,446 167 723 6.3 6,456.3 6,456.3 6,457.3 1.0 MA 142,023 78 483 9.5 6,464.2 6,464.2 6,464.5 0.3 MB 142,489 78 745 8.6 6,468.0 6,468.0 6,469.0 1.0 MC 142,553 146 1,109 4.4 6,472.8 6,472.8 6,473.7 0.9 MD 142,946 111 531 8.6 6,474.6 6,474.6 6,475.1 0.5 ME 143,001 85 399 9.0 6,475.3 6,475.3 6,475.6 0.3 MF 143,282 207 522 6.9 6,479.0 6,479.0 6,479.0 0.0 MG 143,328 321 1,126 3.2 6,481.2 6,481.2 6,481.2 0.0 MH 143,549 211 825 4.4 6,482.0 6,482.0 6,482.0 0.0 MI 144,053 181 730 4.9 6,485.3 6,485.3 6,485.4 0.1 MJ 144,301 288 521 6.9 6,488.1 6,488.1 6,488.1 0.0 MK 144,589 264 873 4.1 6,492.3 6,492.3 6,492.3 0.0 ML 145,000 122 493 7.3 6,495.7 6,495.7 6,495.8 0.1 MM 145,493 65 329 10.9 6,502.5 6,502.5 6,502.6 0.1 MN 145,946 76 422 8.5 6,508.3 6,508.3 6,509.2 0.9 MO 146,446 100 471 7.6 6,513.9 6,513.9 6,514.1 0.2 MP 147,001 422 504 12.5 6,521.2 6,521.2 6,521.2 0.0 MQ 147,112 252 1,328 2.7 6,524.1 6,524.1 6,525.1 1.0
1 Feet above confluence with Rio Hondo
TAB
LE 1
6
FEDERAL EMERGENCY MANAGEMENT AGENCY
RIO RUIDOSO
FLOODWAY DATA
AND INCORPORATED AREAS LINCOLN COUNTY, NM
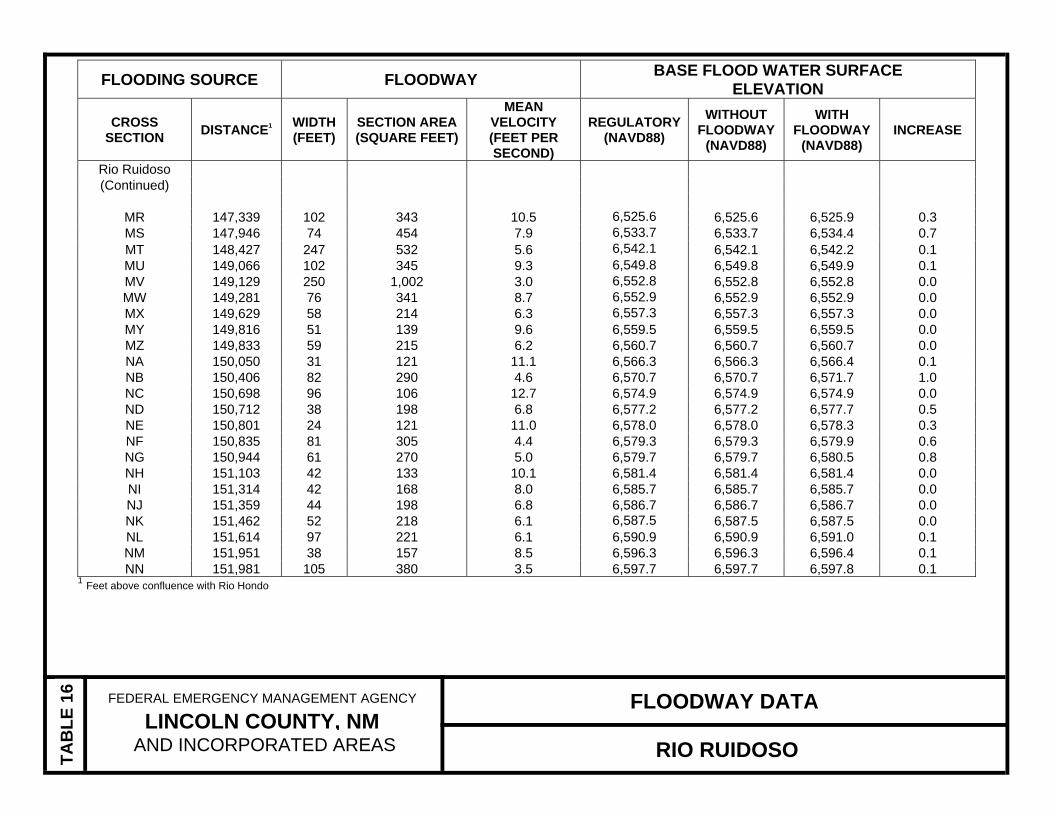
FLOODING SOURCE FLOODWAY BASE FLOOD WATER SURFACE ELEVATION
CROSS SECTION DISTANCE1 WIDTH
(FEET) SECTION AREA (SQUARE FEET)
MEAN VELOCITY (FEET PER SECOND)
REGULATORY(NAVD88)
WITHOUT FLOODWAY
(NAVD88)
WITH FLOODWAY
(NAVD88) INCREASE
Rio Ruidoso (Continued)
MR 147,339 102 343 10.5 6,525.6 6,525.6 6,525.9 0.3 MS 147,946 74 454 7.9 6,533.7 6,533.7 6,534.4 0.7 MT 148,427 247 532 5.6 6,542.1 6,542.1 6,542.2 0.1 MU 149,066 102 345 9.3 6,549.8 6,549.8 6,549.9 0.1 MV 149,129 250 1,002 3.0 6,552.8 6,552.8 6,552.8 0.0 MW 149,281 76 341 8.7 6,552.9 6,552.9 6,552.9 0.0 MX 149,629 58 214 6.3 6,557.3 6,557.3 6,557.3 0.0 MY 149,816 51 139 9.6 6,559.5 6,559.5 6,559.5 0.0 MZ 149,833 59 215 6.2 6,560.7 6,560.7 6,560.7 0.0 NA 150,050 31 121 11.1 6,566.3 6,566.3 6,566.4 0.1 NB 150,406 82 290 4.6 6,570.7 6,570.7 6,571.7 1.0 NC 150,698 96 106 12.7 6,574.9 6,574.9 6,574.9 0.0 ND 150,712 38 198 6.8 6,577.2 6,577.2 6,577.7 0.5 NE 150,801 24 121 11.0 6,578.0 6,578.0 6,578.3 0.3 NF 150,835 81 305 4.4 6,579.3 6,579.3 6,579.9 0.6 NG 150,944 61 270 5.0 6,579.7 6,579.7 6,580.5 0.8 NH 151,103 42 133 10.1 6,581.4 6,581.4 6,581.4 0.0 NI 151,314 42 168 8.0 6,585.7 6,585.7 6,585.7 0.0 NJ 151,359 44 198 6.8 6,586.7 6,586.7 6,586.7 0.0 NK 151,462 52 218 6.1 6,587.5 6,587.5 6,587.5 0.0 NL 151,614 97 221 6.1 6,590.9 6,590.9 6,591.0 0.1 NM 151,951 38 157 8.5 6,596.3 6,596.3 6,596.4 0.1 NN 151,981 105 380 3.5 6,597.7 6,597.7 6,597.8 0.1
1 Feet above confluence with Rio Hondo
TAB
LE 1
6
FEDERAL EMERGENCY MANAGEMENT AGENCY
RIO RUIDOSO
FLOODWAY DATA
AND INCORPORATED AREAS LINCOLN COUNTY, NM

FLOODING SOURCE FLOODWAY BASE FLOOD WATER SURFACE ELEVATION
CROSS SECTION DISTANCE1 WIDTH
(FEET) SECTION AREA (SQUARE FEET)
MEAN VELOCITY (FEET PER SECOND)
REGULATORY(NAVD88)
WITHOUT FLOODWAY
(NAVD88)
WITH FLOODWAY
(NAVD88) INCREASE
Rio Ruidoso (Continued)
NO 152,147 99 179 7.5 6,598.5 6,598.5 6,598.6 0.1 NP 152,456 57 159 8.4 6,605.2 6,605.2 6,605.3 0.1 NQ 152,844 62 185 7.2 6,612.1 6,612.1 6,612.4 0.3 NR 153,538 49 141 9.5 6,626.7 6,626.7 6,626.7 0.0 NS 153,784 62 172 7.8 6,632.4 6,632.4 6,632.6 0.2 NT 153,911 61 148 9.0 6,635.7 6,635.7 6,635.7 0.0 NU 154,479 51 177 7.6 6,646.8 6,646.8 6,646.8 0.0 NV 154,655 51 220 7.3 6,648.5 6,648.5 6,648.5 0.0 NW 154,723 65 549 2.4 6,653.1 6,653.1 6,654.0 0.9 NX 154,855 59 328 4.1 6,653.1 6,653.1 6,654.0 0.9 NY 155,770 44 135 9.9 6,666.6 6,666.6 6,666.6 0.0 NZ 155,859 50 212 6.6 6,668.8 6,668.8 6,668.8 0.0 OA 155,905 56 296 4.5 6,671.4 6,671.4 6,671.4 0.0 OB 156,085 95 195 6.9 6,674.9 6,674.9 6,675.9 1.0 OC 156,498 76 206 6.5 6,684.7 6,684.7 6,685.3 0.6 OD 157,010 66 166 8.1 6,693.8 6,693.8 6,694.7 0.9 OE 157,456 116 269 5.0 6,700.0 6,700.0 6,700.3 0.3 OF 157,493 61 272 4.9 6,700.7 6,700.7 6,701.2 0.5 OG 157,623 36 140 9.6 6,701.6 6,701.6 6,702.0 0.4 OH 157,885 25 116 11.5 6,707.4 6,707.4 6,707.6 0.2 OI 158,201 31 135 9.9 6,714.9 6,714.9 6,715.7 0.8 OJ 158,553 61 155 8.6 6,726.0 6,726.0 6,726.0 0.0 OK 159,191 94 204 6.6 6,739.7 6,739.7 6,739.8 0.1
1 Feet above confluence with Rio Hondo
TAB
LE 1
6
FEDERAL EMERGENCY MANAGEMENT AGENCY
RIO RUIDOSO
FLOODWAY DATA
AND INCORPORATED AREAS LINCOLN COUNTY, NM

FLOODING SOURCE FLOODWAY BASE FLOOD WATER SURFACE ELEVATION
CROSS SECTION DISTANCE1 WIDTH
(FEET) SECTION AREA (SQUARE FEET)
MEAN VELOCITY (FEET PER SECOND)
REGULATORY(NAVD88)
WITHOUT FLOODWAY
(NAVD88)
WITH FLOODWAY
(NAVD88) INCREASE
Rio Ruidoso (Continued)
OL 159,297 29 103 10.2 6,741.3 6,741.3 6,741.4 0.1 OM 159,446 31 101 10.3 6,745.7 6,745.7 6,745.9 0.2 ON 159,847 50 275 3.8 6,749.3 6,749.3 6,749.7 0.4 OO 159,976 49 220 4.8 6,754.0 6,754.0 6,754.0 0.0 OP 160,169 87 144 7.3 6,757.1 6,757.1 6,757.1 0.0 OQ 160,420 34 114 9.2 6,762.6 6,762.6 6,763.0 0.4 OR 160,455 44 200 5.2 6,763.8 6,763.8 6,764.4 0.6 OS 160,592 26 96 10.9 6,766.7 6,766.7 6,766.7 0.0 OT 160,753 58 179 5.9 6,770.2 6,770.2 6,770.8 0.6 OU 161,331 46 116 9.0 6,781.1 6,781.1 6,781.1 0.0 OV 161,820 26 109 9.6 6,792.1 6,792.1 6,792.4 0.3 OW 162,085 74 135 7.8 6,800.4 6,800.4 6,800.4 0.0 OX 162,300 74 174 6.0 6,805.0 6,805.0 6,805.0 0.0 OY 162,783 20 99 10.6 6,812.5 6,812.5 6,813.2 0.7 OZ 163,110 84 163 6.4 6,818.2 6,818.2 6,818.7 0.5 PA 163,163 113 414 2.5 6,823.4 6,823.4 6,823.4 0.0 PB 163,291 48 118 8.9 6,825.4 6,825.4 6,825.5 0.1 PC 163,941 26 116 9.1 6,838.5 6,838.5 6,838.8 0.3 PD 164,328 48 124 8.4 6,846.4 6,846.4 6,846.4 0.0 PE 164,708 28 104 10.1 6,855.0 6,855.0 6,855.1 0.1 PF 164,754 194 147 7.1 6,857.3 6,857.3 6,857.3 0.0 PG 164,953 43 115 9.1 6,866.0 6,866.0 6,866.0 0.0 PH 165,374 110 159 6.6 6,878.8 6,878.8 6,878.8 0.0
1 Feet above confluence with Rio Hondo
TAB
LE 1
6
FEDERAL EMERGENCY MANAGEMENT AGENCY
RIO RUIDOSO
FLOODWAY DATA
AND INCORPORATED AREAS LINCOLN COUNTY, NM

FLOODING SOURCE FLOODWAY BASE FLOOD WATER SURFACE ELEVATION
CROSS SECTION DISTANCE1 WIDTH
(FEET) SECTION AREA (SQUARE FEET)
MEAN VELOCITY (FEET PER SECOND)
REGULATORY(NAVD88)
WITHOUT FLOODWAY
(NAVD88)
WITH FLOODWAY
(NAVD88) INCREASE
Rio Ruidoso (Continued)
PI 166,031 68 160 6.5 6,892.5 6,892.5 6,892.5 0.0 PJ 166,644 171 99 10.6 6,907.0 6,907.0 6,907.0 0.0 PK 166,712 65 457 2.3 6,911.9 6,911.9 6,912.9 1.0 PL 166,957 60 125 8.4 6,916.0 6,916.0 6,916.0 0.0 PM 167,508 46 131 8.0 6,928.1 6,928.1 6,928.1 0.0 PN 168,007 88 145 7.2 6,944.8 6,944.8 6,944.9 0.1 PO 168,670 62 149 7.0 6,959.4 6,959.4 6,959.5 0.1 PP 169,167 91 147 7.1 6,973.4 6,973.4 6,973.4 0.0 PQ 169,548 90 150 7.0 6,984.4 6,984.4 6,984.5 0.1 PR 169,936 132 173 6.1 6,991.8 6,991.8 6,991.8 0.0 PS 170,015 183 682 1.5 6,997.0 6,997.0 6,997.0 0.0 PT 170,186 93 147 7.1 6,999.6 6,999.6 6,999.6 0.0 PU 170,740 48 128 8.2 7,013.2 7,013.2 7,013.2 0.0 PV 171,190 38 114 9.2 7,023.0 7,023.0 7,023.0 0.0 PW 171,545 43 112 9.3 7,033.6 7,033.6 7,033.6 0.0 PX 172,057 66 131 8.0 7,050.2 7,050.2 7,050.2 0.0 PY 172,514 72 150 7.0 7,065.2 7,065.2 7,065.3 0.1 PZ 172,775 34 119 8.8 7,070.6 7,070.6 7,070.7 0.1 QA 172,826 70 363 2.9 7,074.4 7,074.4 7,074.5 0.1 QB 172,975 44 115 9.1 7,076.7 7,076.7 7,076.7 0.0 QC 173,539 60 128 8.2 7,095.4 7,095.4 7,095.4 0.0 QD 173,875 48 118 8.9 7,106.6 7,106.6 7,106.6 0.0 QE 174,148 155 127 8.2 7,112.6 7,112.6 7,112.6 0.0
1 Feet above confluence with Rio Hondo
TAB
LE 1
6
FEDERAL EMERGENCY MANAGEMENT AGENCY
RIO RUIDOSO
FLOODWAY DATA
AND INCORPORATED AREAS LINCOLN COUNTY, NM

FLOODING SOURCE FLOODWAY BASE FLOOD WATER SURFACE ELEVATION
CROSS SECTION DISTANCE1 WIDTH
(FEET) SECTION AREA (SQUARE FEET)
MEAN VELOCITY (FEET PER SECOND)
REGULATORY(NAVD88)
WITHOUT FLOODWAY
(NAVD88)
WITH FLOODWAY
(NAVD88) INCREASE
Rio Ruidoso (Continued)
QF 174,205 150 389 3.9 7,116.3 7,116.3 7,116.3 0.0 QG 174,438 54 140 10.0 7,120.8 7,120.8 7,120.8 0.0 QH 174,548 66 379 2.8 7,128.1 7,128.1 7,128.4 0.3 QI 174,726 241 246 4.3 7,133.7 7,133.7 7,133.7 0.0 QJ 174,901 142 185 5.7 7,139.2 7,139.2 7,139.2 0.0 QK 175,150 118 193 5.4 7,144.5 7,144.5 7,144.6 0.1 QL 175,393 59 127 8.3 7,152.6 7,152.6 7,152.6 0.0 QM 175,886 41 132 7.9 7,173.1 7,173.1 7,173.5 0.4 QN 175,929 23 119 8.8 7,173.8 7,173.8 7,174.7 0.9 QO 175,971 62 284 3.7 7,175.3 7,175.3 7,176.0 0.7
1 Feet above confluence with Rio Hondo
TAB
LE 1
6
FEDERAL EMERGENCY MANAGEMENT AGENCY
RIO RUIDOSO
FLOODWAY DATA
AND INCORPORATED AREAS LINCOLN COUNTY, NM

See Digital Data for Hydraulics
Appendix E - Hydraulics
Appendix F
Flood Recovery Maps and Profiles
See Digital Data for Flood Recovery Maps and Profiles
Appendix F - Flood Recovery Maps
and Profiles

Appendix G
Supplementary Data
See Digital Data for Supplementary Data
Appendix G - Supplementary Data