final report - employment and training...
TRANSCRIPT

jjjjjjjjjjjjjjjjjjjjjjjjjjjjjjjjjjjjj Evaluation of the Strengthening the Connections Between Unemployment Insurance and the One-Stop Delivery Systems Demonstration Project in Wisconsin Final Report December 2006 Submitted to: US Department of Labor David E. Balducchi, Federal Project Officer Employment and Training Administration Office of Policy Development, Evaluation and Research 200 Constitution Ave., NW Room N5637 Washington, DC 20210 Submitted by: Berkeley Policy Associates 440 Grand Avenue, Suite 500 Oakland, California 94610

Authors of this Report:
Sherry Almandsmith, Project Director
Lorena Ortiz Adams
Han Bos
This project has been funded with federal funds from the under Contract No. AF-12529-00002-30 for the U.S. Department of Labor. The contents of this publication do not necessarily reflect the views or policies of the U.S. Department of Labor nor does mention of trade names, commercial products, or organizations imply endorsement by the U.S. Government.

Acknowledgements
The evaluation staff would like to acknowledge our appreciation for the assistance provided by the Wisconsin Department of Workforce Development. Without the cooperation of all the staff involved in designing and implementing the Wisconsin Demonstration Project, this study would not have been possible. In particular, we would like to thank William Breuggeman, Carol Laudenbach, Brian Solomon, Nanette Vetsch, Alfredo Rueda, Laneice McGee, Siliva Carter, Terri Josephs, Norm Gauthier, Julie Gloudemans, Lufti Shahrani, Tom Mund, Rita Atkinson, Patrick McDonnell, Steve Pionke, Judy Otterstein, and Bea Jay Panke. David Balducchi from the Department of Labor, Employment and Training Administration, truly guided the development of the demonstration and evaluation, and provided invaluable assistance with designing the study, reviewing reports, and offering advice and support throughout the study. The study team would also like to thank the other DOL/ETA staff who reviewed our reports and otherwise supported the evaluation: Stephanie Cabell, Donna Dye, Stephanie Garcia, Sahar Rais Danai, Tara C. Smith, Amanda B. Spickard, Kimberly Vitelli, Mary Vrany, and Diane Wood.

Table of Contents
Executive Summary .................................................................................................................... i
1. Introduction........................................................................................................................ 1-1 Demonstration Goals and Design.................................................................................... 1-2 Evaluation Goals and Design .......................................................................................... 1-3 Contents of This Report .................................................................................................. 1-9
2. Implementation of the Wisconsin Demonstration Project .............................................. 2-1 Increasing Collaboration Within the Wisconsin Department of Workforce Development ............................................................................................................ 2-1 Increasing Collaboration Between UI and Job Service at the Local Level................... 2-10 Summary/Conclusion .................................................................................................... 2-22
3. Outcomes of the Wisconsin Demonstration Project ....................................................... 3-1 Composition of the Final Study Sample .......................................................................... 3-1 Characteristics of the Study Sample ................................................................................ 3-2 Service Use .................................................................................................................... 3-11 Impacts on Employment, Earnings, and UI Benefit Receipt ......................................... 3-14 Relationships Between Services and Outcomes ............................................................ 3-20 Summary........................................................................................................................ 3-25
4. Customer Satisfaction......................................................................................................... 4-1 Satisfaction with RES Orientation ................................................................................... 4-1 Satisfaction with Project Services Overall....................................................................... 4-4 Summary of Customer Satisfaction Results .................................................................... 4-6
5. Lessons from the Wisconsin Demonstration Project ....................................................... 5-1 Project Goals and Design................................................................................................. 5-1 Consistency in Project Activities ..................................................................................... 5-2 UI Information Needs ...................................................................................................... 5-2 Staffing............................................................................................................................. 5-3 WPRS Process ................................................................................................................. 5-4 Communications .............................................................................................................. 5-5 Collaboration.................................................................................................................... 5-6 Data Systems and Record-Keeping ................................................................................. 5-7 Conclusion ....................................................................................................................... 5-7
Appendix A: Zip Codes and Demographics for with Demonstration and Comparison Sites Appendix B: Disposition of the Study Sample Appendix C: Construction of the Propensity Score Appendix D: Data Items Provided by Wisconsin Unemployment Insurance and Department of Workforce
Services Agencies Appendix E: Wisconsin Demonstration Project Forms Appendix F: Wisconsin’s UI to Job Center Data Systems Documentation Appendix G: Characteristics of the Demonstration Group, by Subgroup Appendix H: Characteristics of Group A and B Participants by Demonstration Site Appendix I: Characteristics of Demonstration vs. Comparison Groups, by Site Appendix J: Use of Demonstration and Job Center Services Appendix K: Proportion of Demonstration and Comparison Groups Employed Each Quarter After Claim Date, By
Analysis Model Appendix L: Results of Customer Satisfaction Survey

List of Figures
Figure 1.1 Wisconsin Demonstration Project’s Innovations ................................................ 1-4 Figure 1.2 Overview of the Evaluation Study Sample ......................................................... 1-7 Figure 1.3 Final Evaluation Sample by Site.......................................................................... 1-7 Figure 2.1 Proportion of Profiled Claimants Referred to WPRS In Wisconsin Demonstration and Comparison Sites (SFY2003)............................................... 2-3 Figure 2.2 Timeline for Wisconsin Project Staffing Changes............................................. 2-20 Figure 3.1 Total Demonstration Participants by Subgroups ................................................. 3-2 Figure 3.2 Characteristics of Demonstration Group: Claimants Who Used Services vs. Those Who Did Not......................................................................... 3-3 Figure 3.3 Characteristics of Demonstration Participants: Group A vs. Group B ................ 3-5 Figure 3.4 Subgroups of Demonstration Participants by Site ............................................... 3-6 Figure 3.5 Characteristics of Demonstration Group, by Site ................................................ 3-7 Figure 3.6 Characteristics of Demonstration vs. Comparison Groups, By Analysis Model ............................................................................................ 3-10 Figure 3.7 Average Number of Services Used: Demonstration vs. Comparison Groups By Analysis Model ............................................................................................ 3-12 Figure 3.8 Use of Selected Services by Demonstration vs. Comparison Groups, By Analysis Model .......................................................................................... 3-13 Figure 3.9 Impact of the Wisconsin Demonstration Project on Participant Employment
Outcomes: Models Matching on the BPA-Calculated Propensity Score........... 3-16 Figure 3.10 Phi Correlations between Job Services and Entering Employment................... 3-21 Figure 3.11 Pearson’s r Correlations between Job Services and Benefit Duration............... 3-23 Figure 3.12 Pearson’s r Correlations between Job Services and Quarterly Earnings ........... 3-24 Figure 4.1 Customer Satisfaction Survey Questions............................................................. 4-2 Figure 4.2 Results of Wisconsin DWS’ Customer Satisfaction Survey, by Site: Proportion of Respondents Rating Project 1, 2, or 3 ........................................... 4-3

B e r k e l e y P o l i c y A s s o c i a t e s 12/1//06
i
Evaluation of the Strengthening the Connections Between Unemployment Insurance
and One-Stop Delivery Systems Demonstration Project in Wisconsin
Executive Summary During the last decade, strides in technology have allowed states such as Wisconsin to more efficiently deliver Unemployment Insurance (UI) services. Almost all UI services are now delivered remotely, with unemployed individuals making initial claims either by telephone to a centralized benefit center or via the Internet. As a result of such strategies, however, the physical presence and interactions of UI staff with One-Stop Center staff in facilitating the reemployment of UI claimants has diminished, as has the provision of job search assistance to unemployed workers. Over the same period, other outcomes of the UI system have deteriorated. Since 2002, the average duration of UI benefits has increased sharply, to over 16 weeks in 2004. Similarly, the proportion of UI recipients who exhaust their benefits (the exhaustion rate) rose to nearly 45% nationally in 2003.1 Another recent change is that fewer states are systematically reviewing the work search activities of UI claimants than in the past. Recent research has shown that both adherence to UI work search requirements and reemployment services tend to shorten claimants’ duration of insured unemployment by speeding their return to work. Thus, changes in policy that reduce work search review and contact with reemployment services have resulted in longer benefit durations than in the past.2 In sum, balancing the effects of using UI call centers and online claims processing with the availability of One-Stop Center services is a looming challenge for the workforce development system.3 In June 2003, the Department of Labor, Employment and Training Administration funded the Wisconsin Department of Workforce Development (DWD) to implement the Strengthening Connections Between UI and One-Stop Delivery System demonstration project. At the same time, the Department engaged Berkeley Policy Associates (BPA) to evaluate the demonstration and to provide technical assistance in its design.
The Demonstration The demonstration sought to find innovative and effective approaches to facilitate linkages between the Wisconsin Division of Unemployment Insurance (UI) and the state Division of Workforce Solutions’ (DWS) Job Service, which operates the state’s One-Stop Career Centers (called Job Centers). The project’s objectives were to: 1) better connect UI claimants with Job
1 U.S. Department of Labor, Employment and Training Administration. Unemployment Insurance Chart Book, March 29, 2004 http://www.ows.doleta.gov/unemploy/content/chartbook/chtbook.asp#chta3 . 2 O’Leary, Christopher J. 2006. “State UI Job Search Rules and Reemployment Services,” Monthly Labor Review, June 2006. 3 Barnow, B., and C. King. May 2005. The Workforce Investment Act in Eight States: Final Report, ETA Occasional Paper 2005-01.

Evaluation of the Strengthening the Connections Between UI and One-Stop Delivery Systems Demonstration Project in Wisconsin
B e r k e l e y P o l i c y A s s o c i a t e s 12/1/06
ii
Center reemployment services; and 2) better connect its UI and Job Service divisions via data-sharing and joint provision of services. Wisconsin designed an expanded model of Worker Profiling Reemployment Services (WPRS)4 called the Wisconsin Reemployment Connections Demonstration Project. The project’s features included:
• Integration of UI and One-Stop computer systems such that demonstration UI claimants were automatically registered for work;
• One-Stop Job Service staff made personal contact via telephone with UI claimants selected for the demonstration’s WPRS services;5
• Development of strong working relationships between UI adjudicators and One-Stop Center staff. While in the rest of the state, UI staff and One-Stop Center staff have limited interactions, the demonstration's UI staff assisted in the reemployment orientation sessions (RES) conducted at the Job Centers, and returned at the end of participants’ service periods to conduct a Review of Employment Plan (REP, a type of UI eligibility review) jointly with Job Service staff;
• Provision of expanded reemployment workshops (e.g., job search assistance and referrals to skill training, as appropriate) and new curricula, such as “Introduction to Computers;”
• Provision of reemployment services to all claimants referred from the WPRS pool; and
• Provision of at least one staff-assisted job referral to all demonstration participants who participated in the reemployment workshops. Such referrals did not happen elsewhere in the state.
The demonstration began providing services in Oshkosh in July 2004 and in two Milwaukee Job Centers in September 2004. At the required orientation to Job Center services, demonstration staff assigned participants to one of two groups based on their preparedness for conducting a job search, the format and sophistication of their resumes, employment barriers, and confidence in their interviewing skills. Group A consisted of individuals who had more relevant and/or transferable work skills and job search skills; these claimants received minimal reemployment services. Group B was made up of those who were less prepared for looking for a job, and received more intensive services than Group A. Members of both groups were required to register for work, which was not required of Wisconsin UI claimants outside of the demonstration. In addition, all Group B members received a referral to an appropriate job opening.
4 WPRS was established via the Unemployment Insurance Amendments of 1993 (P.L. 103-152) which added Section 303(a)(10) and 303 (j) to the Social Security Act. The program 1) identifies claimants likely to exhaust their regular UI benefits and who will need job search assistance services to make a successful transition to new employment, and 2) refers these claimants to reemployment services. Wisconsin Department of Workforce Development, UI Reemployment Services: Introduction to UI Profiling and Reemployment Services, http://dwd.wisconsin.gov/dws/bjs/Reemployment.htm 5 The Wisconsin UI agency provided overall leadership of the DOL demonstration grant. Job Service staff are traditionally funded by the state’s Wagner-Peyser Act grant, but funds for this project were derived from the DOL demonstration grant.

Evaluation of the Strengthening the Connections Between UI and One-Stop Delivery Systems Demonstration Project in Wisconsin
B e r k e l e y P o l i c y A s s o c i a t e s 12/1/06
iii
Members of Group B, as well as many Group A members, were directed to attend concentrated job search workshops that lasted up to four weeks (from beginning to end of project participation). Those who failed to attend any of the sessions were subject to suspension of their UI benefits. Claimants also were asked to make at least five job contacts per week, although their benefits were not affected if they made at least two contacts per week. The workshop curricula included resume development, interviewing skills, career change, networking skills, labor market projections of “hot jobs,” budgeting, and stress management. The staff in Milwaukee added an “Introduction to the Computer” session to their curricula after they discovered that many participants had no experience using a computer. The last session of the workshop was a formal, individual plan review (the REP) with each participant who had not yet found a job. The review was a new service element, not offered in Wisconsin prior to the demonstration because of resource constraints.
The Evaluation The evaluation documented the linkages that developed between Wisconsin’s UI and Job Service agencies as a result of the demonstration, and assessed whether the demonstration services, and these linkages, had an impact on claimants’ employment outcomes. The evaluation design included both process and outcome components, with the outcome study using a quasi-experimental design. The process study documented the demonstration’s implementation, described the specific linkages created between the Job Service and UI agencies, and identified lessons learned during the project’s implementation that might be useful for other state workforce agencies. The quasi-experimental outcome study assessed the effectiveness of the demonstration’s service model in increasing UI claimants’ return to work post-claim quarterly earnings, and in reducing duration of benefits. This study component compared characteristics, service use, and employment outcomes of the demonstration participants with those of similar UI claimants in adjacent zip code areas. The comparison group received the same services they would in the absence of the demonstration, and were chosen from both individuals who received and did not receive WPRS to ensure that the sample included claimants who had a range of profiling scores. The evaluation team used a matching algorithm to link each sample member in the demonstration group to multiple sample members in the comparison group. This approach increased the statistical precision of the study’s estimates and took advantage of the fact that more comparison group members were available to the evaluation than were demonstration participants. Matches were made on a propensity score calculated using individual background characteristics, including employment history and profiling score.
Findings of Outcome Study The evaluation’s study sample included 6,373 members: 2,180 claimants in the demonstration group and 4,193 in the comparison group. The demonstration group included 1,175 claimants who participated in project services, plus another 1,005 who had either already found
Evaluation of the Strengthening the Connections Between UI and One-Stop Delivery Systems Demonstration Project in Wisconsin
B e r k e l e y P o l i c y A s s o c i a t e s 12/1/06
iv
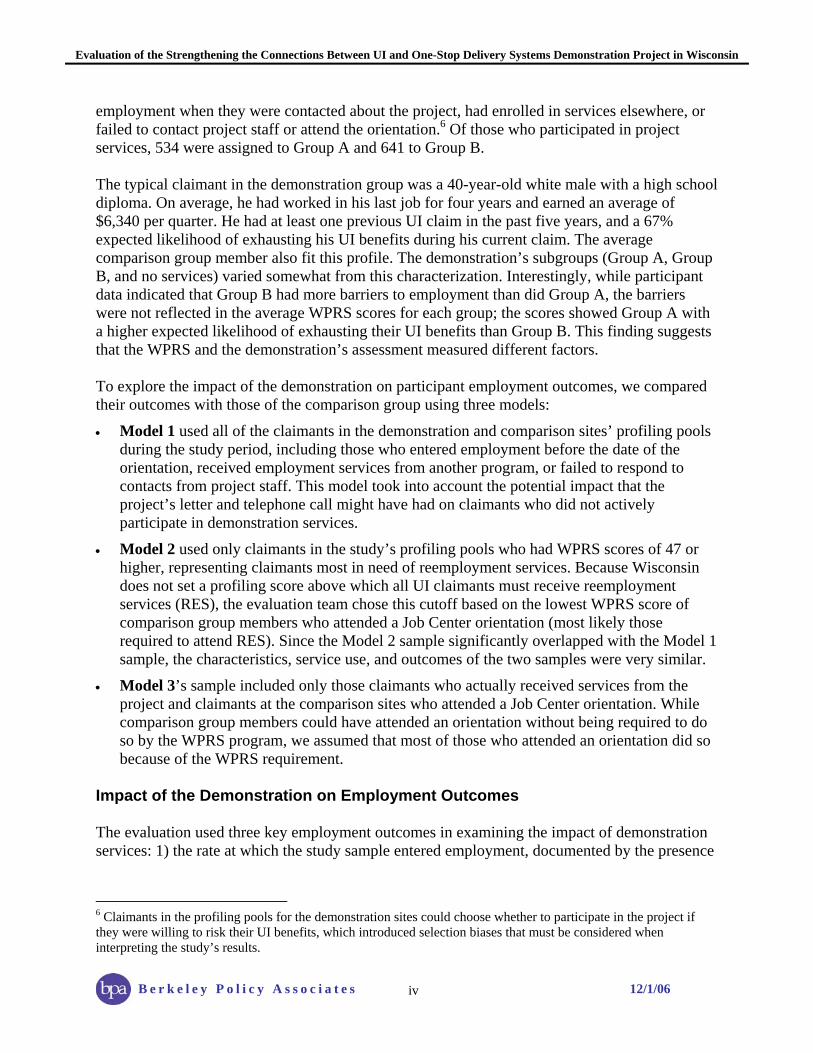
employment when they were contacted about the project, had enrolled in services elsewhere, or failed to contact project staff or attend the orientation.6 Of those who participated in project services, 534 were assigned to Group A and 641 to Group B. The typical claimant in the demonstration group was a 40-year-old white male with a high school diploma. On average, he had worked in his last job for four years and earned an average of $6,340 per quarter. He had at least one previous UI claim in the past five years, and a 67% expected likelihood of exhausting his UI benefits during his current claim. The average comparison group member also fit this profile. The demonstration’s subgroups (Group A, Group B, and no services) varied somewhat from this characterization. Interestingly, while participant data indicated that Group B had more barriers to employment than did Group A, the barriers were not reflected in the average WPRS scores for each group; the scores showed Group A with a higher expected likelihood of exhausting their UI benefits than Group B. This finding suggests that the WPRS and the demonstration’s assessment measured different factors. To explore the impact of the demonstration on participant employment outcomes, we compared their outcomes with those of the comparison group using three models:
• Model 1 used all of the claimants in the demonstration and comparison sites’ profiling pools during the study period, including those who entered employment before the date of the orientation, received employment services from another program, or failed to respond to contacts from project staff. This model took into account the potential impact that the project’s letter and telephone call might have had on claimants who did not actively participate in demonstration services.
• Model 2 used only claimants in the study’s profiling pools who had WPRS scores of 47 or higher, representing claimants most in need of reemployment services. Because Wisconsin does not set a profiling score above which all UI claimants must receive reemployment services (RES), the evaluation team chose this cutoff based on the lowest WPRS score of comparison group members who attended a Job Center orientation (most likely those required to attend RES). Since the Model 2 sample significantly overlapped with the Model 1 sample, the characteristics, service use, and outcomes of the two samples were very similar.
• Model 3’s sample included only those claimants who actually received services from the project and claimants at the comparison sites who attended a Job Center orientation. While comparison group members could have attended an orientation without being required to do so by the WPRS program, we assumed that most of those who attended an orientation did so because of the WPRS requirement.
Impact of the Demonstration on Employment Outcomes The evaluation used three key employment outcomes in examining the impact of demonstration services: 1) the rate at which the study sample entered employment, documented by the presence
6 Claimants in the profiling pools for the demonstration sites could choose whether to participate in the project if they were willing to risk their UI benefits, which introduced selection biases that must be considered when interpreting the study’s results.

Evaluation of the Strengthening the Connections Between UI and One-Stop Delivery Systems Demonstration Project in Wisconsin
B e r k e l e y P o l i c y A s s o c i a t e s 12/1/06
v
of earnings in the UI wage record database; 2) average quarterly earnings of those who did return to work; and 3) UI benefit duration and its corollary, amount of UI benefits drawn.
• Entering Employment: The Wisconsin Demonstration project did not have a significant impact on whether or not participants entered employment. About three-quarters of both demonstration and comparison group members in the study samples for all three analysis models went back to work during the study period.
• Average Quarterly Earnings: Demonstration participants had higher average quarterly earnings than did the comparison group across all three analysis models. The difference was statistically significant for Models 1 and 2. The demonstration increased claimant earnings by $211 per quarter for the demonstration group in the Model 1 sample and by $194 for Model 2 participants. In sum, the demonstration group earned roughly $135,000 more than the comparison group over the project’s 15-month period of operations.
• Duration of UI Benefits: The demonstration groups for Models 1 and 2 had significantly shorter durations of UI benefits than did the comparison groups, by almost a week for the Model 2 sample and by 0.6 weeks for the Model 1 sample. The Model 3 demonstration group showed a comparable reduction in benefit duration of 0.6 weeks, although this reduction was somewhat smaller in relative terms given the longer average duration of benefits among the Model 3 sample.
• Amount of UI Benefits Paid: The reduction in benefit duration directly translated into a similar significant reduction in the average total payout of UI benefits. Demonstration participants received $233 less than comparison group members for Model 2 and $147 less for Model 1. The Model 3 demonstration group also received $155 less in UI benefits than the comparison group, however this impact was not statistically significant. Overall, the three demonstration sites saved Wisconsin’s UI trust fund roughly $385,000 over the project’s 15-month period.
These modest effects compare favorably with the impacts documented by more ambitious employment training interventions, and are also consistent with other research on services provided to dislocated workers. Relationship Between Service Use and Employment Outcomes Use of Job Center services was limited among the evaluation’s study sample; only 38% of the sample participated in any of the 18 services that we tracked. Analyses focused on the eight services that were used by at least 2% of the total population: initial assessment; self-service/ information; job search services; workshops; job referral; one-on-one services; plan review; and follow-up services. All of these services were central to the demonstration’s service model. Examining relationships between specific services used and employment outcomes is complicated by the fact that the strength of a statistical relationship does not identify the direction of causality. For example, the study found significant negative associations between entering employment and participating in the initial assessment and plan review processes. Demonstration participants who started work before they were notified about the project were exempt from participating in the assessment. Similarly, those who started work before the date of their employment plan review (EPR) were exempted from attending the EPR meeting. Thus,

Evaluation of the Strengthening the Connections Between UI and One-Stop Delivery Systems Demonstration Project in Wisconsin
B e r k e l e y P o l i c y A s s o c i a t e s 12/1/06
vi
these associations essentially showed the negative impact on project participation of obtaining a job quickly, rather than vice-versa.
• Entering Employment: The evaluation found positive and statistically significant associations between entering employment and the one-time use of three services—job referral, one-on-one services, and follow-up services. The associations were stronger for claimants in the demonstration group than for those in the comparison group, which suggests that the Wisconsin Demonstration services were valuable in returning demonstration participants to work.
• Duration of UI Benefits: Among members of the Model 3 sample, all of whom used RES services, demonstration participants who used assessment and one-on-one services once experienced significantly shorter durations of UI benefits than did the comparison group.
• Average Quarterly Earnings: Model 3 demonstration claimants who used job referral and follow-up services once had significantly higher earnings than did the comparison group. In addition, Model 2 demonstration participants who used WIA supportive services (e.g., transportation assistance, information on child care services, energy assistance, food stamps, and health insurance)7 multiple times had quarterly earnings that were slightly but significantly higher than those of the comparison group.
Lessons from Implementation of the Wisconsin Demonstration Project • UI and One-Stop staff can provide services jointly without disrupting the UI call center
structure. In the Wisconsin Demonstration project, the state’s DWD developed a service model in which employment service and UI staff worked jointly, together providing both reemployment services and employment plan reviews. Furthermore, the demonstration operated without disrupting or creating other negative impacts on the UI call center structure. Both UI and Job Center staff, as well as participants, found the project’s design to be effective and to improve the quality of information shared between agencies and with claimants. • Project activities must be aligned with project goals to produce congruent impacts on
key participant outcomes. As the demonstration unfolded, the Job Services staff seemed to be referring to training claimants who may have already possessed marketable skills instead of finding good jobs immediately. Because the demonstration’s goal was to assist claimants in entering employment rapidly and to reduce their draw on the UI trust fund, the project director asked staff to adopt a “work first” attitude in serving participants. In designing any type of service projects, staff should be aware of the measurable outcomes associated with each goal, and ensure that related activities have a harmonious effect on the project’s key outcome measures.
7 Please note that supportive services were provided primarily to claimants who enrolled in WIA services.

Evaluation of the Strengthening the Connections Between UI and One-Stop Delivery Systems Demonstration Project in Wisconsin
B e r k e l e y P o l i c y A s s o c i a t e s 12/1/06
vii
• The project’s design team should include both the staff that will be providing services and their supervisors.
To ensure that the project’s design was realistic and reflected current practices, the demonstration staff were involved in designing the project’s service model; however, their One-Stop Job Service managers were not involved in the demonstration until the project was almost ready for implementation. Consequently, the supervisors of demonstration staff were not as knowledgeable about the project as they could have been. Both state and local staff realized that enlisting the supervisors’ involvement early in the design process would have prevented some of the challenges that later emerged during the demonstration’s implementation. • Build in mechanisms to reinforce consistency in program activities. State and local staff collaborated in creating a handbook that outlined the content of the orientation and workshops to ensure consistency in services and operations across the three sites. Staff developed their own workshop materials, however, and even with the handbook, staff thought the project’s services and record-keeping processes should have been better documented to improve the consistency of their operations. A related issue was that demonstration staff no longer met as a group once the project was in operation. Regular project conference calls would have allowed staff to discuss implementation issues as they occurred, to agree upon common data entry protocols, and to share solutions. • UI Benefit call centers are an efficient means of administering claims, but both Job
Center staff and customers need more information about UI and better access to answers to their questions than call centers may provide.
Demonstration staff noted that many customers had questions about their UI benefits that Job Service staff were not prepared to answer. One of the aspects of the project that staff valued the most was the formal connection created between Job Service and UI staff, so that Job Center staff knew whom to call about UI questions and were able to provide better customer service. Participants also appreciated the demonstration’s access to the UI adjudicators, and the information they provided. One-Stop Job Service managers should consider educating Job Center staff on basic UI benefit questions, and/or exploring other approaches to improve customer access to relevant UI information. • The quality of staff can be a key factor in the success of a demanding project. The commitment, flexibility, and enthusiasm of the project staff, including the UI adjudicators, contributed to the success of the demonstration in several ways. RES staff not connected with the project commented that the project was “too much work” compared to the current RES process, nonetheless, staff from two demonstration sites carried over vacation time from fiscal year 2005 because no one was available to take over if they took a vacation. Project staff were extremely flexible in accommodating the needs of participants, scheduling make-up orientations, and providing individual orientations for claimants who spoke only Spanish. They also were excited and passionate about their jobs, and that enthusiasm was transmitted to participants.

Evaluation of the Strengthening the Connections Between UI and One-Stop Delivery Systems Demonstration Project in Wisconsin
B e r k e l e y P o l i c y A s s o c i a t e s 12/1/06
viii
• Hire staff into permanent positions if at all possible. The demonstration was implemented during a period when Wisconsin’s administrative policy prohibited the creation of new staff positions. Both state and local staff faced continuing challenges in implementing the project within this policy environment. They strongly recommended that other projects ensure that staff hold permanent positions and have sufficient seniority so as not to be “bumped” from their assignments if layoffs occur in the agency. • Offer WPRS more frequently. Staff at the comparison sites conducted Job Center orientations for UI claimants on a weekly basis, and thus claimants could be required to attend one of these meetings during their third or fourth week of UI benefits. The demonstration staff provided only one orientation per month, and participants might end up attending the orientation six weeks or seven weeks after first filing for benefits. In responding to the project’s customer satisfaction survey, many participants said that they wished they could have started services earlier in their claim process. Offering services more frequently would provide job seekers with improved access to assistance, and this should be taken into consideration in planning the provision of RES. • Telephoning claimants to inform them about RES offered several benefits. UI benefit claimants selected for RES receive a form letter to let them know that they are required to attend a Job Center orientation on a certain date and time. In contrast, the project’s service model included both the letter and a telephone call to claimants initiated by the One-Stop Job Service staff. The call reinforced the importance of attending the orientation, and demonstration staff found that some claimants were more open to participating in services because the phone call put a friendlier face on the requirement to attend. The phone call allowed claimants to ask questions about the orientation, and allowed staff to find out whether claimants might need an interpreter or had other issues that could affect their attendance. Finally, one of the UI adjudicators noted that the phone call provided a useful second source of information if a claimant reported that he did not receive the letter informing him about the orientation. • The WPRS score may not accurately project a claimant’s need for job search
assistance. The average WPRS score for the demonstration’s Group A claimants was slightly higher than that for members of Group B, who needed more basic help in improving their resumes and job search skills. The WPRS score is formulated as an expected likelihood of claimants exhausting their UI benefits, while the project’s assessment process (for assigning participants to Group A or Group B) focused on participants’ need for assistance in improving their job search skills. Because the WPRS score is used to prioritize the referral of claimants to RES, UI staff should investigate whether changes to the WPRS algorithm could improve its usefulness in identifying claimants who need job search assistance. • Providing more intensive reemployment services is likely to mean serving fewer
claimants. The demonstration’s service model involved more intensive RES services than are currently being offered in Wisconsin. The state’s Job Services Director anticipated reducing the number of RES participants if the model were to be adopted statewide because of budget constraints.

Evaluation of the Strengthening the Connections Between UI and One-Stop Delivery Systems Demonstration Project in Wisconsin
B e r k e l e y P o l i c y A s s o c i a t e s 12/1/06
ix
Balancing the quality of services provided with the quantity of claimants served becomes an important consideration when making such programmatic changes. • The Review of Employment Plan was very useful to project staff, but less appreciated
by participants. UI and Job Service staff noted that the joint plan review offered another opportunity to meet one-on-one with participants and recommend workshops or other services, provide job referrals, and problem-solve. From the UI adjudicator’s point of view, the review was the project’s primary chance to investigate participants’ job search activities. Project staff also said that claimants liked the plan review because it gave them closure; however, data from the project’s customer satisfaction survey failed to confirm this observation. • Communicate clearly to all levels of the partner agencies the roles of each partner and
of key staff. A Job Service supervisor located in northwestern Wisconsin was responsible for overseeing the demonstration. However, her role was not clearly defined and she was not formally introduced to local managers as having key responsibilities related to the project. Without the formal relationship, she often talked directly with the demonstration staff instead of going through their supervisors, although she was not empowered to be directive to the staff. Several Job Services managers and supervisors were unhappy because her relationship with the project staff was outside the chain of command. All partner staff need to know not only about the project’s goals and activities, but the key players as well. • The rewards for increasing collaboration between the Job Service and UI agencies were
far richer than originally anticipated. The project succeeded in increasing collaboration between UI and Job Service staff, and was effective in improving participants’ quarterly earnings and reducing UI benefits duration. In addition, the demonstration also reinforced the fact that both agencies share a common goal of getting people back to work. At the state level, the project’s Oversight Committee provided a structure for planning additional interagency collaboration tasks that went beyond the grant’s original scope of work. Most importantly, interview respondents indicated that they valued the trust that developed between staff of each agency as a result of working together on the project, and noted that the demonstration improved the quality of their work environment. • Implementation of a project within a collaborative structure, such as is used by the
One-Stop Career Centers, will always be impacted by partner agencies, and offers the opportunity to positively impact the partners.
Each of the demonstration sites was affected by decisions made by other Job Center partners, such as the delayed start-up of the Job Center Northwest site because of negotiations with the Job Center operator over rent, the loss of partner staff who provided critical workshops in Oshkosh, and a comparison site moving its orientation to the HIRE Center’s conference room. While avoiding the resulting challenges may have been impossible, project staff at both the state and local levels might have been able to anticipate them with better—and continuous—communication with partner agencies. At the same time, the project’s presence in each Job Center presented an opportunity for positively impacting the centers and their partner agencies.

Evaluation of the Strengthening the Connections Between UI and One-Stop Delivery Systems Demonstration Project in Wisconsin
B e r k e l e y P o l i c y A s s o c i a t e s 12/1/06
x
For example, the presence of the project at Job Center Northwest, which had generally been regarded in the community as being only a “welfare center,” enhanced the center’s image. In each site, project staff provided workshops that otherwise would not have been available to the Centers’ universal customers. • Integrating data from multiple and complex management information systems will take
longer—and be more expensive—than anticipated. Wisconsin was committed to creating a physical link between its UI and Job Service agencies to serve as the basis for further integration of the agencies’ databases in the future; thus creating a better interface between the UI and Automated System Support For Employment and Training (ASSET) data systems became a major task of the project. The link between the two systems provides a basis for further integration in the future. Unfortunately, the costs associated with the data-sharing project were high, and subsequent improvements to the interface under the grant were not possible. As a result, local staff had to do more data entry than they anticipated, and had difficulty interacting with certain components of the dual system. • Staff need timely performance information. Work started on the MIS integration process in November 2004 and first provided data four months later. Because of this timeline, summary information about project participants was not available until the seventh month of a 16-month effort. Staff at both the state and local levels needed more immediate feedback on the project’s progress. Earlier availability of this information also would have encouraged staff to complete their data entry into ASSET in an accurate and timely way.
Conclusion The Wisconsin Demonstration project succeeded in increasing collaboration between the state’s UI and Job Service agencies through both its data sharing component and its implementation of expanded RES for UI claimants. In doing so, staff overcame a variety of barriers including administrative policies, the complexity of MIS systems, and the communications challenges associated with creating a new project. Overall, the Wisconsin Demonstration project appears to have had a modest, but significant, influence on the employment outcomes of participants. In particular, demonstration participants drew UI benefits for a shorter period of time and had higher average quarterly earnings than did comparison group members. Use of specific services−such as assessment, job referral, one-on-one services, and follow-up−improved claimants’ likelihood of entering employment, decreasing receipt of UI benefits, and increasing quarterly earnings. Staff from both the Job Service and UI agencies are continuing to collaborate in exploring strategies for improving the effectiveness of their RES statewide. The demonstration’s most important impacts may be realized in the future as UI and Job Service staff continue to work together toward their common goal of assisting individuals to return to work.

Evaluation of the Strengthening the Connections Between UI and One-Stop Delivery Systems Demonstration Project in Wisconsin
B e r k e l e y P o l i c y A s s o c i a t e s 12/1/06
1-1
1. Introduction During the last decade, strides in technology have allowed states such as Wisconsin to more efficiently deliver Unemployment Insurance (UI) services. Almost all UI services are now delivered remotely, with unemployed individuals making initial claims either by telephone to a centralized benefit center or via the Internet. As a result of such strategies, however, in many states, the physical presence and interactions of UI staff with One-Stop Center staff in facilitating the reemployment of UI claimants has diminished. At the same time that remote filing for UI benefits has become popular, other outcomes of the UI system have deteriorated. Since 2002, the average duration of UI benefits nationally has increased sharply, to over 16 weeks in 2004. Similarly, the proportion of UI recipients who exhaust their benefits (the exhaustion rate) rose to nearly 45% in 2003.1 The increasing popularity of remote claims filing and the attendant reduction in job search assistance to unemployed workers may have contributed to lengthening the average spell of unemployment. This is largely due to the reduced contact between UI claimants and the UI staff who can guide them to the appropriate services. Furthermore, fewer states are systematically reviewing the work search activities of UI claimants than in the past. Recent research has shown that both UI work search requirements and UI reemployment services tend to shorten claimants’ duration of insured unemployment by speeding their return to work. Thus, changes in policy that reduce work search review and contact with reemployment services have resulted in longer benefit durations than in the past.2 Given that remote filing has many advantages and is likely to remain a favored method of administering UI claims, Barnow and King3 recently concluded that balancing the effects of using UI call centers and online claims processing with the effectiveness of One-Stop Center services is a looming challenge for the workforce development system. The primary purpose of this demonstration project and its evaluation was to find innovative and effective approaches to facilitate linkages between these two workforce investment service components.
1 U.S. Department of Labor, Employment and Training Administration. Unemployment Insurance Chart Book, March 29, 2004 http://www.ows.doleta.gov/unemploy/content/chartbook/chtbook.asp#chta3 . Earlier research by Katz and Krueger (1999) and Needels, et al. (2001), UI recipients in the late 1990s were receiving benefits for longer periods of time, were more likely to exhaust their benefits, were less likely to be reemployed at a high wage, and were less likely to be actively looking for work than had been the case in the 1980s and early 1990s. See Katz, L.F. and A.B. Krueger, “The High Pressure U.S. Labor Market of the 1990s.” Brookings Papers on Economic Activity. Washington, DC: 1999, vol. 1, pp.1-87. Also see Needels, K., W. Corson, and W. Nicholson. 2001, Is the UI Claimant Population Changing? Implications for Reemployment Policies. Princeton, NJ: Mathematica Policy Research. 2 O’Leary, Christopher J. 2006. “State UI Job Search Rules and Reemployment Services,” Monthly Labor Review, June 2006. 3 Barnow, B., and C. King. May 2005. The Workforce Investment Act in Eight States: Final Report, ETA Occasional Paper 2005-01.
Evaluation of the Strengthening the Connections Between UI and One-Stop Delivery Systems Demonstration Project in Wisconsin
B e r k e l e y P o l i c y A s s o c i a t e s 12/1/06
1-2
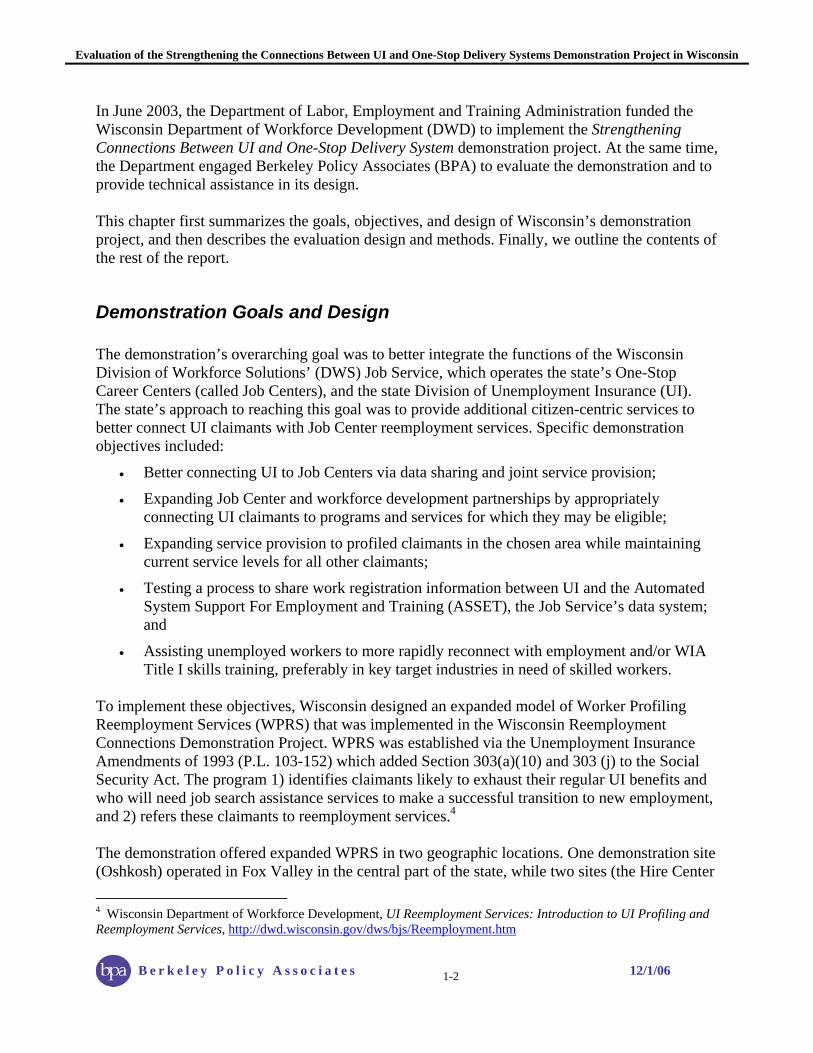
In June 2003, the Department of Labor, Employment and Training Administration funded the Wisconsin Department of Workforce Development (DWD) to implement the Strengthening Connections Between UI and One-Stop Delivery System demonstration project. At the same time, the Department engaged Berkeley Policy Associates (BPA) to evaluate the demonstration and to provide technical assistance in its design. This chapter first summarizes the goals, objectives, and design of Wisconsin’s demonstration project, and then describes the evaluation design and methods. Finally, we outline the contents of the rest of the report.
Demonstration Goals and Design The demonstration’s overarching goal was to better integrate the functions of the Wisconsin Division of Workforce Solutions’ (DWS) Job Service, which operates the state’s One-Stop Career Centers (called Job Centers), and the state Division of Unemployment Insurance (UI). The state’s approach to reaching this goal was to provide additional citizen-centric services to better connect UI claimants with Job Center reemployment services. Specific demonstration objectives included:
• Better connecting UI to Job Centers via data sharing and joint service provision;
• Expanding Job Center and workforce development partnerships by appropriately connecting UI claimants to programs and services for which they may be eligible;
• Expanding service provision to profiled claimants in the chosen area while maintaining current service levels for all other claimants;
• Testing a process to share work registration information between UI and the Automated System Support For Employment and Training (ASSET), the Job Service’s data system; and
• Assisting unemployed workers to more rapidly reconnect with employment and/or WIA Title I skills training, preferably in key target industries in need of skilled workers.
To implement these objectives, Wisconsin designed an expanded model of Worker Profiling Reemployment Services (WPRS) that was implemented in the Wisconsin Reemployment Connections Demonstration Project. WPRS was established via the Unemployment Insurance Amendments of 1993 (P.L. 103-152) which added Section 303(a)(10) and 303 (j) to the Social Security Act. The program 1) identifies claimants likely to exhaust their regular UI benefits and who will need job search assistance services to make a successful transition to new employment, and 2) refers these claimants to reemployment services.4 The demonstration offered expanded WPRS in two geographic locations. One demonstration site (Oshkosh) operated in Fox Valley in the central part of the state, while two sites (the Hire Center 4 Wisconsin Department of Workforce Development, UI Reemployment Services: Introduction to UI Profiling and Reemployment Services, http://dwd.wisconsin.gov/dws/bjs/Reemployment.htm

Evaluation of the Strengthening the Connections Between UI and One-Stop Delivery Systems Demonstration Project in Wisconsin
B e r k e l e y P o l i c y A s s o c i a t e s 12/1/06
1-3
and Job Center Northwest) were located in Milwaukee, the state’s largest city. The WPRS service areas for these sites were adjusted to result in 50 to 60 claimants entering the profiling pool each month during the demonstration period. The demonstration sites provided reemployment services to all of the claimants in their profiling pools during the demonstration period, and demonstration participants were the only claimants receiving WPRS services at these sites. The demonstration sites provided reemployment services (RES) with two levels of intensity, which varied depending upon the barriers to employment that individual claimants faced. Demonstration staff sorted participants into groups based on their preparedness for conducting a job search, knowledge of the local labor market, and knowledge of job search skills and strategies. Group A consisted of individuals who had more relevant and/or transferable work skills and/or job search skills; these claimants received “light touch” reemployment services. Group B was made up of those who were less prepared for looking for a job, and demonstration staff provided more intensive services to this group than to Group A. Unlike other UI claimants in Wisconsin who are not required to register for work, members of both Group A and Group B were required to register for work. Wisconsin’s DWD adopted two methods of facilitating linkages between its UI and Job Service divisions. First, the demonstration supported improved data sharing between the two agencies’ computer systems, including creating a mechanism that automatically registered claimants for work when they filed their initial UI claims. Second, the demonstration’s service model brought UI staff into the One-Stop Center with Job Service staff to interact with RES customers. UI staff participated in reemployment service orientations at the Job Centers, and sat in on the demonstration participants’ Review of Employment Plan (REP) which took place after RES ended. Demonstration services started in Oshkosh in July 2004, while the Milwaukee began operations in September 2004. The evaluation’s study period ended on December 31, 2005; however, the sites continued providing demonstration services through the end of March 2006. Figure 1.1 summarizes the innovations incorporated into the design of the Wisconsin Demonstration Project. Chapter 2 provides more detail about the demonstration’s services, staffing, and the implementation of these innovations.
Evaluation Goals and Design Evaluation Goals The goal of the evaluation was to document the linkages that developed between Wisconsin’s UI and Job Service agencies as a result of the demonstration, and to assess whether the demonstration services, and these linkages, had an impact on claimant employment outcomes. Research questions included:

Evaluation of the Strengthening the Connections Between UI and One-Stop Delivery Systems Demonstration Project in Wisconsin
B e r k e l e y P o l i c y A s s o c i a t e s 12/1/06
1-4
Figure 1.1 Wisconsin Demonstration Project’s Innovations
• The demonstration developed a model of employment service and UI staff providing both reemployment services and employment plan reviews jointly, without creating negative impacts on the UI call centers. While the rest of the state saw limited interaction between staff of the UI benefit call centers and One-Stop Centers, call center staff who worked with the demonstration participated in One-Stop Center orientation sessions and employment plan reviews conducted at Job Centers.
• Provision of Reemployment Services (RES) was expanded to all claimants in the local profiling pool.
• RES staff made personal contact via phone with claimants to inform them about the project.
• The demonstration achieved integration of UI and One-Stop computer systems such that demonstration participants were automatically registered for work.
• The scope of the RES curriculum was expanded. In addition to workshops on resume preparation and interviewing skills, components included "Introduction to Computers" and networking as a job search strategy.
• In contrast to claimants enrolled in RES elsewhere in the state, all Group B participants received at least one job referral.
• Claimants were encouraged to make at least five job contacts per week, instead of the two currently required by the Wisconsin UI Division.
• What are the barriers to increased collaboration between UI and Job Service agency staff, and how does the demonstration address these?
• What relationships, interactions, or other linkages between UI and Job Service agency staff does the demonstration promote at both the state and local levels?
• What changes occurred in each One Stop Center’s operations as a result of hosting the demonstration? How do these changes affect the One-Stops in which the project operates?
• What adjustments were necessary during the course of the demonstration?
• Does providing varying types of reemployment services to UI claimants not usually served by WPRS speed their return to work and reduce the state’s outlay on UI benefits?
• What are the operational and policy lessons from this demonstration? Evaluation Design The evaluation included both process and outcome components, with the outcome study using a quasi-experimental design. This section first discusses the design of the evaluation’s process study, and then describes the outcome study methods.

Evaluation of the Strengthening the Connections Between UI and One-Stop Delivery Systems Demonstration Project in Wisconsin
B e r k e l e y P o l i c y A s s o c i a t e s 12/1/06
1-5
Process Evaluation The process study documented the implementation of the demonstration’s enhanced UI/One-Stop Center linkages, beginning with the planning and design phase of the project. This study focused on implementation of specific linkages between Wisconsin’s Job Service and the state UI Division, and identified lessons learned during the project’s implementation that may be useful for other state workforce agencies 1) seeking to strengthen connections between their UI agencies and One-Stop Centers, or 2) interested in improving their reemployment services to UI claimants. Data collection efforts for the process study included:
• Visits to the state Department of Workforce Development (DWD) to observe (and participate in) demonstration planning meetings and to interview UI and Job Service staff at the state level;
• Visits to the demonstration and comparison sites in Milwaukee and Fox Valley to interview demonstration staff, their counterparts in the comparison sites, Job Center managers, key One-Stop Center partners, and UI claimants who participated in demonstration services; and
• Review of relevant state and local agency documents, such as policy manuals for the demonstration, policy manuals for reemployment service staff in the comparison sites, curricula for demonstration workshops, and sample service plans for both demonstration and comparison group participants. These materials provided detailed information about the operations of both demonstration and comparison site reemployment services.
In addition to visits made to Madison during the demonstration’s planning phase, the evaluation team conducted two visits to each of the demonstration sites starting in October 2004. We also visited each of the comparison sites once, during the initial round of site visits. The visits were supplemented with intermittent telephone interviews with demonstration staff at both the state and local levels. The site visits included tours of facilities and an overview of services offered/provided, as well as observation of orientations and other demonstration services. Site visitors also conducted interviews and focus groups with participants to assess customer satisfaction with services received, and to elicit their views on the efficiency and effectiveness of project services. This information was supplemented by a customer satisfaction survey of demonstration participants, implemented by DWS. Outcome Evaluation The outcome study assessed the effectiveness of the demonstration’s service model in increasing claimants’ return to work and in reducing the duration of their UI benefits. While this evaluation component did not specifically document the linkages between UI and Job Centers forged by the demonstration, it did document the impact of those linkages on claimant outcomes, as they were embodied in demonstration services.

Evaluation of the Strengthening the Connections Between UI and One-Stop Delivery Systems Demonstration Project in Wisconsin
B e r k e l e y P o l i c y A s s o c i a t e s 12/1/06
1-6
The quasi-experimental outcome study compared characteristics, service use, and employment outcomes of demonstration participants with those of similar UI claimants in adjacent zip code areas. Claimants were directed to either a demonstration or comparison site depending upon the zip code of their residence. Those who lived in the zip code areas closest to a demonstration site were part of the demonstration group, while UI claimants who lived closer to a comparison site were comparison group members. (See Appendix A for the specific zip codes associated with each demonstration and comparison site, as well as basic demographic information on the six areas.) The number and location of comparison sites paralleled the demonstration sites. One Job Center in Fox Valley (Menasha) and two Job Centers in Milwaukee (Teutonia and South) served as comparison sites. (Chapter 2 describes selection of the study sites.) The comparison sites provided traditional reemployment services to as many UI claimants as available resources allowed. Comparison group members received the same services they would have in the absence of the demonstration, and were chosen from both individuals who did and did not receive WPRS. This design ensured that both demonstration and comparison groups included claimants with a range of profiling scores, allowing the study to compare the employment outcomes of demonstration participants and comparison group members who had a similar likelihood of exhausting their UI benefits. Figure 1.2 illustrates the structure of the demonstration and comparison groups. In both the demonstration and comparison sites, all claimants who were in the profiling pool were included in the study sample. At each comparison site, the evaluation observed approximately 150 UI claimants per month from each site’s profiling pool. The comparison group included both claimants who received RES and those who did not. As mentioned above, the profiling pools for the project sites were restricted to 50 claimants per month to ensure that staff would be able to provide the demonstration’s package of intensive RES. The comparison sites were not restricted, thus the comparison group was substantially larger than the demonstration group. This approach increases the statistical precision of the study’s findings. Figure 1.3 breaks out the final sample of 6,373 claimants by site. The evaluation used a matching algorithm to link each demonstration group member to multiple comparison group members for the impact analysis. This approach increases the statistical precision of the study’s estimates, and takes advantage of the fact that the profiling pools for the comparison sites were much larger than the pools for the demonstration sites. The analysis created a propensity score based on background characteristics that have historically been associated with successful employment outcomes (including employment history and profiling score; see Appendix B).5 Comparison group members were then matched to demonstration group members using the propensity score, with each comparison group member matched to only one demonstration participant. The goal was to match each member of the demonstration group with 5 Variables used in calculating the propensity score included age, ethnicity, gender, tenure in last job, education level, WPRS score, demonstration site, month of study entry, number of quarters of preprogram employment (up to six), total earnings in preprogram employment period (up to six quarters).

Evaluation of the Strengthening the Connections Between UI and One-Stop Delivery Systems Demonstration Project in Wisconsin
B e r k e l e y P o l i c y A s s o c i a t e s 12/1/06
1-7
Figure 1.2 Overview of the Evaluation Study Sample
Probability of Benefit Exhaustion
Demonstration Sites Oshkosh Job Center
Hire Center Job Center Northwest
Comparison Sites Menasha Job Center
Job Center South Teutonia Job Center
Traditional
Reemployment Services
(% in this group determined by resources)
Group B
Intensive Reemployment Services
(% in this group determined by employment barriers)
Group A “Light Touch”
Reemployment Services
No Required Services
(% in this group determined by relative lack of employment barriers)
100%
0%
Figure 1.3 Final Evaluation Sample by Site*
Sites Demonstration Comparison Oshkosh - Menasha 748 1,660
HIRE Center - Job Center South 733 1,312
Job Center Northwest - Teutonia Job Center 699 1,221
TOTAL (n = 6,373) 2,180 4,193 * Numbers in the table represent the evaluation’s final sample. The original sample size was 8,390 (see Appendix B for disposition of the sample).
at least two comparison group members who had the closest propensity scores, and 98% of the demonstration group matched with two comparison group members. The remaining 2% matched with only one comparison group member. (See Appendix B for more information about the disposition of the sample.)

Evaluation of the Strengthening the Connections Between UI and One-Stop Delivery Systems Demonstration Project in Wisconsin
B e r k e l e y P o l i c y A s s o c i a t e s 12/1/06
1-8
Data Collection Each month, Wisconsin sent the evaluation team an ASCII file containing all of the evaluation data items for the entire study group to date. Each month’s file included information for the 50 new participants from each demonstration site, for all UI claimants in the profiling pool of each of the comparison sites, and for members of previous months’ demonstration and comparison group cohorts. Data items included information about personal characteristics, use of services, and employment outcomes for the demonstration and comparison groups from three major sources: 1) UI agency claimant data; 2) UI wage record data; and 3) DWS’ ASSET data system on Job Center customers. Appendix D lists the data items collected for the evaluation, the definition of each data item, and the source of the information. All demographic data for demonstration group members came from ASSET. As Appendix D illustrates, the primary source of demographic data for comparison group members depended upon whether the claimant had ever used Job Center services. ASSET supplied demographic data for comparison group members who were referred to RES or who accessed Job Center services independently. Since the number of claimants in these two categories was relatively small, the UI database supplied demographic information for most comparison members. Finally, UI wage records were the source of post-claim employment data for both the demonstration and comparison groups. The evaluation team received the first batch of data in March 2005 (see Chapter 2 for a discussion of the implementation of the data system). Although no new participants were enrolled in the study after December 2005, Wisconsin staff continued to send data on members of the study sample through June 2006. This allowed us to observe any employment outcomes that the December 2005 cohort may have achieved in the quarter after they participated in the demonstration, and allowed time for employers to submit their wage data to the state.6 Data Analysis The evaluation team used the participant data provided by the demonstration project to conduct two types of analyses—descriptive and impact. The descriptive analysis primarily used bivariate methods to address the following questions:
• What types of individuals did the demonstration serve? How similar are the demonstration and comparison groups? We used information on personal characteristics such as age, education level, gender, ethnicity, disability, tenure in last job, previous UI claims, site, and profiling score to describe the demonstration participants and to compare participants with comparison group members.
6 In Wisconsin, employers have up to 90 days after the end of a calendar quarter to submit their wage records to the UI agency.

Evaluation of the Strengthening the Connections Between UI and One-Stop Delivery Systems Demonstration Project in Wisconsin
B e r k e l e y P o l i c y A s s o c i a t e s 12/1/06
1-9
• Which demonstration and One-Stop services did participants access during their current UI spell? Do participants use more or different services than claimants served through the usual WPRS process? We used data on the study sample’s use of various types of services (i.e., workshops, job referrals, resource room, one-on-one consultations) during the evaluation’s study period to compare services used by participants vs. those used by comparison group members.
To assess the impact of the demonstration on participant employment outcomes, we compared their outcomes with those of the comparison group using a combination of matching by propensity score and regression adjustment using the following variables: had a disability; limited English proficiency; single parent; and number of previous UI claims. The impact analysis addressed the following questions:
• Are demonstration participants more likely to enter employment than claimants served through the usual WPRS process?
• Do demonstration participants have shorter UI benefit durations than claimants served through the usual WPRS process?
• Does the demonstration project increase participants’ wages in their new jobs more than the usual WPRS process?
• Is use of specific WPRS and One-Stop Center services associated with positive employment outcomes?
The results of these analyses are presented in Chapter 3.
Contents of This Report This remainder of this report summarizes the evaluation’s findings. Chapter 2 describes the implementation of the Wisconsin Demonstration Project at both the state and local levels. Chapter 3 presents the results of the outcome study, describing demonstration participants, their use of Job Center services, and their employment outcomes in contrast to those of the comparison group. Chapter 4 describes the results of the project’s customer satisfaction survey. Finally, Chapter 5 discusses lessons learned from the demonstration that may be of value to other states interested in improving their reemployment services. This report includes 12 appendices, including:
• Appendix A: Zip Codes and Demographics for with Demonstration and Comparison Sites
• Appendix B: Disposition of the Study Sample
• Appendix C: Construction of the Propensity Score
Evaluation of the Strengthening the Connections Between UI and One-Stop Delivery Systems Demonstration Project in Wisconsin
B e r k e l e y P o l i c y A s s o c i a t e s 12/1/06
1-10
• Appendix D: Data Items Provided by Wisconsin Unemployment Insurance and Department of Workforce Services Agencies
• Appendix E: Wisconsin Demonstration Project Forms
• Appendix F: Wisconsin’s UI to Job Center Data Systems Documentation
• Appendix G: Characteristics of the Demonstration Group, by Subgroup
• Appendix H: Characteristics of Group A and B Participants by Demonstration Site
• Appendix I: Characteristics of Demonstration vs. Comparison Groups, by Site
• Appendix J: Use of Demonstration and Job Center Services
• Appendix K: Proportion of Demonstration and Comparison Groups Employed Each Quarter After Claim Date, By Analysis Model
• Appendix L: Results of Customer Satisfaction Survey

Evaluation of the Strengthening the Connections Between UI and One-Stop Delivery Systems Demonstration Project in Wisconsin
B e r k e l e y P o l i c y A s s o c i a t e s 12/1/06
2-1
2. Implementation of the Wisconsin Demonstration Project
Two philosophies guided the implementation of the Strengthening Connections Between UI and One-Stop Delivery Systems Project. First, the Department of Labor envisioned the project and its evaluation as a collaborative effort between the Department, the grantee, and the evaluator. In practice, each partner played its usual role, but had the added advantage of input from the others. Second, the project was seen as a true pilot test of an approach, and thus was open to changes in design or execution as needed. This chapter first describes the efforts of the Wisconsin state staff in implementing the Wisconsin Demonstration project. We then discuss the process of implementing the project at the demonstration sites.
Increasing Collaboration Within the Wisconsin Department of Workforce Development This section first describes the relevant structures of DWD and existing WPRS services in Wisconsin, then discusses the process of designing and planning the demonstration project. Finally, we identify successes and challenges in implementing the project at the state level. Pre-Demonstration Organizational Structure Wisconsin’s Department of Workforce Development (DWD) uses separate divisions to administer its UI and Job Center (One-Stop Career Center) operations. The Division of Workforce Solutions (DWS) oversees the state’s WIA and Job Service (funded by the Wagner-Peyser Act) programs, among others. The Division of Unemployment Insurance administers the various components of the UI program. Each of these divisions has separate data systems, and in fact, UI has two data systems, one for claims and one for wage records. Historically, staff from DWS and UI at the ground level were co-located until UI developed benefit call centers in the early 1990s. Since all UI benefit activities are now completed remotely, via telephone, email, or Internet, staff from the two agencies interact only occasionally. For the most part, these interactions are about issues related to individual claims and may take place entirely by phone and/or email. At the hands-on service level, RES staff interact remotely with UI staff in providing WPRS services, as is discussed below. Prior to the demonstration, relatively few structures existed at the state level that encouraged collaboration between the two agencies. UI and DWS staff at both the state and local levels work together in Rapid Response teams to serve employers and workers affected by large layoffs. Another structure is a formal group of WIA partners that provides oversight and training to local

Evaluation of the Strengthening the Connections Between UI and One-Stop Delivery Systems Demonstration Project in Wisconsin
B e r k e l e y P o l i c y A s s o c i a t e s 12/1/06
2-2
workforce boards. Staff also mentioned a “mega group” convened by DWS that met once to investigate linkages between DWS and UI. A final link between UI and DWS exists in automated applications of the state’s UI Internet filing system. About 13% of UI claimants apply for benefits via the agency’s website. After a claimant’s online application is completed, the UI website automatically opens the Job Center web page. The Wisconsin Demonstration Project unfolded in an era of fiscal conservatism within the state. As the DWS began the process of staffing the demonstration sites, Governor Jim Doyle announced a commitment to cut the number of state employees by 10,000 over the next eight years. The implications of this policy decision are discussed in more detail below, in the section on local implementation of the project. Existing Worker Profiling and Reemployment Services in Wisconsin Worker Profiling and Reemployment Services (WPRS) are designed to provide additional assistance to UI claimants who are predicted to be likely to exhaust all of their benefits.1 UI claimants are “profiled” based on a combination of factors, including tenure in their last position, education level, occupation category, and industry. These data elements are collected from claimants during the initial claims process and combined with the county’s unemployment rate by zip code to create a WPRS score that represents an individual’s likelihood of exhausting UI benefits. Every year, about one million Wisconsin residents file for UI. The majority of these (90%) are short-term layoffs. When claimants receive their first benefit check, they are profiled using a computerized statistical model that assigns them a probability of benefit exhaustion. About 100,000 Wisconsin claimants each year are selected for the profiling pool. Claimants are eligible for WPRS if they:
• Are permanently terminated from employment (vs. laid off with a return to work date);
• Are not affiliated with a labor union/hiring hall;
• Are not employed, even part-time;
• Are not enrolled in a certified training program; or
• Have not accepted a job offer with work to start in the future. A subset of profiled claimants is selected to receive reemployment services. As federal regulations require, WPRS claimants are selected for services in rank order of their probability of exhausting UI benefits. Claimants remain in the profiling pool for five weeks. If they are not chosen for services within that period, they are dropped from the pool. States use varying methods to select claimants for referral to reemployment services (RES). In Wisconsin, the resource capacity of local Job Service staff to provide WPRS services determines 1 WPRS were established in 1993 via amendments to the Social Security Act contained in P.L. 103-152.

Evaluation of the Strengthening the Connections Between UI and One-Stop Delivery Systems Demonstration Project in Wisconsin
B e r k e l e y P o l i c y A s s o c i a t e s 12/1/06
2-3
the number of claimants chosen for services each week,2 since profiled claimants are assigned to Job Centers for RES by the zip code of their residence. Statewide in Wisconsin, 21% of profiling pool claimants received WPRS in State Fiscal Year (SFY) 2003, up from 12% in SFY 2002. As Figure 2.1 illustrates, the Job Centers that participated in the demonstration project varied in the proportion of profiled claimants referred to WPRS before the demonstration, ranging from less than 1% at Job Center Northwest in Milwaukee to 18% in Menasha.
Figure 2.1 Proportion of Profiled Claimants Referred to WPRS In Wisconsin Demonstration and Comparison Sites*
State Fiscal Year 2003
Metro Job Center % Profiled
Referred to WPRS
Oshkosh 11.5%
Fox
Val
ley
Menasha 17.6%
Hire Center 11.9%
Job Center South 17.2%
Job Center Northwest .6%
Milw
auke
e
Teutonia 11.0%
* Oshkosh did not provided WPRS for at least part of the year while the RES staff person was out on maternity leave. Job Center Northwest reinitiated WPRS in April 2004.
Job Service staff members from each Job Center notify state staff of the number of WPRS claimants they are capable of serving in the coming week. Each Saturday night, the state UI agency’s mainframe computer selects that number of profiled claimants to be served the following week and automatically sends out a letter to selected claimants informing them that they must attend an orientation to Job Center services. Claimants are also informed that their continuing eligibility for unemployment benefits is contingent upon participation in reemployment services.
2 Staff capacity to provide WPRS services may be affected by factors such as employee leave, large layoffs in the local workforce investment area, or an increase in temporary or seasonal layoffs associated with religious and other holidays.

Evaluation of the Strengthening the Connections Between UI and One-Stop Delivery Systems Demonstration Project in Wisconsin
B e r k e l e y P o l i c y A s s o c i a t e s 12/1/06
2-4
Resource constraints affected the provision of WPRS in Wisconsin during the fiscal year in which the demonstration began. At various times during SFY 2003, up to one-third of the state’s workforce development areas (WDA) were not providing WPRS because of a lack of funding. Provision of Other Services Relevant to the Demonstration The Wisconsin Demonstration Project’s service model included two services that were not widely available in Wisconsin at the time the demonstration started. These included work registration and eligibility reviews. A number of states use the process of registering for work as a means of ensuring that UI claimants are able and available for work. Claimants in these states must register for work to receive UI benefits. Registration generally involves providing a resume to Wagner-Peyser Act staff, or entering resume information online, so that it can be included in the state’s database of job openings and job seekers. Wisconsin does not require work registration of all UI claimants, and as a result, some claimants who may benefit from services are not registered. About a dozen states have eligibility review programs (ERP) that require UI claimants to participate in counseling and other services in order to receive weekly UI benefits for long periods without interruption.3 Wisconsin has not conducted systematic eligibility reviews since the benefit call centers were implemented in the early 1990s. The UI agency has insufficient staff to cover this function. Overview of Implementation Process at the State Level In funding the Strengthening Connections Between UI and One-Stop Delivery Systems Demonstration, the Department of Labor (DOL) opted not to issue a solicitation for grant applications to start the process of selecting a grantee. Instead, DOL conducted telephone interviews with four states that regional staff of the Department recommended as being strong candidates for the demonstration. DOL staff were looking for states with workforce development agencies that were flexible, open to innovation, and interested in bringing their UI and One-Stop systems together. Because of this approach, the design of the project was not specified in Wisconsin’s grant proposal, and the project’s timeline included an extended design phase up front. The rest of this section describes the process of designing the project, the roles assumed by UI and DWS staff, and ongoing oversight of the project.
3 O’Leary, Christopher. UI Work Search Rules and Their Effects on Employment, National Association of State Workforce Agencies (NASWA), February 2004 http://www.naswa.org/sections/pdf/2004/UI_Work_Search.pdf

Evaluation of the Strengthening the Connections Between UI and One-Stop Delivery Systems Demonstration Project in Wisconsin
B e r k e l e y P o l i c y A s s o c i a t e s 12/1/06
2-5
Design of the Demonstration Early in the study period, the Administrator of the UI Division moved to a new position as the Administrator of the DWS. This move was a positive one in terms of the overall goals of the demonstration grant, in that the senior position was taken over by someone familiar with the project, increasing the potential for collaboration between the two agencies. On the other hand, the new DWS Administrator−and his replacement in the UI Division−needed time to adjust to their new roles. Between the learning curve for senior staff in new positions and an extended decision-making process for approving the demonstration’s design, the project was delayed for approximately four months. In February 2004, DWD formed an Oversight Committee for the project, composed of staff from both the UI and Job Service agencies. The nine-member committee consisted of the following staff:
• Director of the UI Benefits Operations Bureau;
• Manager of the Madison Benefits Call Center;
• Bureau of Job Service Director;
• Manager of Employment and Training;
• Manager of UI’s Management Information Section;
• Job Service supervisor for the Northwestern District;
• IT staff from the UI agency;
• Manager of IT for the DWS agency; and
• Supervisor of an UI Adjudication Unit.
The Oversight Committee was charged with developing and refining the project’s goals, determining the types of services to be provided under the grant, selecting service sites, providing feedback on the evaluation design, and overseeing implementation of the project. The committee accomplished much of its work through the use of subcommittees focused on particular aspects of project design and implementation, such as developing RES curriculum and integrating UI and DWS data systems. The work for these subcommittees is discussed in more detail below. The Oversight Committee met every two weeks, allowing the subcommittees to report on their progress and other members to provide feedback and suggestions on proposed project components and implementation plans. Once the committee had settled upon a project design that offered an expanded model of reemployment services (RES), the next step was to identify Job Centers in which to implement the project. The Oversight Committee used several criteria in selecting the demonstration and comparison sites. First, in order to take advantage of the grant as an opportunity to increase the number of Job Centers offering RES, the demonstration sites were chosen from centers in which these services were not available at the time the project started. Second, the group wanted to implement the demonstration in both an urban area and a suburban/rural area. As the state’s

Evaluation of the Strengthening the Connections Between UI and One-Stop Delivery Systems Demonstration Project in Wisconsin
B e r k e l e y P o l i c y A s s o c i a t e s 12/1/06
2-6
largest city, Milwaukee was the obvious choice for the urban site. Within Milwaukee, the workgroup selected Job Centers that served large proportions of customers with ethnic minority backgrounds. Third, the Job Center had to have space for the project to operate, both an office for staff and a conference room large enough to hold the orientation meetings. This criterion alone removed many of the smaller Job Centers from consideration as a potential project site. Finally, study sites had to be within 40 miles of one of Wisconsin’s four UI adjudication offices. In selecting the comparison sites, the group chose Job Centers where 1) RES was available at the start of the demonstration, and 2) customers had demographics that were relatively similar to those of individuals served at the demonstration sites. Design of Wisconsin Demonstration Project Services The Oversight Committee formed a Curriculum Design Group early in 2004. Members of the design group included staff of the demonstration sites, the two UI adjudicators who worked with the project, a Job Service Supervisor from Milwaukee, and two representatives from the Oversight Committee: the Manager of Employment and Training; and the Job Service Supervisor. The mission of this group was to develop the curriculum and the content material for the demonstration’s services. The group identified the topics that the project’s workshops would address, but left to local site staff the task of identifying specific materials to use in the workshops. The group also developed the forms that staff used in administering services, including the job search journal, self-assessment form, customer satisfaction surveys, individual reemployment plan, and checklist for conducting the plan review (see Appendix E). Drafts of these tools were posted on a shared network computer drive so that oversight committee members could review them and provide comments. The group’s products were compiled into a staff handbook that outlined the goals and structure of the demonstration, and gave directions on how to implement the steps of the project’s service process. In addition to the tools listed above, the handbook included an agenda for the orientations, suggestions for handouts, and sample scripts for making the initial telephone contacts and for describing the demonstration’s requirements to participants. The Curriculum Group met in person once per month in Madison starting in April 2004. DWD invested heavily in the development of the demonstration’s forms and curricula. The group’s first in-person meeting was a week long, and the next two meetings, in May and June 2004, were two to three days in duration. The next two meetings were one to two days in length; one meeting included a visit to the Oshkosh site soon after staff there began providing services. Once the Milwaukee sites began operations, the Curriculum Group was disbanded. During the last six months of the project, members of the Curriculum Group were recruited to serve on DWD’s workgroup for incorporating lessons from the demonstration into ongoing Job Center services. This workgroup met at least twice before the project ceased operations, developed possible scenarios, and circulated their products for review.

Evaluation of the Strengthening the Connections Between UI and One-Stop Delivery Systems Demonstration Project in Wisconsin
B e r k e l e y P o l i c y A s s o c i a t e s 12/1/06
2-7
Developing the Demonstration’s Data Sharing Component In addition to the provision of RES, the demonstration’s second key mechanism for facilitating linkages between UI and Job Service staff was a data-sharing project that automatically provided information from the UI claim data system to the DWS Automated System Support For Employment and Training (ASSET) system. Senior DWS staff saw this component as a way of defining RES participants as common customers of both UI and Job Center staff. In addition, improvements in data-sharing offered a means for the state agency to provide better bureaucratic support to staff in the field to facilitate provision of services to customers. One of the goals of this effort was to automatically register project participants for work when they filed a UI claim, while another was to provide the evaluation with participant data. This seemingly straightforward task involved staff from all levels of both agencies in joint agency workgroups, mapping electronic data processes, and troubleshooting as the electronic inter-change of data was developed. Appendix F provides a graphic flow chart of the steps potentially involved in transferring data between the two data systems. In practice, the process varied from the flow chart in several steps, nonetheless, the chart illustrates the complexity of the task overall. Since DWS’ Job Service staff provided services to participants, the ASSET data system underwent the most changes in order to accommodate the information needed for the demonstra-tion and its evaluation. The agency’s IT staff first had to compare the data fields in both the UI claimant and ASSET systems in order to determine the proper way to convert the UI data into fields compatible with ASSET. Staff then matched information from the UI database with claimants who appeared in the ASSET database. This process was complicated by the fact that while UI uses the claimant’s Social Security number as the primary identifier for individuals, ASSET uses a case number. The ASSET database also was revised to include new fields, such as one capturing whether demonstration participants were in Group A or Group B. DWS’ IT staff also created a new data “screen” for the project’s employment plan (since the demonstration’s services were more extensive than those provided under the regular RES program) and new reports that would provide information from ASSET on the project’s participants. Another step required to provide the evaluation with employment data involved creating a new interface with the UI wage record system, and the DWS IT team had limited experience with this database. Staff created new web services to access the study sample’s wage records, which were then merged with the data pulled from the UI claimant data system and information from ASSET to complete the evaluation’s database. Roles of the Division of Workforce Solutions and UI Division The Wisconsin Demonstration Project had an interesting management structure. The project director, who had responsibility for the grant’s budget, was housed in the UI Division, while the field staff who actually provided services were employed by DWS. The project director had no direct oversight of the DWS demonstration staff, and in fact, rarely communicated with them

Evaluation of the Strengthening the Connections Between UI and One-Stop Delivery Systems Demonstration Project in Wisconsin
B e r k e l e y P o l i c y A s s o c i a t e s 12/1/06
2-8
directly. DWS staff were also responsible for leading the information technology (IT) tasks that integrated the UI and DWS data systems and provided the evaluation with data. The structure of the project overall required staff from the two agencies to collaborate or the project could not be implemented. With the exception of IT staff, none of the state-level administrative or management staff in either UI or DWS who were involved with the demonstration charged their time to the grant. Instead, the grant’s budget was reserved for providing direct services. The contribution of these “matching” resources was indicative of Wisconsin’s commitment to the project, and was critical to the success of the demonstration. Ongoing Oversight After the demonstration’s sites began operations, the Oversight Committee continued to meet every other week for the duration of the grant. In addition, the project director, Director of the Bureau of Job Service, and Director of UI Benefits Operations Bureau met monthly to discuss the project’s progress. The Bureau of Job Service has only four staff in the state office, and the Job Service supervisor for Wisconsin’s Northwest District serves as the lead staff person for RES within the agency. As an extension of this role, she was delegated the task of overseeing implementation of the demonstration at the local level. She contacted project staff at least twice per month and hosted occasional conference calls between state and local staff. Because she was not the direct line supervisor of the project staff, she was not empowered to be directive in dealing with them. She instead took a consulting approach to ensuring the integrity of the demonstration’s service model by asking questions and providing advice when needed. Challenges and Successes in State Implementation The demonstration’s challenges included the complexity of implementing changes in the DWS management information system (MIS), ensuring adequate staffing under a hiring freeze, and questions about the ongoing sustainability of RES. Its successes included the strong working relationships developed through the project, and through the work of the demonstration Oversight Committee in particular, and the positive impact on vision of RES among senior managers. Each of these is discussed below. Challenges in Implementing the Wisconsin Demonstration Project Complexity of Integrating Data from Multiple MIS. Prior to implementation of the demonstration, Job Center staff were required to enter data on RES participants in two computer systems: UI’s claimant database and DWS’ ASSET system. Job Service staff who provided RES in the Job Centers could view some screens in the UI claimant database, but not enter or edit information on those screens. Creating a better interface between the UI and ASSET data systems became a major task of the project. Despite the level of effort devoted to the data-

Evaluation of the Strengthening the Connections Between UI and One-Stop Delivery Systems Demonstration Project in Wisconsin
B e r k e l e y P o l i c y A s s o c i a t e s 12/1/06
2-9
sharing project, its success appeared to be mixed. Not all of the data fields needed for work registration were available in the UI benefit claims system, and demonstration staff still needed to do quite a bit of data entry. While the project also provided a great deal of information on participants to the evaluation team, the cost of the effort prevented the reformatting of some data items in ways that would have been more useful for the study. In addition, because a few data items (e.g., reemployment plan review date) were originally omitted from the ASSET data entry screens, this information was not available for participants who used the demonstration’s services before January 2005, when the error was corrected. The DWS IT team started working on the design of the file layout, the first step in the integration process, in November 2004, and produced the first data extract for the evaluation in February 2005. During that time, both the UI and DWS IT teams faced competing demands from other large projects, which slowed implementation of the needed changes to ASSET. In addition, the data-sharing project faced competing demands on the databases themselves. For example, during an early download of evaluation data, another MIS project’s programming corrupted the data, and the download of data had to be run again. Furthermore, the DWS IT team experienced a learning curve on working with the UI wage record database, which also slowed completion of the data-sharing project. IT staff were able to overcome many of the challenges that emerged in the course of completing the MIS work; however, they still provide a lesson about anticipating the issues that can arise in integrating three different complex data systems. Ensuring Adequate Staffing Under a Hiring Freeze. As is discussed in more detail under “Challenges and Successes of Local Implementation,” below, the state policy prohibiting the creation of new positions posed an ongoing challenge for the Director of the Bureau of Job Services. Even the fact that the demonstration’s budget allowed the project to extend operations through the end of March 2006 presented a challenge, since the Job Services’ authority to hire and retain Wisconsin Demonstration staff expired at the end of December 2005, the project’s original anticipated end date. To continue providing RES services and spend out the grant funds, the Job Services Director applied for and received approval from the DWD’s Division of Administrative Services to extend hiring authority for the demonstration. Sustainability of RES. With dedicated funding for RES removed from required services under the Fiscal Year 2006 Wagner-Peyser Act appropriation, Wisconsin may have difficulty finding financial support for expanding or changing its model of RES provision. Because of limitations on staffing, Job Services was unable to spend out its RES funding for SFY2004, and applied to DOL to roll over the remaining funds to the current fiscal year. Beyond this year, however, the uncertainty of funding for reemployment services may severely curtail any plans to incorporate aspects of the demonstration’s service model into the broader RES program.
Evaluation of the Strengthening the Connections Between UI and One-Stop Delivery Systems Demonstration Project in Wisconsin
B e r k e l e y P o l i c y A s s o c i a t e s 12/1/06
2-10
Successes in Implementing the Wisconsin Demonstration Project Collaborative Relationships Growing Out of the Demonstration Oversight Committee. Both UI and DWS staff at the state level reported that the project has succeeded in providing a process and structure for generating ideas about interagency collaboration that expanded beyond the demonstration. Interview respondents appreciated the trust that developed between UI and DWS staff as a result of working together to implement the project, and noted that the demonstration created a better quality work environment than had existed prior to the project. Wisconsin staff felt that the demonstration had prepared them for addressing the proposed performance standard for UI that measures the rate of claimants reentering employment that has been discussed in policy circles, should DOL implement it. Impact of the Wisconsin Demonstration at the State Level. Before the grant had ended, the Director of the Bureau of Job Services started the process of redesigning the state’s RES based on what he had learned from the demonstration. He and his staff were working closely with UI staff on developing a plan to bring UI staff into the Job Centers for RES orientations on a broader scale. Because the demonstration’s service model involves more intensive RES services than are currently being offered, Job Services would have to reduce the number of RES participants if the model were adopted statewide. The Job Services Director described the goal of this effort as being to balance the quality of services provided with the quantity of claimants served.
Increasing Collaboration Between UI and Job Service at the Local Level Prior to the Wisconsin Demonstration Project, Job Service staff interacted with their counterparts in UI solely in regard to providing WPRS. Communications occurred primarily through the UI claimant database system. The system provided the list of claimants selected for RES, and Job Service staff recorded information on claimant compliance with RES requirements in a case notes screen. Staff in Milwaukee noted that developing relationships with UI staff had been challenging because of turnover among UI workers, and because several adjudicators were assigned to claimants at a single Job Center. This section first describes the demonstration sites, then the backgrounds of the demonstration staff. Next, we discuss implementation of the demonstration at the local level. We conclude with challenges and successes experienced by the demonstration staff in operating the project. Organizational Structure of the Demonstration Sites Below, we briefly describe the local context of the cities in which the demonstration sites were located, and then discuss the structure of the Job Centers in which the project was located.

Evaluation of the Strengthening the Connections Between UI and One-Stop Delivery Systems Demonstration Project in Wisconsin
B e r k e l e y P o l i c y A s s o c i a t e s 12/1/06
2-11
Oshkosh Job Center and Local Economy The City of Oshkosh has a population of 63,237; 93% of residents are white. Oshkosh’s economy differs slightly from the rest of the Fox Valley because it is home to one of the campuses of the University of Wisconsin, with over 12,000 students. The Fox Valley economy was historically built on manufacturing, and up until ten years ago paper manufacturing represented about 28% of the local economy. The area has experienced large dislocations in the intervening period, and manufacturing jobs are on the decline. More work is available in nearby Green Bay, Appleton, and Fond du Lac, but many claimants lack reliable transportation to travel to these jobs. The local workforce investment board (WIB) was the One-Stop operator for all of the Job Centers in the Fox Valley region at the time the demonstration began. The WIB provided core and business services directly, and ran a job club called “Career Builders.” In Oshkosh, the board contracted out its adult intensive and dislocated worker services to CareerPros and to Advocap, a union-affiliated nonprofit. Before the demonstration was implemented, the Job Center manager and the RES supervisor jointly ran the Job Center orientations. RES was not available in Oshkosh at the time the demonstration started because the staff person was out on maternity leave. UI does not have an office in Oshkosh. The adjudicator who participated in the demonstration drove twice a month from Appleton, 20 miles away, where the nearest UI office is located. Milwaukee Demonstration Sites and Local Economy With a population of 921,694, Milwaukee is the largest city in Wisconsin, and has the most diverse residents in the state. Just over one-quarter (26%) of residents are black, 11% are Hispanic, and 59% are white. Manufacturing has long been the backbone of the city’s economy; however employment in this industrial sector declined over 20% between 1997 and 2002. Employment in retail trade and administrative support also declined over the period. On the other hand, the number of workers employed in health care and social services increased 200%.4 The HIRE Center is a specialty center that focuses on serving dislocated workers. The Private Industry Council (PIC) of Milwaukee (the local workforce development board) operates the HIRE Center and acts as the fiscal agent for the center’s consortium of providers. The PIC subcontracts with the center’s partner agencies to provide core and intensive services on a cost reimbursement basis. The HIRE Center had provided RES in the past, but was not doing so at the time the demonstration began. Job Center Northwest is a comprehensive One-Stop Career Center, operated by Maximus, a for- profit company. As is the case in all of Milwaukee’s comprehensive centers, TANF services (called W2 in Wisconsin) are co-located at this Job Center. The PIC contracts for intensive 4 U.S. Census Bureau, 1997 and 2002 Economic Census: Summary Statistics by NAICS for Milwaukee, Wisconsin http://www.census.gov/econ/census02/data/wi/WI079.HTM

Evaluation of the Strengthening the Connections Between UI and One-Stop Delivery Systems Demonstration Project in Wisconsin
B e r k e l e y P o l i c y A s s o c i a t e s 12/1/06
2-12
services separately from Job Center operations for all comprehensive centers, so the One-Stop operator may or may not be the provider of WIA intensive services. Until February 2005, OIC (Opportunities Industrialization Center) provided intensive services and resource room staffing for Job Center Northwest. At that time, another community-based organization, UMOS, took over the contract previously held by OIC. Job Service staff noted that the resource room at Job Center Northwest is often crowded because it is shared by TANF and WIA customers, RES participants, and clients of other partner programs. The UI adjudicator for the Milwaukee demonstration sites works in the UI office located next to the Teutonia Job Center. He usually works as a trainer for new UI staff, and as a result, demonstration participants were the only claimants for whom he provided adjudication during the study period. Background of Demonstration Staff State DWS staff succeeded in finding staff who were well qualified to operate the demonstration project. Staff included:
• The HIRE Center staff was a former dislocated worker himself, and was inspired to work for DWS by the Rapid Response services he received when he was laid off. He worked in a UI benefit call center for over a year and had provided RES services for four years before he was recruited to staff the Wisconsin Demonstration project.
• The original Oshkosh staff worked for DWS for two years as a mental health counselor before serving as the Trade Adjustment Assistance coordinator at the Menasha Job Center.
• The second RES coordinator in Oshkosh had worked for the state for 15 years, including two years at the Watoma Job Center providing RES, employer services, and taking job orders.
• The Job Center Northwest staff had a Master’s degree in human services and provided WIA services at the Teutonia Job Center for two and a half years before she was recruited for the project.
Overview of Implementation Process at the Local Level Service Process The Wisconsin Demonstration’s services were designed to be completed within one month. Staff reported that one of the biggest challenges in implementing the project was conducting multiple workshops within the month, given the timing of the project’s other activities. The general monthly schedule at each of the sites was:

Evaluation of the Strengthening the Connections Between UI and One-Stop Delivery Systems Demonstration Project in Wisconsin
B e r k e l e y P o l i c y A s s o c i a t e s 12/1/06
2-13
• Week 1: Obtain list of claimants selected for WPRS, DWS staff send letters and make telephone contact;
• Week 2: Conduct joint UI and DWS orientation meeting(s);
• Week 3: Hold workshops;
• Week 4: Conduct joint UI and DWS employment plan reviews.
Because the project’s services did not actually begin until participants attended the RES orientation, staff pointed out that the actual service period was less than one month in duration. Project staff contacted all claimants in each month’s profiling pool by letter and by telephone to inform them that they were selected for services. Like staff from the other Job Centers providing RES, demonstration staff originally relied on the UI agency’s automated system to send notification letters to claimants in the study sites’ profiling pools. They found, however, that claimants needed time to complete the project’s self-assessment form5 at home before coming to the orientation. Thus, staff began mailing out notification letters themselves and including the assessment form with the letter. Over time, demonstration staff found it more effective to contact participants by telephone prior to sending out the letter so that the claimants would know to look for it in the mail. Because claimants’ phone numbers were not included on the WPRS list, staff had to take the extra step of finding the numbers in the UI claimant database before they could make the calls. If staff did not reach the claimants when they called, they left messages either on voicemail or with whoever answered the call. Individuals who indicated that they had found a job or were working with another provider of job search assistance were exempt from active participation in project services. Job Center Orientation Because the demonstration staff had worked together in developing the content of the Job Center orientation and basic workshops, the agenda for the orientation at each of the study sites was almost identical. In Milwaukee, staff from the HIRE Center and Job Center Northwest worked together in conducting the orientations and plan reviews. This strategy both speeded the process of sorting claimants into Groups A and B, and resulted in orientation meetings that were very consistent across the two sites. The project staff person at the HIRE Center further ensured that his presentation would be consistent over time by designing a Powerpoint presentation to use in conducting the orientation.
5 The self-assessment form collected the participant’s employment history, employment/career goals, and level of confidence in their interviewing skills (see Appendix E). Other information included on the assessment were: education level; need for childcare, transportation, housing, and health insurance; whether the individual had a disability; whether English was the claimant’s primary language; use of similar services; and need for various types of job search assistance.

Evaluation of the Strengthening the Connections Between UI and One-Stop Delivery Systems Demonstration Project in Wisconsin
B e r k e l e y P o l i c y A s s o c i a t e s 12/1/06
2-14
The RES orientation was designed to last between two and three hours, but often was only 90 minutes long. The Oshkosh site conducted two orientations per month, while each of the Milwaukee sites held one orientation each month. The meeting included a presentation by the UI adjudicators who were involved with the demonstration. The agenda covered the goals of the meeting and of the Wisconsin Demonstration Project overall, information about UI benefits, registering for work, and a one-on-one interview. Demonstration staff explained how and why claimants were selected to participate in the project. Since Job Center Northwest is known in the community as the location of the W2 program, staff at that center made a point of telling participants that the project was not related to TANF. Orientation participants received a folder of program information and a calendar of workshops offered at the Job Center. In addition, various materials describing other resources, services, and job search ideas were available on a display table in the room in which the orientation was held. Staff described the materials in the folder and on display, and discussed the various services available from partner organizations at the Job Center. Staff from Job Center partners sometimes made brief presentations during the orientation, depending upon their availability. Demonstration staff stressed the job search resources available at the Center and online, and described how to use the job search journal6 that all participants must maintain to comply with UI regulations. Demonstration staff strongly encouraged participants to make at least five job contacts per week instead of the two job contacts required by state law for claimants to maintain their UI benefits. The demonstration was not allowed to impose more stringent requirements on its participants than were required of other RES participants, therefore although demonstration participants were urged to make at least five job contacts per week, they were only required to make two. The UI adjudicator then gave a 20-minute presentation, discussing common questions about benefits, such as whether claimants can refuse a job offer and still maintain their benefits. The adjudicator also addressed the project’s work search requirements, using the job search journal, and tips on how to look for a job. This portion of the orientation also included a question and answer session about UI benefits and eligibility. The two adjudicators involved in the project handled the potential for future questions differently. The UI staff in Milwaukee recommended that participants call the UI agency’s toll-free telephone number if they had further questions about benefits and eligibility. In contrast, the adjudicator who worked with the Oshkosh site provided participants with her telephone number because getting through on the toll-free number can sometimes be difficult. While the UI adjudicators made their presentations, demonstration staff assigned claimants into Groups A and B. Group A consisted of individuals who had more relevant and/or transferable work skills and/or job search skills. Participants in this group generally were required only to return for their employment plan review at the end of the month. Group B was made up of 6 The journal consisted of a form developed by RES staff for claimants to use in keeping track of their job search efforts (see Appendix E). The form organized information such as the employer’s contact information, source of the job lead (e.g., newspaper, website, etc.), method of application (resume vs. application), date and results of follow-up calls, and final result of the application.

Evaluation of the Strengthening the Connections Between UI and One-Stop Delivery Systems Demonstration Project in Wisconsin
B e r k e l e y P o l i c y A s s o c i a t e s 12/1/06
2-15
claimants who were less prepared for looking for work; members of Group B were required to attend workshops and other meetings with demonstration staff. Staff reviewed self-assessment forms and resumes to divide participants into the two groups. In particular, they took into consideration claimants’ work history, level of education, resume format and sophistication, confidence in job search skills, and barriers to employment (i.e., need for childcare or transportation assistance). Staff used two primary criteria in assigning participants to Group A or B. First, participants who had a bachelor’s degree were assigned to Group A, while those without a high school education were assigned to Group B. Second, claimants who did not have a resumes, or lacked resumes that were up to date in format and content, were assigned to Group B. In addition, claimants who indicated that they need job search assistance or who had barriers to employment were assigned to Group B. At each orientation session, some participants did not fit clearly into either group. A few were individuals who appeared to meet all of the criteria for Group A, but needed some improvements to their resumes. Job Center Northwest staff called these claimants “Group A minus.” Both Job Center Northwest and the Oshkosh demonstration staff provided this group with advice on improving their resumes either on the day of the orientation or at a later scheduled meeting. Other participants were difficult to sort into a group because, while they met most of the criteria to be in Group A, they had been at the same job for an extended period, had been terminated (instead of laid off) from their last position, or had very messy resumes and/or self-assessment forms. Staff in Oshkosh tended to assign such claimants to Group B, while the Milwaukee staff assigned them to Group A.7 At the conclusion of the UI adjudicator’s presentation, demonstration staff directed participants to their newly assigned groups. During the last part of the orientation, the UI adjudicator met with Group A claimants collectively, reinforcing some of the points discussed earlier and answering any further questions about UI benefits and eligibility. The UI staff also scheduled appointments with Group A participants for their employment plan review, to be conducted three to four weeks after the orientation. Finally, the adjudicator gave Group A members a brief tour of the Job Center’s resource room, and asked them to register for work in JobNet and complete the project’s online customer satisfaction survey about the orientation. While members of Group A met with UI staff, demonstration staff met individually with members of Group B. As they waited for their turn to meet with staff, Group B participants also registered for work and completed the customer satisfaction survey. During the brief one-on-one meetings (10 to 15 minutes), staff discussed with participants their self-assessments and resumes. Based on these documents and the interview, staff identified workshops for the claimants to attend.
7 See discussion of local implementation successes and challenges, below.

Evaluation of the Strengthening the Connections Between UI and One-Stop Delivery Systems Demonstration Project in Wisconsin
B e r k e l e y P o l i c y A s s o c i a t e s 12/1/06
2-16
Workshops and Other Services For the most part, the demonstration staff themselves conducted the workshops that Group B claimants were required to attend. These included resume preparation, interviewing skills, and networking (finding work in the hidden job market). Early in the project’s implementation period, all Group B participants at the three sites were required to attend all three of the project’s workshops. This requirement was relaxed somewhat over time, however, as the project underwent staff changes. Local site staff selected the materials they used in conducting workshops from a variety of sources. Each of the sites used at least one of the handouts developed by DWD for use in the Wisconsin Job Centers, addressing topics such as employment skills, questions that might be asked in an interview, family finances, resume development, keys to successful interviewing, and adjusting to unemployment. In addition, staff used materials from job search and college websites, materials developed by other state and local WIBs, and excerpts from books by Richard Bolles and others. In addition to the three required workshops, staff at all of the demonstration sites met with Group B claimants individually to work on their resumes, as needed. Oshkosh’s first demonstration staff also required that all Group B claimants complete a mock interview with her. The staff person who later took over operation of the Oshkosh site did not require the mock interview, and required Group B participants to attend only two workshops (interviewing skills and resume preparation). On the other hand, the second Oshkosh staff required participants to identify two job leads using the Internet before they could leave the resume preparation and interview skills workshops. In Oshkosh, the project’s workshops were the only such assistance available until late in the study period. In Milwaukee, however, Job Centers throughout the city offered a range of workshops that could benefit participants. The HIRE Center staff informed participants about the workshops available at other Centers. If he required that a participant attend a workshop offered at another Job Center, he would notify the Job Service staff who conducted the session to ensure that the participant’s attendance would be entered in the ASSET database. At each site, the workshops offered by demonstration staff started with the three mandatory sessions discussed above. Over time, project staff added workshops and expanded their lists of relevant workshops available from other providers. For example, the staff in Milwaukee discovered that many participants had no experience using a computer and added a three-hour “Introduction to the Computer” session to their required curricula. By the end of the project, workshop curricula addressed topics such as preparation for job fairs, career change, labor market projections of “hot jobs,” budgeting, and stress management. If a Group B participant failed to attend a required workshop without notifying the project, demonstration staff notified their respective UI adjudicator, who then suspended the individual’s UI benefits and withheld his or her check for that week.
Evaluation of the Strengthening the Connections Between UI and One-Stop Delivery Systems Demonstration Project in Wisconsin
B e r k e l e y P o l i c y A s s o c i a t e s 12/1/06
2-17
Job Referrals In February 2005, the DOL project officer visited the Milwaukee demonstration sites, and provided feedback to all staff associated with the project based on his observations. In particular, he noted that while the orientation appropriately stressed the importance of participants being involved in job search activities, this emphasis faded during the one-on-one interviews at the end of each orientation. Very often, the topic of discussion shifted to short-term training instead of reinforcing the claimant’s job search efforts. The project officer encouraged demonstration staff to maintain their focus on assisting claimants to find jobs. To that end, he suggested that the project add to its service model the provision of job referrals to Group B participants. From March 2005 through the end of the demonstration, staff searched for local job listings in Wisconsin’s JobNet system and in other online job search websites, such as America’s Job Bank, and had printouts of these listings available at the orientation meetings. Staff also identified listings that might be appropriate for specific Group B claimants. For example, based on information from participant resumes, self-assessment forms, and gathered through interviews, Oshkosh staff found weekly job leads for which participants who attended workshops appeared to be qualified. Job codes from DOT or ONET were not used to identify job leads. Staff at Job Center Northwest used a sign-in sheet at orientation that requested participants to identify the type of work for which they were looking. Demonstration staff then looked for job leads for those types of work, printed out the listings, and had them available on tables in the project room on the day that plan reviews were conducted. The Northwest staff also looked through the job search websites twice per week, and sent out job listings by email to claimants who asked to be added to her list. Claimants remained on the email list until they asked to be removed; some participants were still on the list a year after they had attended the Wisconsin Demonstration orientation. Review of Employment Plan The last meeting between demonstration staff and participants was a formal, individual Review of Employment Plan (REP)8 conducted with each participant who had not yet found a job. Staff at the Oshkosh Job Center sent out a reminder letter to participants a week before their review dates, while the Milwaukee staff did not. The REP was a brief interview, generally about 15 minutes in length, conducted with demonstration staff, the UI adjudicator, and the claimant. Staff asked claimants about the type of job search methods they had been using, gave tips, and often provided another job referral. The adjudicator usually reviewed participants’ job search journals and addressed any problems with the number of job search contacts completed or participant compliance with the “able and available” requirements.
8 The REP is an updated version of the traditional Eligibility Review Program (ERP).

Evaluation of the Strengthening the Connections Between UI and One-Stop Delivery Systems Demonstration Project in Wisconsin
B e r k e l e y P o l i c y A s s o c i a t e s 12/1/06
2-18
A majority of claimants in Milwaukee met the project’s goal of contacting five potential employers per week during their job searches. Oshkosh staff, however, noted that more than half of claimants at that site continued to make only two job contacts throughout their participation in the project. Staff at both sites used the REP as an opportunity to reiterate the importance of making at least five job contacts per week. Staff also asked again about any barriers participants might have faced in looking for a job (e.g., transportation, child care) and how they planned to address them. After a reminder that participants could seek help from Center staff even though they had completed project services, staff asked participants to complete another customer satisfaction survey that addressed the services of the demonstration as a whole. Follow-Up With Claimants Beginning in March 2005 in Milwaukee and April 2005 in Oshkosh, demonstration staff began conducting follow-up contacts with participants 30 days after completion of their REPs. Staff developed a letter to claimants that included a survey at the bottom to be returned to the project. The survey asked whether 1) claimants had found a job, 2) they needed more help in looking for work, and 3) they had any comments or questions about the services they received (see Appendix E). Overall, less than half of participants responded to the survey. Of those who did respond, most indicated that they did not need further help with their job search. Challenges and Successes in Local Implementation The staff who implemented the Wisconsin Demonstration project faced a number of challenges, including the impact of other Job Center partners on the project, poor communication within Job Service about the demonstration, inability to hire and retain demonstration staff, supervision and ongoing oversight of the demonstration, and record-keeping and use of ASSET and UI data. The project’s successes included the positive impacts of the project on Job Centers that hosted the demonstration, the flexibility of project staff, and the assistance that the demonstration provided to UI claimants. Each of these is discussed below. Challenges in Implementing the Wisconsin Demonstration Project Impact of Other Job Center Partners on the Demonstration. Each of the demonstration sites was affected by decisions made by other Job Center partners. While project staff were able to address these challenges, they served as examples of the realities of implementing a project within a collaborative structure such as the One-Stop Career Centers. When one of Milwaukee’s Job Service managers approached Maximus, the operator of Job Center Northwest, about operating the demonstration out of the center, Maximus was interested in hosting the demonstration, but required that the project pay rent for use of the space. Because of the delays associated with these negotiations, the Northwest demonstration site started operations slightly later than HIRE Center.

Evaluation of the Strengthening the Connections Between UI and One-Stop Delivery Systems Demonstration Project in Wisconsin
B e r k e l e y P o l i c y A s s o c i a t e s 12/1/06
2-19
The HIRE Center’s site was impacted by the relocation of Job Center South, the demonstration’s comparison site. Job Center South’s new facility did not have a conference room large enough for Job Service staff to conduct WPRS orientations. The HIRE Center’s manager was unaware that Job Center South was a comparison site for the demonstration’s evaluation, and allowed Job Center South to use one of the HIRE Center’s conference rooms for these meetings. Unfortunately, Job Center South scheduled one of its orientations on the same morning as that on which the project’s orientations were regularly held. Fortunately, the ensuing confusion was resolved fairly quickly by providing careful instruction to the HIRE Center’s receptionist. Shortly after Oshkosh site began providing demonstration services in July 2004, the staff person representing one of the Job Center’s primary partners left, and the organization did not have the resources to replace her. Since this partner had been the provider of workshops for the Job Center, demonstration participants found relatively few job search resources available at the Center. While the Job Center manager had anticipated the services of the partner agency again being available after an absence of about four months, the agency did not resume providing workshops during the study period. Thus, during the first few months of the demonstration, staff provided only the RES orientation and one-on-one services to participants. Eventually, Job Service staff developed and conducted workshops on resume writing and interviewing skills. The demonstration’s workshops became the only such assistance available at the Oshkosh Job Center until 2006, when the Job Center manager again engaged other partners in conducting workshops. Communication Throughout Job Service System About the Demonstration. Local Job Service managers in Oshkosh and Milwaukee were not involved in the planning or design of the demonstration until the project was almost ready for implementation. The managers reported that they relied on the project staff to bring back information about the demonstration from planning meetings. At the same time, the managers were not clear about the role of the Job Service supervisor who was involved in overseeing the demonstration. These issues did not adversely affect the implementation of the project, however, because of the commitment of both local and state staff to making the demonstration a success. Nonetheless, these challenges point out the need for being aware of the need for communication among partners at all levels of their organizations. Inability to Hire and Retain Demonstration Staff. The original design of the Wisconsin Demonstration project called for two staff at each site, a total of 1.5 full-time equivalents (FTE). As mentioned earlier in this chapter, the Wisconsin Demonstration project was carried out under a hiring freeze on state employees. This factor had a large impact on the demonstration, particularly at the Oshkosh site. Because of the hiring freeze, state Job Service managers were unable to create new positions for project staff. Instead, staff were brought onto the project using existing temporary staff positions (limited term engagement, or LTE) created under other projects but not being used. The first staff person at the Oshkosh site was hired under this arrangement, as were the Northwest staff and the Milwaukee clerical assistant. (The HIRE Center staff held a regular permanent position.) Because the positions were temporary and were generated in conjunction with earlier projects, they expired on schedules that were unrelated to

Evaluation of the Strengthening the Connections Between UI and One-Stop Delivery Systems Demonstration Project in Wisconsin
B e r k e l e y P o l i c y A s s o c i a t e s 12/1/06
2-20
the demonstration. State staff spent substantial amounts of time looking for vacant temporary staff positions to cover project staff when their LTE positions expired. Figure 2.2 presents a timeline for the demonstration that marks turnover among staff.
Figure 2.2 Timeline for Wisconsin Demonstration Project Staffing Changes
7/1/04 Oshkosh site started operations. Staff hired through LTE project position scheduled to expire December 2004. Clerical assistant position vacant.
9/1/04 Milwaukee sites started operations. HIRE Center staff held regular permanent position; Northwest staff and clerical assistant hired through LTE positions.
10/26/04 Oshkosh clerical person hired (but fell through because admin process took too long)
12/04 Oshkosh staff LTE funding ended; staff person laid off.
12/30/04 Original Project Director retired; New Project Director appointed.
1/05 New LTE funding found for Oshkosh staff, and she returned to work.
1/05 Oshkosh clerical assistant started work.
3/10/05 Milwaukee clerical assistant laid off because LTE position expired
4/30/05 Both Oshkosh staff left the project because LTE positions ended.
4/27/06 New Oshkosh staff started work.
5/05 New LTE position found to cover Milwaukee clerical assistant, and she returned to work.
5/05 New Oshkosh clerical assistant started work.
8/19/05 Oshkosh clerical assistant left the project.
10/05 Both clerical positions were vacant.
11/21/05 New Milwaukee clerical assistant started work.
12/05 Title V (Older Worker) took over Oshkosh clerical duties until new assistant found.
12/31/06 End of evaluation study period.
12/31/06 Job Service manager of Milwaukee sites retired.
1/06 New Oshkosh clerical assistant started work.
2/28/06 Milwaukee clerical assistant left.
3/31/06 Demonstration ended services.
The Director of the Bureau of Job Service noted that the use of temporary positions affected whom he was able to recruit to staff the demonstration. Permanent staff were not attracted to the project positions because they were temporary, which may have resulted in the demonstration being staffed with Job Service employees with less experience. On the other hand, younger, more enthusiastic staff are often more willing to try new approaches to services, which seems to be the case with the local staff responsible for providing the demonstration’s hands-on services.

Evaluation of the Strengthening the Connections Between UI and One-Stop Delivery Systems Demonstration Project in Wisconsin
B e r k e l e y P o l i c y A s s o c i a t e s 12/1/06
2-21
Another factor that contributed to staff turnover in Oshkosh was that the Fox Valley Workforce Investment Board lost its contract to operate another Job Center in the same district. Job Service employees with regular positions who lost their jobs at that Center had the option of remaining employed by taking the position of another Job Service staff with lower seniority. The result of this restructuring was that both the original Oshkosh staff person and the half-time clerical staff were “bumped” by staff with higher seniority and lost their jobs. The timing of the demonstration’s implementation−at a time when hiring new staff was impossible−was an unfortunate coincidence. Nonetheless, the challenges experienced by DWD staff at both the state and local levels were persuasive evidence of the need to hire staff into permanent positions if at all possible. Supervision and Ongoing Oversight of Demonstration. The demonstration’s planning workgroup was the only mechanism for bringing together the demonstration staff to discuss implementation issues, and this group disbanded shortly after the Milwaukee sites began providing services. The inconsistencies across the project sites in sorting similar participants into Groups A and B points to the need for ongoing project meetings to take place beyond the project’s rollout period. Record-Keeping and Use of ASSET and UI Data. Project staff were disappointed with the amount of data entry they were required to do, despite the DWD’s investment in integrating the UI and ASSET data systems. For example, staff found that not all of the necessary data were transferred from the UI claims database to ASSET to register claimants for work. Even at the end of the project, staff experienced difficulties in accessing certain types of information from the UI database. Successes in Implementing the Wisconsin Demonstration Project Impact of Demonstration on Hosting Job Center. Despite the challenges that demonstration staff encountered in working with other Job Center partners, the project also succeeded in creating positive impacts on the centers in which they were based. For example, the presence of the Wisconsin Demonstration project at Job Center Northwest increased the number of job search workshops available in the center, and enhanced the center’s image in the community because it had been generally regarded as being only a “welfare center.” In Oshkosh, demonstration staff provided workshops that were open to the Job Center’s universal customers that otherwise would not have been available. Flexibility of Staff. Project staff were extremely flexible in accommodating the needs of participants. For example, staff from each of the sites regularly scheduled make-up orientations for claimants who had legitimate reasons for being unable to attend the meeting on its regularly scheduled day. The HIRE Center staff also provided individual orientations for claimants who spoke only Spanish.

Evaluation of the Strengthening the Connections Between UI and One-Stop Delivery Systems Demonstration Project in Wisconsin
B e r k e l e y P o l i c y A s s o c i a t e s 12/1/06
2-22
Assistance Provided to UI Claimants. Both reports from staff and the results of the customer satisfaction surveys (see Chapter 4) described claimants who entered the orientation resenting the requirement that they attend, and who left extremely satisfied with—and grateful for—the services they received. Each of the staff received thank-you letters from a number of participants. Many of the letters noted that project staff had not only provided useful information, but had also provided much-needed encouragement that had boosted the claimants’ confidence.
Summary/Conclusion The demonstration succeeded in creating strong relationships between UI and Job Service staff at both the state and local levels that hopefully will be carried forward into the future. All staff involved in the project commented on the value of personal connections—in providing RES services to UI claimants, as well as in creating strong working relationships between UI and DWS staff. The next chapter explores the impact of these improved relationships on the employment outcomes achieved by demonstration participants.
Evaluation of the Strengthening the Connections Between UI and One-Stop Delivery Systems Demonstration Project in Wisconsin
B e r k e l e y P o l i c y A s s o c i a t e s 12/1/06
3-1
3. Outcomes of the Wisconsin Demonstration Project
The demonstration’s increased collaboration between Wisconsin’s UI and Job Service agencies was embodied at the service level in the design of the enhanced package of WPRS that project staff provided to participants. The goal of the evaluation’s outcomes component was to assess the impact of both the demonstration services, and the collaboration implicit in their design, on the employment outcomes of UI claimants. The evaluation looked at two categories of outcomes: descriptive and impact. The descriptive outcomes are those that tell the story of what services the project provided to which types of UI claimants. The impact outcomes explore the outcomes that participants achieved after using demonstration services, compared to similar claimants who did not receive assistance from the project. This chapter first describes the composition of the study sample, and then discusses the characteristics of demonstration and comparison group members, and their differential use of Job Center services. Following presentation of these descriptive outcomes, this chapter discusses employment outcomes among the study sample members, and explores the impact of services on outcomes.
Composition of the Final Study Sample A total of 8,390 UI claimants were included in the profiling pools of the demonstration and comparison sites between July 2003 and December 2005. These included 2,271 demonstration participants and 6,119 comparison group members.1 Unfortunately, data were missing for a small number of study group members from the final data provided to the evaluation team. Overall, data were not available for 193 members of the sample, which represented 2.3% of claimants included in the study sites’ profiling pools. Proportionately more demonstration participants were missing data (4.0%, 91 claimants) than were comparison group members (1.7%, 102 claimants). Another 1,824 comparison group members were excluded from the evaluation’s analyses because they were not matched in the propensity score process. The resulting final study sample included 6,373 members: 2,180 claimants in the demonstration group and 4,193 in the comparison group.
1 Appendix C provides a table illustrating the disposition of the sample.

Evaluation of the Strengthening the Connections Between UI and One-Stop Delivery Systems Demonstration Project in Wisconsin
B e r k e l e y P o l i c y A s s o c i a t e s 12/1/06
3-2
Characteristics of the Study Sample This section describes the characteristics of members of the demonstration and comparison groups. First, we discuss the composition of the demonstration group overall, followed by a more detailed discussion of the demonstration group by subgroups and by site. Next, we describe the comparison group by job center site. Finally, we examine differences in the composition of samples used in each of the evaluation’s analysis models. Composition of the Demonstration Group Despite the fact that claimants faced losing their UI benefits by not responding to letters and calls from demonstration staff, claimants could choose whether or not to participate in project services. Not all of the 2,180 claimants in the demonstration sites’ profiling pools participated in the demonstration; in fact, 1,005 claimants (or 46% of the demonstration group) did not attend an RES orientation. Individual decisions to participate or not raised the potential for selection biases, which this section explores. Among those who did not use demonstration services, 369 individuals, or 17%, had already entered employment by the time they received the letter introducing the demonstration (Group E, see Figure 3.1). Another 2% of claimants were already receiving employment services elsewhere (Group S). The remaining 27% did not respond to the introductory letter and phone call (Group N).
Figure 3.1 Total Demonstration Participants by Subgroups
Subgroup Number
Participants Percent
Participants
A – “Light Touch” Services 534 25%
B − Intensive Services 641 29%
Subtotal A & B 1,175 54%
E – Entered Employment 369 17%
N – No Show 588 27%
S – Received Services Elsewhere 48 2%
Subtotal No Services 1,005 46%
Total 2,180 100%

Evaluation of the Strengthening the Connections Between UI and One-Stop Delivery Systems Demonstration Project in Wisconsin
B e r k e l e y P o l i c y A s s o c i a t e s 12/1/06
3-3
The two other subgroups shown in Figure 3.1 consisted of those who did use demonstration services. As described in Chapter 2, project staff divided the 1,175 claimants who participated in the demonstration into Groups A or B depending upon their level of education, resumes, and job search experience. One-quarter of all claimants in the demonstration sites’ profiling pools, and just under half of those who attended an RES orientation, were classified as Group A, individuals who appeared to need less help in looking for a job. Group B included 641 claimants who needed hands-on assistance in developing their job search skills. Characteristics of Demonstration Participants by Subgroup Overall, the typical claimant in the demonstration group was a 40-year-old white male with a high school diploma. On average, he had worked in his last job for four years and earned an average of $6,130 per quarter. He had at least one previous UI claim in the past five years, and a 67% expected likelihood of exhausting his UI benefits during his current claim (see Figure 3.2).
Figure 3.2 Characteristics of Demonstration Group:
Claimants Who Used Services vs. Those Who Did Not
Total Participants
Group A & B Used Services
Group E, N & S No Services
# of Participants 2,180 1,175 1005
Male 56.3%** 54.0% 59.1%
Age (mean years) 40.1** 41.8 38.2
Education Less Than High School 12.2% 12.2% 12.1% High School Graduate 53.2%** 46.4% 61.1% Some College/College Grad 34.6%** 41.5% 26.8% Ethnicity White 68.3% 69.3% 67.1% Black 24.4% 25.0% 23.8% Other 7.3%* 5.7% 9.1% Limited English Proficiency 3.0% 2.9% 3.2%
Has Disability 3.3% 3.7% 2.9%
Single Parent 8.6%* 7.5% 10.0%
At Least 1 UI Claim in 5 Years 56.1% 54.4% 58.0%
WPRS Score (mean) 67.2 66.6 67.8
Years in Last Job (mean) 4.2* 4.5 3.8
Qtrly Earnings Last Job (mean) $6,340 $6,459 $6,201 ** Difference is statistically significant at the .01 level * Difference is statistically significant at the .05 level
Evaluation of the Strengthening the Connections Between UI and One-Stop Delivery Systems Demonstration Project in Wisconsin
B e r k e l e y P o l i c y A s s o c i a t e s 12/1/06
3-4
The background characteristics of individuals who used demonstration services were significantly different in several respects from demonstration group members who opted not to use services. Claimants who used project services (Groups A and B) were older on average, and more likely to be to have at least some college education, to have had a longer tenure in their last jobs, and to have had higher earnings than members of Groups E, N, and S who did not attend RES. Members of the demonstration group who did not use project services were significantly more likely to have only a high school education and to be a single parent, compared to those who used project services (see Appendix G).2 The evaluation team also compared the personal characteristics of the members of Group A versus Group B to explore the efficacy and consistency of the assessment process conducted by demonstration staff. The differences between Groups A and B were more numerous and pronounced than those between claimants at the demonstration sites who used project services and those who did not (see Figure 3.3, below). Compared to members of Group A, Group B participants were significantly more likely to be male, have a disability, be a single parent, have limited English skills, have not completed high school, and to have had at least one previous UI claim in the past five years. On average, Group A claimants were significantly older, better educated, and more likely to be white than their Group B counterparts. Group A members also had higher average quarterly earnings in their last job than did Group B claimants.3 Despite these differences, however, the average WPRS scores for Groups A and B were very similar (68 vs. 66). Did the demonstration’s assessment process capture differences between the two groups more accurately than the WPRS score did? Given that Group A participants had higher education levels and fewer previous UI claims than did Group B participants, one might expect that the members of Group B would have a higher likelihood of exhausting their UI benefits than Group A participants when in fact the reverse was true. As Chapter 2 discussed, demonstration staff took into account a range of factors in assigning participants to Groups A and B, including the format of the individual’s resume, the participant’s self-confidence about interviewing with employers, and need for transportation or childcare. Staff also considered other, more intangible variables such as how participants presented themselves at the orientation. Thus, the WPRS score and the assessment of participants’ job search skills by demonstration staff measured different factors.
2 Appendix G displays the characteristics of demonstration participants by all subgroups, allowing for investigation of differences between subgroups that did not use project services. For example, on average, members of the “no show” group were the youngest of the subgroups, had the largest proportion of males, the highest WPRS score, the greatest proportion of people with previous UI claims, and shortest previous job tenure of all the subgroups. They seem to be the group that would have most benefited from the demonstration’s services. 3 Appendix H provides more information about Groups A and B by site.
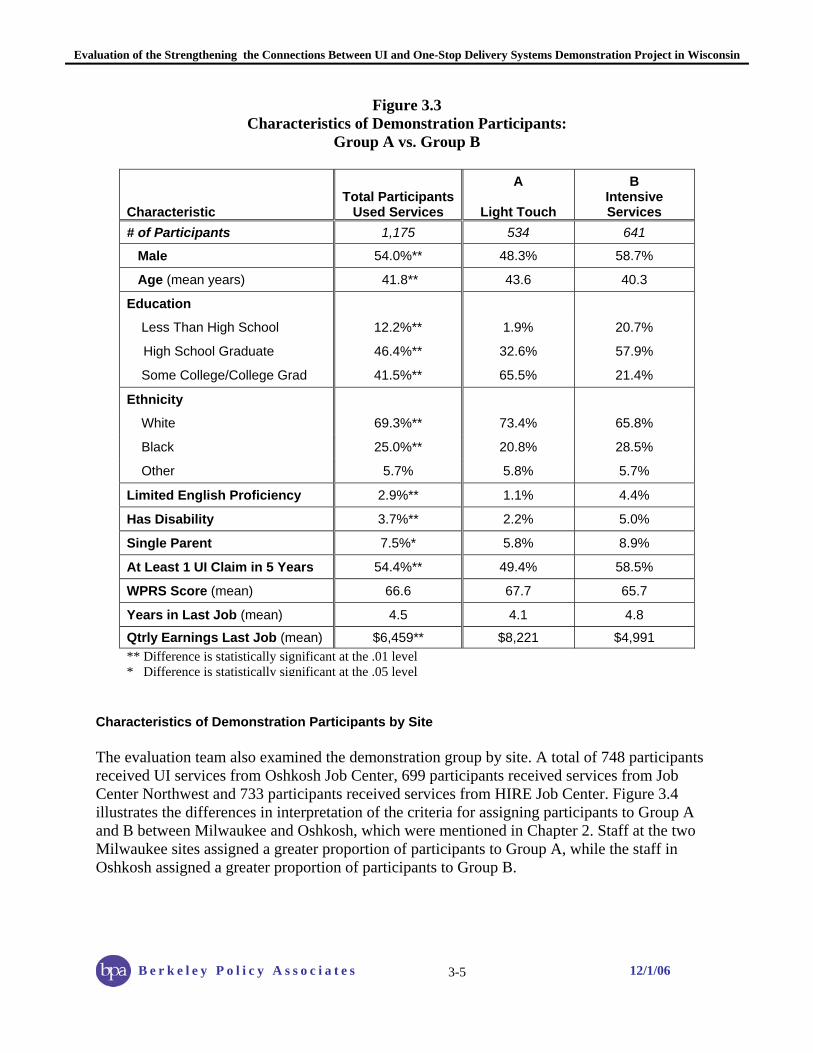
Evaluation of the Strengthening the Connections Between UI and One-Stop Delivery Systems Demonstration Project in Wisconsin
B e r k e l e y P o l i c y A s s o c i a t e s 12/1/06
3-5
Figure 3.3 Characteristics of Demonstration Participants:
Group A vs. Group B
Characteristic Total Participants
Used Services
A
Light Touch
B Intensive Services
# of Participants 1,175 534 641
Male 54.0%** 48.3% 58.7%
Age (mean years) 41.8** 43.6 40.3
Education
Less Than High School 12.2%** 1.9% 20.7%
High School Graduate 46.4%** 32.6% 57.9%
Some College/College Grad 41.5%** 65.5% 21.4%
Ethnicity
White 69.3%** 73.4% 65.8%
Black 25.0%** 20.8% 28.5%
Other 5.7% 5.8% 5.7%
Limited English Proficiency 2.9%** 1.1% 4.4%
Has Disability 3.7%** 2.2% 5.0%
Single Parent 7.5%* 5.8% 8.9%
At Least 1 UI Claim in 5 Years 54.4%** 49.4% 58.5%
WPRS Score (mean) 66.6 67.7 65.7
Years in Last Job (mean) 4.5 4.1 4.8
Qtrly Earnings Last Job (mean) $6,459** $8,221 $4,991 ** Difference is statistically significant at the .01 level * Difference is statistically significant at the .05 level
Characteristics of Demonstration Participants by Site The evaluation team also examined the demonstration group by site. A total of 748 participants received UI services from Oshkosh Job Center, 699 participants received services from Job Center Northwest and 733 participants received services from HIRE Job Center. Figure 3.4 illustrates the differences in interpretation of the criteria for assigning participants to Group A and B between Milwaukee and Oshkosh, which were mentioned in Chapter 2. Staff at the two Milwaukee sites assigned a greater proportion of participants to Group A, while the staff in Oshkosh assigned a greater proportion of participants to Group B.

Evaluation of the Strengthening the Connections Between UI and One-Stop Delivery Systems Demonstration Project in Wisconsin
B e r k e l e y P o l i c y A s s o c i a t e s 12/1/06
3-6
Figure 3.4 Subgroups of Demonstration Participants by Site
24.5%
29.4%
16.9%
27.0%
2.2%
20.9%
33.7%
13.5%
29.9%
2.0%
28.8%
29.5%
18.3%
21.6%
1.9%
24.1%
25.0%
19.1%
29.1%
2.7%
0%
10%
20%
30%
40%
50%
60%
70%
80%
90%
100%
Total (n=2,180)
Oshkosh (n=748)Northwest (n=699)HIRE Center (n=733)
S - Received Services Elsewhere
N - No Show
E - Entered Employment
B - Intensive Services
A - “Light Touch” Services
The demonstration sites varied somewhat in the proportion of the profiling pool who attended an orientation, and in the distribution across subgroups of participants who did not use project services. Job Center Northwest served the largest proportion (58%) of its profiling pool, while less than half (49%) of the HIRE Center’s profiling pool came to an orientation. In contrast, the HIRE Center had the largest proportion (19%) of participants who had already entered employment by the time they were contacted about the project. Finally, Oshkosh had the largest proportion (30%) of participants who did not respond to letters and phone calls from the demonstration staff and who failed to attend an orientation. Participants from the three demonstration sites were similar across several demographic characteristics, such as age, gender, and education levels. Claimants from the three sites differed significantly in ethnicity, however (see Figure 3.5, below). Almost all of the participants from Oshkosh were white (93%), while almost two-thirds of claimants from Job Center Northwest were black (64%). Unlike the other two sites, a significant proportion of claimants from the HIRE Center were Hispanic (15%). Participants from Job Center Northwest had the highest WPRS scores, on average, and were more likely than claimants from the other sites to have had at least one previous UI claim in the last five years (61%), and the shortest previous job tenure (3.1 years).
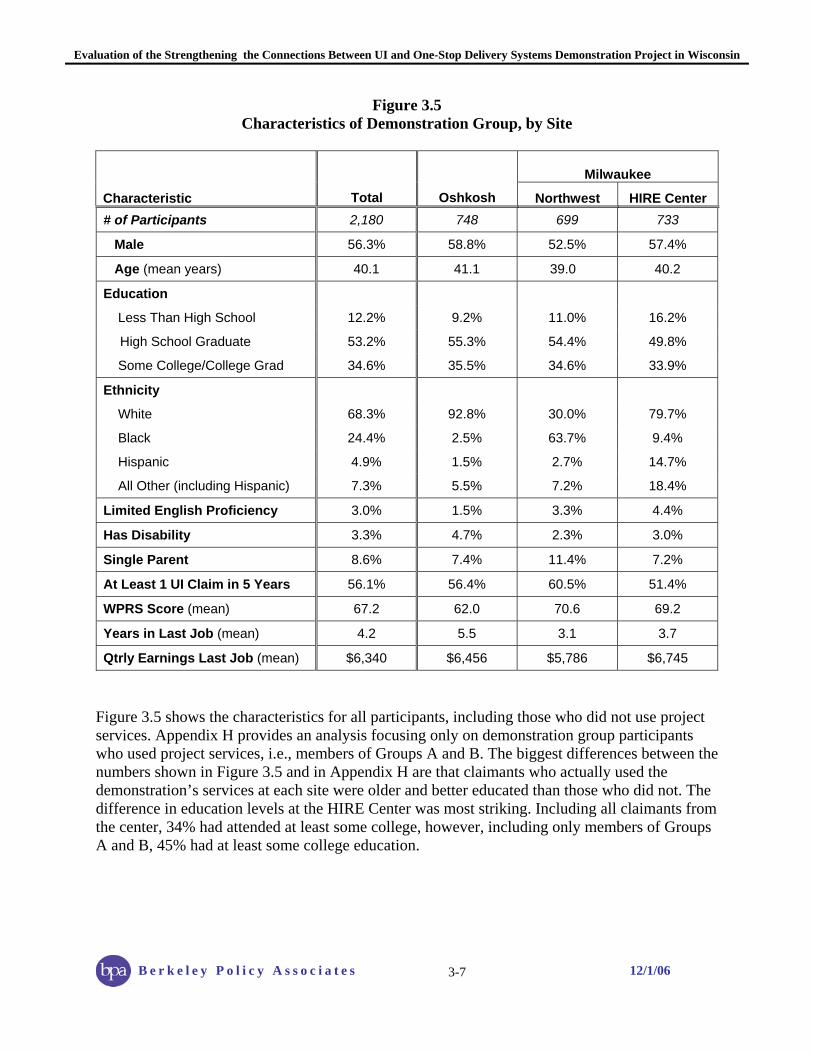
Evaluation of the Strengthening the Connections Between UI and One-Stop Delivery Systems Demonstration Project in Wisconsin
B e r k e l e y P o l i c y A s s o c i a t e s 12/1/06
3-7
Figure 3.5 Characteristics of Demonstration Group, by Site
Milwaukee
Characteristic Total Oshkosh Northwest HIRE Center # of Participants 2,180 748 699 733
Male 56.3% 58.8% 52.5% 57.4%
Age (mean years) 40.1 41.1 39.0 40.2
Education
Less Than High School 12.2% 9.2% 11.0% 16.2%
High School Graduate 53.2% 55.3% 54.4% 49.8%
Some College/College Grad 34.6% 35.5% 34.6% 33.9%
Ethnicity
White 68.3% 92.8% 30.0% 79.7%
Black 24.4% 2.5% 63.7% 9.4%
Hispanic 4.9% 1.5% 2.7% 14.7%
All Other (including Hispanic) 7.3% 5.5% 7.2% 18.4%
Limited English Proficiency 3.0% 1.5% 3.3% 4.4%
Has Disability 3.3% 4.7% 2.3% 3.0%
Single Parent 8.6% 7.4% 11.4% 7.2%
At Least 1 UI Claim in 5 Years 56.1% 56.4% 60.5% 51.4%
WPRS Score (mean) 67.2 62.0 70.6 69.2
Years in Last Job (mean) 4.2 5.5 3.1 3.7
Qtrly Earnings Last Job (mean) $6,340 $6,456 $5,786 $6,745
Figure 3.5 shows the characteristics for all participants, including those who did not use project services. Appendix H provides an analysis focusing only on demonstration group participants who used project services, i.e., members of Groups A and B. The biggest differences between the numbers shown in Figure 3.5 and in Appendix H are that claimants who actually used the demonstration’s services at each site were older and better educated than those who did not. The difference in education levels at the HIRE Center was most striking. Including all claimants from the center, 34% had attended at least some college, however, including only members of Groups A and B, 45% had at least some college education.

Evaluation of the Strengthening the Connections Between UI and One-Stop Delivery Systems Demonstration Project in Wisconsin
B e r k e l e y P o l i c y A s s o c i a t e s 12/1/06
3-8
Characteristics of the Comparison Group The data available to the evaluation on the 4,193 members of the comparison group are less detailed than those provided for the demonstration participants. As described in Chapter 1, the UI claimant database was the source of information about all comparison group members except those who used Job Center services, either on their own or through WPRS at the comparison sites. Thus, information is not available on the disposition of comparison group members who did not attend WPRS as required, or for data items included in ACCESS but not in the UI claimant files, including whether the individual was a single parent, had limited English skills, or had a disability. These characteristics are omitted from the discussion below. Overall, demographic characteristics of the typical comparison group claimant were similar to the average demonstration group claimant. The average comparison group member was a 40-year-old white male with a high school diploma. He worked at his last job for just over four years, had at least one previous UI claim in the last five years, and a 64% expected likelihood of exhausting his UI benefits. A total of 1,660 claimants appeared in the profiling pool for the Menasha Job Center, the Fox Valley comparison site, during the study period, July 2003 through December 2005. The profiling pools for the Milwaukee comparison sites included 1,221 claimants for the Teutonia Job Center and 1,312 claimants for Job Center South. Appendix I presents the characteristics of the comparison group, by site.4 Like claimants at Job Center Northwest, the demonstration site also on the north side of Milwaukee, claimants at the Teutonia Job Center were predominantly black, and more likely to be female than claimants at the other comparison sites. Compared to Menasha and Job Center South claimants, Teutonia claimants had a higher WPRS score (67), and higher proportions with one or more previous UI claims (60%) and a shorter previous job tenure (3.5 years). The more interesting comparison is between claimants from the demonstration vs. the comparison sites. The next section describes these findings, organized in terms of the evaluation’s three analysis models. Characteristics of Demonstration vs. Comparison Groups To assess the impact of the demonstration on participant employment outcomes, we compared their outcomes with those of the comparison group using three models:
• Model 1 used all 2,180 of the claimants in the demonstration sites’ profiling pools during the study period, including those who: entered employment before the date of the orientation; received employment services from another program; or failed to respond to
4 Appendix I also compares the characteristics of the demonstration group by site with those of the comparison group by site. Please note, however, that the process of matching demonstration and comparison group members did not restrict matches to the designated comparison site for each demonstration site.

Evaluation of the Strengthening the Connections Between UI and One-Stop Delivery Systems Demonstration Project in Wisconsin
B e r k e l e y P o l i c y A s s o c i a t e s 12/1/06
3-9
contacts from project staff. The corresponding comparison group numbered 4,193 members. This model takes into account the potential impact that the letters and telephone calls from the project might have on claimants in the profiling pool who did not actively participate in demonstration services.
• Model 2 used only claimants in the study’s profiling pools who had WPRS scores of 47 or higher. Because Wisconsin does not set a profiling score above which all UI claimants must receive RES, the evaluation team chose this cutoff based on the lowest WPRS score of comparison group members who attended a Job Center orientation (most likely those required to attend RES). The 1,824 members of the demonstration group with WPRS scores of 47 or higher, and their matched comparison group of 3,333 individuals, represented claimants most in need of reemployment services.
• Model 3 narrowed the demonstration and comparison groups further. The demonstration group included only those claimants who actually received services from the project, the 1,175 members of Groups A and B. Their comparison group consisted of the 1,290 claimants at the comparison sites who attended a Job Center orientation. While comparison group members may have attended an orientation independently, without being required to do so by the WPRS program, we anticipate that most of those who attended an orientation did so because of the WPRS requirement. This model provides an approximate comparison between individuals who received RES under the existing model of services (the comparison group) and those who participated in the demonstration.
For all three models, the evaluation team chose up to three comparison group members for each demonstration participant from the profiling pools for the comparison sites. Comparison group members were matched to demonstration participants using a propensity score calculated using personal and work history characteristics shown in previous research to be related to employment outcomes.5 This section presents the characteristics of the demonstration vs. comparison groups for each of the three analysis models. The results are summarized in Figure 3.6. Across all three models, demonstration participants were significantly more likely to be male and members of an ethnic minority than were comparison group members. Other differences in characteristics varied by the analysis model we used. For example, the average WPRS score of the demonstration group for Model 1 was significantly higher than that of the comparison group. For Model 2, a significantly larger proportion of the demonstration group than the comparison claimants had experienced at least one previous spell of unemployment in the past five years. In the smaller sample used for Model 3, the comparison group was significantly older than the demonstration group and had spent a longer time working for their last employer than the demonstration participants. In
5 See Appendix B for a description of creation of the propensity score. Comparison group members had to have propensity scores within a pre-established range of a participant’s score to be considered a match. For some participants, fewer than three comparison group members had scores that fell within the appropriate range. As a result, the number of comparison group members used in each model is not three times the number of participants.

Evaluation of the Strengthening the Connections Between UI and One-Stop Delivery Systems Demonstration Project in Wisconsin
B e r k e l e y P o l i c y A s s o c i a t e s 12/1/06
3-10
addition, the average WPRS score of comparison group members (77%) was significantly higher than the average score for the demonstration group (67%).
Figure 3.6 Characteristics of Demonstration vs. Comparison Groups,
By Analysis Model
MODEL 1 All Sample Members
MODEL 2 WPRS 47 or Higher
MODEL 3 Used RES
Characteristic Demo Comp Demo Comp Demo Comp # of Participants 2,180 4,193 1,824 3,333 1,175 1,290
Male 56.3% 52.1%** 54.4% 50.9%* 54.0% 47.7%**
Age (mean years) 40.1 40.1 40.5 40.7 41.8 43.3**
Education
Less Than High School 12.2% 11.4% 13.3% 13.0% 12.2% 14.6%
High School Graduate 53.2% 48.7%** 50.5% 44.9%** 46.4% 46.7%
Some College/College Grad 34.6% 40.0%** 36.2% 42.1%** 41.4% 38.7%
Ethnicity
White 68.3% 74.0%** 66.7% 74.0%** 69.3% 80.4%**
Black 24.4% 20.5%** 25.8% 20.6%** 25.0% 14.8%**
Other 7.3% 5.5%** 7.5% 5.5%** 5.7% 4.8%
Limited English Proficiencya 3.0% 3.1% 3.2% 3.5% 2.9% 4.2%
Has Disabilitya 3.3% 3.6% 3.3% 3.5% 3.7% 5.1%
Single Parenta 8.6% 10.9%** 8.7% 11.0% 7.5% 13.8%** At Least 1 UI Claim in 5 Years 56.0% 54.3% 55.0% 51.5%** 54.3% 50.0%*
WPRS Score (mean) 67.2 64.4** 72.3 72.9 66.6 76.7**
Years in Last Job (mean) 4.2 4.1 4.6 4.7 4.5 5.7** Qtrly Earnings Last Job (mean) $6,340 $6,620 $6,353 $6,874** $6,459 $6,956 a Limited English proficiency, disability status, single parent data were only available from ASSET, therefore were missing for comparison group members unless they used Job Center services. For this reason, only the Model 3 sample had sufficient data to compute the statistical significance of differences between demonstration and comparison groups. ** Difference is statistically significant at the .01 level * Difference is statistically significant at the .05 level

Evaluation of the Strengthening the Connections Between UI and One-Stop Delivery Systems Demonstration Project in Wisconsin
B e r k e l e y P o l i c y A s s o c i a t e s 12/1/06
3-11
The magnitude of the difference between demonstration and comparison claimants in many of the characteristics shown in Figure 3.6 was larger for Model 3 (those who used RES services) than for the other two models. The reason for this is that demonstration and comparison group members “self-selected” themselves into these subsamples. The decision process was likely to be different for those in the demonstration group than for those in the comparison group, which would produce underlying differences in the composition of the two groups. The propensity score matching algorithm could not eliminate all these differences, especially if they were unmeasured. This must be considered in interpreting the impacts from these three models.
Service Use The information on service use for the study sample was extracted from the Job Service’s ASSET data system. ASSET provided data on a number of types of services, including:
• Initial assessment;
• Customer-specific labor market information (LMI);
• Self-service/information;
• A range of testing services;6
• Job referral;
• Job development;
• Job search services;
• One-on-one services;
• Workshops;
• Referral to WIA Adult and Dislocated Worker programs;
• Enrollment in WIA training;
• WIA supportive services;
• Skills training;
• Referral to non-WIA Job Center partner;
• Enrollment in partner agency services;
• Referral to non-WIA support services;
• Employment plan review; and
• Follow-up services.
6 ASSET provided data on the following types of testing: BEAT; GATB; interests; SATB; typing; and other. Since the use of these services was very low, we created a new data item that combined all types of testing.
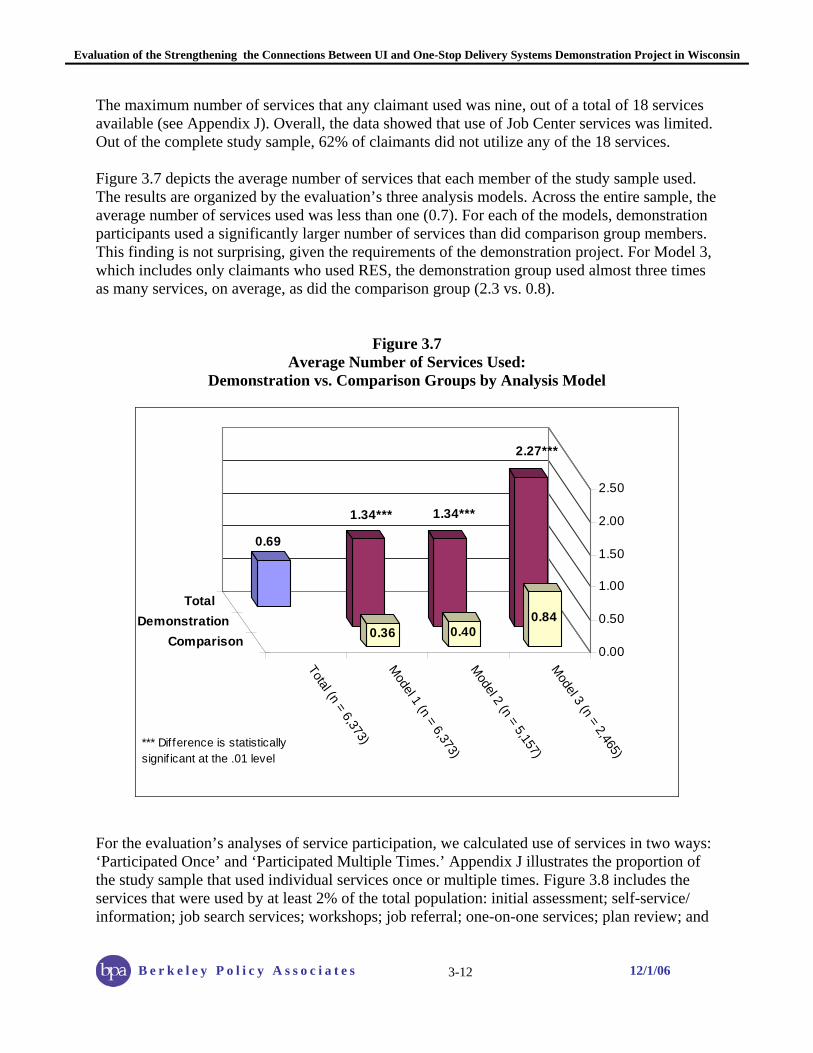
Evaluation of the Strengthening the Connections Between UI and One-Stop Delivery Systems Demonstration Project in Wisconsin
B e r k e l e y P o l i c y A s s o c i a t e s 12/1/06
3-12
The maximum number of services that any claimant used was nine, out of a total of 18 services available (see Appendix J). Overall, the data showed that use of Job Center services was limited. Out of the complete study sample, 62% of claimants did not utilize any of the 18 services. Figure 3.7 depicts the average number of services that each member of the study sample used. The results are organized by the evaluation’s three analysis models. Across the entire sample, the average number of services used was less than one (0.7). For each of the models, demonstration participants used a significantly larger number of services than did comparison group members. This finding is not surprising, given the requirements of the demonstration project. For Model 3, which includes only claimants who used RES, the demonstration group used almost three times as many services, on average, as did the comparison group (2.3 vs. 0.8).
Figure 3.7 Average Number of Services Used:
Demonstration vs. Comparison Groups by Analysis Model
0.69
2.27***
1.34***1.34***
0.840.400.36
0.00
0.50
1.00
1.50
2.00
2.50Total (n = 6,373)
Model 1 (n = 6,373)
Model 2 (n = 5,157)
Model 3 (n = 2,465)
TotalDemonstration
Comparison
*** Difference is statistically signif icant at the .01 level
For the evaluation’s analyses of service participation, we calculated use of services in two ways: ‘Participated Once’ and ‘Participated Multiple Times.’ Appendix J illustrates the proportion of the study sample that used individual services once or multiple times. Figure 3.8 includes the services that were used by at least 2% of the total population: initial assessment; self-service/ information; job search services; workshops; job referral; one-on-one services; plan review; and

Evaluation of the Strengthening the Connections Between UI and One-Stop Delivery Systems Demonstration Project in Wisconsin
B e r k e l e y P o l i c y A s s o c i a t e s 12/1/06
3-13
follow-up services. All of these services were central to the demonstration’s service model. The demonstration group for Model 3, those who participated in the project’s RES services, most frequently used these eight (as well as the other) services.
Figure 3.8
Use of Selected Services by Demonstration vs. Comparison Groups, by Analysis Model
MODEL 1 All Sample Members
MODEL 2 WPRS 47 or Higher
MODEL 3 Used RES
Service Total Demo Comp Demo Comp Demo Comp
# Participants 6,373 2,180 4,193 1,824 3,333 1,175 1,290
Initial Assessment
Participated once 16.3% 42.8%** 2.5% 43.4%** 2.5% 73.6%** 4.6%
Participated multiple times 2.1% 5.5%** 0.4% 5.5%** 0.4% 9.1%** 0.7%
Self Service/Information
Participated once 6.7% 7.0% 6.6% 7.0% 6.6% 9.0% 9.0%
Participated multiple times 5.9% 5.9% 6.0% 5.9% 5.9% 6.6% 7.8%
Job Search Services
Participated once 3.4% 4.8%** 2.7% 4.4%** 3.0% 7.7%* 5.3%
Participated multiple times 1.1% 1.6%** 0.9% 1.6% 0.9% 2.4% 1.6%
Workshops
Participated once 17.2% 15.3%** 18.2% 15.4%** 21.6% 26.2%** 55.4%
Participated multiple times 4.1% 9.2%** 1.5% 9.3%** 1.7% 16.4%** 4.3%
Job Referral
Participated once 2.9% 6.5%** 1.1% 6.6%** 1.1% 10.9%** 1.3%
Participated multiple times 1.4% 3.4%** 0.4% 3.3%** 0.4% 5.2%** 0.6%
One-on-One Services
Participated once 3.9% 9.9%** 0.9% 9.6%** 0.9% 17.4%** 1.6%
Participated multiple times 17.6% 46.7%** 2.4% 47.0%** 2.5% 80.2%** 4.0%
Employment Plan Reviewa
Participated once 12.1% 35.1%** 0.1% 35.0%** 0.1% 61.9%** 0.1%
Follow-Up Services
Participated once 2.4% 6.8%** 0.0% 7.0%** 0.0% 12.4%** 0.0%
Participated multiple times 0.0% 0.1% 0.0% 0.1% 0.0% 0.2% 0.0% a Participants attended only one Plan Review. ** Difference is statistically significant at the .01 level * Difference is statistically significant at the .05 level

Evaluation of the Strengthening the Connections Between UI and One-Stop Delivery Systems Demonstration Project in Wisconsin
B e r k e l e y P o l i c y A s s o c i a t e s 12/1/06
3-14
With two exceptions, the sample of demonstration participants for each analysis model used these eight services significantly more often than did comparison group members. The first second and most notable exception was workshop services. A larger proportion of comparison group members in all three models participated in workshops ‘once’ than did the demonstration group. In fact, members of the comparison group for Model 3 were twice as likely to have attended one workshop than were members of the demonstration group. On the other hand, demonstration participants were much more likely than the comparison group to have participated ‘multiple times’ in workshops. The second exception was self service/information. Across the three analysis models, the comparison group was equally or more likely to use self-service/information than demonstration group members were. Furthermore, Model 3 comparison group members were more likely than demonstration participants to use this service multiple times. None of these differences between groups was significant. The disparity in service use between demonstration and comparison groups was especially evident for one-on-one services, initial assessment, plan review, and follow-up services. These services were specific to the demonstration project, however, and were not always offered at comparison sites. In contrast, the differences in service use between demonstration and comparison participants were not as wide for job search services and several other types of services that were used less frequently (and shown in Appendix J). Among the services that the study sample used less frequently, larger proportions of the comparison group than demonstration group used customer-specific LMI, referral to WIA programs, referral to non-WIA support services, and skilled training. Interestingly enough, almost equal proportions of demonstration participants for Models 1 and 2 used most types of services. In fact, the Model 2 sample comprises over 80% of the Model 1 sample, which most likely explains the similar results of the two sample groups. Finally, for all services except one-on-one services, members of the study sample were not apt to use a service multiple times. The demonstration group did participate multiple times in one-on-one services, however, and one-on-one assistance was the most frequently used service among those for which data were available. It is possible that some claimants who used a service once obtained employment quickly and therefore did not need to utilize that service a second time, while those who used services repeatedly may have done so because they had not yet found work.
Impacts on Employment, Earnings, and UI Benefit Receipt As described in Chapter 1, the evaluation team used a quasi-experimental design to analyze the demonstration project’s impact on employment and UI benefit outcomes. For its counterfactual, the analysis relied on data on UI claimants who lived in ZIP codes adjacent to those where the

Evaluation of the Strengthening the Connections Between UI and One-Stop Delivery Systems Demonstration Project in Wisconsin
B e r k e l e y P o l i c y A s s o c i a t e s 12/1/06
3-15
demonstration was implemented. We matched demonstration group claimants with up to three claimants from the comparison sites using an algorithm that linked individuals based on their propensity to return to work, as predicted by their profiling scores, their prior employment history, and other individual background characteristics. Propensity score analysis is an effective way to create a comparison group because sample members are matched on personal characteristics that are most strongly predictive of a particular outcome or set of outcomes. While sample members in adjacent ZIP codes may be different from one another in many ways, the matching procedure selected comparison group members who shared with demonstration participants the personal characteristics known to influence the employment outcomes central to the evaluation. The evaluation used three key employment outcomes in examining the impact of demonstration services. First, we assessed the rate at which the study sample went back to work after receiving UI benefits, as documented by the presence of earnings in the UI wage record database. We also used a variation on this measure, the rate at which claimants returned to work within the first quarter after their UI claim, to explore whether the project’s services assisted participants in returning to work more quickly than they would have otherwise. Second, we examined the average quarterly earnings of those who did return to work. This measure served as a very rough proxy for either the number of hours that claimants work in their new jobs, or their wages. Since our measure for entering employment was dependent upon whether claimants worked during the calendar quarter ending March 31, 2006, average quarterly earnings also captured employment that members of the study sample may have entered and left during the course of the study period. The third type of outcome measure used in this evaluation was benefit duration and its corollary, UI benefits drawn. Because total benefits, weekly benefit amount, and maximum number of weeks can all vary, we also created a measure, percent of maximum benefits drawn, which standardizes across such variables. This section discusses the impact of the Wisconsin Demonstration project on each of these outcomes. As mentioned earlier in this chapter, the evaluation used three analysis models in assessing the demonstration’s impact. Each of the three analyses examined outcomes using a regression-adjusted method that included the following variables: had a disability; limited English proficiency; single parent; and number of previous UI claims. Figure 3.9 summarizes the demonstration’s impacts on employment, earnings, and benefit receipt for each of the study’s analysis models. The figure compares these outcomes for the demonstration and comparison groups, and presents our best estimates of the impacts associated with the demonstration across these three comparisons. For the first two analysis models, the table tells a compelling story with modest but statistically significant demonstration impacts on I claimants’ earnings and benefit receipt. For the third model, which looks exclusively at those who received project services, impacts are smaller and generally not statistically significant.

Evaluation of the Strengthening the Connections Between UI and One-Stop Delivery Systems Demonstration Project in Wisconsin
B e r k e l e y P o l i c y A s s o c i a t e s 12/1/06
3-16
Figure 3.9 Impact of the Wisconsin Demonstration Program on
Participant Employment Outcomes: Models Matching on the BPA-Calculated Propensity Score
Model 1
All Sample Members Model 2
WPRS Scores of 47% or Higher Model 3
Used RES
Program Outcomes Demo Comp Difference Demo Comp Difference Demo Comp Difference
Sample Size 2,180 4,193 -- 1,824 3,333 -- 1,175 1,290 --
Entered Employment a 77.0% 78.0% -0.9% 77% 77.0% 0.3% 75.0% 75.0% -0.4%
Entered Employed 1st Quarter After New Claim a
54.0% 53.0% 1.3% 54.0% 52.0% 2.3% 44.0% 43.0% 1.2%
Average Quarterly Earnings a $3,020 $2,892 $129** $3,107 $2,912 $194 $2,370 $2,400 -$31
Average Benefit Duration (weeks) 14.7 15.2 -0.6* 14.8 15.7 -0.9** 17.8 18.4 -0.6
Percent of Maximum Benefits Drawn 64.0% 66.0% -2.2%* 64.0% 67.0% -3.4%** 76.0% 78.0% -1.3%
Average UI Benefits Drawn b $3,638 $3,785 -$147* $3,690 $3,923 -$233** $4,588 $4,743 -$155
a Employment outcomes through March 2006 b Benefit drawdown through June 2006
**.01 significance level * .05 significance level
Impact of the Demonstration on Employment The first two rows of Figure 3.9 present the results of our analysis of the project’s impact on employment rates. Claimants in the demonstration and comparison groups had very similar rates of entering employment; about three-quarters of each group for each analysis model found employment during the study period.7 Thus, the Wisconsin Demonstration’s impacts on this outcome measure were neither large nor statistically significant. While the project may have accelerated reemployment for participants who went back to work during the first quarter after filing their claims, the UI wage records do not include dates of employment which would allow us to more accurately measure such an impact. This finding was similar to those cited by
7 Appendix K presents the results of an analysis of the demonstration’s impact on whether claimants entered or maintained employment over time. Since the data provided to the evaluation by UI did not include date of employment, we assessed whether claimants were employed during each quarter after their UI claim date. This analysis showed that demonstration participants were slightly more likely to be employed during their first and second quarters post-claim, but were less likely to be employed during Quarters 3 – 6.

Evaluation of the Strengthening the Connections Between UI and One-Stop Delivery Systems Demonstration Project in Wisconsin
B e r k e l e y P o l i c y A s s o c i a t e s 12/1/06
3-17
O’Leary (2006)8 in a recent article discussing a range of studies of different reemployment strategies. The research cited in O’Leary’s article similarly found that RES did not have significant impacts on UI claimants entering employment. Despite the similarity of the evaluation’s findings to previous research on reemployment services, the consistency of the rate at which claimants entered employment across the three models is worth noting. Because of the structure of the analysis models, one might expect the employment rate for both project and comparison groups to be higher for Model 1, which includes participants who found jobs before they were contacted about the demonstration project, than for Model 2, which was defined to specifically target claimants who were most in need of services as measured by their WPRS scores. Similarly, one might expect employment rates for Model 2 claimants to be higher than the Model 3 sample, because Model 3 includes only claimants who were unemployed long enough to require and receive services. Several explanations could account for these results. The differences in employment barriers between claimants in these groups might have been too small to measure over a relatively long follow-up period, or the WPRS score might not be a fine enough measure to capture substantial differences between claimants.9 The table’s second row describes the rate at which the study sample entered employment in the first quarter after their initial claims. Across all three analysis models, slightly larger proportions of demonstration participants were employed during the first quarter than were members of the comparison group. The differences between groups were not statistically significant, however. Just over half of the samples for Model 1 and 2 (52-54%) found a job during the first quarter after they filed for UI benefits. The proportions of the Model 3 demonstration and comparison groups who entered employment during their first few months of benefits were lower (43%-44%). Impact of the Demonstration on Earnings Figure 3.9 also displays the average quarterly earnings during the follow-up period for demonstration and comparison groups by each analysis model. For comparison group members, earnings varied from a low of $2,400 for those in the Model 3 sample, to a high of $2,912 for claimants in the Model 2 sample. The range of average quarterly earnings across models for the demonstration group was somewhat larger, from $2,370 for Model 3 participants, to $3,207 for Model 2 participants. The differences in average quarterly earnings for demonstration participants versus comparison group members for both Models 1 and 2 were statistically significant, however. Participation in the demonstration increased earnings for the demonstration group in the Model 1 sample by $129
8 O’Leary, Christopher J. “State UI Job Search Rules and Reemployment Services,” Monthly Labor Review, June 2006. 9 For example, Figure 3.6 shows that the demonstration and comparison groups used in analysis Model 3 had significantly different WPRS scores; the average score for the demonstration group was 67%, compared to 77% for the demonstration group (significant at the .01 level). Nonetheless, 75% of both groups had entered employment by the end of the study period.
Evaluation of the Strengthening the Connections Between UI and One-Stop Delivery Systems Demonstration Project in Wisconsin
B e r k e l e y P o l i c y A s s o c i a t e s 12/1/06
3-18
over the comparison group and by $194 for participants included in the Model 2 sample. In contrast, the average quarterly earnings of both the demonstration and comparison groups in the Model 3 sample were about $700 less than those of the other two models, and the difference between the demonstration and comparison groups was only $31 and not statistically significant. This finding may result from the high opportunity cost of the demonstration group’s participation in project activities not being offset by higher earnings, or it could signal a problem with the quality of the comparison group match in this model.10 Nonetheless, overall the demonstration group earned roughly $135,000 more than the comparison group over the project’s 15-month period of operations. The earnings impact shown for Model 2 represented 7% of the comparison group’s average quarterly earnings, which compares favorably to the outcomes of more ambitious employment interventions, such as those measured in the National JTPA study (Orr, et al., 1996, Bloom, et al., 1997). The earnings impacts for Models 1 and 2 were smaller in magnitude than impacts of job search assistance in the UI system reported by Black, et al. (2003).11 Unfortunately, the quarterly nature of the UI earnings data and the lack of data on hours worked do not allow these impacts to be broken down into separate impacts on the various components of earnings, such as the weeks worked, weekly hours worked, and wage rates. These earnings impacts might represent an increase in the wage rate (which would suggest a human capital benefit from services received), but could also mean that demonstration group members were more successful at finding full-time work (which could signal the influence of targeted job placement services). For example, quarterly earnings of $2,500 could represent full time work at minimum wage, or 125 hours at $20 per hour. These wages could have been earned in the first month of the quarter, with the claimant unemployed the rest of the quarter, or vice versa. A later section of this chapter extends this analysis by exploring the relationships between service receipt and employment outcomes.12
10 It is possible that comparison group members who received services were, on average, more motivated than project group members, given the lack of incentives and encouragement received by the comparison group relative to the demonstration group. Although the matching algorithm addresses these underlying differences to the extent that they are reflected in measurable characteristics, it is possible that remaining uncontrolled differences in underlying motivation can cause the impact estimates for this model to be biased downward. 11 Orr, L.L., H.S. Bloom, S.H. Bell, F. Doolittle, W. Lin. Does Job Training for the Disadvantaged Work? Evidence from the National JTPA Study. Washington, DC: U.S. Department of Labor, 1996. Bloom, Howard S., Larry L. Orr, Stephen H. Bell, George Cave, Fred Doolittle, Winston Lin, and Johannes M. Bos. “The Benefits and Costs of JTPA Title II-A Programs,” The Journal of Human Resources. The University of Wisconsin Press, Madison, Wisconsin, 1997. Black, Dan, Jeffrey Smith, Mark Berger, and Brett Noel. “Is the Threat of Reemployment Services More Effective than the Services Themselves? Evidence from Random Assignment in the UI System,” cited in O’Leary 2006. Black, et al. found an annual earnings impact of $1,054 in the benefit year. The annualized value of the earnings impacts in our study was $516 for Model 1 and $776 for Model 2. 12 Another way to continue to study these earnings impacts and better understand how they came about is to continue to follow the sample members over time. Impacts on human capital (wage rates) are more likely to be sustained in the long run than impacts on employment reentry or weekly hours worked.

Evaluation of the Strengthening the Connections Between UI and One-Stop Delivery Systems Demonstration Project in Wisconsin
B e r k e l e y P o l i c y A s s o c i a t e s 12/1/06
3-19
Impact of the Demonstration on UI Benefits The bottom half of Figure 3.9 explores the demonstration’s impacts on the receipt of UI benefits. In addition to the duration of UI benefits, the evaluation also examined the total amount of UI benefits drawn down, and the proportion of maximum benefits drawn. On average, comparison group members for analysis Models 1 and 2 received unemployment insurance benefits for approximately 15 weeks (15.3 and 15.7 weeks, respectively). The demonstration groups for these models had significantly shorter durations of UI benefits than did the comparison groups, by almost a week for the Model 2 sample and by 0.6 weeks for the Model 1 sample. The reduction in benefits for Models 1 and 2 represented between 5%-6% of the comparison groups’ average duration. Demonstration claimants in the Model 3 sample showed a comparable reduction in benefit duration of 0.6 weeks, although this reduction was somewhat smaller in relative terms given the longer average duration of benefit receipt (18 weeks) among these claimants. This reduction in the number of benefit weeks is comparable to several of the studies reported in O’Leary which found benefit duration impacts ranging from half a week or less, up to two to three weeks (O’Leary, 2006, pp. 33-35). The demonstration project also reduced the proportion of each claimant’s maximum UI benefits paid. On average, comparison group members for Models 1 and 2 had used about two-thirds of their benefits at the end of the study’s data collection period. The demonstration group drew slightly smaller, but statistically significant, proportions of their total available benefits than did the comparison group: 2.2% less for Model 1, and 3.4% for Model 2. The sample for Model 3 had received a much higher percentage (78%) of their maximum benefits. The demonstration group for Model 3 had drawn 1.3% less of their total available benefits at the end of the data collection period than did the comparison group; however, this difference was not statistically significant. The reduction in benefit duration among the demonstration groups for each of the analysis models directly translated into a similar significant reduction in the average total payout of UI benefits. As Figure 3.9 illustrates, demonstration participants received $233 less than comparison group members for Model 2 (representing 6% of the comparison group’s average total benefits received), and $147 less (4%) for Model 1. The Model 3 demonstration group also received $155 less in UI benefits than the comparison group, however this impact was not statistically significant. With the exception of Model 3, the order of magnitude of these impacts was similar to the increases in earnings reported above. In total, the demonstration saved Wisconsin’s UI trust fund roughly $385,000 over the project’s 15-month period. In conclusion, the demonstration project had modest, but statistically significant, impacts on participant earnings and receipt of UI benefits, increasing the former and reducing the latter. Impacts ranged from 3.5% to 7% of the comparison group’s average outcomes. These outcomes compare favorably to the impacts of more ambitious employment training interventions. They are also consistent with other research on reemployment services provided to dislocated workers. Longer-term follow-up might allow researchers to better distinguish the short-term incentive and job placement impacts of the demonstration project from its longer-term human capital benefits.

Evaluation of the Strengthening the Connections Between UI and One-Stop Delivery Systems Demonstration Project in Wisconsin
B e r k e l e y P o l i c y A s s o c i a t e s 12/1/06
3-20
Relationships Between Services and Outcomes The relationships between participants’ use of specific services and their employment and UI benefit outcomes can reflect causal links in two directions. On the one hand, claimants who receive effective services may reenter employment more quickly than they would have otherwise, while on the other hand, those who have trouble finding a job may use more services. The result is that the apparent relationships between service receipt and outcomes can be ambiguous. This section examines how different levels of service use are correlated with entering employment and UI benefit duration. We examine these relationships separately for the demonstration group and the comparison group. Relationships Between Services and Entering Employment The evaluation team calculated Phi statistics to measure the strength of the relationship between claimants’ use of demonstration services and entering employment. While the Phi statistic does not explain causality, it provides an idea of the strength of the association between an input (e.g., use of a type of service) and outcome (e.g., entering employment) by testing if the association is significantly different from zero. In particular, the analysis examined the strength of the association between 1) participating once or participating more than once in a range of job services and 2) the rate that claimants entered employment. Figure 3.10 shows positive and statistically significant associations between entering employment and the use of three services—job referral, one-on-one services, and follow-up services. These positive associations were found only for participants who used each of these services once (as opposed to multiple times). The associations were stronger for claimants in the demonstration group than for those in the comparison group, which suggests that the Wisconsin Demonstration’s services were valuable in returning demonstration participants to work. On the other hand, the analysis revealed significant negative associations between entering employment and participating in the initial assessment for Models 1 and 2. For all three models, participating in the plan review and using one-on-one services multiple times was negatively associated with finding a job; these relationships were statistically significant. Members of the demonstration group who had found a job before being contacted regarding RES were exempt from participating in the program. Thus, those who attended the orientation and assessment meeting had not found work and the association is essentially showing the negative impact on project participation of obtaining a job quickly, rather than vice-versa. Similarly, demonstration participants who entered employment before the date of their employment plan review were exempt from attending the meeting, and repeated use of one-on-one services may be an indicator that a claimant was having difficulty finding a job.

Evaluation of the Strengthening the Connections Between UI and One-Stop Delivery Systems Demonstration Project in Wisconsin
B e r k e l e y P o l i c y A s s o c i a t e s 12/1/06
3-21
Figure 3.10 Phi Correlations between Job Services and Entering Employment
Model 1 All Sample
Model 2 WPRS 47% or higher
Model 3 Used RES Services
Service Demo Comp Demo Comp Demo Comp # Participants 2,180 4,193 1,824 3,333 1,175 1,290 Entered Employment 77.0% 78.0% 77.0% 77.0% 75.0% 75.0% Initial Assessment Participated once -.04* -.01 -.05* -.01 .00 .02 Participated multiple times -.02 -.03 -.01 -.03 .01 -.02 Self Service/Information Participated once .03 -.04* .03 -.05** .04 -.04 Participated multiple times .02 .00 .02 .00 -.01 .00 Job Search Services Participated once .01 -.00 .01 -.01 .04 .02 Participated multiple times .02 .01 .01 .01 .03 .05 Workshops Participated once -.05* -.05** -.02 -.06** -.02 -.04 Participated multiple times -.00 .01 .00 .02 .03 .04
Job Referral
Participated once .04* .03 .05* .02 .07* .00 Participated multiple times .02 .02 .02 .01 .03 .00 One-on-One Services Participated once .05* .02 .06* .02 .09** .04 Participated multiple times -.11** -.03* -.11** -.03 -.09** -.00 Enrollment in WIA Training Participated once .01 -.05** .03 -.05** .04 -.06* Participated multiple times .01 .01 .01 .01 .02 .01 Employment Plan Review^ Participated once -.10** -.05** -.10** -.06** -.09** -.05 Follow-Up Services Participated once .06** -.03 .07** -- .10** -- Participated multiple times .02 -- .01 -- .02 --
^ Participants only attended one Plan Review. All phi correlations range from –1 to 1. ** Difference is statistically significant at the .01 level * Difference is statistically significant at the .05 level -- Represents instances where no one received that particular service.

Evaluation of the Strengthening the Connections Between UI and One-Stop Delivery Systems Demonstration Project in Wisconsin
B e r k e l e y P o l i c y A s s o c i a t e s 12/1/06
3-22
While the Phi statistic can give an idea of the strength of association between two factors, it also can be interpreted in the same manner as the Pearson’s r correlation coefficient by using the square of the coefficient. The squared values of the Phi statistic fall between zero and one and can be interpreted as the proportion of variance in one variable that can be explained by the other variable. A high Phi-squared (close to one) is an indication of strong predictive power by one variable to explain another variable. If Phi-squares were calculated from the Phi values in Figure 3.10, the highest Phi-squared value, 0.01 (.112), would be between multiple participation in one-on-one services and the proportion of demonstration participants from Models 1 and 2 entering employment. In summary, while some of the associations shown in the figure are statistically significant, their predictive power is fairly low. Relationships Between Services and Benefit Duration The evaluation team calculated Pearson’s r-statistics to measure the correlation between participation in services and benefit duration. As shown in Figure 3.11, this resulted in a large number of statistically significant associations, most of which were unfavorable: participation was associated with longer benefit durations, for both the demonstration and comparison groups. The consistency and magnitude of these associations strongly suggest that the results are mostly mechanical in nature. That is, those individuals who were most in need of services were likely to both draw benefits for long period and to use services, and, compared to claimants who found work relatively quickly, with longer duration of benefits claimants were more likely to have the opportunity to avail themselves of program services or be required by program rules to use these services multiple times. The exceptions to this pattern were found among members of the Model 3 sample. All of the members of this group used RES services, and for the demonstration claimants in this group participating once in the initial assessment and one-on-one services made a small but significant reduction in benefit duration. Relationships Between Services and Quarterly Earnings We also calculated Pearson’s r-statistics to explore the relationships between participation in specific services and the average quarterly earnings of the study sample. Like the results for our analysis of the impact of services on benefit duration, a number of the correlations between services and quarterly earnings were statistically significant but negative, particularly for the Model 1 and 2 samples (see Figure 3.12). One exception to this pattern was the use of WIA supportive services multiple times by the Model 2 claimants; quarterly earnings for the demonstration group were slightly but significantly higher than those of the comparison group. For the Model 3 group, two services had small but statistically significant impacts on earnings. Model 3 demonstration claimants who used job referral and follow-up services once had significantly higher earnings than did the comparison group.

Evaluation of the Strengthening the Connections Between UI and One-Stop Delivery Systems Demonstration Project in Wisconsin
B e r k e l e y P o l i c y A s s o c i a t e s 12/1/06
3-23
Figure 3.11 Pearson’s r Correlations between Job Services and Benefit Duration
Model 1 All Sample Members
Model 2 WPRS 47% or Higher
Model 3 Used RES Services
Service Demo Comp Demo Comp Demo Comp # Participants 2,151 4,193 1,824 3,333 1,175 1,290 Average Benefit Duration (wks) 14.7 15.2 14.8 15.7 17.8 18.4 Initial Assessment Participated once .25** .09** .26** .09** -.08** .06* Participated multiple times .17** .02 .16** .02 .12** .02 Self Service/Information Participated once .06** .04** .05 .05** .00 -.02 Participated multiple times .06** .05** .06** .06** .05 .04 Job Search Services Participated once .12** .03* .11** .04* .08** -.06* Participated multiple times .08** .03* .08** .04* .06* .02 Workshops Participated once .17** .22** .16** .26** .05 .16** Participated multiple times .16** .07** .17** .08** .09** .07* Job Referral Participated once .11** .00 .11** -.00 .05 -.02 Participated multiple times .06** -.01 .06** -.01 .03 -.04 One-on-One Services Participated once .03 .01 .03 .02 -.14** .00 Participated multiple times .38** .08** .37** .09** .13** .07** Enrollment in WIA Training Participated once .07** .05** .06* .06** .02 .06* Participated multiple times .09** .06** .08** .06** .07** .05 WIA Supportive Services Participated once .05* .04** .05* .05** .02 .04 Participated multiple times .09** .03* .08** .04* .08** .03 Employment Plan Review^ Participated once .32** .03* .32** .03 .14** .03 Follow-Up Services Participated once .07** .01 .08** -- -.03 -- Participated multiple times -.02 -- -.04 -- -.04 --
^ Participants only attended one Plan Review. All r correlations range from –1 to 1. ** Difference is statistically significant at the .01 level * Difference is statistically significant at the .05 level -- Represents instances where no one received that particular service.

Evaluation of the Strengthening the Connections Between UI and One-Stop Delivery Systems Demonstration Project in Wisconsin
B e r k e l e y P o l i c y A s s o c i a t e s 12/1/06
3-24
Figure 3.12 Pearson’s r Correlations between Job Services and Quarterly Earnings
Model 1 All Sample Members
Model 2 WPRS 47% or Higher
Model 3 Used RES Services
Service Demo Comp Demo Comp Demo Comp # Participants 2,180 4,193 1,824 3,333 1,175 1,290 Average Quarterly Earnings $3,020 $2,892 $3,107 $2,912 $2,370 $2,400 Initial Assessment Participated once -.11** -.01 -.12** -.01 .04 -.01 Participated multiple times -.04 -.02 -.03 -.02 .01 -.03 Self Service/Information Participated once -.09** -.04** -.09** -.04* -.07* -.03 Participated multiple times -.08** -.04** -.08** -.04* -.12** -.06* Job Search Services Participated once -.03 -.01 -.03 -.01 .01 .01 Participated multiple times -.01 -.01 .00 -.01 .02 .01 Workshops Participated once -.10** -.04** -.10** -.05** -.05 -.05 Participated multiple times -.06** -.01 -.05* -.01 -.00 -.01 Job Referral Participated once .01 -.00 .01 -.00 .07** -.00 Participated multiple times -.01 -.00 -.00 -.00 .03 .00 One-on-One Services Participated once -.03 -.00 -.02 -.00 .04 -.00 Participated multiple times -.17** -.02 -.16** -.02 -.05 -.04 Enrollment in WIA Training Participated once -.00 -.01 .01 -.01 .01 -.03 Participated multiple times .00 -.00 .00 -.01 .04 -.00 WIA Supportive Services Participated once .01 -.02 .02 -.04* .03 -.02 Participated multiple times .04 .00 .05* .00 .05 .03 Employment Plan Review^ Participated once -.14** -.01 -.14** -.01 -.03 -.01 Follow-Up Services Participated once .01 -.01 .02 -- .09** -- Participated multiple times -.01 -- -.01 -- -.02 --
^ Participants only attended one Plan Review All r correlations range from –1 to 1. ** Difference is statistically significant at the .01 level * Difference is statistically significant at the .05 level -- Represents instances where no one received that particular service.

Evaluation of the Strengthening the Connections Between UI and One-Stop Delivery Systems Demonstration Project in Wisconsin
B e r k e l e y P o l i c y A s s o c i a t e s 12/1/06
3-25
Summary Just over half of the demonstration group used Wisconsin Demonstration services, and the evaluation found significant differences in personal characteristics between those who did and did not use project services. Some of these differences may be the result of claimants in the demonstration sites’ profiling pools having a choice about whether or not to participate in the project (assuming they were willing to forego UI benefits). The evaluation team also explored the variations in personal characteristics between the demonstration’s Groups A and B and found that these two groups had a larger number of, and more pronounced, differences than did members of the demonstration group who used services and those who did not. While the participant data provided by DWS indicated that Group B had more barriers to employment than did Group A, the barriers were not reflected in the average WPRS scores for each group; the score showed Group A with a higher expected likelihood of exhausting their UI benefits than Group B. This finding suggests that the WPRS and the assessments done by demonstration staff measured different factors. Only 38% of the study sample used any Job Center services during the study period. Of the 18 services for which the evaluation received data, only eight were used by 2% or more of the study sample. These included: initial assessment; self-service/information; job search services; workshops; job referral; one-on-one services; plan review; and follow-up services. A larger proportion of the demonstration group used each service than did comparison group members; the sole exception was that more comparison claimants attended a workshop than did members of the demonstration group. Aside from one-on-one services that were used by demonstration participants multiple times, few claimants used each service more than once. The demonstration group members were also significantly more likely to use multiple types of services than were the comparison group. The evaluation used three analysis models to examine the impact of the demonstration on claimants’ employment outcomes. Model 1 included the entire study sample. The Model 2 sample included only claimants with WPRS scores of 47% or higher. The Model 3 sample was made up of claimants who used RES services at both the demonstration and comparison sites. Since the Model 2 sample significantly overlapped with the Model 1 sample, the characteristics, service use, and outcomes of the two samples were very similar. The study used outcome measures associated with three key employment outcomes: entering employment; duration of UI benefits; and quarterly earnings in new jobs. The evaluation’s measures included: the rate at which the study sample went back to work after receiving UI benefits; the rate at which claimants returned to work within the first quarter after their UI claim; average quarterly earnings of those who did return to work; duration of UI benefits; total amount of UI benefits drawn; and proportion of maximum benefits drawn. Paralleling previous research on RES services, the Wisconsin Demonstration project did not have a significant impact on whether or not participants entered employment. About three-quarters of both demonstration and comparison group members in the study samples for all three

Evaluation of the Strengthening the Connections Between UI and One-Stop Delivery Systems Demonstration Project in Wisconsin
B e r k e l e y P o l i c y A s s o c i a t e s 12/1/06
3-26
analysis models went back to work during the study period. During the first quarter after they first filed their UI claims, 54% of the samples for Model 1 and 2 entered employment, and 44% of the Model 3 sample found jobs. Participation in the demonstration appeared to result in higher average quarterly earnings for the participant group than for the comparison group across all three models. The difference was statistically significant difference for Models 1 and 2. The demonstration increased claimant earnings by $129 for the demonstration group in the Model 1 sample and by $194 for Model 2 participants. These results were also similar to findings from other studies on the impact of RES on post-UI wages. Overall, demonstration participants earned roughly $135,000 more than comparison group members over the project’s 15-month period of operations. The demonstration groups for Models 1 and 2 had significantly shorter durations of UI benefits than did the comparison groups, by almost a week for the Model 2 sample and by 0.6 weeks for the Model 1 sample. The Model 3 demonstration group showed a comparable reduction in benefit duration of 0.6 weeks, although this reduction was somewhat smaller in relative terms given the longer average duration of benefit receipt among the Model 3 sample. The demonstration project also reduced the proportion of each claimant’s maximum UI benefits paid. On average, demonstration group members for Models 1 and 2 drew slightly smaller, but statistically significant, proportions of their total available benefits than did the comparison group. These differences represented 2.2% less for the Model 1 sample and 3.4% less for the Model 2 sample. The reduction in benefit duration directly translated into a similar significant reduction in the average total payout of UI benefits. Demonstration participants received $233 less than comparison group members for Model 2 and $147 less for Model 1. The Model 3 demonstration group also received $155 less in UI benefits than the comparison group, however this impact was not statistically significant. In total, the demonstration saved Wisconsin’s UI trust fund roughly $385,000 over the project’s 15-month period. These modest effects compare favorably with the impacts documented by more ambitious employment training interventions, and are also consistent with other research on services provided to dislocated workers. Examining relationships between specific services used and employment outcomes is complicated by the fact that the strength of a statistical relationship does not identify the direction of causality. For example, the study found negative associations between entering employment and participating in the initial assessment and plan review processes. Since members of the demonstration group who found employment before they were notified about attending the program were exempt from participating, the association essentially showed the negative impact on project participation of obtaining a job quickly, rather than vice-versa. Similarly, those who started work before the date of their employment plan review were exempted from attending the meeting, so the claimants who participated in the review by definition had not yet found a job. Across almost all of the analyses, claimants who used a particular service multiple times had worse outcomes than those who used it only once. Rather than inferring that continued participation in service decreased the success of participants, the more likely explanation is that claimants who did not enter employment continued to use

Evaluation of the Strengthening the Connections Between UI and One-Stop Delivery Systems Demonstration Project in Wisconsin
B e r k e l e y P o l i c y A s s o c i a t e s 12/1/06
3-27
services, probably because they needed them. The analyses examining the impact of services on the other employment outcomes (e.g., benefit duration and quarterly earnings) found similar patterns of negative relationships. On the other hand, the evaluation found positive and statistically significant associations between entering employment and the one-time use of three services—job referral, one-on-one services, and follow-up services—across all three analysis models. The associations were stronger for claimants in the demonstration group than for those in the comparison group, which suggests that the Wisconsin Demonstration services were valuable in returning demonstration participants to work. The Model 3 sample were the only group with positive and statistically significant relationships between participation in services and benefit duration. All of the members of this sample used RES services, and demonstration group members who used assessment and one-on-one services once experienced a shorter duration of UI benefits than did the comparison group. Finally, we examined the relationship between use of services and average quarterly earnings and identified a few services that had positive and statistically significant correlations with earnings. Among the Model 2 sample, demonstration claimants who used WIA supportive services multiple times had slightly higher quarterly earnings than their peers in the comparison group. Among the claimants in the Model 3 sample, who actually used RES, demonstration participants who used job referral and follow-up services once had higher earnings than did the comparison group. Overall, the Wisconsin Demonstration Project appears to have had a modest, but significant, influence on the employment outcomes of participants. In particular, demonstration participants experienced shorter duration of UI benefits and had quarterly earnings that were higher than those for the comparison group. Use of specific services−such as assessment, job referral, one-on-one services, and follow-up−improved claimants’ likelihood of entering employment, decreasing receipt of UI benefits, and increasing quarterly earnings.

Evaluation of the Strengthening the Connections Between UI and One-Stop Delivery Systems Demonstration Project in Wisconsin
B e r k e l e y P o l i c y A s s o c i a t e s 12/1/06
4-1
4. Customer Satisfaction Wisconsin’s DWS designed an online survey for Wisconsin Demonstration participants to complete anonymously at two points in their service process: 1) after attending an RES orientation; and 2) after participating in their employment plan review. Demonstration staff asked claimants to complete the survey in the Job Center resource room. Because the surveys were completed anonymously, the only information available about participant characteristics was the site at which they received services. The customer satisfaction survey included ten questions about the orientation session, seven of which used a ten-point Likert scale for respondents to indicate their satisfaction with the session. Similarly, six of the nine questions to be completed after the plan review used the ten-point scale for rating satisfaction with the project’s services overall (see Figure 4.1). The remaining three questions in each section were open-ended, soliciting comments about respondents’ most positive and negative experiences, and their suggestions for improving the project. Figure 4.2 summarizes the results of the survey’s closed-ended questions for each demonstration site, and across all three sites. Appendix L provides more detailed results of the customer satisfaction survey. This chapter first discusses participant satisfaction with the orientation session, and then describes survey results for project services as a whole.
Satisfaction With RES Orientation A total of 914 demonstration participants completed the survey questions regarding the RES orientation. Overall, a majority of participants rated the experience highly (a score of one, two, or three on the scale of ten, with one being the strongest score). Respondents were most enthusiastic about the friendliness and courtesy of the staff, with 86% rating this aspect of the orientation highly. They were least positive about the self-assessment and employment plan; just over two-thirds (69%) rated these processes highly. Claimants served at the Job Center Northwest site appeared to be more satisfied with their orientation experience than did those served at the other two sites. A larger proportion of Northwest participants rated the demonstration highly on more of the features addressed in the survey than did participants from other sites (see Figure 4.2). Northwest participants were more positive than their peers at other sites when rating the project’s handouts, facilities, materials, self-assessment and employment plan, and their overall experience with the orientation.

Evaluation of the Strengthening the Connections Between UI and One-Stop Delivery Systems Demonstration Project in Wisconsin
B e r k e l e y P o l i c y A s s o c i a t e s 12/1/06
4-2
Figure 4.1 Customer Satisfaction Survey Questions
Wisconsin Demonstration Project Survey
The Department of Workforce Development is improving its services to individuals receiving Unemployment Insurance benefits. As a participant in the Wisconsin Demonstration project, you can help in this important mission by answering the questions below.
I am taking this survey because: O I just completed my initial orientation session.
On a scale of 1 to 10, 1 = "Strongly Agree" and 10 = "Strongly Disagree" please answer the following questions. You must provide a response to each question.
The presenters were knowledgeable. The handouts provided were useful to me. The facilities were comfortable. The materials met my needs. The staff was friendly and courteous. The self-assessment and Employment Plan process were helpful to me. Overall, I am satisfied with the reemployment services information I received. What did you like best about the orientation? What did you like least about orientation? What could we do to improve these orientations?
O I just completed my Employment Plan Review
On a scale of 1 to 10, 1 = "Strongly Agree" and 10 = "Strongly Disagree" please answer the following questions. You must provide a response to each question.
The services I received prepared me for my job search. What were the most useful services you received? What services were not useful to you? What services would you like to see offered that were not available? The staff was knowledgeable. The staff was friendly and courteous. I would recommend the services of the Job Center to others. I am likely to use the Job Center services again (if needed) to find employment. Overall, I am satisfied with the reemployment services information I received.

Evaluation of the Strengthening the Connections Between UI and One-Stop Delivery Systems Demonstration Project in Wisconsin
B e r k e l e y P o l i c y A s s o c i a t e s 12/1/06
4-3
Figure 4.2 Results of Wisconsin DWS’ Customer Satisfaction Survey, by Site:
Proportion of Respondents Rating Project 1, 2, or 3*
Question Total HIRE
Center Northwest Oshkosh
Orientation 914 289 334 288
• The presenters were knowledgeable. 84.1% 86.9% 85.3% 79.5%
• The handouts provided were useful to me. 77.5% 77.5% 82.6% 70.8%
• The facilities were comfortable. 75.3% 70.6% 80.8% 72.9%
• The materials met my needs. 73.6% 74.0% 78.7% 66.3%
• The staff was friendly and courteous. 86.4% 88.9% 88.6% 80.6% • The self-assessment and Employment Plan
process were helpful to me. 68.6% 67.1% 76.3% 60.4%
• Overall, I am satisfied with the reemployment services information I received. 77.5% 77.5% 82.3% 71.2%
Employment Plan Review 663 150 288 221
• The services I received prepared me for my job search. 70.7% 74.7% 75.3% 62.9%
• The staff was knowledgeable. 79.6% 84.0% 81.3% 75.1%
• The staff was friendly and courteous. 83.3% 88.7% 84.0% 78.7% • I would recommend the services of the Job Center
to others. 79.2% 81.3% 81.9% 74.7%
• I am likely to use the Job Center services again (if needed) to find employment. 75.3% 82.7% 76.0% 69.2%
• Overall, I am satisfied with the reemployment services information I received. 77.2% 82.0% 80.6% 70.1%
*Respondents rated their agreement with the statement using a scale of one to ten, with one representing the strongest agreement.
While the majority of Oshkosh participants also rated the orientation highly, a smaller proportion of those served in Oshkosh were satisfied with all aspects of the RES orientation. The reason for these results is not entirely clear, though a number of implementation factors may be associated with the less positive attitudes of Oshkosh participants. This site had more staff turnover than the other two sites combined. In addition, the Oshkosh site operated without clerical assistance for half of the study period, which would make the wait for one-on-one interviews after the orientation sessions longer than at the other sites.

Evaluation of the Strengthening the Connections Between UI and One-Stop Delivery Systems Demonstration Project in Wisconsin
B e r k e l e y P o l i c y A s s o c i a t e s 12/1/06
4-4
The customer satisfaction survey included an open-ended question which asked respondents to report what they liked best about the orientation. Participants could mention as many different features of the project as they liked. Evaluation staff post-coded answers to the open-ended questions, though it should be noted that the post-coded categories only covered about half of the responses provided for these questions. Across all of the sites, respondents mentioned that staff were helpful and friendly more often than any other aspect of the demonstration (13% of respondents; see Appendix J). The other most frequently reported favorite aspects were the handouts, the fact that staff were knowledgeable and professional, the resources available at the Job Center, the one-on-one interview at the end of the orientation, and the fact that staff presented information in a direct and concise way. In addition, the Oshkosh participants particularly appreciated the chance to talk to UI staff in person and the information that the adjudicator provided. Northwest participants also liked that information was presented in a clear manner, and that the presentation was short. In responding to the survey’s open-ended question about what they liked least about the orientation, half of the demonstration participants answered “nothing.” Much smaller proportions indicated that they were least satisfied with the amount of time consumed by attending the orientation, were uncomfortable in the meeting room for various reasons (e.g., too hot, too cold, chairs uncomfortable), or thought that the information presented was not relevant to their own situation or wanted more information. Claimants in Oshkosh least liked the wait for their one-on-one interview, while a number from the HIRE Center thought that the location was inconvenient. The last open-ended question regarding the RES orientation asked how the orientations could be improved. Relatively few participants offered suggestions, since half of the group had no complaints about the meeting. Among those who did respond, the most frequent improvements mentioned were providing more one-on-one attention and making the orientation shorter. Respondents also thought that the group should be divided either by professional vs. blue-collar occupations, or by level of experience in looking for work. This approach would allow staff to tailor the presentation more specifically to the needs of participants. HIRE Center participants recommended that the project should provide more flexibility in scheduling the orientations, while those in Oshkosh asked for the number attending the meeting to be smaller, in part so that the wait for one-on-one interviews would be shorter.
Satisfaction with Project Services Overall After demonstration participants completed their employment plan review, staff asked them to complete survey questions evaluating their satisfaction with project services overall. A total of 663 claimants completed the post-review survey. Because the surveys were conducted confidentially, the evaluation team was unable to analyze individual changes in attitude about the project from orientation to plan review.

Evaluation of the Strengthening the Connections Between UI and One-Stop Delivery Systems Demonstration Project in Wisconsin
B e r k e l e y P o l i c y A s s o c i a t e s 12/1/06
4-5
The majority of participants responded positively to the questions about various aspects of the project. As Figure 4.2 illustrates, respondents were again most positive about the attitude of demonstration staff; 83% agreed very strongly with the statement “The staff was friendly and courteous.” In contrast, only 71% agreed very strongly that project services had prepared them for their job searches. Larger proportions of the HIRE Center’s participants rated four of the six project features addressed in the survey highly, suggesting that HIRE Center claimants were more pleased with the demonstration services than were other participants. HIRE Center claimants were more positive than their peers at other sites about the knowledge levels of staff, the friendliness and courtesy of staff, the likelihood of using Job Center services in the future, and their overall satisfaction with reemployment services. Compared to participants from the other sites, fewer Oshkosh participants agreed very strongly with any of the statements about the project’s features. In particular, just under two-thirds (63%) agreed very strongly that the demonstration’s services had prepared them for looking for a job. The factors listed above regarding participants’ views of the RES orientation could also affect their satisfaction with project services overall. In addition, because of changes in the Job Center’s partnerships and partners’ financial health, the Oshkosh Center offered very few workshops during the first few months of the demonstration project. Once demonstration staff began conducting workshops, other One-Stop partners began referring their customers to these workshops because they were the only such services available. In response to the open-ended question, “What were the most useful services you received?” over one-quarter (28%) of all demonstration participants responded that help with their resumes was the most useful service they received from the Wisconsin Demonstration staff. Smaller proportions also mentioned information about job search websites as being useful, as well as help improving their interview skills. Claimants at Northwest also said that various types of workshops were especially helpful, while Oshkosh participants mentioned one-on-one counseling as being of the most use to them. The survey also included an open-ended question that asked respondents to identify the project services that were the least useful to them. Two-thirds of those who completed the plan review portion of the survey reported that none of the project’s services were useless. Very small numbers of claimants thought that help with preparing resumes or use of the Job Centers’ computers and internet connection were not useful to them. Most of those who reported that use of computers and/or the Internet was not helpful also noted that they had those resources at home. Very few respondents answered the open-ended question about suggestions of services they would like to see the project offer that were not available, and the types of responses they offered varied widely. A number of participants would have liked to receive more information about education and training resources, and more—and better targeted—job leads. Several also
Evaluation of the Strengthening the Connections Between UI and One-Stop Delivery Systems Demonstration Project in Wisconsin
B e r k e l e y P o l i c y A s s o c i a t e s 12/1/06
4-6
suggested that the project offer direct contact with employers, either through job fairs, employer presentations, or employers conducting mock interviews with participants.
Summary of Customer Satisfaction Results All in all, a substantial majority of demonstration participants were happy with the assistance they received from the project. Survey respondents from different sites did vary in their opinion of the services they received; often these variations reflected the strengths and/or challenges of the sites’ staff or facilities. The survey results for Oshkosh were consistent, however, in that smaller proportions of Oshkosh participants than claimants from other sites were very satisfied with the services they received across all of the project dimensions that the survey addressed. These results may be the consequence of the various implementation challenges that the site encountered during the study period.

Evaluation of the Strengthening the Connections Between UI and One-Stop Delivery Systems Demonstration Project in Wisconsin
B e r k e l e y P o l i c y A s s o c i a t e s 12/1//06
5-1
5. Lessons from the Wisconsin Demonstration Project Like the execution of any project, implementing the Wisconsin Demonstration generated a number of useful lessons about the provision of reemployment services that might be useful for other states. The lessons presented below were drawn from the challenges and successes of the demonstration project, and are organized by the following topics: project goals and design; consistency of service provision; needs for UI information; staffing; communications; employment plan review; collaboration; the WPRS process; and management information systems and data management.
Project Goals and Design • UI and One-Stop staff can provide services jointly without disrupting the UI call center
structure. In the Wisconsin Demonstration project, the state’s Department of Workforce Development developed a service model in which employment service and UI staff worked jointly, together providing both reemployment services and employment plan reviews. Furthermore, the demonstration operated without disrupting or creating other negative impacts on the UI call center structure. Both UI and Job Center staff, as well as participants, found the project’s design to be effective and to improve the quality of information shared between agencies and with claimants. • Project activities must be aligned with project goals to produce congruent impacts on
key participant outcomes. As the demonstration unfolded, the DOL Project Officer and project director realized that the Job Services staff seemed to be referring workers to training services who may have already possessed marketable skills instead of finding good jobs work immediately. Participants would then continue to draw UI benefits, adversely affecting one of the evaluation’s key employment outcomes. Because the demonstration’s larger goal was to assist claimants in entering employment more rapidly and to reduce their draw on the UI trust fund, Project Officer reminded the Oversight Committee of this goal, and the project director asked staff to adopt a “work first” attitude in serving participants. In designing any type of service projects, staff should be aware of the measurable outcomes associated with each goal, and ensure that related activities have a harmonious effect on the project’s key outcome measures.

Evaluation of the Strengthening the Connections Between UI and One-Stop Delivery Systems Demonstration Project in Wisconsin
B e r k e l e y P o l i c y A s s o c i a t e s 12/1//06
5-2
• The project’s design team should include both the staff that will be providing services
and their supervisors. To ensure that the project’s design was realistic and reflected current practices, the demonstration staff made significant contributions to designing the project’s service model. On the other hand, local Job Service managers in Oshkosh and Milwaukee were not involved in the planning or design of the demonstration until the project was almost ready for implementation. Consequently, the supervisors of demonstration staff were not as knowledgeable about the project as they could have been, and felt that they were expected to supervise staff without knowing what the project’s focus was. Both state and local staff realized that enlisting the supervisors’ involvement early in the design process would have encouraged them to “buy into” the project, preventing some of the challenges that later emerged during the demonstration’s implementation.
Consistency in Project Activities • Build in mechanisms to reinforce consistency in program activities. State and local staff collaborated in creating a handbook that described all of the project activities to ensure consistency in services and operations across the three sites. The handbook outlined the content of the orientation and workshops, but staff developed and selected their own materials. Even with this guiding document, staff thought the project’s services and record-keeping processes should have been documented in more detail to improve the consistency of their operations. Staff noted that this issue also existed in the regular RES program, and that the demonstration at least had the advantage of the handbook’s template for the standard presentation for the orientation, which regular RES staff did not have. A particular need was for tools to track the participant flow process (including initial phone contact with claimants, communications with participants, and scheduling one-on-one meetings), and instructions for completing data entry tasks. Staff members created their own systems, which affected their efficiency especially when they first started the job. Staff also varied in how they coded specific activities when entering data in ASSET. Finally, after the project was up and running at each site, demonstration staff no longer met as a group. Regular project meetings, even conducted by conference call, would have provided a venue for staff to discuss implementation issues as they occurred, to agree upon common data entry protocols, and to share solutions.
UI Information Needs • UI Benefit call centers are an efficient means of administering claims, but both Job
Center staff and customers need more information about UI and better access to answers to their questions than call centers may provide.
Job Center staff at each of the demonstration sites noted that many customers had questions about their UI benefits that Job Service staff were not prepared to answer. One of the aspects of

Evaluation of the Strengthening the Connections Between UI and One-Stop Delivery Systems Demonstration Project in Wisconsin
B e r k e l e y P o l i c y A s s o c i a t e s 12/1//06
5-3
the project that staff valued the most was the establishment of a formal connection between Job Service and UI staff, so that Job Center staff knew whom to call about UI questions. They reported that the connection with UI staff took pressure off of Job Center staff because it allowed them to get customers’ questions about UI answered quickly and accurately. Access to the UI adjudicators, and the information they provided, also was one of the aspects of project services that participants valued the most. Staff appreciated being able to provide better customer service by having their UI staff partners answer questions, rather than referring customers to the call center’s 800 line and the potential for a long wait on hold. They suggested that after the project ended, DWD should consider educating Job Service staff on basic UI benefit questions, and/or exploring other approaches to improve customer access to relevant UI information.
Staffing ● The quality of staff can be a key factor in the success of a demanding project. The commitment, flexibility, and enthusiasm of the project staff, including the UI adjudicators, contributed to the success of the demonstration in several ways. First, when discussing the possibility of statewide adoption of the demonstration model, other RES staff commented that the project was “too much work” compared to the current RES process. Nonetheless, members of the project staff were committed to the project. Both the HIRE Center and Oshkosh staff carried over vacation time from SFY2005 because the project’s continuous schedule made taking a break difficult, and no one was available to take over if they took a vacation. Second, as noted above, project staff were extremely flexible in accommodating the needs of participants, scheduling make-up orientations, and providing individual orientations for claimants who spoke only Spanish. Finally, as the demonstration’s project director said, “they were excited and passionate about their jobs,” and that enthusiasm was transmitted to participants. • Hire staff into permanent positions if at all possible. As Chapter 2 described, the demonstration was implemented during a period when Wisconsin’s administrative policy prohibited the creation of new staff positions. Given the challenges that both state and local staff faced in implementing the project within this policy environment, they strongly recommended that other projects ensure that staff turnover be kept to minimum. If the demonstration were starting today, the grant’s project director would ensure that staff held permanent, not temporary, positions and had high enough seniority that they could not be “bumped” from their assignments if layoffs occurred elsewhere in the agency. Assuming that such an approach could be ensured, the challenge of finding staff that met the foregoing criteria− and were flexible, creative, and enthusiastic−would remain.

Evaluation of the Strengthening the Connections Between UI and One-Stop Delivery Systems Demonstration Project in Wisconsin
B e r k e l e y P o l i c y A s s o c i a t e s 12/1//06
5-4
WPRS Process ● Offer WPRS more frequently. Participants in the Wisconsin Demonstration project experienced one disadvantage compared to claimants who participated in RES at other Job Centers. Staff at the comparison sites conducted Job Center orientations for UI claimants on a weekly basis, and thus claimants could be required to attend one of these meetings as early as their third or fourth week of drawing benefits. Because the demonstration sites provided a longer program of services, however, staff basically provided one orientation per month, and participants might be scheduled to attend the orientation as late as six weeks or seven weeks after first filing for benefits. To some degree, this difference is an artifact of the project’s status as a demonstration. Nonetheless, in responding to the project’s customer satisfaction survey, many participants commented that they wished they could have started services earlier in their claim process. Offering services more frequently would provide job seekers with improved access to assistance, and this should be taken into consideration in planning the provision of RES. ● Telephoning claimants to inform them about RES offered several benefits. UI benefit claimants selected for RES receive a form letter letting them know that they are required to attend a meeting at their local Job Center on a certain date and time. The project’s service model included a telephone call to claimants as well as the letter. In addition to reinforcing the importance of attending the orientation, demonstration staff found that some claimants were more open to participating in services because the phone call put a friendlier face on the requirement to attend. The phone call allowed claimants to ask questions about the orientation, and provided a way for staff to find out whether claimants had limited English skills, were deaf (and might need an interpreter), or had other disabilities that could affect their attendance. Finally, one of the UI adjudicators noted that the phone call provided a useful second source of information in his monitoring of the claimant’s job seeking activities. For example, if a claimant said that he did not receive the letter informing him about the orientation, the adjudicator could check with demonstration staff to determine whether they had made personal contact with the individual. ● The WPRS score may not accurately project a claimant’s need for job search
assistance. The WPRS score is formulated as an expected likelihood of claimants exhausting their UI benefits. Nonetheless, as Chapter 3 discussed, the average WPRS score for the demonstration’s Group A claimants, who were identified by demonstration staff as needing only minimal services, was slightly higher than that for members of Group B, who were assessed as needing more substantial assistance with their resumes and job search skills. This finding suggests that the WPRS and staff assessments measured different factors. Because the WPRS score is used to prioritize the referral of claimants to RES, however, UI staff should investigate whether changes to the WPRS algorithm could improve its effectiveness in identifying claimants who need job search assistance.

Evaluation of the Strengthening the Connections Between UI and One-Stop Delivery Systems Demonstration Project in Wisconsin
B e r k e l e y P o l i c y A s s o c i a t e s 12/1//06
5-5
• Providing more intensive reemployment services is likely to mean serving fewer claimants.
The demonstration’s service model involved more intensive RES services than are currently being offered in Wisconsin. Given budget limitations, the Job Services Director stated that he was anticipating reducing the number of RES participants if the model were to be adopted statewide. Balancing the quality of services provided with the quantity of claimants served becomes an important consideration when making such programmatic changes. ● The Review of Employment Plan was very useful to project staff, but less appreciated
by participants. UI and Job Service staff noted that the joint plan review offered another opportunity to meet one-on-one with participants and recommend workshops or other services, provide job referrals, and problem-solve. From the UI adjudicator’s point of view, the review was the project’s primary chance to investigate participants’ job search activities. The fact that this was done jointly with both UI and demonstration staff participating served to increase the sense of accountability among claimants. The Milwaukee adjudicator observed that he had identified many UI issues in these in-person meetings that he would not have known about if he stayed in his office. Project staff also said that claimants liked the plan review because it gave them closure, however, none of the participants who completed the customer satisfaction survey listed the review as one of the project services that they liked the best. In fact, two claimants stated that the review was one of the services that they liked the least.
Communications • Communicate clearly to staff the impacts the project should achieve. A Job Service supervisor remarked that staff were sometimes confused about the goals of the demonstration’s services, particularly early in its implementation. Again, the project originally was attempting to achieve conflicting goals: 1) to assist claimants in finding new jobs quickly; and 2) to assist claimants to enter employment in high paying positions in growth industries, which likely would require training to secure. As a project starts, senior staff should be clear in identifying the outcomes expected and how they will be measured, and ensure that service-level staff understand these expectations. • Communicate clearly to all levels of the partner agencies the roles of each partner and
of key staff. As Chapter 2 described, the role of the Job Service supervisor who was involved in overseeing the demonstration was not clearly defined, and she was not formally introduced to local managers as having key responsibilities related to the project. Without the formal relationship, she often talked directly with the demonstration staff instead of going through their supervisors, although she was not empowered to be directive to the staff. In one instance, she informed the project staff that funds were available for workshop materials. A manager two levels above the

Evaluation of the Strengthening the Connections Between UI and One-Stop Delivery Systems Demonstration Project in Wisconsin
B e r k e l e y P o l i c y A s s o c i a t e s 12/1//06
5-6
project staff objected to the purchase because it was outside the chain of command. All partner staff need to know not only about the project’s goal and activities, but the key players as well.
Collaboration • The rewards for increasing collaboration between the Job Service and UI agencies were
far richer than originally anticipated. At the demonstration’s start-up meeting, the UI administrator commented that his agency had increased its efficiency by moving to the benefit call center structure, but that DWD had taken on the demonstration to improve the department’s effectiveness. The project’s implementation included a mutual education process, wherein UI and Job Service staff each clarified what the other agency does and developed a better understanding of why they do things the way they do, moving beyond stereotypes about each agency. The demonstration also reinforced the fact that both agencies share a common goal of getting people back to work. At the state level, the project’s Oversight Committee assumed a role beyond improving the effectiveness of RES provided to UI claimants. The committee provided a process and structure for generating ideas about interagency collaboration and identifying concrete work tasks that went further than the grant’s original scope of work. At the local level, Job Service staff appreciated having access to claimant’s UI claim data, and found that the UI adjudicators could provide information (such as why a claimant lost her job) that was useful in determining how best to serve individual claimants. Most importantly, interview respondents indicated that they valued the trust that developed between staff of each agency as a result of working together to implement the project, and noted that the demonstration created a better quality work environment than had existed prior to the project. • Implementation of a project within a collaborative structure, such as is used by the
One-Stop Career Centers, will always be impacted by partner agencies, and offers the opportunity to positively impact the partners.
Each of the demonstration sites was affected by decisions made by other Job Center partners, such as the delayed start-up of the Job Center Northwest site because of negotiations with the Job Center operator over rent, the loss of partner staff members who provided critical workshops in Oshkosh, and a comparison site moving its orientation to the HIRE Center’s conference room. While avoiding the resulting challenges may have been impossible, project staff at both the state and local levels might have been able to anticipate them with better—and continuous—communication with partner agencies. At the same time, the project’s presence in each Job Center presented an opportunity for positively impacting the centers and their partner agencies. For example, the presence of the Wisconsin Demonstration project at Job Center Northwest enhanced the center’s image in the community because it had generally been regarded as being only a “welfare center.” Furthermore, the project helped increase the focus of some TANF staff on employment goals for their clients. In each of the demonstration sites, project staff provided workshops that were open to the Centers’ universal customers that otherwise would not have been available.

Evaluation of the Strengthening the Connections Between UI and One-Stop Delivery Systems Demonstration Project in Wisconsin
B e r k e l e y P o l i c y A s s o c i a t e s 12/1//06
5-7
Data Systems and Record-Keeping • Integrating data from multiple and complex management information systems will take
longer—and be more expensive—than anticipated. Wisconsin’s DWD was committed to creating a physical link between its UI and Job Service divisions that could serve as the basis for further integration of the agencies’ databases in the future. As a result, creating a better interface between the UI and ASSET data systems became a major task of the demonstration. The link between the two systems provides a basis for further integration in the future. Unfortunately, the costs associated with the data-sharing project were high enough that subsequent improvements to the interface under the grant were not possible. As a result, local staff were disappointed with the amount of data entry they were required to do. In addition, they had difficulty filling in missing data in ASSET for participants served in past months and accessing certain types of information from the UI database. Finally, the cost of the effort prevented the reformatting of some data items so that they would have been more useful for the evaluation. • Staff need timely performance information. Work started on the MIS integration process in November 2004 and first provided data four months later. Because of this timeline, summary information about participants that the project served was not available until the seventh month of a 16-month effort. Staff at both the state and local levels would have preferred to have more immediate feedback on the project’s progress. Furthermore, such input would have been useful in ensuring that staff completed their data entry into ASSET in an accurate and timely way.
Conclusion The Wisconsin Demonstration project succeeded in increasing collaboration between the state’s UI and Job Service agencies through both its data sharing component and its implementation of expanded RES for UI claimants. In doing so, staff overcame a variety of barriers including administrative policies, the complexity of MIS systems, and the communications challenges associated with creating a new project. The evaluation assessed the effect of these collaborative efforts on the employment outcomes of RES participants. The study’s findings were similar to those of other research on reemployment services. Overall, the Wisconsin Demonstration project appears to have had a modest, but significant, influence on the employment outcomes of participants. In particular, demonstration participants drew UI benefits for a shorter period of time and had higher average quarterly earnings than did comparison group members. Use of specific services−such as assessment, job referral, one-on-one services, and follow-up−improved claimants’ likelihood of entering employment, decreasing receipt of UI benefits, and increasing quarterly earnings.

Evaluation of the Strengthening the Connections Between UI and One-Stop Delivery Systems Demonstration Project in Wisconsin
B e r k e l e y P o l i c y A s s o c i a t e s 12/1//06
5-8
Staff from both the Job Service and UI agencies are continuing to collaborate in exploring strategies for improving the effectiveness of their RES statewide. The demonstration’s most important impacts may be realized in the future as UI and Job Service staff continue to work together toward their common goal of assisting individuals to return to work.

Appendix A
Zip Codes and Demographics for with Demonstration and Comparison Sites

A-1
Appendix A
Exhibit A.1 Zip Codes for Demonstration and Comparison Sites
Demonstration Comparison
Loca
tion
Sites Zip Codes Sites Zip Codes
Fox
Valle
y
Oshkosh
54901 54902 54903 54904
Menasha
54130 54136 54140 54911 54912 54913 54914 54915 54952 54956
HIRE Center
53204 53221 53207 53129 53132
Job Center South
53110 53154 53172 53235 53215
Milw
auke
e
Job Center Northwest
53223 53224 Teutonia Center
53209 53217 53225
Exhibit A.2 Demographic Information for Demonstration
vs. Comparison Site “Catchment Areas”
Site
Job Center
Operator Population
Age 16+
% w/ at least High School
Diploma Unemployment
Rate
% Below Poverty
Level Fox Valley: Oshkosh Consortium 62,050 85.50% 2.94% 9.05%
Menasha Consortium 154,943 88.77% 2.19% 4.86% Milwaukee: Hire Center WIB 122,037 76.50% 3.66% 13.45%
Job Center South UMOS 100,616 78.38% 3.81% 11.44%
Job Center Northwest Maximus 37,315 85.52% 3.86% 13.15%
Teutonia OIC 77,387 84.49% 4.64% 12.76%

Appendix B
Construction of the Propensity Score

B-1
Appendix B
Construction of the Propensity Score The evaluation used a matching algorithm to link each demonstration group member to multiple comparison group members for the impact analysis. This approach increases the statistical precision of the study’s estimates, and takes advantage of the fact that the profiling pools for the comparison sites were much larger than the pools for the demonstration sites. We used a two-stage matching procedure, in which matches were made on a propensity score that was estimated using sample members’ background characteristics (including their employment history and profiling score). This propensity score was created as follows:
• First, we randomly selected one-fourth of the comparison group. For this subgroup, we used the following regression model:
ikiki XY εββ ++= ∑0 , (1)
where Yi is a measure of outcome Y for person i, Xki is a vector of individual background variables for person i, and εi is a random error term. The coefficients βk were saved and used subsequently to create a predicted value of Yi for the remaining comparison group members and the demonstration group members. This predicted value (Ŷi) was a measure of these sample members’ propensity for outcome Yi.
• Second, each member of the demonstration group was matched with the two1 closest
comparison group members, based on the value of Ŷi. To maintain the statistical independence of our observations i, we allowed each comparison group member to be matched only once. After each demonstration group member was matched to two comparison group members, we discarded any remaining comparison group members for that particular analysis and estimated the following model:
iiii YPY εβββ +++= ˆ210 , (2)
in which Pi is a dummy variable that is 1 for program group members and 0 for comparison group members, Ŷi is the propensity score for Yi from Equation 1, and β1 is the estimated program effect on outcome Y.
Note that the composition of the comparison group will change from outcome to outcome, depending on the propensity scores associated with each outcome for individuals i. In essence, the analysis chooses the “best” comparison group members for each outcome Y, discarding comparison group members who are not well matched to a program group member in their propensity of achieving that particular outcome.
1 The larger number of comparison group members per site allows for the best two comparison group members to be selected for each demonstration group member during analysis.

Appendix C
Disposition of the Study Sample

C-1
Appendix C
Exhibit C.1 Disposition of the Evaluation’s Study Sample
Subsets Total Demonstration ComparisonIn Study Site WPRS Pools Between July 1, 2003 and December 31, 2005 8,390 2,271 6,119
Missing Data 193 91 102
Total for Whom Data Available 8,197 2,180 6,017
Not Matched by Propensity Score 1,824 0 1,824
Final Study Sample 6,373 2,180 4,193
Exhibit C.2 Number of Comparison Group Members Matched to Each Demonstration Participant,
By Analysis Model
Model 1 All Sample
Model 2 WPRS 47% or higher
Model 3 Used RES Services
# Matches Number
Participants Percent Number
Participants Percent Number
Participants Percent
1 168 8% 318 17% 1060 90%
2 2,011 92% 1,503 82% 115 10%
3 1 0% 3 1% 0 0%
Total 2,180 100% 1,824 100% 1,175 100%

Appendix D
Data Items Provided by Wisconsin Unemployment Insurance and
Department of Workforce Services Agencies

D-1
Appendix D
Data Items Provided by Wisconsin Unemployment Insurance and Department of Workforce Services Agencies1, 2
Data Item Definition Source Individual Characteristics
Identification Number Different IDs for UI vs. ASSET DWS/UI
Demo Group (A vs. B) or C
Service group (A or B) assigned based on staff assessment of job search readiness; or C for comparison group.
UI Database
Service Site The demonstration or comparison site with which the individual is associated. UI Database
Date of Birth Used to calculate age ASSET if available; otherwise UI Database
Gender Male/female ASSET if available; otherwise UI Database
Race/Ethnicity American Indian/ Asian/ Black/ Hispanic/ Hawaiian or Pacific/White/Other
ASSET if available; otherwise UI Database
Education Level Highest school grade completed ASSET if available; otherwise UI Database
Limited English Proficiency
Limited proficiency in English language: yes/no
Available only in ASSET
Disability Individual has disability: yes/no ASSET if available; otherwise UI Database
Single Parent Yes/no Available only in ASSET
Number Years at Primary Employer Proxy for Employment History UI Database
Industry of Last Employer
Customary Industry of Employment (NAICS code) UI Database
Type of Work Last Job As captured by SIC code UI Database Earnings Last Job Base period wage credits UI Wage Record Data Previous UI Claims # Previous UI claims in past 5 years UI Database Access to Transportation Has access to transportation: yes/no Available only in
ASSET Worker Profiling Score Probability factor UI Database Maximum Benefit Entitlement
Maximum benefit amount UI Database
1 For the comparison group, the ASSET data for any item was used if it was available, otherwise, UI data was the source. 2 The evaluation team created other variables based on this data.

D-2
Data Item Definition Source Service Use
UI Claim Date VNC week (First week paid in calendar year) UI Database
UI Profiled Job Seeker Orientation WPRS Orientation ASSET Service Plan
Initial Assessment Cumulative total of: Initial determination of customer's skill levels, barriers, and needs
ASSET Service Plan
Testing – BEAG Cumulative total of: completions of the Spanish General Aptitude Test Battery
ASSET Service Plan
Testing – GATB Cumulative total of: completions of the General Aptitude Test Battery
ASSET Service Plan
Testing – Interest Cumulative total of: completions of Vocational Interest Profile (VIP) testing
ASSET Service Plan
Testing – SATB Cumulative total of: completions of Specific Aptitude Test Battery (Apprenticeship) testing
ASSET Service Plan
Testing – Typing Cumulative total of: a typing proficiency test
ASSET Service Plan
Testing – Other Cumulative total of: completions of any other test such as Aptitude, Achievement or Interest
ASSET Service Plan
Resume Development Cumulative total of: assistance in developing a resume
ASSET Service Plan
Customer Specific LMI Cumulative total of: provision of labor market information specific to the customer
ASSET Service Plan
Job Development Cumulative total of: marketing an individual to secure a job interview with no published job opening
ASSET Service Plan
Assisted Job Search & Placement
Cumulative total of: provision of job leads or job hunting tips to assist the customer in becoming employed
ASSET Service Plan
Job Referral Cumulative total of: referrals to a known job opening
ASSET Service Plan
Referral to non-WIA support services
Cumulative total of: referrals to any supportive service provided by a partner agency
ASSET Service Plan
Referral to federal training
Cumulative total of: referrals to federally-funded job-training program
ASSET Service Plan
Referral to non-WIA Partner
Cumulative total of: referrals to non-WIA agency or community group for services or information
ASSET Service Plan
Referral to WIA Program
Cumulative total of: referrals to additional WIA Program
ASSET Service Plan
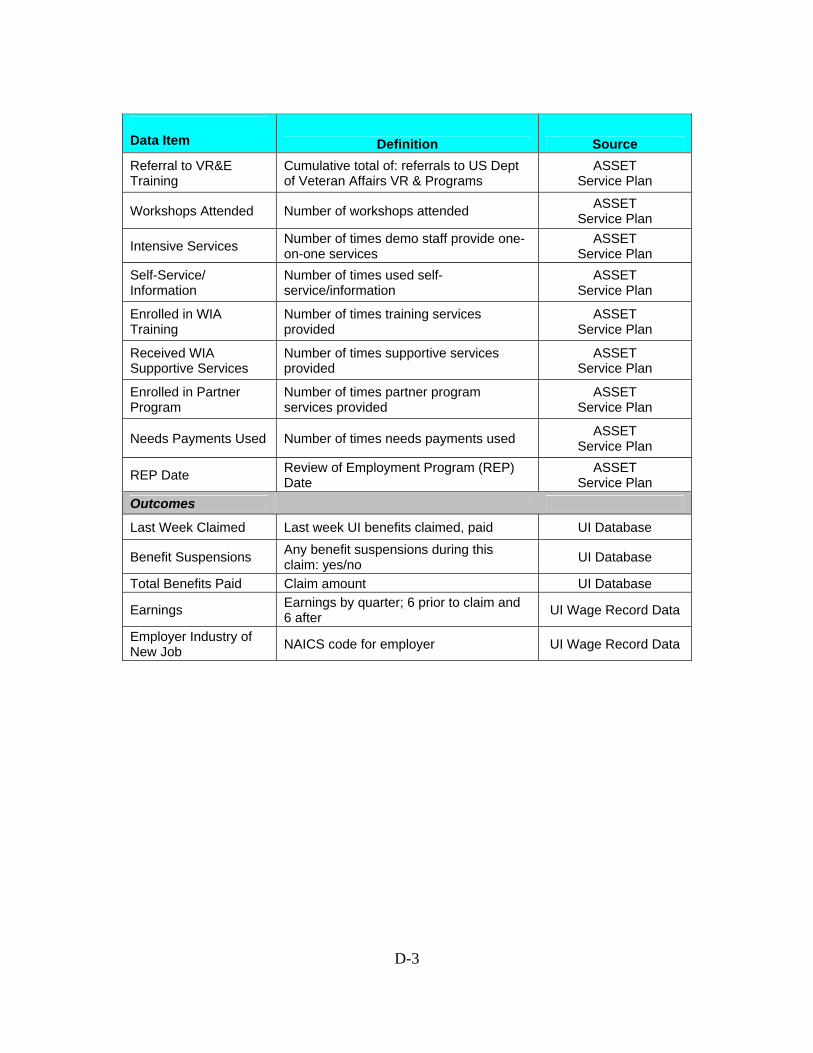
D-3
Data Item Definition Source Referral to VR&E Training
Cumulative total of: referrals to US Dept of Veteran Affairs VR & Programs
ASSET Service Plan
Workshops Attended Number of workshops attended ASSET Service Plan
Intensive Services Number of times demo staff provide one-on-one services
ASSET Service Plan
Self-Service/ Information
Number of times used self-service/information
ASSET Service Plan
Enrolled in WIA Training
Number of times training services provided
ASSET Service Plan
Received WIA Supportive Services
Number of times supportive services provided
ASSET Service Plan
Enrolled in Partner Program
Number of times partner program services provided
ASSET Service Plan
Needs Payments Used Number of times needs payments used ASSET Service Plan
REP Date Review of Employment Program (REP) Date
ASSET Service Plan
Outcomes
Last Week Claimed Last week UI benefits claimed, paid UI Database
Benefit Suspensions Any benefit suspensions during this claim: yes/no UI Database
Total Benefits Paid Claim amount UI Database
Earnings Earnings by quarter; 6 prior to claim and 6 after UI Wage Record Data
Employer Industry of New Job NAICS code for employer UI Wage Record Data

Appendix E
Wisconsin Demonstration Project Forms
• Self-Assessment and Employment History
• Job Search Journal
• Reemployment Plan
• Customer Satisfaction Surveys
• Follow-Up Survey
• Employment Plan Review


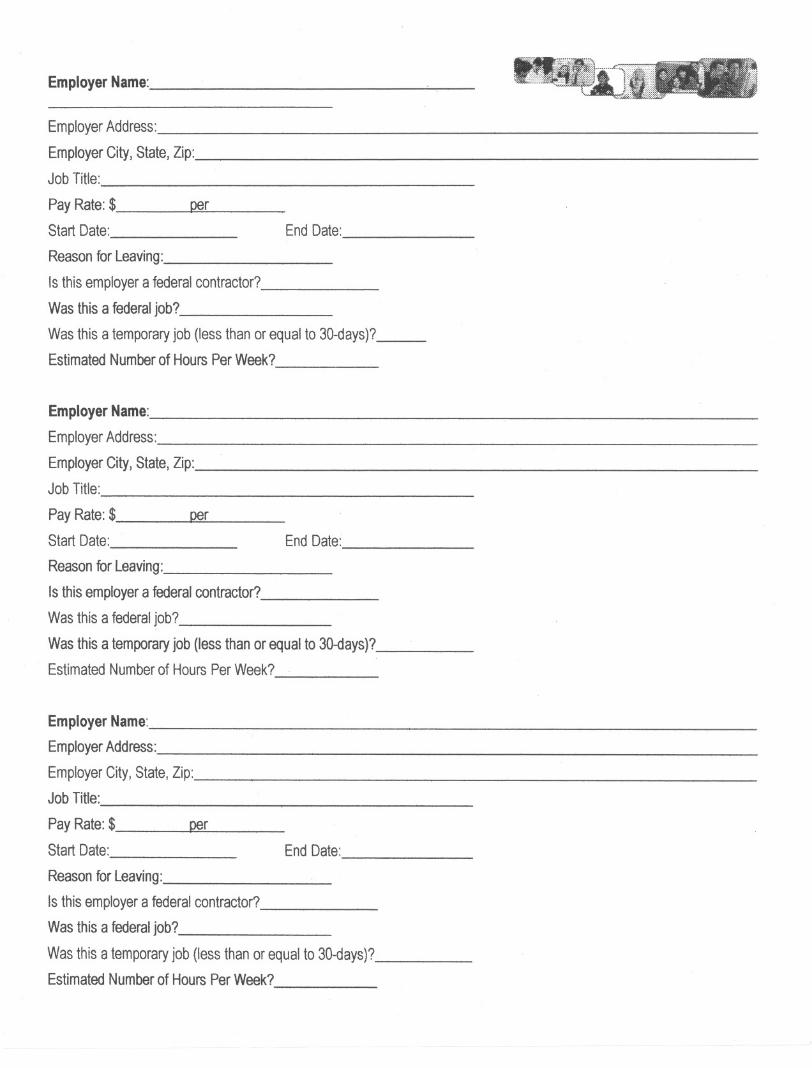


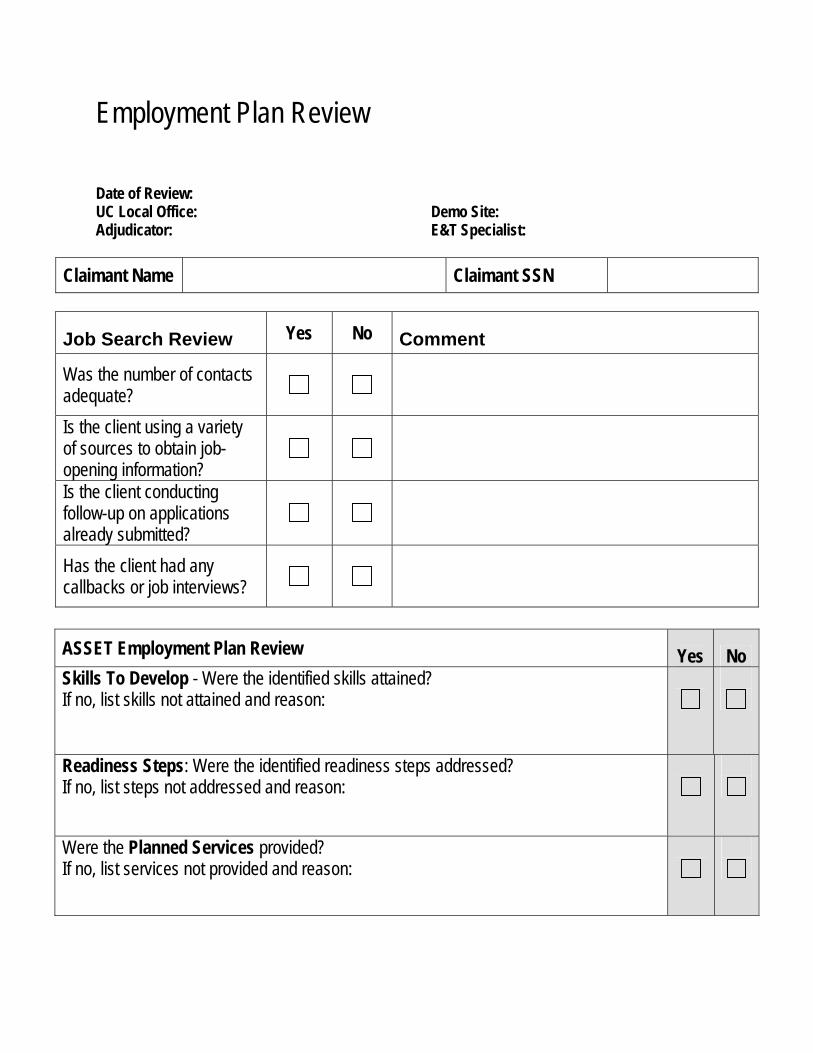
Employment Plan Review Date of Review: UC Local Office: Demo Site: Adjudicator: E&T Specialist:
Claimant Name Claimant SSN
Job Search Review Yes No Comment
Was the number of contacts adequate?
Is the client using a variety of sources to obtain job-opening information?
Is the client conducting follow-up on applications already submitted?
Has the client had any callbacks or job interviews?
ASSET Employment Plan Review Yes No Skills To Develop - Were the identified skills attained? If no, list skills not attained and reason:
Readiness Steps: Were the identified readiness steps addressed? If no, list steps not addressed and reason:
Were the Planned Services provided? If no, list services not provided and reason:

Appendix F
Wisconsin’s UI to Job Center Data Systems Documentation

F-1
Appendix F
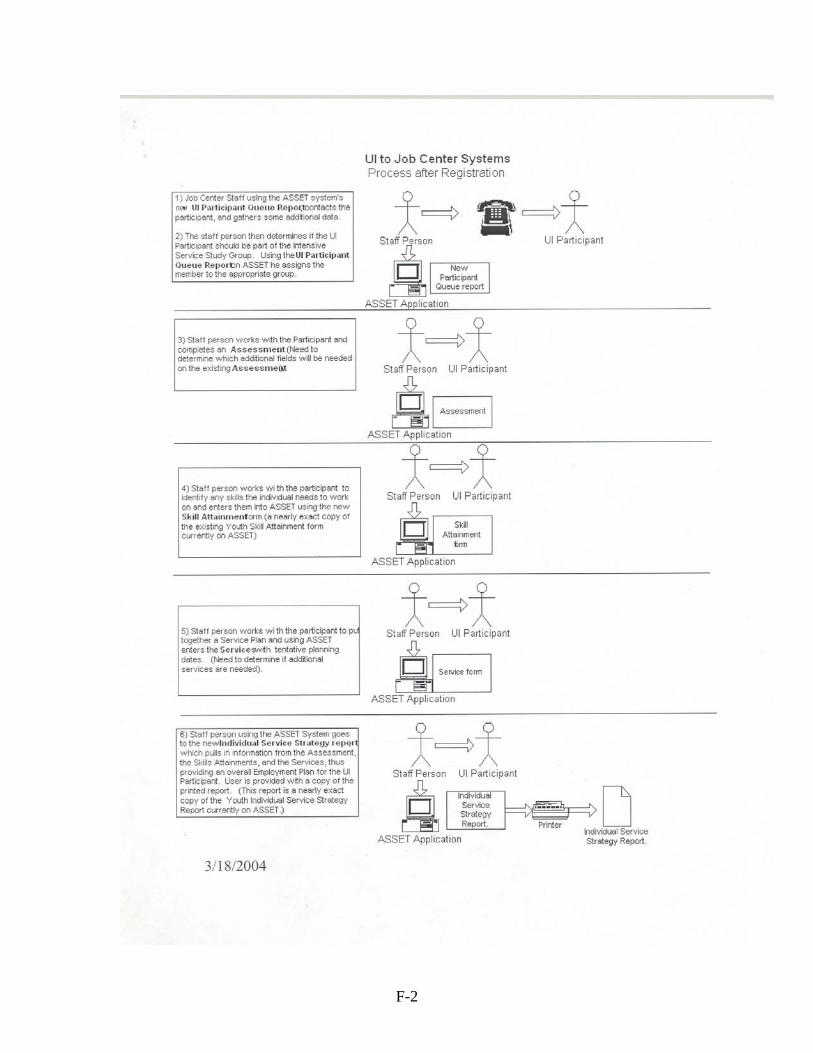
F-2

F-3

F-4
Appendix G
Characteristics of the Demonstration Group, by Subgroup

G-1
Appendix G Characteristics of the Demonstration Group, by Subgroup
Characteristic
Total Participants
A Light Touch
B Intensive Services
Subtotal A & B
E Entered
Employment
N
No Show
S Other
Services
Subtotal No
Services # of Participants 2,180 534 641 1,175 369 588 48 1,005
Male 56.3% 48.3% 58.7% 54.0% 57.7% 59.9% 60.4% 59.1%
Age (mean years) 40.1 43.6 40.3 41.8 39.4 37.2 42.6 38.2
Education
Less Than High School 12.2% 1.9% 20.7% 12.2% 6.2% 14.8% 25.0% 12.1%
High School Graduate 53.2% 32.6% 57.9% 46.4% 79.1% 50.3% 54.2% 61.1%
Some College/College Grad 34.6% 65.5% 21.4% 41.4% 14.6% 34.8% 20.8% 26.7%
Ethnicity
White 68.3% 73.4% 65.8% 69.3% 69.6% 65.5% 66.7% 67.1%
Black 24.4% 20.8% 28.5% 25.0% 25.5% 23.1% 18.8% 23.8%
Other 10.4% 7.3% 10.1% 8.9% 10.6% 12.2% 22.9% 12.1%
Limited English Proficiency 3.0% 1.1% 4.4% 2.9% 2.2% 3.2% 10.4% 3.2%
Has Disability 3.3% 2.2% 5.0 % 3.7% 1.9% 2.7% 12.5% 2.9%
Single Parent 8.6% 5.8% 8.9% 7.5% 7.3% 11.4% 12.5% 10.0% At Least 1 UI Claim in 5 Yrs 56.1% 49.4% 58.5% 54.4% 55.8% 60.0% 50.0% 58.0%
WPRS Score (mean) 67.2 67.7 65.7 66.6 67.5 68.2 65.9 67.8
Years in Last Job (mean) 4.2 4.1 4.8 4.5 4.5 3.3 5.4 3.8 Qtrly Earnings Last Job (mean) $6,340 $8,221 $4,991 $6,459 $7,116 $5,541 $7,237 $6,201
Appendix H
Characteristics of Group A and B Participants by Demonstration Site

H-1
Appendix H
Exhibit H.1 Characteristics of Demonstration Groups A & B by Job Center Site
Milwaukee
Characteristic
A & B Participants
Total Oshkosh Job
Center Job Center Northwest
HIRE Job Center
# of Participants 1,141 408 407 360
Male 54.0% 57.4% 52.1% 52.2%
Age (mean years) 41.8 42.9 40.6 41.9
Education
Less Than High School 12.2% 9.6% 10.3% 17.2%
High School Graduate 46.4% 52.0% 36.1% 25.0%
Some College/College Grad 41.4% 38.5% 41.3% 45.0%
Ethnicity
White 69.3% 93.6% 32.7% 83.1%
Black 25.0% 2.2% 61.7% 9.4%
Other 8.9% 5.4% 6.1% 15.8%
Limited English Proficiency 2.9% 0.7% 3.9% 4.2%
Has Disability 3.7% 4.9% 2.5% 3.9%
Single Parent 7.5% 4.7% 11.1% 6.7%
One or more UI past claims 54.4% 56.1% 56.8% 49.7%
WPRS Score (mean) 66.6 61.8 68.5 69.8
Years in Last Job (mean) 4.5 6.1 3.3 3.9
Qtrly Earnings Last Job (mean) $6,459 $6,855 $5,992 $6,537
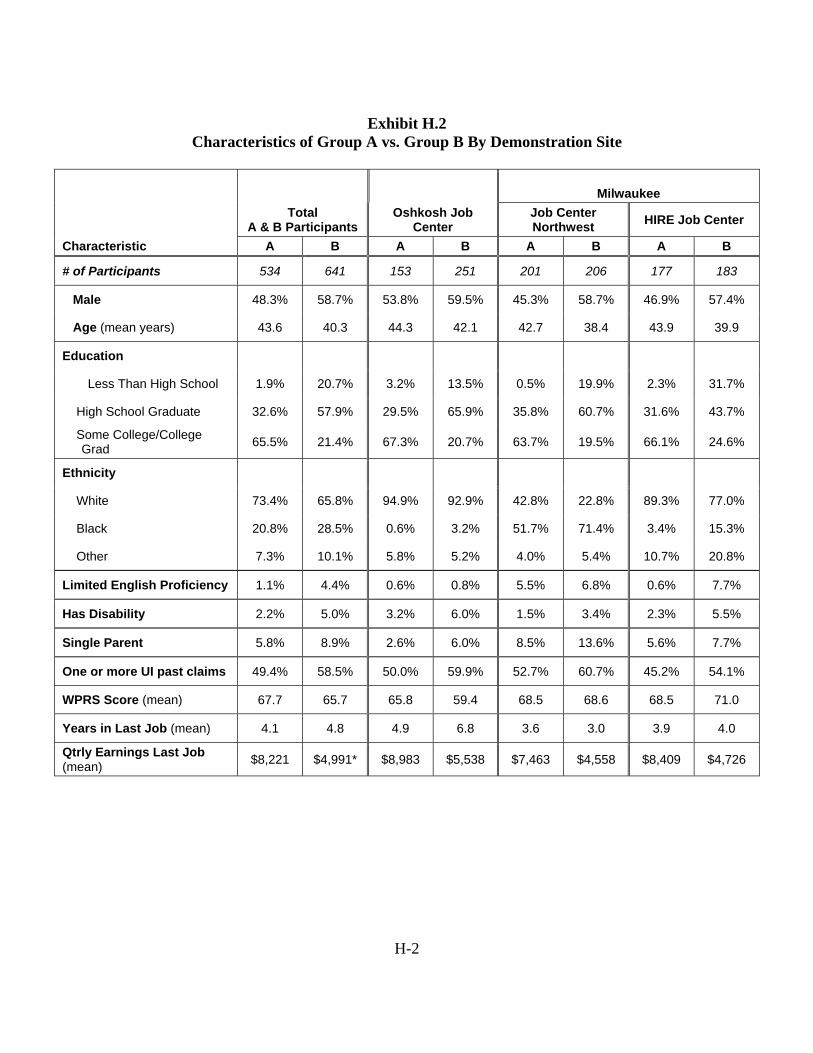
H-2
Exhibit H.2 Characteristics of Group A vs. Group B By Demonstration Site
Milwaukee
Total A & B Participants
Oshkosh Job Center
Job Center Northwest HIRE Job Center
Characteristic A B A B A B A B
# of Participants 534 641 153 251 201 206 177 183
Male 48.3% 58.7% 53.8% 59.5% 45.3% 58.7% 46.9% 57.4%
Age (mean years) 43.6 40.3 44.3 42.1 42.7 38.4 43.9 39.9
Education
Less Than High School 1.9% 20.7% 3.2% 13.5% 0.5% 19.9% 2.3% 31.7%
High School Graduate 32.6% 57.9% 29.5% 65.9% 35.8% 60.7% 31.6% 43.7%
Some College/College Grad 65.5% 21.4% 67.3% 20.7% 63.7% 19.5% 66.1% 24.6%
Ethnicity
White 73.4% 65.8% 94.9% 92.9% 42.8% 22.8% 89.3% 77.0%
Black 20.8% 28.5% 0.6% 3.2% 51.7% 71.4% 3.4% 15.3%
Other 7.3% 10.1% 5.8% 5.2% 4.0% 5.4% 10.7% 20.8%
Limited English Proficiency 1.1% 4.4% 0.6% 0.8% 5.5% 6.8% 0.6% 7.7%
Has Disability 2.2% 5.0% 3.2% 6.0% 1.5% 3.4% 2.3% 5.5%
Single Parent 5.8% 8.9% 2.6% 6.0% 8.5% 13.6% 5.6% 7.7%
One or more UI past claims 49.4% 58.5% 50.0% 59.9% 52.7% 60.7% 45.2% 54.1%
WPRS Score (mean) 67.7 65.7 65.8 59.4 68.5 68.6 68.5 71.0
Years in Last Job (mean) 4.1 4.8 4.9 6.8 3.6 3.0 3.9 4.0
Qtrly Earnings Last Job (mean) $8,221 $4,991* $8,983 $5,538 $7,463 $4,558 $8,409 $4,726

Appendix I
Characteristics of Demonstration Group vs. Comparison Group,
by Site

I-1
Appendix I
Characteristics of Demonstration Group vs. Comparison Group, by Site*
Total Fox Valley Milwaukee
Characteristic Demo Comparison
Oshkosh (Demo)
Menasha (Comp)
Northwest (Demo)
Teutonia (Comp)
HIRE Center (Demo)
South (Comp)
# of Participants 2,180 4,193 748 1,660 699 1,221 733 1,312
Male 56.3% 50.9% 58.8% 54.6% 52.5% 45.0% 57.4% 51.0%
Age (mean years) 40.1 40.1% 41.1 40.3 39.1 39.6 40.2 40.3
Education
Less Than High School 12.2% 11.4% 9.2% 8.3% 11.0% 14.9% 16.2% 12.0%
High School Graduate 53.2% 48.7% 55.3% 49.8% 54.4% 45.2% 49.8% 50.5%
Some College/College Grad 34.6% 40.0% 35.5% 41.9% 34.6% 39.9% 33.9% 37.5%
Ethnicity
White 68.3% 74.0% 92.8% 93.7% 30.0% 31.0% 79.7% 89.2%
Black 24.4% 20.5% 2.5% 1.4% 63.7% 63.6% 9.4% 4.6%
Hispanic 6.3% 4.2% 1.5% 2.5% 2.7% 3.5% 14.7% 6.6%
All Other (including Hispanic) 7.3% 5.5% 5.5% 4.9% 7.2% 5.4% 18.4% 6.2%
Limited English Proficiency 3.0% 3.1% 1.5% 2.1% 3.3% 5.0% 4.4% 2.5%
Has Disability 3.3% 3.6% 4.7% 3.6% 2.3% 3.0% 3.0% 4.3%
Single Parent 8.6% 10.9% 7.4% 8.9% 11.4% 17.7% 7.2% 7.3%
One or more UI past claims 56.1% 54.3% 56.4% 50.6% 60.5% 59.3% 51.4% 54.3%
WPRS Score (mean) 67.2 64.4 62.0 62.9 70.5 66.7 69.2 64.0
Years in Last Job (mean) 4.2 4.1 5.5 4.7 3.1 3.5 3.7 4.1 Qtrly Earnings Last Job (mean) $6,340 $6,620 $6,456 $7,252 $5,790 $6,107 $6,747 $6,299
* Please note that the process of matching demonstration and comparison group members did not restrict matches to the designated comparison site for each demonstration site.

Appendix J
Use of Demonstration and Job Center Services

J-1
Appendix J
Exhibit J.1 Number of Services Each Participant Used At Least Once
MODEL 1
All Sample Members MODEL 2
WPRS 47% or higherMODEL 3 Used RES
# Services Used TOTAL Demo Comp Demo Comp Demo Comp
# Participants 6,373 2,180 4,193 1,824 3,333 1,175 1,290
Average 0.69 1.34*** 0.36 1.34*** 0.40 2.27*** 0.84
0 62.0% 40.5% 73.1% 40.3% 69.8% 1.4% 34.4%
1 19.2% 14.5% 21.7% 14.8% 24.5% 20.4% 54.2%
2 10.1% 23.4% 3.2% 23.4% 3.6% 40.9% 7.2%
3 5.9% 15.4% 1.0% 15.4% 1.0% 26.7% 2.2%
4 2.0% 4.9% 0.6% 4.9% 0.5% 8.5% 1.2%
5 0.6% 1.2% 0.3% 1.2% 0.3% 1.8% 0.6%
6 0.1% 0.1% 0.1% 0.1% 0.2% 0.2% 0.2%
7 0.1% 0.1% 0.1% 0.1% 0.0% 0.2% 0.0%
8 0.0% 0.0% 0.0% 0.0% 0.0% 0.0% 0.0%
9 0.02% 0.0% 0.0% 0.0% 0.0% 0.0% 0.0%
*** Difference is statistically significant at the .01 level

J-2
Exhibit J.2 Use of Services by Demonstration vs. Comparison Groups, by Analysis Model
Model 1
All Sample
Model 2 WPRS 47% or
higher Model 3
Used RES ServicesDemonstration
Group
Service Total Demo Comp Demo Comp Demo Comp Group A Group B
# Participants 6,373 2,180 4,193 1,824 3,333 1,175 1,290 534 641
Initial Assessment
Participated once 16.3% 42.8% 2.5% 43.4% 2.5% 73.6% 4.6% 76.2% 71.5%
Participated multiple times 2.1% 5.5% 0.4% 5.5% 0.4% 9.1% 0.7% 10.1% 8.3%
Customer Specific LMI
Participated once 0.2% 0.1% 0.3% 0.1% 0.3% 0.2% 0.5% 0.4% 0.0%
Participated multiple times 0.0% 0.0% 0.0% 0.0% 0.0% 0.0% 0.0% 0.0% 0.0%
Self Service/Information
Participated once 6.7% 7.0% 6.6% 7.0% 6.6% 9.0% 9.0% 6.7% 10.9%
Participated multiple times 5.9% 5.9% 6.0% 5.9% 5.9% 6.6% 7.8% 4.9% 8.0%
Testing Services
Participated once 0.3% 0.3% 0.3% 0.3% 0.2% 0.5% 0.3% 0.4% 0.6%
Participated multiple times 0.0% 0.0% 0.0% 0.0% 0.0% 0.0% 0.1% 0.0% 0.0%
Job Search Services
Participated once 3.4% 4.8% 2.7% 4.4% 3.0% 7.7% 5.3% 5.2% 9.8%
Participated multiple times 1.1% 1.6% 0.9% 1.6% 0.9% 2.4% 1.6% 2.1% 2.7%
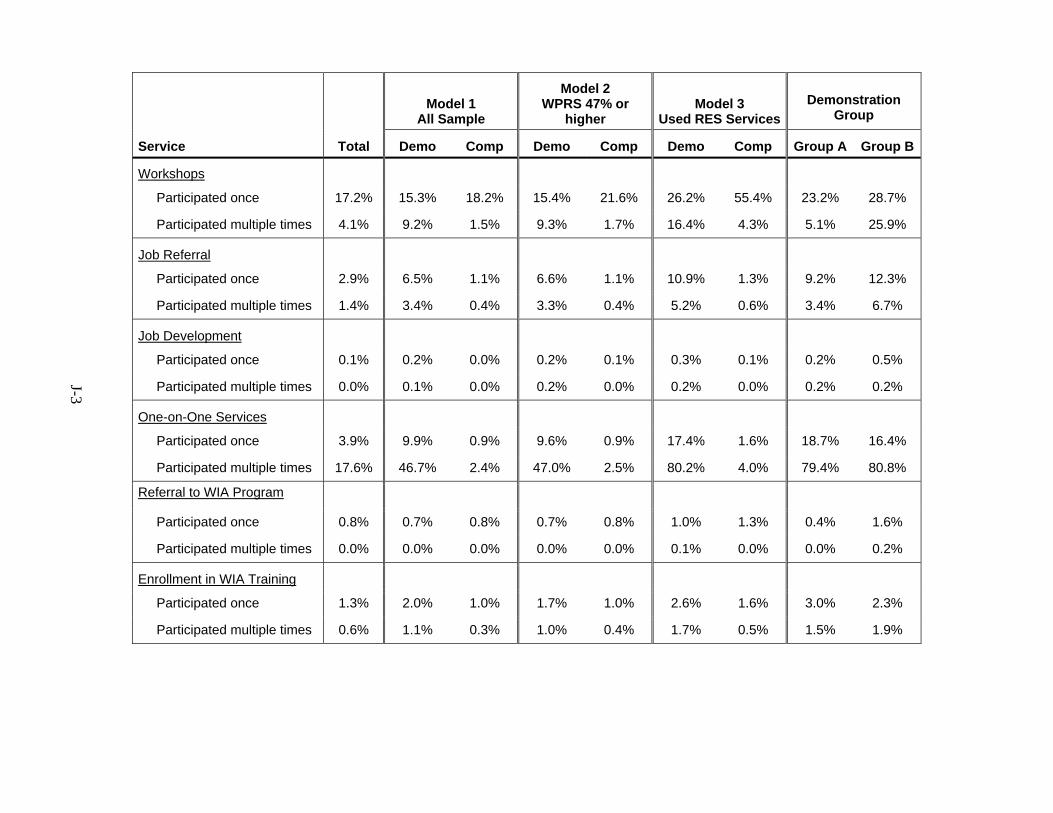
J-3
Model 1
All Sample
Model 2 WPRS 47% or
higher Model 3
Used RES ServicesDemonstration
Group
Service Total Demo Comp Demo Comp Demo Comp Group A Group B
Workshops
Participated once 17.2% 15.3% 18.2% 15.4% 21.6% 26.2% 55.4% 23.2% 28.7%
Participated multiple times 4.1% 9.2% 1.5% 9.3% 1.7% 16.4% 4.3% 5.1% 25.9%
Job Referral
Participated once 2.9% 6.5% 1.1% 6.6% 1.1% 10.9% 1.3% 9.2% 12.3%
Participated multiple times 1.4% 3.4% 0.4% 3.3% 0.4% 5.2% 0.6% 3.4% 6.7%
Job Development
Participated once 0.1% 0.2% 0.0% 0.2% 0.1% 0.3% 0.1% 0.2% 0.5%
Participated multiple times 0.0% 0.1% 0.0% 0.2% 0.0% 0.2% 0.0% 0.2% 0.2%
One-on-One Services
Participated once 3.9% 9.9% 0.9% 9.6% 0.9% 17.4% 1.6% 18.7% 16.4%
Participated multiple times 17.6% 46.7% 2.4% 47.0% 2.5% 80.2% 4.0% 79.4% 80.8%
Referral to WIA Program
Participated once 0.8% 0.7% 0.8% 0.7% 0.8% 1.0% 1.3% 0.4% 1.6%
Participated multiple times 0.0% 0.0% 0.0% 0.0% 0.0% 0.1% 0.0% 0.0% 0.2%
Enrollment in WIA Training
Participated once 1.3% 2.0% 1.0% 1.7% 1.0% 2.6% 1.6% 3.0% 2.3%
Participated multiple times 0.6% 1.1% 0.3% 1.0% 0.4% 1.7% 0.5% 1.5% 1.9%

J-4
Model 1
All Sample
Model 2 WPRS 47% or
higher Model 3
Used RES ServicesDemonstration
Group
Service Total Demo Comp Demo Comp Demo Comp Group A Group BWIA Supportive Services
Participated once 0.5% 1.1% 0.2% 1.0% 0.2% 1.5% 0.4% 1.5% 1.6%
Participated multiple times 0.4% 0.8% 0.1% 0.8% 0.2% 1.3% 0.2% 1.3% 1.2%
Skilled Training
Participated once 0.8% 0.8% 0.8% 0.7% 0.8% 1.3% 1.4% 0.7% 1.7%
Participated multiple times 0.0% 0.1% 0.0% 0.1% 0.0% 0.2% 0.0% 0.0% 0.3%
Referral to non-WIA Partner
Participated once 0.2% 0.2% 0.2% 0.2% 0.2% 0.2% 0.5% 0.0% 0.3%
Participated multiple times 0.0% 0.0% 0.0% 0.0% 0.0% 0.0% 0.1% 0.0% 0.0%
Enrollment in Partner Services
Participated once 0.1% 0.2% 0.0% 0.2% 0.0% 0.2% 0.1% 0.0% 0.3%
Participated multiple times 0.0% 0.0% 0.0% 0.0% 0.0% 0.0% 0.0% 0.0% 0.0%
Referral to non-WIA Support
Participated once 0.3% 0.3% 0.3% 0.2% 0.4% 0.4% 0.9% 0.4% 0.5%
Participated multiple times 0.0% 0.0% 0.0% 0.0% 0.0% 0.0% 0.0% 0.0% 0.0%
Employment Plan Review*
Participated once 12.1% 35.1% 0.1% 35.0% 0.1% 61.9% 0.1% 63.9% 60.2%
Follow-Up Services
Participated once 2.4% 6.8% 0.0% 7.0% 0.0% 12.4% 0.0% 13.1% 11.9%
Participated multiple times 0.0% 0.1% 0.0% 0.1% 0.0% 0.2% 0.0% 0.0% 0.3%
* Participants only attended one Plan Review.

Appendix K
Proportion of Demonstration and Comparison Group
Employed Each Quarter After Claim Date, by Analysis Model

K-1
Appendix K
Proportion of Demonstration and Comparison Group Employeda Each Quarter After Claim Date, by Analysis Model
Model 1
All Sample Members Model 2
WPRS Scores of 47% or Higher Model 3
Used RES Program Outcomes Demo Comp Difference Demo Comp Difference Demo Comp Difference Sample Size 2,180 4,193 -- 1,824 3,333 -- 1,175 1,290 -- Ever Employed After First Claim Week 76.8% 78.2% -1.4% 77.0% 77.3% -0.3% 75.1% 74.4% -0.4%
Employed 1st Quarter 54.2% 53.3% 0.9% 54.1% 52.3% 1.8% 43.7% 42.7% 1.0%
Employed 2nd Quarter 57.8% 56.5% 1.3% 57.5% 55.9% 1.6% 52.3% 53.0% -0.7%
Employed 3rd Quarter 47.6% 52.1% -4.5%** 47.9% 50.9% -3.0%* 46.5% 50.0% -3.5%*
Employed 4th Quarter 36.9% 41.6% -4.7%** 36.6% 40.2% -3.6%** 36.9% 41.2% -4.3%*
Employed 5th Quarter 22.8% 28.2% -5.4%** 22.6% 27.5% -4.9%** 22.8% 27.1% -4.3%**
Employed 6th Quarter 12.1% 16.2% -4.1%** 12.7% 15.8% -3.1%** 13.1% 17.0% -3.9%** a Employment outcomes through 1st quarter 2006 **.01 significance level * .05 significance level

Appendix L
Results of Customer Satisfaction Survey

L-1
Exhibit L.1
Results of Customer Satisfaction Survey on Orientation
Orientation Presenters
Knowledgeable Handouts Useful Facilities
Comfortable Materials Met
Needs Staff Friendly,
Courteous
Self-Assessment Employment Plan
Helpful Overall Rating Percent Percent Percent Percent Percent Percent Percent Total AVERAGE 2.39 2.64 2.78 2.84 2.20 3.03 2.72 (n=914) % RATED 3 OR HIGHER 84.1% 77.5% 75.3% 73.6% 86.4% 68.6% 77.5% % RATED 8 OR UNDER 9.6% 9.2% 10.1% 8.6% 10.5% 8.8% 9.6% Oshkosh AVERAGE 2.83 3.16 3.09 3.38 2.68 3.60 3.20 (n=288) % RATED 3 OR HIGHER 79.5% 70.8% 72.9% 66.3% 80.6% 60.4% 71.2% % RATED 8 OR UNDER 13.5% 13.2% 13.2% 13.2% 15.6% 12.5% 12.8% HIRE Center AVERAGE 2.18 2.60 2.89 2.73 2.00 2.99 2.63 (n=289) % RATED 3 OR HIGHER 86.9% 77.5% 70.6% 74.0% 88.9% 67.1% 77.5% % RATED 8 OR UNDER 7.3% 8.3% 9.0% 6.6% 8.0% 7.6% 8.0% Northwest AVERAGE 2.21 2.26 2.42 2.49 1.98 2.58 2.39 (n=334) % RATED 3 OR HIGHER 85.3% 82.6% 80.8% 78.7% 88.6% 76.3% 82.3% % RATED 8 OR UNDER 8.4% 6.6% 8.4% 6.6% 8.4% 6.6% 8.4%

L-2
Exhibit L.2
Results of Customer Satisfaction Survey on Employment Plan Review
Employment Plan Review
Services Prepared Me
Services Staff Knowledgeable
Services Staff Friendly Courteous
Recommend Job Centers
Use Job Centers Again Overall
Rating Percent Percent Percent Percent Percent Percent Total AVERAGE 3.12 2.68 2.42 2.64 2.79 2.75 (n=663) % RATED 3 OR HIGHER 70.7% 79.6% 83.3% 79.2% 75.3% 77.2% % RATED 8 OR UNDER 13.3% 13.0% 13.0% 11.8% 12.7% 12.5% Oshkosh AVERAGE 3.73 3.13 2.88 3.12 3.35 3.36 (n=221) % RATED 3 OR HIGHER 62.9% 75.1% 78.7% 74.7% 69.2% 70.1% % RATED 8 OR UNDER 19.5% 16.7% 17.6% 15.8% 19.0% 19.0% HIRE Center AVERAGE 2.91 2.33 1.95 2.39 2.38 2.41 (n=150) % RATED 3 OR HIGHER 74.7% 84.0% 88.7% 81.3% 82.7% 82.0% % RATED 8 OR UNDER 9.3% 8.7% 8.0% 8.7% 10.0% 8.7% Northwest AVERAGE 2.72 2.47 2.35 2.38 2.58 2.40 (n=288) % RATED 3 OR HIGHER 75.3% 81.3% 84.0% 81.9% 76.0% 80.6% % RATED 8 OR UNDER 10.8% 12.5% 12.2% 10.4% 9.4% 9.7%

L-3
Exhibit L.3
Customer Satisfaction Survey Results: Orientation
What did you like best about the orientation? HIRE CTR NORTHWEST OSHKOSH TOTAL Presentation Was Clear, Easy to Understand 4 13 9 26 Presentation Was Direct & Concise 11 16 13 40 Information on Education & Training 10 11 1 22 Staff Provided Encouragement 6 6 6 18 Handouts 28 26 29 83 Resources Available at Job Center 5 13 28 46 Location Was Convenient 2 2 1 5 Staff Were Nice People 39 44 36 119 One-on-One Meetings with Staff 20 6 14 40 Staff W ere Professional & Knowledgeable 23 19 16 58 Question & Answer Period 13 10 15 38 It Was Short 2 14 10 26 Group Was Small 4 1 0 5 Snacks Were Provided 0 2 2 4 Information on UI (including presence of UI Staff) 10 7 20 37 Information on Workshops 4 1 9 14 Results will not add to the total number of participants per site. Respondents could provide multiple answers to this open-ended question and only responses mentioned by more than one participant at a site are included in the table.

L-4
Exhibit L.4
Summary Orientation from Customer Satisfaction Survey
What did you like least about the orientation? HIRE CTR NORTHWEST OSHKOSH TOTAL It Was Boring 2 3 4 9 Started Too Late in Job Search Process 0 2 3 5 Group Was Too Big 2 3 5 10 Requirement to Make 5 Job Contacts/Week 0 3 6 9 It Took Too Long 14 13 32 59 Location Was Inconvenient 14 3 2 19 It was Mandatory 7 13 13 33 Wanted More Information Before Meeting 0 4 1 5 Nothing – It Was All Good 145 183 130 458 No Flexibility in Scheduling 6 12 7 25 Not Enough Information/Information Not Relevant 17 10 11 38 Not Designed for Professional Occupations 2 2 7 11 Other Participants Were Rude, Disruptive 5 5 2 12 Staff Had Poor Presentation Skills 1 15 6 22 It Was Repetitious 11 2 6 19 Room Was Uncomfortable (too hot, cold, etc.) 21 18 8 47 Wanted Coffee, Water, Snacks 7 4 0 11 It Was Confusing, Too Much Information 7 1 4 12 It Was Too Short 2 3 1 6 Waiting for One-On-One Interview 9 8 15 32 Wanted More Personal Approach 4 4 8 16 Results will not add to the total number of participants per site. Respondents could provide multiple answers to this open-ended question and only responses mentioned by more than one participant at a site are included in the table.

L-5
Exhibit L.5
Summary Orientation from Customer Satisfaction Survey
What could we do to improve these orientations? HIRE CTR NORTHWEST OSHKOSH TOTAL Provide More Information for People Changing Careers 1 1 2 4 Divide Group by Type Occupation or Job Search Experience 12 4 13 29 Offer Them Sooner After First UI Claim 4 1 1 6 Provide More Information on Education & Training Available 3 2 3 8 Bring In Employers 0 4 0 4 Fix ASSET/Work Registration Software 0 1 3 4 Provide Job Leads, Job Referrals 2 9 7 18 Make Them Less Repetitious 7 0 0 7 Offer In More Locations 9 2 0 11 Make Them Longer 4 0 1 5 Provide More Information on Contents Before Meeting 5 10 6 21 Make Them More Interactive 6 4 4 14 Provide More One-On-One Time With Staff 12 4 24 40 Use More Staff 10 7 8 25 Improve Staff Presentation Skills 8 5 4 17 Make Room More Comfortable (cold, hot, etc.) 10 6 6 22 Offer At Different Times of Day 13 8 3 24 Make Them Shorter 9 5 12 26 Invite a Smaller Group 1 6 12 19 Provide More/Better Coffee, Water, Snacks 7 12 5 24 Start on Time 0 0 2 2 Make Them Voluntary 3 3 2 8
Results will not add to the total number of participants per site. Respondents could provide multiple answers to this open-ended question and only responses mentioned by more than one participant at a site are included in the table.

L-6
Exhibit L.6
Summary Employment Plan Review Customer Service Survey
What were the most useful services you received? HIRE NORTHWEST OSHKOSH TOTAL All of Them Were Useful 3 10 6 19 Information & Support for Changing Careers 2 0 5 7 Information on Education & Training Available 8 8 2 18 Encouragement From Staff 3 5 10 18 Handouts 11 9 6 26 Help With Interview Skills (including workshop) 10 26 22 58 Job Center Resources (including partners) 20 10 11 41 Job Leads, Job Referrals 6 15 4 25 Job Search Journal 1 2 7 10 Information on Job Bank & Other Websites 33 22 28 83 JOBNET 5 9 19 33 None Were Useful 0 5 1 6 Networking (including networking workshop) 3 10 7 20 One-on-One Meetings with Staff 2 7 21 30 Help Improving Resume (including workshop) 40 57 77 174 Information on UI (including presence of UI Staff) 2 1 5 8 Use of Job Center Computers & Internet 11 10 14 35 Workshops 17 23 17 57 Results will not add to the total number of participants per site. Respondents could provide multiple answers to this open-ended question and only responses mentioned by more than one participant at a site are included in the table.

L-7
Exhibit L.7
Summary Employment Plan Review Customer Service Survey
What services were not useful to you? HIRE NORTHWEST OSHKOSH TOTAL None Were Useful 3 0 6 9 Information & Support for Changing Careers 3 0 0 3 Information on Education & Training Available 0 1 0 1 Help With Interview Skills (including workshop) 1 3 9 13 Job Leads, Job Referrals 0 1 1 2 Job Search Journal 0 1 1 2 Information on Job Bank & Other Websites 2 1 1 4 All of Them Were Useful 107 166 145 418 Networking (including networking workshop) 0 2 0 2 RES Orientation 1 0 4 5 Employment Plan Review 1 0 1 2 Help Improving Resume (including workshop) 10 6 13 29 Use of Job Center Computers & Internet 5 5 10 20 Information on Veteran’s Services 0 0 2 2 Workshops 9 2 2 13 Results will not add to the total number of participants per site. Respondents could provide multiple answers to this open-ended question and only responses mentioned by more than one participant at a site are included in the table.

L-8
Exhibit L.8
Summary Employment Plan Review Customer Service Survey
What services would you like to see offered that were not available? HIRE NORTHWEST OSHKOSH TOTAL More Information & Support for Changing Careers 4 2 0 6 Child Care 0 2 0 2 Mental Health Counseling 2 3 2 7 More Information on (& Funding for) Education & Training 7 11 4 22 Bring In Employers 4 6 10 20 Offer In More Locations 2 0 0 2 Focus on Professionals 6 1 5 12 Assistance/Workshop Following-Up With Employers 2 1 1 4 More Interactive, Hands-On Activities 0 1 2 3 Job Placement Services 1 0 4 5 More Computer Assistance 6 3 4 13 More Help With Interview Skills (including workshop) 4 1 9 14 More Networking (including networking workshop) 2 1 2 5 More One-on-One Meetings with Staff 6 6 4 16 More Personalized Services 4 1 2 7 More Help Improving Resume (including workshop) 4 2 2 8 More Workshops 0 3 4 7 More/Better Job Leads, Job Referrals 7 10 4 21 Start Program Sooner After First UI Claim 0 0 2 2 Transportation Assistance 3 0 0 3 Assistance/Workshop Working With Temporary Agencies 0 0 2 2 Results will not add to the total number of participants per site. Respondents could provide multiple answers to this open-ended question and only responses mentioned by more than one participant at a site are included in the table.