adb’s japan funds: japan special fund - oecd.org · jsf ta operations was compared with those...
TRANSCRIPT
Operations Evaluation Department
Reference Number: SES: REG 2007-12 Special Evaluation Study August 2007 ADB’s Japan Funds: Japan Special Fund
Evaluation Study

ABBREVIATIONS
ADB – Asian Development Bank ADTA – advisory technical assistance DMC – developing member country IPF – indicative planning figure JSF – Japan Special Fund Lao PDR – Lao People’s Democratic Republic OED – Operations Evaluation Department PPTA – project preparatory technical assistance RETA – regional technical assistance SES – special evaluation study TA – technical assistance TASF – Technical Assistance Special Fund
NOTE
In this report, “$” refers to US dollars.
Key Words
adb, asian development bank, adb development grants, japanese embassy, japan special fund, jsf, performance assessment, technical assistance, technical assistance special fund
Director General B. Murray, Operations Evaluation Department (OED) Director/Team Leader R. K. Leonard, Operations Evaluation Division 1, OED Team Members A C. Morales, Evaluation Officer, Operations Evaluation Division 1, OED
I. C. De Guzman, Assistant Knowledge Management Administrator, Operations Evaluation Division 1, OED
Operations Evaluation Department, SS-78
CONTENTS
Page EXECUTIVE SUMMARY iii
I. INTRODUCTION 1 A. Study Objectives 1 B. Background 1 C. Approach, Methodology, and Limitations of the Study 1
II. FUND UTILIZATION 3 A. Procedures and Guidelines 3 B. Administration 3 C. Contributions and Allocations 4 D. Sector Distribution 6 E. Processing and Implementation Efficiency 7
III. PERFORMANCE 8 A. Performance Assessment 8 B. Success Factors 11
IV. FUND MANAGEMENT 20
A. Allocation Policy 20 B. IPF Allocations and Funds Available 20 C. Approval Process 21 D. ADB Management 21 E. Managing Risk 22 F. Enhancement of Japanese Profile 22
V. CONCLUSIONS AND RECOMMENDATIONS 23 A. Conclusions 23 B. Recommendations 25
APPENDIXES 1. Evaluation Methodology 26 2. Performance 33 3. Japan Special Fund Transactions 57 4. Key Factors Influencing Technical Assistance Effectiveness 65 5. Recommendations of the Special Evaluation Study on the Performance of 66
Technical Assistance
The guidelines formally adopted by the Operations Evaluation Department (OED) on avoiding conflict of interest in its independent evaluations were observed in the preparation of this report. International consultants Michael Heppell and Graham Walter were assisted by Grace Agnes Sevilla and Cherry Ann Santos, national consultants. To the knowledge of the management of OED, there were no conflicts of interest of the persons preparing, reviewing, or approving this report.
EXECUTIVE SUMMARY
This study of the Japan Special Fund (JSF) has been prepared within the framework of a special evaluation study (SES) conducted by the Asian Development Bank’s (ADB) Operations Evaluation Department (OED) on the three Japanese grant funds administered by ADB through its Office of Cofinancing Operations.
The JSF was established in March 1988 to provide financial support for ADB's technical
assistance (TA) program in the form of an untied grant, with ADB as administrator of the fund. ADB’s regular policies for TA projects were to generally apply to JSF-financed TAs. The Fund was to be utilized for supporting the efforts of developing member countries towards industrialization, natural resource development, human resource development and transfer of technology. Projects eligible for financing or cofinancing were to include (i) TAs in the public or private sector for the formulation and preparation of development projects and programs, advisory services, and regional activities; (ii) private sector development projects or programs through equity investments in private entities; and (iii) TA components of public sector development projects or programs financed under loans from ADB.
In April 2006, new policy guidelines were issued, which for the first time more specifically spelled out directions for the use of the JSF for that year while reconfirming that TAs should help prepare ADB projects or programs and be used for institution building and regional activities. These guidelines were reissued for 2007 with only minor changes. A ceiling of $2 million was introduced, which can be exceeded for exceptional reasons. Key points are as follows:
(i) Project preparatory TA (PPTA) and advisory TA (ADTA) accompanying a loan are
preferred. (ii) All proposals should be included in the relevant country strategy and program (now
country partnership strategy) or concept approved by a vice president. Other TA activities (regional TA [RETA] or stand-alone TA projects) should be clearly linked to ADB operations.
(iii) There is a mandatory requirement for coordination with Japanese embassies. (iv) Specific and measurable indicators and risks should be identified in all TA
proposals except those for PPTAs. (v) Nonconsultant costs are pegged at a maximum of 10% of the total TA amount. (vi) Study tours and foreign training are no longer allowed. (vii) The importance of signing ceremonies with Japanese embassy officials present is
reemphasized. This evaluation included a broad coverage of ADTA and PPTA funded by the JSF.
Analysis confirmed that there was little difference in JSF and regular TA operations at the strategic, department, country, or sector levels; however, a significantly higher proportion of JSF funds was allocated to PPTA compared with the TA Special Fund (TASF). The performance of JSF TA operations was compared with those funded under the TASF and other trust funds managed by ADB.
The study comprised both a desk review of the JSF and TASF program and fieldwork in
four countries (Indonesia, Lao People’s Democratic Republic, Mongolia, and Nepal). The four countries selected for fieldwork were chosen to cover diverse geopolitical systems and different countries from prior evaluations. In total, the study evaluated 174 JSF TA projects, comprising 99 ADTAs and 75 PPTAs, representing 14% of total JSF ADTAs and 11% of JSF

iv
PPTAs. The database was supplemented by the findings of six other OED evaluations that had used the same methodology. The methodology employed survey questionnaires and structured interviews with project staff (including resident mission staff), staff of executing agencies, and TA implementation consultants. Performance assessment used OED’s standard evaluation criteria of relevance, effectiveness, efficiency, and sustainability. Ratings were compared with those provided in TA completion reports.
Allocations. While no percentage of allocations is specified in the JSF guidelines,
in 2007 ADB used an indicative planning figure that implied that 70% of JSF is targeted for PPTAs, with 30% for ADTAs and RETAs. This allocation is not achievable. The annual value of PPTAs is currently about $50 million, which, if completely allocated to the JSF, would represent 63% of the total JSF funds available for 2007. Having all PPTAs funded by the JSF may not in the best interest of either ADB or Japan.
Performance. The study rates the overall performance of JSF TA projects successful,
based on OED’s four-point scale (highly successful, successful, partly successful, or unsuccessful), with 65% of JSF ADTAs and 67% of PPTAs rated successful. Success ratings are just below ADB’s target for 2010 of 70% of TA projects to be so rated. ADTAs in particular have frequently addressed very complex issues in areas with a high degree of difficulty—a factor that should also be taken into account when assessing the degree of success. The JSF has outperformed challenging benchmarks for effectiveness and efficiency. The relevance rating suggests the need for a more strategic approach to JSF resource allocation. Sustainability is more complex but could be addressed by longer term TA engagement and larger TA projects and/or cluster TA projects. Although a significant minority of ADTAs are rated partly successful, this does not mean they have failed. Reasons for partial success vary. Sometimes objectives are overambitious in relation to the resources provided and the implementation period set.
There is considerable diversity in sector ratings and across countries. Among the sample
countries, TAs in India and Viet Nam have been particularly successful. ADTAs in Lao People’s Democratic Republic, Philippines, and Samoa also performed well, as did PPTAs in Mongolia, Nepal, and Uzbekistan. TAs in Indonesia performed less well. Part of the solution to the variation in performance of TA by country and sector is for the assumptions and risk column in a design and monitoring (logical) framework to better assess risk and for consideration to be explicitly given to how it will be managed.
A number of factors associated with success are: (i) clarity of objectives; (ii) need and ownership (country ownership, priority, agency and beneficiary input
into design, selection of consultants, identification of client, provision of counterparts, and appropriate process);
(iii) adequacy of time and resources; (iv) quality of consultants; (v) continuous alignment of objectives and client priorities; and (vi) customer satisfaction and client relationship management. Approval Process. While the requirement by Japan to approve each TA is not onerous,
adding 4–5 weeks to the process, it is unclear what value it adds other than Government of Japan ownership.
v
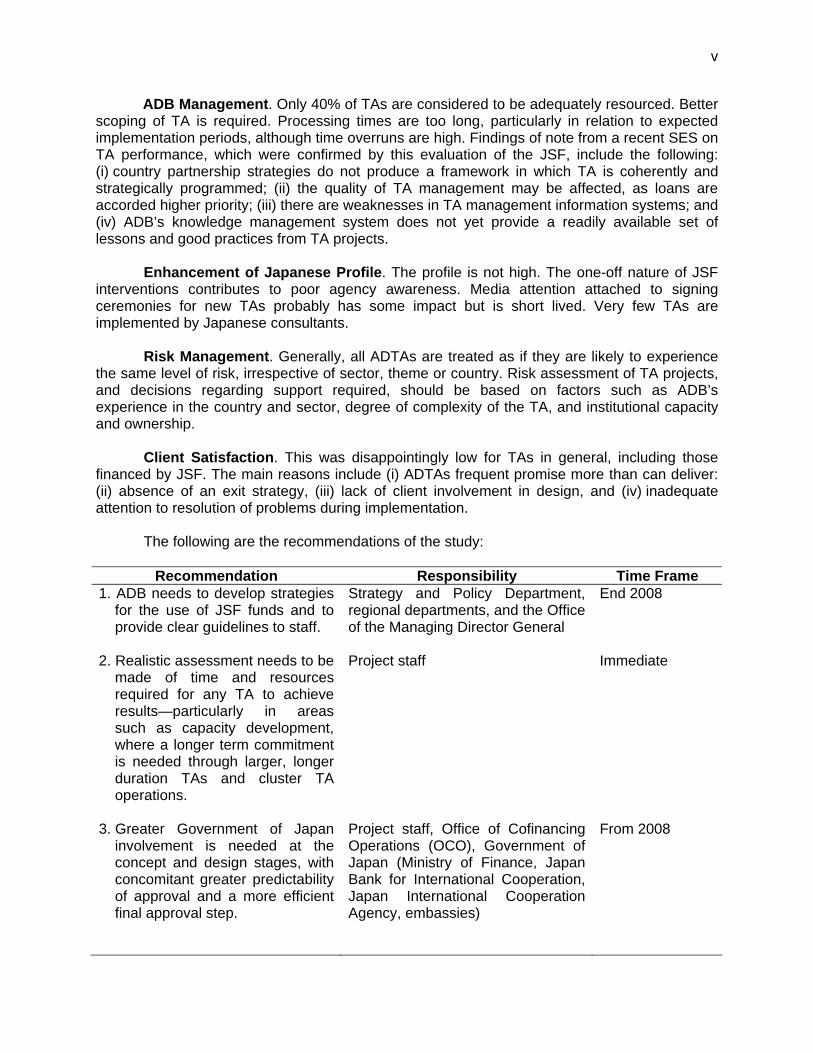
ADB Management. Only 40% of TAs are considered to be adequately resourced. Better scoping of TA is required. Processing times are too long, particularly in relation to expected implementation periods, although time overruns are high. Findings of note from a recent SES on TA performance, which were confirmed by this evaluation of the JSF, include the following: (i) country partnership strategies do not produce a framework in which TA is coherently and strategically programmed; (ii) the quality of TA management may be affected, as loans are accorded higher priority; (iii) there are weaknesses in TA management information systems; and (iv) ADB’s knowledge management system does not yet provide a readily available set of lessons and good practices from TA projects.
Enhancement of Japanese Profile. The profile is not high. The one-off nature of JSF interventions contributes to poor agency awareness. Media attention attached to signing ceremonies for new TAs probably has some impact but is short lived. Very few TAs are implemented by Japanese consultants. Risk Management. Generally, all ADTAs are treated as if they are likely to experience the same level of risk, irrespective of sector, theme or country. Risk assessment of TA projects, and decisions regarding support required, should be based on factors such as ADB’s experience in the country and sector, degree of complexity of the TA, and institutional capacity and ownership. Client Satisfaction. This was disappointingly low for TAs in general, including those financed by JSF. The main reasons include (i) ADTAs frequent promise more than can deliver: (ii) absence of an exit strategy, (iii) lack of client involvement in design, and (iv) inadequate attention to resolution of problems during implementation.
The following are the recommendations of the study:
Recommendation Responsibility Time Frame 1. ADB needs to develop strategies
for the use of JSF funds and to provide clear guidelines to staff.
Strategy and Policy Department, regional departments, and the Office of the Managing Director General
End 2008
2. Realistic assessment needs to be
made of time and resources required for any TA to achieve results—particularly in areas such as capacity development, where a longer term commitment is needed through larger, longer duration TAs and cluster TA operations.
Project staff Immediate
3. Greater Government of Japan
involvement is needed at the concept and design stages, with concomitant greater predictability of approval and a more efficient final approval step.
Project staff, Office of Cofinancing Operations (OCO), Government of Japan (Ministry of Finance, Japan Bank for International Cooperation, Japan International Cooperation Agency, embassies)
From 2008
vi
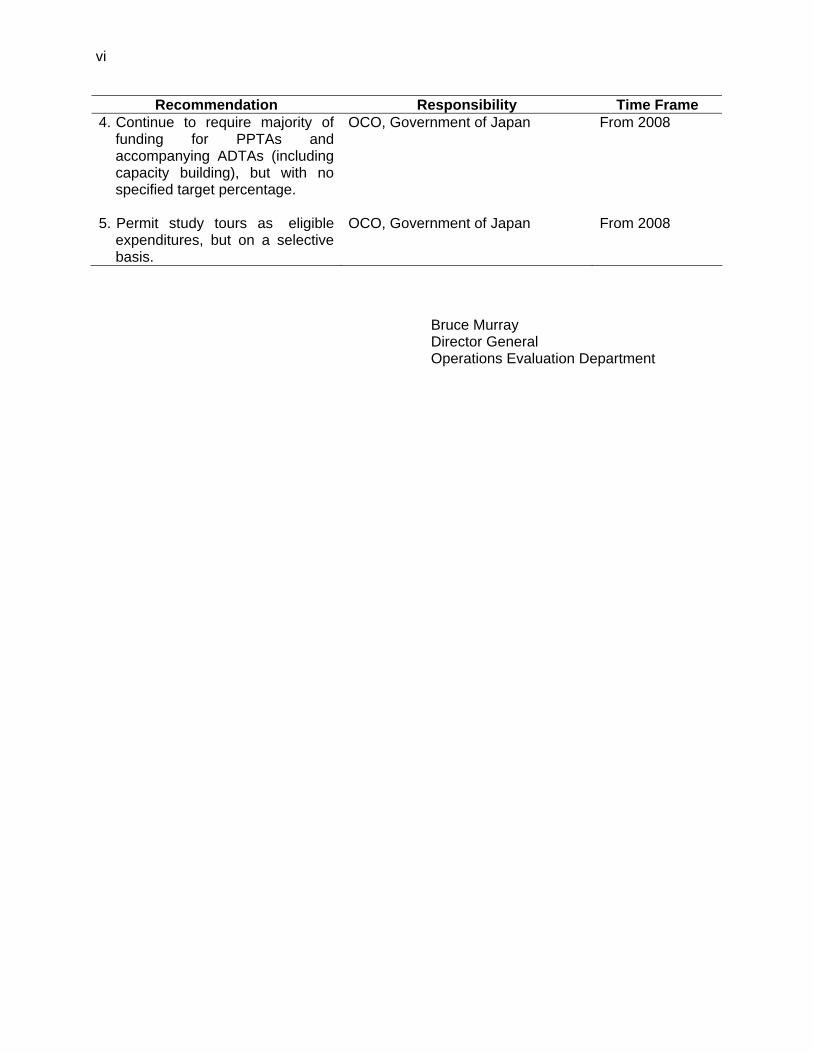
Recommendation Responsibility Time Frame 4. Continue to require majority of
funding for PPTAs and accompanying ADTAs (including capacity building), but with no specified target percentage.
OCO, Government of Japan From 2008
5. Permit study tours as eligible
expenditures, but on a selective basis.
OCO, Government of Japan From 2008
Bruce Murray Director General Operations Evaluation Department
I. INTRODUCTION
A. Study Objectives 1. This evaluation of the Japan Special Fund (JSF) was undertaken by the Operations Evaluation Department (OED) of the Asian Development Bank (ADB) at the request of, and funded by, the Government of Japan. It (i) assesses the performance of the JSF from its inception in 1988 through 2006; (ii) highlights JSF accomplishments, opportunities, and strengths; and identifies constraints and weaknesses; (iii) reviews the management and operation of the Fund; (iv) assesses the extent of the visibility of Japan, and whether coordination arrangements with Japanese aid agencies (such as the Japan Bank for International Cooperation and the Japan International Cooperation Agency) and Japanese embassies are appropriate or require changing; and (v) provides recommendations for future administration of the JSF. 2. The report sets out to answer three principal questions aimed at more effective and efficient management of the JSF: (i) in what areas did the Fund perform well, and what areas need improvement; (ii) how should risk be managed more effectively; and (iii) how should the JSF be managed more effectively so that development objectives are achieved? B. Background 3. The JSF was established in March 1988 when Japan entered into an agreement with ADB to provide financial support for ADB's technical assistance (TA) program in the form of an untied grant, with ADB becoming the administrator of the Fund. The objectives of the JSF were to help ADB’s developing member countries (DMCs) restructure their economies in light of the changing global environment and to broaden the scope of investment opportunities. The initial guidelines stated that preference should be given to projects that would contribute to these objectives. The Fund was to be utilized for supporting the efforts of DMCs towards industrialization, natural resource development, human resource development, and transfer of technology; in addition, it would support ADB’s efforts to promote regional cooperation and capacity enhancement in DMCs. Projects eligible for financing or cofinancing were to include (i) TA projects in the public or private sector for the formulation and preparation of development projects and programs, advisory services, and regional activities; (ii) private sector development projects or programs through equity investments in private entities; and (iii) TA components of public sector development projects or programs financed under loans from ADB. ADB’s regular policies for TA projects would generally apply to JSF-financed TA projects. Financing or cofinancing from the JSF is entirely on a grant basis and is not subject to any reimbursement requirements.1 C. Approach, Methodology, and Limitations of the Study 4. This evaluation of the JSF program included a broad coverage of advisory TA (ADTA) and project preparatory TA (PPTA) funded by the JSF. The JSF is regarded as a core part of ADB’s TA program, with administration in accordance with standard practices. Analysis confirmed that there was little difference in JSF and regular TA operations at the strategic, department, country or sector levels, although there is a far higher proportion of PPTAs in the JSF portfolio than under the TA Special Fund (TASF). The performance of JSF TA projects was compared with those funded under the TASF and other trust funds managed by ADB. 1 Further details concerning the JSF can be found on the web at http://www.adb.org/JSF/default.asp.

2
If differences were minimal, then the findings and conclusions of other evaluation studies could be used in the evaluation of the JSF. 5. The methodology used in this study has been used by OED in several evaluations since 1995 (see Appendix 1 for details of the methodology and its background). The study comprised both a desk review of the JSF and TASF2 programs and fieldwork in four DMCs (Indonesia, Lao People’s Democratic Republic [Lao PDR], Mongolia, and Nepal). The study evaluated 174 JSF TA projects comprising 99 ADTAs and 75 PPTAs. This is 14% of the total JSF ADTAs and 11% of JSF PPTAs. The field evaluation covered 30 ADTAs and 39 PPTAs. In 2006, OED evaluated the performance of TA operations in a special evaluation study (SES).3 That SES provided valuable input to this study, as its sample covered 13 JSF and 55 non-JSF ADTAs, and 18 JSF and 22 non-JSF PPTAs. The database was supplemented by the findings of five other OED evaluations4 that used the same methodology. 6. The four countries selected for fieldwork were chosen to cover diverse geopolitical systems and different countries from prior evaluations. The selection of the TA projects for fieldwork was designed to be representative of sectors and operations in each DMC. Survey questionnaires and structured interviews with project staff (including resident mission staff), staff of executing agencies, and project implementation consultants were the key instruments used. The information from these formed the core qualitative data for this study, and together with the quantitative desk analysis, contributed to the basis for the assessment. Performance assessment used OED’s standard evaluation criteria of relevance, effectiveness, efficiency, and sustainability. Ratings were compared with those provided in TA completion reports.5 An assessment of the performance of JSF and non-JSF TAs is found in Appendix 2 of this report. 7. As a caveat, it was not possible to conduct a detailed analysis of each TA and its consequences due to resource limitations. This, however, could be addressed and would be more appropriate for specific studies of related TA projects in the future. Nonetheless, the broad coverage of this study provides a clearer view of the efficiency of JSF allocation and allows a comparison of success achieved by non-JSF TA projects including the identification of important and wide-ranging issues related to ADB’s TA facilities.
2 A detailed study comparing the distribution and performance of JSF and non-JSF operations is found in
Appendix 2. 3 ADB. 2007. Special Evaluation Study on the Performance of Technical Assistance. Manila. Available:
http://www.adb.org/Documents/SES/REG/sst-reg-2007-02/SST-REG-2007-02.asp. 4 ADB. 1995. Assessment of the Effectiveness of Bank Assistance in Capacity Building to Western Samoa. Manila;
ADB. 1996. Assessment of the Effectiveness of Bank Technical Assistance for Capacity Building in Indonesia. Manila; ADB. 1998. Impact of Bank Project Preparatory Technical Assistance in the Agriculture Sector in Bangladesh. Manila; ADB. 2004. Country Assistance Program Evaluation for Cambodia. Manila; and ADB. 2006. Country Assistance Program Evaluation for Uzbekistan. Manila.
5 The study drew on various databases to (i) collate technical assistance completion report ratings; (ii) identify TA projects accompanying loans; (iii) compute elapsed time from start to end of fact-finding, original and actual completion dates, and start date of TA and fielding of consultants; (iv) itemize unspent and disbursed amounts; and (v) compute percentage value of JSF and TASF PPTAs approved from 2000 to 2004 not producing a loan. None of these seemingly simple tasks could be readily accomplished. For example, several databases had to be accessed for basic information such as original and revised completion dates. This experience revealed deficiencies in ADB’s TA information systems.
3
II. FUND UTILIZATION
A. Procedures and Guidelines 8. There is one main difference in the procedure for approving TA projects from the JSF versus those from other sources. Periodically, ADB seeks the approval of Japan regarding batches of TA projects proposed to be financed from the JSF. Subsequent to approval by Japan, processing of the TA projects follows standard ADB procedures. 9. In April 2006, new policy guidelines were issued6 reconfirming the objectives of the Fund to help prepare ADB projects or programs, and for institution building and regional activities. For the first time, the guidelines spelled out more specifically directions for the use of the JSF for the year, key points being as follows:
(i) PPTAs or accompanying ADTAs were preferred over other types. (ii) All proposals should be included in the relevant country strategy and program
(now country partnership strategy) or concept approved by a vice president. Other TA projects (regional TA [RETA], stand-alone TA projects) should be clearly linked to ADB operations.
(iii) Coordination with Japanese embassies became mandatory. (iv) Specific and measurable indicators and risks should be identified in all TA
proposals, except PPTAs. (v) Nonconsultant costs were limited to a maximum of 10% of the total TA amount. (vi) Study tours and foreign training were no longer allowed. (vii) The importance of signing ceremonies with Japanese embassy officials present
was reemphasized. 10. These guidelines were reissued for 2007, with only minor changes.7 A ceiling of $2 million was introduced, which can be exceeded for exceptional reasons. The indicative budget was $65 million in 2006 and is $65 million for 2007, with the latter to be processed in six batches with an agreed upon processing schedule. B. Administration 11. A small unit has been established in ADB’s Office of Cofinancing Operations to process the work of a number of Japanese funds including the JSF. ADB is solely responsible for the administration of JSF-financed operations. All budgetary requirements for JSF-financed activities are incorporated in the regular internal administrative budget, and normal budgetary procedures are applicable. Income from investment and reinvestment of JSF proceeds pending disbursement is used to defray the costs incurred in the processing and administration of JSF-financed activities. 12. Once approval for a TA has been given, a signing ceremony is held in which officials of the local embassy of Japan are invited to participate. In the countries visited, each embassy interviewed stated that this was a useful event in the context of its own work in official development assistance. After the signing ceremony, there is little further involvement of in-country Japanese agencies in a TA and no formal reporting of progress to Japan. However,
6 ADB. 2006. JSF Technical Assistance and Resource Allocation 2006 Guidelines. Manila. 7 Available: http://www.adb.org/JSF/jsf-policy-guidelines-2007.pdf.
4
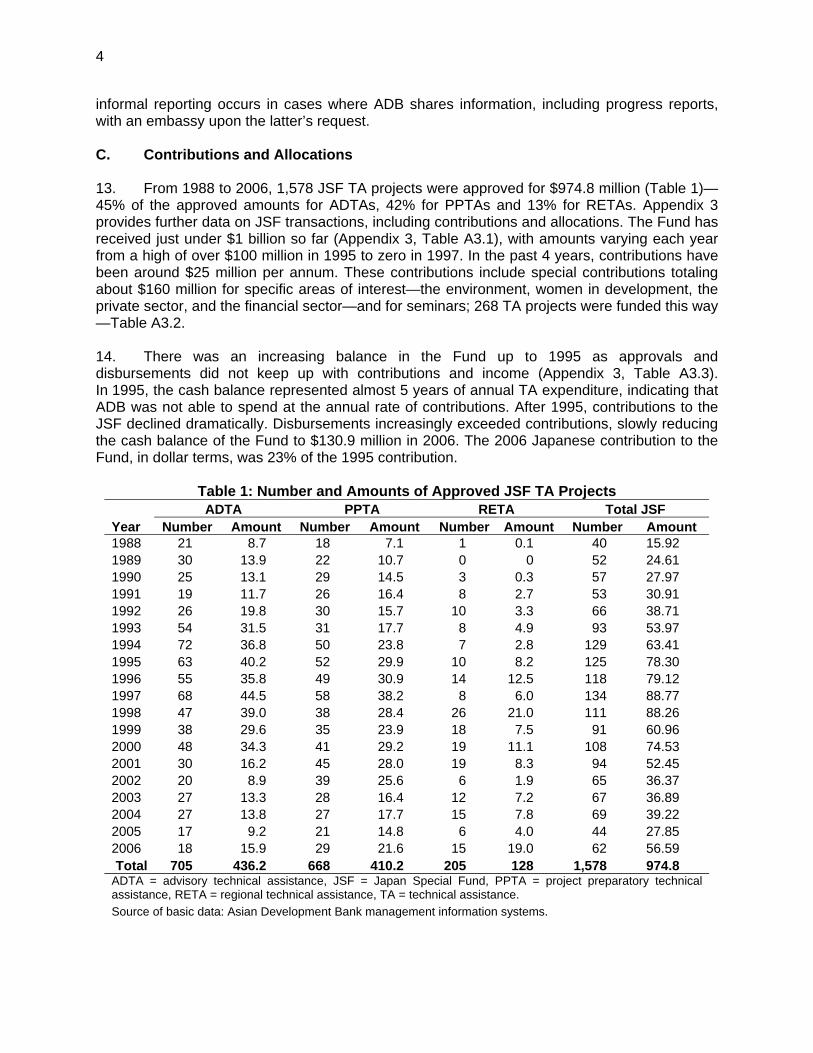
informal reporting occurs in cases where ADB shares information, including progress reports, with an embassy upon the latter’s request. C. Contributions and Allocations 13. From 1988 to 2006, 1,578 JSF TA projects were approved for $974.8 million (Table 1)—45% of the approved amounts for ADTAs, 42% for PPTAs and 13% for RETAs. Appendix 3 provides further data on JSF transactions, including contributions and allocations. The Fund has received just under $1 billion so far (Appendix 3, Table A3.1), with amounts varying each year from a high of over $100 million in 1995 to zero in 1997. In the past 4 years, contributions have been around $25 million per annum. These contributions include special contributions totaling about $160 million for specific areas of interest—the environment, women in development, the private sector, and the financial sector—and for seminars; 268 TA projects were funded this way —Table A3.2. 14. There was an increasing balance in the Fund up to 1995 as approvals and disbursements did not keep up with contributions and income (Appendix 3, Table A3.3). In 1995, the cash balance represented almost 5 years of annual TA expenditure, indicating that ADB was not able to spend at the annual rate of contributions. After 1995, contributions to the JSF declined dramatically. Disbursements increasingly exceeded contributions, slowly reducing the cash balance of the Fund to $130.9 million in 2006. The 2006 Japanese contribution to the Fund, in dollar terms, was 23% of the 1995 contribution.
Table 1: Number and Amounts of Approved JSF TA Projects ADTA PPTA RETA Total JSF Year Number Amount Number Amount Number Amount Number Amount 1988 21 8.7 18 7.1 1 0.1 40 15.92 1989 30 13.9 22 10.7 0 0 52 24.61 1990 25 13.1 29 14.5 3 0.3 57 27.97 1991 19 11.7 26 16.4 8 2.7 53 30.91 1992 26 19.8 30 15.7 10 3.3 66 38.71 1993 54 31.5 31 17.7 8 4.9 93 53.97 1994 72 36.8 50 23.8 7 2.8 129 63.41 1995 63 40.2 52 29.9 10 8.2 125 78.30 1996 55 35.8 49 30.9 14 12.5 118 79.12 1997 68 44.5 58 38.2 8 6.0 134 88.77 1998 47 39.0 38 28.4 26 21.0 111 88.26 1999 38 29.6 35 23.9 18 7.5 91 60.96 2000 48 34.3 41 29.2 19 11.1 108 74.53 2001 30 16.2 45 28.0 19 8.3 94 52.45 2002 20 8.9 39 25.6 6 1.9 65 36.37 2003 27 13.3 28 16.4 12 7.2 67 36.89 2004 27 13.8 27 17.7 15 7.8 69 39.22 2005 17 9.2 21 14.8 6 4.0 44 27.85 2006 18 15.9 29 21.6 15 19.0 62 56.59 Total 705 436.2 668 410.2 205 128 1,578 974.8
ADTA = advisory technical assistance, JSF = Japan Special Fund, PPTA = project preparatory technical assistance, RETA = regional technical assistance, TA = technical assistance. Source of basic data: Asian Development Bank management information systems.
5
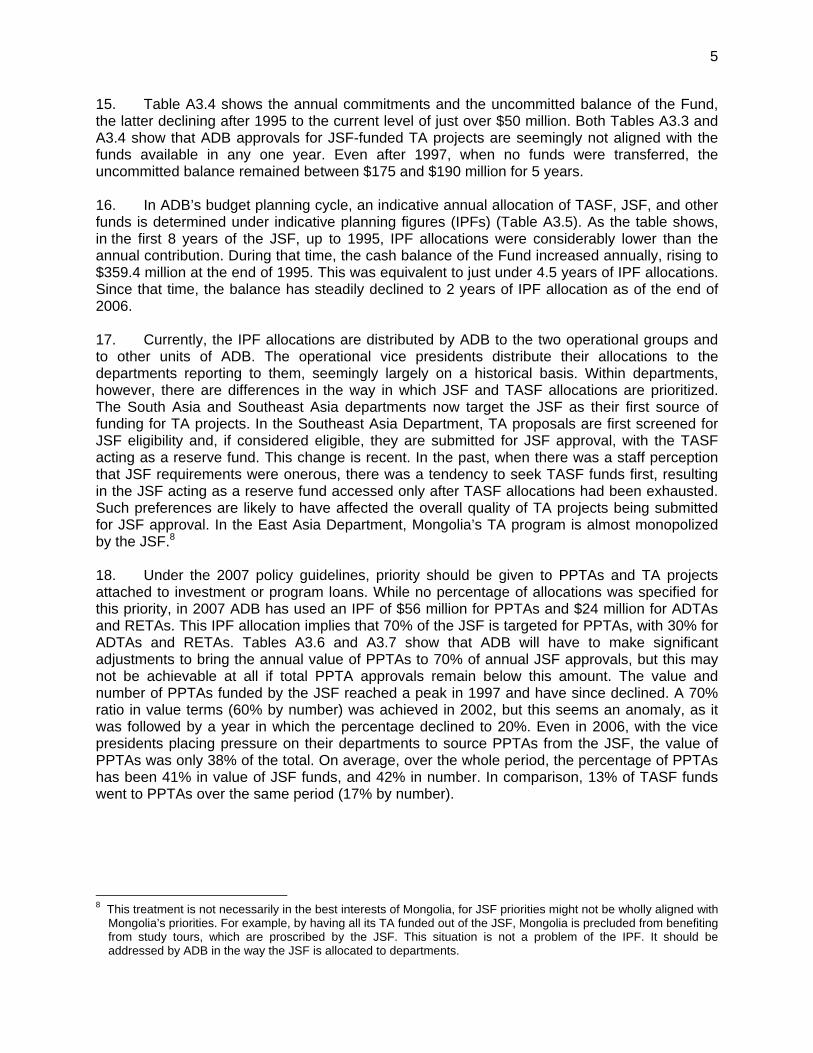
15. Table A3.4 shows the annual commitments and the uncommitted balance of the Fund, the latter declining after 1995 to the current level of just over $50 million. Both Tables A3.3 and A3.4 show that ADB approvals for JSF-funded TA projects are seemingly not aligned with the funds available in any one year. Even after 1997, when no funds were transferred, the uncommitted balance remained between $175 and $190 million for 5 years. 16. In ADB’s budget planning cycle, an indicative annual allocation of TASF, JSF, and other funds is determined under indicative planning figures (IPFs) (Table A3.5). As the table shows, in the first 8 years of the JSF, up to 1995, IPF allocations were considerably lower than the annual contribution. During that time, the cash balance of the Fund increased annually, rising to $359.4 million at the end of 1995. This was equivalent to just under 4.5 years of IPF allocations. Since that time, the balance has steadily declined to 2 years of IPF allocation as of the end of 2006. 17. Currently, the IPF allocations are distributed by ADB to the two operational groups and to other units of ADB. The operational vice presidents distribute their allocations to the departments reporting to them, seemingly largely on a historical basis. Within departments, however, there are differences in the way in which JSF and TASF allocations are prioritized. The South Asia and Southeast Asia departments now target the JSF as their first source of funding for TA projects. In the Southeast Asia Department, TA proposals are first screened for JSF eligibility and, if considered eligible, they are submitted for JSF approval, with the TASF acting as a reserve fund. This change is recent. In the past, when there was a staff perception that JSF requirements were onerous, there was a tendency to seek TASF funds first, resulting in the JSF acting as a reserve fund accessed only after TASF allocations had been exhausted. Such preferences are likely to have affected the overall quality of TA projects being submitted for JSF approval. In the East Asia Department, Mongolia’s TA program is almost monopolized by the JSF.8 18. Under the 2007 policy guidelines, priority should be given to PPTAs and TA projects attached to investment or program loans. While no percentage of allocations was specified for this priority, in 2007 ADB has used an IPF of $56 million for PPTAs and $24 million for ADTAs and RETAs. This IPF allocation implies that 70% of the JSF is targeted for PPTAs, with 30% for ADTAs and RETAs. Tables A3.6 and A3.7 show that ADB will have to make significant adjustments to bring the annual value of PPTAs to 70% of annual JSF approvals, but this may not be achievable at all if total PPTA approvals remain below this amount. The value and number of PPTAs funded by the JSF reached a peak in 1997 and have since declined. A 70% ratio in value terms (60% by number) was achieved in 2002, but this seems an anomaly, as it was followed by a year in which the percentage declined to 20%. Even in 2006, with the vice presidents placing pressure on their departments to source PPTAs from the JSF, the value of PPTAs was only 38% of the total. On average, over the whole period, the percentage of PPTAs has been 41% in value of JSF funds, and 42% in number. In comparison, 13% of TASF funds went to PPTAs over the same period (17% by number).
8 This treatment is not necessarily in the best interests of Mongolia, for JSF priorities might not be wholly aligned with
Mongolia’s priorities. For example, by having all its TA funded out of the JSF, Mongolia is precluded from benefiting from study tours, which are proscribed by the JSF. This situation is not a problem of the IPF. It should be addressed by ADB in the way the JSF is allocated to departments.
6
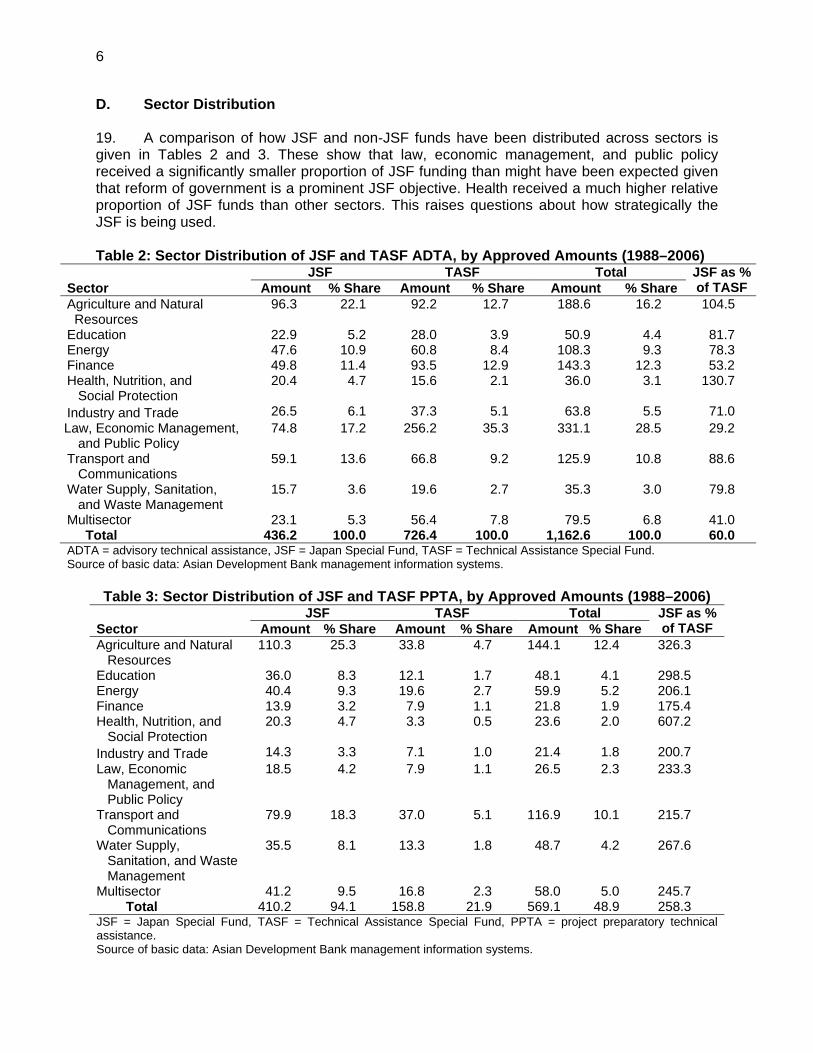
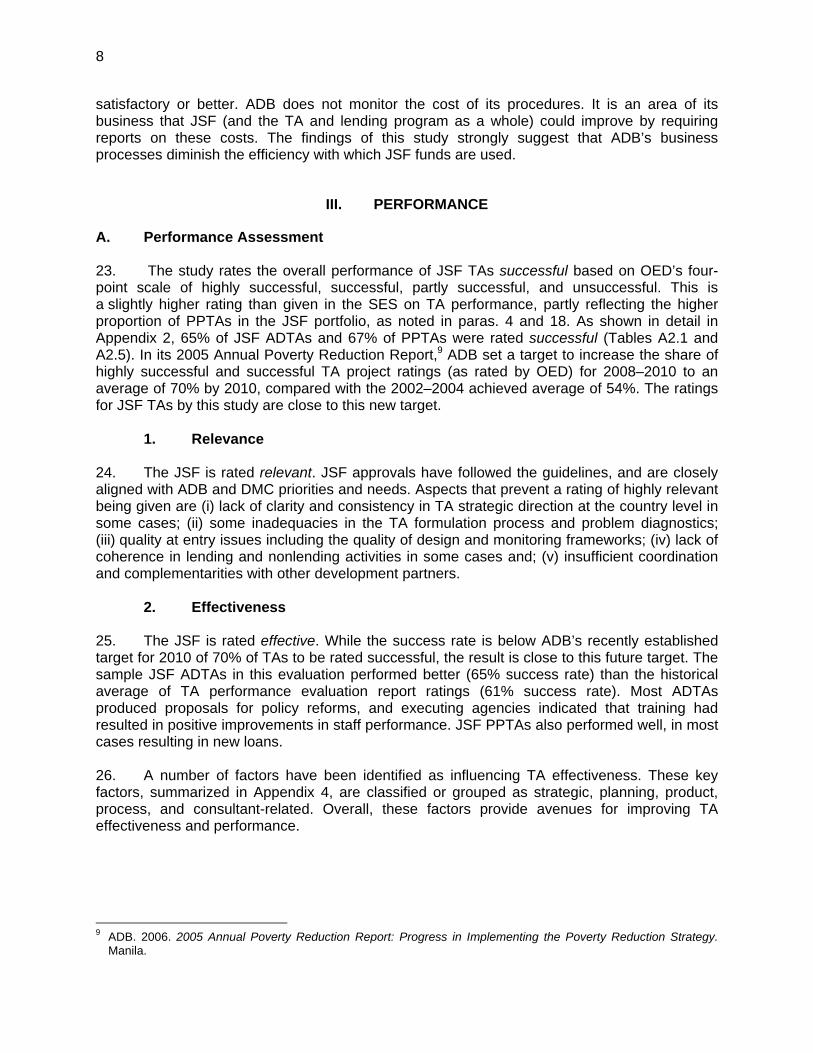
D. Sector Distribution 19. A comparison of how JSF and non-JSF funds have been distributed across sectors is given in Tables 2 and 3. These show that law, economic management, and public policy received a significantly smaller proportion of JSF funding than might have been expected given that reform of government is a prominent JSF objective. Health received a much higher relative proportion of JSF funds than other sectors. This raises questions about how strategically the JSF is being used. Table 2: Sector Distribution of JSF and TASF ADTA, by Approved Amounts (1988–2006)
JSF TASF Total Sector Amount % Share Amount % Share Amount % Share
JSF as % of TASF
Agriculture and Natural Resources
96.3 22.1 92.2 12.7 188.6 16.2 104.5
Education 22.9 5.2 28.0 3.9 50.9 4.4 81.7 Energy 47.6 10.9 60.8 8.4 108.3 9.3 78.3 Finance 49.8 11.4 93.5 12.9 143.3 12.3 53.2 Health, Nutrition, and Social Protection
20.4 4.7 15.6 2.1 36.0 3.1 130.7
Industry and Trade 26.5 6.1 37.3 5.1 63.8 5.5 71.0 Law, Economic Management, and Public Policy
74.8 17.2 256.2 35.3 331.1 28.5 29.2
Transport and Communications
59.1 13.6 66.8 9.2 125.9 10.8 88.6
Water Supply, Sanitation, and Waste Management
15.7 3.6 19.6 2.7 35.3 3.0 79.8
Multisector 23.1 5.3 56.4 7.8 79.5 6.8 41.0 Total 436.2 100.0 726.4 100.0 1,162.6 100.0 60.0 ADTA = advisory technical assistance, JSF = Japan Special Fund, TASF = Technical Assistance Special Fund. Source of basic data: Asian Development Bank management information systems.
Table 3: Sector Distribution of JSF and TASF PPTA, by Approved Amounts (1988–2006)
JSF TASF Total Sector Amount % Share Amount % Share Amount % Share
JSF as % of TASF
Agriculture and Natural Resources
110.3 25.3 33.8 4.7 144.1 12.4 326.3
Education 36.0 8.3 12.1 1.7 48.1 4.1 298.5 Energy 40.4 9.3 19.6 2.7 59.9 5.2 206.1 Finance 13.9 3.2 7.9 1.1 21.8 1.9 175.4Health, Nutrition, and Social Protection
20.3 4.7 3.3 0.5 23.6 2.0 607.2
Industry and Trade 14.3 3.3 7.1 1.0 21.4 1.8 200.7 Law, Economic Management, and Public Policy
18.5 4.2 7.9 1.1 26.5 2.3 233.3
Transport and Communications
79.9 18.3 37.0 5.1 116.9 10.1 215.7
Water Supply, Sanitation, and Waste Management
35.5 8.1 13.3 1.8 48.7 4.2 267.6
Multisector 41.2 9.5 16.8 2.3 58.0 5.0 245.7 Total 410.2 94.1 158.8 21.9 569.1 48.9 258.3 JSF = Japan Special Fund, TASF = Technical Assistance Special Fund, PPTA = project preparatory technical assistance. Source of basic data: Asian Development Bank management information systems.

7
E. Processing and Implementation Efficiency 20. A random selection of TA grants was made from 2000–2006 to determine the average time taken to process a TA from the start of fact-finding to approval. It was expected that the lead time for JSF TA grants would be greater by about a month given the additional step of approval by Japan, which proved to be so. The mean lead time from fact-finding to mobilization of consultants for an ADTA was about 18 months (Table 4). The equivalent lead time for processing PPTAs was about 13 months for JSF PPTAs and 12 months for non-JSF. The added pressure of PPTAs leading to loans would appear to be responsible for the shorter processing time of PPTAs.
Table 4: Average Lead Time from Fact-Finding to Approval JSF TAs
ADTAs PPTAs
Country No. of TAs
Ave. Lead Time (days) Country
No. of TAs
Ave. Lead Time (days)
Bangladesh 1 103 Bangladesh 1 139 Cambodia 7 240 Cambodia 1 67 China, PR 1 88 India 1 198 Fiji Islands 3 278 Indonesia 2 161 Indonesia 5 239
Kyrgyz Republic
5 193
Kyrgyz Republic
2 249
Lao PDR 8 119
Lao PDR 2 120 Mongolia 4 180 Mongolia 2 441 Nepal 3 133 Nepal 5 311 Pakistan 1 151 Philippines 2 192 Philippines 1 55 Uzbekistan 4 309 Uzbekistan 4 110 Viet Nam 1 134 Viet Nam 4 172 Total 35 252 35 145 ADTA = advisory technical assistance; Ave. = average; China, PR = People’s Republic of China; JSF = Japan Special Fund; Lao PDR = Lao People's Democratic Republic; No. = number; PPTA = project preparatory technical assistance; TA = technical assistance. Source of basic data: Asian Development Bank management information systems.
21. There are small differences in the average time overruns for the completion of JSF and non-JSF TA projects. For JSF ADTAs, the average completion overrun is 12 months compared with 14.5 months for non-JSF. For PPTAs, the corresponding completion overrun is 17.7 months for JSF and 17.5 months for non-JSF. Given that TA projects usually last for only about 18 months, an average completion overrun of 12 months indicates that estimates of completion time made by project officers are inaccurate, or that management of TA projects is deficient, or both. Extensions by directors do not appear to be monitored systematically, and time overruns are not managed carefully. There is no obvious underlying reason why the average overrun for PPTAs is greater than that for ADTAs. PPTAs have a simple measurable output, usually a feasibility study, while ADTAs address complex issues such as capacity building and policy development, where the likelihood of overruns would seem to be greater. 22. Survey results among executing agencies of selected JSF TA projects reveal that supervision of implementation was generally regarded as satisfactory, with 80% considering JSF ADTAs as satisfactory or better and 92% of executing agencies considering JSF PPTAs as
8
satisfactory or better. ADB does not monitor the cost of its procedures. It is an area of its business that JSF (and the TA and lending program as a whole) could improve by requiring reports on these costs. The findings of this study strongly suggest that ADB’s business processes diminish the efficiency with which JSF funds are used.
III. PERFORMANCE
A. Performance Assessment 23. The study rates the overall performance of JSF TAs successful based on OED’s four- point scale of highly successful, successful, partly successful, and unsuccessful. This is a slightly higher rating than given in the SES on TA performance, partly reflecting the higher proportion of PPTAs in the JSF portfolio, as noted in paras. 4 and 18. As shown in detail in Appendix 2, 65% of JSF ADTAs and 67% of PPTAs were rated successful (Tables A2.1 and A2.5). In its 2005 Annual Poverty Reduction Report,9 ADB set a target to increase the share of highly successful and successful TA project ratings (as rated by OED) for 2008–2010 to an average of 70% by 2010, compared with the 2002–2004 achieved average of 54%. The ratings for JSF TAs by this study are close to this new target. 1. Relevance 24. The JSF is rated relevant. JSF approvals have followed the guidelines, and are closely aligned with ADB and DMC priorities and needs. Aspects that prevent a rating of highly relevant being given are (i) lack of clarity and consistency in TA strategic direction at the country level in some cases; (ii) some inadequacies in the TA formulation process and problem diagnostics; (iii) quality at entry issues including the quality of design and monitoring frameworks; (iv) lack of coherence in lending and nonlending activities in some cases and; (v) insufficient coordination and complementarities with other development partners. 2. Effectiveness 25. The JSF is rated effective. While the success rate is below ADB’s recently established target for 2010 of 70% of TAs to be rated successful, the result is close to this future target. The sample JSF ADTAs in this evaluation performed better (65% success rate) than the historical average of TA performance evaluation report ratings (61% success rate). Most ADTAs produced proposals for policy reforms, and executing agencies indicated that training had resulted in positive improvements in staff performance. JSF PPTAs also performed well, in most cases resulting in new loans. 26. A number of factors have been identified as influencing TA effectiveness. These key factors, summarized in Appendix 4, are classified or grouped as strategic, planning, product, process, and consultant-related. Overall, these factors provide avenues for improving TA effectiveness and performance.
9 ADB. 2006. 2005 Annual Poverty Reduction Report: Progress in Implementing the Poverty Reduction Strategy.
Manila.
9
3. Efficiency 27. The JSF is rated as partly efficient. The following factors were taken into account in arriving at this rating:
(i) Lead time for TA Approval. Both ADTAs and PPTAs are developed to address priority issues of concern to an agency; however, the preparation and approval process is too long. Results from the random sample of TA projects from the period 2000–2006 (para. 20) show that (i) the mean lead time from fact-finding to mobilization of consultants for a JSF ADTA is about 16 months (18 months if concept paper preparation is included); and (ii) for JSF PPTAs, the lead time is about 13 months.
(ii) Time Overrruns. For JSF ADTAs, the average completion overrun is 12 months. For PPTAs, the corresponding completion overrun is 17.7 months. Both figures are similar to those for TA funded from other sources. The long completion overruns indicate that completion time estimates made by project officers are either very inaccurate, or implementation efficiency is poor.
(iii) Stability in Staffing. There are frequent changes of staff by both ADB and executing agencies. Frequent changes in executing agency staff require good client management by ADB. Most TA projects, however, are managed from headquarters and review missions are not frequent. Resident missions are in a better position to maintain close executing agency contact. The SES on the performance of TA indicated that project officers changed in 67% of ADTAs, which is very high for projects with a duration of 18 months. Executing agencies reported that the replacement project officer often did not have the same knowledge about the TA, and seemed not to accord the same priority.
(iv) Cost of Procedures. ADB does not monitor the cost of its procedures and thus cannot readily determine the efficiency with which JSF funds are applied. A time recording system would be needed for this.
4. Sustainability
28. Rating of sustainability is complicated by the fact that 42% of JSF funds were provided to PPTAs, which, thus, have a short implementation period and finite duration, ending with a design for a possible loan. For ADTAs, sustainability was frequently rated lower than effectiveness. On balance, the sustainability of JSF TAs is rated as likely. 29. A constraint to sustainability, which should be within the control of ADB, is the frequent failure to estimate the time taken to implement a TA and the time required to achieve sustainability. Agencies considered that the length of time allocated to JSF ADTAs was too short in 63% of cases, and too short in 50% of surveyed PPTAs. The frequent time overrun for TAs supports this. Longer term TA engagement through longer duration TA projects and cluster TA projects would help overcome this. 30. There seem to be two main factors for underresourcing of TA projects, and particularly for ADTAs, which reduces the likelihood of sustainability. First, TA projects are frequently allocated a fixed amount of funding (often related to approval ceilings) that is not based on a careful assessment and costing of what is actually required to achieve the desired outcome. Second, ADB staff responsible for TA formulation and management frequently do not have direct experience in capacity building, change management and policy development in a

10
government environment, activities that comprise the majority of ADTA activities. This affects their ability to accurately estimate the time and resources required. 5. Impact 31. The impact of JSF-funded TA projects has been significant in the following respects: (i) policy development ADTAs have had profound beneficial impacts on the legislative environments governing a number of sectors; (ii) capacity development ADTAs have improved the performance of sector and subnational agencies in the delivery of services, especially to the poor; and (iii) about 75% of the total ADB PPTAs are funded from the JSF and therefore design 75% of ADB’s loan program. Some illustrative examples are discussed in the succeeding paragraphs. 32. Profound development impacts from small investments can be achieved. In the case of an ADTA in Indonesia, a $1 million investment focusing on institutional development improved the country’s judicial system and the battle against corruption. This amount, invested in establishing an anti-corruption commission,10 signaled an intention on the part of the Government to take corruption much more seriously than its predecessors, produced the legislation and special court that provide an environment in which corruption can be addressed effectively through an independent judicial tribunal, and enabled the commission to begin to pursue a number of corrupt officials where there was confidence in the evidence leading to a conviction. In effect the JSF-funded TA served as a catalyst to put forward such a development initiative. 33. The education sector in Uzbekistan benefited from a JSF PPTA that was a part of a program of interventions to improve the country’s education system. The assistance stabilized and developed the coordination and efficiency of the sector by exposing officials to best practice overseas through study tours, and opened the Government’s mind to the benefits of reform. The relatively small $350,000 JSF PPTA brought together the much-needed relationship between curriculum and teacher training and earlier work that had been done on textbook development, production, and affordability, resulting in significant improvements in basic education, benefiting every child in Uzbekistan. 34. Tables A2.4 and A2.8 show the overall results for the countries in the sample, together with results from earlier OED studies. These show that ratings for JSF ADTAs in Lao PDR, Philippines, Samoa, and Viet Nam exceeded the 2010 70% target. The JSF in Indonesia performed less well on average. For JSF PPTAs, Fiji Islands, Mongolia, Nepal, Uzbekistan, and Viet Nam met or exceeded the 70% target. Bangladesh, India, Indonesia, Kyrgyz Republic, and Philippines were below the target. Tables A2.15 and A2.16 show TA ratings, grouped by country, for the four OED evaluation criteria of relevance, effectiveness, efficiency, and sustainability. Broadly, they present a successful result, with high ratings for effectiveness, and efficiency, although ratings for sustainability are weaker, as discussed in paras. 28–30. 35. There was considerable diversity in sector ratings, as shown in Tables A2.10 and A2.11. ADTAs in health, education, and finance were the most successful, while those in energy and water supply, sanitation, and waste management performed least well. This may be due to difficulties in implementing the policy changes they often targeted (tariff changes, privatization, etc.). PPTAs for finance, health, and industry performed well below the 2010 target.
10 TA 3381-INO: Establishment of an Anticorruption Commission, for $1.0 million, approved on 28 December 1999.
11
36. The findings of this study are consistent with those of the SES on the performance of TA (footnote 3). Appendix 4 summarizes the key factors influencing TA effectiveness as determined by that SES. The SES includes summary details of its country analysis, which are consistent with those of this study. The SES includes a detailed section on quality at entry, which again supports this study’s findings, namely
(i) need to improve diagnostic analysis underpinning many TA projects; (ii) insufficient country ownership; (iii) objectives that are not attainable within the time provided; (iv) budgets that are not based on requirements of the project; (v) a “one-size-fits-all” design; (vi) unclear terms of reference; (vii) work scheduling not agreed upon with executing agencies; (viii) performance indicators not included, precluding effective monitoring and
evaluation; and (ix) exit strategies not included for ADTA.
B. Success Factors 37. TA projects examined as part of the present study were generally successful. Nevertheless, there are always opportunities for better performance. This study identified a number of factors associated with success—namely clarity of objectives, need for and ownership of TA (country ownership, priority, agency and beneficiary input into design, selection of consultants, identification of client, provision of counterparts, and appropriate process), adequacy of time and resources, quality of consultants, continuous alignment of objectives and client priorities, and customer satisfaction and client relationship management. Each of these is discussed in the succeeding paragraphs.
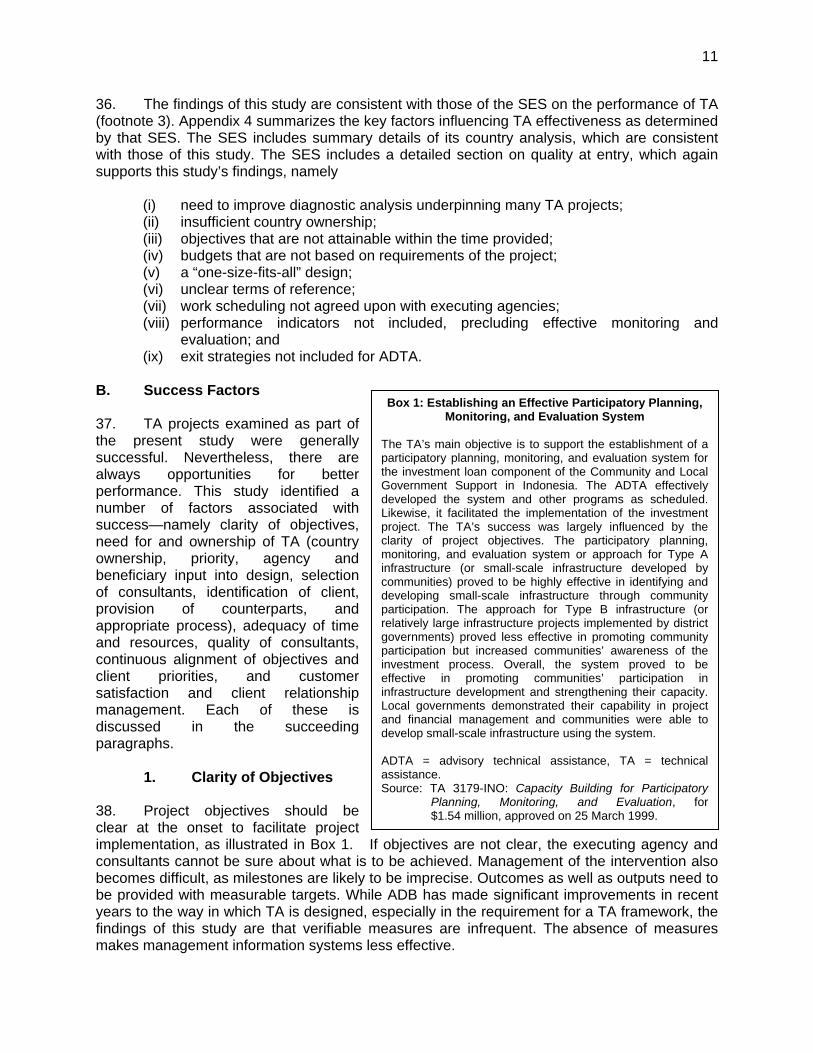
1. Clarity of Objectives 38. Project objectives should be clear at the onset to facilitate project implementation, as illustrated in Box 1. If objectives are not clear, the executing agency and consultants cannot be sure about what is to be achieved. Management of the intervention also becomes difficult, as milestones are likely to be imprecise. Outcomes as well as outputs need to be provided with measurable targets. While ADB has made significant improvements in recent years to the way in which TA is designed, especially in the requirement for a TA framework, the findings of this study are that verifiable measures are infrequent. The absence of measures makes management information systems less effective.
Box 1: Establishing an Effective Participatory Planning, Monitoring, and Evaluation System
The TA’s main objective is to support the establishment of a participatory planning, monitoring, and evaluation system for the investment loan component of the Community and Local Government Support in Indonesia. The ADTA effectively developed the system and other programs as scheduled. Likewise, it facilitated the implementation of the investment project. The TA’s success was largely influenced by the clarity of project objectives. The participatory planning, monitoring, and evaluation system or approach for Type A infrastructure (or small-scale infrastructure developed by communities) proved to be highly effective in identifying and developing small-scale infrastructure through community participation. The approach for Type B infrastructure (or relatively large infrastructure projects implemented by district governments) proved less effective in promoting community participation but increased communities’ awareness of the investment process. Overall, the system proved to be effective in promoting communities’ participation in infrastructure development and strengthening their capacity. Local governments demonstrated their capability in project and financial management and communities were able to develop small-scale infrastructure using the system. ADTA = advisory technical assistance, TA = technical assistance. Source: TA 3179-INO: Capacity Building for Participatory
Planning, Monitoring, and Evaluation, for $1.54 million, approved on 25 March 1999.

12
2. Need and Ownership a. Country Ownership
39. Ownership has long been a concern of ADB. In 2003, a review of management and effectiveness of TA11 recommended that “a checklist of good practices to enhance country ownership will be used for all TA, and staff instructions for TA processing under preparation will explicitly include these.” The Strategy and Policy Department produced the required checklist, which was attached to draft Staff Instructions on Identification, Preparation, and Processing of Grant-Funded Technical Assistance. However, this draft was not adopted by ADB. 40. Ownership is a necessary condition for effectiveness, but it is not a sufficient one. This study revealed a number of examples of a high level of ownership on the part of an executing agency, but disappointing results because of a lack of budgetary and other support by a DMC, an example of which is given in Box 2. 41. Where there is a driving need for change, there is a strong likelihood that it will occur. For example, corruption was a burning issue in Indonesian politics in 1999. For the newly elected government, something had to be done to address the perceived pervasive corruption in public affairs. Consequently, the prospects for a JSF TA12 establishing an anti-corruption commission were good. The consultants presented a report and recommendations based on best practices drawn largely from Hong Kong experience. The Indonesian Government considered that such a model would not work in Indonesia and altered the proposals to make them politically acceptable without prejudicing the core requirements for an effective commission. The commission was established and in very difficult circumstances made good headway.
b. Priority of an Intervention
42. An intervention should be regarded as a high priority by a government and executing agency. One marker of priority, particularly in the case where a loan is sought, is that the executing agency is prepared to invest its own resources to perform preliminary work necessary to prepare a project design, as illustrated in Box 3. In the sample, executing agencies generally perceived priorities as high. Findings from the survey indicated that 70% considered JSF ADTAs as a high government priority, and 86% considered JSF PPTAs as such (Appendix 2). A surprising feature of this study is that there was a significantly higher proportion of non-JSF funded TAs which were regarded as high priority than were JSF-funded ADTAs and PPTAs. The most plausible, though speculative, explanation is the perception of ADB officers in the past 11 ADB. 2002. Review of the Management and Effectiveness of Technical Assistance of the Asian Development
Bank. Manila. Appendix 1 of that report shows a table of the status of management action on the recommendations in the 2003 review taken from a sample of interviews with operational divisional directors.
12 ADTA 3381-INO: Establishment of an Anti-Corruption Commission, for $1,000,000, approved on 28 December 1999.
Box 2: Lack of Government Support for an Intervention
A JSF project established the National AIDS Authority (NAA) in 1999 in Cambodia as a lead organization for coordination, advocacy, and resource mobilization. It was headed by a person dedicated to developing effective programs and staffed by equally committed personnel. The ADTA enhanced the capacity of staff. The national budget, however, did not provide the NAA with sufficient funds to carry out its remit effectively. HIV/AIDS, at that time, was not a sufficient national problem for there to be a driving need to use the assistance effectively. ADTA = advisory technical assistance, HIV/AIDS = human immunodeficiency virus/acquired immunodeficiency syndrome, JSF = Japan Special Fund. Source: TA 3511-CAM: Capacity Building for HIV/AIDS
Prevention and Control, for $600,000, approved on 3 October 2000.

13
that JSF-funded TA projects were more difficult to process. Consequently, high priority projects were assigned to the TASF.
c. Agency and Beneficiary Input to Design
43. Enabling agencies to determine what they require in a project is one of the conditions for ownership. In the study questionnaire, only 4% of executing agencies stated they had full control over the scope of an ADTA, with a further 46% stating “mostly” (Table A2.25), indicating that for 50% there was less executing agency input into TA design. With PPTAs, to a slightly different question asking who was responsible for designing the terms of reference, only 4% of respondent executing agencies replied that it was mainly their responsibility. Nevertheless, agencies were generally satisfied with the terms of reference for PPTAs, with only 8% expressing dissatisfaction. However, 18% expressed dissatisfaction with the design of ADTAs. The study found a strong correlation between client satisfaction and successful TA design. 44. Effectively meeting beneficiary needs is also a success factor. A number of projects in the sample provided electricity, water, sanitation, and other services in which tariff reform was part of the design. However, there was little research into what local households would be prepared to pay for a service of a given standard, nor of the political willingness of the government to increase tariffs. In Mongolia, a PPTA13 for preparing an integrated development project for basic urban services in secondary towns incorrectly assumed that tariffs would be raised and did not carry out a survey of what local people would be prepared to pay for services. In a proposed microfinance for rural development14 project in the Philippines, a survey of rural demand for microfinance was conducted, but no market research was carried out into the preparedness of microfinance institutions to lend, which they were not.
d. Selection of Consultants 45. Many executing agencies commented adversely on their lack of inclusion in the consultant selection process. ADB procedures precluded this, with ADB determining the shortlist, the selection criteria and weighting, and assessment of the proposals. The executing agency is able only to comment on the shortlist and the final selection. Enabling them to make, or more fully participate in, the selection would increase their perception that they are in control of an intervention. The relevant project administration instruction has now been amended to allow the delegation of consultant selection to executing agencies where appropriate.
13 PPTA 3685-MON: Integrated Development of Basic Urban Services in Secondary Towns, for $700,000, approved
on 19 July 2001. 14 PPTA 3814-PHI: Micro Finance for Rural Development, for $560,000, approved on 19 December 2001.
Box 3: Government Support for an Intervention
A marker of agency priority was a 15-year development program prepared by the Department of Water Supply and Sanitation in Nepal to extend services to over 200 small towns. ADB built on this work in a JSF PPTA to develop an innovative and effective project providing water supply, non-water based sewerage and solid waste management to about 30 small towns in a number of different environmental and economic zones of Nepal. The department had justifiable concerns that it might be divested of its construction role in favour of the district level. It started initial consultations with prospective beneficiaries of the loan well before the loan was approved. A result was that the project was ready to move as soon as it was mobilized. ADB = Asian Development Bank, JSF = Japan Special Fund, PPTA = project preparatory technical assistance. Source: TA 3059-NEP: Small Towns Water Supply and
Sanitation, for $600,000, approved on 20 August 1998.

14
e. The Client 46. An important issue in the management of ownership is clear identification of the client. Given the way in which ADB manages TAs (particularly in contracting consultants, supervising them through a project officer, having the consultants first submit all reports to the ADB, and ADB remunerating them), the effective client remains ADB, not the executing agency. One executing agency in Nepal perhaps exaggerated when it observed: “If the relationship between consultants and ADB is good, there is no room for the executing agency to get its voice heard.” When ADB and the executing agency have different expectations for a TA, there is likely to be a serious problem (for example, the Philippine microfinance example cited in para. 44 where the project officer pursued an objective to privatize microfinance despite it being clear that such a change was not on the agenda of the government). Although not specifically examined by this study, other evaluations of TA projects show that steering committees (through which clients are expected to oversee TAs) frequently do not function as intended. 47. Consultants consider the effective client as ADB in many TA projects. Table A2.26 shows that in 32% of ADTAs and 70% of PPTAs, consultants considered that ADB was the effective client. There were examples of consultants following directives of ADB despite opposition on the part of the executing agency, even while answering that the client was the executing agency (see also para. 63). Again, if consultants do not genuinely treat the executing agency as the client, ownership will be prejudiced. 48. Where change is an objective, often the client has to gain agreement from other stakeholders who are able to influence or direct a final decision. Consequently, to ensure continued agreement and support from the principal client, the consultants must be in regular contact with the right level of the organization. Continuity of engagement is often important in this relationship. TA is most successful when it draws the client along in agreement with the progress from early findings to recommendations. There were instances in recent TA projects of executing agencies reporting that they were unable to comment on the effectiveness of an ADTA because they were still awaiting the consultant’s final report, which had been submitted to ADB but not officially to them. For TA projects involving a number of different agencies, the question of client identification becomes more essential. The design of a TA often does not identify all important stakeholders. Not identifying them can have unfavorable consequences.15 When all stakeholders are fully involved, there can be conspicuous successes (Box 4).
15 For example, TA 3332-NEP: Ecotourism (approved on 10 December 1999 for $500,000) did not adequately consult
with at least two concerned ministries, and it is likely that their lack of interest contributed to the TA project never being agreed upon.
Box 4: Binding in All Stakeholders An ADTA in the Lao PDR set out to strengthen social and environmental management through the auspices of the agency with overall responsibility for environmental matters. The consultants worked with five line agencies such as energy and roads as well as the executing agency, getting the former to establish environmental impact units and having those units integrated into every project preparation process. They received continuing technical support from the executing agency. As a result, environmental impact assessments were prepared in the normal course of any project development. ADTA = advisory technical assistance, Lao PDR = Lao People’s Democratic Republic. Source: TA 3133-LAO: Strengthening Social and
Environmental Management, for $950,000, approved on 22 December 1998.
15
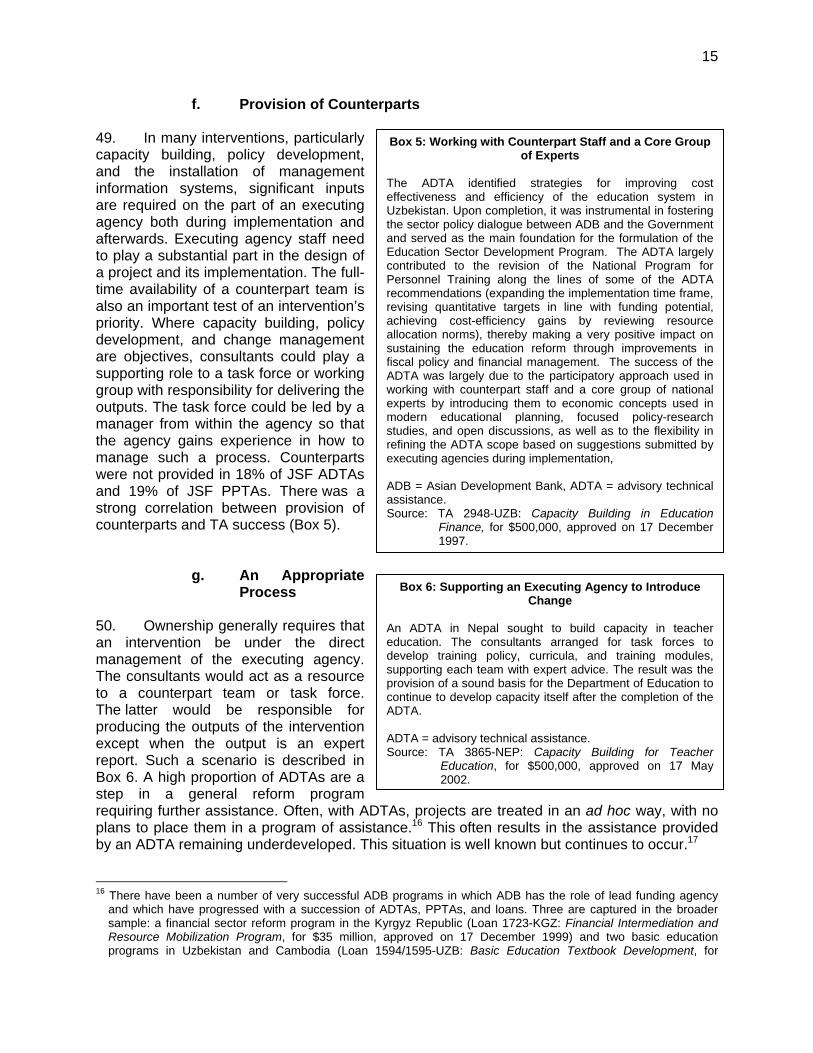
f. Provision of Counterparts 49. In many interventions, particularly capacity building, policy development, and the installation of management information systems, significant inputs are required on the part of an executing agency both during implementation and afterwards. Executing agency staff need to play a substantial part in the design of a project and its implementation. The full- time availability of a counterpart team is also an important test of an intervention’s priority. Where capacity building, policy development, and change management are objectives, consultants could play a supporting role to a task force or working group with responsibility for delivering the outputs. The task force could be led by a manager from within the agency so that the agency gains experience in how to manage such a process. Counterparts were not provided in 18% of JSF ADTAs and 19% of JSF PPTAs. There was a strong correlation between provision of counterparts and TA success (Box 5).
g. An Appropriate Process
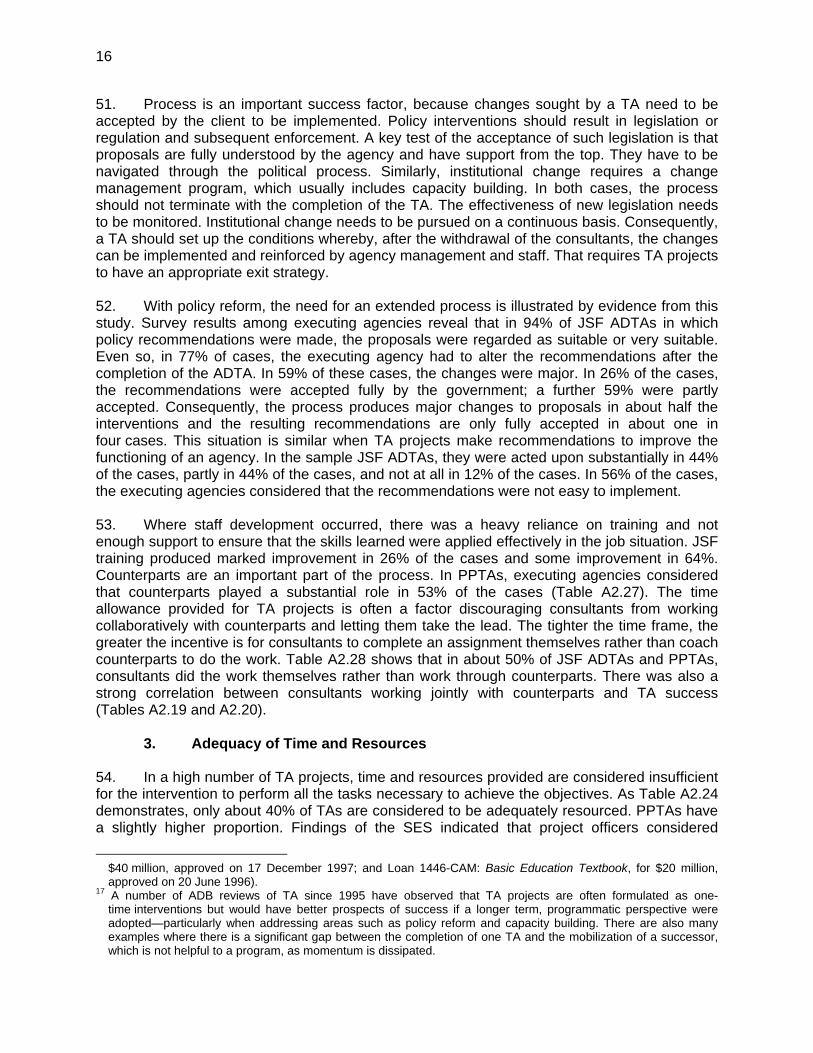
50. Ownership generally requires that an intervention be under the direct management of the executing agency. The consultants would act as a resource to a counterpart team or task force. The latter would be responsible for producing the outputs of the intervention except when the output is an expert report. Such a scenario is described in Box 6. A high proportion of ADTAs are a step in a general reform program requiring further assistance. Often, with ADTAs, projects are treated in an ad hoc way, with no plans to place them in a program of assistance.16 This often results in the assistance provided by an ADTA remaining underdeveloped. This situation is well known but continues to occur.17
16 There have been a number of very successful ADB programs in which ADB has the role of lead funding agency
and which have progressed with a succession of ADTAs, PPTAs, and loans. Three are captured in the broader sample: a financial sector reform program in the Kyrgyz Republic (Loan 1723-KGZ: Financial Intermediation and Resource Mobilization Program, for $35 million, approved on 17 December 1999) and two basic education programs in Uzbekistan and Cambodia (Loan 1594/1595-UZB: Basic Education Textbook Development, for
Box 6: Supporting an Executing Agency to Introduce Change
An ADTA in Nepal sought to build capacity in teacher education. The consultants arranged for task forces to develop training policy, curricula, and training modules, supporting each team with expert advice. The result was the provision of a sound basis for the Department of Education to continue to develop capacity itself after the completion of the ADTA. ADTA = advisory technical assistance. Source: TA 3865-NEP: Capacity Building for Teacher
Education, for $500,000, approved on 17 May 2002.
Box 5: Working with Counterpart Staff and a Core Group of Experts
The ADTA identified strategies for improving cost effectiveness and efficiency of the education system in Uzbekistan. Upon completion, it was instrumental in fostering the sector policy dialogue between ADB and the Government and served as the main foundation for the formulation of the Education Sector Development Program. The ADTA largely contributed to the revision of the National Program for Personnel Training along the lines of some of the ADTA recommendations (expanding the implementation time frame, revising quantitative targets in line with funding potential, achieving cost-efficiency gains by reviewing resource allocation norms), thereby making a very positive impact on sustaining the education reform through improvements in fiscal policy and financial management. The success of the ADTA was largely due to the participatory approach used in working with counterpart staff and a core group of national experts by introducing them to economic concepts used in modern educational planning, focused policy-research studies, and open discussions, as well as to the flexibility in refining the ADTA scope based on suggestions submitted by executing agencies during implementation, ADB = Asian Development Bank, ADTA = advisory technical assistance. Source: TA 2948-UZB: Capacity Building in Education
Finance, for $500,000, approved on 17 December 1997.
16
51. Process is an important success factor, because changes sought by a TA need to be accepted by the client to be implemented. Policy interventions should result in legislation or regulation and subsequent enforcement. A key test of the acceptance of such legislation is that proposals are fully understood by the agency and have support from the top. They have to be navigated through the political process. Similarly, institutional change requires a change management program, which usually includes capacity building. In both cases, the process should not terminate with the completion of the TA. The effectiveness of new legislation needs to be monitored. Institutional change needs to be pursued on a continuous basis. Consequently, a TA should set up the conditions whereby, after the withdrawal of the consultants, the changes can be implemented and reinforced by agency management and staff. That requires TA projects to have an appropriate exit strategy. 52. With policy reform, the need for an extended process is illustrated by evidence from this study. Survey results among executing agencies reveal that in 94% of JSF ADTAs in which policy recommendations were made, the proposals were regarded as suitable or very suitable. Even so, in 77% of cases, the executing agency had to alter the recommendations after the completion of the ADTA. In 59% of these cases, the changes were major. In 26% of the cases, the recommendations were accepted fully by the government; a further 59% were partly accepted. Consequently, the process produces major changes to proposals in about half the interventions and the resulting recommendations are only fully accepted in about one in four cases. This situation is similar when TA projects make recommendations to improve the functioning of an agency. In the sample JSF ADTAs, they were acted upon substantially in 44% of the cases, partly in 44% of the cases, and not at all in 12% of the cases. In 56% of the cases, the executing agencies considered that the recommendations were not easy to implement. 53. Where staff development occurred, there was a heavy reliance on training and not enough support to ensure that the skills learned were applied effectively in the job situation. JSF training produced marked improvement in 26% of the cases and some improvement in 64%. Counterparts are an important part of the process. In PPTAs, executing agencies considered that counterparts played a substantial role in 53% of the cases (Table A2.27). The time allowance provided for TA projects is often a factor discouraging consultants from working collaboratively with counterparts and letting them take the lead. The tighter the time frame, the greater the incentive is for consultants to complete an assignment themselves rather than coach counterparts to do the work. Table A2.28 shows that in about 50% of JSF ADTAs and PPTAs, consultants did the work themselves rather than work through counterparts. There was also a strong correlation between consultants working jointly with counterparts and TA success (Tables A2.19 and A2.20).
3. Adequacy of Time and Resources 54. In a high number of TA projects, time and resources provided are considered insufficient for the intervention to perform all the tasks necessary to achieve the objectives. As Table A2.24 demonstrates, only about 40% of TAs are considered to be adequately resourced. PPTAs have a slightly higher proportion. Findings of the SES indicated that project officers considered
$40 million, approved on 17 December 1997; and Loan 1446-CAM: Basic Education Textbook, for $20 million, approved on 20 June 1996).
17 A number of ADB reviews of TA since 1995 have observed that TA projects are often formulated as one-time interventions but would have better prospects of success if a longer term, programmatic perspective were adopted—particularly when addressing areas such as policy reform and capacity building. There are also many examples where there is a significant gap between the completion of one TA and the mobilization of a successor, which is not helpful to a program, as momentum is dissipated.
17
resources in 30% of TA projects as being far too small, and a further 28% as being somewhat too small. There is a correlation between adequacy of time and overall success and sustainability of projects (Table A2.21 and A2.22). For PPTAs, the study sample findings are anomalous. There is little difference in ratings between TA projects judged to have adequate time and those without (Table A2.10). 55. A number of factors adversely influence the way in which time and resources are allocated to TA projects:
(i) According to the findings of the SES, 73% of ADTAs and 53% of PPTAs had budgets predetermined, regardless of what was required to do the work. The current business process of having a fixed TA budget allocation before the development of the terms of reference contradicts common sense that a sound budget should be based on the tasks to be undertaken.
(ii) TA papers rarely include a satisfactory diagnostic of the problem or issues that they seek to address. Failure to produce a thorough diagnostic may result in incomplete bidding documents, with consultants consequently preparing proposals with an incomplete understanding of the nature and extent of the issues to be addressed. In addition there is the possibility of an inappropriate selection of consultants, as certain expertise might be overlooked, a situation that occurred in some TAs in this sample. TA budgets may then be inadequate to accommodate variations needed following diagnostic analysis under the TA. ADB officers do not work in an environment where time and costs are measured as a matter of course. Consequently, departments and staff have little awareness of the cost to complete a given task in a particular environment.18
(iii) About 70% of JSF ADTAs have addressed policy development, change management, and capacity building issues, areas that require specialized and/or experienced expertise. Such TAs are often prepared by staff with insufficient experience in these fields.
4. Quality of Consultants
56. Executing agencies were generally satisfied with the performance of consultants, with 85% rating their performance as satisfactory or better in both ADTAs and PPTAs, (Tables A2.2919 and A2.3020). Effective client management is frequently the responsibility of the team leader. Poor performance by a team leader is likely to constrain a project’s effectiveness, but changing a team leader is often very difficult, particularly if the company has outsourced much of its work to external consultants. An example of successful collaboration between consultants and the executing agencies is provided in Box 7.
18 OED found in its Annual Report on Loan and Technical Assistance Portfolio Performance for 2005, that the
average PPTA budget decreased by 18% in real terms over the period 1996–2005. In that time, several additional policy requirements were added to the PPTA tasks, providing further testimony that resource allocations are not driven by requirements.
19 The question on performance of consultants was not asked in the SES on the performance of TA and the Cambodian and Uzbekistan samples; the question on communication of consultants was not asked in the Cambodian and Uzbekistan samples; and the question on communicating best practice was asked only in the SES evaluation and this sample.
20 The question on understanding the needs of the agency was not asked in the Uzbekistan sample, and that on communicating best practice was not asked in the Bangladesh and Uzbekistan samples.
18
5. Continuous Alignment of Project Objectives with Agency Priorities
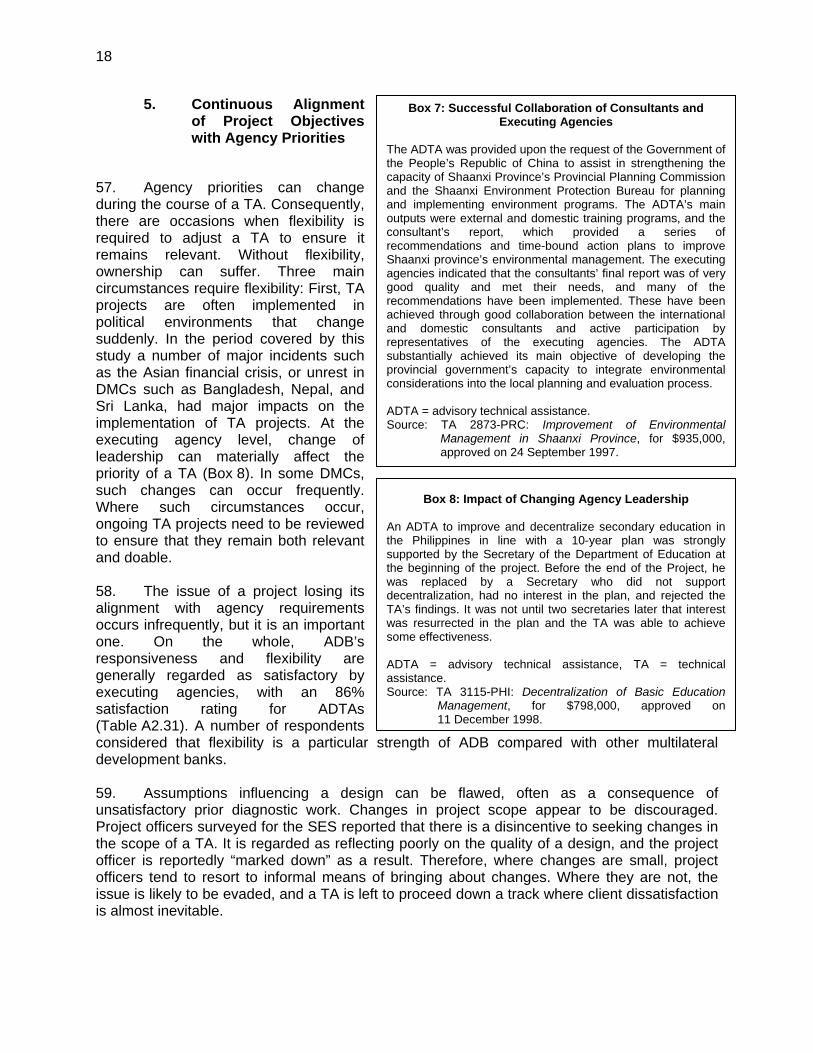
57. Agency priorities can change during the course of a TA. Consequently, there are occasions when flexibility is required to adjust a TA to ensure it remains relevant. Without flexibility, ownership can suffer. Three main circumstances require flexibility: First, TA projects are often implemented in political environments that change suddenly. In the period covered by this study a number of major incidents such as the Asian financial crisis, or unrest in DMCs such as Bangladesh, Nepal, and Sri Lanka, had major impacts on the implementation of TA projects. At the executing agency level, change of leadership can materially affect the priority of a TA (Box 8). In some DMCs, such changes can occur frequently. Where such circumstances occur, ongoing TA projects need to be reviewed to ensure that they remain both relevant and doable. 58. The issue of a project losing its alignment with agency requirements occurs infrequently, but it is an important one. On the whole, ADB’s responsiveness and flexibility are generally regarded as satisfactory by executing agencies, with an 86% satisfaction rating for ADTAs (Table A2.31). A number of respondents considered that flexibility is a particular strength of ADB compared with other multilateral development banks. 59. Assumptions influencing a design can be flawed, often as a consequence of unsatisfactory prior diagnostic work. Changes in project scope appear to be discouraged. Project officers surveyed for the SES reported that there is a disincentive to seeking changes in the scope of a TA. It is regarded as reflecting poorly on the quality of a design, and the project officer is reportedly “marked down” as a result. Therefore, where changes are small, project officers tend to resort to informal means of bringing about changes. Where they are not, the issue is likely to be evaded, and a TA is left to proceed down a track where client dissatisfaction is almost inevitable.
Box 7: Successful Collaboration of Consultants and Executing Agencies
The ADTA was provided upon the request of the Government of the People’s Republic of China to assist in strengthening the capacity of Shaanxi Province’s Provincial Planning Commission and the Shaanxi Environment Protection Bureau for planning and implementing environment programs. The ADTA’s main outputs were external and domestic training programs, and the consultant’s report, which provided a series of recommendations and time-bound action plans to improve Shaanxi province’s environmental management. The executing agencies indicated that the consultants’ final report was of very good quality and met their needs, and many of the recommendations have been implemented. These have been achieved through good collaboration between the international and domestic consultants and active participation by representatives of the executing agencies. The ADTA substantially achieved its main objective of developing the provincial government’s capacity to integrate environmental considerations into the local planning and evaluation process. ADTA = advisory technical assistance. Source: TA 2873-PRC: Improvement of Environmental
Management in Shaanxi Province, for $935,000, approved on 24 September 1997.
Box 8: Impact of Changing Agency Leadership An ADTA to improve and decentralize secondary education in the Philippines in line with a 10-year plan was strongly supported by the Secretary of the Department of Education at the beginning of the project. Before the end of the Project, he was replaced by a Secretary who did not support decentralization, had no interest in the plan, and rejected the TA’s findings. It was not until two secretaries later that interest was resurrected in the plan and the TA was able to achieve some effectiveness. ADTA = advisory technical assistance, TA = technical assistance. Source: TA 3115-PHI: Decentralization of Basic Education
Management, for $798,000, approved on 11 December 1998.

19
60. Another situation is that of the recruitment of an inappropriately qualified international consultant following a flawed job specification. This situation is more difficult to address without ADB suffering losses from having to terminate a contract for insufficient cause. But it is preferable to do this than to provide a DMC with an unwanted service, as illustrated in Box 9.
6. Client Management and Satisfaction
61. Client satisfaction with TA is relatively low for TAs in general, including those financed by ADB (para. 66). This raises two important issues. First, most TA projects are managed from ADB headquarters with little delegation to resident missions, which makes it harder to provide timely support. A number of executing agencies complained about the difficulties of getting responses from ADB headquarters. Supervision missions are relatively infrequent. In contrast, staff in resident missions are more readily available. 62. A second issue is the need for greater realism on the part of a client about the contribution it must make to achieve the desired outcomes. Usually, this area is left vague. The contributions expected of an executing agency are often glossed over and frequently limited to provision of workplace and furniture and fittings so that there is no impediment to getting agreement to approve a TA. 63. The first important rule of effective client management is to determine where decisions necessary for the success of an intervention are made, and to develop an effective working relationship with the person in that position. For example, policy reform is usually an issue for a cabinet of ministers and is championed by the responsible sector minister. Consequently, the principal client should be the relevant minister. Decisions about institutional change might be made by a minister or a head of department, depending on the government system and the division of responsibilities between them. It is important for a consultancy team to have regular access to the appropriate decision maker to ensure that progress, findings, and proposals are in harmony with his or her objectives. However, achieving this level of access can be difficult, if not impossible in some circumstances. 64. Effective client management ensures that the executing agency is satisfied with every step in the progress from the definition of a TA activity, through the appointment and mobilization of consultants to eventual conclusion. During TA implementation, the consultant team leader should take this responsibility. Client management is not something that is stressed in terms of reference for consultants. In most it is not mentioned, while in some it is merely presumed. 65. Project officers also have an important role in client management. That is made more difficult by the frequency with which they are changed. The SES found that in 67% of ADTAs, the project officer was changed at least once. Often there appears to be inadequate handover. Frequent changes of this kind give an appearance that a TA is not a high priority for ADB. The
Box 9: Employing a Consultant with an Inappropriate Background
An ADTA was designed to strengthen Indonesia’s National Secretariat for Regional Cooperation. The agency wanted someone who understood the Indonesian Government and was the kind of person who would get private sector initiatives up and running to demonstrate what the nascent agency might be able to offer. ADB provided a legal expert who was well versed in the top-down approaches of Brunei, Malaysia, and Philippines, but unfamiliar with Indonesia’s bottom up approach. The consultant could only provide an output that the executing agency did not want. ADB = Asian Development Bank, ADTA = advisory technical assistance. Source: TA 4555-INO: Strengthening the National Secretariat
for Regional Cooperation, for $296,500, approved on 23 December 2004.

20
impression is sometimes augmented by there being no process whereby the change is negotiated with the agency in a timely way. Often what seems to happen is that the new project officer simply presents himself or herself to the agency at his or her own convenience. With frequent changes in project officers, someone at a senior level should be made responsible for ensuring client satisfaction. On a number of occasions executing agencies expressed frustration with a project officer due to poor communication but had little idea whom to contact to resolve the issues causing the problem. They should know whom to contact at more senior levels if issues are not being resolved to their satisfaction, whether this is the sector or country director, or someone else. Effective client management is particularly important at the closure of an intervention. This is an occasion that provides opportunities for investigating opportunities for further work and obtaining feedback about how effective an intervention is regarded. 66. Client satisfaction should be an important indicator of ADB performance. Findings from this study and the SES on TA performance suggest that only about 40% of agencies interviewed21 considered TA projects fully successful. The reasons for this low level of satisfaction include the following:
(i) ADTAs often promise more than they are resourced to deliver. (ii) Exit strategies in ADTAs are poor, often resulting in agencies having to finalize and
continue activities not completed under the TA. (iii) Greater attention needs to be paid by ADB staff to the resolution of problems
during the course of implementation. (iv) There is dissatisfaction with the lack of client involvement in TA design and in
consultant selection and management with a consequent lack of ownership by clients of the outputs.
IV. FUND MANAGEMENT
A. Allocation Policy 67. The present IPF allocation targeting 70% of JSF funds for PPTAs is not achievable. The annual value of PPTAs is currently about $50 million, which, if completely allocated to JSF, would represent 62.5% of the total JSF funds available for 2007. Having all PPTAs funded by JSF may not in the best interest of ADB DMCs or Japan. It would make ADB very dependent on JSF and its priorities for its investment and program loan development, with the concern that Japan, following its priorities, could significantly shape the ADB lending program through its ability to approve, or not, proposed PPTAs. This is not desirable. The present ratio of 75% of PPTAs being funded by JSF appears reasonable and sustainable. B. IPF Allocations and Funds Available 68. There is little apparent relationship between IPF allocations and the JSF funds available in any one year, as shown in Table A3.5. Total IPF figures, for the most part, have little relationship to actual approvals. For example, the JSF IPF figures differ from IPF allocations by amounts up to $30 million, although from 2002 this has been between $9 and $16 million (except 2006). It should be possible to calculate an annual amount with a reasonable degree of precision, given that there is a pipeline of TA projects produced in the country partnership
21 Approximately 130 respondents.
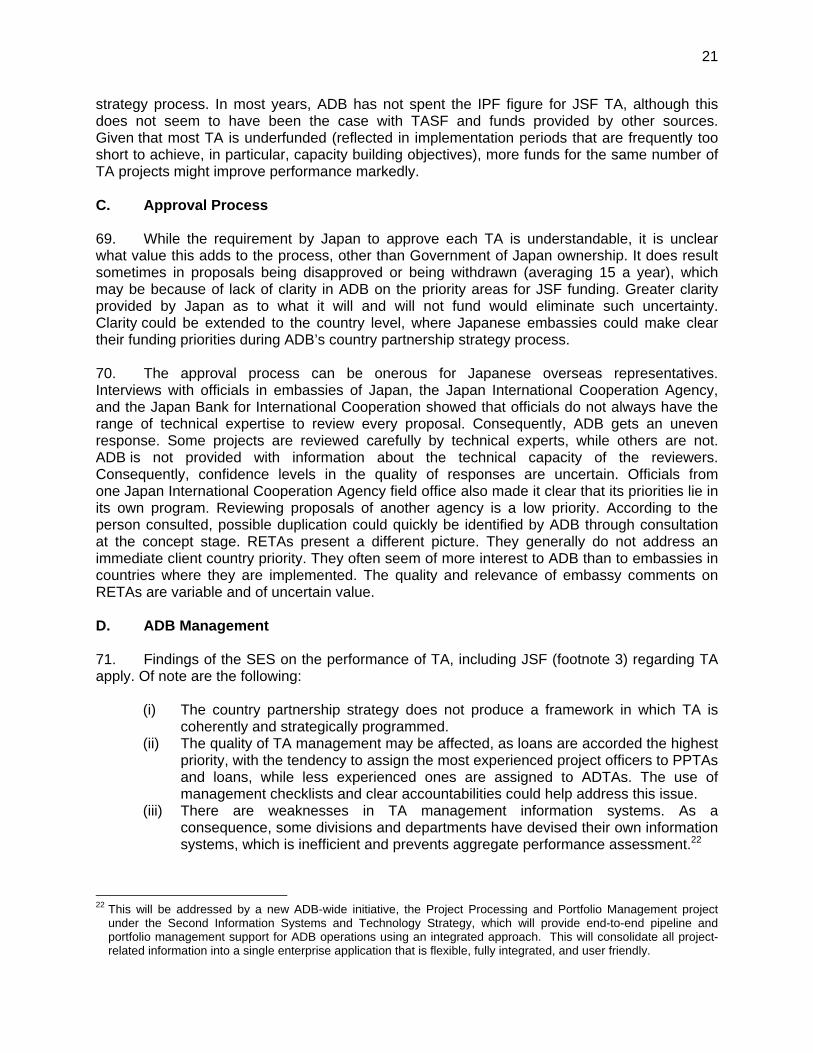
21
strategy process. In most years, ADB has not spent the IPF figure for JSF TA, although this does not seem to have been the case with TASF and funds provided by other sources. Given that most TA is underfunded (reflected in implementation periods that are frequently too short to achieve, in particular, capacity building objectives), more funds for the same number of TA projects might improve performance markedly. C. Approval Process 69. While the requirement by Japan to approve each TA is understandable, it is unclear what value this adds to the process, other than Government of Japan ownership. It does result sometimes in proposals being disapproved or being withdrawn (averaging 15 a year), which may be because of lack of clarity in ADB on the priority areas for JSF funding. Greater clarity provided by Japan as to what it will and will not fund would eliminate such uncertainty. Clarity could be extended to the country level, where Japanese embassies could make clear their funding priorities during ADB’s country partnership strategy process. 70. The approval process can be onerous for Japanese overseas representatives. Interviews with officials in embassies of Japan, the Japan International Cooperation Agency, and the Japan Bank for International Cooperation showed that officials do not always have the range of technical expertise to review every proposal. Consequently, ADB gets an uneven response. Some projects are reviewed carefully by technical experts, while others are not. ADB is not provided with information about the technical capacity of the reviewers. Consequently, confidence levels in the quality of responses are uncertain. Officials from one Japan International Cooperation Agency field office also made it clear that its priorities lie in its own program. Reviewing proposals of another agency is a low priority. According to the person consulted, possible duplication could quickly be identified by ADB through consultation at the concept stage. RETAs present a different picture. They generally do not address an immediate client country priority. They often seem of more interest to ADB than to embassies in countries where they are implemented. The quality and relevance of embassy comments on RETAs are variable and of uncertain value. D. ADB Management 71. Findings of the SES on the performance of TA, including JSF (footnote 3) regarding TA apply. Of note are the following:
(i) The country partnership strategy does not produce a framework in which TA is coherently and strategically programmed.
(ii) The quality of TA management may be affected, as loans are accorded the highest priority, with the tendency to assign the most experienced project officers to PPTAs and loans, while less experienced ones are assigned to ADTAs. The use of management checklists and clear accountabilities could help address this issue.
(iii) There are weaknesses in TA management information systems. As a consequence, some divisions and departments have devised their own information systems, which is inefficient and prevents aggregate performance assessment.22
22 This will be addressed by a new ADB-wide initiative, the Project Processing and Portfolio Management project
under the Second Information Systems and Technology Strategy, which will provide end-to-end pipeline and portfolio management support for ADB operations using an integrated approach. This will consolidate all project-related information into a single enterprise application that is flexible, fully integrated, and user friendly.
22
(iv) ADB’s knowledge management system does not yet provide a comprehensive and readily available set of lessons and good practices. This issue is being partly addressed with OED’s recently launched Evaluation Information System, but this needs to be extended to cover lessons from project and/or program and TA completion reports.
E. Managing Risk 72. Generally, all ADTAs are treated as if they are likely to experience the same level of risk, regardless of sector, theme, or country. There is a standard number of supervision missions provided for under ADB’s business processes, although frequently the required number is not fully provided for in the budgets of the operating departments concerned. Project staff assigned to the TA do not always have relevant experience and divisional management attention to progress is often negligible, as priorities lie in loan processing and disbursements. Another OED report23 noted that in both 2004 and 2005 review missions were fielded for only 25%24 of TA projects, although there may be some underreporting. Staff resource constraints are the main problem. Risk assessment of TA projects, and decisions regarding support required, should be based on factors such as ADB’s experience in the country and sector, degree of complexity of the TA, and institutional capacity and ownership. This assessment should determine the size of the initial investment, the seniority and expertise of project officer required, and the degree of supervision and divisional management oversight. F. Enhancement of Japanese Profile 73. Japan was warmly regarded in the countries visited for this study. The media attention attached to signing ceremonies for new TA projects probably has some impact. However, more strategic and tactical use of JSF funds is likely to increase the profile of Japan. For example, 50% of executing agency staff interviewed were not aware that a particular ADTA was JSF funded, and 31% said the same for PPTA. The one-off nature of JSF interventions is a factor that contributes to low agency awareness. Although JSF has contributed to successful programs such as those in education in Cambodia and Uzbekistan, and those in financial reform in Kyrgyz Republic and Mongolia, the JSF is not associated directly with the programs. In the study sample, there was a very effective TA program in housing finance in Mongolia in which two later TA projects were JSF funded and, the first, a small-scale TA, was funded by the TASF. This program is strongly associated with the JSF, given the continuity of the two follow-on TA projects. Alternating funding sources between the JSF and the TASF in one program reduces the association with a particular funding source. 74. The Japanese profile is not advanced by the fact that very few TA projects are implemented by Japanese consultants. Of the 69 JSF TA projects examined in this sample, none was implemented by Japanese consultants. In contrast, officials interviewed in executing agencies were very positive about the quality of Japanese consultants under other programs—38% considered that they were better than consultants from elsewhere, 59% that they were as
23 ADB. 2006. Annual Report on Loan and Technical Assistance Portfolio Performance for the Year Ending
31 December 2005. Manila. 24 Data on TA missions are recorded in the TA performance evaluation report. According to data from this report for
2005, 1,048 TA projects were active during the year, of which 977 were ongoing. The situation was much the same as in 2004 (when only 248 of 1,016 ongoing TAs had one or more missions or 25%)–missions of all types were reported for only 245 TA projects or 25% of the ongoing 2005 portfolio (paras. 173–177, pages 81–82, ibid).
23
good, and 3% that they were not as good. Lack of cost competitiveness is frequently given as a reason for the lack of Japanese involvement in TA contracts.25 75. The fact that the new JSF guidelines make study tours ineligible also represents a missed opportunity to augment the profile of Japan. If appropriately targeted and structured, with the right people are selected (important provisos), study tours can be of considerable value, particularly where reform and significant change are being proposed and there is a need to develop “champions of reform.” There were examples in the sample where a study tour was requested for good reasons, but ADB was unable to fund from the JSF, so it was financed by another agency. The study tour had a major impact on the ideas of the agency and was remembered favorably, while the TA was remembered less favorably because of its unwillingness to fund this activity. Ironically, Japan is associated with best practice across a wide range of issues and would be an excellent locus for a study tour, which, in turn, would raise the profile of Japan with the client. JSF guidelines, in this case, may be at odds with the policy objective of raising the profile of Japan. 76. To further enhance the Japanese profile, the Office of Cofinancing Operations, together with the regional departments and resident missions, should increase its efforts towards visibility to internal and external audiences (e.g., enhanced JSF websites, press releases, and JSF news features) as well as its knowledge sharing activites (e.g., dissemination through media featuring the results, outcomes, and contributions of TAs).
III. CONCLUSIONS AND RECOMMENDATIONS A. Conclusions 77. The main conclusion of this study is that JSF TA projects have generally been of a good standard and successful. Based on the study sample and other OED studies, 65% of JSF ADTAs and 67% of JSF PPTAs were rated highly successful or successful. These ratings are just below ADB’s new target for 2010 for 70% of TA projects to be so rated. ADTAs have frequently addressed very complex issues in areas in which there is a high degree of difficulty, factors that should also be taken into account when assessing the degree of success. The JSF has outperformed challenging benchmarks for effectiveness and efficiency. The rating for relevance, not being the highest, takes into account the need for a more strategic approach to JSF resource allocation. Sustainability is more complex but could be addressed by longer term TA engagement through longer duration TA projects and cluster TA projects. Although a significant minority of TA projects are rated partly successful, this does not mean they have completely failed, as positive achievements have often been made. Reasons for partial success vary. Sometimes objectives are overambitious in relation to the resources provided and implementation period set. 78. Client satisfaction is an important performance measure. Two issues figure prominently: First, many interventions promise more than they can deliver. They also often gloss over the work that an executing agency must put in to ensure that the objectives are achieved. Second, many interventions finish prematurely, before outcomes are achieved. A final report is unlikely to be sufficient to ensure the achievement of the desired objectives. The gap between the final 25 The Central Operations Services Office has been conducting business opportunity seminars for Japanese
consultants every year. Measures are being undertaken to make such seminars more effective in promoting business opportunities to Japanese consultants.

24
report and an achieved objective needs to be addressed in ADB’s TA model through longer term engagement. 79. The annual report on JSF produced by ADB should include an assessment of effectiveness to complement the information currently presented covering volume of assistance. Consultants could be required, as part of their contract, to write a two-page assessment sheet covering key successes and lessons emerging. Translating these into local languages, where necessary, would add value. It would also promote the JSF much more effectively than present methods. The profile of JSF would also be augmented if ADB were required to focus it on particular programs at the country level. 80. Management of the JSF would be more efficient if Japan were able to fully delegate responsibility for approval to ADB according to guidelines and criteria provided by the Government of Japan. Japan’s vetting would then be ex-post rather than ex-ante as currently. Recognizing, however, that this not likely to be a feasible option for Japan, consideration could be given to greater involvement at the concept and design stages, which would offer better opportunities for synergy with bilateral programs (along the lines of the Japan Fund for Poverty Reduction process). It would also increase the predictability of subsequent approval by the Government of Japan. 81. For ADTAs, sustainability is a concern. This needs to be addressed through better client relationship management, more resources provided to each TA over a longer period where required, more strategic TA selection, more implementation support closer to the action, more effective involvement of counterparts, clearly defined exit strategies, and more specific and task-related contributions by the executing agency. 82. There is variability in the achievement of success across countries and sectors. Part of the solution is for the assumptions and risk column in a TA framework to better assess risk and for consideration to be explicitly given to how it will be managed. 83. As the survey results reveal, approximately 60% of TA projects are underresourced to some extent, while 30% are significantly underresourced. Better scoping of TA is required. There will remain instances when unforeseen difficulties during implementation create the need for additional resources to complete a TA satisfactorily. The current process for mobilizing supplementary funding is cumbersome. Instead, consideration could be given to allocating a proportion of each year’s JSF budget for topping up TA projects where a clear justification can be made.26 84. Akin to the current processing periods of all TAs, processing times are too long, particularly in relation to expected implementation periods. It takes 16–18 months from fact-finding to mobilization of consultants for ADTAs, and between 12 and 13 months for PPTAs, with JSF TAs being no different from TA projects funded from other sources. This requires changes in ADB’s business processes. Projects, on average, overrun their targeted completion dates by about 13 months for ADTAs and nearly 18 months for PPTAs. This indicates poor design, and/or inadequate management and administrative procedures.
26 ADB’s Cooperation Fund for the Water Sector provides additional funds of up to $160,000 for underfunded TA.
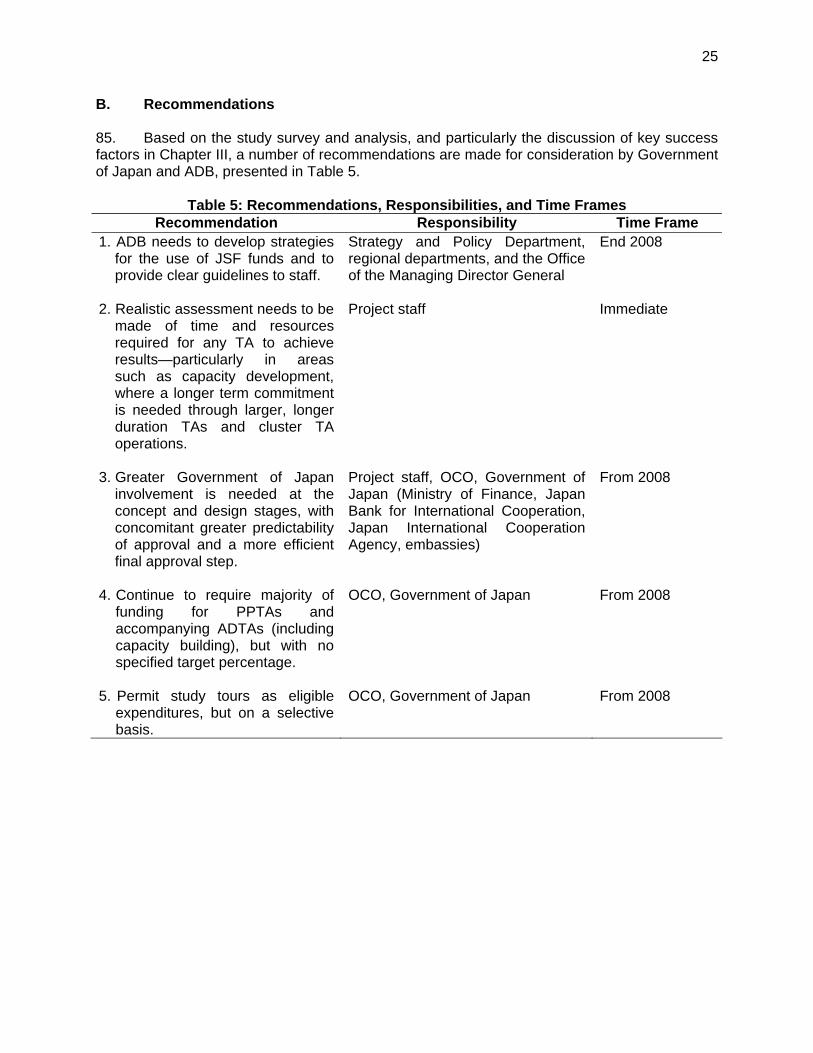
25
B. Recommendations 85. Based on the study survey and analysis, and particularly the discussion of key success factors in Chapter III, a number of recommendations are made for consideration by Government of Japan and ADB, presented in Table 5.
Table 5: Recommendations, Responsibilities, and Time Frames Recommendation Responsibility Time Frame
1. ADB needs to develop strategies for the use of JSF funds and to provide clear guidelines to staff.
Strategy and Policy Department, regional departments, and the Office of the Managing Director General
End 2008
2. Realistic assessment needs to be
made of time and resources required for any TA to achieve results—particularly in areas such as capacity development, where a longer term commitment is needed through larger, longer duration TAs and cluster TA operations.
Project staff Immediate
3. Greater Government of Japan
involvement is needed at the concept and design stages, with concomitant greater predictability of approval and a more efficient final approval step.
Project staff, OCO, Government of Japan (Ministry of Finance, Japan Bank for International Cooperation, Japan International Cooperation Agency, embassies)
From 2008
4. Continue to require majority of
funding for PPTAs and accompanying ADTAs (including capacity building), but with no specified target percentage.
OCO, Government of Japan From 2008
5. Permit study tours as eligible
expenditures, but on a selective basis.
OCO, Government of Japan From 2008
Appendix 1
26
EVALUATION METHODOLOGY
A. Methodology 1. This study evaluates the Japan Special Fund (JSF) program, including a broad coverage of advisory technical assistance (ADTA) and project preparatory TA (PPTA) funded by the JSF since its inception in 1988, and compares their overall performance with ADTAs and PPTAs funded under the TA Special Fund (TASF) and other trust funds managed by the Asian Development Bank (ADB). The methodology used in this study has been used by ADB’s Operations Evaluation Department over a number of years, beginning in 1995 with evaluations of ADTAs in Western Samoa and Indonesia.1 The JSF is regarded as a core part of ADB’s TA program. ADB administers JSF and non-JSF TAs in accordance with its normal practices and standards. 2. A desk review of the JSF program was conducted in order to make an assessment of the extent of the contribution of the JSF to intended recipients in ADB’s developing member countries, as well as the performance and impacts of the program as evaluated in completion and postevaluation reports. A comparison of the JSF program with that of the TASF was also included in the desk review. The desk analysis entailed the review of project files and TA papers (including completion and evaluation reports), and the use of relevant ADB databases. A database was produced containing amounts approved and disbursed, duration, projected and actual completion dates, and various other facets of each TA. TAs were classified by sector and, additionally, ADTAs were classified by the major objective of the assignment. Data sheets were also produced that detailed the objectives and activities of each TA and other information of note as well as summaries of TA completion reports (TCRs) and TA performance evaluation reports (TPERs) and information from questionnaires. The data sheets provided the base information for in-depth interviews of executing and implementing agency personnel responsible for implementation of each TA. These assessment sheets formed the basis of the ratings for each TA. 3. To effectively make an assessment of the outcomes and impacts of JSF TAs, field inspections were conducted in four of ADB’s developing member countries2 through operations evaluation missions to evaluate a selection of JSF TAs implemented there. The selection of TAs was based on a number of sectors/themes in each country. Structured interviews with ADB’s project officers (including resident mission staff), key staff of executing agencies involved in the TAs’ implementation, and project implementation consultants were also conducted during the operations evaluation mission. The interviews sought to establish the degree to which an ADTA had contributed to the attainment of its objectives and whether a PPTA had produced a design that had good prospects of achieving sustainable and positive results. The approach was to evaluate the view of the executing agency about the quality of the project as well as verifying what contribution the TA had made to the stated outputs and objectives.3 The information from these interviews formed the core qualitative data for this study and also contributed to the basis for the ratings given to the TAs.
1 ADB. 1995. Assessment of the Effectiveness of Bank Assistance in Capacity Building in Western Samoa. Manila;
and ADB. 1996. Assessment of the Effectiveness of Bank Technical Assistance for Capacity Building in Indonesia. Manila. Note that in 1997 Western Samoa changed its name to Samoa.
2 Indonesia, Lao People’s Democratic Republic, Mongolia, and Nepal. 3 The study did not perform an evaluation of the draft final reports of consultants. The major constraint to performing
such an exercise was the lack of a good understanding of the political and organizational context in which a report was made which would tend to make any evaluation more theoretical than realistic.
Appendix 1
27
4. Two types of survey questionnaires were also sent out through e-mail. One type was sent out to consultants involved in the implementation of TAs included in the sample for this study and another one was sent to key officials of executing agencies. The response rate was good at 43%. While the questionnaires changed slightly over a succession of evaluations, a core set of questions remained the same, and the data from these were entered into the database for the study. The questionnaires were used predominantly for statistical purposes, but they also produced data that were inputs to the assessment sheets for each TA in the sample. However, the survey questionnaires contained a number of open-ended questions, responses to which were listed and then sorted to identify those that were most frequently given in order to develop an understanding of the kinds of issues that officials in executing agencies and consultants considered were most important in the execution of TAs. For TAs evaluated in earlier evaluations, the answers to core open-ended questions were sorted and treated in the same way. 5. From the information collected from the desk analysis and from answers provided in the questionnaires and the structured interviews, ratings were given to each TA for its performance against the five criteria used by OED. In the case of earlier reviews, some had to be “rerated,” as the five criteria were not used when they were conducted. The five criteria are:
(i) relevance, (ii) effectiveness, (iii) efficiency, (iv) sustainability, and (v) overall impact.
The rating ranked TAs at the following four levels:
(i) Highly successful (Rank 3), (ii) Successful (Rank 2), (iii) Partly successful (Rank 1), and (iv) Unsuccessful (Rank 0).
6. In 2006, OED conducted an evaluation of the performance of technical assistance. The evaluation looked at 13 JSF ADTAs and 55 ADTAs funded from other sources, as well as 18 JSF PPTAs and 22 PPTAs funded from other sources. The evaluation provided valuable input to this study, as the broad findings, particularly with regard to the management and administration of TA, apply equally to this study. 7. To supplement the data collected through interviews and survey questionnaires, and to provide comparative material, OED’s databases were accessed for other evaluations, namely the Western Samoa and Indonesia studies evaluated in 1995 and 1996, respectively; an evaluation of PPTAs in the agriculture sector in Bangladesh; an evaluation of ADTAs in Cambodia, which was done as part of the 2004 Cambodia Country Assistance Program Evaluation (CAPE); an evaluation of ADTAs and PPTAs done as part of the 2005 Uzbekistan CAPE; and the evaluation on the performance of TA mentioned in para. 6, which included TAs from Fiji Islands, India, Kyrgyz Republic, Philippines, and Viet Nam. The aforesaid evaluations used the same methodology of using questionnaires supported by in-depth interviews with key officials of executing agencies and with implementation consultants. 8. This evaluation compared its ratings with TCRs conducted by the departments responsible for each TA. Table A1.1 compares TCR evaluations with this study’s evaluations of

Appendix 1
28
the same TAs. TCR evaluations are now made on a similar four-point scale as used in this study. Operational departments began preparing TCRs in 1993. However, major differences between the self- evaluation and independent evaluation occur. TCRs, which focus on outputs, have reported consistently high success rates of more than 80% for TAs. Independent evaluations, focusing more on achievement of outcomes and sustainability, have shown much lower success rates (57% according to the 2005 Annual Evaluation Review4 and 63% in OED’s evaluation of the performance of TA5). This sample shows a slightly better result than that reported by OED, with the JSF registering 64% of TAs for which there is a TCR as successful or better compared with the TCR result of 78%. For non-JSF TAs, the respective results were 67% for this study and 86% for TCRs, as shown in Table A1.1. 9. Independent evaluations only verify a sample of TCRs. Their selection has often not been random. It is likely that the sample for this study might be biased towards ADTAs that addressed objectives with a higher level of difficulty than average, particularly in the two early ones in Indonesia and Samoa when issues like capacity building were conceived by ADB as more an exercise in training than a coherent program to address issues in an organization affecting performance. 10. OED has found that TCR ratings have not shown any significant difference between JSF- and TASF-financed TAs. This study found that both TCR and OED evaluations of TASF-financed TAs have outperformed JSF-financed TAs, though in the case of this evaluation, only slightly.
Table A1.1: Comparison of TCR and OED Evaluations for ADTAs JSF Evaluations Non-JSF Evaluations Rating TCR % OED % TCR % OED %
Highly Successful
6 9.5 12 19 3 5.3 8 14
Successful 43 68.3 28 44.5 46 80.7 30 52.6Partly Successful
14 22.2 22 34.9 7 12.3 15 26.3
Unsuccessful 0 0 1 1.6 1 1.7 4 7.1 Total 63 100 63 100 57 100 57 100ADTA = advisory technical assistance, JSF = Japan Special Fund, OED = Operations Evaluation Department, TCR = technical assistance completion report. Source of basic data: Asian Development Bank management information systems.
B. Study Sample 11. This study team visited four countries—Indonesia, Lao People’s Democratic Republic, Mongolia, and Nepal—to evaluate a sample of TAs implemented there. The selection of TAs was based on a number of themes in each country. Inevitably, this was biased in favor of TAs with a longer duration than would have occurred if a time period had been the basis of selection. That made it more difficult to locate people who were associated with the TAs.
4 ADB. 2005. Annual Evaluation Review. Manila. 5 The evaluation added ratings from its own random study and from those conducted recently in CAPEs and sector
assistance program evaluations. These evaluations had ratings in excess of 70%. It was unclear from the report how far back the database stretched (ADB. 2007. Special Evaluation Study on the Performance of Technical Assistance. Manila).
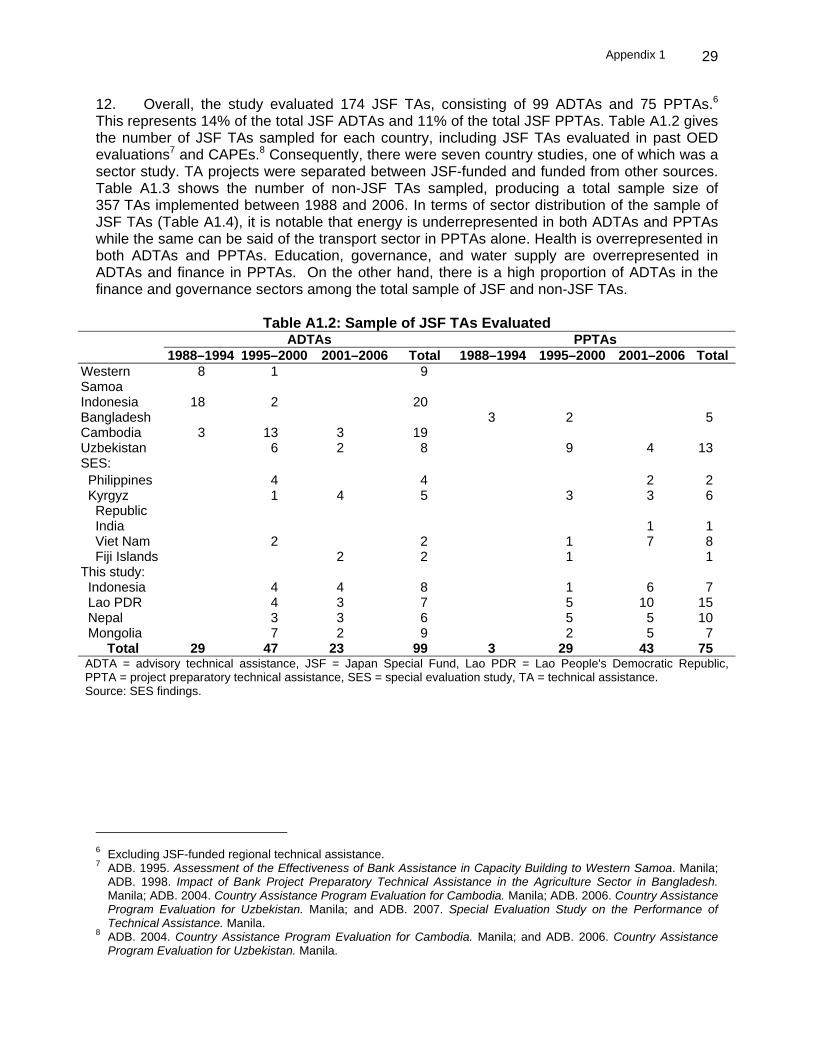
Appendix 1
29
12. Overall, the study evaluated 174 JSF TAs, consisting of 99 ADTAs and 75 PPTAs.6 This represents 14% of the total JSF ADTAs and 11% of the total JSF PPTAs. Table A1.2 gives the number of JSF TAs sampled for each country, including JSF TAs evaluated in past OED evaluations7 and CAPEs.8 Consequently, there were seven country studies, one of which was a sector study. TA projects were separated between JSF-funded and funded from other sources. Table A1.3 shows the number of non-JSF TAs sampled, producing a total sample size of 357 TAs implemented between 1988 and 2006. In terms of sector distribution of the sample of JSF TAs (Table A1.4), it is notable that energy is underrepresented in both ADTAs and PPTAs while the same can be said of the transport sector in PPTAs alone. Health is overrepresented in both ADTAs and PPTAs. Education, governance, and water supply are overrepresented in ADTAs and finance in PPTAs. On the other hand, there is a high proportion of ADTAs in the finance and governance sectors among the total sample of JSF and non-JSF TAs.
Table A1.2: Sample of JSF TAs Evaluated ADTAs PPTAs 1988–1994 1995–2000 2001–2006 Total 1988–1994 1995–2000 2001–2006 Total
Western Samoa
8 1 9
Indonesia 18 2 20 Bangladesh 3 2 5Cambodia 3 13 3 19 Uzbekistan 6 2 8 9 4 13SES: Philippines 4 4 2 2 Kyrgyz Republic
1 4 5 3 3 6
India 1 1 Viet Nam 2 2 1 7 8 Fiji Islands 2 2 1 1This study: Indonesia 4 4 8 1 6 7 Lao PDR 4 3 7 5 10 15 Nepal 3 3 6 5 5 10 Mongolia 7 2 9 2 5 7 Total 29 47 23 99 3 29 43 75ADTA = advisory technical assistance, JSF = Japan Special Fund, Lao PDR = Lao People's Democratic Republic, PPTA = project preparatory technical assistance, SES = special evaluation study, TA = technical assistance. Source: SES findings.
6 Excluding JSF-funded regional technical assistance. 7 ADB. 1995. Assessment of the Effectiveness of Bank Assistance in Capacity Building to Western Samoa. Manila;
ADB. 1998. Impact of Bank Project Preparatory Technical Assistance in the Agriculture Sector in Bangladesh. Manila; ADB. 2004. Country Assistance Program Evaluation for Cambodia. Manila; ADB. 2006. Country Assistance Program Evaluation for Uzbekistan. Manila; and ADB. 2007. Special Evaluation Study on the Performance of Technical Assistance. Manila.
8 ADB. 2004. Country Assistance Program Evaluation for Cambodia. Manila; and ADB. 2006. Country Assistance Program Evaluation for Uzbekistan. Manila.
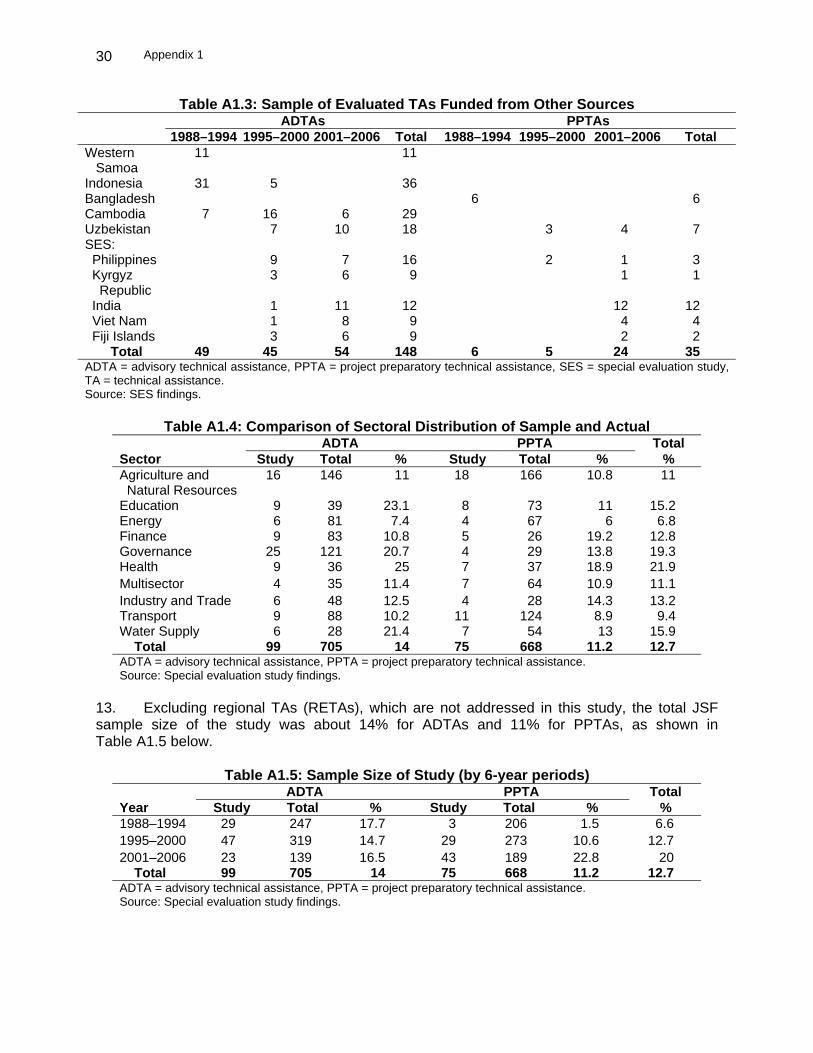
Appendix 1
30
Table A1.3: Sample of Evaluated TAs Funded from Other Sources ADTAs PPTAs 1988–1994 1995–2000 2001–2006 Total 1988–1994 1995–2000 2001–2006 Total Western Samoa
11 11
Indonesia 31 5 36 Bangladesh 6 6Cambodia 7 16 6 29 Uzbekistan 7 10 18 3 4 7SES: Philippines 9 7 16 2 1 3 Kyrgyz Republic
3 6 9 1 1
India 1 11 12 12 12 Viet Nam 1 8 9 4 4 Fiji Islands 3 6 9 2 2 Total 49 45 54 148 6 5 24 35ADTA = advisory technical assistance, PPTA = project preparatory technical assistance, SES = special evaluation study, TA = technical assistance. Source: SES findings.
Table A1.4: Comparison of Sectoral Distribution of Sample and Actual
ADTA PPTA Total Sector Study Total % Study Total % % Agriculture and Natural Resources
16 146 11 18 166 10.8 11
Education 9 39 23.1 8 73 11 15.2Energy 6 81 7.4 4 67 6 6.8Finance 9 83 10.8 5 26 19.2 12.8Governance 25 121 20.7 4 29 13.8 19.3Health 9 36 25 7 37 18.9 21.9Multisector 4 35 11.4 7 64 10.9 11.1Industry and Trade 6 48 12.5 4 28 14.3 13.2Transport 9 88 10.2 11 124 8.9 9.4Water Supply 6 28 21.4 7 54 13 15.9 Total 99 705 14 75 668 11.2 12.7ADTA = advisory technical assistance, PPTA = project preparatory technical assistance. Source: Special evaluation study findings.
13. Excluding regional TAs (RETAs), which are not addressed in this study, the total JSF sample size of the study was about 14% for ADTAs and 11% for PPTAs, as shown in Table A1.5 below.
Table A1.5: Sample Size of Study (by 6-year periods) ADTA PPTA Total Year Study Total % Study Total % % 1988–1994 29 247 17.7 3 206 1.5 6.61995–2000 47 319 14.7 29 273 10.6 12.72001–2006 23 139 16.5 43 189 22.8 20 Total 99 705 14 75 668 11.2 12.7ADTA = advisory technical assistance, PPTA = project preparatory technical assistance. Source: Special evaluation study findings.
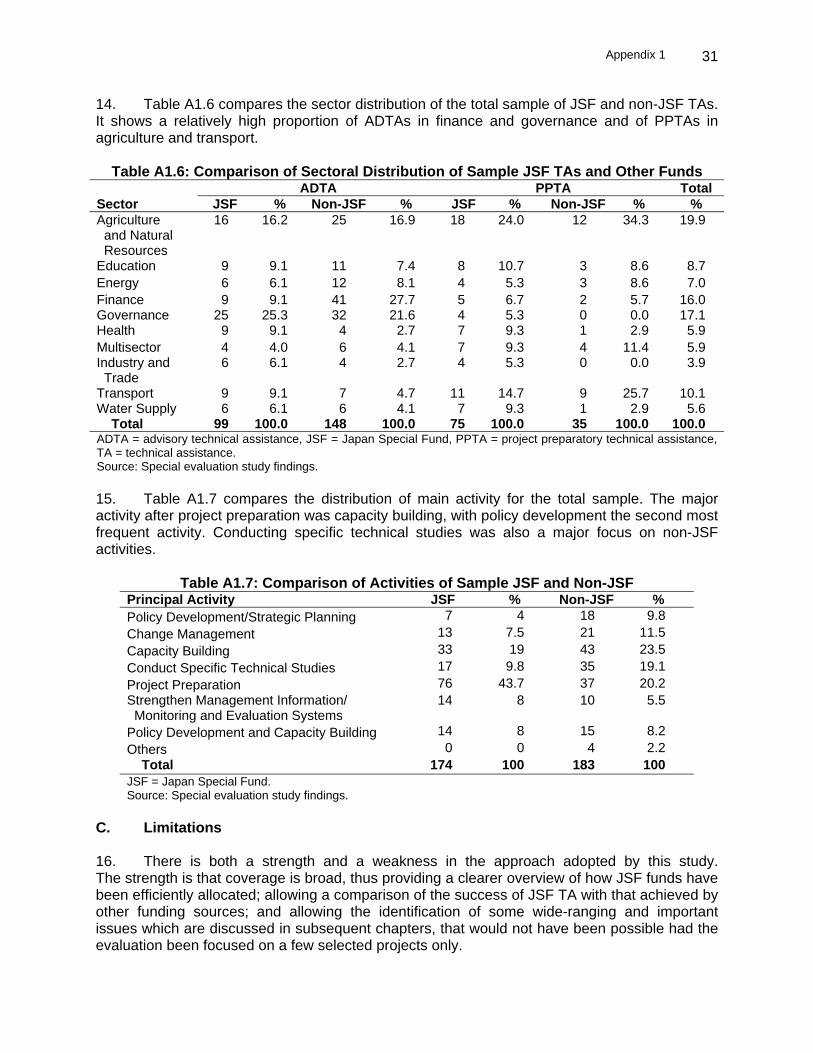
Appendix 1
31
14. Table A1.6 compares the sector distribution of the total sample of JSF and non-JSF TAs. It shows a relatively high proportion of ADTAs in finance and governance and of PPTAs in agriculture and transport.
Table A1.6: Comparison of Sectoral Distribution of Sample JSF TAs and Other Funds ADTA PPTA Total
Sector JSF % Non-JSF % JSF % Non-JSF % % Agriculture and Natural Resources
16 16.2 25 16.9 18 24.0 12 34.3 19.9
Education 9 9.1 11 7.4 8 10.7 3 8.6 8.7Energy 6 6.1 12 8.1 4 5.3 3 8.6 7.0Finance 9 9.1 41 27.7 5 6.7 2 5.7 16.0Governance 25 25.3 32 21.6 4 5.3 0 0.0 17.1Health 9 9.1 4 2.7 7 9.3 1 2.9 5.9Multisector 4 4.0 6 4.1 7 9.3 4 11.4 5.9Industry and Trade
6 6.1 4 2.7 4 5.3 0 0.0 3.9
Transport 9 9.1 7 4.7 11 14.7 9 25.7 10.1Water Supply 6 6.1 6 4.1 7 9.3 1 2.9 5.6 Total 99 100.0 148 100.0 75 100.0 35 100.0 100.0ADTA = advisory technical assistance, JSF = Japan Special Fund, PPTA = project preparatory technical assistance, TA = technical assistance. Source: Special evaluation study findings.
15. Table A1.7 compares the distribution of main activity for the total sample. The major activity after project preparation was capacity building, with policy development the second most frequent activity. Conducting specific technical studies was also a major focus on non-JSF activities.
Table A1.7: Comparison of Activities of Sample JSF and Non-JSF Principal Activity JSF % Non-JSF % Policy Development/Strategic Planning 7 4 18 9.8Change Management 13 7.5 21 11.5Capacity Building 33 19 43 23.5Conduct Specific Technical Studies 17 9.8 35 19.1Project Preparation 76 43.7 37 20.2Strengthen Management Information/ Monitoring and Evaluation Systems
14 8 10 5.5
Policy Development and Capacity Building 14 8 15 8.2Others 0 0 4 2.2 Total 174 100 183 100JSF = Japan Special Fund. Source: Special evaluation study findings.
C. Limitations 16. There is both a strength and a weakness in the approach adopted by this study. The strength is that coverage is broad, thus providing a clearer overview of how JSF funds have been efficiently allocated; allowing a comparison of the success of JSF TA with that achieved by other funding sources; and allowing the identification of some wide-ranging and important issues which are discussed in subsequent chapters, that would not have been possible had the evaluation been focused on a few selected projects only.
Appendix 1
32
17. The weakness is that a detailed longitudinal analysis of each TA and its consequences is not possible. Addressing such a weakness would be more appropriate for specific studies of small groups of related TAs rather than this study.
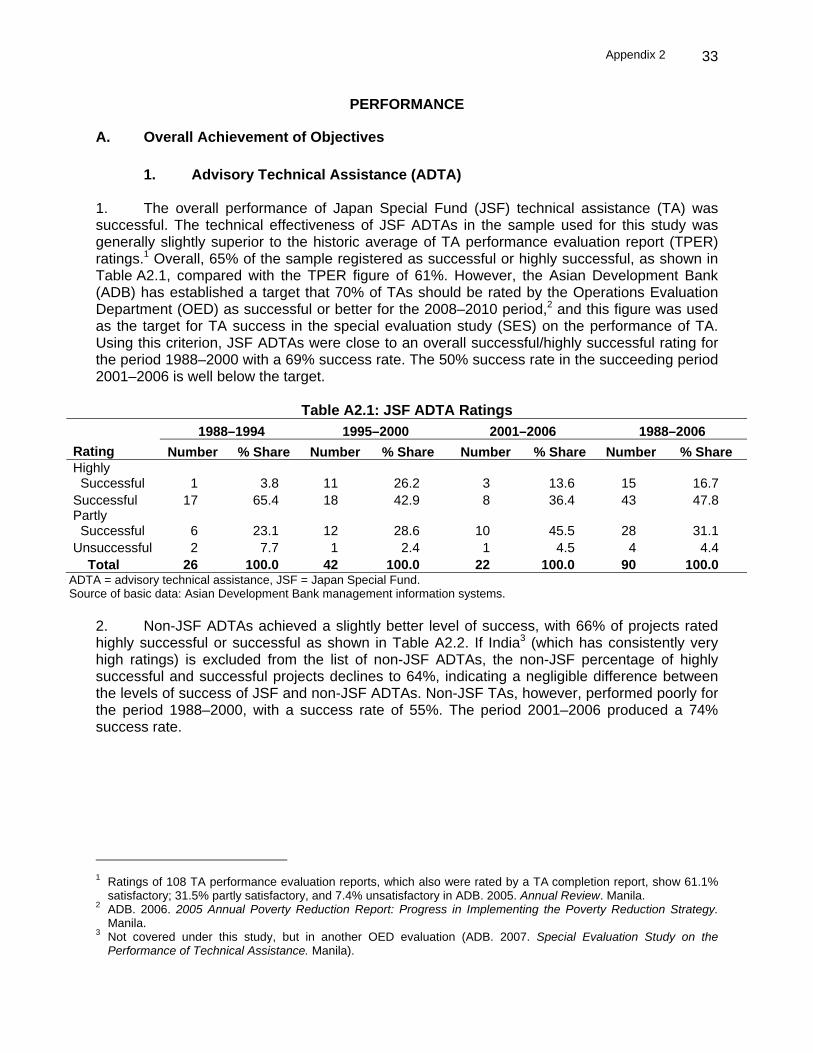
Appendix 2
33
PERFORMANCE
A. Overall Achievement of Objectives
1. Advisory Technical Assistance (ADTA) 1. The overall performance of Japan Special Fund (JSF) technical assistance (TA) was successful. The technical effectiveness of JSF ADTAs in the sample used for this study was generally slightly superior to the historic average of TA performance evaluation report (TPER) ratings.1 Overall, 65% of the sample registered as successful or highly successful, as shown in Table A2.1, compared with the TPER figure of 61%. However, the Asian Development Bank (ADB) has established a target that 70% of TAs should be rated by the Operations Evaluation Department (OED) as successful or better for the 2008–2010 period,2 and this figure was used as the target for TA success in the special evaluation study (SES) on the performance of TA. Using this criterion, JSF ADTAs were close to an overall successful/highly successful rating for the period 1988–2000 with a 69% success rate. The 50% success rate in the succeeding period 2001–2006 is well below the target.
Table A2.1: JSF ADTA Ratings
1988–1994 1995–2000 2001–2006 1988–2006 Rating Number % Share Number % Share Number % Share Number % Share Highly Successful 1 3.8 11 26.2 3 13.6 15 16.7Successful 17 65.4 18 42.9 8 36.4 43 47.8Partly Successful 6 23.1 12 28.6 10 45.5 28 31.1Unsuccessful 2 7.7 1 2.4 1 4.5 4 4.4 Total 26 100.0 42 100.0 22 100.0 90 100.0
D ADTA = advisory technical assistance, JSF = Japan Special Fund. Source of basic data: Asian Development Bank management information systems.
2. Non-JSF ADTAs achieved a slightly better level of success, with 66% of projects rated highly successful or successful as shown in Table A2.2. If India3 (which has consistently very high ratings) is excluded from the list of non-JSF ADTAs, the non-JSF percentage of highly successful and successful projects declines to 64%, indicating a negligible difference between the levels of success of JSF and non-JSF ADTAs. Non-JSF TAs, however, performed poorly for the period 1988–2000, with a success rate of 55%. The period 2001–2006 produced a 74% success rate.
1 Ratings of 108 TA performance evaluation reports, which also were rated by a TA completion report, show 61.1%
satisfactory; 31.5% partly satisfactory, and 7.4% unsatisfactory in ADB. 2005. Annual Review. Manila. 2 ADB. 2006. 2005 Annual Poverty Reduction Report: Progress in Implementing the Poverty Reduction Strategy.
Manila. 3 Not covered under this study, but in another OED evaluation (ADB. 2007. Special Evaluation Study on the
Performance of Technical Assistance. Manila).
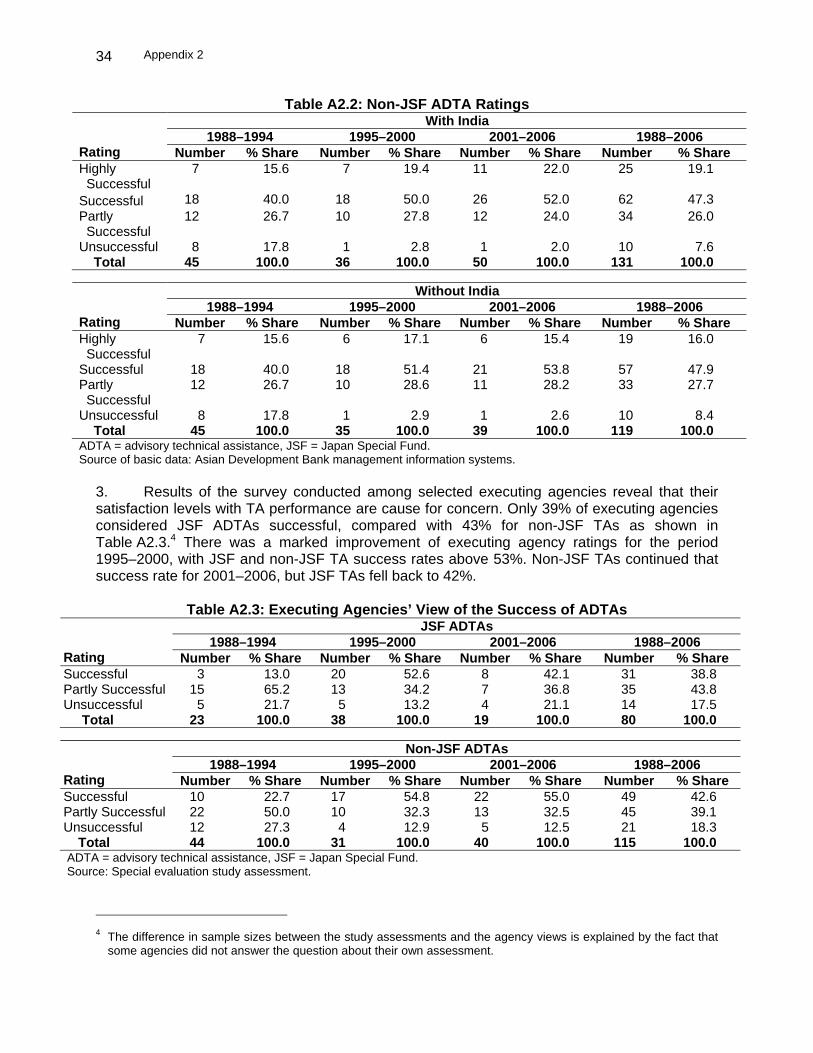
Appendix 2
34
Table A2.2: Non-JSF ADTA Ratings With India
1988–1994 1995–2000 2001–2006 1988–2006 Rating Number % Share Number % Share Number % Share Number % Share Highly Successful
7 15.6 7 19.4 11 22.0 25 19.1
Successful 18 40.0 18 50.0 26 52.0 62 47.3Partly Successful
12 26.7 10 27.8 12 24.0 34 26.0
Unsuccessful 8 17.8 1 2.8 1 2.0 10 7.6 Total 45 100.0 36 100.0 50 100.0 131 100.0
Without India 1988–1994 1995–2000 2001–2006 1988–2006
Rating Number % Share Number % Share Number % Share Number % Share Highly Successful
7 15.6 6 17.1 6 15.4 19 16.0
Successful 18 40.0 18 51.4 21 53.8 57 47.9Partly Successful
12 26.7 10 28.6 11 28.2 33 27.7
Unsuccessful 8 17.8 1 2.9 1 2.6 10 8.4 Total 45 100.0 35 100.0 39 100.0 119 100.0ADTA = advisory technical assistance, JSF = Japan Special Fund. Source of basic data: Asian Development Bank management information systems.
3. Results of the survey conducted among selected executing agencies reveal that their satisfaction levels with TA performance are cause for concern. Only 39% of executing agencies considered JSF ADTAs successful, compared with 43% for non-JSF TAs as shown in Table A2.3.4 There was a marked improvement of executing agency ratings for the period 1995–2000, with JSF and non-JSF TA success rates above 53%. Non-JSF TAs continued that success rate for 2001–2006, but JSF TAs fell back to 42%.
Table A2.3: Executing Agencies’ View of the Success of ADTAs JSF ADTAs
1988–1994 1995–2000 2001–2006 1988–2006 Rating Number % Share Number % Share Number % Share Number % Share Successful 3 13.0 20 52.6 8 42.1 31 38.8Partly Successful 15 65.2 13 34.2 7 36.8 35 43.8Unsuccessful 5 21.7 5 13.2 4 21.1 14 17.5 Total 23 100.0 38 100.0 19 100.0 80 100.0
Non-JSF ADTAs 1988–1994 1995–2000 2001–2006 1988–2006
Rating Number % Share Number % Share Number % Share Number % Share Successful 10 22.7 17 54.8 22 55.0 49 42.6Partly Successful 22 50.0 10 32.3 13 32.5 45 39.1Unsuccessful 12 27.3 4 12.9 5 12.5 21 18.3 Total 44 100.0 31 100.0 40 100.0 115 100.0ADTA = advisory technical assistance, JSF = Japan Special Fund. Source: Special evaluation study assessment.
4 The difference in sample sizes between the study assessments and the agency views is explained by the fact that
some agencies did not answer the question about their own assessment.
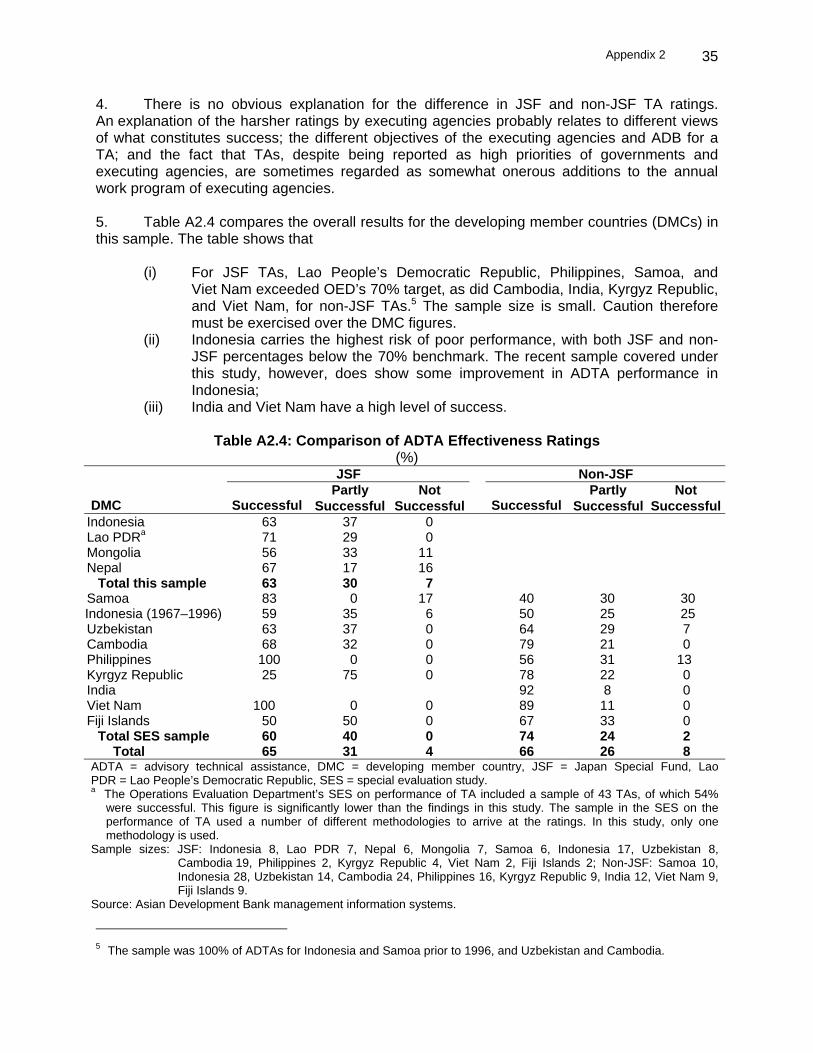
Appendix 2
35
4. There is no obvious explanation for the difference in JSF and non-JSF TA ratings. An explanation of the harsher ratings by executing agencies probably relates to different views of what constitutes success; the different objectives of the executing agencies and ADB for a TA; and the fact that TAs, despite being reported as high priorities of governments and executing agencies, are sometimes regarded as somewhat onerous additions to the annual work program of executing agencies. 5. Table A2.4 compares the overall results for the developing member countries (DMCs) in this sample. The table shows that
(i) For JSF TAs, Lao People’s Democratic Republic, Philippines, Samoa, and Viet Nam exceeded OED’s 70% target, as did Cambodia, India, Kyrgyz Republic, and Viet Nam, for non-JSF TAs.5 The sample size is small. Caution therefore must be exercised over the DMC figures.
(ii) Indonesia carries the highest risk of poor performance, with both JSF and non-JSF percentages below the 70% benchmark. The recent sample covered under this study, however, does show some improvement in ADTA performance in Indonesia;
(iii) India and Viet Nam have a high level of success.
Table A2.4: Comparison of ADTA Effectiveness Ratings (%)
JSF Non-JSF Partly Not Partly Not
DMC Successful Successful Successful Successful Successful SuccessfulIndonesia 63 37 0 Lao PDRa 71 29 0 Mongolia 56 33 11 Nepal 67 17 16 Total this sample 63 30 7 Samoa 83 0 17 40 30 30 Indonesia (1967–1996) 59 35 6 50 25 25 Uzbekistan 63 37 0 64 29 7 Cambodia 68 32 0 79 21 0 Philippines 100 0 0 56 31 13 Kyrgyz Republic 25 75 0 78 22 0 India 92 8 0 Viet Nam 100 0 0 89 11 0 Fiji Islands 50 50 0 67 33 0 Total SES sample 60 40 0 74 24 2 Total 65 31 4 66 26 8 ADTA = advisory technical assistance, DMC = developing member country, JSF = Japan Special Fund, Lao PDR = Lao People’s Democratic Republic, SES = special evaluation study. a The Operations Evaluation Department’s SES on performance of TA included a sample of 43 TAs, of which 54%
were successful. This figure is significantly lower than the findings in this study. The sample in the SES on the performance of TA used a number of different methodologies to arrive at the ratings. In this study, only one methodology is used.
Sample sizes: JSF: Indonesia 8, Lao PDR 7, Nepal 6, Mongolia 7, Samoa 6, Indonesia 17, Uzbekistan 8, Cambodia 19, Philippines 2, Kyrgyz Republic 4, Viet Nam 2, Fiji Islands 2; Non-JSF: Samoa 10, Indonesia 28, Uzbekistan 14, Cambodia 24, Philippines 16, Kyrgyz Republic 9, India 12, Viet Nam 9, Fiji Islands 9.
Source: Asian Development Bank management information systems.
5 The sample was 100% of ADTAs for Indonesia and Samoa prior to 1996, and Uzbekistan and Cambodia.

Appendix 2
36
2. Project Preparatory Technical Assistance (PPTA)
a. PPTA Ratings 6. The success profile of JSF PPTAs was slightly better than that of ADTAs, as shown in Table A2.5. As with ADTAs, there was a higher rate of success in the middle period of 1995–2000 than for the subsequent period of 2001–2006, though the difference was not as great as with ADTAs. The overall success rate of 67% is a little below ADB’s target of 70%.
Table A2.5: JSF PPTA Ratings
1988–1994 1995–2000 2001–2006 1988–2006 Rating Number % Share Number % Share Number % Share Number % Share Highly Successful 0 0.0 5 17.2 6 15.0 11 15.3 Successful 1 33.3 15 51.7 21 52.5 37 51.4 Partly Successful 2 66.7 7 24.1 10 25.0 19 26.4 Unsuccessful 0 0.0 2 6.9 3 7.5 5 6.9 Total 3 100.0 29 100.0 40 100.0 72 100.0 JSF = Japan Special Fund, PPTA = project preparatory technical assistance. Source of basic data: Asian Development Bank management information systems.
7. Non-JSF PPTAs, like ADTAs, achieved a better level of success than JSF PPTAs, with 73% of projects rated highly successful or successful as shown in Table A2.6 which comfortably exceeds OED’s benchmark of 70%.
Table A2.6: Non-JSF PPTA Ratings 1988–1994 1995–2000 2001–2006 1988–2006
Rating Number % Share Number % Share Number % Share Number % Share Highly Successful 1 16.7 1 20.0 2 9.1 4 12.1 Successful 2 33.3 3 60.0 14 63.6 20 60.6 Partly Successful 3 50.0 1 20.0 4 18.2 7 21.2 Unsuccessful 0 0.0 0 0.0 2 9.1 2 6.1 Total 6 100.0 5 100.0 22 100.0 33 100.0 JSF = Japan Special Fund, PPTA = project preparatory technical assistance. Source of basic data: Asian Development Bank management information systems.
8. However, executing agencies generally considered the quality of JSF PPTAs better than non-JSF PPTAs, with 44% being rated as making a high contribution to the design process, compared with 37% for non-JSF PPTAs as shown in Table A2.7. There was a substantial improvement in the final period, 2001–2006, with 54% of PPTAs considered as making a high contribution to the design process. Non-JSF PPTAs, however, remained at a very moderate 38% success.

Appendix 2
37
Table A2.7: Executing Agencies’ View of the Success of PPTAs JSF PPTAs
1988–1994 1995–2000 2001–2006 1988–2006 Rating Number % Share Number % Share Number % Share Number % Share High 1 33.3 8 32.0 19 54.3 28 44.4 Medium 1 33.3 14 56.0 11 31.4 26 41.3 Low 1 33.3 3 12.0 5 14.3 9 14.3 Total 3 100.0 25 100.0 35 100.0 63 100.0
Non-JSF PPTAs 1988–1994 1995–2000 2001–2006 1988–2006
Rating Number % Share Number % Share Number % Share Number % Share High 1 20.0 2 50.0 8 38.1 11 36.7 Medium 3 60.0 1 25.0 8 38.1 12 40.0 Low 1 20.0 1 25.0 5 23.8 7 23.3 Total 5 100.0 4 100.0 21 100.0 30 100.0 JSF = Japan Special Fund, PPTA = project preparatory technical assistance. Source: Special evaluation study assessment.
9. Table A2.8 compares the overall results for PPTAs in DMCs in this study sample. The table shows the following:
(i) For JSF TAs in DMCs with a sample greater than two, Mongolia, Nepal, Uzbekistan, and Viet Nam met or exceeded OED’s 70% target. Non-JSF TAs in Uzbekistan and Viet Nam exceeded that target.
(ii) Bangladesh, Indonesia, Kyrgyz Republic, and Philippines all carry a serious risk of below successful performance. Indonesia had the highest risk of poor performance, being well below the targeted 70% for both ADTAs and PPTAs.
Table A2.8: Comparison of PPTA Effectiveness Ratings
(%) JSF Non-JSF
Partly Not Partly Not DMC Successful Successful Successful Successful Successful Successful
Indonesia 50 17 33 Lao PDR 67 33 0 Mongolia 100 0 0 Nepal 70 30 0 Total this sample 71 24 5 Uzbekistan 73 18 9 83 17 0 Bangladesh 40 60 0 50 50 0 Philippines 50 0 50 67 0 33 Kyrgyz Republic 33 67 0 0 0 0 India 0 0 100 67 25 8 Viet Nam 88 12 0 100 0 0 Fiji Islands 100 0 0 100 0 0 Total SES sample 61 28 11 76 14 10 Total 67 26 7 73 21 6 DMC = developing member country, JSF = Japan Special Fund, Lao PDR = Lao People’s Democratic Republic, SES = special evaluation study. Sample sizes: JSF: Indonesia 6, Lao PDR 15, Nepal 10, Mongolia 7, Uzbekistan 11, Bangladesh 5, Philippines 2,
Kyrgyz Republic 6, India 1, Viet Nam 8, Fiji Islands 1; Non-JSF: Uzbekistan 6, Bangladesh 6, Philippines 3, Kyrgyz Republic 0, India 12, Viet Nam 4, Fiji Islands 2.
Source: Asian Development Bank management information systems.
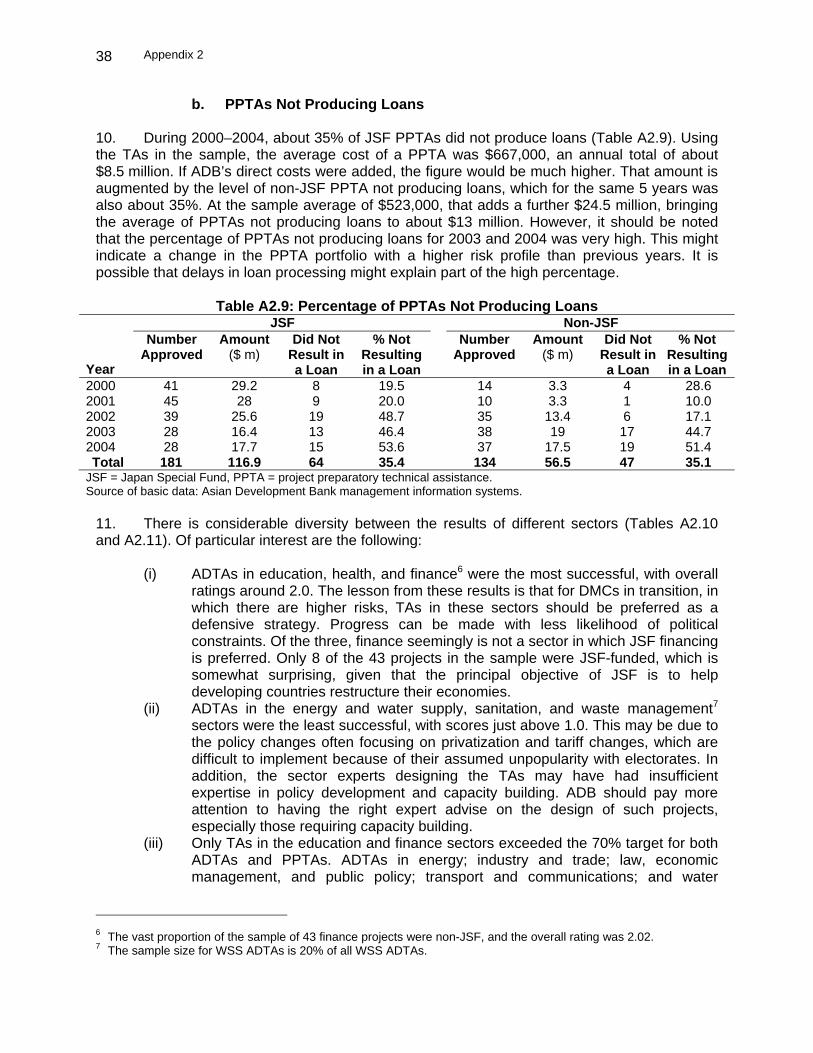
Appendix 2
38
b. PPTAs Not Producing Loans 10. During 2000–2004, about 35% of JSF PPTAs did not produce loans (Table A2.9). Using the TAs in the sample, the average cost of a PPTA was $667,000, an annual total of about $8.5 million. If ADB’s direct costs were added, the figure would be much higher. That amount is augmented by the level of non-JSF PPTA not producing loans, which for the same 5 years was also about 35%. At the sample average of $523,000, that adds a further $24.5 million, bringing the average of PPTAs not producing loans to about $13 million. However, it should be noted that the percentage of PPTAs not producing loans for 2003 and 2004 was very high. This might indicate a change in the PPTA portfolio with a higher risk profile than previous years. It is possible that delays in loan processing might explain part of the high percentage.
Table A2.9: Percentage of PPTAs Not Producing Loans JSF Non-JSF
Year
Number Approved
Amount ($ m)
Did Not Result in a Loan
% Not Resulting in a Loan
Number Approved
Amount ($ m)
Did Not Result in a Loan
% Not Resulting in a Loan
2000 41 29.2 8 19.5 14 3.3 4 28.6 2001 45 28 9 20.0 10 3.3 1 10.0 2002 39 25.6 19 48.7 35 13.4 6 17.1 2003 28 16.4 13 46.4 38 19 17 44.7 2004 28 17.7 15 53.6 37 17.5 19 51.4
Total 181 116.9 64 35.4 134 56.5 47 35.1 JSF = Japan Special Fund, PPTA = project preparatory technical assistance. Source of basic data: Asian Development Bank management information systems.
11. There is considerable diversity between the results of different sectors (Tables A2.10 and A2.11). Of particular interest are the following:
(i) ADTAs in education, health, and finance6 were the most successful, with overall ratings around 2.0. The lesson from these results is that for DMCs in transition, in which there are higher risks, TAs in these sectors should be preferred as a defensive strategy. Progress can be made with less likelihood of political constraints. Of the three, finance seemingly is not a sector in which JSF financing is preferred. Only 8 of the 43 projects in the sample were JSF-funded, which is somewhat surprising, given that the principal objective of JSF is to help developing countries restructure their economies.
(ii) ADTAs in the energy and water supply, sanitation, and waste management7 sectors were the least successful, with scores just above 1.0. This may be due to the policy changes often focusing on privatization and tariff changes, which are difficult to implement because of their assumed unpopularity with electorates. In addition, the sector experts designing the TAs may have had insufficient expertise in policy development and capacity building. ADB should pay more attention to having the right expert advise on the design of such projects, especially those requiring capacity building.
(iii) Only TAs in the education and finance sectors exceeded the 70% target for both ADTAs and PPTAs. ADTAs in energy; industry and trade; law, economic management, and public policy; transport and communications; and water
6 The vast proportion of the sample of 43 finance projects were non-JSF, and the overall rating was 2.02. 7 The sample size for WSS ADTAs is 20% of all WSS ADTAs.

Appendix 2
39
supply, sanitation, and waste management failed to meet the 70% target. Agriculture, education, finance, health, and multisector TAs met this benchmark for ADTAs. Education, energy, law, economic management, and public policy, multisector, transport, and water and sanitation met the benchmark for PPTAs.
(iv) In some cases, the results of PPTAs were the opposite of ADTAs. Energy and water supply, sanitation, and waste management were among the most successful sectors for PPTAs and the worst for ADTAs.
(v) The performance of finance, health, and industry and trade in PPTAs was well below the benchmark.
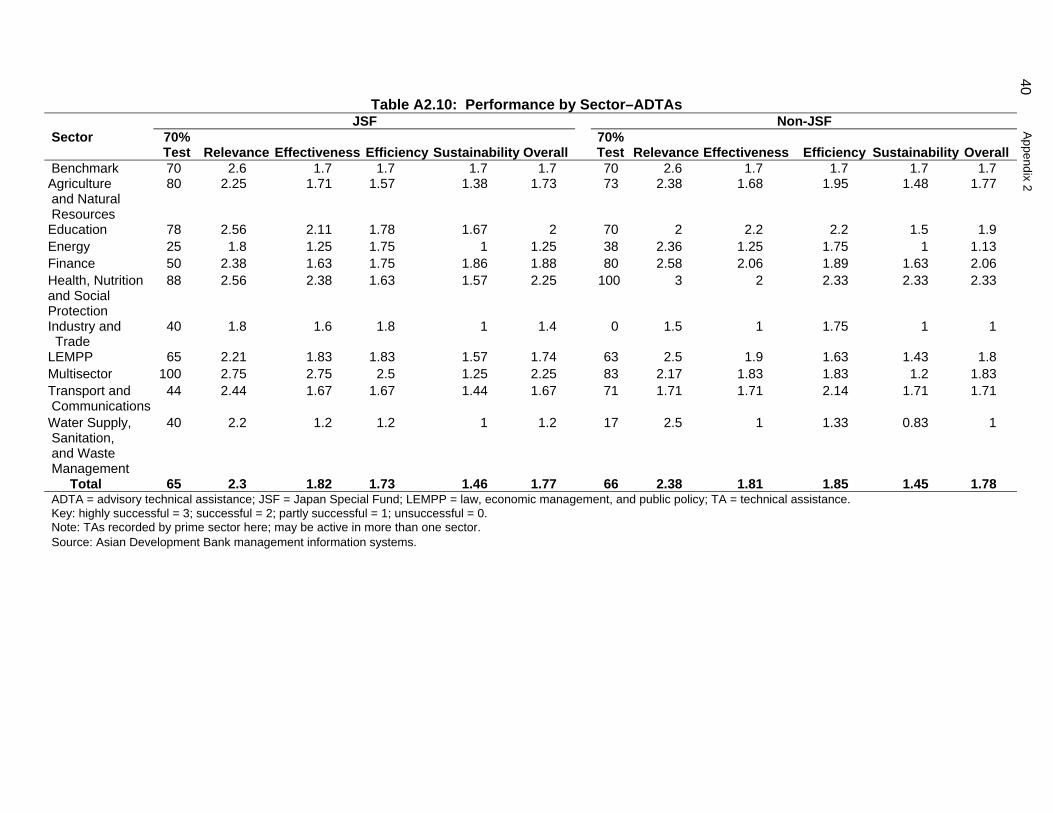
40 A
ppendix 2
Table A2.10: Performance by Sector–ADTAs JSF Non-JSF
Sector 70% Test Relevance Effectiveness Efficiency Sustainability Overall
70% Test Relevance Effectiveness Efficiency Sustainability Overall
Benchmark 70 2.6 1.7 1.7 1.7 1.7 70 2.6 1.7 1.7 1.7 1.7 Agriculture and Natural Resources
80 2.25 1.71 1.57 1.38 1.73 73 2.38 1.68 1.95 1.48 1.77
Education 78 2.56 2.11 1.78 1.67 2 70 2 2.2 2.2 1.5 1.9 Energy 25 1.8 1.25 1.75 1 1.25 38 2.36 1.25 1.75 1 1.13 Finance 50 2.38 1.63 1.75 1.86 1.88 80 2.58 2.06 1.89 1.63 2.06 Health, Nutrition and Social Protection
88 2.56 2.38 1.63 1.57 2.25 100 3 2 2.33 2.33 2.33
Industry and Trade
40 1.8 1.6 1.8 1 1.4 0 1.5 1 1.75 1 1
LEMPP 65 2.21 1.83 1.83 1.57 1.74 63 2.5 1.9 1.63 1.43 1.8 Multisector 100 2.75 2.75 2.5 1.25 2.25 83 2.17 1.83 1.83 1.2 1.83 Transport and Communications
44 2.44 1.67 1.67 1.44 1.67 71 1.71 1.71 2.14 1.71 1.71
Water Supply, Sanitation, and Waste Management
40 2.2 1.2 1.2 1 1.2 17 2.5 1 1.33 0.83 1
Total 65 2.3 1.82 1.73 1.46 1.77 66 2.38 1.81 1.85 1.45 1.78 ADTA = advisory technical assistance; JSF = Japan Special Fund; LEMPP = law, economic management, and public policy; TA = technical assistance. Key: highly successful = 3; successful = 2; partly successful = 1; unsuccessful = 0. Note: TAs recorded by prime sector here; may be active in more than one sector. Source: Asian Development Bank management information systems.
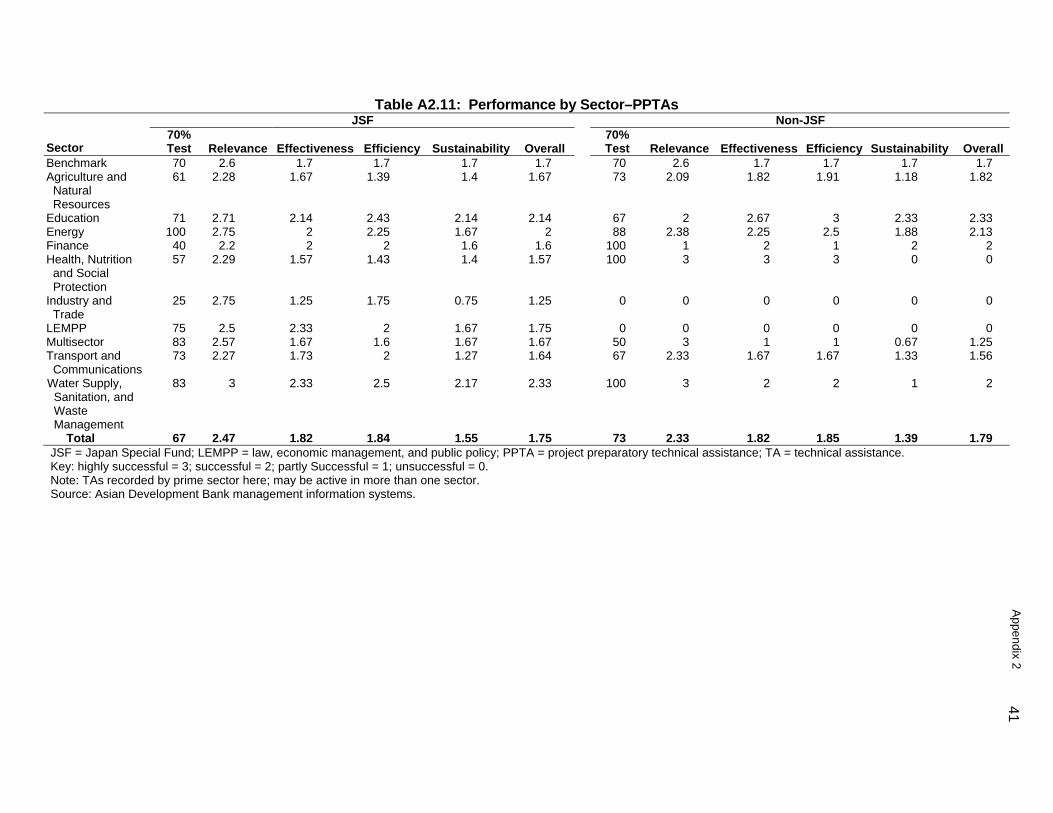
41 A
ppendix 2
Table A2.11: Performance by Sector–PPTAs JSF Non-JSF
Sector 70% Test Relevance Effectiveness Efficiency Sustainability Overall
70% Test Relevance Effectiveness Efficiency Sustainability Overall
Benchmark 70 2.6 1.7 1.7 1.7 1.7 70 2.6 1.7 1.7 1.7 1.7 Agriculture and Natural Resources
61 2.28 1.67 1.39 1.4 1.67
73 2.09 1.82 1.91 1.18 1.82
Education 71 2.71 2.14 2.43 2.14 2.14 67 2 2.67 3 2.33 2.33 Energy 100 2.75 2 2.25 1.67 2 88 2.38 2.25 2.5 1.88 2.13 Finance 40 2.2 2 2 1.6 1.6 100 1 2 1 2 2 Health, Nutrition and Social Protection
57 2.29 1.57 1.43 1.4 1.57
100 3 3 3 0 0
Industry and Trade
25 2.75 1.25 1.75 0.75 1.25
0 0 0 0 0 0
LEMPP 75 2.5 2.33 2 1.67 1.75 0 0 0 0 0 0 Multisector 83 2.57 1.67 1.6 1.67 1.67 50 3 1 1 0.67 1.25 Transport and Communications
73 2.27 1.73 2 1.27 1.64
67 2.33 1.67 1.67 1.33 1.56
Water Supply, Sanitation, and Waste Management
83 3 2.33 2.5 2.17 2.33
100 3 2 2 1 2
Total 67 2.47 1.82 1.84 1.55 1.75 73 2.33 1.82 1.85 1.39 1.79 JSF = Japan Special Fund; LEMPP = law, economic management, and public policy; PPTA = project preparatory technical assistance; TA = technical assistance. Key: highly successful = 3; successful = 2; partly Successful = 1; unsuccessful = 0. Note: TAs recorded by prime sector here; may be active in more than one sector. Source: Asian Development Bank management information systems.
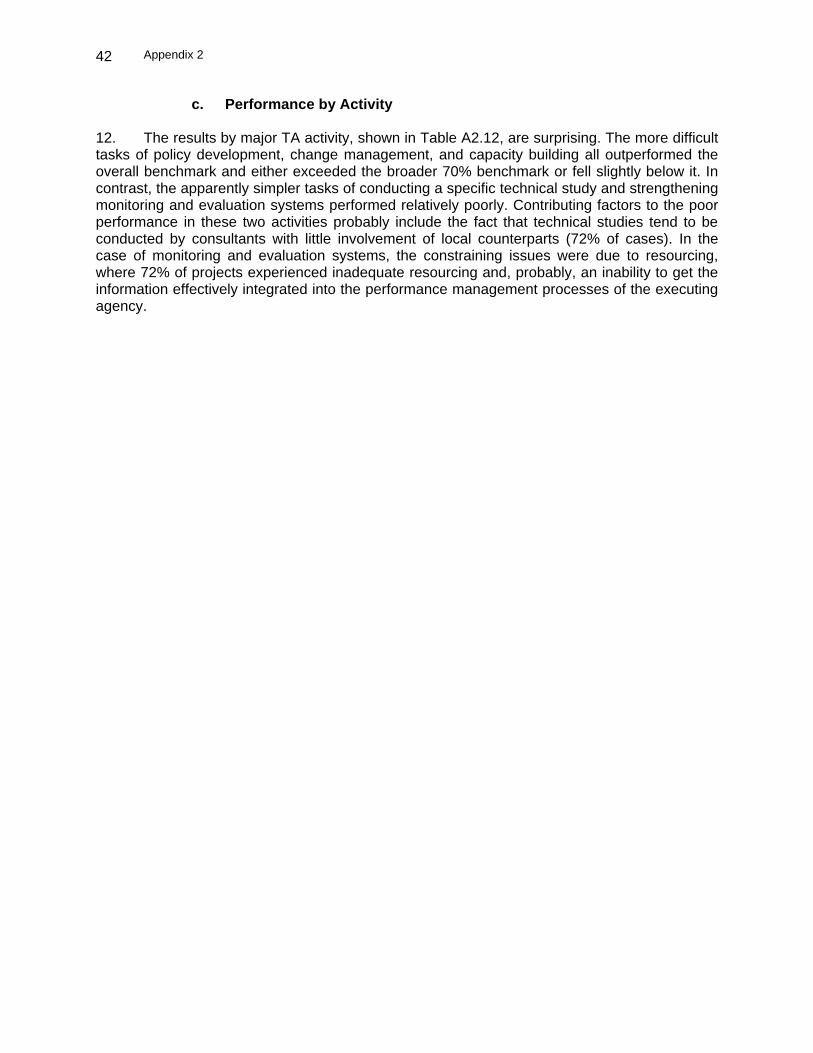
Appendix 2
42
c. Performance by Activity 12. The results by major TA activity, shown in Table A2.12, are surprising. The more difficult tasks of policy development, change management, and capacity building all outperformed the overall benchmark and either exceeded the broader 70% benchmark or fell slightly below it. In contrast, the apparently simpler tasks of conducting a specific technical study and strengthening monitoring and evaluation systems performed relatively poorly. Contributing factors to the poor performance in these two activities probably include the fact that technical studies tend to be conducted by consultants with little involvement of local counterparts (72% of cases). In the case of monitoring and evaluation systems, the constraining issues were due to resourcing, where 72% of projects experienced inadequate resourcing and, probably, an inability to get the information effectively integrated into the performance management processes of the executing agency.

43 A
ppendix 2
Table A2.12: Performance by Major Activity
JSF Non-JSF
Activity 70% Test Relevance Effectiveness Efficiency Sustainability Overall
70% Test Relevance Effectiveness Efficiency Sustainability Overall
Benchmark 70 2.6 1.7 1.7 1.7 1.7 70 2.6 1.7 1.7 1.7 1.7 Policy Development
71 2.71 2 2 1.71 2 80 2.69 1.93 2.33 1.38 1.87
Change Management
69 2.38 1.67 1.67 1.82 1.77 67 2.33 1.95 1.71 1.52 1.81
Capacity Building 68 2.44 1.86 1.61 1.46 1.82 72 2.5 1.78 1.67 1.51 1.86 Conduct Specific Technical Studies
47 1.93 1.47 1.73 1.27 1.4 58 2.03 1.77 1.81 1.34 1.65
Project Preparationa
67 2.48 1.83 1.86 1.53 1.75 73 2.33 1.82 1.85 1.39 1.79
Strengthen Monitoring and Evaluation Systems
57 2.14 1.79 1.71 1.23 1.64 40 2.3 1.4 1.8 0.9 1.4
Policy Development and Capacity Building
75 2.17 2.17 1.83 1.64 2.08 77 2.57 2 2.15 1.77 2.08
Others 67 2.67 1.67 1.67 2 1.67 Total 65 2.38 1.82 1.78 1.5 1.76
68 2.37 1.81 1.85 1.44 1.78 ADTA = advisory technical assistance, JSF = Japan Special Fund, PPTA = project preparatory technical assistance. a The ratings for project preparation are slightly different from the PPTA totals because the principal objectives of one JSF ADTA was, in fact, project preparation. Key: 3 = exceeds expectations; 2 = meets expectations; 1 = low; 0 = negligible. Sources: Asian Development Bank management information systems, and special evaluation study findings.
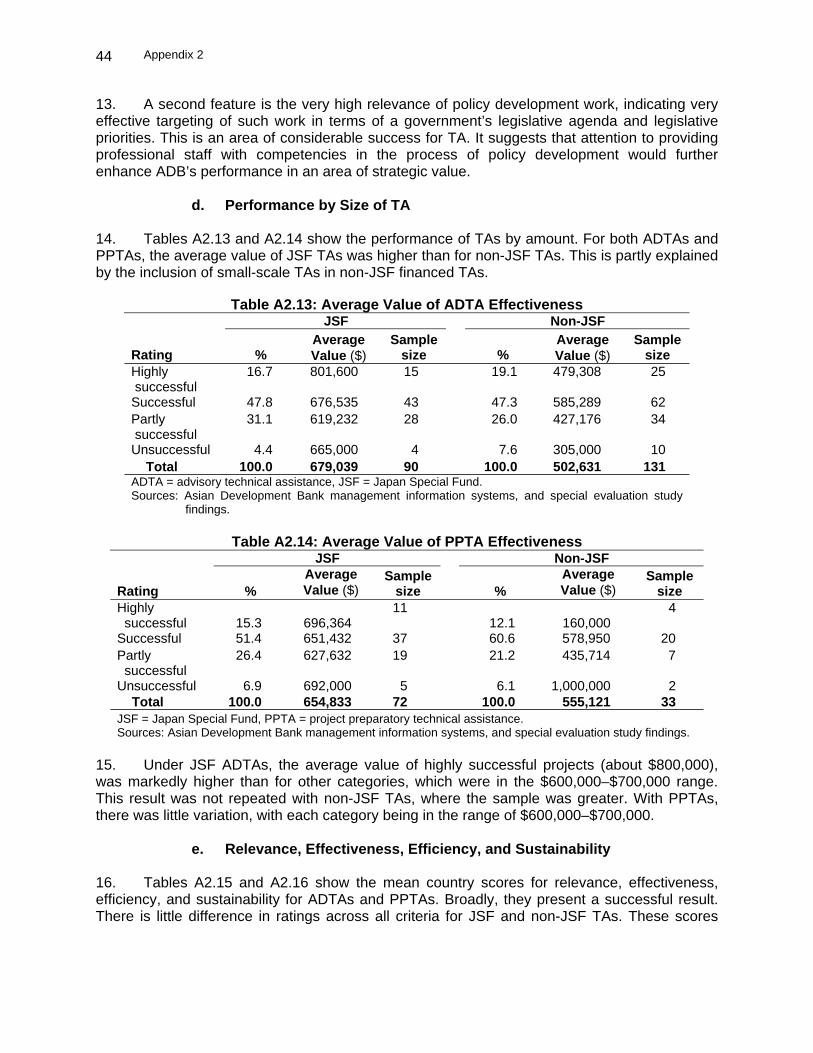
Appendix 2
44
13. A second feature is the very high relevance of policy development work, indicating very effective targeting of such work in terms of a government’s legislative agenda and legislative priorities. This is an area of considerable success for TA. It suggests that attention to providing professional staff with competencies in the process of policy development would further enhance ADB’s performance in an area of strategic value.
d. Performance by Size of TA 14. Tables A2.13 and A2.14 show the performance of TAs by amount. For both ADTAs and PPTAs, the average value of JSF TAs was higher than for non-JSF TAs. This is partly explained by the inclusion of small-scale TAs in non-JSF financed TAs.
Table A2.13: Average Value of ADTA Effectiveness
JSF Non-JSF Average Average
Rating % Value ($) Sample
size % Value ($) Sample
size Highly successful
16.7 801,600 15 19.1 479,308 25
Successful 47.8 676,535 43 47.3 585,289 62Partly successful
31.1 619,232 28 26.0 427,176 34
Unsuccessful 4.4 665,000 4 7.6 305,000 10 Total 100.0 679,039 90
100.0 502,631 131ADTA = advisory technical assistance, JSF = Japan Special Fund. Sources: Asian Development Bank management information systems, and special evaluation study
findings.
Table A2.14: Average Value of PPTA Effectiveness JSF Non-JSF
Average Average Rating % Value ($)
Sample size % Value ($)
Sample size
Highly successful
15.3
696,364
11 12.1
160,000
4
Successful 51.4 651,432 37 60.6 578,950 20Partly successful
26.4 627,632 19 21.2 435,714 7
Unsuccessful 6.9 692,000 5 6.1 1,000,000 2 Total 100.0 654,833 72 100.0 555,121 33JSF = Japan Special Fund, PPTA = project preparatory technical assistance. Sources: Asian Development Bank management information systems, and special evaluation study findings.
15. Under JSF ADTAs, the average value of highly successful projects (about $800,000), was markedly higher than for other categories, which were in the $600,000–$700,000 range. This result was not repeated with non-JSF TAs, where the sample was greater. With PPTAs, there was little variation, with each category being in the range of $600,000–$700,000.
e. Relevance, Effectiveness, Efficiency, and Sustainability 16. Tables A2.15 and A2.16 show the mean country scores for relevance, effectiveness, efficiency, and sustainability for ADTAs and PPTAs. Broadly, they present a successful result. There is little difference in ratings across all criteria for JSF and non-JSF TAs. These scores

Appendix 2
45
present a slightly different picture from the target of 70% ratings. With a greater than expected number of highly successful ratings factored in, the overall picture is that
(i) ADTAs and PPTAs at 1.75 and 1.79, respectively, outperform the proposed benchmark on overall rating;
(ii) ADTAs outperform the target for effectiveness and efficiency; (iii) JSF PPTAs approximate the benchmark for effectiveness and efficiency, while
non-JSF PPTAs outperform it for these categories; (iv) None of the TAs reached the benchmark for relevance and sustainability; this
suggests that for relevance, focus in the context of country strategy, and country priority require greater attention when prioritizing TAs; for sustainability, implementation process and exit strategies require greater attention.

46Appendix 2
Table A2.15: Relevance, Effectiveness, Efficiency, and Sustainability Performance of ADTAs JSF Non-JSF
DMC 70% Test Relevance Effectiveness Efficiency Sustainability Overall
70% Test Relevance Effectiveness Efficiency Sustainability Overall
Benchmark 70 2.6 1.7 1.7 1.7 1.7 70 2.6 1.7 1.7 1.7 1.7 Indonesia 63 2.63 1.88 1.88 1.38 1.75 Lao PDR 71 1.57 2.14 2.2 2.2a 2.14 Mongolia 56 2.56 1.56 1.44 1.88 1.78 Nepal 67 1.67 1.6 1.8 1.6 1.67 Total this sample
63 2.17 1.79 1.76 1.71 1.83
Samoa 83 2.38 1.67 1.83 1.67 1.67 40 1.91 1.5 1.2 1.2 1.3 Indonesia 2.38 1.54 1.82 1.18 1.5 (1967–1996)
59 2.16 1.76 1.88 1.24 1.59
50
Uzbekistan 63 2.25 1.63 1.75 1.33 1.63 64 2.07 1.93 1.93 1.58 1.79 Cambodia 68 2.47 2 1.63 1.05 1.84 79 2.5 2.08 2.08 1.58 1.92 Philippines 100 2.5 2.5 2 2.5 2.5 56 2.06 1.81 1.75 1.38 1.63 Kyrgyz Republic
25 2.25 1.25 1 1 1.25
78 2.78 1.67 1.67 1.44 1.89
India 92 2.67 2.42 2.17 1.82 2.42 Viet Nam 100 3 3 2 3 3 89 3 1.56 2 2 2 Fiji Islands 50 2.28 1.82 1.69 1.78 1.85 67 2.78 1.67 1.67 1.44 1.89 Total SES sample
60 2.6 1.9 1.5 2 1.9
74 2.57 1.93 1.93 1.64 2.02
Total 65 2.3 1.82 1.73 1.46 1.77 66 2.38 1.81 1.85 1.45 1.78 ADTA = advisory technical assistance, DMC = developing member country, JSF = Japan Special Fund, Lao PDR = Lao People’s Democratic Republic, SES = special evaluation study. a Recent projects could not be evaluated for sustainability, as insufficient time had elapsed since their completion to do so reliably. Consequently, the sample size for sustainability
is different. Sample sizes: JSF: Indonesia 8, Lao PDR 7, Mongolia 7, Nepal 6, Samoa 6, Indonesia 17, Uzbekistan 8, Cambodia 19, Philippines 2, Kyrgyz Republic 4, Viet Nam 2, Fiji
Islands 2; Non-JSF: Samoa 10, Indonesia 28, Uzbekistan 14, Cambodia 24, Philippines 16, Kyrgyz Republic 9, India 12, Viet Nam 9, Fiji Islands 9. Sources: Asian Development Bank management information systems, and SES findings.
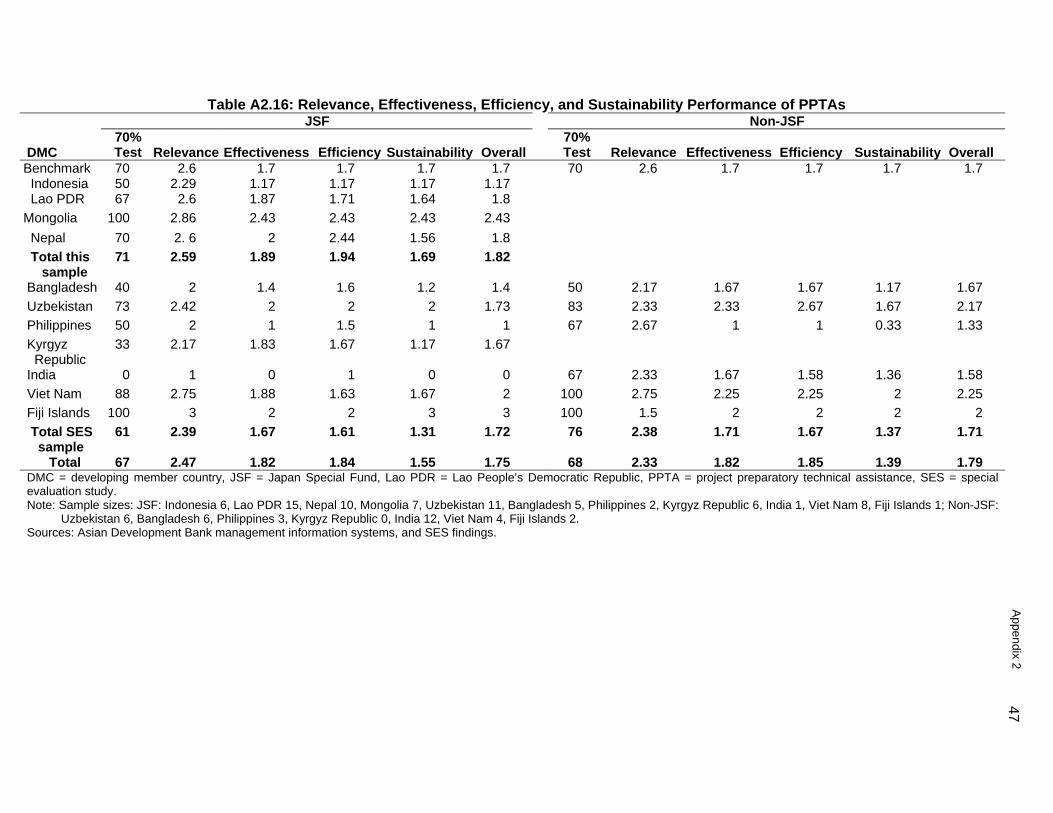
47 A
ppendix 2
Table A2.16: Relevance, Effectiveness, Efficiency, and Sustainability Performance of PPTAs JSF Non-JSF
DMC 70% Test Relevance Effectiveness
Efficiency Sustainability Overall
70% Test Relevance Effectiveness Efficiency Sustainability Overall
Benchmark 70 2.6 1.7 1.7 1.7 1.7 70 2.6 1.7 1.7 1.7 1.7 Indonesia 50 2.29 1.17 1.17 1.17 1.17 Lao PDR 67 2.6 1.87 1.71 1.64 1.8
Mongolia 100 2.86 2.43 2.43 2.43 2.43
Nepal 70 2. 6 2 2.44 1.56 1.8
Total this sample
71 2.59 1.89 1.94 1.69 1.82
Bangladesh 40 2 1.4 1.6 1.2 1.4 50 2.17 1.67 1.67 1.17 1.67
Uzbekistan 73 2.42 2 2 2 1.73 83 2.33 2.33 2.67 1.67 2.17
Philippines 50 2 1 1.5 1 1 67 2.67 1 1 0.33 1.33
Kyrgyz Republic
33 2.17 1.83 1.67 1.17 1.67
India 0 1 0 1 0 0 67 2.33 1.67 1.58 1.36 1.58
Viet Nam 88 2.75 1.88 1.63 1.67 2 100 2.75 2.25 2.25 2 2.25
Fiji Islands 100 3 2 2 3 3 100 1.5 2 2 2 2
Total SES sample
61 2.39 1.67 1.61 1.31 1.72 76 2.38 1.71 1.67 1.37 1.71
Total 67 2.47 1.82 1.84 1.55 1.75 68 2.33 1.82 1.85 1.39 1.79 DMC = developing member country, JSF = Japan Special Fund, Lao PDR = Lao People’s Democratic Republic, PPTA = project preparatory technical assistance, SES = special evaluation study. Note: Sample sizes: JSF: Indonesia 6, Lao PDR 15, Nepal 10, Mongolia 7, Uzbekistan 11, Bangladesh 5, Philippines 2, Kyrgyz Republic 6, India 1, Viet Nam 8, Fiji Islands 1; Non-JSF:
Uzbekistan 6, Bangladesh 6, Philippines 3, Kyrgyz Republic 0, India 12, Viet Nam 4, Fiji Islands 2. Sources: Asian Development Bank management information systems, and SES findings.

Appendix 2
48
17. Given the smaller sample sizes in DMCs, it is not surprising that there is variability between JSF and non-JSF results. The ratings for Indonesia have improved for ADTAs compared with the earlier study. ADTAs in India, Lao People’s Democratic Republic, and Viet Nam performed conspicuously well. PPTAs performed conspicuously well in Fiji Islands, Mongolia, Uzbekistan, and Viet Nam. 18. For both ADTAs and PPTAs, sustainability was well below the benchmark. Sustainability is a major issue for both kinds of TA. In the case of PPTA, a proposed design that has weaknesses in sustainability will require changes either during loan processing, which add costs to the process, or later, during implementation, which can impact adversely on what a loan project is able to deliver. About 66% of the sampled JSF TAs and 55% of non-JSF TAs required design changes during loan processing, with 37% and 27% of these being regarded as major changes in JSF and non-JSF TA, respectively. Subsequent loan projects were not reviewed to determine the magnitude of change they required.
B. Development Impact 19. ADTA can have profound development impacts well beyond the small investment made. For example, the $1 million invested in establishing an anti-corruption commission in Indonesia816signaled an intention on the part of the Government to take corruption much more seriously than its predecessors had, produced the legislation and special court that provides an environment in which corruption can be addressed effectively through an independent judicial tribunal, and enabled the commission to begin to pursue a number of corrupt officials where there was confidence in the evidence leading to a conviction. It needed one intervention at that time to do this, and the JSF provided that intervention. 20. In the education sector in Uzbekistan, one JSF PPTA917was part of a program of interventions intended to save the education system there from collapse and, through a process of gentle persuasion, assisted by exposing officials to best practices overseas through study tours, opened the Government’s mind to the benefits of reform. The relatively small $350,000 JSF PPTA brought together the much-needed relationship between curriculum and teacher training and the earlier work that had been done on textbook development, production, and affordability, resulting in significant improvements to basic education, benefiting every child in Uzbekistan. 21. Development impact has been significant, in particular the following:
(i) Policy development ADTAs had profound beneficial impacts on the legislative environments governing a number of sectors.
(ii) Capacity development ADTAs improved the performance of sector and sub-national agencies in the delivery of services, especially to the poor.
(iii) About 75% of the total ADB PPTAs are funded out of JSF, and therefore the JSF is responsible for the design of 75% of ADB’s loan program.
8 TA 3381-INO: Establishment of an Anticorruption Commission, for $1.0 million, approved on 28 December 1999. 9 TA 3187-UZB: Basic Education Staff Development, for $350,000, approved on 23 April 1999.
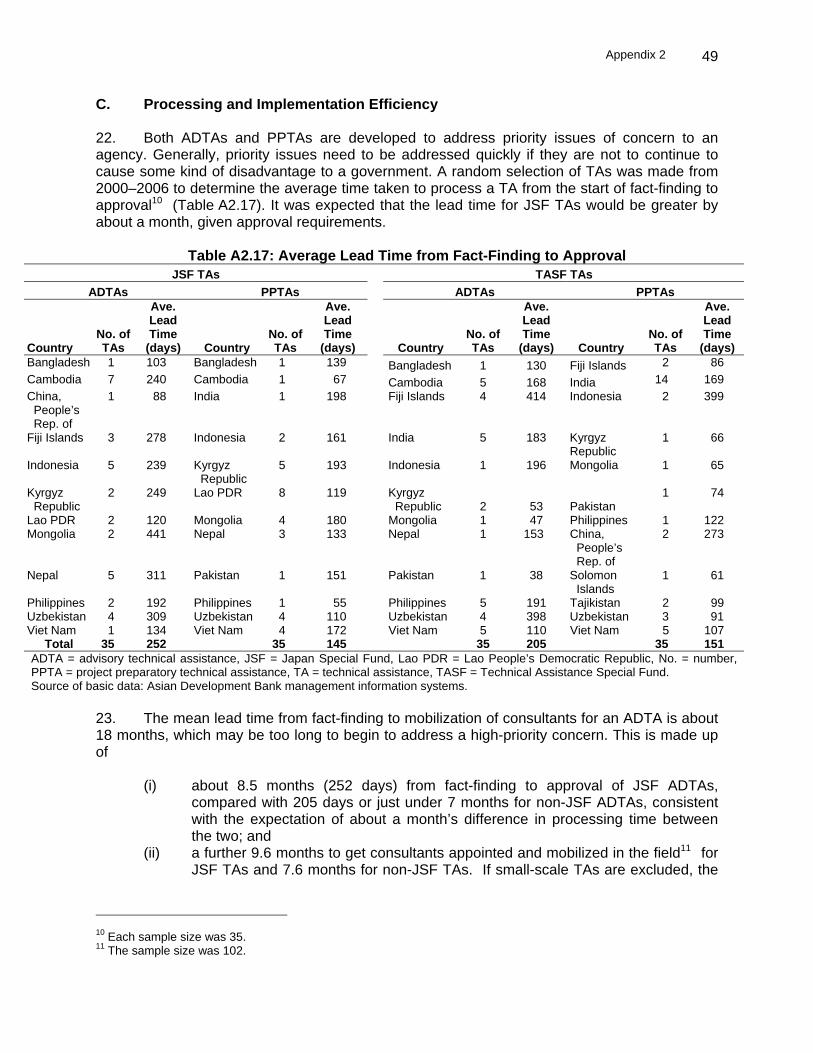
Appendix 2
49
C. Processing and Implementation Efficiency 22. Both ADTAs and PPTAs are developed to address priority issues of concern to an agency. Generally, priority issues need to be addressed quickly if they are not to continue to cause some kind of disadvantage to a government. A random selection of TAs was made from 2000–2006 to determine the average time taken to process a TA from the start of fact-finding to approval1018(Table A2.17). It was expected that the lead time for JSF TAs would be greater by about a month, given approval requirements.
Table A2.17: Average Lead Time from Fact-Finding to Approval JSF TAs TASF TAs
ADTAs PPTAs ADTAs PPTAs
Country No. of TAs
Ave. Lead Time
(days) Country No. of TAs
Ave. Lead Time
(days) Country No. of TAs
Ave. Lead Time
(days) Country No. of TAs
Ave. Lead Time
(days) Bangladesh 1 103 Bangladesh 1 139 Bangladesh 1 130 Fiji Islands 2 86 Cambodia 7 240 Cambodia 1 67 Cambodia 5 168 India 14 169 China, People’s Rep. of
1 88
India 1 198
Fiji Islands 4 414 Indonesia 2 399
Fiji Islands 3 278
Indonesia 2 161
India 5 183 Kyrgyz Republic
1 66
Indonesia 5 239
Kyrgyz Republic
5 193
Indonesia 1 196 Mongolia 1 65
Kyrgyz Republic
2 249 Lao PDR 8 119
Kyrgyz Republic 2 53 Pakistan
1 74
Lao PDR 2 120 Mongolia 4 180 Mongolia 1 47 Philippines 1 122 Mongolia 2 441
Nepal 3 133
Nepal 1 153 China, People’s Rep. of
2 273
Nepal 5 311
Pakistan 1 151
Pakistan 1 38 Solomon Islands
1 61
Philippines 2 192 Philippines 1 55 Philippines 5 191 Tajikistan 2 99 Uzbekistan 4 309 Uzbekistan 4 110 Uzbekistan 4 398 Uzbekistan 3 91 Viet Nam 1 134 Viet Nam 4 172 Viet Nam 5 110 Viet Nam 5 107
Total 35 252 35 145 35 205 35 151 ADTA = advisory technical assistance, JSF = Japan Special Fund, Lao PDR = Lao People’s Democratic Republic, No. = number, PPTA = project preparatory technical assistance, TA = technical assistance, TASF = Technical Assistance Special Fund. Source of basic data: Asian Development Bank management information systems.
23. The mean lead time from fact-finding to mobilization of consultants for an ADTA is about 18 months, which may be too long to begin to address a high-priority concern. This is made up of
(i) about 8.5 months (252 days) from fact-finding to approval of JSF ADTAs, compared with 205 days or just under 7 months for non-JSF ADTAs, consistent with the expectation of about a month’s difference in processing time between the two; and
(ii) a further 9.6 months to get consultants appointed and mobilized in the field1119for JSF TAs and 7.6 months for non-JSF TAs. If small-scale TAs are excluded, the
10 Each sample size was 35. 11 The sample size was 102.
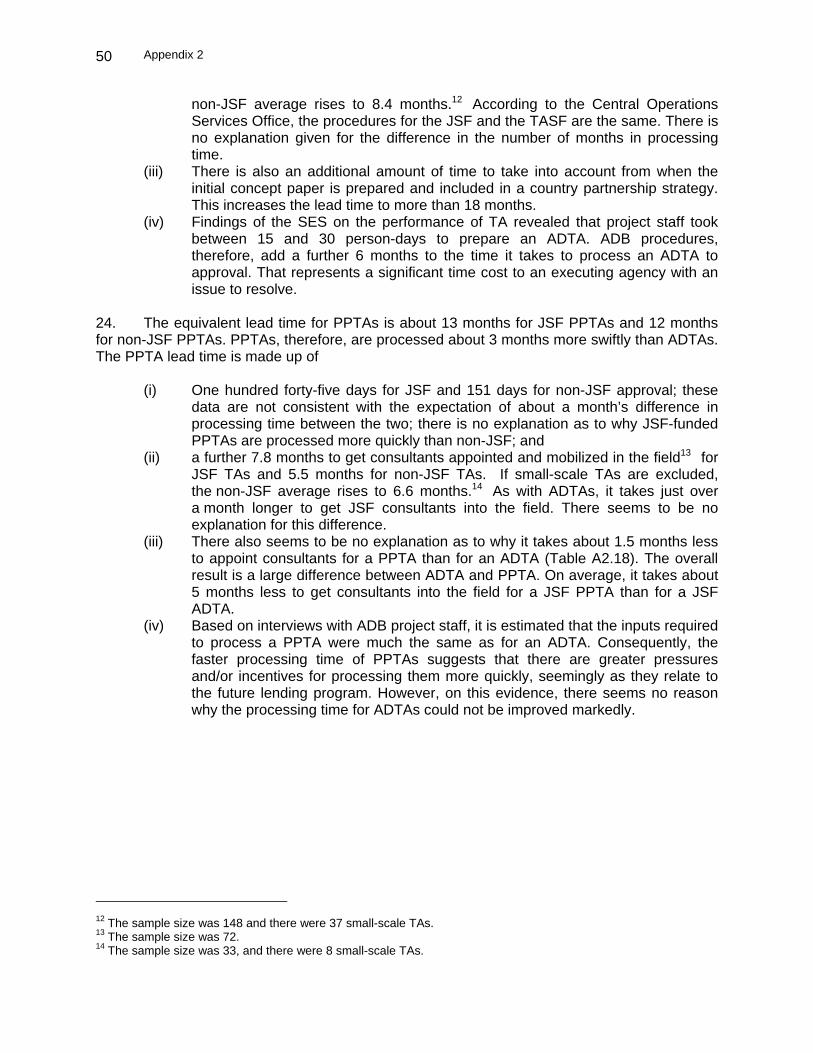
Appendix 2
50
non-JSF average rises to 8.4 months.1220According to the Central Operations Services Office, the procedures for the JSF and the TASF are the same. There is no explanation given for the difference in the number of months in processing time.
(iii) There is also an additional amount of time to take into account from when the initial concept paper is prepared and included in a country partnership strategy. This increases the lead time to more than 18 months.
(iv) Findings of the SES on the performance of TA revealed that project staff took between 15 and 30 person-days to prepare an ADTA. ADB procedures, therefore, add a further 6 months to the time it takes to process an ADTA to approval. That represents a significant time cost to an executing agency with an issue to resolve.
24. The equivalent lead time for PPTAs is about 13 months for JSF PPTAs and 12 months for non-JSF PPTAs. PPTAs, therefore, are processed about 3 months more swiftly than ADTAs. The PPTA lead time is made up of
(i) One hundred forty-five days for JSF and 151 days for non-JSF approval; these data are not consistent with the expectation of about a month’s difference in processing time between the two; there is no explanation as to why JSF-funded PPTAs are processed more quickly than non-JSF; and
(ii) a further 7.8 months to get consultants appointed and mobilized in the field1321for JSF TAs and 5.5 months for non-JSF TAs. If small-scale TAs are excluded, the non-JSF average rises to 6.6 months.1422As with ADTAs, it takes just over a month longer to get JSF consultants into the field. There seems to be no explanation for this difference.
(iii) There also seems to be no explanation as to why it takes about 1.5 months less to appoint consultants for a PPTA than for an ADTA (Table A2.18). The overall result is a large difference between ADTA and PPTA. On average, it takes about 5 months less to get consultants into the field for a JSF PPTA than for a JSF ADTA.
(iv) Based on interviews with ADB project staff, it is estimated that the inputs required to process a PPTA were much the same as for an ADTA. Consequently, the faster processing time of PPTAs suggests that there are greater pressures and/or incentives for processing them more quickly, seemingly as they relate to the future lending program. However, on this evidence, there seems no reason why the processing time for ADTAs could not be improved markedly.
12 The sample size was 148 and there were 37 small-scale TAs. 13 The sample size was 72. 14 The sample size was 33, and there were 8 small-scale TAs.
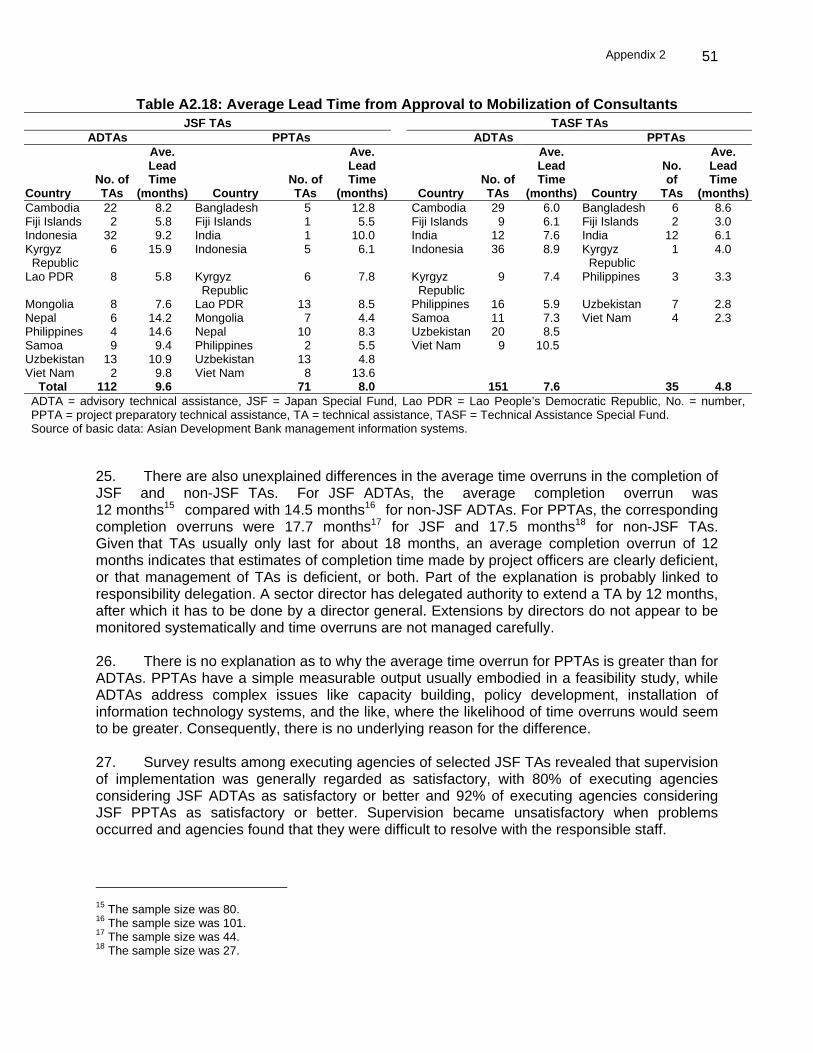
Appendix 2
51
Table A2.18: Average Lead Time from Approval to Mobilization of Consultants JSF TAs TASF TAs
ADTAs PPTAs ADTAs PPTAs
Country No. of TAs
Ave. Lead Time
(months) Country No. of TAs
Ave. Lead Time
(months) Country No. of TAs
Ave. Lead Time
(months) Country
No. of
TAs
Ave. Lead Time
(months)Cambodia 22 8.2 Bangladesh 5 12.8 Cambodia 29 6.0 Bangladesh 6 8.6 Fiji Islands 2 5.8 Fiji Islands 1 5.5 Fiji Islands 9 6.1 Fiji Islands 2 3.0 Indonesia 32 9.2 India 1 10.0 India 12 7.6 India 12 6.1 Kyrgyz Republic
6
15.9
Indonesia
5 6.1
Indonesia 36 8.9 Kyrgyz Republic
1 4.0
Lao PDR 8
5.8
Kyrgyz Republic
6 7.8
Kyrgyz Republic
9 7.4 Philippines 3 3.3
Mongolia 8 7.6 Lao PDR 13 8.5 Philippines 16 5.9 Uzbekistan 7 2.8 Nepal 6 14.2 Mongolia 7 4.4 Samoa 11 7.3 Viet Nam 4 2.3 Philippines 4 14.6 Nepal 10 8.3 Uzbekistan 20 8.5 Samoa 9 9.4 Philippines 2 5.5 Viet Nam 9 10.5 Uzbekistan 13 10.9 Uzbekistan 13 4.8 Viet Nam 2 9.8 Viet Nam 8 13.6 Total 112 9.6 71 8.0 151 7.6 35 4.8 ADTA = advisory technical assistance, JSF = Japan Special Fund, Lao PDR = Lao People’s Democratic Republic, No. = number, PPTA = project preparatory technical assistance, TA = technical assistance, TASF = Technical Assistance Special Fund. Source of basic data: Asian Development Bank management information systems.
25. There are also unexplained differences in the average time overruns in the completion of JSF and non-JSF TAs. For JSF ADTAs, the average completion overrun was 12 months1523compared with 14.5 months1624for non-JSF ADTAs. For PPTAs, the corresponding completion overruns were 17.7 months1725for JSF and 17.5 months1826for non-JSF TAs. Given that TAs usually only last for about 18 months, an average completion overrun of 12 months indicates that estimates of completion time made by project officers are clearly deficient, or that management of TAs is deficient, or both. Part of the explanation is probably linked to responsibility delegation. A sector director has delegated authority to extend a TA by 12 months, after which it has to be done by a director general. Extensions by directors do not appear to be monitored systematically and time overruns are not managed carefully. 26. There is no explanation as to why the average time overrun for PPTAs is greater than for ADTAs. PPTAs have a simple measurable output usually embodied in a feasibility study, while ADTAs address complex issues like capacity building, policy development, installation of information technology systems, and the like, where the likelihood of time overruns would seem to be greater. Consequently, there is no underlying reason for the difference. 27. Survey results among executing agencies of selected JSF TAs revealed that supervision of implementation was generally regarded as satisfactory, with 80% of executing agencies considering JSF ADTAs as satisfactory or better and 92% of executing agencies considering JSF PPTAs as satisfactory or better. Supervision became unsatisfactory when problems occurred and agencies found that they were difficult to resolve with the responsible staff.
15 The sample size was 80. 16 The sample size was 101. 17 The sample size was 44. 18 The sample size was 27.

Appendix 2
52
28. ADB does not monitor the cost of its procedures. It is an area of its business that JSF (and the TA and lending program as a whole) could improve by requiring reports on these costs. The findings of this study strongly suggest that they diminish the efficiency with which JSF funds are applied. 29. Tables A2.19 to A2.31 provide a summary comparison of JSF and non-JSF TAs and the survey results of executing agency views on consultant performance. Tables A2.32 to A2.33 show the distribution of JSF TAs by type.
Table A2.19: Comparison of Results between ADTAs in which Work Produced by Consultant and Jointly with Agency
JSF (Mean Value) Non-JSF (Mean Value)
Product Produced by Overall Sustainability
Agency View of Long-Term Effectivenessa Overall Sustainability
Agency View of Long-Term Effectiveness
Consultants 1.43 1.19 1.87 1.58 1.26 2.06 Consultants Jointly with Counterparts
2.15 1.84 2.55 2.00 1.60 2.47
ADTA = advisory technical assistance, JSF = Japan Special Fund. a This was based on a three point scale of 3 = successful; 2 = partly successful; and 1 = unsuccessful. Sample size: JSF = 75; Non-JSF = 111. Sources: Asian Development Bank management information systems, and special evaluation study findings.
Table A2.20: Comparison of Results between PPTAs in which Work Produced by
Consultant and Jointly with Agency JSF (Mean Value) Non-JSF (Mean Value)
Product Produced by Overall Sustainability
Agency View of Long-Term Effectivenessa Overall Sustainability
Agency View of Long-Term Effectiveness
Consultants 1.53 1.27 1.87 1.73 1.27 2.09 Consultants Jointly with Counterparts
1.97 1.48 2.55
2.00 1.71 2.50
JSF = Japan Special Fund, PPTA = project preparatory technical assistance. a This was based on a three point scale of 3 = successful; 2 = partly successful; and 1 = unsuccessful. Sample size: JSF = 63; Non-JSF = 29 Sources: Asian Development Bank management information systems, and special evaluation study findings.
Table A2.21: Comparison of Results between ADTAs Deemed by Agency as “Just Right,”
“Slightly Too Short,” and “Far Too Short” for Time and Resources JSF (Mean Value) Non-JSF (Mean Value)
Time and Resources Overall Sustainability
Agency View of Long Term Effectivenessa Overall Sustainability
Agency View of Long Term Effectiveness
Just Right 2.19 2.05 2.55 2.08 1.77 2.19 Slightly Too Short 1.83 1.72 2.21 1.8 1.37 2.27 Far Too Short 1.47 0.94 1.88 1.16 0.76 1.88 ADTA = advisory technical assistance, JSF = Japan Special Fund. a This was based on a three point scale of 3 = successful; 2 = partly successful; and 1 = unsuccessful. Sample size: JSF = 56; Non-JSF = 97. Sources: Asian Development Bank management information systems, and special evaluation study findings.

Appendix 2
53
Table A2.22: Comparison of Results between PPTAs Deemed by Agency as “Just Right,” “Slightly too Short,” and “Far Too Short” for Time and Resources
JSF (Mean Value) Non-JSF (Mean Value)
Time and Resources Overall Sustainability
Agency View of Long Term Effectivenessa Overall Sustainability
Agency View of Long Term Effectiveness
Just Right 1.94 1.53 2.24 1.83 1.45 2.17 Slightly Too Short 1.80 1.60 2.64 2.00 1.36 2.27 Far Too Short 1.27 1.33 2.00 1.83 1.50 2.00 JSF = Japan Special Fund, PPTA = project preparatory technical assistance. a This was based on a three point scale of 3 = successful; 2 = partly successful; and 1= unsuccessful. Sample size: JSF = 62; Non-JSF = 28. Sources: Asian Development Bank management information systems, and special evaluation study findings.
Table A2.23: Executing Agencies' View—Consultants' Approach to TA Outputs
JSF Non-JSF ADTA PPTA ADTA PPTA
Rating Number %
Share Number%
Share Number%
Share Number%
Share Helped Agency 41 51.3 33 62.3 60 51.7 7 23.3 Did it Themselves 39 48.8 20 37.7 56 48.3 23 76.7 Total 80 100.0 53 100.0 116 100.0 30 100.0 ADTA = advisory technical assistance, JSF = Japan Special Fund, PPTA = project preparatory technical assistance, TA = technical assistance. Source: Special evaluation study assessment.
Table A2.24: Appropriateness of Length of Time Allocated to TAs
Executing Agencies' View: JSF TAs Consultants’ View: JSF TAs ADTAs PPTAs ADTAs PPTAs Rating Number % Share Number % Share Number % Share Number % Share Just Right 22 36.7 32 50.0 6 31.6 11 39.3 Slightly Too Short
20 33.3 15 23.4 6 31.6 11 39.3
Far Too Short
18 30.0 17 26.6 7 36.8 6 21.4
Total 60 100.0 64 100.0 19 100.0 28 100.0 ADTA = advisory technical assistance, JSF = Japan Special Fund, PPTA = project preparatory technical assistance, TA = technical assistance. Source: Special evaluation study assessment.
Table A2.25: Appropriateness of Length of Time Allocated to TAs
Executing Agencies' Share of ADTA Design
Responsibility for Designing JSF PPTA
Rating Number % Share
Number % Share All 1 3.6 ADB 20 30.3 Most 13 46.4 ADB/Agency 43 65.2 Some 7 25.0 Agency 3 4.5 Little 5 17.9 None 2 7.1 Total 28 100.0 66 100.0 ADB = Asian Development Bank, ADTA = advisory technical assistance, JSF = Japan Special Fund, PPTA = project preparatory technical assistance, TA = technical assistance. Source: Special evaluation study assessment.
Appendix 2
54
Table A2.26: The Effective Client ADTAs PPTAs Number % Share Number % Share ADB 6 31.6 21 70.0 Agency 12 63.2 8 26.7 ADB/Agency 1 5.3 1 3.3 Total 19 100.0 30 100.0 ADB = Asian Development Bank, ADTA = advisory technical assistance, PPTA = project preparatory technical assistance. Source: Special evaluation study assessment.
Table A2.27: Role Played by Counterpart Staff
JSF Non-JSF Rating Number % Share Number % Share Substantial 33 53.2 10 37.0 Partial 25 40.3 14 51.9 Little 4 6.5 3 11.1 Total 62 100.0 27 100.0 JSF = Japan Special Fund. Source: Special evaluation study assessment.
Table A2.28: Executing Agencies' View —Consultants' Approach to TA Outputs
JSF Non-JSF ADTA PPTA ADTA PPTA Rating Number % Share Number % Share Number % Share Number % Share Helped Agency 41 51.3 33 62.3 60 51.7 7 23.3 Did it Themselves 39 48.8 20 37.7 56 48.3 23 76.7 Total 80 100.0 53 100.0 116 100.0 30 100.0 ADTA = advisory technical assistance, JSF = Japan Special Fund, PPTA = project preparatory technical assistance, TA = technical assistance. Source: Special evaluation study assessment.
Table A2.29: Executing Agencies' View of the Performance of ADTA Consultants
JSF TAs Non-JSF TAs Rating Number % Share Number % Share A. Performance of Consultants Very Well 11 21.2 10 24.4 Satisfactory 33 63.5 25 61.0 Poor 8 15.4 6 14.6 Total 52 100.0 41 100.0
B. Understanding the Needs of the EA Very Well 24 30.0 41 34.7 Satisfactory 42 52.5 64 54.2 Poor 14 17.5 13 11.0 Total 80 100.0 118 100.0
C. Communication of Consultants Very Well 21 33.9 27 31.4 Satisfactory 36 58.1 45 52.3 Poor 5 8.1 14 16.3 Total 62 100.0 86 100.0

Appendix 2
55
JSF TAs Non-JSF TAs Rating Number % Share Number % Share D. Communicating Best Practice Very Well 21 33.9 27 31.4 Satisfactory 36 58.1 45 52.3 Poor 5 8.1 14 16.3 Total 62 100.0 86 100.0
ADTA = advisory technical assistance, EA = executing agency, JSF = Japan Special Fund, TA = technical assistance. Source: Special evaluation study assessment.
Table A2.30: Executing Agencies' View of the Performance of PPTA Consultants
JSF TAs Non-JSF TAs Rating Number % Share Number % Share A. Performance of Consultants Very Well 14 20.6 6 20.7 Satisfactory 44 64.7 18 62.1 Poor 10 14.7 5 17.2 Total 68 100.0 29 100.0
B. Understanding the Needs of the EA Very Well 16 27.1 7 26.9 Satisfactory 35 59.3 13 50.0 Poor 8 13.6 6 23.1 Total 59 100.0 26 100.0
C. Communication of Consultants Very Well 24 35.8 4 14.3 Satisfactory 31 46.3 19 67.9 Poor 12 17.9 5 17.9 Total 67 100.0 28 100.0
D. Communicating Best Practice Very Well 11 21.2 27 31.4 Satisfactory 30 57.7 45 52.3 Poor 11 21.2 14 16.3 Total 52 100.0 86 100.0
E. Understanding the Needs of the Beneficiaries Very Well 12 18.5 4 14.8 Satisfactory 41 63.1 20 74.1 Poor 12 18.5 3 11.1 Total 65 100.0 27 100.0 EA = executing agency, JSF = Japan Special Fund, PPTA = project preparatory technical assistance, TA = technical assistance. Source: Special evaluation study assessment.
Table A2.31: Executing Agencies' View—ADB's Flexibility and Responsiveness in ADTAs
JSF ADTAs Non-JSF ADTAs Rating Number % Share Number % Share Highly Satisfactory 19 27.1 41 37.6 Satisfactory 41 58.6 49 45.0 Not Satisfactory 10 14.3 19 17.4 Total 70 100.0 109 100.0 ADB = Asian Development Bank, ADTA = advisory technical assistance, JSF = Japan Special Fund. Source: Special evaluation study assessment.
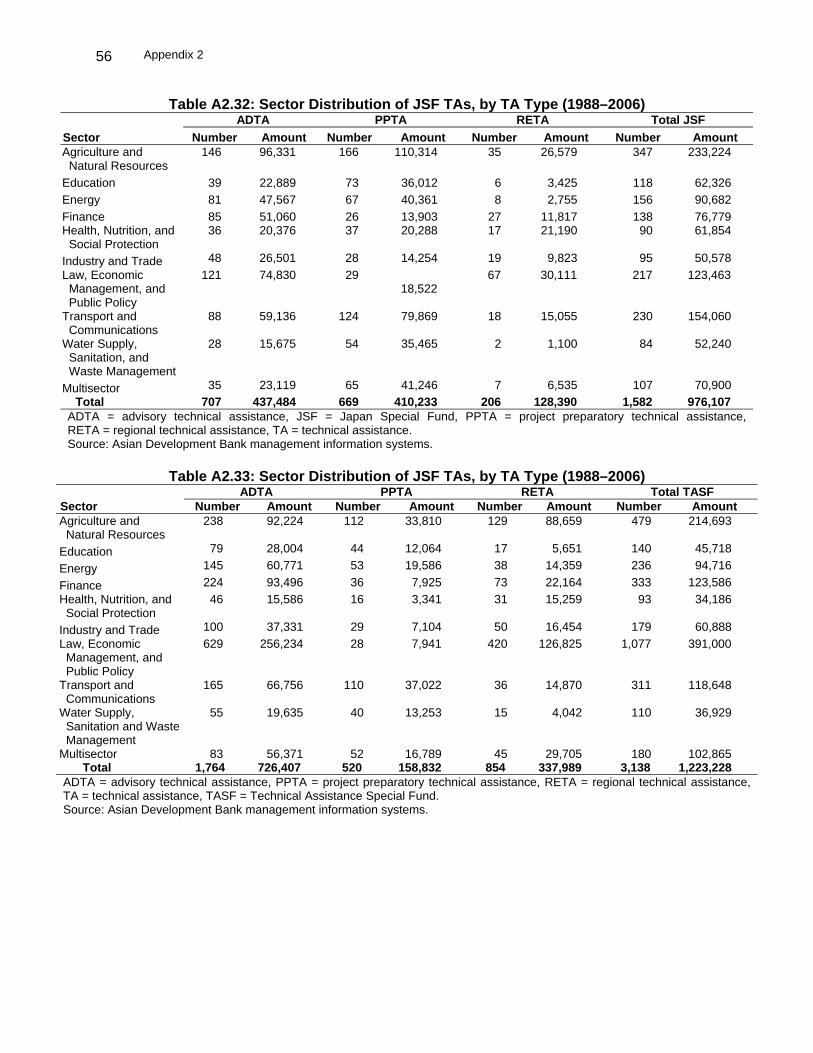
Appendix 2
56
Table A2.32: Sector Distribution of JSF TAs, by TA Type (1988–2006) ADTA PPTA RETA Total JSF
Sector Number Amount Number Amount Number Amount Number Amount Agriculture and Natural Resources
146 96,331 166 110,314 35 26,579 347 233,224
Education 39 22,889 73 36,012 6 3,425 118 62,326 Energy 81 47,567 67 40,361 8 2,755 156 90,682 Finance 85 51,060 26 13,903 27 11,817 138 76,779 Health, Nutrition, and Social Protection
36 20,376 37 20,288 17 21,190 90 61,854
Industry and Trade 48 26,501 28 14,254 19 9,823 95 50,578 Law, Economic Management, and Public Policy
121 74,830 29 18,522
67 30,111 217 123,463
Transport and Communications
88 59,136 124 79,869 18 15,055 230 154,060
Water Supply, Sanitation, and Waste Management
28 15,675 54 35,465 2 1,100 84 52,240
Multisector 35 23,119 65 41,246 7 6,535 107 70,900 Total 707 437,484 669 410,233 206 128,390 1,582 976,107 ADTA = advisory technical assistance, JSF = Japan Special Fund, PPTA = project preparatory technical assistance, RETA = regional technical assistance, TA = technical assistance. Source: Asian Development Bank management information systems.
Table A2.33: Sector Distribution of JSF TAs, by TA Type (1988–2006)
ADTA PPTA RETA Total TASF Sector Number Amount Number Amount Number Amount Number Amount Agriculture and Natural Resources
238 92,224 112 33,810 129 88,659 479 214,693
Education 79 28,004 44 12,064 17 5,651 140 45,718
Energy 145 60,771 53 19,586 38 14,359 236 94,716
Finance 224 93,496 36 7,925 73 22,164 333 123,586 Health, Nutrition, and Social Protection
46 15,586 16 3,341 31 15,259 93 34,186
Industry and Trade 100 37,331 29 7,104 50 16,454 179 60,888 Law, Economic Management, and Public Policy
629 256,234 28 7,941 420 126,825 1,077 391,000
Transport and Communications
165 66,756 110 37,022 36 14,870 311 118,648
Water Supply, Sanitation and Waste Management
55 19,635 40 13,253 15 4,042 110 36,929
Multisector 83 56,371 52 16,789 45 29,705 180 102,865 Total 1,764 726,407 520 158,832 854 337,989 3,138 1,223,228 ADTA = advisory technical assistance, PPTA = project preparatory technical assistance, RETA = regional technical assistance, TA = technical assistance, TASF = Technical Assistance Special Fund. Source: Asian Development Bank management information systems.
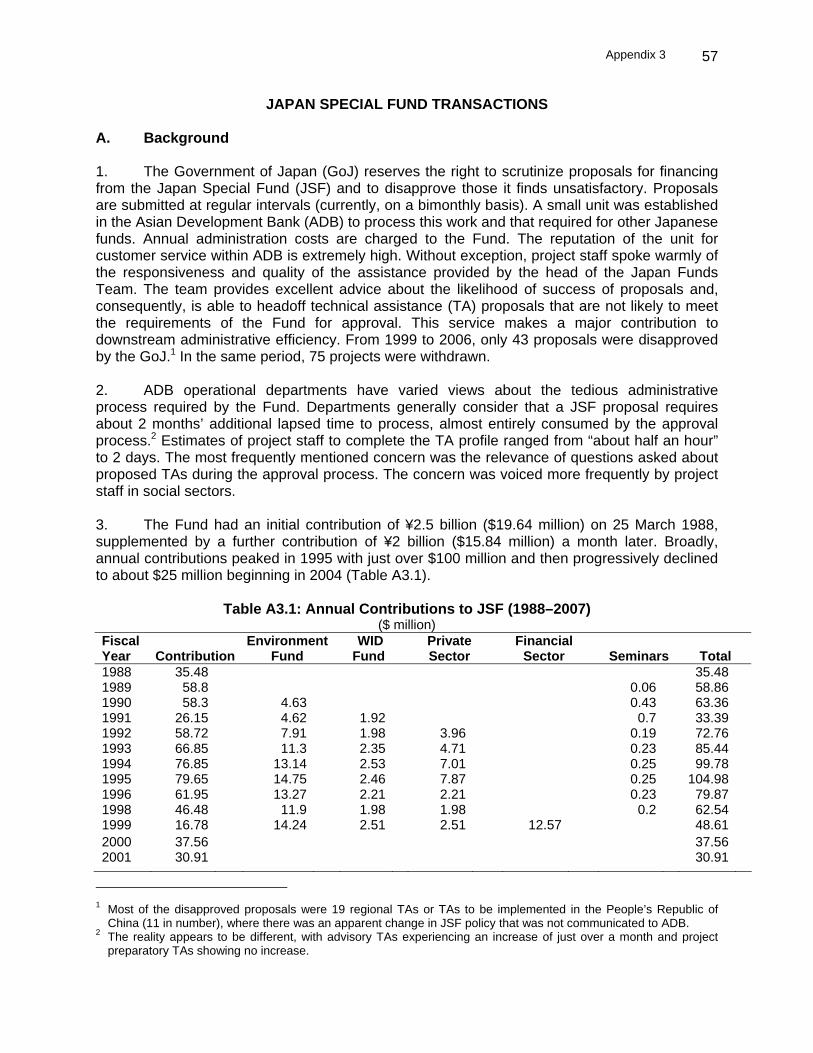
Appendix 3
57
JAPAN SPECIAL FUND TRANSACTIONS A. Background 1. The Government of Japan (GoJ) reserves the right to scrutinize proposals for financing from the Japan Special Fund (JSF) and to disapprove those it finds unsatisfactory. Proposals are submitted at regular intervals (currently, on a bimonthly basis). A small unit was established in the Asian Development Bank (ADB) to process this work and that required for other Japanese funds. Annual administration costs are charged to the Fund. The reputation of the unit for customer service within ADB is extremely high. Without exception, project staff spoke warmly of the responsiveness and quality of the assistance provided by the head of the Japan Funds Team. The team provides excellent advice about the likelihood of success of proposals and, consequently, is able to headoff technical assistance (TA) proposals that are not likely to meet the requirements of the Fund for approval. This service makes a major contribution to downstream administrative efficiency. From 1999 to 2006, only 43 proposals were disapproved by the GoJ.1 In the same period, 75 projects were withdrawn. 2. ADB operational departments have varied views about the tedious administrative process required by the Fund. Departments generally consider that a JSF proposal requires about 2 months’ additional lapsed time to process, almost entirely consumed by the approval process.2 Estimates of project staff to complete the TA profile ranged from “about half an hour” to 2 days. The most frequently mentioned concern was the relevance of questions asked about proposed TAs during the approval process. The concern was voiced more frequently by project staff in social sectors. 3. The Fund had an initial contribution of ¥2.5 billion ($19.64 million) on 25 March 1988, supplemented by a further contribution of ¥2 billion ($15.84 million) a month later. Broadly, annual contributions peaked in 1995 with just over $100 million and then progressively declined to about $25 million beginning in 2004 (Table A3.1).
Table A3.1: Annual Contributions to JSF (1988–2007) ($ million)
Fiscal Year Contribution
Environment Fund
WID Fund
Private Sector
Financial Sector Seminars Total
1988 35.48 35.481989 58.8 0.06 58.861990 58.3 4.63 0.43 63.361991 26.15 4.62 1.92 0.7 33.391992 58.72 7.91 1.98 3.96 0.19 72.761993 66.85 11.3 2.35 4.71 0.23 85.441994 76.85 13.14 2.53 7.01 0.25 99.781995 79.65 14.75 2.46 7.87 0.25 104.981996 61.95 13.27 2.21 2.21 0.23 79.871998 46.48 11.9 1.98 1.98 0.2 62.541999 16.78 14.24 2.51 2.51 12.57 48.612000 37.56 37.562001 30.91 30.91
1 Most of the disapproved proposals were 19 regional TAs or TAs to be implemented in the People’s Republic of
China (11 in number), where there was an apparent change in JSF policy that was not communicated to ADB. 2 The reality appears to be different, with advisory TAs experiencing an increase of just over a month and project
preparatory TAs showing no increase.
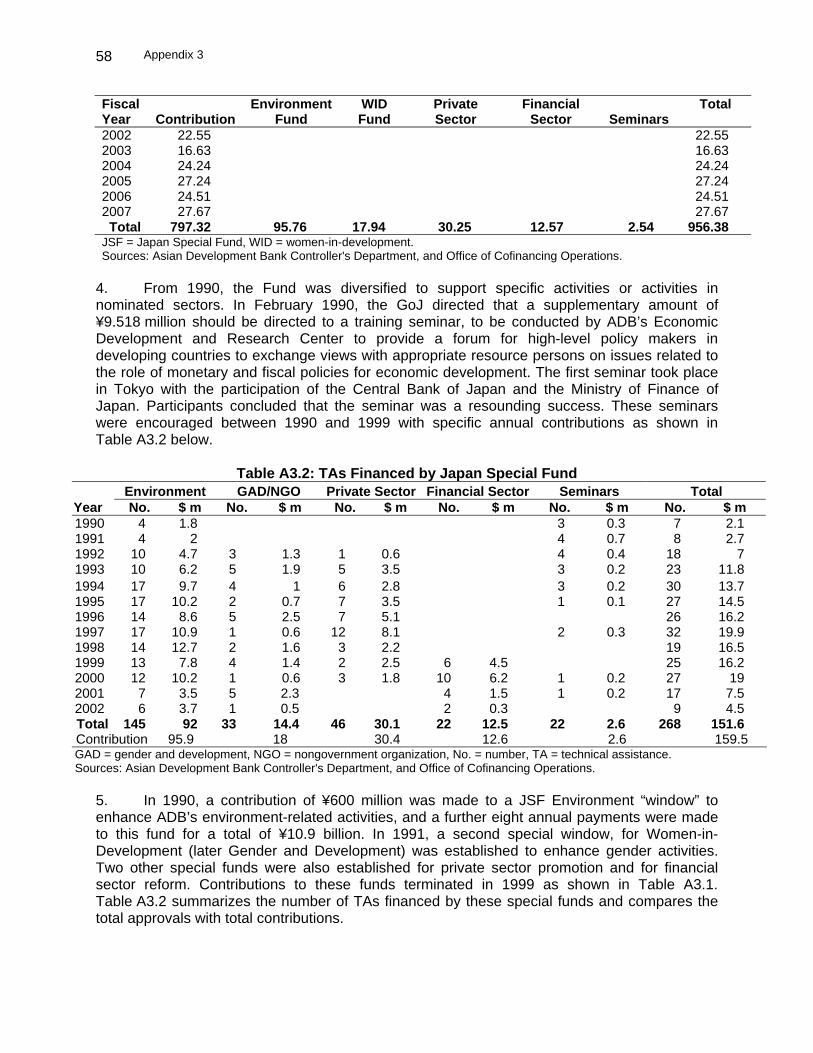
Appendix 3
58
Fiscal Year Contribution
Environment Fund
WID Fund
Private Sector
Financial Sector Seminars
Total
2002 22.55 22.552003 16.63 16.632004 24.24 24.242005 27.24 27.242006 24.51 24.512007 27.67 27.67 Total 797.32 95.76 17.94 30.25 12.57 2.54 956.38JSF = Japan Special Fund, WID = women-in-development. Sources: Asian Development Bank Controller's Department, and Office of Cofinancing Operations.
4. From 1990, the Fund was diversified to support specific activities or activities in nominated sectors. In February 1990, the GoJ directed that a supplementary amount of ¥9.518 million should be directed to a training seminar, to be conducted by ADB’s Economic Development and Research Center to provide a forum for high-level policy makers in developing countries to exchange views with appropriate resource persons on issues related to the role of monetary and fiscal policies for economic development. The first seminar took place in Tokyo with the participation of the Central Bank of Japan and the Ministry of Finance of Japan. Participants concluded that the seminar was a resounding success. These seminars were encouraged between 1990 and 1999 with specific annual contributions as shown in Table A3.2 below.
Table A3.2: TAs Financed by Japan Special Fund
Environment GAD/NGO Private Sector Financial Sector Seminars Total Year No. $ m No. $ m No. $ m No. $ m No. $ m No. $ m 1990 4 1.8 3 0.3 7 2.11991 4 2 4 0.7 8 2.71992 10 4.7 3 1.3 1 0.6 4 0.4 18 71993 10 6.2 5 1.9 5 3.5 3 0.2 23 11.81994 17 9.7 4 1 6 2.8 3 0.2 30 13.71995 17 10.2 2 0.7 7 3.5 1 0.1 27 14.51996 14 8.6 5 2.5 7 5.1 26 16.21997 17 10.9 1 0.6 12 8.1 2 0.3 32 19.91998 14 12.7 2 1.6 3 2.2 19 16.51999 13 7.8 4 1.4 2 2.5 6 4.5 25 16.22000 12 10.2 1 0.6 3 1.8 10 6.2 1 0.2 27 192001 7 3.5 5 2.3 4 1.5 1 0.2 17 7.52002 6 3.7 1 0.5 2 0.3 9 4.5Total 145 92 33 14.4 46 30.1 22 12.5 22 2.6 268 151.6Contribution 95.9 18 30.4 12.6 2.6 159.5 GAD = gender and development, NGO = nongovernment organization, No. = number, TA = technical assistance. Sources: Asian Development Bank Controller's Department, and Office of Cofinancing Operations.
5. In 1990, a contribution of ¥600 million was made to a JSF Environment “window” to enhance ADB’s environment-related activities, and a further eight annual payments were made to this fund for a total of ¥10.9 billion. In 1991, a second special window, for Women-in-Development (later Gender and Development) was established to enhance gender activities. Two other special funds were also established for private sector promotion and for financial sector reform. Contributions to these funds terminated in 1999 as shown in Table A3.1. Table A3.2 summarizes the number of TAs financed by these special funds and compares the total approvals with total contributions.
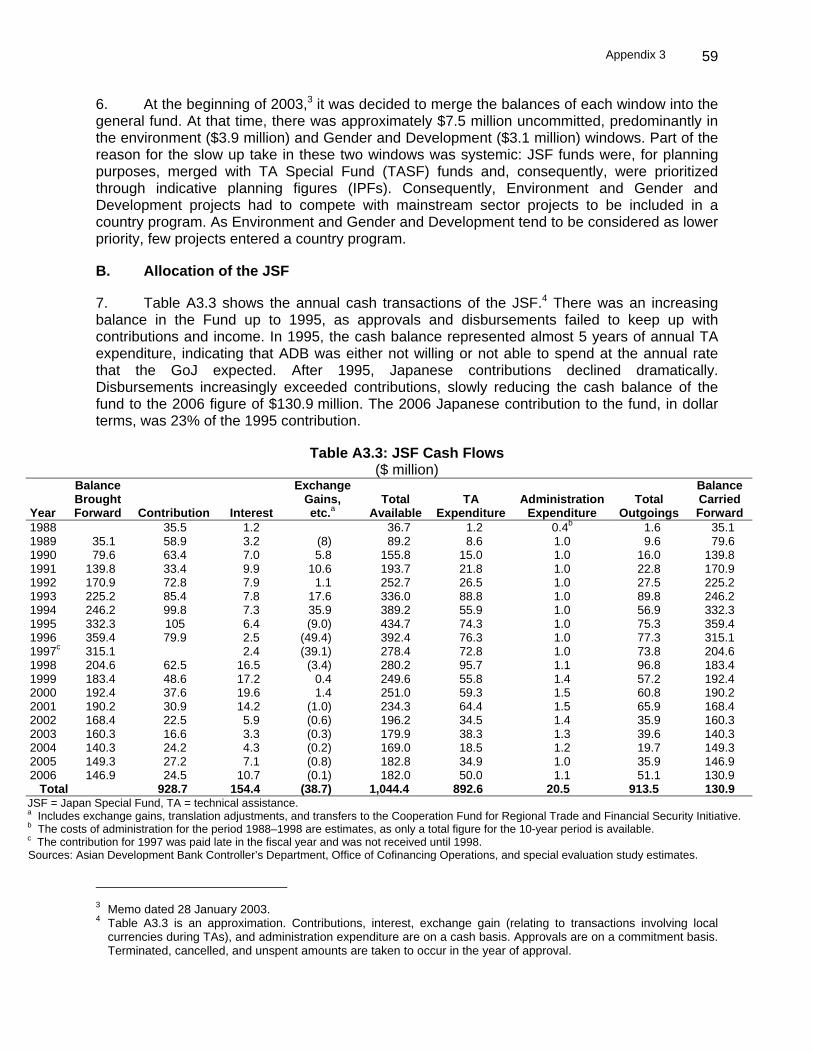
Appendix 3
59
6. At the beginning of 2003,3 it was decided to merge the balances of each window into the general fund. At that time, there was approximately $7.5 million uncommitted, predominantly in the environment ($3.9 million) and Gender and Development ($3.1 million) windows. Part of the reason for the slow up take in these two windows was systemic: JSF funds were, for planning purposes, merged with TA Special Fund (TASF) funds and, consequently, were prioritized through indicative planning figures (IPFs). Consequently, Environment and Gender and Development projects had to compete with mainstream sector projects to be included in a country program. As Environment and Gender and Development tend to be considered as lower priority, few projects entered a country program. B. Allocation of the JSF 7. Table A3.3 shows the annual cash transactions of the JSF.4 There was an increasing balance in the Fund up to 1995, as approvals and disbursements failed to keep up with contributions and income. In 1995, the cash balance represented almost 5 years of annual TA expenditure, indicating that ADB was either not willing or not able to spend at the annual rate that the GoJ expected. After 1995, Japanese contributions declined dramatically. Disbursements increasingly exceeded contributions, slowly reducing the cash balance of the fund to the 2006 figure of $130.9 million. The 2006 Japanese contribution to the fund, in dollar terms, was 23% of the 1995 contribution.
Table A3.3: JSF Cash Flows ($ million)
Year
Balance Brought Forward Contribution Interest
Exchange Gains, etc.a
Total Available
TA Expenditure
Administration Expenditure
Total Outgoings
Balance Carried Forward
1988 35.5 1.2 36.7 1.2 0.4b 1.6 35.1 1989 35.1 58.9 3.2 (8) 89.2 8.6 1.0 9.6 79.6 1990 79.6 63.4 7.0 5.8 155.8 15.0 1.0 16.0 139.8 1991 139.8 33.4 9.9 10.6 193.7 21.8 1.0 22.8 170.9 1992 170.9 72.8 7.9 1.1 252.7 26.5 1.0 27.5 225.2 1993 225.2 85.4 7.8 17.6 336.0 88.8 1.0 89.8 246.2 1994 246.2 99.8 7.3 35.9 389.2 55.9 1.0 56.9 332.3 1995 332.3 105 6.4 (9.0) 434.7 74.3 1.0 75.3 359.4 1996 359.4 79.9 2.5 (49.4) 392.4 76.3 1.0 77.3 315.1 1997c 315.1 2.4 (39.1) 278.4 72.8 1.0 73.8 204.6 1998 204.6 62.5 16.5 (3.4) 280.2 95.7 1.1 96.8 183.4 1999 183.4 48.6 17.2 0.4 249.6 55.8 1.4 57.2 192.4 2000 192.4 37.6 19.6 1.4 251.0 59.3 1.5 60.8 190.2 2001 190.2 30.9 14.2 (1.0) 234.3 64.4 1.5 65.9 168.4 2002 168.4 22.5 5.9 (0.6) 196.2 34.5 1.4 35.9 160.3 2003 160.3 16.6 3.3 (0.3) 179.9 38.3 1.3 39.6 140.3 2004 140.3 24.2 4.3 (0.2) 169.0 18.5 1.2 19.7 149.3 2005 149.3 27.2 7.1 (0.8) 182.8 34.9 1.0 35.9 146.9 2006 146.9 24.5 10.7 (0.1) 182.0 50.0 1.1 51.1 130.9 Total 928.7 154.4 (38.7) 1,044.4 892.6 20.5 913.5 130.9
JSF = Japan Special Fund, TA = technical assistance. a Includes exchange gains, translation adjustments, and transfers to the Cooperation Fund for Regional Trade and Financial Security Initiative. b The costs of administration for the period 1988–1998 are estimates, as only a total figure for the 10-year period is available. c The contribution for 1997 was paid late in the fiscal year and was not received until 1998. Sources: Asian Development Bank Controller’s Department, Office of Cofinancing Operations, and special evaluation study estimates.
3 Memo dated 28 January 2003. 4 Table A3.3 is an approximation. Contributions, interest, exchange gain (relating to transactions involving local
currencies during TAs), and administration expenditure are on a cash basis. Approvals are on a commitment basis. Terminated, cancelled, and unspent amounts are taken to occur in the year of approval.
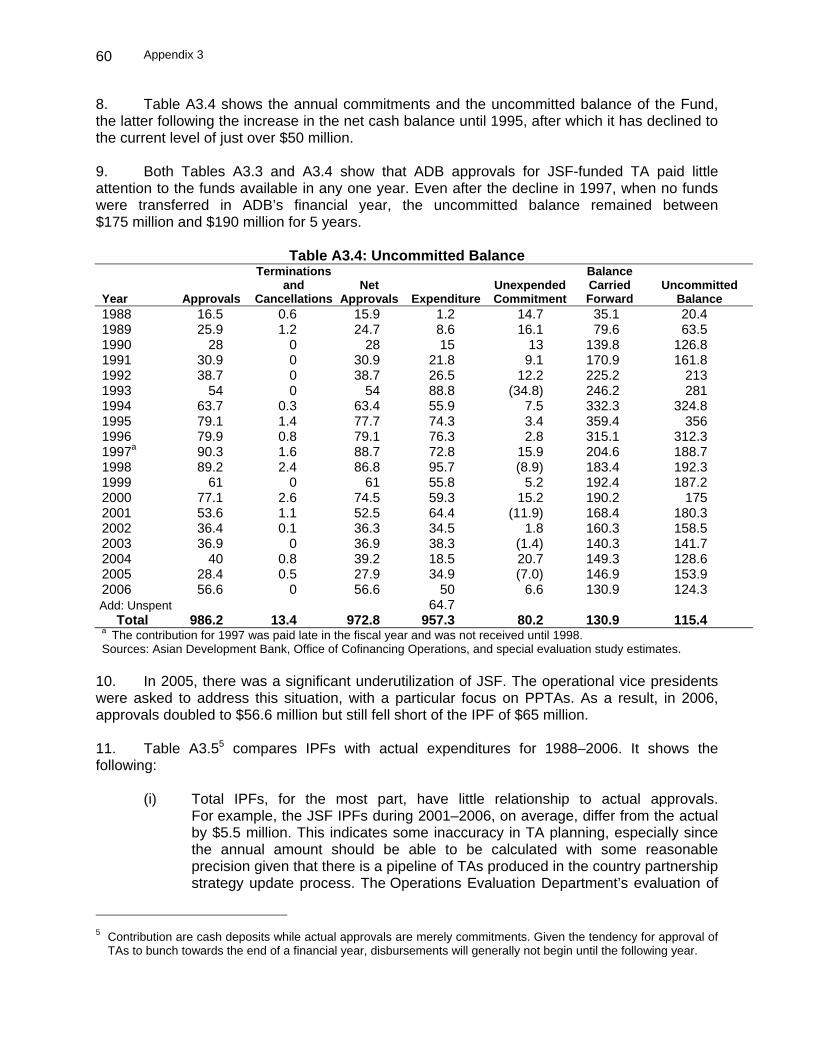
Appendix 3
60
8. Table A3.4 shows the annual commitments and the uncommitted balance of the Fund, the latter following the increase in the net cash balance until 1995, after which it has declined to the current level of just over $50 million. 9. Both Tables A3.3 and A3.4 show that ADB approvals for JSF-funded TA paid little attention to the funds available in any one year. Even after the decline in 1997, when no funds were transferred in ADB’s financial year, the uncommitted balance remained between $175 million and $190 million for 5 years.
Table A3.4: Uncommitted Balance
Year Approvals
Terminations and
CancellationsNet
Approvals ExpenditureUnexpended Commitment
Balance Carried Forward
Uncommitted Balance
1988 16.5 0.6 15.9 1.2 14.7 35.1 20.41989 25.9 1.2 24.7 8.6 16.1 79.6 63.51990 28 0 28 15 13 139.8 126.81991 30.9 0 30.9 21.8 9.1 170.9 161.81992 38.7 0 38.7 26.5 12.2 225.2 2131993 54 0 54 88.8 (34.8) 246.2 2811994 63.7 0.3 63.4 55.9 7.5 332.3 324.81995 79.1 1.4 77.7 74.3 3.4 359.4 3561996 79.9 0.8 79.1 76.3 2.8 315.1 312.31997a 90.3 1.6 88.7 72.8 15.9 204.6 188.71998 89.2 2.4 86.8 95.7 (8.9) 183.4 192.31999 61 0 61 55.8 5.2 192.4 187.22000 77.1 2.6 74.5 59.3 15.2 190.2 1752001 53.6 1.1 52.5 64.4 (11.9) 168.4 180.32002 36.4 0.1 36.3 34.5 1.8 160.3 158.52003 36.9 0 36.9 38.3 (1.4) 140.3 141.72004 40 0.8 39.2 18.5 20.7 149.3 128.62005 28.4 0.5 27.9 34.9 (7.0) 146.9 153.92006 56.6 0 56.6 50 6.6 130.9 124.3Add: Unspent 64.7 Total 986.2 13.4 972.8 957.3 80.2 130.9 115.4a The contribution for 1997 was paid late in the fiscal year and was not received until 1998. Sources: Asian Development Bank, Office of Cofinancing Operations, and special evaluation study estimates.
10. In 2005, there was a significant underutilization of JSF. The operational vice presidents were asked to address this situation, with a particular focus on PPTAs. As a result, in 2006, approvals doubled to $56.6 million but still fell short of the IPF of $65 million. 11. Table A3.55 compares IPFs with actual expenditures for 1988–2006. It shows the following:
(i) Total IPFs, for the most part, have little relationship to actual approvals. For example, the JSF IPFs during 2001–2006, on average, differ from the actual by $5.5 million. This indicates some inaccuracy in TA planning, especially since the annual amount should be able to be calculated with some reasonable precision given that there is a pipeline of TAs produced in the country partnership strategy update process. The Operations Evaluation Department’s evaluation of
5 Contribution are cash deposits while actual approvals are merely commitments. Given the tendency for approval of
TAs to bunch towards the end of a financial year, disbursements will generally not begin until the following year.

Appendix 3
61
TA performance, however, showed how imprecise pipelines are, with TAs not in a pipeline often being substituted for TAs that were.
(ii) The JSF was the major driving force in expanding the overall TA program during 1994–1998. Its contribution to this comparative advantage of ADB was important during this period.
(iii) IPFs do not appear to take cognizance of the funds available for investment but seem more guided by historical figures. Given that most TAs are underfunded, greater availability of funds for the same number of TAs might well have improved performance markedly.
Table A3.5: Comparison of Indicative Planning Figures with Actual Expenditurea
JSF TASF Other sources
Year Contribution IPF
(Over)/ Under
Budget of Contribution
Actual (Over)/Under Spent
IPF Actual (Over) / Under Spent
IPF Actual (Over)/ Under Spent
1988 35.5 29 6.5 16.5 12.5 30 101.2 (71.2) 15 12.3 2.7 1989 58.9 25 33.9 24.6 0.4 51.9 93.9 (42.0) 13.1 12.7 0.4 1990 63.4 30 33.4 29.2 0.8 54 92.3 (38.3) 11 9.4 1.6 1991 33.4 35 (1.6) 30.9 4.1 50 66.9 (16.9) 20 20.2 (0.2) 1992 72.8 41 31.8 38.7 2.3 60 164.8 (104.8) 17 12.4 4.6 1993 85.4 54 41.4 54.0 0.0 55 49.7 5.3 24 18.1 5.9 1994 99.8 67 32.8 64.0 3.0 50 42.9 7.1 23 21.9 1.1 1995 105.0 80 25.0 79.1 0.9 40 56.4 (16.4) 20 9.4 10.6 1996 79.9 85 (5.1) 79.4 5.6 53 59.0 (6.0) 10 36.3 (26.3) 1997 0 90 (90.0) 90.3 (0.3) 52 65.1 (13.1) 10 15.3 (5.3) 1998 62.5 90 (17.5) 89.2 0.8 55 78.4 (23.4) 10 19.3 (9.3) 1999 48.6 2000 37.6 2001 30.9 60 (29.1) 53.2 6.8 75 47.5 27.5 10 53.2 (43.2) 2002 22.6 33 (10.4) 36.4 (3.4) 117 142.8 (25.8) 10 39.9 (29.9) 2003 16.6 33 (16.4) 36.9 (3.9) 89 104.2 (15.2) 15 52.1 (37.1) 2004 24.2 36 (11.8) 39.5 (3.5) 84 94.6 (10.6) 35 77.2 (42.2) 2005 27.2 36 (8.8) 28.4 7.6 109 107.9 1.1 30 80.9 (50.9) 2006 24.5 65 (40.5) 56.6 8.4 101 95.6 5.4 80 92.7 (12.7) ADB = Asian Development Bank, IPF = indicative planning figure, JSF = Japan Special Fund, TASF = Technical Assistance Special Fund. a ADB information is kept in a number of systems, and it is difficult to reconcile them or to know which one is accurate. In this table,
the annual figures for approvals differ, in many cases, from those in Table A3.4. The different figures are used because Table A3.4 has the sum of approvals for a particular year, while in Table A3.5, the different figures are what appear in annual reports in conjunction with figures for the TASF and other sources of funding. Figures for 1999 and 2000 could not be retrieved.
Sources: ADB Treasury Department and Strategy and Policy Department for IPF; ADB annual reports for actual. 12. Apart from the special windows, the original intention of JSF was to direct most of its funds to proposals related to economic planning and investment. The investments were to be directed at future loan projects. Priority, therefore, was to be given to PPTAs and to ADTAs accompanying loans, the latter assisting the effective implementation of loan projects. Both economic planning and TA encouraging future investment suggest that there would also have been a preference for a programmatic approach to the utilization of JSF funds, as improved economic planning in developing member countries was unlikely to require only a short-term intervention. 13. ADB has not approached the allocation of JSF grants in a programmatic way, partly because of the GoJ’s priority for PPTA, which results in TAs being distributed randomly to the agencies in which loans are planned. Historically, TA projects generally have been selected in an ad hoc way and not in line with a programmatic approach. PPTAs certainly lead to loan
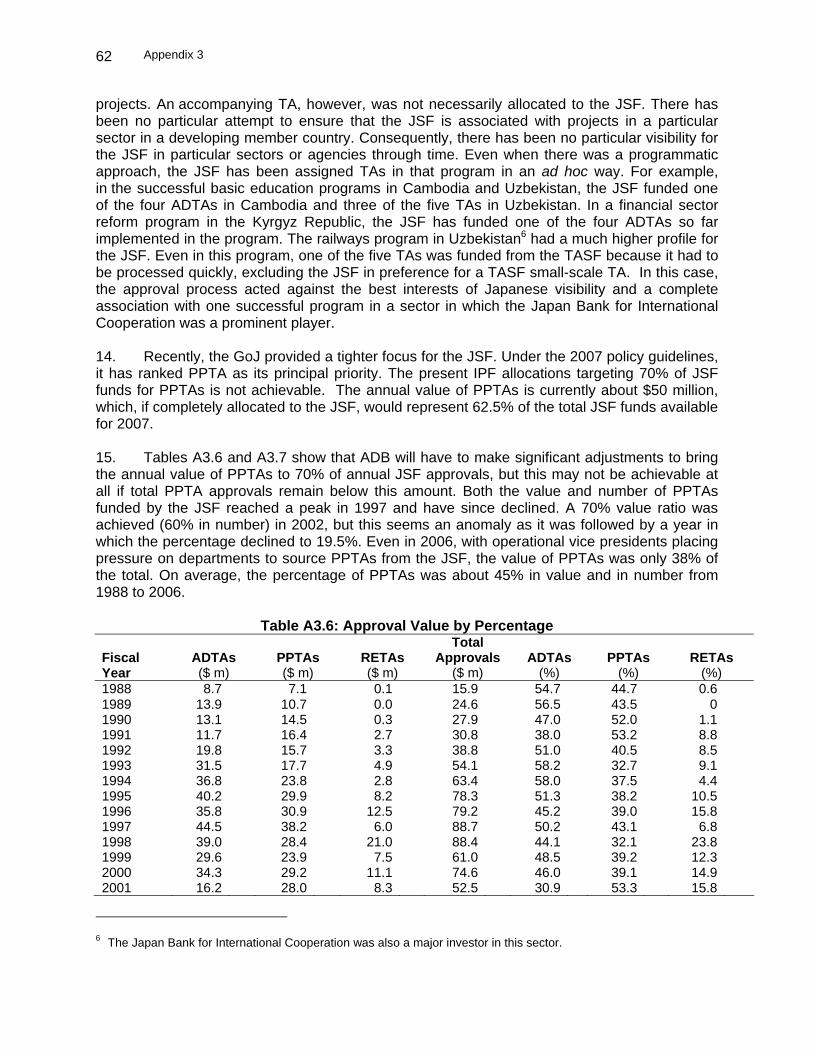
Appendix 3
62
projects. An accompanying TA, however, was not necessarily allocated to the JSF. There has been no particular attempt to ensure that the JSF is associated with projects in a particular sector in a developing member country. Consequently, there has been no particular visibility for the JSF in particular sectors or agencies through time. Even when there was a programmatic approach, the JSF has been assigned TAs in that program in an ad hoc way. For example, in the successful basic education programs in Cambodia and Uzbekistan, the JSF funded one of the four ADTAs in Cambodia and three of the five TAs in Uzbekistan. In a financial sector reform program in the Kyrgyz Republic, the JSF has funded one of the four ADTAs so far implemented in the program. The railways program in Uzbekistan6 had a much higher profile for the JSF. Even in this program, one of the five TAs was funded from the TASF because it had to be processed quickly, excluding the JSF in preference for a TASF small-scale TA. In this case, the approval process acted against the best interests of Japanese visibility and a complete association with one successful program in a sector in which the Japan Bank for International Cooperation was a prominent player. 14. Recently, the GoJ provided a tighter focus for the JSF. Under the 2007 policy guidelines, it has ranked PPTA as its principal priority. The present IPF allocations targeting 70% of JSF funds for PPTAs is not achievable. The annual value of PPTAs is currently about $50 million, which, if completely allocated to the JSF, would represent 62.5% of the total JSF funds available for 2007. 15. Tables A3.6 and A3.7 show that ADB will have to make significant adjustments to bring the annual value of PPTAs to 70% of annual JSF approvals, but this may not be achievable at all if total PPTA approvals remain below this amount. Both the value and number of PPTAs funded by the JSF reached a peak in 1997 and have since declined. A 70% value ratio was achieved (60% in number) in 2002, but this seems an anomaly as it was followed by a year in which the percentage declined to 19.5%. Even in 2006, with operational vice presidents placing pressure on departments to source PPTAs from the JSF, the value of PPTAs was only 38% of the total. On average, the percentage of PPTAs was about 45% in value and in number from 1988 to 2006.
Table A3.6: Approval Value by Percentage
Fiscal Year
ADTAs ($ m)
PPTAs ($ m)
RETAs ($ m)
Total Approvals
($ m) ADTAs
(%) PPTAs
(%) RETAs
(%) 1988 8.7 7.1 0.1 15.9 54.7 44.7 0.6 1989 13.9 10.7 0.0 24.6 56.5 43.5 0 1990 13.1 14.5 0.3 27.9 47.0 52.0 1.1 1991 11.7 16.4 2.7 30.8 38.0 53.2 8.8 1992 19.8 15.7 3.3 38.8 51.0 40.5 8.5 1993 31.5 17.7 4.9 54.1 58.2 32.7 9.1 1994 36.8 23.8 2.8 63.4 58.0 37.5 4.4 1995 40.2 29.9 8.2 78.3 51.3 38.2 10.5 1996 35.8 30.9 12.5 79.2 45.2 39.0 15.8 1997 44.5 38.2 6.0 88.7 50.2 43.1 6.8 1998 39.0 28.4 21.0 88.4 44.1 32.1 23.8 1999 29.6 23.9 7.5 61.0 48.5 39.2 12.3 2000 34.3 29.2 11.1 74.6 46.0 39.1 14.9 2001 16.2 28.0 8.3 52.5 30.9 53.3 15.8
6 The Japan Bank for International Cooperation was also a major investor in this sector.

Appendix 3
63
Fiscal Year
ADTAs ($ m)
PPTAs ($ m)
RETAs ($ m)
Total Approvals
($ m) ADTAs
(%) PPTAs
(%) RETAs
(%) 2002 8.9 25.6 1.9 36.4 24.5 70.3 5.2 2003 13.3 16.4 7.2 36.9 36.0 44.4 19.5 2004 13.8 17.6 7.8 39.2 35.2 44.9 19.9 2005 9.2 14.8 4.0 28.0 32.9 52.9 14.3 2006 15.9 21.6 19.0 56.5 28.1 38.2 33.6 Total 436.2 410.2 128.6 974.8 44.7 42.1 13.2 ADTA = advisory technical assistance, PPTA = project preparatory technical assistance, RETA = regional technical assistance. Source: Asian Development Bank management information systems.
Table A3.7: Annual Approval Number by Percentage
Number Percentage Fiscal Year ADTAs PPTAs RETAs Total ADTAs PPTAs RETAs 1988 21 18 1 40 52.5 45.0 2.5 1989 30 22 0 52 57.7 42.3 0 1990 25 29 3 57 43.9 50.9 5.3 1991 19 26 8 53 35.8 49.1 15.1 1992 26 30 10 66 39.4 45.5 15.2 1993 54 31 8 93 58.1 33.3 8.6 1994 72 50 7 129 55.8 38.8 5.4 1995 63 52 10 125 50.4 41.6 8.0 1996 55 49 14 118 46.6 41.5 11.9 1997 68 58 8 134 50.7 43.3 6.0 1998 47 38 26 111 42.3 34.2 23.4 1999 38 35 18 91 41.8 38.5 19.8 2000 48 41 19 108 44.4 38.0 17.6 2001 30 45 19 94 31.9 47.9 20.2 2002 20 39 6 65 30.8 60.0 9.2 2003 27 28 12 67 40.3 41.8 17.9 2004 27 27 15 69 39.1 39.1 21.7 2005 17 21 6 44 38.6 47.7 13.6 2006 18 29 15 62 29.0 46.8 24.2 Total 705 668 205 1,578 44.7 42.3 13.0 ADTA = advisory technical assistance, PPTA = project preparatory technical assistance, RETA = regional technical assistance. Source: Asian Development Bank management information systems.
16. A target of 70% of the value of JSF grants to be allocated to PPTAs might be very difficult to achieve and might not be in the best interests of ADB. The projected value of JSF approvals for 2007 is $65 million. A JSF monopoly on PPTAs might have the following adverse consequences for ADB:
(i) It might discourage other agencies from providing trust funds for PPTAs if the JSF appears to crowd them out. For example, a poverty-related British grant of $30 million in India is the funding cornerstone of the ADB program there. The fund is available only until the end of 2007. With the JSF as a monopoly alternative for PPTAs, there might be less incentive for the British to replenish the grant.
Appendix 3
64
(ii) It would make ADB too dependent on JSF funds for its investment and program loan development program, with the real danger that the GoJ would be largely directing ADB’s investment program through its ability to approve or disapprove all PPTAs proposed.
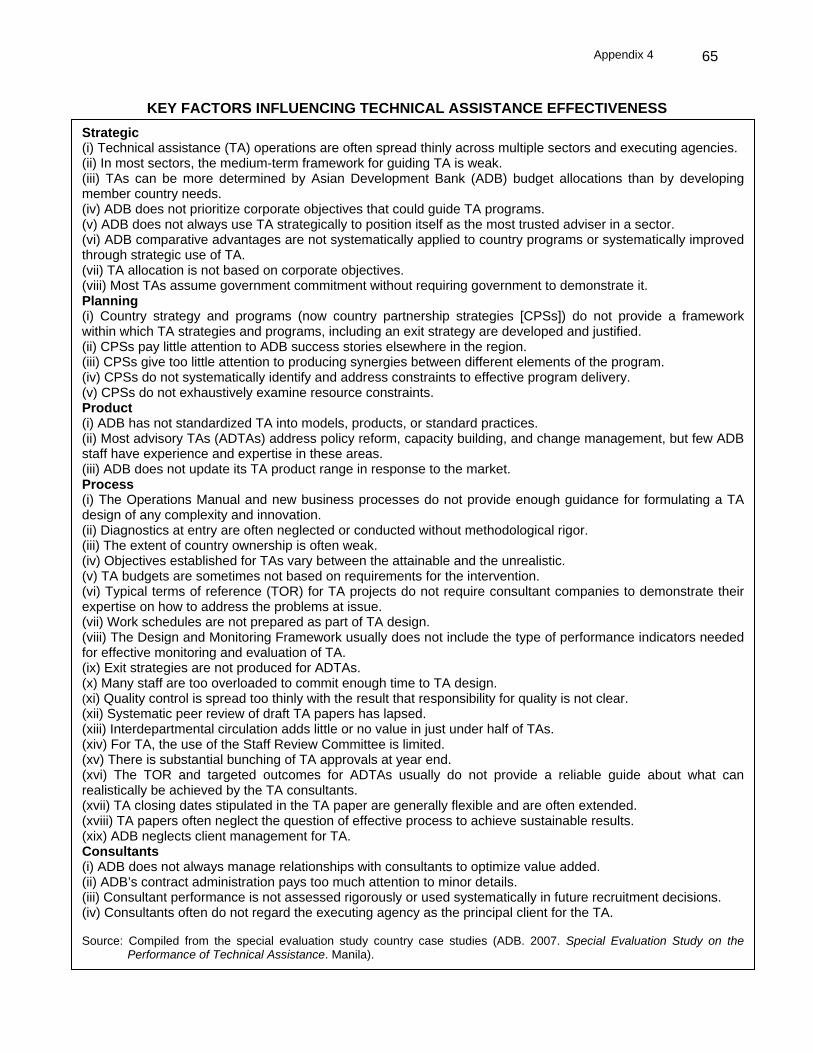
Appendix 4
65
KEY FACTORS INFLUENCING TECHNICAL ASSISTANCE EFFECTIVENESS
Strategic (i) Technical assistance (TA) operations are often spread thinly across multiple sectors and executing agencies. (ii) In most sectors, the medium-term framework for guiding TA is weak. (iii) TAs can be more determined by Asian Development Bank (ADB) budget allocations than by developing member country needs. (iv) ADB does not prioritize corporate objectives that could guide TA programs. (v) ADB does not always use TA strategically to position itself as the most trusted adviser in a sector. (vi) ADB comparative advantages are not systematically applied to country programs or systematically improved through strategic use of TA. (vii) TA allocation is not based on corporate objectives. (viii) Most TAs assume government commitment without requiring government to demonstrate it. Planning (i) Country strategy and programs (now country partnership strategies [CPSs]) do not provide a framework within which TA strategies and programs, including an exit strategy are developed and justified. (ii) CPSs pay little attention to ADB success stories elsewhere in the region. (iii) CPSs give too little attention to producing synergies between different elements of the program. (iv) CPSs do not systematically identify and address constraints to effective program delivery. (v) CPSs do not exhaustively examine resource constraints. Product (i) ADB has not standardized TA into models, products, or standard practices. (ii) Most advisory TAs (ADTAs) address policy reform, capacity building, and change management, but few ADB staff have experience and expertise in these areas. (iii) ADB does not update its TA product range in response to the market. Process (i) The Operations Manual and new business processes do not provide enough guidance for formulating a TA design of any complexity and innovation. (ii) Diagnostics at entry are often neglected or conducted without methodological rigor. (iii) The extent of country ownership is often weak. (iv) Objectives established for TAs vary between the attainable and the unrealistic. (v) TA budgets are sometimes not based on requirements for the intervention. (vi) Typical terms of reference (TOR) for TA projects do not require consultant companies to demonstrate their expertise on how to address the problems at issue. (vii) Work schedules are not prepared as part of TA design. (viii) The Design and Monitoring Framework usually does not include the type of performance indicators needed for effective monitoring and evaluation of TA. (ix) Exit strategies are not produced for ADTAs. (x) Many staff are too overloaded to commit enough time to TA design. (xi) Quality control is spread too thinly with the result that responsibility for quality is not clear. (xii) Systematic peer review of draft TA papers has lapsed. (xiii) Interdepartmental circulation adds little or no value in just under half of TAs. (xiv) For TA, the use of the Staff Review Committee is limited. (xv) There is substantial bunching of TA approvals at year end. (xvi) The TOR and targeted outcomes for ADTAs usually do not provide a reliable guide about what can realistically be achieved by the TA consultants. (xvii) TA closing dates stipulated in the TA paper are generally flexible and are often extended. (xviii) TA papers often neglect the question of effective process to achieve sustainable results. (xix) ADB neglects client management for TA. Consultants (i) ADB does not always manage relationships with consultants to optimize value added. (ii) ADB’s contract administration pays too much attention to minor details. (iii) Consultant performance is not assessed rigorously or used systematically in future recruitment decisions. (iv) Consultants often do not regard the executing agency as the principal client for the TA. Source: Compiled from the special evaluation study country case studies (ADB. 2007. Special Evaluation Study on the
Performance of Technical Assistance. Manila).
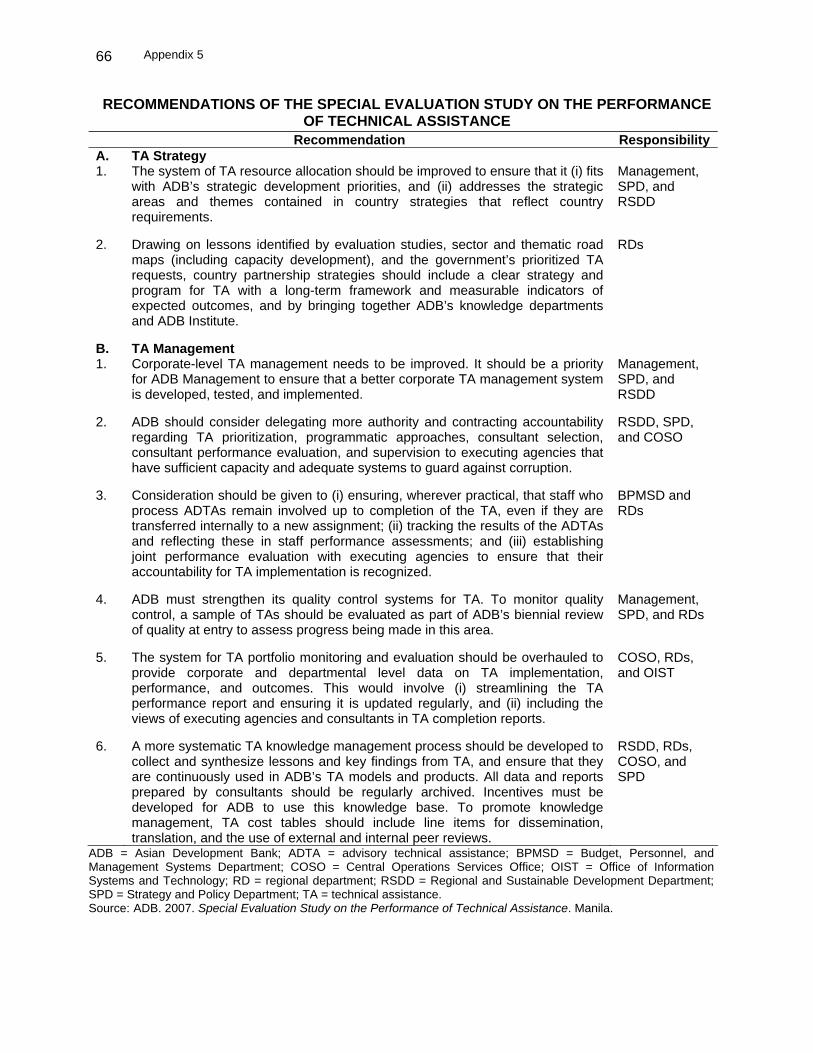
Appendix 5
66
RECOMMENDATIONS OF THE SPECIAL EVALUATION STUDY ON THE PERFORMANCE OF TECHNICAL ASSISTANCE
ADB = Asian Development Bank; ADTA = advisory technical assistance; BPMSD = Budget, Personnel, and Management Systems Department; COSO = Central Operations Services Office; OIST = Office of Information Systems and Technology; RD = regional department; RSDD = Regional and Sustainable Development Department; SPD = Strategy and Policy Department; TA = technical assistance. Source: ADB. 2007. Special Evaluation Study on the Performance of Technical Assistance. Manila.
Recommendation Responsibility A. TA Strategy 1. The system of TA resource allocation should be improved to ensure that it (i) fits
with ADB’s strategic development priorities, and (ii) addresses the strategic areas and themes contained in country strategies that reflect country requirements.
Management, SPD, and RSDD
2. Drawing on lessons identified by evaluation studies, sector and thematic road maps (including capacity development), and the government’s prioritized TA requests, country partnership strategies should include a clear strategy and program for TA with a long-term framework and measurable indicators of expected outcomes, and by bringing together ADB’s knowledge departments and ADB Institute.
RDs
B. TA Management 1. Corporate-level TA management needs to be improved. It should be a priority
for ADB Management to ensure that a better corporate TA management system is developed, tested, and implemented.
Management, SPD, and RSDD
2. ADB should consider delegating more authority and contracting accountability regarding TA prioritization, programmatic approaches, consultant selection, consultant performance evaluation, and supervision to executing agencies that have sufficient capacity and adequate systems to guard against corruption.
RSDD, SPD, and COSO
3. Consideration should be given to (i) ensuring, wherever practical, that staff who process ADTAs remain involved up to completion of the TA, even if they are transferred internally to a new assignment; (ii) tracking the results of the ADTAs and reflecting these in staff performance assessments; and (iii) establishing joint performance evaluation with executing agencies to ensure that their accountability for TA implementation is recognized.
BPMSD and RDs
4. ADB must strengthen its quality control systems for TA. To monitor quality control, a sample of TAs should be evaluated as part of ADB’s biennial review of quality at entry to assess progress being made in this area.
Management, SPD, and RDs
5. The system for TA portfolio monitoring and evaluation should be overhauled to provide corporate and departmental level data on TA implementation, performance, and outcomes. This would involve (i) streamlining the TA performance report and ensuring it is updated regularly, and (ii) including the views of executing agencies and consultants in TA completion reports.
COSO, RDs, and OIST
6. A more systematic TA knowledge management process should be developed to collect and synthesize lessons and key findings from TA, and ensure that they are continuously used in ADB’s TA models and products. All data and reports prepared by consultants should be regularly archived. Incentives must be developed for ADB to use this knowledge base. To promote knowledge management, TA cost tables should include line items for dissemination, translation, and the use of external and internal peer reviews.
RSDD, RDs, COSO, and SPD