final report (arial 22) - serdp-estcp.org final report ew-201336 ... fdd fault detection and...
TRANSCRIPT

FINAL REPORT Collaborative Building Energy Management and Control
at 171st Air Refueling Wing, USAF
Pennsylvania Air National Guard (PaANG)
ESTCP Project EW-201336
DECEMBER 2014
Dmitriy Okunev Siemens Corporation
ESTCP Final Report EW-201336 Collaborative Building Energy Management and Control 1
TABLE OF CONTENTS
LIST OF FIGURES ........................................................................................................................ 3
LIST OF TABLES .......................................................................................................................... 6
ACRONYMS .................................................................................................................................. 7
ACKNOWLEDGEMENTS ............................................................................................................ 9
EXECUTIVE SUMMARY .......................................................................................................... 10
1.0 INTRODUCTION ............................................................................................................. 13
1.1 BACKGROUND ............................................................................................................ 13
1.2 DRIVERS ....................................................................................................................... 14
1.3 OBJECTIVE OF THE DEMONSTRATION ................................................................ 15
2.0 TECHNOLOGY DESCRIPTION .......................................................................................... 16
2.1 TECHNOLOGY OVERVIEW ...................................................................................... 17
2.2 TECHNOLOGY DEVELOPMENT .............................................................................. 25
2.3 ADVANTAGES AND LIMITATIONS OF THE TECHNOLOGY ............................. 34
3.0 PERFORMANCE OBJECTIVES .......................................................................................... 37
3.1 SUMMARY OF PERFORMANCE OBJECTIVES ...................................................... 37
3.2 PERFORMANCE OBJECTIVES DESCRIPTIONS .................................................... 39
4.0 FACILITY/SITE DESCRIPTION .......................................................................................... 45
4.1 FACILITY/SITE LOCATION AND OPERATIONS ................................................... 46
4.2 SITE-RELATED PERMITS AND REGULATIONS ................................................... 48
5.0 TEST DESIGN ....................................................................................................................... 49
5.1 CONCEPTUAL TEST DESIGN ................................................................................... 50
5.2 BASELINE CHARACTERIZATION ........................................................................... 54
5.3 DESIGN AND LAYOUT OF SYSTEM COMPONENTS ........................................... 58
5.4 OPERATIONAL TESTING .......................................................................................... 64
5.5 SAMPLING PROTOCOL ............................................................................................. 70
5.6 SAMPLING RESULTS ................................................................................................. 71
6.0 PERFORMANCE ASSESSMENT ........................................................................................ 72
6.1 PO-I: BUILDING ENERGY USE REDUCTION ......................................................... 72
6.2 PO-II: FACILITY ELECTRICAL LOAD SHEDDING ............................................... 80
6.3 PO-III: SCOPE 2 GREENHOUSE GAS (GHG) EMISSIONS ..................................... 85
6.4 PO-IV: SYSTEM ECONOMICS ................................................................................... 86
ESTCP Final Report EW-201336 Collaborative Building Energy Management and Control 2
6.5 PO-V: OCCUPANT CONTROL AND DSM ENGAGEMENT ................................... 88
6.6 PO-VI: OCCUPANT COMFORT AND SATISFACTION .......................................... 92
6.7 PO-VII: FACILITY MANAGER/OPERATORS FEEDBACK .................................. 112
7.0 COST ASSESSMENT ......................................................................................................... 113
7.1 COST MODEL ............................................................................................................ 113
7.2 COST DRIVERS.......................................................................................................... 115
7.3 COST ANALYSIS AND COMPARISON .................................................................. 115
8.0 IMPLEMENTATION ISSUES ............................................................................................ 120
8.1 PERTINENT REGULATIONS .................................................................................. 120
8.2 END-USER CONCERNS ............................................................................................ 120
8.3 PROCUREMENT ISSUES .......................................................................................... 121
8.4 INTEGRATION WITH BAS ....................................................................................... 121
8.5 USER EXPERIENCE .................................................................................................. 123
9.0 REFERENCES ..................................................................................................................... 125
APPENDIX A: POINTS OF CONTACT ................................................................................... 127
APPENDIX B: ON-SITE OCCUPANT SATISFACTION SURVEY ...................................... 128
APPENDIX C: CBEMC SOFTWARE USABILITY SURVEY ............................................... 129
ESTCP Final Report EW-201336 Collaborative Building Energy Management and Control 3
LIST OF FIGURES
Figure 1: cBEMC approach vs. traditional approach.................................................................... 16
Figure 2: cBEMC Architecture ..................................................................................................... 17
Figure 3: SEB-based cBEMC Architecture .................................................................................. 18
Figure 4: cBEMC controller configuration tool ............................................................................ 20
Figure 5: Temperature arbitration logic in cBEMC controller ..................................................... 21
Figure 6: Occupant engaged DCV ................................................................................................ 23
Figure 7: softThermostat home view ............................................................................................ 27
Figure 8: Occupant zone view ...................................................................................................... 28
Figure 9: Occupant calendar view ................................................................................................ 28
Figure 10: Occupant overall comfort and energy performance view ........................................... 29
Figure 11: Occupant DR notification view ................................................................................... 29
Figure 12: Occupant DR feedback view ....................................................................................... 30
Figure 13: Example of Skeuomorphism UI Elements. Left: thermometer. Center: thermostat. Right: leaves.................................................................................................................................. 30
Figure 14: FM dashboard home view ........................................................................................... 31
Figure 15: FM DR event creation view ........................................................................................ 32
Figure 16: FM aggregated schedule view ..................................................................................... 32
Figure 17: FM occupant feedback view ........................................................................................ 33
Figure 18: Zonal satisfaction and energy performance rating view ............................................. 33
Figure 19: 171st Air refueling wing.............................................................................................. 45
Figure 20: Building PaANG-300 .................................................................................................. 46
Figure 21: 2nd floor plan for PaANG-300 .................................................................................... 47
Figure 22: cBEMC system installation architecture at PaANG-300 ............................................ 49
Figure 23: Baseline estimation for energy saving determination ................................................. 55
Figure 24: Fragment of TRNSYS model showing schematic VAV topology .............................. 56
Figure 25: Model Calibration for 1 months from August 27 to September 29 ............................. 57
Figure 26: Model calibration accuracy ......................................................................................... 57
Figure 27: NEAT Cart .................................................................................................................. 59
ESTCP Final Report EW-201336 Collaborative Building Energy Management and Control 4
Figure 28: Building energy audit partial checklist ........................................................................ 60
Figure 29: cBEMC network integration at PaANG ...................................................................... 62
Figure 30: FM system control interfaces ...................................................................................... 63
Figure 31: Operational sequence of temeprature arbitration for the cBEMC EE tests at PaANG 300................................................................................................................................................. 65
Figure 32: Operational sequences of cBEMC DR Test - Mode 1 ................................................ 66
Figure 33: Operational sequences of cBEMC DR Test - Mode 2 ................................................ 67
Figure 34: Operational sequences of cBEMC DR Test - Mode 3 ................................................ 68
Figure 35: Operational sequences of cBEMC DR Test - Mode 4 ................................................ 69
Figure 36: National commercial building energy density distribution [7] ................................... 74
Figure 37: Pre-baseline energy consumption using real data ....................................................... 74
Figure 38: Work density of PaANG 300 2nd floor....................................................................... 75
Figure 39: PaANG 300 actual energy consumption from Sep. 1-7 (without cBEMC) ................ 76
Figure 40: PaANG 300 energy consumption from Sep. 15-21 (with cBEMC) using field data .. 76
Figure 41: TRNSYS simulated monthly energy savings breakdown ........................................... 77
Figure 42: Energy performance of PaANG 300 2nd floor ........................................................... 78
Figure 43: VAVs weekday hours of operation comparison between baseline (blue columns) and cBEMC deployment (orange Columns) ........................................................................................ 78
Figure 44: RM 218 VAV flow ...................................................................................................... 79
Figure 45: Extrapolated yearly energy savings with cBEMC deployment ................................... 79
Figure 46: Extrapolated yearly energy savings with cBEMC deployment (Best Case scenario) . 80
Figure 47: Average monthly weekday demand curves for PaANG 300 ...................................... 81
Figure 48: Baseline and actual demand during DR Test 1 (Mode 2) ........................................... 83
Figure 49: Baseline and actual demand during DR Test 2 (Mode 3) ........................................... 83
Figure 50: Baseline and actual demand during DR Test 3 (Mode 4) ........................................... 84
Figure 51: Excerpt from the occupants engagement report for PaANG -300 .............................. 90
Figure 52: Building exterior, PaANG 1st IEQ field study, Jan 15, 2014 ..................................... 93
Figure 53: Floor plan, Workstations IEQ measurements at PaANG “before cBEMC” Jan 15, 2014............................................................................................................................................... 95
Figure 54: Floor plan, Workstations IEQ measurements at PaANG “during cBEMC” April 30 95
ESTCP Final Report EW-201336 Collaborative Building Energy Management and Control 5
Figure 55: Building Interior: lighting, thermal, air quality, acoustic, spatial attributes ............... 96
Figure 56: Photos of user adaptations for thermal control ............................................................ 97
Figure 57: User Satisfaction: Temperature in your work area ...................................................... 99
Figure 58: Overall User Satisfaction with Winter Temperature on ASHRAE point scale ......... 100
Figure 59: Overall User Satisfaction with Summer Temperature on ASHRAE point scale ...... 100
Figure 60: IEQ Occupant Satisfaction Result, PaANG before cBEMC, January 2014 ............. 101
Figure 61: IEQ Occupant Satisfaction Result, PaANG during cBEMC heating, April 2014 .... 101
Figure 62: IEQ Occupant Satisfaction Result, PaANG during cBEMC cooling, August 2014 . 102
Figure 63: Spot Measurement: Air Temperature at 4 Feet from floor (oF) ................................ 102
Figure 64: Continuous measurement: 24 hour Air Temperature (oF) ......................................... 103
Figure 65: Continuous Measurement: CO2 level (ppm) ............................................................. 104
Figure 66: Spot Measurement: CO2 level (ppm) ........................................................................ 104
Figure 67: User Satisfaction: Overall air quality in your work area ........................................... 105
Figure 68: User Satisfaction: Air movement in your work area ................................................. 105
Figure 69: Ceiling light ............................................................................................................... 108
Figure 70: Fisheye Image for glare analysis ............................................................................... 108
Figure 71: Spot Measurement: Unified Glare Ratio ................................................................... 109
Figure 72: User Satisfaction: Quality of lighting in work area ................................................... 109
Figure 73: User Satisfaction: Access to a view of outside when seated ..................................... 110
Figure 74: Spot Measurement: Noise Criteria ............................................................................ 111
Figure 75: User Satisfaction: Amount of background noise at your workstation ....................... 111
Figure 76: User Satisfaction: Frequency of distractions from other people ............................... 111
Figure 77: Payback time by type of problems in the re-commissioning [15] ............................. 117
Figure 78: Distributions on office building maintenance costs according to ASHRAE database [15]. ............................................................................................................................................. 118
ESTCP Final Report EW-201336 Collaborative Building Energy Management and Control 6
LIST OF TABLES
Table 1: Demonstration Results Summary ................................................................................... 11
Table 2: Chronological Summary of the cBEMC Technology .................................................... 24
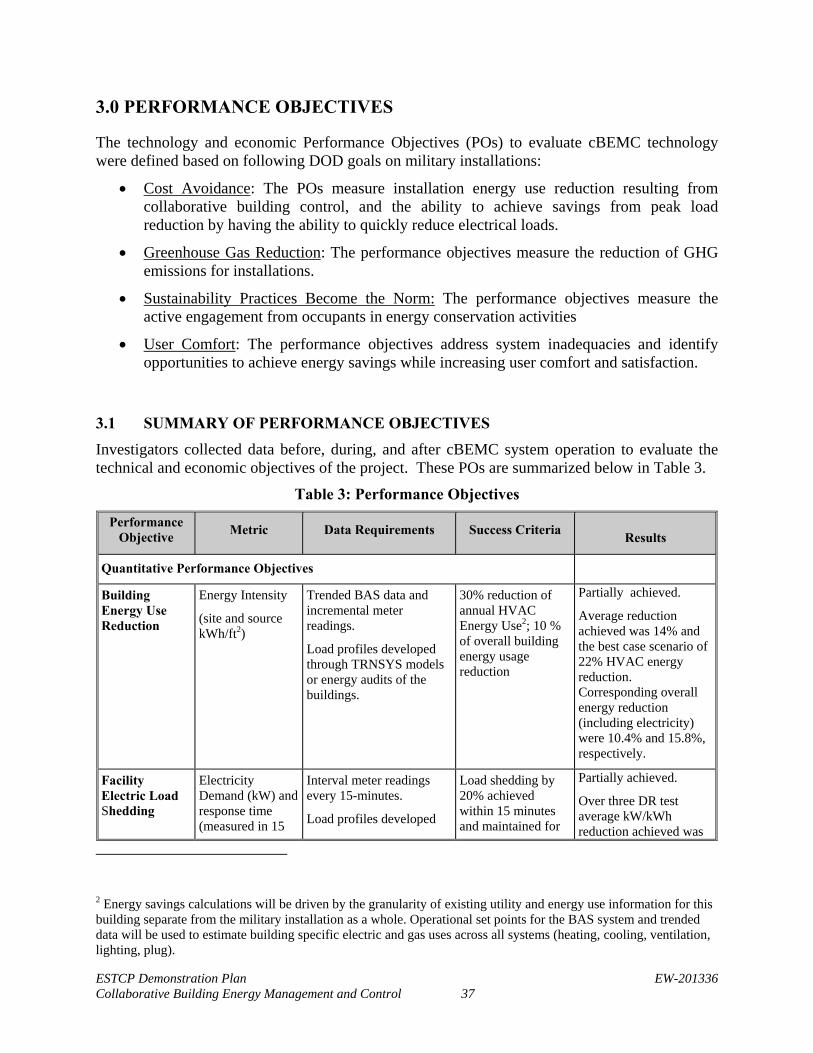
Table 3: Performance Objectives .................................................................................................. 37
Table 4: Test Design Summary ..................................................................................................... 50
Table 5: DR Modes ....................................................................................................................... 52
Table 6: Statistical results of Calibration results .......................................................................... 57
Table 7: Sampling Protocol Table ................................................................................................ 70
Table 8: DR Event Schedule ......................................................................................................... 82
Table 9: Results Summary for DR-1 (Mode 2) ............................................................................ 83
Table 10: Results Summary for DR-2 (Mode 3) .......................................................................... 84
Table 11: Results Summary for DR-3 (Mode 4) .......................................................................... 84
Table 12: DR Results Summary ................................................................................................... 85
Table 13: Total Power Plant Emissions – East Region ................................................................. 86
Table 14: Comparison of baseline emission to the post cBEMC intervention ............................. 86
Table 15: Annual Consumptions without cBEMC ....................................................................... 87
Table 16: Annual Consumptions with cBEMC ............................................................................ 87
Table 17: cBEMC Savings............................................................................................................ 88
Table 18: Results of User Satisfaction Questionnaire .................................................................. 91
Table 19: Environmental quality measures taken ......................................................................... 98
Table 20: The measurements taken at each workstation, as well as calculated variables ............ 98
Table 21: Continuous measurement: 2-Week Thermal and Air Quality .................................... 106
Table 22: Trend Details for 2 week thermal and air quality measurement by GrayWolf Sensor107
Table 23: FM Feedback .............................................................................................................. 112
Table 24: Cost Model for the cBEMC at PaANG 300 ............................................................... 113
Table 25: Scenarios 1 and 2 Cost Structures .............................................................................. 117
ESTCP Final Report EW-201336 Collaborative Building Energy Management and Control 7
ACRONYMS
AHU Air Handling Unit ASHRAE American Society for Heating, Refrigerating and Air Conditioning BAS Building Automation System BMS Building Management System Btu British thermal unit BACnet Building Automation and Control Network Communication Protocol cBEMC Collaborative Building Energy Management and Control CFM Cubic feet per minute CMU Carnegie Mellon University DOD US Department of Defense DOE US Department of Energy DR Demand Response DSM Demand Side Management EEB Hub Energy Efficient Building Hub of the DOE (formerly GPIC) EPA Environmental Protection Agency E-Plus DOE “Energy Plus” Software ESTCP Environmental Security Technology Certification Program FDD Fault Detection and Diagnosis FM Facility Manager FEMP Federal Energy Management program GHG Green House Gas GSA General Services Administration GForge Web-based project management portal for software projects HASP Health and Safety Plan HMI Human-Machine Interface HVAC Heating, Ventilation, & Air Conditioning IENSA Illuminating Engineering Society of North America IEQ Indoor Environmental quality IPMVP International Performance Measurement and Verification Protocol LCCA Life Cycle Cost Analysis MOU Memo of Understanding NEAT National Environmental Assessment Toolkit NIST National Institute of Standards and Technology NIST RMF NIST Risk Management Framework O&M Operations and Maintenance PaANG Pennsylvania Air National Guard PNNL Pacific Northwest National Laboratory PPCL Powers Process Control Language PO Performance Objective POC Point of Contact RMSE Root mean square error RTD&E Research, development, test, and evaluation SBT Siemens Building Technologies SCT Siemens Corporation, Corporate Technology

ESTCP Final Report EW-201336 Collaborative Building Energy Management and Control 8
SVN Version control / source control software for Windows TMY3 Typical Meteorological Year 3 – weather data for the average year (of 30) VAV Variable Air Volume

ESTCP Final Report EW-201336 Collaborative Building Energy Management and Control 9
ACKNOWLEDGEMENTS
This work is supported by the U.S. Department of Defense ESTCP program under Project 201336. The team would like to thank Dr. James Galvin for his leadership during the project execution. We are also very thankful to the technical support provided by Glen DeWillie and Scott Clark of HydroGeoLogic, Inc. The team gratefully acknowledges the support from the staff of Building 300 of the 171st Air Refueling Wing of the Pennsylvania Air National Guard who not only provided information and coordination assistance for the project, but also actively participated in the project, by evaluating our software.
ESTCP Final Report EW-201336 Collaborative Building Energy Management and Control 10
EXECUTIVE SUMMARY
To move the U.S. toward greater energy independence and security, the Department of Defense (DOD) seeks ways to reduce energy use intensity, electricity demand, and energy costs in its building portfolio, as required by legislation (Energy Independence and Security Act [EISA], 2007 [1]) and Executive Orders (72 FR - 39193923 and 74 FR 52117- 52127). One approach toward meeting this mandate is enhancement of building controls so they can a) minimize energy usage in response to occupancy schedules, b) utilize weather forecasts to shift loads in advance of heat and cold waves, and c) decrease expenses and increase revenue stream from the utility’s demand response (DR) programs. While building automation system (BAS) operators can readily achieve energy and cost savings for a few buildings through changes to the building controls, the task becomes much more difficult to implement across a campus of buildings. Campus-wide savings are particularly complicated because even state-of-the-art BASes are incapable of coordinating electricity demand among buildings.
To address the above mentioned issues, Siemens, in collaboration with the Carnegie Mellon University (CMU), deployed and demonstrated an innovative building energy management technology called Collaborative Building Energy Management and Control (cBEMC) at Building 300 of the 171st Air Refueling Wing of the Pennsylvania Air National Guard (PaANG) located at the Pittsburgh International Airport in Coraopolis, Pennsylvania. The objective of this demonstration was to achieve energy savings using cBEMC to implement advanced, integrated control for building cooling/heating, lighting, ventilation, and plug-load management while still providing a healthy, productive, and comfortable environment for the building occupants. Additionally, our goal was to demonstrate a dynamic DR approach to shave or shift aggregated building peak load in response to a request from the grid, microgrid, or BAS operator, through iBEMS. Finally, the project team demonstrated the feasibility of a secure integration of individual building controls to a central campus energy management center in a secure network environment. In addition to validating the effectiveness of the technology in improving energy efficiency (EE) and performing adaptive DR, the demonstration allowed the team to determine the system installation costs, identify areas of greatest savings for 1950’s-era buildings, and provide a viable transfer plan to DOD sites.
cBEMC is a vendor-independent software platform that enhances the capabilities of an existing Building Automation System (BAS) by actively engaging occupants in energy management and comfort control for their environment. These capabilities are designed to improve building EE and the ability to rapidly respond to fluctuations in the grid. In particular, the following innovations were introduced by cBEMC:
“cBEMC Controller” – a runtime software component that is integrated with BAS network and communicates with BAS server via BACnet protocol. It is also connected to a virtual private network exposing parts of its controlling functions to building occupants and facility management via Web Human-Machine Interface (HMI). cBEMC controller provides real-time methods for both occupancy-based energy management, and comfort-based building environmental control to optimize building energy efficiency and to manage DR events.
Social network-type participation of building occupants in EE and DR events. HMI for social interaction among building occupants.
ESTCP Final Report EW-201336 Collaborative Building Energy Management and Control 11
Visualization of energy centric results to promote healthy competition among building occupants for energy reduction.
Dynamic DR capability to achieve rapid target load shedding capacity in response to grid or microgrid needs.
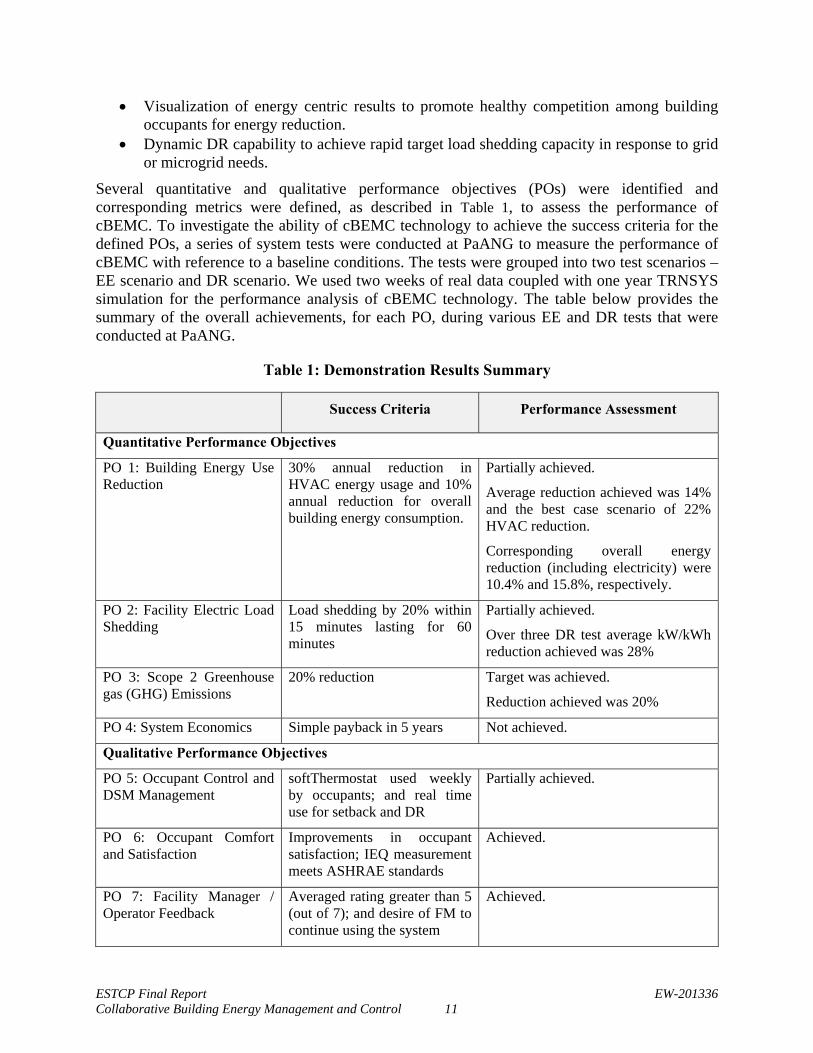
Several quantitative and qualitative performance objectives (POs) were identified and corresponding metrics were defined, as described in Table 1, to assess the performance of cBEMC. To investigate the ability of cBEMC technology to achieve the success criteria for the defined POs, a series of system tests were conducted at PaANG to measure the performance of cBEMC with reference to a baseline conditions. The tests were grouped into two test scenarios – EE scenario and DR scenario. We used two weeks of real data coupled with one year TRNSYS simulation for the performance analysis of cBEMC technology. The table below provides the summary of the overall achievements, for each PO, during various EE and DR tests that were conducted at PaANG.
Table 1: Demonstration Results Summary
Success Criteria Performance Assessment
Quantitative Performance Objectives
PO 1: Building Energy Use Reduction
30% annual reduction in HVAC energy usage and 10% annual reduction for overall building energy consumption.
Partially achieved.
Average reduction achieved was 14% and the best case scenario of 22% HVAC reduction.
Corresponding overall energy reduction (including electricity) were 10.4% and 15.8%, respectively.
PO 2: Facility Electric Load Shedding
Load shedding by 20% within 15 minutes lasting for 60 minutes
Partially achieved.
Over three DR test average kW/kWh reduction achieved was 28%
PO 3: Scope 2 Greenhouse gas (GHG) Emissions
20% reduction Target was achieved.
Reduction achieved was 20%
PO 4: System Economics Simple payback in 5 years Not achieved.
Qualitative Performance Objectives
PO 5: Occupant Control and DSM Management
softThermostat used weekly by occupants; and real time use for setback and DR
Partially achieved.
PO 6: Occupant Comfort and Satisfaction
Improvements in occupant satisfaction; IEQ measurement meets ASHRAE standards
Achieved.
PO 7: Facility Manager / Operator Feedback
Averaged rating greater than 5 (out of 7); and desire of FM to continue using the system
Achieved.

ESTCP Final Report EW-201336 Collaborative Building Energy Management and Control 12
As is common when designing and implementing control technologies that have a wide range of capabilities, field conditions are not always optimal to fully “test drive” a technology’s controls and algorithms. There were several onsite constraints because of which the team was not able to achieve some of the objectives, whereas some objectives were only partially achieved, as shown in Table 1. Details of possible reasons for not fully realizing some of the objectives are explained in section 6. It can be safely stated that in spite of several constraints, the cBEMC performed as expected most of the time. Although it was not able to achieve some of its PO’s, but was able to increase energy awareness among building occupants.
ESTCP Demonstration Plan EW-201336 Collaborative Building Energy Management and Control 13
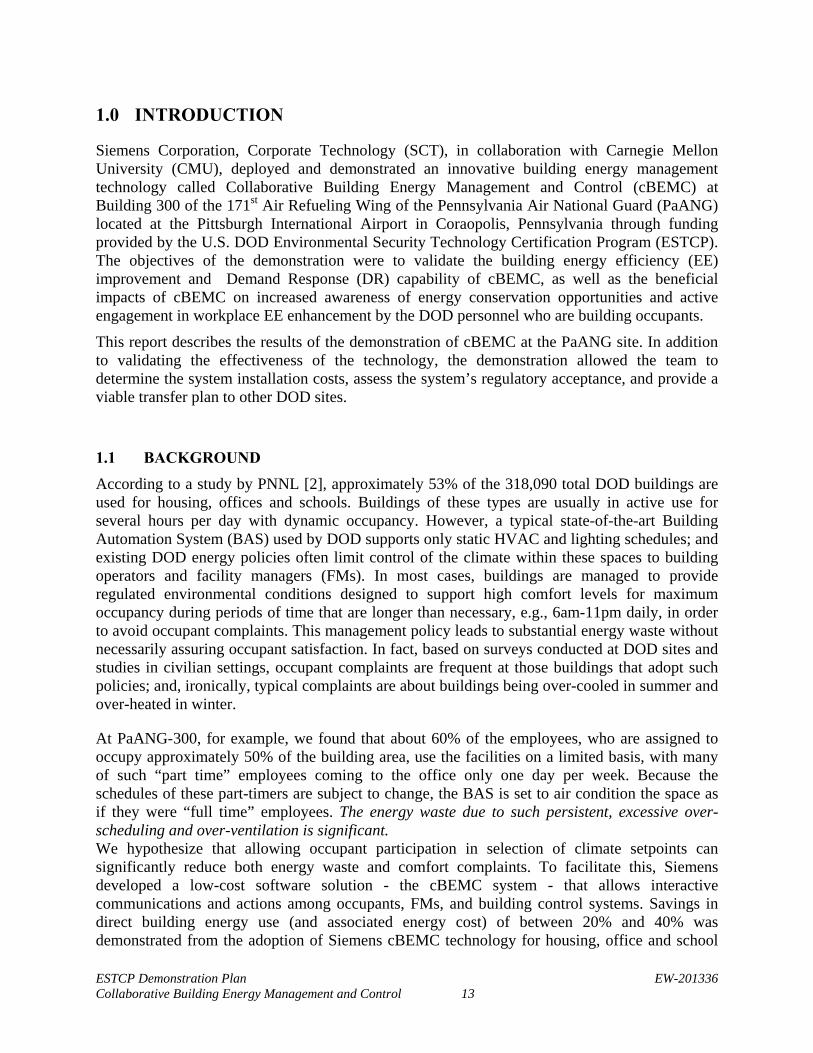
1.0 INTRODUCTION
Siemens Corporation, Corporate Technology (SCT), in collaboration with Carnegie Mellon University (CMU), deployed and demonstrated an innovative building energy management technology called Collaborative Building Energy Management and Control (cBEMC) at Building 300 of the 171st Air Refueling Wing of the Pennsylvania Air National Guard (PaANG) located at the Pittsburgh International Airport in Coraopolis, Pennsylvania through funding provided by the U.S. DOD Environmental Security Technology Certification Program (ESTCP). The objectives of the demonstration were to validate the building energy efficiency (EE) improvement and Demand Response (DR) capability of cBEMC, as well as the beneficial impacts of cBEMC on increased awareness of energy conservation opportunities and active engagement in workplace EE enhancement by the DOD personnel who are building occupants.
This report describes the results of the demonstration of cBEMC at the PaANG site. In addition to validating the effectiveness of the technology, the demonstration allowed the team to determine the system installation costs, assess the system’s regulatory acceptance, and provide a viable transfer plan to other DOD sites.
1.1 BACKGROUND
According to a study by PNNL [2], approximately 53% of the 318,090 total DOD buildings are used for housing, offices and schools. Buildings of these types are usually in active use for several hours per day with dynamic occupancy. However, a typical state-of-the-art Building Automation System (BAS) used by DOD supports only static HVAC and lighting schedules; and existing DOD energy policies often limit control of the climate within these spaces to building operators and facility managers (FMs). In most cases, buildings are managed to provide regulated environmental conditions designed to support high comfort levels for maximum occupancy during periods of time that are longer than necessary, e.g., 6am-11pm daily, in order to avoid occupant complaints. This management policy leads to substantial energy waste without necessarily assuring occupant satisfaction. In fact, based on surveys conducted at DOD sites and studies in civilian settings, occupant complaints are frequent at those buildings that adopt such policies; and, ironically, typical complaints are about buildings being over-cooled in summer and over-heated in winter.
At PaANG-300, for example, we found that about 60% of the employees, who are assigned to occupy approximately 50% of the building area, use the facilities on a limited basis, with many of such “part time” employees coming to the office only one day per week. Because the schedules of these part-timers are subject to change, the BAS is set to air condition the space as if they were “full time” employees. The energy waste due to such persistent, excessive over-scheduling and over-ventilation is significant. We hypothesize that allowing occupant participation in selection of climate setpoints can significantly reduce both energy waste and comfort complaints. To facilitate this, Siemens developed a low-cost software solution - the cBEMC system - that allows interactive communications and actions among occupants, FMs, and building control systems. Savings in direct building energy use (and associated energy cost) of between 20% and 40% was demonstrated from the adoption of Siemens cBEMC technology for housing, office and school

ESTCP Demonstration Plan EW-201336 Collaborative Building Energy Management and Control 14
types of DOD buildings [3] [4] [5]. Furthermore, the cBEMC collaborative intelligent load management function can be used to help DOD meet its energy security targets for DR agility. Moreover, use of cBEMC can enhance the productivity of both occupants and the building operator as the result of better comfort experience leading to a more productive workplace and fewer complaints. Most pertinent for ESTCP, by actively engaging building occupants in energy conservation, cBEMC specifically addresses the DOD Strategic Sustainability Performance Plan Sub-Goal 1.1 “Energy Intensity of Facilities Reduced by 30% from FY 2003 by FY 2015 and 37.5% by FY 2020” and Sub-Goal 7.2 “15% of Existing Buildings Conform to the Guiding Principles on High Performance and Sustainable Buildings By FY 2015, and Thereafter Through FY 2020.”
1.2 DRIVERS
The energy saving activities of this demonstration are aligned with legislative mandates, Executive Orders, and DOD policy.
1) Legislative Mandates: Energy Policy Act of 2005 [6], Energy Independence and Security Act of 2007:
These laws serve to move the United States toward greater energy independence and security, increased efficiency of products and buildings, and improved energy performance by the Federal Government. The technology used in this demonstration specifically addresses both Title III: Energy Savings Though Improved Standards for Appliance and Lighting and Title IV: Energy Savings in Buildings and Industry of this mandate. The core objective of this project is demonstration of cBEMC abilities to achieve energy savings by following the guidelines and regulations stipulated in the mandates and in the industry standards, such as Federal Leadership in High Performance and Sustainable Buildings, etc.
2) Executive Order 13423 of January 24, 2007: Strengthening Federal Environmental, Energy, and Transportation Management:
In compliance with this executive order, Federal agencies must conduct their environmental, transportation, and energy-related activities in an environmentally, economically, and fiscally sound manner. The technology used in this demonstration specifically addresses two subsections of Section 2 of this Executive Order:
Subsections (a) “improve energy efficiency and reduce greenhouse gas (GHG) emissions of the agency, through reduction of energy intensity by (i) 3 percent annually through the end of fiscal year 2015, or (ii) 30 percent by the end of fiscal year 2015,” and
Subsection (f) “ensure that (i) new construction and major renovation of agency buildings comply with the Guiding Principles for Federal Leadership in High Performance and Sustainable Buildings set forth in the Federal Leadership in High Performance and Sustainable Buildings Memorandum of Understanding (2006), and (ii) 15 percent of the existing Federal capital asset building inventory of the agency as of the end of fiscal year 2015.”
ESTCP Demonstration Plan EW-201336 Collaborative Building Energy Management and Control 15
3) DOD Policy: Strategic Sustainability Performance Plan, Energy Security MOU with DOE
This plan directs US military departments to execute their missions in a sustainable manner that attends to energy, environmental, safety, and occupational health considerations. Incorporating sustainability into DOD planning and decision-making ensures that current and emerging mission needs are addressed along with anticipation of future challenges. The technology used in this demonstration specifically addresses Goal 7 of this plan, “Sustainability Practices Become the Norm Sub-Goal 7.2 15% of Existing Buildings Conform to the Guiding Principles on High Performance and Sustainable Buildings By FY 2015, and Thereafter Through FY 2020.”
1.3 OBJECTIVE OF THE DEMONSTRATION
The objective of this project is to demonstrate at a DOD site the ability of a cBEMC system to empower deep occupant-engagement that can achieve ongoing building energy savings and, on command, to obtain a targeted fast load-shedding relative to baseline building total load.
Specifically, we sought 30% HVAC energy savings and 20% of electric load reduction at PaANG-300 building through the cBEMC deployment. In addition, we tested GHG emissions reduction; greater occupant control and engagement; and increased occupant comfort and satisfaction through cBEMC implementation.
As an extension of traditional BASes, cBEMC allowed collaborative building control among building occupants and FMs to determine optimal set points for BASes in order to save energy and reduce peak load. Although cBEMC technology had previously been tested and proven effective within living labs as a new, groundbreaking technology, neither its performance nor its cost had been quantified prior to this demonstration; and the new feature of load management had not been tested. Demonstration of this technology will help DOD assess the potential for the adoption of collaborative building energy management and control technology to increase energy security at its installations. In particular, the demonstration addressed application of the social media aspects of the technology within the security limitations of military environments; and it assessed the adequacy and acceptance of the HMI developed by Siemens for the technology implementation.
A cBEMC system was engineered and deployed at Building 300 of the PaANG installation at the Pittsburgh International Airport following a Level 3 energy audit of the building. The system was rolled out first for a small group of occupants and tuned for optimal performance before full-scale deployment. Before and during the testing period, comparable meter data, building control data, and feedback from occupancy interaction logs were collected; and project costs were tracked during the engineering and testing phases. Deep data analysis was conducted by SCT and CMU in accordance with ASHRAE and DOE guidelines to validate the performance, costs and benefits of the technology.
ESTCP Demonstration Plan EW-201336 Collaborative Building Energy Management and Control 16
2.0 TECHNOLOGY DESCRIPTION
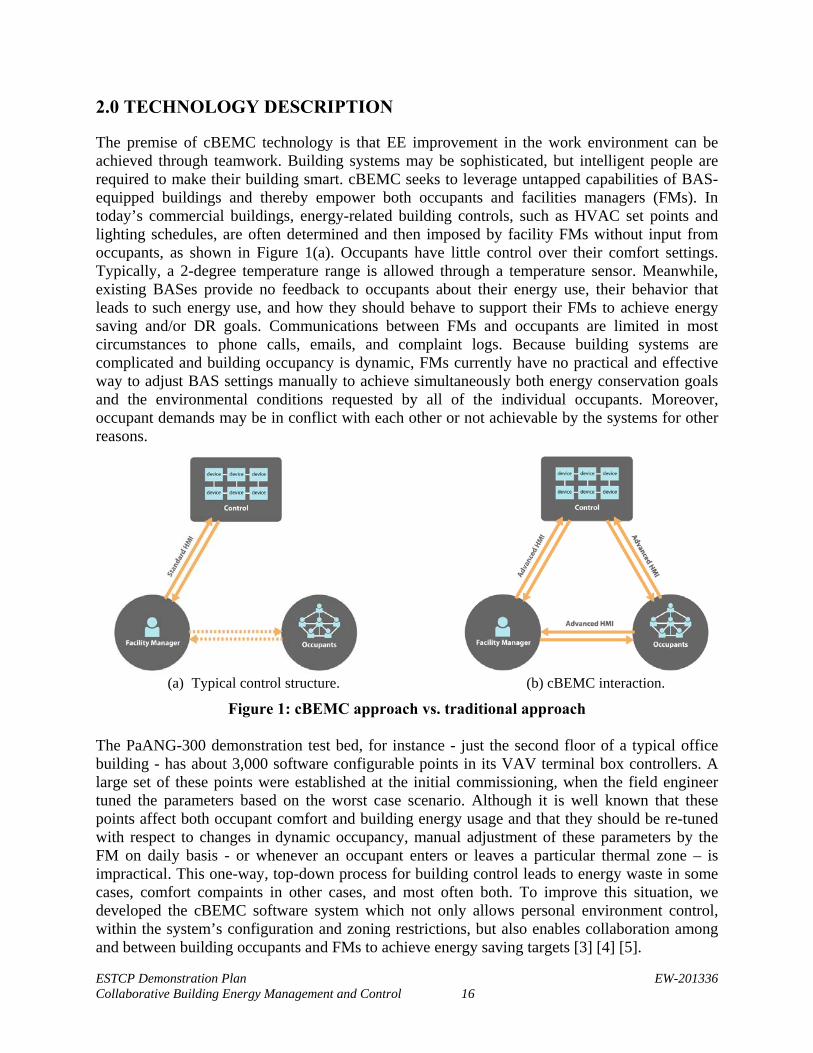
The premise of cBEMC technology is that EE improvement in the work environment can be achieved through teamwork. Building systems may be sophisticated, but intelligent people are required to make their building smart. cBEMC seeks to leverage untapped capabilities of BAS-equipped buildings and thereby empower both occupants and facilities managers (FMs). In today’s commercial buildings, energy-related building controls, such as HVAC set points and lighting schedules, are often determined and then imposed by facility FMs without input from occupants, as shown in Figure 1(a). Occupants have little control over their comfort settings. Typically, a 2-degree temperature range is allowed through a temperature sensor. Meanwhile, existing BASes provide no feedback to occupants about their energy use, their behavior that leads to such energy use, and how they should behave to support their FMs to achieve energy saving and/or DR goals. Communications between FMs and occupants are limited in most circumstances to phone calls, emails, and complaint logs. Because building systems are complicated and building occupancy is dynamic, FMs currently have no practical and effective way to adjust BAS settings manually to achieve simultaneously both energy conservation goals and the environmental conditions requested by all of the individual occupants. Moreover, occupant demands may be in conflict with each other or not achievable by the systems for other reasons.
(a) Typical control structure. (b) cBEMC interaction.
Figure 1: cBEMC approach vs. traditional approach The PaANG-300 demonstration test bed, for instance - just the second floor of a typical office building - has about 3,000 software configurable points in its VAV terminal box controllers. A large set of these points were established at the initial commissioning, when the field engineer tuned the parameters based on the worst case scenario. Although it is well known that these points affect both occupant comfort and building energy usage and that they should be re-tuned with respect to changes in dynamic occupancy, manual adjustment of these parameters by the FM on daily basis - or whenever an occupant enters or leaves a particular thermal zone – is impractical. This one-way, top-down process for building control leads to energy waste in some cases, comfort compaints in other cases, and most often both. To improve this situation, we developed the cBEMC software system which not only allows personal environment control, within the system’s configuration and zoning restrictions, but also enables collaboration among and between building occupants and FMs to achieve energy saving targets [3] [4] [5].
ESTCP Demonstration Plan EW-201336 Collaborative Building Energy Management and Control 17
Figure 1(b) depicts the concept of our cBEMC system: occupants can directly submit their comfort preferences and schedules to the building control system while the FM can configure energy policy as a set of rules. The building control system detects and resolves conflicts, and continuously applies energy optimization algorithms to generate automatically a configuration of set points designed to achieve maximum energy savings and peak load reductions. Specifically, the cBEMC platform achieves energy savings and efficient DR using the following innovative functions unavailable in existing systems: (1) Occupancy registration: collection of occupant schedules by using an interactive web interface. (2) Arbitration: mediation of temperature set points and occupant preferences.
2.1 TECHNOLOGY OVERVIEW
2.1.1 cBEMC Architecture
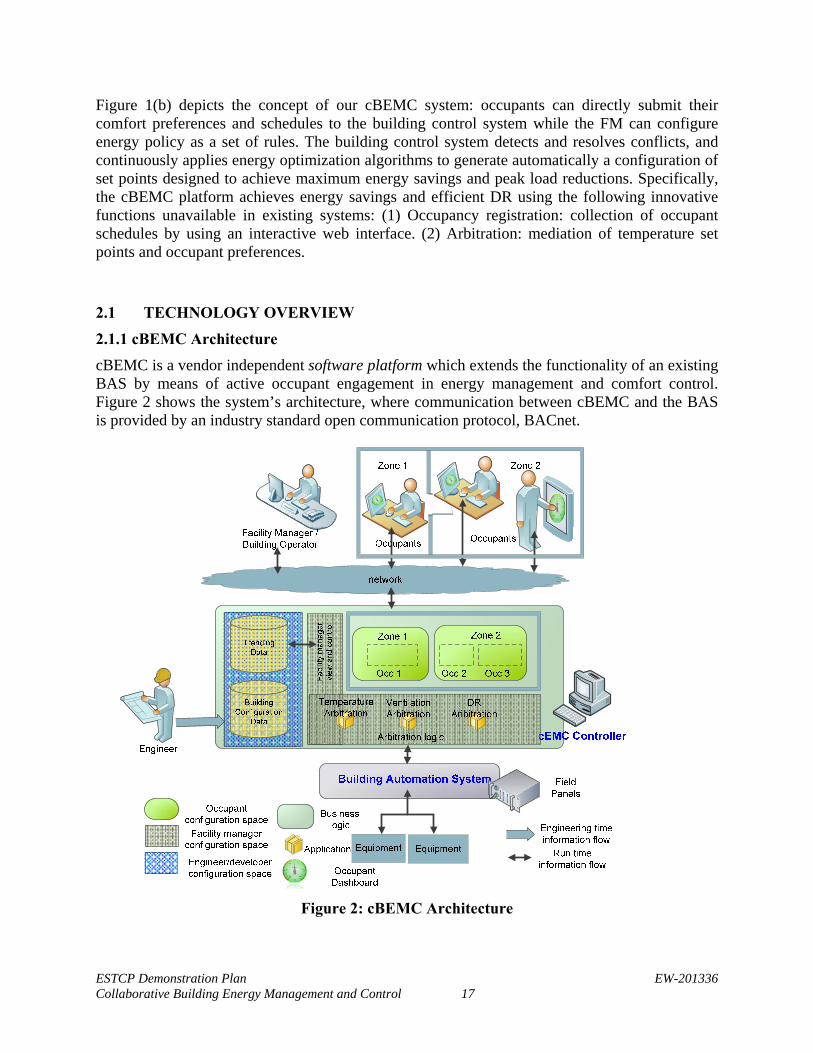
cBEMC is a vendor independent software platform which extends the functionality of an existing BAS by means of active occupant engagement in energy management and comfort control. Figure 2 shows the system’s architecture, where communication between cBEMC and the BAS is provided by an industry standard open communication protocol, BACnet.
Figure 2: cBEMC Architecture
ESTCP Demonstration Plan EW-201336 Collaborative Building Energy Management and Control 18
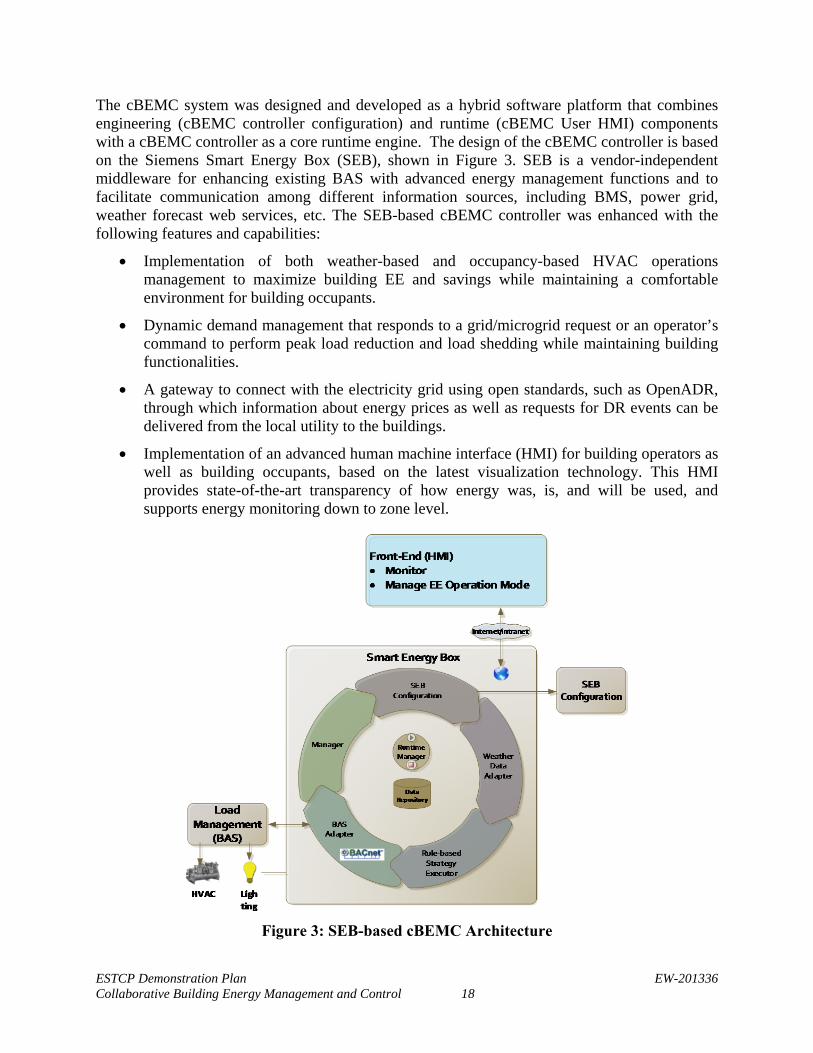
The cBEMC system was designed and developed as a hybrid software platform that combines engineering (cBEMC controller configuration) and runtime (cBEMC User HMI) components with a cBEMC controller as a core runtime engine. The design of the cBEMC controller is based on the Siemens Smart Energy Box (SEB), shown in Figure 3. SEB is a vendor-independent middleware for enhancing existing BAS with advanced energy management functions and to facilitate communication among different information sources, including BMS, power grid, weather forecast web services, etc. The SEB-based cBEMC controller was enhanced with the following features and capabilities:
Implementation of both weather-based and occupancy-based HVAC operations management to maximize building EE and savings while maintaining a comfortable environment for building occupants.
Dynamic demand management that responds to a grid/microgrid request or an operator’s command to perform peak load reduction and load shedding while maintaining building functionalities.
A gateway to connect with the electricity grid using open standards, such as OpenADR, through which information about energy prices as well as requests for DR events can be delivered from the local utility to the buildings.
Implementation of an advanced human machine interface (HMI) for building operators as well as building occupants, based on the latest visualization technology. This HMI provides state-of-the-art transparency of how energy was, is, and will be used, and supports energy monitoring down to zone level.
Figure 3: SEB-based cBEMC Architecture
ESTCP Demonstration Plan EW-201336 Collaborative Building Energy Management and Control 19
At the center of the cBEMC system is a device called the “cBEMC Controller,” which sits on the network to interconnect building occupants, the FMs, and the BAS. The cBEMC Controller applies techniques for both occupancy-based energy management and micro-zoning building environmental control to maximize or optimize building EE and to manage occupant-engaged DR events. The details of these technology implementations are presented in section 2.2. The collaborative HMIs which provide monitoring and controlling functionality for occupants and building operators are called the “Occupant Dashboard” and the “FM Dashboard” respectively. Occupant and FM Dashboards communicate with the cBEMC controller based on standard web technology through a BACnet.
The dashboards provide holistic views for both occupants and the building operator to see detailed aspects of their environmental conditions and summary information regarding both themselves and their colleagues’ individual/aggregated/competitive energy performance from an EE perspective and during a DR event. In addition, occupants can directly submit their personal comfort needs, provide their in/out-of-office schedule, and state their DR preferences by using their Occupant Dashboards. Simultaneously, the FM can manage and respond to such occupant requests, can configure energy policy as rules to control cBEMC and the BAS, and can issue DR commands from the FM Dashboard. With the information or requests received from the Occupant Dashboards and the rules established through the FM Dashboard, the cBEMC controller makes decisions about BAS set points by resolving conflicts among and between multiple occupants and the FM, within the context of optimizing building energy performance. cBEMC decision making process involves three categories of control logics: temperature arbitration, ventilation arbitration, and DR arbitration. The arbitration logics in the cBEMC controller can be configured for different building operation status modes, e.g., EE or DR.
The same collaborative Occupant and FM Dashboards facilitate ongoing dialogs and group communication between the FM and occupants, and among occupants themselves. Social networking is adopted to enhance the quality and timeliness of communication as well as to prompt energy conservation behaviors through peer pressure, competition, and the establishment of cultural norms. Although, due to security restrictions, we were not allowed to integrate full-featured external social network engines at PaANG, the embedded social network functions were sufficient for evaluation of the Performance Objectives for this demonstration.
2.1.2 cBEMC Controller
The cBEMC Controller (the “Controller”) integrates Occupant Dashboards, FM Dashboards, and the BAS. The Controller applies both occupancy-based energy management and comfort-based building environmental control to maximize building EE and DR capacities. Algorithms of the Controller integrate modules that address three key logic issues: temperature arbitration, demand controlled ventilation (DCV), and DR arbitration.
Configuration
At the design level, the Controller can be configured to provide site-specific, as well as default, settings to enhance BAS equipment such as AHUs, chillers, boilers, and VAV controllers by enabling EE control strategies. Also, using the same configuration mechanism, information that is building-specific, related to strategies for energy use and conservation, pertinent for network
ESTCP Demonstration Plan EW-201336 Collaborative Building Energy Management and Control 20
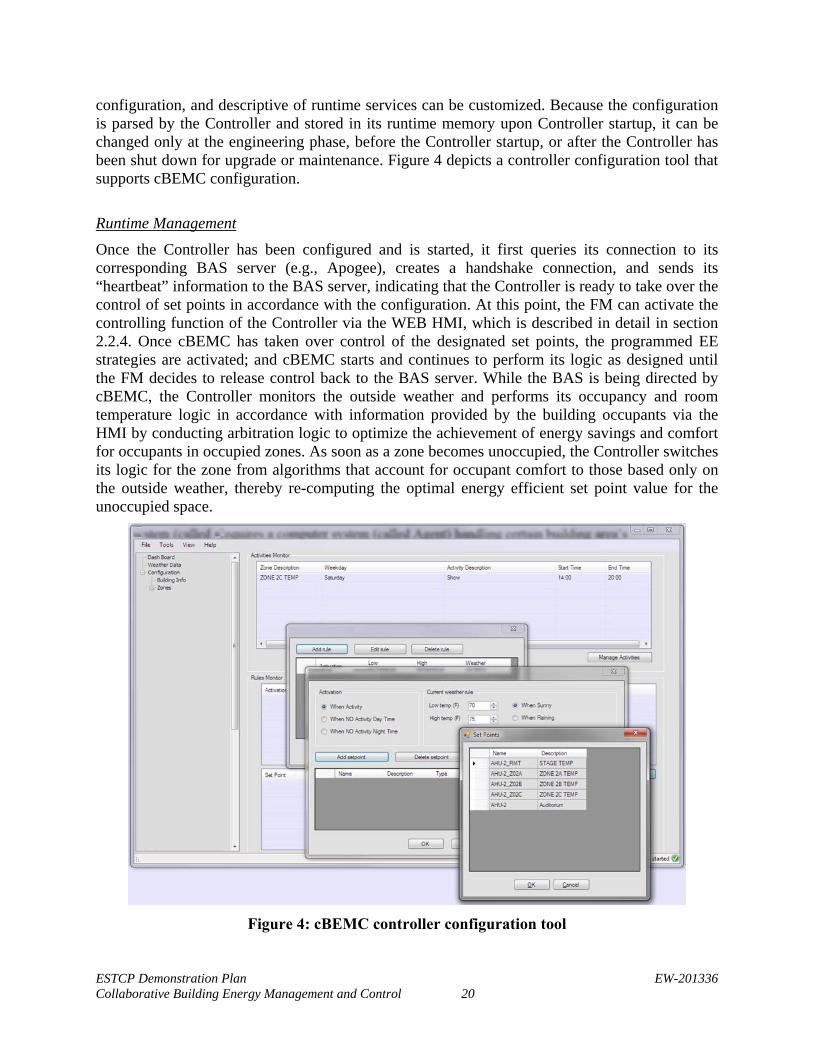
configuration, and descriptive of runtime services can be customized. Because the configuration is parsed by the Controller and stored in its runtime memory upon Controller startup, it can be changed only at the engineering phase, before the Controller startup, or after the Controller has been shut down for upgrade or maintenance. Figure 4 depicts a controller configuration tool that supports cBEMC configuration.
Runtime Management
Once the Controller has been configured and is started, it first queries its connection to its corresponding BAS server (e.g., Apogee), creates a handshake connection, and sends its “heartbeat” information to the BAS server, indicating that the Controller is ready to take over the control of set points in accordance with the configuration. At this point, the FM can activate the controlling function of the Controller via the WEB HMI, which is described in detail in section 2.2.4. Once cBEMC has taken over control of the designated set points, the programmed EE strategies are activated; and cBEMC starts and continues to perform its logic as designed until the FM decides to release control back to the BAS server. While the BAS is being directed by cBEMC, the Controller monitors the outside weather and performs its occupancy and room temperature logic in accordance with information provided by the building occupants via the HMI by conducting arbitration logic to optimize the achievement of energy savings and comfort for occupants in occupied zones. As soon as a zone becomes unoccupied, the Controller switches its logic for the zone from algorithms that account for occupant comfort to those based only on the outside weather, thereby re-computing the optimal energy efficient set point value for the unoccupied space.
Figure 4: cBEMC controller configuration tool
ESTCP Demonstration Plan EW-201336 Collaborative Building Energy Management and Control 21
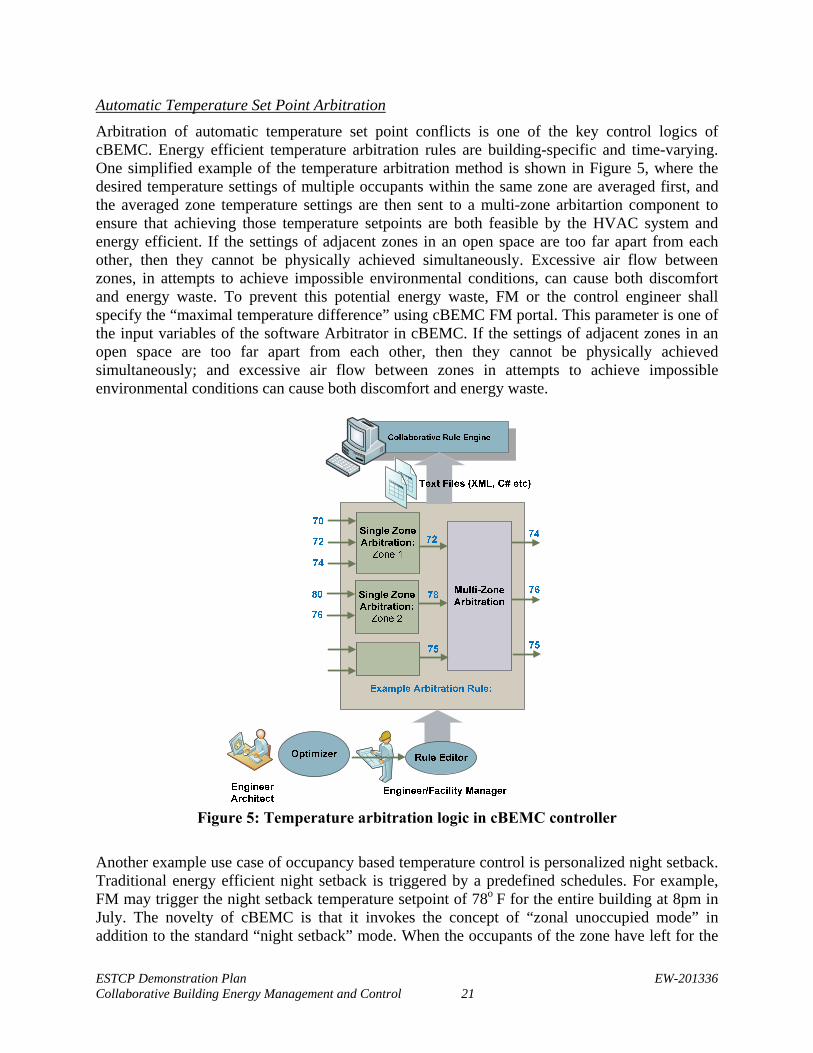
Automatic Temperature Set Point Arbitration
Arbitration of automatic temperature set point conflicts is one of the key control logics of cBEMC. Energy efficient temperature arbitration rules are building-specific and time-varying. One simplified example of the temperature arbitration method is shown in Figure 5, where the desired temperature settings of multiple occupants within the same zone are averaged first, and the averaged zone temperature settings are then sent to a multi-zone arbitartion component to ensure that achieving those temperature setpoints are both feasible by the HVAC system and energy efficient. If the settings of adjacent zones in an open space are too far apart from each other, then they cannot be physically achieved simultaneously. Excessive air flow between zones, in attempts to achieve impossible environmental conditions, can cause both discomfort and energy waste. To prevent this potential energy waste, FM or the control engineer shall specify the “maximal temperature difference” using cBEMC FM portal. This parameter is one of the input variables of the software Arbitrator in cBEMC. If the settings of adjacent zones in an open space are too far apart from each other, then they cannot be physically achieved simultaneously; and excessive air flow between zones in attempts to achieve impossible environmental conditions can cause both discomfort and energy waste.
Figure 5: Temperature arbitration logic in cBEMC controller
Another example use case of occupancy based temperature control is personalized night setback. Traditional energy efficient night setback is triggered by a predefined schedules. For example, FM may trigger the night setback temperature setpoint of 78o F for the entire building at 8pm in July. The novelty of cBEMC is that it invokes the concept of “zonal unoccupied mode” in addition to the standard “night setback” mode. When the occupants of the zone have left for the

ESTCP Demonstration Plan EW-201336 Collaborative Building Energy Management and Control 22
day at 4pm, the cBEMC control logic sets VAV controller of that zone to a “Zonal Unoccupied Mode”, which does not exist in traditional HVAC systemst. The Zonal Unoccupied Mode strategy commands a combination of three values: a weather and occupancy-dependent value for the room temperature set point, minimum air flow rate and the reheat coil value, to reduce or temporarily disable VAV logic, thus allowing to save energy for the unoccupied space of the building. Software-based Occupancy Detection
An innovative feature of cBEMC is the volunteer-based software oriented occupancy detection approach. The innovation is not the feature of a single component, but a system design philosophy that is supported globally by all components. The vision is to engage occupants as sensors and actuators, which is a radically different perspective. This vision is supported by many detailed designs in our cBEMC system:
The user interface reveals more occupant specific information. Occupants can not only observe their own energy impacts to the whole building, but can also observe their co-workers’ energy impacts.
The HMI allows the cBEMC to estimate the HVAC energy consumptions for individual zone, which was not feasible before.
The social network and whole building energy performance dashboards creates inviting energy game environments.
All of the aforementioned methods are pure software-based approaches, without requirements for additional hardware sensors. Hardware occupancy sensors often require significant engineering efforts to install on existing buildings, therefore have long payback periods.
With these combined innovations, cBEMC is designed to engage occupants in the control loop. We can then employ cost effective, pure software-based approach to enable occupancy-based HVAC control.
Demand Controlled Ventilation
Demand controlled ventilation provides other opportunities for energy savings. According to the ASHRAE 62.1-2013 standard, commercial buildings shall provide 5 CFM of fresh air for each occupant. However, using today’s technologies, hardware occupancy sensors, typically IR occupancy sensors that register whether or not anybody is present, are either not capable of counting the number of occupants or, as with camera-based occupancy sensors, are very costly and raise privacy issues. The software based occupancy detection reduced deployment costs for our cBEMC system.
The occupant-engaged DCV logic is split into two parts and implemented in both cBEMC and Apogee, using C# and Powers Process Control Language (PPCL) respectively. The rationale for splitting the logic in this manner is to achieve reliability and speed. As shown in Figure 6, based on calendar aggregation, cBEMC estimates the total number of occupants as well as the number of occupants in each zone for controlling the ventilation. Based on this information, cBEMC calculates the minimal requirements for outdoor air intake based on the ASHRAE 62.1 standard. The LEED standard suggests 30% over-ventilation in cases of unbalanced occupancy rates in
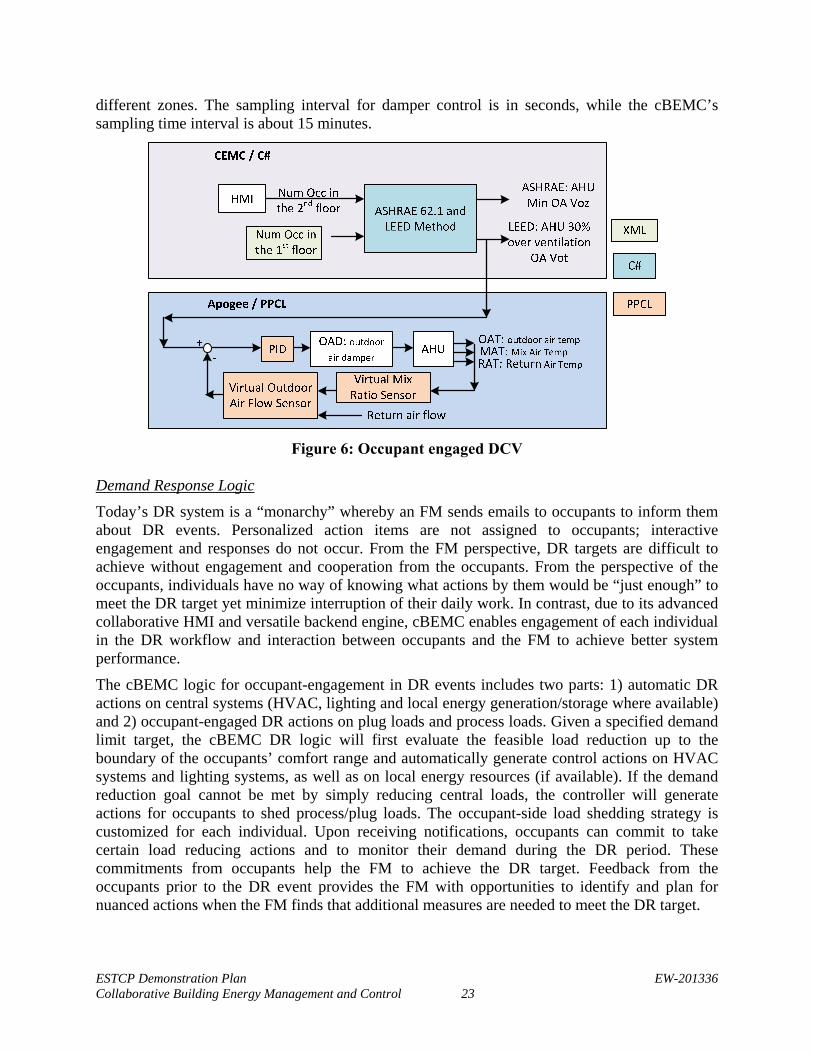
ESTCP Demonstration Plan EW-201336 Collaborative Building Energy Management and Control 23
different zones. The sampling interval for damper control is in seconds, while the cBEMC’s sampling time interval is about 15 minutes.
Figure 6: Occupant engaged DCV
Demand Response Logic
Today’s DR system is a “monarchy” whereby an FM sends emails to occupants to inform them about DR events. Personalized action items are not assigned to occupants; interactive engagement and responses do not occur. From the FM perspective, DR targets are difficult to achieve without engagement and cooperation from the occupants. From the perspective of the occupants, individuals have no way of knowing what actions by them would be “just enough” to meet the DR target yet minimize interruption of their daily work. In contrast, due to its advanced collaborative HMI and versatile backend engine, cBEMC enables engagement of each individual in the DR workflow and interaction between occupants and the FM to achieve better system performance.
The cBEMC logic for occupant-engagement in DR events includes two parts: 1) automatic DR actions on central systems (HVAC, lighting and local energy generation/storage where available) and 2) occupant-engaged DR actions on plug loads and process loads. Given a specified demand limit target, the cBEMC DR logic will first evaluate the feasible load reduction up to the boundary of the occupants’ comfort range and automatically generate control actions on HVAC systems and lighting systems, as well as on local energy resources (if available). If the demand reduction goal cannot be met by simply reducing central loads, the controller will generate actions for occupants to shed process/plug loads. The occupant-side load shedding strategy is customized for each individual. Upon receiving notifications, occupants can commit to take certain load reducing actions and to monitor their demand during the DR period. These commitments from occupants help the FM to achieve the DR target. Feedback from the occupants prior to the DR event provides the FM with opportunities to identify and plan for nuanced actions when the FM finds that additional measures are needed to meet the DR target.
ESTCP Demonstration Plan EW-201336 Collaborative Building Energy Management and Control 24
From the occupants’ perspectives, cBEMC allows the DR information to be much more transparent and makes planned actions less disruptive in comparison to the current practice of using a one-way announcement. In the cBEMC DR scenarios, occupants receive individual action items that are executable, predictable, measurable, and result in visual feedback. With better understanding of the DR event, occupants can minimize disturbance to their work while cooperating with the FM to achieve the DR target.
2.1.3 Chronological Summary
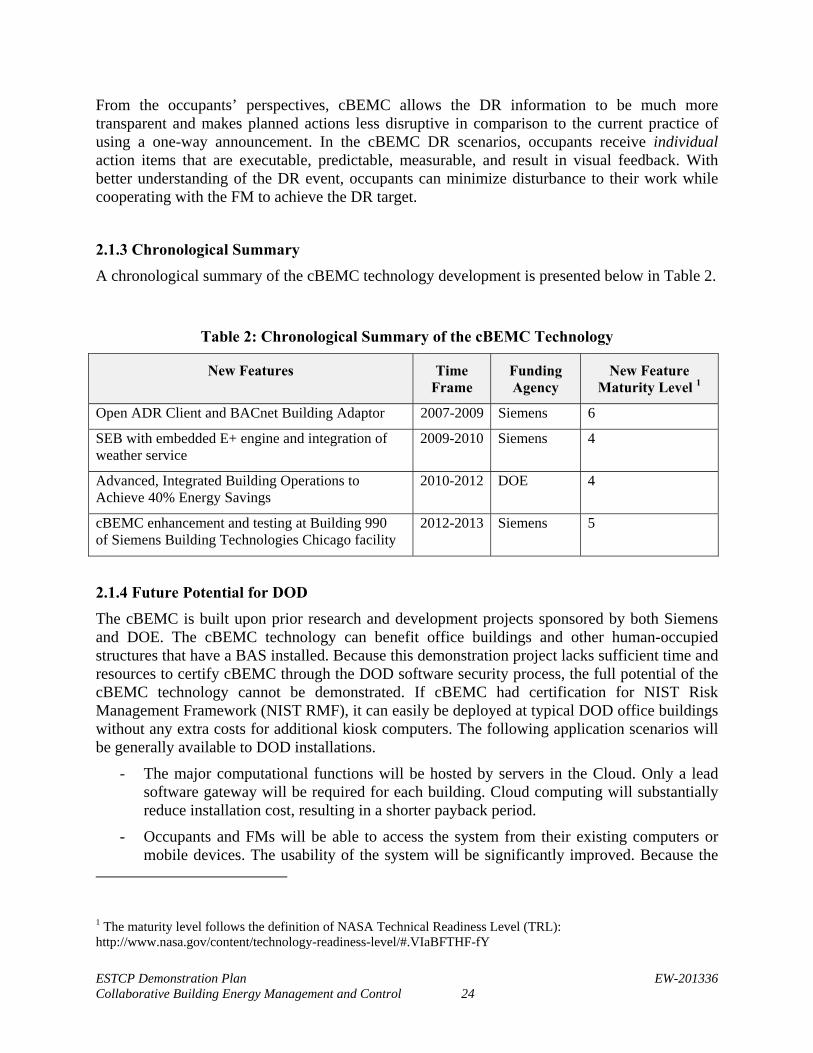
A chronological summary of the cBEMC technology development is presented below in Table 2.
Table 2: Chronological Summary of the cBEMC Technology
New Features Time Frame
Funding Agency
New Feature Maturity Level 1
Open ADR Client and BACnet Building Adaptor 2007-2009 Siemens 6
SEB with embedded E+ engine and integration of weather service
2009-2010 Siemens 4
Advanced, Integrated Building Operations to Achieve 40% Energy Savings
2010-2012 DOE 4
cBEMC enhancement and testing at Building 990 of Siemens Building Technologies Chicago facility
2012-2013 Siemens 5
2.1.4 Future Potential for DOD
The cBEMC is built upon prior research and development projects sponsored by both Siemens and DOE. The cBEMC technology can benefit office buildings and other human-occupied structures that have a BAS installed. Because this demonstration project lacks sufficient time and resources to certify cBEMC through the DOD software security process, the full potential of the cBEMC technology cannot be demonstrated. If cBEMC had certification for NIST Risk Management Framework (NIST RMF), it can easily be deployed at typical DOD office buildings without any extra costs for additional kiosk computers. The following application scenarios will be generally available to DOD installations.
- The major computational functions will be hosted by servers in the Cloud. Only a lead software gateway will be required for each building. Cloud computing will substantially reduce installation cost, resulting in a shorter payback period.
- Occupants and FMs will be able to access the system from their existing computers or mobile devices. The usability of the system will be significantly improved. Because the
1 The maturity level follows the definition of NASA Technical Readiness Level (TRL): http://www.nasa.gov/content/technology-readiness-level/#.VIaBFTHF-fY
ESTCP Demonstration Plan EW-201336 Collaborative Building Energy Management and Control 25
installation for the demonstration requires that multiple occupants share one kiosk to access cBEMC, the system’s full potential has not yet been explored.
- When building operation data are transmitted to the Cloud, cBEMC will provide access to additional innovative Business Analytic applications, such as those for asset management and fault detection.
- Purely software-based, the cBEMC cloud-ready solution is already among the highest return of investment (ROI) solutions for EE and DR problems.
2.2 TECHNOLOGY DEVELOPMENT
During the course of the project, SEB functionality was extended by the addition of several modules with new functions and an enhanced HMI to implement cBEMC technology. The demonstration implemented new modules for occupant-collaboration-based EE and DR management. Furthermore, SEB HMI was enhanced to provide holistic, building-wide energy monitoring and control interfaces for building operators and FMs. The following sections describe the new components of SEB for cBEMC in details.
2.2.1 Demand Response Logic
This component has already been explained earlier in section 2.1.2.
2.2.2 Social Network Integration
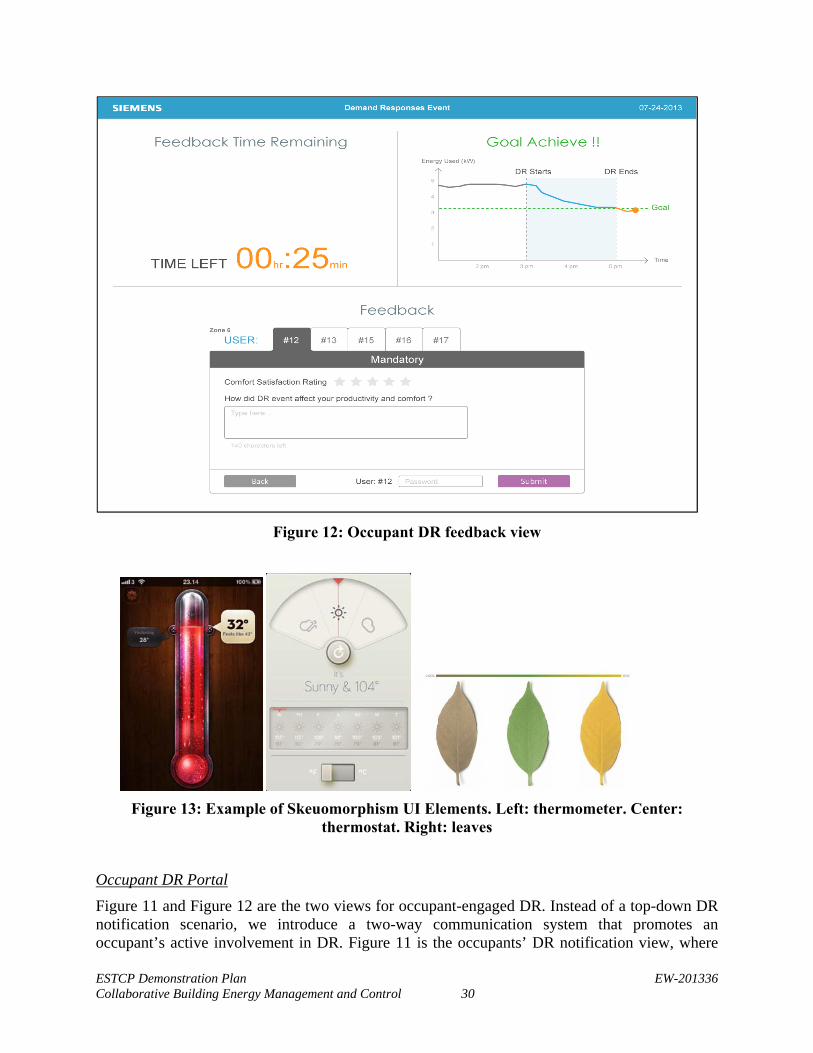
Social networking capability is an important feature in cBEMC for facilitating communication and collaboration among and between occupants and building operators/FMs. It also enables applications such as occupants’ comfort voting, and it facilitates implementation of demand management by the FM. We designed and implemented a private social network for both EE and DR scenarios, which are illustrated in Figure 12 and Figure 17. Occupants and FMs can exchange their opinions on building performance and control issues via an internal social networking engine we developed. For example, if one occupant feels the zone temperature set point after arbitration is still too hot, he/she can send messages to colleagues in the adjacent zone, or complaints to the FM. In addition, the private social network is a platform for social gaming to prompt energy savings. As shown in Figure 10, occupants are aware of the ranking of energy saving zones which may motivate them to compete to win the energy saving game.
2.2.3 Collaborative HMI
We designed and developed the Advanced HMIs for building collaborative control that allows interactive communications and collaborations among and between occupants and facilities managers to refine energy policies in ways that optimize energy saving and improve occupants’ comfort. The resulting Occupant Dashboard includes a “softThermostat” and a DR portal. The softThermostat allows occupants to set up their comfort preference as a range, input their out-of-office schedules, command their desired zone temperature settings, and monitor their
ESTCP Demonstration Plan EW-201336 Collaborative Building Energy Management and Control 26
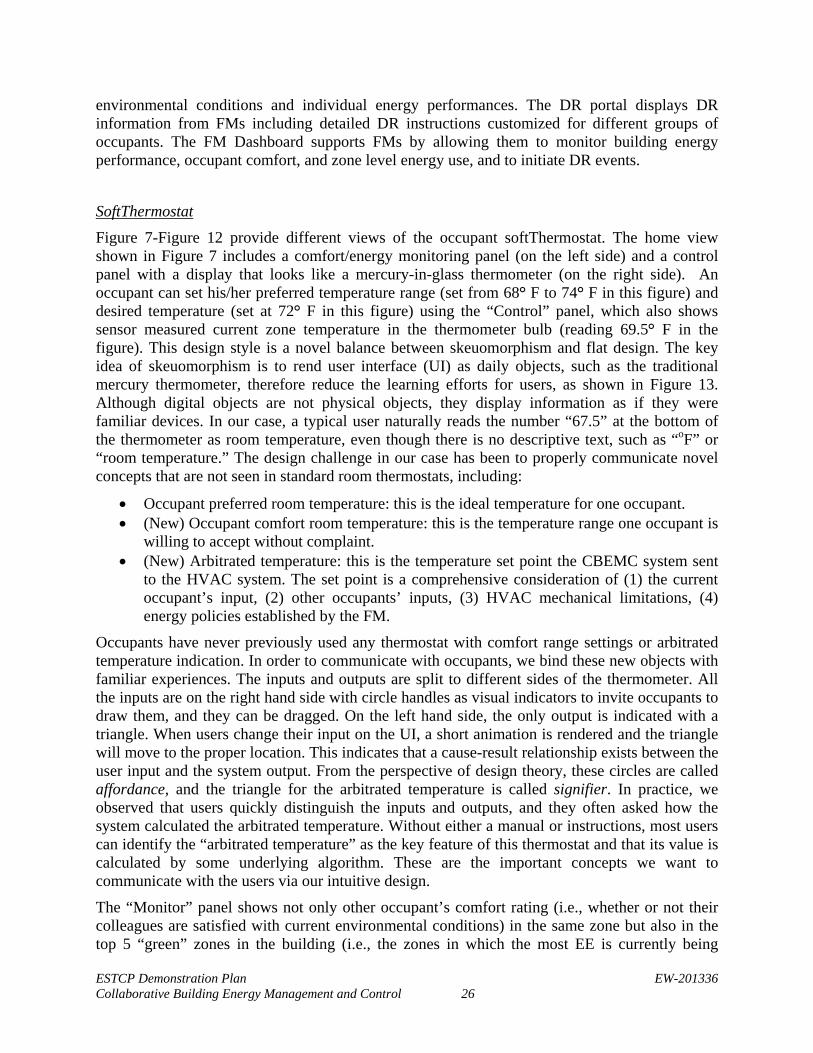
environmental conditions and individual energy performances. The DR portal displays DR information from FMs including detailed DR instructions customized for different groups of occupants. The FM Dashboard supports FMs by allowing them to monitor building energy performance, occupant comfort, and zone level energy use, and to initiate DR events. SoftThermostat
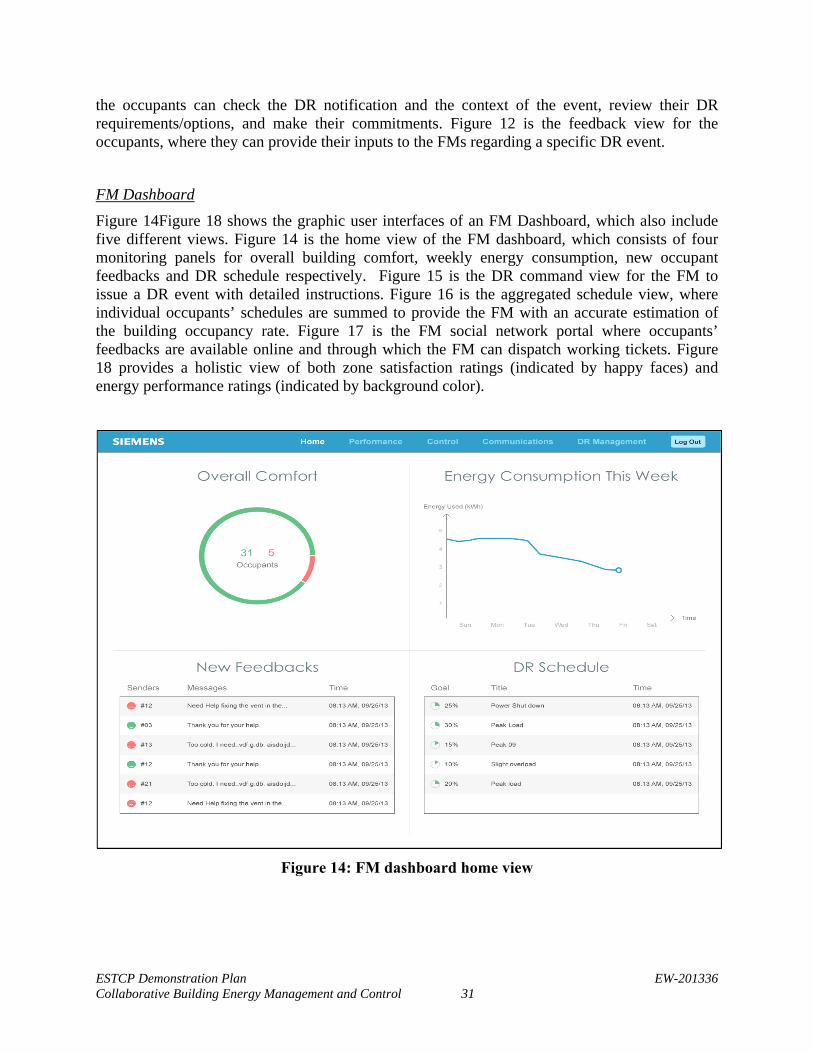
Figure 7-Figure 12 provide different views of the occupant softThermostat. The home view shown in Figure 7 includes a comfort/energy monitoring panel (on the left side) and a control panel with a display that looks like a mercury-in-glass thermometer (on the right side). An occupant can set his/her preferred temperature range (set from 68° F to 74° F in this figure) and desired temperature (set at 72° F in this figure) using the “Control” panel, which also shows sensor measured current zone temperature in the thermometer bulb (reading 69.5° F in the figure). This design style is a novel balance between skeuomorphism and flat design. The key idea of skeuomorphism is to rend user interface (UI) as daily objects, such as the traditional mercury thermometer, therefore reduce the learning efforts for users, as shown in Figure 13. Although digital objects are not physical objects, they display information as if they were familiar devices. In our case, a typical user naturally reads the number “67.5” at the bottom of the thermometer as room temperature, even though there is no descriptive text, such as “oF” or “room temperature.” The design challenge in our case has been to properly communicate novel concepts that are not seen in standard room thermostats, including:
Occupant preferred room temperature: this is the ideal temperature for one occupant. (New) Occupant comfort room temperature: this is the temperature range one occupant is
willing to accept without complaint. (New) Arbitrated temperature: this is the temperature set point the CBEMC system sent
to the HVAC system. The set point is a comprehensive consideration of (1) the current occupant’s input, (2) other occupants’ inputs, (3) HVAC mechanical limitations, (4) energy policies established by the FM.
Occupants have never previously used any thermostat with comfort range settings or arbitrated temperature indication. In order to communicate with occupants, we bind these new objects with familiar experiences. The inputs and outputs are split to different sides of the thermometer. All the inputs are on the right hand side with circle handles as visual indicators to invite occupants to draw them, and they can be dragged. On the left hand side, the only output is indicated with a triangle. When users change their input on the UI, a short animation is rendered and the triangle will move to the proper location. This indicates that a cause-result relationship exists between the user input and the system output. From the perspective of design theory, these circles are called affordance, and the triangle for the arbitrated temperature is called signifier. In practice, we observed that users quickly distinguish the inputs and outputs, and they often asked how the system calculated the arbitrated temperature. Without either a manual or instructions, most users can identify the “arbitrated temperature” as the key feature of this thermostat and that its value is calculated by some underlying algorithm. These are the important concepts we want to communicate with the users via our intuitive design.
The “Monitor” panel shows not only other occupant’s comfort rating (i.e., whether or not their colleagues are satisfied with current environmental conditions) in the same zone but also in the top 5 “green” zones in the building (i.e., the zones in which the most EE is currently being
ESTCP Demonstration Plan EW-201336 Collaborative Building Energy Management and Control 27
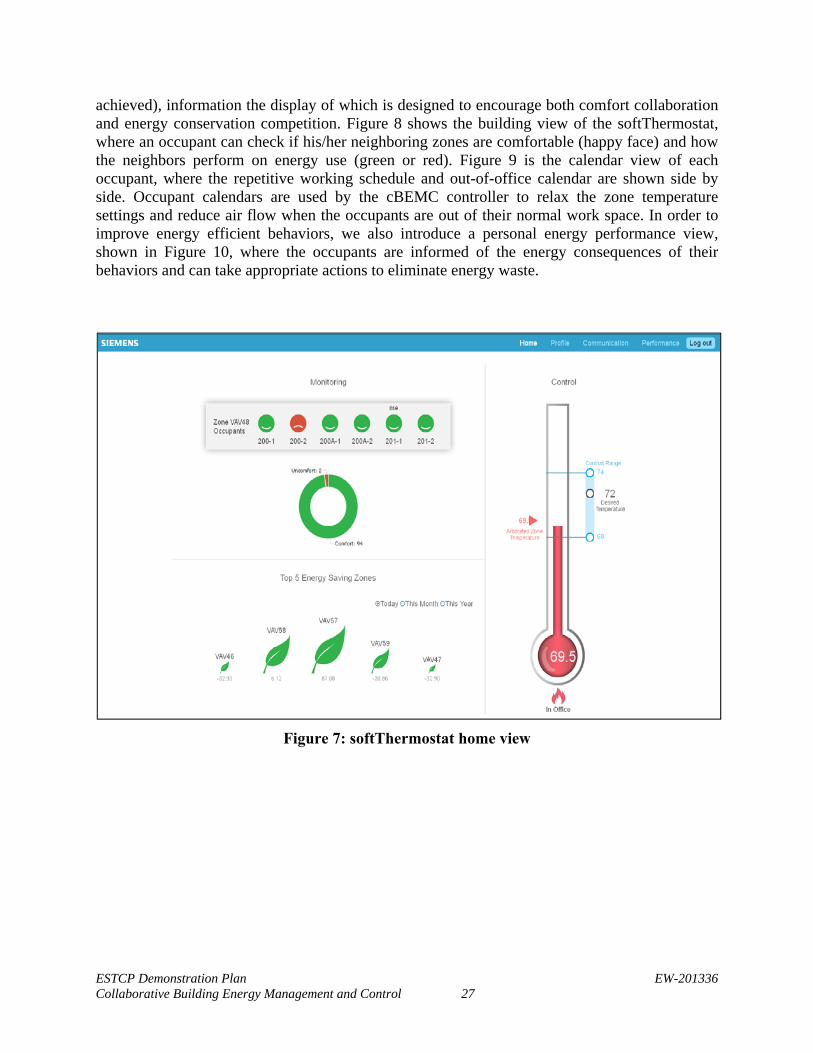
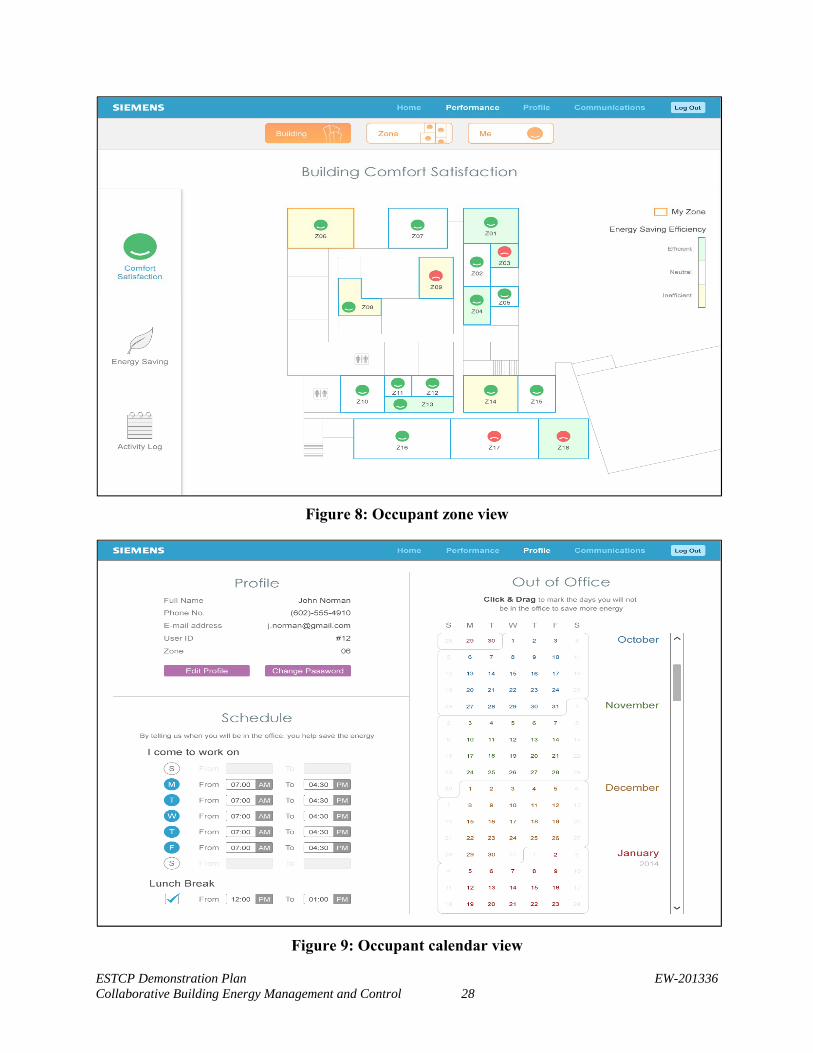
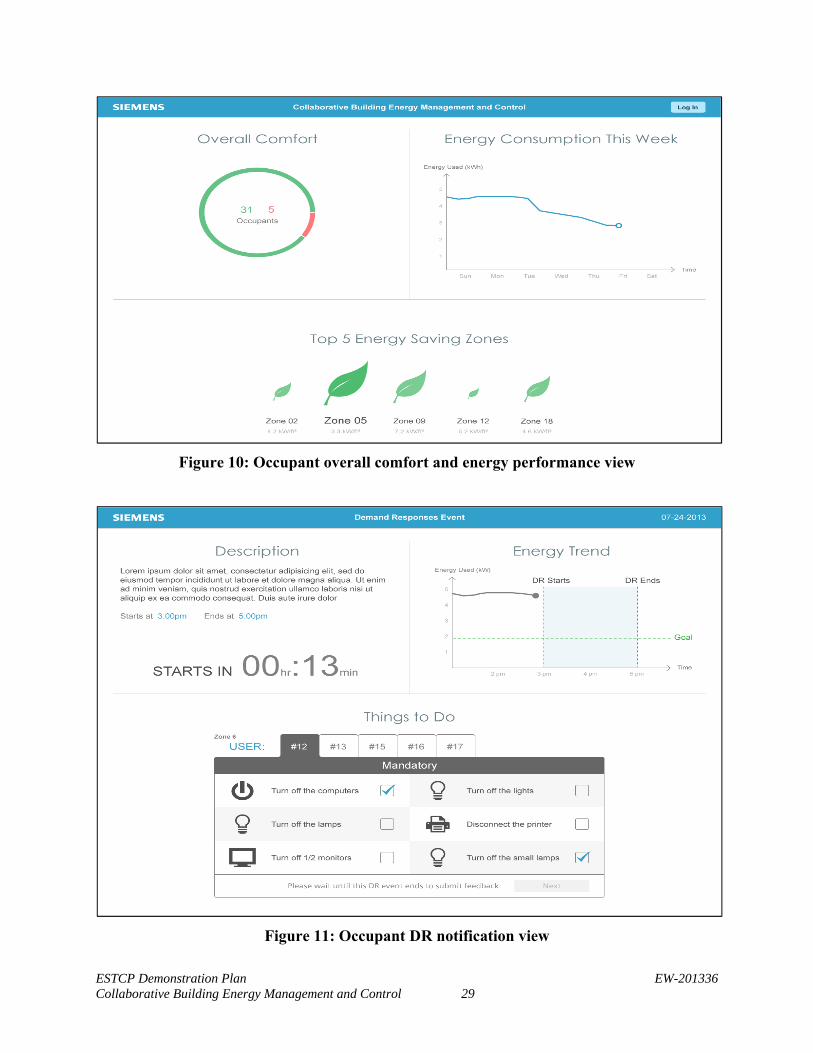
achieved), information the display of which is designed to encourage both comfort collaboration and energy conservation competition. Figure 8 shows the building view of the softThermostat, where an occupant can check if his/her neighboring zones are comfortable (happy face) and how the neighbors perform on energy use (green or red). Figure 9 is the calendar view of each occupant, where the repetitive working schedule and out-of-office calendar are shown side by side. Occupant calendars are used by the cBEMC controller to relax the zone temperature settings and reduce air flow when the occupants are out of their normal work space. In order to improve energy efficient behaviors, we also introduce a personal energy performance view, shown in Figure 10, where the occupants are informed of the energy consequences of their behaviors and can take appropriate actions to eliminate energy waste.
Figure 7: softThermostat home view
ESTCP Demonstration Plan EW-201336 Collaborative Building Energy Management and Control 28
Figure 8: Occupant zone view
Figure 9: Occupant calendar view
ESTCP Demonstration Plan EW-201336 Collaborative Building Energy Management and Control 29
Figure 10: Occupant overall comfort and energy performance view
Figure 11: Occupant DR notification view
ESTCP Demonstration Plan EW-201336 Collaborative Building Energy Management and Control 30
Figure 12: Occupant DR feedback view
Figure 13: Example of Skeuomorphism UI Elements. Left: thermometer. Center:
thermostat. Right: leaves
Occupant DR Portal
Figure 11 and Figure 12 are the two views for occupant-engaged DR. Instead of a top-down DR notification scenario, we introduce a two-way communication system that promotes an occupant’s active involvement in DR. Figure 11 is the occupants’ DR notification view, where
ESTCP Demonstration Plan EW-201336 Collaborative Building Energy Management and Control 31
the occupants can check the DR notification and the context of the event, review their DR requirements/options, and make their commitments. Figure 12 is the feedback view for the occupants, where they can provide their inputs to the FMs regarding a specific DR event.
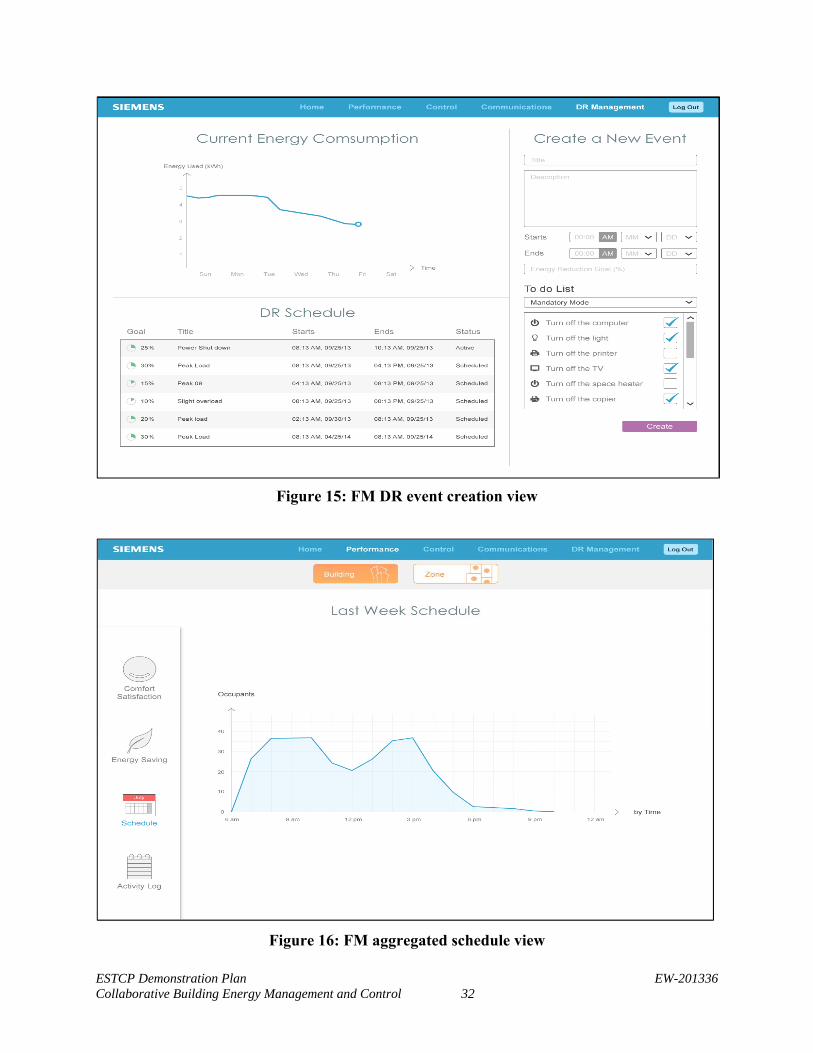
FM Dashboard
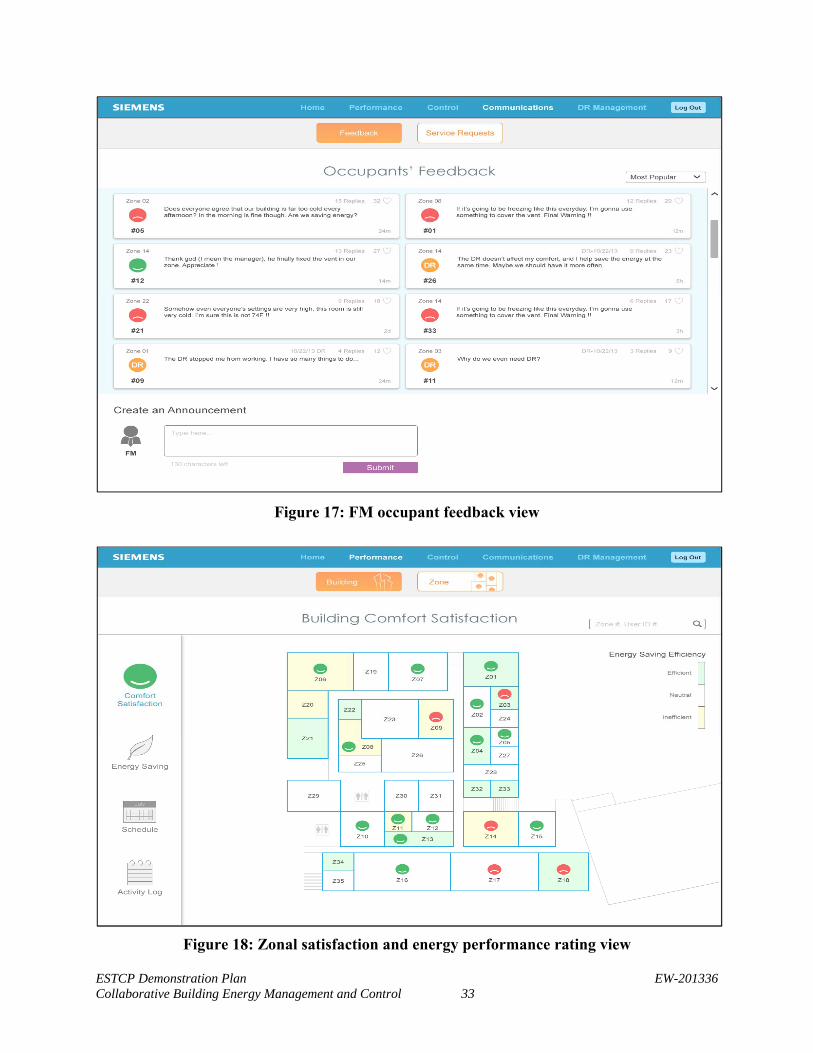
Figure 14Figure 18 shows the graphic user interfaces of an FM Dashboard, which also include five different views. Figure 14 is the home view of the FM dashboard, which consists of four monitoring panels for overall building comfort, weekly energy consumption, new occupant feedbacks and DR schedule respectively. Figure 15 is the DR command view for the FM to issue a DR event with detailed instructions. Figure 16 is the aggregated schedule view, where individual occupants’ schedules are summed to provide the FM with an accurate estimation of the building occupancy rate. Figure 17 is the FM social network portal where occupants’ feedbacks are available online and through which the FM can dispatch working tickets. Figure 18 provides a holistic view of both zone satisfaction ratings (indicated by happy faces) and energy performance ratings (indicated by background color).
Figure 14: FM dashboard home view
ESTCP Demonstration Plan EW-201336 Collaborative Building Energy Management and Control 32
Figure 15: FM DR event creation view
Figure 16: FM aggregated schedule view
ESTCP Demonstration Plan EW-201336 Collaborative Building Energy Management and Control 33
Figure 17: FM occupant feedback view
Figure 18: Zonal satisfaction and energy performance rating view
ESTCP Demonstration Plan EW-201336 Collaborative Building Energy Management and Control 34
2.3 ADVANTAGES AND LIMITATIONS OF THE TECHNOLOGY
2.3.1 Performance Advantages
cBEMC technology provides functional and operational advantages that are not available from any other currently deployed technology. Unique performance advantages are derived from the ongoing engagement of building occupants, in collaboration with their FM and through interaction with their building’s BAS, to control and improve their working environment and to actively participate in EE efforts and DR events.
Although other technologies exist for peak load shaving, only cBEMC can respond to a grid/microgrid or FM request with nuanced strategies that minimize disruption of building occupant activities. Furthermore, the HMI used for DR events is the same familiar cBEMC user interface that occupants and FMs use daily to coordinate control of the working environment. No other system harnesses the intelligence of building occupants to assist their FMs and interact with their building’s BAS in such dynamic and efficient ways. cBEMC implements proactive as well as reactive management of energy consuming equipment to mediate the interests of EE and occupant comfort in order to optimize achievement of both goals. cBEMC bases its control of the BAS on occupant preferences and feedback, including accommodation of dynamic occupancy schedules, as well as on outside weather conditions and the parameters of building systems. In response to current and anticipated occupancy and weather conditions, adjustments can be made to chilled and heated water, supply and duct static air pressure, and air temperature and humidity to achieve maximum mechanic system efficiency over time.
Most significantly, reassessment of the minimum ventilation requirements for a zone can eliminate substantial amounts of energy waste. As much as 30% overall EE improvement can be achieved for an office building by cBEMC management of ventilation instead of using fixed set points that assume constant maximum occupancy. Energy intensity can be dropped from ~100 to ~70 kBtu per square foot per year.
In addition, cBEMC is capable of networking and managing an unlimited number of facilities, executing energy management strategies for each individual building based on that building’s energy demand. Furthermore, cBEMC is capable of managing EE for multiple buildings and simultaneously managing instantaneous DR for a subset of those buildings. This powerful approach provides flexibility in terms of choosing the most appropriate energy savings methods for each individual building at a particular time. Also, the mobile scheduler (a tablet PC) allows unprecedented flexibility and simplicity for occupant management of personal comfort settings and work schedule.
2.3.2 Cost Advantages Because cBEMC is software based, its acquisition, installation, and maintenance costs are much lower than the costs of hardware-based solutions. The major cost of cBEMC is associated with engineering effort during the commissioning phase. After commissioning, very little maintenance is required in contrast with hardware-based systems (e.g. CO2 sensor-based ventilation control requires yearly calibration of CO2 sensors). The integration of SEB-based cBEMC with BAS is quick, easy, and cost effective. cBEMC follows service oriented architecture (SOA), which allows this easy integration and cBEMC has no hard dependencies on any existing BAS components. Communication by cBEMC with the BAS system is implemented
ESTCP Demonstration Plan EW-201336 Collaborative Building Energy Management and Control 35
via an open protocol, such as BACNet or Modbus, and provides a loosely coupled interface via a communication client service that is explicitly configured for the cBEMC controller. In essence, the cBEMC is designed to discover and command values for existing BAS control points only, without modifying or optimizing the internal BAS architecture. In addition, the advanced web-based HMI provides enhanced visualization that enables the cBEMC administrator (FM) to monitor and control building energy usage. Also, the simple and intuitive cBEMC UI requires very little training for occupants to operate. Furthermore, the scalability of the system allows it to coordinate DR and EE for multiple facilities to achieve greater load reduction and participation in utility incentive offerings. Increasing the size of the existing system and/or deploying the system into other facilities should only require software installation and configuration for the specifics of each BAS. Expanding the cBEMC to other facilities of PaANG would require a straight-forward update of the configuration and some additional system testing. Time required to do this kind of update would be in the order of days.
2.3.3 Performance Limitations
For purposes of EE improvement, the primary cBEMC performance limitation is the availability of up-to-date occupancy information. Also, cBEMC EE control depends on the availability and condition of the assets that are actually controllable in the field. These limitations can pose constraints to EE and DR strategy design. In addition, lack of access due to site-specific security limitations and unsecured web architecture of cBEMC system can significantly constraint user access, and thus can drastically impacting the overall energy savings results. Moreover, cBEMC support for notification and diagnosis of BAS failures is limited. cBEMC does not handle real-time alarms. The cBEMC system logging and trend data logging are the only way to analyze and identify cBEMC operational failures or communication with the BAS at this point.
2.3.4 Cost Limitations Engineering effort during the commissioning phase accounts for the primary cost of cBEMC. cBEMC also requires an initial effort to develop building energy models that are used for energy consumption analysis, as well as energy consumption simulation and analysis of energy savings. Developing and calibrating detailed models, using software such as EnergyPlus, Matlab, etc., can be time-consuming and is heavily dependent on the availability of building information and meter data for the model calibration. However, once the building model has been established, it can be used beneficially in many ways for life-cycle analysis and energy management.
cBEMC has no functionality for automatic point discovery. Development of control point listing and mapping is a manual process that requires a great deal of communication effort between the FM and the BAS service team. This is currently a cost-ineffective, lengthy process that needs to be optimized and can be improved through record-keeping and procedural innovations.
The absence of a real-time failure notification mechanism in cBEMC constrains users from quickly troubleshooting issues as they arise, especially during a building’s ongoing EE operation. Analysis of the trended or logging data to identify and troubleshoot problems, the current way to find and fix failures, is excessively tedious and time consuming.

ESTCP Demonstration Plan EW-201336 Collaborative Building Energy Management and Control 36
2.3.5 Social Acceptance
Because cBEMC returns control – or, at least, influence - over the working environment to the people who use a building – occupants are expected to be positively disposed toward accepting the technology. More directly related to their personal interests, occupants responded positively to a system that allows them to state their comfort-setting preferences and report their satisfaction with environmental conditions as a matter of course rather than voicing a complaint. As reassuring as the invitation to collaborate is to occupants, with or without cBEMC, occupant attitudes are most responsive to results. cBEMC success in improving environmental conditions can determine the occupants’ acceptance of the technology.
ESTCP Demonstration Plan EW-201336 Collaborative Building Energy Management and Control 37
3.0 PERFORMANCE OBJECTIVES
The technology and economic Performance Objectives (POs) to evaluate cBEMC technology were defined based on following DOD goals on military installations:
Cost Avoidance: The POs measure installation energy use reduction resulting from collaborative building control, and the ability to achieve savings from peak load reduction by having the ability to quickly reduce electrical loads.
Greenhouse Gas Reduction: The performance objectives measure the reduction of GHG emissions for installations.
Sustainability Practices Become the Norm: The performance objectives measure the active engagement from occupants in energy conservation activities
User Comfort: The performance objectives address system inadequacies and identify opportunities to achieve energy savings while increasing user comfort and satisfaction.
3.1 SUMMARY OF PERFORMANCE OBJECTIVES
Investigators collected data before, during, and after cBEMC system operation to evaluate the technical and economic objectives of the project. These POs are summarized below in Table 3.
Table 3: Performance Objectives
Performance Objective
Metric Data Requirements Success Criteria Results
Quantitative Performance Objectives
Building Energy Use Reduction
Energy Intensity
(site and source kWh/ft2)
Trended BAS data and incremental meter readings.
Load profiles developed through TRNSYS models or energy audits of the buildings.
30% reduction of annual HVAC Energy Use2; 10 % of overall building energy usage reduction
Partially achieved.
Average reduction achieved was 14% and the best case scenario of 22% HVAC energy reduction. Corresponding overall energy reduction (including electricity) were 10.4% and 15.8%, respectively.
Facility Electric Load Shedding
Electricity Demand (kW) and response time (measured in 15
Interval meter readings every 15-minutes.
Load profiles developed
Load shedding by 20% achieved within 15 minutes and maintained for
Partially achieved.
Over three DR test average kW/kWh reduction achieved was
2 Energy savings calculations will be driven by the granularity of existing utility and energy use information for this building separate from the military installation as a whole. Operational set points for the BAS system and trended data will be used to estimate building specific electric and gas uses across all systems (heating, cooling, ventilation, lighting, plug).
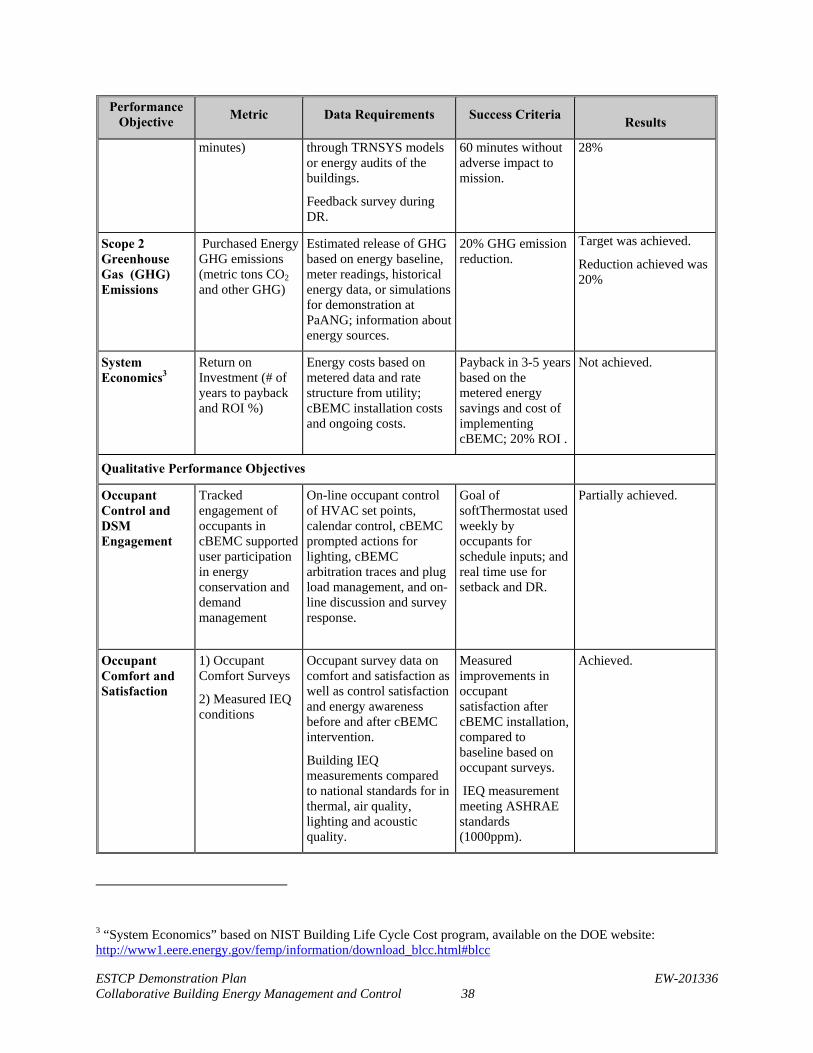
ESTCP Demonstration Plan EW-201336 Collaborative Building Energy Management and Control 38
Performance Objective
Metric Data Requirements Success Criteria Results
minutes) through TRNSYS models or energy audits of the buildings.
Feedback survey during DR.
60 minutes without adverse impact to mission.
28%
Scope 2 Greenhouse Gas (GHG) Emissions
Purchased Energy GHG emissions (metric tons CO2 and other GHG)
Estimated release of GHG based on energy baseline, meter readings, historical energy data, or simulations for demonstration at PaANG; information about energy sources.
20% GHG emission reduction.
Target was achieved.
Reduction achieved was 20%
System Economics3
Return on Investment (# of years to payback and ROI %)
Energy costs based on metered data and rate structure from utility; cBEMC installation costs and ongoing costs.
Payback in 3-5 years based on the metered energy savings and cost of implementing cBEMC; 20% ROI .
Not achieved.
Qualitative Performance Objectives
Occupant Control and DSM Engagement
Tracked engagement of occupants in cBEMC supported user participation in energy conservation and demand management
On-line occupant control of HVAC set points, calendar control, cBEMC prompted actions for lighting, cBEMC arbitration traces and plug load management, and on-line discussion and survey response.
Goal of softThermostat used weekly by occupants for schedule inputs; and real time use for setback and DR.
Partially achieved.
Occupant Comfort and Satisfaction
1) Occupant Comfort Surveys
2) Measured IEQ conditions
Occupant survey data on comfort and satisfaction as well as control satisfaction and energy awareness before and after cBEMC intervention.
Building IEQ measurements compared to national standards for in thermal, air quality, lighting and acoustic quality.
Measured improvements in occupant satisfaction after cBEMC installation, compared to baseline based on occupant surveys.
IEQ measurement meeting ASHRAE standards (1000ppm).
Achieved.
3 “System Economics” based on NIST Building Life Cycle Cost program, available on the DOE website: http://www1.eere.energy.gov/femp/information/download_blcc.html#blcc
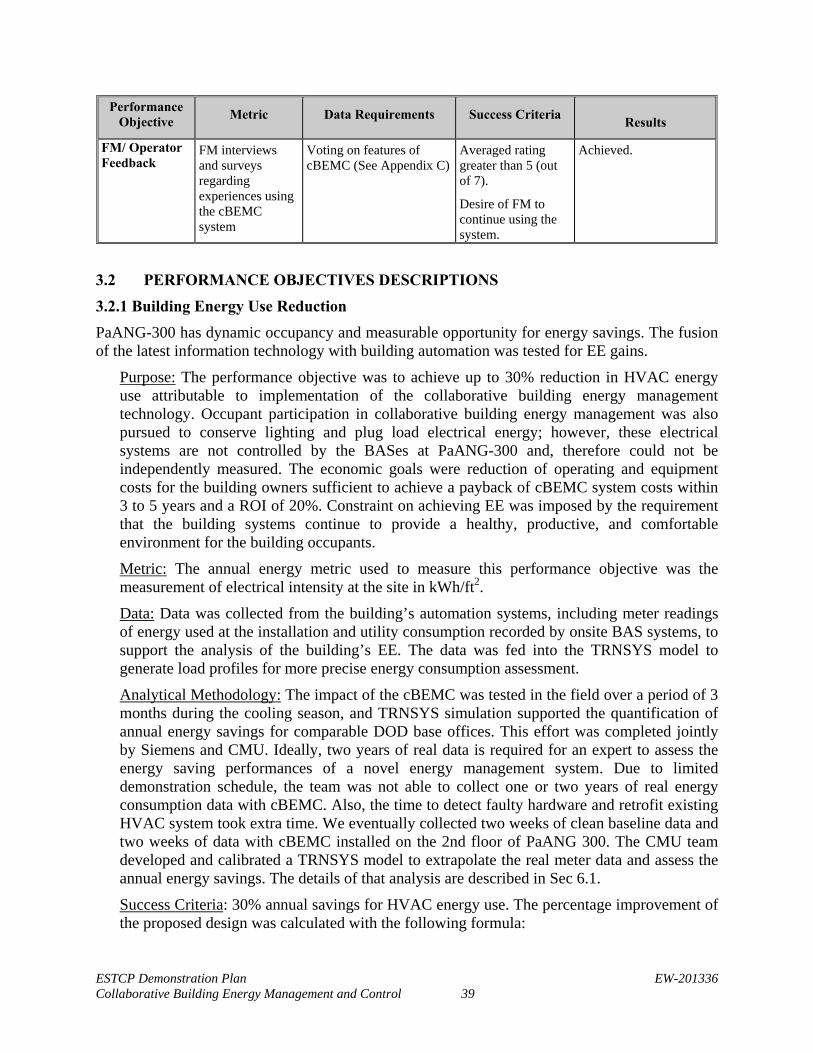
ESTCP Demonstration Plan EW-201336 Collaborative Building Energy Management and Control 39
Performance Objective
Metric Data Requirements Success Criteria Results
FM/ Operator Feedback
FM interviews and surveys regarding experiences using the cBEMC system
Voting on features of cBEMC (See Appendix C)
Averaged rating greater than 5 (out of 7).
Desire of FM to continue using the system.
Achieved.
3.2 PERFORMANCE OBJECTIVES DESCRIPTIONS
3.2.1 Building Energy Use Reduction
PaANG-300 has dynamic occupancy and measurable opportunity for energy savings. The fusion of the latest information technology with building automation was tested for EE gains.
Purpose: The performance objective was to achieve up to 30% reduction in HVAC energy use attributable to implementation of the collaborative building energy management technology. Occupant participation in collaborative building energy management was also pursued to conserve lighting and plug load electrical energy; however, these electrical systems are not controlled by the BASes at PaANG-300 and, therefore could not be independently measured. The economic goals were reduction of operating and equipment costs for the building owners sufficient to achieve a payback of cBEMC system costs within 3 to 5 years and a ROI of 20%. Constraint on achieving EE was imposed by the requirement that the building systems continue to provide a healthy, productive, and comfortable environment for the building occupants.
Metric: The annual energy metric used to measure this performance objective was the measurement of electrical intensity at the site in kWh/ft2.
Data: Data was collected from the building’s automation systems, including meter readings of energy used at the installation and utility consumption recorded by onsite BAS systems, to support the analysis of the building’s EE. The data was fed into the TRNSYS model to generate load profiles for more precise energy consumption assessment.
Analytical Methodology: The impact of the cBEMC was tested in the field over a period of 3 months during the cooling season, and TRNSYS simulation supported the quantification of annual energy savings for comparable DOD base offices. This effort was completed jointly by Siemens and CMU. Ideally, two years of real data is required for an expert to assess the energy saving performances of a novel energy management system. Due to limited demonstration schedule, the team was not able to collect one or two years of real energy consumption data with cBEMC. Also, the time to detect faulty hardware and retrofit existing HVAC system took extra time. We eventually collected two weeks of clean baseline data and two weeks of data with cBEMC installed on the 2nd floor of PaANG 300. The CMU team developed and calibrated a TRNSYS model to extrapolate the real meter data and assess the annual energy savings. The details of that analysis are described in Sec 6.1.
Success Criteria: 30% annual savings for HVAC energy use. The percentage improvement of the proposed design was calculated with the following formula:
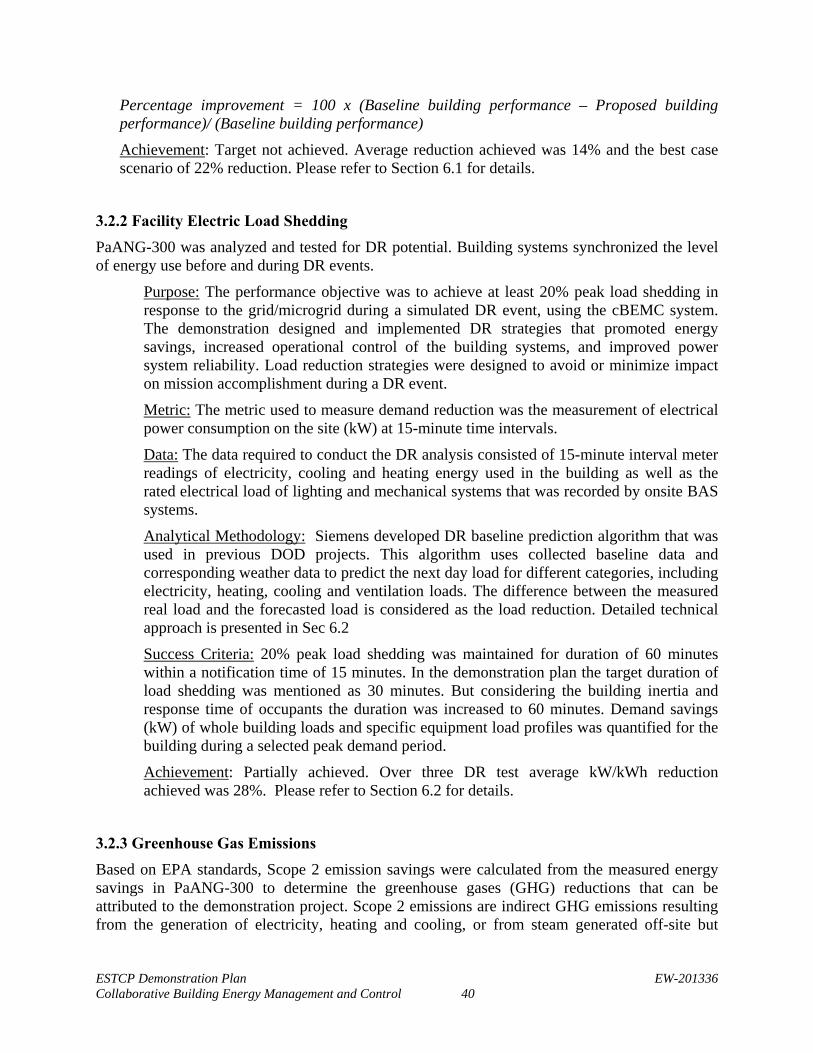
ESTCP Demonstration Plan EW-201336 Collaborative Building Energy Management and Control 40
Percentage improvement = 100 x (Baseline building performance – Proposed building performance)/ (Baseline building performance)
Achievement: Target not achieved. Average reduction achieved was 14% and the best case scenario of 22% reduction. Please refer to Section 6.1 for details.
3.2.2 Facility Electric Load Shedding
PaANG-300 was analyzed and tested for DR potential. Building systems synchronized the level of energy use before and during DR events.
Purpose: The performance objective was to achieve at least 20% peak load shedding in response to the grid/microgrid during a simulated DR event, using the cBEMC system. The demonstration designed and implemented DR strategies that promoted energy savings, increased operational control of the building systems, and improved power system reliability. Load reduction strategies were designed to avoid or minimize impact on mission accomplishment during a DR event.
Metric: The metric used to measure demand reduction was the measurement of electrical power consumption on the site (kW) at 15-minute time intervals.
Data: The data required to conduct the DR analysis consisted of 15-minute interval meter readings of electricity, cooling and heating energy used in the building as well as the rated electrical load of lighting and mechanical systems that was recorded by onsite BAS systems.
Analytical Methodology: Siemens developed DR baseline prediction algorithm that was used in previous DOD projects. This algorithm uses collected baseline data and corresponding weather data to predict the next day load for different categories, including electricity, heating, cooling and ventilation loads. The difference between the measured real load and the forecasted load is considered as the load reduction. Detailed technical approach is presented in Sec 6.2
Success Criteria: 20% peak load shedding was maintained for duration of 60 minutes within a notification time of 15 minutes. In the demonstration plan the target duration of load shedding was mentioned as 30 minutes. But considering the building inertia and response time of occupants the duration was increased to 60 minutes. Demand savings (kW) of whole building loads and specific equipment load profiles was quantified for the building during a selected peak demand period.
Achievement: Partially achieved. Over three DR test average kW/kWh reduction achieved was 28%. Please refer to Section 6.2 for details.
3.2.3 Greenhouse Gas Emissions
Based on EPA standards, Scope 2 emission savings were calculated from the measured energy savings in PaANG-300 to determine the greenhouse gases (GHG) reductions that can be attributed to the demonstration project. Scope 2 emissions are indirect GHG emissions resulting from the generation of electricity, heating and cooling, or from steam generated off-site but
ESTCP Demonstration Plan EW-201336 Collaborative Building Energy Management and Control 41
purchased by the entity, and the transmission and distribution (T&D) losses associated with some purchased utilities (e.g., chilled water, steam, and high temperature hot water).4
Purpose: The concentrations of greenhouse gas emissions in the atmosphere is increasing due to human activity which is causing serious climate changes that affect the environment and natural resources across the globe. Achievement of the two performance objectives - optimizing building EE and reducing facility peak energy demand – will result in a reduction of direct GHG emissions.
Metric: Metric tons of CO2 were the primary focus of the Scope 2 greenhouse gas emission savings from the cBEMC investment. The research team also considered the other major greenhouse gases: methane, SOX, NOX, HFCs, and PFCs.
Data: Measured or estimated reduction of GHG emissions were based on emission factors that take into account the fuel mix of electricity in the Pittsburg region, and were also based on standard emission factors for natural gas. To quantify the emissions from these sources, data was collected from the Academy’s building energy baseline (including electric meter readings and trend data recorded by the onsite Apogee BAS). The U.S. EPA publishes a database called “eGrid” that displays the GHG’s emitted by electricity generation by geographic region and allows customers to see emission profiles for their region. The team employed this database and standard emission factors for natural gas to determine the GHG baseline and the GHG reductions for the PaANG demonstration.
Analytical Methodology: The cBEMC system is designed to involve building occupants in the energy efficient control of building subsystems. The electricity and fuel energy savings from these collaborative controls have a direct impact on greenhouse gas reductions. The EPA Energy Profiler and the “eGrid” database was used to calculate fuel source mix, source emissions, transmission losses, and distribution losses.
Success Criteria: 20% reduction in greenhouse gases (GHG) was expected, directly correlated to energy consumption reduction, with additional benefits expected from peak load reductions.
Achievement: Target was achieved. Reduction achieved was 20%. Please refer to Section 6.3 for details.
3.2.4 System Economics
It is estimated that DOD spends as much as $4 billion annually on energy related costs for its facilities. The cBEMC system with its softThermostat is an approach that applies intelligent operational strategies to save electricity and fuel consumption in buildings with automation systems. The cost of the cBEMC hardware and software installation, training, operations, and
4 http://www.epa.gov/oaintrnt/ghg/
ESTCP Demonstration Plan EW-201336 Collaborative Building Energy Management and Control 42
maintenance must be justified by meeting the payback criteria of the DOD to move from demonstration status to implementation at multiple sites.
Purpose: To demonstrate that the cBEMC energy savings benefits outweigh the installation and operating costs, for widespread adoption in DOD buildings with BAS systems.
Metric: System installation and operational costs in dollars were compared to annual and peak energy savings in kWh and dollars to calculate return on investment as a percentage, period for payback of investment in years, and net present value of investment (NPV) given a fifteen year life cycle.
Data: The data required to complete the analysis of the cBEMC consisted of calculated baseline and peak savings, utility/fuel costs, and estimates of market-ready equipment, estimates of installation, training, operational, and maintenance costs.
Analytical Methodology: The project team developed simple paybacks as well as life-cycle costs based on NIST’s Life-Cycle Costing Manual for the Federal Energy Management Program.
Success Criteria: cBEMC enabled at least 15% energy cost savings with simple payback within 3 to 5 years based on the cost of implementing cBEMC.
Achievement: Partially achieved. Please refer to Section 6.5 for details.
3.2.5 Occupant control and DSM engagement
Occupant behavior is the interaction between occupants and systems in the building that contributes to reducing energy consumption of the facility and of its individual components.
Purpose: Occupant behavior has a significant impact on building energy consumption. Design of the envelope, lighting, mechanical, and process systems in a building is driven by the need to meet the thermal and visual comfort needs of the building’s occupants. If occupants actively change their behavior to reduce energy waste while maintaining or improving comfort, then we can positively quantify the influence of behavior on specific energy end uses.
Metric: Occupant behavior was evaluated based on the number of occupant interactions with the softThermostat, and their implementation of energy efficient and demand reduction strategies with measurable results. How often the arbitration logics are called upon for each control zone was recorded in the cBEMC trace system. The change of the arbitration frequency during the experimentation phase provided a quantifiable indication of cultural acceptance of the technology and a willingness to participate in actions to save energy. At the end of the test period, occupants were interviewed to establish their awareness of consumption patterns and their interest in changing behaviors for the long term.
Interviews of the Energy Management Center staff determined the frequency of complaint calls before, during and after the cBEMC test period.
Data: Review of frequency of use of the cBEMC (softThermsostat) by office occupants including on-line occupant control of HVAC setpoints, calendar control, cBEMC
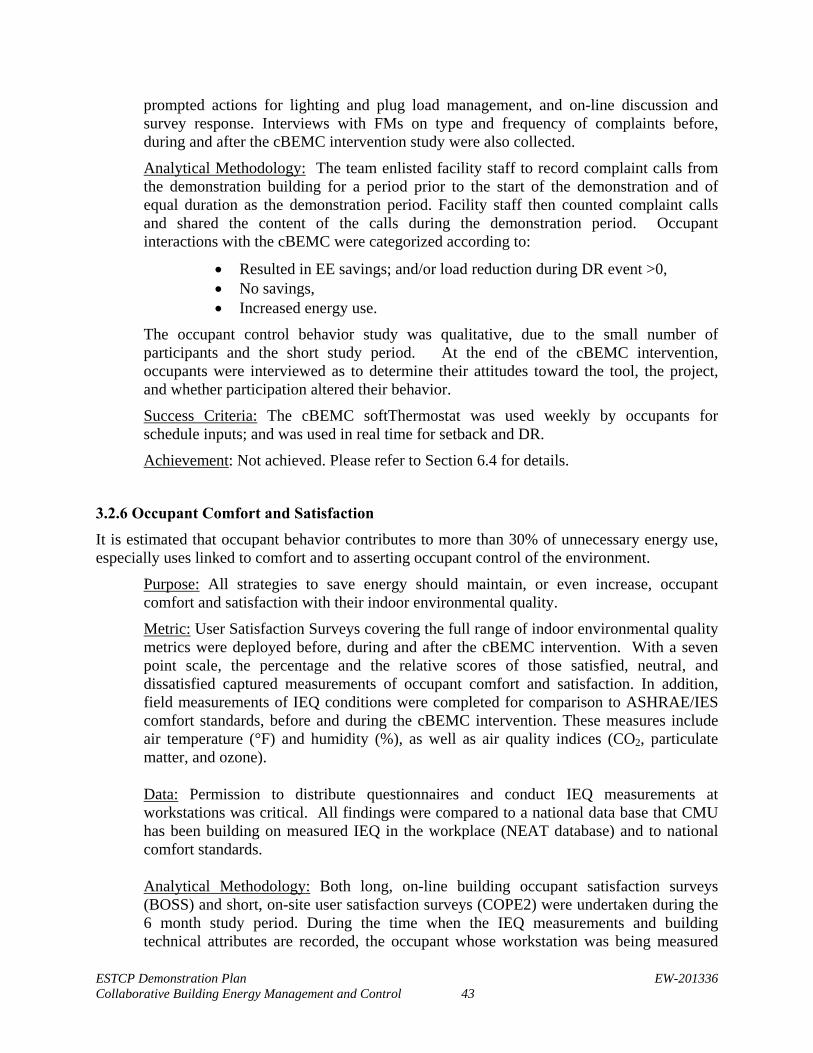
ESTCP Demonstration Plan EW-201336 Collaborative Building Energy Management and Control 43
prompted actions for lighting and plug load management, and on-line discussion and survey response. Interviews with FMs on type and frequency of complaints before, during and after the cBEMC intervention study were also collected.
Analytical Methodology: The team enlisted facility staff to record complaint calls from the demonstration building for a period prior to the start of the demonstration and of equal duration as the demonstration period. Facility staff then counted complaint calls and shared the content of the calls during the demonstration period. Occupant interactions with the cBEMC were categorized according to:
Resulted in EE savings; and/or load reduction during DR event >0, No savings, Increased energy use.
The occupant control behavior study was qualitative, due to the small number of participants and the short study period. At the end of the cBEMC intervention, occupants were interviewed as to determine their attitudes toward the tool, the project, and whether participation altered their behavior.
Success Criteria: The cBEMC softThermostat was used weekly by occupants for schedule inputs; and was used in real time for setback and DR.
Achievement: Not achieved. Please refer to Section 6.4 for details.
3.2.6 Occupant Comfort and Satisfaction
It is estimated that occupant behavior contributes to more than 30% of unnecessary energy use, especially uses linked to comfort and to asserting occupant control of the environment.
Purpose: All strategies to save energy should maintain, or even increase, occupant comfort and satisfaction with their indoor environmental quality.
Metric: User Satisfaction Surveys covering the full range of indoor environmental quality metrics were deployed before, during and after the cBEMC intervention. With a seven point scale, the percentage and the relative scores of those satisfied, neutral, and dissatisfied captured measurements of occupant comfort and satisfaction. In addition, field measurements of IEQ conditions were completed for comparison to ASHRAE/IES comfort standards, before and during the cBEMC intervention. These measures include air temperature (°F) and humidity (%), as well as air quality indices (CO2, particulate matter, and ozone).
Data: Permission to distribute questionnaires and conduct IEQ measurements at workstations was critical. All findings were compared to a national data base that CMU has been building on measured IEQ in the workplace (NEAT database) and to national comfort standards.
Analytical Methodology: Both long, on-line building occupant satisfaction surveys (BOSS) and short, on-site user satisfaction surveys (COPE2) were undertaken during the 6 month study period. During the time when the IEQ measurements and building technical attributes are recorded, the occupant whose workstation was being measured

ESTCP Demonstration Plan EW-201336 Collaborative Building Energy Management and Control 44
was given a short user satisfaction questionnaire related to that day’s specific environmental conditions for comparison with measurements. This survey was issued before, during, and after the cBEMC intervention. A longer online questionnaire was issued to all of the building participants to help investigators understand multi-season comfort and environmental satisfaction and its potential impact on outcomes.
In addition, on-site IEQ measurements were completed at a statistical sample of workstations before and during the cBEMC deployment to evaluate the IEQ impacts of selected control strategies. Measurements were compared to thresholds set by standard-setting bodies including ASHRAE, IESNA, and EPA. CMU has developed the National Environmental Assessment Toolkit (NEAT), with original funding from U.S. GSA, to measure thermal, air, lighting, and acoustic qualities of the indoor environment; to capture building energy consumption; and to collect data on occupant comfort. NEAT evaluation protocols are aligned with ASHRAE’s 2010, “Performance Measurement Protocols for Commercial Buildings”. In parallel to IEQ measurements, the technical attributes of building systems (TABS) were collected with regard to the office and workstation enclosure, HVAC, lighting, and furniture systems, as well as desktop plug loads.
Success Criteria: cBEMC produced measured improvements in occupant satisfaction with the environmental variables after installation of cBEMC controlled them, compared to the baseline. cBEMC maintained or improved indoor environmental quality outcomes related to the environmental variables controlled.
Achievement: Achieved. Please refer to Section 6.6 for details.
3.2.7 Facility Manager/Operators Feedback
Improvements in building automation and the engagement of building occupants in EE should reduce complaints and facility management workloads, and/or ensure greater operator success in maintaining comfort and reducing energy.
Purpose: To assess the benefits of the cBEMC and soft Thermostat in read and read/write modes for facility management.
Metric: The demonstration team measured the usability of the cBEMC software system, including its work flow, user interface design, flexibility, and scalability.
Data: The occupants and building operator/facility manager voted on the features of cBEMC (see Appendix C)
Analytical Methodology: The FMs and occupants were interviewed. A total score was generated from the voting on various features of cBEMC. The outliers were identified and analyzed. Recommendations for improving cBEMC for widespread application were also gathered and documented.
Success Criteria: Voting averaged a rating greater than 5 (out of 7), and the building occupants and FMs expressed a desire to continue using the software
Achievement: Achieved. Please refer to Section 6.7 for details.
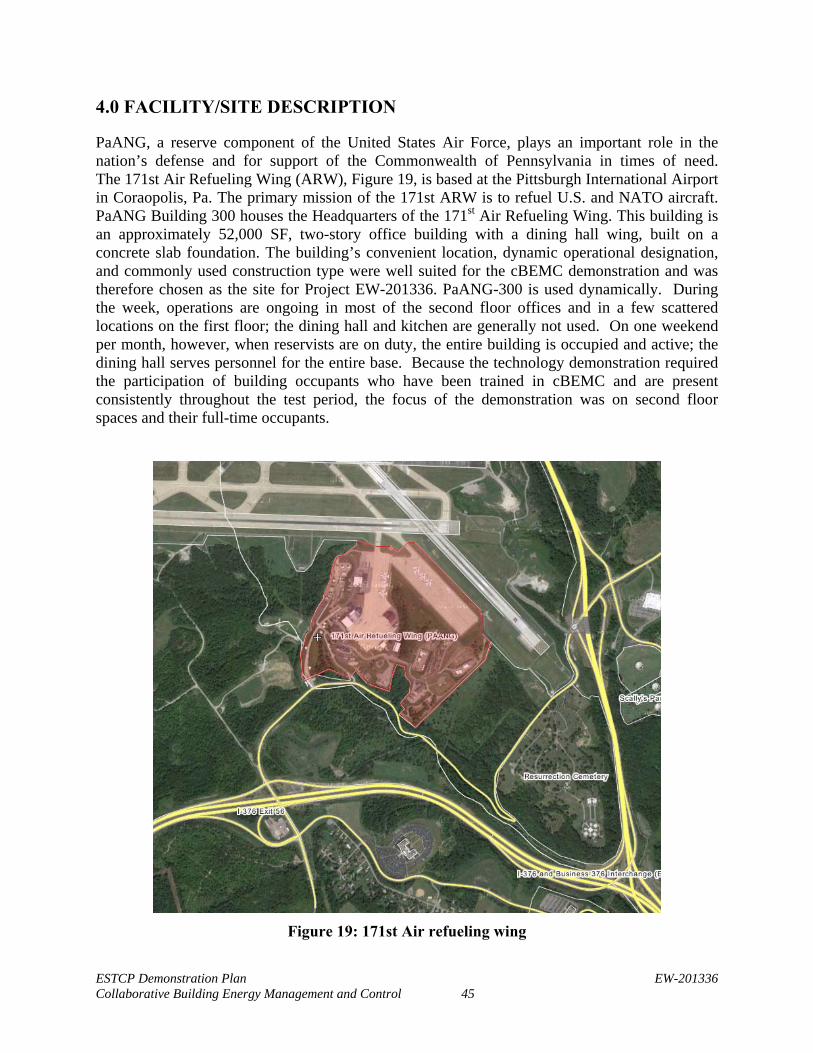
ESTCP Demonstration Plan EW-201336 Collaborative Building Energy Management and Control 45
4.0 FACILITY/SITE DESCRIPTION
PaANG, a reserve component of the United States Air Force, plays an important role in the nation’s defense and for support of the Commonwealth of Pennsylvania in times of need. The 171st Air Refueling Wing (ARW), Figure 19, is based at the Pittsburgh International Airport in Coraopolis, Pa. The primary mission of the 171st ARW is to refuel U.S. and NATO aircraft. PaANG Building 300 houses the Headquarters of the 171st Air Refueling Wing. This building is an approximately 52,000 SF, two-story office building with a dining hall wing, built on a concrete slab foundation. The building’s convenient location, dynamic operational designation, and commonly used construction type were well suited for the cBEMC demonstration and was therefore chosen as the site for Project EW-201336. PaANG-300 is used dynamically. During the week, operations are ongoing in most of the second floor offices and in a few scattered locations on the first floor; the dining hall and kitchen are generally not used. On one weekend per month, however, when reservists are on duty, the entire building is occupied and active; the dining hall serves personnel for the entire base. Because the technology demonstration required the participation of building occupants who have been trained in cBEMC and are present consistently throughout the test period, the focus of the demonstration was on second floor spaces and their full-time occupants.
Figure 19: 171st Air refueling wing
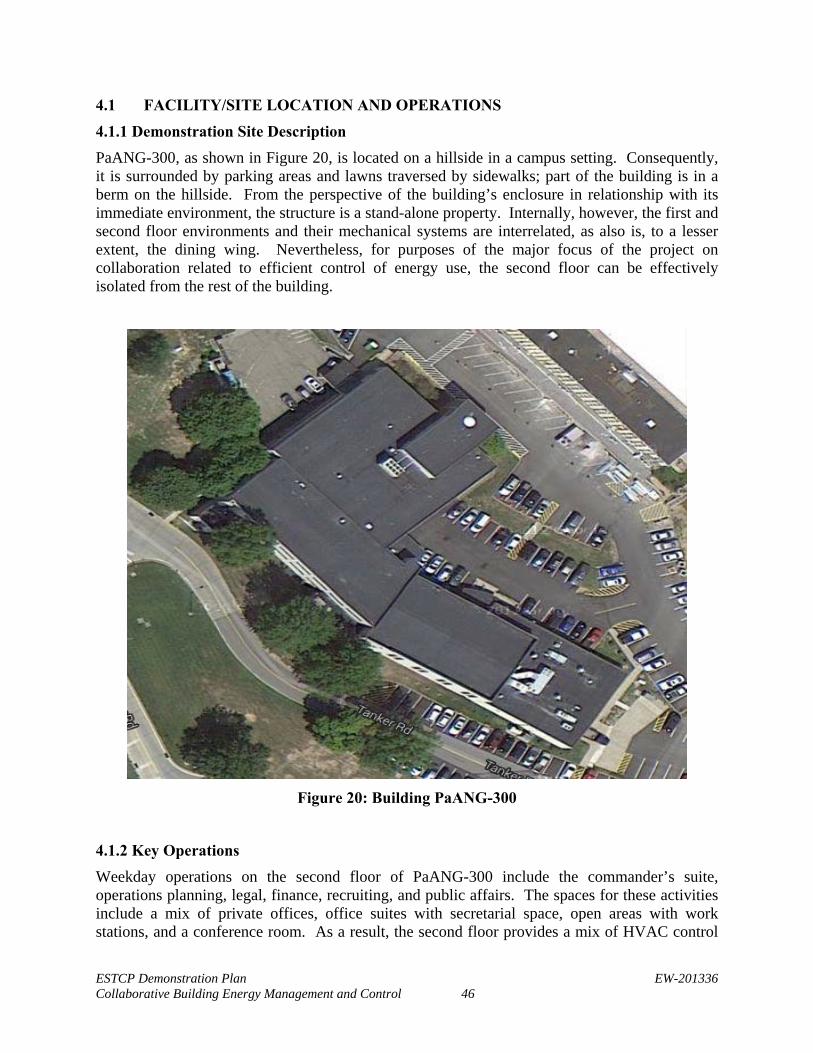
ESTCP Demonstration Plan EW-201336 Collaborative Building Energy Management and Control 46
4.1 FACILITY/SITE LOCATION AND OPERATIONS
4.1.1 Demonstration Site Description
PaANG-300, as shown in Figure 20, is located on a hillside in a campus setting. Consequently, it is surrounded by parking areas and lawns traversed by sidewalks; part of the building is in a berm on the hillside. From the perspective of the building’s enclosure in relationship with its immediate environment, the structure is a stand-alone property. Internally, however, the first and second floor environments and their mechanical systems are interrelated, as also is, to a lesser extent, the dining wing. Nevertheless, for purposes of the major focus of the project on collaboration related to efficient control of energy use, the second floor can be effectively isolated from the rest of the building.
Figure 20: Building PaANG-300
4.1.2 Key Operations
Weekday operations on the second floor of PaANG-300 include the commander’s suite, operations planning, legal, finance, recruiting, and public affairs. The spaces for these activities include a mix of private offices, office suites with secretarial space, open areas with work stations, and a conference room. As a result, the second floor provides a mix of HVAC control
ESTCP Demonstration Plan EW-201336 Collaborative Building Energy Management and Control 47
zones serving single occupants (such as for the commanding officer), shared suites (such as for the attorneys), and interacting open areas of desks (such as for the recruiting personnel). Some occupants use their assigned desks on a regular schedule (such as for the finance department), while others have schedules that often require their presence elsewhere within (such as for operations planning) and/or outside (such as for recruiting) the building. Such a dynamic mix of building occupant usage profiles provided a robust test bed for the project. The second floor of PaANG-300 was the primary test bed for this project. Although the HVAC systems for PaANG-300 serve the entire building and thermal/physical dynamics affects are interactive throughout the structure, measurable delivery of energy through ventilation systems, as well as electrical service, can be effectively isolated for the second floor.
4.1.3 Demonstration Site Floor Plan The second floor of PaANG-300 presents a common layout, as shown in Figure 21, of peripheral (fenestrated) and internal (windowless) offices with entrances from connecting corridors. Two stairways descend to the first floor; two exits access ground level at the north side of the building. The shaded area indicates air space above the dining hall/kitchen wing of the building.
Figure 21: 2nd floor plan for PaANG-300
The parts of the second floor that are not used continuously during weekdays include the chaplain’s offices and operations control facilities. (The operations control facilities are also served by a supplemental, separate air conditioning unit that is not controlled by Apogee, but
ESTCP Demonstration Plan EW-201336 Collaborative Building Energy Management and Control 48
contributes to the building electrical load. The existence of this exception is not expected to have had an impact on the demonstration.)
Weekday activities related to medical and personnel support are conducted at a few disbursed locations on the first floor. These areas were excluded from the test bed. Approximately one weekend per month, the reserve personnel are on duty and the building is then fully occupied with first-floor offices and examining rooms being used for medical and dental examinations. These spaces within the building that are excluded from the second floor test bed are also used on other occasions, when appropriate. Although not part of the collaborative aspects of the demonstration, energy use in areas other than the second floor test bed must be included in data analysis for establishing baselines and extrapolation of data for seasonal and/or annual comparisons.
4.2 SITE-RELATED PERMITS AND REGULATIONS
4.3.1 Regulations & Environmental Permits No special permits were required for the technology demonstration. No specific regulations at the federal, state, or local levels of government are applicable to the demonstration. All permissions from the perspective of military operations and security were obtained by the PaANG military partner for the project; there was a concern raised by PaANG primary POC, LTC Joseph Sullivan regarding the use of SCT proprietary equipment/hardware on site. It was decided to use PaANG equipment (laptop computers) for installation and execution of the cBEMC demonstration.
The technology demonstration does not produce any emissions or have any other environmental effects. In fact, one aspect of the project is the measurement of Indoor Environmental Quality (IEQ) to correlate physical working conditions with occupant satisfaction. No environmental permits or other approvals related to environmental impact are required for this demonstration.
4.3.2 Agreements & Arrangements Since the demonstration specifically studies occupant behavior and perception, approval of the study protocols by an Independent Review Board (IRB) was required for CMU to proceed. A letter of support for this process was provided by ESTCP, and PaANG collaborated with CMU to expedite IRB approval. Coordination of the IRB process was conducted by CMU POC Dr. Vivian Loftness and PaANG POC LTC Joseph Sullivan.
Three additional electrical meters were installed prior the demonstration to measure energy consumption by the assets on second floor with appropriate precision. No special permits were required for this metering. The additional metering process was coordinated between PaANG POC LTC Joseph Sullivan and SBT POC Stephen Campbell. LTC Sullivan and the Siemens Building Technologies Pittsburgh Branch also coordinated the cBEMC IT infrastructure installation (cBEMC server, cBEMC kiosks, communication hub, etc.).
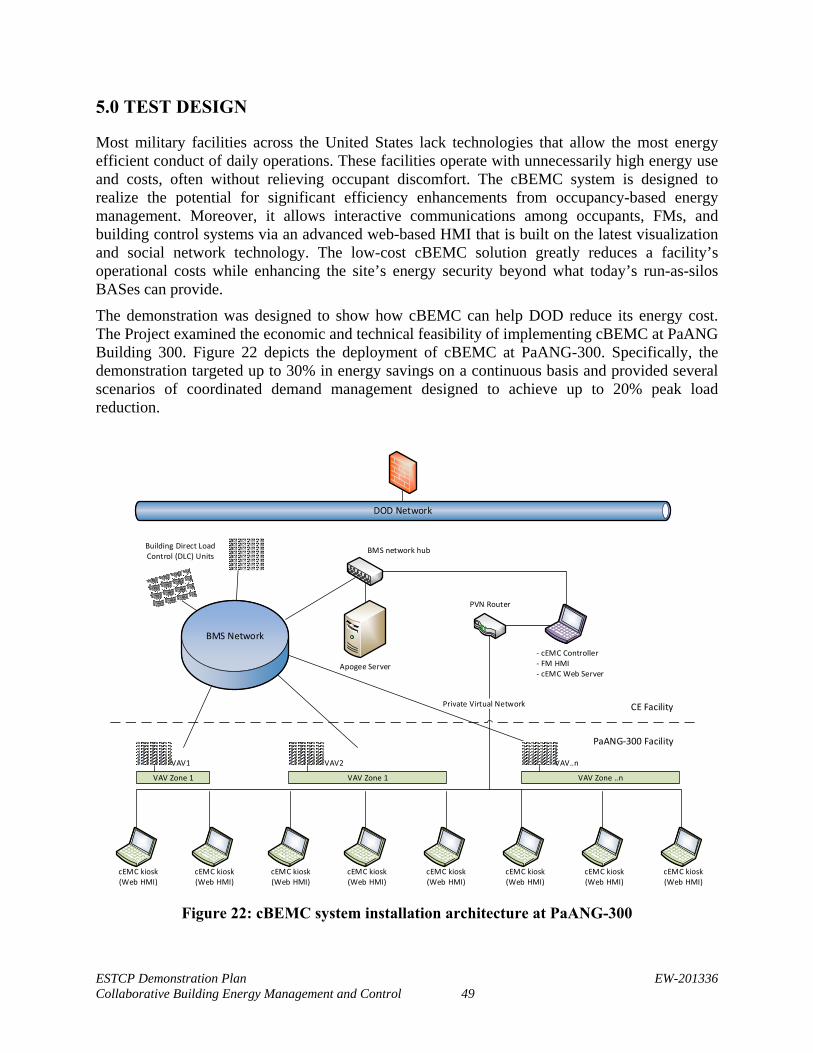
ESTCP Demonstration Plan EW-201336 Collaborative Building Energy Management and Control 49
5.0 TEST DESIGN
Most military facilities across the United States lack technologies that allow the most energy efficient conduct of daily operations. These facilities operate with unnecessarily high energy use and costs, often without relieving occupant discomfort. The cBEMC system is designed to realize the potential for significant efficiency enhancements from occupancy-based energy management. Moreover, it allows interactive communications among occupants, FMs, and building control systems via an advanced web-based HMI that is built on the latest visualization and social network technology. The low-cost cBEMC solution greatly reduces a facility’s operational costs while enhancing the site’s energy security beyond what today’s run-as-silos BASes can provide.
The demonstration was designed to show how cBEMC can help DOD reduce its energy cost. The Project examined the economic and technical feasibility of implementing cBEMC at PaANG Building 300. Figure 22 depicts the deployment of cBEMC at PaANG-300. Specifically, the demonstration targeted up to 30% in energy savings on a continuous basis and provided several scenarios of coordinated demand management designed to achieve up to 20% peak load reduction.
BMS Network
Apogee Server
BMS network hub
PVN Router
Building Direct Load Control (DLC) Units
‐ cEMC Controller ‐ FM HMI‐ cEMC Web Server
Private Virtual Network
VAV1
cEMC kiosk(Web HMI)
cEMC kiosk(Web HMI)
cEMC kiosk(Web HMI)
cEMC kiosk(Web HMI)
cEMC kiosk(Web HMI)
cEMC kiosk(Web HMI)
cEMC kiosk(Web HMI)
cEMC kiosk(Web HMI)
CE Facility
PaANG‐300 Facility
VAV Zone 1 VAV Zone 1 VAV Zone ..n
VAV2 VAV..n
Figure 22: cBEMC system installation architecture at PaANG-300

ESTCP Demonstration Plan EW-201336 Collaborative Building Energy Management and Control 50
5.1 CONCEPTUAL TEST DESIGN
To assess the ability of the cBEMC technology to achieve the success criteria for the performance objectives, several tests were designed to measure the performance of cBEMC with reference to baseline conditions.
5.1.1 Variables
Independent variable:
These are variables that can be manipulated or changed by or on behalf of the User. For the purpose of this conceptual test design, the independent variable is application of cBEMC software for building energy savings and agile peak load shaving (Table 4):
Configurable Variables: These variables can be set and/or changed by the User during the cBEMC configuration phase. Example: DR modes, EE or DR mode.
Manipulated Variables: These variables can be changed and controlled by the User during the cBEMC Runtime Phase, or they may be changed by cBEMC software. Examples: control set points in HVAC units, On/Off for lighting and plug loads.
Dependent variable(s):
These are variables that will change and be measured based upon the use of the cBEMC software (Table 4):
These variables are the results being measured. Example: kWh consumed, peak demand (kW), greenhouse gases, total electricity costs, changes in run times of air handling units, cooling distribution, and ventilation.
Controlled variable(s):
These variables are held constant between the baseline case and designed experimental test cases to avoid influencing the independent or dependent variables. These variables are considered “given” and outside the influence of the User (Table 4).
Static Variables: These variables are physical properties that are static. Example – Area of a Control Zone (shape and square feet), baseline electricity data (i.e., nominal electrical consumption of the building without cBEMC application)
Dynamic Variables: These variables may change predictably or unpredictably over time. Example – weather, building occupancy, duration of baseline, and the demonstration periods.
Local Variables: Existing equipment and distribution systems.
Table 4: Test Design Summary
Controlled Variables Independent Variables Dependent Variables
• Building characteristics (size, set points, etc)
• Weather pattern • Occupancy pattern • Duration of baseline • Demonstration periods
• Use of cBEMC software vs. no use of cBEMC software
• Energy usage for whole building
• Peak demand • GHG emissions • Total electricity costs • Occupant comfort voting
ESTCP Demonstration Plan EW-201336 Collaborative Building Energy Management and Control 51
5.1.2 Hypothesis Employing the cBEMC system leads to major improvements in EE, agile peak load shaving, active occupant participation in energy saving actions, and greater information sharing with occupants; and it enables occupant energy saving awareness and behavior to be a sustainable operation as a “norm,” compared to the baseline case where cBEMC is not installed.
The acceptance criteria for the above hypothesis are:
cBEMC system implementation leads to 10-30% reduction in HVAC. Demonstration of 10-20% agile peak load shaving within 15 minutes.
5.1.3 Test Design
To validate our hypothesis, we’ve conducted series of tests in which we monitored the dependent variables and tracked the correctness and sufficiency of cBEMC algorithms. We also tested the performance and integrity of the cBEMC design. During the testing we applied:
cBEMC EE Method to the second floor of the building PaANG -300
4 types of cBEMC DR (Demand Management) methods to the second floor of the building PaANG -300
The results of these tests were analyzed in the context of changes of dependent variables such as energy usage of PaANG -300 in comparison to its energy consumption baseline, energy demand of PaANG -300 in comparison to its demand baseline, and the number of occupancy comfort complaints as a result of the cBEMC test. As changes were made to building operations in response to weather, electricity demand, and occupancy, the team logged and trended the data through the Apogee BAS, and cBEMC system controller. The engineering costs were collected in the application development phase of cBEMC, and the facility operational cost was calculated using kWh utility rates and kW demand charges from Moon Township, PA Utilities.
Energy Efficiency Test
The EE subsystem of cBEMC provided a cost effective approach to manage energy consumption of the existing building equipment. In essence, this approach relies on the occupancy based EE strategies for VAV boxes, AHUs, chillers, boiler and thermostats operations. The main inputs of EE strategies are building occupancy, occupants’ comfort settings and the weather. One of the key logics for improving EE for PaANG-300 was comfort based temperature control and DCV that was implemented on VAV boxes via ventilation arbitration algorithm, as explained in section 2. This dynamic strategy at PaANG-300 was based on the number of occupants and their comfort preference in a zone. The team initially also planned to conduct various supplemental EE strategies, such as managing AHU’s supply air temperature and supply static pressure. However due to the fact that PaANG-300 has only one AHU, and its availability is crucial, the facility management team advised us not to do so. In addition we applied a boiler demand reduction strategy by decreasing the hot water temperature set point, and a chiller demand reduction strategy by increasing the chilled water temperature set point. The EE strategies were configured and managed in the cBEMC controller located in the Facility Management Room of PaANG-CE building.
For the defined strategies, the corresponding BAS control points were mapped to each individual strategy. Whenever a building operation mode in cBEMC was set to EE mode, the cBEMC was
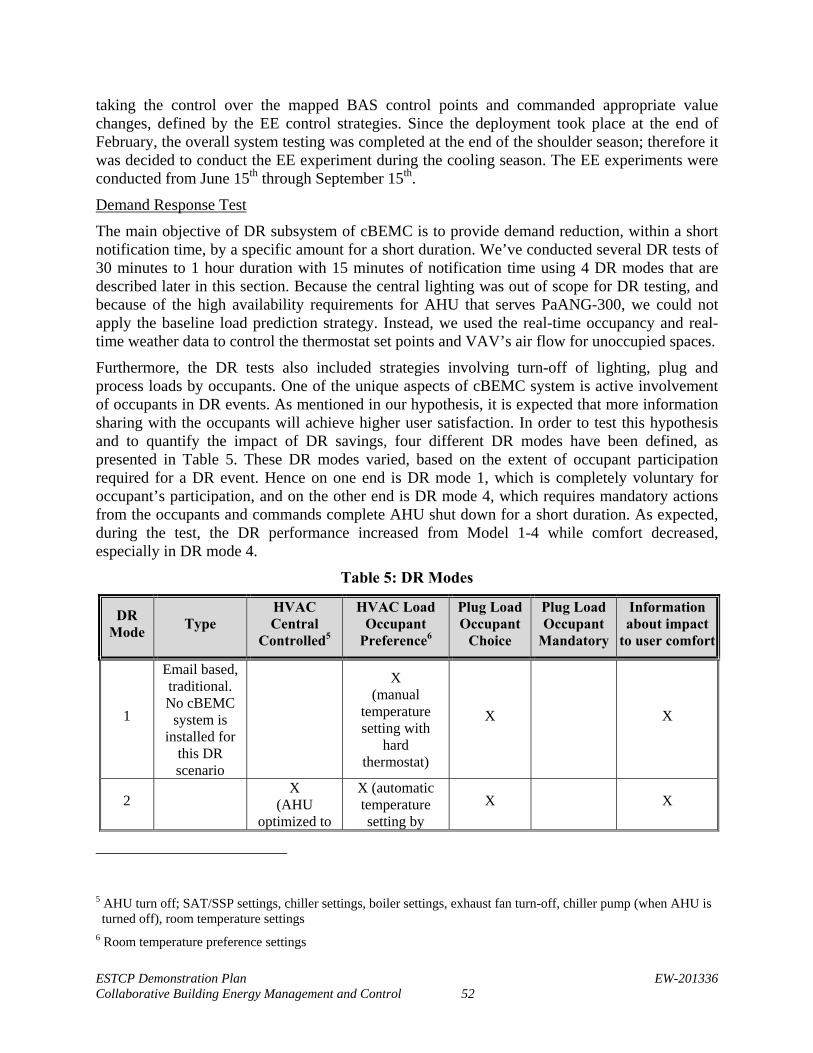
ESTCP Demonstration Plan EW-201336 Collaborative Building Energy Management and Control 52
taking the control over the mapped BAS control points and commanded appropriate value changes, defined by the EE control strategies. Since the deployment took place at the end of February, the overall system testing was completed at the end of the shoulder season; therefore it was decided to conduct the EE experiment during the cooling season. The EE experiments were conducted from June 15th through September 15th.
Demand Response Test
The main objective of DR subsystem of cBEMC is to provide demand reduction, within a short notification time, by a specific amount for a short duration. We’ve conducted several DR tests of 30 minutes to 1 hour duration with 15 minutes of notification time using 4 DR modes that are described later in this section. Because the central lighting was out of scope for DR testing, and because of the high availability requirements for AHU that serves PaANG-300, we could not apply the baseline load prediction strategy. Instead, we used the real-time occupancy and real-time weather data to control the thermostat set points and VAV’s air flow for unoccupied spaces.
Furthermore, the DR tests also included strategies involving turn-off of lighting, plug and process loads by occupants. One of the unique aspects of cBEMC system is active involvement of occupants in DR events. As mentioned in our hypothesis, it is expected that more information sharing with the occupants will achieve higher user satisfaction. In order to test this hypothesis and to quantify the impact of DR savings, four different DR modes have been defined, as presented in Table 5. These DR modes varied, based on the extent of occupant participation required for a DR event. Hence on one end is DR mode 1, which is completely voluntary for occupant’s participation, and on the other end is DR mode 4, which requires mandatory actions from the occupants and commands complete AHU shut down for a short duration. As expected, during the test, the DR performance increased from Model 1-4 while comfort decreased, especially in DR mode 4.
Table 5: DR Modes
DR Mode
Type HVAC Central
Controlled5
HVAC Load Occupant
Preference6
Plug Load Occupant
Choice
Plug Load Occupant
Mandatory
Information about impact
to user comfort
1
Email based, traditional. No cBEMC
system is installed for
this DR scenario
X (manual
temperature setting with
hard thermostat)
X X
2 X
(AHU optimized to
X (automatic temperature setting by
X X
5 AHU turn off; SAT/SSP settings, chiller settings, boiler settings, exhaust fan turn-off, chiller pump (when AHU is turned off), room temperature settings
6 Room temperature preference settings
ESTCP Demonstration Plan EW-201336 Collaborative Building Energy Management and Control 53
follow occupant settings)
considering the occupant comfort
temperature band)
3 Unified Setback
X X X
4 Unified Setback
X X X
5.1.4 Test Phases
The main test phases are described below:
Pre-test preparation: The operational data for PaANG-300 was collected from the walkthrough, interviews with PaANG 171 ARW facility team, the BAS trending system, occupancy logs, plug-load surveys and an electric metering system. The collected data was used to build a building energy model. It was also used for calibration of the model in TRNSYS software. At the same time, the SCT team worked on cBEMC customization to meet the site-specific needs.
BAS and equipment upgrades: This phase included automation equipment preparation before cBEMC commissioning. One automation panel was upgraded to support faster Ethernet communication with cBEMC controller, in comparison to the existing old panels supporting only serial communication. Also three electrical sub-meters and two HVAC hot water submitters were installed in order to isolate electrical loads and hot water consumption for the second floor of PaANG-300.
Baseline characterization: In order to predict the building dynamics with better accuracy and establish a realistic baseline of the building, the cBEMC established runtime data collection 6 months prior to cBEMC commissioning. The cBEMC required simulations to evaluate alternatives and, through comparison to the site baseline and/or to industry practice norms, to compute EE settings for HVAC. The building simulation model was built specifically for PaANG-300, because the precision of the building baseline is particularly important for the EE experiment. Please note that although the data that was initially collected during the heating season helped to develop a comprehensive TRNSYS model, it couldn’t be used for the cBEMC testing, since the actual tests took place during the cooling season. Eventually, only 2.5 weeks of cooling data was used to apply TRNSYS energy analytics as described in section 5.2.2
Simulation based validation of control settings: The integrity of the cBEMC hardware and software as well as runtime logic of EE and Demand Management was tested in simulation environment at SCT’s Princeton facilities. The various DR-modes strategies were also validated using TRNSYS model.
System Installation and Commissioning: This phase included the site preparation for the cBEMC commissioning – configuration of control automation points and sensor reading points; cBEMC hardware acquisition and configuration, including routers, cables, cBEMC runtime station, and cBEMC occupant kiosks. The commissioning and staff training at PaANG 171 ARW took place on February 20th, 2014.
ESTCP Demonstration Plan EW-201336 Collaborative Building Energy Management and Control 54
Design of experiment and testing EE hypotheses: This step involved running the design of experiments to accept or reject the EE hypothesis that was formulated earlier in this chapter.
Design of experiment and testing Demand Management hypotheses – This step involved running the design of experiments to accept or reject the demand management hypothesis that was formulated earlier in this chapter.
5.2 BASELINE CHARACTERIZATION
5.2.1 Reference Conditions
The following data were collected for baseline characterization and used as reference conditions to assess each performance objective:
– Indoor temperatures and humidity values. – Boiler supply water flow and temperature; return water temperature. – Chiller supply water flow and temperature; return water temperature. – VAV supply air flow and temperature. VAV damper and valve positions. – Lighting and plug load consumption. – All building electrical consumption. – Weather conditions (temperature, humidity, wind speed, wind direction, and solar
radiation). – The level of activity of the FM.
5.2.2 Baseline Collection Period
As mentioned in section 5.1.4, a comprehensive trend collection for the baseline characterization began at the end of August 2013 for heating season. However due to cBEMC commissioning delays a stable version of cBEMC didn’t become available until April, 2014. Thus, the initial baseline, that was collected for the heating season became obsolete. Moreover, a faulty outdoor flow meter and erratic behavior of CO2 sensor prevented conducting energy consumption analysis and model calibration. Addressing these issues also contributed to the delays during system testing. In addition, during the final phase of system testing in June 2014, it was determined that some of VAV controllers that serve PaANG-300 were not tuned for complete air damper closure during the night mode, as described in chapter 8. Fixing the damper closure issue created yet another delay of the baseline characterization for the cooling season. Finally, the baseline for cooling season was collected in August 2014. The cBEMC used 2.5 weeks of baseline data for the final cBEMC testing for the cooling season.
5.2.3 Existing Baseline Data
The site utility bill for the year 2011 and 2012 could not be used to establish the baseline because it is a campus wide utility bill with no breakdown by buildings (4-5 buildings).Therefore the team investigated and developed alternative strategies to estimate baseline using simulation software calibrated with onsite measurements.
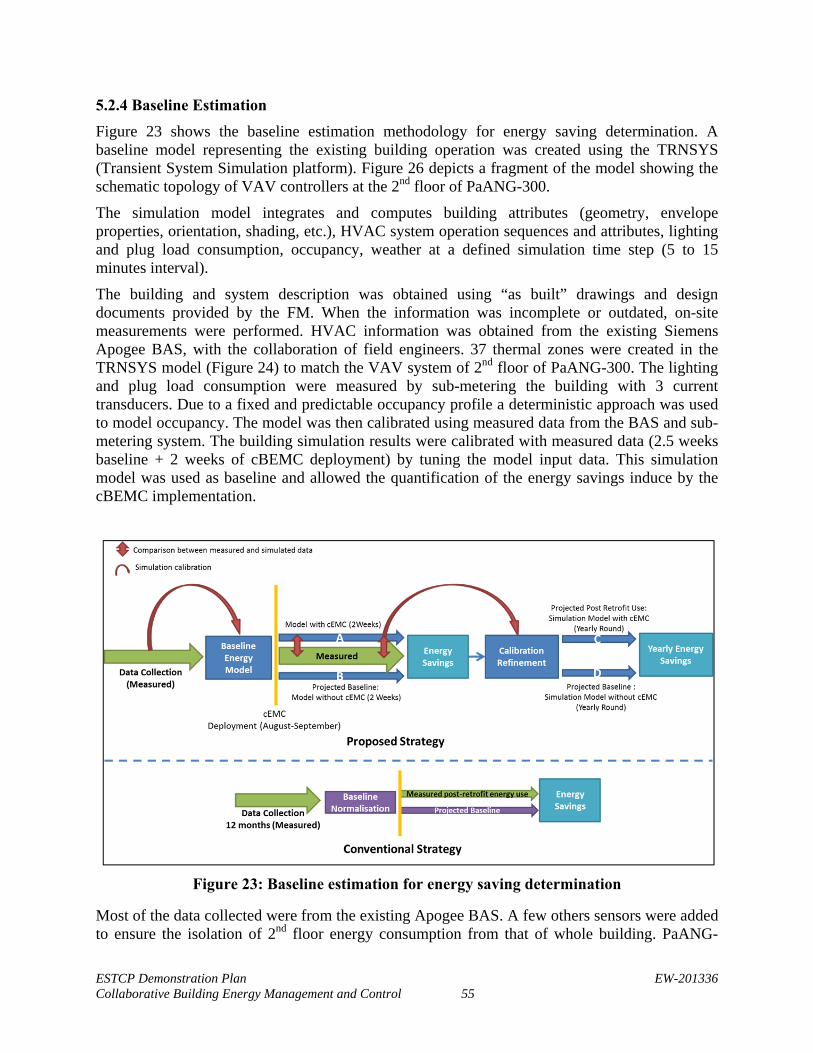
ESTCP Demonstration Plan EW-201336 Collaborative Building Energy Management and Control 55
5.2.4 Baseline Estimation
Figure 23 shows the baseline estimation methodology for energy saving determination. A baseline model representing the existing building operation was created using the TRNSYS (Transient System Simulation platform). Figure 26 depicts a fragment of the model showing the schematic topology of VAV controllers at the 2nd floor of PaANG-300.
The simulation model integrates and computes building attributes (geometry, envelope properties, orientation, shading, etc.), HVAC system operation sequences and attributes, lighting and plug load consumption, occupancy, weather at a defined simulation time step (5 to 15 minutes interval).
The building and system description was obtained using “as built” drawings and design documents provided by the FM. When the information was incomplete or outdated, on-site measurements were performed. HVAC information was obtained from the existing Siemens Apogee BAS, with the collaboration of field engineers. 37 thermal zones were created in the TRNSYS model (Figure 24) to match the VAV system of 2nd floor of PaANG-300. The lighting and plug load consumption were measured by sub-metering the building with 3 current transducers. Due to a fixed and predictable occupancy profile a deterministic approach was used to model occupancy. The model was then calibrated using measured data from the BAS and sub-metering system. The building simulation results were calibrated with measured data (2.5 weeks baseline + 2 weeks of cBEMC deployment) by tuning the model input data. This simulation model was used as baseline and allowed the quantification of the energy savings induce by the cBEMC implementation.
Figure 23: Baseline estimation for energy saving determination
Most of the data collected were from the existing Apogee BAS. A few others sensors were added to ensure the isolation of 2nd floor energy consumption from that of whole building. PaANG-
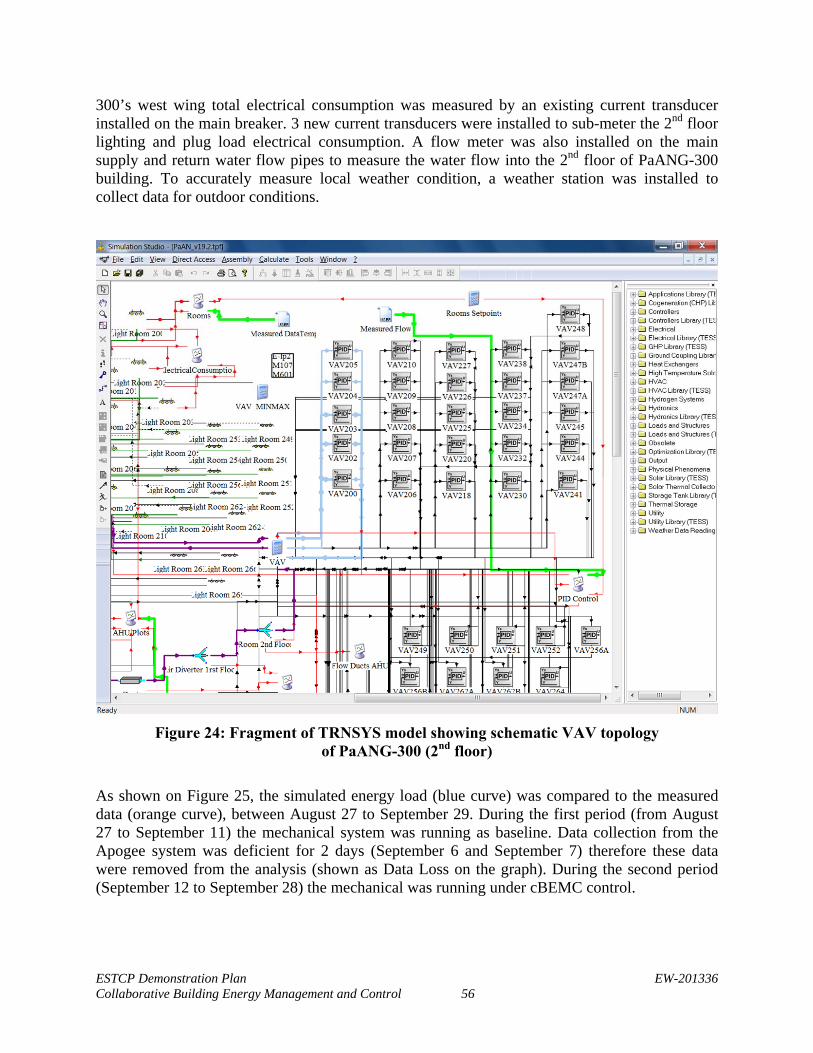
ESTCP Demonstration Plan EW-201336 Collaborative Building Energy Management and Control 56
300’s west wing total electrical consumption was measured by an existing current transducer installed on the main breaker. 3 new current transducers were installed to sub-meter the 2nd floor lighting and plug load electrical consumption. A flow meter was also installed on the main supply and return water flow pipes to measure the water flow into the 2nd floor of PaANG-300 building. To accurately measure local weather condition, a weather station was installed to collect data for outdoor conditions.
Figure 24: Fragment of TRNSYS model showing schematic VAV topology
of PaANG-300 (2nd floor)
As shown on Figure 25, the simulated energy load (blue curve) was compared to the measured data (orange curve), between August 27 to September 29. During the first period (from August 27 to September 11) the mechanical system was running as baseline. Data collection from the Apogee system was deficient for 2 days (September 6 and September 7) therefore these data were removed from the analysis (shown as Data Loss on the graph). During the second period (September 12 to September 28) the mechanical was running under cBEMC control.
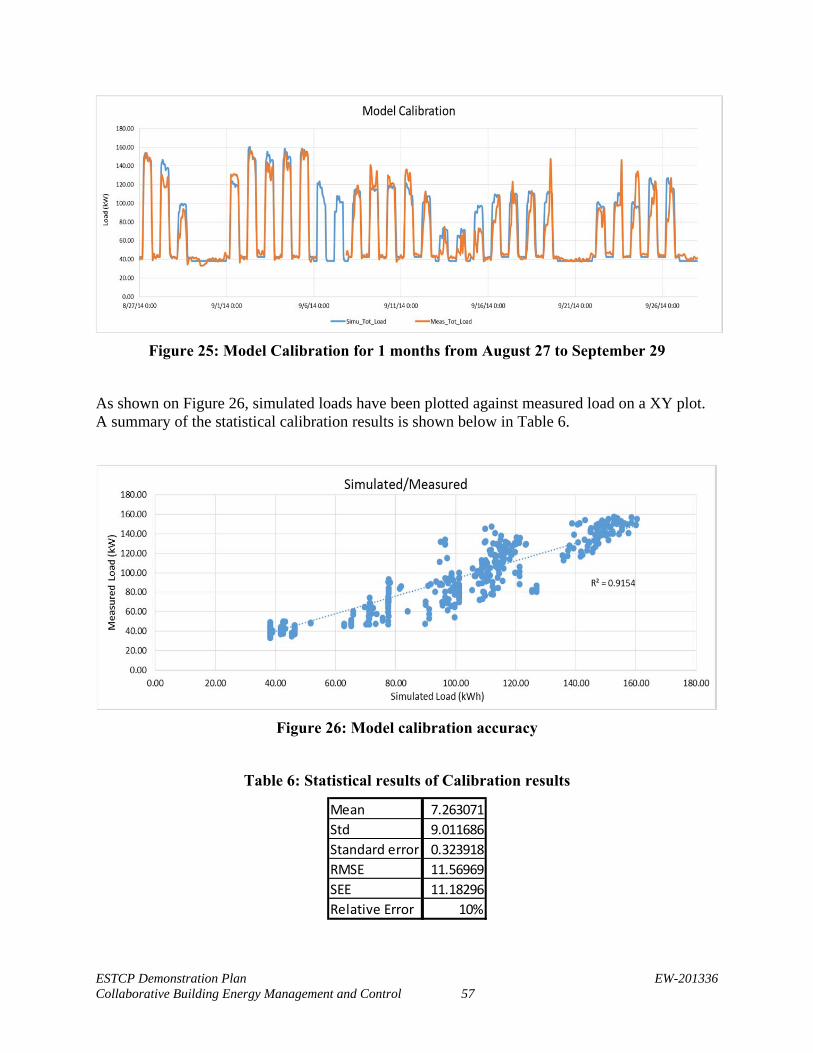
ESTCP Demonstration Plan EW-201336 Collaborative Building Energy Management and Control 57
Figure 25: Model Calibration for 1 months from August 27 to September 29
As shown on Figure 26, simulated loads have been plotted against measured load on a XY plot. A summary of the statistical calibration results is shown below in Table 6.
Figure 26: Model calibration accuracy
Table 6: Statistical results of Calibration results
Mean 7.263071
Std 9.011686
Standard error 0.323918
RMSE 11.56969
SEE 11.18296
Relative Error 10%
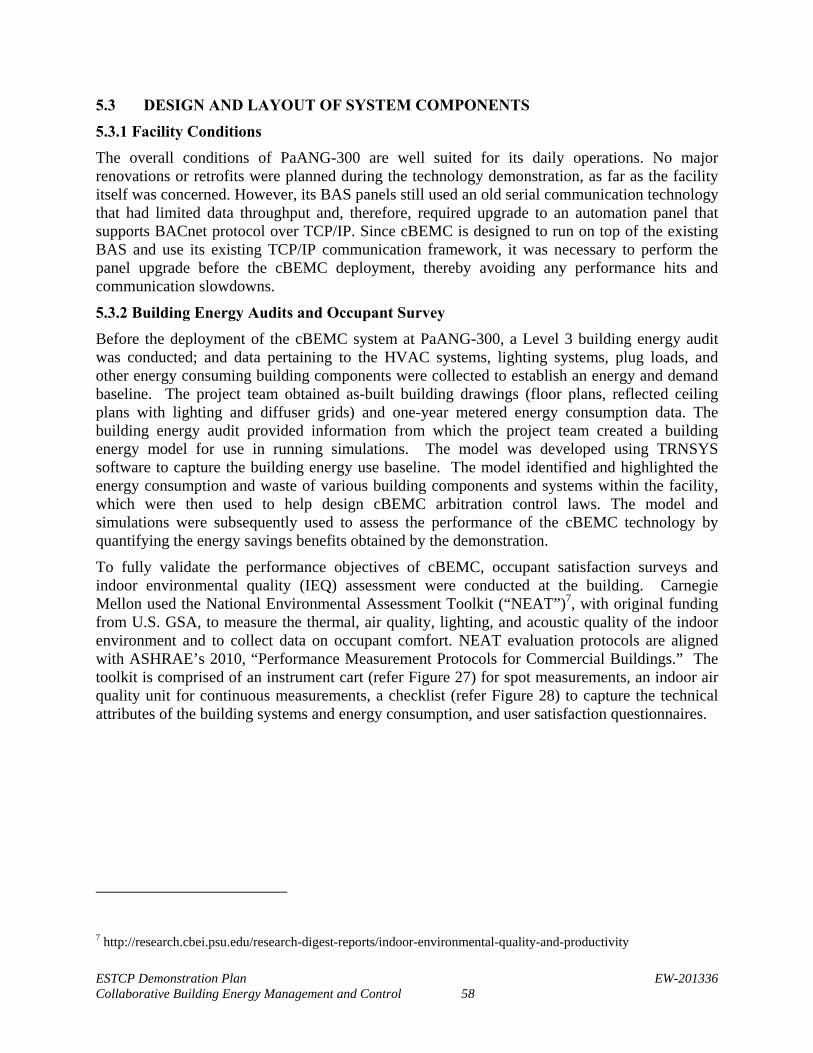
ESTCP Demonstration Plan EW-201336 Collaborative Building Energy Management and Control 58
5.3 DESIGN AND LAYOUT OF SYSTEM COMPONENTS
5.3.1 Facility Conditions
The overall conditions of PaANG-300 are well suited for its daily operations. No major renovations or retrofits were planned during the technology demonstration, as far as the facility itself was concerned. However, its BAS panels still used an old serial communication technology that had limited data throughput and, therefore, required upgrade to an automation panel that supports BACnet protocol over TCP/IP. Since cBEMC is designed to run on top of the existing BAS and use its existing TCP/IP communication framework, it was necessary to perform the panel upgrade before the cBEMC deployment, thereby avoiding any performance hits and communication slowdowns.
5.3.2 Building Energy Audits and Occupant Survey
Before the deployment of the cBEMC system at PaANG-300, a Level 3 building energy audit was conducted; and data pertaining to the HVAC systems, lighting systems, plug loads, and other energy consuming building components were collected to establish an energy and demand baseline. The project team obtained as-built building drawings (floor plans, reflected ceiling plans with lighting and diffuser grids) and one-year metered energy consumption data. The building energy audit provided information from which the project team created a building energy model for use in running simulations. The model was developed using TRNSYS software to capture the building energy use baseline. The model identified and highlighted the energy consumption and waste of various building components and systems within the facility, which were then used to help design cBEMC arbitration control laws. The model and simulations were subsequently used to assess the performance of the cBEMC technology by quantifying the energy savings benefits obtained by the demonstration.
To fully validate the performance objectives of cBEMC, occupant satisfaction surveys and indoor environmental quality (IEQ) assessment were conducted at the building. Carnegie Mellon used the National Environmental Assessment Toolkit (“NEAT”)7, with original funding from U.S. GSA, to measure the thermal, air quality, lighting, and acoustic quality of the indoor environment and to collect data on occupant comfort. NEAT evaluation protocols are aligned with ASHRAE’s 2010, “Performance Measurement Protocols for Commercial Buildings.” The toolkit is comprised of an instrument cart (refer Figure 27) for spot measurements, an indoor air quality unit for continuous measurements, a checklist (refer Figure 28) to capture the technical attributes of the building systems and energy consumption, and user satisfaction questionnaires.
7 http://research.cbei.psu.edu/research-digest-reports/indoor-environmental-quality-and-productivity
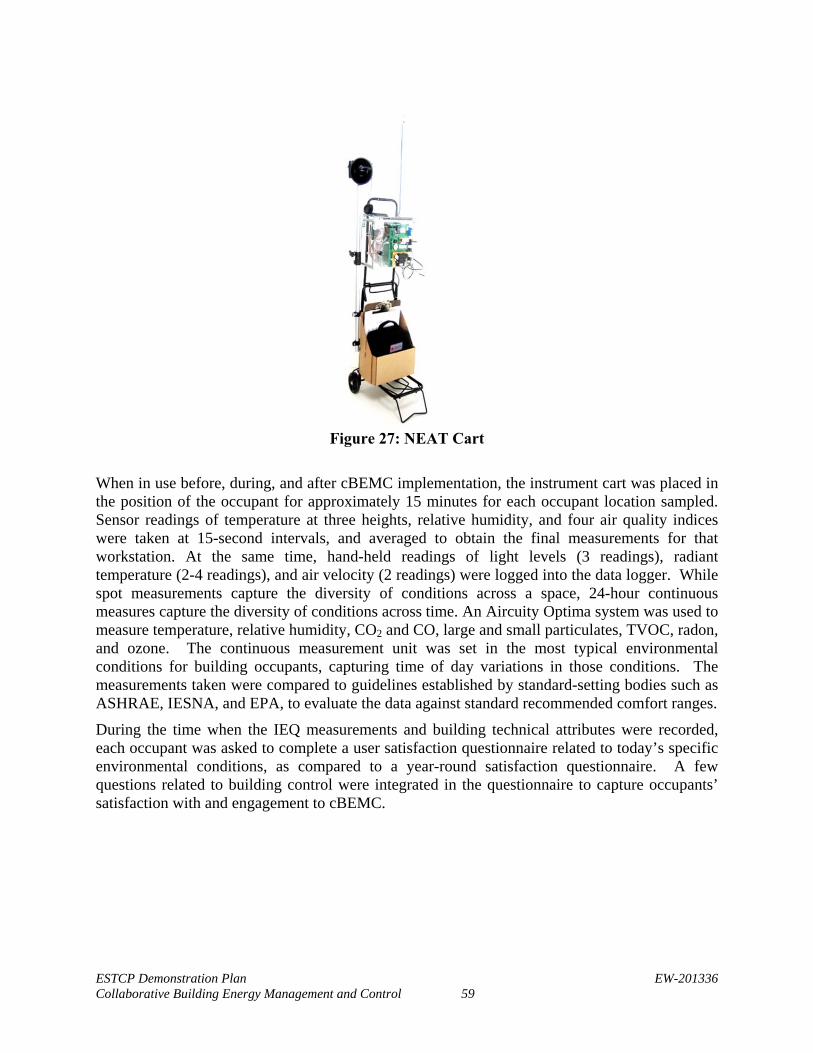
ESTCP Demonstration Plan EW-201336 Collaborative Building Energy Management and Control 59
Figure 27: NEAT Cart
When in use before, during, and after cBEMC implementation, the instrument cart was placed in the position of the occupant for approximately 15 minutes for each occupant location sampled. Sensor readings of temperature at three heights, relative humidity, and four air quality indices were taken at 15-second intervals, and averaged to obtain the final measurements for that workstation. At the same time, hand-held readings of light levels (3 readings), radiant temperature (2-4 readings), and air velocity (2 readings) were logged into the data logger. While spot measurements capture the diversity of conditions across a space, 24-hour continuous measures capture the diversity of conditions across time. An Aircuity Optima system was used to measure temperature, relative humidity, CO2 and CO, large and small particulates, TVOC, radon, and ozone. The continuous measurement unit was set in the most typical environmental conditions for building occupants, capturing time of day variations in those conditions. The measurements taken were compared to guidelines established by standard-setting bodies such as ASHRAE, IESNA, and EPA, to evaluate the data against standard recommended comfort ranges.
During the time when the IEQ measurements and building technical attributes were recorded, each occupant was asked to complete a user satisfaction questionnaire related to today’s specific environmental conditions, as compared to a year-round satisfaction questionnaire. A few questions related to building control were integrated in the questionnaire to capture occupants’ satisfaction with and engagement to cBEMC.
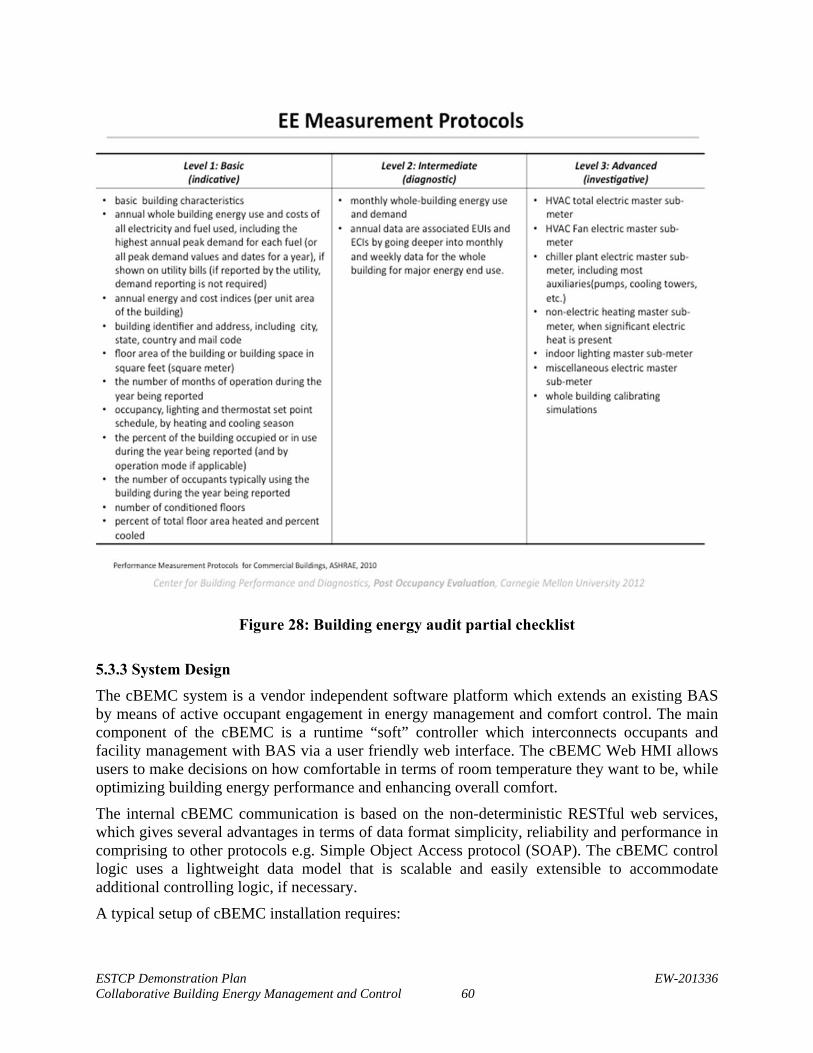
ESTCP Demonstration Plan EW-201336 Collaborative Building Energy Management and Control 60
Figure 28: Building energy audit partial checklist
5.3.3 System Design
The cBEMC system is a vendor independent software platform which extends an existing BAS by means of active occupant engagement in energy management and comfort control. The main component of the cBEMC is a runtime “soft” controller which interconnects occupants and facility management with BAS via a user friendly web interface. The cBEMC Web HMI allows users to make decisions on how comfortable in terms of room temperature they want to be, while optimizing building energy performance and enhancing overall comfort.
The internal cBEMC communication is based on the non-deterministic RESTful web services, which gives several advantages in terms of data format simplicity, reliability and performance in comprising to other protocols e.g. Simple Object Access protocol (SOAP). The cBEMC control logic uses a lightweight data model that is scalable and easily extensible to accommodate additional controlling logic, if necessary.
A typical setup of cBEMC installation requires:
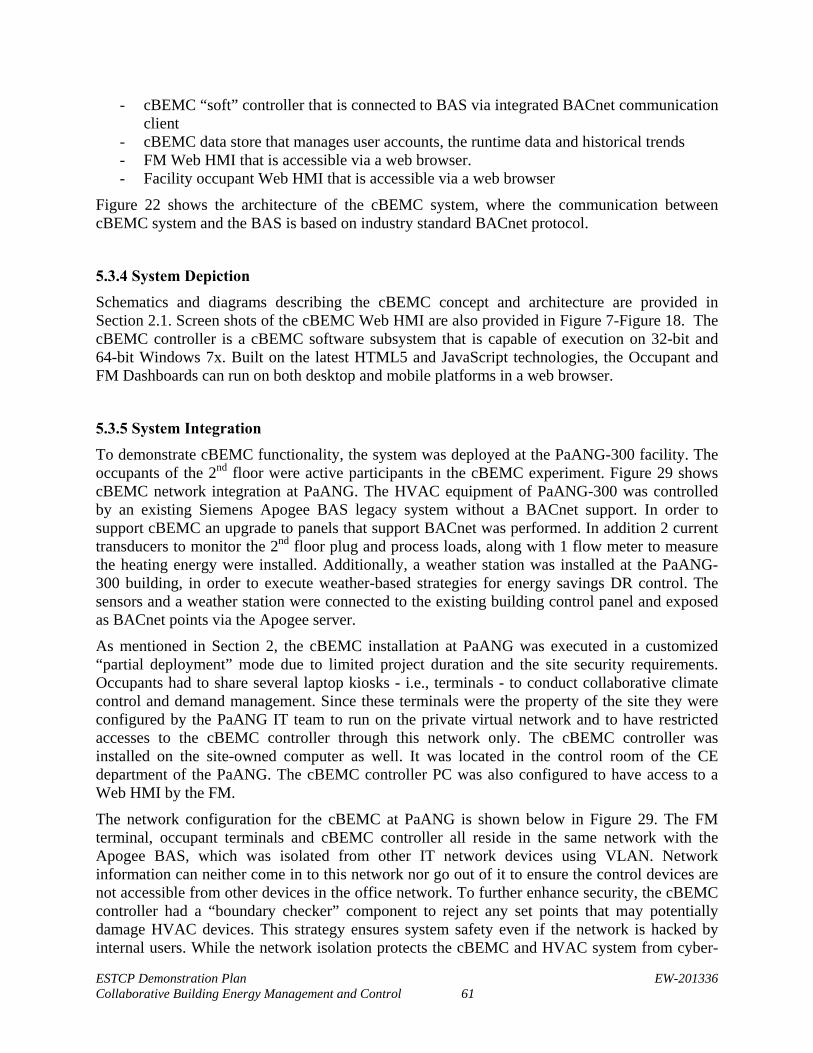
ESTCP Demonstration Plan EW-201336 Collaborative Building Energy Management and Control 61
- cBEMC “soft” controller that is connected to BAS via integrated BACnet communication client
- cBEMC data store that manages user accounts, the runtime data and historical trends - FM Web HMI that is accessible via a web browser. - Facility occupant Web HMI that is accessible via a web browser
Figure 22 shows the architecture of the cBEMC system, where the communication between cBEMC system and the BAS is based on industry standard BACnet protocol.
5.3.4 System Depiction
Schematics and diagrams describing the cBEMC concept and architecture are provided in Section 2.1. Screen shots of the cBEMC Web HMI are also provided in Figure 7-Figure 18. The cBEMC controller is a cBEMC software subsystem that is capable of execution on 32-bit and 64-bit Windows 7x. Built on the latest HTML5 and JavaScript technologies, the Occupant and FM Dashboards can run on both desktop and mobile platforms in a web browser.
5.3.5 System Integration
To demonstrate cBEMC functionality, the system was deployed at the PaANG-300 facility. The occupants of the 2nd floor were active participants in the cBEMC experiment. Figure 29 shows cBEMC network integration at PaANG. The HVAC equipment of PaANG-300 was controlled by an existing Siemens Apogee BAS legacy system without a BACnet support. In order to support cBEMC an upgrade to panels that support BACnet was performed. In addition 2 current transducers to monitor the 2nd floor plug and process loads, along with 1 flow meter to measure the heating energy were installed. Additionally, a weather station was installed at the PaANG-300 building, in order to execute weather-based strategies for energy savings DR control. The sensors and a weather station were connected to the existing building control panel and exposed as BACnet points via the Apogee server.
As mentioned in Section 2, the cBEMC installation at PaANG was executed in a customized “partial deployment” mode due to limited project duration and the site security requirements. Occupants had to share several laptop kiosks - i.e., terminals - to conduct collaborative climate control and demand management. Since these terminals were the property of the site they were configured by the PaANG IT team to run on the private virtual network and to have restricted accesses to the cBEMC controller through this network only. The cBEMC controller was installed on the site-owned computer as well. It was located in the control room of the CE department of the PaANG. The cBEMC controller PC was also configured to have access to a Web HMI by the FM.
The network configuration for the cBEMC at PaANG is shown below in Figure 29. The FM terminal, occupant terminals and cBEMC controller all reside in the same network with the Apogee BAS, which was isolated from other IT network devices using VLAN. Network information can neither come in to this network nor go out of it to ensure the control devices are not accessible from other devices in the office network. To further enhance security, the cBEMC controller had a “boundary checker” component to reject any set points that may potentially damage HVAC devices. This strategy ensures system safety even if the network is hacked by internal users. While the network isolation protects the cBEMC and HVAC system from cyber-
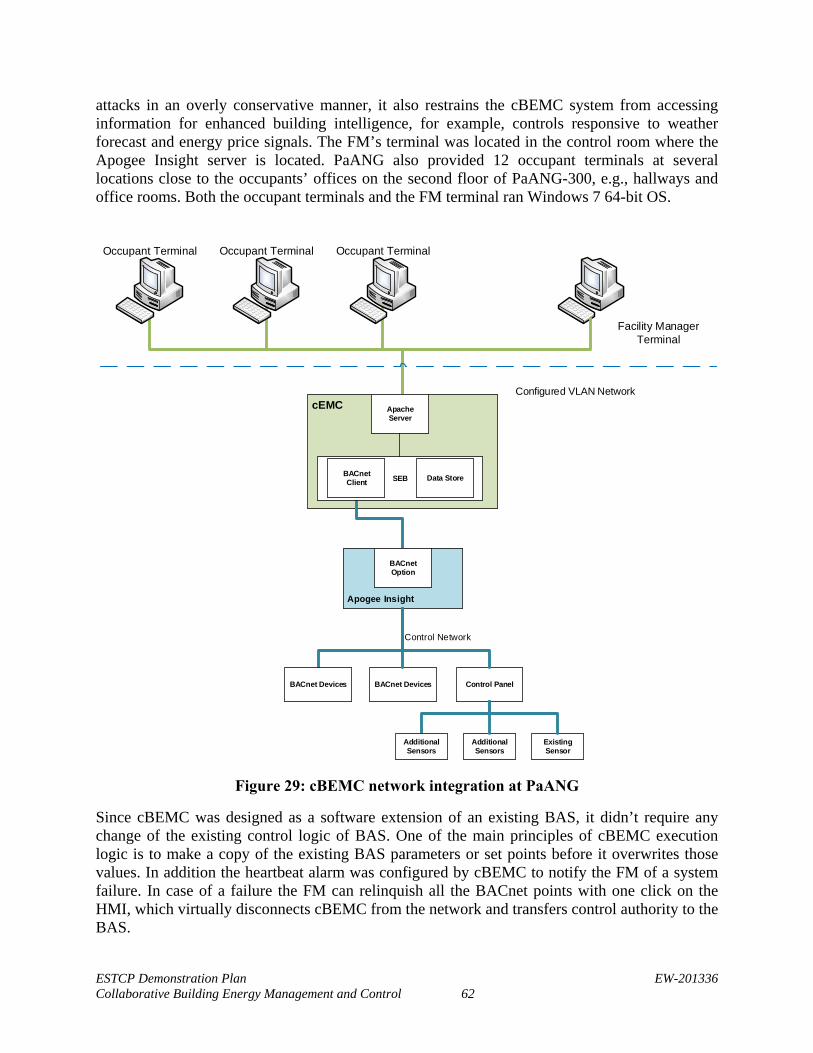
ESTCP Demonstration Plan EW-201336 Collaborative Building Energy Management and Control 62
attacks in an overly conservative manner, it also restrains the cBEMC system from accessing information for enhanced building intelligence, for example, controls responsive to weather forecast and energy price signals. The FM’s terminal was located in the control room where the Apogee Insight server is located. PaANG also provided 12 occupant terminals at several locations close to the occupants’ offices on the second floor of PaANG-300, e.g., hallways and office rooms. Both the occupant terminals and the FM terminal ran Windows 7 64-bit OS.
Configured VLAN Network
Occupant Terminal Occupant Terminal Occupant Terminal
cEMC Apache Server
Facility Manager Terminal
BACnet
Apogee Insight
BACnet Devices BACnet Devices Control Panel
Control Network
SEB
Additional Sensors
Additional Sensors
Existing Sensor
BACnet Option
BACnet Client Data Store
Figure 29: cBEMC network integration at PaANG
Since cBEMC was designed as a software extension of an existing BAS, it didn’t require any change of the existing control logic of BAS. One of the main principles of cBEMC execution logic is to make a copy of the existing BAS parameters or set points before it overwrites those values. In addition the heartbeat alarm was configured by cBEMC to notify the FM of a system failure. In case of a failure the FM can relinquish all the BACnet points with one click on the HMI, which virtually disconnects cBEMC from the network and transfers control authority to the BAS.
ESTCP Demonstration Plan EW-201336 Collaborative Building Energy Management and Control 63
5.3.4 System Controls
During cBEMC demonstration, the FM and the occupants had a limited control of each room’s temperature using a virtual thermostat feature, provided by cBEMC via Web HMI. While the occupants could change their zone temperature settings indirectly, the FM has a final decision on building energy policy. The FM had the authority to monitor and control the BASes using both the existing BAS HMI and cBEMC FM Dashboard as shown in Figure 30.
Figure 30: FM system control interfaces
In addition, the cBEMC demonstration was focused on testing and evaluating several innovative features based on the following scenarios:
a. Occupants and FM interactions with temperature and ventilation control;
b. Occupants monitor their own energy savings and collaborate with each other to achieve whole building energy savings;
c. Occupants and FM use social networking to communicate and solve discomfort issues;
d. Occupants’ schedule information allows setback on zone temperature and ventilation control to achieve energy saving;
e. Occupants receive transparent, action-oriented DR information from FM and get actively engaged in the DR process;
f. FM has multiple options to balance the DR target and occupants’ productivity;
g. FM monitors DR process in the real-time and control the process.
h. FM review aggregated, holistic occupants’ information, such as, preference, schedule, satisfaction, energy saving, DR action acceptance, and activities within the embedded social network.
cBEMC HMI BAS HMI (Apogee Insight)
ESTCP Demonstration Plan EW-201336 Collaborative Building Energy Management and Control 64
5.4 OPERATIONAL TESTING
The operational testing of the cBEMC was based on the following operational scenarios:
cBEMC EE Test Scenario (cooling season) – EE test for a PaANG-300 building during the cooling season were conducted using AH facilities at USAFA in the period of 3 months July 15 - September 15, 2014 with 2 breaks for the baseline development (June 13 – June 25; August 26 – September 11).
cBEMC DR Test Scenario (cooling season) – 2 DR site tests for PaANG-300 building were conducted during the cooling season in the month of July. These tests included application of all 4 DR modes that are described in section 6.2.
5.4.1 cBEMC Energy Efficiency Test Scenario
Duration: 8 weeks
Configuration: cBEMC configured with rule-based EE strategies for the PaANG-300 automation zones based on the occupants room temperature input, occupancy schedule and current weather conditions.
Requirements of facility occupants:
Provided up-to-date time-out calendar. Provided up-to-date weekly work schedule.
Requirements of FM:
Provided outdoor temperature sensor reading, which is part of the installed HVAC system, via BAS data point to cBEMC.
Monitored controlling strategies and availability of the deployed cBEMC system.
FM control access:
Can switch the building from normal operation to cBEMC-EE operation (weather, comfort and occupancy-based control strategy adopted).
Can monitor zone setting (temperature set points); AHU setting (On/Off), and analyze the changes from a normal operation.
Can relinquish the Apogee control points back to normal operations at the end of the test or for unforeseen events.
Figure 31 depicts the operational sequence of the temperature arbitration within cBEMC for EE tests at PaANG.
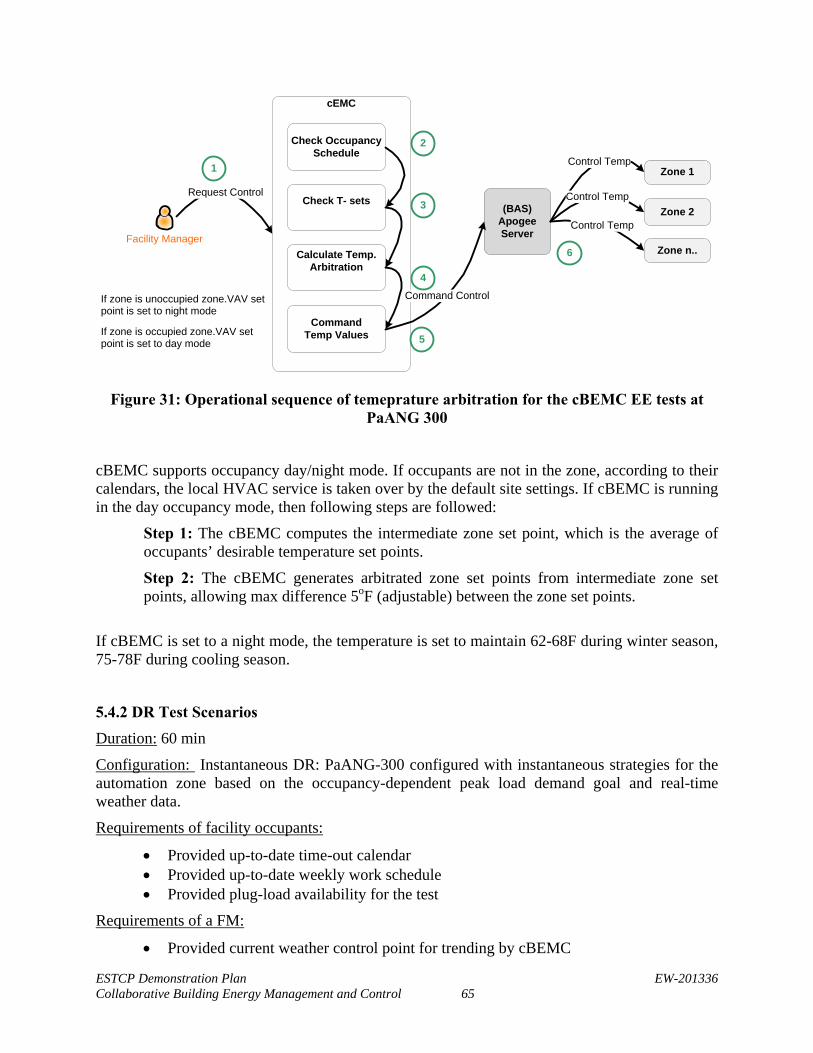
ESTCP Demonstration Plan EW-201336 Collaborative Building Energy Management and Control 65
(BAS)ApogeeServer
Request Control
1
Facility Manager
Zone 1
Zone 2
Zone n..
Control Temp
Control Temp
Control Temp
cEMC
Check Occupancy Schedule
Check T- sets
Calculate Temp. Arbitration
CommandTemp Values
Command Control
2
3
4
5
6
If zone is unoccupied zone.VAV set point is set to night mode
If zone is occupied zone.VAV set point is set to day mode
Figure 31: Operational sequence of temeprature arbitration for the cBEMC EE tests at
PaANG 300
cBEMC supports occupancy day/night mode. If occupants are not in the zone, according to their calendars, the local HVAC service is taken over by the default site settings. If cBEMC is running in the day occupancy mode, then following steps are followed:
Step 1: The cBEMC computes the intermediate zone set point, which is the average of occupants’ desirable temperature set points.
Step 2: The cBEMC generates arbitrated zone set points from intermediate zone set points, allowing max difference 5oF (adjustable) between the zone set points.
If cBEMC is set to a night mode, the temperature is set to maintain 62-68F during winter season, 75-78F during cooling season.
5.4.2 DR Test Scenarios
Duration: 60 min
Configuration: Instantaneous DR: PaANG-300 configured with instantaneous strategies for the automation zone based on the occupancy-dependent peak load demand goal and real-time weather data.
Requirements of facility occupants:
Provided up-to-date time-out calendar Provided up-to-date weekly work schedule Provided plug-load availability for the test
Requirements of a FM:
Provided current weather control point for trending by cBEMC
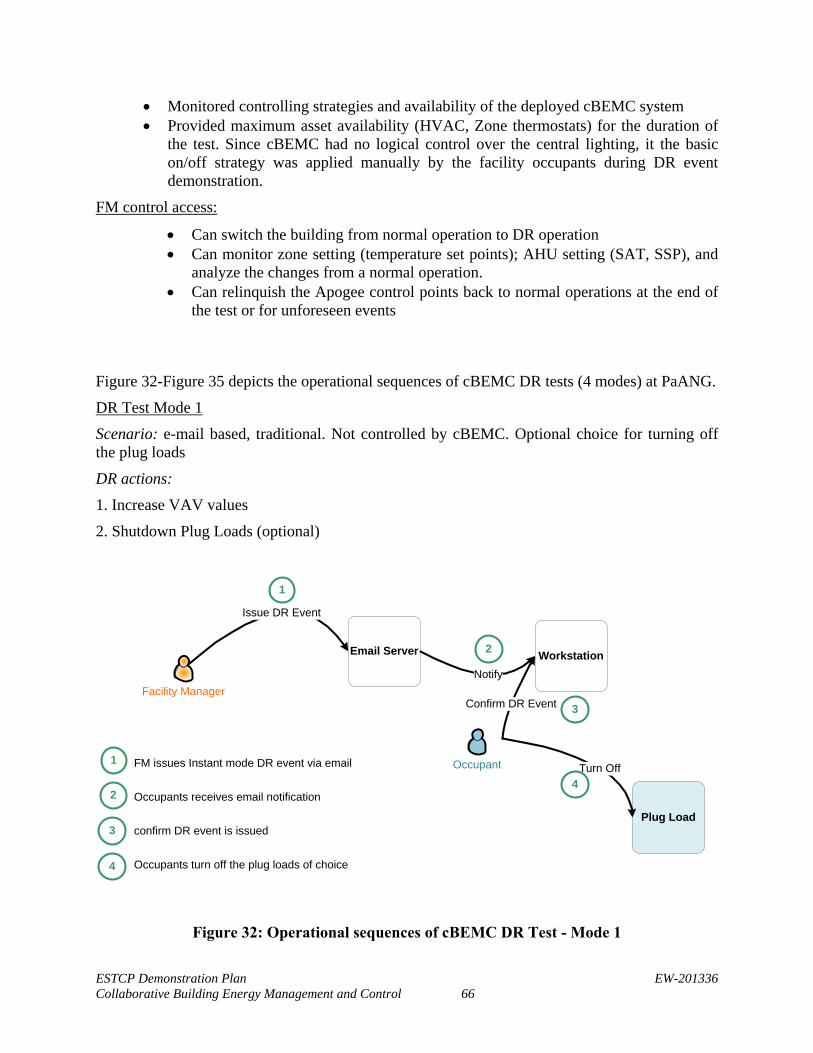
ESTCP Demonstration Plan EW-201336 Collaborative Building Energy Management and Control 66
Monitored controlling strategies and availability of the deployed cBEMC system Provided maximum asset availability (HVAC, Zone thermostats) for the duration of
the test. Since cBEMC had no logical control over the central lighting, it the basic on/off strategy was applied manually by the facility occupants during DR event demonstration.
FM control access:
Can switch the building from normal operation to DR operation Can monitor zone setting (temperature set points); AHU setting (SAT, SSP), and
analyze the changes from a normal operation. Can relinquish the Apogee control points back to normal operations at the end of
the test or for unforeseen events
Figure 32-Figure 35 depicts the operational sequences of cBEMC DR tests (4 modes) at PaANG.
DR Test Mode 1
Scenario: e-mail based, traditional. Not controlled by cBEMC. Optional choice for turning off the plug loads
DR actions:
1. Increase VAV values
2. Shutdown Plug Loads (optional)
Email Server
1
Issue DR Event
Facility Manager
FM issues Instant mode DR event via email
Occupants receives email notification
confirm DR event is issued
Occupants turn off the plug loads of choice
1
WorkstationNotify
Occupant
Plug Load
Confirm DR Event
Turn Off
3
2
42
3
4
Figure 32: Operational sequences of cBEMC DR Test - Mode 1
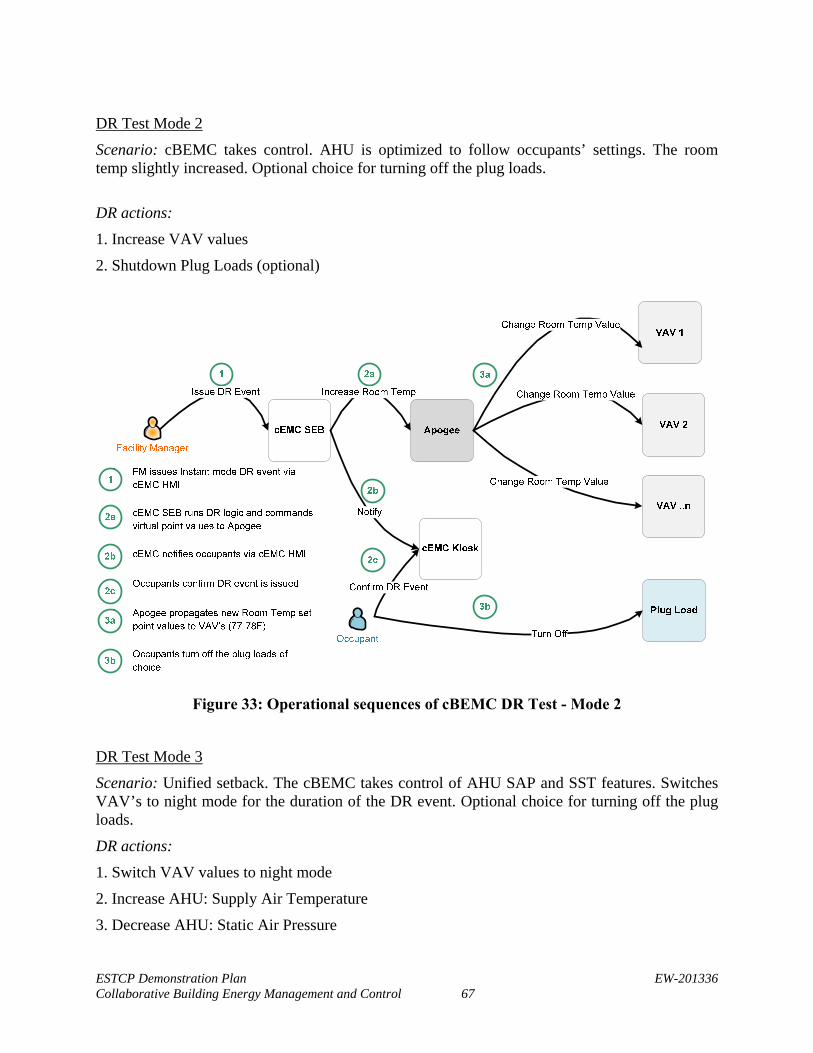
ESTCP Demonstration Plan EW-201336 Collaborative Building Energy Management and Control 67
DR Test Mode 2
Scenario: cBEMC takes control. AHU is optimized to follow occupants’ settings. The room temp slightly increased. Optional choice for turning off the plug loads.
DR actions:
1. Increase VAV values
2. Shutdown Plug Loads (optional)
Figure 33: Operational sequences of cBEMC DR Test - Mode 2
DR Test Mode 3
Scenario: Unified setback. The cBEMC takes control of AHU SAP and SST features. Switches VAV’s to night mode for the duration of the DR event. Optional choice for turning off the plug loads.
DR actions:
1. Switch VAV values to night mode
2. Increase AHU: Supply Air Temperature
3. Decrease AHU: Static Air Pressure
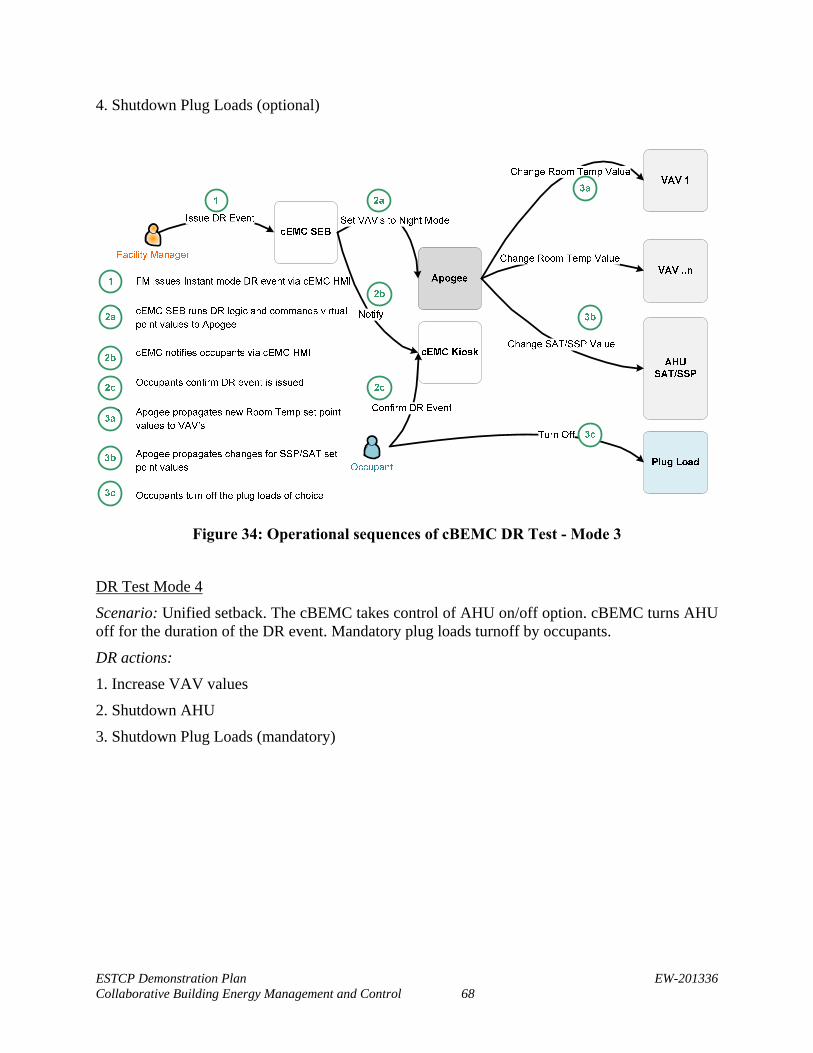
ESTCP Demonstration Plan EW-201336 Collaborative Building Energy Management and Control 68
4. Shutdown Plug Loads (optional)
Figure 34: Operational sequences of cBEMC DR Test - Mode 3
DR Test Mode 4
Scenario: Unified setback. The cBEMC takes control of AHU on/off option. cBEMC turns AHU off for the duration of the DR event. Mandatory plug loads turnoff by occupants.
DR actions:
1. Increase VAV values
2. Shutdown AHU
3. Shutdown Plug Loads (mandatory)
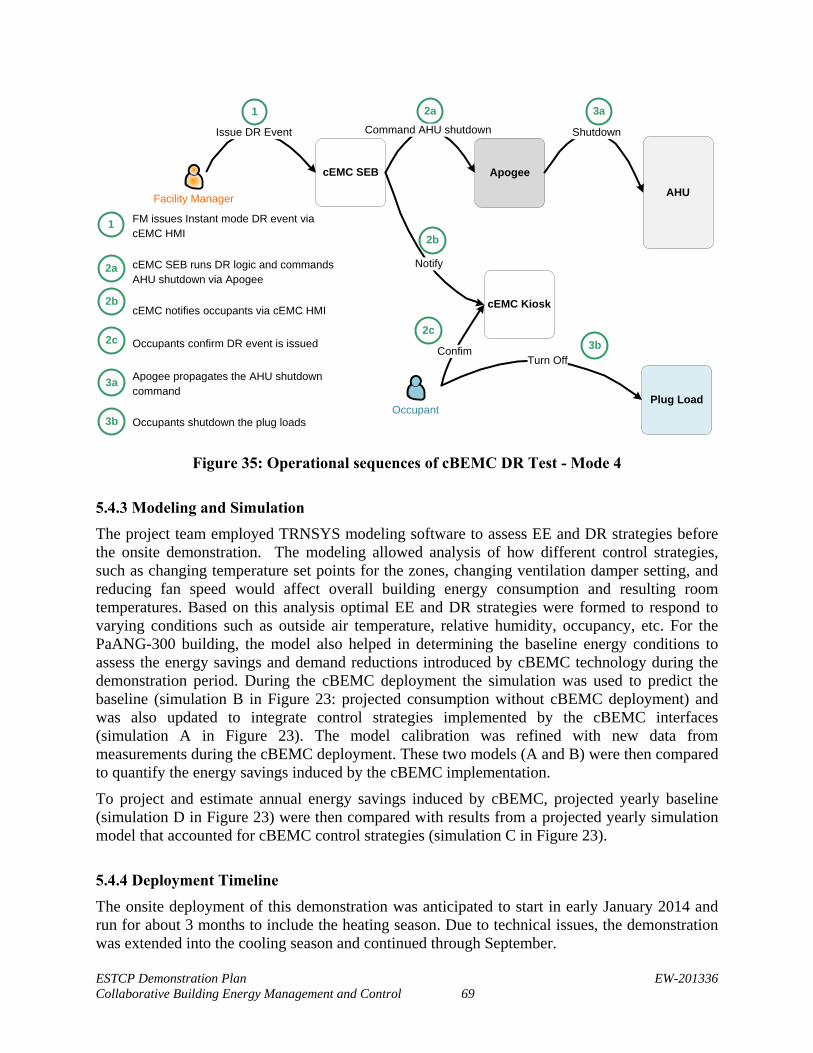
ESTCP Demonstration Plan EW-201336 Collaborative Building Energy Management and Control 69
cEMC SEB Apogee
1 2a
Issue DR Event Command AHU shutdown
AHU
Shutdown
FM issues Instant mode DR event via cEMC HMI
cEMC SEB runs DR logic and commands AHU shutdown via Apogee
cEMC notifies occupants via cEMC HMI
Occupants confirm DR event is issued
Apogee propagates the AHU shutdown command
Occupants shutdown the plug loads
1
cEMC Kiosk
Notify
OccupantPlug Load
ConfimTurn Off
2c
2b
3b
2a
2b
2c
3a
3b
3a
Facility Manager
Figure 35: Operational sequences of cBEMC DR Test - Mode 4
5.4.3 Modeling and Simulation
The project team employed TRNSYS modeling software to assess EE and DR strategies before the onsite demonstration. The modeling allowed analysis of how different control strategies, such as changing temperature set points for the zones, changing ventilation damper setting, and reducing fan speed would affect overall building energy consumption and resulting room temperatures. Based on this analysis optimal EE and DR strategies were formed to respond to varying conditions such as outside air temperature, relative humidity, occupancy, etc. For the PaANG-300 building, the model also helped in determining the baseline energy conditions to assess the energy savings and demand reductions introduced by cBEMC technology during the demonstration period. During the cBEMC deployment the simulation was used to predict the baseline (simulation B in Figure 23: projected consumption without cBEMC deployment) and was also updated to integrate control strategies implemented by the cBEMC interfaces (simulation A in Figure 23). The model calibration was refined with new data from measurements during the cBEMC deployment. These two models (A and B) were then compared to quantify the energy savings induced by the cBEMC implementation.
To project and estimate annual energy savings induced by cBEMC, projected yearly baseline (simulation D in Figure 23) were then compared with results from a projected yearly simulation model that accounted for cBEMC control strategies (simulation C in Figure 23).
5.4.4 Deployment Timeline
The onsite deployment of this demonstration was anticipated to start in early January 2014 and run for about 3 months to include the heating season. Due to technical issues, the demonstration was extended into the cooling season and continued through September.
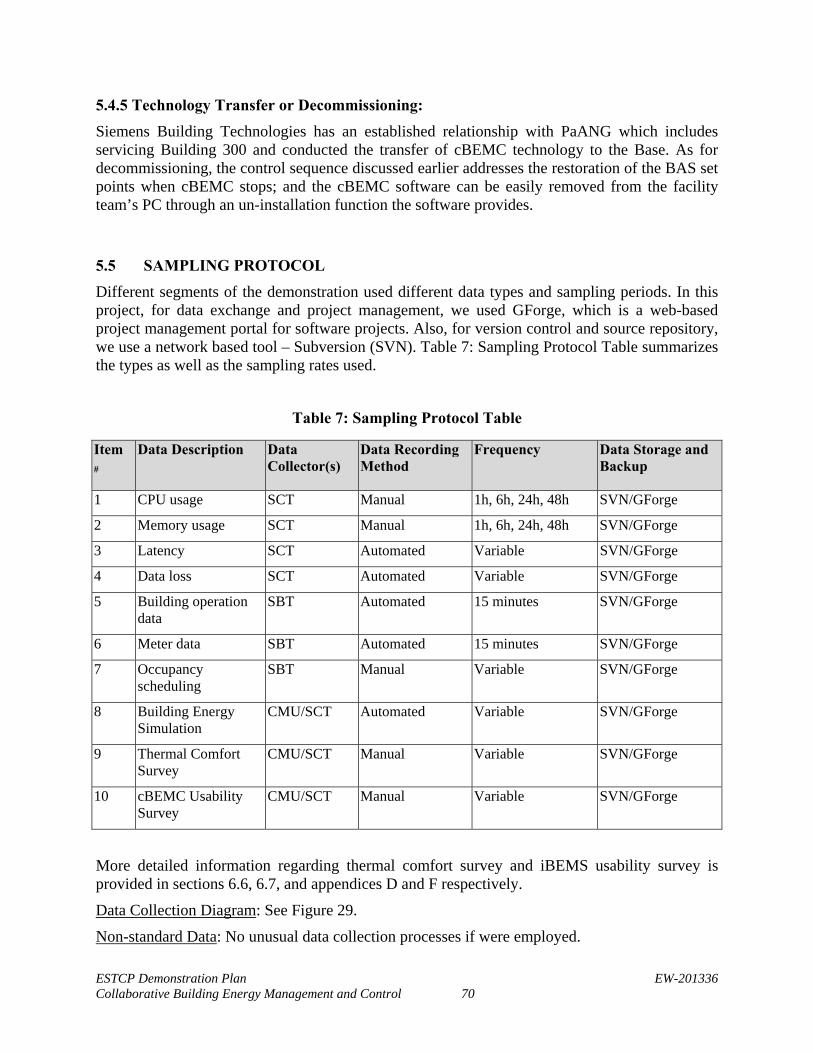
ESTCP Demonstration Plan EW-201336 Collaborative Building Energy Management and Control 70
5.4.5 Technology Transfer or Decommissioning:
Siemens Building Technologies has an established relationship with PaANG which includes servicing Building 300 and conducted the transfer of cBEMC technology to the Base. As for decommissioning, the control sequence discussed earlier addresses the restoration of the BAS set points when cBEMC stops; and the cBEMC software can be easily removed from the facility team’s PC through an un-installation function the software provides.
5.5 SAMPLING PROTOCOL
Different segments of the demonstration used different data types and sampling periods. In this project, for data exchange and project management, we used GForge, which is a web-based project management portal for software projects. Also, for version control and source repository, we use a network based tool – Subversion (SVN). Table 7: Sampling Protocol Table summarizes the types as well as the sampling rates used.
Table 7: Sampling Protocol Table
Item #
Data Description Data Collector(s)
Data Recording Method
Frequency Data Storage and Backup
1 CPU usage SCT Manual 1h, 6h, 24h, 48h SVN/GForge
2 Memory usage SCT Manual 1h, 6h, 24h, 48h SVN/GForge
3 Latency SCT Automated Variable SVN/GForge
4 Data loss SCT Automated Variable SVN/GForge
5 Building operation data
SBT Automated 15 minutes SVN/GForge
6 Meter data SBT Automated 15 minutes SVN/GForge
7 Occupancy scheduling
SBT Manual Variable SVN/GForge
8 Building Energy Simulation
CMU/SCT Automated Variable SVN/GForge
9 Thermal Comfort Survey
CMU/SCT Manual Variable SVN/GForge
10 cBEMC Usability Survey
CMU/SCT Manual Variable SVN/GForge
More detailed information regarding thermal comfort survey and iBEMS usability survey is provided in sections 6.6, 6.7, and appendices D and F respectively.
Data Collection Diagram: See Figure 29.
Non-standard Data: No unusual data collection processes if were employed.
ESTCP Demonstration Plan EW-201336 Collaborative Building Energy Management and Control 71
Survey Questionnaires: See Appendix B & C
5.6 SAMPLING RESULTS
Equipment Calibration: N/A
Quality Assurance Sampling: The CMU and SCT team performed an internal quality control (QC) process of its TRANSYS models to ensure that data collected was properly represented. Any planned actions to prevent findings that do not represent the true performance of the demonstrated technology caused by the demonstration process itself, such as variability in the equipment, inadequate data collection time, or uncontrolled variables, are described in Chapter 6.
ESTCP Demonstration Plan EW-201336 Collaborative Building Energy Management and Control 72
6.0 PERFORMANCE ASSESSMENT
The criteria for each of the Performance Objectives were measured (and, where appropriate, validated as follows:
6.1 PO-I: BUILDING ENERGY USE REDUCTION
Performance was measured as the difference between projected annual energy use under baseline and cBEMC conditions as extrapolated by applying the TRANSYS model to the heating-season test period measurements of gas and electric consumption.
The TRANSYS model was constructed to integrate building attributes of geometry, envelope properties, orientation, and shading; HVAC system operation sequences and attributes; lighting and plug load consumption; occupancy and schedules; and weather at 15-minute time intervals. After being created based on historic energy use, the model was validated by a trended data analysis of measurements taken by the demonstration team during the 6-month pre-test period. RMSE (root mean square error) and MBE (mean bias error) statistical indices were used to evaluate the accuracy of the model compared to field measured data. The validated model was extrapolated for a full year.
6.1.1 Baseline
In the project, we established a relatively strict baseline to quantify cBEMC performance. It is important to notice that we consider the energy performance of PaANG 300 before the project as pre-baseline. At the first stage of the project, the team optimized the energy performance of the PaANG 300 building without cBEMC and considered it as the baseline. We also compare PaANG 300 performance with the 5th percentile of the national office
These optimization activities include fixing hardware defects and optimizing control logic without cBEMC. The energy saving of cBEMC is the difference between the baseline and the energy consumption after cBEMC installed.
The activities of converting pre-baseline performance to the baseline performance, i.e., baseline optimization, include:
Replaced control panels for reliable and fast data trending. Replaced return duct CO2 sensor. Adjusted boiler and AHU schedules to minimize the operation time. For example, in the
pre-baseline scenarios, the AHU operated 24x7 in early May. Adjusted the AHU season mode switch logic. Detected damper stuck issue for the minimal outdoor air damper. Economizer logic is
adjusted accordingly.
The baseline energy performance is considered as the following control sequence of operation of the mechanical systems:
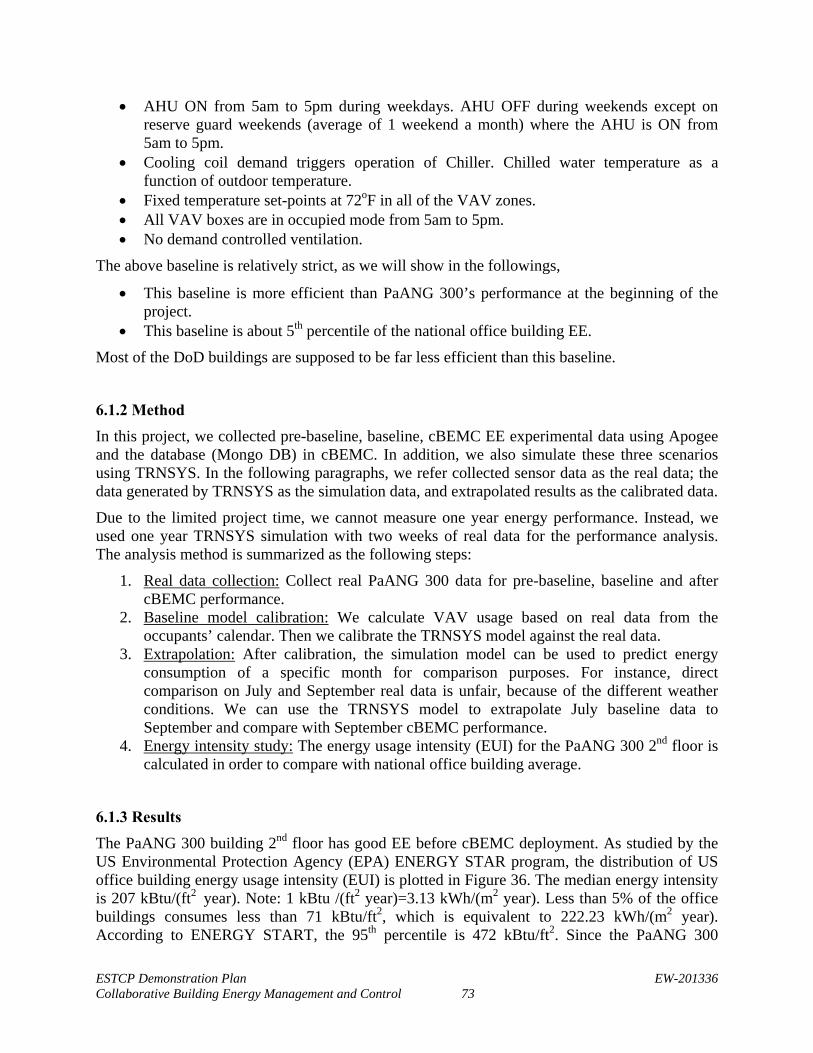
ESTCP Demonstration Plan EW-201336 Collaborative Building Energy Management and Control 73
AHU ON from 5am to 5pm during weekdays. AHU OFF during weekends except on reserve guard weekends (average of 1 weekend a month) where the AHU is ON from 5am to 5pm.
Cooling coil demand triggers operation of Chiller. Chilled water temperature as a function of outdoor temperature.
Fixed temperature set-points at 72oF in all of the VAV zones. All VAV boxes are in occupied mode from 5am to 5pm. No demand controlled ventilation.
The above baseline is relatively strict, as we will show in the followings,
This baseline is more efficient than PaANG 300’s performance at the beginning of the project.
This baseline is about 5th percentile of the national office building EE.
Most of the DoD buildings are supposed to be far less efficient than this baseline.
6.1.2 Method
In this project, we collected pre-baseline, baseline, cBEMC EE experimental data using Apogee and the database (Mongo DB) in cBEMC. In addition, we also simulate these three scenarios using TRNSYS. In the following paragraphs, we refer collected sensor data as the real data; the data generated by TRNSYS as the simulation data, and extrapolated results as the calibrated data.
Due to the limited project time, we cannot measure one year energy performance. Instead, we used one year TRNSYS simulation with two weeks of real data for the performance analysis. The analysis method is summarized as the following steps:
1. Real data collection: Collect real PaANG 300 data for pre-baseline, baseline and after cBEMC performance.
2. Baseline model calibration: We calculate VAV usage based on real data from the occupants’ calendar. Then we calibrate the TRNSYS model against the real data.
3. Extrapolation: After calibration, the simulation model can be used to predict energy consumption of a specific month for comparison purposes. For instance, direct comparison on July and September real data is unfair, because of the different weather conditions. We can use the TRNSYS model to extrapolate July baseline data to September and compare with September cBEMC performance.
4. Energy intensity study: The energy usage intensity (EUI) for the PaANG 300 2nd floor is calculated in order to compare with national office building average.
6.1.3 Results
The PaANG 300 building 2nd floor has good EE before cBEMC deployment. As studied by the US Environmental Protection Agency (EPA) ENERGY STAR program, the distribution of US office building energy usage intensity (EUI) is plotted in Figure 36. The median energy intensity is 207 kBtu/(ft2 year). Note: 1 kBtu /(ft2 year)=3.13 kWh/(m2 year). Less than 5% of the office buildings consumes less than 71 kBtu/ft2, which is equivalent to 222.23 kWh/(m2 year). According to ENERGY START, the 95th percentile is 472 kBtu/ft2. Since the PaANG 300
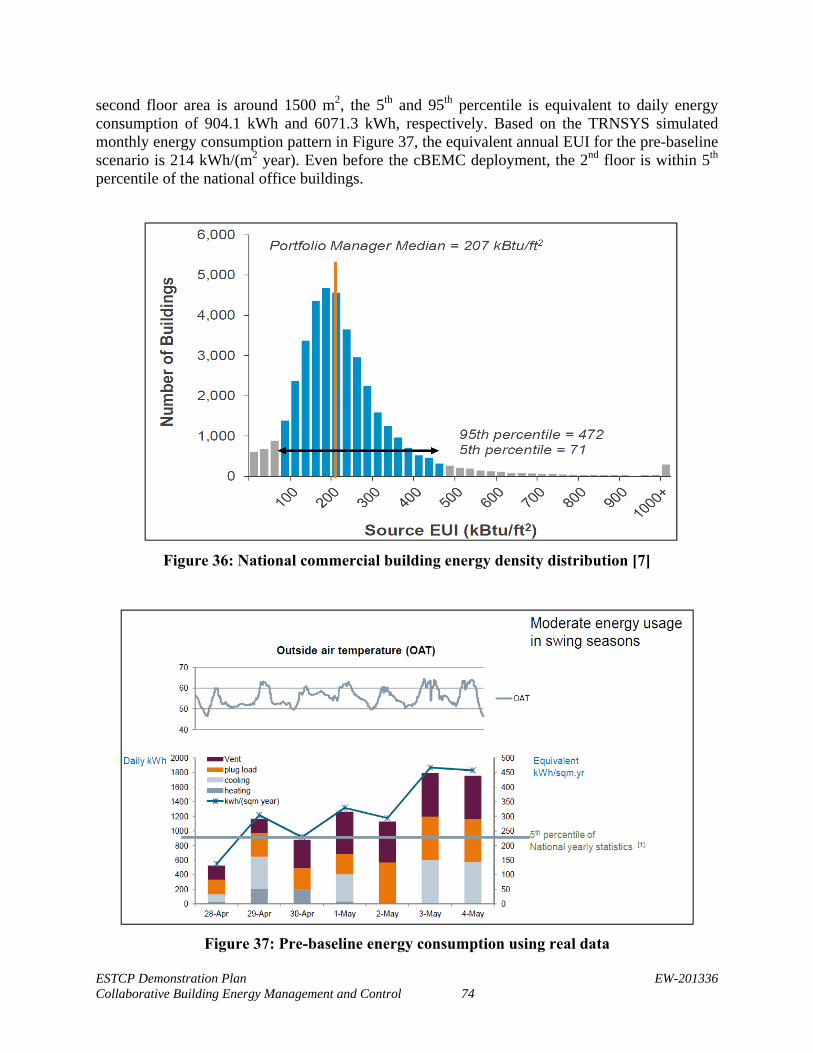
ESTCP Demonstration Plan EW-201336 Collaborative Building Energy Management and Control 74
second floor area is around 1500 m2, the 5th and 95th percentile is equivalent to daily energy consumption of 904.1 kWh and 6071.3 kWh, respectively. Based on the TRNSYS simulated monthly energy consumption pattern in Figure 37, the equivalent annual EUI for the pre-baseline scenario is 214 kWh/(m2 year). Even before the cBEMC deployment, the 2nd floor is within 5th percentile of the national office buildings.
Figure 36: National commercial building energy density distribution [7]
Figure 37: Pre-baseline energy consumption using real data
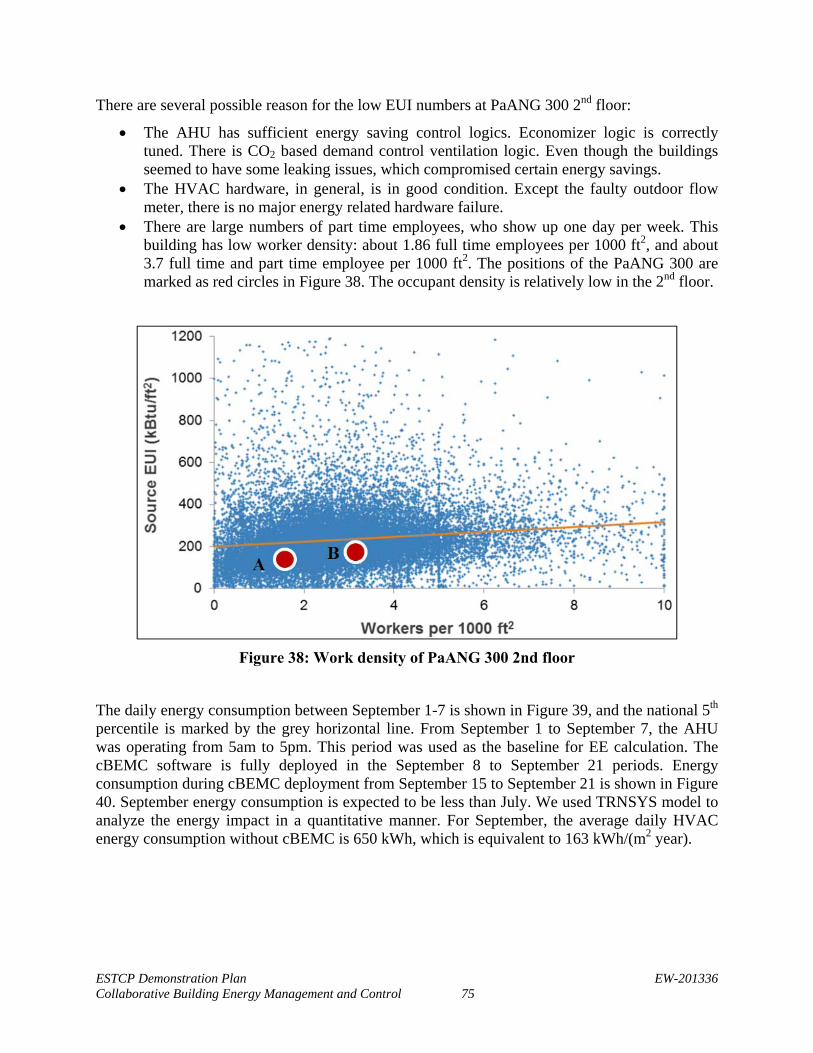
ESTCP Demonstration Plan EW-201336 Collaborative Building Energy Management and Control 75
There are several possible reason for the low EUI numbers at PaANG 300 2nd floor:
The AHU has sufficient energy saving control logics. Economizer logic is correctly tuned. There is CO2 based demand control ventilation logic. Even though the buildings seemed to have some leaking issues, which compromised certain energy savings.
The HVAC hardware, in general, is in good condition. Except the faulty outdoor flow meter, there is no major energy related hardware failure.
There are large numbers of part time employees, who show up one day per week. This building has low worker density: about 1.86 full time employees per 1000 ft2, and about 3.7 full time and part time employee per 1000 ft2. The positions of the PaANG 300 are marked as red circles in Figure 38. The occupant density is relatively low in the 2nd floor.
Figure 38: Work density of PaANG 300 2nd floor
The daily energy consumption between September 1-7 is shown in Figure 39, and the national 5th percentile is marked by the grey horizontal line. From September 1 to September 7, the AHU was operating from 5am to 5pm. This period was used as the baseline for EE calculation. The cBEMC software is fully deployed in the September 8 to September 21 periods. Energy consumption during cBEMC deployment from September 15 to September 21 is shown in Figure 40. September energy consumption is expected to be less than July. We used TRNSYS model to analyze the energy impact in a quantitative manner. For September, the average daily HVAC energy consumption without cBEMC is 650 kWh, which is equivalent to 163 kWh/(m2 year).
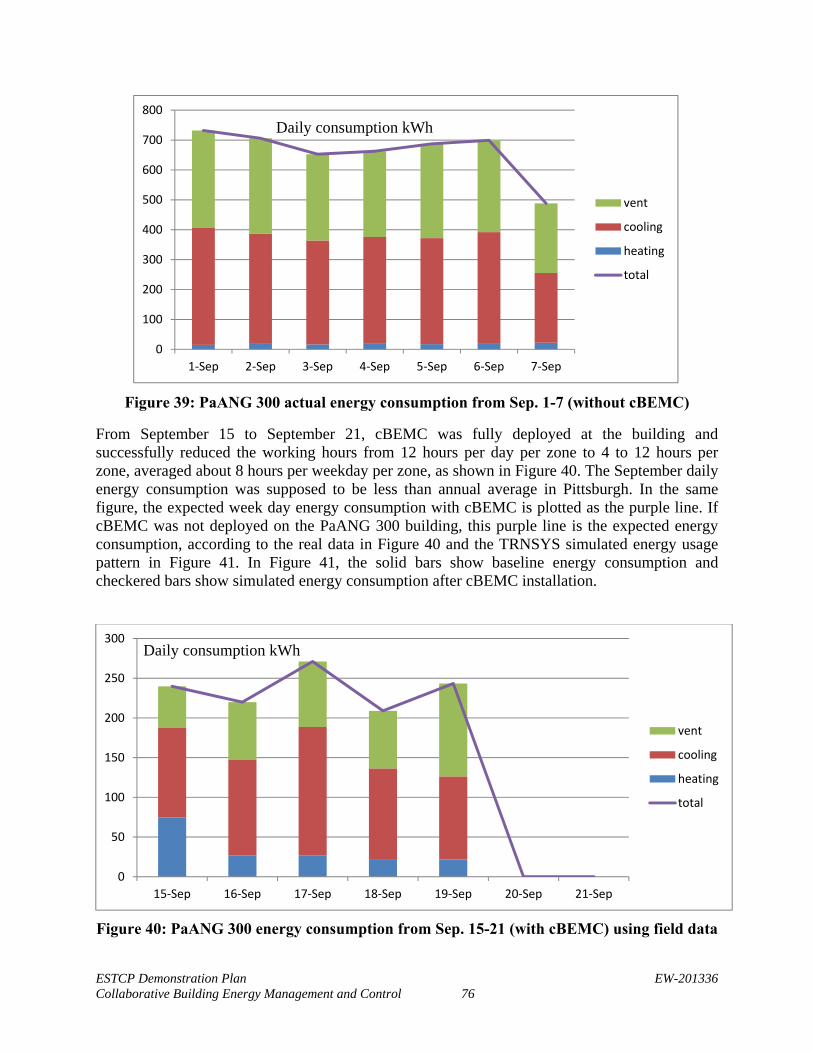
ESTCP Demonstration Plan EW-201336 Collaborative Building Energy Management and Control 76
Figure 39: PaANG 300 actual energy consumption from Sep. 1-7 (without cBEMC)
From September 15 to September 21, cBEMC was fully deployed at the building and successfully reduced the working hours from 12 hours per day per zone to 4 to 12 hours per zone, averaged about 8 hours per weekday per zone, as shown in Figure 40. The September daily energy consumption was supposed to be less than annual average in Pittsburgh. In the same figure, the expected week day energy consumption with cBEMC is plotted as the purple line. If cBEMC was not deployed on the PaANG 300 building, this purple line is the expected energy consumption, according to the real data in Figure 40 and the TRNSYS simulated energy usage pattern in Figure 41. In Figure 41, the solid bars show baseline energy consumption and checkered bars show simulated energy consumption after cBEMC installation.
Figure 40: PaANG 300 energy consumption from Sep. 15-21 (with cBEMC) using field data
0
100
200
300
400
500
600
700
800
1‐Sep 2‐Sep 3‐Sep 4‐Sep 5‐Sep 6‐Sep 7‐Sep
vent
cooling
heating
total
0
50
100
150
200
250
300
15‐Sep 16‐Sep 17‐Sep 18‐Sep 19‐Sep 20‐Sep 21‐Sep
vent
cooling
heating
total
Daily consumption kWh
Daily consumption kWh
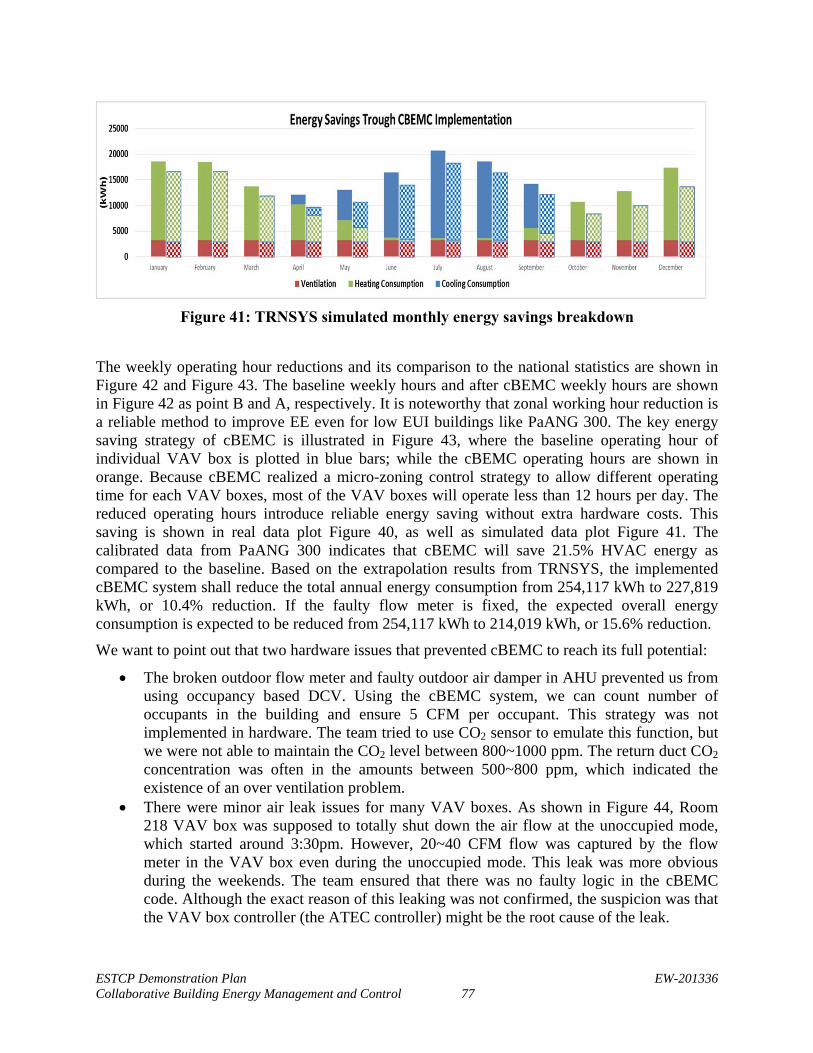
ESTCP Demonstration Plan EW-201336 Collaborative Building Energy Management and Control 77
Figure 41: TRNSYS simulated monthly energy savings breakdown
The weekly operating hour reductions and its comparison to the national statistics are shown in Figure 42 and Figure 43. The baseline weekly hours and after cBEMC weekly hours are shown in Figure 42 as point B and A, respectively. It is noteworthy that zonal working hour reduction is a reliable method to improve EE even for low EUI buildings like PaANG 300. The key energy saving strategy of cBEMC is illustrated in Figure 43, where the baseline operating hour of individual VAV box is plotted in blue bars; while the cBEMC operating hours are shown in orange. Because cBEMC realized a micro-zoning control strategy to allow different operating time for each VAV boxes, most of the VAV boxes will operate less than 12 hours per day. The reduced operating hours introduce reliable energy saving without extra hardware costs. This saving is shown in real data plot Figure 40, as well as simulated data plot Figure 41. The calibrated data from PaANG 300 indicates that cBEMC will save 21.5% HVAC energy as compared to the baseline. Based on the extrapolation results from TRNSYS, the implemented cBEMC system shall reduce the total annual energy consumption from 254,117 kWh to 227,819 kWh, or 10.4% reduction. If the faulty flow meter is fixed, the expected overall energy consumption is expected to be reduced from 254,117 kWh to 214,019 kWh, or 15.6% reduction.
We want to point out that two hardware issues that prevented cBEMC to reach its full potential:
The broken outdoor flow meter and faulty outdoor air damper in AHU prevented us from using occupancy based DCV. Using the cBEMC system, we can count number of occupants in the building and ensure 5 CFM per occupant. This strategy was not implemented in hardware. The team tried to use CO2 sensor to emulate this function, but we were not able to maintain the CO2 level between 800~1000 ppm. The return duct CO2 concentration was often in the amounts between 500~800 ppm, which indicated the existence of an over ventilation problem.
There were minor air leak issues for many VAV boxes. As shown in Figure 44, Room 218 VAV box was supposed to totally shut down the air flow at the unoccupied mode, which started around 3:30pm. However, 20~40 CFM flow was captured by the flow meter in the VAV box even during the unoccupied mode. This leak was more obvious during the weekends. The team ensured that there was no faulty logic in the cBEMC code. Although the exact reason of this leaking was not confirmed, the suspicion was that the VAV box controller (the ATEC controller) might be the root cause of the leak.
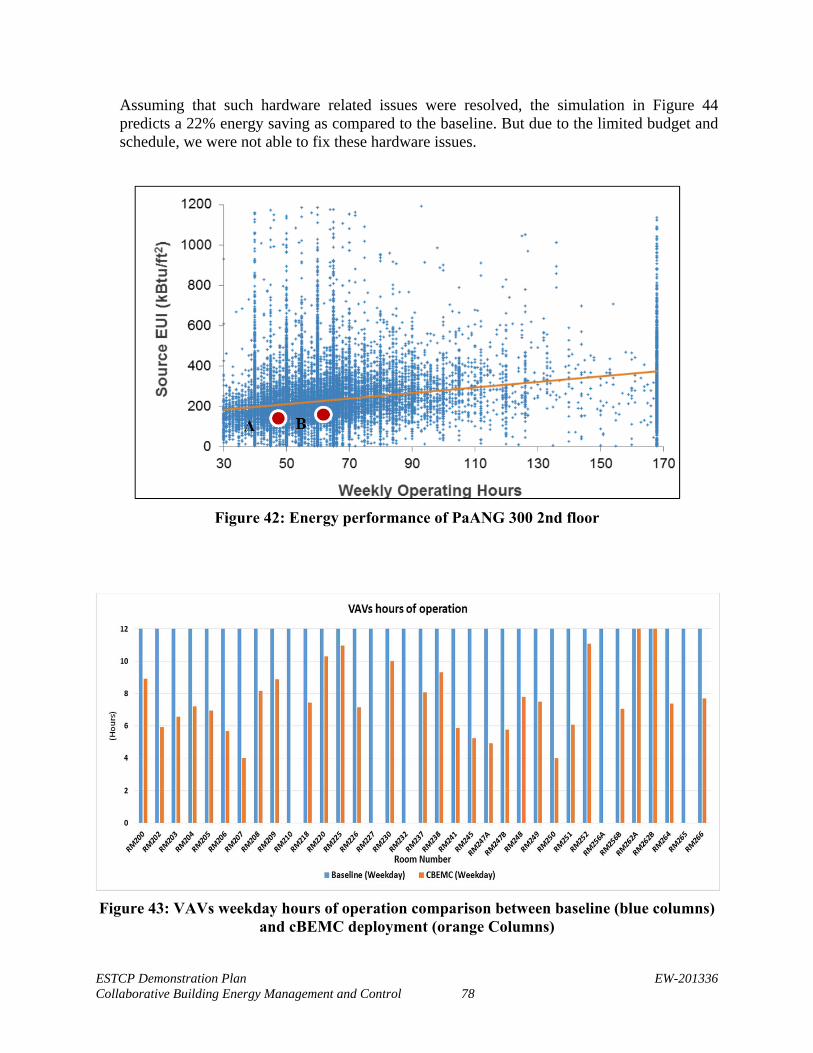
ESTCP Demonstration Plan EW-201336 Collaborative Building Energy Management and Control 78
Assuming that such hardware related issues were resolved, the simulation in Figure 44 predicts a 22% energy saving as compared to the baseline. But due to the limited budget and schedule, we were not able to fix these hardware issues.
Figure 42: Energy performance of PaANG 300 2nd floor
Figure 43: VAVs weekday hours of operation comparison between baseline (blue columns)
and cBEMC deployment (orange Columns)
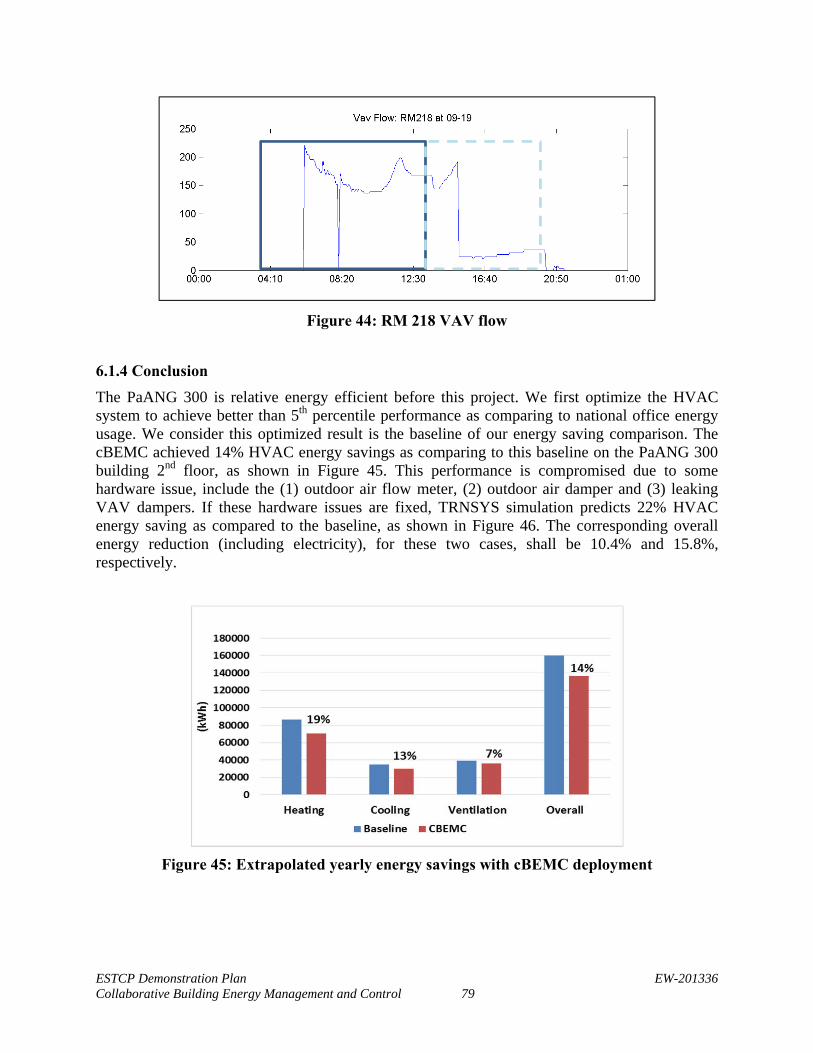
ESTCP Demonstration Plan EW-201336 Collaborative Building Energy Management and Control 79
Figure 44: RM 218 VAV flow
6.1.4 Conclusion The PaANG 300 is relative energy efficient before this project. We first optimize the HVAC system to achieve better than 5th percentile performance as comparing to national office energy usage. We consider this optimized result is the baseline of our energy saving comparison. The cBEMC achieved 14% HVAC energy savings as comparing to this baseline on the PaANG 300 building 2nd floor, as shown in Figure 45. This performance is compromised due to some hardware issue, include the (1) outdoor air flow meter, (2) outdoor air damper and (3) leaking VAV dampers. If these hardware issues are fixed, TRNSYS simulation predicts 22% HVAC energy saving as compared to the baseline, as shown in Figure 46. The corresponding overall energy reduction (including electricity), for these two cases, shall be 10.4% and 15.8%, respectively.
Figure 45: Extrapolated yearly energy savings with cBEMC deployment
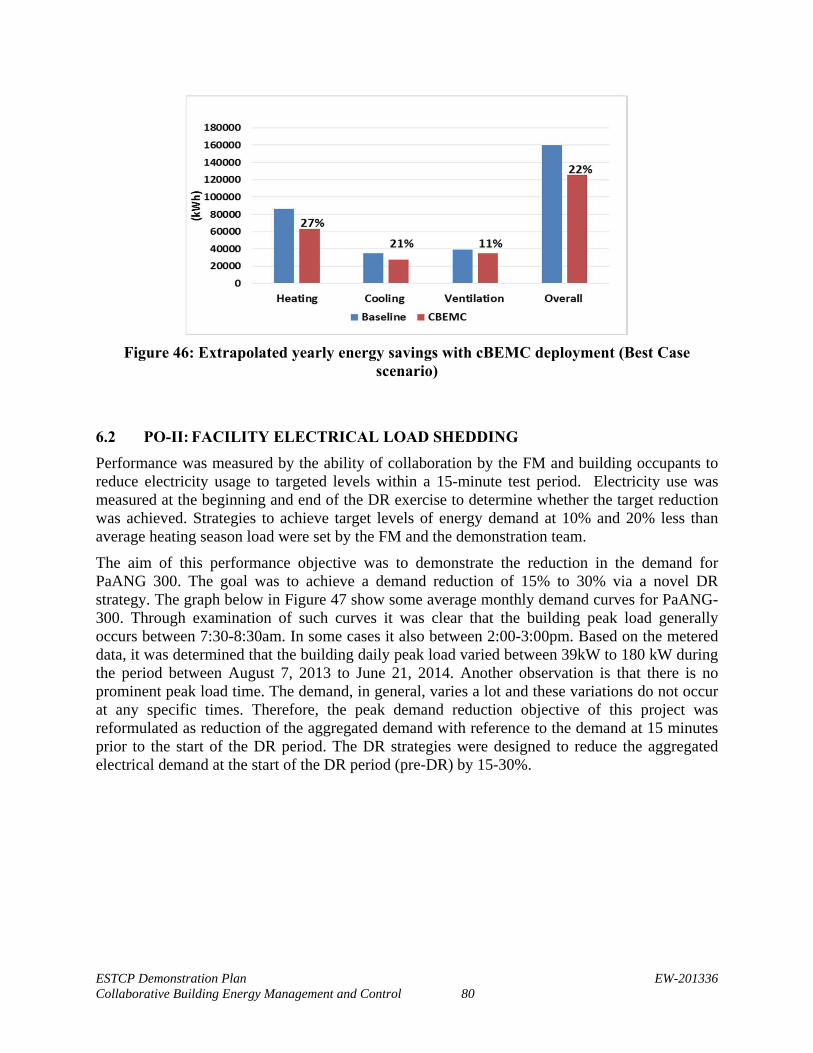
ESTCP Demonstration Plan EW-201336 Collaborative Building Energy Management and Control 80
Figure 46: Extrapolated yearly energy savings with cBEMC deployment (Best Case
scenario)
6.2 PO-II: FACILITY ELECTRICAL LOAD SHEDDING
Performance was measured by the ability of collaboration by the FM and building occupants to reduce electricity usage to targeted levels within a 15-minute test period. Electricity use was measured at the beginning and end of the DR exercise to determine whether the target reduction was achieved. Strategies to achieve target levels of energy demand at 10% and 20% less than average heating season load were set by the FM and the demonstration team.
The aim of this performance objective was to demonstrate the reduction in the demand for PaANG 300. The goal was to achieve a demand reduction of 15% to 30% via a novel DR strategy. The graph below in Figure 47 show some average monthly demand curves for PaANG-300. Through examination of such curves it was clear that the building peak load generally occurs between 7:30-8:30am. In some cases it also between 2:00-3:00pm. Based on the metered data, it was determined that the building daily peak load varied between 39kW to 180 kW during the period between August 7, 2013 to June 21, 2014. Another observation is that there is no prominent peak load time. The demand, in general, varies a lot and these variations do not occur at any specific times. Therefore, the peak demand reduction objective of this project was reformulated as reduction of the aggregated demand with reference to the demand at 15 minutes prior to the start of the DR period. The DR strategies were designed to reduce the aggregated electrical demand at the start of the DR period (pre-DR) by 15-30%.
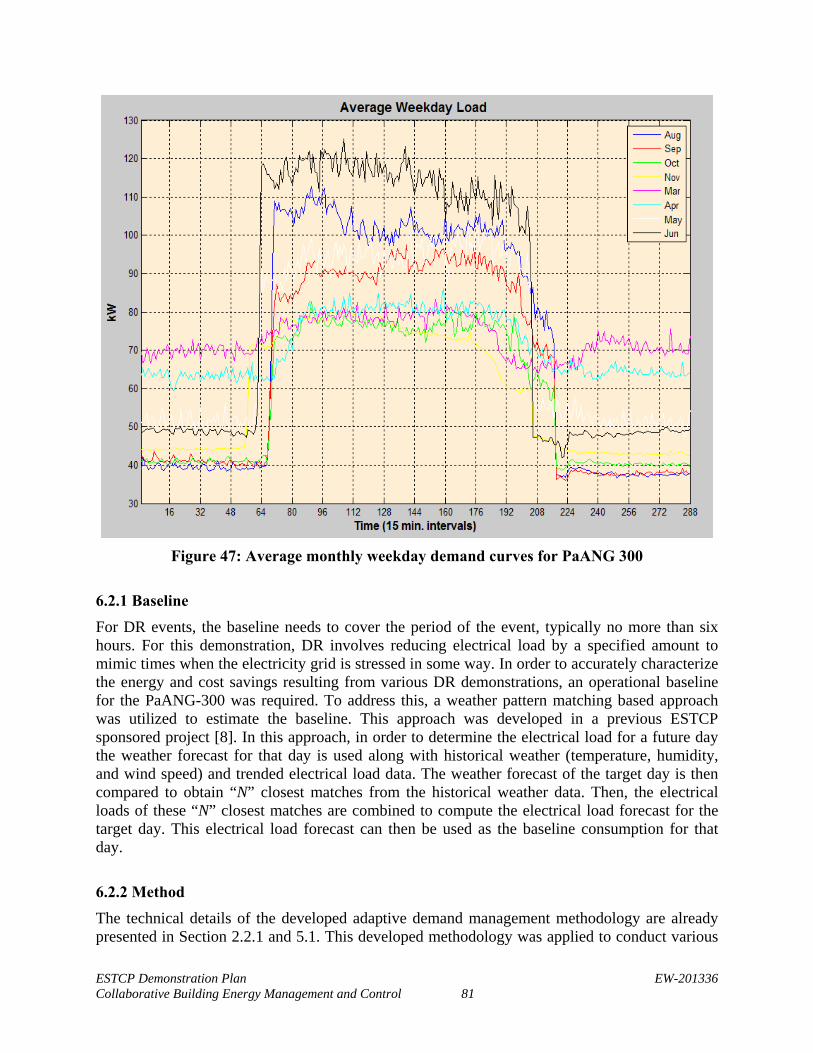
ESTCP Demonstration Plan EW-201336 Collaborative Building Energy Management and Control 81
Figure 47: Average monthly weekday demand curves for PaANG 300
6.2.1 Baseline
For DR events, the baseline needs to cover the period of the event, typically no more than six hours. For this demonstration, DR involves reducing electrical load by a specified amount to mimic times when the electricity grid is stressed in some way. In order to accurately characterize the energy and cost savings resulting from various DR demonstrations, an operational baseline for the PaANG-300 was required. To address this, a weather pattern matching based approach was utilized to estimate the baseline. This approach was developed in a previous ESTCP sponsored project [8]. In this approach, in order to determine the electrical load for a future day the weather forecast for that day is used along with historical weather (temperature, humidity, and wind speed) and trended electrical load data. The weather forecast of the target day is then compared to obtain “N” closest matches from the historical weather data. Then, the electrical loads of these “N” closest matches are combined to compute the electrical load forecast for the target day. This electrical load forecast can then be used as the baseline consumption for that day.
6.2.2 Method
The technical details of the developed adaptive demand management methodology are already presented in Section 2.2.1 and 5.1. This developed methodology was applied to conduct various
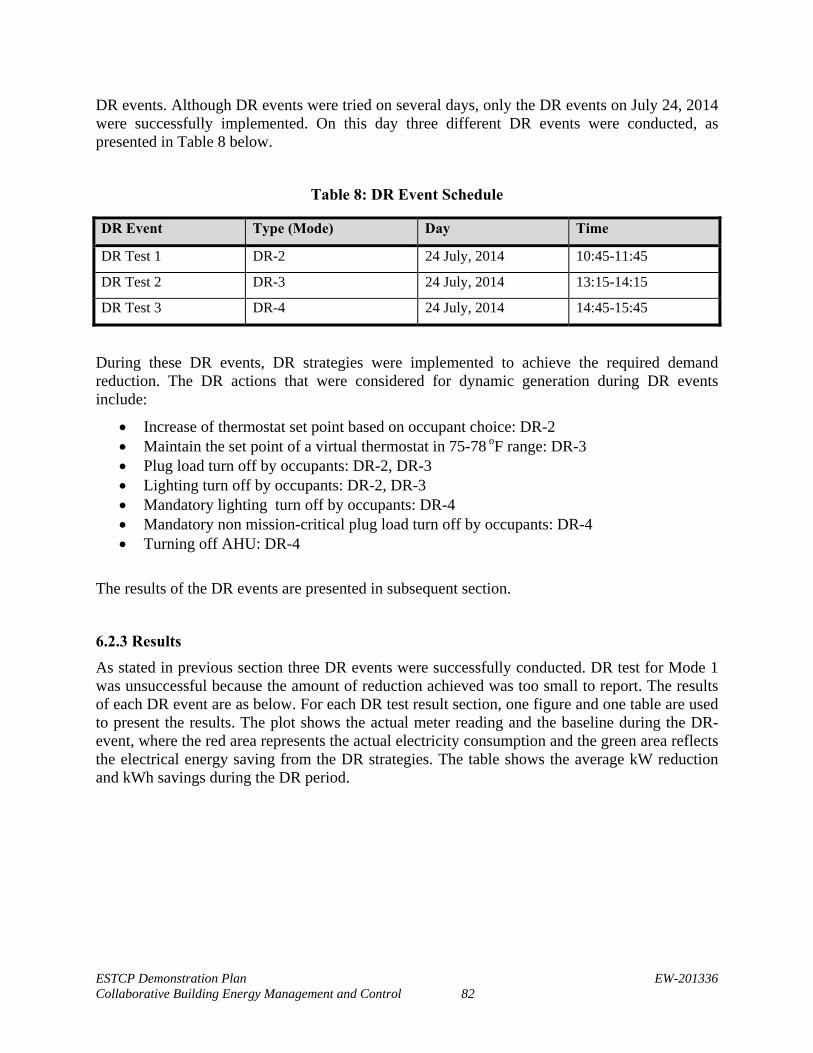
ESTCP Demonstration Plan EW-201336 Collaborative Building Energy Management and Control 82
DR events. Although DR events were tried on several days, only the DR events on July 24, 2014 were successfully implemented. On this day three different DR events were conducted, as presented in Table 8 below.
Table 8: DR Event Schedule
DR Event Type (Mode) Day Time
DR Test 1 DR-2 24 July, 2014 10:45-11:45
DR Test 2 DR-3 24 July, 2014 13:15-14:15
DR Test 3 DR-4 24 July, 2014 14:45-15:45
During these DR events, DR strategies were implemented to achieve the required demand reduction. The DR actions that were considered for dynamic generation during DR events include:
Increase of thermostat set point based on occupant choice: DR-2 Maintain the set point of a virtual thermostat in 75-78 oF range: DR-3 Plug load turn off by occupants: DR-2, DR-3 Lighting turn off by occupants: DR-2, DR-3 Mandatory lighting turn off by occupants: DR-4 Mandatory non mission-critical plug load turn off by occupants: DR-4 Turning off AHU: DR-4
The results of the DR events are presented in subsequent section.
6.2.3 Results
As stated in previous section three DR events were successfully conducted. DR test for Mode 1 was unsuccessful because the amount of reduction achieved was too small to report. The results of each DR event are as below. For each DR test result section, one figure and one table are used to present the results. The plot shows the actual meter reading and the baseline during the DR-event, where the red area represents the actual electricity consumption and the green area reflects the electrical energy saving from the DR strategies. The table shows the average kW reduction and kWh savings during the DR period.
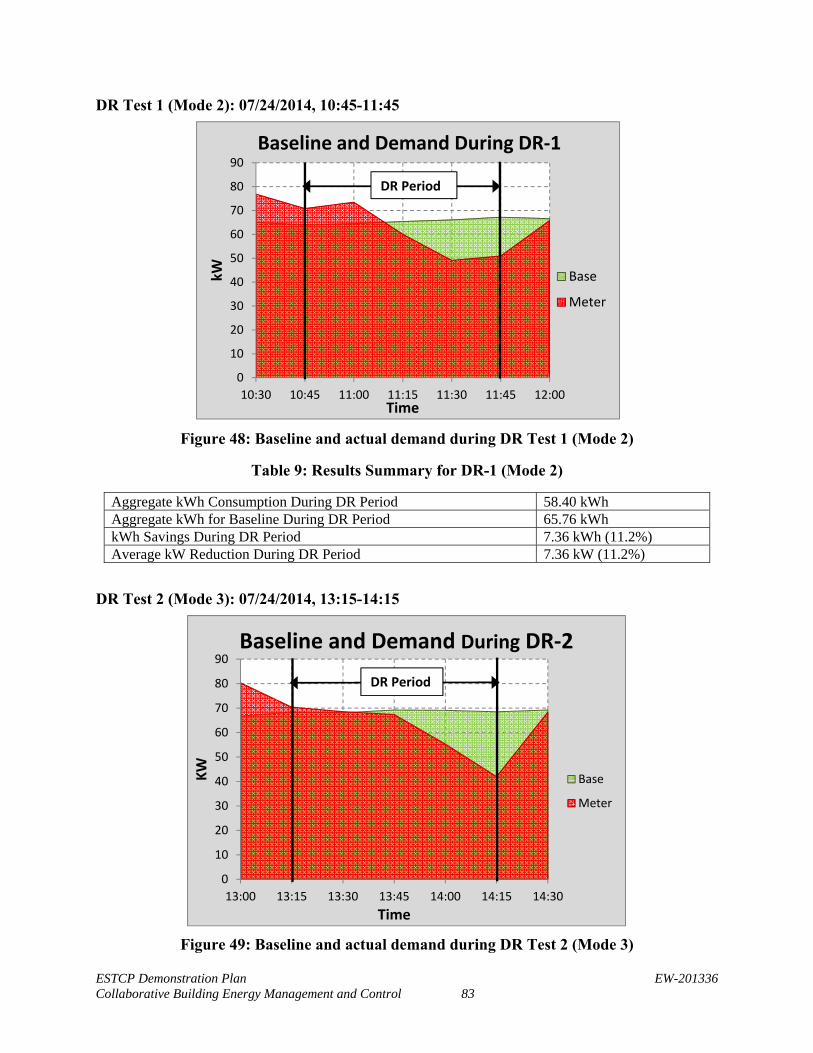
ESTCP Demonstration Plan EW-201336 Collaborative Building Energy Management and Control 83
DR Test 1 (Mode 2): 07/24/2014, 10:45-11:45
Figure 48: Baseline and actual demand during DR Test 1 (Mode 2)
Table 9: Results Summary for DR-1 (Mode 2)
Aggregate kWh Consumption During DR Period 58.40 kWh Aggregate kWh for Baseline During DR Period 65.76 kWh kWh Savings During DR Period 7.36 kWh (11.2%) Average kW Reduction During DR Period 7.36 kW (11.2%)
DR Test 2 (Mode 3): 07/24/2014, 13:15-14:15
Figure 49: Baseline and actual demand during DR Test 2 (Mode 3)
0
10
20
30
40
50
60
70
80
90
10:30 10:45 11:00 11:15 11:30 11:45 12:00
kW
Time
Baseline and Demand During DR‐1
Base
Meter
DR Period
0
10
20
30
40
50
60
70
80
90
13:00 13:15 13:30 13:45 14:00 14:15 14:30
KW
Time
Baseline and Demand During DR‐2
Base
Meter
DR Period
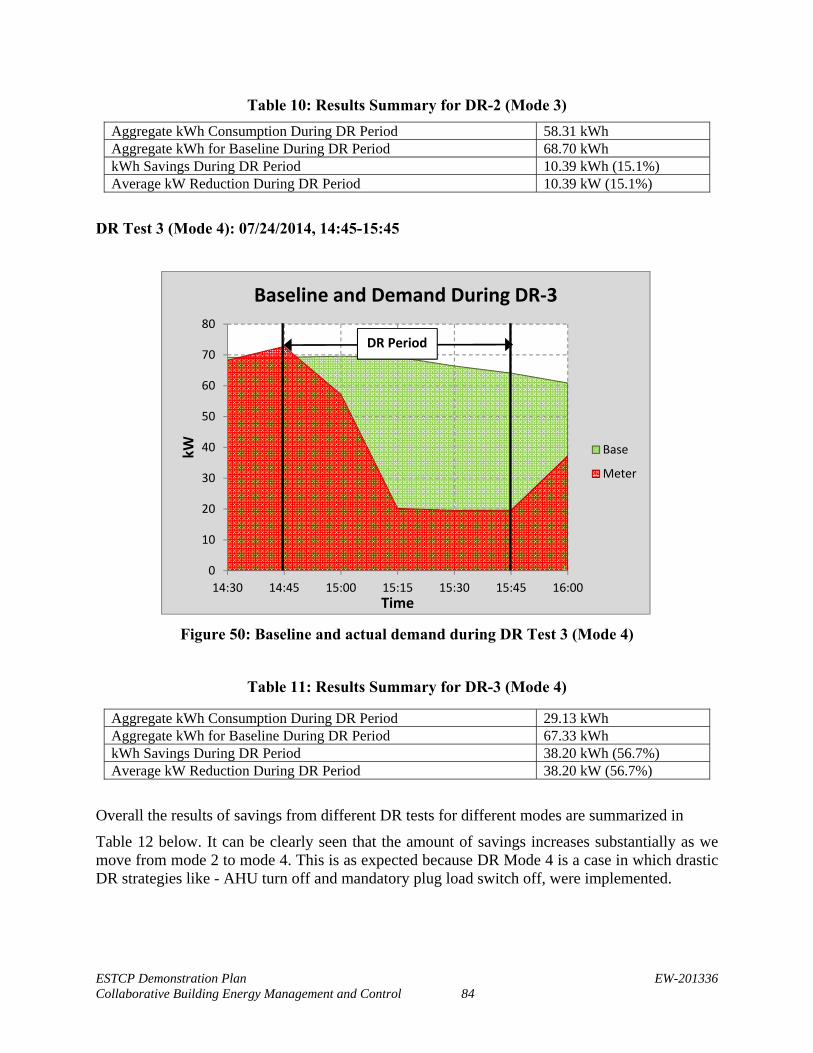
ESTCP Demonstration Plan EW-201336 Collaborative Building Energy Management and Control 84
Table 10: Results Summary for DR-2 (Mode 3)
Aggregate kWh Consumption During DR Period 58.31 kWh Aggregate kWh for Baseline During DR Period 68.70 kWh kWh Savings During DR Period 10.39 kWh (15.1%) Average kW Reduction During DR Period 10.39 kW (15.1%)
DR Test 3 (Mode 4): 07/24/2014, 14:45-15:45
Figure 50: Baseline and actual demand during DR Test 3 (Mode 4)
Table 11: Results Summary for DR-3 (Mode 4)
Aggregate kWh Consumption During DR Period 29.13 kWh Aggregate kWh for Baseline During DR Period 67.33 kWh kWh Savings During DR Period 38.20 kWh (56.7%) Average kW Reduction During DR Period 38.20 kW (56.7%)
Overall the results of savings from different DR tests for different modes are summarized in
Table 12 below. It can be clearly seen that the amount of savings increases substantially as we move from mode 2 to mode 4. This is as expected because DR Mode 4 is a case in which drastic DR strategies like - AHU turn off and mandatory plug load switch off, were implemented.
0
10
20
30
40
50
60
70
80
14:30 14:45 15:00 15:15 15:30 15:45 16:00
kW
Time
Baseline and Demand During DR‐3
Base
Meter
DR Period
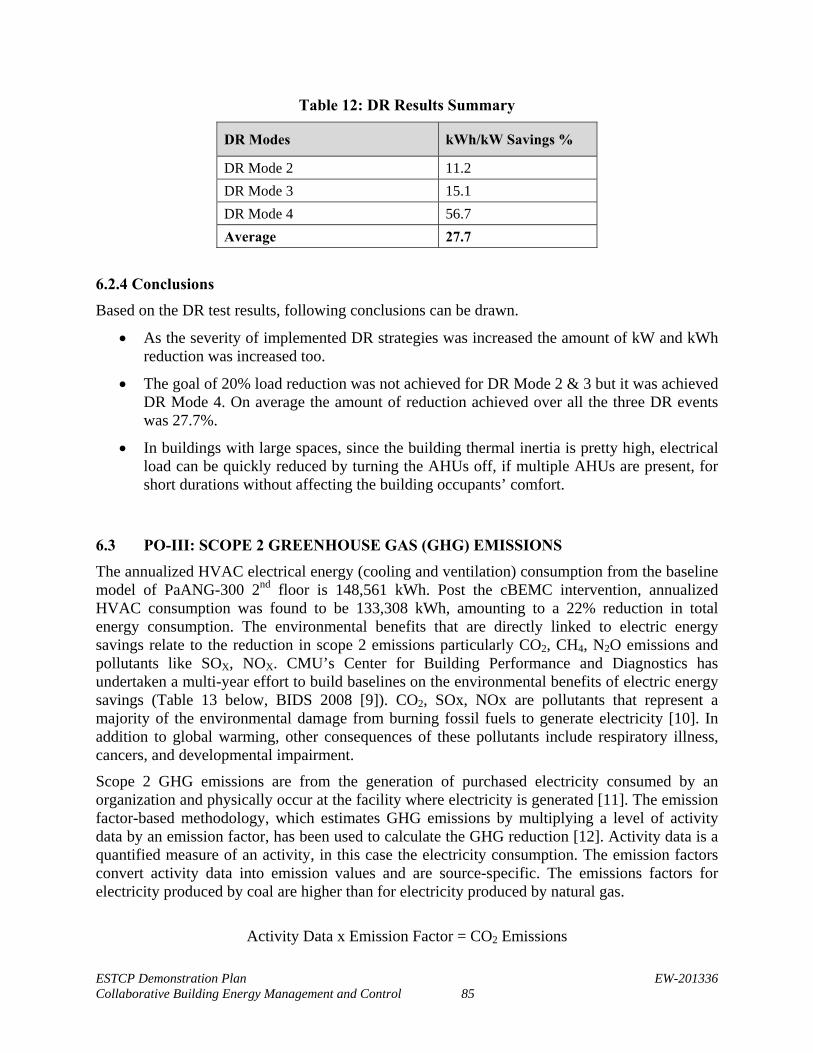
ESTCP Demonstration Plan EW-201336 Collaborative Building Energy Management and Control 85
Table 12: DR Results Summary
DR Modes kWh/kW Savings %
DR Mode 2 11.2 DR Mode 3 15.1 DR Mode 4 56.7 Average 27.7
6.2.4 Conclusions
Based on the DR test results, following conclusions can be drawn.
As the severity of implemented DR strategies was increased the amount of kW and kWh reduction was increased too.
The goal of 20% load reduction was not achieved for DR Mode 2 & 3 but it was achieved DR Mode 4. On average the amount of reduction achieved over all the three DR events was 27.7%.
In buildings with large spaces, since the building thermal inertia is pretty high, electrical load can be quickly reduced by turning the AHUs off, if multiple AHUs are present, for short durations without affecting the building occupants’ comfort.
6.3 PO-III: SCOPE 2 GREENHOUSE GAS (GHG) EMISSIONS
The annualized HVAC electrical energy (cooling and ventilation) consumption from the baseline model of PaANG-300 2nd floor is 148,561 kWh. Post the cBEMC intervention, annualized HVAC consumption was found to be 133,308 kWh, amounting to a 22% reduction in total energy consumption. The environmental benefits that are directly linked to electric energy savings relate to the reduction in scope 2 emissions particularly CO2, CH4, N2O emissions and pollutants like SOX, NOX. CMU’s Center for Building Performance and Diagnostics has undertaken a multi-year effort to build baselines on the environmental benefits of electric energy savings (Table 13 below, BIDS 2008 [9]). CO2, SOx, NOx are pollutants that represent a majority of the environmental damage from burning fossil fuels to generate electricity [10]. In addition to global warming, other consequences of these pollutants include respiratory illness, cancers, and developmental impairment.
Scope 2 GHG emissions are from the generation of purchased electricity consumed by an organization and physically occur at the facility where electricity is generated [11]. The emission factor-based methodology, which estimates GHG emissions by multiplying a level of activity data by an emission factor, has been used to calculate the GHG reduction [12]. Activity data is a quantified measure of an activity, in this case the electricity consumption. The emission factors convert activity data into emission values and are source-specific. The emissions factors for electricity produced by coal are higher than for electricity produced by natural gas.
Activity Data x Emission Factor = CO2 Emissions
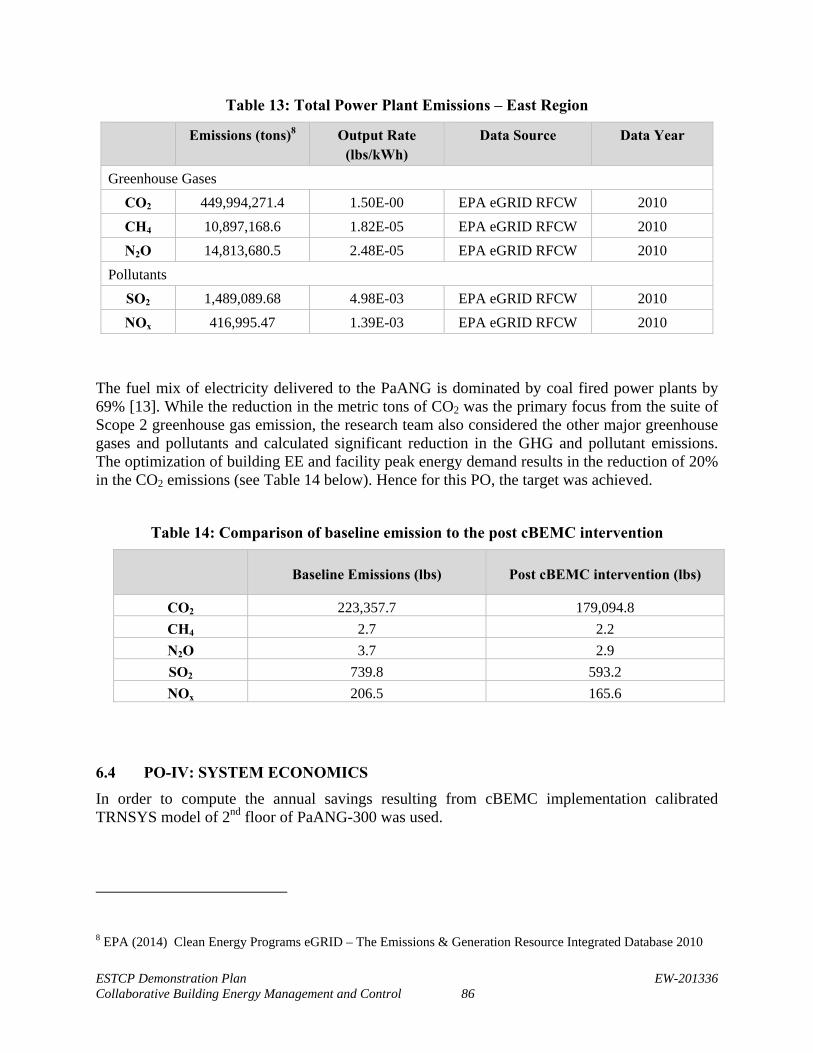
ESTCP Demonstration Plan EW-201336 Collaborative Building Energy Management and Control 86
Table 13: Total Power Plant Emissions – East Region
Emissions (tons)8 Output Rate (lbs/kWh)
Data Source Data Year
Greenhouse Gases
CO2 449,994,271.4 1.50E-00 EPA eGRID RFCW 2010
CH4 10,897,168.6 1.82E-05 EPA eGRID RFCW 2010
N2O 14,813,680.5 2.48E-05 EPA eGRID RFCW 2010
Pollutants
SO2 1,489,089.68 4.98E-03 EPA eGRID RFCW 2010
NOx 416,995.47 1.39E-03 EPA eGRID RFCW 2010
The fuel mix of electricity delivered to the PaANG is dominated by coal fired power plants by 69% [13]. While the reduction in the metric tons of CO2 was the primary focus from the suite of Scope 2 greenhouse gas emission, the research team also considered the other major greenhouse gases and pollutants and calculated significant reduction in the GHG and pollutant emissions. The optimization of building EE and facility peak energy demand results in the reduction of 20% in the CO2 emissions (see Table 14 below). Hence for this PO, the target was achieved.
Table 14: Comparison of baseline emission to the post cBEMC intervention
Baseline Emissions (lbs) Post cBEMC intervention (lbs)
CO2 223,357.7 179,094.8 CH4 2.7 2.2 N2O 3.7 2.9 SO2 739.8 593.2 NOx 206.5 165.6
6.4 PO-IV: SYSTEM ECONOMICS
In order to compute the annual savings resulting from cBEMC implementation calibrated TRNSYS model of 2nd floor of PaANG-300 was used.
8 EPA (2014) Clean Energy Programs eGRID – The Emissions & Generation Resource Integrated Database 2010
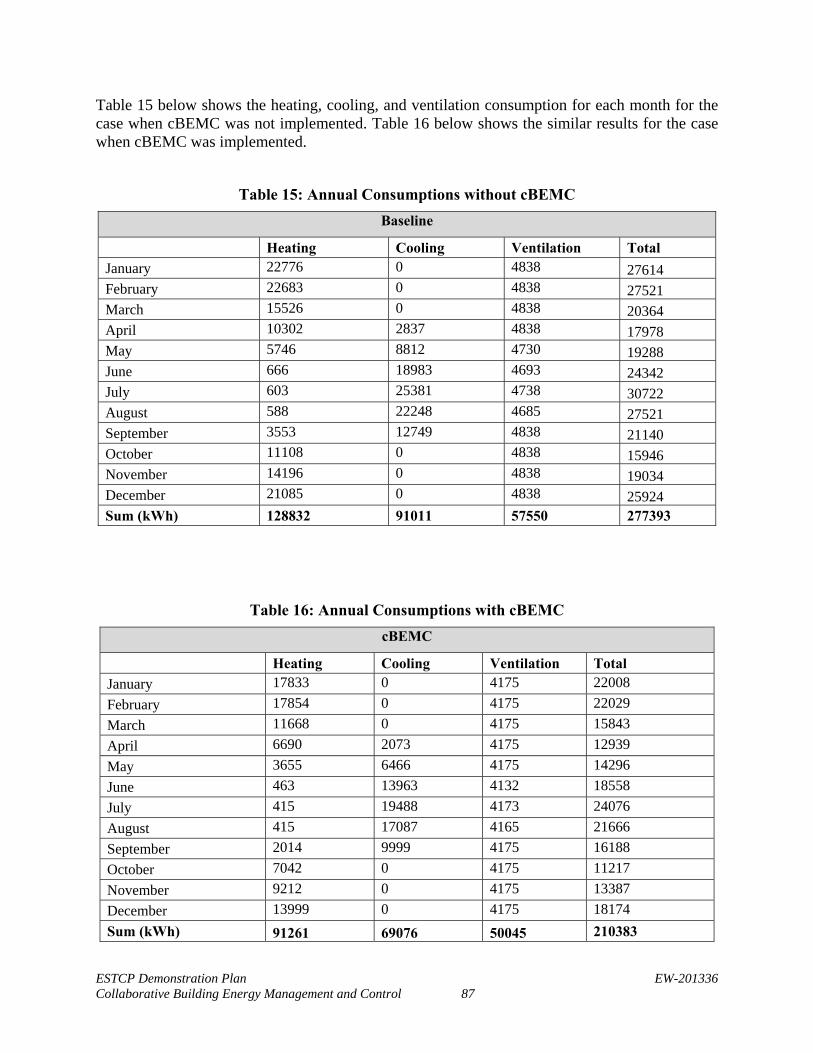
ESTCP Demonstration Plan EW-201336 Collaborative Building Energy Management and Control 87
Table 15 below shows the heating, cooling, and ventilation consumption for each month for the case when cBEMC was not implemented. Table 16 below shows the similar results for the case when cBEMC was implemented.
Table 15: Annual Consumptions without cBEMC
Baseline
Heating Cooling Ventilation Total
January 22776 0 4838 27614 February 22683 0 4838 27521 March 15526 0 4838 20364 April 10302 2837 4838 17978 May 5746 8812 4730 19288 June 666 18983 4693 24342 July 603 25381 4738 30722 August 588 22248 4685 27521 September 3553 12749 4838 21140 October 11108 0 4838 15946 November 14196 0 4838 19034 December 21085 0 4838 25924 Sum (kWh) 128832 91011 57550 277393
Table 16: Annual Consumptions with cBEMC
cBEMC
Heating Cooling Ventilation Total
January 17833 0 4175 22008 February 17854 0 4175 22029 March 11668 0 4175 15843 April 6690 2073 4175 12939 May 3655 6466 4175 14296 June 463 13963 4132 18558 July 415 19488 4173 24076 August 415 17087 4165 21666 September 2014 9999 4175 16188 October 7042 0 4175 11217 November 9212 0 4175 13387 December 13999 0 4175 18174 Sum (kWh) 91261 69076 50045 210383
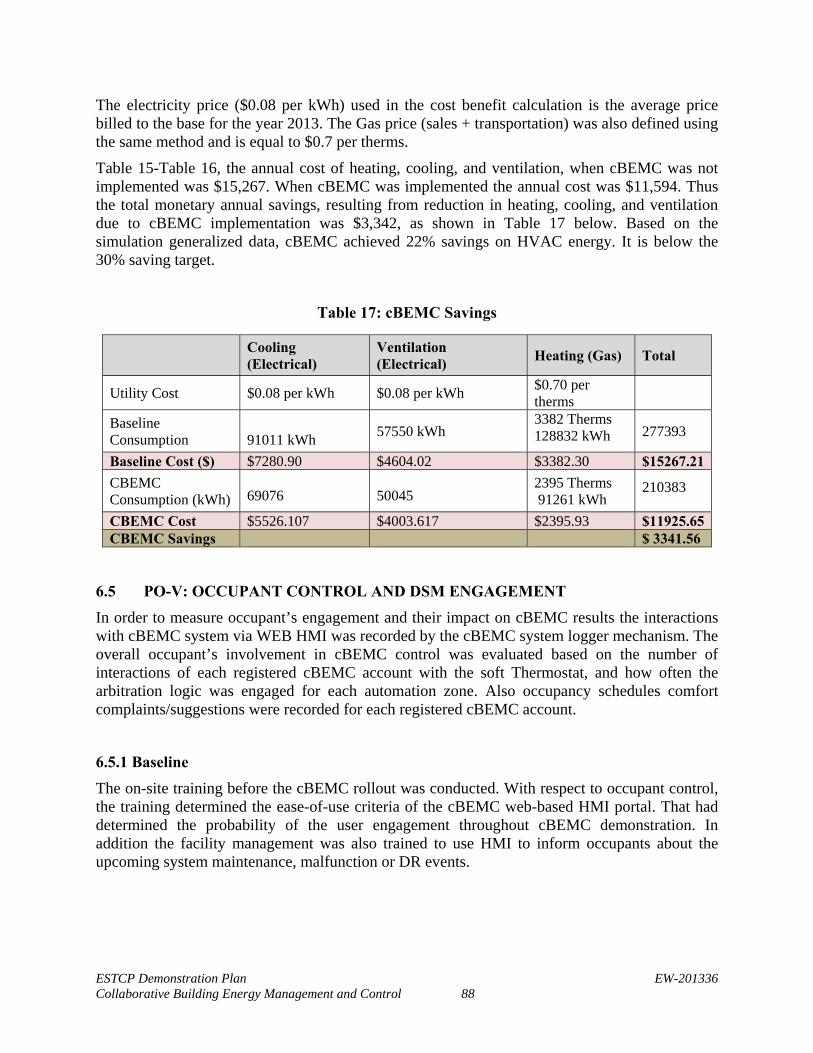
ESTCP Demonstration Plan EW-201336 Collaborative Building Energy Management and Control 88
The electricity price ($0.08 per kWh) used in the cost benefit calculation is the average price billed to the base for the year 2013. The Gas price (sales + transportation) was also defined using the same method and is equal to $0.7 per therms.
Table 15-Table 16, the annual cost of heating, cooling, and ventilation, when cBEMC was not implemented was $15,267. When cBEMC was implemented the annual cost was $11,594. Thus the total monetary annual savings, resulting from reduction in heating, cooling, and ventilation due to cBEMC implementation was $3,342, as shown in Table 17 below. Based on the simulation generalized data, cBEMC achieved 22% savings on HVAC energy. It is below the 30% saving target.
Table 17: cBEMC Savings
Cooling (Electrical)
Ventilation (Electrical)
Heating (Gas) Total
Utility Cost $0.08 per kWh $0.08 per kWh $0.70 per therms
Baseline Consumption
91011 kWh 57550 kWh
3382 Therms 128832 kWh 277393
Baseline Cost ($) $7280.90 $4604.02 $3382.30 $15267.21
CBEMC Consumption (kWh)
69076
50045
2395 Therms 91261 kWh
210383
CBEMC Cost $5526.107 $4003.617 $2395.93 $11925.65CBEMC Savings $ 3341.56
6.5 PO-V: OCCUPANT CONTROL AND DSM ENGAGEMENT
In order to measure occupant’s engagement and their impact on cBEMC results the interactions with cBEMC system via WEB HMI was recorded by the cBEMC system logger mechanism. The overall occupant’s involvement in cBEMC control was evaluated based on the number of interactions of each registered cBEMC account with the soft Thermostat, and how often the arbitration logic was engaged for each automation zone. Also occupancy schedules comfort complaints/suggestions were recorded for each registered cBEMC account.
6.5.1 Baseline
The on-site training before the cBEMC rollout was conducted. With respect to occupant control, the training determined the ease-of-use criteria of the cBEMC web-based HMI portal. That had determined the probability of the user engagement throughout cBEMC demonstration. In addition the facility management was also trained to use HMI to inform occupants about the upcoming system maintenance, malfunction or DR events.
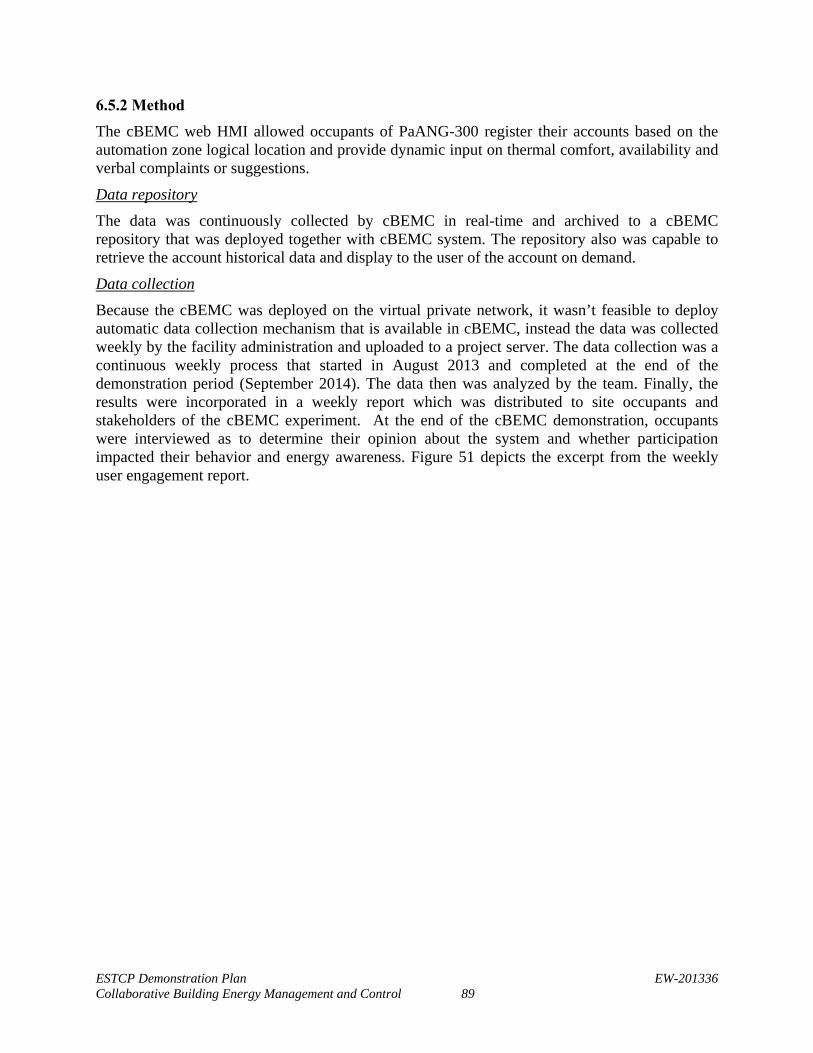
ESTCP Demonstration Plan EW-201336 Collaborative Building Energy Management and Control 89
6.5.2 Method
The cBEMC web HMI allowed occupants of PaANG-300 register their accounts based on the automation zone logical location and provide dynamic input on thermal comfort, availability and verbal complaints or suggestions.
Data repository
The data was continuously collected by cBEMC in real-time and archived to a cBEMC repository that was deployed together with cBEMC system. The repository also was capable to retrieve the account historical data and display to the user of the account on demand.
Data collection
Because the cBEMC was deployed on the virtual private network, it wasn’t feasible to deploy automatic data collection mechanism that is available in cBEMC, instead the data was collected weekly by the facility administration and uploaded to a project server. The data collection was a continuous weekly process that started in August 2013 and completed at the end of the demonstration period (September 2014). The data then was analyzed by the team. Finally, the results were incorporated in a weekly report which was distributed to site occupants and stakeholders of the cBEMC experiment. At the end of the cBEMC demonstration, occupants were interviewed as to determine their opinion about the system and whether participation impacted their behavior and energy awareness. Figure 51 depicts the excerpt from the weekly user engagement report.
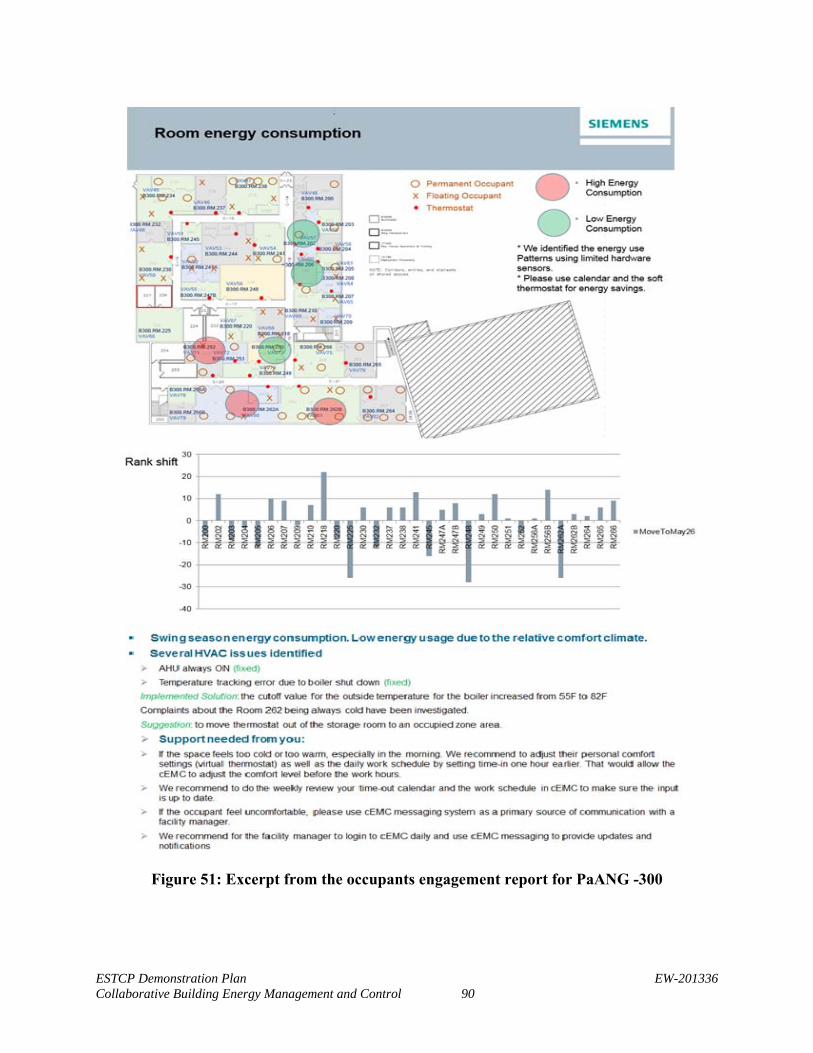
ESTCP Demonstration Plan EW-201336 Collaborative Building Energy Management and Control 90
Figure 51: Excerpt from the occupants engagement report for PaANG -300
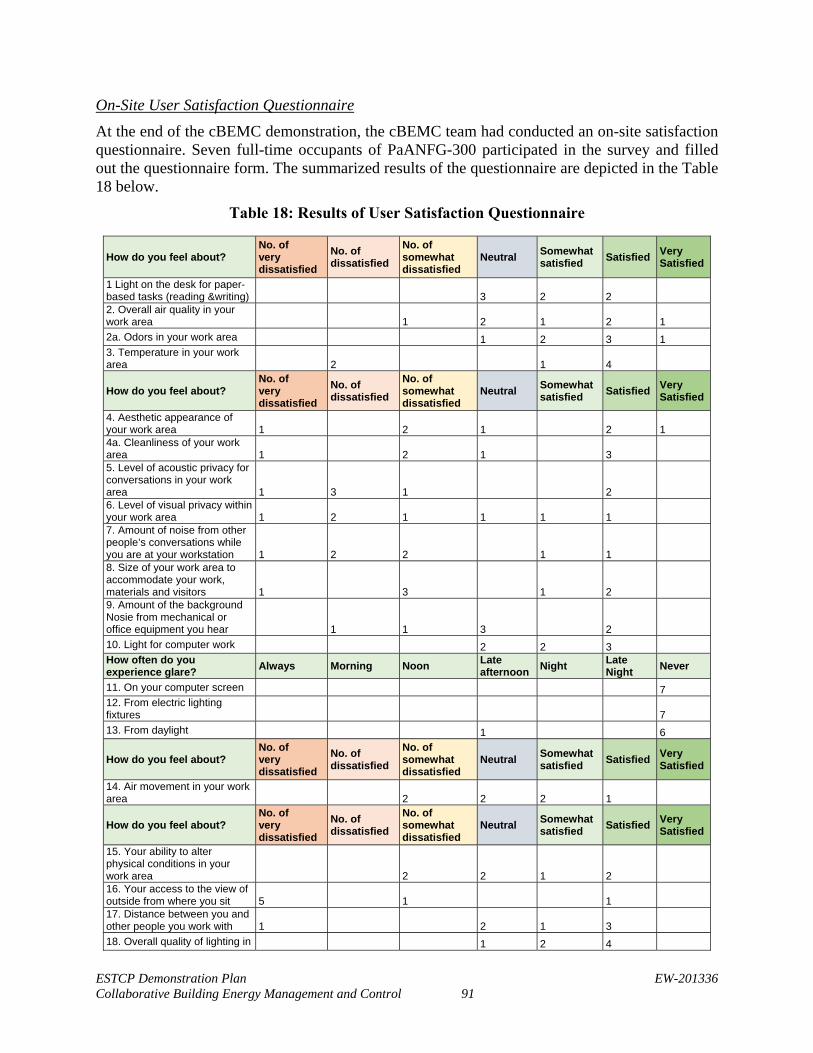
ESTCP Demonstration Plan EW-201336 Collaborative Building Energy Management and Control 91
On-Site User Satisfaction Questionnaire
At the end of the cBEMC demonstration, the cBEMC team had conducted an on-site satisfaction questionnaire. Seven full-time occupants of PaANFG-300 participated in the survey and filled out the questionnaire form. The summarized results of the questionnaire are depicted in the Table 18 below.
Table 18: Results of User Satisfaction Questionnaire
How do you feel about? No. of very dissatisfied
No. of dissatisfied
No. of somewhat dissatisfied
Neutral Somewhat satisfied Satisfied Very
Satisfied
1 Light on the desk for paper-based tasks (reading &writing) 3 2 2 2. Overall air quality in your work area 1 2 1 2 1 2a. Odors in your work area 1 2 3 1 3. Temperature in your work area 2 1 4
How do you feel about? No. of very dissatisfied
No. of dissatisfied
No. of somewhat dissatisfied
Neutral Somewhat satisfied Satisfied Very
Satisfied
4. Aesthetic appearance of your work area 1 2 1 2 1 4a. Cleanliness of your work area 1 2 1 3 5. Level of acoustic privacy for conversations in your work area 1 3 1 2 6. Level of visual privacy within your work area 1 2 1 1 1 1 7. Amount of noise from other people’s conversations while you are at your workstation 1 2 2 1 1 8. Size of your work area to accommodate your work, materials and visitors 1 3 1 2 9. Amount of the background Nosie from mechanical or office equipment you hear 1 1 3 2 10. Light for computer work 2 2 3 How often do you experience glare? Always Morning Noon Late
afternoon Night Late Night Never
11. On your computer screen 7 12. From electric lighting fixtures 7 13. From daylight 1 6
How do you feel about? No. of very dissatisfied
No. of dissatisfied
No. of somewhat dissatisfied
Neutral Somewhat satisfied Satisfied Very
Satisfied
14. Air movement in your work area 2 2 2 1
How do you feel about? No. of very dissatisfied
No. of dissatisfied
No. of somewhat dissatisfied
Neutral Somewhat satisfied Satisfied Very
Satisfied
15. Your ability to alter physical conditions in your work area 2 2 1 2 16. Your access to the view of outside from where you sit 5 1 1 17. Distance between you and other people you work with 1 2 1 3 18. Overall quality of lighting in 1 2 4
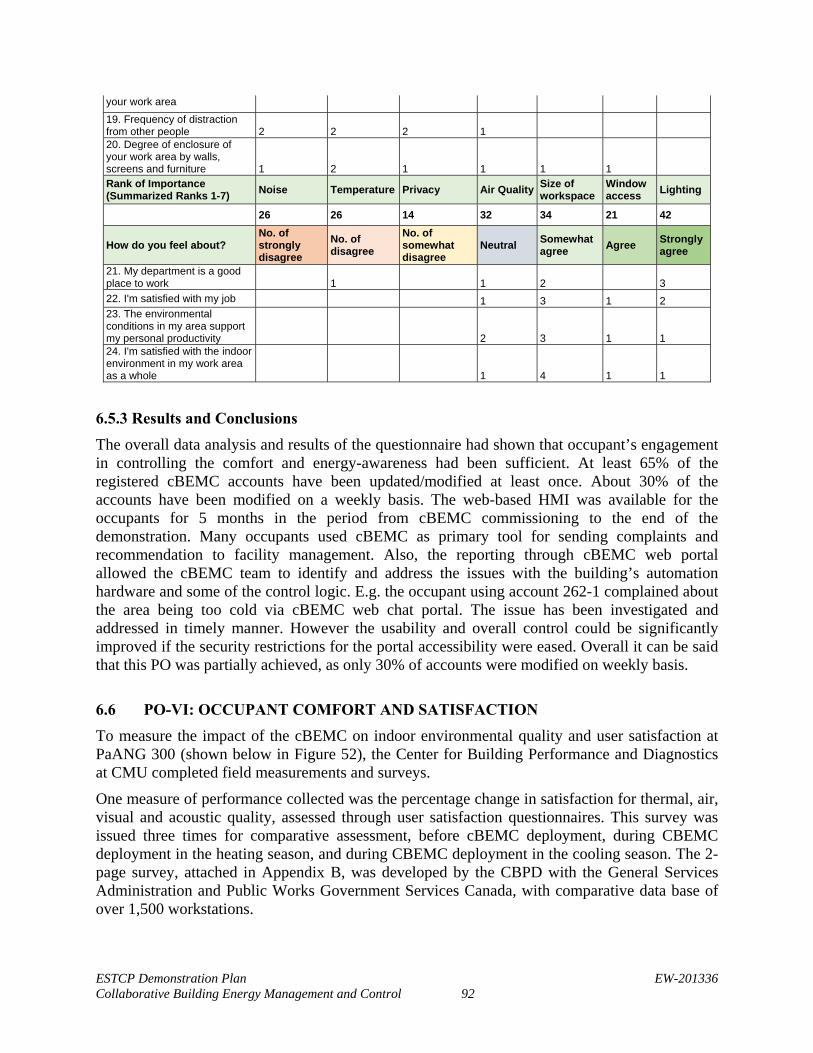
ESTCP Demonstration Plan EW-201336 Collaborative Building Energy Management and Control 92
6.5.3 Results and Conclusions
The overall data analysis and results of the questionnaire had shown that occupant’s engagement in controlling the comfort and energy-awareness had been sufficient. At least 65% of the registered cBEMC accounts have been updated/modified at least once. About 30% of the accounts have been modified on a weekly basis. The web-based HMI was available for the occupants for 5 months in the period from cBEMC commissioning to the end of the demonstration. Many occupants used cBEMC as primary tool for sending complaints and recommendation to facility management. Also, the reporting through cBEMC web portal allowed the cBEMC team to identify and address the issues with the building’s automation hardware and some of the control logic. E.g. the occupant using account 262-1 complained about the area being too cold via cBEMC web chat portal. The issue has been investigated and addressed in timely manner. However the usability and overall control could be significantly improved if the security restrictions for the portal accessibility were eased. Overall it can be said that this PO was partially achieved, as only 30% of accounts were modified on weekly basis.
6.6 PO-VI: OCCUPANT COMFORT AND SATISFACTION
To measure the impact of the cBEMC on indoor environmental quality and user satisfaction at PaANG 300 (shown below in Figure 52), the Center for Building Performance and Diagnostics at CMU completed field measurements and surveys.
One measure of performance collected was the percentage change in satisfaction for thermal, air, visual and acoustic quality, assessed through user satisfaction questionnaires. This survey was issued three times for comparative assessment, before cBEMC deployment, during CBEMC deployment in the heating season, and during CBEMC deployment in the cooling season. The 2-page survey, attached in Appendix B, was developed by the CBPD with the General Services Administration and Public Works Government Services Canada, with comparative data base of over 1,500 workstations.
your work area 19. Frequency of distraction from other people 2 2 2 1 20. Degree of enclosure of your work area by walls, screens and furniture 1 2 1 1 1 1 Rank of Importance (Summarized Ranks 1-7) Noise Temperature Privacy Air Quality Size of
workspace Window access Lighting
26 26 14 32 34 21 42
How do you feel about? No. of strongly disagree
No. of disagree
No. of somewhat disagree
Neutral Somewhat agree Agree Strongly
agree
21. My department is a good place to work 1 1 2 3 22. I'm satisfied with my job 1 3 1 2 23. The environmental conditions in my area support my personal productivity 2 3 1 1 24. I'm satisfied with the indoor environment in my work area as a whole 1 4 1 1
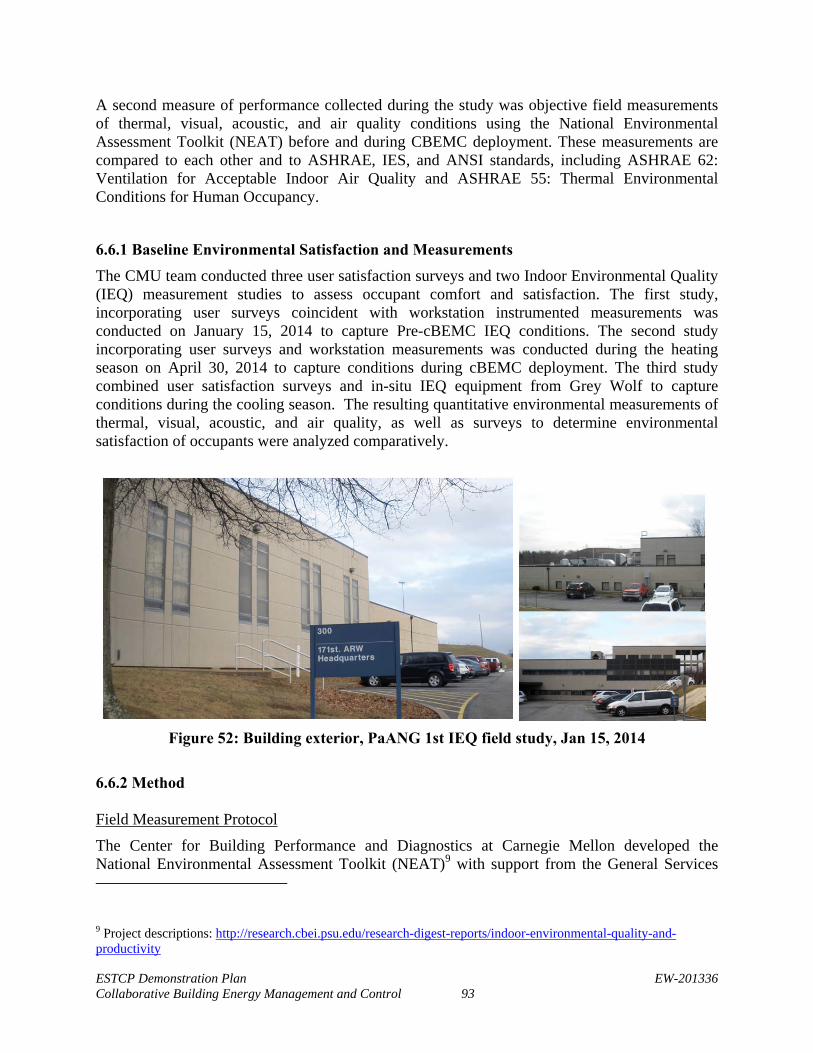
ESTCP Demonstration Plan EW-201336 Collaborative Building Energy Management and Control 93
A second measure of performance collected during the study was objective field measurements of thermal, visual, acoustic, and air quality conditions using the National Environmental Assessment Toolkit (NEAT) before and during CBEMC deployment. These measurements are compared to each other and to ASHRAE, IES, and ANSI standards, including ASHRAE 62: Ventilation for Acceptable Indoor Air Quality and ASHRAE 55: Thermal Environmental Conditions for Human Occupancy.
6.6.1 Baseline Environmental Satisfaction and Measurements
The CMU team conducted three user satisfaction surveys and two Indoor Environmental Quality (IEQ) measurement studies to assess occupant comfort and satisfaction. The first study, incorporating user surveys coincident with workstation instrumented measurements was conducted on January 15, 2014 to capture Pre-cBEMC IEQ conditions. The second study incorporating user surveys and workstation measurements was conducted during the heating season on April 30, 2014 to capture conditions during cBEMC deployment. The third study combined user satisfaction surveys and in-situ IEQ equipment from Grey Wolf to capture conditions during the cooling season. The resulting quantitative environmental measurements of thermal, visual, acoustic, and air quality, as well as surveys to determine environmental satisfaction of occupants were analyzed comparatively.
Figure 52: Building exterior, PaANG 1st IEQ field study, Jan 15, 2014
6.6.2 Method Field Measurement Protocol
The Center for Building Performance and Diagnostics at Carnegie Mellon developed the National Environmental Assessment Toolkit (NEAT)9 with support from the General Services
9 Project descriptions: http://research.cbei.psu.edu/research-digest-reports/indoor-environmental-quality-and-productivity
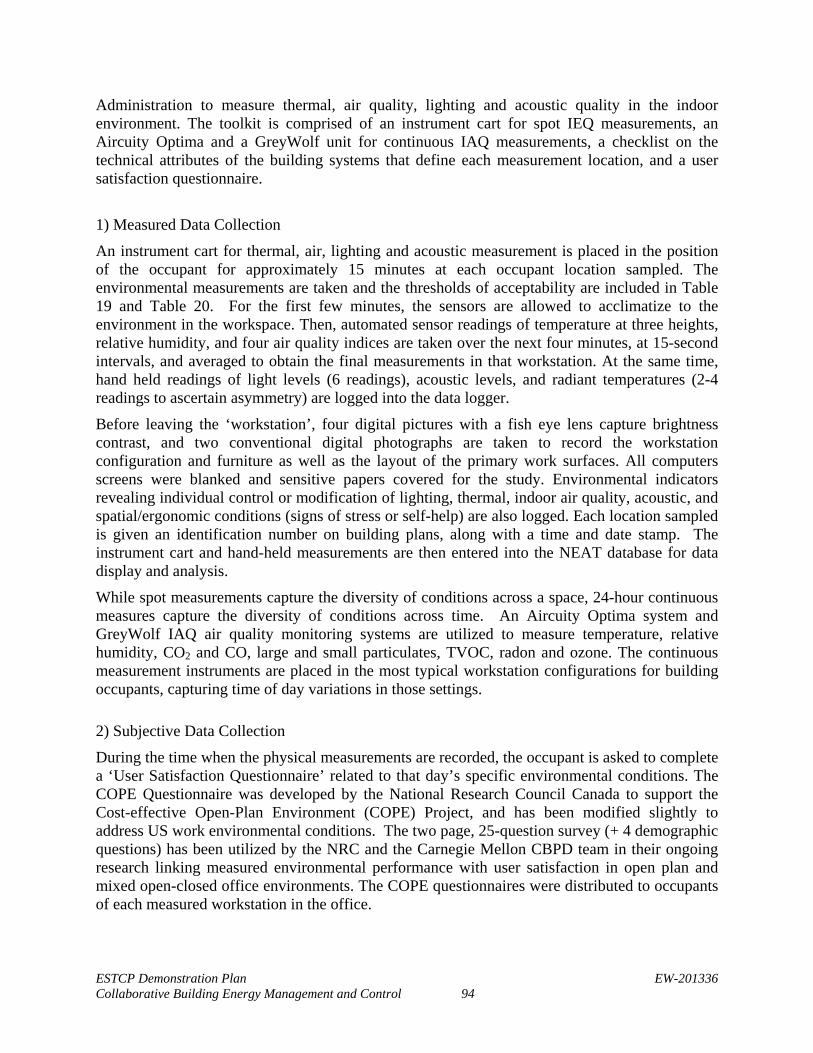
ESTCP Demonstration Plan EW-201336 Collaborative Building Energy Management and Control 94
Administration to measure thermal, air quality, lighting and acoustic quality in the indoor environment. The toolkit is comprised of an instrument cart for spot IEQ measurements, an Aircuity Optima and a GreyWolf unit for continuous IAQ measurements, a checklist on the technical attributes of the building systems that define each measurement location, and a user satisfaction questionnaire.
1) Measured Data Collection
An instrument cart for thermal, air, lighting and acoustic measurement is placed in the position of the occupant for approximately 15 minutes at each occupant location sampled. The environmental measurements are taken and the thresholds of acceptability are included in Table 19 and Table 20. For the first few minutes, the sensors are allowed to acclimatize to the environment in the workspace. Then, automated sensor readings of temperature at three heights, relative humidity, and four air quality indices are taken over the next four minutes, at 15-second intervals, and averaged to obtain the final measurements in that workstation. At the same time, hand held readings of light levels (6 readings), acoustic levels, and radiant temperatures (2-4 readings to ascertain asymmetry) are logged into the data logger.
Before leaving the ‘workstation’, four digital pictures with a fish eye lens capture brightness contrast, and two conventional digital photographs are taken to record the workstation configuration and furniture as well as the layout of the primary work surfaces. All computers screens were blanked and sensitive papers covered for the study. Environmental indicators revealing individual control or modification of lighting, thermal, indoor air quality, acoustic, and spatial/ergonomic conditions (signs of stress or self-help) are also logged. Each location sampled is given an identification number on building plans, along with a time and date stamp. The instrument cart and hand-held measurements are then entered into the NEAT database for data display and analysis.
While spot measurements capture the diversity of conditions across a space, 24-hour continuous measures capture the diversity of conditions across time. An Aircuity Optima system and GreyWolf IAQ air quality monitoring systems are utilized to measure temperature, relative humidity, CO2 and CO, large and small particulates, TVOC, radon and ozone. The continuous measurement instruments are placed in the most typical workstation configurations for building occupants, capturing time of day variations in those settings.
2) Subjective Data Collection
During the time when the physical measurements are recorded, the occupant is asked to complete a ‘User Satisfaction Questionnaire’ related to that day’s specific environmental conditions. The COPE Questionnaire was developed by the National Research Council Canada to support the Cost-effective Open-Plan Environment (COPE) Project, and has been modified slightly to address US work environmental conditions. The two page, 25-question survey (+ 4 demographic questions) has been utilized by the NRC and the Carnegie Mellon CBPD team in their ongoing research linking measured environmental performance with user satisfaction in open plan and mixed open-closed office environments. The COPE questionnaires were distributed to occupants of each measured workstation in the office.
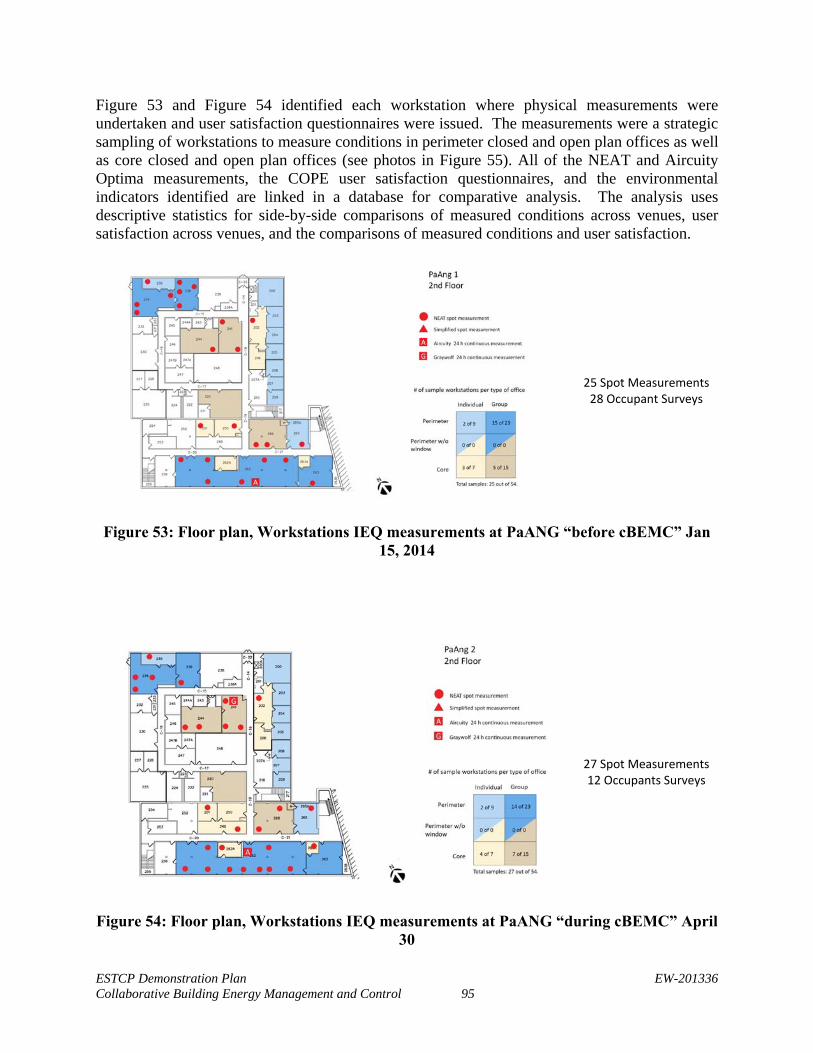
ESTCP Demonstration Plan EW-201336 Collaborative Building Energy Management and Control 95
Figure 53 and Figure 54 identified each workstation where physical measurements were undertaken and user satisfaction questionnaires were issued. The measurements were a strategic sampling of workstations to measure conditions in perimeter closed and open plan offices as well as core closed and open plan offices (see photos in Figure 55). All of the NEAT and Aircuity Optima measurements, the COPE user satisfaction questionnaires, and the environmental indicators identified are linked in a database for comparative analysis. The analysis uses descriptive statistics for side-by-side comparisons of measured conditions across venues, user satisfaction across venues, and the comparisons of measured conditions and user satisfaction.
25 Spot Measurements28 Occupant Surveys
Figure 53: Floor plan, Workstations IEQ measurements at PaANG “before cBEMC” Jan 15, 2014
27 Spot Measurements12 Occupants Surveys
Figure 54: Floor plan, Workstations IEQ measurements at PaANG “during cBEMC” April 30
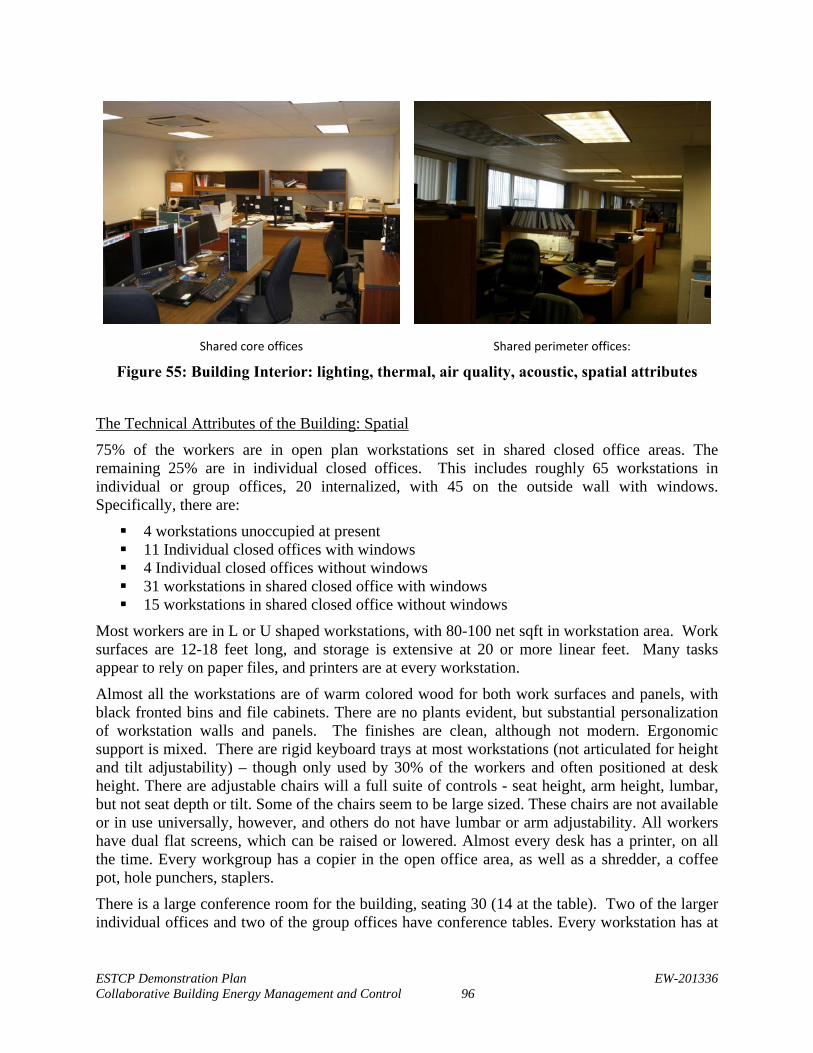
ESTCP Demonstration Plan EW-201336 Collaborative Building Energy Management and Control 96
Shared core offices Shared perimeter offices:
Figure 55: Building Interior: lighting, thermal, air quality, acoustic, spatial attributes
The Technical Attributes of the Building: Spatial
75% of the workers are in open plan workstations set in shared closed office areas. The remaining 25% are in individual closed offices. This includes roughly 65 workstations in individual or group offices, 20 internalized, with 45 on the outside wall with windows. Specifically, there are:
4 workstations unoccupied at present 11 Individual closed offices with windows 4 Individual closed offices without windows 31 workstations in shared closed office with windows 15 workstations in shared closed office without windows
Most workers are in L or U shaped workstations, with 80-100 net sqft in workstation area. Work surfaces are 12-18 feet long, and storage is extensive at 20 or more linear feet. Many tasks appear to rely on paper files, and printers are at every workstation.
Almost all the workstations are of warm colored wood for both work surfaces and panels, with black fronted bins and file cabinets. There are no plants evident, but substantial personalization of workstation walls and panels. The finishes are clean, although not modern. Ergonomic support is mixed. There are rigid keyboard trays at most workstations (not articulated for height and tilt adjustability) – though only used by 30% of the workers and often positioned at desk height. There are adjustable chairs will a full suite of controls - seat height, arm height, lumbar, but not seat depth or tilt. Some of the chairs seem to be large sized. These chairs are not available or in use universally, however, and others do not have lumbar or arm adjustability. All workers have dual flat screens, which can be raised or lowered. Almost every desk has a printer, on all the time. Every workgroup has a copier in the open office area, as well as a shredder, a coffee pot, hole punchers, staplers.
There is a large conference room for the building, seating 30 (14 at the table). Two of the larger individual offices and two of the group offices have conference tables. Every workstation has at
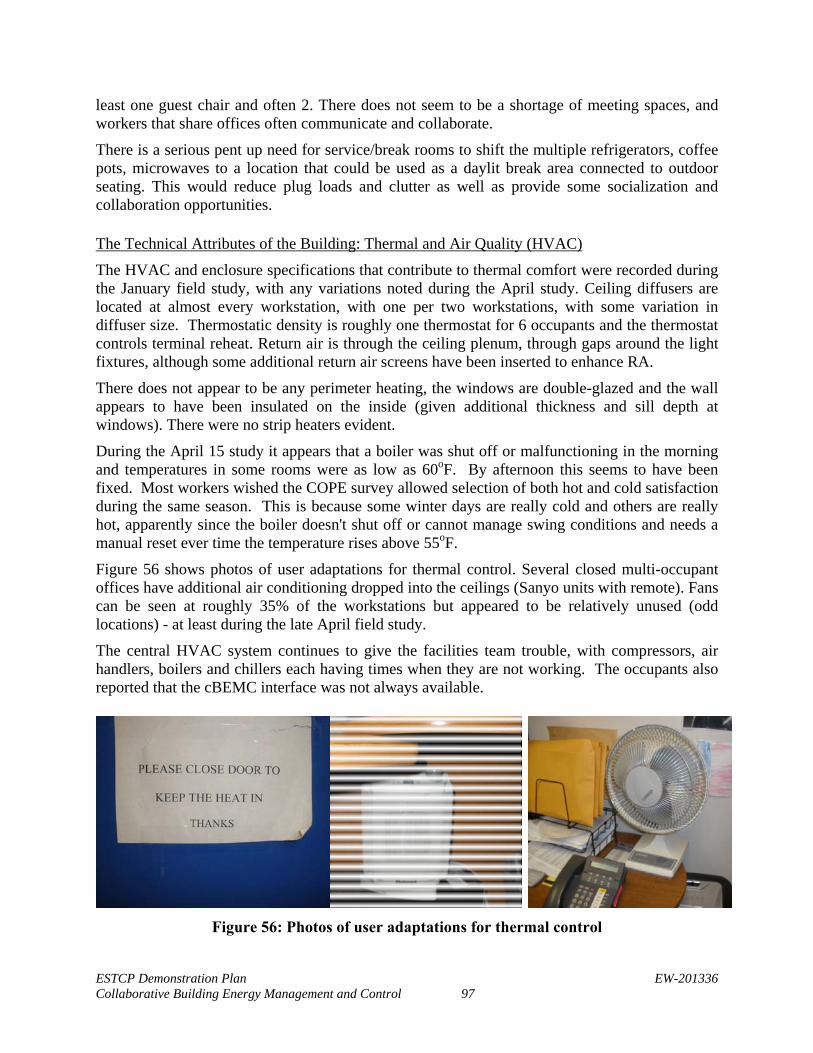
ESTCP Demonstration Plan EW-201336 Collaborative Building Energy Management and Control 97
least one guest chair and often 2. There does not seem to be a shortage of meeting spaces, and workers that share offices often communicate and collaborate.
There is a serious pent up need for service/break rooms to shift the multiple refrigerators, coffee pots, microwaves to a location that could be used as a daylit break area connected to outdoor seating. This would reduce plug loads and clutter as well as provide some socialization and collaboration opportunities.
The Technical Attributes of the Building: Thermal and Air Quality (HVAC)
The HVAC and enclosure specifications that contribute to thermal comfort were recorded during the January field study, with any variations noted during the April study. Ceiling diffusers are located at almost every workstation, with one per two workstations, with some variation in diffuser size. Thermostatic density is roughly one thermostat for 6 occupants and the thermostat controls terminal reheat. Return air is through the ceiling plenum, through gaps around the light fixtures, although some additional return air screens have been inserted to enhance RA.
There does not appear to be any perimeter heating, the windows are double-glazed and the wall appears to have been insulated on the inside (given additional thickness and sill depth at windows). There were no strip heaters evident.
During the April 15 study it appears that a boiler was shut off or malfunctioning in the morning and temperatures in some rooms were as low as 60oF. By afternoon this seems to have been fixed. Most workers wished the COPE survey allowed selection of both hot and cold satisfaction during the same season. This is because some winter days are really cold and others are really hot, apparently since the boiler doesn't shut off or cannot manage swing conditions and needs a manual reset ever time the temperature rises above 55oF.
Figure 56 shows photos of user adaptations for thermal control. Several closed multi-occupant offices have additional air conditioning dropped into the ceilings (Sanyo units with remote). Fans can be seen at roughly 35% of the workstations but appeared to be relatively unused (odd locations) - at least during the late April field study.
The central HVAC system continues to give the facilities team trouble, with compressors, air handlers, boilers and chillers each having times when they are not working. The occupants also reported that the cBEMC interface was not always available.
Figure 56: Photos of user adaptations for thermal control
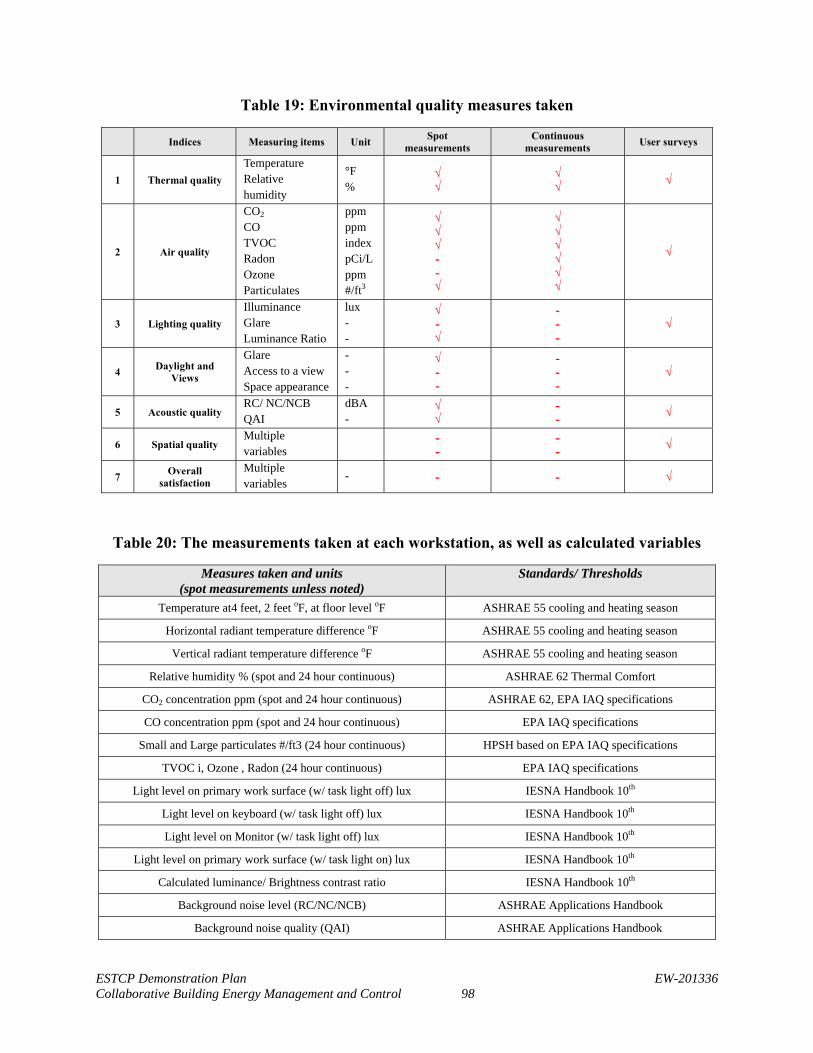
ESTCP Demonstration Plan EW-201336 Collaborative Building Energy Management and Control 98
Table 19: Environmental quality measures taken
Indices Measuring items Unit Spot
measurements Continuous
measurements User surveys
1 Thermal quality
Temperature Relative humidity
°F %
√ √
√ √
√
2 Air quality
CO2 CO TVOC Radon Ozone Particulates
ppm ppm index pCi/L ppm #/ft3
√ √ √ - - √
√ √ √ √ √ √
√
3 Lighting quality
Illuminance Glare Luminance Ratio
lux - -
√ - √
- - -
√
4 Daylight and
Views
Glare Access to a view Space appearance
- - -
√ - -
- - -
√
5 Acoustic quality RC/ NC/NCB QAI
dBA -
√ √
- -
√
6 Spatial quality Multiple variables
- -
- -
√
7 Overall
satisfaction
Multiple variables
- - - √
Table 20: The measurements taken at each workstation, as well as calculated variables
Measures taken and units (spot measurements unless noted)
Standards/ Thresholds
Temperature at4 feet, 2 feet oF, at floor level oF ASHRAE 55 cooling and heating season
Horizontal radiant temperature difference oF ASHRAE 55 cooling and heating season
Vertical radiant temperature difference oF ASHRAE 55 cooling and heating season
Relative humidity % (spot and 24 hour continuous) ASHRAE 62 Thermal Comfort
CO2 concentration ppm (spot and 24 hour continuous) ASHRAE 62, EPA IAQ specifications
CO concentration ppm (spot and 24 hour continuous) EPA IAQ specifications
Small and Large particulates #/ft3 (24 hour continuous) HPSH based on EPA IAQ specifications
TVOC i, Ozone , Radon (24 hour continuous) EPA IAQ specifications
Light level on primary work surface (w/ task light off) lux IESNA Handbook 10th
Light level on keyboard (w/ task light off) lux IESNA Handbook 10th
Light level on Monitor (w/ task light off) lux IESNA Handbook 10th
Light level on primary work surface (w/ task light on) lux IESNA Handbook 10th
Calculated luminance/ Brightness contrast ratio IESNA Handbook 10th
Background noise level (RC/NC/NCB) ASHRAE Applications Handbook
Background noise quality (QAI) ASHRAE Applications Handbook
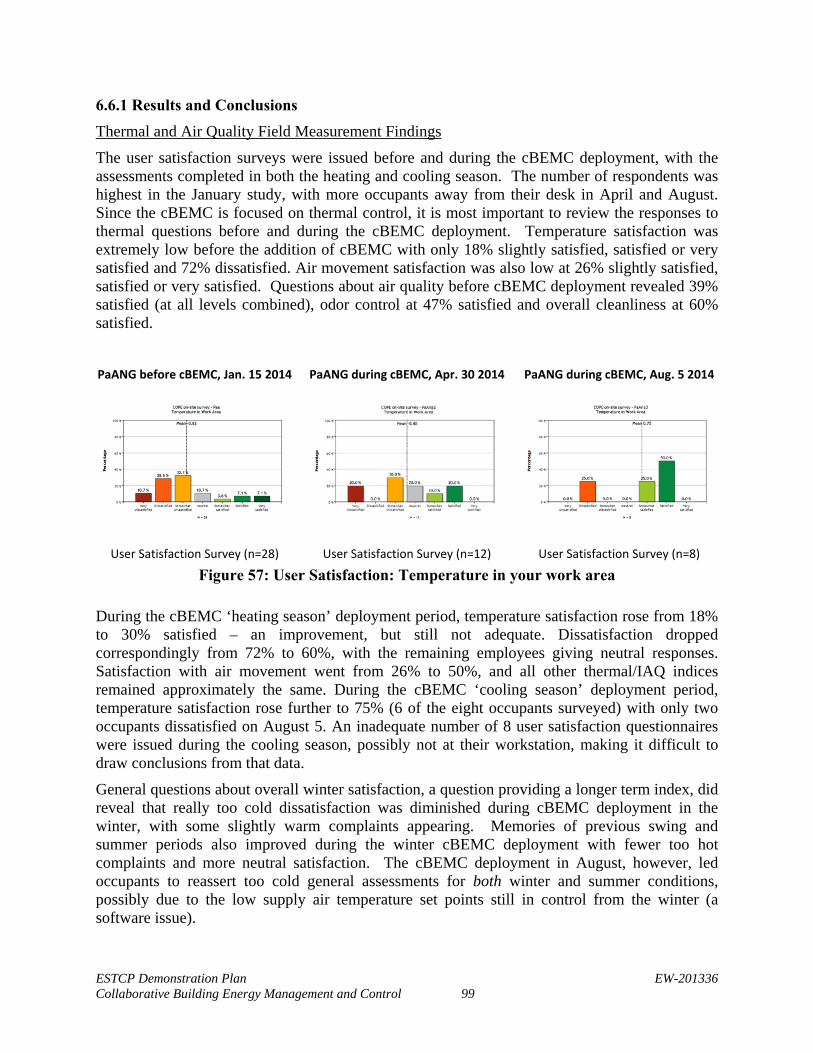
ESTCP Demonstration Plan EW-201336 Collaborative Building Energy Management and Control 99
6.6.1 Results and Conclusions
Thermal and Air Quality Field Measurement Findings
The user satisfaction surveys were issued before and during the cBEMC deployment, with the assessments completed in both the heating and cooling season. The number of respondents was highest in the January study, with more occupants away from their desk in April and August. Since the cBEMC is focused on thermal control, it is most important to review the responses to thermal questions before and during the cBEMC deployment. Temperature satisfaction was extremely low before the addition of cBEMC with only 18% slightly satisfied, satisfied or very satisfied and 72% dissatisfied. Air movement satisfaction was also low at 26% slightly satisfied, satisfied or very satisfied. Questions about air quality before cBEMC deployment revealed 39% satisfied (at all levels combined), odor control at 47% satisfied and overall cleanliness at 60% satisfied.
PaANG before cBEMC, Jan. 15 2014 PaANG during cBEMC, Apr. 30 2014 PaANG during cBEMC, Aug. 5 2014
User Satisfaction Survey (n=28) User Satisfaction Survey (n=12) User Satisfaction Survey (n=8)
Figure 57: User Satisfaction: Temperature in your work area
During the cBEMC ‘heating season’ deployment period, temperature satisfaction rose from 18% to 30% satisfied – an improvement, but still not adequate. Dissatisfaction dropped correspondingly from 72% to 60%, with the remaining employees giving neutral responses. Satisfaction with air movement went from 26% to 50%, and all other thermal/IAQ indices remained approximately the same. During the cBEMC ‘cooling season’ deployment period, temperature satisfaction rose further to 75% (6 of the eight occupants surveyed) with only two occupants dissatisfied on August 5. An inadequate number of 8 user satisfaction questionnaires were issued during the cooling season, possibly not at their workstation, making it difficult to draw conclusions from that data.
General questions about overall winter satisfaction, a question providing a longer term index, did reveal that really too cold dissatisfaction was diminished during cBEMC deployment in the winter, with some slightly warm complaints appearing. Memories of previous swing and summer periods also improved during the winter cBEMC deployment with fewer too hot complaints and more neutral satisfaction. The cBEMC deployment in August, however, led occupants to reassert too cold general assessments for both winter and summer conditions, possibly due to the low supply air temperature set points still in control from the winter (a software issue).
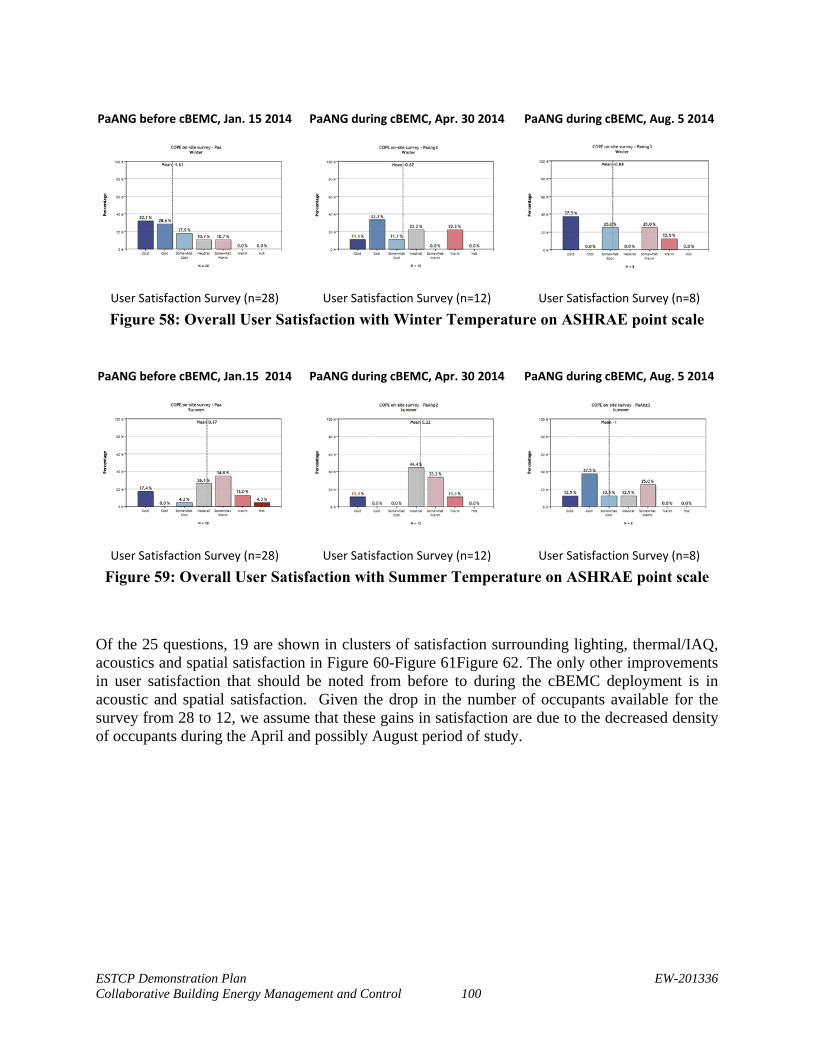
ESTCP Demonstration Plan EW-201336 Collaborative Building Energy Management and Control 100
PaANG before cBEMC, Jan. 15 2014 PaANG during cBEMC, Apr. 30 2014 PaANG during cBEMC, Aug. 5 2014
User Satisfaction Survey (n=28) User Satisfaction Survey (n=12) User Satisfaction Survey (n=8)
Figure 58: Overall User Satisfaction with Winter Temperature on ASHRAE point scale
PaANG before cBEMC, Jan.15 2014 PaANG during cBEMC, Apr. 30 2014 PaANG during cBEMC, Aug. 5 2014
User Satisfaction Survey (n=28) User Satisfaction Survey (n=12) User Satisfaction Survey (n=8)
Figure 59: Overall User Satisfaction with Summer Temperature on ASHRAE point scale
Of the 25 questions, 19 are shown in clusters of satisfaction surrounding lighting, thermal/IAQ, acoustics and spatial satisfaction in Figure 60-Figure 61Figure 62. The only other improvements in user satisfaction that should be noted from before to during the cBEMC deployment is in acoustic and spatial satisfaction. Given the drop in the number of occupants available for the survey from 28 to 12, we assume that these gains in satisfaction are due to the decreased density of occupants during the April and possibly August period of study.
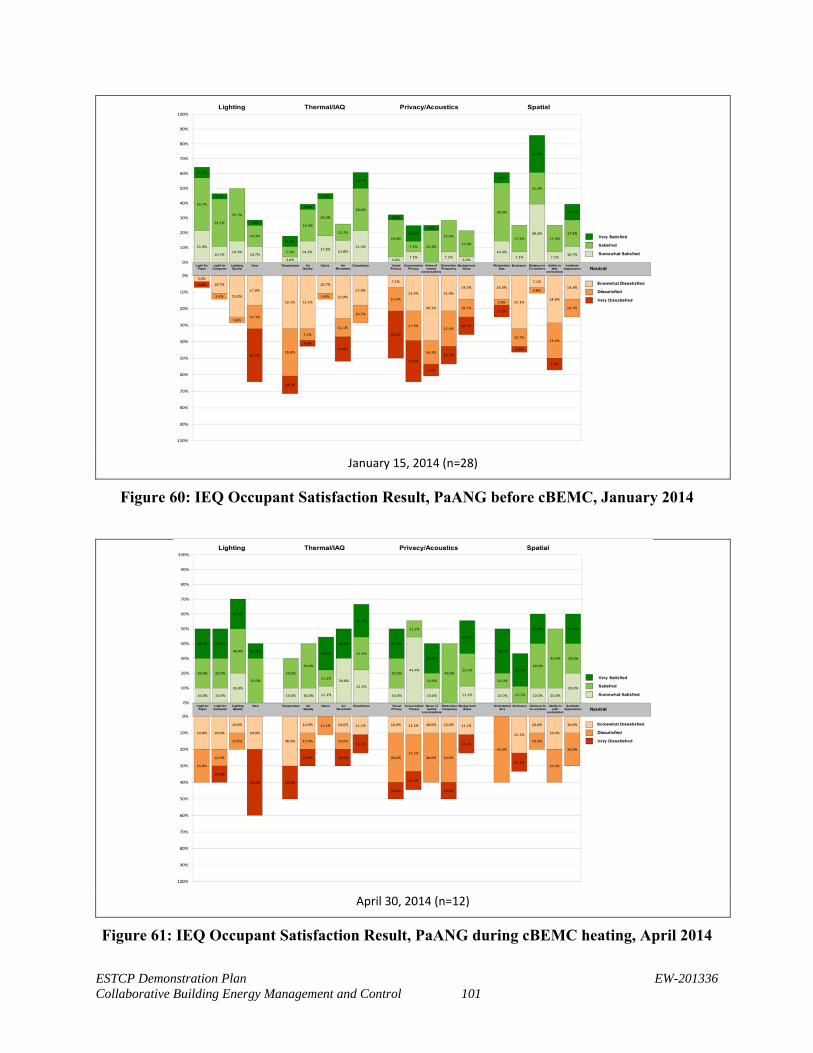
ESTCP Demonstration Plan EW-201336 Collaborative Building Energy Management and Control 101
January 15, 2014 (n=28)
Figure 60: IEQ Occupant Satisfaction Result, PaANG before cBEMC, January 2014
April 30, 2014 (n=12)
Figure 61: IEQ Occupant Satisfaction Result, PaANG during cBEMC heating, April 2014
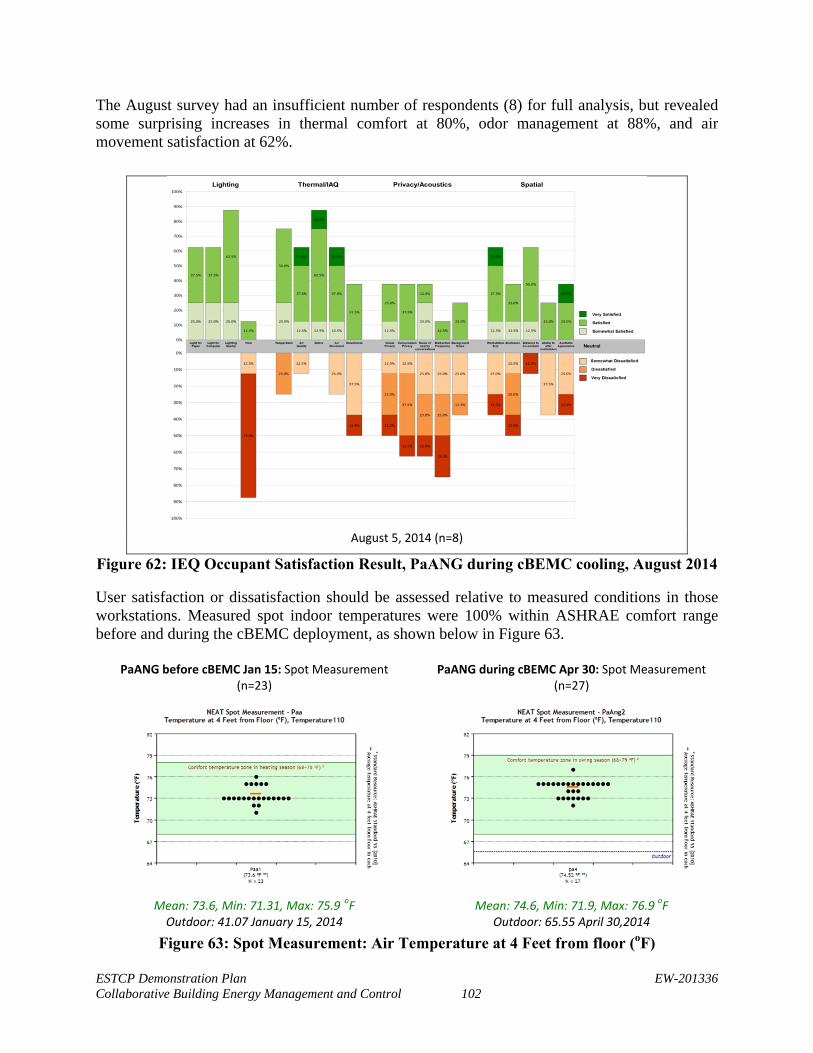
ESTCP Demonstration Plan EW-201336 Collaborative Building Energy Management and Control 102
The August survey had an insufficient number of respondents (8) for full analysis, but revealed some surprising increases in thermal comfort at 80%, odor management at 88%, and air movement satisfaction at 62%.
August 5, 2014 (n=8)
Figure 62: IEQ Occupant Satisfaction Result, PaANG during cBEMC cooling, August 2014
User satisfaction or dissatisfaction should be assessed relative to measured conditions in those workstations. Measured spot indoor temperatures were 100% within ASHRAE comfort range before and during the cBEMC deployment, as shown below in Figure 63.
PaANG before cBEMC Jan 15: Spot Measurement (n=23)
PaANG during cBEMC Apr 30: Spot Measurement (n=27)
Mean: 73.6, Min: 71.31, Max: 75.9 oF Outdoor: 41.07 January 15, 2014
Mean: 74.6, Min: 71.9, Max: 76.9 oF Outdoor: 65.55 April 30,2014
Figure 63: Spot Measurement: Air Temperature at 4 Feet from floor (oF)
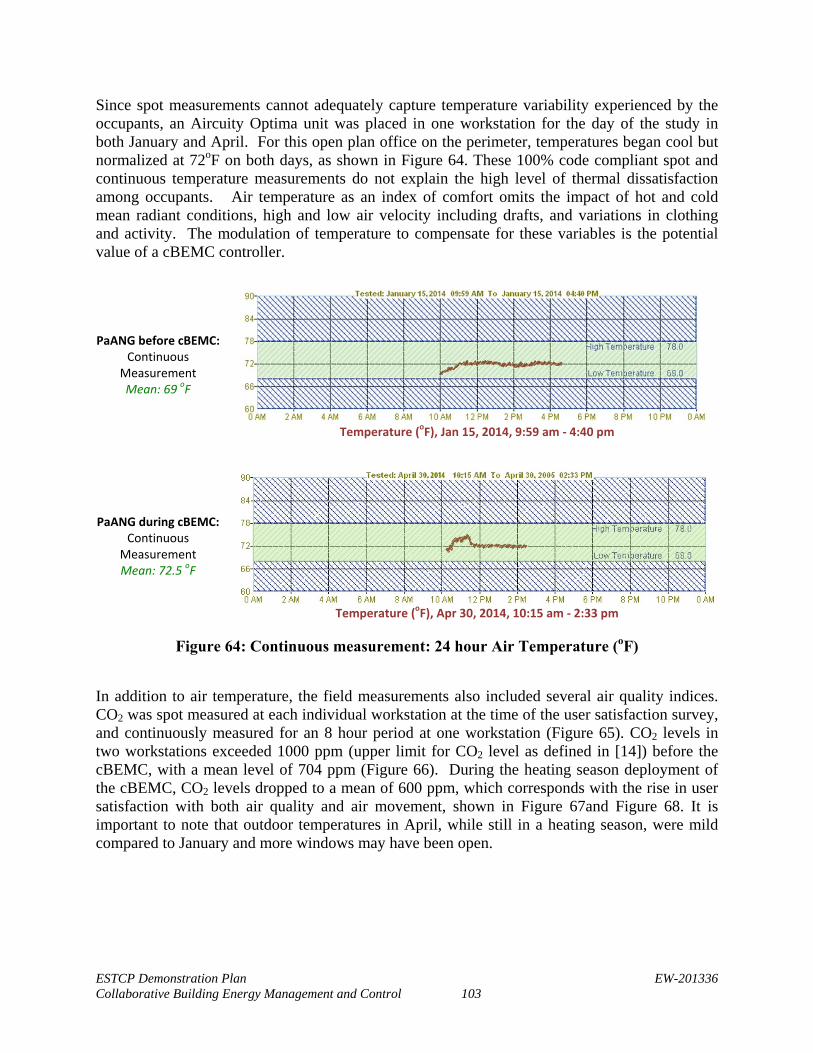
ESTCP Demonstration Plan EW-201336 Collaborative Building Energy Management and Control 103
Since spot measurements cannot adequately capture temperature variability experienced by the occupants, an Aircuity Optima unit was placed in one workstation for the day of the study in both January and April. For this open plan office on the perimeter, temperatures began cool but normalized at 72oF on both days, as shown in Figure 64. These 100% code compliant spot and continuous temperature measurements do not explain the high level of thermal dissatisfaction among occupants. Air temperature as an index of comfort omits the impact of hot and cold mean radiant conditions, high and low air velocity including drafts, and variations in clothing and activity. The modulation of temperature to compensate for these variables is the potential value of a cBEMC controller.
PaANG before cBEMC: Continuous
Measurement Mean: 69 oF
Temperature (oF), Jan 15, 2014, 9:59 am ‐ 4:40 pm
PaANG during cBEMC: Continuous
Measurement Mean: 72.5 oF
Temperature (oF), Apr 30, 2014, 10:15 am ‐ 2:33 pm
Figure 64: Continuous measurement: 24 hour Air Temperature (oF)
In addition to air temperature, the field measurements also included several air quality indices. CO2 was spot measured at each individual workstation at the time of the user satisfaction survey, and continuously measured for an 8 hour period at one workstation (Figure 65). CO2 levels in two workstations exceeded 1000 ppm (upper limit for CO2 level as defined in [14]) before the cBEMC, with a mean level of 704 ppm (Figure 66). During the heating season deployment of the cBEMC, CO2 levels dropped to a mean of 600 ppm, which corresponds with the rise in user satisfaction with both air quality and air movement, shown in Figure 67and Figure 68. It is important to note that outdoor temperatures in April, while still in a heating season, were mild compared to January and more windows may have been open.
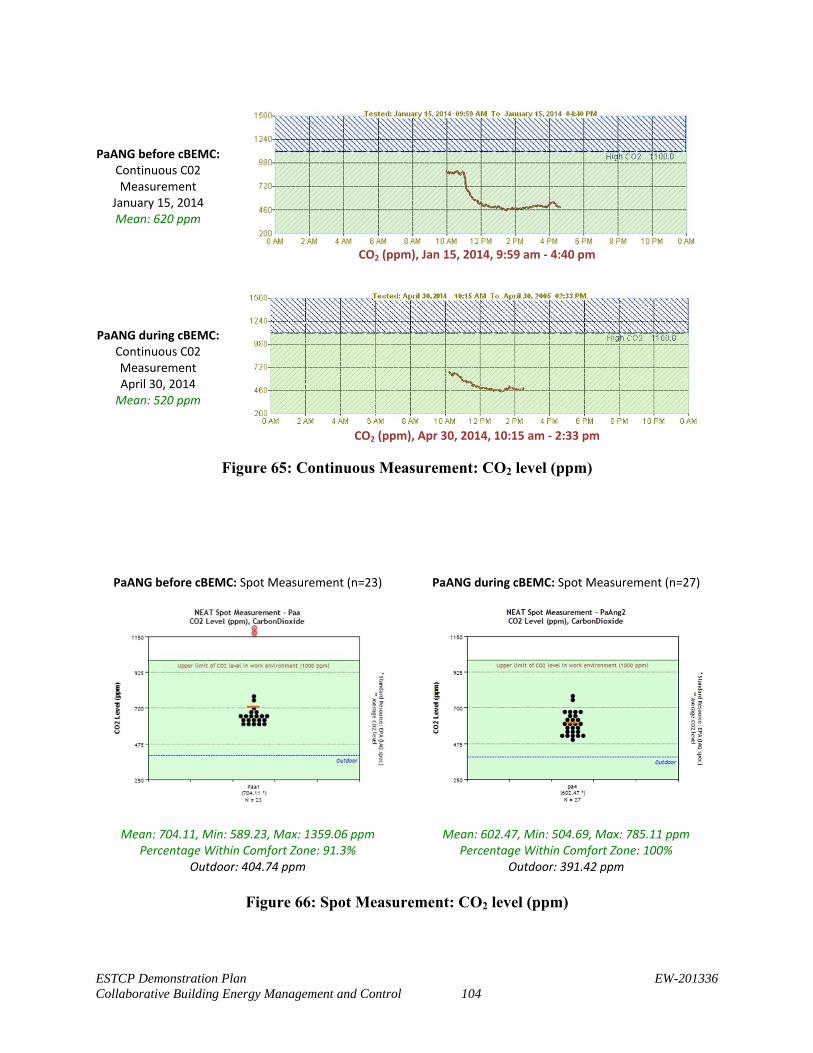
ESTCP Demonstration Plan EW-201336 Collaborative Building Energy Management and Control 104
PaANG before cBEMC: Continuous C02 Measurement
January 15, 2014 Mean: 620 ppm
CO2 (ppm), Jan 15, 2014, 9:59 am ‐ 4:40 pm
PaANG during cBEMC: Continuous C02 Measurement April 30, 2014 Mean: 520 ppm
CO2 (ppm), Apr 30, 2014, 10:15 am ‐ 2:33 pm
Figure 65: Continuous Measurement: CO2 level (ppm)
PaANG before cBEMC: Spot Measurement (n=23) PaANG during cBEMC: Spot Measurement (n=27)
Mean: 704.11, Min: 589.23, Max: 1359.06 ppm Percentage Within Comfort Zone: 91.3%
Outdoor: 404.74 ppm
Mean: 602.47, Min: 504.69, Max: 785.11 ppm Percentage Within Comfort Zone: 100%
Outdoor: 391.42 ppm
Figure 66: Spot Measurement: CO2 level (ppm)
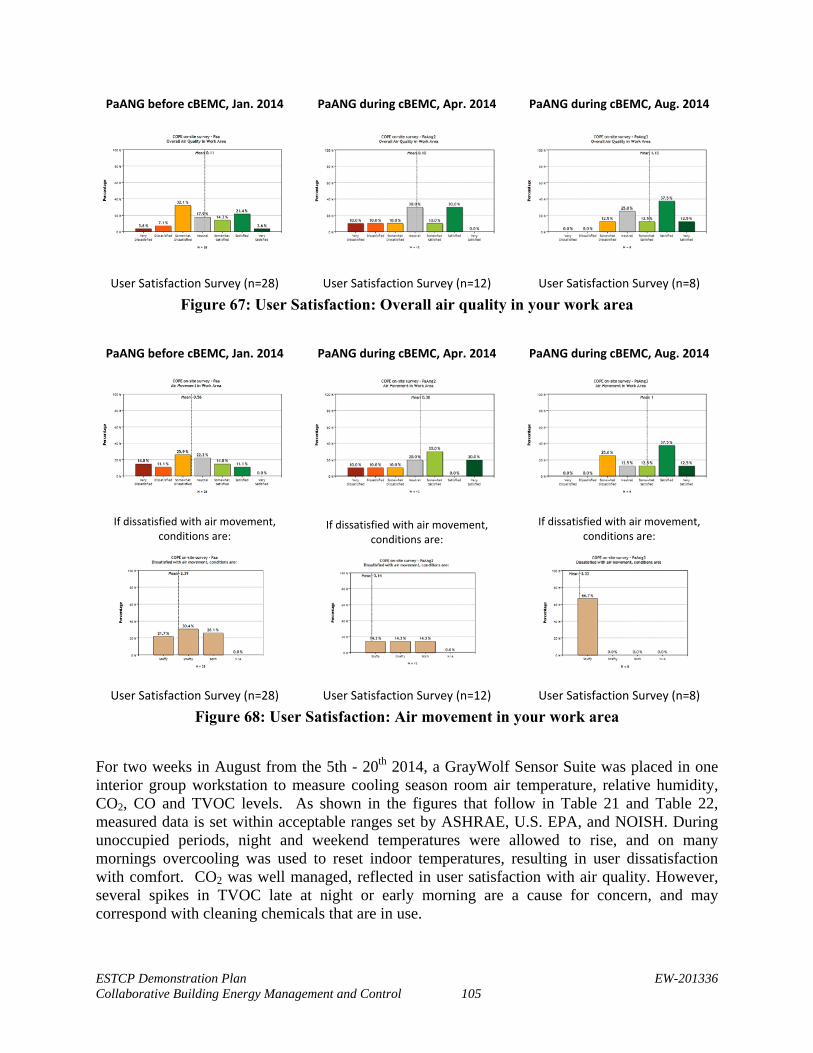
ESTCP Demonstration Plan EW-201336 Collaborative Building Energy Management and Control 105
PaANG before cBEMC, Jan. 2014 PaANG during cBEMC, Apr. 2014 PaANG during cBEMC, Aug. 2014
User Satisfaction Survey (n=28) User Satisfaction Survey (n=12) User Satisfaction Survey (n=8)
Figure 67: User Satisfaction: Overall air quality in your work area
PaANG before cBEMC, Jan. 2014 PaANG during cBEMC, Apr. 2014 PaANG during cBEMC, Aug. 2014
If dissatisfied with air movement, conditions are:
If dissatisfied with air movement, conditions are:
If dissatisfied with air movement, conditions are:
User Satisfaction Survey (n=28) User Satisfaction Survey (n=12) User Satisfaction Survey (n=8)
Figure 68: User Satisfaction: Air movement in your work area
For two weeks in August from the 5th - 20th 2014, a GrayWolf Sensor Suite was placed in one interior group workstation to measure cooling season room air temperature, relative humidity, CO2, CO and TVOC levels. As shown in the figures that follow in Table 21 and Table 22, measured data is set within acceptable ranges set by ASHRAE, U.S. EPA, and NOISH. During unoccupied periods, night and weekend temperatures were allowed to rise, and on many mornings overcooling was used to reset indoor temperatures, resulting in user dissatisfaction with comfort. CO2 was well managed, reflected in user satisfaction with air quality. However, several spikes in TVOC late at night or early morning are a cause for concern, and may correspond with cleaning chemicals that are in use.
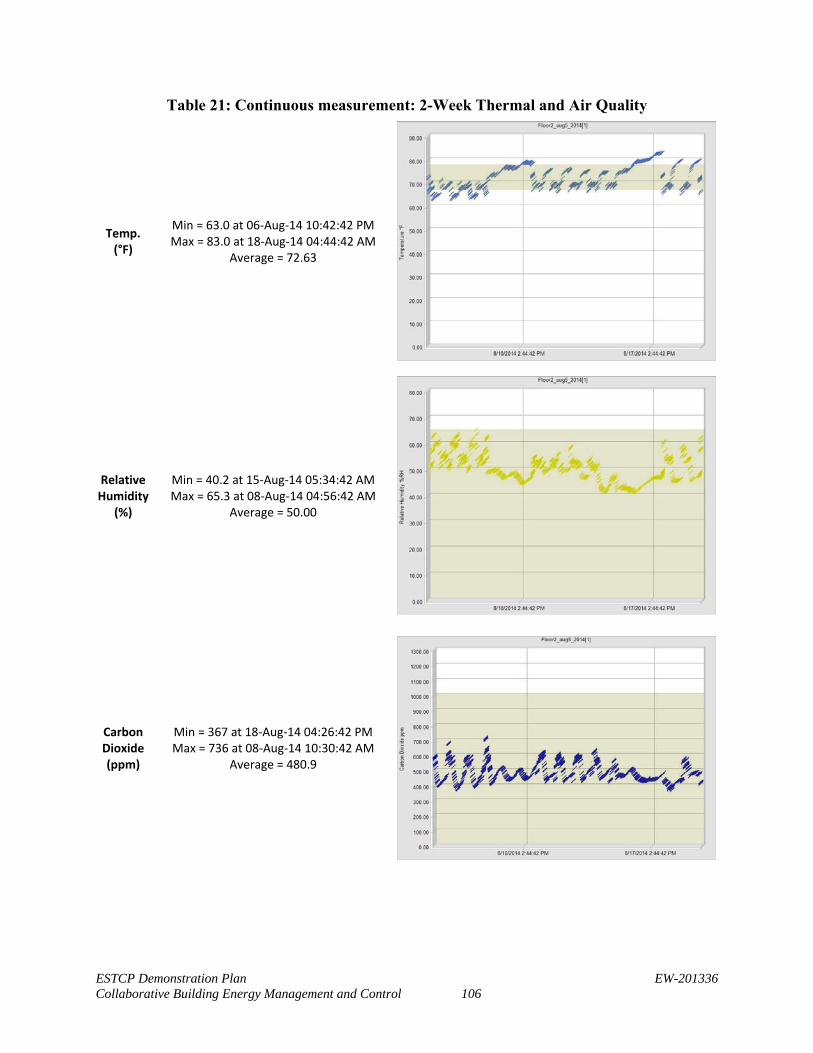
ESTCP Demonstration Plan EW-201336 Collaborative Building Energy Management and Control 106
Table 21: Continuous measurement: 2-Week Thermal and Air Quality
Temp. (°F)
Min = 63.0 at 06‐Aug‐14 10:42:42 PM Max = 83.0 at 18‐Aug‐14 04:44:42 AM
Average = 72.63
Relative Humidity
(%)
Min = 40.2 at 15‐Aug‐14 05:34:42 AM Max = 65.3 at 08‐Aug‐14 04:56:42 AM
Average = 50.00
Carbon Dioxide (ppm)
Min = 367 at 18‐Aug‐14 04:26:42 PM Max = 736 at 08‐Aug‐14 10:30:42 AM
Average = 480.9
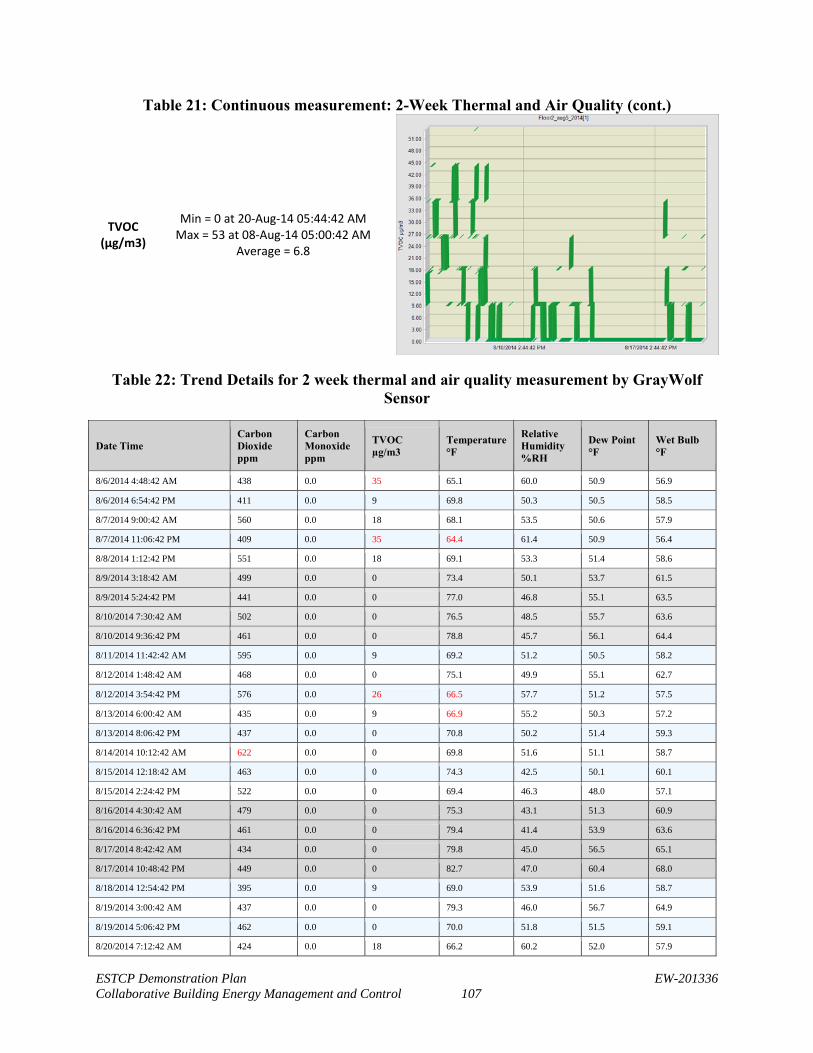
ESTCP Demonstration Plan EW-201336 Collaborative Building Energy Management and Control 107
Table 21: Continuous measurement: 2-Week Thermal and Air Quality (cont.)
TVOC (µg/m3)
Min = 0 at 20‐Aug‐14 05:44:42 AM Max = 53 at 08‐Aug‐14 05:00:42 AM
Average = 6.8
Table 22: Trend Details for 2 week thermal and air quality measurement by GrayWolf Sensor
Date Time Carbon Dioxide ppm
Carbon Monoxide ppm
TVOC µg/m3
Temperature °F
Relative Humidity %RH
Dew Point °F
Wet Bulb °F
8/6/2014 4:48:42 AM 438 0.0 35 65.1 60.0 50.9 56.9
8/6/2014 6:54:42 PM 411 0.0 9 69.8 50.3 50.5 58.5
8/7/2014 9:00:42 AM 560 0.0 18 68.1 53.5 50.6 57.9
8/7/2014 11:06:42 PM 409 0.0 35 64.4 61.4 50.9 56.4
8/8/2014 1:12:42 PM 551 0.0 18 69.1 53.3 51.4 58.6
8/9/2014 3:18:42 AM 499 0.0 0 73.4 50.1 53.7 61.5
8/9/2014 5:24:42 PM 441 0.0 0 77.0 46.8 55.1 63.5
8/10/2014 7:30:42 AM 502 0.0 0 76.5 48.5 55.7 63.6
8/10/2014 9:36:42 PM 461 0.0 0 78.8 45.7 56.1 64.4
8/11/2014 11:42:42 AM 595 0.0 9 69.2 51.2 50.5 58.2
8/12/2014 1:48:42 AM 468 0.0 0 75.1 49.9 55.1 62.7
8/12/2014 3:54:42 PM 576 0.0 26 66.5 57.7 51.2 57.5
8/13/2014 6:00:42 AM 435 0.0 9 66.9 55.2 50.3 57.2
8/13/2014 8:06:42 PM 437 0.0 0 70.8 50.2 51.4 59.3
8/14/2014 10:12:42 AM 622 0.0 0 69.8 51.6 51.1 58.7
8/15/2014 12:18:42 AM 463 0.0 0 74.3 42.5 50.1 60.1
8/15/2014 2:24:42 PM 522 0.0 0 69.4 46.3 48.0 57.1
8/16/2014 4:30:42 AM 479 0.0 0 75.3 43.1 51.3 60.9
8/16/2014 6:36:42 PM 461 0.0 0 79.4 41.4 53.9 63.6
8/17/2014 8:42:42 AM 434 0.0 0 79.8 45.0 56.5 65.1
8/17/2014 10:48:42 PM 449 0.0 0 82.7 47.0 60.4 68.0
8/18/2014 12:54:42 PM 395 0.0 9 69.0 53.9 51.6 58.7
8/19/2014 3:00:42 AM 437 0.0 0 79.3 46.0 56.7 64.9
8/19/2014 5:06:42 PM 462 0.0 0 70.0 51.8 51.5 59.1
8/20/2014 7:12:42 AM 424 0.0 18 66.2 60.2 52.0 57.9

ESTCP Demonstration Plan EW-201336 Collaborative Building Energy Management and Control 108
Lighting/ Visual Quality
While the cBEMC interface does not engage users in lighting control, user satisfaction with Indoor Environmental Quality is often affected by the integrated conditions of thermal, air, lighting, acoustics and spatial quality. For this reason, the CMU team completed summaries of the lighting and acoustic conditions, user satisfaction surveys, and field measurements for January 15 and April 30 before and during the heating season cBEMC deployment.
The lighting in both closed and open offices is predominantly through recessed ceiling 2x4 troffers with 3 T-5 28 watt lamps and large cell parabolic louvers, as shown in Figure 69. Large cell parabolic louvers do not effectively shield the lamps from the occupants causing a glare condition that should be improved. The lighting was almost all on, at roughly 1.6 watts/sqft of light. While individual office and zone on-off switching is available, when the first individual arrives they typically turn on lights for the entire office suite. Color temperatures of the lamps vary from warm white to cool white.
Figure 69: Ceiling light Figure 70: Fisheye Image for glare analysis
Lights are reasonably well aligned with work surfaces and panels are not taller than 5 feet so modest shadowing occurs. In some areas lights have been delamped since they are not needed.
Most workstations have one or two under-bin T-8 lamps with local on off control, but less than 10% of the workstations have them on. At most 5% of the workstations have additional personal task lights but they are also rarely on, with a total lighting power density of 1.7 watts/sqft estimated.
The measured ambient lighting levels were adequate for computer based tasks and the underbin lights provide additional lumens for paper based tasks. Nonetheless, replacement of the ceiling and task lights with LED fixtures could be justified with energy savings and improved management of direct glare.
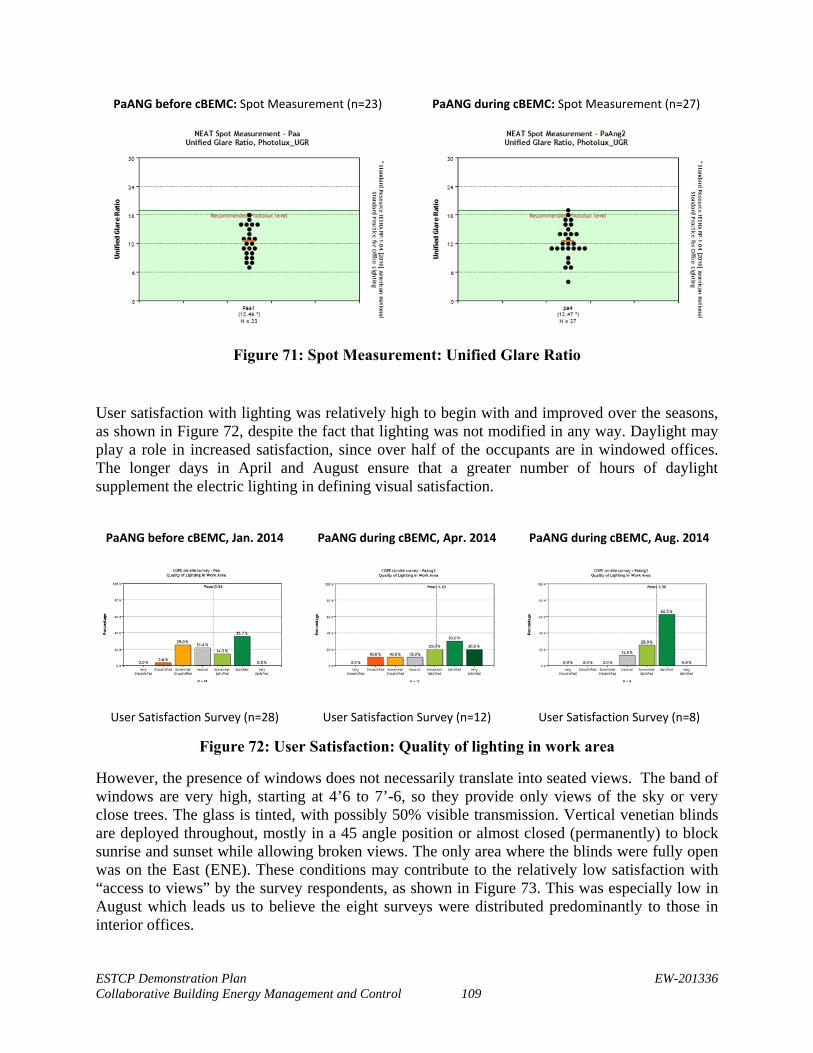
ESTCP Demonstration Plan EW-201336 Collaborative Building Energy Management and Control 109
PaANG before cBEMC: Spot Measurement (n=23) PaANG during cBEMC: Spot Measurement (n=27)
Figure 71: Spot Measurement: Unified Glare Ratio
User satisfaction with lighting was relatively high to begin with and improved over the seasons, as shown in Figure 72, despite the fact that lighting was not modified in any way. Daylight may play a role in increased satisfaction, since over half of the occupants are in windowed offices. The longer days in April and August ensure that a greater number of hours of daylight supplement the electric lighting in defining visual satisfaction.
PaANG before cBEMC, Jan. 2014 PaANG during cBEMC, Apr. 2014 PaANG during cBEMC, Aug. 2014
User Satisfaction Survey (n=28) User Satisfaction Survey (n=12) User Satisfaction Survey (n=8)
Figure 72: User Satisfaction: Quality of lighting in work area
However, the presence of windows does not necessarily translate into seated views. The band of windows are very high, starting at 4’6 to 7’-6, so they provide only views of the sky or very close trees. The glass is tinted, with possibly 50% visible transmission. Vertical venetian blinds are deployed throughout, mostly in a 45 angle position or almost closed (permanently) to block sunrise and sunset while allowing broken views. The only area where the blinds were fully open was on the East (ENE). These conditions may contribute to the relatively low satisfaction with “access to views” by the survey respondents, as shown in Figure 73. This was especially low in August which leads us to believe the eight surveys were distributed predominantly to those in interior offices.
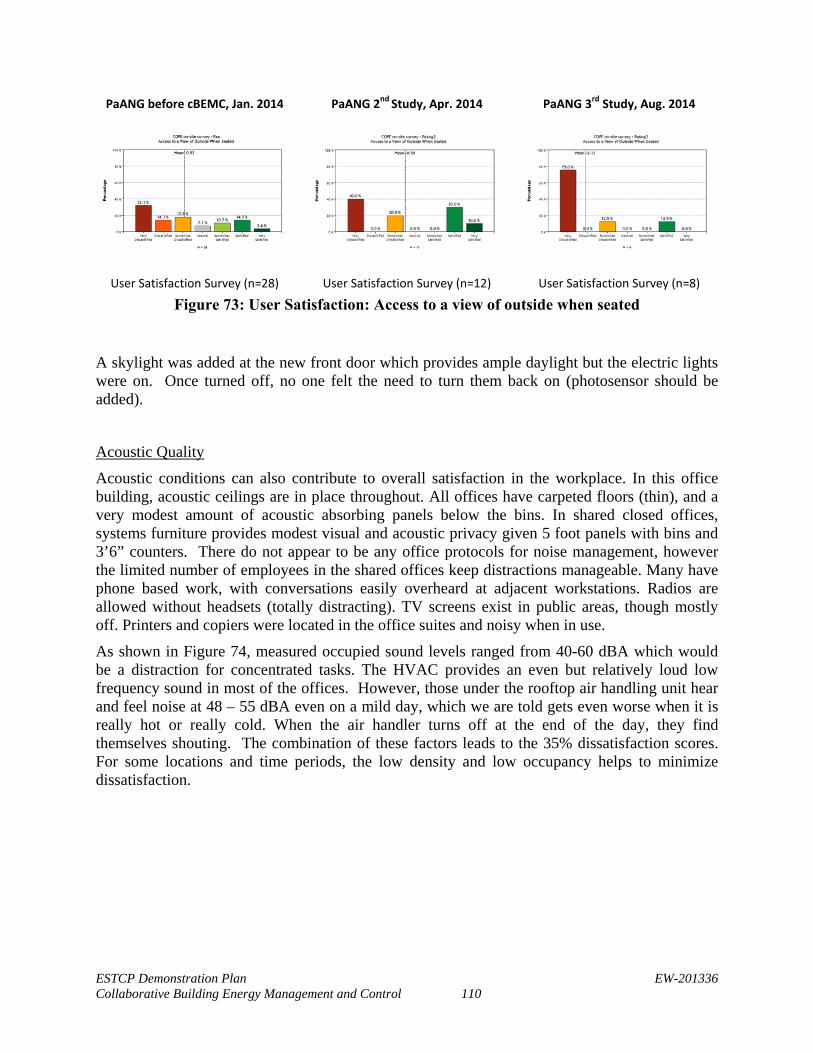
ESTCP Demonstration Plan EW-201336 Collaborative Building Energy Management and Control 110
PaANG before cBEMC, Jan. 2014 PaANG 2nd Study, Apr. 2014 PaANG 3rd Study, Aug. 2014
User Satisfaction Survey (n=28) User Satisfaction Survey (n=12) User Satisfaction Survey (n=8)
Figure 73: User Satisfaction: Access to a view of outside when seated
A skylight was added at the new front door which provides ample daylight but the electric lights were on. Once turned off, no one felt the need to turn them back on (photosensor should be added).
Acoustic Quality
Acoustic conditions can also contribute to overall satisfaction in the workplace. In this office building, acoustic ceilings are in place throughout. All offices have carpeted floors (thin), and a very modest amount of acoustic absorbing panels below the bins. In shared closed offices, systems furniture provides modest visual and acoustic privacy given 5 foot panels with bins and 3’6” counters. There do not appear to be any office protocols for noise management, however the limited number of employees in the shared offices keep distractions manageable. Many have phone based work, with conversations easily overheard at adjacent workstations. Radios are allowed without headsets (totally distracting). TV screens exist in public areas, though mostly off. Printers and copiers were located in the office suites and noisy when in use.
As shown in Figure 74, measured occupied sound levels ranged from 40-60 dBA which would be a distraction for concentrated tasks. The HVAC provides an even but relatively loud low frequency sound in most of the offices. However, those under the rooftop air handling unit hear and feel noise at 48 – 55 dBA even on a mild day, which we are told gets even worse when it is really hot or really cold. When the air handler turns off at the end of the day, they find themselves shouting. The combination of these factors leads to the 35% dissatisfaction scores. For some locations and time periods, the low density and low occupancy helps to minimize dissatisfaction.
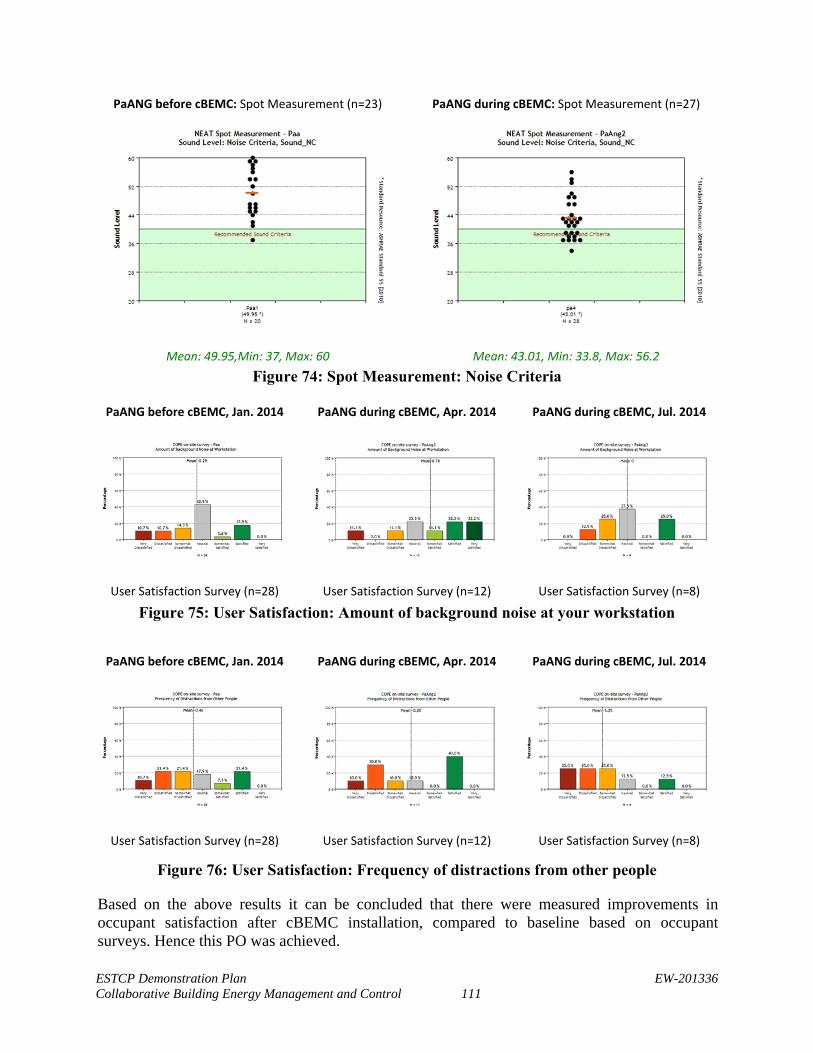
ESTCP Demonstration Plan EW-201336 Collaborative Building Energy Management and Control 111
PaANG before cBEMC: Spot Measurement (n=23) PaANG during cBEMC: Spot Measurement (n=27)
Mean: 49.95,Min: 37, Max: 60 Mean: 43.01, Min: 33.8, Max: 56.2
Figure 74: Spot Measurement: Noise Criteria PaANG before cBEMC, Jan. 2014 PaANG during cBEMC, Apr. 2014 PaANG during cBEMC, Jul. 2014
User Satisfaction Survey (n=28) User Satisfaction Survey (n=12) User Satisfaction Survey (n=8)
Figure 75: User Satisfaction: Amount of background noise at your workstation
PaANG before cBEMC, Jan. 2014 PaANG during cBEMC, Apr. 2014 PaANG during cBEMC, Jul. 2014
User Satisfaction Survey (n=28) User Satisfaction Survey (n=12) User Satisfaction Survey (n=8)
Figure 76: User Satisfaction: Frequency of distractions from other people
Based on the above results it can be concluded that there were measured improvements in occupant satisfaction after cBEMC installation, compared to baseline based on occupant surveys. Hence this PO was achieved.
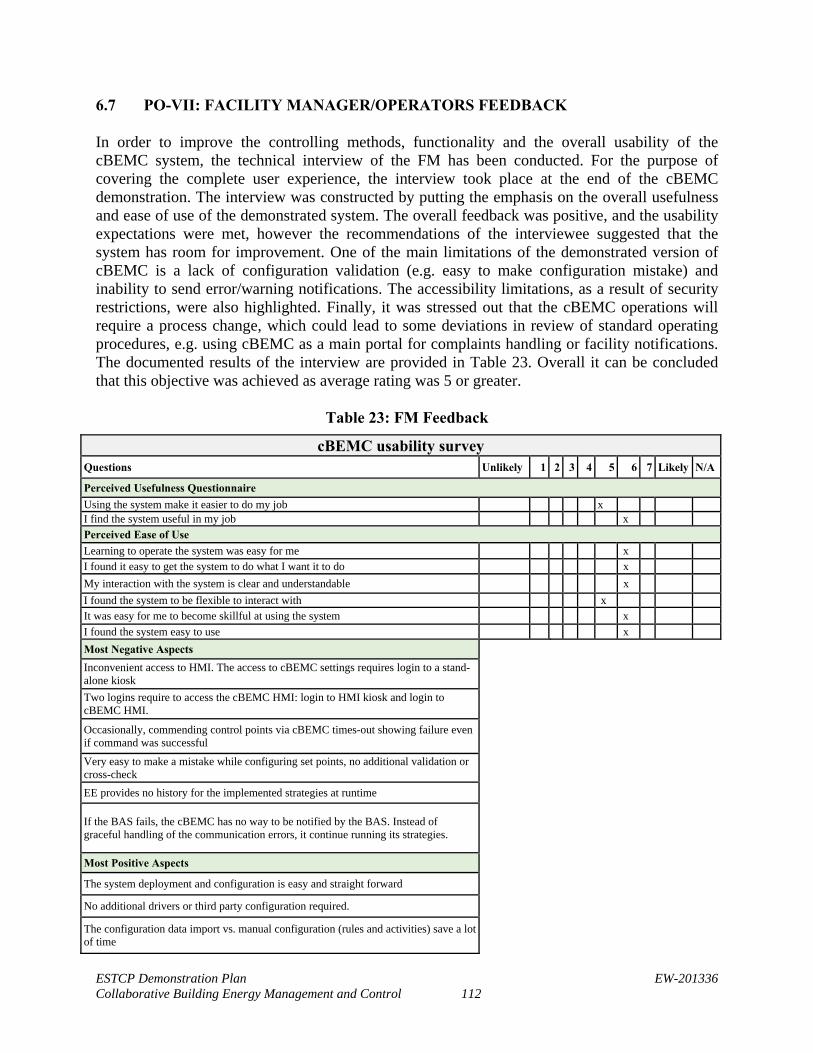
ESTCP Demonstration Plan EW-201336 Collaborative Building Energy Management and Control 112
6.7 PO-VII: FACILITY MANAGER/OPERATORS FEEDBACK
In order to improve the controlling methods, functionality and the overall usability of the cBEMC system, the technical interview of the FM has been conducted. For the purpose of covering the complete user experience, the interview took place at the end of the cBEMC demonstration. The interview was constructed by putting the emphasis on the overall usefulness and ease of use of the demonstrated system. The overall feedback was positive, and the usability expectations were met, however the recommendations of the interviewee suggested that the system has room for improvement. One of the main limitations of the demonstrated version of cBEMC is a lack of configuration validation (e.g. easy to make configuration mistake) and inability to send error/warning notifications. The accessibility limitations, as a result of security restrictions, were also highlighted. Finally, it was stressed out that the cBEMC operations will require a process change, which could lead to some deviations in review of standard operating procedures, e.g. using cBEMC as a main portal for complaints handling or facility notifications. The documented results of the interview are provided in Table 23. Overall it can be concluded that this objective was achieved as average rating was 5 or greater.
Table 23: FM Feedback
cBEMC usability surveyQuestions Unlikely 1 2 3 4 5 6 7 Likely N/A
Perceived Usefulness Questionnaire
Using the system make it easier to do my job x I find the system useful in my job x Perceived Ease of Use
Learning to operate the system was easy for me x I found it easy to get the system to do what I want it to do x My interaction with the system is clear and understandable x I found the system to be flexible to interact with x It was easy for me to become skillful at using the system x I found the system easy to use x Most Negative Aspects Inconvenient access to HMI. The access to cBEMC settings requires login to a stand-alone kiosk
Two logins require to access the cBEMC HMI: login to HMI kiosk and login to cBEMC HMI.
Occasionally, commending control points via cBEMC times-out showing failure even if command was successful
Very easy to make a mistake while configuring set points, no additional validation or cross-check
EE provides no history for the implemented strategies at runtime
If the BAS fails, the cBEMC has no way to be notified by the BAS. Instead of graceful handling of the communication errors, it continue running its strategies.
Most Positive Aspects
The system deployment and configuration is easy and straight forward
No additional drivers or third party configuration required.
The configuration data import vs. manual configuration (rules and activities) save a lot of time

ESTCP Demonstration Plan EW-201336 Collaborative Building Energy Management and Control 113
7.0 COST ASSESSMENT
The team developed a life cycle cost analysis of the project using rules established in the standards published by NIST in Handbook 13510 and the Annual Supplement to Handbook 13511. The team used the actual energy price at the building site and calculated the Savings-to-Investment ratio and Adjusted Rate of Return in addition to ROI. To the extent possible, the team utilized NIST’s Building Life Cycle Cost (BLCC512) computer program. The data inputs include duration of life cycle, capital and labor costs, equipment and software replacement costs, recurring maintenance and site specific utility charges for electricity and natural gas.
7.1 COST MODEL
Table 24 shows the data, relevant to the cBEMC technology, tracked by project team during the demonstration. These data were used to estimate life cycle costs at full scale operation. Please note: some costs for PaANG 300 are for experimental and energy audit purposes. They are not required for typically installations. The cost structure of typical building is discussed in Sec 7.3.
Table 24: Cost Model for the cBEMC at PaANG 300
Cost Element Estimated Values
Data Collection $9,600 Hardware Capital Costs $3,510 Software Costs $9,600 Commissioning and Installation $4,800 Facility Operational Cost $5,760 Hardware Lifetime 15 years Operator Training $4,800 Total $29,070
7.1.1 Cost Elements
The two primary types of costs associated with the cBEMC system are specific to actual integration and deployment costs (initial costs), and the overall products lifecycle costs (operations and maintenance). Integration and deployment address specific costs associated with the actual integration, deployment and the cost to operate and maintain this system. The cost data
10 http://fire.nist.gov/bfrlpubs/build96/PDF/b96121.pdf 11 http://www1.eere.energy.gov/femp/pdfs/ashb13.pdf 12 http://www1.eere.energy.gov/femp/information/download_blcc.html

ESTCP Demonstration Plan EW-201336 Collaborative Building Energy Management and Control 114
for the commissioning and deployment of cBEMC system at PaANG–300 is broken down for the following categories:
Data Collection and Energy Modeling
The data collection cost is contributed an effort of gathering information about the site, site schedule and dynamics, energy information and installed equipment; and it was assumed to be a total of 2 weeks effort. Assuming a 40 hour week with $120/hour work rate, the total cost for a single building data collection, as given in Table 24 is $9,600.
Hardware Costs
Additional CPU’s, laptops, network hubs, and Ethernet cable are needed to run the cBEMC system and communicate with the BAS system. This cost consists of 1 Siemens industrial box-PC, 1 industrial level hub, 1 network cable and 1 monitoring station in the form of dedicated laptop computer. The total cost amounted to $3,510.
Software and Installation costs
They are any costs related to initial cBEMC software installations that include integration of software with existing BAS software, system testing, and software documentation. For the single building case, this includes cBEMC one-time non-recurring software customization, configuration cost of $9600 and one-time commissioning cost of $4800 leading to a total cost of $14,400.
Facility Operation and Maintenance (O&M) Costs
Operation and maintenance costs are for software, hardware, and troubleshooting and cBEMC configuration. For a single building case, the O&M cost for cBEMC were estimated based on the feedback from the Siemens’ engineer responsible for Apogee system at PaANG. Based on those discussions 6 days effort was estimated for annual O&M cost. This amounts to $5,760 annually.
Hardware Lifetime
Lifetime costs were provided in ranges and the middle of the range was selected for the LCCA. For example, equipment expected to last 5 to 10 years was entered as 7.5 years for its life cycle.
Operator training
Training is necessary for building system operators to optimize use of cBEMC to its full capabilities. The training cost for cBEMC was estimated as 1 week effort, amounting to $4,800.
ESTCP Demonstration Plan EW-201336 Collaborative Building Energy Management and Control 115
7.2 COST DRIVERS
As demonstration had shown, the most significant cost drivers for cBEMC are the loads for heating and cooling, the automation and control of facilities and the costs associated with utilities. We researched average commercial electricity costs for 2013 for different states and selected states where the average $/kWh was $0.10 or greater. Additionally, bases located in utility territories that have high rates per kWh and active DR programs are also good candidates for the cBEMC. Furthermore, cBEMC will add value to bases that rely on coal-fired electricity or heating oil (or both) due to the greater GHG emissions associated with each fossil fuel.
One cost driver not associated specifically with energy is the need to meet / address security and NIST RMF requirements. Costs typically associated with meeting NIST RMF requirements include understanding NIST RMF and unique facility requirements, deployment, configuring the system, testing and documenting to meet the requirements. In some cases where system elements and the system installation has not gone through a previous NIST RMF process, large costs and schedule impacts could be associated with the NIST RMF accreditation and approval. To offset some of the nonrecurring costs and risks associated with installing cBEMC system under the NIST RMF process, accreditation of the reuse components of the cBEMC system should be done, independent of any specific facility deployment. Once components are accredited specific deployment costs and schedule impacts would be greatly reduced. The costs to do this type of reuse accreditation would not be tied a specific deployment but associated to cBEMC product life cycle costs.
The cBEMC and PaANG deployment did not have to meet NIST RMF requirements due to the configuration of the cBEMC on the private isolated network and the requirements of PaANG IT security at the time. The future primary cost elements would be addressed to network configuration of the system, possible upgrades at the Operating System level and the labor to do this.
Another cost driver is the site’s BAS network infrastructure. Costs can vary drastically depending on the level of BAS integration among buildings and the level of access to a global network for the remote system operation. At PaANG, the BAS was networked throughout the entire site; however, the fact that security constraints disallowed the cBEMC to be configured and operated remotely drove the cost of system commissioning, servicing and operation. The lack of remote access to the system required a physical presence of the cBEMC operator throughout all phases of the demonstration.
7.3 COST ANALYSIS AND COMPARISON
The demonstration of the cBEMC on the 2nd floor of PaANG -300 reveals annual energy savings of $3342 from reduced electricity and gas use. Other assumptions used for the payback calculations are outlined below:
• The cost of electricity for the baseline is $0.08/kWh and $0.70 /Therm for natural gas. • The boiler efficiency is 0.91. • The electricity and natural gas prices are fixed, not time-dependent. • The re-commissioning costs and benefits data is based on DoE studies [15] [16].
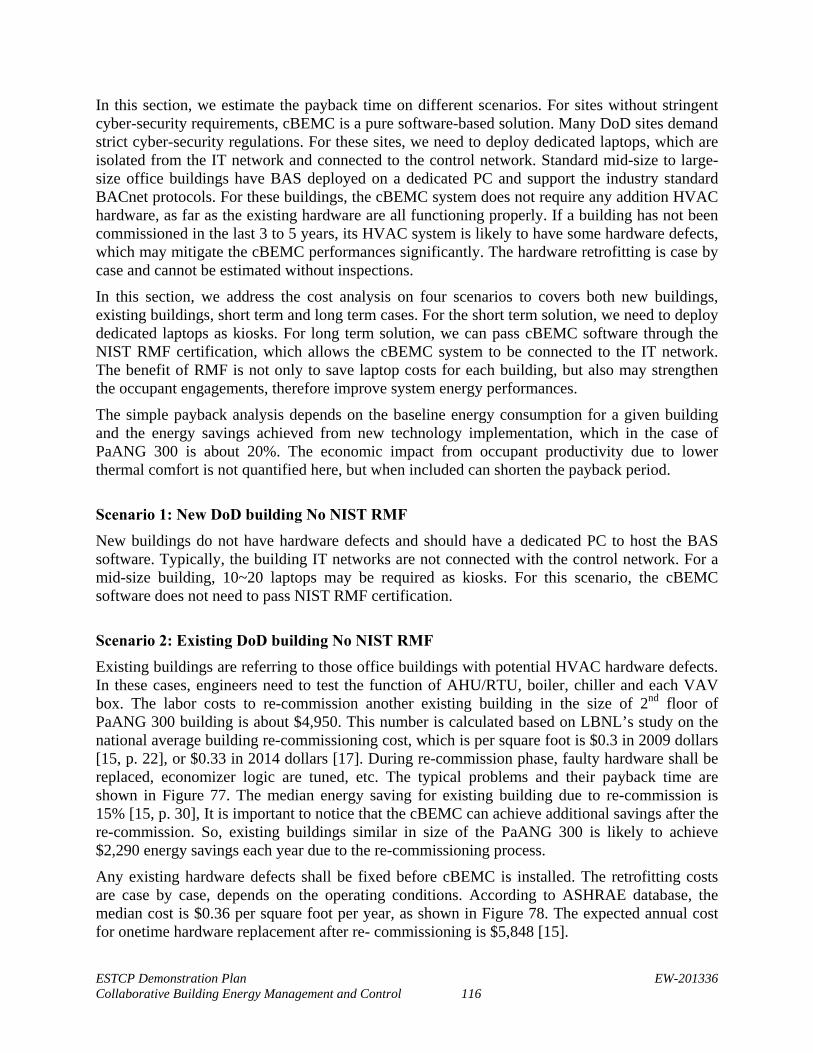
ESTCP Demonstration Plan EW-201336 Collaborative Building Energy Management and Control 116
In this section, we estimate the payback time on different scenarios. For sites without stringent cyber-security requirements, cBEMC is a pure software-based solution. Many DoD sites demand strict cyber-security regulations. For these sites, we need to deploy dedicated laptops, which are isolated from the IT network and connected to the control network. Standard mid-size to large-size office buildings have BAS deployed on a dedicated PC and support the industry standard BACnet protocols. For these buildings, the cBEMC system does not require any addition HVAC hardware, as far as the existing hardware are all functioning properly. If a building has not been commissioned in the last 3 to 5 years, its HVAC system is likely to have some hardware defects, which may mitigate the cBEMC performances significantly. The hardware retrofitting is case by case and cannot be estimated without inspections.
In this section, we address the cost analysis on four scenarios to covers both new buildings, existing buildings, short term and long term cases. For the short term solution, we need to deploy dedicated laptops as kiosks. For long term solution, we can pass cBEMC software through the NIST RMF certification, which allows the cBEMC system to be connected to the IT network. The benefit of RMF is not only to save laptop costs for each building, but also may strengthen the occupant engagements, therefore improve system energy performances.
The simple payback analysis depends on the baseline energy consumption for a given building and the energy savings achieved from new technology implementation, which in the case of PaANG 300 is about 20%. The economic impact from occupant productivity due to lower thermal comfort is not quantified here, but when included can shorten the payback period.
Scenario 1: New DoD building No NIST RMF New buildings do not have hardware defects and should have a dedicated PC to host the BAS software. Typically, the building IT networks are not connected with the control network. For a mid-size building, 10~20 laptops may be required as kiosks. For this scenario, the cBEMC software does not need to pass NIST RMF certification.
Scenario 2: Existing DoD building No NIST RMF
Existing buildings are referring to those office buildings with potential HVAC hardware defects. In these cases, engineers need to test the function of AHU/RTU, boiler, chiller and each VAV box. The labor costs to re-commission another existing building in the size of 2nd floor of PaANG 300 building is about $4,950. This number is calculated based on LBNL’s study on the national average building re-commissioning cost, which is per square foot is $0.3 in 2009 dollars [15, p. 22], or $0.33 in 2014 dollars [17]. During re-commission phase, faulty hardware shall be replaced, economizer logic are tuned, etc. The typical problems and their payback time are shown in Figure 77. The median energy saving for existing building due to re-commission is 15% [15, p. 30], It is important to notice that the cBEMC can achieve additional savings after the re-commission. So, existing buildings similar in size of the PaANG 300 is likely to achieve $2,290 energy savings each year due to the re-commissioning process.
Any existing hardware defects shall be fixed before cBEMC is installed. The retrofitting costs are case by case, depends on the operating conditions. According to ASHRAE database, the median cost is $0.36 per square foot per year, as shown in Figure 78. The expected annual cost for onetime hardware replacement after re- commissioning is $5,848 [15].
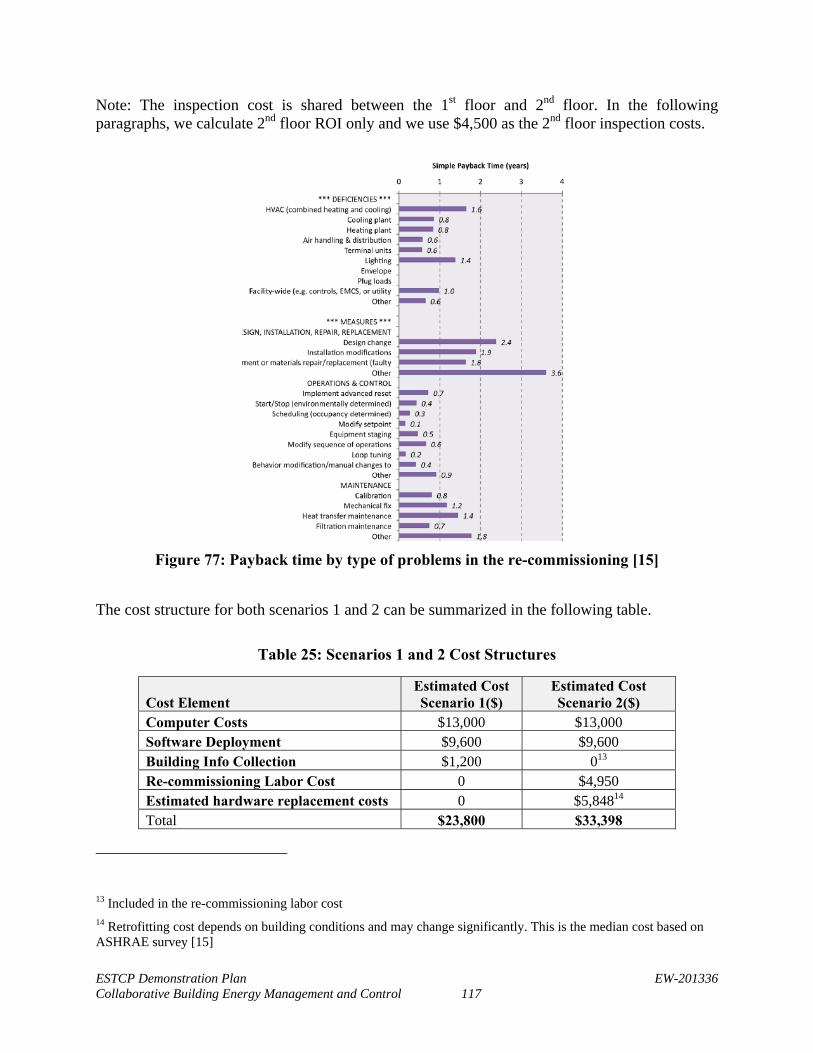
ESTCP Demonstration Plan EW-201336 Collaborative Building Energy Management and Control 117
Note: The inspection cost is shared between the 1st floor and 2nd floor. In the following paragraphs, we calculate 2nd floor ROI only and we use $4,500 as the 2nd floor inspection costs.
Figure 77: Payback time by type of problems in the re-commissioning [15]
The cost structure for both scenarios 1 and 2 can be summarized in the following table.
Table 25: Scenarios 1 and 2 Cost Structures
Cost Element Estimated Cost Scenario 1($)
Estimated Cost Scenario 2($)
Computer Costs $13,000 $13,000 Software Deployment $9,600 $9,600 Building Info Collection $1,200 013 Re-commissioning Labor Cost 0 $4,950 Estimated hardware replacement costs 0 $5,84814 Total $23,800 $33,398
13 Included in the re-commissioning labor cost 14 Retrofitting cost depends on building conditions and may change significantly. This is the median cost based on ASHRAE survey [15]
ESTCP Demonstration Plan EW-201336 Collaborative Building Energy Management and Control 118
Note: There is no computer cost if we deploy cBEMC on a building where control network and IT network are connected (moderate cyber-security restriction). So the total cost is $10,800 per new building and $20,398 per existing building.
Figure 78: Distributions on office building maintenance costs according to ASHRAE
database [15].
Scenario 3: DoD new building with NIST RMF
If we want to deploy cBEMC to large number of buildings, it is more cost effective to certify the software with NIST RMF. The process is required once for multiple buildings. In the following estimation, we assume there are N new buildings and M existing buildings.
Scenario 4: DoD existing building with NIST RMF
If cBEMC system had NIST RMF license, we don’t need to deploy laptops as kiosks. Users can use their desktop PCs instead.
For both scenarios 3 and 4, after one time investment to pass the NIST RMF certification, there is no costs to deploy laptops as kiosks, the estimated initial costs for N new buildings and M existing buildings is , with US Dollar as its unit. We have:
2 9,600 1,200 2 3,000 5,848
The ROI of new building with NIST RMF is 3.68 years (Scenario 3), while that ROI of No NIST RMF solution stays at 5.6 years (Scenario 1). For the existing building scenario, the ROI for No

ESTCP Demonstration Plan EW-201336 Collaborative Building Energy Management and Control 119
NIST RMF solution (Scenario 2) is about 4.8 years, while the ROI for the existing building with NIST RMF (Scenario 4) case is about 3.3 years.
For comparison purposes, we list the estimated payback time using re-commissioning methods. The payback time for the re-commissioning method is about 3.41 years. The payback years may have large variations too. The cBEMC technology has no conflict with the re-commissioning method. As our data analysis shows, the cBEMC is expected to save another 22% energy on top of re-commissioned buildings, with similar conditions to the PaANG 300 2nd floor.
ESTCP Demonstration Plan EW-201336 Collaborative Building Energy Management and Control 120
8.0 IMPLEMENTATION ISSUES
The commissioning and demonstration of the cBEMC system at PaANG helped the development team to understand the advantages as well as shortcomings of the cBEMC implementation in the areas of equipment, integration, communication, facility assets management, and user experience of the system.
8.1 PERTINENT REGULATIONS
As of November 28, 2007, the United States Department of Defense mandates that all the IT equipment on DOD sites must pass the DIACAP or superseding NIST RMF certification. The PaANG site was no exception; therefore the team had to commission the cBEMC onto PaANG’s NIST RMF-accredited systems. Since the cBEMC system was not NIST RMF certified, the entire cBEMC platform was deployed on the isolated private network. Also, all cBEMC client kiosks (laptops) were NIST RMF certified. The kiosks were deployed as stand-alone stations on the same isolated network which was used by the cBEMC controller and cBEMC web server.
8.2 END-USER CONCERNS
8.2.1 cBEMC controller availability
One of the major concerns raised by the PaANG facility management was the cBEMC availability. The unexpected shutdown of cBEMC could result in a failure to relinquish control points back to the BAS, and in extreme cases this can lead to physical failure of certain equipment. In order to address this concern, along with extensive system testing of the software, the cBEMC integration team developed a heartbeat solution. The heartbeat command was cyclically issued by the cBEMC controller to the Apogee Alarm subsystem. The alarm would trigger and notify a FM in case of unexpected cBEMC shutdown. Also, if the cBEMC becomes unavailable for a certain (configurable) period of time, all BAS control points would be automatically relinquished, giving the full control over the set points back to the Apogee server.
8.2.2 Comfort-tuned EE strategies
The maintenance of occupant comfort during the cBEMC demonstration wasn’t considered less important than achievement of energy savings. The cBEMC energy saving strategies were tuned in ways such that occupant comfort wouldn’t be compromised. For example, strategies based on occupancy, on the ranking of specific equipment by its mission, and on only partially shutting down equipment were developed in accordance with occupancy comfort standards and PaANG site regulations. In addition, pre- and post-demonstration occupancy surveys were conducted to identify the relevant occupancy comfort concerns and to gather occupant’s suggestions for improving the cBEMC comfort strategies.
ESTCP Demonstration Plan EW-201336 Collaborative Building Energy Management and Control 121
8.3 PROCUREMENT ISSUES
8.3.1 Facility Audit
In order to develop sufficient cBEMC energy management strategies, one of the primary core tasks was to conduct a comprehensive energy audit of the facilities. The results of the audit were used as an input for the development of a building model that was used to simulate overall facility energy consumption and to fine-tune cBEMC control strategies further. The lack of facility equipment data, trending data, and standardized process for the facility energy auditing made the auditing process a challenge. There is no common building information model, especially for older facilities like Building 300. The fact that there is no standard data exchange mechanism or data repository to retrieve building information, or to quickly identify the physical properties of the building, or the building’s daily schedule, etc., makes energy auditing expensive and time-consuming. 8.3.2 Data collection
It was concluded that existing building automation equipment at PaANG-300 did not provide comprehensive and accurate information about energy consumption by an individual load. Although the present BAS is capable of data trending and logging, it’s not capable of identifying and isolating specific loads for heating, cooling, ventilation and electrical plug loads. Therefore, three sub-meters were installed at PaANG-300 in order to provide monitoring and logging of specific energy loads. In addition, the security constraints did not allow the cBEMC development team to set up a mechanism to collect trending data automatically. The trending data was collected manually by the Siemens Building Technologies specialist, who is responsible for management of the site BAS infrastructure and equipment.
8.4 INTEGRATION WITH BAS
8.4.1 cBEMC- BAS Runtime Communication
The BAS infrastructure and equipment analysis was conducted before the deployment. Since the BAS of Building 300 has not been renovated for more than a decade, the BAS panels were still using old panels supporting serial communication. After conducting series of communication tests, the team came to the conclusion that quite a few calls failed as a result of slow-speed serial connections of older field panels. Since a new Apogee field panel supports a Gigabit Ethernet and is capable of achieving almost double the speed of the older serial panel, a new field panel was installed and the control points were migrated to the new panel.
Because cBEMC uses a non-deterministic (command-based) approach to control energy via BACnet, it was important to test the version of the BACnet at PaANG-300 and its compatibility with a BACstac client library that was used by the cBEMC – SEB runtime platform for the real-time communication. The BACstac client library is a commercial off-the-shelf product of Cimentrix15 that was integrated into the cBEMC runtime subsystem. The advantage of using a
15 http://www.cimetrics.com/index.php/cimetrics-announces-bacstac-v62.html
ESTCP Demonstration Plan EW-201336 Collaborative Building Energy Management and Control 122
loosely coupled BACnet client vs. tight coupling with BAS is that the client only applies change of value (COV) commands to the BAS via self-descriptive control points, without affecting overall BAS communication by loading the BACnet with heavy packets of system-proprietary data. The success or failure of COV’s commands was determined in the callback function of the BACnet client. Since this approach does not require any specific configuration on the BAS side, it simplified the commissioning of the cBEMC. The mapping of the BAS control points to cBEMC logic was also necessary before the cBEMC startup. Each zone controlled by the cBEMC has a subset of control points defined and published through the BACnet communication. The subset of control points is responsible for controlling equipment components - e.g., VAV air flow damper, the zone thermostat value, VAV heat valve etc. Mapping the current weather and overall building meter data (current load) via read-only control point’s subscription was also required as part of the input condition for the cBEMC energy management strategies. It was determined that the cBEMC system could not automatically import control point information from the BAS. The definition and mapping of the control points required manual export of the point defined in Apogee, and manual creation and mapping of the Apogee point attributes in the cBEMC. This manual work was prone to errors, and it took several iterations before all the control points were appropriately mapped between the cBEMC and BAS. In the future, the cBEMC should support an automatic data point exchange mechanism. Moreover, the network security constraints made the processes of cBEMC runtime troubleshooting very inefficient. It was not possible to access the site remotely; and, therefore, at least one team member was required to be present on site for upgrades, data collection, and troubleshooting.
8.4.2 Issues with Automation Equipment
During the cBEMC system testing it was determined that outdoor temperature flow meter produced faulty reading. Also, the installed CO2 sensor was not properly calibrated and malfunctioned during out testing phase. This was discovered after the retrofitting phase, when the funding reserved for hardware purchase was depleted. In our experiments, the cBEMC sent correct “outdoor air flow” set point to AHU, but AHU could not implement it.
We used return duct CO2 sensors to partially take the role of the faulty outdoor air flowmeter, but the performance was compromised. The outdoor CO2 level is 400 parts per million (ppm). In the US, the indoor CO2 level shall be maintained at less than 1,000 ppm. To establish a balanced tradeoff between EE and a healthy environment, studies have recommended maintenance of CO2 levels within the range of 800 ppm to 1,000 ppm [7]. However, since the PaANG 300 indoor CO2 level is often within 480 ppm to 650 ppm, this suggested there was a slight air leak in the PaANG 300 HVAC or the envelope, but the team could not identify the source due to the limited budget and time.
Even though the cBEMC supported an occupant-engaged Demand Control Ventilation algorithm, the existing outdoor air flowmeter had a hardware defect. Due to a limited timeframe, insufficient budget and resources to replace the hardware, the team decided to use temperature sensors to estimate the outdoor air flow intake. Regrettably, such estimation wasn’t always reliable.
It was also determined that cBEMC nigh control strategy during the cooling season sporadically fails to shut close air dampers on some of VAV controllers. After extensive strategy analysis and VAV testing it was concluded that setting room temperature to a higher value e.g. 78oF for an
ESTCP Demonstration Plan EW-201336 Collaborative Building Energy Management and Control 123
unoccupied space, triggers a VAV heat valve to kick-in, creating reheat phenomena which disallow to close some of the dampers completely because of the agitated hot air in the ducts system. Development of additional strategy for the heat valve control helped cBEMC team to solve this problem.
8.5 USER EXPERIENCE
The cBEMC user interface supports two operational levels - Facility Management UI and Occupant UI. Both interfaces were designed using web technologies and were accessed via Google’s Chrome web browser during the cBEMC demonstration. Both the facility management team and occupants were satisfied with the features and functionality of their cBEMC WEB UI; however, some critical points were also identified.
8.5.1 cBEMC Access
Due to the fact that site security procedures required the cBEMC to be commissioned on a separate private network, the stand-alone user HMI kiosks had 2-level password access. The first level is a typical user logon mechanism to MS Windows and the second level is user login to a web-based HMI for cBEMC. This created a great inconvenience for the users and contributed to lowering user participation.
8.5.2 cBEMC Facility Management UI
The configuration of control points is rather difficult, due to the fact that it requires manual mapping of the point attributes from Apogee to cBEMC. There is no tool to validate the attributes after the configuration; so it is difficult to correct mistakes.
The energy consumption graphs display for only 24 hours of history. There is no access to the detailed trending information for previous days.
The zone information in the UI does not provide information about the corresponding rooms and their designations.
Sometimes, the energy savings summary view did not work.
There is no information in the UI about communication errors or failures. This information is displayed only in the SEB runtime console window.
When the cBEMC is started, the EE control has to be activated manually by pressing a button, which is not a step that is obvious to a FM.
8.5.3 cBEMC Occupant UI
The account access via web browser requires an additional login. The login mechanism could’ve been mapped to windows credentials for easier access.
When cBEMC control is not enabled, the occupant UI does not reflect that condition. As a result, virtual thermostat changes, made by the user, don’t get commanded; but the UI does not show any errors or warnings to alert the occupant that cBEMC is not currently available.
ESTCP Demonstration Plan EW-201336 Collaborative Building Energy Management and Control 124
When the cBEMC system is down, it simply cannot be accessed via web browser. There is no explicit notification or warning issued by cBEMC for the user.
There is no help or training assistance available in the UI to guide new users who are trying to understand the cBEMC functionality.
8.5.4 Social Acceptance
Although initially concerned that cBEMC would impose additional time and work requirements for training, analysis, maintenance and management, the FM was positively disposed toward cBEMC due to its automation capabilities and provision of feedback information. The facility management functions are fully exposed in the HMI for the FM and provide easy access to cBEMC administration of EE and DR events. In addition, using cBEMC HMI a FM can opt out of the system’s DR operation, if necessary. The FM was particularly pleased with the ability of cBEMC to help manage and measure DR events. Overall, the FM was satisfied with cBEMC and believes that it would be accepted by other FMs in similar situations.
During the demonstration, active engagement in energy conservation from both the facility management team and the occupants was observed. The ability of cBEMC to create a log of social networking among the occupants and facility management personnel allowed us to create a weekly user engagement report, showing general input such as occupant’s requests, complaints, and use setting changes approved by the occupants. These activities specifically address DOD Strategic Sustainability Performance Plan, Energy Security MOU with DOE-Goal 7: Sustainability Practices Become the Norm.
ESTCP Demonstration Plan EW-201336 Collaborative Building Energy Management and Control 125
9.0 REFERENCES
[1] "Energy Independence and Security Act of 2007, Title III and Title IV".
[2] S. A. Loper and W. F. Sandusky, "Attributes of the Federal Energy Management Program’s Federal Site Building Characteristics Database," PNNL, 2010.
[3] Z. Song, L. Wang and Y. Lu, "Social Learning SoftThermostat for Commercial Buildings," in Proceedings of the Fourth ACM Workshop on Embedded Sensing Systems for Energy-Efficiency in Buildings, Toronto, 2012.
[4] Z. Song, S. Zhen and Y. Lu, "Collaborative Building Control to Optimize Energy Saving and Improve Occupants' Experience," ASHRAE Transactions, vol. 119, no. 1, 2013.
[5] Y. Lu, "Advanced, Integrated Control for Building Operations to Achieve 40% Energy Saving," 2012.
[6] "Energy Policy Act of 2005," Washington D.C., 2005.
[7] "DataTrends: Energy Use in Office Buildings," EPA (United States Environmental Protection Agency), [Online]. Available: http://www.energystar.gov/buildings/tools-and-resources/datatrends-energy-use-office-buildings. [Accessed 30 October 2014].
[8] Y. Lu, "Integrated Control for Building Energy Management," 2014.
[9] V. Loftness and e. al, "Building Investment Decision Support (BIDS™) - Cost-Benefit Tool to Promote High," Center for Building Performance and Diagnostics, 2008.
[10] G. Kats, L. Alevantis, A. Berman, E. Mills and J. Perlman, "The Costs and Financial Benefits of Green Buildings," California's Sustainable Building Task Force, 2003.
[11] "The Greenhouse Gas Protocol. Retrieved from," World Resources Institute and World Business Council, 2004.
[12] S. P. Pino and P. Bhatia, "Working 9 to 5 on Climate Change: An Office Guide. Published by the," World Resource Institute, 2002.
[13] "EPA Power Profiler (2014) Clean Energy Power Profiler," 2014. [Online]. Available: http://oaspub.epa.gov/powpro/ept_pack.charts.
[14] ASHRAE, "Ventilation for Acceptable Indoor Air Quality, ASHRAE 62.1," 2013.
[15] ASHRAE, "HVAC Maintenance Cost Database," https://www.ashrae.org/resources--publications/free-resources/free-software.
[16] E. Mills, "Building Commissioning, a golden opportunity for reducing energy costs and Greenhouse gas emissions," LBNL, Berkeley, 2009.
[17] "US Inflation claculator," [Online]. Available: http://www.usinflationcalculator.com . [Accessed 30 10 2014].

ESTCP Demonstration Plan EW-201336 Collaborative Building Energy Management and Control 126
[18] D&R International Ltd., "2011 Buildings Energy Data Book," Building Technologies Program, Energy Efficiency and Renewable Energy, U.S. Department of Energy, March 2012.

ESTCP Demonstration Plan EW-201336 Collaborative Building Energy Management and Control 127
APPENDICES
APPENDIX A: POINTS OF CONTACT
Point of Contact Organization Phone & E-mail Role in Project
Dmitriy Okunev Siemens Corporation,
Corporate Technology
609-734-3540
PI
Sue DeMeo Siemens Corporation,
Corporate Technology
609-734-4469
Business Contact
Thomas Gruenewald
Siemens Corporation,
Corporate Technology
609-734-3546
PM
Vivian Loftness CMU 412-268-2350
Key Contributor
Joseph Sulivan Airforce PaANG [email protected] Site Support
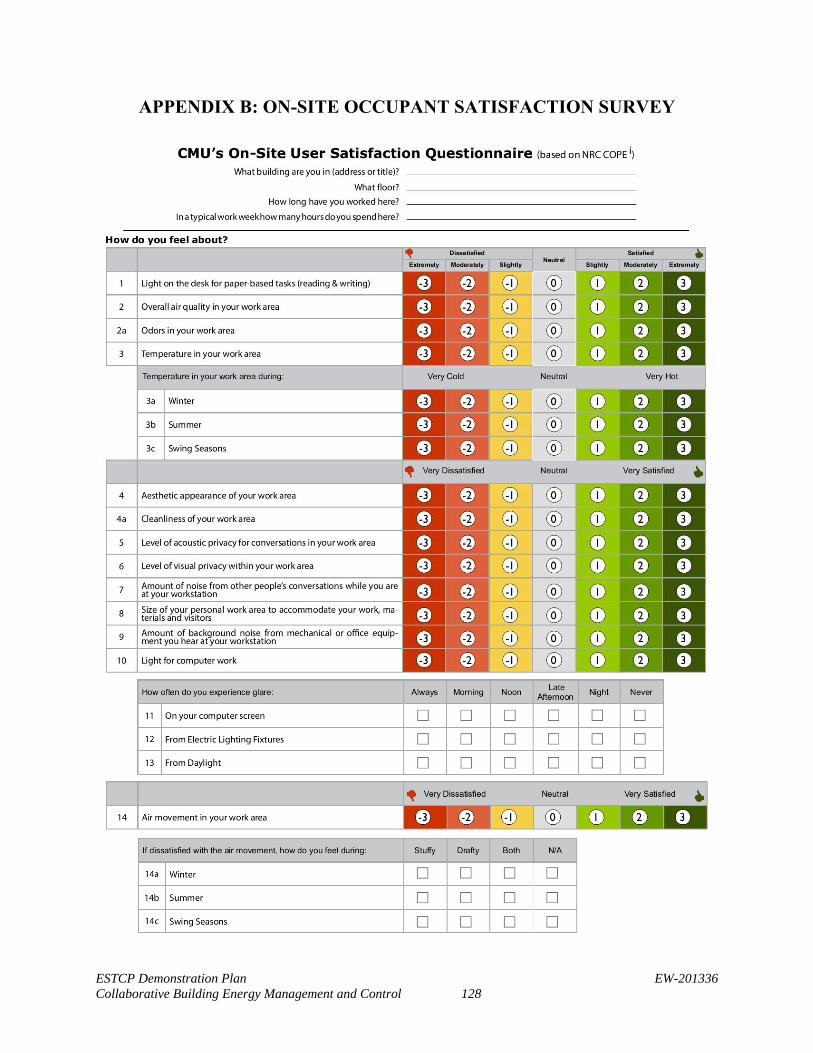
ESTCP Demonstration Plan EW-201336 Collaborative Building Energy Management and Control 128
APPENDIX B: ON-SITE OCCUPANT SATISFACTION SURVEY
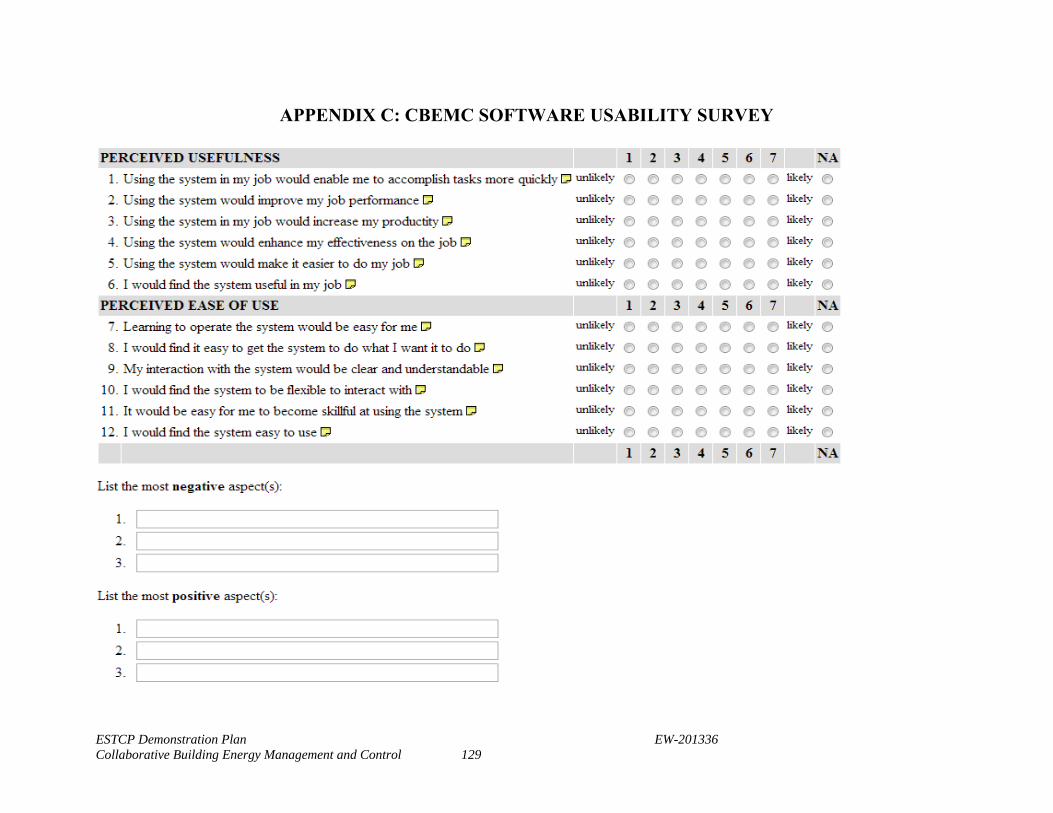
ESTCP Demonstration Plan EW-201336 Collaborative Building Energy Management and Control 129
APPENDIX C: CBEMC SOFTWARE USABILITY SURVEY