final report - serdp-estcp.org 2210... · final report thermal catalytic ... the analysis also...
TRANSCRIPT

FINAL REPORT Thermal Catalytic Syngas Cleanup for High-Efficiency Waste-to-
Energy Converters
SERDP Project WP-2210
DECEMBER 2015 Christopher Martin David Dunham Nikhil Patel University of North Dakota
Distribution Statement A

This report was prepared under contract to the Department of Defense Strategic Environmental Research and Development Program (SERDP). The publication of this report does not indicate endorsement by the Department of Defense, nor should the contents be construed as reflecting the official policy or position of the Department of Defense. Reference herein to any specific commercial product, process, or service by trade name, trademark, manufacturer, or otherwise, does not necessarily constitute or imply its endorsement, recommendation, or favoring by the Department of Defense.
REPORT DOCUMENTATION PAGE Form Approved
OMB No. 0704-0188 Public reporting burden for this collection of information is estimated to average 1 hour per response, including the time for reviewing instructions, searching existing data sources, gathering and maintaining the data needed, and completing and reviewing this collection of information. Send comments regarding this burden estimate or any other aspect of this collection of information, including suggestions for reducing this burden to Department of Defense, Washington Headquarters Services, Directorate for Information Operations and Reports (0704-0188), 1215 Jefferson Davis Highway, Suite 1204, Arlington, VA 22202-4302. Respondents should be aware that notwithstanding any other provision of law, no person shall be subject to any penalty for failing to comply with a collection of information if it does not display a currently valid OMB control number. PLEASE DO NOT RETURN YOUR FORM TO THE ABOVE ADDRESS. 1. REPORT DATE (DD-MM-YYYY) 11-12-2015
2. REPORT TYPEFinal Technical
3. DATES COVERED (From - To)Jun 2012 – Dec 2015
4. TITLE AND SUBTITLE Thermal Catalytic Syngas Cleanup for High-Efficiency Waste-
5a. CONTRACT NUMBER W912HQ-12-C-0026
to-Energy Converters 5b. GRANT NUMBER
5c. PROGRAM ELEMENT NUMBER
6. AUTHOR(S) Martin, Christopher, L.
5d. PROJECT NUMBER
Dunham, David, J. Patel, Nikhil, M.
5e. TASK NUMBER
5f. WORK UNIT NUMBER
7. PERFORMING ORGANIZATION NAME(S) AND ADDRESS(ES) University of North Dakota
8. PERFORMING ORGANIZATION REPORT NUMBER
Energy & Environmental Research Center 15 North 23rd Street, Stop 9018 Grand Forks, ND 58202-9018
2015-EERC-12-06
9. SPONSORING / MONITORING AGENCY NAME(S) AND ADDRESS(ES) 10. SPONSOR/MONITOR’S ACRONYM(S)Strategic Environmental 4800 Mark Center Drive SERDP Research and Development Suite 17D08 Program Alexandria, VA 22350-3605 11. SPONSOR/MONITOR’S REPORT NUMBER(S) WP-2210 12. DISTRIBUTION / AVAILABILITY STATEMENT 13. SUPPLEMENTARY NOTES
14. ABSTRACT The objective of this project was to develop a robust, efficient, and compact syngas-cleaning system that would complement small-scale countercurrent, or updraft, gasifier technology for waste-to-energy conversion. Results show that the concept of using a countercurrent gasifier coupled with a catalytic tar-reforming stage can be a viable route to meet the performance targets established for a forward operating base waste-to-energy converter. An analysis of data from prototype testing shows that the concept could exceed the conversion efficiency target of 50% with relatively straightforward improvements to sensible heat recovery from the clean syngas leaving the tar reformer. This project’s testing has also substantiated the operational benefits associated with countercurrent gasification. The prototype produced a clean syngas that will minimize the frequency and severity of routine maintenance, and after passing through the system, the processed waste was fully converted to inert ash, thereby achieving the volume reduction and sanitized ash goals.
15. SUBJECT TERMS Forward Operating Base Waste-to-Energy, Gasification, Tar Management, Catalytic Reforming
16. SECURITY CLASSIFICATION OF:
17. LIMITATION OF ABSTRACT
18. NUMBER OF PAGES
19a. NAME OF RESPONSIBLE PERSONChristopher Martin
a. REPORT U
b. ABSTRACT U
c. THIS PAGEU
UU 77
19b. TELEPHONE NUMBER (include area code) (701) 777-5083
Standard Form 298 (Rev. 8-98)Prescribed by ANSI Std. Z39.18

THERMAL CATALYTIC SYNGAS CLEANUP FOR HIGH-EFFICIENCY WASTE-TO-ENERGY CONVERTERS
ABSTRACT
The objective of this multiyear project by the Energy & Environmental Research Center was to develop a robust, efficient, and compact syngas-cleaning system that would complement small-scale countercurrent, or updraft, gasifier technology. These gasifiers feature high efficiency and simple operation that would be beneficial for service as a waste-to-energy converter (WEC) at deployed military forward operating bases but are currently handicapped by the relatively high loading of condensable organics, tars, in the fuel gas.
Results from the project have shown that the concept of using a countercurrent gasifier coupled with a catalytic tar-reforming stage can be a viable route to meet the performance targets established for forward operating bases. An analysis of data from the prototype testing shows that the concept could exceed the conversion efficiency target of 50% with relatively straightforward improvements to sensible heat recovery from the clean syngas leaving the tar reformer. The analysis also shows the value of incorporating an integrated waste dryer using heat from the electric generator exhaust stream or other low-quality heat source. With relatively dry waste, the WEC’s net conversion efficiency could exceed 60%, and at the scale of a Force Provider base camp, the net WEC electrical generating potential would be approximately 10% of the entire base’s generation capacity. Over an 8-hour processing shift, a WEC under these conditions would displace approximately 100 gallons of diesel fuel.
In addition to the potential for high energy conversion, this project’s testing has also substantiated the operational benefits associated with countercurrent gasification. The prototype produced a clean syngas that will minimize the frequency and severity of routine maintenance, and after passing through the system, the processed waste was fully converted to inert ash, thereby achieving the volume reduction and sanitized ash goals. Furthermore, the identified steps for system operation appear to be suitable for automatic control and would conceivably only require significant user oversight at start-up and incremental fuel loadings. The operator burden is estimated to be approximately 1 hour per 8 hours of waste processing.

TABLE OF CONTENTS LIST OF FIGURES ....................................................................................................................... iii LIST OF TABLES .......................................................................................................................... v NOMENCLATURE ...................................................................................................................... vi BACKGROUND ............................................................................................................................ 1 OBJECTIVE ................................................................................................................................... 3
Task 1 – Tar-Cracking Reactor Optimization ....................................................................... 3 Task 2 – Prototype System Performance Testing ................................................................. 4 Task 3 – Integrated System Performance Testing ................................................................. 4 Task 4 – WEC Design Analysis ............................................................................................ 4
TECHNICAL APPROACH............................................................................................................ 5
Task 1 – Tar-Cracking Reactor Optimization ....................................................................... 5 Laboratory Test System ............................................................................................... 5 Process Data Collection ............................................................................................... 8 Fuel Mix..................................................................................................................... 11 Catalyst Candidates ................................................................................................... 12
Task 2 and 3 System Performance Testing ......................................................................... 13 Prototype System Description ................................................................................... 14 Process Data Collection ............................................................................................. 19
Task 4 – WEC Design Analysis .......................................................................................... 20 RESULTS AND DISCUSSION ................................................................................................... 21
Task 1 – Tar-Cracking Reactor Optimization ..................................................................... 21 Reformed Syngas Composition ................................................................................. 21 Tar Reforming ........................................................................................................... 22 NREL Catalyst Evaluation ......................................................................................... 26
Task 2 – Prototype System Performance Testing ............................................................... 28 Energy Balance .......................................................................................................... 28 Tar Reforming ........................................................................................................... 33 Gasifier Ash Characteristics ...................................................................................... 36
Task 3 – Integrated System Performance Testing ............................................................... 38 TQG Efficiency ......................................................................................................... 39 TQG Emissions .......................................................................................................... 41 Comparison to EPA Tier 4 Criteria ........................................................................... 47 Visual Inspection ....................................................................................................... 47
Task 4 – WEC Design Analysis .......................................................................................... 49 Physical Layout ......................................................................................................... 49 Operation ................................................................................................................... 52
Continued…
i

TABLE OF CONTENTS (continued) CONCLUSIONS AND RECOMMENDATIONS ....................................................................... 55 REFERENCES ............................................................................................................................. 56 NREL REPORT ON CATALYST PERFORMANCE AND REGENERATION EXPERIMENTS ............................................................................................................ Appendix A
ii

LIST OF FIGURES Figure 1 Material flows and reaction zone profiles within a downdraft gasifier and a
countercurrent gasifier ................................................................................................. 2 Figure 2 Conceptual diagram showing the core concept of countercurrent gasification
coupled with thermal catalytic tar cracking ................................................................. 3 Figure 3 Schematic for the laboratory catalyst-screening system .............................................. 6 Figure 4 Photograph of the laboratory system ........................................................................... 6 Figure 5 Laboratory countercurrent gasifier .............................................................................. 7 Figure 6 Tested fuel mixture components, from left: soybeans, cardboard, polystyrene
and polyethylene, and PVC film ................................................................................ 12 Figure 7 Examples of evaluated catalysts ................................................................................ 13 Figure 8 Process schematic for the prototype WEC ................................................................ 14 Figure 9 Photographs of the skid-mounted prototype gasification and cleanup system .......... 15 Figure 10 Photograph of the control panel and the syngas transfer line to the TQG ................. 15 Figure 11 Natural gas-fired preheat combustor ......................................................................... 16 Figure 12 View into reforming reactor after catalyst filling ...................................................... 17 Figure 13 Sensing unit display of the fuel consumption meter, left, and one of two fuel
flowmeters that were installed on the TQG, right ..................................................... 18 Figure 14 Illustrative gas composition data from the laboratory catalyst screening .................. 21 Figure 15 Breakdown of condensed tars in the raw syngas ....................................................... 23 Figure 16 Catalyst temperature screening results summary ...................................................... 23 Figure 17 Equilibrium-based carbon deposition boundary for the as-fired fuel mixture
composition ................................................................................................................ 24 Figure 18 Automotive oxidation catalyst samples before (left) and after (right) exposure ....... 25 Figure 19 Summary of 900°C catalyst-screening tests .............................................................. 26
Continued…
iii

LIST OF FIGURES (continued) Figure 20 Comparison of hydrocarbon conversion rates for the two catalyst types
submitted to NREL for comparative analysis ............................................................ 27 Figure 21 Partial monolith plugging due to flaking washcoat for the original catalyst used
with the full-moisture fuel condition ......................................................................... 34 Figure 22 Typical appearance of an exposed set of tar-sampling particulate filters .................. 35 Figure 23 SEM image of an exposed particulate filter surface .................................................. 36 Figure 24 Typical ash collection from the test fuel mixture ...................................................... 37 Figure 25 Range of TQG test conditions ................................................................................... 40 Figure 26 Sensitivity of fuel offsetting for a constant generator load of 30 kWe ...................... 40 Figure 27 TQG conversion efficiency as a function of increased syngas energy content ......... 41 Figure 28 TQG exhaust CO2 trends ........................................................................................... 42 Figure 29 TQG exhaust O2 trends ............................................................................................. 42 Figure 30 TQG exhaust CO trends ............................................................................................. 43 Figure 31 TQG exhaust NOx trends ........................................................................................... 43 Figure 32 Interrelation between the syngas input energy fraction and the generator load
for the cofiring data of Figures 28–31 ....................................................................... 44 Figure 33 TQG baseline exhaust SO2 trend and the estimated cofiring emission ..................... 45 Figure 34 Comparison of particle-size distributions for the generator exhaust sampling ......... 46 Figure 35 The only obvious visual indicator of cofiring was a yellowing of the coalescing
filter element versus a new filter ............................................................................... 48 Figure 36 Images from inspection of the generator’s air inlet passages .................................... 48 Figure 37 Overall WEC layout with the maximum number of associated 60-kWe TQGs ........ 50 Figure 38 Rear view of WEC and TQG layout .......................................................................... 50 Figure 39 Perspective WEC detail with TRICON walls removed ............................................. 51 Figure 40 Plan WEC view highlighting equipment distribution among the three TRICONs ... 51
iv
LIST OF TABLES Table 1 As-Fired Fuel Data for the Laboratory Testing ......................................................... 11 Table 2 Catalyst Candidates ................................................................................................... 13 Table 3 Data Collection for Task 2 and 3 Prototype System Testing ..................................... 19 Table 4 Comparison of Reformed Syngas Heating Values Based on NREL-Reported
Data ............................................................................................................................ 27 Table 5 Fuel Component Data for the Prototype Testing ....................................................... 29 Table 6 Composite Fuel Mixtures Data .................................................................................. 29 Table 7 Averaged Syngas Composition Summary ................................................................. 29 Table 8 As-Tested Prototype Energy Balance ........................................................................ 30 Table 9 Energy Summary Scaled to 22.3 kg/hr (50 lb/hr) Feed Rate ..................................... 32 Table 10 Assumed Values to Estimate the Parasitic Electrical Energy Requirement .............. 32 Table 11 Ultimate Analysis and Heating Value Comparison for the Raw Syngas
Condensate ................................................................................................................. 33 Table 12 Summary of Reformed Syngas Tar Sampling ........................................................... 34 Table 13 Elemental Analyses Corresponding to the Selection Points in Figure 23 ................. 36 Table 14 Normalized Mass Balance Data for Gasification of the Test Fuel Mixture .............. 38 Table 15 TCLP Results for Gasifier Ash Sample ..................................................................... 38 Table 16 Generator Exhaust Unburned Hydrocarbon Emissions ............................................. 44 Table 17 Summary of Generator Exhaust Particulate Sampling under a 30-kWe Load .......... 46 Table 18 Comparison of Measured Engine Emissions with the Most Recent EPA
Standards .................................................................................................................... 47 Table 19 Key Design Parameters for Sizing the Full-Scale WEC ........................................... 52 Table 20 Energy Summary for the Full-Scale 114-kg/hr (250-lb/hr) WEC ............................. 53 Table 21 Assumed Values to Estimate the Full-Scale Parasitic Electrical Energy
Requirement ............................................................................................................... 53 Table 22 Daily WEC Operation Schedule of Activities ........................................................... 54
v

NOMENCLATURE CENTCOM U.S. Central Command CERL U.S. Army Engineer Research & Development Center’s Construction
Engineering Research Laboratory DAC data acquisition and control DoD U.S. Department of Defense EC elemental carbon EDX energy dispersive x-ray spectroscopy EERC Energy & Environmental Research Center EPA U.S. Environmental Protection Agency ER equivalence ratio FOB forward operating base GC gas chromatograph HC hydrocarbon ISO International Organization for Standardization JDW2E Joint Development Waste to Energy Community of Interest LGA laser gas analyzer MS mass spectrometer NMHC nonmethane hydrocarbon NREL National Renewable Energy Laboratory OC organic carbon PAH polycyclic aromatic hydrocarbon PM particulate matter PVC polyvinylchloride SEM scanning electron microscopy SERDP Strategic Environmental Research and Development Program SON statement of need SVOC semivolatile organic compound TCLP toxicity characteristic leaching procedure TQG tactical quiet generator TRICON triple container VOC volatile organic compound WEC waste-to-energy converter
vi

THERMAL CATALYTIC SYNGAS CLEANUP FOR HIGH-EFFICIENCY WASTE-TO-ENERGY CONVERTERS
BACKGROUND
Waste disposal at remote sites having limited infrastructure is a challenging issue. Local landfilling is not always an option, and even when it is available, it can result in unsanitary conditions or environmental degradation if handled improperly. Open burning is possible, but this practice is ineffective for the disposal of difficult-to-burn plastics and waterlogged food. Furthermore, the toxic fumes produced present a hazard to nearby personnel that can be more potent than the original waste stream. In fact, health concerns over open air burning have ultimately led to a U.S. Department of Defense (DoD) mandate to virtually eliminate the practice (1).
In addition to the possible health hazards, ineffective waste disposal also squanders the potential energy embodied in these resources that could otherwise be used to offset on-base fuel consumption. Fifty pounds of typical forward operating base (FOB) waste has the approximate energy content of 3 gallons of diesel fuel, 50% of which could feasibly be recovered and used to offset 1.5 gallons of diesel for heating or power generation. A single 600-man Force Provider-scale FOB can produce nearly 3 tons of waste a day, which, if harvested, could displace roughly 180 gallons of diesel: enough fuel to run a standard 60-kWe tactical quiet generator (TQG) at full load for nearly 40 hours. Therefore, incorporating energy recovery into waste disposal allows FOBs access to a potential energy-saving resource that these bases have already expended great effort to obtain and transport to their site.
The conflicts in Iraq and Afghanistan have exacerbated the issue of FOB waste disposal by bringing it to the public’s attention and, in turn, setting in motion the process for DoD to identify and procure a deployable waste-to-energy converter (WEC). Multiple efforts of WEC development and field trials have been conducted by all branches of the armed forces. While each system tested has generally demonstrated positive aspects over open burning, each one has fallen short with respect to all desired features, including auxiliary fuel consumption, emissions, or the useful conversion of recovered fuel energy. This project by the Energy & Environmental Research Center (EERC) focused on determining whether the proposed combination of countercurrent gasification and thermal catalytic tar cracking can meet the requirements outlined in a 2012 Strategic Environmental Research and Development Program (SERDP) statement of need (SON) entitled “Waste to Energy Converters for Overseas Contingency Operations.” Countercurrent, or updraft gasification, is an inherently more thermally efficient conversion process that is also less sensitive to fuel pretreatment compared to other distributed gasification technologies. These characteristics can result in a more efficient WEC system that is also compact in overall size because of the reduced fuel pretreatment requirements.
A further advantage of the countercurrent fixed-bed gasifier is its ability to achieve near-complete conversion of combustible matter in the waste compared to typical gasification- and
1

pyrolysis-based processes, including many commercial downdraft gasifiers. In a countercurrent gasifier, complete combustion is the last zone that the fuel passes through before being eliminated from the gasifier (see Figure 1, right). In this zone, the most recalcitrant chars are simply burned to provide the thermal energy needed to power the preceding gasification, pyrolysis, and drying zones. The high-temperature combustion zone leaves only sterile ashes that are unlikely to retain hazardous organic compounds. In contrast, the incomplete oxidation stage in a downdraft gasifier (Figure 1, left) is followed by a gasification stage, and there is inevitably some char that remains unconverted in the ash. This not only compromises the conversion efficiency of the gasifier because of lost fuel value, but it can also result in a less desirable ash depending on the method of disposal.
Figure 1. Material flows and reaction zone profiles within a downdraft gasifier (left) and a countercurrent gasifier (right).
Despite these desirable operating characteristics, the key disadvantage of updraft gasifiers, and the reason they are not commonly recommended for small-scale power production, is that the resulting syngas contains a significant fraction of condensable organic compounds (tars) that typically make the gas unsuitable for any purpose other than close-coupled combustion. Effective gas cleanup systems have been designed for larger systems and include thermal cracking, scrubbing, or a combination of both. However, at the time of this project’s inception, a reliable, compact, and effective syngas-cleaning train for high-tar syngas had not been demonstrated that could meet the military’s needs for a deployable WEC.
2
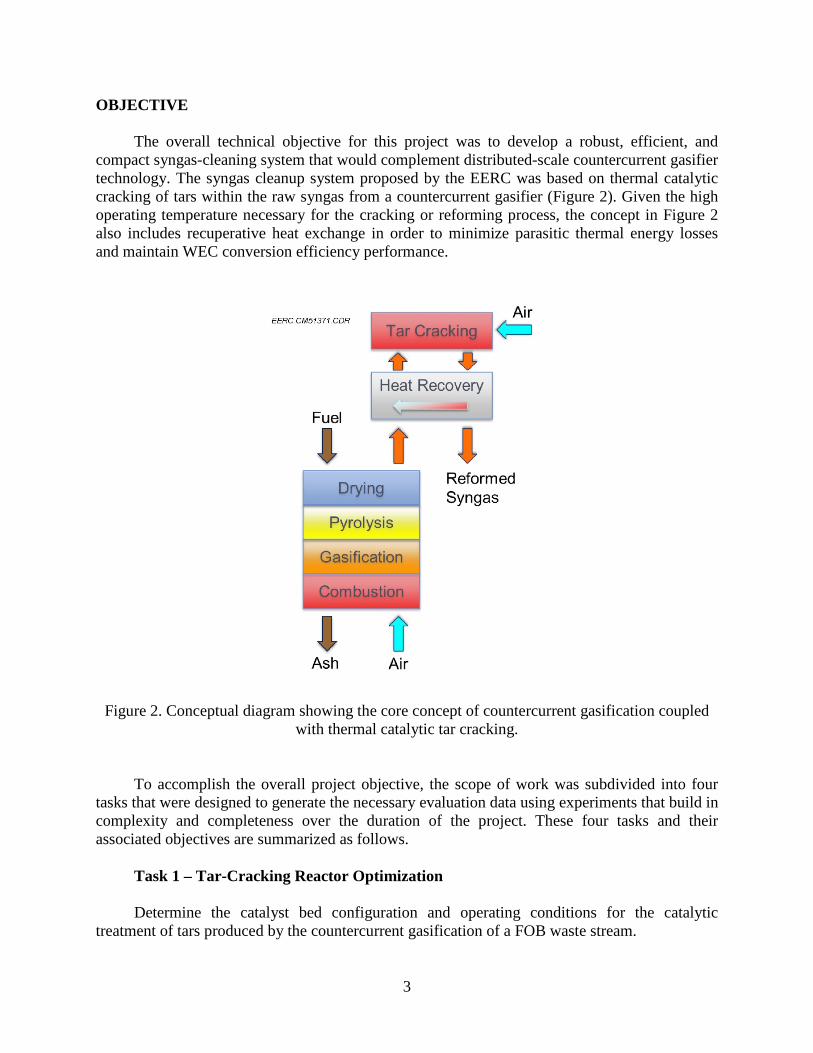
OBJECTIVE The overall technical objective for this project was to develop a robust, efficient, and compact syngas-cleaning system that would complement distributed-scale countercurrent gasifier technology. The syngas cleanup system proposed by the EERC was based on thermal catalytic cracking of tars within the raw syngas from a countercurrent gasifier (Figure 2). Given the high operating temperature necessary for the cracking or reforming process, the concept in Figure 2 also includes recuperative heat exchange in order to minimize parasitic thermal energy losses and maintain WEC conversion efficiency performance.
Figure 2. Conceptual diagram showing the core concept of countercurrent gasification coupled with thermal catalytic tar cracking.
To accomplish the overall project objective, the scope of work was subdivided into four tasks that were designed to generate the necessary evaluation data using experiments that build in complexity and completeness over the duration of the project. These four tasks and their associated objectives are summarized as follows.
Task 1 – Tar-Cracking Reactor Optimization Determine the catalyst bed configuration and operating conditions for the catalytic treatment of tars produced by the countercurrent gasification of a FOB waste stream.
3

Task 2 – Prototype System Performance Testing Measure the sustained syngas-cleaning performance and heat recovery efficiency for the proposed cleanup system using a prototype gasifier and cleanup system.
Task 3 – Integrated System Performance Testing Integrate a diesel generator with the prototype system, conduct syngas cofiring tests to determine the overall conversion efficiency for the proposed concept, and identify operational impacts to the military’s fleet of tactical generators.
Task 4 – WEC Design Analysis Perform a design analysis of a deployable WEC using the findings from Tasks 1–3, and make a determination regarding whether the proposed concept could feasibly meet the evaluation criteria outlined in the original SON.
4

TECHNICAL APPROACH The evaluation criteria set forth to judge this approach for a WEC design were drawn directly from the original SON and are listed as follows:
• Overall WEC operating efficiency of 50%
• Physical size constrained to a single 8-ft by 8-ft by 20-ft ISO (International Standards Organization) transport container
• Simple operation and minimal maintenance requirements
In order to compare the proposed concept against the stated evaluation criteria, the scope of work for this project has been structured to 1) demonstrate that the catalytic gas cleanup system can enable conversion efficiencies in excess of 50% by testing a prototype syngas cleanup system with heat recuperation; 2) show that a WEC based on this configuration can also comply with the maximum size limitations by evaluating the design of a full-scale WEC using experimentally measured performance data; and 3) generate estimates for the required level of operations and maintenance effort that are substantiated with testing observations from a prototype gasifier, syngas-cleaning system, and integrated diesel generator.
To aid in meeting the project’s objectives, the EERC solicited input from expert organizations including the U.S. Army Engineer Research & Development Center’s Construction Engineering Research Laboratory (CERL) and the U.S. Department of Energy’s National Renewable Energy Laboratory (NREL). Activities at CERL encompass distributed generation and remote power production for the military, and their team was able to provide DoD-relevant feedback regarding equipment selection and evaluation criteria. The Thermochemical Sciences Group at NREL has been active in developing syngas reforming catalyst from renewable sources. The NREL team was able to provide multiple catalysts for screening as well as conduct experiments comparing catalyst options with more resolution and insight than possible with the EERC’s screening tests.
Task 1 – Tar-Cracking Reactor Optimization
Laboratory Test System
Task 1 focused on determining the necessary operating parameters of the catalytic reactor using laboratory-scale screening tests. A process schematic for the laboratory setup is shown in Figure 3, and a photograph of the setup is provided in Figure 4. Individual system components and the overall test procedure are described in the remainder of this section. A lab-scale updraft gasifier was constructed at the EERC to generate a real syngas stream for exposing tar-cracking catalysts. The gasifier was designed to gasify approximately 0.25–1 kg of fuel an hour. The gasifier and hopper are 4 inches in diameter, and the entire system is approximately 72 inches tall. The unit was built with 304 stainless steel, and the gasification
5
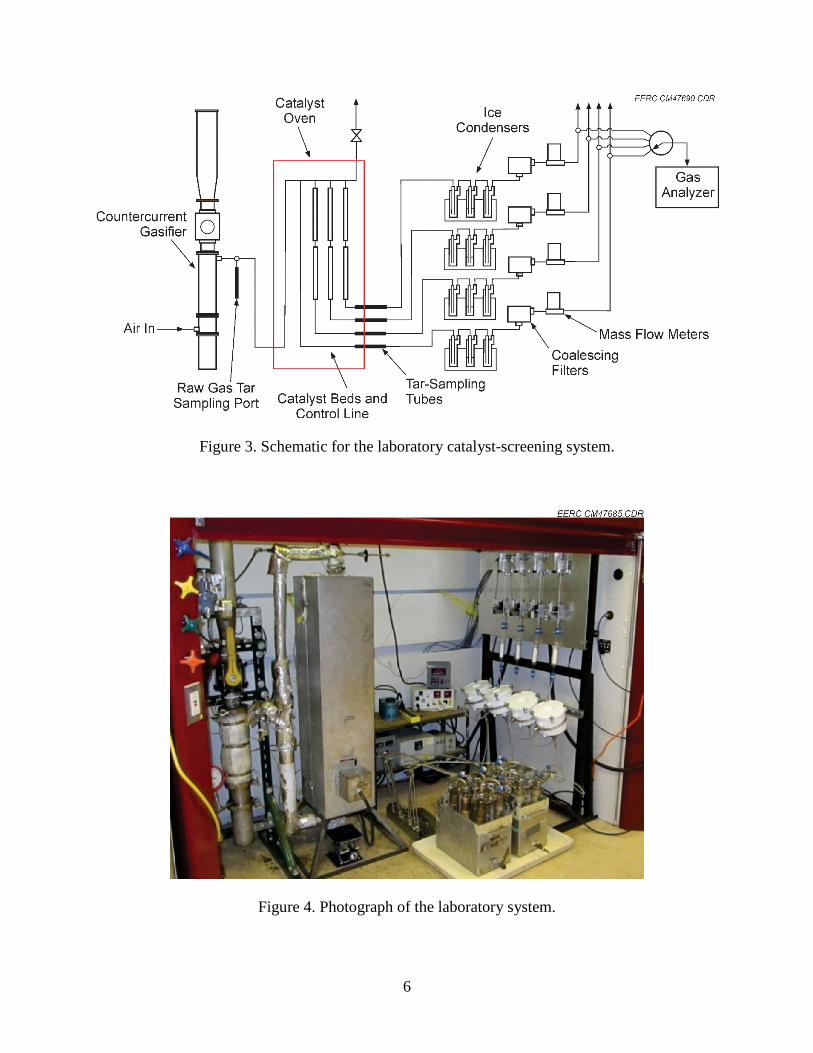
Figure 3. Schematic for the laboratory catalyst-screening system.
Figure 4. Photograph of the laboratory system.
6

section was lined with a ceramic sleeve. The gasifier was equipped with thermocouples in the reactor zone that monitored the temperature profile of the fuel bed. In order to counteract excessive heat loss due to the small size of the reactor, an electric cable heater operated at low wattage was utilized on the exterior of the gasifier to ensure that heat lost through the wall was prevented. Gasification air was injected at a rate of 4–10 slpm through a manifold at the bottom of the gasification chamber, and fuel was introduced through a hopper above the gasifier. As fuel was consumed in the gasifier, additional material moved down from the hopper by gravity. The gasifier was also equipped with a manual agitation rod capable of pushing fuel down into the reactor section if any bridging was observed. Ashes dropped into a pot through a grate at the bottom of the gasifier. The gasification air was supplied by the laboratory’s house air system. Pressure in the gasifier was monitored with a gauge and ranged from 0.25 to 0.75 psig during normal operations. A picture of the gasifier is shown in Figure 5. Raw syngas generated in the gasifier was either sent to the thermal oxidizer and vented or sent into the catalyst oven. Temperature-controlled heated lines were employed along both paths
Figure 5. Laboratory countercurrent gasifier.
7
to ensure all condensable components remained in the gas phase. The temperature set point for these lines was 288°C (550°F), and they were constructed of insulated 304 stainless steel tubing. An electric furnace was used to provide the high-temperature environment necessary for tar cracking. The furnace had a temperature controller and was operated at 600°–900°C depending on the test requirements. Raw syngas was routed into the furnace where it was split into four separate streams as indicated in Figure 3. During testing, three of the gas pathways contained catalyst beds, and the fourth remained empty. This arrangement permitted three catalysts to be screened simultaneously while the effect of thermal cracking alone was also evaluated by sampling the empty bed line. Each catalyst bed reactor was built from 304 stainless steel tubing. The reactor tube diameters were 0.5 to 1 inch in diameter, and the bed heights varied from 0.5 to 8 inches depending on the size of the catalyst being evaluated. Both the reactor diameter and catalyst bed height were manipulated to achieve the space velocity target of 4000–5000/hr. Inside the reactors, the syngas flowed from top to bottom, with the catalyst being supported on a stainless steel mesh disc. After each series of exposure tests, the reactors were opened, and catalyst was recovered for analysis.
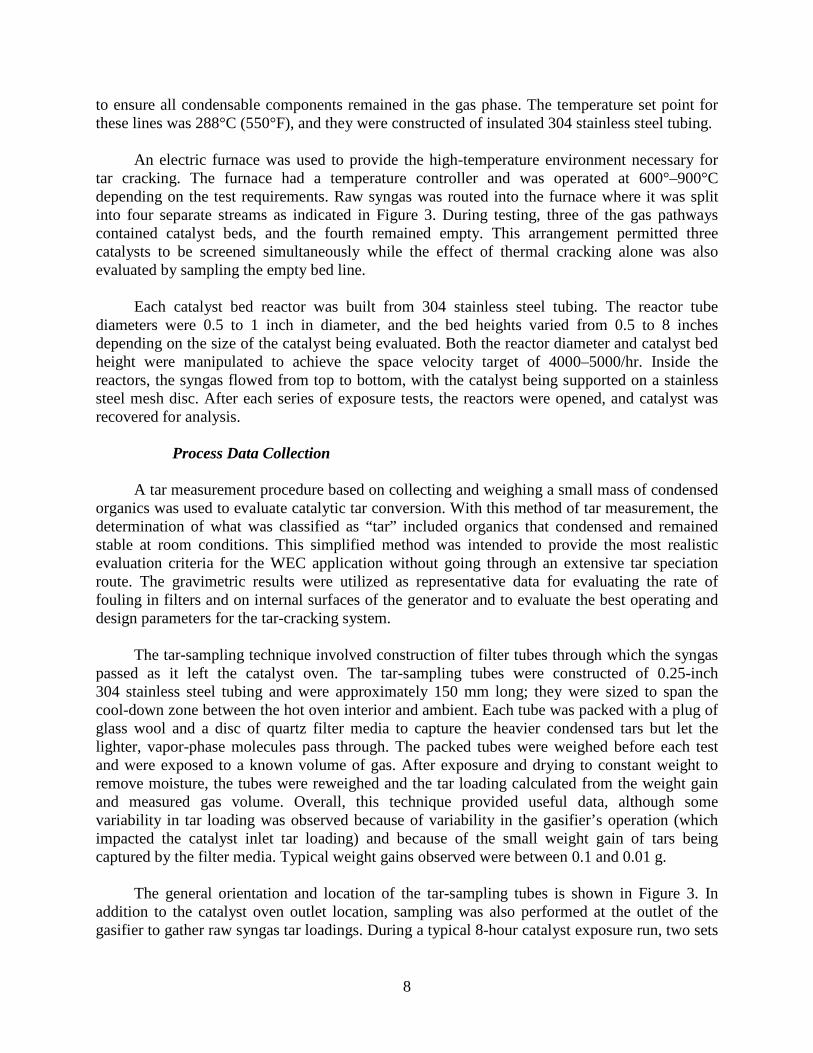
Process Data Collection A tar measurement procedure based on collecting and weighing a small mass of condensed organics was used to evaluate catalytic tar conversion. With this method of tar measurement, the determination of what was classified as “tar” included organics that condensed and remained stable at room conditions. This simplified method was intended to provide the most realistic evaluation criteria for the WEC application without going through an extensive tar speciation route. The gravimetric results were utilized as representative data for evaluating the rate of fouling in filters and on internal surfaces of the generator and to evaluate the best operating and design parameters for the tar-cracking system. The tar-sampling technique involved construction of filter tubes through which the syngas passed as it left the catalyst oven. The tar-sampling tubes were constructed of 0.25-inch 304 stainless steel tubing and were approximately 150 mm long; they were sized to span the cool-down zone between the hot oven interior and ambient. Each tube was packed with a plug of glass wool and a disc of quartz filter media to capture the heavier condensed tars but let the lighter, vapor-phase molecules pass through. The packed tubes were weighed before each test and were exposed to a known volume of gas. After exposure and drying to constant weight to remove moisture, the tubes were reweighed and the tar loading calculated from the weight gain and measured gas volume. Overall, this technique provided useful data, although some variability in tar loading was observed because of variability in the gasifier’s operation (which impacted the catalyst inlet tar loading) and because of the small weight gain of tars being captured by the filter media. Typical weight gains observed were between 0.1 and 0.01 g. The general orientation and location of the tar-sampling tubes is shown in Figure 3. In addition to the catalyst oven outlet location, sampling was also performed at the outlet of the gasifier to gather raw syngas tar loadings. During a typical 8-hour catalyst exposure run, two sets
8

of tar-sampling filter tubes would be exposed for approximately 20–30 minutes at a time. The remainder of the run would employ open tubes of the same size but without the filter packing. After passing through the tar-sampling tubes, the cracked syngas entered a series of ice condensers to remove moisture and any remaining condensable hydrocarbons. Out of the condensers, the gas entered a coalescing filter and a backup thimble filter to ensure any remaining aerosols were captured. The dry and clean syngas then passed through a mass flow meter and a manual rotameter to measure and balance the flow through each of the catalyst gas paths, respectively. A solenoid switching manifold was constructed to sequentially route gases from each of the gas streams to the laser gas analyzer (LGA). A data acquisition and control (DAC) system was constructed using National Instruments LabVIEW hardware and software. The DAC system had inputs for thermocouples and outputs that controlled the solenoid switching valves. The valves switched between the four gas paths at regular intervals, allowing the project team to gather gas data for all catalysts during test runs. Both the LGA and DAC systems stored test data for later analysis. For start-up, shutdown, and other periods of bypassing the catalyst oven, a thermal oxidizer was constructed to destroy the waste gases before venting. The oxidizer consisted of an electrically heated chamber filled with oxidation catalyst; waste gases were mixed with air and passed through the chamber before going to vent. The temperature set point for the outside wall of the thermal oxidizer was 593°C (1100°F), which was sufficient to trigger light-off of the oxidation catalyst inside. Periodic measurements of the vent stream were made to ensure thorough oxidation. A LGA from Atmospheric Recovery Inc. was used to identify constituents in the clean producer gas stream. The LGA uses the phenomenon of Raman scattering of laser light to quantitatively identify gas constituents of interest. It can be calibrated for a wide range of gases and sensitivity levels. The LGA captured a slipstream of gas after the cleanup train, and the model used for this work was capable of identifying the following constituents: CO, H2O, H2, O2, N2, CO2, CH4, and CxHy. The higher hydrocarbon number, i.e., CxHy, is a composite value for hydrocarbon molecules larger than methane. This measurement is useful for indicating the amount of larger hydrocarbon molecules but does not identify specific compounds. For the purposes of this testing, the CxHy number was interpreted as an equivalent volume of propane. Because of this, gas composition data with high CxHy values may not sum to 100%. Periodic gas bag samples were taken and analyzed using a gas chromatograph (GC) to confirm the breakdown provided by the LGA. The construction of the catalyst screening system was completed in October 2012. The team spent approximately another month going through shakedown testing on the unit prior to the start of the catalyst-screening campaign. Shakedown testing included calibrating mass flow meters, balancing flows across all four gas streams, LGA setup and calibration, and developing an effective gas cleanup train. Time was also spent early on in the program developing an
9

effective tar-sampling method. After the team became comfortable with operating the laboratory gasification system, the test program commenced. Task 1 testing took place between December 2012 and April 2013. Typical catalyst screening days lasted 6–8 hours. After the system was cleaned and reassembled from previous testing, the fuel mix for the next test would be prepared. The dry components—cardboard and plastics—would be weighed and combined with wet soybeans that had been soaked in water until saturation. Prior to loading fuel, the heaters and catalyst oven would be turned on and allowed to reach that test run’s temperature set point. When system set points were reached, the fuel was loaded into the gasifier hopper which flowed into the gasifier by gravity. The fuel bed was ignited by removing the ash pot from the bottom of the unit and firing a propane torch up into the fuel bed. After the fuel was lit, the ash pot was reattached, and gasification air was started to the fuel bed. The gasification air was controlled by the operator by means of a 0–10-slpm gas rotameter. Gasification air flow ranged from 4 to 10 slpm depending on the planned test conditions. During start-up, the produced gas was sent to the thermal oxidizer and then vented. A slipstream of the start-up gas was also monitored by the LGA to determine when to bring on the catalyst beds. After the beds were brought online, the test operator used four rotameters with control valves to control and balance flow between the four paths in the catalyst oven. Individual gas flows were measured by mass flow meters, and the bed flows, temperatures, and LGA data were logged by a data acquisition system. Each catalyst-screening test run consisted of two operation modes. The first mode, and the majority of each test, consisted of monitoring the cracked syngas compositions with the LGA. The syngas from the gasifier passed through the catalyst beds directly into the cleanup train and on to the LGA. Steady operation in this state provided the team with gas composition data and established baseline cracked gas compositions for each of the catalyst candidates. The flow and composition data were used to calculate space velocity, catalyst exposure time, and the methane and hydrocarbon conversions for each candidate. For an 8-hour test run, approximately 6 hours would be devoted to gathering gas data. The other mode of testing involved tar sampling. A description of the tar-sampling tubes was provided previously. To begin the tar loading trial, the operator would shut off the gasification air and allow the system pressure to reach zero. Preweighed sampling tubes were installed at the outlet of each catalyst oven line, and then the gasification air was restarted. The operator balanced flows across each catalyst bed using the rotameters. Typical exposure times for the tar-sampling experiments were in the range of 20–30 minutes. The test would end when either the predetermined time was reached or there were visible signs of breakthrough. The team also used the filter tubes to measure tar loadings in the raw syngas at the outlet of the gasifier. Samples at this location usually lasted only 4–8 minutes because of the higher amount of tars present. A complete set of tar-sampling tests were performed twice each test day. It would take approximately 1 hour to complete each tar loading test. After each exposure, the filter tubes were cleaned and repacked for the next test. Between each testing run, the unit was disassembled for cleaning. All of the tubing, gasifier, thermal oxidizer, and condensers were cleaned regularly. The mass flow meters were
10
calibrated prior to the test campaign and rechecked several times as the test matrix was being completed.
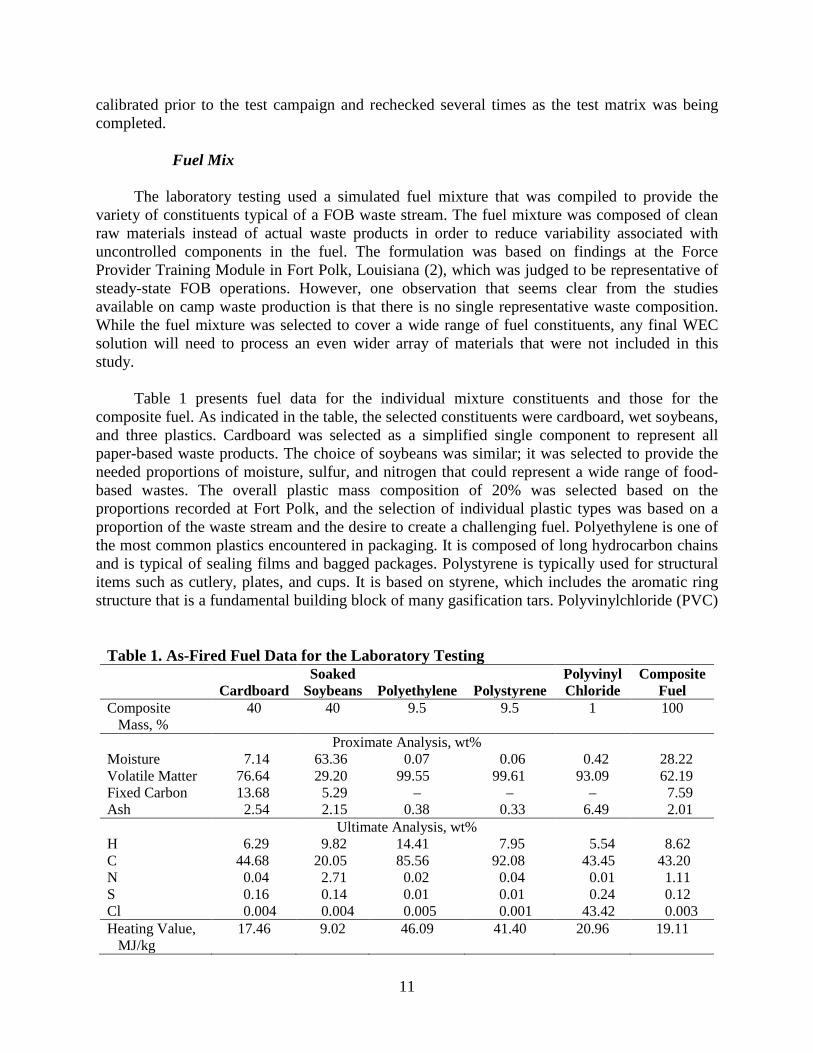
Fuel Mix The laboratory testing used a simulated fuel mixture that was compiled to provide the variety of constituents typical of a FOB waste stream. The fuel mixture was composed of clean raw materials instead of actual waste products in order to reduce variability associated with uncontrolled components in the fuel. The formulation was based on findings at the Force Provider Training Module in Fort Polk, Louisiana (2), which was judged to be representative of steady-state FOB operations. However, one observation that seems clear from the studies available on camp waste production is that there is no single representative waste composition. While the fuel mixture was selected to cover a wide range of fuel constituents, any final WEC solution will need to process an even wider array of materials that were not included in this study. Table 1 presents fuel data for the individual mixture constituents and those for the composite fuel. As indicated in the table, the selected constituents were cardboard, wet soybeans, and three plastics. Cardboard was selected as a simplified single component to represent all paper-based waste products. The choice of soybeans was similar; it was selected to provide the needed proportions of moisture, sulfur, and nitrogen that could represent a wide range of food-based wastes. The overall plastic mass composition of 20% was selected based on the proportions recorded at Fort Polk, and the selection of individual plastic types was based on a proportion of the waste stream and the desire to create a challenging fuel. Polyethylene is one of the most common plastics encountered in packaging. It is composed of long hydrocarbon chains and is typical of sealing films and bagged packages. Polystyrene is typically used for structural items such as cutlery, plates, and cups. It is based on styrene, which includes the aromatic ring structure that is a fundamental building block of many gasification tars. Polyvinylchloride (PVC)
Table 1. As-Fired Fuel Data for the Laboratory Testing
Cardboard Soaked
Soybeans Polyethylene Polystyrene Polyvinyl Chloride
Composite Fuel
Composite Mass, %
40 40 9.5 9.5 1 100
Proximate Analysis, wt% Moisture 7.14 63.36 0.07 0.06 0.42 28.22 Volatile Matter 76.64 29.20 99.55 99.61 93.09 62.19 Fixed Carbon 13.68 5.29 – – – 7.59 Ash 2.54 2.15 0.38 0.33 6.49 2.01
Ultimate Analysis, wt% H 6.29 9.82 14.41 7.95 5.54 8.62 C 44.68 20.05 85.56 92.08 43.45 43.20 N 0.04 2.71 0.02 0.04 0.01 1.11 S 0.16 0.14 0.01 0.01 0.24 0.12 Cl 0.004 0.004 0.005 0.001 43.42 0.003 Heating Value,
MJ/kg 17.46 9.02 46.09 41.40 20.96 19.11
11

does exist in packaging waste streams but to a much lesser degree than other plastics. Common uses include shrink-wrapped labels and tamper-proof seals. The key reason to include PVC is its high concentration of chlorine, which is known to form corrosive HCl and have possible deleterious effects on catalyst performance. A photograph of the tested forms of the fuel components is shown in Figure 6. Other than the soybeans being soaked and the constituents being mixed together, no further pretreatment of the materials in Figure 6 was performed. Based on the performance of the laboratory gasifier with this fuel mixture, it is believed that a countercurrent gasifier WEC could operate without the need for extensive fuel pretreatment like pelletizing. Only a coarse shredding is envisioned to ensure that all of the fuel components can physically pass through the feed system.
Figure 6. Tested fuel mixture components, from left: soybeans (shown dry), cardboard, polystyrene and polyethylene, and PVC film.
Catalyst Candidates Several catalyst candidates were sourced based on discussions with commercial vendors, results published in the open literature, and communication with project partners at the National Renewable Energy Laboratory (NREL). Table 2 lists the catalyst candidates screened with the laboratory system. The catalysts varied in their physical forms, as shown in Figure 7. As mentioned during the discussion of the catalyst reactor sizes, efforts were made to target a space velocity of 4000–5000/hr among the different catalyst shapes.
12
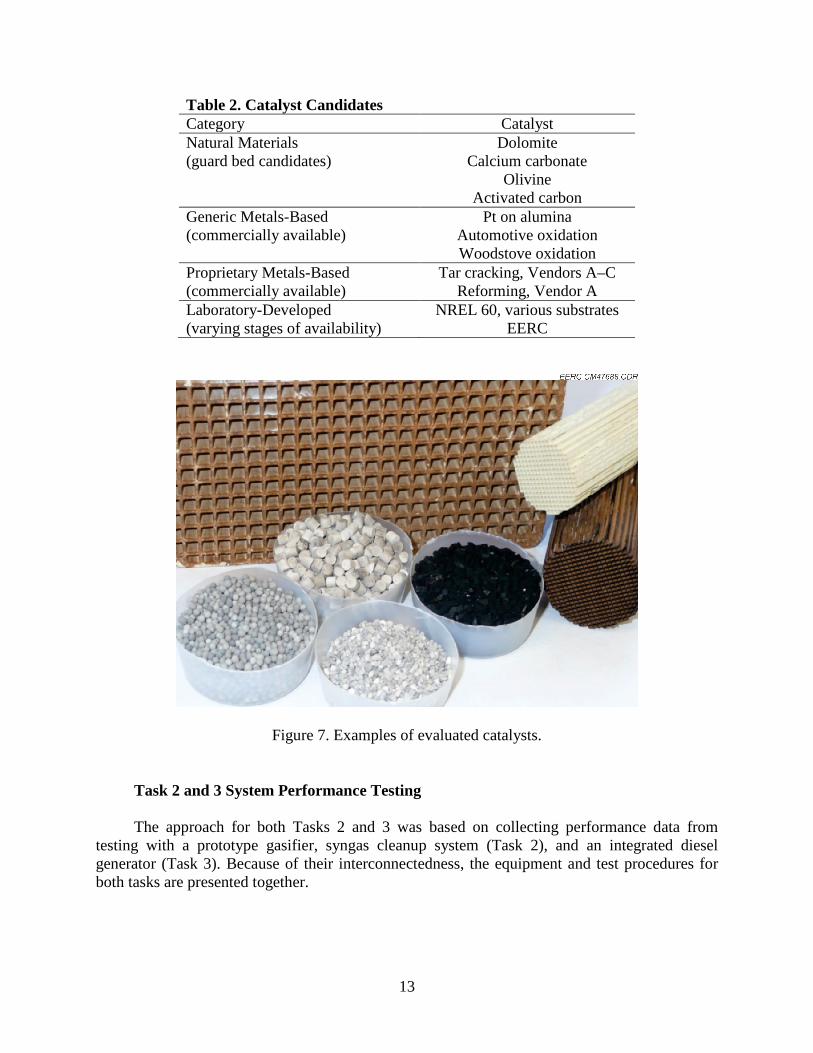
Table 2. Catalyst Candidates Category Catalyst Natural Materials (guard bed candidates)
Dolomite Calcium carbonate
Olivine Activated carbon
Generic Metals-Based (commercially available)
Pt on alumina Automotive oxidation Woodstove oxidation
Proprietary Metals-Based (commercially available)
Tar cracking, Vendors A–C Reforming, Vendor A
Laboratory-Developed (varying stages of availability)
NREL 60, various substrates EERC
Figure 7. Examples of evaluated catalysts.
Task 2 and 3 System Performance Testing
The approach for both Tasks 2 and 3 was based on collecting performance data from testing with a prototype gasifier, syngas cleanup system (Task 2), and an integrated diesel generator (Task 3). Because of their interconnectedness, the equipment and test procedures for both tasks are presented together.
13

Prototype System Description The prototype system consists of a complete gasifier and prototype thermal catalytic syngas-cleaning circuit. A schematic of the system is shown in Figure 8, with photographs of the system in Figures 9 and 10. Under Task 2 testing, the produced syngas was consumed in a thermal oxidizer (an enclosed flare fired with natural gas) before being exhausted to the atmosphere. During generator testing under Task 3, the gas was diverted from the oxidizer to the generator. Individual component descriptions are as follows.
Referring to Figure 8, the process begins in the gasifier which is a cylindrical reactor roughly 1.2 m high, with an inner diameter of 0.46 m in the fuel drying zone and a 0.34-m-i.d. refractory-lined section for the hottest combustion and gasification zones. This refractory lining was added after testing had started to correct excessive heat loss from the gasifier that was observed to impact its operating efficiency. The fuel bed was supported on top of a movable grate that was actuated with a pneumatic cylinder. During operation, the grate was actuated according to a timed cycle to dislodge accumulated ashes and drop them into the ash collection drawer at the bottom of the gasifier. Two methods were used to feed fuel into the gasifier; the first used a feed auger to convey chipped or shredded material from a hopper, and the second was a lock hopper on top of the gasifier that could be used to batch-load irregularly sized fuel materials or even whole bags of unprocessed fuel. While the lock hopper approach was effective
Figure 8. Process schematic for the prototype WEC.
14

Figure 9. Photographs of the skid-mounted prototype gasification and cleanup system.
Figure 10. Photograph of the control panel and the syngas transfer line to the TQG.
15

at introducing unprocessed fuel, it suffered from sticking under operating conditions, and all of the results discussed in this report used the feed auger to convey fuel. Following the gasifier in Figure 8 is a combustor that was used to preheat the catalytic cleanup circuit at start-up by burning the raw syngas and sending the hot exhaust gases through the recuperator and catalyst beds. When used, the combustor mixed raw syngas from the gasifier and combustion air and focused this mixture onto a hot surface ignitor to initiate combustion. Once the downstream catalyst reached operating temperature, the supply of combustion air was stopped, and raw syngas flowed through the combustor for the remainder of the test. The advantage of this approach was that no external fuel source was required to bring the reforming catalyst to operating temperature, but it was somewhat slow and unreliable because the combustible gas content leaving the gasifier varied significantly, especially at start-up.
A second approach was eventually adopted to preheat the catalyst using an external fuel source (natural gas in this case). In this method, a natural gas combustor was temporarily placed at the raw gas outlet of the recuperator to speed preheating and improve the stability of the start-up process. Figure 11 is a photograph of the preheat combustor.
The recuperator was a high-temperature heat exchanger that was intended to preheat the incoming raw syngas using the outgoing hot reformed syngas. The particular recuperator used was an off-the-shelf item that is used for high-temperature (1150°C) heat recovery in industrial furnaces. It was a shell-and-tube design and was installed such that the raw syngas passed within the tubes and the reformed gas passed through the shell side.
Figure 11. Natural gas-fired preheat combustor.
16

Following the recuperator, a catalytic, partial oxidation stage was used to provide the makeup heat necessary to bring the raw gas up to the desired tar-reforming temperature. Partial oxidation air was injected at the reactor inlet, which was then reacted over conventional monolithic oxidation catalyst sections. During operation, the quantity of injected air was adjusted to maintain the gas temperature set point at the entrance to the reforming reactor. The tar reformer or cracking reactor was a cylindrical vessel filled with reforming catalyst. Figure 12 shows the reactor with the top flange removed prior to testing. The design space velocity at standard conditions was 1600 hr-1 and was based on the space velocities evaluated during Task 1. Figure 12 shows the catalyst that was initially tested. It was in the form of 13-mm cylindrical ring supports and was one of the materials evaluated during Task 1 (i.e., Vendor A tar cracking). During Task 1 testing, this particular catalyst demonstrated good tar-cracking performance, along with other candidates, but the reason it was loaded first was its relatively massive support that could moderate temperature fluctuations as the EERC team developed procedures for stable operation. Monolithic catalysts with significantly higher surface area per unit volume were subsequently installed and were used for all reported results. This catalyst was nickel-based similar to some of the candidates evaluated under Task 1, but it was not included in the Task 1 screening. The selected monolithic catalyst formulation had previously been evaluated by the vendor with a 1200-hour exposure test (3).
Figure 12. View into reforming reactor after catalyst filling.
17

In order to counteract heat losses to the environment from the reforming reactor, additional partial oxidation air was injected at its inlet in order to maintain the desired operating temperature through to the bed outlet.
Gas circulation through the system was maintained by the suction flow generated by a compressed air eductor, as indicated in Figure 8. The system is maintained under a slight vacuum during operation, which is a desirable design feature to protect operating personnel from harmful gases or the buildup of combustible mixtures. Originally, a blower was used to generate suction flow on the prototype system, but the team experienced problems with back propagation of the flame front from the thermal oxidizer into the blower at low syngas flow rates. The motive air of the eductor maintained positive flow into the oxidizer at all times, even when syngas flow was halted.
For integrated dual-fuel generator testing under Task 3, a used 30-kWe TQG was obtained as military surplus equipment. It was equipped with a Model 4039T John Deere four-cylinder, four-cycle, turbocharged diesel engine with a displacement of 3.9 liters. The TQG was manufactured December 1997 and had a logged total of 1281 operating hours at the time of receipt at the EERC (December 2014). In order to allow dual-fuel operation by cofiring syngas, the engine’s air intake was modified to allow syngas fumigation into the engine. Other modifications to the generator included the addition of thermocouples to monitor coolant and exhaust temperatures and the addition of a fuel consumption meter, as shown in Figure 13. The fuel meter was an off-the-shelf kit and consisted of two calibrated diesel flowmeters and a differential sensing unit that provided a proportional output signal for data logging.
In order to place a load on the generator, an existing resistive load bank at the EERC was used. The load bank was capable of dissipating up to 100 kWe but could be set at intermediate load levels using a digital controller.
Figure 13. Sensing unit display of the fuel consumption meter, left, and one of two fuel flowmeters that were installed on the TQG, right.
18

Process Data Collection
Data sources consisted of a combination of continuously recording transducers, periodic manual sampling, and end-of-run inspections and laboratory analyses. The collected data and associated measurement methods are presented in Table 3.
Table 3. Data Collection for Task 2 and 3 Prototype System Testing Sampling Frequency Collected Data Measurement Method Online Monitoring with Continuous Data Logging
System temperatures Thermocouples located throughout the system. Gasification air flow Derived from a hot wire anemometer velocity measurement
in the gasifier’s air inlet. Syngas flow rate Orifice meter placed downstream of the particulate screen.
System pressure drop Pressure transducer located at the gasification air inlet. Syngas composition Continuous LGA operating on a dry slipstream of syngas.
TQG fuel consumption Commercially available fuel monitor based on the differential flow reading between fuel supply and return
flowmeters. Periodic Sampling
Syngas tar and particulate loading
Extractive syngas sampling, with particulates captured on a heated filter and tars in downstream chilled solvent
impingers. TQG exhaust particulate
loading Extractive exhaust gas sampling performed according to
EPA1 Method 5. TQG exhaust particle-size
distribution Periodic analysis of a slipstream of exhaust flow with a
laser-based aerodynamic particle sizer. TQG exhaust composition Periodic measurement with a portable emissions analyzer to
collect CO, CO2, O2, SO2, NOx, and total hydrocarbons. End-of-Run Data Collection and Analysis
Inlet fuel mix heating value Standard calorimeter-based determination of heating value. Gasifier ash carbon content Standard mass loss-on-ignition determination.
Gasifier ash hazardous content
Collected ash submitted to Test America Laboratories, Inc., Cedar Falls, Iowa, for TCLP2 analysis of VOC3 and SVOC4
content. Elemental carbon and
organic carbon (EC/OC) content of TQG exhaust
particulate
Collected particulate sampling filters submitted to Sunset Laboratory Inc., Tigard, Oregon, for EC/OC determination.
Heat exchanger and engine air intake fouling; catalyst
condition
Postrun visual inspection.
1 U.S. Environmental Protection Agency. 2 Toxicity characteristic leaching procedure. 3 Volatile organic compound. 4 Semivolatile organic compound.
19

Task 4 – WEC Design Analysis
Collected experimental data from Tasks 1–3 were used to inform the WEC design analysis of Task 4. The approach for this task was to size components and estimate performance characteristics for a full-scale WEC based on the collected experimental data.
20

RESULTS AND DISCUSSION
Task 1 – Tar-Cracking Reactor Optimization
Reformed Syngas Composition The syngas composition was monitored for all of the catalyst-screening tests. These data were collected on a dry basis since the LGA sampled the gas stream at a point after moisture and any residual tars were removed from the gas. An example of these data are shown in Figure 14, which is a plot of the LGA-measured gas composition for a complete sequence of sampling among the empty bed and three catalyst candidates. Switching between the gas streams highlights the effects of each catalyst. For example, the empty bed composition has relatively low CO and H2 content but appreciable methane and hydrocarbon constituencies. Both oxidation catalyst candidates show progressively higher concentrations of CO and H2, which is coming from the decomposition of a portion of the hydrocarbon content and, presumably, the tars. However, only the gas passing through the methane reforming catalyst in Figure 14 begins to approach a reformed syngas composition, one with minimal quantities of both methane and other hydrocarbon species and where the fuel constituents are dominated by CO and H2. Nitrogen content for all of the data in Figure 14 was higher than 40% and is, therefore, not visible with the selected scale.
Figure 14. Illustrative gas composition data from the laboratory catalyst screening. Testing was done at 900°C.
21

During testing, high conversion of methane and, more importantly, hydrocarbons into CO and H2 was a clear indicator of catalytic activity, and those catalysts that reduced methane and hydrocarbon content generally showed good tar conversion as well. Catalysts that resulted in incomplete or ineffective tar conversion retained appreciable CxHy content in their respective sample stream.
Tar Reforming For the WEC application, the species of concern included heavier organic compounds that could condense at ambient temperatures. The laboratory countercurrent gasifier produced syngas with a significant loading of tars that averaged 39.4 g/dsm3. This placed the laboratory gasifier solidly within the range expected for countercurrent systems, which is roughly 10 to 50 g/dsm3. In order to gain further insight into the nature of these tars, captured condensed samples were dissolved in solvent and analyzed using a GC–mass spectrometer (MS) system. The raw tars were quite complex, and a complete identification of individual species was not feasible. Instead, Figure 15 presents a breakdown of the tars into major categories in order to qualitatively understand the fate of the fuel constituents. As shown in the breakdown of Figure 15, the majority of the dissolved compounds could be classified as aliphatic hydrocarbons (HCs) that are believed to be fractions of the polyethylene component of the fuel feed. Identifiable derivatives from the polystyrene feed made up a much smaller percentage of the total, approximately 2.4%. The category of “other aromatics” includes some ring structures that could be attributed to the breakdown of polystyrene; however, this category primarily represents secondary and tertiary tars typical of gasification, including naphthalene, phenanthrene, anthracene, and a range of heavier tars. The final category comprising 30.6% of the total includes aliphatic and aromatic molecules containing heteroatoms including nitrogen, chlorine, and sulfur. Identification of these compounds in the tars coupled with their apparent absence in forms such as NH3 and H2S (as judged by a lack of significant odor) suggests that these contaminants are volatilized with the tars.
Tar conversion was based on the reduction in tar loading between the catalyst oven inlet and the outlet loadings from each individual bed. Figure 16 is a plot of the bed outlet tar loadings as a function of catalyst oven temperature for the empty bed condition and several of the catalyst candidates. Data with the empty bed show a significant effect of thermal cracking alone; the average raw gas inlet tar loading was 39.4 g/dsm3 but was approximately 7.2 g/dsm3 out of the empty bed at 600°–700°C and tapered to 5.8 g/dsm3 at 900°C. Nearly all of the data with a catalyst present show an improvement compared to the empty bed used as a baseline case; however, at temperatures of 800°C and lower, none of the catalysts resulted in tar loadings below approximately 2.5 g/dsm3. Significant further reductions in tar loading were not achieved until a temperature of 900°C was tested, and at that temperature, it was only the metal-based catalysts that resulted in tar loading less than 1 g/dsm3.
22

Figure 15. Breakdown of condensed tars in the raw syngas (PAHs = polycyclic aromatic hydrocarbons).
Figure 16. Catalyst temperature screening results summary.
23

The improvement in catalytic tar conversion from 800° to 900°C is at least partially, if not completely, attributed to an increase in the reaction rate of kinetically controlled cracking reactions due to an increase in catalyst bed temperature. Another possible contributing factor, but one of unknown impact, is partial fouling of the catalyst surface with carbon or coke at the lower testing temperatures.
Equilibrium calculations based on minimizing free energy of the composition were conducted at constant temperature to evaluate the potential for carbon deposition under the test conditions. Figure 17 shows the equilibrium-based carbon deposition boundary for the specific H:C molar ratio of the as-fired fuel mixture. These results are plotted as a function of the equivalence ratio (ER), which defines the ratio of the actual amount of oxygen reacting relative to the amount needed for complete combustion. Complete combustion occurs with an ER of 1, and partial combustion and gasification occur at lower ER values. According to the calculations, 800°C appears to be an approximate transition temperature regarding carbon deposition. Above 800°C, the risk of deposition is essentially reduced to the limitation of operating below the minimum ER needed to at least convert all of the carbon to CO (which was approximately 0.3 for the evaluated conditions). However, below 800°C, the risk of carbon deposition increases even when additional oxygen is present. The estimated operating equivalence ratio for the laboratory gasifier ranged between 0.45 and 0.55, which spans the deposition boundary over the temperature range of 650° to 750°C.
Figure 17. Equilibrium-based carbon deposition boundary for the as-fired fuel mixture composition.
24
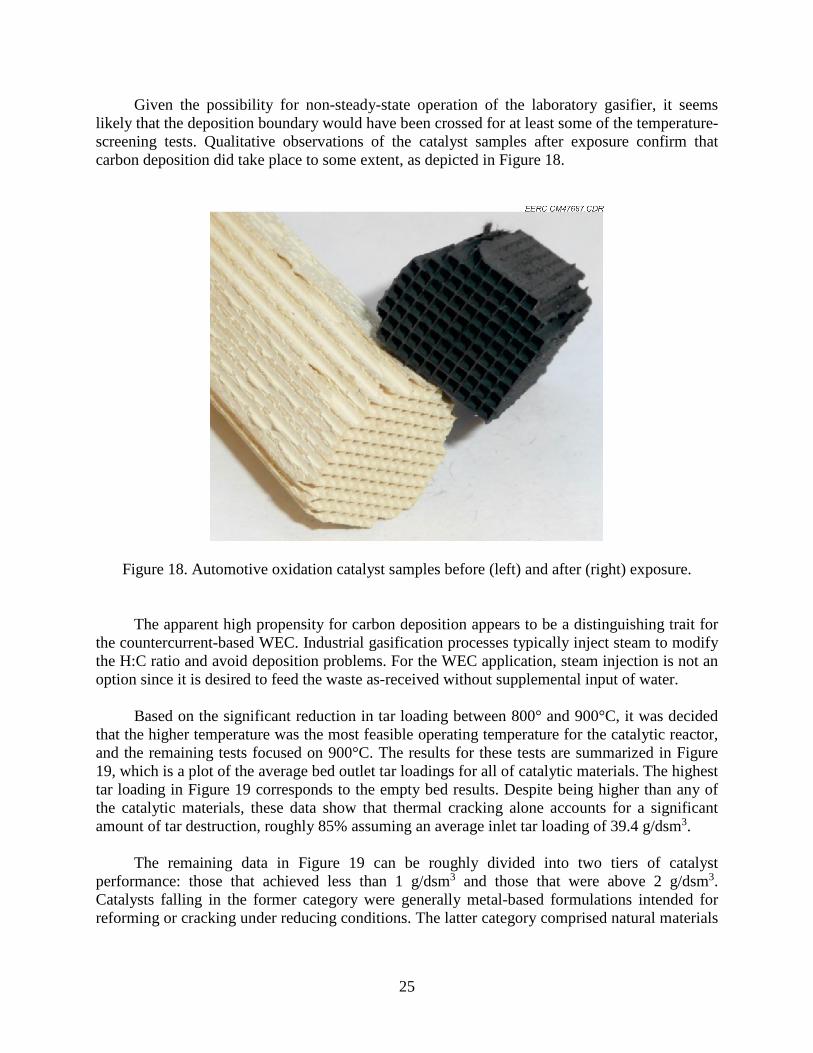
Given the possibility for non-steady-state operation of the laboratory gasifier, it seems likely that the deposition boundary would have been crossed for at least some of the temperature-screening tests. Qualitative observations of the catalyst samples after exposure confirm that carbon deposition did take place to some extent, as depicted in Figure 18.
Figure 18. Automotive oxidation catalyst samples before (left) and after (right) exposure.
The apparent high propensity for carbon deposition appears to be a distinguishing trait for the countercurrent-based WEC. Industrial gasification processes typically inject steam to modify the H:C ratio and avoid deposition problems. For the WEC application, steam injection is not an option since it is desired to feed the waste as-received without supplemental input of water. Based on the significant reduction in tar loading between 800° and 900°C, it was decided that the higher temperature was the most feasible operating temperature for the catalytic reactor, and the remaining tests focused on 900°C. The results for these tests are summarized in Figure 19, which is a plot of the average bed outlet tar loadings for all of catalytic materials. The highest tar loading in Figure 19 corresponds to the empty bed results. Despite being higher than any of the catalytic materials, these data show that thermal cracking alone accounts for a significant amount of tar destruction, roughly 85% assuming an average inlet tar loading of 39.4 g/dsm3. The remaining data in Figure 19 can be roughly divided into two tiers of catalyst performance: those that achieved less than 1 g/dsm3 and those that were above 2 g/dsm3. Catalysts falling in the former category were generally metal-based formulations intended for reforming or cracking under reducing conditions. The latter category comprised natural materials
25
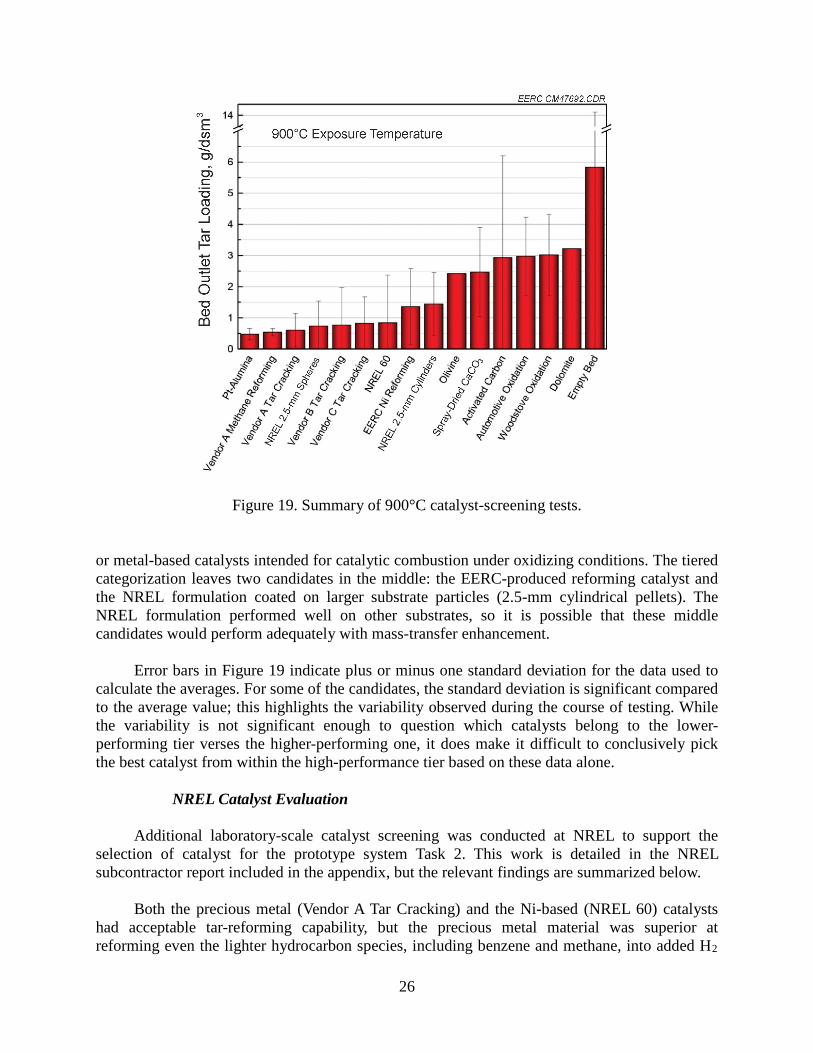
Figure 19. Summary of 900°C catalyst-screening tests. or metal-based catalysts intended for catalytic combustion under oxidizing conditions. The tiered categorization leaves two candidates in the middle: the EERC-produced reforming catalyst and the NREL formulation coated on larger substrate particles (2.5-mm cylindrical pellets). The NREL formulation performed well on other substrates, so it is possible that these middle candidates would perform adequately with mass-transfer enhancement.
Error bars in Figure 19 indicate plus or minus one standard deviation for the data used to calculate the averages. For some of the candidates, the standard deviation is significant compared to the average value; this highlights the variability observed during the course of testing. While the variability is not significant enough to question which catalysts belong to the lower-performing tier verses the higher-performing one, it does make it difficult to conclusively pick the best catalyst from within the high-performance tier based on these data alone.
NREL Catalyst Evaluation
Additional laboratory-scale catalyst screening was conducted at NREL to support the selection of catalyst for the prototype system Task 2. This work is detailed in the NREL subcontractor report included in the appendix, but the relevant findings are summarized below.
Both the precious metal (Vendor A Tar Cracking) and the Ni-based (NREL 60) catalysts had acceptable tar-reforming capability, but the precious metal material was superior at reforming even the lighter hydrocarbon species, including benzene and methane, into added H2
26

and CO. In contrast, the reforming capability of the lightest hydrocarbons, especially methane, was poorer for the Ni-based catalyst, Figure 20. The net effect of these differences on the reformed syngas heating value shows that the lesser performance of the Ni-based material is not entirely detrimental since it results in a slightly more energy-dense syngas composition as shown in Table 4. Additional NREL tests showed that each catalyst maintained their respective starting levels of activity for periods up to 48 hours, suggesting that an equilibrium was reached with contaminants such as H2S and coke deposition instead of a perpetual degradation.
Figure 20. Comparison of hydrocarbon conversion rates for the two catalyst types submitted to NREL for comparative analysis. Values based on NREL-reported data.
Table 4. Comparison of Reformed Syngas Heating Values Based on NREL-Reported Data
Reformed Gas Composition Input Gas
Composition Blank Monolith Ni-Based Catalyst
Precious Metal Catalyst
Fuel Species H2, vol% 16 18 23.1 31 CO, vol% 16 18 20 24 CH4, vol% 5 5 4.8 0.5 C2H4, vol% 2 0.5 0.2 0 C6H6, vol% 0.02 0 0 0 Heating Value 6.95 6.51 7.11 6.81 Relative Flow 1.00 1.07 0.98 1.02
27

The slight optimum in syngas heating value shown by the Ni-based catalyst in Table 4 is only a small potential advantage over the precious metal material. However, a more critical reason to consider the Ni-based material over the precious metal was its potentially greater tolerance for oxidizing conditions versus the precious metal. Limited data from the NREL study suggest that the reforming activity of the Ni-based material either stayed the same or even slightly improved after a regeneration step in which accumulated coke was burned away with the introduction of oxygen. The equivalent test with the precious metal material resulted in a 20% reduction in its methane-reforming capability, potentially indicating an intolerance of oxidizing conditions. Granted, these are limited test results; however, they do raise an important evaluation criteria for future catalyst selection. Given the small scale of the eventual WEC and limited oversight of its operations, it will be very helpful to employ catalyst that will not degrade during a transition to oxidizing conditions since they will most likely be experienced on a regular basis at start-up and when the gasifier fuel is allowed to burn away completely.
Task 2 – Prototype System Performance Testing
With the operating parameters identified under Task 1 for the catalytic reformer, activities under Task 2 sought to investigate the energy efficiency implications that these conditions had on system performance. A scaled-down prototype system was fabricated in order to determine if self-sufficient operation could be maintained and if the level of tar reforming observed in the laboratory could be achieved at a larger scale.
Energy Balance
The fuel mixture used for the prototype system tests was virtually the same as that used under Task 1, with the exception that fuel moisture content was varied as a test parameter and the small percentage of PVC was omitted. The PVC represented the chief source of chlorine in the lab-scale fuel feed, and the team decided to avoid its inclusion in the prototype fuel mix to avoid the possibility of producing chlorinated by-products, at least until the system’s destruction efficacy could be demonstrated.
The proximate and ultimate analyses for the individual fuel components specific to the prototype system testing are presented in Table 5, and the tested composite fuel mixtures are shown in Table 6. The range of composite fuel moisture levels ranged from about 6% to 28% for the no-added-moisture fuel to the full-moisture fuel, respectively. The intention of this test series was to investigate the effect of fuel moisture and determine the value of drying wet waste.
Averaged steady-state syngas compositions for each of the fuel mixture tests are presented in Table 7. The dry basis values represent what the LGA actually detected during testing, while the wet basis values are calculated based on the assumed water vapor content in the syngas. The wet basis values are most relevant to determining the overall energy conversion rate since they represent the gas composition that was eventually fired in the generator.
28

Table 5. Fuel Component Data for the Prototype Testing Cardboard Soybeans Polyethylene Polystyrene Water
Moisture, wt% 7.14 9.30 0.07 0.06 100.0 Volatile Matter, wt% 76.64 72.28 99.55 99.61 – Fixed Carbon, wt% 13.68 13.09 – – – Ash, wt% 2.54 5.33 0.38 0.33 – H, wt% 6.29 7.80 14.41 7.95 11.10 C, wt% 44.68 49.62 85.56 92.08 – N, wt% 0.04 6.72 0.02 0.04 – S, wt% 0.16 0.34 0.01 0.01 – Heating Value, MJ/kg 17.46 22.32 46.09 41.40 –
Table 6. Composite Fuel Mixtures Data No Added
Moisture Midmoisture Full Moisture Mass Composition, wt% Cardboard Soybeans (dry) Polyethylene Polystyrene Water
53 21 13 13 0
45 18 11 11 14
39 16 10 10 25
Moisture, wt% 5.75 18.90 28.22 Volatile Matter, wt% 81.69 70.40 62.19 Fixed Carbon, wt% 10.00 8.51 7.59 Ash, wt% 2.56 2.18 2.01 H, wt% 7.88 8.25 8.62 C, wt% 57.19 48.58 43.20 N, wt% 1.44 1.23 1.11 S, wt% 0.16 0.14 0.12 Heating Value, MJ/kg 25.31 21.50 19.11
Table 7. Averaged Syngas Composition Summary
No Added Moisture Midmoisture Full Moisture Volume Composition
Dry Basis, measured
Wet Basis, calculated
Dry Basis, measured
Wet Basis, calculated
Dry Basis, measured
Wet Basis, calculated
CO, % 19.9 18.7 15.6 14.3 12.0 10.7 H2, % 11.7 11.0 12.0 11.0 10.3 9.19 CH4, % 1.79 1.68 0.31 0.28 1.70 1.51 CxHy, % 0.00 0.00 0.00 0.00 0.00 0.00 CO2, % 10.5 9.84 9.73 8.90 12.8 11.4 H2O, % 1.44 7.4 N/A 9.5 1.23 12.0 O2, % 0.03 0.03 0.00 0.00 0.16 0.14 N2, % 54.7 51.4 61.3 56.1 61.8 55.0 Heating Value,
MJ/sm3 4.47 4.20 3.44 3.15 3.32 2.96
29

The overall trend in Table 7 is for the gas quality, as indicated by its heating value, to degrade with increasing fuel moisture content. As fuel moisture increases, more energy must be consumed within the gasifier to evaporate water, and the lower heating values in Table 7 are the manifestation of that effect. The noticeably lower methane values for the midmoisture test are likely due to the fact that a fresh layer of monolithic reforming catalyst was installed prior to that test while the other tests were conducted with previously exposed catalyst.
The experimentally derived energy balances for the three fuel moisture conditions are presented in Table 8. As shown in the table, each test condition resulted in somewhat variable fuel feed and input energy rates because of inconsistencies with metering fuel out of the hopper as well as the difference in energy density of the fuel itself. Therefore, the most reliable comparison value is the gross conversion efficiency which is the normalized measure of the amount of chemical energy of the fuel that eventually becomes embodied as chemical energy in the reformed syngas but without deductions to account for parasitic electrical power consumption. The values of gross conversion efficiency descend with increasing fuel moisture content as expected because of increased sensible and latent energy consumption for moisture evaporation and steam heating. Increases in fuel moisture should be manifested as a larger energy loss and poorer efficiency in the gasifier, and for the midmoisture and full-moisture cases, this is the trend in Table 8, but unexpectedly, the gasifier efficiency was determined to be lowest for the no-added-moisture condition. This last value is most likely in error and is reflective of the fact that it is a derived value based on the assignment of losses between the gasifier and the cleanup system instead of being based on more direct measurements such as those that go into determining the gross conversion efficiency. As discussed in the section regarding raw syngas sampling, an alternate determination of gasifier efficiency with the no-added-moisture fuel was 88.1% which would complete the trend of increasing gasifier efficiency with reduced fuel moisture in Table 8.
Table 8. As-Tested Prototype Energy Balance Fuel Mixture No Added
Moisture Midmoisture Full
Moisture Fuel Feed Rate, kg/hr 14.8 11.8 13.2 Fuel Energy In, kWth 104 70.3 70.1 Gasifier Loss, kWth (18.2) (9.91) (11.5) Cleanup System Loss, kWth (11.3) (9.69) (10.7) Lost Sensible Energy, kWth (9.22) (8.01) (8.20) Gross Syngas Output,a kWth 65.3 42.7 39.8 Gasifier Efficiency, % 82.5b 85.9 83.7 Recuperator Effectiveness, % 39.3 41.0 41.4 Gross Conversion Efficiency,a % 62.8 60.7 56.7 a Without the deduction of syngas energy to supply the parasitic electrical loads. b Indicated efficiency based on the method used to allocate losses between the gasifier and cleanup
system. An alternate method using the raw syngas energy content suggests a higher value of 88%.
30
The gross conversion efficiencies of Table 8 all exceed 50%, but none would likely meet the net conversion efficiency goal of 50% if energy for the parasitic loads were deducted. This is partially due to a low recuperator efficiency, which was fairly consistent among the cases but was below the original assumption of 70%. Furthermore, the fuel throughput of the prototype system was consistently low, roughly 60% of the design feed rate of 50 lb/hr. This shortcoming came down to insufficient capacity of the flow eductor to draw gases through the system. The flow eductor replaced a blower because of issues with flame propagation back to the blower housing from the thermal oxidizer, a problem which the eductor solved, but at the cost of reduced flow capacity.
These operational deficiencies do not invalidate the obtained results, but they do give a distorted picture of the possible conversion efficiency of the countercurrent gasification system since some of the ambient heat losses scale with exposed surface area and not with syngas flow rate. In other words, it would be expected that the environmental losses should be relatively insensitive to flow rate, and so they would become a smaller relative component with a higher fuel throughput. Table 9 was prepared to show the effect of reaching the target throughput rate of 50 lb/hr on conversion efficiency. In scaling up the experimental results, the only loss component that did not scale with fuel throughput was the cleanup system loss to the environment; instead, it was held the same as the experimentally determined values since the high-temperature portions of the system would remain at the same temperature and heat loss to the environment would be expected to remain relatively constant since the exterior geometry would not change.
As shown in the top half of Table 9, the impact of recalculating the energy balance with an increased fuel throughput was to increase the gross conversion efficiency values by an average of 5 percentage points. Net conversion efficiencies are also presented in Table 9, and they show that with this level of performance the no-added-moisture and midmoisture cases can exceed the net conversion efficiency target of 50%. Also included in Table 9 is the impact of improving the recuperator effectiveness to 70%. These recalculated values are in the bottom half of the table, and they show that even the full-moisture condition can meet the conversion target with improved thermal energy recovery at 50 lb/hr throughput. Details of the parasitic loads used in the calculations are presented in Table 10.
31

Table 9. Energy Summary Scaled to 22.3-kg/hr (50-lb/hr) Feed Rate Fuel Mixture No Added
Moisture Midmoisture Full
Moisture Fuel Feed Rate, kg/hr 22.3 22.3 22.3 Results Using the Experimental Recuperator Effectiveness Fuel Energy In, kWth 160 136 121 Gasifier Loss, kWth (27.9) (19.1) (19.7) Cleanup System Loss, kWth (11.3) (9.69) (10.7) Lost Sensible Energy, kWth (13.9) (16.0) (15.5) Gross Syngas Output,a kWth 107 90.9 74.8 Parasitic Syngas for Electrical Loads, kWth (20.3) (20.3) (20.3) Net Syngas Output,b kWth 86.4 70.6 54.5 Gasifier Efficiency, % 82.5 85.9 83.7 Recuperator Effectiveness, % 39.3 41.0 41.4 Gross Conversion Efficiency,a % 66.8 67.0 62.0 Net Conversion Efficiency,b % 54.1 52.0 45.1 Results with Improved Recuperator Effectiveness Fuel Energy In, kWth 160 136 121 Gasifier Loss, kWth (27.9) (19.1) (19.7) Cleanup System Loss, kWth (11.3) (9.69) (10.7) Lost Sensible Energy, kWth (6.86) (8.13) (7.92) Gross Syngas Output,a kWth 114 98.8 82.3 Parasitic Syngas for Electrical Loads, kWth (20.3) (20.3) (20.3) Net Syngas Output,b kWth 93.4 78.5 62.0 Gasifier Efficiency, % 82.5c 85.9 83.7 Recuperator Effectiveness, % 70.0 70.0 70.0 Gross Conversion Efficiency,a % 71.2 72.8 68.2 Net Conversion Efficiency,b % 58.5 57.8 51.4 a Without the deduction of syngas energy to supply the parasitic electrical loads. b Includes a deduction of syngas energy for the parasitic electrical loads. c Indicated efficiency based on the method used to allocate losses between the gasifier and cleanup system. An
alternate method using the raw syngas energy content suggests a higher value of 88%.
Table 10. Assumed Values to Estimate the Parasitic Electrical Energy Requirement Air Compressor,a kWe 3.7 Fuel Shredder,b kWe 0.75 Fuel Feed Auger, kWe 0.25 Control System, kWe 2 Total Electrical Load Estimate, kWe 6.7 Required Syngas Energy Assuming 33% Conversion
Efficiency in a Cofired Generator, kWth 20.3
a Used to supply the motive air for the flow eductor and ash grate. b Average continuous power consumption, actual shredder power rating assumed to be 6 kWe.
32

Tar Reforming
Tar sampling was conducted for one sample of raw syngas and for the reformed syngas during two of the three fuel moisture conditions. The raw gas tar measurement indicated a very high tar and particulate matter (PM) loading in the range of 197 g/dsm3. Particulate speciation using a heated filter was not used during this sample because of the extremely high tar loading. Instead, the collected condensate was treated as containing both tar and PM. This material was subjected to a standard fuel analysis and is compared to the input fuel properties in Table 11.
Based on the condensate heating value presented in Table 11, the total heating value of the raw syngas including tars was estimated to be 9.85 MJ/m3, more than double the value for the reformed syngas in Table 7. Tars and PM embodied 42.1% of the raw syngas chemical energy content. The raw gas energy content determination also provided an alternate way to estimate gasifier efficiency with the no-moisture-added fuel mixture. The energy content leaving with the raw syngas versus the input energy with the fuel indicates a gasifier efficiency of 88.1% which was more consistent with the expected performance using the dry fuel compared to the value reported in Table 8.
This measurement of raw syngas tar loading was noticeable higher than the average determined for the laboratory-scale gasifier under Task 1 which was 39.4 g/dsm3. The laboratory results did record a wide range of raw gas tar loadings; of the 35 measurements that were used to compute the average, the minimum was 6.20 g/dsm3, and the maximum was 123 g/dsm3. The variation was linked to parameters such as the immediate fuel composition entering the gasifier, gasifier exit temperature, and the gas flow rate through the fuel bed. However, sampling raw gas on the prototype system was difficult because of the high tar concentration, and the effort needed to capture these relationships in more detail was not invested.
Reformed syngas tar samples were collected for the midmoisture and full-moisture fuel conditions, and the results are summarized in Table 12 as quantities of total tar, nonbenzene tar, and particulates. Differences were noticed between the measured heavier-than-benzene tar concentrations, i.e., 683 vs. 244 mg/dsm3. However, instead of being a reflection of a change in fuel moisture, this decrease is most likely the result of exchanging a damaged layer of reforming
Table 11. Ultimate Analysis and Heating Value Comparison for the Raw Syngas Condensate Ultimate Analysis Raw Syngas Tar and PM Gasifier Fuel % Change Hydrogen, wt%
10.23 7.9 22.8 Carbon, wt% 76.01 57.2 24.7 Nitrogen, wt% 1.26 1.4 −11.1 Sulfur, wt% 0.08 0.2 −150.0 Oxygen (ind.), wt% 12.42 30.9 −148.8 Ash, wt% – 2.6 NA Chlorine, µg/g 31.2 – NA Calorific Value, MJ/kg 36.3 25.3 30.2
33

Table 12. Summary of Reformed Syngas Tar Sampling Midmoisture with New
Catalyst Layer Full Moisture with Original Catalyst
Total Tar Collected, mg/m3 362 1070 Tar Heavier Than Benzene, mg/m3 244 683 Particulate Matter, mg/m3 684 204 catalyst with a new layer between the two runs. The catalyst damage consisted of what appears to have been surface layers of the washcoat flaking from the substrate. These lost flakes reduced the active surface area of the reforming catalyst and conceivably altered equal syngas flow distribution since individual flakes could block flow channels through the monoliths (Figure 21). The root cause for the damage was not clear, but thermomechanical stress from rapid and frequent thermal cycling was a likely contributing factor.
Figure 21. Partial monolith plugging because of flaking washcoat for the original catalyst used with the full-moisture fuel condition.
34

Between the two tests in Table 12, the system’s particulate screen was moved from upstream of the tar-sampling port to a downstream point at the generator inlet to reduce its operating temperature and allow the use of a higher-efficiency particle collection filter. Assuming minimal changes to the particulate loading from the fuel moisture content, the effect of moving the particulate screen between runs appears to have been a threefold increase in the sampled particulate concentration.
Figure 22 shows a typical set of exposed particulate filters from a tar-sampling measurement. The PM is similar to soot in appearance and does not resemble typical entrained inorganic ash particles. Examination of the filters using scanning electron microscopy with energy dispersive x-ray spectroscopy (SEM/EDX) (Figure 23 and Table 13) reveals that the bulk of the collected PM is indeed composed of very fine, submicron carbon particles that have most likely formed in the gas phase during the partial oxidation and tar-reforming processes. Isolated inorganic particles, e.g., Spectrum 5 in Figure 23, are observed and could be traditional ash particulates or, more likely, dislodged flakes of the reforming catalyst given the detected metal content in Table 13.
Figure 22. Typical appearance of an exposed set of tar-sampling particulate filters.
35
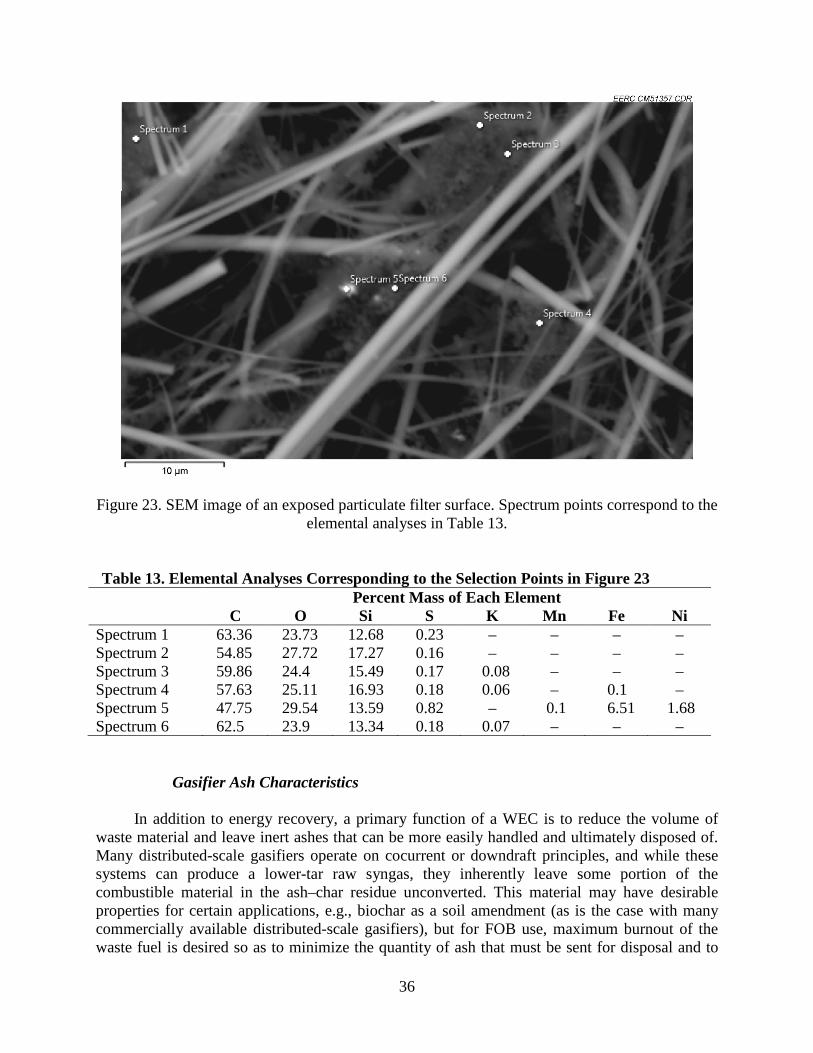
Figure 23. SEM image of an exposed particulate filter surface. Spectrum points correspond to the elemental analyses in Table 13.
Table 13. Elemental Analyses Corresponding to the Selection Points in Figure 23
Percent Mass of Each Element C O Si S K Mn Fe Ni
Spectrum 1 63.36 23.73 12.68 0.23 – – – – Spectrum 2 54.85 27.72 17.27 0.16 – – – – Spectrum 3 59.86 24.4 15.49 0.17 0.08 – – – Spectrum 4 57.63 25.11 16.93 0.18 0.06 – 0.1 – Spectrum 5 47.75 29.54 13.59 0.82 – 0.1 6.51 1.68 Spectrum 6 62.5 23.9 13.34 0.18 0.07 – – –
Gasifier Ash Characteristics
In addition to energy recovery, a primary function of a WEC is to reduce the volume of waste material and leave inert ashes that can be more easily handled and ultimately disposed of. Many distributed-scale gasifiers operate on cocurrent or downdraft principles, and while these systems can produce a lower-tar raw syngas, they inherently leave some portion of the combustible material in the ash–char residue unconverted. This material may have desirable properties for certain applications, e.g., biochar as a soil amendment (as is the case with many commercially available distributed-scale gasifiers), but for FOB use, maximum burnout of the waste fuel is desired so as to minimize the quantity of ash that must be sent for disposal and to
36

completely sanitize the material for safe handling. In the countercurrent gasifier, the final stage that the fuel stream is exposed to is a combustion zone where the most recalcitrant carbonaceous materials are simply burned away to provide heat for the preceding gasification, pyrolysis, and drying zones. The result is that only inorganic ash with small traces of unburned material remains at the gasifier ash grate. Figure 24 shows the typical appearance of ash resulting from a prototype system run, and Table 14 summarizes the mass balance for the fuel and collected ash and the resultant conversion of combustible materials. The data indicate a conversion of 99% of the combustible material in the original fuel. Furthermore, there was roughly a 10:1 reduction in volume after gasification based on the input density of the corresponding shredded fuel mixture. This reduction would potentially be higher if compared to a starting bag of low-density trash before shredding.
In order to further characterize the ash resulting from this process, a sample was submitted for TCLP analysis as required in Central Command (CENTCOM) Regulation 200-2 (1) to determine if the ash is potentially hazardous. As indicated in Table 15, leachate results for all of the VOCs and SVOCs were below the relevant detection limits, indicating that the ash would meet the CENTCOM nonhazardous classification and could be disposed of in a landfill.
Figure 24. Typical ash collection from the test fuel mixture.
37

Table 14. Normalized Mass Balance Data for Gasification of the Test Fuel Mixture Fuel Mixture In, % 100 Combustiblesa Content of Fuel, % 90.29 Recovered Ash, % 5.0 Unconverted Combustible Matter in Ash,b % 0.9 Conversion of Combustible Matter, % 99 a Sum of volatile matter and fixed carbon from fuel proximate analysis, Table 2. b Determined from ash loss-on-ignition measurement of 18%.
Table 15. TCLP Results for Gasifier Ash Sample VOCs mg/L Benzene <0.0100 2-Butanone <5.00 Carbon Tetrachloride <0.0400 Chlorobenzene <0.0200 Chloroform <0.0200 1,2-Dichloroethane <0.0200 1,1-Dichloroethene <0.0400 Tetrachloroethene <0.0200 Trichloroethene <0.0200 Vinyl Chloride <0.0200 SVOCs mg/L 1,4-Dichlorobenzene <0.0700 2,4-Dinitrotoluene <0.0700 2,4,5-Trichlorophenol <0.0700 2,4,6-Trichlorophenol <0.0700 2-Methylphenol <0.0700 Methylphenol, 3 and 4 <0.0700 Hexachlorobenzene <0.0700 Hexachlorobutadiene <0.0700 Hexachloroethane <0.0700 Nitrobenzene <0.0700 Pyridine <0.0700 Pentachlorophenol <0.0700 Total Cresols <0.0700
Task 3 – Integrated System Performance Testing
The intent of Task 3 was to complete the prototype WEC process by using the generated syngas to produce electricity in a diesel generator. As indicated in Table 7, the syngas resulting from the countercurrent gasifier was of low heating value because of its dilution with partial oxidation air during the tar-reforming process, so it was important to ascertain how it would impact engine performance.
38
During the syngas-cofiring tests, the WEC was operated at constant conditions to provide a nominally consistent amount of syngas to the generator. However, generator performance was evaluated over a load range of 50% to 117% of its rated capacity, which meant that the amount of diesel fuel consumed by the engine and the ratio of syngas to diesel energy input varied with the generator load setting. At low generator loads, the syngas supplied more of the generator’s input energy needs relative to the diesel fuel, while the converse was true at high loads.
TQG Efficiency
The range of data collected during cofiring the TQG with syngas is shown in Figure 25,
which is a plot of engine fuel consumption versus the applied generator electrical load. The diesel-only data agree well with the manufacturer’s reported fuel consumption, while the cofiring data set show a reduced fuel consumption. By assuming that the linear fit of the cofiring data represents the nominal effect of the added syngas, it appears that the syngas had an approximate fuel equivalent value of 0.8 gal/hr of diesel fuel.
The data of Figure 25 show that a significant range of variability was present for individual load set points, e.g., the measured fuel consumption varied between 0.8 and 1.7 gal/hr at the 30-kWe set point. Looking at this data set specifically in Figure 26 reveals that much of the variation can be attributed to fluctuations in the syngas energy content which is a product of the syngas quality (heating value) and its quantity (flow rate). Despite the attempt to operate under constant conditions, the composition and production rate of the syngas did vary somewhat, and these variations are reflected in the scatter of the cofiring data.
Figure 27 is a plot of the generator’s conversion efficiency (electricity out versus fuel chemical energy in) as a function of the input syngas energy fraction, including data at all generator loads. The resulting trend suggests that the generator’s conversion efficiency during syngas cofiring remained within 10% of the diesel-only baseline value for a syngas energy input fraction up to 0.5, but generally decreased when the syngas supplied a majority of the input energy. For instance, at a syngas energy input fraction of 0.8, the generator’s conversion efficiency was reduced by 30% relative to the diesel-only specification.
Reduced generator efficiency with increased syngas energy fraction was attributed to the lower energy density of the syngas–combustion air mixture compared to a diesel fuel–air mixture. From the standpoint of maintaining electrical conversion efficiency, the data of Figure 27 suggest that optimal syngas input energy fraction be maintained below roughly 0.6. These observations imply that the syngas might be better utilized if distributed over multiple generators in order to keep the energy fraction within this range, rather than concentrating syngas flow into a single unit or fewer units.
39

Figure 25. Range of TQG test conditions.
Figure 26. Sensitivity of fuel offsetting for a constant generator load of 30 kWe.
40
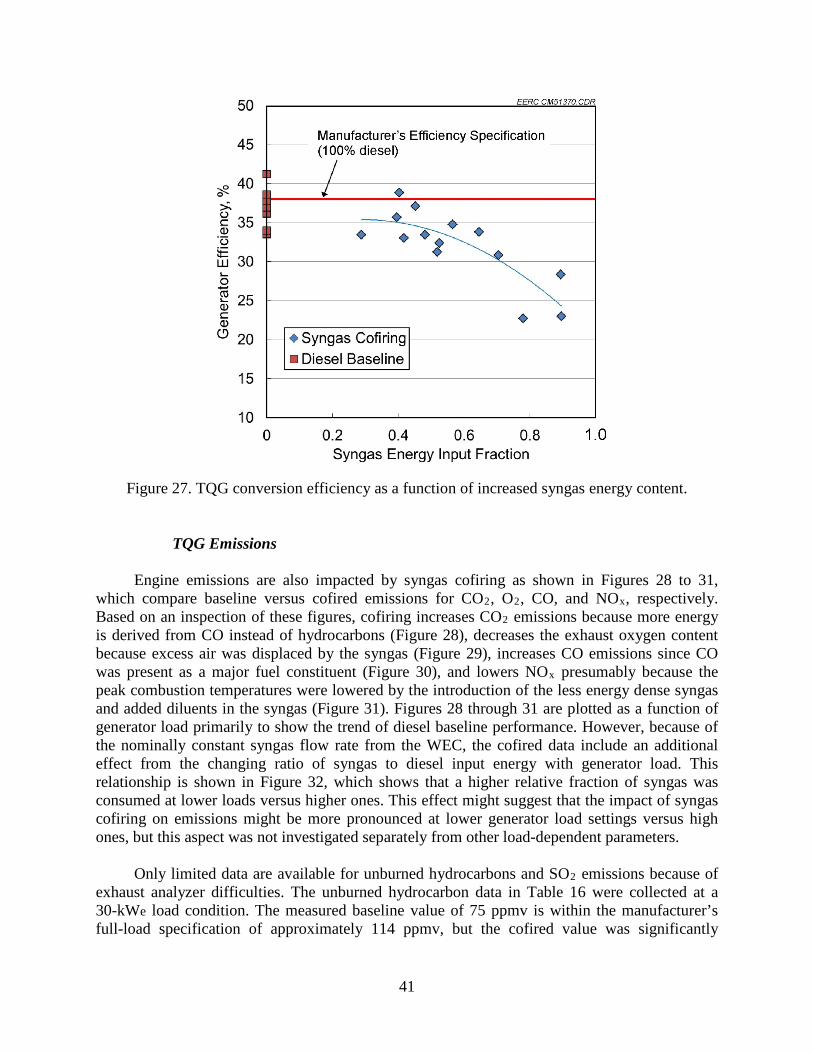
Figure 27. TQG conversion efficiency as a function of increased syngas energy content.
TQG Emissions
Engine emissions are also impacted by syngas cofiring as shown in Figures 28 to 31, which compare baseline versus cofired emissions for CO2, O2, CO, and NOx, respectively. Based on an inspection of these figures, cofiring increases CO2 emissions because more energy is derived from CO instead of hydrocarbons (Figure 28), decreases the exhaust oxygen content because excess air was displaced by the syngas (Figure 29), increases CO emissions since CO was present as a major fuel constituent (Figure 30), and lowers NOx presumably because the peak combustion temperatures were lowered by the introduction of the less energy dense syngas and added diluents in the syngas (Figure 31). Figures 28 through 31 are plotted as a function of generator load primarily to show the trend of diesel baseline performance. However, because of the nominally constant syngas flow rate from the WEC, the cofired data include an additional effect from the changing ratio of syngas to diesel input energy with generator load. This relationship is shown in Figure 32, which shows that a higher relative fraction of syngas was consumed at lower loads versus higher ones. This effect might suggest that the impact of syngas cofiring on emissions might be more pronounced at lower generator load settings versus high ones, but this aspect was not investigated separately from other load-dependent parameters.
Only limited data are available for unburned hydrocarbons and SO2 emissions because of exhaust analyzer difficulties. The unburned hydrocarbon data in Table 16 were collected at a 30-kWe load condition. The measured baseline value of 75 ppmv is within the manufacturer’s full-load specification of approximately 114 ppmv, but the cofired value was significantly
41
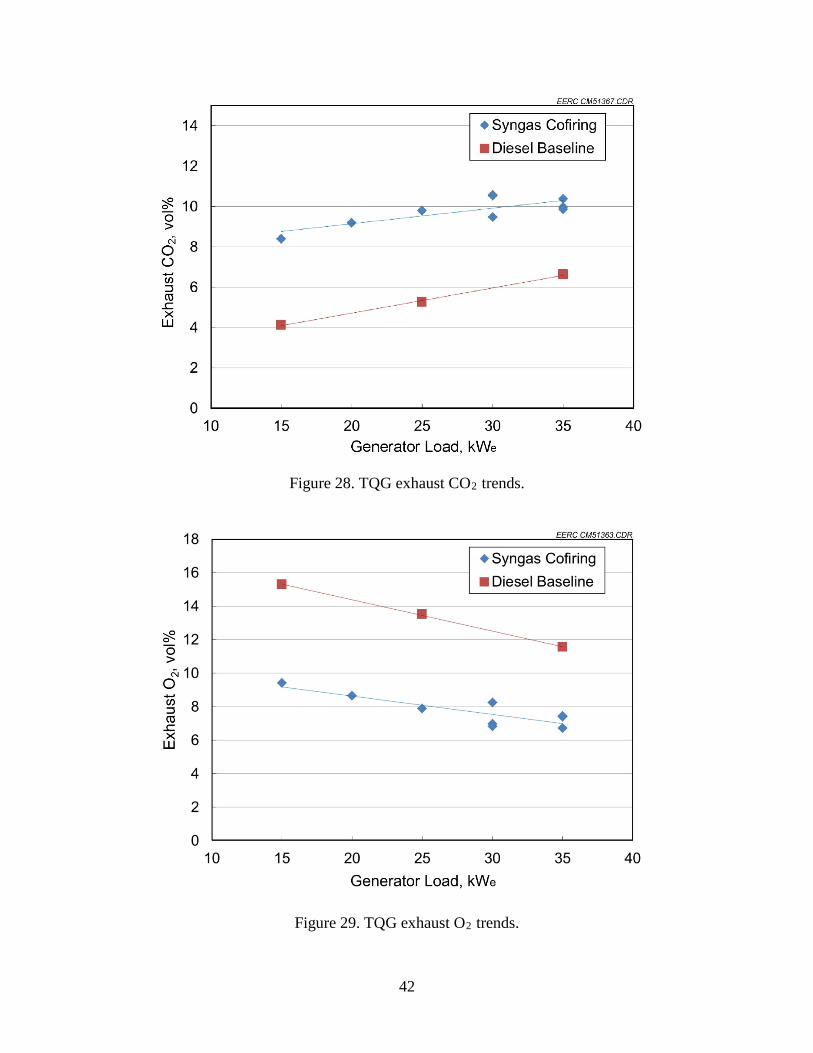
Figure 28. TQG exhaust CO2 trends.
Figure 29. TQG exhaust O2 trends.
42
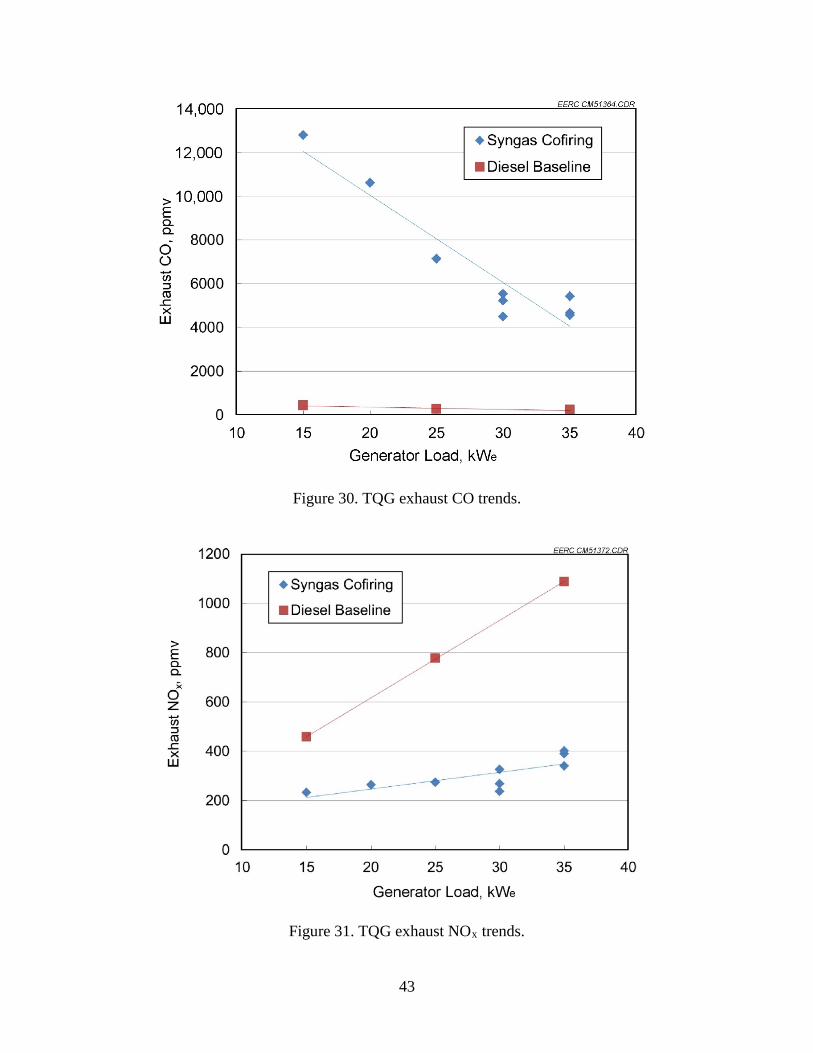
Figure 30. TQG exhaust CO trends.
Figure 31. TQG exhaust NOx trends.
43

Figure 32. Interrelation between the syngas input energy fraction and the generator load for the cofiring data of Figures 28–31.
Table 16. Generator Exhaust Unburned Hydrocarbon Emissions Manufacturer’s Reported Full-Load Hydrocarbon Emission Rate
Measured Diesel-Only Hydrocarbon Emission
Concentration at 30-kWe Load
Measured Cofired Hydrocarbon Emission
Concentration at 30-kWe Load 22 g/hr or approximately
114 ppmv 75 ppmv 2830 ppmv
higher, 2830 ppmv, possibly due to a lower combustion efficiency from the introduction of syngas.
The exhaust analyzers used during testing were able to measure the baseline diesel SO2 emissions that are shown in Figure 33, but reliable SO2 emissions measurements could not be obtained at the generator exhaust during cofiring. As a substitute, an estimate was prepared based on the upstream measurement of precursor H2S in the syngas. During the averaging period for the midmoisture fuel testing, the average H2S concentration was measured to be 214 ppmvd which agrees well with the theoretical value of 226 ppmvd that assumes all of the fuel sulfur is released into the syngas as H2S. This measured H2S value translates into a SO2 concentration of 36.3 ppmvd in the generator exhaust, and when added to the sulfur introduced by the balance of diesel fuel to meet the 30-kWe load, the total SO2 emission estimate is 52.6 ppmvd, nearly double the baseline emission as shown in Figure 33.
44
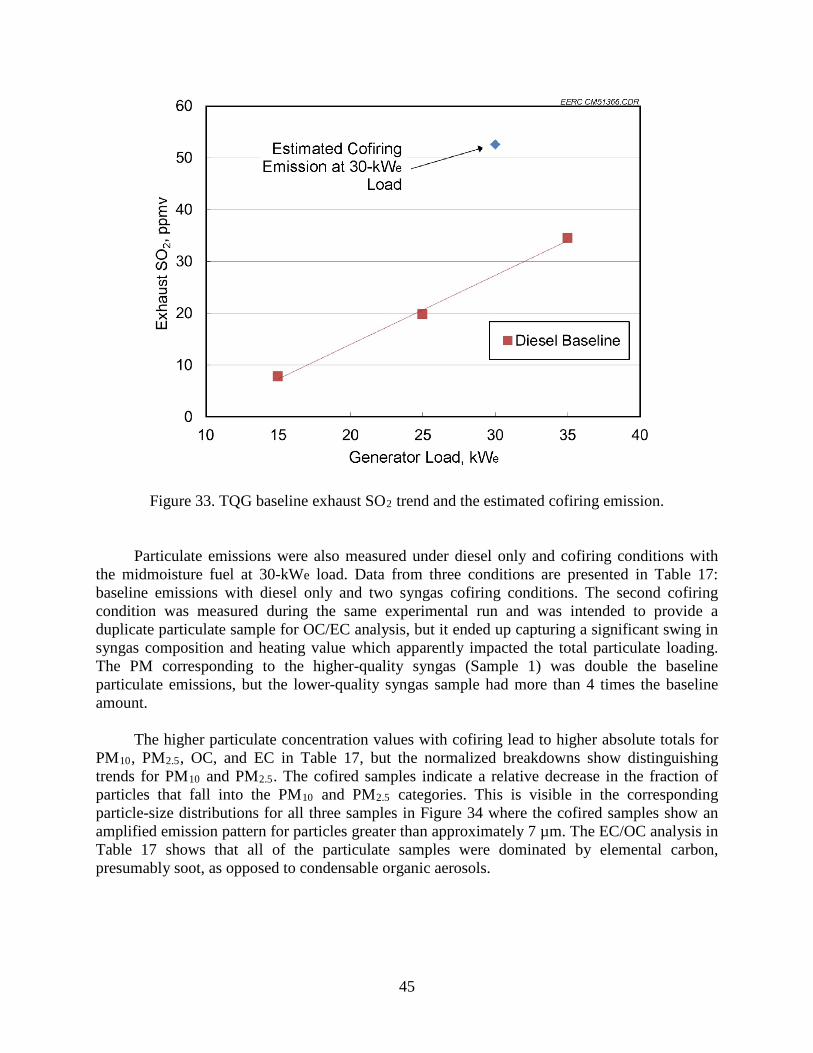
Figure 33. TQG baseline exhaust SO2 trend and the estimated cofiring emission.
Particulate emissions were also measured under diesel only and cofiring conditions with the midmoisture fuel at 30-kWe load. Data from three conditions are presented in Table 17: baseline emissions with diesel only and two syngas cofiring conditions. The second cofiring condition was measured during the same experimental run and was intended to provide a duplicate particulate sample for OC/EC analysis, but it ended up capturing a significant swing in syngas composition and heating value which apparently impacted the total particulate loading. The PM corresponding to the higher-quality syngas (Sample 1) was double the baseline particulate emissions, but the lower-quality syngas sample had more than 4 times the baseline amount.
The higher particulate concentration values with cofiring lead to higher absolute totals for PM10, PM2.5, OC, and EC in Table 17, but the normalized breakdowns show distinguishing trends for PM10 and PM2.5. The cofired samples indicate a relative decrease in the fraction of particles that fall into the PM10 and PM2.5 categories. This is visible in the corresponding particle-size distributions for all three samples in Figure 34 where the cofired samples show an amplified emission pattern for particles greater than approximately 7 µm. The EC/OC analysis in Table 17 shows that all of the particulate samples were dominated by elemental carbon, presumably soot, as opposed to condensable organic aerosols.
45

Table 17. Summary of Generator Exhaust Particulate Sampling under a 30-kWe Load Diesel-
Only Baseline
Cofiring Sample 1
Cofiring Sample 2
Corresponding Syngas Heating Value, MJ/m3 N/A 4.08 2.61 Generator Exhaust Total Particulate Loading, mg/m3 23.9 46.6 108 Subcategories PM10 Loading, mg/m3 20.9 34.0 79.2 PM2.5 Loading, mg/m3 16.3 24.7 55.2 OC Loading, mg/m3 1.17 2.89 3.78 EC Loading, mg/m3 22.7 43.7 104 Normalized Breakdown PM10, % 87.5 73.1 73.7 PM2.5, % 68.4 53.0 51.3 OC, % 4.90 6.20 3.52 EC, % 95.1 93.8 96.5
Figure 34. Comparison of particle-size distributions for the generator exhaust sampling.
46
Comparison to EPA Tier 4 Criteria
Ultimate emissions from the WEC are from the generator, and as such, the seemingly applicable emission criteria would be EPA’s Tier 4 standards for nonroad diesel engines. These standards apply to model year 2014 engines and newer. Clearly the tested TQG predated Tier 4 requirements, and according to Table 18, it would appear to fall short in all categories except for CO. However, the intent of making the comparison in Table 18 is to highlight the order(s) of magnitude reductions that would be needed to bring CO, PM, and hydrocarbon cofiring emissions down in order to approach current emission standards. Table 18. Comparison of Measured Engine Emissions with the Most Recent EPA Standards
EPA Tier 4 Standarda
Manufacturer’s Specification at
69 kWb
Baseline Diesel
Operation at 30-kWe Load
Average Cofired
Operation at 30-kWe Load
CO, g/kWh 5.0 3.19 2.96 57.0 Particulate Matter, g/kWh 0.02 N/Ac 0.230 0.448d NOx, g/kWh 0.40 14.5 11.2 3.20 NMHC,e g/kWh 0.19 0.314f 0.473 17.9 a After model year 2014 for nonroad engines between 56 and 130 kW maximum engine power. b The tested TQG’s engine was oversized relative to the generator’s stated capacity; 69 kW is the engine’s actual
full-load rating. c Not measured by the manufacturer. d Using Sample 1 particulate loading of 46.6 mg/m3. e Nonmethane hydrocarbon. f Includes a recommended factor of 0.984 to convert diesel total hydrocarbon measurements to NMHC.
Visual Inspection
Interior inspection of the generator’s turbocharger inlet and the downstream air distribution manifold were conducted near the conclusion of the cofiring tests. The collected images and video indicated no negative effects of cofiring, but it must be remembered that the operational time was relatively short and the coalescing filter upstream of the engine was highly efficient at capturing the fine soot remaining in the reformed syngas. The only obvious visual indication of syngas cofiring on the clean side of the coalescing filter was a yellowing of the coalescing filter’s clean-side surface, presumably from light tar vapors (Figure 35). However, the inspection did reveal that the engine’s interior air passages were not pristine; a possible oily film on the turbocharger and discrete black particulates in the air manifold were observed (Figure 36). Since these effects were not consistent with the appearance of the syngas coalescing filter surfaces, it was assumed that they were the result of oil aerosols from the engine’s crankcase vent which also exhausts into the turbocharger inlet.
47

Figure 35. The only obvious visual indicator of cofiring was a yellowing of the coalescing filter element, right, versus a new filter, left.
Figure 36. Images from inspection of the generator’s air inlet passages. The turbocharger inlet, left, suggests the presence of a light oily film, while the downstream engine air manifold shows
the presence of small, spherical particulates; both effects are thought to be from the engine’s crankcase vent instead of as a result of cofiring.
48

Task 4 – WEC Design Analysis
Results of the WEC design analysis are presented in two sections. The first covers the system’s physical layout, and the second examines the projected operating characteristics, including the expected burden on operating personnel.
Physical Layout
Figures 37 and 38 show the overall layout for a countercurrent WEC and associated TQGs. Detailed perspective and plan views for the WEC itself are shown in Figures 39 and 40. Key features of the proposed full-scale WEC design include the following.
• The WEC is packaged into three adjacent triple containers (TRICONs) which have the equivalent total volume of one 20-ft ISO container. TRICONs were the recommended standard unit for packaging, and the system’s interior components were arranged so that the individual TRICONs could be separated if necessary by disconnecting only piping and electrical connections.
• A powerful shredder is included to process waste during a short period of operator time
rather than an operator continuously operating a smaller capacity unit. The shredded fuel is then stored in a hopper and consumed during the course of a processing shift. The fuel bin could also be used to dry the waste using low-quality engine waste heat with the incorporation of a heating jacket.
• Preheating of the reforming catalyst is accomplished using a diesel-fired combustor in
order to improve the reliability and simplify the start-up process. The combustor will also serve to burn waste syngas in the event that the generators are bypassed.
• A high-efficiency membrane filter for particulate control follows the recuperator to
remove fine soot from the reforming process. The filter vessel was sized to hold nine 6-inch-diameter by 6-ft filter bags for an operating air-to-cloth ratio of 5 fpm. Given the relatively light soot loading, the filter is expected to operate for an extended period of time between bag cleanings. The target for bag-cleaning duration is at least the length of one shift, so that offline cleaning can be limited to start-up and any subsequent fuel bin refill.
• Sorbent beds have been included to remove acid gases and metals (primarily mercury)
using commercially available sorbents developed for hydrocarbon gas processing.
• Gas is drawn through the system using a centrifugal blower instead of a compressed air eductor. The blower is a more energy-efficient mechanism to move gas compared to the eductor, and with reliable catalyst preheating, the issues of backward flame propagation are greatly reduced.
49

Figure 37. Overall WEC layout with the maximum number of associated 60-kWe TQGs.
Figure 38. Rear view of WEC and TQG layout.
• Reformed syngas is distributed through a manifold to as many as six 60-kWe TQGs for offsetting diesel fuel consumption. Depending on the specific WEC operating conditions, this will provide each generator with 35%–50% of syngas input energy, which the experimental testing has shown to result in the maximum efficiency conversion of syngas into electricity as well as minimizing the impact to generator emissions to the extent possible.
50
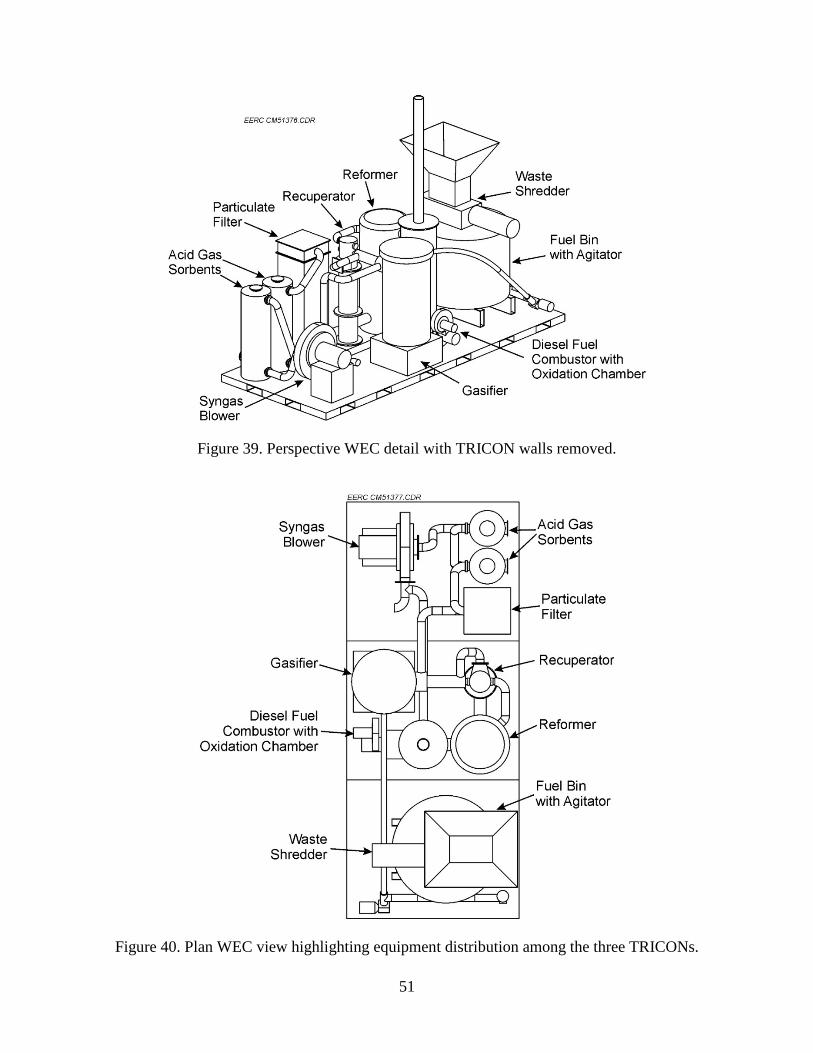
Figure 39. Perspective WEC detail with TRICON walls removed.
Figure 40. Plan WEC view highlighting equipment distribution among the three TRICONs.
51
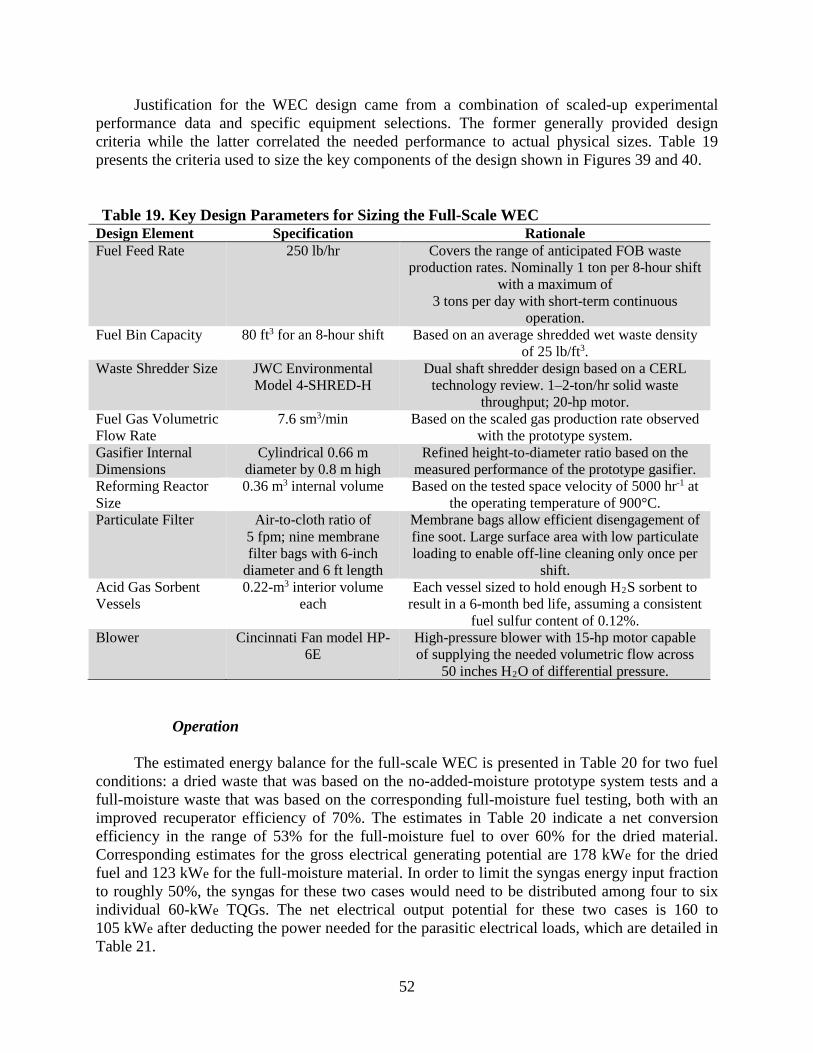
Justification for the WEC design came from a combination of scaled-up experimental performance data and specific equipment selections. The former generally provided design criteria while the latter correlated the needed performance to actual physical sizes. Table 19 presents the criteria used to size the key components of the design shown in Figures 39 and 40. Table 19. Key Design Parameters for Sizing the Full-Scale WEC
Design Element Specification Rationale Fuel Feed Rate 250 lb/hr Covers the range of anticipated FOB waste
production rates. Nominally 1 ton per 8-hour shift with a maximum of
3 tons per day with short-term continuous operation.
Fuel Bin Capacity 80 ft3 for an 8-hour shift Based on an average shredded wet waste density of 25 lb/ft3.
Waste Shredder Size JWC Environmental Model 4-SHRED-H
Dual shaft shredder design based on a CERL technology review. 1–2-ton/hr solid waste
throughput; 20-hp motor. Fuel Gas Volumetric Flow Rate
7.6 sm3/min Based on the scaled gas production rate observed with the prototype system.
Gasifier Internal Dimensions
Cylindrical 0.66 m diameter by 0.8 m high
Refined height-to-diameter ratio based on the measured performance of the prototype gasifier.
Reforming Reactor Size
0.36 m3 internal volume Based on the tested space velocity of 5000 hr-1 at the operating temperature of 900°C.
Particulate Filter Air-to-cloth ratio of 5 fpm; nine membrane filter bags with 6-inch
diameter and 6 ft length
Membrane bags allow efficient disengagement of fine soot. Large surface area with low particulate loading to enable off-line cleaning only once per
shift. Acid Gas Sorbent Vessels
0.22-m3 interior volume each
Each vessel sized to hold enough H2S sorbent to result in a 6-month bed life, assuming a consistent
fuel sulfur content of 0.12%. Blower Cincinnati Fan model HP-
6E High-pressure blower with 15-hp motor capable of supplying the needed volumetric flow across
50 inches H2O of differential pressure.
Operation
The estimated energy balance for the full-scale WEC is presented in Table 20 for two fuel conditions: a dried waste that was based on the no-added-moisture prototype system tests and a full-moisture waste that was based on the corresponding full-moisture fuel testing, both with an improved recuperator efficiency of 70%. The estimates in Table 20 indicate a net conversion efficiency in the range of 53% for the full-moisture fuel to over 60% for the dried material. Corresponding estimates for the gross electrical generating potential are 178 kWe for the dried fuel and 123 kWe for the full-moisture material. In order to limit the syngas energy input fraction to roughly 50%, the syngas for these two cases would need to be distributed among four to six individual 60-kWe TQGs. The net electrical output potential for these two cases is 160 to 105 kWe after deducting the power needed for the parasitic electrical loads, which are detailed in Table 21.
52

Table 20. Energy Summary for the Full-Scale 114 kg/hr (250 lb/hr) WEC Dried Waste Full-Moisture Waste
Fuel Feed Rate, kg/hr 114 114 Fuel Energy In, kWth 799 603 Gasifier Loss, kWth (140) (98.6) Cleanup System Loss, kWth (86.6) (91.8) Lost Sensible Energy, kWth (34.3) (39.6) Gross Syngas Output,a kWth 538 373 Parasitic Syngas for Electrical Loads, kWth (54.2) (54.2) Net Syngas Output,b kWth 484 319 Gasifier Efficiency, % 82.5 83.7 Recuperator Effectiveness, % 70.0 70.0 Gross Conversion Efficiency,a % 67.4 61.9 Net Conversion Efficiency,b % 60.6 52.9 Gross Electrical Generation,c kWe 178 123 Net Electrical Output, kWe 160 105 a Without the deduction of syngas energy to supply the parasitic electrical loads. b Includes a deduction of syngas energy for the parasitic electrical loads. c Represents the total electrical power produced before deduction of the parasitic electrical loads. Assumes 33%
generator conversion efficiency.
Table 21. Assumed Values to Estimate the Full-Scale Parasitic Electrical Energy Requirement Syngas Blower, kWe 11.2 Fuel Shredder,a kWe 1.9 Fuel Agitator and Feed Augers,b kWe 0.6 Ash Grate Drive, kWe 0.2 Control System, kWe 4 Total Electrical Load Estimate, kWe 17.9 Required Syngas Energy Assuming 33% Conversion
Efficiency in a Cofired Generator, kWth 54.2
a Average continuous power consumption, actual shredder power rating assumed to be 15 kWe. b Three motors at 0.2 kWe each.
The standard Force Provider base camp configuration includes a complement of twenty-six 60-kWe TQGs that have the potential for 1.56 MWe of electricity production. Assuming that fuel drying could be implemented using engine waste heat, the estimated net electrical output of 160 kWe in Table 20 would represent 10% of the FOB’s total generating capacity. Over an 8-hour processing shift, a WEC under these conditions would displace approximately 100 gallons of diesel fuel.
53

Daily WEC operation would follow a semicontinuous batch schedule according to the activities outlined in Table 22. The schedule was based upon multiple 8-hour waste-processing shifts so that a system rated for 250 lb/hr of waste throughput could meet the 1- to 3-ton-per-day processing requirement with one to three operating shifts a day. The individual processes outlined in Table 22 have been modeled on the practices learned during the prototype system testing under Tasks 2 and 3 and the accumulated feedback from the WEC community from sources such as SERDP interim report feedback and comments from the Joint Development Waste to Energy (JDW2E) community of interest briefings.
The daily cycle begins with a start-up process where the activities are divided into three categories: removing the residuals (ash and particulates) from the previous day’s cycle, shredding the first shift’s batch of fuel, and allowing time for the catalytic reformer to heat to operating temperature. Once these start-up tasks are completed, the gasifier is ignited, and automatic waste processing begins. With a full bin of shredded fuel, this process can last approximately 8 hours and consume 1 ton of waste materials. If processing needs to continue beyond the initial batch of waste, then a refill period is initiated where the fuel bin is refilled by shredding additional material. This refill is also an opportunity to momentarily bypass the particulate filter and clean away the accumulated soot layer through rapping or pulsing. Fuel processing continues until the fuel bin is emptied, at which time the gasifier is allowed to burn out completely to remove accumulated fuel materials within the reactor and potential tar deposits near the cool exhaust port. Table 22. Daily WEC Operation Schedule of Activities
Activity Process Hours
Operator Hours Description
Start-Up 1–3 Depending on
reformer starting
temperature
1 Operator intervention required to: Preheat reformer using diesel combustor. Shred waste to fill fuel bin. Clean particulate filters offline. Remove ash from gasifier. Light gasifier.
Automatic Waste Processing
Up to 8 0 Temperature and flow set points maintained by automatic control; minimal to no operator intervention required.
Online Fuel Bin Refill
Up to 1 Up to 1 Online refill of fuel bin to continue the current processing cycle. Operator needed to shred waste, bypass particulate filter for a clean cycle if needed, and empty the gasifier ash if needed.
Shutdown 2 0.25 Operator to bypass generators and route waste gases to the oxidation chamber. The residual heat in the gasifier is sufficient to completely burn out any residue on its own.
54

CONCLUSIONS AND RECOMMENDATIONS
Work on this project has shown that the concept of using a countercurrent gasifier coupled with a catalytic tar-reforming stage can be a viable route to meet the performance targets established for FOB WEC use. An analysis of data from the prototype testing shows that the concept could exceed the conversion efficiency target of 50% with relatively straightforward improvements to sensible heat recovery. The analysis also shows the value of incorporating waste drying using generator waste heat or other low-quality heat sources. With relatively dry waste, the WEC’s net conversion efficiency could exceed 60%, and at the scale of a Force Provider base camp, the net WEC electrical generating potential would be approximately 10% of the entire base’s generation capacity. Over an 8-hour processing shift, a WEC under these conditions would displace approximately 100 gallons of diesel fuel.
In addition to the potential for high energy conversion, this project’s testing has also substantiated the operational benefits associated with countercurrent gasification. The prototype produced a clean syngas that will minimize the frequency and severity of routine maintenance, and after passing through the system, the processed waste was fully combusted, thereby maximizing the volume reduction of the waste stream while producing a sanitized ash for ultimate disposal. Furthermore, the identified steps for routine waste processing appear to be suitable for automatic control and would conceivably only require significant user oversight at start-up and fuel loadings. The operator burden is estimated to be approximately 1 hour per 8 hours of waste processing.
Based on the state of the technology at the conclusion of this project and the projected level of performance needed for a full-scale WEC, the following topics now represent the key areas of uncertainty and should receive first consideration if continued development of this approach is pursued:
• Extended-term demonstration of core processes. While the prototype testing showed that a path exists for a countercurrent-based design, the duration of testing was too short to draw realistic conclusions about its potential long-term performance. Going forward, a longer-term demonstration is needed to evaluate issues such as catalyst lifetime, corrosion rates of high-temperature components, and generator maintenance impacts.
• Catalyst supports for rapid heatup. The daily start-up period is largely determined by the
length of time needed to bring the reforming catalyst up to operating temperature. Given the premium for on-base fuel resources, it does not seem feasible to maintain the reformer at temperature during idle periods; therefore, it will need to be designed for large and frequent temperature fluctuations. This may necessitate a switch to more durable catalyst substrates and active surfaces.
• Sustainable fine particulate collection. Tar sampling of the reformed syngas showed that
a small quantity of fine soot is present which is likely formed during the high-temperature reforming process. It might be possible to minimize soot production with a proper choice of reforming catalyst, but in reality, some form of fine particulate control will still be needed. The recommended technology for this particulate control
55

application is membrane filtration, which was factored into Task 4’s design analysis. However, the actual characteristics of using these filters are unknown and will need to be tested before finalizing a design.
• Generator emissions governing criteria. Syngas cofiring appears to negatively impact
generator emissions in terms of increased CO, unburned hydrocarbon, and particulate emissions. These effects can be minimized by improving the quality of the syngas and limiting the syngas input energy fraction for any single TQG. This approach was factored into Task 4’s design analysis but may not be sufficient if adherence to more strict standards such as EPA Tier 4 is required. In the latter case, the design philosophy may need to change, and instead of cofiring multiple standard TQGs, a WEC-specific generator with optimized engine operation and additional emission controls might need to be developed.
REFERENCES 1. U.S. Central Command. Environmental Quality, CENTCOM Contingency Environmental
Guidance; CENTCOM Regulation 200-2, MacDill Air Force Base, FL, U.S. Central Command, Sept 3, 2009.
2. Ruppert, W.H.; Bush, T.A.; Verdonik, D.P.; Geiman, J.A.; Harrison, M.A. Force Provider
Solid Waste Characterization Study; Technical Report NATICK/TR-04/017; Aug 2004. 3. Long, R.Q.; Monfort, S.M.; Arkenberg, G.B.; Matter, P.H.; Swartz, S.L. Sulfur Tolerant
Magnesium Nickel Silicate Catalyst for Reforming of Biomass Gasification Products to Syngas. Catalysts 2012, (2), 264–280.
56
APPENDIX A
NREL REPORT ON CATALYST PERFORMANCE AND REGENERATION EXPERIMENTS
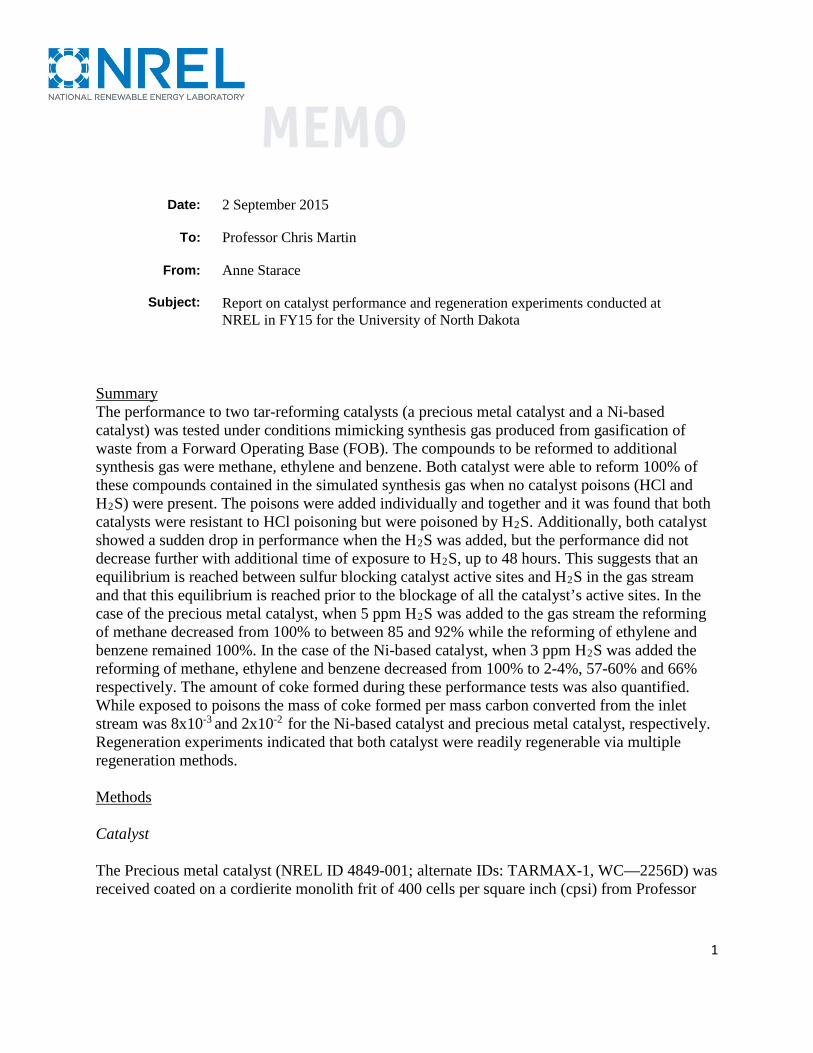
Date: 2 September 2015
To: Professor Chris Martin
From: Anne Starace
Subject: Report on catalyst performance and regeneration experiments conducted at NREL in FY15 for the University of North Dakota
Summary The performance to two tar-reforming catalysts (a precious metal catalyst and a Ni-based catalyst) was tested under conditions mimicking synthesis gas produced from gasification of waste from a Forward Operating Base (FOB). The compounds to be reformed to additional synthesis gas were methane, ethylene and benzene. Both catalyst were able to reform 100% of these compounds contained in the simulated synthesis gas when no catalyst poisons (HCl and H2S) were present. The poisons were added individually and together and it was found that both catalysts were resistant to HCl poisoning but were poisoned by H2S. Additionally, both catalyst showed a sudden drop in performance when the H2S was added, but the performance did not decrease further with additional time of exposure to H2S, up to 48 hours. This suggests that an equilibrium is reached between sulfur blocking catalyst active sites and H2S in the gas stream and that this equilibrium is reached prior to the blockage of all the catalyst’s active sites. In the case of the precious metal catalyst, when 5 ppm H2S was added to the gas stream the reforming of methane decreased from 100% to between 85 and 92% while the reforming of ethylene and benzene remained 100%. In the case of the Ni-based catalyst, when 3 ppm H2S was added the reforming of methane, ethylene and benzene decreased from 100% to 2-4%, 57-60% and 66% respectively. The amount of coke formed during these performance tests was also quantified. While exposed to poisons the mass of coke formed per mass carbon converted from the inlet stream was 8x10⁻³ and 2x10⁻² for the Ni-based catalyst and precious metal catalyst, respectively. Regeneration experiments indicated that both catalyst were readily regenerable via multiple regeneration methods. Methods Catalyst The Precious metal catalyst (NREL ID 4849-001; alternate IDs: TARMAX-1, WC—2256D) was received coated on a cordierite monolith frit of 400 cells per square inch (cpsi) from Professor
1

Chris Martin at the University of North Dakota. The Ni, Mg catalyst (NREL ID 4849-013) was made at NREL by dissolving nickel nitrate hexahydrate and magnesium nitrate hexahydrate in ethanol then placing the solution and the 400 cpsi cordierite monolith frit (Applied Ceramics) in a Roto-Torque and rotating under a flow of nitrogen to slowly and evenly coat the monolith in the metal salts while the ethanol evaporated. The catalyst was then calcined in air at 650°C for 3 hours. Catalyst lifetime and regeneration testing Catalyst performance, lifetime and regeneration tests were performed in a micro activity test system (MATS) reactor at 850°C. Samples are placed in a quartz tube reactor within a tube furnace. Gases are passed over the catalyst and the composition of the exit gas stream is measured with gas chromatography (GC) and mass spectrometry (MS). All gases except water are metered into the reactor via mass flow controllers. Water is metered through an Eldex Optos pump and then heated to the vapor phase prior to entering the reactor. The exit gas is passed through a condenser, drier and particle filter before being analyzed with an Agilent 490 micro GC with a MS5A (molsieve 5 angstroms) and a PPQ (PoraPLOT Q) column sampling every 4 minutes and a MKS Cirrus MS scanning up to 80 amu every 26 seconds. In this work catalysts were subject to each of the regeneration and reforming steps described in Table 1. The catalysts were heated to 850°C in the MATS reactor under a flow of nitrogen with 8% hydrogen at a rate of 10°C/minute. Table 23: Incoming gas composition for each step used in MATS tests of simulated synthesis gas tar reforming
step ID A-1 A-2 B C D E X Y
step description
regen. steam
regen. hydrogen
reforming with no poison
reforming with H2S and HCl
reforming with HCl
reforming with H2S inert flush regen.
oxidizing
species volume percent N2* 33.20% 61.60% 41.30% 41.30% 41.30% 41.30% 100.00% 90.00% HCl 0.0000% 0.0000% 0.0000% 0.0020% 0.0020% 0.0000% 0.0000% 0.0000% H2S 0.0000% 0.0000% 0.0000% 0.0005% 0.0000% 0.0005% 0.0000% 0.0000% H2 0.00% 10.00% 15.88% 15.88% 15.88% 15.88% 0.00% 0.00%
CH4 0.00% 0.00% 4.83% 4.83% 4.83% 4.83% 0.00% 0.00% C2H4 0.00% 0.00% 1.92% 1.92% 1.92% 1.92% 0.00% 0.00% CO 0.00% 0.00% 15.90% 15.90% 15.90% 15.90% 0.00% 0.00% CO2 0.00% 0.00% 8.15% 8.15% 8.15% 8.15% 0.00% 0.00% He 0.00% 28.40% 0.00% 0.00% 0.00% 0.00% 0.00% 0.00%
zero air 0.00% 0.00% 0.00% 0.00% 0.00% 0.00% 0.00% 10.00% water 66.80% 0.00% 12.00% 12.00% 12.00% 12.00% 0.00% 0.00%
benzene 0.0000% 0.0000% 0.0168% 0.0168% 0.0168% 0.0168% 0.0000% 0.0000%
* does not include nitrogen in zero air
2

Values for percent conversion were normalized to 138 mg catalyst sample (the mode monolith mass) and a total gas flow of 250 sccm (the total gas flow mode). Quantification of coke deposited on catalysts Following five experiments ending with reforming, the amount of coke deposited on both the catalyst and rector walls was quantified by an oxidation step (step Y: regeneration: oxidation in Table 1). During oxidation for the purpose of measuring the amount of deposited coke, the MS sensitivity was decreased and the scan range was decreased so that each scan would finish in three seconds to increase the time resolution in the integration of the CO2 signal. AC type activated carbon from Barnebey & Sutcliffe which contain a maximum of 5 weight percent moisture and 5 weight % ash were used to verify the quantitation of this method, which resulted in a carbon mass balance ranging from 90-108%. Results and Discussion Catalyst performance and lifetime tests In these experiments catalysts were regenerated via steam, then hydrogen. Then their reforming performance with no poisons present was measured for half an hour followed by the introduction of H2S and HCl poisons. A summary of the reforming performance of the catalyst in each experiment is given in Table 2. A short experiment using the cordierite monolith frit with no catalyst showed some catalytic activity with no poisons but no catalytic activity (zero percent conversion of methane, ethylene, and benzene) when poisons are present. Thus, any catalytic activity in the presence of poisons was due to the catalyst and not the catalyst support.
Both the Ni, Mg catalyst and the precious metal catalyst provide 100% conversion of methane, ethylene and benzene when no poisons are present. When 5 ppm of hydrogen sulfide is introduced, the precious metal catalyst retained 100% conversion of ethylene and benzene while its conversion of methane dropped to 81-92%. The change in performance of the Ni, Mg catalyst upon the introduction of 5 ppm H2S was more drastic—benzene conversion dropped to around 66%, ethylene conversion dropped to 57-70% and methane conversion dropped to 2-4%.
3
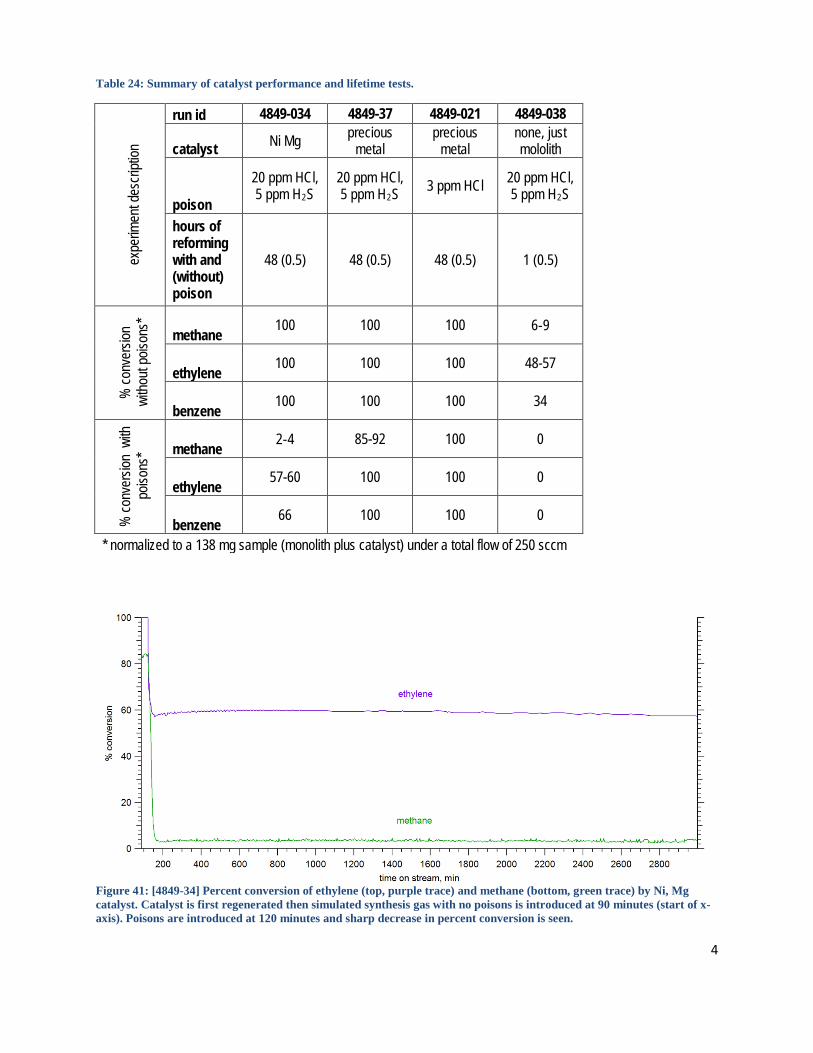
Table 24: Summary of catalyst performance and lifetime tests.
expe
rimen
t des
cripti
on
run id 4849-034 4849-37 4849-021 4849-038
catalyst Ni Mg precious metal
precious metal
none, just mololith
poison
20 ppm HCl, 5 ppm H2S
20 ppm HCl, 5 ppm H2S 3 ppm HCl 20 ppm HCl,
5 ppm H2S
hours of reforming with and (without) poison
48 (0.5) 48 (0.5) 48 (0.5) 1 (0.5)
% co
nver
sion
witho
ut po
isons
*
methane 100 100 100 6‐9
ethylene 100 100 100 48-57
benzene 100 100 100 34
% co
nver
sion
with
poiso
ns* methane 2‐4 85-92 100 0
ethylene 57-60 100 100 0
benzene 66 100 100 0
* normalized to a 138 mg sample (monolith plus catalyst) under a total flow of 250 sccm
Figure 41: [4849-34] Percent conversion of ethylene (top, purple trace) and methane (bottom, green trace) by Ni, Mg catalyst. Catalyst is first regenerated then simulated synthesis gas with no poisons is introduced at 90 minutes (start of x-axis). Poisons are introduced at 120 minutes and sharp decrease in percent conversion is seen.
4
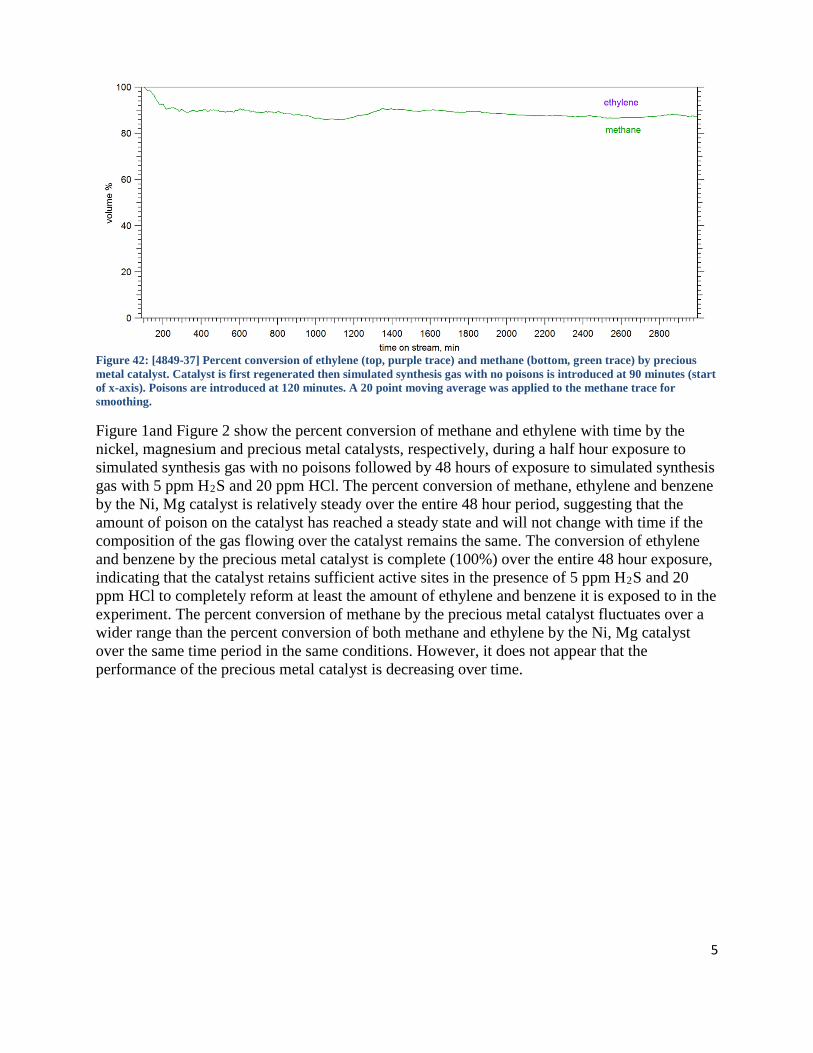
Figure 42: [4849-37] Percent conversion of ethylene (top, purple trace) and methane (bottom, green trace) by precious metal catalyst. Catalyst is first regenerated then simulated synthesis gas with no poisons is introduced at 90 minutes (start of x-axis). Poisons are introduced at 120 minutes. A 20 point moving average was applied to the methane trace for smoothing.
Figure 1and Figure 2 show the percent conversion of methane and ethylene with time by the nickel, magnesium and precious metal catalysts, respectively, during a half hour exposure to simulated synthesis gas with no poisons followed by 48 hours of exposure to simulated synthesis gas with 5 ppm H2S and 20 ppm HCl. The percent conversion of methane, ethylene and benzene by the Ni, Mg catalyst is relatively steady over the entire 48 hour period, suggesting that the amount of poison on the catalyst has reached a steady state and will not change with time if the composition of the gas flowing over the catalyst remains the same. The conversion of ethylene and benzene by the precious metal catalyst is complete (100%) over the entire 48 hour exposure, indicating that the catalyst retains sufficient active sites in the presence of 5 ppm H2S and 20 ppm HCl to completely reform at least the amount of ethylene and benzene it is exposed to in the experiment. The percent conversion of methane by the precious metal catalyst fluctuates over a wider range than the percent conversion of both methane and ethylene by the Ni, Mg catalyst over the same time period in the same conditions. However, it does not appear that the performance of the precious metal catalyst is decreasing over time.
5

Table 25: Summary of amount of coke (deposited carbon) during catalyst performance and lifetime experiments
expe
rimen
t des
cripti
on run id 4849-034 4849-037 4849-021 4849-038
catalyst Ni Mg precious metal
precious metal
none, just monolith
poison 20 ppm
HCl, 5 ppm H2S
20 ppm HCl, 5 ppm
H2S 3 ppm HCl
20 ppm HCl, 5 ppm
H2S hours of reforming with and (without) poison
48 (0.5) 48 (0.5) 48 (0.5) 1 (0.5)
cokin
g
mg deposited carbon 6.7 33.6 7 3
mg deposited carbon per mg frit per hour
8.5E-04 4.8E-03 6.3E-04 1.4E-02
mg deposited carbon/total mg carbon passed through reactor
1.4E-03 7.2E-03 6.1E-04 2.1E-02
mg deposited carbon/total mg converted
7.9E-03 2.1E-02 1.6E-03 3.8E-01
Table 3 shows the amount of deposited carbon (AKA coke) from each of the experiments summarized in Table 2. The amount of coke has been normalized to the mg of monolith per hour exposure to simulated synthesis gas, the total amount of carbon passed through the reactor and the total amount of carbon that has been converted by the catalyst. Unsurprisingly, the bare cordierite monolith frit forms the most coke. Comparing the precious metal catalyst ran with both H2S and HCl with the precious metal catalyst ran with just HCl, we see that the presence of hydrogen sulfide causes more coke formation, even when adjusting for the lower overall conversion of the carbon species. Less coke is formed by the Ni, Mg catalyst than by the precious metal catalyst under exposure to both hydrogen sulfide and hydrogen chloride. ICP analysis of sulfur retained on catalyst after experiment for select experiments Table 26: Amount of sulfur on monolith (reported in ppm relative to total mass of monolith) measured with ICP
catalyst precious metal Ni, Mg precious
metal Ni, Mg precious metal Ni, Mg precious
metal last 3 steps none none B-C-Y B-C-Y B-C-Y B-C-X B-C-X
hours per step unused catalyst
unused catalyst
0.5-17.25-0.66 0.5-48-0.66 0.5-48-0.66 0.5-0.5-1 1‐1‐1
ppm sulfur BDL BDL BDL BDL BDL 279 165 standard deviation NA NA NA NA NA 4.868 6.154
detection limit, ppm 66 65 197 153 157 65 59
6

In the case of the Ni, Mg catalyst, flushing with inert after reforming with poisons leaves a larger amount of sulfur on the surface than does oxidizing after reforming with poisons. The same may be true for the precious metal catalyst, but it is not clear from this data since the detection limit for the runs that were oxidized is higher than the amount measured with the inert flush. Comparing the Ni, Mg catalyst and precious metal catalyst which both experienced an inert flush only after reforming, the Ni, Mg catalyst had more sulfur absorbed on the surface even though it experienced reforming with poisons for half the time than the precious metal catalyst did. Catalyst regeneration In the case of the precious metal catalyst and the Ni-based catalyst, catalytic activity lost due to sulfur poisoning is regained when the hydrogen sulfide is removed from the incoming gas stream. Experiments where the catalyst was flushed with inert gas after poisoning (see Appendix page 7) indicate this is not due to Le Chatelier’s principal, as the flushing with inert gas did not regenerate the catalyst. Instead, the removal of the poison allowed the regenerative gasses in the incoming simulated dirty synthesis gas stream (H2, H2O, CH4 and CO) to regenerate the catalyst. In the case of the precious metal catalyst, the activity is regenerated within several minutes of the removal of the poison. However, in the case of the Ni, Mg catalyst, regeneration in the presence of synthesis gas with no poisons takes longer than eight hours (see Appendix page 13). A designated regeneration step can be used to reduce the time it takes to regenerate the Ni, Mg catalyst. Additionally, it is advantageous to use the least amount of hydrogen possible when regenerating the catalyst, as hydrogen is a desirable product. Looking at Figure 3 and Table 6, one can see that if only hydrogen is used to regenerate the catalyst, 3 hydrogen atoms are required for each poisoned site that is regenerated. By using other regeneration pathways, the amount of hydrogen consumed can be reduced. To better isolate the regeneration mechanism, subsequent experiments were performed with steam reforming of methane (SRM). This removes hydrogen and carbon monoxide as a possible regenerating molecule that can alter the catalyst’s performance in the time between when the gases are switched from regeneration to reforming to when the first gas chromatogram is collected. The additional steps and their gas compositions used in the regeneration tests are shown in Table 5.
7

Table 27: Incoming gas compositions of additional steps used for regeneration testing
step SRM SRMP CH4 CO
description
steam reforming
of methane
steam reforming
of methane with
poisons
methane regeneration
carbon monoxide
regeneration
species volume percent
N2 82.80% 82.80% 94.80% 0.00% HCl 0.0000% 0.0020% 0.00% 0.00% H2S 0.0000% 0.0006% 0.00% 0.00% H2 0.00% 0.00% 0.00% 0.00% HC4 5.20% 5.20% 5.20% 0.00% C2H4 0.00% 0.00% 0.00% 0.00% CO 0.00% 0.00% 0.00% 5.20% CO2 0.00% 0.00% 0.00% 0.00% He 0.00% 0.00% 0.00% 0.00% zero air 0.00% 0.00% 0.00% 0.00% water 12.00% 12.00% 0.00% 0.00%
Figure 43: Schematic diagram of catalyst regeneration mechanisms. M signifies an active metal site on the catalyst surface. M-H signifies a protonated active site (the desired state). M- , M-S and M-O signify empty, sulfur-poisoned and oxidized active sites, respectively.
8
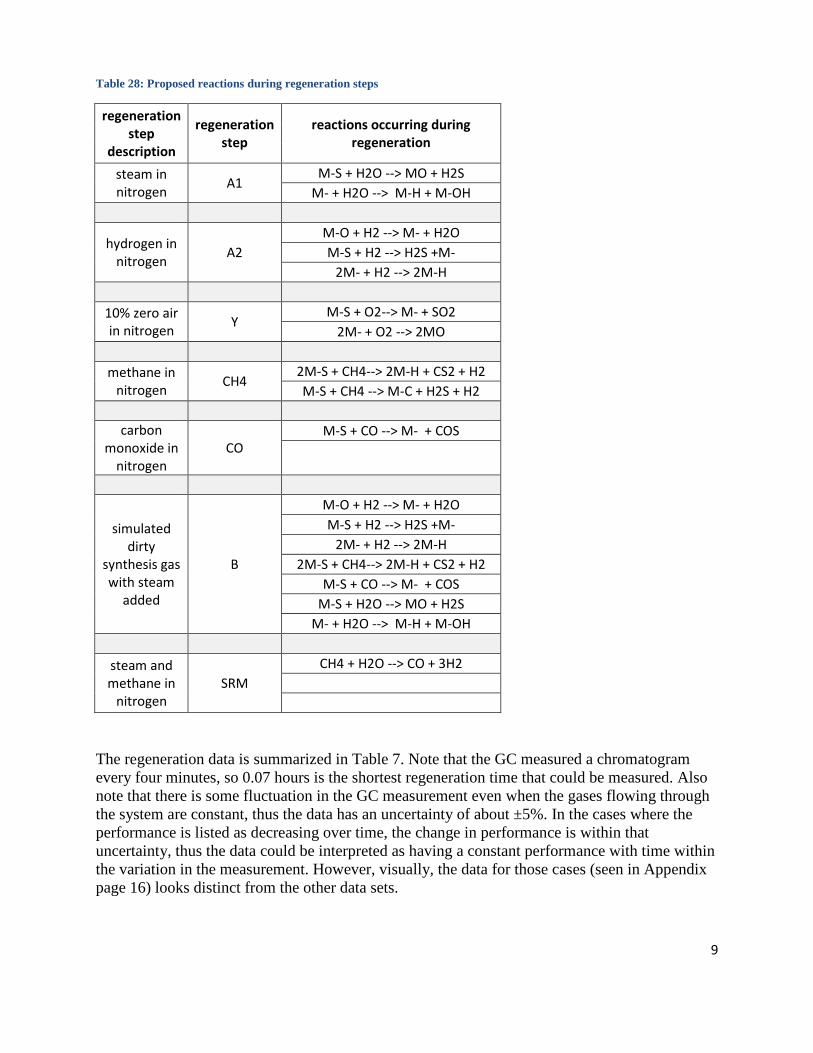
Table 28: Proposed reactions during regeneration steps
regeneration step
description
regeneration step
reactions occurring during regeneration
steam in nitrogen A1
M-S + H2O --> MO + H2S M- + H2O --> M-H + M-OH
hydrogen in nitrogen A2
M-O + H2 --> M- + H2O M-S + H2 --> H2S +M-
2M- + H2 --> 2M-H 10% zero air in nitrogen Y
M-S + O2--> M- + SO2 2M- + O2 --> 2MO
methane in
nitrogen CH4 2M-S + CH4--> 2M-H + CS2 + H2 M-S + CH4 --> M-C + H2S + H2
carbon
monoxide in nitrogen
CO M-S + CO --> M- + COS
simulated dirty
synthesis gas with steam
added
B
M-O + H2 --> M- + H2O M-S + H2 --> H2S +M-
2M- + H2 --> 2M-H 2M-S + CH4--> 2M-H + CS2 + H2
M-S + CO --> M- + COS M-S + H2O --> MO + H2S
M- + H2O --> M-H + M-OH
steam and methane in
nitrogen SRM
CH4 + H2O --> CO + 3H2
The regeneration data is summarized in Table 7. Note that the GC measured a chromatogram every four minutes, so 0.07 hours is the shortest regeneration time that could be measured. Also note that there is some fluctuation in the GC measurement even when the gases flowing through the system are constant, thus the data has an uncertainty of about ±5%. In the cases where the performance is listed as decreasing over time, the change in performance is within that uncertainty, thus the data could be interpreted as having a constant performance with time within the variation in the measurement. However, visually, the data for those cases (seen in Appendix page 16) looks distinct from the other data sets.
9

From the summarized results in Table 7 and the data presented in the appendix one can draw the following conclusions. Once the catalyst is oxidized, hydrogen or CO is required to complete the regeneration. When the catalyst is poisoned with sulfur, hydrogen and methane are the only regeneration gases that can restore the catalyst to its M-H state without the presence of any other gases, however other regeneration gases can be used in combination or sequence to achieve the conversion form M-S to M-H. Using methane only as the regeneration step resulted in 100% recovery when the catalyst when the catalyst was exposed to methane for 60 or 30 minutes, but only 92% recovery when the regeneration duration was only 15 minutes. Exposure to CO followed by steam completely regenerates the catalyst from sulfur poisoning. The suggested mechanism for this is that the CO removes the sulfur by forming COS and the steam subsequently protonates the bare active site. However, when the sulfur-poisoned catalyst is exposed to carbon monoxide followed by exposure to methane, the performance of the catalyst is not completely regenerated. This suggests that the methane is more efficient at protonating M-S sites than M- sites. When the sulfur-poisoned catalyst is exposed to carbon monoxide followed by steam reforming of methane, the performance of the catalyst is less than the performance when the sulfur poisoned- catalyst is used for steam reforming of methane. We have found that the performance of the catalysts studied here does not decrease when carbon is deposited as a byproduct of tar reforming (coking). However, in applications where coking is problematic, it is of interest to determine the mechanism of regeneration from methane, whether the sulfur is carried off as CS2, producing no coke, or if it is removed as H2S and leaving carbon on the surface.
10
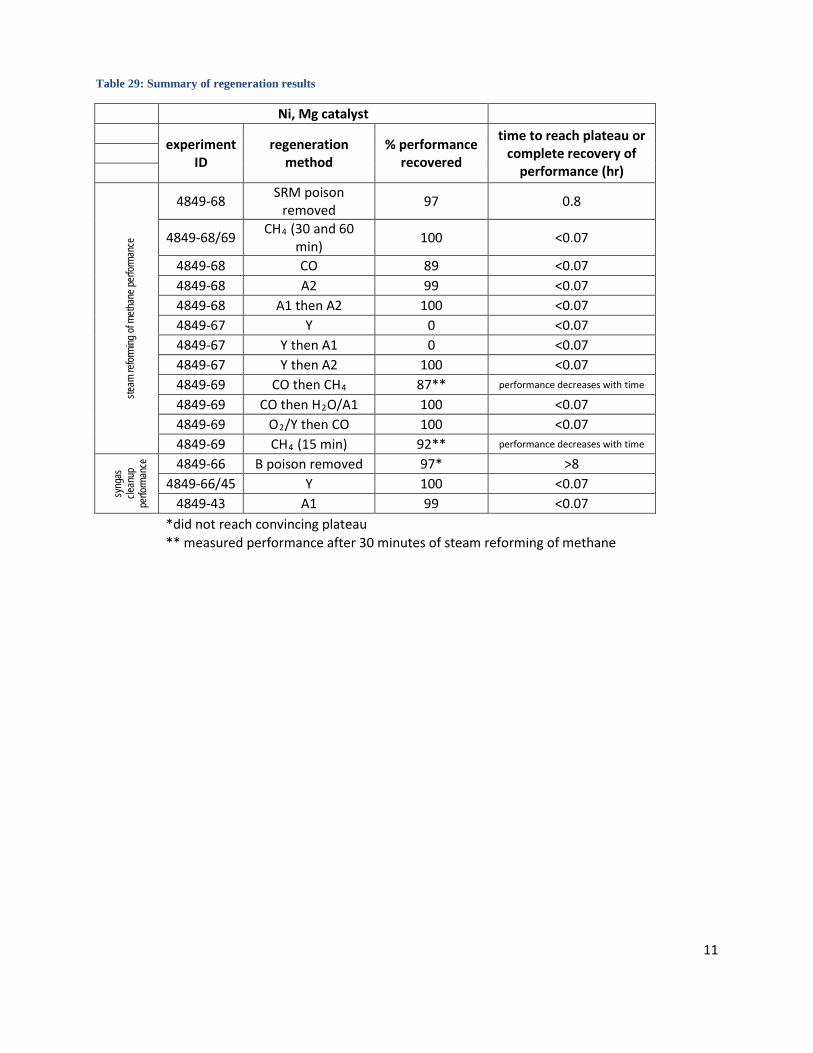
Table 29: Summary of regeneration results
Ni, Mg catalyst
experiment ID
regeneration method
% performance recovered
time to reach plateau or complete recovery of
performance (hr)
steam
refor
ming
of m
ethan
e per
forma
nce
4849-68 SRM poison removed 97 0.8
4849-68/69 CH4 (30 and 60 min) 100 <0.07
4849-68 CO 89 <0.07 4849-68 A2 99 <0.07 4849-68 A1 then A2 100 <0.07 4849-67 Y 0 <0.07 4849-67 Y then A1 0 <0.07 4849-67 Y then A2 100 <0.07 4849-69 CO then CH4 87** performance decreases with time
4849-69 CO then H2O/A1 100 <0.07 4849-69 O2/Y then CO 100 <0.07 4849-69 CH4 (15 min) 92** performance decreases with time
syng
as
clean
up
perfo
rman
ce
4849-66 B poison removed 97* >8 4849-66/45 Y 100 <0.07
4849-43 A1 99 <0.07
*did not reach convincing plateau
** measured performance after 30 minutes of steam reforming of methane
11