final performance evaluation of the ensure development
TRANSCRIPT

March 2020 | Volume I
IMPEL | Implementer-Led Evaluation & Learning Associate Award
Final Performance Evaluation of the ENSURE
Development Food Assistance Program in Zimbabwe
ABOUT IMPEL
The Implementer-Led Evaluation & Learning Associate Award works to improve the design and implementation of Food for Peace (FFP)
funded development food security activities (DFSAs) through implementer-led evaluations and knowledge sharing. Funded by the USAID
Office of Food for Peace (FFP), the Implementer-Led Evaluation & Learning Associate Award will gather information and knowledge in
order to measure performance of DFSAs, strengthen accountability, and improve guidance and policy. This information will help the food
security community of practice and USAID to design projects and modify existing projects in ways that bolster performance, efficiency and
effectiveness. The Implementer-Led Evaluation & Learning Associate Award is a two-year activity (2019-2021) implemented by Save the
Children (lead), TANGO International, and Tulane University in Haiti, the Democratic Republic of Congo, Madagascar, Malawi, Nepal, and
Zimbabwe.
RECOMMENDED CITATION
IMPEL. (2020). Final Performance Evaluation of the ENSURE Development Food Assistance Program in Zimbabwe (Vol. 1). Washington, DC:
The Implementer-Led Evaluation and Learning Associate Award
PHOTO CREDITS
Jeanne Downen. ENSURE-supported community garden in Chimanimani district.
DISCLAIMER
This report is made possible by the generous support of the American people through the United States Agency for International
Development (USAID). The contents are the responsibility of the Implementer-Led Evaluation & Learning (IMPEL) award and do not
necessarily reflect the views of USAID or the United States Government.
CONTACT INFORMATION
IDEAL Activity
c/o Save the Children
899 North Capitol Street NE, Suite #900
Washington, DC 20002
www.fsnnetwork.org
Prepared by:
Final Performance Evaluation of the ENSURE DFAP in Zimbabwe
Acknowledgments i
Acknowledgments
The members of the final evaluation team would like to gratefully acknowledge the support provided by the staff of the ENSURE program. Special thanks go to Richard Ndou, Chief of Party, and Jammaine Jimu, M&E Coordinator for ENSURE, for their ongoing support throughout the final evaluation process. We also want to thank all of the field staff from ENSURE at district and ward offices, and the implementing partners who went out of their way to provide logistical support to enable the team to implement an intensive schedule over a relatively short period of time. We also greatly appreciated the time they set aside for discussions with the qualitative survey team and their insightful observations into the project and its implementation challenges. We also wish to thank the many program participants who took time to talk openly about their experiences with the ENSURE project. Their perceptive responses regarding the challenges they face in their lives, and the stimulating discussions we had with them about the ways in which ENSURE helped to improve the quality of their lives, provided invaluable information.
We also thank our partner Jimat Development Consultants, including Munhamo Chisvo, Gideon Gavera, and in particular Tinashe Sande, who provided invaluable assistance in organizing the staff, training, and logistics for the quantitative and qualitative surveys. In addition, our thanks go out to Deveria Banda, Arnold Damba, Jacob Kandayi, Munjira Mutambwa, Lazarus Mutizwa, Tasiana Nyadzayo, and Mikiri Shingirai, and to independent survey monitor Kuziwa Makamanzi.
The qualitative team wishes to acknowledge the excellent support of our field assistants: Edmore Chikazhe, Tichaona Chivero, Ropafadzo Alice Gavera, Confidence Mandikutse, Hermton Ngwenya, Memory Takavarasha, and Renias Tasaranarwo.
Behind the scenes at TANGO HQ we have appreciated the guidance and support of Mark Langworthy, Monica Mueller, Elizabeth Cuellar, Lynn Michalopoulos, Stephanie Martin, and Carrie Presnall.
Finally, we appreciate the guidance and interest from USAID Food for Peace Washington in this project: Arif Rashid and Adam Trowbridge.
Hopefully, we've listened well, our observations are grounded in reality, our assessment is accurate, and our recommendations will be useful.
Sincerely,
Jeanne Downen, TANGO International (Team Leader)
Dr. Suzanne Nelson, Agronomist, TANGO International
Dr. Daniel Kibuuka Musoke, International Research Consortium
George Nhunhama, Independent Consultant

IMPEL | Implementer-Led Evaluation and Learning
ii Table of Contents
Table of Contents
Acknowledgments ............................................................................................................................. i Table of Contents ............................................................................................................................... ii Figures .............................................................................................................................................. iii Tables ............................................................................................................................................... iv Acronyms .......................................................................................................................................... v Executive Summary .......................................................................................................................... vii 1. Introduction ................................................................................................................................1
1.1 Program Background ........................................................................................................................ 1 1.2 Theory of Change ............................................................................................................................. 2
2. Evaluation Overview ......................................................................................................................4 2.1 Evaluation Purpose ........................................................................................................................... 4 2.2 Evaluation Questions ........................................................................................................................ 5
3. Evaluation Methods .....................................................................................................................7 3.1 Quantitative Data Collection ............................................................................................................ 7
Overview .......................................................................................................................................... 7 Population-Based Survey Design ..................................................................................................... 7 Data Analysis .................................................................................................................................... 8 Sample Weights ............................................................................................................................. 10
3.2. Qualitative Data Collection ............................................................................................................ 11 Overview ........................................................................................................................................ 11 Evaluation Team ............................................................................................................................ 11 Sample Design ................................................................................................................................ 12 Methods ......................................................................................................................................... 12 Analysis, Coding and Interpretation Methods ............................................................................... 13
3.3 Integration of Quantitative and Qualitative Findings..................................................................... 13 3.4 Limitations ...................................................................................................................................... 14
4. Evaluation Findings .................................................................................................................... 16 4.1 Targeting ......................................................................................................................................... 16 4.2 SO1: Nutrition among women of reproductive age and children under 5 years improved .......... 17
Results ............................................................................................................................................ 17 IR 1.1 - Consumption of nutritious foods improved ...................................................................... 17 IR 1.2 - Prevalence of diarrhea in children under 5 reduced ......................................................... 21 WASH ............................................................................................................................................. 22 Gender Equitable Participation and Leadership ............................................................................ 24
4.3 SO2: Household Income Increased ................................................................................................. 25 Results ............................................................................................................................................ 25 IR 2.1 – Agricultural productivity and production increased ......................................................... 26 IR 2.2 Increased revenue from targeted value chains ................................................................... 28 IR 2.3 Household income increased ............................................................................................... 34
4.4 SO3: Resilience to Food Insecurity of Communities Improved ...................................................... 35 Results ............................................................................................................................................ 35 IR 3.1 Community disaster management and preparedness capacities improved ....................... 37 IR 3.2 Access to and management of disaster risk and mitigation assets improved ..................... 38
4.5 Unintended Outcomes ................................................................................................................... 40 4.6 Factors Contributing to Outcomes ................................................................................................. 40

Final Performance Evaluation of the ENSURE DFAP in Zimbabwe
Table of Contents iii
Integration of Interventions........................................................................................................... 40 Care Group Model and SBCC ......................................................................................................... 42 Capacity Building of Communities ................................................................................................. 43 Market Systems Approach ............................................................................................................. 43 National Economic Context ........................................................................................................... 43
4.7 Contribution of Activities to Mitigation, Adaptation to, and Recovery from Food Security Shocks and Stresses .......................................................................................................................................... 44 4.8 Beneficiary Satisfaction .................................................................................................................. 44 4.9 Coordination ................................................................................................................................... 45 4.10 Gender Considerations ................................................................................................................. 46 4.11 Environmental Considerations ..................................................................................................... 50 4.12 Sustainability ................................................................................................................................ 51 4.13 Lessons Learned ........................................................................................................................... 54
Care Groups ................................................................................................................................... 54 Inclusion of Men in MCH Interventions ......................................................................................... 54 Additional Lessons ......................................................................................................................... 55
5. Recommendations ..................................................................................................................... 57 Annex A: References ........................................................................................................................ 59 Annex B: Evaluation Statement of Work ........................................................................................... 61 Annex C: Training, Data Collection, and Quality Assurance ................................................................ 83 Annex D: Imputing Missing Data ....................................................................................................... 87 Annex E: List of Interviews and Focus Groups ................................................................................... 89 Annex F: Comparison of Baseline and Endline Indicators – ENSURE ................................................... 93 Annex G: Analysis of “Adequacy” Indicators ................................................................................... 101 Annex H: Supplementary Tables ..................................................................................................... 104 Annex I: Multiple Regression Analysis............................................................................................. 106 Annex J: Comparison of Participants and Non-Participants .............................................................. 110
Volume II Annexes:
Annex K: Data Collection Instruments
Annex L: Disclosure of Conflicts of Interest
Figures
Figure 1: Average Household Dietary Diversity Score (HDDS) .................................................................... 18 Figure 2: Prevalence of underweight, stunting, or wasting of CU5 at baseline and endline...................... 19 Figure 3: Child feeding practices and dietary diversity ............................................................................... 19 Figure 4: Timing of first ANC visit by women at baseline and endline (ENSURE) ....................................... 20 Figure 5: ENSURE WASH indicators at baseline and endline ...................................................................... 23 Figure 6: Mean depth of poverty at baseline (corrected) and endline (using the TPCPDL, USD 2014) ..... 26 Figure 7: Percentage of farmers using sustainable agriculture (crop, livestock, NRM) practices in the 12 months prior to the baseline and to the endline ........................................................................................ 27 Figure 8: Percentage of farmers who practiced value chain activities promoted by the project in the past 12 months ................................................................................................................................................... 29 Figure 9: Percentage of farmers who used financial services in the past 12 months ................................ 34 Figure 10: Per capita daily expenditures (USD 2014) ................................................................................. 34

IMPEL | Implementer-Led Evaluation and Learning
iv Table of Contents
Figure 11: Percentage of households with moderate or severe hunger (HHS) .......................................... 36 Figure 12: Percentage of households with poor, borderline, or adequate Food Consumption Score at baseline (2014) and endline (2019) ............................................................................................................ 36 Figure 13: Women’s adequacy of ownership in assets, adequacy of decision-making about assets, and adequacy in decision on credit ................................................................................................................... 47 Figure 14: Men’s adequacy of ownership in assets, adequacy of decision-making about assets, and adequacy in decision on credit ................................................................................................................... 48 Figure 15: FEWSNET seasonal calendar and critical events timeline for Zimbabwe .................................. 62
Tables
Table 1: Primary evaluation questions and methods ................................................................................... 5 Table 2: Information used to compute sample size...................................................................................... 8 Table 3: ENSURE endline indicators .............................................................................................................. 9 Table 4: Survey response rates ENSURE ..................................................................................................... 10 Table 5: Personnel employed for Zimbabwe quantitative survey training and data collection ................. 83 Table 6: Per capita daily consumption: expenditures over a 30-day period (2014 USD) ........................... 88 Table 7: Key informants interviewed .......................................................................................................... 89 Table 8: Summary data for focus groups conducted .................................................................................. 91 Table 9: Asset ownership and joint decision-making on assets and credit .............................................. 103 Table 10. Stunting, underweight, and wasting in CU5 (ENSURE) ............................................................. 104 Table 11. Baseline-endline comparison of household sanitation and drinking water, sanitation facility, source and treatment of drinking water (ENSURE) ...................................................................... 105 Table 12: Regression results for use of financial services and adoption of sustainable crop practices ... 107 Table 13: Regression results for child nutritional variables, underweight and stunting of CU5 .............. 108 Table 14: Regression results for household food security status (adequate food security based on FCS) ............................................................................................................................................ 109

Final Performance Evaluation of the ENSURE DFAP in Zimbabwe
Acronyms v
Acronyms
ABBS Annual beneficiary-based survey AMC Asset Management Committee ANC Antenatal care BCC Behavior change communication BL Baseline CARE Cooperative for Assistance and Relief Everywhere CBDRM Community-based disaster risk management CSI Coping Strategies Index CU5 Children under the age of 5 DDF District Development Fund DFAP Development Food Assistance Program DFSA Development Food Security Activity DMC Disaster Management Committee DRR Disaster risk reduction EA Enumeration area EL Endline ENSURE Enhancing Nutrition, Stepping Up Resilience and Enterprise EQ Evaluation Question EW Early warning FaaB Farming as a Business FCS Food Consumption Score FEWS NET Famine Early Warning System Network FFA Food for Assets FFP Food for Peace FGD Focus Group Discussion FY Fiscal Year HDDS Household Dietary Diversity Score HH Household HHS Household Hunger Scale ICRISAT International Crop Research Institute for Semi-Arid Tropics IEC Information, Education and Communication IGA Income-generating activity IP Implementing Partner IPTT Indicator Performance Tracking Table IR Intermediate Result IYCF Infant and Young Child Feeding KII Key informant interview LOA Life of Agreement MAD Minimum Acceptable Diet MCH Maternal and child health MoHCC Ministry of Health and Child Care MoWACSME Ministry of Women Affairs, Community, Small and Medium Enterprise NOP National Organic Producer NRM Natural resource management ODF Open-defecation-free

IMPEL | Implementer-Led Evaluation and Learning
vi Acronyms
ODK Open Data Kit ORT Oral rehydration therapy P4P Purchase for Progress PBS Population-based survey PLW Pregnant and lactating women PMG Producer and marketing group SAA Social analysis and action SAFIRE Southern Alliance for Indigenous Resources SBCC Social behavior change communication SNV Stichting Nederlandse Vrijwilligers (“Foundation of Netherlands
Volunteers”) SO Strategic objective TANGO Technical Assistance to Non-Governmental Organizations ToC Theory of change TPCPDL Total per capita poverty datum line USAID U.S. Agency for International Development USD United States dollar VHW Village health worker VS&L Village Savings and Loan/Lending WASH Water, sanitation and hygiene WDDS Women’s Dietary Diversity Score WHO World Health Organization WRA WUA
Women of reproductive age Water User Associations
VPM Village Pump Mechanic Z$ Zimbabwe dollar

Final Performance Evaluation of the ENSURE DFAP in Zimbabwe
Executive Summary vii
Executive Summary
Evaluation Purpose and Evaluation Questions
The purpose of this final evaluation is to measure the performance and development outcomes of the Enhancing Nutrition, Stepping Up Resilience and Enterprise (ENSURE) project, a Development Food Assistance Program implemented in Zimbabwe and funded by the United States Agency for International Development (USAID) Office of Food for Peace (FFP). It is designed as the second step in a two‐part mixed methods evaluation, following the baseline at the beginning of the program. The primary audience of this report is the awardee, World Vision, and its partners. Findings from the final evaluation will be used to inform and shape future food security projects. The specific objectives of the final evaluation are:
1. Determine the endline values of key impact and outcome-level indicators—disaggregated by awardee, age, and sex as appropriate— in addition to endline values of demographics in target areas and appropriate independent variables;
2. Conduct bivariate and multivariate analyses of impact and outcome indicators with independent variables identified for inclusion in the survey as appropriate, with results provided by awardee and the overall Title II country program area;
3. Gather qualitative data to ground‐truth survey data and provide contextual information on the overall food insecurity and malnutrition situation; and
4. Assess progress toward end‐of‐program targets for impact and outcome indicators.
This evaluation was framed by a set of primary evaluation questions centered on impact, beneficiary satisfaction, relevance, effectiveness, coordination, and sustainability and replicability of project interventions. The main evaluation questions are: 1) To what extent has the project met its defined goals, purposes and outcomes? 2) How satisfied were beneficiaries with the program? 3) How sustainable are the program’s outcomes? 4) How well were gender and environmental considerations integrated into the program? 5) What lessons can be learned to inform future FFP and USAID Title II projects in Zimbabwe?
Project Background
Zimbabwe is rich in human and natural resources. However, for decades it has experienced food insecurity and poverty rooted in recurrent drought, economic instability, and policy decisions that severely undercut economic growth, agricultural production, and employment opportunities. The most affected people are those living in rural, drought-prone areas of the country. The difficult conditions have fueled migration for employment, a contraction of the informal economy, a decline in health and social services, an increase in child stunting and burdens on women, and an increase in food insecurity and malnutrition. Zimbabwe is increasingly subject to low and unreliable rainfall, high temperatures, cyclones, and floods. Hyperinflation, increasing prices for food and basic goods, a national cash shortage, and credit restrictions have been significant challenges to ENSURE activities and participants over the course of the project.
The ENSURE project goal was to increase long-term food security among chronically food insecure rural households in 66 wards in six districts of Manicaland and Masvingo provinces, where food insecurity and stunting are higher than the national average. ENSURE’s main activities were to: 1) improve nutrition among women of reproductive age and children under five years of age (CU5), 2) increase the income of vulnerable households, and 3) improve household resilience. Promoting gender equity in decision-making, access to financial services, and participation in project activities were cross-cutting priorities, as were environmental protection and disaster risk reduction. ENSURE's approach, captured in its theory of change, was to address underlying causes of food insecurity through expanded knowledge, increased

IMPEL | Implementer-Led Evaluation and Learning
viii Executive Summary
capacity, improved means of producing food and income, and access to savings, coupled with building community assets that provide greater resilience to disasters and environmental degradation.
Methodology
The ENSURE final evaluation consisted of a population-based survey (PBS) (May-June 2019) of 1,360 households that gathered data on FFP indicators in the six project districts and a qualitative study (August-September 2019). The statistically representative PBS sample was selected using a multi-stage clustered sampling approach. The quantitative analysis follows a pre-post design to track statistically significant changes in indicators from the 2014 baseline to the end of project.
The purpose of the qualitative study was to provide the empirical basis for an interpretation of the quantitative outcomes, to better understand why a set of indicators had changed over the course of project implementation. It also sought to understand participant and staff perceptions of the project, the constraints to change, and the dynamics of household decision-making with regard to project interventions. The qualitative study used topical outlines structured along the evaluation questions to guide the interviews. A purposive sample of wards and villages was created, based on maximizing coverage of project activities and on logistical feasibility. The final dataset was comprised of 46 focus group discussions with 498 project participants and 80 key informant interviews conducted in four of ENSURE’s operational districts. The integrated analysis synthesizes quantitative and qualitative data, along with other information sources.
Some limitations to the methodology were: i) parts of several survey questions were skipped in three modules; consequently analysts used baseline data to impute the missing data and estimate values where necessary; ii) the ongoing currency crisis makes comparison over time of monetary indicators difficult, and iii) a difference in seasonal timing between baseline and endline quantitative surveys may contribute to differences in some of the indicator estimates.
Findings and Conclusions
ENSURE has been highly successful in achieving its objectives in a very challenging economic and environmental context. It is seen by government and key stakeholders as well managed and well implemented, and participants acknowledged the positive changes brought about by the application of the training and skills received. Even in the face of multiple challenges, and quantitative data that showed little evidence of progress for some indicators at the population level, the qualitative survey showed gains among project participants in health and nutrition, agricultural and livestock production, incomes, community assets, community disaster preparedness and early warning, community management, and linkages with local government.
SO1: NUTRITION AMONG WOMEN OF REPRODUCTIVE AGE AND CHILDREN UNDER FIVE YEARS
IMPROVED
Women’s and children’s health showed improvement in some critical areas. At endline, almost half of pregnant women had their first antenatal care visit within the first four months of pregnancy, a significant improvement from baseline. The prevalence of underweight women decreased slightly. Interviews with project participants and health workers confirmed that the health and nutrition of mothers and children under two (CU2) improved, and many households are able to purchase more nutritious foods with income from the Village Savings and Loan (VS&L) and small enterprise activities. Project participants credited the Care Group model for their increased nutrition knowledge and practice,

Final Performance Evaluation of the ENSURE DFAP in Zimbabwe
Executive Summary ix
in part because it reached out to key decision-makers on health and nutrition in the family - men, grandmothers, and mothers-in-law. The food distributions brought people into the health facilities, where they could access a range of services. Challenges to the nutrition activities included inadequate supervision of Care Group sessions, sharing of rations targeted to CU2 when there were other children in the household, and limited project coverage in each district, which limited the impact on the larger population.
There were significant improvements in the prevalence of underweight and stunted children under the ENSURE project. Stunting in CU5 fell from 28.1 percent at baseline to 19.6 percent at endline. Exclusive breastfeeding for children under six months of age increased by 24.7 percentage points from baseline to 60.5 percent at endline. Other child nutritional indicators did not show a statistically significant change from baseline to endline. Since dietary diversity scores and measures of stress and coping are very responsive to seasonality and context, the lack of change may reflect the difficult economic and environmental situation at the time of the survey. By contrast, anthropometric indicators such as stunting are not as responsive to immediate circumstances and give a better idea of the general trend over time. The gains in children’s health are positive considering the difficult conditions during the life of the project.
Water, hygiene and sanitation activities were designed to support improved health and nutrition. ENSURE participants acknowledged that the knowledge and skills acquired through ENSURE's community training sessions contributed to their changed behaviors. The Community Health Clubs played a key role, helping community members to identify, analyze, and improve health practices and behaviors. Four of the six basic WASH practices promoted by ENSURE showed statistically significant improvement, with the largest gain in the safe storage of drinking water. Over half of all households are using an improved source of drinking water. Although the endline showed no statistically significant change in the percentage of households using improved sanitation facilities, the evaluation team observed good hygiene practices and many well-constructed latrines built under ENSURE. Community water management groups are ensuring that water points function, though many communities did not get access to safe water as planned due to problems obtaining official permission to blast for boreholes.
SO2: HOUSEHOLD INCOME INCREASED
The endline survey results reflect the environmental and economic hardships in Zimbabwe over the five years of the project. There was no change in poverty between baseline and endline. Per capita daily expenditures decreased and most households in the survey area were further below the national poverty line at endline than at baseline.
SO2 sought to improve household production and market access as a means of increasing income and food security. ENSURE’s approach was to strengthen knowledge and skills in dryland crop production and to create Food for Assets-supported irrigation works to support crop and livestock production, irrigate vegetable and fruit gardens, and provide water for domestic use. ENSURE promoted five value chains—sorghum, beans, groundnuts, indigenous poultry and goats—centered around the formation of producer and marketing groups. SO2 also supported the formation of village savings and lending groups that provide women in particular access to loans and capital for income-generating activities.
Results under SO2 were also affected by successive years of drought that dramatically reduced harvests and by Cyclone Idai in March 2019, which shifted the focus of many farmers from production to recovery. The endline survey results showed that half of all farmers had adopted sustainable agricultural practices promoted by ENSURE while participant-specific data indicate that nearly three-quarters of ENSURE farmers had done so, and project monitoring data show strong achievement in the adoption of

IMPEL | Implementer-Led Evaluation and Learning
x Executive Summary
nearly all improved practices and technologies. Natural resource management and improved storage practices declined among the survey population. Endline survey results also showed that while over three-quarters of farmers in the ENSURE implementation area were engaged in one or more value chains, there was no change in the percentage of farmers who practiced value chain activities promoted by ENSURE.
Focus group and key informant discussions with ENSURE participants presented a more successful picture than the endline data. While ENSURE participants voiced their concern about the difficult and worsening conditions, they stated that their agricultural productivity had improved as a result of the skills and resources acquired under the project. The sorghum value chain promotion, linked with the World Food Programme’s pilot Purchase for Progress initiative, was particularly successful in improving production and increasing sales. Women credited their participation in poultry and goat value chains for a significant increase in their income, and most poultry producer groups reported that they had reliable markets. A partnership with Metbank and National Organic Produce to provide loans and a market for poultry production was initially successful until inflation caused the loan program to be suspended. The goat value chain was hampered by a lack of capital among participants to build sustainable herds and limited market access. The production of a new variety of bio-fortified bean was seen as quite successful by participants, who have secured a large national food company as a dedicated buyer. When drought made some value chains less viable, the project shifted to a market-systems approach to support people’s efforts to diversify into non-farm enterprises and promote resilience. To complement increased production, ENSURE facilitated expanded access to market information, and though price volatility, inflation, and poor communications infrastructure remain problematic, farmers have established communications with their new markets through information platforms such as WhatsApp.
The village savings and lending component of ENSURE has proved highly successful and has contributed financially to activities in all three strategic objectives. Financial literacy increased, and over one quarter of farmers were using financial services by the endline. Nearly the same percentage of male and female farmers used financial services, but the increase was larger among female farmers. The savings and lending groups have enabled women to earn interest on their savings and to obtain loans, many for the first time. Women have invested this money in a wide range of small businesses, in their children’s education, and in home improvements. The VS&L groups face challenges as hyperinflation erodes the value of their savings, and most groups reported making adjustments to preserve value, such as converting their cash to material goods or to foreign exchange.
SO 3: RESILIENCE TO FOOD INSECURITY OF COMMUNITIES IMPROVED
The endline survey results show that food insecurity intensified, consistent with the increasing hardships in Zimbabwe. The prevalence of moderate to severe hunger increased, though ENSURE households experienced less hunger than those that did not participate in the project. The majority of respondents in the qualitative study said that they are more food secure now, despite the shocks, especially those households that have access to irrigated community gardens and water for livestock. Farmers said that due to drought they harvested only about half of their crop, but before ENSURE they would have harvested nothing.
As part of its resilience strategy, ENSURE supported the organization of community-based committees that have increased community capacity to identify, anticipate and mitigate risks, better manage their natural resource base, and improve food security. Activities focused on disaster preparedness, early warning information; resource management and disaster risk reduction; participatory community disaster reduction plans; and asset management. Food for Assets was used to build or rehabilitate community assets and specifically included the most vulnerable households. ENSURE’s strategy of

Final Performance Evaluation of the ENSURE DFAP in Zimbabwe
Executive Summary xi
reactivating and strengthening community-based Disaster Management Committees was successful in awareness-raising, creating community plans, and fostering a strong sense of community ownership of disaster management and early warning activities. The value of the committees was demonstrated by their dissemination of early warning messages in advance of Cyclone Idai, and their subsequent assistance to government civil protection workers after the disaster. Women’s access to early warning information increased, and while remote communities still face communication problems, they are able to use WhatsApp and other platforms to receive more timely information.
The collaborative management of community assets was strengthened through the organization of multiple community-level committees to manage dams, natural resources, and the local watershed. This contributed to increased crop and livestock production and improved food security and income among project participants, particularly those with access to the community gardens. The dams are substantial structures, and while communities contribute to maintenance, they need strong links to and additional support from government to enhance their sustainability, particularly to meet the cost of major repairs.
GENDER
Endline survey results show a decrease in women’s adequacy around ownership of assets, decisions on credit, and decision-making about assets, along with a decrease in men’s adequacy for the first two indicators. The decrease in adequacy can likely be attributed to the economic and environmental challenges confronting women and men, in addition to traditional barriers to asset ownership and credit for women. By contrast, project participants reported that ENSURE’s initiatives to promote gender equity messages, facilitate the creation of VS&Ls and productive income-generating activities for women, and support the inclusion of women in community decision-making committees have created a powerful platform for women’s active participation in in their communities. Men and women reported significant changes in behavior and greater gender equity in household labor and decision-making, and a reduction in gender-based violence. Men’s fora in particular were cited as an effective way to provide a safe place for men to learn about positive behaviors that benefit the entire family. Finally, the qualitative study showed a major change in self-perception among women, as women now see themselves as leaders in their communities.
SUSTAINABILITY
One of ENSURE’s strengths was its focus on knowledge and skill acquisition rather than a large amount of material inputs. Both participants and government officials felt that participants’ newly acquired skills had increased their capacity to independently continue activities in agricultural production, health and nutrition, savings groups, water management and other areas. Project participants displayed good knowledge of project activities, their purpose, and how different activities form synergies that reinforce their overall effectiveness. The majority of communities visited by the qualitative team voiced confidence in their ability to continue their activities and are highly motivated to do so because they have seen the benefits of their work, though they acknowledge it will be more difficult after project support ends. Several communities felt strongly that unrealized access to water remains a critical challenge to their future success. The project has worked closely with communities to establish strong linkages with government offices, local service providers, and the private sector. These links will help communities to access local resources and technical support in the future, although likely at reduced levels. At the time of the qualitative study, there were positive indications of sustainability: the Ministry of Health and Child Care has adopted the Care Group methodology and was providing support to existing groups, VS&Ls continued to operate despite difficult economic conditions, and community disaster response committees worked with government civil protection units. ENSURE committee
IMPEL | Implementer-Led Evaluation and Learning
xii Executive Summary
leaders are now participating in ward-level meetings and planning sessions, and ENSURE groups have been incorporated into Ward Development Committees. At a national level, the government ministry responsible for women’s and community affairs adopted ENSURE’s package of gender tools and committed to using the approach. In addition, as part of a two-year cost extension, ENSURE has prioritized further strengthening community partnerships with government technical services and with private-sector input suppliers, buyers, and microfinance institutions to ensure sustainability.
Recommendations
R1: Maximize integration of program activities to enhance health and nutrition gains and strengthen community resilience. ENSURE’s success stems in part from the highly integrated nature of its implementation. For example, the integration of SO1 health and nutrition and SO2 agriculture interventions supported gains in maternal and child nutrition and health practices; the development of irrigation schemes under SO3 supported increased agricultural production and income under SO2, which improved food availability and access for improved child nutritional status. Future programs that use multiple interventions to improve food security should emphasize integration and complementarity, where relevant, to amplify and strengthen the impact of any one intervention.
R2: Make longer-term investments. The five-year timeframe of DFAPs is often not long enough to realize sustained progress, or to capture it by quantitative measurement. In some cases, misalignment of start-up activities and agricultural cycles means that some agricultural outcomes are not realized until the second or third year of implementation. Additionally, factors outside the program’s control (e.g., disasters, macro-economic conditions) can have negative impacts on activities. USAID should continue to invest in ENSURE program areas to strengthen the sustainable impact of its investments to date.
R3: Design M&E systems to better capture impact. The disparity between the population-based results and annual beneficiary-based results suggests that, at least under some circumstances, project impact may be better captured at the participant level—at least in a funding-limited context. Although more expensive, an impact evaluation including a control group provides the best measure of results that can be attributed to the program. As noted in R2, the timeframe needed for certain impacts to be measurable by quantitative means also supports the idea of focusing on participant outcomes, as spill-over effects on the larger population often require more time.
R4: Ensure that the Care Group model cascade strategy is adequately supported and supervised. The Ministry of Health and Child Care has begun to roll out the Care Group methodology in non-ENSURE wards using evidence of effectiveness from ENSURE. To support a more strategic approach for scale-up, rigorous evidence on the following is needed: i) the causal impact of the Care Group model on maternal and child health outcomes; ii) the cost-benefit of scaling up the Care Group model compared to other standard care models; iii) innovative approaches for enhancing adolescent and young mother participation in Care Groups or similar cascade models; and iv) how mobile health applications can be used to enhance the efficiency and effectiveness of the Care Group model. In addition, high-quality supervision and ensuring the messages are not diluted in a cascade model are key to effectiveness; research on how to ensure the effectiveness of these dimensions of cascade models is also needed.
R5. Use social behavior change communication (SBCC) to enhance project integration. ENSURE addressed social and behavior change challenges around infant and young child feeding practices. Changing behaviors requires understanding current practices and barriers and motivations for new practices. SBCC interventions should apply a holistic approach, using communications to motivate change along with other project activities to influence behaviors. Use formative research to inform

Final Performance Evaluation of the ENSURE DFAP in Zimbabwe
Executive Summary xiii
technology transfer and skills development activities and address the social norms that influence the selection of crops, land use patterns, and agronomic practices.
R6. Use formative research to identify the barriers and facilitators to improved dietary diversity. Formative research on motivations underpinning improved production practices should inform a communications strategy for promoting new foods or dietary practices. Such research should also consider the impact of adverse economic conditions on diets and identify ways to help people overcome this challenge.
R7. Link community-based committees to government agencies to strengthen sustainability. AMCs oversee the use and upkeep of assets built by ENSURE participants. The committees are important to the sustainability of new assets, but need additional support in management, maintenance, and financing. Stronger linkages should be facilitated between AMCs and government technical services, such as the Environmental Management Agency and the District Development Fund for dams, to strengthen the AMCs sustainability and their ability to pay for asset maintenance.
R8. Use a responsive and flexible approach to adapt to contextual changes. In Zimbabwe’s dynamic environment, projects should continually monitor contextual factors to inform adaptive programming and to be responsive to participants’ own ideas and needs. This approach was used in ENSURE’s shift from a strict value-chain approach to a market-systems approach under SO2, in order to give farmers greater scope to diversify into non-farm income-generating activities.

Final Performance Evaluation of the ENSURE DFAP in Zimbabwe
Introduction 1
1. Introduction
1.1 Program Background
Context: Zimbabwe is a land of great potential with abundant natural resources, good infrastructure, high literacy rates, and rich in human capital. However, for decades it has suffered from food insecurity and poverty, rooted in recurring drought and irregular rainfall, economic instability, hyperinflation, and political decisions have that truncated economic growth and agricultural production. Formal employment opportunities are scarce, the business and industry sector has undergone a severe contraction, and most people must generate income in the informal sector.
Macroeconomic changes, including inflation and increasing prices, a national cash shortage, changes in the legal currency and credit restrictions have had a significant effect on ENSURE activities over the course of the project. During the time of the qualitative study, mobile money and electronic payment were widespread due to the non-availability of bank notes. While this provided a short-term solution to a shortage of cash, a government tax on money transfers further reduced the income of program participants (World Vision Zimbabwe, ENSURE ARR FY 2019). Hyperinflation created a challenge to otherwise successful VS&Ls, who found their ability to provide loans for small enterprises and the purchase of agricultural and other inputs much reduced.
In addition to macroeconomic challenges, Zimbabwe is increasingly subject to environmental challenges including drought, low and unreliable rainfall, uncharacteristically high temperatures, and floods. This has reduced harvests and resulted in the death of large numbers of livestock, as well as increased prices for food and decreased income from the sale of animals. Widespread drought, erratic rainfall, and dry spells in 2015, 2016, and 2017 had a significant negative impact on food security in Manicaland and Masvingo provinces and prompted an emergency food assistance response in 2016-2017. Cyclone Idai in March 2019 affected over a quarter of a million people in five of the ENSURE districts, causing floods, crop losses, and extensive damage. Thus, ENSURE project activities have had to confront both climatic and man-made challenges during all of its years of operation. Despite the difficult environment, the small-scale agriculture and livestock sector targeted by ENSURE remains a critical source of livelihoods for much of Zimbabwe’s rural population.
Project goals and objectives: In FY13, the United States Agency of International Development’s (USAID) Office of Food for Peace (FFP) awarded World Vision and partners a five-year Title II project in Zimbabwe (2013 – 2018, with a two-year cost extension to 2020). The project, named Enhancing Nutrition, Stepping Up Resiliency and Enterprise (ENSURE) was implemented in Manicaland and Masvingo provinces. It was led by World Vision in collaboration with three implementing partners—CARE, Foundation of Netherlands Volunteers (SNV), Southern Alliance for Indigenous Resources (SAFIRE)—and one service provider, the International Crops Research Institute for the Semi-Arid Tropics (ICRISAT). The ENSURE project targeted chronically food insecure rural households in 66 wards in six districts of Manicaland and Masvingo provinces where food insecurity was higher than the national average. The project has three strategic objectives (SOs):
SO1: Nutrition among women of reproductive age and children under 5 years improved. SO1 focuses on improving material and child nutrition by promoting behavior change to improve health, nutrition, and water and sanitation practices, and provides a protective supplementary food distribution. SO1 has a strong focus on gender through gender dialogues that examine social and cultural barriers to gender equity, promote the sharing of labor and decision-making in households, and create an enabling environment for women to take up leadership roles in the community.

IMPEL | Implementer-Led Evaluation and Learning
2 Introduction
SO2: Household income increased. SO2 promotes increased agricultural productivity and production through training to farmers on agronomy (including climate change mitigation strategies), livestock, and business skills. Training was complemented with Food for Assets (FFA)-supported infrastructure that provided water for agriculture and livestock and stronger links to local markets. These activities were strengthened by the organization of Village Savings and Loan/Lending (VS&L) associations that improved women and men’s access to financial capital for agricultural and livestock production and income-generating activities (IGAs).
SO3: Resilience to food insecurity of communities improved. SO3 strengthens the ability of communities to prepare for and respond to shocks and stresses—particularly drought—that are a major cause of food insecurity. SO3 activities build social and physical assets in communities to improve the management of agricultural and water resources, raise awareness and encourage behavior change on the management of environmental resources, and develop disaster risk reduction (DRR) and early warning mechanisms.
1.2 Theory of Change
ENSURE's theory of change (ToC) posits that many of the underlying causes of food insecurity can be addressed through a combination of expanded knowledge, increased capacity, improved means of producing food and income, and access to savings, coupled with community assets that provide greater resilience to disasters and environmental degradation. Health and nutrition activities have built on a wealth of evidence-based research to reduce chronic malnutrition and stunting through supplementary food, better nutrition practices, safer water, and improved sanitation. Mainstreaming gender equity and organizing VS&Ls (especially as a means of providing women access to financial services), both a strong program focus, have become a common thread connecting the other activities. The ToC’s foundation of gender equity and access to savings and loans have enabled women to become leaders in their communities through participation in committees, producer groups, and marketing groups. Women’s increased access to savings and income through improved agricultural production has helped increase household income. Moreover, due to the success of the VS&Ls in funding all of the program activities, they became a cross-cutting intervention in the ToC.
In addition to these building blocks to achieve long-term food security, ENSURE’s design includes nesting and layering interventions to strengthen sustainability. The largest group reached through ENSURE are community members who are engaged in and/or benefit from capacity building, preparedness and planning under SO3. These communities are engaged in asset construction and rehabilitation, environmental resource management, DRR, and sanitation and water management activities that benefit the whole community. Within these environmental conservation activities designed to produce a more stable and climate-change resistant environment are nested the farmer participants under SO2, who receive training and support to increase production, savings and access markets in order to increase both income and food security. Also nested within the SO3 environmental activities, and overlapping somewhat with SO2, is the SO1 nutrition support to women and children. SO1 supports behavior change in health and nutrition, combined with access to safe water and adequate, locally available nutritious food for families. While there are many other activities included in this approach, including mainstreaming gender equity, ENSURE’s core strategic approach that focused on integrating critical, complementary behavioral and technical changes across communities is critical to participants’ stated success in increasing their food and nutrition security.
Over the life of the activity, the ENSURE ToC was revisited and adjusted slightly in order to adapt to conditions on the ground such as the worsening economic situation. Given the distressed economic and

Final Performance Evaluation of the ENSURE DFAP in Zimbabwe
Introduction 3
climatic environment in which ENSURE has implemented activities, its strategies to build local knowledge, capacity and resilience to shocks have shown themselves to be highly relevant. Further, the project efforts to create synergies among the key sectors of agriculture, nutrition, health and sanitation, savings and small enterprises, gender, disaster risk reduction and environmental protection are supporting increased resilience and reduced food insecurity, in line with its ToC.

IMPEL | Implementer-Led Evaluation and Learning
4 Evaluation Overview
2. Evaluation Overview
2.1 Evaluation Purpose
This report details the findings and recommendations of the final evaluation of the ENSURE project. The evaluation’s broad objective is to measure the development outcomes of the ENSURE project and contribute to increased learning about what works well and what doesn’t work in different contexts. It is comprised of a representative population‐based household survey focused on the collection of data for the required impact and outcome indicators for Title II program intervention areas. The evaluation also includes a qualitative study that provides depth, richness, and context and serves to triangulate information from survey findings and analysis.
The purpose of the final evaluation is to measure the performance and development outcomes of the ENSURE project. It is designed as the second step in a two‐part evaluation process, following the baseline at the beginning of the program (USAID 2015). Data collection occurred during the peak vegetable gardening period, while the qualitative survey took place near the end of the dry season and before farmers began land preparation.
The specific objectives of the final evaluation are the following:
1. Determine the endline values of key impact and outcome-level indicators—disaggregated by awardee, age, and sex as appropriate— in addition to endline values of demographics in target areas and appropriate independent variables;
2. Conduct bivariate and multivariate analyses of impact and outcome indicators with independent variables identified for inclusion in the survey as appropriate, with results provided by awardee and the overall Title II country program area;
3. Gather qualitative data to ground‐truth survey data and provide contextual information on the overall food insecurity and malnutrition situation; and
4. Assess progress toward end‐of‐program targets for impact and outcome indicators.
The final evaluation was conducted by TANGO International with assistance from Jimat Development Consultants. Staff from FFP and the USAID Mission in Zimbabwe provided input and were involved throughout the process. The Evaluation Team consulted with the ENSURE awardees to understand the program description and theory of change, obtain inputs for the quantitative survey instrument and qualitative study, and receive contextual information to properly develop a sampling and logistics plan. In discussion and coordination with FFP, TANGO is providing draft and final versions of specific deliverables to the awardees for review and information.
The evaluation’s results are aimed at multiple audiences. The findings are expected to have primary accountability and learning value to USAID (FFP/Washington, USAID/Zimbabwe, FFP Southern Africa Regional Office, and the FFP learning network), IPs, and their sub-partners. Additional stakeholders include the Zimbabwean government officials from key collaborating ministry offices and regional committees in Manicaland and Masvingo provinces. The findings, conclusions, and recommendations of the evaluation will be used by USAID/FFP to extract lessons learned and generate insights to inform the design of follow-on FFP activities in Zimbabwe and the southern region of Africa. Evaluation recommendations and findings may also be used by FFP internally to refine future Development Food Assistance Program (DFAP) proposal guidelines and project policy.

Final Performance Evaluation of the ENSURE DFAP in Zimbabwe
Evaluation Overview 5
2.2 Evaluation Questions
FFP provided evaluation questions to guide the design and development of the final evaluation. In response to these questions, the evaluation team also referred to the baseline quantitative and qualitative data as a basis for comparison. The team assessed the technical viability of the evaluation questions and incorporated specific elements in the design and methodology of the final evaluation (both the quantitative and qualitative components) to ensure the evaluation provides valid and reliable data and directly addresses the evaluation questions. In some cases, this method involved incorporating additional variables or strata in the design of the household survey and the qualitative component. Table 1 shows the evaluation questions and corresponding evaluation method.
Table 1: Primary evaluation questions and methods
Criteria Main evaluation
questions Sub-questions Evaluation method
Impact 1. To what extent did the programs achieve the intended goal, objectives and results as defined by their Results Framework?
2. How did program activities improve the ability of beneficiary households and communities able to mitigate, adapt to, and recover from food security shocks and stresses?
1.1 Were there any important unintended outcomes, either positive or negative?
1.2 What were the main reasons that determined whether intended outcomes were or were not achieved, and whether there were positive or negative unintended outcomes? Which reasons were under control of the programs and which were not?
1. Quantitative bivariate analysis
2. Quantitative and qualitative
Beneficiary satisfaction
3. How satisfied were beneficiaries with the programs?
3.1 What issues were most important to beneficiaries forming their perceptions of the programs? What were the key successes and challenges of the programs?
Qualitative
Relevance 4. How relevant was beneficiary targeting, considering the needs of the target population?
4.1 Were beneficiary targeting criteria and processes appropriate, transparent, and properly implemented?
4.2 Were the scale, type, and timing of the program activities appropriate to the needs of the target population?
Qualitative
Effectiveness 5. How well were program activities planned and implemented?
5.1. What were the main factors that contributed to whether activities resulted in intended outputs and outcomes?
5.2. What quality standards were defined? How did the programs develop those standards?
Quantitative and qualitative

IMPEL | Implementer-Led Evaluation and Learning
6 Evaluation Overview
Criteria Main evaluation
questions Sub-questions Evaluation method
Coordination 6. To what extent did the programs coordinate with other food security and humanitarian programming, the host country government, and the donor?
Qualitative
Sustainability and Replicability
7. How sustainable are the programs’ outcomes?
7.1. What exit strategies were incorporated into program design? Were such strategies implemented, how were they perceived by the beneficiary population, and what were the strengths and weaknesses of the exit strategies adopted?
Qualitative
Cross‐cutting issues
8. How well were gender and environmental considerations integrated into program design and implementation?
8.1. Were they successful in meeting their stated objectives? How?
Quantitative and qualitative
Lessons Learned
9. What lessons can be learned future FFP and USAID Title II in Zimbabwe?
Quantitative and qualitative

Final Performance Evaluation of the ENSURE DFAP in Zimbabwe
Evaluation Methods 7
3. Evaluation Methods
3.1 Quantitative Data Collection
OVERVIEW
The objectives of the quantitative portion of this evaluation are to provide endline estimates of FFP program indicators, to measure changes in indicators over the five-year program cycle, and to provide evidence to prioritize and refine interventions. The quantitative analysis follows a pre-post design in which the same survey was conducted in 2014, at the start of program implementation, and in 2019, following completion. Pre-post designs provide for measurement and statistical tests of changes in indicators between the baseline and endline, but do not allow for attribution or causation.
The data were gathered via an in-person PBS of 1360 households in the six ENSURE districts. Survey fieldwork took place from May 21 to June 6, 2019, as close as possible to the baseline data collection timeframe (late March through May). Data collection was scheduled close to the end of the program given weather constraints, namely, that the lean season coincides with the rainy season; the timing of data collection was thus designed to allow for probable access to all project areas.
TANGO International and Jimat Development Consultants collaborated for survey training, household listing, and survey fieldwork. Surveys were translated into Shona, the most common local language. Annex C describes the training and fieldwork in detail.
POPULATION-BASED SURVEY DESIGN
The evaluation uses a mixed-method design to measure performance, integrating data from multiple sources. A performance evaluation design uses an ex-ante and ex-post comparison to detect changes in key indicators of interest. A performance evaluation focuses on descriptive and normative questions: what a particular project or program has achieved; how it is being implemented; how it is perceived and valued; whether expected results are occurring; and other questions that are pertinent to program design, management and operational decision-making. A performance evaluation design lacks a counterfactual, and without a counterfactual, the results cannot be attributed to the interventions.
The statistically representative sample was selected using a multi-stage clustered sampling approach (USAID 2015). The sampling frame for the endline survey was constructed from the 2012 Zimbabwe census enumeration areas (EAs).1 ENSURE project staff provided TANGO with a list of wards in each
district and TANGO used these wards to identify all EAs for inclusion in the sampling frame. Stunting, one of several key measures of food insecurity, was used to compute sample size in the baseline and endline surveys.
Sample size is the minimum number of households necessary to detect whether stunting decreased to the project target rate of 21.6 percent (baseline value: 28.1 percent), a reduction of 6.5 percentage points. As shown in Table 2, the total target sample size is 1,360.2
The minimum required sample sizes for the baseline and endline surveys were computed to provide estimates of key project indicators (stunting in particular) with similar levels of statistical precision over the two surveys. However, the minimum required sample size for the endline sample has been
1 The EA is the lowest census administrative level and typically includes 100-200 households. 2 Refer to Table 4 for actual non-response rates.

IMPEL | Implementer-Led Evaluation and Learning
8 Evaluation Methods
computed to be significantly smaller than what was estimated for the baseline for two reasons. First, at the time of the baseline, there was less available information about characteristics of project populations, so conservative estimates of key parameters were adopted. At the time of the endline, more accurate estimates of key parameters were available from the baseline results. In particular, the formula used at the baseline to estimate the number of households to achieve a sufficient number of CU53 resulted in a much larger number of CU5 being surveyed than was actually required for statistical purposes. A second reason that the required sample of households to be interviewed in the endline was adjusted downward was to reduce the unnecessary oversampling of CU5. The actual design effect (a parameter in the sample size calculation formula) was 1.85, somewhat lower than the value of 2.0 used in the baseline calculation.
These adjustments to the minimum required sample for the endline have resulted in significantly smaller required samples of households to attain indicator estimates that still have the desired level of statistical precision. For this reason, even though the endline sample is smaller than the baseline, the comparison of results with the baseline are statistically valid.
Table 2: Information used to compute sample size
Percentage of stunting at baseline (actual) 28.1
Expected percentage of stunting at endline 21.6
Design effect at baseline (actual) 1.849
Percentage of CU5 of the total population at baseline (actual) 14.9
Household size at baseline (actual) 5.1
Minimum required sample size (# CU5; computed) 720
Minimum required sample size adjusted for the number of CU5 per household (# HH; computed)
1,233
Non-response rate (estimated) 10%
Final target sample size (# HH) (computed) 1,360
Note: All FFP development projects are part of Feed the Future. Feed the Future strategy calls for a population-level change in key outcomes. Therefore, FFP expects a population-level change in key outcomes. This is well articulated in Feed the Future strategy, the Request for Applications, and FFP's M&E Policy and Reporting Guidance. An implementing partner must be strategic in deciding coverage to make a population-level change. Inadequate village-level coverage without a dedicated strategy to promote secondary adoption will not likely demonstrate a population-level change even when an activity produces excellent results among its direct participants.
In accordance with the Feed the Future strategy described above, FFP quantitative performance evaluations use a population-based survey (PBS) that is drawn from the general population in a DFAP implementation area. Accordingly, beneficiaries that directly participate in DFAP activities are not specifically targeted in the quantitative survey; rather, the sample is selected from the entire population within the project implementation area, which includes DFAP participants and non-participants.
This report includes an annex (Annex F) showing participant versus non-participant data for key indicators for illustrative purposes only. It is important to note that the baseline and endline surveys are independent population-based samples, and there may be systematic, non-random differences between participants and non-participants. As a result, observed differences between participant and non-participant groups, whether positive or negative, cannot be directly attributed to DFAP activities.
3 Per guidance in Appendix A of the Feed the Future Population-Based Survey (PBS) Sampling Guide.

Final Performance Evaluation of the ENSURE DFAP in Zimbabwe
Evaluation Methods 9
Further, as the PBS was not designed to allow comparisons between participants and non-participants, the interpretation of differences in indicator results must be done judiciously. In the ENSURE survey, 40.1 percent of sampled households self-identified as directly participating in any project activity. However, experience from past FFP surveys suggests that self-reporting of participation may not be accurate, particularly when there are multiple projects in an area, which weakens the validity of any comparison of outcomes. The analysis has sought to present more accurate information about project participants by consulting project performance monitoring data.
DATA ANALYSIS
The endline indicator calculation methods are the same as those for the baseline. The data to compute the indicators were collected using a questionnaire with separate modules for each indicator topic. Table 3 shows indicators, disaggregates and corresponding questionnaire module. See Annex I for the quantitative survey questionnaire.
Child stunting and underweight indicators were derived using WHO child growth standards and associated software (WHO 2011). Household, women’s and farmer’s indicators were computed following FFP guidelines (FANTA III 2015). Expenditures and poverty indicators follow World Bank guidelines (World Bank n.d.).
Bivariate analyses were applied to the survey data to compare changes in indicators from baseline to endline. Module I collected information about program participation, which was used to categorize households and individuals. Differences in means or proportions, as appropriate, test whether the change over time or between groups is statistically significant (at levels ranging from 0.10 to less than 0.001). Note that comparisons over time of monetary indicators are difficult because of the extremely high and variable rate of price inflation, large fluctuations in currency exchange rates, and multiple currencies used in Zimbabwe over the life of the project.4
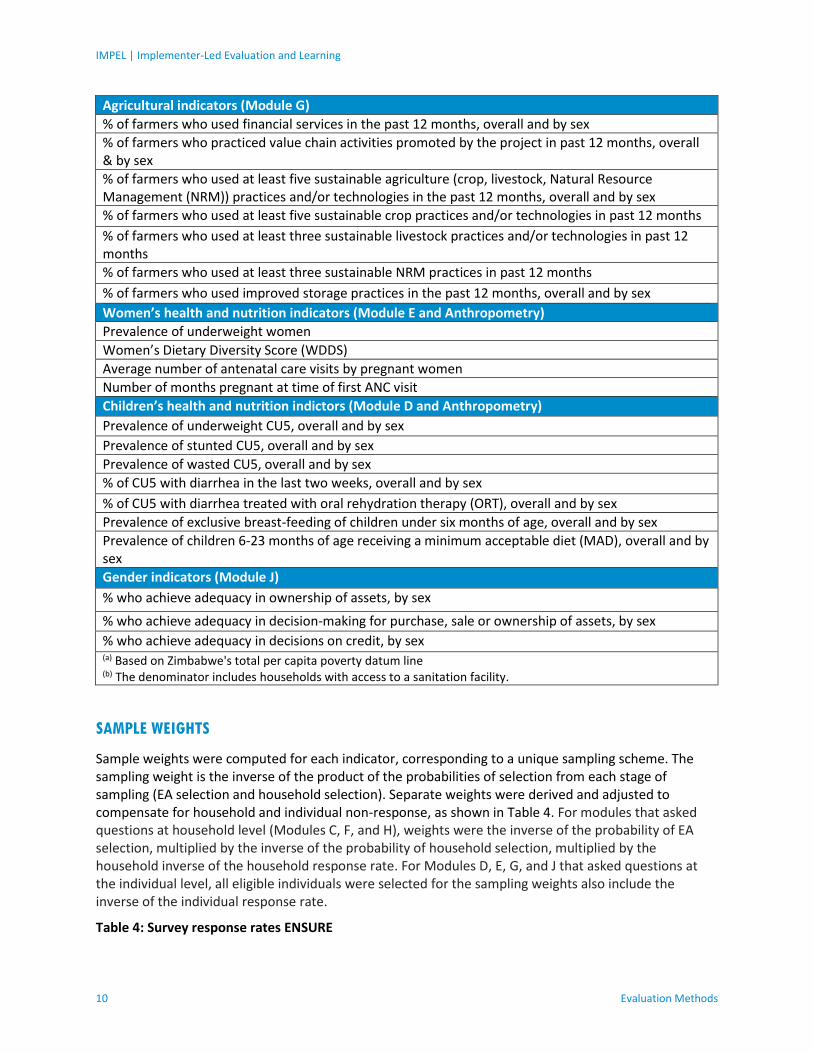
Table 3: ENSURE endline indicators
Food security indicators (Module C)
Average Household Dietary Diversity Score (HDDS)
Prevalence of households with moderate or severe hunger (HHS), overall and by gendered household type
Average Coping Strategies Index (CSI)
Food Consumption Score (FCS)
Poverty indicators (Module H)
Per capita expenditures (USD 2014)
% below the total per capita poverty datum line (TPCPDL)(a)
Mean depth of poverty (using the TPCPDL)
Sanitation and hygiene (WASH) indicators (Module F)
% of households using an improved source of drinking water
% of households using improved sanitation facilities
% of households with soap and water at a handwashing station
% of households practicing correct use of recommended household water treatment technologies
% of households practicing safe storage of drinking water
% of households with a handwashing station near a sanitation facility(b)
4 See relevant discussion of the poverty analysis in Section 3.4 Limitations.
IMPEL | Implementer-Led Evaluation and Learning
10 Evaluation Methods
Agricultural indicators (Module G)
% of farmers who used financial services in the past 12 months, overall and by sex
% of farmers who practiced value chain activities promoted by the project in past 12 months, overall & by sex
% of farmers who used at least five sustainable agriculture (crop, livestock, Natural Resource Management (NRM)) practices and/or technologies in the past 12 months, overall and by sex
% of farmers who used at least five sustainable crop practices and/or technologies in past 12 months
% of farmers who used at least three sustainable livestock practices and/or technologies in past 12 months
% of farmers who used at least three sustainable NRM practices in past 12 months
% of farmers who used improved storage practices in the past 12 months, overall and by sex
Women’s health and nutrition indicators (Module E and Anthropometry)
Prevalence of underweight women
Women’s Dietary Diversity Score (WDDS)
Average number of antenatal care visits by pregnant women
Number of months pregnant at time of first ANC visit
Children’s health and nutrition indictors (Module D and Anthropometry)
Prevalence of underweight CU5, overall and by sex
Prevalence of stunted CU5, overall and by sex
Prevalence of wasted CU5, overall and by sex
% of CU5 with diarrhea in the last two weeks, overall and by sex
% of CU5 with diarrhea treated with oral rehydration therapy (ORT), overall and by sex
Prevalence of exclusive breast-feeding of children under six months of age, overall and by sex
Prevalence of children 6-23 months of age receiving a minimum acceptable diet (MAD), overall and by sex
Gender indicators (Module J)
% who achieve adequacy in ownership of assets, by sex
% who achieve adequacy in decision-making for purchase, sale or ownership of assets, by sex
% who achieve adequacy in decisions on credit, by sex (a) Based on Zimbabwe's total per capita poverty datum line (b) The denominator includes households with access to a sanitation facility.
SAMPLE WEIGHTS
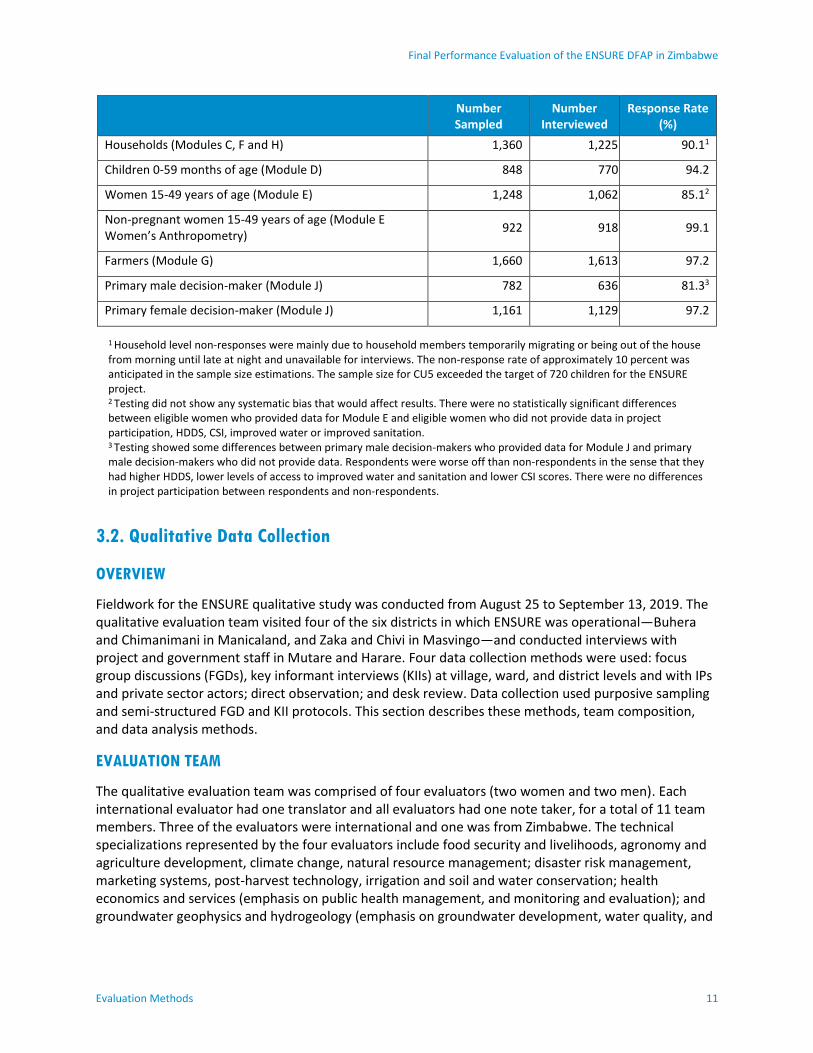
Sample weights were computed for each indicator, corresponding to a unique sampling scheme. The sampling weight is the inverse of the product of the probabilities of selection from each stage of sampling (EA selection and household selection). Separate weights were derived and adjusted to compensate for household and individual non-response, as shown in Table 4. For modules that asked questions at household level (Modules C, F, and H), weights were the inverse of the probability of EA selection, multiplied by the inverse of the probability of household selection, multiplied by the household inverse of the household response rate. For Modules D, E, G, and J that asked questions at the individual level, all eligible individuals were selected for the sampling weights also include the inverse of the individual response rate.
Table 4: Survey response rates ENSURE
Final Performance Evaluation of the ENSURE DFAP in Zimbabwe
Evaluation Methods 11
Number Sampled
Number Interviewed
Response Rate (%)
Households (Modules C, F and H) 1,360 1,225 90.11
Children 0-59 months of age (Module D) 848 770 94.2
Women 15-49 years of age (Module E) 1,248 1,062 85.12
Non-pregnant women 15-49 years of age (Module E Women’s Anthropometry)
922 918 99.1
Farmers (Module G) 1,660 1,613 97.2
Primary male decision-maker (Module J) 782 636 81.33
Primary female decision-maker (Module J) 1,161 1,129 97.2
1 Household level non-responses were mainly due to household members temporarily migrating or being out of the house from morning until late at night and unavailable for interviews. The non-response rate of approximately 10 percent was anticipated in the sample size estimations. The sample size for CU5 exceeded the target of 720 children for the ENSURE project. 2 Testing did not show any systematic bias that would affect results. There were no statistically significant differences between eligible women who provided data for Module E and eligible women who did not provide data in project participation, HDDS, CSI, improved water or improved sanitation. 3 Testing showed some differences between primary male decision-makers who provided data for Module J and primary male decision-makers who did not provide data. Respondents were worse off than non-respondents in the sense that they had higher HDDS, lower levels of access to improved water and sanitation and lower CSI scores. There were no differences in project participation between respondents and non-respondents.
3.2. Qualitative Data Collection
OVERVIEW
Fieldwork for the ENSURE qualitative study was conducted from August 25 to September 13, 2019. The qualitative evaluation team visited four of the six districts in which ENSURE was operational—Buhera and Chimanimani in Manicaland, and Zaka and Chivi in Masvingo—and conducted interviews with project and government staff in Mutare and Harare. Four data collection methods were used: focus group discussions (FGDs), key informant interviews (KIIs) at village, ward, and district levels and with IPs and private sector actors; direct observation; and desk review. Data collection used purposive sampling and semi-structured FGD and KII protocols. This section describes these methods, team composition, and data analysis methods.
EVALUATION TEAM
The qualitative evaluation team was comprised of four evaluators (two women and two men). Each international evaluator had one translator and all evaluators had one note taker, for a total of 11 team members. Three of the evaluators were international and one was from Zimbabwe. The technical specializations represented by the four evaluators include food security and livelihoods, agronomy and agriculture development, climate change, natural resource management; disaster risk management, marketing systems, post-harvest technology, irrigation and soil and water conservation; health economics and services (emphasis on public health management, and monitoring and evaluation); and groundwater geophysics and hydrogeology (emphasis on groundwater development, water quality, and

IMPEL | Implementer-Led Evaluation and Learning
12 Evaluation Methods
sustainable WASH projects). All translators and note takers (four females, four males) were from Zimbabwe and were fluent in Shona and English.
SAMPLE DESIGN
Village/ward selection for qualitative data collection was based on maximizing coverage of a range of project activities5 and maximizing variation in village distance to a regional town. Sampling was also
opportunistic in terms of field and timing logistics and sites that could be reached in one day. An additional consideration was project personnel availability, as most of the remote areas do not have improved roads, so each team had to be guided by field personnel for the duration of the day’s field activities.
The sampling design used for the FGDs and KIIs conducted with project participants was purposive in two ways: i) the team held FGDs with project participants only, and ii) it aimed to maximize coverage of the full breadth project activity types. The evaluation team also requested that the district and field-level personnel arranging FGDs do so to reflect the range of strengths and weaknesses in programming across the four districts comprising the project.
While village selection for the qualitative data collection aimed for representativeness to the extent possible, it is noted that purposive qualitative data collection, particularly within short timeframes, is inherently non-representative (Bernard, 2017). Moreover, respondents who participated in FGDs and were willing to share their views may not be representative of all project participants, or may be different in key observable or unobservable ways. The evaluation team sought to mitigate the potential for biased results by asking field-level personnel to recruit respondents with a range of experiences and beneficiary roles for the qualitative data collection, and also by triangulating information across different types of project beneficiaries and stakeholders. Field and district personnel were also interviewed as a means for triangulating information gathered from project participants.
METHODS
Focus group discussions. The qualitative evaluation team conducted 46 FGDs involving more than 498 participants (355 female, 143 male). Focus group categories included both leaders and general members of producer and marketing groups, water management committees, care groups, mothers, village health workers, DRR committees, VS&L members, and others (details in Annex E). The FGDs were organized with the assistance of district-level project personnel, community leaders, and DFAP field staff, and on average were comprised of 8-12 participants. Evaluators, working with their respective translators and note takers, conducted the FGDs in Shona, the predominant language in the DFAP implementation areas. Responses to questions were translated for the team evaluator during the course of the KII or FGD. FGDs were generally held outside at common gathering areas in the respective villages. Semi-structured instruments with questions organized by the evaluation team were used to guide the discussion (see Annex I).
Key informant interviews. The qualitative evaluation team conducted 80 KIIs with project participants (35 female, 45 male), IPs, government and private sector actors (details in Annex E). The interviews followed a semi-structured format to allow for follow-up questions and flexibility in the discussion. The KII protocol was structured to gather information on the extent to which activities have been achieved; any gaps or challenges the project experienced over the course of the five years; what factors promoted or inhibited project activities and outcomes; perspectives on the effectiveness of project interventions and targeted
5 This information was drawn from IP data on activity implementation by village.

Final Performance Evaluation of the ENSURE DFAP in Zimbabwe
Evaluation Methods 13
groups; quality of services provided; motivations and capacity to demand and sustain services; and the projected sustainability of project interventions and outcomes (see Annex I for KII protocols).
Direct observations. The team made observations and site visits to assets built by ENSURE, including site visits to infrastructure projects and gardens, observation of livestock watering practices, lead mother observations, and observation of sanitary facilities and practices.
Desk review. The IPs provided documents to the evaluation team, including quarterly and annual reports, training documents, field manuals and studies addressing particular initiatives of the project (e.g., VS&L organizations, natural resource management (NRM) practices, gender mainstreaming and farming as a business (FaaB), and monitoring formats. The purpose of the desk review was to identify key findings and explanatory factors from IP reports and internal M&E data pertaining to each of the outlined evaluation questions. Examination of key documents before data collection assisted in the design of some of the evaluation questions. The secondary information was also used as a source of triangulation for qualitative data provided by project beneficiaries and KIIs, or to help interpret or provide explanatory context for both PBS and qualitative results.
ANALYSIS, CODING AND INTERPRETATION METHODS
The FGDs were recorded, with consent from participants, and transcribed from Shona into English. Transcribed FGD data and detailed FGD notes were reviewed for accuracy by team members together with their respective translators and note takers. Interview data were then recorded on matrices provided to all team members according to key themes, evaluation questions, and ultimately, sections of the report template. KII notes were summarized using standard content analysis techniques. For both KIIs and FGD data, analyses summarized common trends and patterns to highlight project-, sector-, and gender-differentiated trends, and to specifically identify examples of perceived strong areas of probable sustainability, unexpected outcomes, positive deviance, and most significant changes and impacts.
3.3 Integration of Quantitative and Qualitative Findings
As detailed in the previous sections, this mixed-methods final evaluation utilized both quantitative data collected through the PBS and qualitative data collected through KIIs, FGDs, direct observation, and document review. This collective information is integrated in several ways in the evaluation to interpret findings and provide support for recommendations.
A systematic integration of various datasets, including the endline data, occurred during the process of composing the report, after all field data collection was complete. The team reviewed the data and used the information as a starting point for the analysis of what was learned during the qualitative study.
The process of integrating the quantitative and qualitative findings was as follows:
The qualitative team reviewed the Indicator Performance Tracking Table (IPTT) indicator results by SO, focusing initially on the implications of the results relative to each objective and their respective intermediate results (IRs). This review included the minimum acceptable diet (MAD) data and additional analyses conducted by TANGO to explore data addressing particular IRs, e.g., a breakdown of the specific types of food groups used to calculate the Household Dietary Diversity Score (HDDS) under SO1 and specific value chain activities under SO2.
The integrated analysis of quantitative and qualitative data, along with consideration of other information sources, is synthesized in the report sections that address evidence of cross-integration of initiatives within the project. These discussions, oriented around assessing the broader impacts of synthesized project initiatives (intentional or not), are specifically discussed throughout the latter sections of the report.

IMPEL | Implementer-Led Evaluation and Learning
14 Evaluation Methods
3.4 Limitations
ODK programming errors. ODK programming errors caused skips over parts of several questions. Consequently, data are missing from three modules. i) In the household consumption module (Module H), which collects data on weekly, monthly and annual consumption and expenditures, data are missing for six out of seven categories of monthly expenditures. Analysts used baseline data to impute missing monthly data, then to estimate per capita daily expenditures and poverty indicators. Refer to Appendix D for imputation methods. ii) In the children’s nutrition module (Module D), one of the variables used to compute Minimum Adequate Diet (MAD), meal frequency, was skipped. Analysts imputed meal frequency and used the imputed values to estimate MAD. To be comparable, imputations include both baseline and endline values for MAD. iii) In the gender module (Module J), one of the asset categories, mechanized farming equipment, was missing from the endline survey. This did not affect indicator values. Analysts re-estimated baseline values of the indicator percentage who achieve adequacy in ownership of assets omitting the missing variable, and found only a very small difference (less than 0.01). This brought survey response rates below the 10 percent estimate for survey Module E, Women 15-49 years of age, and for Module J, Primary male decision-maker (see Volume II).
Timing of quantitative data results. Given the short timeline from completion of the PBS to the beginning of the qualitative survey, the evaluation team received preliminary results of the PBS during the qualitative data collection period, and those findings were used to help direct follow-up probing on some issues, e.g., types of sustainable agricultural practices.
Poverty analysis. As noted above in the Data Analysis section, comparisons over time of monetary indicators are problematic because of the extremely high and variable rate of price inflation, large fluctuations in currency exchange rates, and multiple currencies used in Zimbabwe over the life of the project. Expenditure and poverty indicators at endline should be interpreted with caution for several reasons: (1) Reporting issues: Expenditure totals may underestimate the contribution of food and other items that households receive from remittances or barter. Data collection methods follow World Bank guidelines and are not specifically designed to measure contributions of remittances or barter. For each food item, enumerators ask whether it was consumed, then for each item, how much of what was consumed came from purchases, own-production, or gifts. Foods received from bartering or remittances should be counted as gifts. However, survey questions are not worded to explicitly ask about consumption items from barter or remittances. (2) The unstable financial situation in Zimbabwe contributes to issues with the indicator computation. At the time of the endline survey, Zimbabweans were experiencing sharp price increases and fluctuating currency exchange rates, and the government had recently changed the official currency, moving from the US dollar (USD) to the Zimbabwe dollar. Data on all of these elements are part of the calculations. If these are changing, the estimated value is unstable and not very reliable. (3) Between baseline and endline, along with changing the official currency, the Total Per Capita Poverty Datum Line (TPCPDL) changed from being denominated in USD to Zimbabwe dollars and the poverty line was increasing rapidly. During endline survey fieldwork the daily per capita poverty line increased by almost 4 Zimbabwe dollars. This also contributed to the unreliability of expenditure and poverty indicator estimates.
Difference in seasonal timing of data collection between baseline and endline PBSs. The baseline data collection for the PBS took place March 24 – May 1, 2015, and the endline household survey was conducted May 21 – June 6, 2019. It is possible that this slight difference in seasonality across the two rounds of data collection could contribute to differences in some of the indicator estimates. The main variation is in the green harvest, which is more available in March/April than in May/June. Also, depending on the crop, in May some farmers begin land preparation in anticipation of the rainy season

Final Performance Evaluation of the ENSURE DFAP in Zimbabwe
Evaluation Methods 15
and planting; the lean season for farmers generally occurs somewhat later in the year. In particular, dietary diversity, prevalence of household hunger, and prevalence of diarrhea indicators may be more sensitive to this difference. In addition, the end of March through June are harvest months in which it is not uncommon for seasonal migrants to have migrated out of villages to seek wage work.

IMPEL | Implementer-Led Evaluation and Learning
16 Evaluation Findings
4. Evaluation Findings
4.1 Targeting
ENSURE targeted 66 out of 184 wards, approximately 30 percent of all wards in the six districts in which the project operated. The selection of wards and allocation of program participant numbers at district level was led by the District Drought Relief Committee (DDRC). At the district level, an ENSURE consortium member (and staff from the Provincial Development Coordinator’s office and Social Service provincial officials, when available) engaged with the selected district authorities to organize DDRC meetings. In these meetings, which are chaired by District Development Coordinators (DDCs), ENSURE consortium staff members explained the DFAP program principles to key district stakeholders. ENSURE staff facilitated the prioritization of wards on the basis of food insecurity, using available data and DDRC expert knowledge of the districts.
Villages were selected through a ward assembly meeting attended by local leadership (Chiefs, Village Heads, Ward Councilors, and government ward-level staff from different ministries and departments. Village Secretaries attended to document the process. Village heads were requested to bring updated household records to the meeting, and ENSURE staff verified the records against those provided by the DDC’s office. Only authentic villages were recognized in the meeting to avoid village splitting and/ or creation of temporary “villages” in the communities. The ward assemblies then ranked villages using agreed food insecurity indicators (including but not limited to remittances, own cereal production, and sale or exchange of livestock and/or livestock products). The ward assembly meeting, household targeting, and registration processes were held on the same day to minimize cases of pre-registration meetings occurring in the villages, with an intention to pre-select program participants after the ward ranking exercise.
Following the selection of wards, program staff engaged directly with key stakeholders including local farmers groups, local extension agents, NGOs, and agro-dealers to provide input to prioritize relevant areas within their respective wards. ENSURE developed detailed targeting criteria for each activity, the use of which was broadly confirmed in the various FGDs and KIIs. Targeting was a participatory process, involving stakeholders at various levels of government, ENSURE staff, and other local groups. Targeting for SO1 involved pregnant and lactating women (PLW) and caregivers of children under two years of age (CU2) within the wards selected for SO2/SO3.
Participation in asset-building activities was open to vulnerable households with available labor, and was essentially self-selecting in that only those who wanted to participate chose to do so. Eligible households were selected through a combination of a vulnerability assessment and community selection. Many people dropped out of the FFA activities at some point, causing delays in completing construction of dams. Some of the reasons given for dropping out included the labor-intensive work and the extended time commitment required (e.g., up to two years). FGD participants said that the project adapted to this by continuing the work with existing members, and by absorbing new members, which may explain why some projects took longer than planned. The FFA participants felt that more intensive involvement of the local leadership would have helped resolve these issues.
According to FGD participants, targeting of participants in garden activities was typically contingent on a set of selection criteria, which varied slightly across sites. For most sites, participation in asset creation activities (e.g., dam construction, fencing, building troughs) was a prerequisite for participation in garden activities. It was not, however, a guarantee of inclusion in gardening activities: additional criteria may also have been used, depending on the site. For example, one garden in Chivi selected plot holders
Final Performance Evaluation of the ENSURE DFAP in Zimbabwe
Evaluation Findings 17
based on participation in asset creation activities and on the household’s proximity to the garden (e.g., within five kilometers). In another site, priority went to households who had not had access to garden plots through previous programming activities (e.g., CARE, Gem Agro Action). Some communities created opportunities for vulnerable households (e.g., chronically food insecure, elderly, physically disabled people) identified by the community to participate in FFA by including tasks that required lighter labor, which then gave those households access to the garden. Many women participated in FFA work on the weir dams alongside men; women acknowledged that the work was very hard but gave them a sense of accomplishment. For the most part, there were no significant issues with targeting, although many focus groups indicated that the gardens were not sufficiently large for everyone to have plots that wanted them. In a number of communities, more households did not have plots than did, though the evaluation team observed several communities in the process of expanding their gardens.
Some focus groups perceived that there was no significant accommodation for the disabled, at least in garden activities. On-site observations support such a claim, as garden sites were often not easily accessed and walkways between garden plots were often narrow and uneven. Although KIIs with ENSURE staff suggested that the visually and physically impaired were accommodated by the program, it was not clear exactly how.
Targeting of lead farmers was accomplished by identification of individuals that were considered to be experienced and approachable, and who had fenced-land and a passion for farming. Both community members and the Agritex officer had to be in agreement of those selected.
4.2 SO1: Nutrition among women of reproductive age and children under 5 years
improved
SO1 focused on addressing chronic malnutrition by targeting pregnant and lactating women (PLW) and children under two years of age (CU2) with food rations, as well as by improving nutrient intake, access, and availability of nutritious food, and addressing the gender and power dynamics that limit a mother’s time and access to resources (World Vision Zimbabwe 2013a). Overall, the integrated approach involving SO1 nutrition and SO2 agriculture interventions contributed to improvements in maternal and child nutrition as well as knowledge and adoption of maternal and child health practices.
Improved water, sanitation, and health (WASH) practices are a vital component of good health for all people, especially children and women of reproductive age (WRA). WASH activities are included under IR 1.2, which focuses on reducing diarrhea in children under five (CU5).
RESULTS
This section discusses the extent to which the ENSURE program achieved its intended goal, objectives and outcomes as defined in the Results Framework for SO1.
IR 1.1 - CONSUMPTION OF NUTRITIOUS FOODS IMPROVED
The Household Dietary Diversity Score (HDDS) reflects the quality of a household’s diet and is the total number of food groups, out of 12, from which household members consumed food in the 24 hours prior to the survey (FAO 2010). HDDS ranges from 0 to 12, with lower numbers indicating less dietary diversity, and can be interpreted as an indicator of food access and a proxy for socioeconomic status. There was a statistically significant—though not large—decrease in household dietary diversity between baseline and endline (Figure 1), suggesting that households had less access to diverse foods at endline than at baseline.
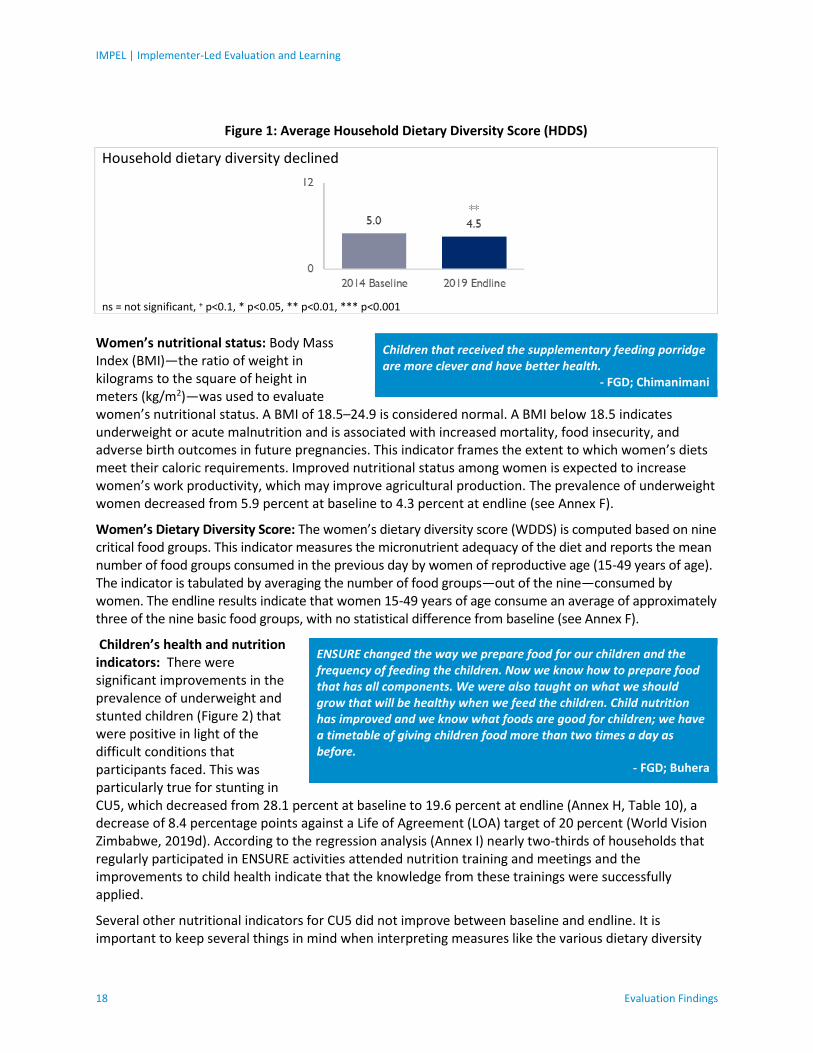
IMPEL | Implementer-Led Evaluation and Learning
18 Evaluation Findings
Women’s nutritional status: Body Mass Index (BMI)—the ratio of weight in kilograms to the square of height in meters (kg/m2)—was used to evaluate women’s nutritional status. A BMI of 18.5–24.9 is considered normal. A BMI below 18.5 indicates underweight or acute malnutrition and is associated with increased mortality, food insecurity, and adverse birth outcomes in future pregnancies. This indicator frames the extent to which women’s diets meet their caloric requirements. Improved nutritional status among women is expected to increase women’s work productivity, which may improve agricultural production. The prevalence of underweight women decreased from 5.9 percent at baseline to 4.3 percent at endline (see Annex F).
Women’s Dietary Diversity Score: The women’s dietary diversity score (WDDS) is computed based on nine critical food groups. This indicator measures the micronutrient adequacy of the diet and reports the mean number of food groups consumed in the previous day by women of reproductive age (15-49 years of age). The indicator is tabulated by averaging the number of food groups—out of the nine—consumed by women. The endline results indicate that women 15-49 years of age consume an average of approximately three of the nine basic food groups, with no statistical difference from baseline (see Annex F).
Children’s health and nutrition indicators: There were significant improvements in the prevalence of underweight and stunted children (Figure 2) that were positive in light of the difficult conditions that participants faced. This was particularly true for stunting in CU5, which decreased from 28.1 percent at baseline to 19.6 percent at endline (Annex H, Table 10), a decrease of 8.4 percentage points against a Life of Agreement (LOA) target of 20 percent (World Vision Zimbabwe, 2019d). According to the regression analysis (Annex I) nearly two-thirds of households that regularly participated in ENSURE activities attended nutrition training and meetings and the improvements to child health indicate that the knowledge from these trainings were successfully applied.
Several other nutritional indicators for CU5 did not improve between baseline and endline. It is important to keep several things in mind when interpreting measures like the various dietary diversity
Figure 1: Average Household Dietary Diversity Score (HDDS)
Household dietary diversity declined
ns = not significant, + p<0.1, * p<0.05, ** p<0.01, *** p<0.001
Children that received the supplementary feeding porridge are more clever and have better health.
- FGD; Chimanimani
ENSURE changed the way we prepare food for our children and the frequency of feeding the children. Now we know how to prepare food that has all components. We were also taught on what we should grow that will be healthy when we feed the children. Child nutrition has improved and we know what foods are good for children; we have a timetable of giving children food more than two times a day as before.
- FGD; Buhera

Final Performance Evaluation of the ENSURE DFAP in Zimbabwe
Evaluation Findings 19
scores (HDDS, MAD, MDD-W, WDDS) and measures of stress and coping (HHS, CSI). First of all, they are very responsive to time and seasonality, and therefore the current context has an impact on those measurements. Because they are based on current food consumption and other behaviors during the preceding day or month (depending on the indicator), they are best interpreted as a group rather than individually (Maxwell et al., 2013). This is in contrast to the anthropometric indicators, which are not so responsive to immediate circumstances and so give a better idea of the general trend over time.
Exclusive breastfeeding of children under six months of age increased by 24.7 percentage points from baseline to endline (Figure 3) to 60.5 percent of children versus a LOA target of 80 percent World Vision Zimbabwe, 2019d). Endline results show no statistical changes in the prevalence of children 6-23 months old receiving a minimally acceptable diet (MAD) or improved dietary diversity (i.e., foods from four or more food groups). Again, the effects of drought and the economic situation made feeding a diversified diet to children difficult as some foods became too expensive and as mothers had to divert time from child care in order to earn more money through casual labor (World Vision Zimbabwe, 2019e).
Though there was no apparent improvement in the survey population in infant feeding practices over the LOA (due to the worsening economic and food security context generally), some health workers reported that, from their observations, the growth monitoring records for infants and young children who received supplemental feeding from ENSURE were better than those who did not. Still, the overall percentage of children 6-23 months in ENSURE receiving food from four or more groups is low; the FY19
Figure 2: Prevalence of underweight, stunting, or wasting of CU5 at baseline and endline
Underweight and stunting in CU5 declined between baseline and endline
ns = not significant, + p<0.1, * p<0.05, ** p<0.01, *** p<0.001
Figure 3: Child feeding practices and dietary diversity
Exclusive breastfeeding for children under 6 months old increased between baseline and endline
ns = not significant, + p<0.1, * p<0.05, ** p<0.01, *** p<0.001
1The meal frequency component of the MAD indicator was imputed. This information was not collected at endline. Indicator includes imputed values for both baseline and endline. There are fewer observations at baseline than children 6 to 23 months because not all child data could be matched onto the household file. See Section 3.1 Limitations.

IMPEL | Implementer-Led Evaluation and Learning
20 Evaluation Findings
target was 35 percent of participants and the achievement was 27 percent, or 77 percent of target; ENSURE attributed the underachievement to drought and the poor economy (World Vision Zimbabwe, 2019a). An FY19 survey by ENSURE found low consumption by participant children of dairy products (6 percent of those surveyed), eggs (17.6 percent), and vitamin-A rich fruits and vegetables (23 percent) (World Vision Zimbabwe, 2019b).
Antenatal care (ANC) is important for maintaining the health of pregnant women and their babies. By the endline, pregnant women were having their first ANC visits within the first four months of their pregnancy, earlier than they had at baseline (Figure 4).
The qualitative data generally support the quantitative findings described above. Insights from FGD participants and KIIs with care group volunteers and health workers all suggest improved nutrition status among women and especially children. Health workers reported that there was optimal growth for most children who were assessed during the food distribution sessions.
Care group volunteers, health workers and project staff attributed the improved nutritional status to the increased availability and consumption of nutritious foods that were availed through the supplementary food rations and garden plots, as well as increased production and income through the five promoted value chains (sorghum, beans, groundnuts, indigenous poultry, and goats). In addition, many households are now able to purchase nutritious foods using income from the enterprises and activities made possible through their participation in VS&L associations.
Most caregivers reported that they have access to a greater variety of foods during the harvest season than before the ENSURE program, when they could obtain primarily only cereals. Specifically, the caregivers have increased access to animal-source foods like meat, poultry, small dried fish, beans, peas, and groundnuts, which was not the case prior to ENSURE. In addition, cooking classes conducted during care group sessions taught caregivers how to prepare nutritious meals using locally available ingredients/ foods. Caregivers also reported increased consumption of fresh green vegetables and fruits like melons, pumpkins, tomatoes, and nuts. This finding is inconsistent with WDDS, which did not change during the project period (see Annex F). Again, the qualitative data represents perceptions by ENSURE participants and may be more relevant as an indicator of program performance.
Most FGDs with care group members and leaders revealed a number of benefits they felt they had gained as a result of participating in ENSURE activities, including:
Figure 4: Timing of first ANC visit by women at baseline and endline (ENSURE)
Women’s first ANC visit began earlier at endline than at baseline
ns = not significant, + p<0.1, * p<0.05, ** p<0.01, *** p<0.001

Final Performance Evaluation of the ENSURE DFAP in Zimbabwe
Evaluation Findings 21
Acquiring a lot of knowledge and now using recommended maternal and infant and young child feeding (IYCF) practices; e.g., they no longer feed CU2 the same food as the rest of the family;
Knowing how to keep and maintain nutrition gardens;
Knowing how to prepare and consume nutritious rations (e.g., enriched porridge) using locally available indigenous foods;
More-supportive husbands who participate in household chores such as gardening (including weeding), fetching water and firewood, and accompany their wives on ANC visits;
Participation in key decisions at home, which makes women feel more empowered because their voices are heard;
Owning assets like livestock, land and having some cash from village savings to make purchases;
More peaceful homes; and
More time to rest, breastfeed and prepare food for their children.
Some of these changes were attributed in large part to home visits used as part of the care group model. Such visits provided unique opportunities to reach out to other key household decision-makers, such as men, grandmothers, and mothers-in-law.
All health workers reported increased coverage with health services such as early ANC bookings, growth monitoring, and vitamin A supplementation. The food distributions attracted many people to health facilities (including members of the apostolic faith who abstain from using health services) who were provided with other services in addition to the food rations.
While the results for nutrition activities were largely positive, most of the project beneficiaries and staff also reported challenges related to implementation of different activities. The monthly Care Group Sessions for the Care Group Leader and male advocates were not adequately supervised using a structured and standardized tool. Participants also cited inadequate household rations6 because they did not cater for all the other CU5 in the household, which led to intra-household sharing: rations targeted a few (but not all) household members, which led to sharing of rations; in addition, the project did not reach vulnerable groups like children with moderate acute malnutrition at the health facilities. Another challenge is that government staff are few—moreover, some districts do not have staff at ward level—and therefore could not be fully engaged in different project activities. Government staff stated that the project covered only a few wards in each district, which made it difficult to influence district-wide statistics. In addition, key informants reported that there were minimal improvements to dietary diversity, even with the formulation of enriched porridges using locally available foods, as dietary options are very sensitive to the economic situation and seasonal changes in food availability. Key informants also reported that while some incentives for community health volunteers exist, they are not standardized. In addition, the supplementary feeding program implemented through the Care Groups in ENSURE wards caused some IYCF support group clients in non-ENSURE wards to migrate to the ENSURE wards in order to receive rations.
IR 1.2 - PREVALENCE OF DIARRHEA IN CHILDREN UNDER 5 REDUCED
There was no statistically significant change between baseline and endline in the percentage of CU5 with diarrhea in the two weeks prior to each survey (25 and 26 percent, respectively), nor for those
6 ENSURE provided a monthly dry ration of 3 kg Corn Soy Blend (CSB+) and 0.9 kg vegetable oil to each beneficiary from May to September/October.

IMPEL | Implementer-Led Evaluation and Learning
22 Evaluation Findings
being treated with oral rehydration therapy (79 and 73 percent, respectively). See Annex F for more detail.
Although the quantitative data indicate otherwise, there was a strong perception by ENSURE FGD participants that diarrheal diseases in the community had been reduced over the life of the project. The qualitative evaluation team observed high levels of good hygiene practices by community members,7 which FGD participants stated had been emphasized in the ENSURE project. Some good hygiene practices (e.g., handwashing) were demonstrated during FGD sessions. FGD participants also perceived that the promotion and introduction of slow sand filters and boiling unsafe water had contributed to a reduction of diarrhea in CU5 as well as the community in general. Most communities had not received bio-sand filters at the time of the evaluation, but those with completed filters in their community gardens appreciated the visually clean water, though they had no information on the water quality. ENSURE staff reported that the project concentrated on creating drinking water sources within irrigation schemes and gardens, as the number of deep wells planned was only enough to satisfy the needs in the irrigation schemes and there was no budget to create deep wells to improve access to safe drinking water in the community (World Vision Zimbabwe, 2019c.) FGDs expressed satisfaction with the knowledge gained in treating water from unsafe sources through bio-sand filters, aquatabs (when available), and—the vast majority—through boiling. Community members who do not belong to the garden have access to treated water from the gardens (since culturally, one cannot deny another person the right to drinking water).
WASH
Improved maternal and child nutrition is closely linked to improved water, sanitation and hygiene practices, hence WASH activities were an important component of the ENSURE project. IR 1.2 includes two sub-intermediate results, one related to WASH and one related to gender-equitable leadership and participation in program implementation. Both are presented here, in turn.
Baseline and endline values for standard indicators for household WASH practices are presented in Figure 5.8 Four of the six indicators for WASH practices promoted by ENSURE showed statistically significant improvement. The largest gains are in households practicing safe storage of drinking water. FGD participants acknowledged that the knowledge and skills acquired through ENSURE's community training sessions contributed to their changed behaviors. In particular, the reestablishment of Community Health Clubs (CHCs) was considered to play a key role. The CHCs were established by other NGOs prior to ENSURE and then adopted by government in 2013, but fell dormant due to the absence of a government mechanism to sustain them. ENSURE revived these groups through training and knowledge dissemination. Care group leaders, CBFs, and VHWs helped reestablish the clubs through refresher courses and developing activities. We conclude that ENSURE WASH promotion-related activities were the major drivers of good hygiene practices and promotion of positive behavior change in participating communities. Periodic competitions held by the clubs have been a source of inspiration to CHC members—as well as those wanting to join. Thus, the reemergence of the CHC and its inspirational effects are unintended—and positive—outcomes of the ENSURE project.
The Intensive Participatory Health and Hygiene Education (PHHE) training sessions conducted by ENSURE staff, village health workers (VHWs), and community-based facilitators (CBFs), also contributed to positive behavior change. In FY19, the number of people gaining access to a basic sanitation facility achieved 127 percent of target, and according to ENSURE, awareness campaigns conducted after the
7 See also the discussion under WASH, below. 8 Annex F and Table 11, Annex H show additional WASH indicators.
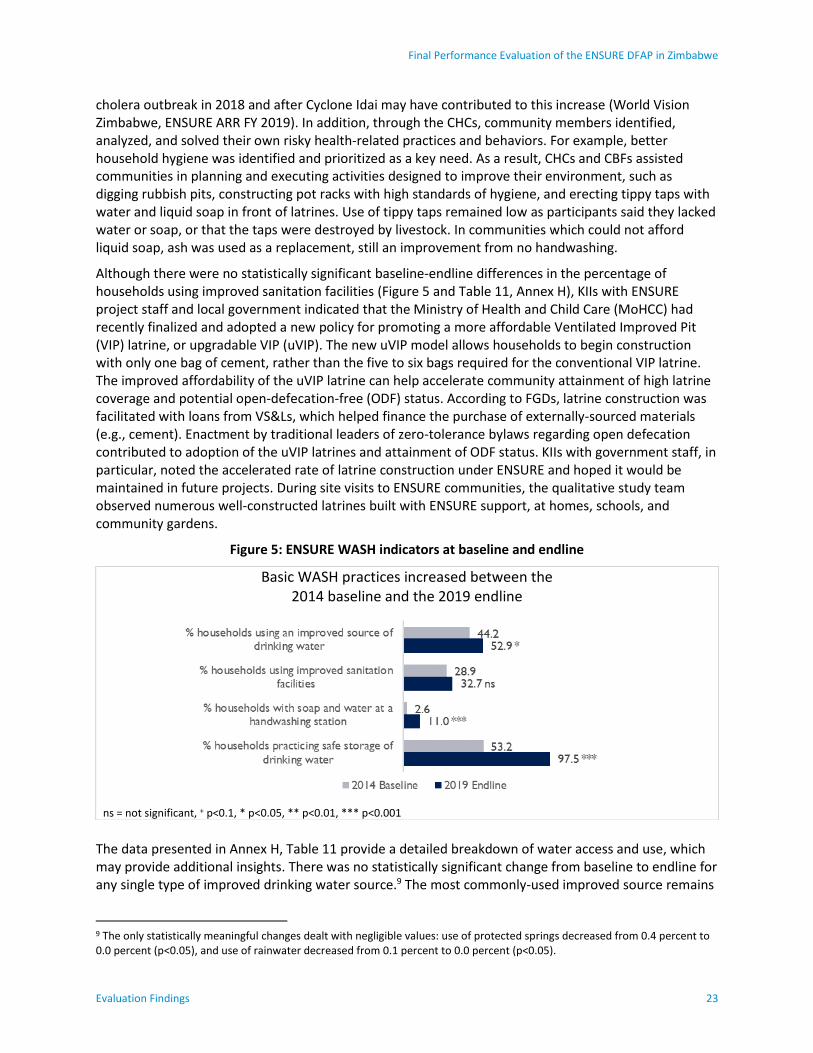
Final Performance Evaluation of the ENSURE DFAP in Zimbabwe
Evaluation Findings 23
cholera outbreak in 2018 and after Cyclone Idai may have contributed to this increase (World Vision Zimbabwe, ENSURE ARR FY 2019). In addition, through the CHCs, community members identified, analyzed, and solved their own risky health-related practices and behaviors. For example, better household hygiene was identified and prioritized as a key need. As a result, CHCs and CBFs assisted communities in planning and executing activities designed to improve their environment, such as digging rubbish pits, constructing pot racks with high standards of hygiene, and erecting tippy taps with water and liquid soap in front of latrines. Use of tippy taps remained low as participants said they lacked water or soap, or that the taps were destroyed by livestock. In communities which could not afford liquid soap, ash was used as a replacement, still an improvement from no handwashing.
Although there were no statistically significant baseline-endline differences in the percentage of households using improved sanitation facilities (Figure 5 and Table 11, Annex H), KIIs with ENSURE project staff and local government indicated that the Ministry of Health and Child Care (MoHCC) had recently finalized and adopted a new policy for promoting a more affordable Ventilated Improved Pit (VIP) latrine, or upgradable VIP (uVIP). The new uVIP model allows households to begin construction with only one bag of cement, rather than the five to six bags required for the conventional VIP latrine. The improved affordability of the uVIP latrine can help accelerate community attainment of high latrine coverage and potential open-defecation-free (ODF) status. According to FGDs, latrine construction was facilitated with loans from VS&Ls, which helped finance the purchase of externally-sourced materials (e.g., cement). Enactment by traditional leaders of zero-tolerance bylaws regarding open defecation contributed to adoption of the uVIP latrines and attainment of ODF status. KIIs with government staff, in particular, noted the accelerated rate of latrine construction under ENSURE and hoped it would be maintained in future projects. During site visits to ENSURE communities, the qualitative study team observed numerous well-constructed latrines built with ENSURE support, at homes, schools, and community gardens.
The data presented in Annex H, Table 11 provide a detailed breakdown of water access and use, which may provide additional insights. There was no statistically significant change from baseline to endline for any single type of improved drinking water source.9 The most commonly-used improved source remains
9 The only statistically meaningful changes dealt with negligible values: use of protected springs decreased from 0.4 percent to 0.0 percent (p<0.05), and use of rainwater decreased from 0.1 percent to 0.0 percent (p<0.05).
Figure 5: ENSURE WASH indicators at baseline and endline
Basic WASH practices increased between the 2014 baseline and the 2019 endline
ns = not significant, + p<0.1, * p<0.05, ** p<0.01, *** p<0.001

IMPEL | Implementer-Led Evaluation and Learning
24 Evaluation Findings
the tube well or borehole (about half of respondents), followed by protected wells (about one-fifth). The most common unimproved source of water, used by a little more than one-tenth of households, remains unprotected hand-dug wells. Of those households using unimproved sources, similar to baseline, most do not treat it in any way before use.
Project activities to improve access to water focused on community water safety, facilitating the revival of Water User Associations (WUA, also referred to as Water Point Committees), and local private sector participation10 in water point management. FGD participants noted that most of the WUAs had been trained or retrained through ENSURE and were very active. Participants attributed this in part to the prominent role played by women in the committees, and a well-planned compensation mechanism for VPMs. As a result, there were minimal hand pump breakdowns and repairs were generally attended to in a few days. Prior to ENSURE, such repairs might take a month or longer. Trained Village Pump Mechanics (VPMs) conducted repairs, receiving compensation from the community in the form of fees or contributions. VPMs were usually able to keep a supply of spare parts commonly needed for repairs or could easily and promptly procure them, depending on the availability of resources from fees and contributions. FGDs also noted that allowing the poorest households to contribute labor (e.g., helping with repairs) rather than cash fees or contributions helped minimize defaults in contributions to VPMs.
Both KIIs and FGDs revealed that activities around digging boreholes had to be terminated due to blasting problems that arose throughout the ENSURE project area. Although the project envisioned needing to blast with explosives, it encountered significant challenges in obtaining permission to use them, and new borehole construction activities were suspended. Although the project was able to compensate by rehabilitating many water points, it nonetheless left a significant number of targeted communities without much improved access to safe water. Though improved, water remained the key limiting factor, according to FGD participants in the four ENSURE operational districts visited by the ET.
GENDER EQUITABLE PARTICIPATION AND LEADERSHIP
FGD participants in all four districts visited by the qualitative team indicated that initial WASH planning and implementation meetings consisted primarily of women, perhaps not surprisingly because WASH issues were considered as traditionally women’s issues. However, as the project progressed and as gender issues were prioritized in other project activities, men’s involvement in leadership and implementation increased, leading to more equitable gender representation in both community management and project implementation. All FGDs alluded to the enhancement of gender equity by the actions and activities of Male Advocates who, with the active support of traditional leadership, effectively promoted women’s empowerment by promoting actions to reduce women’s time burden related to their household responsibilities. That is, more men began sharing household chores with their wives, especially those that had traditionally been the exclusive domain of women (e.g., childcare, cooking). Focus groups felt strongly that improved equity is also now reflected in enhanced community cohesion in project activities such as VS&Ls, DRR activities, construction of dams, and building of latrines (e.g., in community gardens). Focus groups also indicated that support from traditional and community leaders assisted in shifting away from negative cultural norms, and that community participation was more gender-balanced than in previous projects. The exception was VPM training: FGDs suggested that women’s participation in VPM training was very low and more effort and encouragement was needed in order to improve gender equity in borehole maintenance. On further probing, FGDs revealed that women considered borehole repairs as demanding more energy and would rather leave it for men.
10 e.g., local VPMs trained to repair boreholes and who are paid for their service by the community; local shops that supply borehole spares.

Final Performance Evaluation of the ENSURE DFAP in Zimbabwe
Evaluation Findings 25
Secondly, some repairs would keep them away from their homes for extended periods, thereby compromising their primary responsibility of child and family care.
4.3 SO2: Household Income Increased
Overall, the objective of SO2 is to improve household production and market access in order to increase income, which in turn contributes to ENSURE’s main goal of improved food security. This section provides results from the endline household survey as well as insights from FGDs and KIIs.
RESULTS
Poverty indicators capture a household’s ability to meet its basic survival needs such as food, clothing, and shelter. Households have two types of resources they can draw on to meet these needs: current income, and assets they can rely on to generate future income. This report uses measures of income poverty, which indicates whether a household currently has sufficient
resources to meet basic needs. The poverty indicators used here include the percentage of households below the total per capita poverty datum line (TPCDL), and depth of poverty. For both measures, the poverty line below which a household is considered poor is the 2014 national poverty line of US$3.35 per person per day. Household income is measured using total per capita expenditures, including food and non-food items.
Poverty:11
Using the 2014 national poverty line of US$3.35 per person per day, nearly all households (93.5 percent) were below the TPCPDL at endline though there was no statistically significant change from baseline (see Annex F). Per capita daily expenditures declined from US$1.46 at baseline to US$0.94 at endline (Annex F). This is consistent with worsening economic conditions (e.g., currency crisis, hyperinflation12) in Zimbabwe during much of the life of the activity. Coupled with the difficult economic conditions, three of the five years in which ENSURE was implemented (2015, 2016, 2017) experienced drought and in March 2019 some areas of Manicaland were severely damaged by Cyclone Idai. At the time of the qualitative study, Manicaland and Masvingo provinces were classified as “stressed” or “IPC Phase 2!” by FEWS NET, where the exclamation point denotes that the situation in these provinces would be worse without ongoing humanitarian aid (FEWSnet, 2018).
Figure 6 shows the depth of poverty also increased between baseline and endline. Depth of poverty measures how far households are below the poverty line.13 At baseline, on average, households were at 59.3 percent below the poverty line; this deteriorated to 74.7 percent at endline.14 This is consistent with World Bank data showing that extreme poverty in Zimbabwe rose between 2018 and 2019.
11 See explanation of limitations around the poverty analysis under Section 3.4 Limitations, and Annex F for a more detailed breakdown of the poverty data. 12 According to the World Bank, Zimbabwe’s annual inflation rate was 230 percent, with the food price inflation rate at 319 percent as of July 2019. https://www.worldbank.org/en/country/zimbabwe/overview. 13 Using expenditures as a proxy for income. 14 Following World Bank guidance, this calculation assigns a value of zero to households above the poverty line.
Most plan to keep using what they learned through ENSURE, though there will be difficulties without continued support.
- FGD, Buhera

IMPEL | Implementer-Led Evaluation and Learning
26 Evaluation Findings
Figure 6: Mean depth of poverty at baseline (corrected) and endline (using the TPCPDL, USD 2014)
The mean depth of poverty worsened.1
1 Corrections to baseline: Monthly and annual expenditures, missing recoded to zero which allowed for a more accurate sum. ns = not significant, + p<0.1, * p<0.05, ** p<0.01, *** p<0.001
IR 2.1 – AGRICULTURAL PRODUCTIVITY AND PRODUCTION INCREASED
Dryland agriculture is the predominant livelihood activity in the six districts where ENSURE was implemented. ENSURE’s approach to improving production and productivity was to strengthen knowledge and skills associated with dryland crop production, introduce irrigated vegetable gardens and fruit trees, and rehabilitate or create irrigation schemes that support crop and livestock production as well as provide water for domestic uses.
Along with project-promoted dryland crops of sorghum, millet, cowpea, and groundnuts, farmers produced a number of nutritious vegetables under irrigation in protected garden sites, including nutrient-rich leafy green and orange-fleshed vegetables. Direct observations of gardens during qualitative fieldwork suggest most gardens are dominated by a combination of project-promoted and other desirable crops including cabbage, tomatoes, covo, and onions (e.g., king onions). Other vegetables observed by the team included butternut squash, beans, okra, rape, carrots, spinach, shallots, garlic, and cucumber. Most garden sites visited by the team had also produced—and sold through contractual agreements—the biofortified sugar bean variety, NUA45.
In concert with Agritex officers, ENSURE staff promoted improved varieties of crops (e.g., NUA45) and livestock (e.g., Boschveld chickens), crop cultural practices (e.g., spacing, row planting, thinning), early planting, conservation agriculture (e.g., low-tillage, mulching, crop rotations), contour farming, irrigation practices, supplementary feeding for livestock, livestock health (e.g., vaccinations), improved livestock pens/shelters (e.g., poultry, goats), proper use of pesticides, soil conservation, animal breeding, post-harvest handling and storage, etc.
Figure 7 presents findings regarding rates of adoption of improved practices based on the household surveys. These data show that although the percentage of farmers adopting at least five sustainable crop practices/technologies increased between baseline and endline, fewer farmers at endline used at least three sustainable NRM practices and improved storage practices compared to baseline. The ENSURE IPTT for 2018 provides more specific indicators and data, limited to project participants: the data show substantial achievement of targets for nearly all improved practices/technologies and only two indicators failed to meet their targets, but only by small margins—post-harvest storage and handling (84 percent of the FY18 target) and recordkeeping, budgeting, and financial management (96 percent of the FY18 target). All other improved practices and/or technologies promoted by the project surpassed FY18 targets, as well as life-of-activity targets, including crop genetics, livestock management, crop management, pest management, soil-related fertility and conservation, irrigation practices, water management, and climate adaptation/mitigation practices (World Vision Zimbabwe, 2019d).
Again, this seeming “contradiction” could result from differences in PBS data (the baseline and endline surveys include both project participants and non-participants) and data derived from beneficiary-based
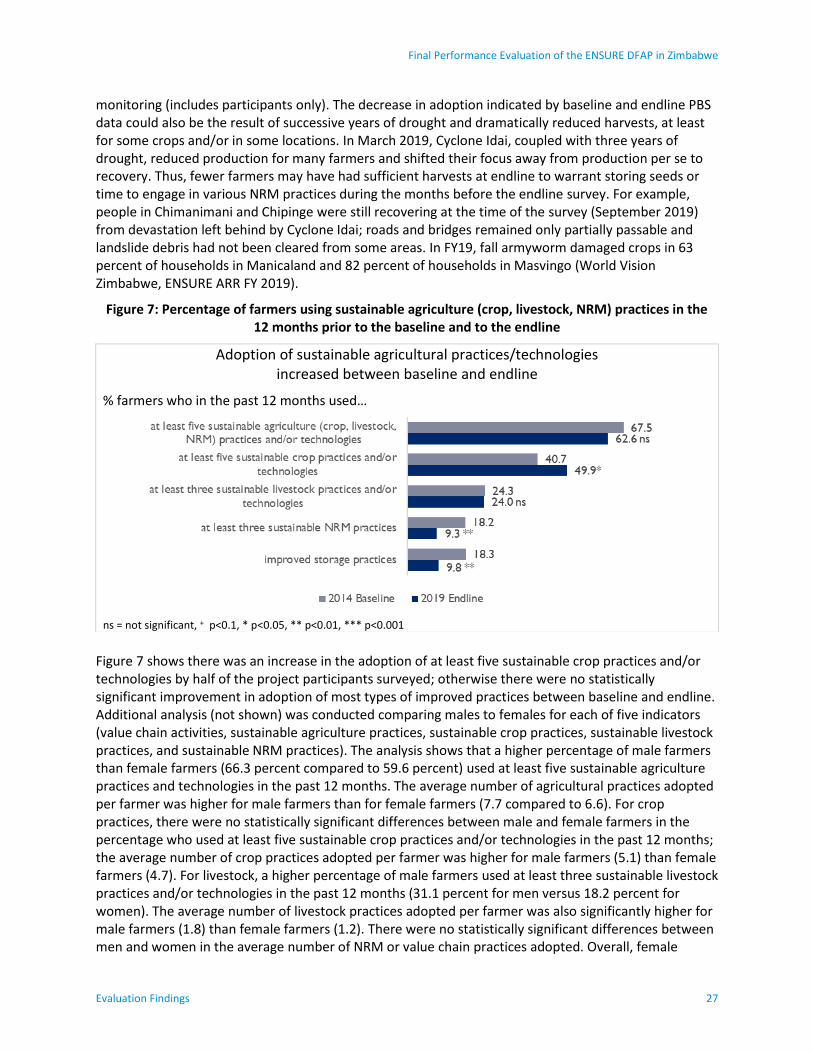
Final Performance Evaluation of the ENSURE DFAP in Zimbabwe
Evaluation Findings 27
monitoring (includes participants only). The decrease in adoption indicated by baseline and endline PBS data could also be the result of successive years of drought and dramatically reduced harvests, at least for some crops and/or in some locations. In March 2019, Cyclone Idai, coupled with three years of drought, reduced production for many farmers and shifted their focus away from production per se to recovery. Thus, fewer farmers may have had sufficient harvests at endline to warrant storing seeds or time to engage in various NRM practices during the months before the endline survey. For example, people in Chimanimani and Chipinge were still recovering at the time of the survey (September 2019) from devastation left behind by Cyclone Idai; roads and bridges remained only partially passable and landslide debris had not been cleared from some areas. In FY19, fall armyworm damaged crops in 63 percent of households in Manicaland and 82 percent of households in Masvingo (World Vision Zimbabwe, ENSURE ARR FY 2019).
Figure 7 shows there was an increase in the adoption of at least five sustainable crop practices and/or technologies by half of the project participants surveyed; otherwise there were no statistically significant improvement in adoption of most types of improved practices between baseline and endline. Additional analysis (not shown) was conducted comparing males to females for each of five indicators (value chain activities, sustainable agriculture practices, sustainable crop practices, sustainable livestock practices, and sustainable NRM practices). The analysis shows that a higher percentage of male farmers than female farmers (66.3 percent compared to 59.6 percent) used at least five sustainable agriculture practices and technologies in the past 12 months. The average number of agricultural practices adopted per farmer was higher for male farmers than for female farmers (7.7 compared to 6.6). For crop practices, there were no statistically significant differences between male and female farmers in the percentage who used at least five sustainable crop practices and/or technologies in the past 12 months; the average number of crop practices adopted per farmer was higher for male farmers (5.1) than female farmers (4.7). For livestock, a higher percentage of male farmers used at least three sustainable livestock practices and/or technologies in the past 12 months (31.1 percent for men versus 18.2 percent for women). The average number of livestock practices adopted per farmer was also significantly higher for male farmers (1.8) than female farmers (1.2). There were no statistically significant differences between men and women in the average number of NRM or value chain practices adopted. Overall, female
Figure 7: Percentage of farmers using sustainable agriculture (crop, livestock, NRM) practices in the 12 months prior to the baseline and to the endline
Adoption of sustainable agricultural practices/technologies increased between baseline and endline
% farmers who in the past 12 months used…
ns = not significant, + p<0.1, * p<0.05, ** p<0.01, *** p<0.001

IMPEL | Implementer-Led Evaluation and Learning
28 Evaluation Findings
farmers had lower adoption rates than male farmers, likely due to a higher labor burden, less access to resources, and in some cases constraints to female ownership of large productive assets (e.g., livestock).
Perhaps the more interesting observations are around the somewhat low rates of adoption generally, and particularly for sustainable livestock and NRM practices, as well as improved storage practices. FGDs and KIIs recounted how successive droughts affected the ENSURE program area over a three-year period, as did flooding and other damage from Cyclone Idai (though some areas were harder hit than others). Floods destroyed bridges, fields and crops, and swept away livestock. Drought reduced crop yields and eliminated household stocks. Landslides washed out roads and covered houses and land with boulders and other debris. People lost family members and friends, their productive assets, and their market and communications access. Simply put, people may have had more pressing concerns to deal with over the 12 months prior to the endline survey than ensuring they were employing the specific practices promoted through ENSURE.
The qualitative data provide a somewhat more encouraging perspective, however. FGD participants and key informants were unanimous in their appreciation of the skills and resources acquired through ENSURE, in particular as regards improved crop and vegetable production. Almost all agreed their productivity had improved as a result of their participation in the project and adoption of the practices they learned therein. For example, early planting and optimal spacing of crops, use of contour and conservation farming to help preserve soil moisture, improve soil fertility and reduce soil erosion, better pest management through IPM practices, irrigation, supplementary feeding, protected shelter and vaccinations for livestock, and use of crop and livestock breeds better adapted to their production areas were all perceived to have contributed to increased production of their dryland crops (e.g., sorghum, groundnuts), vegetables, and livestock.
As earlier noted, prevailing economic conditions tempered gains; very limited market opportunities for most agricultural products, high transport costs, and unstable and variable prices all created a difficult and risky environment for small businesses. Successive years of drought also eroded progress. Despite these difficulties, focus groups and key informants agreed they had benefitted greatly and would continue to engage in production and marketing strategies they had learned through ENSURE. There was unanimous agreement by FGD participants, however, that more boreholes—better access to water—was key to their ability to deal with droughts.
Several focus groups mentioned the difficulty of engaging youth in the project. In particular, participants suggested that the lack of financial incentives as part of the project meant youths were not particularly incentivized to remain in their communities to earn their livings. Rather, youths—males in particular—are highly mobile and continued to migrate both within and outside of Zimbabwe to “look for greener pastures” that would enable them to better care for their families.
IR 2.2 INCREASED REVENUE FROM TARGETED VALUE CHAINS
Originally, five value chains were identified through a value chain analysis conducted in participating ENSURE districts. The value chains selected were sorghum, groundnut/roundnut, sugar beans, indigenous poultry, and goats. The main strategy for promoting value chains used by ENSURE involved formation of producer and marketing groups (PMGs). Groups received training on small grain production (e.g., sorghum, rapoko [millet], cowpeas, groundnuts), poultry and goat rearing, vegetable production, post-harvest handling, seed storage, value-addition (e.g., peanut butter, solar drying of vegetables), and marketing. Each PMG selected one or more Market Facilitators to seek new markets and negotiate with market actors.

Final Performance Evaluation of the ENSURE DFAP in Zimbabwe
Evaluation Findings 29
Endline survey results show no significant change in the percentage of farmers who practiced value chain activities promoted by the project in the 12 months prior to the survey (Figure 8). Project reports noted that due to the drought, male farmers sought to diversity their livelihood activities, including off-farm activities (World Vision Zimbabwe, ENSURE ARR FY 2019). Overall, approximately three-fourths of farmers in the ENSURE implementation area were engaged in one or more of the five value chains, regardless of their participation with ENSURE. The project reported that currency fluctuations made it difficult to calculate income, gross margin, and value of incremental sales (World Vision Zimbabwe, ENSURE ARR FY 2019).
Figure 8: Percentage of farmers who practiced value chain activities promoted by the project in the past 12 months
Participation of farmers in value chain activities promoted by the project
did not change between the baseline and the endline
ns = not significant, + p<0.1, * p<0.05, ** p<0.01, *** p<0.001
Sorghum
One of the more impressive value chains promoted by the project involved linking small producers with WFP’s Purchase for Progress (P4P) initiative, which was implemented as a pilot initiative in two wards in Chivi and two in Buhera. ENSURE supported 36 sorghum producer and marketing groups with 313 farmers in these wards to register as three cooperatives. The registration allowed the groups to sell 93 metric tons of sorghum valued at more than US$27,000 to WFP’s P4P program (World Vision Zimbabwe, ENSURE ARR FY 2018). Not only did farmers increase their overall sorghum production through this partnership, but they also improved post-harvest handling, both of which resulted in increased revenue. According to project KIIs, no sorghum produced by the ENSURE farmers has been rejected due to issues with seed quality. Several PMG spoke of growth in their production and sales since participating in the project. In Chivi, PMG members indicated that prior to ENSURE, they typically harvested five bags (one bag = 50 kg), or about 250 kg, of sorghum from 1.5 ha of farmland. Now, as a result of their ENSURE training, they harvest approximately one metric ton (1000 kg) from the same amount of land. Supported by the Zimbabwe Women’s Microfinance Bank, who provided seed and fertilizer as loans, the group has a three-year contract with WFP. The Market Facilitator maintains the relationship between the PMG and WFP. Another group in Chivi has reportedly sold their sorghum to WFP for two years, with one year remaining on their contract. The first year they sold nine tons of seed. Drought during the second year of production limited their sales to four tons. Another PMG in Chivi produced and sold over 12 tons of white sorghum to WFP, though their productivity was also depressed due to drought. Although prices vary year to year, the PMG only sells to WFP (they retain some seed for household use), who provides them with branded sacks. Production is aggregated at the community level, where WFP staff come to weigh and retrieve the sacks. Payment is deposited in a bank (e.g., Stewart Bank), and withdrawn by the Market Facilitator, who distributes it among group members. In FY18, despite a dry spell and fall armyworm infestations, 183 (58 percent) of the farmers from the cooperatives sold sorghum to WFP’s P4P program; in FY19, 111 (31 percent) farmers sold sorghum the WFP program. The program attributes the lower number in FY 19 to reduced production due to drought, a preference by some farmers to keep
IMPEL | Implementer-Led Evaluation and Learning
30 Evaluation Findings
the grain for consumption, and farmers no longer receiving payment from WFP in USD due to a change in government policy (World Vision Zimbabwe, ENSURE ARR FY 2018 and FY 2019).
ENSURE, in partnership with Agritex, provided producers with training regarding physiological maturity of sorghum seed and what signs to look for to determine ripeness. Harvesting seed too early, before it is fully mature, causes the grains to be shrunken and not fully formed, which does not meet market standards. They were also trained in proper harvesting techniques (e.g., cutting only the seed heads and not the entire stalk) and threshing practices that help minimize contamination with weeds, dirt, etc.
FGD respondents felt that the P4P pilot had been extremely successful, even considering the drought. That is, even with drought-reduced yields (amount produced per area of land), they are planting more hectares and as a group are able to sell considerably more than was the case prior to ENSURE. At least one group noted that training in FaaB was key; they simply had never considered sorghum as a business. Now, they are able to profit from dryland production, using their earnings to pay for school fees and invest in other IGAs. They also learned about the importance of recordkeeping and costing—including the costs of consumption (not just sales), and marketing, including market research and securing contractual agreements prior to beginning production. After learning about FaaB, which was a new concept, most households satisfy their home consumption needs and sell what remains.
Poultry/goats
Poultry appears to be perhaps the most profitable value chain, according to FGDs. For many, money earned from selling their garden vegetables is used to buy chicks. Most poultry PMGs have been able to secure some type of contractual agreement for poultry (see box), including with nearby mining operations, boarding and local schools (i.e., feeding points), resort hotels in Masvingo, vendors and small businesses in nearby Growth Points, and commodity outlets at both district and national levels. In an FGD, one woman indicated she was able to send her children to university as a result of her poultry income. Thus, at the very least, the poultry value chain provided significant income for some producers over the course of the project.
Poultry production has involved the White Sussex and Boschveld breeds. Many farmers stopped using White Sussex due to their comparatively low egg-laying rates or their tendency to “produce too many cocks.” In contrast, Boschvelds easily brood and hatch chicks, and are sometimes used as surrogate incubators for poultry hatching given the lack of electricity in much of rural Zimbabwe and rolling power cuts across the country. According to one poultry producer in Zaka, Boschvelds produce one egg each day for up to 70 days, and then stop for about two weeks before starting to lay again.
Eggs and live chickens are sold locally to schoolteachers, who use them for school events as well as their own meals. Teachers often buy in bulk, which provides producers with income sufficient for school fees and other basic household needs. Although egg markets are not typically flooded, most local buyers have cash shortages, limiting their ability to purchase steady supplies of eggs from producers.
In one community in Zaka, poultry producers invest their income in the VS&L, which is then a source of funding for purchasing additional chicks. Monthly VS&L contributions range from Z$5 to Z$10. The VS&L constitution mandates a minimum of Z$50 saved before loans can be made. In this community, there are four poultry VS&Ls, each with 20 households.

Final Performance Evaluation of the ENSURE DFAP in Zimbabwe
Evaluation Findings 31
Partnering on Poultry and Poultry Production
ENSURE, Metbank and National Organic Produce (NOP) formed a partnership in 2015 to support fertilized egg and poultry production as an IGA for ENSURE participants. The partnership gave ENSURE farmers trained in FaaB access to financial services through Metbank, and gave the bank the ability to reach individual farmers, while NOP provided a link to markets. The activity was very successful and to date, 500 farmers have accessed over US$250,000 in loans for poultry and fertilized egg production, with a 92 percent repayment rate. Unfortunately, Metbank suspended its loans in June 2018, as the difference between its lending rate and the high inflation rate made loans unprofitable. There are currently 300 ENSURE farmers waiting for new loans. Metbank considers the activity a success and wants to continue with the program, though its future ability to participate is unclear.
Along with poultry, ENSURE promoted goats as a value chain activity. FGD participants expressed great interest in—and noted the potential of—goat rearing as a source of household income, but current economic conditions within Zimbabwe are not particularly conducive to helping small producers easily access the market. The main constraint appears to be the cash shortage on the part of buyers, who simply did not have sufficient capital for purchasing animals (nor could they easily get loans from banks) or paid low prices. One goat PMG in Manicaland indicated their goats were in good condition, a result of their training by ENSURE. They had a new shaded, nine-pen holding area built through ENSURE, but were still unable to attract buyers to the community. Neither were they able to hire transport to get to other markets, where prices might have been somewhat higher. Although their animals are in good body condition, herds remain small, averaging less than 10 animals. Most goat producers indicated they need at least 30-40 animals in order to really benefit; larger herds allow for the sale of some while maintaining enough to breed. Though goats are primarily managed to produce live animals for sale, they also provide milk for household consumption. Groups learned to feed goats with stalks and other plant debris from their sorghum and groundnut harvests.
Sugar beans
FGD participants also considered the Michigan white bean value chain to have been quite successful. Most gardens visited by the qualitative evaluation team grew the NUA45 variety of white bean, which was grown through a contracted arrangement with Cairns Food Company. As such, Cairns provided the seed to small producers and then agreed to purchase the beans after harvest. Households with plots in irrigated gardens grew the beans, producing four to five packets per household, or the equivalent of approximately 80-100 kg per household (20 kg = 1 packet). Harvested beans were then aggregated at the community level and picked up by Cairns. One PMG in Chimanimani indicated they had lost money due to a delay by Cairns in picking up the harvest. Instead of receiving Z$20-30 per kg as expected, they only received Z$18.
Village Savings & Loans/Lending associations
The VS&L component of ENSURE has been highly successful, and contributed financially to activities in all three SOs (e.g., via latrine construction and food purchases, agricultural income and IGAs, and contributions to maintenance costs for infrastructure assets), though VS&Ls reported facing challenges due to the economic environment. Participants received training on VS&L formation and financial management, and take their constitutions and loan repayment obligations very seriously: in FGDs members often cited their responsibility to adhere to their constitution. Monthly contributions varied by community and by type of VS&L. For women in particular, the VS&Ls provided a means to save money

IMPEL | Implementer-Led Evaluation and Learning
32 Evaluation Findings
and earn interest for the first time. As the primary source of loans for most farmers participating in the ENSURE project, loans from VS&Ls were used for a wide variety of purposes (see box).
FGD participants indicated their communities had multiple VS&L groups. Some were for specific value chains (e.g., gardens, poultry), but generally VS&Ls were not restricted to one value chain. One focus group in Chivi indicated there were about six VS&L groups in that community, each with at least 10 members, and that funds from the VS&Ls are
specifically for the garden, where members use VS&L funds to buy seeds, fencing, and other inputs from nearby Growth Points. Many garden PMGs indicated that above and beyond any garden VS&Ls, households with garden plots were required to make monthly contributions, in this case, Z$2 per household. Some groups set different contribution levels to accommodate households that are unable to afford higher levels, for example, because they have many children.
Many VS&L groups have been functioning well and nearly all members in VS&L FGDs reported taking and repaying loans. However, groups are facing a challenge with rising prices and inflation, and many groups have made changes in order for their VS&Ls to remain functional in the challenging environment. Many groups indicated that they had increased their monthly contributions to the VS&L in order to meet rising costs; rates had increased from $Z1 to Z$10 in one group and from $Z10 to $Z20 in others. Some groups have decided to buy groceries to stockpile and share out in order to preserve the immediate value of their cash, while others are able to convert their savings into hard currency. Some groups indicated their VS&Ls were still functional, but “less so at the moment.” In still other cases, loan activities were suspended because members were afraid that they might not be able to repay the loans. The effect of the difficult economic situation on VS&Ls affected other project activities, as the VS&Ls are the main funders for private latrine construction and the maintenance of infrastructure built under ENSURE. The project tried to mitigate this by encouraging communities to diversify their on-farm and off-farm income-generating activities (World Vision Zimbabwe, ENSURE ARR FY 2018).
Focus group members noted that they had also learned how to “secure market agreements before beginning production” and that such skills have given them more confidence to approach and link up with banks and buyers. Several PMGs acknowledged that they now have their own SACCO accounts (e.g., from gardening PMGs) from which loans are provided—at 20 percent interest—and repaid after one month. Such accounts help link farmers to formal banks, such as Metbank, and offer access to larger loans than VS&Ls can provide. The success of this linkage was shown in FY19, when 50 VS&L and PMGs were able to access over US$23,000 in loans through the project-supported link with the National Organic Produce Metbank loan facility (World Vision Zimbabwe, ENSURE ARR FY 2019). KII at the government-supported Zimbabwe Women’s Microfinance Bank, an ENSURE partner, said that ENSURE groups provide a new market for the bank, as the groups are well organized, know how to handle money, know how loans work, and are operating IGAs.
VS&L Loans
Money borrowed from VS&Ls was used for a wide variety of purposes:
Buying and reselling clothes bought in South Africa or Mozambique
Buying and reselling household items (soap, flour, oil, sugar, tea, etc.)
Purchase and resale of fish
Making pottery and other crafts (e.g., Baobab “carpets”)
Producing and selling peanut butter
Producing and selling dried vegetables (rape, covo, sweet cabbage)
Paying school fees and buying school uniforms
Buying households utensils and furniture and improving houses
Final Performance Evaluation of the ENSURE DFAP in Zimbabwe
Evaluation Findings 33
Perhaps not surprisingly, most FGD participants agreed that within their communities, “everyone is in a VS&L.” The groups include both males and females, and many groups have women in leadership positions (e.g., chairperson, secretary, treasurer). Both women and men agreed strongly that increased participation of women in leadership roles benefits everyone. As one male FGD participant said, “The women give men lots of ideas; men don’t mind women in leadership roles.” With VS&Ls serving as one vehicle for ENSURE’s gender messaging, both men and women felt that things had improved with more women’s engagement and participation. There was a perception that whereas women used to be “below men,” making it hard for them to express their views, they “are now equal.”
Access to Market Information
According to the 2019 Annual Beneficiary-Based Survey, farmers participating in ENSURE activities continue to receive market information, primarily at community meetings but also through their Market Facilitators (World Vision 2019). This is consistent with qualitative findings suggesting that while farmers took advantage of the ESOKO platform early in the program, price volatility and inflation rendered it mostly moot. Network capacity is also unreliable or non-existent in some of the ENSURE implementation area, limiting the usefulness of mobile-phone-based communications. Rather, many farmers came to rely primarily on personal relationships (i.e., individuals’ direct linkages to specific markets or market actors) as their main sources of information. FGD participants in other areas, however, indicated they used—and were quite satisfied with—other information platforms, including the radio and WhatsApp.
Access to Financial Services
Financial literacy trainings provided through VS&L activities contributed to expanded knowledge and skills related to loan acquisition and management. The percentage of farmers who used financial services in the 12 months prior to the survey increased by 13.3 percentage points between baseline and endline (Figure 9). The increase from baseline to endline was larger among female than male farmers (see Annex F), which is in line with the program’s focus on women in value chain and other IGA activities. For example, the Women’s Empowerment Bank, an ENSURE partner that began operations in 2018, prioritized loans for women. Women were the main participants in ENSURE financial service activities, in part due to men prioritizing off-farm activities (e.g., casual labor and gold panning). ABBS data from 2019 suggest that the value of loans was small, not the least due to the volatile economic context within the country; farmers were reluctant to take out a loan and banks were reluctant to issue loans. Farmers choose to finance only part of their input needs (e.g., seeds) through loans, relying on VS&L savings for other inputs—or eliminating them altogether.
The unfavorable commercial lending environment made it difficult for poor smallholder farmers to obtain loans for investment. As an adaptive strategy, ENSURE encouraged VS&Ls to grow their capital and to provide a much-needed source of capital for IGAs. ENSURE also increasingly encouraged Men’s Fora participants to join VS&L groups to help them overcome barriers associated with limited access to income. This was a major change in ENSURE’s original conceptualization of VS&Ls, and the subsequent loans from VS&Ls for IGAs provided an important means of funding value chain activities promoted by ENSURE (World Vision Zimbabwe, ENSURE ARR FY 2015).
The volatile economic situation was a persistent drag on the financial inclusion goals of ENSURE; project reports note that in 2016 VS&L members could not withdraw cash from their bank accounts due to a banking crisis (World Vision Zimbabwe, ENSURE ARR FY 2016).
Women’s involvement uplifts the community because women give constructive ideas.
- FGD; Chimanimani

IMPEL | Implementer-Led Evaluation and Learning
34 Evaluation Findings
IR 2.3 HOUSEHOLD INCOME INCREASED
Using daily per capita expenditures (USD 2014) as a proxy for household income, Figure 10 shows that household income decreased dramatically over time and that this is consistent with an increase in the percentage of households living in poverty. The largest decline in expenditures was among households with adult males and no adult females (Annex F), though this type of household is a very small proportion of the overall sample. For households with adult males and no adult females, the average per capita expenditures dropped from US$2.61 at baseline (corrected) to US$1.52 at endline.15 At endline, households with male and female adults had the highest prevalence of poverty, the worst depth of poverty, and the lowest expenditures.
During FY19, project monitoring recorded that 50 percent of the cereal crop, particularly maize, failed and the yield of sorghum and other grains fell more than 40 percent, due to extreme weather. That was followed by Cyclone Idai, which affected 20 percent to 60 percent of project wards (World Vision Zimbabwe, ENSURE ARR FY 2019).
Figure 10: Per capita daily expenditures (USD 2014)
Qualitative data from focus groups paint a slightly different picture in terms of household income, though they do not necessarily contradict quantitative results. By and large most FGD participants
15 There were only 46 "adult males no adult female" households out of the 1,214 households surveyed, representing less than 4 percent of all households.
Figure 9: Percentage of farmers who used financial services in the past 12 months
Farmers’ use of financial services increased between the 2014 baseline and 2019 endline
ns = not significant, + p<0.1, * p<0.05, ** p<0.01, *** p<0.001
Daily per capita expenditures (USD 2014) decreased for all groups
ns = not significant, + p<0.1, * p<0.05, ** p<0.01, *** p<0.001 Note: Corrections to baseline: Monthly and annual expenditures, missing recoded to zero which allowed for a more accurate sum. Endline monthly expenditures were imputed. Inflation adjusted price per kilogram from the baseline dataset were applied some baseline food expenditures.

Final Performance Evaluation of the ENSURE DFAP in Zimbabwe
Evaluation Findings 35
suggested their household income had gone up substantially as a result of participation in ENSURE. Key informants confirmed that people generally perceived their income to have increased as a result of ENSURE, though it varied somewhat on the value chain activities they engaged in (e.g., horticulture, goats, poultry).
According to one KII in Masvingo, the gross margin for ENSURE’s sugar bean producers was approximately US$1,400 per ton from irrigated plots. Producers involved with WFP’s P4P program had an average gross margin of US$339 per ton for white sorghum. In Chivi, producers sold approximately 24 tons of white sorghum to the P4P program in 2018 and 15 tons in 2019. Red sorghum, which is used for brewing beer, has a considerably higher gross margin, at US$750 per ton. The gross margin for goats was US$26 per animal. This is slightly higher than what is typical because there are no costs associated with purchased feed; producers tend to browse their goats rather than provide supplemental feed other than plant stalks from their own fields.
Increased household income allowed families to send their children to school, and in particular to university, which is still valued as a pathway out of poverty in rural Zimbabwe. The increased income also allowed people to invest in small IGAs, such as buying chicks and young livestock to raise for sale, selling clothing, and operating small grocery stores.
The apparent discrepancy between measured (i.e., household expenditures) and perceived (i.e., FGD input) income could stem from several potential sources. First, the indicators do not directly measure income but rather household expenditures, a proxy for household income. Thus, it is possible that reports of household expenditures do not adequately represent income within the ENSURE implementation area. Second, Figure 10 is based on PBS data and may reflect a lack of spillover effect from the project. That is, the benefits of the ENSURE project did not spread beyond immediate participants. Participants did, however, indicate that rising prices for food, inputs, and other necessities were having a negative impact on their incomes.
It should be noted that estimates of income aside, variable prices, hyperinflation, lack of capital, and unavailability of physical cash create difficult conditions in which households are attempting to provide for their families. Still, many FGD participants feel they are doing better income-wise, not the least because in many households, women are now engaged in IGAs, thus resulting in two sources of income in the household. Overall, VS&Ls were considered very successful. Although the VS&L concept was not new, the activity provided women, in particular, a place to grow their savings for the first time, and introduced the concept of using their money for investing in income-generating activities.
4.4 SO3: Resilience to Food Insecurity of Communities Improved
SO3 focuses on empowering existing community structures to identify, anticipate, and mitigate known environmental risks to the predominantly traditional livelihoods common in the ENSURE implementation area. Activities focused on disaster preparedness, including access to and dissemination of early warning information; training on resource management and DRR practices; participatory community disaster reduction plans; and asset management. FFA was used to build or rehabilitate community assets and specifically included the most vulnerable households (e.g., female-headed households without males).
RESULTS
Key results for SO3 include food security indicators. Household hunger was measured using the Household Hunger Scale (HHS), an index that reflects people’s experiences with food insecurity. It is

IMPEL | Implementer-Led Evaluation and Learning
36 Evaluation Findings
based on three questions regarding the most severe forms of food insecurity. A score ranging from 0 to 6 is constructed and the prevalence of hunger is then calculated as a percentage of households whose index value is greater than or equal to two, which represents “moderate to severe hunger.”
The prevalence of households with moderate or severe hunger increased among the overall sample (Figure 11) and for households with male and female adults but not for single-headed households (see Annex F). This is consistent with a general deterioration in the economic context within Zimbabwe, including high prices and inflation, as well as several years of sequential drought that reduced production. Households that participated in ENSURE experienced less moderate to severe hunger (31.7 percent) than households that did not participate in ENSURE (40.9 percent) (see Annex J).
Figure 11: Percentage of households with moderate or severe hunger (HHS)
The prevalence of moderate or severe hunger increased.
ns = not significant, + p<0.1, * p<0.05, ** p<0.01, *** p<0.001
The Food Consumption Score (FCS) is an indicator of dietary quality and how regularly people eat. At endline, higher percentages of households have poor to borderline FCS compared to baseline, indicating worsening food security (Figure 12).
The Coping Strategies Index (CSI) is a scale that accounts for the frequency and severity of coping strategies households use to deal with food insecurity. The CSI measures the extent to which households use negative coping strategies such as limiting the quantity and quality of meals, borrowing food, switching to less-preferred food types, or begging to deal with difficulties accessing food in the 30
Figure 12: Percentage of households with poor, borderline, or adequate Food Consumption Score at baseline (2014) and endline (2019)
Food insecurity increased between baseline and endline
ns = not significant, +p<0.1, * p<0.05, ** p<0.01, *** p<0.001
Final Performance Evaluation of the ENSURE DFAP in Zimbabwe
Evaluation Findings 37
days prior to the survey. The index is calculated as a weighted average of the number of days a strategy was employed, where the weights reflect the severity of food insecurity associated with each strategy.
The maximum value in the endline sample for the CSI is 234. The average CSI increased from 28.6 at baseline to 45.7 at endline (see Annex F), indicating greater reliance on negative coping strategies at endline than at baseline.
In contrast to the PBS data, and despite the climate and economic shocks, the majority of ENSURE respondents in the qualitative study stated that they are more food secure than before the project, especially those who had access to the irrigated community gardens and water for livestock. Through the different income-generating enterprises (goat, poultry, cowpeas, groundnuts, cattle and roundnuts, vegetables from the garden, fish from the dams), farmers have been able to earn a little more income for food, shelter and other basic family needs. Loans from VS&Ls have enabled women in particular to start or expand small businesses that not only increased income, but strengthened resilience by enabling them to pay school fees to keep children in school, and increased dignity by allowing them to buy household utensils and furniture. Unfortunately, the macro-economic changes are eroding income gains and keeping participants from fully experiencing the positive impact. Nevertheless, some are still better-off than they would have been without the project: farmers in one FGD stated that due to the drought they harvested only about half of their crop, however this is a positive outcome because they said that before ENSURE they would have harvested nothing.
IR 3.1 COMMUNITY DISASTER MANAGEMENT AND PREPAREDNESS CAPACITIES IMPROVED
ENSURE has worked to build the capacity of communities to become more resilient to shocks through early warning, greater preparedness, and risk reduction measures. In response to common shocks (e.g., floods; drought; cholera outbreaks; crop pests and diseases such as fall armyworm; invasive plants such as lantana; and price increases), the project supported participants in gully reclamation, dam and irrigation system maintenance, rehabilitation of access roads, and provision of water for livestock.
The foundation for much of ENSURE’s success was built through reactivating and strengthening community-based Disaster Management Committees (DMCs) in all 66 wards and using DRR activities as an entry point with communities. As some of the first activities implemented under the program, community-based disaster risk management (CBDRM) exercises and the creation of disaster management plans allowed for significant awareness-raising within communities and a sense of community ownership. For example, when asked if the ideas for ENSURE activities came from the community or from the ENSURE project, participants were emphatic that the activities originated with the community. A strong participatory process brought together the communities, local authorities and relevant government departments in conducting vulnerability and capacity assessments and developing disaster preparedness plans. This included identifying the priority needs of male and female beneficiaries, which was done in all 66 wards. A number of focus groups were extremely proud of the work their communities had done toward developing such plans, including identification of key risks and appropriate responses. Community members developed hazard maps and DRR plans for their villages, which wards then took to the district for consolidation into district DRR plans, which cascade back down to ward and community level. All (100 percent) of the target wards have disaster and early warning and response plans that are working effectively and that have identified the priority needs of both men and women. The value of the DMCs was demonstrated during Cyclone Idai, when committees were able to disseminate early warning messages before the cyclone hit, then aided the district Civil Protection Units (CPU) by collecting damage reports after the disaster (World Vision Zimbabwe, ENSURE ARR FY 2019).

IMPEL | Implementer-Led Evaluation and Learning
38 Evaluation Findings
ENSURE also sought to provide women, who are more vulnerable to disasters, with risk and early warning information. There has been an improvement in women’s ability to access early warning information since the beginning of the project, with access rising from 66.6 percent to 85.6 percent of respondents (against a 90 percent target), and more women (81 percent) than men (73.2 percent) receiving early warning information (World Vision Zimbabwe, 2019b). Both men and women indicated that information on weather, pests, and diseases was useful. The project noted that remote communities with poor connectivity face a greater challenge in accessing timely information; the Meteorological Services supplied communities with radios but they experienced connectivity problems (World Vision Zimbabwe. ENSURE ARR FY 2019).
ENSURE participants said that they obtained early warning information mainly from community and DMC meetings; they confirmed that the DMCs are connected to the government Meteorological Services Department, which provides weather information and early warning updates. Participants also reported receiving early warning information from WhatsApp
groups and community gatherings, and at times DMC members would disseminate information directly to households. The project also disseminated early warning information through Farmer Field School sessions, radio, national DRR commemoration days, and simple fact sheets on El Niño (World Vision Zimbabwe. ENSURE ARR FY 2019).
In qualitative interviews, DMC members explained how they work with village leaders and community-based implementation committees to develop plans for mitigating and preventing siltation, floods and other disasters. The DMC sends requests and suggestions to the Civil Protection Unit at the district level, which is responsible for responding to resource requests by communities as well as to disasters. For example, one community in Chimanimani had a request pending at the time of the endline for a dam scooper in order to remove built-up sand from behind a local dam and to install fencing to protect a garden. They had also solicited permission to increase the height of a local dam.
DMCs helped site and build dams, as well as ensure conducive working conditions under ENSURE, for example, by ensuring food was provided to workers, according to a DMC FGD in Chimanimani.
FGD and KI participants indicated that training also focused on the risks of deforestation and the importance of reforestation and watershed management. They were sensitized to avoid stream bank cultivation, to plant trees and grasses in dam catchment areas to help prevent soil erosion, and to cut tree branches (or gather dead wood) rather than fell entire trees. The dams observed by the qualitative evaluation team were well fenced and in some places the community had plans to replace the treated fence poles with trees or other live fencing.
IR 3.2 ACCESS TO AND MANAGEMENT OF DISASTER RISK AND MITIGATION ASSETS IMPROVED
Qualitative interviews indicated that community management of public assets has improved under ENSURE through the involvement of multiple community-level committees that contribute in different ways to the management of the watershed, dams, and the use/conservation of water resources. The dams and boreholes are significant community assets that have contributed to increased production, resilience to food insecurity, and income, providing strong motivation to protect and manage these assets. Furthermore, participants showed a strong sense of pride in their accomplishments and committees, which are linked to government through the Rural District Council, the district Civil Protection Unit, and the Forest Commission.
Before ENSURE, people used to live on the riverbank like [the people] in another ward, but due to warnings and teaching, people moved and no one was affected by being swept away by the river.
- Village Headman, Buhera

Final Performance Evaluation of the ENSURE DFAP in Zimbabwe
Evaluation Findings 39
Participants highly valued the construction of weir dams, associated environmental management structures, and livestock watering facilities, as they provided sustainable and easily accessible water for crops and livestock. The construction of these structures and facilities, including rehabilitation of cattle dip tanks, were welcomed by both community members and agricultural extension staff, as they were found to be as important as disaster and risk reduction measures, especially for livestock wellbeing. VS&L members in Buhera consider their dam a major success as the livestock they bought with VS&L support are drinking water from the nearby dam, making the livestock safer and saving both animals and owners from long treks to get water. The construction of the weir dams has reduced the exposure of productive assets to drought; however, with the ongoing drought, participants at several dam sites visited by the qualitative evaluation team were watering gardens by hand, and expressed concern that water levels behind the dams were very low. Although Cyclone Idai damaged eight weir sites, all the dams remained intact, testifying to the quality of their construction. Asset Management Committees (AMCs) organized recovery efforts, but project staff noted that AMCs need additional support in management, maintenance, and financing of assets to enhance sustainability, particularly as AMC funds are not adequate to cover major repairs (World Vision Zimbabwe. ENSURE ARR FY 2019). The evaluation team also notes that establishing stronger linkages of AMCs to relevant government agencies such as the Veterinary Department for dip tanks, and the Environmental Management Agency and the District Development Fund (DDF) for dams, would strengthen their sustainability.
AMCs oversee day-to-day activities and upkeep of wells and other assets. There are two sub-committees: the production/marketing sub-committee, which oversees planting plans, schedules, and other garden-related activities, and the security and maintenance sub-committee, which controls the keys and otherwise helps ensure safety and security at the garden sites. In FGDs, AMC subcommittee members explained that they meet with other committees, such as the Irrigation Management Committee, to coordinate the planning of activities. Maintenance and security committees safeguard the dam from theft of fish, and ensure that the fencing remains intact. Water point management (boreholes and other water sources that support the community) committees work to prevent breakdowns and contamination of the sites by livestock. However, rising prices for irrigation pipes and other equipment are presenting a challenge to maintenance and expansion plans. One garden chairperson in Zaka explained that a pipe needed to expand the irrigation system had quadrupled in price from RTGS 50 to RTGS 200, preventing them from expanding the garden. Communities were aware of the need for regular maintenance of assets like dams/weirs and dip tanks. As a result they collect regular contributions, which they know may not be enough in the case of major repairs. Some of the labor-based maintenance requirements are covered under the activities of the DRR committees. FGDs and KIIs also revealed that participants are aware that their assets normally fall under a government department like DDF or the Veterinary Department and they intend to seek assistance from these departments if they fall short of money for maintenance. Participants did not indicate that they know the true cost of maintenance but are very keen to maintain their assets in a functional state since they have realized the benefits.
Most irrigation schemes used low-level technology such as gravity-fed systems or solar pumps although some schemes remained dependent on diesel-powered water pumps, the fuel for and maintenance of which can be costly and difficult to obtain in remote communities. Some of the affected gardens are upstream from the water point, so gravity-fed systems do not work for them. Many focus group members were interested in solar pumps but the project budget for solar pumps had been exhausted. For one community however, the extra costs associated with a diesel pump outweighed the burden of ferrying water from the crocodile-infested river near their garden plots.

IMPEL | Implementer-Led Evaluation and Learning
40 Evaluation Findings
ENSURE supported the organization of a number of community-based committees, all of which contribute to increased capacity at the community level to identify, anticipate and mitigate risks, more effectively managing the resource base on which the community depends, and enhancing resilience to food insecurity. According to FGDs and KIIs, the management capacity of community-based committees was strengthened through the constitutions and by-laws developed with the support of ENSURE; as with the VS&Ls, participants indicated that their take their constitutions and responsibilities very seriously. The community-based Environmental Sub-Committees, which were reconstituted and/or strengthened in all wards, were able to engage people in mitigating environmental risks and protecting the natural resource base in conjunction with the Water Management Committees and DMCs. Members of the Environmental Sub-Committees, Water Management Committees and DMCs indicated that they work together closely to implement the resource management plans developed with the community.
4.5 Unintended Outcomes
A few unintended positive outcomes were reported in FGDs and KIIs with program beneficiaries, IPs, and World Vision staff.
Increased access to funds under the results-based financing mechanism. Most interviewed health workers reported that the supplementary feeding rations attracted many people to health clinics, including members of the apostolic faith and who typically shun health services. These clinics also provided other health services, including growth monitoring, vitamin A supplementation, early ANC bookings, and immunizations. The influx of people—ostensibly for supplementary feeding rations—boosted service delivery statistics and facilitated health facility access to more funds through results-based financing. Nurses reported that these funds were used to improve the quality of services by purchasing essential drugs, maternal and child health (MCH) equipment and other items required for providing better services, and setting up maternity waiting shelters.
Improved social capital: Many FGD participants and key informants noted improved relations within communities as a result of training they received in leadership and skills in coordinating and participating in community works (e.g., dam and garden construction). In particular, the group model—Care Groups, garden groups, VS&L groups—provided a strong framework around which members supported each other, including in land preparation for planting, harvesting, construction of toilets for the elderly, etc. As an indicative example, one man in a VS&L FGD in Buhera commented that VS&L members are more trusting of each other. Participation in ENSURE has also strengthened linking social capital at the local level: ENSURE activity leaders are invited to attend ward meetings and participate in ward committees, helping to ensure that they have greater voice and influence in local governance.
4.6 Factors Contributing to Outcomes
This section describes factors the evaluation team assessed as contributing to project outcomes, based on the information and perspectives gathered from KIIs with project stakeholders and FGDs with project participants.
INTEGRATION OF INTERVENTIONS
The qualitative survey found through FGD and KI interviews that the highly integrated nature of ENSURE’s interventions across SOs helped to create a supportive and enabling environment for behavior change that contributed to positive outcomes in nutrition, WASH, gender equity, savings, social capital and cohesion, and community resilience. For example, project stakeholders said that an increase in the
Final Performance Evaluation of the ENSURE DFAP in Zimbabwe
Evaluation Findings 41
availability and diversity of vegetables and fruits produced primarily through SO2 contributed to improved nutritional outcomes under SO1, reflected in a reduction in the prevalence of stunted CU5 (baseline 28.1 percent; endline 19.6 percent) (p<0.001) and a decrease in the prevalence of underweight CU5 (baseline 8.6 percent; endline 5.0 percent) (p<0.01). Care group volunteers, health workers and project staff told the qualitative study team that they attributed the improved nutritional status of CU5 in part to the garden plots and the increased production and income from the promoted value chains, as well as to the IGAs financed by their VS&L memberships. FFA activities under SO3 (e.g., building dams) directly supported the construction of irrigation systems and gardens, which allowed for better production and more diversity in foods produced as part of SO2. Participants stated that the large-scale works implemented by communities helped to build social capital and a sense of working together toward common goals, and better management of the community’s natural resources and environment through improved DRR strategies. This is particularly important in strengthening resilience at the community level, where assets (including natural resources) are built and/or maintained for the benefit of all community members, as are local structures and governance mechanisms that help direct resources in times of need.
Quantitative analyses also provided evidence of integration and its benefits. Multivariate analysis of selected outcome indicators (see Annex I) showed that participation in nutrition or agricultural training also increased the likelihood of adequate food consumption. Improvements in gender decision-making were associated with improvements in agricultural, children’s health and household food security indicators. Specifically, farmer households practicing joint decision-making about credit were more likely to use financial services and to adopt sustainable practices. CU5 living in households where male and female heads jointly owned assets were less likely to be stunted or underweight. Households with joint asset ownership were more likely to have adequate food consumption. WASH programming was associated with improved food security. The PBS survey showed that the percentage of households using an improved source of drinking water increased from 44.2 percent at baseline to 52.9 percent at endline (p<0.05), and households using soap and water at a handwashing station increased from 2.6 percent at baseline to 11.0 percent at endline (p<0.001) (Annex F). The multivariate analysis showed that these households (i.e., those using an improved drinking water source and those that had a cleansing agent and water) were more likely to have adequate food consumption.
While most agricultural indicators showed no change at the population level, the percentage of farmers who used at least five sustainable crop practices and/or technologies in the past 12 months increased from 40.7 percent at baseline to 49.9 percent at endline (p<0.05). ENSURE participants stated that the five promoted value chains—sorghum, beans, groundnuts, indigenous poultry and goats helped to increase the availability of nutritious foods for the households, through greater availability of animal-sourced protein (e.g., eggs, milk, meat) at the household level and by improving households’ ability to purchase better quality and quantity of foods due to increased income and/or savings. Communities were supported in horticulture, aquaculture, improved post-harvest handling and storage (e.g., solar drying, blanching), and food processing to better preserve nutrients, all of which facilitated better health and nutrition outcomes. Increased production and sales allowed for accrual of savings in VS&Ls, which in turn provided capital for investing in new IGAs or expanding existing ones. Despite the shocks during the LOA, the PBS indicated that farmers were able to accrue savings, and the data showed that the percentage of farmers who used financial services in the past 12 months increased from 14.2 percent at baseline to 27.5 percent at endline (p<0.001) (Annex F).
The integration of gender across all program activities helped to break down some of the socio-cultural norms that affect consumption of nutritious foods. During each monthly care group session, one specific behavior was promoted in addition to the key gender domains of household decision-making, gender-

IMPEL | Implementer-Led Evaluation and Learning
42 Evaluation Findings
based violence, equitable participation, and socialization. The Men’s Fora increased male involvement in promoting and influencing key maternal and IYCF practices at the household level. Most male project participants interviewed reported that they no longer feel ashamed to do household work, including caring for a child, or to do cooking, gardening and cleaning in the presence of other people. Additionally, many men report that they spend more time with their wives and that relationships have improved at home.
Food distributions were also integrated with MCH activities at health facilities, which increased access to health education, growth monitoring, and vitamin A supplements. Vulnerable households—in particular those with WRA and PLW– from certain religious persuasions who normally do not access health services were drawn in to health facilities by food distributions, helping to expand their knowledge and understanding of the importance of ANC.
CARE GROUP MODEL AND SBCC
Qualitative interviews with Care Group members and project staff indicated that the Care Groups helped to create effective peer networks among targeted beneficiaries. For example, the Care Group approach had a multiplier effect that resulted in reaching most beneficiary households with interpersonal behavior change communication (BCC) on maternal and IYCF practices, including exclusive breastfeeding and complementary feeding. Messages cascaded from VHWs to the Care Group leader and finally to neighborhood women through peer education. In addition, messages were also relayed from the VHW to male advocates and finally to the Men’s Fora.
KIs stated that home visits provided a unique opportunity for reaching out to other key household decision makers (e.g., men, grandmothers, mothers-in-law) with similar messages. Care Group participants said that cooking classes conducted during Care Group sessions provided the groups with firsthand knowledge regarding preparation of nutritious meals using locally available ingredients/foods. Finally, the dialogue counselling process used in monthly meetings taught women to identify barriers—and enablers/facilitators—to behavior change. The effectiveness of ENSURE and the MoHCC in promoting these messages through Care Groups is reflected in the PBS data, which show reductions in stunting and underweight in CU5, increases in exclusive breastfeeding in the first six months, and earlier antenatal visits. Women’s dietary diversity remained unchanged. The qualitative team determined that the way in which the Care Group model was implemented contributed to the success of ENSURE. However, further research is needed on the causal effect of the Care Group model to determine whether the cascade model is effective or if other factors such as SBCC sessions and home visits were determining factors in the behavioral change that was achieved.
As noted in the midterm evaluation, ENSURE used highly effective SBCC materials and messaging (ENSURE 2016). KIIs with project staff indicated that the MoHCC was closely involved in the development of Information, Education and Communication (IEC) materials and provided final approval of the materials. In addition, all IEC materials were translated and illustrated with pictorials for easy use. Most interviews with Care Group members showed that interpersonal communication was very effective for learning the messages delivered during the home group counselling sessions. In addition, the Care Group leader was able to tailor the messages provided during the home visit sessions to the unique situation of each household.
A barrier analysis conducted by ENSURE helped to identify factors that prevented the adoption of appropriate behaviors. This helped to tailor SBCC messages to beneficiaries’ information needs. Linkages between ENSURE and health facilities promoted consistency in messaging and as a result, behaviors promoted in the community through ENSURE were similar to those promoted at health facilities. For

Final Performance Evaluation of the ENSURE DFAP in Zimbabwe
Evaluation Findings 43
example, complementary feeding recipes using foods that were locally available but not commonly used were based on the barrier analysis for dietary diversity, and ENSURE helped to develop complementary feeding recipes using these foods. This recipe book helped to reinforce the trainings provided during the cooking demonstrations.
CAPACITY BUILDING OF COMMUNITIES
Along with an intentional integration of interventions and linkages to key government service providers, ENSURE worked to build capacity in communities to use the skills and knowledge acquired under the project. The capacity-building spanned all three SOs and included technical agricultural, health and nutrition knowledge, financial practices, disaster risk assessment and reduction, community water management, NRM, and gender equality. Project trainings guided behavior change, built skills to negotiate with outside entities, and strengthened relationships with government and private-sector service providers. The majority of communities voiced confidence in their new skills and knowledge and in their new connections with government and private sector.
Community leaders and elders are the custodians of community norms and their early engagement was key to reducing barriers and to the adoption of new practices. For example, the monthly social action analysis dialogues facilitated the transformation of sociocultural norms that were barriers to maternal and IYCF practices at the community level. The use of village heads to select male advocates increased enrollment of men in Care Group and facilitated receptivity to gender equality messages and practices.
MARKET SYSTEMS APPROACH
Persistent drought was a major challenge across the ENSURE implementation area. ENSURE promoted sustainable agricultural practices, and the endline PBS data showed that nearly half of all farmers were using at least five sustainable crop practices and/or technologies (Annex F). Project staff told the qualitative team that they also saw the need to thoroughly assess what mechanisms (e.g., dams, solar pumps) would help minimize the negative effects of drought. With the recurrent droughts, staff realized that farmers were eventually limited by the five value chains in terms of their ability to diversify into off-farm and non-farm IGAs. Communities had their own ideas for potential non-farm IGAs, including sewing, blacksmithing, making cooking utensils, crafts, rolling pins, etc., whose products could be sold along roadsides and through cross-border trading. Thus, a strategic shift was made from a strict value-chain approach to a market-systems approach in order to better support people’s own ideas and innovations.
NATIONAL ECONOMIC CONTEXT
As previously mentioned, the national economic situation had a strong negative effect on project outcomes. Currencies changed three times over the LOA, money was steadily losing value, cash was largely unavailable, prices varied widely, and hyper-inflation went unchecked. Overall, the lack of stability in prices and access to cash meant small producers were handicapped and subject to a highly risky business environment, which hampered marketing and sales and access to credit. The quantitative survey data show, at a population level, that per capita daily expenditures declined steeply and the percent of people below the poverty line more than doubled during the life of the project (Annex F).
IMPEL | Implementer-Led Evaluation and Learning
44 Evaluation Findings
4.7 Contribution of Activities to Mitigation, Adaptation to, and Recovery from Food
Security Shocks and Stresses
As previously discussed, ENSURE strengthened community resilience to shocks through EW, greater preparedness, and risk reduction measures (see Section 4.2 for more details). Community and household resilience has been strengthened through the combination and integration of activities under the three strategic objectives, as discussed in detail above. In addition to its programmed activities, ENSURE mounted an emergency lean season food assistance program in FY 17 in response to the severe drought, providing a protective ration to vulnerable people within its operational area.
Based on FGD and KI input, the project greatly improved people’s ability to generate income, to produce more and better-quality agricultural products—both crops and livestock, and improved their access to certain assets that help protect against climate shocks, especially drought. Supplementary feeding rations increased access to nutritious meals for PLW and children aged six to 23 months, at least temporarily. Cooking demonstrations and trainings on preparation of nutritious locally available foods and knowledge of how to prepare enriched porridge strengthened households’ ability to provide better diets over the longer-term. Adoption of better health, IYCF, and WASH practices contributes to human capital, resulting in better schooling outcomes for children and better productive outcomes for adults. Overall, people are healthier and more able to engage in productive pursuits that provide food and income for household needs and strengthen their ability to deal with future shocks.
However, Cyclone Idai had a significant impact on people’s lives and livelihoods, as well as on project implementation. After the cyclone, staff assessed the damage and needs going forward, encouraging people, and helping with awareness campaigns and ideas of how to get back on their feet. Communities came together to consider and implement feasible recovery measures, and in particular, had a new appreciation for disaster preparedness and DRR activities.
Infrastructure needed to be rehabilitated, which delayed implementation of activities underway. For example, sand needed to be removed from dams before gardening activities could resume in earnest. Livestock shelters needed to be reinforced or repaired. Overall, the project shifted its approach in response to the cyclone, focusing more on rehabilitation of assets and getting people back on their feet in terms of their livelihoods. Staff efforts prioritized disaster preparedness and livelihood diversification, particularly into non- and off-farm IGAs.
4.8 Beneficiary Satisfaction
In qualitative study interviews, participants expressed a high degree of satisfaction with ENSURE activities and results and thought the activities were the right ones to benefit their community. These sentiments are reflected in the discussion of the qualitative findings throughout this report. As noted, many participants are impressed by their own transformation through the dams, gardens, VS&Ls, IGAs, and access to new markets. Participants commented on how access to new markets has expanded opportunities such as selling fish to other communities and supplying vegetables and poultry to boarding schools, though many groups face a challenge of obtaining transportation money so that members can look for markets, attend ward or district meetings, and meet other ENSURE groups. The many project activities allowed broad engagement: participants interviewed by the qualitative teams were involved in multiple committees and activities, and one ward leader stated that almost every family participates in one way or another.

Final Performance Evaluation of the ENSURE DFAP in Zimbabwe
Evaluation Findings 45
Participants expressed a strong sense of pride and ownership in project activities. The qualitative survey team observed a widespread and strong branding/inclusion in project messages through shirts, hats, and signage. While this likely contributed to people’s motivation and identification with the project activities, it may also have created an expectation that every activity should be accompanied by project-branded clothing or other accessories.
Under SO1, most Care Group members and members of the Men’s Fora reported to be satisfied with the trainings conducted and the training materials that were used in the home visit sessions and cooking demonstrations. They reported that the IEC materials were easy to use because they were translated into local languages and illustrated with pictorials.
4.9 Coordination
The ENSURE project was implemented by a consortium, including government partners and local and international NGOs. As such, effective coordination is paramount to program success. Program management by all partners has been of high quality, with strong technical staff and good collaboration among partners and with government. The program has had to operate within a highly uncertain economic and climatic environment, requiring adaptive management and flexible problem-solving among partners. The program interventions follow both USAID and Government of Zimbabwe policies and standards, and ENSURE has strengthened government approaches in gender and health in particular. Consortium partners successfully integrated their activities so that the sum of all activities exceeded what would have been accomplished by any one activity in isolation.
KIIs with ward-level government officials confirmed a good working relationship with ENSURE. ENSURE staff kept ward officials informed of planned activities, and members of committees formed under ENSURE were proud to attend and participate in ward meetings. One ward councilor observed that ENSURE fulfilled its promises and followed government policies (e.g., regarding gender equity, savings, and investing). In many cases, project staff knew ward staff personally, which helped ensure they were pursuing common goals. Despite good collaboration with government counterparts, full participation of government staff in ENSURE activities was negatively affected by the project’s contractual inability to provide allowances/per diems to government stakeholders for participating in trainings or other key activities. This made some Agritex staff in particular reluctant to participate, even though all of their actual expenses for participation were paid for by the project.
A number of KIIs with project staff indicated that certain elements of ENSURE began in a somewhat “disjointed” manner but improved over time. In particular, the inclusion of Technical Working Group members in expanded management meetings provided a platform for better sharing, coordination of implementation, and standardization of approaches. At first, staff created their own activity plans but quickly realized they needed to work together because their goals overlapped. For example, agricultural officers were not only focused on production, but also on WASH, nutrition, DRR, and resilience. By coming together in planning meetings with district staff to share plans for achieving the project’s goals they were able to improve coordination and implementation in a tightly integrated manner.
Under SO1, KIIs with government stakeholders (e.g., MoHCC, Ministry of Women Affairs, Community, Small and Medium Enterprise [MoWACSME]) showed strong collaboration in the planning, implementation and monitoring of interventions. Government actors were fully engaged in the barrier analysis, development and pre-testing of IEC materials, training and monitoring of activities. Strong collaboration with the MoHCC allowed for working within existing structures and helped to avoid creation of parallel structures. MoHCC involvement in decisions on how to engage the VHWs: i) facilitated adherence to national standards and guidelines.; (ii) allowed the integration of food

IMPEL | Implementer-Led Evaluation and Learning
46 Evaluation Findings
distribution into child health activities, which provided an opportunity for child growth monitoring, identification and enrolment of severely malnourished children into medical care and resulted in more effective BCC messaging to the caregivers; and (iii) facilitated early adoption of the Care Group model. KIIs at MoWACSME, which was engaged in the gender analysis, stated that ENSURE was in sync with the ministry’s mission, values, and objectives.
While the consortium functioned well overall, for at least one of ENSURE’s consortium partners, several issues arose related primarily to the consortium structure and functioning. For smaller local NGOs, more visibility and acknowledgement (e.g., as part of ENSURE) in the field is desired. Stakeholders and beneficiaries are often unaware of the individual IPs, particularly of local rather than international partners. The allocation of financial resources and timing of disbursements were somewhat problematic and needed better coordination. In particular, disbursements were done on a monthly basis but were often delayed, delaying project implementation. Improved coordination and timely payment submissions helped ease the burden, but quarterly payments were preferred over monthly payments in order to have more flexibility in terms of operations.
It appears that there was some uncertainty over the criteria used for allocating the budget, though it is not clear how widespread the concern was. According to a key IP informant, their allocation was based on the number of wards in which they worked, rather than on their scope of activities. In the case of ENSURE, the NGO said it had to scale down activities because the budget they were allocated was not sufficient to the task. Better alignment of the budget with activities should be examined, at least from the perspective of smaller, local NGOs, particularly when they lack reserves to cover budget delays or shortfalls.
4.10 Gender Considerations
ENSURE conducted a gender analysis in July 2014 (World Vision Zimbabwe, 2014) to help target activities to address gender inequity that contributes to food and nutrition insecurity. The analysis identified key issues and attitudes that constrain gender equity, and highlighted opportunities to partner with government on gender initiatives. The analysis helped design ways to address gender issues by involving the entire community, especially men, in health and nutrition, by creating opportunities for women to join agricultural value chains, and by supporting labor-sharing and joint decision-making at the household level. ENSURE then engaged target communities in an outcome-mapping process to develop graduated progress markers of anticipated change in behaviors for men and women. These progress markets were disseminated in part through an impressive set of posters printed by the project (World Vision Zimbabwe, 2018). The combination of project initiatives that promote gender equity messages, facilitate the creation of VS&Ls and productive IGAs for women, and support the inclusion of women in community decision-making committees have created a powerful platform for women. In its interviews, the qualitative evaluation team looked for evidence that the gender-transformative initiatives undertaken by ENSURE had changed relationships in the communities.
Although originally designed as a separate, cross-cutting SO (i.e., SO4), gender-equitable outcomes were measured for all IRs and most sub-IRs. This section provides insights from FGDs and KIIs regarding gender activities and results, and answers questions about how well gender considerations were integrated into program design and implementation, as well as why they were successful—or not—in meeting stated objectives.
It should be noted that in the 2018 Human Development Report (UNDP, 2019), Zimbabwe ranked 128 out of 160 countries on the Gender Inequality Index, which measures gender-based inequalities in reproductive health, empowerment, and participation in the labor market. The index indicates that

Final Performance Evaluation of the ENSURE DFAP in Zimbabwe
Evaluation Findings 47
women in Zimbabwe are still largely excluded from equal participation in society. The government and its development partners continue to promote gender equity initiatives. However, the quantitative data indicates a worsening situation among the general population that can likely be attributed to the economic and environmental challenges on top of traditional barriers.
According to the quantitative household survey, women’s adequacy in three gender-related indicators decreased between baseline and endline (Figure 13), suggesting that overall, women’s agency had worsened from baseline to endline.
Men’s agency also worsened, according to the quantitative survey: adequacy of achievement in asset ownership and decisions on credit declined between the baseline and endline (Figure 14). In general, more men reported adequacy of achievement in asset ownership and decision-making around assets than women. 16 This reflects the findings in ENSURE’s 2019 gender study that found slower change among women over control of major productive assets. Strong gains were made in women’s ability to buy and sell productive assets (10 percent in 2014 to 63 percent in 2019), and 79 percent of older women and 59 percent of younger women were engaged in an IGA. However, the percent of women who owned their own farmland or livestock remained low (World Vision Zimbabwe 2018). Few men feel adequacy in terms of decisions regarding credit, though this is not surprising given the severely limited availability of credit under the current economic situation in Zimbabwe. Overall, the quantitative data for men’s and women’s adequacy, as noted, likely reflects the extremely difficult economic and environmental climate in Zimbabwe over the past five years. The project noted that fewer men participated in decisions over food consumption issues as they were more focused on livelihood activities outside the home due to the difficult economic and environmental circumstances (World Vision Zimbabwe, 2019e).
16 See Annex G for further analysis of indicators related to gender and adequacy/ decision-making.
Figure 13: Women’s adequacy of ownership in assets, adequacy of decision-making about assets, and adequacy in decision on credit
All three women’s gender indicators decreased between the 2014 baseline and the 2019 endline
ns = not significant, + p<0.1, * p<0.05, ** p<0.01, *** p<0.001 ¹ Women ages 15-49 with a live birth in the past 2 years.

IMPEL | Implementer-Led Evaluation and Learning
48 Evaluation Findings
Figure 14: Men’s adequacy of ownership in assets, adequacy of decision-making about assets, and adequacy in decision on credit
The population-based data show an overall decrease in both women and men’s adequacy in ownership of assets and decision-making and lower adequacy for women relative to men in ownership of assets and decision-making, and higher adequacy, though low overall scores, among women on decisions on credit. Women, however, make greater use of financial services; while adequacy of credit was low for both sexes, in the quantitative survey, 14.8 percent of female farmers used financial services in the past 12 months, as opposed to 11.4 percent of male farmers.
By contrast, in the qualitative interviews most ENSURE participants, both women and men, reported in FGDs that positive changes in behaviors had occurred over time. Many women perceived that a discernible shift toward greater gender equity had taken place in terms of household labor and decision-making, and a reduction in gender-based violence. In the qualitative interviews, both men and women indicated that “things had improved” and that men have a better understanding of women’s issues (e.g., time burden associated with hauling firewood/water, lack of decision-making, nutrition/health needs). As one male FG participant in Chivi said, “In the past, women were oppressed, but now we realize women can do it better than us and we know they can even lead companies and committees.” According to this group, “Before ENSURE, duties for men and women used to be split as prescribed and informed by culture, but this has changed.” The FGD statements about change are supported by a 2018 gender study by ENSURE that found that the percentage of men assisting their wives with household chores and childcare activities had increased from 25 percent in 2014 to 75 percent in 2018 (World Vision Zimbabwe, 2018).
FGD participants said that men are now more willing to help with household tasks, including caring for children (even when children are sick), cooking, and fetching firewood and water. Men have adopted these new practices in ways that allow them to support their wives in culturally acceptable ways; for example, women indicated that wheelbarrows allowed men to “save face” in terms of gathering firewood/water, as they could hardly be expected to haul it on their heads like women. The shift toward sharing household tasks includes many, but not all households; a member of one FGD in Zaka mentioned, “Of five households, the husband is doing chores in three of them.” Additionally, there has been a shift toward men accompanying their wives to meetings and/or trainings (e.g., for ENSURE) and when seeking health services (e.g., at health facilities). Though women’s ownership of assets has declined at the population level (again, a likely result of the overall decline in household assets due to the economic situation),
Men’s adequacy in ownership of assets and in decisions on credit decreased between the 2014 baseline and the 2019 endline
ns = not significant, + p<0.1, * p<0.05, ** p<0.01, *** p<0.001
Our lives are better now because of ENSURE; in the past men would look for homemade beer but now they are helping us in the garden.
- FGD; Zaka

Final Performance Evaluation of the ENSURE DFAP in Zimbabwe
Evaluation Findings 49
some female ENSURE participants are now registering livestock (e.g., cattle, goats) in their own names, effectively gaining “ownership,” and participating in household decisions regarding how income is spent. As one female FGD participant indicated, “In the past, women were beaten when they asked about money [how it was spent].” Now, more couples are making joint decisions, prioritizing household needs before “wants.” Women in a focus group in Chimanimani explained the positive changes thus: “We’re no longer fighting because men used to say that when they got money, it was for them but now if he gets money, we decide together how to spend it.” Overall, participants felt that ENSURE had “brought about unity.”
Nearly all FGDs and KIIs perceived that the gender training and messaging provided through ENSURE had resulted in much-increased participation of women in community-based committees (e.g., DMC, security, watershed management), including positions of leadership (e.g., councilors, chairpersons) and in decision-making—and a number of groups indicated there were now more women in leadership positions than men. One female FGD participant in Chivi stated, “Men now appreciate our wisdom and
knowledge and that we are capable of doing things.” This was echoed in other groups, who indicated that more equal participation of men and women in producer groups had uplifted the community. In particular, in FGDs men said that women bring good ideas to the groups, and they recognized that women in general notice problems earlier than men. Men in one focus group in Chimanimani indicated they appreciate women’s participation and constructive ideas. According to them, men and women are now equal whereas in the past, “[Women] were below men and it was hard for women to express their views.” Similarly, the project found that participation by women over 29 years of age in leadership positions increased from 8 percent in 2014 to 66 percent in 2018 (World Vision Zimbabwe 2018).
Although gender training and gender dialogues were incorporated into each SO, including at the organizational level to help ensure balanced male and female staffing, in SO1 it was especially focused on
men’s engagement around health and nutrition. Based on a Social Analysis and Action (SAA) assessment, many barriers—particularly cultural—still exist that limit the health and nutritional status of women, especially PLW and WRA. For example, some iron-rich foods (e.g., liver) are reserved for men, even though they are of particular benefit to PLW and women generally. Men’s fora provided safe
spaces for men to learn about nutrition, especially for women and children, and to promote positive behavior change, e.g., more equitable division of household labor and decision-making. A number of groups specifically identified the Men’s Fora and male advocates as having contributed much to the shift in thinking and behavior changes around gender equity. Under SO1, many caregivers reported that they can make decisions about what foods to buy at home and also about ownership of assets and livestock. By engaging men and other key decision makers, the program has overcome barriers to continued adoption of key health and nutrition practices.
Interviews with most project staff, as well as male and female participants showed that the project increased women’s participation and decision-making in households and the community by mainstreaming gender across all project interventions and training women on how to participate in decisions affecting community development.
The evaluation also showed a change in self-perception among women. For example, many women now see themselves as leaders and there are more women in leadership positions on village committees, including VS&Ls and water source management committees. More couples are engaging in joint decision-making on financial matters and asset sales unlike in the past when women were excluded.
The burden is no longer only on men; women are helping too.
- FGD; Zaka
In the past, men looked down on women but now we are allowed to be part of committees and leaders.
- FGD; Zaka
IMPEL | Implementer-Led Evaluation and Learning
50 Evaluation Findings
More men are sharing household chores, gardening and caring for the babies at home. Men’s participation in ante-natal and post-natal care increased from 25 percent in 2014 to 75 percent in 2018 (World Vision Zimbabwe, 2018).
Participants acknowledged that some men remain unchanged in their views. As one female FGD participant noted, “There are a few men who are stubborn, but most men think it’s a good change.” In Buhera, male FGD participants thought it important for women to be empowered but that “the wife doesn’t become the head of the household. She is more of a helper.” According to them, women’s empowerment means that men allow women to be in VS&Ls and that men listen to women’s ideas. Thus, some men still tend to view women in the traditional role of “housewife” and see themselves as the main breadwinners. Women are optimistic, however. In Chivi, female FGD participants said they will continue moving forward because “There is good life and even if ENSURE leaves, men cannot take our knowledge; it’s as important as material goods.” Importantly, in FGDs women said that they are determined to pass on principles of gender equity to their children and their children’s marriage partners.
Most of the male and female beneficiaries expressed to the qualitative evaluation team strong appreciation for the benefits of women’s increased participation in joint decision-making and men’s involvement in child health activities and household chores. Most men and women reported that they see and appreciate the benefits of gender mainstreaming; therefore, they will continue to practice the improved behaviors.
4.11 Environmental Considerations
Qualitative interviews indicated that the use of environmentally-sensitive community NRM and climate change responsive practices has increased as a result of the project. Respondents said that their awareness of the need for conserving the environment has improved. While some of the environmental and NRM measures were not immediately observable to the qualitative evaluation team, community members described conservation works undertaken in the community including tree planting and tree conservation to protect the environment, preserving native species, gully filling and other erosion control measures, and encouraging people not to farm on riverbanks. ENSURE also used existing structures, especially the Environmental Sub-Committees, to help enforce existing provisions regarding NRM by, for example, levying fines on community members for misusing natural resources. Participants acknowledged that the need for income undercuts some of these practices; for example, some households sell firewood to people from town who are burning wood due to power outages, and some people continue to farm near riverbanks.
As part of its resilience approach, ENSURE developed a low-cost community-based NRM (or “Re-greening”) strategy (World Vision Zimbabwe, N.d.). Overall, the qualitative study found that community awareness of and capacity for NRM and DRR was strengthened through the training and revitalization of existing committees (e.g., DMC, Environmental Sub-Committees, AMC, watershed committee, MUA) and the development of community action plans through a participatory process that built community ownership. The focus on gender equity provided opportunities for women to participate in planning, in committees, and in information dissemination, so that women went from little or no involvement in community-level planning to become leaders in many committees involved with NRM and DRR.
If my daughter is married to a family that does not know about gender I will visit them and show them that this is what it is like at our place. I invite them at different occasions so that they can see. You can’t just denounce what they do.
- Female FGD; Chivi
Final Performance Evaluation of the ENSURE DFAP in Zimbabwe
Evaluation Findings 51
4.12 Sustainability
This section provides insights from FGDs and KIIs regarding the sustainability of project outcomes.
Achieving sustainability depends on the continued presence of resources, capacity, and motivation after a project ends. In addition to these interrelated and synergistic factors, strong vertical linkages to local government, private sector, and other actors are often needed (FANTA III 2015b). The ENSURE strategy addressed these criteria in several ways. The strategy posited that promoting self-replicating models such as Care Groups, VS&L groups and ESCs would improve sustainability. In addition, ENSURE envisioned that its strategy of support for community-based groups, strengthening local capacity, and working with existing systems, along with improving nutrition, income and resilience, would enable the project to phase out support as participants built relationships with local government and the private sector. (World Vision Zimbabwe 2013a). ENSURE included five strategic “sustainability keys” in its approach: i) alignment with current and future government structures and strategy; ii) improvement of community-based and national linkages; iii) dissemination of behavior change messaging to all beneficiary groups; iv) inclusion of private-sector involvement of market agreements; and v) gradual phase-out of non-sustainable projects by end of project.
SO 1 sought to build sustainability by working alongside the MoHCC to improve access to clinics and government services, improving communities’ understanding of nutrition and health services, and increasing participants’ capacity to identify their needs and respond appropriately (World Vision Zimbabwe 2013a). The project established strong linkages with the MoHCC, which facilitated the ministry’s learning and early adoption of the Care Group approach. Interviews with project staff showed that as part of its sustainability strategy, over the LOA, ENSURE increasingly engaged MoHCC staff in the training and supervision of Care Groups and Male Champions, including health facility staff (nurses, environmental health technicians and ward nutrition officers), while project staff phased down direct support. KIIs with MoHCC officials showed that they intend to build capacity and provide the resources for the roll-out of the Care Group approach in non-ENSURE wards, and at the time of the final evaluation, the nurses at primary care centers were increasingly involved in supporting and monitoring the activities of Care Groups. The project also created a large pool of volunteers who are considered to be a hub of knowledge within their communities. Experience from other FFP projects indicates that volunteers often drop out after the project ends (FANTA III 2015b). While some drop-off is likely to occur, the MoHCC’s adoption of the Care Group approach and the continuing links between nurses and volunteers should help keep more highly motivated volunteers engaged. As part of the exit strategy, ENSURE will also transfer Care Group training materials to the MoHCC.
Part of ENSURE’s WASH sustainability strategy under SO1 was to build community competency for multiple use water management and to link communities to private-sector support (World Vision, 2013a). ENSURE accomplished this in communities where dams and boreholes were constructed or rehabilitated, although whether the communities can financially manage maintenance and repairs over the long run, without outside assistance, remains an open question. In other project communities, boreholes for safe drinking water and other domestic use, were ubiquitously lacking. Many communities also felt strongly that access to water remained a critical issue challenging their continued success.
A key part of ENSURE’s sustainability strategy involves linking communities to existing systems of government and private stakeholders, and working within government policies and strategies. Under SO2, the program has built strong linkages with private-sector commodity buyers (e.g., upscale hotels, district- and national-level commodities buyers, and boarding schools), financial services institutions
[We] will continue with the project since it has improved our lives.
- FGD, Chivi

IMPEL | Implementer-Led Evaluation and Learning
52 Evaluation Findings
(e.g., Zimbabwe Women’s Microfinance Bank, Nedbank/Metbank), the UN World Food Programme (in at least a few communities) and the government (e.g., Agritex, MoHCC, MoWACSME, and ward and district committees). Participation in WFP’s P4P program in particular has been very successful for those few communities participating and there is great enthusiasm for continuing. Agritex officers have been heavily involved with ENSURE over the life of the program as trainers of Market Facilitators and lead farmers (i.e., Training of Trainers), as frontline staff, and in establishing linkages between PMGs and financial services, commodity buyers, and input suppliers. While dams and gardens are considered community assets, they are technically under the purview of Agritex officers after being handed over by ENSURE and a number of asset handover ceremonies had already been conducted as part of the exit strategy at the time of the qualitative study.
The program budget did not, however, provide support to government stakeholders in the form of allowances for attending meetings and trainings. This proved to be troublesome for the program as some ENSURE partners allowed for such subsidies in their other programs. For example, SAFIRE provides allowances to Agritex officers working with other SAFIRE projects in Zimbabwe, which caused considerable ill feelings among those officers working with ENSURE. Both ENSURE staff and Agritex KIs suggested this would likely result in a lower level of involvement by Agritex after the program ends, which raises concerns about Agritex’s willingness—or ability—to continue providing the same type and degree of assistance to ENSURE communities. A key informant in Chivi suggested that the lack of government resources would likely mean that more- isolated communities would no longer receive services. Poor roads also threaten to undermine sustainability as producers cannot easily get their products to market, and potential buyers are not motivated to seek out these producers. Thus, some KIs were unsure how sustainable the program’s outcomes might be over the long term.
The VS&Ls under SO2 were envisioned as a vehicle for poor and very poor households to achieve financial success and sustainability. As noted in FGDs with project participants, VS&Ls have been successful in providing sustained resources to fund post-project activities such as purchasing agricultural inputs, funding IGAs, and maintaining dams and irrigation systems, albeit at a modest level. Equipping participants with skills in FaaB and facilitating the formation of producer groups and marketing links was part of the strategy to diversify households’ opportunities to use their VS&L savings (World Vision Zimbabwe, 2013a). As evidence of sustainable linkages, a number of producer groups have successfully established relationships with private-sector buyers while individual households have used VS&L loans to fund IGAs.
As part of its resilience strategy, under SO3 ENSURE supported the organization of community-based committees to increase community capacity in disaster risk reduction and early warning. Disaster Management Committees functioned successfully after Cyclone Idai and are now linked to government civil protection services. Remote communities are better linked to early warning information through information platforms, but still face connectivity problems.
The collaborative management of community assets was also strengthened under SO3 through the organization of multiple community-level committees to manage dams, natural resources, and the local watershed. This contributed to increased crop and livestock production and improved food security and income among project participants, particularly those with access to the community gardens. FFA was used to build the structures and temporarily reduced food insecurity among the most vulnerable households. The dams are substantial structures, and while communities contribute to maintenance, they need strong links to and additional support from government to enhance their sustainability, particularly to meet the cost of major repairs.
Given the recurrent financial and environmental challenges faced by ENSURE participants, as part of its two-year cost extension ENSURE prioritized strengthening community partnerships and vertical linkages

Final Performance Evaluation of the ENSURE DFAP in Zimbabwe
Evaluation Findings 53
to strengthen sustainability. This included partnerships with government technical services and with input suppliers, buyers, and microfinance institutions in the private sector (World Vision Zimbabwe, ENSURE ARR FY 2019). The majority of communities visited by the qualitative team feel they can continue after ENSURE ends and are confident that they can continue to obtain help from Agritex, Veterinary Officers, and Ward Councilors.
ENSURE committee leaders are now participating in ward-level meetings and planning, an indication of the importance that ward officials give to community-based committees formed under ENSURE and to maintaining their relationship with the committees. One ward official confirmed that ENSURE groups have been incorporated into the Ward Development Committees so that officials can continue to observe and improve the work left in place by ENSURE.
At the national level, the project formally handed over its package of gender tools to the MoWACSME. This was accompanied by a signed commitment by the ministry to adopt ENSURE’s approach in districts where the project was not implemented, though it is expected to be implemented at a lower intensity.
As noted earlier, motivation is also a factor in sustainability (FANTA III 2015b). The qualitative team found that participants exhibited good knowledge and understanding of project approaches and how to implement activities. Both participants and government stakeholders stated that their improved knowledge and capacity would help them sustain activities. At the time of the qualitative study, motivation to continue activities was high, particularly among members of the community gardens and livestock owners who benefitted from the dams. However, a few communities in highly vulnerable areas that receive food assistance nearly every year stated that they want ENSURE to continue its inputs, and the qualitative team felt that those communities may lack the resources as well as the motivation to sustain benefits after the project ends.
Nevertheless, the limited inputs provided by the project can be seen as favoring sustainability overall. According to a number of ENSURE project KIIs, one of the strengths of ENSURE was perceived to be the absence of free transfers (e.g., seed, tools). Beneficiary perceptions were also, overall, quite optimistic. Participants said that they considered the knowledge and skills gained from the program to be of even more value than any material resources they might have received, and indicated that they would continue using what they had learned “because it now runs in our veins.” Several KIs in Chivi indicated that ENSURE staff were no longer actively engaged with communities as the communities were “self-motivated to be successful.” A few focus groups, particularly in Buhera, were not as confident about maintaining their gains primarily because they had only begun to realize such gains toward the end of the project. For example, delays in dam construction pushed back gardening activities and some PMGs were only in their first season of production at the time of the final evaluation. In other cases, communities felt they had not fully recovered from the effects of recurrent drought. While a number of groups expressed the desire that ENSURE continue to support them, most participants interviewed understood that the project support was coming to an end.
Ultimately, sustainability will rest on factors such as the motivation of community members to maintain improved practices and community assets, the availability of external technical and financial resources when needed, and the community’s ability to cope with recurrent environmental and economic shocks. At the time of the qualitative study, ENSURE participants were realizing a return on their efforts in terms of maternal and child health, access to greater financial resources through the VS&Ls, and new markets for agricultural and livestock products. External challenges to resilience, and thus to sustainability, are likely to remain for the foreseeable future.

IMPEL | Implementer-Led Evaluation and Learning
54 Evaluation Findings
4.13 Lessons Learned
The following lessons learned are the evaluators’ assessment, formed from the findings of this evaluation and based on information gathered from focus groups and key informants, review of performance indicators and PBS data, field observation, and the evaluators’ own technical expertise and extensive experience in FFP and other kinds of development programming. These lessons are presented for consideration in future FFP programming in Zimbabwe.
CARE GROUPS
The Care Group model in ENSURE was an effective mechanism for developing peer networks to improve the adoption of MCHN behaviors and practices. It created a multiplier effect, equitably reaching participant households with interpersonal BCC messages on maternal and IYCF practices, including exclusive breastfeeding and complementary feeding.
Additionally, according to a number of program staff KIIs, Care Groups that are engaged in VS&Ls have strengthened cohesion among community members. They also show a high likelihood of continued functionality after the project ends. In interviews with Care Group members who participated in VS&L activities, participants stated that they were more united, helped each other and frequently came together to support each other more than before the project, for example during latrine construction, garden preparation, and harvesting. The strong engagement of Care Group leaders and clients in multiple interventions under ENSURE was important for enhancing their participation in other activities and helped to create an enabling environment for behavior change. From the qualitative assessment, it was evident that the Care Group model contributed to the success of ENSURE. However, further research on the efficacy/causal effect of the Care Group model on behavior change via the cascade approach is needed.
INCLUSION OF MEN IN MCH INTERVENTIONS
There is a tendency in public health systems to only target women for MCHN interventions. However, men are critical targets for enhancing the uptake of MCHN practices because women are not typically key decision-makers. Thus, it is critical to engage other spheres of influence who are key decision-makers at home (e.g., men, mothers-in-law) when rolling out BCC messaging. Activity-based trainings around events such as soccer matches proved to be highly effective in generating interest among men in groups promoted by ENSURE while serving as a platform to engage men on messages around MCHN, gender, and other issues.
In addition, training public health staff and volunteers, including Lead Mothers, caregivers, CBFs, Community Health Clubs, and Male Advocates assists in improving health care in communities. These community-based volunteers provide positive peer pressure and help to promote improved hygiene and other health practices.
Beyond MCH interventions, the inclusion of traditional leaders/elders in all stages of project implementation assists in shifting negative cultural norms in communities. This is particularly important for promoting health and nutrition—especially among PLW and children, gender equity in household decision-making, IGAs, and community governance mechanisms. While gender messaging over the life of the activity appeared to be quite effective at promoting more equitable perspectives and moving the needle on cultural norms and acceptance of women’s decision-making and participation in the aspects of community and household situations on which the project focused, mechanisms are needed to encourage women’s participation in leadership positions beyond those with which the project engages.

Final Performance Evaluation of the ENSURE DFAP in Zimbabwe
Evaluation Findings 55
ADDITIONAL LESSONS
One of the most striking features of ENSURE is the degree to which the complementary messages and activities of the three SOs are integrated at the participant level. ENSURE participants displayed a deep understanding of project concepts (rather than simply repeating project messages) and how different activities working together yield a greater benefit than a single activity.17 This integration was intentionally promoted by ENSURE staff from the outset and in the view of the evaluation team, has been key to the project’s success. Consistent messaging among community and service providers also contributed to the project’s effectiveness and success.
The integration of ENSURE’s activities contributed to an enabling environment, one that supports longer-term sustainability of results through local buy-in of government partners and project participants. ENSURE provided skills training, capacity building and guidance (e.g., manuals, guidelines), allowing much self-determination among communities for their own benefit.
Assessments of the social, economic, political, and environmental contexts in which activities occurred were used to inform better programming and were key to designing appropriate interventions. The continued monitoring of contextual factors allowed for responsive and flexible changes to programming, which increased project impact and benefit to participants. For example, the market environment was in constant flux due to the national monetary crisis, which prompted ENSURE staff to shift from a value chain to a market systems approach under SO2. Such a shift took advantage of participant ideas and needs, and provided opportunities for new and more-profitable products than the five identified value chains.
VS&Ls can serve as a core integrating activity for all other project activities to build on. For example, linking value chain activities to VS&L activities resulted in greater effectiveness in both activities, as did linking VS&Ls to construction of assets, such as latrines. VS&Ls became an important means for women to acquire livestock and other assets for the first time, supporting the women’s empowerment goals of the project. VS&Ls can also provide participants with the knowledge and experience necessary to successfully access formal financial services.
In a highly inflationary environment, projects should ensure that support and training of VS&L members include how to best protect their savings and manage their loan activities to preserve value against loss due to inflation.
ENSURE’s comprehensive emphasis on women’s empowerment and gender equity, through multiple avenues across all activities, helped to create a safer environment for men and women to examine traditional attitudes and undertake changes in behavior within their communities. ENSURE incorporated a non-confrontational, blame-free approach as part of its male engagement strategy, which promoted high acceptance of the messages, according to project staff. The qualitative survey found that the multi-pronged approach used in ENSURE, particularly the gender dialogues incorporated into various activities, has enabled female program participants to achieve greater equity in household decision-making and to assume leadership roles in their communities. Project staff noted that progress still needs to be made on women’s decision-making and control over large productive assets. Also, the PBS survey showed a decrease in gender equity, indicating that the gains at program level did not diffuse to the broader population. Since the MoWACSME formally adopted ENSURE’s gender materials for use in its own activities, there is future potential for the program methods to have a wider, if less intense, impact among non-participating communities.
17 See Sec. 4.4 Integration of Activities

IMPEL | Implementer-Led Evaluation and Learning
56 Evaluation Findings
One Provincial Health and Nutrition Officer said that the provision of food led to earlier ANC visits by women, which enabled the clinics to increase patient coverage, and in turn made the clinics eligible for more government funds under the government’s results-based financing system. The additional funds were used to purchase equipment and provide more services, so that participating clinics were able to offer better-quality and more-satisfying services to communities.
Community asset sites (i.e., dams and gardens) were important motivators and launching points for many other activities and provided safe zones for community interaction, knowledge sharing and learning. Communities that lacked access to safe potable water sources were somewhat disadvantaged in terms of receiving the full benefit of project activities. For some outcomes, particularly WASH-related outcomes, both software and hardware are required.
The original assumptions in the ENSURE Results Framework included stable rainfall and weather conditions, a stable rate of inflation, and a continuation of the multi-currency economy. The project plan was to make adjustments to programming if these changes came about. Given the repeated occurrences of climate-change-related stresses and the volatility of the economic situation, future projects should incorporate mitigation strategies and activities that address these elements in programming.
Overall, the ENSURE project has been well implemented and has shown that it can adapt to changing circumstances, making it a good model for other parts of Zimbabwe. Comprehensive assessments make it adaptable to other areas of the country, where contextual factors may differ.

Final Performance Evaluation of the ENSURE DFAP in Zimbabwe
Recommendations 57
5. Recommendations
R1: Maximize integration of program activities to enhance health and nutrition gains and strengthen community resilience. Based on qualitative insights, ENSURE has been very successful in achieving its objectives despite a challenging economic and environmental context. It was perceived as well managed and implemented, and participants acknowledged and appreciated the changes brought about by the application of the training and skills received. Even in the face of multiple challenges, gains were evident among project participants. This is supported by quantitative regression analysis that shows multiple positive relationships between nutrition and agricultural training, adequate food consumption, children’s health, and improvements in gender decision-making (Annex I). In large part, this success stems from the highly relevant activities and integrated nature of implementation: development of irrigation schemes under SO3 contributed to increased production and income under SO2, which in turn improved availability and access of foods that resulted in improved nutritional status, particularly of children, under SO1. VS&L activities cut across all SOs, facilitated by better production under SO2, which led to increased income that was then used to support dams and irrigation schemes (SO3), gardens (SO2), and WASH (SO1). Gender messaging was also effectively rolled out across the SOs, including in Care Groups (SO1), PMGs (SL 2), and DRR-related activities (SO3).
R2: Make longer-term investments. The five-year timeframe of DFAPs is often not long enough to allow for sustained progress to be realized, let alone captured by quantitative means of measurement. In some cases, misalignment of programs with agricultural cycles (e.g., programs begin in the middle of an agricultural cycle, after farmers have planted) means that potential gains in some agricultural outcomes are not realized until well into the second—and more likely the third—year of implementation. Additionally, factors outside the program’s control of (e.g., Cyclone Idai, macro-economic conditions) can have negative impacts on activities, as was the case in Zimbabwe over the life of the activity. While qualitative data suggest overall that the program had a significant positive effect, the quantitative data show no such progress among the broader population. USAID should continue to invest in ENSURE program areas in order to help ensure longer-term sustainable impact of its investments to date. One approach could involve “guaranteed” additional phases of a program, such that support is provided—though potentially layered and sequenced—over a longer timeframe.
R3: Design M&E systems to better capture impact. The disparity between the population-based results and annual beneficiary-based results suggests that, at least under some circumstances, project impact may be better captured at the participant level—at least in a funding-limited context. Although more expensive, a quasi-experimental impact evaluation design (including a well-designed control group where the sample households are as similar as possible to the treatment group, and the sample is stratified to ensure that a sufficient number of treatment and control respondents are included to provide statistically significant findings) provides findings that can capture the contribution of program interventions to results. As noted above, the length of time it takes before certain impacts can be captured by quantitative means also supports the idea of focusing on participant outcomes: spill-over often requires longer timeframes to take hold within the larger population and be measurable.
R4: Ensure that the Care Group model cascade strategy is adequately supported and supervised. The MoHCC has started rolling out the Care Group methodology in non-ENSURE ward/ districts using evidence of effectiveness from ENSURE project implementation. However, additional information is needed on the cost of scaling up, on effective, sustainable and innovative community-based incentives, on how to enhance adolescent and young mother participation in Care Groups or similar cascade models, and how to harness mobile health applications for greater effectiveness. In order to support a more strategic approach for scaling up the Care Group or model to other areas of Zimbabwe, rigorous evidence on the following is needed: i) the causal impact of the Care Group model on MCH outcomes; ii)

IMPEL | Implementer-Led Evaluation and Learning
58 Recommendations
the cost-benefit of scaling up the Care Group model compared to other standard care models; iii) the identification of innovative approaches for enhancing adolescent and young mother participation in Care Groups; and iv) establishing how mobile health applications can be used to enhance the efficiency and effectiveness of the Care Group model. In addition, high-quality supervision and ensuring the messages are not diluted in a cascade model are key to effectiveness; research on how to ensure the effectiveness of these dimensions of cascade models is also needed. Ultimately, further research is needed using quasi-experimental study designs to examine the efficacy/causal effect of the Care Group model on the behavioral changes achieved in FFP-supported MCHN activities. This would allow the use of rigorous methods to examine the effect of the cascading approach, specifically the significance of such aspects as quality of the SBCC sessions and number of home visits to SBCC among targeted beneficiaries and the larger population.
R5. Use social behavior change communication (SBCC) to enhance project integration. ENSURE addressed several important nutrition social and behavior change challenges related to improved infant and young child feeding practices. However, changing behaviors for improved outcomes requires more than skills development or knowledge transfer. Successful SBCC activities require understanding current practices and their motivation, and understanding barriers and motivations for new practices. The SBCC interventions should look at behaviors holistically, using communications to motivate change but also recognizing that other project activities can influence behaviors.
Future similar projects should support stronger SBCC efforts that support the production of nutritious foods, livestock, and livestock products because they create an environment that enables a shift in production practices. This effort should also include technology transfer and skills development, and address the social norms that influence the selection of crops, land use patterns, and even agronomic practices with evidence from formative research. The role of SBCC in achieving a synergistic effect between the agriculture and nutrition/health interventions should be a unique aspect of future similar projects.
R6. Use formative research to identify the barriers and facilitators to improved dietary diversity. Formative research on motivations for improving production practices will provide a foundation for a communications strategy when promoting new foods or dietary practices. Such research should also take into account the impact of adverse economic conditions, and identify ways to help people overcome this challenge.
R7. Link community-based committees to government agencies to strengthen sustainability. AMCs oversee day-to-day activities and the upkeep of wells and other assets built by ENSURE participants. The committees are important to the long-term sustainability of new assets, but AMCs need additional support in managing, maintaining, and financing assets to enhance sustainability, particularly as AMC funds are not adequate to cover major repairs. The evaluation team recommends establishing stronger linkages of AMCs to relevant government agencies such as the Veterinary Department (for dip tanks), and the Environmental Management Agency and the District Development Fund (for dams) in order to strengthen their sustainability and their ability to pay for asset maintenance.
R8. Use a responsive and flexible approach to adapt to contextual changes. In a dynamic environment like Zimbabwe, projects should continually monitor contextual factors to allow for responsive and flexible changes and more appropriate programming. This was particularly evident in ENSURE’s shift from a strict value-chain approach to a market-systems approach under SO2. With the markets continually changing due to economic factors, ENSURE realized that farmers were limited by the five value chains in terms of their ability to diversify into non-farm IGAs to respond to the effects of drought. Communities saw many opportunities for new and more profitable non-farm IGAs. ENSURE’s shift to support for a market-systems approach was responsive to participants’ own ideas and needs.

Final Performance Evaluation of the ENSURE DFAP in Zimbabwe
Annex A: References 59
Annex A: References
Alkire, Sabina, Ruth Meinzen-Dick, Amber Peterman, Agnes R. Quisumbing, Greg Seymour and Ana Vaz. 2012. The Women’s Empowerment in Agriculture Index. 2012. IFPRI Discussion Paper 01240 International Food Policy Research Institute. December. https://www.ifpri.org/publication/women’s-empowerment-agriculture-index
Bernard, H. Russell. 2017. Research Methods in Anthropology: Qualitative and Quantitative Approaches. Lanham, MD: Rowman & Littlefield, Publishing Group.
CNFA and World Vision. 2016. Mid-Term Evaluation Report for the Development Food Assistance Programs: ENSURE and Amalima. ENSURE Agreement No. AID FFP-A-13-00003-00. Washington D.C.: USAID, December.
FANTA III. 2015. FFP Indicators Handbook Part I: Indicators for Baseline and Final Evaluation Surveys. April. Washington, DC: Food and Nutrition Technical Assistance III Project (FANTA III).
FANTA III. 2015b. Sustaining Development: A Synthesis of Results from a Four-Country Study of Sustainability and Exit Strategies among Development Food Assistance Projects, Beatrice Rogers and Jennifer Coates. Boston: Gerald J. and Dorothy R. Friedman School of Nutrition Science and Policy, Tufts University.
FAO. 2010. Guidelines for measuring household and individual dietary diversity. Rome.
FEWSnet. 2019. https://fews.net/southern-africa/zimbabwe/food-security-outlook/october-2019.
Jimat Development Consultants. 2018. Outcome Monitoring Survey Report FY18. Final Report 13 December 2018.
Maxwell, D., J. Coates and B. Vaitla. 2013. How Do Different Indicators of Household Food Security Compare? Empirical Evidence from Tigray. Medford, USA: Feinstein International Center, Tufts University.
UNDP. 2019. Human Development Report – Zimbabwe (Briefing Note). http://hdr.undp.org/sites/all/themes/hdr_theme/country-notes/ZWE.pdf
USAID. 2018. ENSURE Program. Gender Progress Market Assessment Report. February 2018.
USAID. 2015. Baseline study of the Title II Development Food Assistance Programmes in Zimbabwe. Washington, D.C.: USAID/ICF, June 3.
USAID 2014. ENSURE Gender Analysis. Draft Report. July 2014.
World Bank. n.d. Living Standards Measurement Study of the World Bank. Available at http://web.worldbank.org/archive/website00002/WEB/INDEX-5.HTM
World Bank. 2019. https://www.worldbank.org/en/country/zimbabwe/overview.
World Health Organization (WHO). 2011. WHO Anthro and Macros, version 3.2.2. Available at http://www.who.int/childgrowth/software/en/
World Vision Zimbabwe. n.d. ENSURE Re-greening strategy.
World Vision Zimbabwe. 2019a. Significant Indicator Deviations Table ENSURE Program 4 November 2019.

IMPEL | Implementer-Led Evaluation and Learning
60 Annex A: References
World Vision Zimbabwe. 2019b. Annual Beneficiary-Based Survey. Draft Report. Prepared by EVE Employment Consultancy, 17 September 2019.
World Vision Zimbabwe. 2019c. ENSURE Project Revisions 19 August 2019.
World Vision Zimbabwe. 2019d. (ENSURE Consortium). FY18 IPTT for ARR, 12 March 2019.
World Vision Zimbabwe. 2019e. ENSURE FY19 ARR SIDT. 23 October 2019.
World Vision Zimbabwe. 2018. ENSURE Draft Program Gender Progress Marker Assessment Report. February 2018.
World Vision Zimbabwe. 2017a. ENSURE Project Results Framework FY18 PREP. 31 March 2017.
World Vision Zimbabwe. 2017b. Gender Equity and Women’s Empowerment: The Journey So Far. The Experience of the ENSURE Program. January.
World Vision Zimbabwe. 2016a. Outcome Monitoring Survey Report FY16.
World Vision Zimbabwe. 2016b. Risk Communication and Early Warning Strategy for ENSURE. Makwiramiti, Patrick, SAFIRE. 13 January 2016.
World Vision Zimbabwe. 2014. ENSURE Gender Analysis.
World Vision Zimbabwe. 2013a. ENSURE Enhancing Nutrition, Stepping Up Resilience and Enterprise FY 2013 Title II Development Food Assistance Program Application Submission.
World Vision Zimbabwe. 2013b. Annex G Revised WV Zimbabwe FY13 ENSURE DFAP Results Framework.
World Vision Zimbabwe. 2013c. Annex Iii WV Zimbabwe FY13 Targeting Methodology 3 May 2013.
World Vision Zimbabwe. Annual Results Reports (ARR) - ENSURE:
FY 2019
FY 2018
FY 2017
FY 2016
FY 2015
FY 2014
World Vision Zimbabwe. Quarterly Reports - ENSURE:
FY 2018 – Quarters 1, 2 and 3
FY 2017 – Quarters 1 and 3
FY 2016 – Quarters 1, 2 and 3
FY 2015 – Quarters 2 and 3
FY 2014 – Quarters 1, 2 and 3
Final Performance Evaluation of the ENSURE DFAP in Zimbabwe
Annex B: Evaluation Statement of Work 61
Annex B: Evaluation Statement of Work
Statement of Work for Endline Study: Title II Development Food Assistance
Programs in Zimbabwe
I. Introduction
A. OVERVIEW
The final evaluation of the Title II Office of Food for Peace (FFP) Development Food Assistance Programs in Zimbabwe is the second and final phase of a pre-post evaluation strategy. In FY 2013, FFP awarded Cultivating New Frontiers in Agriculture (CNFA) and World Vision two five-year Title II projects in Zimbabwe: (1) the Amalima I Program in western and southwestern Zimbabwe, implemented by Cultivating New Frontiers in Agriculture (CNFA) and partners: the Organization for Rural Associations for Progress (ORAP), International Medical Corps (IMC), The Manoff Group, Africare, and Dabane Trust, and (2) Enhancing Nutrition, Stepping Up Resiliency and Enterprise (ENSURE) in eastern Zimbabwe, implemented by World Vision and partners: CARE, SNV USA, Southern Alliance for Indigenous Resources and International Crops Research Institute for the Semi-Arid Tropics.
The baseline study was conducted by ICF International from January through August 2014 and employed a mixed methods approach. 18 The study investigated population characteristics; household hunger and coping strategies; dietary diversity and food consumption; poverty; water, sanitation and hygiene practices; agricultural practices; women’s health and nutrition; children’s health and nutrition; and gender equality.
Through this solicitation, FFP seeks a firm (referred to in this document as “the Contractor”) to conduct an endline study to determine conditions in targeted areas of Zimbabwe prior to the start of new Title II programs. FFP requires a representative population‐based household survey focused on the collection of data for the required impact and outcome indicators for Title II program intervention areas. The study will also include a qualitative component that will add depth, richness, and context and serve to triangulate information from survey findings and analysis.
B. EVALUATION PURPOSE AND OBJECTIVES
The purpose of the endline study is to measure the development outcomes of the Amalima and ENSURE projects.
The endline study is designed as the first step in a two‐part evaluation process, following the baseline at the beginning of the program. Endline data should be conducted at approximately the same time of the year as the baseline, which was late March through May. Further, endline data should be collected as close as possible to the end of the program. Given that the lean season coincides with the rainy season, the Contractor should be aware that certain areas where data collection will occur may be difficult to access.
The Famine Early Warning System Network (FEWSNET) graph below shows the seasonal calendar and critical events timelines for Zimbabwe. Note that this figure corresponds to the country in general; the
18 https://www.usaid.gov/sites/default/files/documents/1866/Zimbabwe%20Baseline%20Study%20Report%2C%20June%202015.pdf
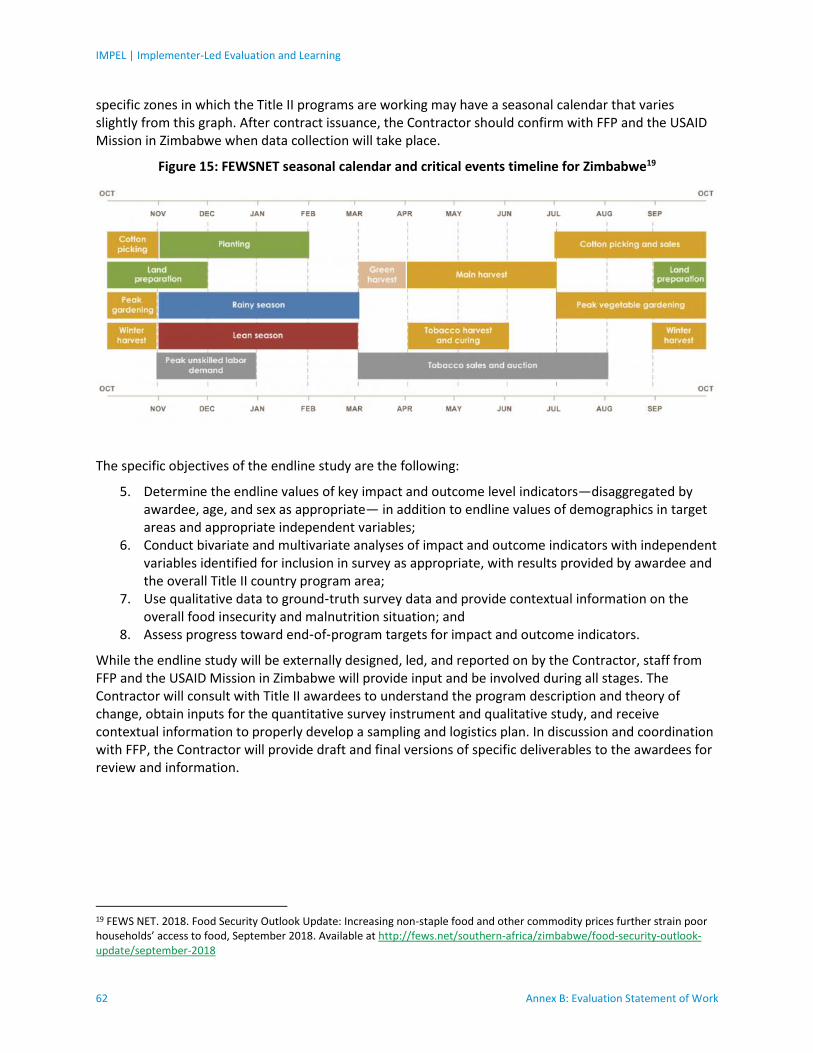
IMPEL | Implementer-Led Evaluation and Learning
62 Annex B: Evaluation Statement of Work
specific zones in which the Title II programs are working may have a seasonal calendar that varies slightly from this graph. After contract issuance, the Contractor should confirm with FFP and the USAID Mission in Zimbabwe when data collection will take place.
Figure 15: FEWSNET seasonal calendar and critical events timeline for Zimbabwe19
The specific objectives of the endline study are the following:
5. Determine the endline values of key impact and outcome level indicators—disaggregated by awardee, age, and sex as appropriate— in addition to endline values of demographics in target areas and appropriate independent variables;
6. Conduct bivariate and multivariate analyses of impact and outcome indicators with independent variables identified for inclusion in survey as appropriate, with results provided by awardee and the overall Title II country program area;
7. Use qualitative data to ground‐truth survey data and provide contextual information on the overall food insecurity and malnutrition situation; and
8. Assess progress toward end‐of‐program targets for impact and outcome indicators.
While the endline study will be externally designed, led, and reported on by the Contractor, staff from FFP and the USAID Mission in Zimbabwe will provide input and be involved during all stages. The Contractor will consult with Title II awardees to understand the program description and theory of change, obtain inputs for the quantitative survey instrument and qualitative study, and receive contextual information to properly develop a sampling and logistics plan. In discussion and coordination with FFP, the Contractor will provide draft and final versions of specific deliverables to the awardees for review and information.
19 FEWS NET. 2018. Food Security Outlook Update: Increasing non-staple food and other commodity prices further strain poor households’ access to food, September 2018. Available at http://fews.net/southern-africa/zimbabwe/food-security-outlook-update/september-2018
Final Performance Evaluation of the ENSURE DFAP in Zimbabwe
Annex B: Evaluation Statement of Work 63
II. Indicators for Collection and Final Evaluation Questions
A. INDICATORS FOR COLLECTION
The Contractor will be responsible for collecting data on all applicable indicators listed below, plus a limited number of additional indicators for each Title II development food aid program awardee, including women’s status and empowerment indicators. The final list of indicators to be collected will be discussed and agreed upon in consultation with FFP, the USAID Mission in Zimbabwe, and each of the FY 2013 Title II awardees. The FFP Indicators for the baseline and final evaluation surveys are:
1. Prevalence of underweight children under five years of age
2. Prevalence of Poverty: Percent of people living on less than US$1.25/day
3. Mean depth of poverty
4. Per capita expenditures (as a proxy for income) of USG targeted beneficiaries
5. Prevalence of stunted children under five years of age
6. Prevalence of underweight women (of reproductive age)
7. Percentage of farmers who used at least [a project‐defined minimum number of] sustainable agriculture (crop/livestock and/or NRM) practices and/or technologies in the past 12 months
8. Percentage of farmers who used at least [a project‐defined minimum number of] improved storage techniques in the past 12 months
9. Percentage of farmers who used financial services (savings, agricultural credit, and/or agricultural insurance) in the past 12 months
10. Percentage of farmers who practiced the value chain activities promoted by the project in the past 12 months
11. Household Hunger Scale (HHS): Prevalence of households with moderate or severe hunger
12. Average Household Dietary Diversity Score (HDDS)
13. Percentage of children 6‐23 months of age receiving a minimum acceptable diet
14. Women’s Dietary Diversity Score (WDDS): Mean number of food groups consumed by women of reproductive age
15. Prevalence of exclusive breastfeeding of children under six months of age
16. Percentage of children under age five who had diarrhea in the prior two weeks
17. Percent of children under five years old with diarrhea treated with Oral Rehydration Therapy (ORT) 18. Percentage of households using an improved drinking water source
19. Percentage of households with access to an improved sanitation facility
20. Percent of households with soap and water at a handwashing station commonly used by family members
21. Women’s status and empowerment indicator(s) and/or awardee gender objectives as identified in the results frameworks

IMPEL | Implementer-Led Evaluation and Learning
64 Annex B: Evaluation Statement of Work
The Contractor will closely follow the guidance on the FFP Standard Indicators Handbook for Baseline and Final Evaluation for indicator definition, collection, and analysis for the indicators listed above.20 In several instances, the Contractor will have to refer to the source documents used to develop the FFP Standard Indicators Handbook for Baseline and Final Evaluation for instructions on adapting questionnaires to the local context, as well as other important details on data collection and tabulation. The Contractor will also work closely with FFP, the USAID Mission in Zimbabwe, and Title II awardees to develop questionnaires and tabulation instructions for the agriculture indicators (#7‐10), gender indicator(s), and any additional program‐specific indicators not specified in the Handbook.
For the poverty prevalence indicator, the Contractor will closely follow Feed the Future guidance for indicator definition, collection, and analysis. To derive the mean depth of poverty indicator, the Contractor will use the same per capita expenditure data used for the poverty prevalence indicator. The Contractor will work closely with FFP to develop tabulation and analysis instructions for this indicator.
The Contractor will ensure that rigorous practices are used to collect, tabulate, and analyze the indicator data. Refer to Section III of this SOW for further information on the required quantitative methodology.
B. EVALUATION QUESTIONS
FFP has identified preliminary evaluation questions that will guide the design and development of endline study. To answer the evaluation questions, the Contractor will be responsible for referring to baseline quantitative and qualitative data as a basis for comparison. In concert with the Title II program awardees, the Contractor is expected to assess the technical viability of the evaluation questions and incorporate specific elements in the design and methodology of the baseline study (both the quantitative and qualitative components) to ensure that the endline study provides valid and reliable data and responds to the evaluation questions. This might involve incorporating additional variables or strata in the design of the household survey and the qualitative component. The following table lists the primary evaluation questions:
Criteria Main evaluation questions Sub-questions
Impact 1. To what extent did the programs achieve the intended goal, objectives and results as defined by their Results Framework?
2. How did program activities improve the ability of beneficiary households and communities able to mitigate, adapt to, and recover from food security shocks and stresses?
1.1 Were there any important unintended outcomes, either positive or negative?
1.2 What were the main reasons that determined whether intended outcomes were or were not achieved, and whether there were positive or negative unintended outcomes? Which reasons were under control of the programs and which were not?
Beneficiary satisfaction 3. How satisfied were beneficiaries with the programs?
3.1 What issues were most important to beneficiaries forming their perceptions of the
20 The FFP Standard Indicators Handbook for Baseline and Final Evaluation can be found at http://www.usaid.gov/what‐we‐do/agriculture‐and‐food‐security/food‐assistance/guidance/food‐peace‐information‐bulletins

Final Performance Evaluation of the ENSURE DFAP in Zimbabwe
Annex B: Evaluation Statement of Work 65
Criteria Main evaluation questions Sub-questions
programs? What were the key successes and challenges of the programs?
Relevance 4. How relevant were program activities beneficiary targeting, considering the needs of the target population?
4.1 Were beneficiary targeting criteria and processes appropriate, transparent, and properly implemented?
4.2 Were the scale, type, and timing of the program activities appropriate to the needs of the target population?
Effectiveness 5. How well were program activities planned and implemented?
5.1. What were the main factors that contributed to whether activities resulted in intended outputs and outcomes?
5.2. What quality standards were defined? How did the programs develop those standards?
Coordination 6. To what extent did the programs coordinate with other food security and humanitarian programming, the host country government, and the donor?
Sustainability and Replicability 7. How sustainable are programs’ the outcomes?
7.1. What exit strategies were incorporated into program design? Were such strategies implemented, how were they perceived by the beneficiary population, and what were the strengths and weaknesses of the exit strategies adopted?
Cross‐cutting issues 8. How well were gender and environmental considerations integrated into program design and implementation?
8.1. Were they successful in meeting their stated objectives? How?
Lessons Learned 9. What lessons can be learned future FFP and USAID Title II in Zimbabwe?

IMPEL | Implementer-Led Evaluation and Learning
66 Annex B: Evaluation Statement of Work
III. Endline Study Design and Methodology
The endline study will consist of the following data collection activities, described below:
A. Representative population‐based household survey
B. Qualitative data collection activities
A. REPRESENTATIVE POPULATION‐BASED HOUSEHOLD SURVEY
The Contractor is expected to take responsibility for the design and execution of all aspects of a representative, population‐based household survey, including sampling plan; questionnaire instrument development; field procedure manuals for enumerators and supervisors; training of enumerators, supervisors, and anthropometrists; piloting of the questionnaire instrument; organization of field work; pre‐testing of the survey rollout; data collection, cleaning, manipulation, and analysis.
1. Sampling Design: Before embarking on designing the sample survey, the Contractor should become familiar with the FANTA Sampling Guide (1997)21 and Addendum (2012).22 The former provides an overview of the recommended design features for Title II baseline and final evaluation surveys. The 2012 Addendum provides important corrections to the guide, which should be followed closely. The survey population should be limited to those living in geographic areas where program implementation is intended to take place and the sampling frame should reflect this constraint.
The Contractor should plan to conduct one survey and two strata, with each awardee area representing one stratum in the survey design. The sample size will be approximately 1600 households. A multi‐stage cluster sampling design should be used. FFP requires that the final evaluation for the program be a performance evaluation (rather than an impact evaluation).
This implies that a simple pre‐post design without control groups will be used at both baseline and final evaluation. The Contractor should provide initial indication of the sampling design for the endline survey in a Sampling Plan document in advance of field implementation. This document should include all of the following elements:
The base sample size at both the awardee and overall combined levels. The equation used to drive the calculation of the sample size should also be indicated, where the basis of the calculation should be a test of differences of proportions over two time points. The parameters used in the equation, including the design effect, confidence level, and statistical power assumed should be given. The Contractor should provide a table showing a comparison of sample sizes across “candidate indicators” under consideration for taking on the role of “principal indicator to drive the overall sample size”. The Contractor should carry out sample size calculations separately for each awardee and then sum them to obtain the total sample size for the country survey.
The final choice of principal indicator that will drive the sample size calculation for the entire survey (and associated target group) along with a rationale for the choice of indicator. In terms
21 Although the FANTA Sampling Guide presents random walk as an acceptable sampling method, it is no longer considered acceptable and will not be accepted as a proposed second stage method. 22 The FANTA Sampling Guide and Addendum can be found at http://www.fantaproject.org/publications/sampling.shtml

Final Performance Evaluation of the ENSURE DFAP in Zimbabwe
Annex B: Evaluation Statement of Work 67
of associated target group, if stunting is the principal indicator, the target group will be children 0‐59 months, for example.
The number of households to be sampled in order to achieve the desired sample size for the target group (assuming that households may contain more than one or no eligible members from the target group). The Contractor should give an indication of how the base sample size will be adjusted to account for the number of households that need to be visited. See the FANTA 2012 Addendum for more details.23
The number of households to be sampled to account for anticipated household non‐ response. The Contractor should indicate by how much the number of households to be sampled will be pre‐inflated to account for household non‐response.
Geographic or other stratification along with the associated sample allocation scheme (optional). Note that at a minimum, the sample will be stratified by awardee if two awards are made. Additional strata are not required but may be considered. Note that estimates must be produced at both the awardee and combined Title II country program level. Also note, while additional stratification can be considered in the design, estimates do not have to be produced at the level of the lower strata and are likely not feasible given limited survey resources.
The number of stages of sampling to be used. Explanation of how the number of clusters and of households per cluster in the sample will be determined.
Explanation on the source of the information for the sampling frame, e.g., census lists or other national or internationally‐sponsored surveys, such as the Demographic Health Surveys (DHS). The Contractor should indicate how reliable and recent the frame information is.
A Probability Proportionate to Size (PPS) sampling mechanism should be used to randomly select the clusters. The Contractor should use the number of households per cluster as the size measure and include a table of size measures and another table showing the final list of selected clusters along with their probabilities of selection.
Indication that the Contractor will use systematic sampling (or some other probability‐ based sampling technique such as Simple Random Sampling) to select dwellings within clusters. This implies that for the sampled clusters, a list of all households, with household identification and location indicated, must be obtained through either a mapping and listing operation in the cluster prior to interviewing (preferred), or through other existing reliable sources.
The Contractor should collect geographic information system (GIS) information using GPS equipment to locate dwellings during the listing process. GPS units should be used to capture the precise longitude and latitude of each household to be surveyed. These values may then be randomly displaced by a given distance or aggregated up to a higher administrative unit as needed.
Explanation of how households are defined by the Census office in the country in question. In cases where there are multiple households per dwelling, the Contractor should adopt a “take‐all‐households” approach. The Contractor should specify how polygamous households will be treated as polygamy is prevalent in Zimbabwe.
Indication that the Contractor will adopt a “take‐all‐individuals” approach to select individuals within households from whom to collect data for each target group, particularly for target groups that are more rare in the population, such as children ages 0‐5 months in the case of the exclusive breastfeeding indicator, for example.
23 Ibid.

IMPEL | Implementer-Led Evaluation and Learning
68 Annex B: Evaluation Statement of Work
2. Questionnaire Instrument: FFP expects the Contractor to develop a questionnaire instrument in English and the local languages, Ndebele and Shona, in which the survey will be conducted, incorporating modules specified in the FFP Standard Indicators Handbook for Baseline and Final Evaluation (referenced above) to respond to the data collection needs of the Title II development food aid programs and USAID. Some of the modules associated with various FFP Indicators, such as HDDS, will require country‐specific adaptation which should be done in consultation with FFP and the Title II awardees.11 Given the limited time and resources for development, it is recommended that the Contractor limit the instrument to a paper and pencil version. The questionnaire should include an informed consent statement for each respondent and commence with a set of questions to establish a household roster. The questions within the questionnaire should be organized by respondent type24 and questions should follow international standard format, e.g. DHS, wherever possible. In general, the Contractor should ensure that questions are written following established questionnaire design principles and that rigorous practices are used to collect, tabulate, and analyze indicator data. These practices should include adding identifiers, such as cluster number, household number, and respondent identification number (line number from household roster) to each page of the questionnaire(s). This helps to ensure that pages can be correctly associated with a given household and respondent if separated, and enable the derivation of household‐level sampling weights and a household non‐response adjustment to be incorporated into the sampling weights for use in all data analyses. The Contractor should ensure that the questionnaire is piloted and validated in communities not included in the sample frame prior to commencement of data collection.
3. Field Procedure Manuals for Enumerators and Supervisors: FFP expects that the Contractor will develop two field manuals to be used as part of the training materials and serve as reference material for staff in the field conducting the survey: one for enumerators and one for supervisors of enumerators. The field manual for enumerators should give recommended best practices for conducting interviews and dealing with specific challenging situations, e.g. households that refuse to participate, and provide a household and individual respondent non‐response follow‐up strategy. It should also contain a detailed explanation of how to properly administer each question in the questionnaire. The field manual for supervisors can contain some of the same material as the field manual for enumerators, The supervisor field procedure manual should also describe the roles and responsibilities of the field staff and outline the chronology of field work, including training, piloting the questionnaire, pre‐testing the survey, data collection, etc. It should also include instructions on mapping and listing clusters, use of GPS equipment, enumerator quality assurance monitoring, questionnaire editing procedures, re‐ interviewing procedures, and procedures for sampling dwellings within clusters, households within dwellings, and individuals within households.
4. Anthropometry Training Materials: The Contractor will provide a short guide and/or other materials to support the training of anthropometrists in the measurements required for the stunting and underweight indicators. This will include instructions on how to take measurements on height and weight for both women and children under five years of age, citing a reference for the methodology that will be used. It will also include a section on methods (event calendars, e.g.) that will be used to ascertain the age of the individuals whose measurements are being taken. Finally, the training materials should include a section on standardization testing of the anthropometrists, which should cover
24 Note that a respondent is an individual or set of individual(s) identified as most appropriate to respond to a set of questions on behalf of a specific target group. Such respondents can be the actual sampled members of the target group themselves (e.g., adults providing direct responses on behalf of themselves) or can be individuals not part of the target group providing proxy responses on behalf of sampled individuals in the target group (e.g., caregivers on behalf of young children).

Final Performance Evaluation of the ENSURE DFAP in Zimbabwe
Annex B: Evaluation Statement of Work 69
anthropometrical measurement taking and testing of precision and validity of measurements taken by each anthropometrist.
5. Data Treatment and Analysis Plan: The Contractor will prepare a data treatment and analysis plan to address the following elements:
Indication of how and when data will be entered into the database, as well as the software to be used for data entry. Double‐data entry is required;
Data quality checks and edits (data cleaning) planned to ensure logical consistency and coherence across records, as well as an indication of the software to be used;
Sampling weights to be included on the data file. The formulae used to calculate the sampling weights should be included as part of a data dictionary document. Different sampling weights will need to be calculated for separate analysis of each awardee area and of the aggregate Title II program data for the country. Note that a household non‐response adjustment should be made to the sampling weights as part of the final weighting system;
Indicator tabulation plan. Estimates should be produced for each awardee stratum and for the overall level;
Sub‐groups (e.g., age, sex or other geographic breakdowns), if any, for which the Contractor will produce estimators (provided the associated precision levels are sufficient);
Any other planned data analyses. The Contractor should specify all intended bivariate and multivariate analyses here;
Confidence intervals associated with the indicators that will be produced alongside the indicator estimates, and assurance that that these will take into account the design effect associated with the complex sampling design; and
Software to be used for data analysis and for conversion of anthropometric data into Z‐ scores (WHO’s Anthro is recommended but not mandatory).
Upon completion of the survey, location information and associated data collected as part of this award will be delivered to FFP. The Contractor should specify how location data will be adjusted to protect personally identifiable information in accordance with the research protocol submitted to the Institutional Review Board (IRB). Note that the Contractor will be responsible for adhering to and obtaining all necessary US and host country IRB approvals.
The Contractor will ensure that the labeling and architecture of all datasets is consistent to help facilitate meta‐analyses of datasets across Title II development programs and countries at a later date.
B. QUALITATIVE DATA COLLECTION
FFP will discuss with the Contractor specific details with respect to the requested architecture of the datasets. The meta‐analysis of data is not part of this SOW. The Contractor will undertake qualitative data collection as part of the endline study. The main objective of the qualitative study is to provide a deeper understanding of the overall food security situation in the program implementation area as perceived by communities and potential beneficiaries. Qualitative information adds depth, richness, and context and will serve to triangulate and interpret information from the household survey. Quantitative and qualitative results should be combined to provide a more complete picture of the overall food security situation. The qualitative study described in this SOW is not expected to replace any in‐depth qualitative assessments or formative research that implementing partners may conduct at the beginning of a program to inform specific aspects of their program design.

IMPEL | Implementer-Led Evaluation and Learning
70 Annex B: Evaluation Statement of Work
The Contractor is expected to take responsibility for the design and execution of all aspects of the qualitative study. The Contractor should submit a proposed methodology for the qualitative study that clearly shows how it will complement the quantitative survey and includes the following elements:
1. Purpose and objectives of the qualitative study; 2. Research questions the qualitative study will answer; 3. Conceptual framework presenting the themes that are thought to be relevant to answer the
research questions; 4. Detailed methodology presenting data collection methods to be used, e.g., rapid
appraisal/participatory rural appraisal, focus groups, key informant interviews, structured/semi‐ structured interviews, anecdotal evidence, organizational capacity assessments, observations, or seasonal calendars;
5. Description of the instruments that will be developed and the type of questions to be asked, e.g., key informant interview guides, focus group guides, or organizational capacity assessment questionnaires;
6. Sampling design and approach for selecting sites, key informants, focus group discussion participants, and/or direct observation sites for the qualitative component;
7. Timeline and overall approach to data collection, i.e. will it take place prior, in parallel, or subsequent to the household survey, and any potential timeline constraints. (Note that it is highly recommended to conduct the qualitative data collection after the quantitative data collection has been completed and at least partially analyzed to better inform the questions that the qualitative component will set out to answer); and
8. Plan for data management, coding, and analysis specifying how collected data will be translated, transcribed, coded, and analyzed, the time required for each, and the specific software to be used.
IV. Endline Study Deliverables and Report Outline
A. DELIVERABLES
The Contractor is responsible for the following deliverables:
Details Deliverables Deadline
1) Pertinent permissions, insurance, and other required permits
a) Obtain all necessary permissions for implementing the baseline data collection.
b) Adhere to Governments of the U.S. and Zimbabwe national and local formalities. Obtain all required permits related to data collection from human subjects and logistics of survey implementation, including necessary IRB approvals, health and accident insurance, salary and taxes for all enumerators, supervisors and anthropometrists.
Pertinent permissions, insurance, and other required permits
Evidence submitted and approved prior to FFP granting permission to Contractor to commence pre‐data collection activities, including training of enumerators, supervisors and anthropometrists

Final Performance Evaluation of the ENSURE DFAP in Zimbabwe
Annex B: Evaluation Statement of Work 71
Details Deliverables Deadline
2) Inception report and project management tool
a) Inception report: specify details for critical tasks, anticipated outputs, date-bound timelines, resource needs, and responsible person(s). Composition of a standard field survey team, including expected tasks and responsibilities of each team member, should also be described.
b) Project management tool: an online project management tool should be set up and accessible by FFP and the Contractor. The tool should include a breakdown of key tasks and activities with agreed‐upon deadlines, as well as a Gantt/flow chart of activities over the lifetime of the study.
Inception report and project management tool
Draft of inception report submitted four weeks after contract issuance. Draft reviewed, revised, finalized, and approved within eight weeks of signing contract.
Launch of project management tool four weeks after contract issuance.
3) In‐country endline workshop
a) Organize, develop materials for, and conduct a three‐ to four‐day in‐ country workshop in English that brings together the Contractor, Title II awardees, FFP, and the USAID Mission in Zimbabwe.
b) Purpose is to glean information on program implementation and country‐ specific ground realities in relation to survey sampling and fieldwork logistics planning; define questions for qualitative component, and vet quantitative instrument and qualitative methodology plan.
c) Contractor staff who must attend include those responsible for developing the sampling plan, quantitative instrument, and qualitative methodology, and responsible for overseeing fieldwork. Staff from sub‐contractor firms must also attend the workshop.
d) Participants from FFP, USAID, and Title II awardees will fund their attendance at the workshop. However, the Contractor will bear the costs of travel and attendance, in addition to the costs of venue rental, catering,
Two months after the conclusion of the M&E in‐country workshop

IMPEL | Implementer-Led Evaluation and Learning
72 Annex B: Evaluation Statement of Work
Details Deliverables Deadline
simultaneous translation for the workshop, etc.
4) Quantitative survey questionnaire instrument
a) Draft a questionnaire instrument in English adapted to Zimbabwe context that responds to the elements specified in Section III A above.
b) Translate the approved questionnaire instrument from English into the local languages, Ndebele and Shona, in which the survey will be administered. If oral (non‐written) languages are needed, a phonetic translation will be required and additional training of enumerators will be necessary.
c) Back‐translate the questionnaire from the local languages to English with a second translator to ensure accurate translation.
d) Pilot the survey instrument in all the languages in which the survey will take place. (More details under deliverable #9).
Final English, corresponding local language, and back‐translated questionnaires approved by FFP
Draft English version of instrument submitted two weeks after conclusion of in‐country workshop conducted by Contractor (see Deliverable 3).
Local language versions of questionnaire instrument to be submitted after English version approved. Date TBD.
Draft versions reviewed, revised, finalized, and approved by FFP prior to granting permission to Contractor to commence pre‐data collection activities, including training of enumerators, supervisors and anthropometrists
5) Qualitative data collection methodology
a) Draft a detailed qualitative data collection methodology that responds to the elements specified in Section III B.
Qualitative data collection materials approved by FFP
Draft materials to be submitted to FFP 3 weeks after conclusion of in-country workshop conducted by Contract (see Deliverable 3).
Draft version of materials reviewed, revised, and approved by FFP prior to granting permission to the Contractor to
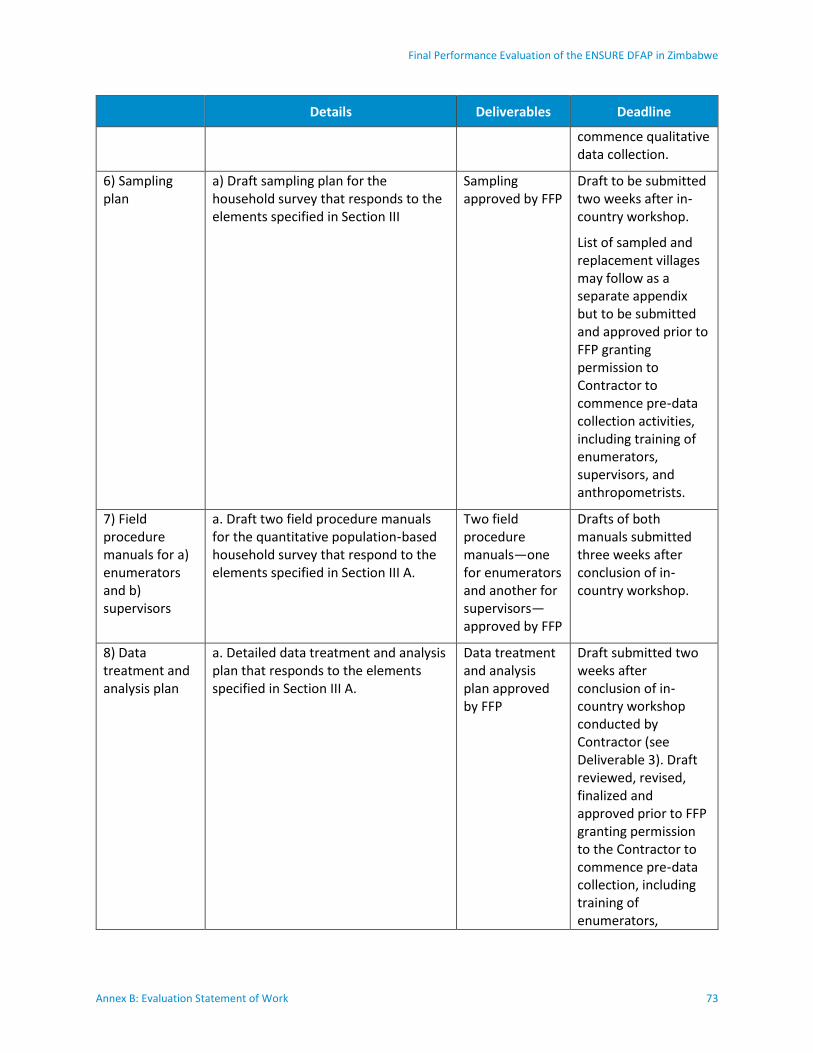
Final Performance Evaluation of the ENSURE DFAP in Zimbabwe
Annex B: Evaluation Statement of Work 73
Details Deliverables Deadline
commence qualitative data collection.
6) Sampling plan
a) Draft sampling plan for the household survey that responds to the elements specified in Section III
Sampling approved by FFP
Draft to be submitted two weeks after in‐ country workshop.
List of sampled and replacement villages may follow as a separate appendix but to be submitted and approved prior to FFP granting permission to Contractor to commence pre‐data collection activities, including training of enumerators, supervisors, and anthropometrists.
7) Field procedure manuals for a) enumerators and b) supervisors
a. Draft two field procedure manuals for the quantitative population‐based household survey that respond to the elements specified in Section III A.
Two field procedure manuals—one for enumerators and another for supervisors—approved by FFP
Drafts of both manuals submitted three weeks after conclusion of in‐ country workshop.
8) Data treatment and analysis plan
a. Detailed data treatment and analysis plan that responds to the elements specified in Section III A.
Data treatment and analysis plan approved by FFP
Draft submitted two weeks after conclusion of in‐country workshop conducted by Contractor (see Deliverable 3). Draft reviewed, revised, finalized and approved prior to FFP granting permission to the Contractor to commence pre‐data collection, including training of enumerators,
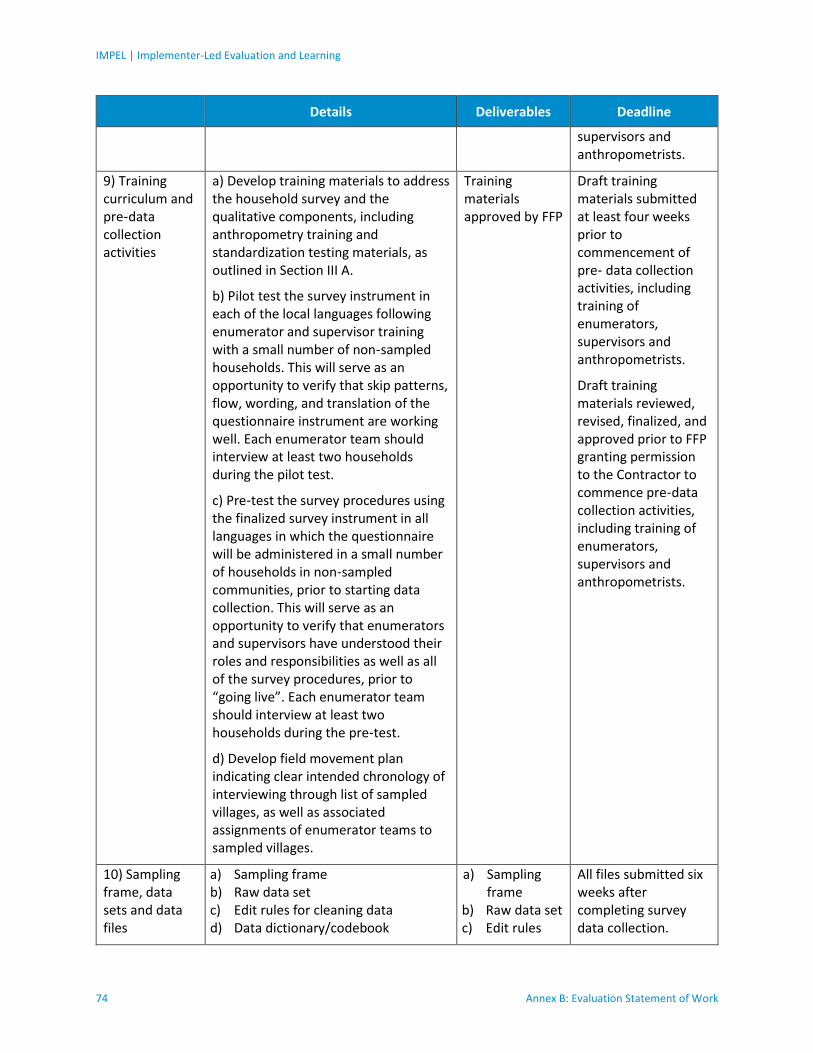
IMPEL | Implementer-Led Evaluation and Learning
74 Annex B: Evaluation Statement of Work
Details Deliverables Deadline
supervisors and anthropometrists.
9) Training curriculum and pre‐data collection activities
a) Develop training materials to address the household survey and the qualitative components, including anthropometry training and standardization testing materials, as outlined in Section III A.
b) Pilot test the survey instrument in each of the local languages following enumerator and supervisor training with a small number of non‐sampled households. This will serve as an opportunity to verify that skip patterns, flow, wording, and translation of the questionnaire instrument are working well. Each enumerator team should interview at least two households during the pilot test.
c) Pre‐test the survey procedures using the finalized survey instrument in all languages in which the questionnaire will be administered in a small number of households in non‐sampled communities, prior to starting data collection. This will serve as an opportunity to verify that enumerators and supervisors have understood their roles and responsibilities as well as all of the survey procedures, prior to “going live”. Each enumerator team should interview at least two households during the pre‐test.
d) Develop field movement plan indicating clear intended chronology of interviewing through list of sampled villages, as well as associated assignments of enumerator teams to sampled villages.
Training materials approved by FFP
Draft training materials submitted at least four weeks prior to commencement of pre‐ data collection activities, including training of enumerators, supervisors and anthropometrists.
Draft training materials reviewed, revised, finalized, and approved prior to FFP granting permission to the Contractor to commence pre‐data collection activities, including training of enumerators, supervisors and anthropometrists.
10) Sampling frame, data sets and data files
a) Sampling frame b) Raw data set c) Edit rules for cleaning data d) Data dictionary/codebook
a) Sampling frame
b) Raw data set c) Edit rules
All files submitted six weeks after completing survey data collection.

Final Performance Evaluation of the ENSURE DFAP in Zimbabwe
Annex B: Evaluation Statement of Work 75
Details Deliverables Deadline
e) Syntax and output for all analyses and variable transformations
f) Final data set including cleaned data, sampling weights at each stage, final sampling weights, and all derived indicators
Programming specifications for data cleaning to be submitted and approved prior to commencement of programming. Final submission of the data sets must be in the format required by FFP Information Bulletin 11‐02 (August 11, 2011).
d) Data dictionary codebook
e) Syntax f) Final data
set
11) Briefings a) Weekly phone briefings with FFP and other stakeholders identified by FFP to include a progress report and discussion on any difficulties related to the baseline study. During data collection period, electronic material accompanying briefings should include short field progress reports with number of clusters completed, non‐response rates, re‐interview rates, enumerator drop‐out rates, etc. Template for field progress reports to be determined jointly by FFP and Contractor.
b) Monthly phone briefings with the USAID Mission in Zimbabwe and FFP. These briefings should follow the same format as the weekly briefings.
c) Formal, final in‐country briefing to the USAID Mission in Zimbabwe , FFP, and Title II awardees to include a PowerPoint presentation and cover the contents of the baseline study report, including findings, conclusions, lessons learned, and recommendations
Weekly phone briefings with FFP and other stakeholders. Monthly phone briefing and final in‐country briefings with the USAID Mission in Zimbabwe , FFP, and Title II awardees.
Schedule of briefings to be determined jointly by Contractor and FFP.
12) Draft baseline study report
a) Draft final report, not to exceed 50pages, excluding appendices and attachments. The report must be presented in English and must
Draft report reviewed by FFP
Submitted 14 weeks after completing data collection in the field (and eight weeks after
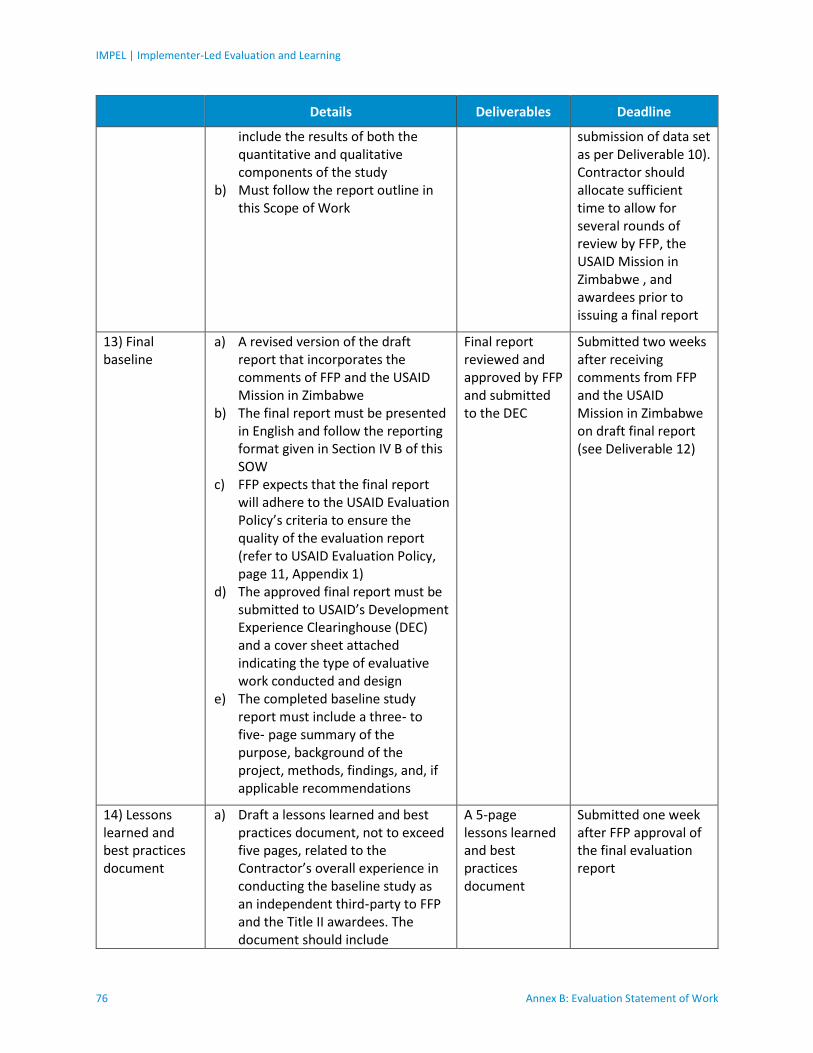
IMPEL | Implementer-Led Evaluation and Learning
76 Annex B: Evaluation Statement of Work
Details Deliverables Deadline
include the results of both the quantitative and qualitative components of the study
b) Must follow the report outline in this Scope of Work
submission of data set as per Deliverable 10). Contractor should allocate sufficient time to allow for several rounds of review by FFP, the USAID Mission in Zimbabwe , and awardees prior to issuing a final report
13) Final baseline
a) A revised version of the draft report that incorporates the comments of FFP and the USAID Mission in Zimbabwe
b) The final report must be presented in English and follow the reporting format given in Section IV B of this SOW
c) FFP expects that the final report will adhere to the USAID Evaluation Policy’s criteria to ensure the quality of the evaluation report (refer to USAID Evaluation Policy, page 11, Appendix 1)
d) The approved final report must be submitted to USAID’s Development Experience Clearinghouse (DEC) and a cover sheet attached indicating the type of evaluative work conducted and design
e) The completed baseline study report must include a three‐ to five‐ page summary of the purpose, background of the project, methods, findings, and, if applicable recommendations
Final report reviewed and approved by FFP and submitted to the DEC
Submitted two weeks after receiving comments from FFP and the USAID Mission in Zimbabwe on draft final report (see Deliverable 12)
14) Lessons learned and best practices document
a) Draft a lessons learned and best practices document, not to exceed five pages, related to the Contractor’s overall experience in conducting the baseline study as an independent third‐party to FFP and the Title II awardees. The document should include
A 5-page lessons learned and best practices document
Submitted one week after FFP approval of the final evaluation report

Final Performance Evaluation of the ENSURE DFAP in Zimbabwe
Annex B: Evaluation Statement of Work 77
Details Deliverables Deadline
recommendations for FFP on areas of improvement for future baseline studies and final evaluations.
B. OUTLINE OF ENDLINE STUDY REPORT
The recommended endline study report outline follows:
Cover page, Table of Contents, List of Acronyms;
Executive Summary should be a clear and concise stand‐alone document that states the most salient findings, conclusions, and recommendations of the study and gives readers the essential contents of the endline report in three to five pages. The Executive Summary helps readers to build a mental framework for organizing and understanding the detailed information within the report;
Introduction should include purpose, audience, and synopsis of task;
Methodology and Study Design should describe the methodology and design of the household survey and qualitative component, constraints and limitations to the study process and rigor, and issues in carrying out the study;
Overview of the Current Food Security Situation should provide a brief overview of the current food security situation in Zimbabwe related to food availability, access, and utilization; current and anticipated programming; and stakeholders. A desk review of information already available will suffice;
Tabular summary of quantitative survey results should present findings of the household survey in table form for all the indicators by awardee and for the aggregate Title II program area in Zimbabwe;
Findings should present results from the household quantitative survey and qualitative study. Results from the quantitative survey should be analyzed and discussed, using findings from the qualitative study to complement and help triangulate them. The qualitative study findings should also provide a deeper understanding of the overall food security situation in the program implementation area. Any bivariate and multivariate analysis undertaken should also be included;
Conclusions and Recommendations should provide high‐level conclusions from the endline study and recommendations for the design and implementation of future programming in Zimbabwe. Recommendations must be relevant to program and context and include concrete and realistic steps for implementing or applying the recommendation;
Issues should provide a list of key technical and/or administrative issues, if any, that the Title II programs for which the baseline study was conducted should consider; and
Annexes should document the following and be succinct, pertinent, and readable:
References, including bibliographical documentation;
List of meetings, including key informant interviews and focus group discussions, with number, type, and date of interactions;
Quantitative survey instruments in English and applicable local languages, Ndebele and Shona in Zimbabwe;
Sampling Plan for the quantitative survey;
Qualitative study methodology and instruments developed and used;
Quantitative data sets and qualitative data transcripts in electronic format;
IMPEL | Implementer-Led Evaluation and Learning
78 Annex B: Evaluation Statement of Work
Data dictionary and program files used to process the data in electronic format;
Baseline study SOW; and
Other special documentation identified as necessary or useful
V. Contractor Qualifications
The selected firm/consortium shall possess the following qualifications:
Legal status recognized to work in the country, enabling the organization to perform the above‐mentioned tasks;
Demonstrated experience and strong internal capacity in designing, organizing, and managing the implementation of large‐scale population‐based household surveys in developing countries within the past five years;
Demonstrated experience and strong internal capacity in designing, organizing, and conducting qualitative research, data collection, and analysis in developing countries within the past five years;
Demonstrated experience and strong internal capacity in the statistical analysis of complex survey data and in analyzing data from mixed‐method studies;
Good network of experienced enumerators, supervisors, anthropometrists, and data entry clerks in Zimbabwe, or demonstrated ability to effectively recruit skilled enumerators, supervisors, and data entry clerks in developing countries
Experience engaging and managing statistical or evaluation firms and/or institutions in Zimbabwe or other developing countries; and
Ability to deliver high‐quality written and oral products.
VI. Team Composition and Qualifications
For planning purposes, the team for this study will consist of key personnel with defined technical expertise, a mix of consultants that will provide varying technical and subject matter expertise, and support staff. The team should include local consultants with expertise, knowledge, and experience in Zimbabwe. Offerors may propose an alternative personnel configuration to implement the study based on the approach provided in their proposals.
The required areas of technical and subject matter expertise represented on the team should reflect the multi‐sectoral nature of Title II food assistance and the expertise required to conduct qualitative research and quantitative population‐based household surveys:
Expertise in food security programming;
Expertise in agriculture;
Expertise in maternal and child health and nutrition;
Expertise in gender integration;
Expertise in qualitative data collection methods and analysis; and
Expertise in the design and execution of population‐based household surveys, and in the analysis of complex survey data.
Key Personnel:
1. Endline Study Team Leader: This individual will serve as team leader in a full‐time position for the duration of the study. S/he will be the primary point of contact between USAID and the endline study

Final Performance Evaluation of the ENSURE DFAP in Zimbabwe
Annex B: Evaluation Statement of Work 79
team and have responsibility for the overall compilation of the final endline study report. The incumbent must meet the following criteria:
At least 10 years of food security programming in senior management positions; Master’s or PhD degree in development studies, management, program evaluation, or other relevant field of study;
Directly managed the design and implementation of at least two food security‐related, large‐scale, population‐based household surveys with complex designs;
Broad range of subject matter expertise and demonstrated experience in the areas of food security, agriculture development, nutrition, and health;
Excellent organization and writing skills and a demonstrated ability to deliver a quality written product (Evaluation Report and PowerPoint)
Excellent oral communication, presentation, and inter‐personal skills;
Technical and management skills to manage budget resources (dollars and staff) for the evaluation, as well as assist and support the team with field logistics (e.g., coordinating with USAID and/or a government ministry to set up initial appointments for interviews); and
Experience on past Title II baseline surveys or final evaluations would be a plus.
2. Senior Survey Specialist: This individual will be responsible for designing, managing, and coordinating the population‐based household survey and analysis of the survey data. The incumbent must meet the following criteria:
At least eight years of experience designing, managing, leading, and coordinating representative population‐based household surveys in developing countries;
Master’s degree or PhD in statistics, survey methodology, epidemiology or other relevant field of study;
Extensive knowledge of and experience in sample design for complex surveys and complex survey data analysis;
Extensive experience with the design and development of quantitative survey questionnaire instruments; Extensive experience with data management and database organization, including developing data entry programs and supervising data entry, cleaning, and quality control;
Strong working knowledge of SPSS, STATA, SAS or other statistical package; Excellent writing and organization skills and a demonstrated ability to deliver a high‐quality written product ; and
Experience on past Title II baseline surveys or final evaluations would be a plus.
3. Qualitative Research Specialist: This individual will be responsible for designing, managing, and supervising qualitative data collection and analysis. The incumbent must meet the following criteria:
At least eight years of experience designing and implementing qualitative research studies in developing countries;
Experience with a diverse range of qualitative methodologies, such as rapid appraisal/participatory rural appraisal, focus groups, key informant interviews, structured/semi‐structured interviews, anecdotal evidence, organizational capacity assessments, observations, and seasonal calendars;
Excellent writing and organization skills and a demonstrated ability to deliver a high‐quality written product;
Familiarity with a broad range of subject matter in the areas of food security, agriculture development, nutrition, and health; and
Experience on past Title II baseline surveys or final evaluations would be a plus

IMPEL | Implementer-Led Evaluation and Learning
80 Annex B: Evaluation Statement of Work
4. Field Operation Manager: This individual will be responsible for planning, managing, and supervising the household survey data collection in‐country. The incumbent must meet the following criteria:
Undergraduate degree in one of the social science disciplines;
Eight years of experience supervising large‐scale survey field work in developing countries, preferably involving anthropometric data collection;
Experience hiring, training, and overseeing field supervisors and enumerators; coordinating field logistics, schedules, and equipment; and managing data quality control in the field; and Fluency in relevant national language required.
As per the criteria presented above and given the multi‐sectoral approach of Title II programs, the Contractor will be expected to involve sectoral experts in the areas of agriculture, livelihoods, health, and nutrition, as needed. These experts can either be external consultants engaged on a full‐ or part‐ time basis or members of the selected firm with the necessary skills. The required skills of the agriculture and health and nutrition experts are outlined below; however, additional sectoral experts may be needed based on the country context and Title II program activities:
Agriculture Expert: This expert will provide technical guidance related to agriculture and agribusiness during the study. The incumbent must meet the following criteria:
At least five years of food security implementation experience in developing countries; Master’s or PhD degree in agriculture‐related field of study;
Strong knowledge of agriculture indicators, agriculture extension, conservation agriculture, input management, post‐harvest handling, livestock management, and agricultural marketing;
Excellent writing and organization skills;
Excellent oral communication, presentation, and inter‐personal skills;
Excellent analytical and technical skills; and Strong knowledge of Title II programming, experience on past Title II baseline surveys or final evaluations would be a plus.
Health and Nutrition Expert: This expert will provide technical guidance related to maternal and child health and nutrition during the study. The incumbent must meet the following criteria:
At least five years of maternal and child health and nutrition expertise in developing countries;
Master’s or PhD degree in international public health, international nutrition or other relevant field of study;
At least three years of emergency or development food security implementation experience;
Strong knowledge of health and nutrition indicators, supplementary and vulnerable group feeding practices, positive deviance, care group, and community healthcare methodologies;
Excellent writing and organization skills;
Excellent oral communication, presentation, and inter‐personal skills;
Excellent analytical and technical skills; and
Strong knowledge of Title II programming, experience on past Title II baseline surveys or final evaluations would be a plus.
Other team members:
The offeror will need to consider and budget accordingly to what extent the team will require junior or mid‐level support (e.g., to assist in collecting, analyzing, and cleaning data, and preparing tabular or graphic materials).

Final Performance Evaluation of the ENSURE DFAP in Zimbabwe
Annex B: Evaluation Statement of Work 81
As per the USAID Evaluation Policy, all endline study team members will provide a signed statement attesting to a lack of conflict of interest or describing an existing conflict of interest relative to the program for which the endline study is being conducted.
VII. Endline Study Management
A. LOGISTICS
FFP will provide overall direction to the Contractor, identify key documents, and assist in facilitating a work plan. FFP staff in Washington and the USAID Mission in Zimbabwe will assist in arranging meetings with key stakeholders as identified by USAID prior to the initiation of field work. The Contractor is responsible for arranging other meetings as identified during the course of this study and advising FFP prior to each of those meetings. The Contractor is also responsible for arranging vehicle rental and drivers as needed for site visits and field work. The Contractor will be responsible for making hotel arrangements, procuring its own work/office space, computers, internet access, printing, and photocopying. The Contractor will be required to make its own payments. Staff from FFP and the USAID Mission in Zimbabwe will be made available to the team for consultations regarding sampling, geographical targeting, sources, and technical issues before and during the evaluation process.
B. SCHEDULE/TIMELINE
Offerors must submit a timeline of activities as part of their proposals, which should follow the timeline set forth in Section IV A of this Scope of Work.
C. BUDGET
A firm bidding on this activity must, in addition to a technical proposal, submit a Budget in Excel showing the projected Level of Effort (LOE) for each proposed full‐time and/or short‐time member of the Team, including subject matter expertise and administrative (logistical) support. Other costs that should be included are international travel and per diem, in‐country costs for data collection and interviewing, communications, report preparation and reproduction, and other costs as appropriate. A six‐day work week is authorized when working in‐country.
Offeror proposals will be evaluated on the merit of the proposed approach including the following criteria:
30% Technical Approach as illustrated in the description of proposed methodology.
25% Timeline reflecting proposed activities, which emphasizes the ability to meet the proposed deadlines.
25% Key personnel and composition of the technical team, including CVs and commitment of availability. FFP will also consider the offeror’s ability to engage and use local firms.
20% Past performance, including a sample document (preferably of a baseline or final evaluation with quantitative and qualitative methodologies) provided as a writing sample to evaluate this criteria. The offeror should also include in the submission a list of references, preferably in USAID, related to the completion of a baseline study or final evaluation for a Title II or food security project.
IMPEL | Implementer-Led Evaluation and Learning
82 Annex B: Evaluation Statement of Work
VIII. Intellectual Property
USAID shall, solely and exclusively, own all rights in and to any work created in connection with this agreement, including all data, documents, information, copyrights, patents, trademarks, trade secrets or other proprietary rights in and to the work. The Contractor is not allowed to withhold any information related to this agreement, as this will become public information.

Final Performance Evaluation of the ENSURE DFAP in Zimbabwe
Annex C: Training, Data Collection, and Quality Assurance 83
Annex C: Training, Data Collection, and Quality Assurance
Training
TANGO organized and led enumerator training in preparation for the ENSURE and Amalima endline quantitative survey. The training took place from April 22 to May 4, 2019. It was led by two TANGO consultants with assistance from Jimat Development Consultants. The Jimat team included a Survey Director, Survey Coordinator, and two PBS Specialists. An independent Anthropometry Specialist led the anthropometry training and an Independent Survey Monitor provided support to the TANGO team and to all supervisors. Table 5 shows the number of different personnel employed in the training and data collection phases, by personnel category.
Table 5: Personnel employed for Zimbabwe quantitative survey training and data collection
# listers # lister
supervisors # enumerators,
HH survey # enumerators, anthropometry
# team leaders
Training 30 10 47 12 9
Data collection 18 10 46 9 9
Household survey enumerator training
A team of 47 household survey enumerators and nine field team leaders participated in the 11-day training. The training covered: study objectives and sampling methodology, human subjects research, interview norms and survey implementation guidance. It also included a thorough review of the household survey instrument, instruction how to conduct household listing, and the use of tablets and data collection through Open Data Kit (ODK). During the course of the training, enumerators and field team leaders practiced administering the household survey, using both paper and tablet versions in order to familiarize themselves with different scenarios they could encounter in the field. Throughout the course of the training, participants maintained a list of questions and issues to review with TANGO.
Listing enumerator training
The listers and lister supervisors attended the first two days of the household enumerator training (April 22-23, 2019) for overall orientation. On the third day, the listing group split away for its own training and practice before beginning the listing exercise on April 25. The listing team was comprised of 30 listers and 10 lister supervisors.
The listers received training on the listing survey and on developing sketch maps for use by the household survey enumerators. An exercise was developed to encourage listers and household enumerators to develop and interpret sketch maps, using the local venue as an example. This ensured enumerators and listers had a good understanding of how the data collected by the two individual surveys (household and listing) were linked and how enumerators’ work contributed to their peers’ work.
The lister supervisors were trained on processing listing surveys, overseeing the listing data collection, and quality control checks. The training reviewed protocol to introduce the project to the local leadership, as the listing teams were the first point of contact between survey teams, households and communities.
IMPEL | Implementer-Led Evaluation and Learning
84 Annex C: Training, Data Collection, and Quality Assurance
Anthropometry enumerator training
A team of 12 anthropometry enumerators also participated in the first two days of the training (April 22-23, 2019) alongside the household enumerators and listing enumerators. The anthropometry enumerators then participated in separate training from April 24 to May 4, 2019 to focus on the anthropometry survey. Training included sessions on i) measurement procedures for women and children on stunting and underweight indicators; ii) introduction to using tablets and data collection through ODK; and iii) anthropometry quality control measures to be covered with field team leaders.
Jimat invited women and children to participate as volunteers for the anthropometry training. Household survey enumerators assisted the anthropometry enumerators by positioning children so that they could be measured correctly. The Anthropometry Specialist instructed enumerators on how to avoid recording errors when measuring women’s height and weight and children’s standing or recumbent height and weight.
Supervisor training
In addition to the 11-day training, field team leaders participated in a one-day supervisor training which covered roles and responsibilities of supervisors and the fieldwork workplan. The training was led by the TANGO team; participants were the Jimat personnel (Survey Director, Study Coordinator, and PBS Quality Controllers), Independent Survey Monitor, and Anthropometry Specialist. The TANGO team discussed responsibilities for each type of supervisor to ensure role clarity and optimal quality control over the data collection process and data management. This was necessary given the layered approach to supervision that was established for data collection: Jimat team members, independent consultants, and field team leaders each had specific roles to play. The team of 15 field team leaders, responsible for directly managing survey and anthropometry enumerators, were trained on the necessary procedures to follow when arriving at a cluster (EA), including communication with local leadership, the identification of households, and the assigning of households to enumerators.
All supervisors were instructed on procedures for data quality control and troubleshooting through the use of control sheets, spot checks, and re-check processes. Field team leaders were instructed on monitoring household survey and anthropometry enumerators’ data collection closely, on verifying questionnaire completeness, and on data management. This included creating backup copies of data, data archiving, and transferring complete and verified questionnaires to the TANGO server.
Training location and pre-testing
All trainings took place in Harare. During the course of the training, the household survey enumerators, anthropometry enumerators, and field team leaders had the opportunity to role-play data collection measures with volunteer members of the public who Jimat Consultants invited to the training. This was done so they could practice introductions, gather practice survey data and enter it into tablets, and ensure coordination among data collectors.
A field pre-test was organized on May 2, near the end of the training. It was conducted in a rural community within the boundaries of the projects but outside the sample, so teams could have the opportunity to gather information in an environment that closely resembled the area where actual data collection would take place. The pre-test allowed the enumerators and field team leaders to practice the procedures to follow when arriving in each EA. Household enumerators were asked to complete one household survey, and anthropometry enumerators were asked to measure at least one child and one woman. Field team leaders supervised each enumerator during a portion of their interview and

Final Performance Evaluation of the ENSURE DFAP in Zimbabwe
Annex C: Training, Data Collection, and Quality Assurance 85
provided feedback on the conduct of the interview. In addition to serving as a practice for the enumerators and a test of the survey tool, the pre-test allowed enumerators to practice coordinating the logistics of household interviews and anthropometric measurements. It also served as a test of the anthropometric equipment, and was helpful to understand the time needed to complete the survey, measurements, and data quality procedures.
The last two days of training for household survey and anthropometry enumerators in Harare were reserved for reviewing obstacles faced during the pre-test, reviewing definitions and terms in local languages, and discussing issues that needed further clarity. Issues encountered during the pre-test led TANGO to add an extra day of training (May 4) that was not originally planned.
Translation and back-translation
Following the baseline survey procedure, the household survey questions were translated and entered into ODK in Shona and Ndebele. The translation and back-translation of the household survey questionnaire were done by three enumerators hired by Jimat: one translated questions from English to Shona and one translated the questions from English to Ndebele. A third translator back-translated the household survey from the local language to English to ensure accuracy. As in the baseline, anthropometry and listing surveys were in English. The translation process was monitored by the TANGO team and closely verified by the Independent Survey Monitor to ensure accuracy.
Household survey enumerators spent a total of seven days role-playing in English/ Shona/ Ndebele with other enumerators and with the invited volunteers. Anthropometry enumerators also practiced in local languages with women and child volunteers throughout their training.
Field procedure manuals for enumerators and supervisors
TANGO produced a series of manuals to guide and support the teams throughout the data collection process. The manual for field team leaders includes:
information on household and anthropometry surveys, including explanations for every question and instructions;
terminology on agriculture, WASH practices, and food security;
description of the anthropometry survey and measurement that was covered during training;
instructions for operating tablets, understanding ODK, and uploading data to the TANGO server; and
quality control sheets for leaders to conduct checks on enumerators’ work.
The household survey manual and anthropometry manual focus on detailed explanations of questions from each survey and on working with ODK.
The anthropometry manual describes procedures adapted from the DHS biomarker manual for all DHS surveys worldwide. Reinforcing information from the training, it also includes enumerator instructions for cases where a child is suffering from wasting or exhibiting bilateral pitted edema.
Survey programming
TANGO staff converted the baseline survey questionnaire to an Excel version that was readable by ODK software. This included typing out more than 900 rows in Excel and adding columns for three languages (English, Shona, and Ndebele), with codes for skip patterns and constraints that would allow the survey logic to run appropriately. Prior to the team’s departure for fieldwork, TANGO performed a final check

IMPEL | Implementer-Led Evaluation and Learning
86 Annex C: Training, Data Collection, and Quality Assurance
and the Independent Survey Monitor also did a quality control check to verify the ODK logic in all three languages before finalizing the household survey on May 20. The programming of the listing survey and the anthropometry survey were also done using the questions from the baseline surveys; a similar process was followed for ODK programming.
Listing
Listing began on April 25 while household and anthropometry survey trainings continued in Harare. Jimat obtained detailed boundary maps for each sampled EA from the Zimbabwe National Statistics Agency, which included household counts from the 2012 census.
Lister enumerators used these maps to develop sketch maps, which included the official EA borders and sketches of infrastructure, forests, bridges, and any other natural and physical key points that would help the household and anthropometry teams locate sampled households. The listing team included a mapper and a lister working together to collect listing data and develop the maps. Listing supervisors traveled with the teams, introduced teams to village leaders, and followed all procedures, including quality control checks.
Each lister team recorded GPS coordinates at the center of the EA they listed. Each listing team gathered household-identifying information from each dwelling in the EA, including the name of the head of household. The teams worked closely with their supervisors to avoid duplications and missing households.
The listing data were uploaded to the TANGO server, where the TANGO team verified them for completeness and accuracy. The Survey Director at TANGO conducted the sampling of households (described in Section 3.1 of main report). The selected households were provided to the Independent Survey Monitor in Harare, who distributed lists of households by EA to field team leaders. The field team leaders used these lists to assign households to individual household survey and anthropometry enumerators.
Household survey and anthropometric data collection
The household survey enumerators collected data from their assigned households and worked in coordination with the anthropometry enumerators to ensure that the criteria for measuring children and women were applied. In the rare cases where household survey enumerators finished their interview and moved to another household before the anthropometry enumerators arrived (sometimes they were delayed at the previous household because they had to measure multiple individuals), the teams communicated with each other on which children and women that needed to be measured. The field team leader, anthropometry enumerators, and household survey enumerators debriefed at the end of each data collection day to plan the logistics for the next day and allow the leader to perform quality control checks.
Quality assurance
The field team leaders provided the first level of quality control by implementing spot checks and directly observing enumerators. The Survey Director, Survey Coordinator, PBS Quality Controllers, and the two independent consultants provided quality oversight to the teams in the field. The TANGO team monitored data uploaded to the TANGO secure server and provided feedback to the teams. This process ensured questionnaires were reviewed daily for completeness and accuracy. In the analysis stage, data were cleaned using STATA statistical software; identifying information was removed from the final dataset.

Final Performance Evaluation of the ENSURE DFAP in Zimbabwe
Annex D: Imputing Missing Data 87
Annex D: Imputing Missing Data
There are two areas where data needed to be imputed to compute FFP indicators: children’s meal frequency and household monthly expenditures. Each is discussed in turn, below.
Children’s meal frequency
The ODK program skipped the question in the children’s nutrition module about meal frequency. This information is required to estimate the Minimum Adequate Diet (MAD) indicator. Analysts therefore used information from the baseline survey to impute meal frequency, compared baseline imputed values to actual values, imputed meal frequency for the endline, and then computed MAD for baseline and endline using the imputed values.
The analysis estimated separate Poisson25 regression equations for children who are breastfeeding and children who are not. The dependent variable (y) in the equation is meal frequency. Explanatory (x) variables are the child’s dietary diversity, child’s age in months, milk feeds, whether or not the child had diarrhea, whether the biological mother resides in the same household, HDDS, improved water source, and household food expenditures. Household type, child’s sex, household size and geographic district were included as control variables. Imputed values of meal frequency are equal to the predicted values from each equation.
Analysts estimated several sets of equations. The first set used each explanatory variable by itself, plus the control variables. The second combined all the variables that were statistically significant in the first set into one equation (one for breastfed and one for non-breastfed children), plus the control variables. The third included all the explanatory variables, regardless of their statistical significance in the first set of equations.
The next step was to compute correlations of predicted values and actual values from the baseline survey. Predicted values of meal frequency from the final equation, with all the variables, had the highest correlation with actual values. Coefficients from that equation were applied to the endline data to impute endline meal frequency. Analysts estimated baseline and endline values of MAD using imputed meal frequency.
Household monthly expenditures
Most of the data to estimate monthly expenditures were not collected in the Zimbabwe endline survey. Skip patterns in ODK limited responses to questions about utilities. Data are missing for six categories of monthly expenditures:
Vehicle-related expenses
Transport and communications
Health care
Personal care and effects
Household operations
Recreation and entertainment
Estimation equations to impute endline monthly expenditures use baseline data. The estimation equations are of the form:
25 Poisson regression equations are used where the dependent variable is a count, in this case, meals per day.
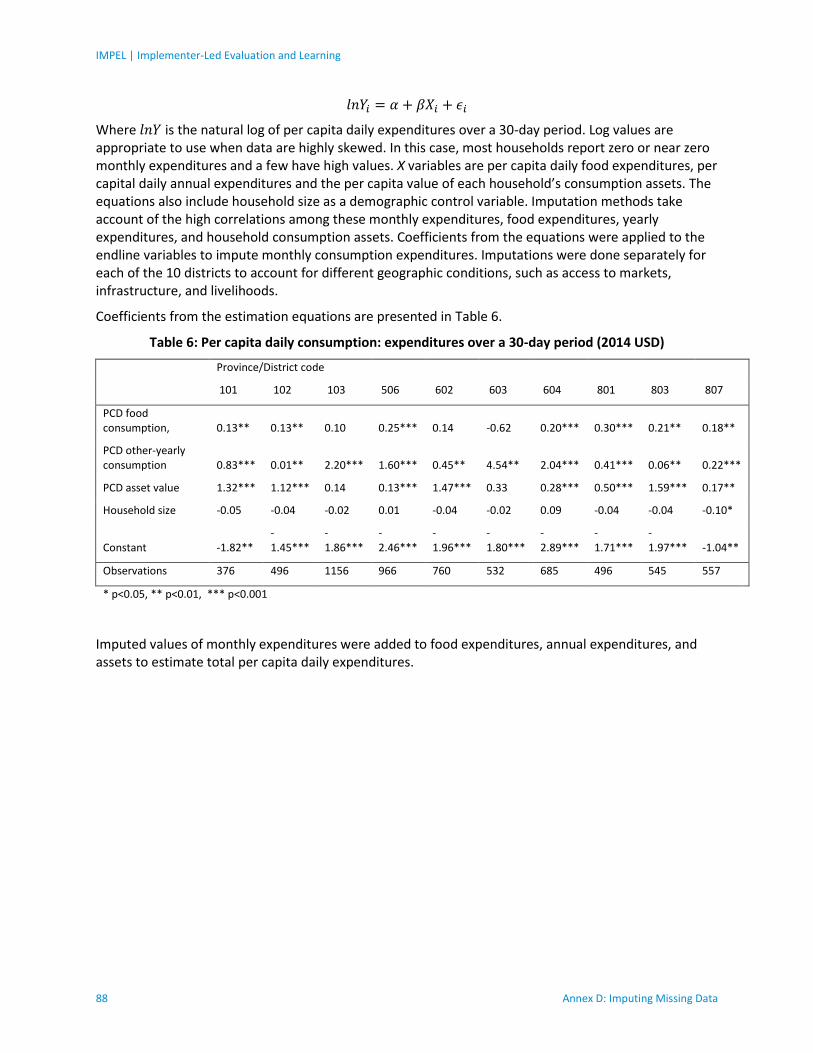
IMPEL | Implementer-Led Evaluation and Learning
88 Annex D: Imputing Missing Data
𝑙𝑛𝑌𝑖 = 𝛼 + 𝛽𝑋𝑖 + 𝜖𝑖
Where 𝑙𝑛𝑌 is the natural log of per capita daily expenditures over a 30-day period. Log values are appropriate to use when data are highly skewed. In this case, most households report zero or near zero monthly expenditures and a few have high values. X variables are per capita daily food expenditures, per capital daily annual expenditures and the per capita value of each household’s consumption assets. The equations also include household size as a demographic control variable. Imputation methods take account of the high correlations among these monthly expenditures, food expenditures, yearly expenditures, and household consumption assets. Coefficients from the equations were applied to the endline variables to impute monthly consumption expenditures. Imputations were done separately for each of the 10 districts to account for different geographic conditions, such as access to markets, infrastructure, and livelihoods.
Coefficients from the estimation equations are presented in Table 6.
Table 6: Per capita daily consumption: expenditures over a 30-day period (2014 USD)
Province/District code
101 102 103 506 602 603 604 801 803 807
PCD food consumption, 0.13** 0.13** 0.10 0.25*** 0.14 -0.62 0.20*** 0.30*** 0.21** 0.18**
PCD other-yearly consumption 0.83*** 0.01** 2.20*** 1.60*** 0.45** 4.54** 2.04*** 0.41*** 0.06** 0.22***
PCD asset value 1.32*** 1.12*** 0.14 0.13*** 1.47*** 0.33 0.28*** 0.50*** 1.59*** 0.17**
Household size -0.05 -0.04 -0.02 0.01 -0.04 -0.02 0.09 -0.04 -0.04 -0.10*
Constant -1.82** -1.45***
-1.86***
-2.46***
-1.96***
-1.80***
-2.89***
-1.71***
-1.97*** -1.04**
Observations 376 496 1156 966 760 532 685 496 545 557
* p<0.05, ** p<0.01, *** p<0.001
Imputed values of monthly expenditures were added to food expenditures, annual expenditures, and assets to estimate total per capita daily expenditures.
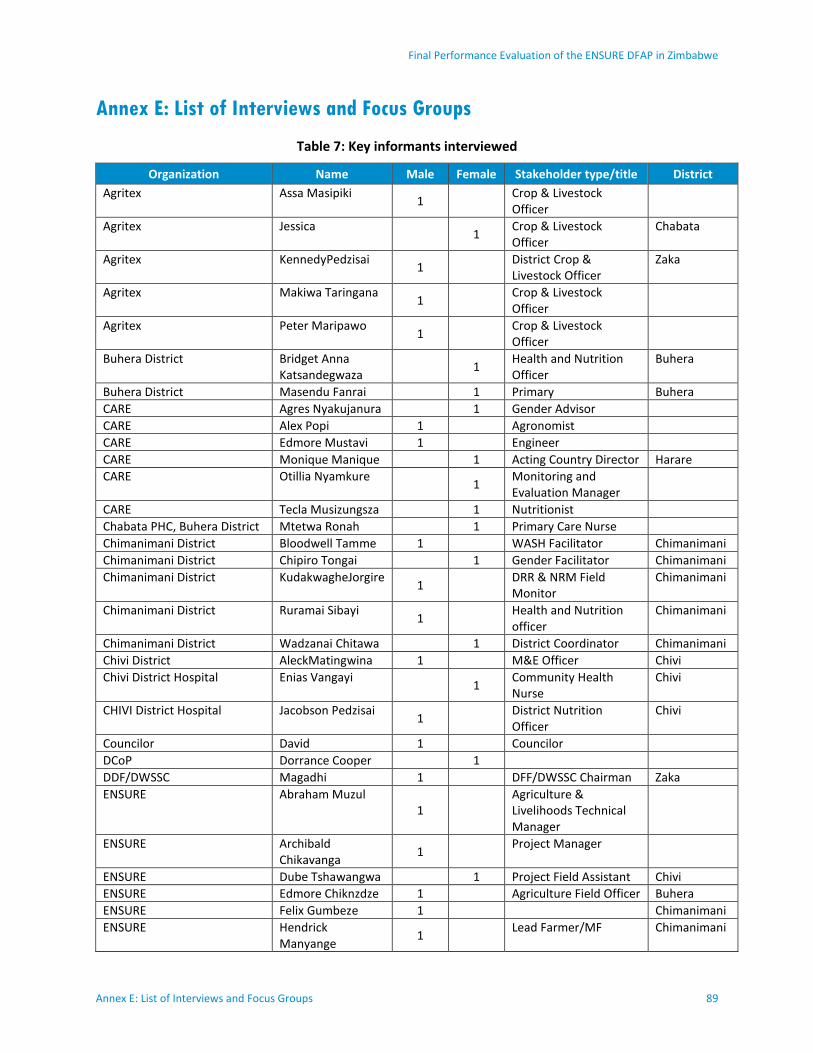
Final Performance Evaluation of the ENSURE DFAP in Zimbabwe
Annex E: List of Interviews and Focus Groups 89
Annex E: List of Interviews and Focus Groups
Table 7: Key informants interviewed
Organization Name Male Female Stakeholder type/title District
Agritex Assa Masipiki 1
Crop & Livestock Officer
Agritex Jessica 1 Crop & Livestock Officer
Chabata
Agritex KennedyPedzisai 1 District Crop &
Livestock Officer Zaka
Agritex Makiwa Taringana 1 Crop & Livestock
Officer
Agritex Peter Maripawo 1 Crop & Livestock
Officer
Buhera District Bridget Anna Katsandegwaza
1 Health and Nutrition Officer
Buhera
Buhera District Masendu Fanrai 1 Primary Buhera
CARE Agres Nyakujanura 1 Gender Advisor
CARE Alex Popi 1 Agronomist
CARE Edmore Mustavi 1 Engineer
CARE Monique Manique 1 Acting Country Director Harare
CARE Otillia Nyamkure 1 Monitoring and Evaluation Manager
CARE Tecla Musizungsza 1 Nutritionist
Chabata PHC, Buhera District Mtetwa Ronah 1 Primary Care Nurse
Chimanimani District Bloodwell Tamme 1 WASH Facilitator Chimanimani
Chimanimani District Chipiro Tongai 1 Gender Facilitator Chimanimani
Chimanimani District KudakwagheJorgire 1 DRR & NRM Field
Monitor Chimanimani
Chimanimani District Ruramai Sibayi 1 Health and Nutrition
officer Chimanimani
Chimanimani District Wadzanai Chitawa 1 District Coordinator Chimanimani
Chivi District AleckMatingwina 1 M&E Officer Chivi
Chivi District Hospital Enias Vangayi 1 Community Health Nurse
Chivi
CHIVI District Hospital Jacobson Pedzisai 1 District Nutrition
Officer Chivi
Councilor David 1 Councilor
DCoP Dorrance Cooper 1
DDF/DWSSC Magadhi 1 DFF/DWSSC Chairman Zaka
ENSURE Abraham Muzul 1
Agriculture & Livelihoods Technical Manager
ENSURE Archibald Chikavanga
1 Project Manager
ENSURE Dube Tshawangwa 1 Project Field Assistant Chivi
ENSURE Edmore Chiknzdze 1 Agriculture Field Officer Buhera
ENSURE Felix Gumbeze 1
Chimanimani
ENSURE Hendrick Manyange
1 Lead Farmer/MF Chimanimani
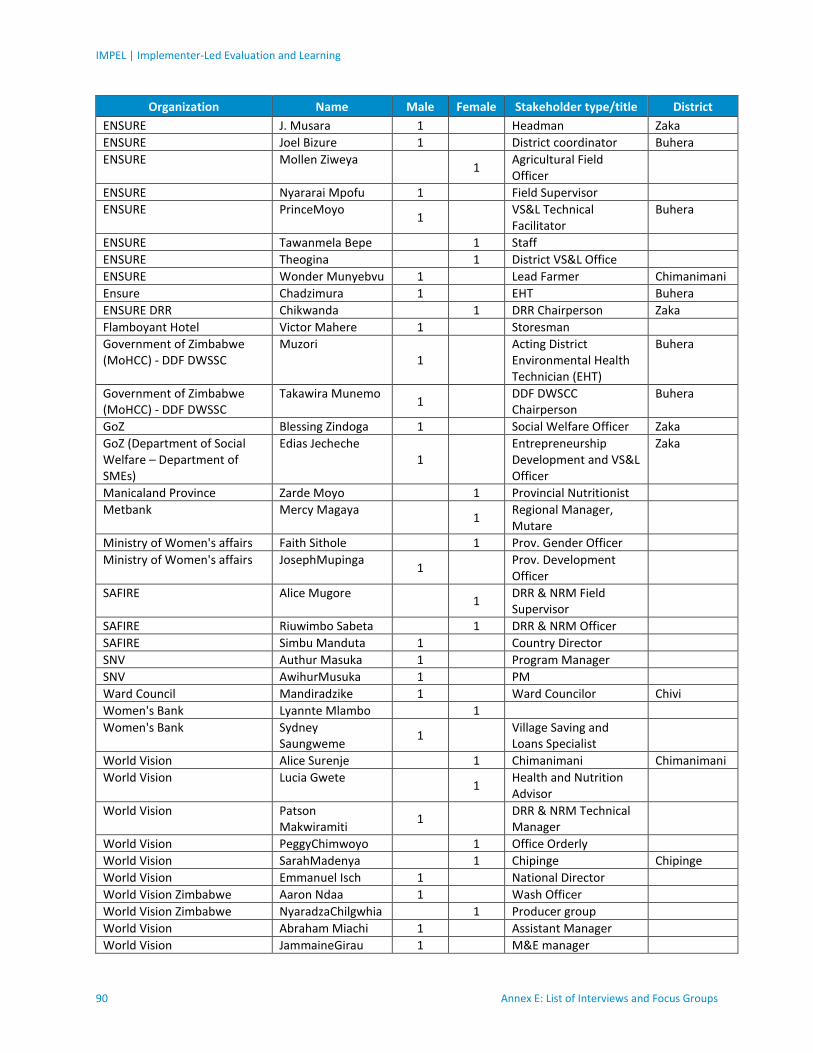
IMPEL | Implementer-Led Evaluation and Learning
90 Annex E: List of Interviews and Focus Groups
Organization Name Male Female Stakeholder type/title District
ENSURE J. Musara 1 Headman Zaka
ENSURE Joel Bizure 1 District coordinator Buhera
ENSURE Mollen Ziweya 1 Agricultural Field Officer
ENSURE Nyararai Mpofu 1 Field Supervisor
ENSURE PrinceMoyo 1 VS&L Technical
Facilitator Buhera
ENSURE Tawanmela Bepe 1 Staff
ENSURE Theogina 1 District VS&L Office
ENSURE Wonder Munyebvu 1 Lead Farmer Chimanimani
Ensure Chadzimura 1 EHT Buhera
ENSURE DRR Chikwanda 1 DRR Chairperson Zaka
Flamboyant Hotel Victor Mahere 1 Storesman
Government of Zimbabwe (MoHCC) - DDF DWSSC
Muzori 1
Acting District Environmental Health Technician (EHT)
Buhera
Government of Zimbabwe (MoHCC) - DDF DWSSC
Takawira Munemo 1 DDF DWSCC
Chairperson Buhera
GoZ Blessing Zindoga 1 Social Welfare Officer Zaka
GoZ (Department of Social Welfare – Department of SMEs)
Edias Jecheche 1
Entrepreneurship Development and VS&L Officer
Zaka
Manicaland Province Zarde Moyo 1 Provincial Nutritionist
Metbank Mercy Magaya 1 Regional Manager, Mutare
Ministry of Women's affairs Faith Sithole 1 Prov. Gender Officer
Ministry of Women's affairs JosephMupinga 1 Prov. Development
Officer
SAFIRE Alice Mugore 1 DRR & NRM Field Supervisor
SAFIRE Riuwimbo Sabeta 1 DRR & NRM Officer
SAFIRE Simbu Manduta 1 Country Director
SNV Authur Masuka 1 Program Manager
SNV AwihurMusuka 1 PM
Ward Council Mandiradzike 1 Ward Councilor Chivi
Women's Bank Lyannte Mlambo 1
Women's Bank Sydney Saungweme
1 Village Saving and Loans Specialist
World Vision Alice Surenje 1 Chimanimani Chimanimani
World Vision Lucia Gwete 1 Health and Nutrition Advisor
World Vision Patson Makwiramiti
1 DRR & NRM Technical Manager
World Vision PeggyChimwoyo 1 Office Orderly
World Vision SarahMadenya 1 Chipinge Chipinge
World Vision Emmanuel Isch 1 National Director
World Vision Zimbabwe Aaron Ndaa 1 Wash Officer
World Vision Zimbabwe NyaradzaChilgwhia 1 Producer group
World Vision Abraham Miachi 1 Assistant Manager
World Vision JammaineGirau 1 M&E manager

Final Performance Evaluation of the ENSURE DFAP in Zimbabwe
Annex E: List of Interviews and Focus Groups 91
Organization Name Male Female Stakeholder type/title District
WV Zimbabwe WitnessNkomo 1 M&E Officer
Zaka District Chipat Amol 1 Care Group Leader Zaka
Zaka District Elizabeth Nhondova
1 Primary Care Nurse Zaka
Bangure Clinic 1 Nurse Buhera
Buhera Chabata Clinc 1 Nurse Buhera
Buhera_PHC 1 Nurse Buhera
CARE 1
Agriculture Engineer/Resilience Specialist
Masvingo
Chivi District Hospital 1 District Nutrition Officer
Chivi
ENSURE 1 Garden Chairperson Chimanimani
ENSURE 1 Community Health Nurse
Chivi
ENSURE Team Member 1 WASH Facilitator Buhera
Masvingo Provincial Health 1 Provincial Health and Nutrition Officer
Masvingo
Total KIIs: 80 (combined male and female)
45 35
Table 8: Summary data for focus groups conducted
Location # M # F Type of FGD
Buhera (Ward 11) 6 23 PMG
Buhera (Ward 12) 4 3 Producers Group
Buhera (Ward 12) 4 4 Community Garden Workers
Buhera (Ward 12) 4 3 SAG, Water Management Committee, Care Group Leaders
Buhera (Ward 12) 2 3 PMG
Buhera (Ward 19) 2 6 Care Group Leaders and Clients
Buhera (Ward 19) 3 3 Male forum and Village Health Workers
Buhera (Ward 29) 1 3 Water Point Committee, Care Group Leaders
Buhera (Ward 29) 8 3 PMG
Buhera (Ward 29) 7 3 PMG
Chimanimani (Ward 18) 5 3 Nemaramba Micro Irrigation Project-Care Group Leaders, Water Point Management, Irrigation Water Management Committee
Chimanimani (Ward 2) 0 12 Care Group Leaders and Clients, VHWs
Chimanimani (Ward 20) 2 3 DRR
Chimanimani (Ward 20) 0 10 Care Group Members and Mothers
Chimanimani (Ward 20) 3 11 VS&L
Chimanimani (Ward 3) 1 3 DRR
Chimanimani (Ward 3) 2 7 PMG/VS&L
Chimanimani (Ward 3) 1 3 DRR
Chimanimani (Ward 3) 2 7 PMG/VS&L

IMPEL | Implementer-Led Evaluation and Learning
92 Annex E: List of Interviews and Focus Groups
Location # M # F Type of FGD
Chimanimani (Ward 3) 6 0 Male advocates
Chimanimani (Ward 3) 2 7 Village Health Workers (VHW) and Care Group Leaders
Chimanimani (Ward 5) 5 2 PMG
Chimanimani (Ward 5) 3 6
Care Group leaders/clients, Water-point committee, Irrigation water management committee
Chinanimani (Ward 5) 5 7 PMG
Chimanimani (Ward 5) 3 62 CHC members, paravets and male champions
Chivi (Ward 12) 5 (est) 5 (est) PMG/VS&L
Chivi (Ward 12) 2 4 Care group leaders, Males forum, VHW
Chivi (Ward 15) 6 5 PMG/VS&L
Chivi (Ward 15) 2 5 VHW and Care Group Leaders
Chivi (Ward 24) 3 7 PMG/VS&L
Chivi (Ward 25) 2 4 Marketing, VHW and Care groups
Chivi (Ward 25) 4 4 PMG/VS&L
Chivi (Ward 25) 1 8 CGL, clients, AMC, wasarira garden members/ male forum
Chivi (Ward 25) 2 12
Care Group leaders, male advocates, VSL, DRR and Producer groups
Chivi (Ward 26) 2 10 VHWs, DRR, MF, EM, CGL, DMC
Zaka (Ward 13) 3 4
Care groups, male advocates, Water Point, VSL Producer Groups, Male Advocates, DRR
Zaka (Ward 13) 1 9 VS&L, AMC, Male Forum, WPC
Zaka (Ward 14) 0 6 VS&L
Zaka (Ward 14) 5 5 PMG/VS&L
Zaka (Ward 14) 0 14 VS&L
Zaka (Ward 21) 5 9 PMG
Zaka (Ward 21) 2 8 VS&L
Zaka (Ward 21) 5 9 Poultry and Horticulture groups
Zaka (Ward 24) 3 6 VS&L
Zaka (Ward 25) 2 12 CG Members
Zaka (Ward 25) 3 4 Care groups, producer groups, DRR, Male forum
Zaka (Ward 25) 4 8 Garden Members, VS&l, CG/Leaders Clients, AMC, WPC
Zaka Care group 5 (est) 5 (est) Care Group Leader, VSL, Producer group
Total Participants (46 FGDs)
143 355
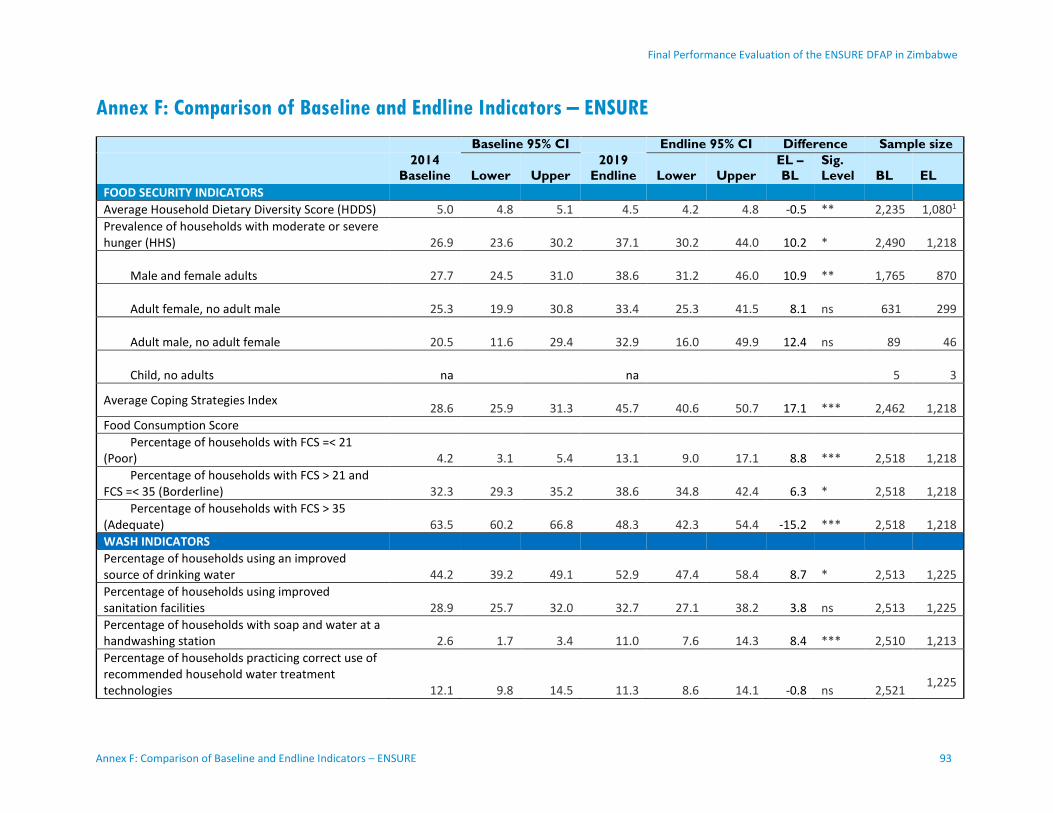
Final Performance Evaluation of the ENSURE DFAP in Zimbabwe
Annex F: Comparison of Baseline and Endline Indicators – ENSURE 93
Annex F: Comparison of Baseline and Endline Indicators – ENSURE
Baseline 95% CI Endline 95% CI Difference Sample size
2014
Baseline Lower Upper
2019
Endline Lower Upper
EL –
BL
Sig.
Level BL EL
FOOD SECURITY INDICATORS
Average Household Dietary Diversity Score (HDDS) 5.0 4.8 5.1 4.5 4.2 4.8 -0.5 ** 2,235 1,0801
Prevalence of households with moderate or severe hunger (HHS) 26.9 23.6 30.2 37.1 30.2 44.0 10.2 * 2,490
1,218
Male and female adults 27.7 24.5 31.0 38.6 31.2 46.0 10.9 ** 1,765
870
Adult female, no adult male 25.3 19.9 30.8 33.4 25.3 41.5 8.1 ns 631
299
Adult male, no adult female 20.5 11.6 29.4 32.9 16.0 49.9 12.4 ns 89
46
Child, no adults na na 5
3
Average Coping Strategies Index 28.6 25.9 31.3 45.7 40.6 50.7 17.1 *** 2,462
1,218
Food Consumption Score
Percentage of households with FCS =< 21 (Poor) 4.2 3.1 5.4 13.1 9.0 17.1 8.8 *** 2,518
1,218
Percentage of households with FCS > 21 and FCS =< 35 (Borderline) 32.3 29.3 35.2 38.6 34.8 42.4 6.3 * 2,518
1,218
Percentage of households with FCS > 35 (Adequate) 63.5 60.2 66.8 48.3 42.3 54.4 -15.2 *** 2,518
1,218
WASH INDICATORS
Percentage of households using an improved source of drinking water 44.2 39.2 49.1 52.9 47.4 58.4 8.7 * 2,513
1,225
Percentage of households using improved sanitation facilities 28.9 25.7 32.0 32.7 27.1 38.2 3.8 ns 2,513
1,225
Percentage of households with soap and water at a handwashing station 2.6 1.7 3.4 11.0 7.6 14.3 8.4 *** 2,510
1,213
Percentage of households practicing correct use of recommended household water treatment technologies 12.1 9.8 14.5 11.3 8.6 14.1 -0.8 ns 2,521
1,225
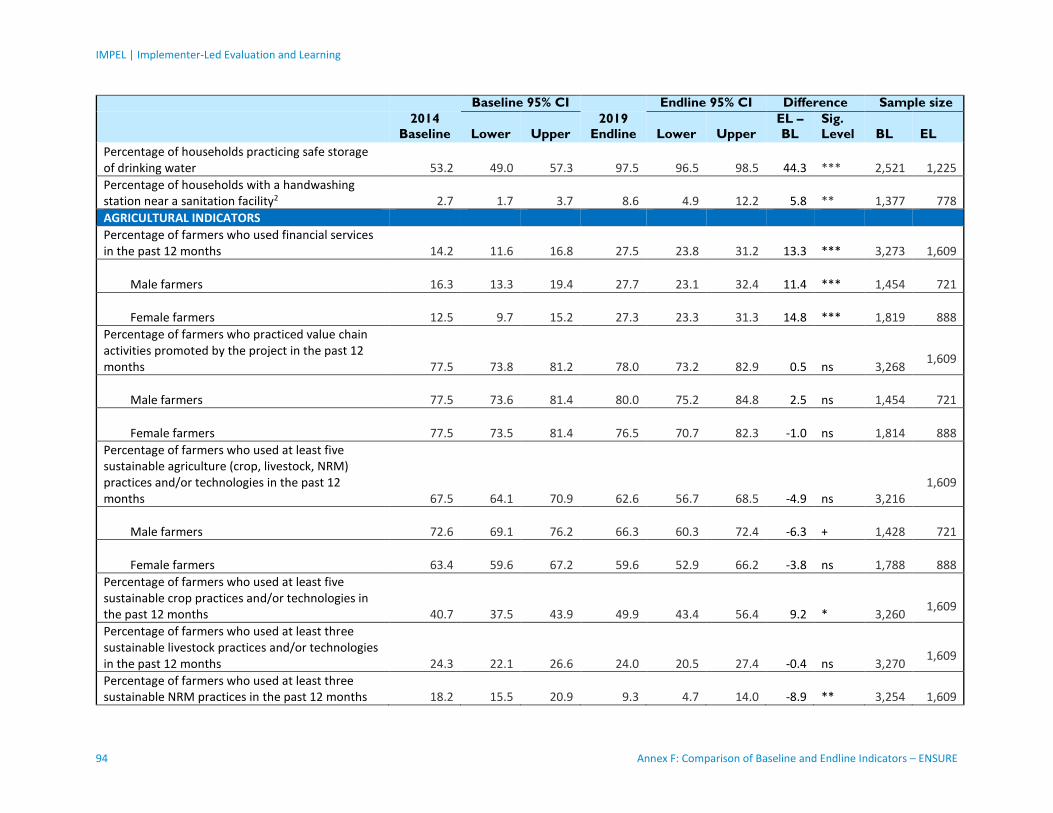
IMPEL | Implementer-Led Evaluation and Learning
94 Annex F: Comparison of Baseline and Endline Indicators – ENSURE
Baseline 95% CI Endline 95% CI Difference Sample size
2014
Baseline Lower Upper
2019
Endline Lower Upper
EL –
BL
Sig.
Level BL EL
Percentage of households practicing safe storage of drinking water 53.2 49.0 57.3 97.5 96.5 98.5 44.3 *** 2,521
1,225
Percentage of households with a handwashing station near a sanitation facility2 2.7 1.7 3.7 8.6 4.9 12.2 5.8 ** 1,377
778
AGRICULTURAL INDICATORS
Percentage of farmers who used financial services in the past 12 months 14.2 11.6 16.8 27.5 23.8 31.2 13.3 *** 3,273
1,609
Male farmers 16.3 13.3 19.4 27.7 23.1 32.4 11.4 *** 1,454
721
Female farmers 12.5 9.7 15.2 27.3 23.3 31.3 14.8 *** 1,819
888
Percentage of farmers who practiced value chain activities promoted by the project in the past 12 months 77.5 73.8 81.2 78.0 73.2 82.9 0.5 ns 3,268
1,609
Male farmers 77.5 73.6 81.4 80.0 75.2 84.8 2.5 ns 1,454
721
Female farmers 77.5 73.5 81.4 76.5 70.7 82.3 -1.0 ns 1,814
888
Percentage of farmers who used at least five sustainable agriculture (crop, livestock, NRM) practices and/or technologies in the past 12 months 67.5 64.1 70.9 62.6 56.7 68.5 -4.9 ns 3,216
1,609
Male farmers 72.6 69.1 76.2 66.3 60.3 72.4 -6.3 + 1,428
721
Female farmers 63.4 59.6 67.2 59.6 52.9 66.2 -3.8 ns 1,788
888
Percentage of farmers who used at least five sustainable crop practices and/or technologies in the past 12 months 40.7 37.5 43.9 49.9 43.4 56.4 9.2 * 3,260
1,609
Percentage of farmers who used at least three sustainable livestock practices and/or technologies in the past 12 months 24.3 22.1 26.6 24.0 20.5 27.4 -0.4 ns 3,270
1,609
Percentage of farmers who used at least three sustainable NRM practices in the past 12 months 18.2 15.5 20.9 9.3 4.7 14.0 -8.9 ** 3,254
1,609

Final Performance Evaluation of the ENSURE DFAP in Zimbabwe
Annex F: Comparison of Baseline and Endline Indicators – ENSURE 95
Baseline 95% CI Endline 95% CI Difference Sample size
2014
Baseline Lower Upper
2019
Endline Lower Upper
EL –
BL
Sig.
Level BL EL
Percentage of farmers who used improved storage practices in the past 12 months 18.3 14.2 22.5 9.8 6.8 12.8 -8.5 ** 3,195
1,487
Male farmers 19.1 14.8 23.4 9.0 5.9 12.1 -10.1 *** 1,421
686
Female farmers 17.7 13.3 22.1 10.5 7.3 13.7 -7.2 ** 1,774
801
WOMEN'S HEALTH AND NUTRITION INDICATORS
Prevalence of underweight women 5.9 4.4 7.4 4.3 3.1 5.4 -1.6 ** 1,616
918
Women’s Dietary Diversity Score (WDDS) 3.3 3.2 3.4 3.2 3.0 3.3 -0.1 ns 1,826
1,054
Average number of antenatal care (ANC) visits by pregnant women2 4.7 4.4 4.9 4.8 4.5 5.1 0.2 ns 560
255
Number of months pregnant at time of first ANC visit
Percentage <4 months pregnant 31.7 26.5 36.9 47.8 39.6 56.0 16.1 ** 571
258
Percentage 4-5 months pregnant 40.6 36.3 44.8 29.4 22.9 36.0 -11.1 ** 571
258
Percentage 6-7 months pregnant 18.2 14.8 21.6 15.5 10.9 20.1 -2.7 ns 571
258
Percentage 8 or more months pregnant 3.3 1.8 4.7 2.2 0.5 4.0 -1.0 ns 571
258
Percentage with no antenatal care 6.3 3.7 8.9 4.9 2.2 7.7 -1.3 ns 571
258
CHILDREN'S HEALTH AND NUTRITION INDICATORS
Prevalence of underweight children under 5 years of age (Total) 8.6 6.7 10.4 5.0 3.5 6.4 -3.6 ** 1,506
770
Male 8.2 6.2 10.2 3.9 1.9 5.9 -4.3 ** 762
370
Female 8.9 6.2 11.6 6.0 3.7 8.2 -2.9 + 744
400
Prevalence of stunted children under 5 years of age (Total) 28.1 25.3 30.8 19.6 16.5 22.7 -8.5 *** 1,506
770

IMPEL | Implementer-Led Evaluation and Learning
96 Annex F: Comparison of Baseline and Endline Indicators – ENSURE
Baseline 95% CI Endline 95% CI Difference Sample size
2014
Baseline Lower Upper
2019
Endline Lower Upper
EL –
BL
Sig.
Level BL EL
Male 31.0 27.2 34.7 18.9 15.2 22.6 -12.1 *** 762
370
Female 25.1 21.7 28.5 20.3 16.1 24.4 -4.9 + 744
400
Prevalence of wasted children under 5 years of age (Total) 1.2 0.6 1.9 1.4 0.5 2.3 0.2 ns 1,506
770
Male 1.5 0.6 2.5 1.6 -0.1 3.2 0.0 ns 762
370
Female 0.9 0.2 1.6 1.2 0.2 2.3 0.3 ns 744
400
Percentage of children under age 5 with diarrhea in the last two weeks (Total) 24.7 22.1 27.3 25.8 21.2 30.4 1.1 ns 1,904
841
Male 25.5 22.0 29.0 28.6 23.4 33.7 3.1 ns 951
408
Female 24.0 20.7 27.2 23.2 16.8 29.6 -0.7 ns 948
433
Percentage of children under age 5 with diarrhea treated with ORT (Total) 78.6 74.4 82.7 73.1 67.3 79.0 -5.4 ns 470
200
Male 77.3 71.9 82.7 77.5 69.7 85.4 0.2 ns 239
110
Female 79.8 75.0 84.7 68.0 61.1 75.0 -11.8 ** 231
90
Prevalence of exclusive breast-feeding of children under six months of age 35.8 27.6 44.0 60.5 50.4 70.6 24.7 *** 152
88
Male 31.8 20.4 43.1 69.6 53.4 85.8 37.8 *** 76
36
Female 39.8 28.7 51.0 54.6 37.6 71.5 14.7 ns 76
52
Percentage of children 6-23 months who receive foods from 4 or more groups
19.2 15.2 23.2 14.7 9.5 20.0 -4.5 ns 570
245
Male 17.8 12.4 23.2 15.5 8.8 22.3 -2.3 ns 275
123
Female 20.5 15.3 25.8 14.0 8.0 19.9 -6.6 ns 295
122
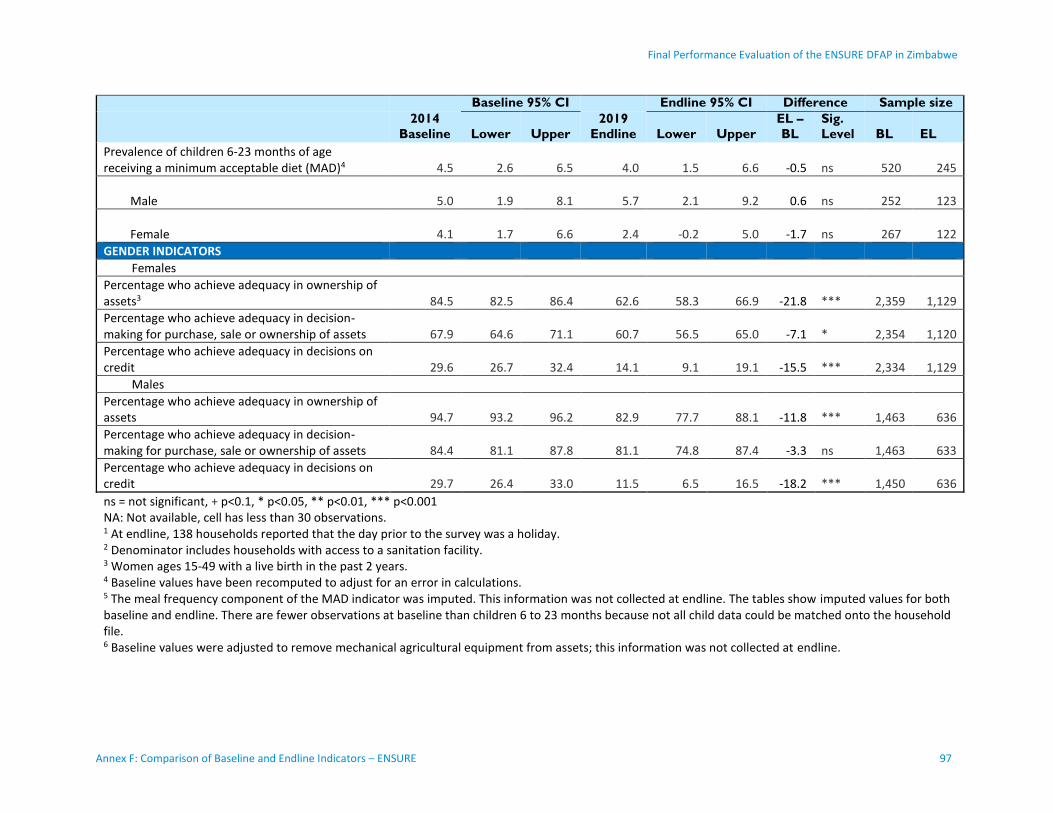
Final Performance Evaluation of the ENSURE DFAP in Zimbabwe
Annex F: Comparison of Baseline and Endline Indicators – ENSURE 97
Baseline 95% CI Endline 95% CI Difference Sample size
2014
Baseline Lower Upper
2019
Endline Lower Upper
EL –
BL
Sig.
Level BL EL
Prevalence of children 6-23 months of age receiving a minimum acceptable diet (MAD)4 4.5 2.6 6.5 4.0 1.5 6.6 -0.5 ns 520
245
Male 5.0 1.9 8.1 5.7 2.1 9.2 0.6 ns 252
123
Female 4.1 1.7 6.6 2.4 -0.2 5.0 -1.7 ns 267
122
GENDER INDICATORS
Females
Percentage who achieve adequacy in ownership of assets3 84.5 82.5 86.4 62.6 58.3 66.9 -21.8 *** 2,359
1,129
Percentage who achieve adequacy in decision-making for purchase, sale or ownership of assets 67.9 64.6 71.1 60.7 56.5 65.0 -7.1 * 2,354
1,120
Percentage who achieve adequacy in decisions on credit 29.6 26.7 32.4 14.1 9.1 19.1 -15.5 *** 2,334
1,129
Males
Percentage who achieve adequacy in ownership of assets 94.7 93.2 96.2 82.9 77.7 88.1 -11.8 *** 1,463
636
Percentage who achieve adequacy in decision-making for purchase, sale or ownership of assets 84.4 81.1 87.8 81.1 74.8 87.4 -3.3 ns 1,463
633
Percentage who achieve adequacy in decisions on credit 29.7 26.4 33.0 11.5 6.5 16.5 -18.2 *** 1,450
636
ns = not significant, + p<0.1, * p<0.05, ** p<0.01, *** p<0.001 NA: Not available, cell has less than 30 observations. 1 At endline, 138 households reported that the day prior to the survey was a holiday. 2 Denominator includes households with access to a sanitation facility. 3 Women ages 15-49 with a live birth in the past 2 years. 4 Baseline values have been recomputed to adjust for an error in calculations. 5 The meal frequency component of the MAD indicator was imputed. This information was not collected at endline. The tables show imputed values for both baseline and endline. There are fewer observations at baseline than children 6 to 23 months because not all child data could be matched onto the household file. 6 Baseline values were adjusted to remove mechanical agricultural equipment from assets; this information was not collected at endline.

IMPEL | Implementer-Led Evaluation and Learning
98 Annex F: Comparison of Baseline and Endline Indicators – ENSURE
95% CI 95% CI Difference Number of observations
2014
Baseline
2014 Baseline,
corrected1 Lower Upper 2019
Endline2 Lower Upper
Endline - Baseline, corrected
Sig. Level Baseline
Baseline, corrected Endline
POVERTY INDICATORS
Per capita daily expenditures (USD 2010) 0.53 0.61 0.57 0.64 0.39 0.33 0.45 -0.22 ***
2,522
2,522
1,214
Male and Female Adults 0.52 0.59 0.55 0.62 0.38 0.31 0.46 -0.20 ***
1,787 1,787
867
Adult Female no Adult Male 0.56 0.65 0.58 0.72 0.39 0.32 0.47 -0.26 ***
639 639
298
Adult Male no Adult Female 0.90 1.08 0.83 1.33 0.63 0.40 0.86 -0.45 **
91 91
46
Child No Adults NA NA NA
5 5
3
Per capita daily expenditures (Zim$ 2019) 15.77 14.81 16.73 10.15 8.49 11.81 -5.62 ***
2,522
1,214
Male and Female Adults 15.27 14.33 16.21 10.01 8.14 11.88 -5.26 *** 1,787
867
Adult Female no Adult Male 16.96 15.14 18.78 10.27 8.30 12.25 -6.69 *** 639
298
Adult Male no Adult Female 28.20 21.73 34.67 16.45 10.45 22.44 -11.75 *** 91
46
Child No Adults NA NA 5
3
Percentage below the Total Per Capita Poverty Datum Line (TPCPDL), Zim$ 2019 3 36.4 32.5 40.2 71.3 65.5 77.0 34.91 ***
2,522
1,214
Male and Female Adults 37.1 33.0 41.1 71.6 65.4 77.8 34.51 *** 1,787
867
Adult Female no Adult Male 34.2 28.1 40.3 70.7 63.6 77.8 36.48 *** 639
298
Adult Male no Adult Female 27.2 14.6 39.8 58.8 41.3 76.3 31.55 *** 91
46
Child No Adults NA NA 5
3

Final Performance Evaluation of the ENSURE DFAP in Zimbabwe
Annex F: Comparison of Baseline and Endline Indicators – ENSURE 99
95% CI 95% CI Difference Number of observations
2014
Baseline
2014 Baseline,
corrected1 Lower Upper 2019
Endline2 Lower Upper
Endline - Baseline, corrected
Sig. Level Baseline
Baseline, corrected Endline
Mean depth of poverty (using the TPCPDL), Zim$ 2019 13.1 11.0 15.1 36.6 31.7 41.4 23.51 ***
2,522
1,224
Male and Female Adults 13.4 11.3 15.5 37.0 31.9 42.1 23.60 *** 1,787
875
Adult Female no Adult Male 12.0 9.1 14.8 35.6 30.1 41.0 23.61 *** 639
299
Adult Male no Adult Female 9.9 3.8 16.1 28.5 16.8 40.2 18.55 *** 91
47
Child No Adults NA NA 5
3
Per capita daily expenditures (USD 2014) 1.46 1.37 1.55 0.94 0.79 1.09 -0.52 ***
2,522
1,214
Male and Female Adults 1.42 1.33 1.50 0.93 0.75 1.10 -0.49 *** 1,787
867
Adult Female no Adult Male 1.57 1.40 1.74 0.95 0.77 1.14 -0.62 *** 639
298
Adult Male no Adult Female 2.61 2.01 3.21 1.52 0.97 2.08 -1.09 ** 91
46
Child No Adults NA NA 5
3
Percentage below the Total Per Capita Poverty Datum Line, USD2014 (TPCPDL)4 96.1 94.2 93.1 95.4 93.5 91.7 95.3 -0.7 ns
2,522
1,214
Male and Female Adults 96.5 94.9 93.7 96.0 93.7 91.6 95.8 -1.2 ns 1,787
867
Adult Female no Adult Male 95.4 92.8 90.2 95.3 93.9 90.2 97.5 1.1 ns 639
298
Adult Male no Adult Female 82.4 78.8 69.0 88.5 80.7 67.9 93.5 1.9 ns 91
46
Child No Adults NA NA 5
3
Mean depth of poverty (using the TPCPDL) 63.2 59.3 57.2 61.4 74.7 71.6 77.7 15.3 ***
2,522
2,522
1,224

IMPEL | Implementer-Led Evaluation and Learning
100 Annex F: Comparison of Baseline and Endline Indicators – ENSURE
95% CI 95% CI Difference Number of observations
2014
Baseline
2014 Baseline,
corrected1 Lower Upper 2019
Endline2 Lower Upper
Endline - Baseline, corrected
Sig. Level Baseline
Baseline, corrected Endline
Male and Female Adults 63.9 60.1 58.0 62.2 74.9 71.6 78.2 14.8 ***
1,787 1,787
875
Adult Female no Adult Male 61.8 57.5 54.2 60.9 74.5 70.4 78.5 16.9 ***
639 639
299
Adult Male no Adult Female 44.4 41.0 33.3 48.7 63.1 51.0 75.1 22.1 **
91 91
47
Child No Adults NA NA
5 5
3
ns = not significant, + p<0.1,* p<0.05, ** p<0.01, *** p<0.001 NA : Not available, cell has less than 30 observations 1 Corrections to baseline: Monthly and annual expenditures, missing recoded to zero which allowed for a more accurate sum. 2 Endline monthly expenditures were imputed. Inflation adjusted price per kilogram from the baseline dataset were applied some baseline food expenditures. 3 Based on Zimbabwe's Total Per Capita Poverty Datum Line (TPCPDL) 2019 in Zimbabwe dollars; the national poverty line is Z$ 9.36 per person per day. 4 Based on Zimbabwe's Total Per Capita Poverty Datum Line (TPCPDL) 2014 USD; in 2014 the national poverty line was denominated in USD, at US$3.35 per person per day.

Final Performance Evaluation of the ENSURE DFAP in Zimbabwe
Annex G: Analysis of “Adequacy” Indicators 101
Annex G: Analysis of “Adequacy” Indicators
The household survey included a series of questions from the resources domain of the Women's Empowerment in Agriculture Index (WEAI) (Alkire et al., 2013). The questions provide information for three values reported in the baseline and endline reports: adequacy of asset ownership, adequacy of decision-making about asset disposition, and adequacy of decision-making about use of credit. Males and females who self-identified as decision-makers in their households were asked the following questions:
Asset ownership: Who owns most of [item]? (agricultural land, livestock, farm equipment, business equipment, house, large and small durables, cell phone, transport)
Disposition of assets: Who would you say can decide whether to sell, give away, rent or mortgage [item]?
Use of credit (cash or in-kind): Who made the decision to borrow, what to do with money, item borrowed from [source]? (NGO, informal lender, formal lender [bank], friends or relatives, savings or credit group)
Response codes for all three:
1) Self 2) Partner/spouse 3) Self and partner/spouse jointly 4) Other household members 5) Self and other household member(s) 6) Partner/spouse and other household member(s) 7) Someone (or group of people) outside the household 8) Self and other outside people 9) Partner/spouse and other outside people 10) Self, partner/spouse and other outside people 11) None of these items
Based on the response codes, males and females were categorized as achieving or not achieving “adequacy” or not in each of the three indicators. Adequacy is equal to 100 for response codes 1, 3, 5, 8 or 10 (which all include “self”). Adequacy is equal to 0 for other codes, or if the household does not own assets.
The analysis made statistical comparisons between baseline and endline, but not between men and women. We did, however, conduct some additional analysis of decision-making. The original indicator is from the WEAI. TANGO modified and recomputed the indicators in two ways.
The first was to estimate whether joint decision-making in the three measured values (as defined above) increased from baseline to endline. This modification changes the numerator used in the WEAI-based indicator: joint decision-making is defined as self with partner/spouse and uses only response codes 3 and 10. The results are shown in the top section of Table 9.
The analysis shows that for both men and women, joint ownership of assets decreased (worsened) from baseline to endline, dropping from 31.8 to 27.0 percent for females (p<0.05) and from 43.0 to 36.8 percent for males (p<0.05). There was an increase (improvement) for males in joint decision-making about the purchase, sale and ownership of assets, from 35.2 percent at baseline to 43.8 percent at

IMPEL | Implementer-Led Evaluation and Learning
102 Annex G: Analysis of “Adequacy” Indicators
endline (p<0.01). The results for females for this indicator were not statistically significant. Joint decision-making about credit significantly decreased from baseline to endline, dropping from 9.9 percent to 6.5 percent for women (p<0.05) and from 15.1 percent to 6.2 percent for men (p<0.01).
The second modification focused on decision-making regarding the use of credit. This analysis included only households that had borrowed either cash or in-kind.26 The percentage of households that borrowed cash or in-kind was much lower at endline when 13.7 percent of households reported borrowing, compared to 34.2 percent at baseline (p<0.001, result not shown). Households without any debt were omitted instead of being coded equal to 0 or inadequate. The results are shown in the bottom section of Table 9. The analysis shows that for both females and males there were no statistically significant differences in adequacy (using the indicator definition). However, joint decision-making on credit (using codes 3 and 10) improved for females, increasing 25.7 to 36.9 percent (p<0.05). There were no statistically significant differences for males for this indicator.
26 Refers to households answering the Gender Module that reported borrowing cash or in-kind.

Final Performance Evaluation of the Food for Peace ENSURE DFAP in Zimbabwe
Annex G: Analysis of “Adequacy” Indicators 103
Table 9: Asset ownership and joint decision-making on assets and credit
Baseline 95% CI Endline 95% CI Difference Sample size
2014
Baseline Lower Upper
2019
Endline Lower Upper
Endline -
Baseline
Sig.
Level
Baseline
Endline
Joint ownership of assets and joint decision-making on
assets and credit (n = all households)
Females
Percentage who jointly own assets 31.8 29.8 33.9 27.0 23.4 30.7 -4.8 * 2,337 1,128
Percentage making decisions jointly for
purchase, sale or ownership of assets 26.9 24.6 29.2 28.4 24.5 32.4 1.5 ns 2,354 1,129
Percentage who make decisions jointly on
credit 9.9 8.1 11.7 6.5 3.7 9.3 -3.3 * 2,334 1,129
Males
Percentage who jointly own assets 43.0 40.1 45.9 36.8 32.3 41.3 -6.2 * 1,445 636
Percentage making decisions jointly for
purchase, sale or ownership of assets 35.2 31.8 38.6 43.8 38.4 49.2 8.5 ** 1,463 636
Percentage who make decisions jointly on
credit 15.1 12.7 17.4 6.2 3.4 9.0 -8.9 *** 1,450 636
Joint decision-making on credit (n = only households reporting
borrowing cash or in-kind)
Females
Percentage who achieve adequacy in decision-
making in decisions on credit (self or joint) 87.4 85.4 89.4 91.0 86.3 95.8 3.6 ns 1,713 238
Percentage making decisions jointly on credit 25.7 22.7 28.7 36.9 28.8 45.0 11.2 * 1,713 238
Males
Percentage who achieve adequacy in decision-
making in decisions on credit (self or joint) 87.0 84.5 89.4 83.1 73.5 92.7 -3.9 ns 905 104
Percentage making decisions jointly on credit 40.8 36.5 45.0 46.3 35.3 57.3 5.5 ns 905 104
ns = not significant, † p<0.1, * p<0.05, ** p<0.01, *** p<0.001
NA: Not available; cell has less than 30 observations.

IMPEL | Implementer-Led Evaluation and Learning
104 Annex H: Supplementary Tables
Annex H: Supplementary Tables
Table 10. Stunting, underweight, and wasting in CU5 (ENSURE)
2014 Baseline 2019 Endline Sig. level Prevalence of stunting (%<-2sd) 28.1 19.6 *** <6 15.7 1.7 *** 6-11 10.9 7.3 ns 12-23 36.4 32.4 ns 24-35 36.9 27.3 * 36-47 25.2 22.2 ns 48-59 25.7 14.0 ** Prevalence of severe stunting (%<-3sd) 7.8 4.1 ** <6 4.0 1.1 ns 6-11 5.3 3.7 ns 12-23 11.7 8.1 ns 24-35 10.6 3.5 * 36-47 6.8 3.4 ns 48-59 4.2 3.5 ns Prevalence of underweight (%<-2sd) 8.6 5.0 ** <6 2.7 2.9 ns 6-11 8.8 6.5 ns 12-23 12.4 7.2 † 24-35 8.9 4.5 † 36-47 8.5 4.6 † 48-59 6.6 4.0 ns Prevalence of severe underweight (%<-3sd) 1.2 0.7 ns <6 0.8 1.1 ns 6-11 2.3 3.7 ns 12-23 1.7 0.6 ns 24-35 0.3 0.7 ns 36-47 1.7 0.0 * 48-59 0.7 0.0 ns Prevalence of wasting (%<-2sd) 1.2 1.4 ns <6 1.6 4.3 ns 6-11 3.0 3.7 ns 12-23 1.7 1.0 ns 24-35 1.0 1.0 ns 36-47 0.7 0.0 ns 48-59 0.5 0.9 ns Prevalence of severe wasting (%<-3sd) 0.3 0.1 ns <6 0.0 0.0 *** 6-11 1.1 0.0 ns 12-23 0.3 0.0 ns 24-35 0.3 0.0 ns 36-47 0.4 0.0 ns 48-59 0.0 0.4 ns
n 1506 770 ns = not significant, + p<0.1,* p<0.05, ** p<0.01, *** p<0.001 Note: The prevalence of stunting is based on children with valid height for age measurements, the prevalence of underweight is based on children with valid weight for age measurements, and the prevalence of wasting is based on children with valid weight for height measurements.
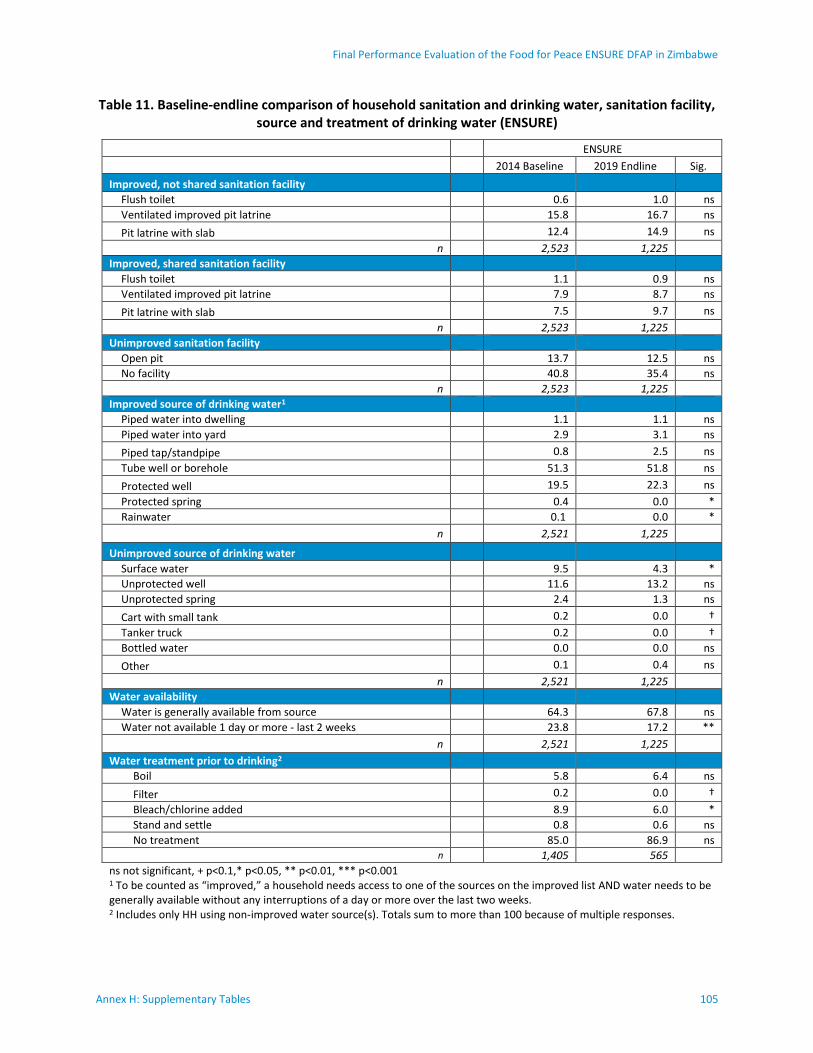
Final Performance Evaluation of the Food for Peace ENSURE DFAP in Zimbabwe
Annex H: Supplementary Tables 105
Table 11. Baseline-endline comparison of household sanitation and drinking water, sanitation facility, source and treatment of drinking water (ENSURE)
ENSURE
2014 Baseline 2019 Endline Sig.
Improved, not shared sanitation facility
Flush toilet 0.6 1.0 ns
Ventilated improved pit latrine 15.8 16.7 ns
Pit latrine with slab 12.4 14.9 ns
n 2,523 1,225
Improved, shared sanitation facility
Flush toilet 1.1 0.9 ns
Ventilated improved pit latrine 7.9 8.7 ns
Pit latrine with slab 7.5 9.7 ns
n 2,523 1,225
Unimproved sanitation facility
Open pit 13.7 12.5 ns
No facility 40.8 35.4 ns
n 2,523 1,225
Improved source of drinking water1
Piped water into dwelling 1.1 1.1 ns
Piped water into yard 2.9 3.1 ns
Piped tap/standpipe 0.8 2.5 ns
Tube well or borehole 51.3 51.8 ns
Protected well 19.5 22.3 ns
Protected spring 0.4 0.0 *
Rainwater 0.1 0.0 *
n 2,521 1,225
Unimproved source of drinking water
Surface water 9.5 4.3 *
Unprotected well 11.6 13.2 ns
Unprotected spring 2.4 1.3 ns
Cart with small tank 0.2 0.0 †
Tanker truck 0.2 0.0 †
Bottled water 0.0 0.0 ns
Other 0.1 0.4 ns
n 2,521 1,225
Water availability
Water is generally available from source 64.3 67.8 ns
Water not available 1 day or more - last 2 weeks 23.8 17.2 **
n 2,521 1,225
Water treatment prior to drinking2
Boil 5.8 6.4 ns
Filter 0.2 0.0 †
Bleach/chlorine added 8.9 6.0 *
Stand and settle 0.8 0.6 ns
No treatment 85.0 86.9 ns n 1,405 565
ns not significant, + p<0.1,* p<0.05, ** p<0.01, *** p<0.001 1 To be counted as “improved,” a household needs access to one of the sources on the improved list AND water needs to be generally available without any interruptions of a day or more over the last two weeks. 2 Includes only HH using non-improved water source(s). Totals sum to more than 100 because of multiple responses.

IMPEL | Implementer-Led Evaluation and Learning
106 Annex I: Multiple Regression Analysis
Annex I: Multiple Regression Analysis
Multiple regression analysis was undertaken to further explore the underlying factors associated with changes in several of the key project outcome and impact variables. The specific variables that were examined in this analysis are:
Farmers’ use of financial services
Farmers’ adoption of at least 5 sustainable agricultural practices
Households with adequate food consumption (FCS)
Underweight of under-5 children
Stunting of under-5 children
The regression analysis measured the contribution of a number of variables to explain variation in these outcome and impact variables. General categories of explanatory variables were applied in all the regression analyses:
Survey round: a dummy variable for survey round (0=baseline, 1 = endline) was included to
measure the changes in the dependent variables independent of any of the other explanatory
variables in the model
Program participation: These variables were included to measure the extent to which changes in
the dependent variables are associated with the respondents’ participation in project-supported
activities.
Gender variables: that measure gender characteristics of the respondents, including the
reported participation of women in relevant decision-making.
Household characteristics: that measure household demographic characteristics, including
gendered household type, education characteristics of household members
Non-food assets: as a measure of household wealth
District: dummy variables for districts (Buhera is the excluded comparison district): to account
for any geographic factors not captured in the other explanatory variables.
Table 12 reports the results from the regressions estimating the probability that a farmer used financial services and the probability that farmers adopted at least five sustainable agricultural practices. Adoption of financial services showed significant increases from baseline to endline, controlling for all the other explanatory variables in the equations. Participation in agricultural trainings is positively associated with increased rates of adoption of both types of practices. Participation in value-chain activities and adoption of sustainable agricultural practices are also associated with greater use of financial services.
Female farmers are less likely to adopt sustainable practices. Households in which women participate in joint decisions about credit are more likely to use financial services and adopt sustainable practices, and joint decision-making over use of assets is also positively associated with adoption of sustainable agricultural practices. Information about gendered household type provides more information about female decision-making. Households without female decision-makers are less likely to adopt sustainable agricultural practices, while households with no male decision-makers are more likely to adopt such practices.
In these regression models, a variable measuring non-food assets was included as an explanatory variable to measure the effect of wealth on use of financial services, or adoption of sustainable

Final Performance Evaluation of the Food for Peace ENSURE DFAP in Zimbabwe
Annex I: Multiple Regression Analysis 107
practices. This wealth variable is positively associated with adoption of sustainable agricultural practices, suggesting that access to savings is a requirement to adopt these practices.
Table 12: Regression results for use of financial services and adoption of sustainable crop practices
Dependent Variable Use of financial services in
the past 12 months Adopt sustainable crop practices
(5 or more)
Survey round (Baseline)
Endline 1.02*** -0.20
Program participation
Sustainable agricultural practices/technologies
0.09***
Participated in value-chain activities 0.66***
Participated in agriculture trainings 0.34*** 0.75***
Gender variables
Female farmer 0.03 -0.55***
Joint asset ownership 0.24 0.02
Joint right to one or more assets -0.16 0.38**
Joint decisions about credit 0.54** 0.18*
Household characteristics
Household size 0.04 0.03
Gendered household type
Adult males no adult female -0.17 -0.54*
Adult female no adult male 0.18 0.42***
Share of adults with more than primary education
0.59*** 0.23*
Non-food assets 0.28* 0.67**
District (Buhera)
Chimanimani 0.01 -0.21
Chipinge 0.51** -0.93
Bikita 0.27 0.66+
Chivi 0.00 0.21
Zaka -0.38 -0.07
Constant -4.26*** 0.25***
Observations 4772 4800 + p<0.1; * p<0.05; ** p<0.01; *** p<0.001
Table 13 provides estimates from the regressions of child nutritional variables: underweight and stunting. None of the program participation variables are significantly associated with changes in the likelihood of children being underweight or stunted. Access to improved drinking water source and use of cleansing agent and water for washing is associated with lower likelihood of underweight, but these WASH variables are not associated with stunting.
Child age is strongly associated with higher likelihood of stunting (the negative coefficient on the squared age term means that this effect is relatively less for older children than for younger).

IMPEL | Implementer-Led Evaluation and Learning
108 Annex I: Multiple Regression Analysis
The education level of the child’s caregiver is negatively associated with both underweight and stunting. The education level of household members is associated with lower likelihood of underweight children.
Table 13: Regression results for child nutritional variables, underweight and stunting of CU5
Dependent Variable Underweight
(%<-2sd) Stunting (%<-2sd)
Survey round (Baseline)
Endline -0.14 -0.15
Program participation Child rations 0.06 0.12
Cash transfer -1.17 -0.39
Nutrition training -0.43 -0.30
WASH practices Using an improved drinking water source -0.06 0.26*
Have cleansing agent and water 0.82* 0.24
Child characteristics Child age (months) 0.04 0.13***
Child age (months) squared -0.00** -0.00***
Female child 0.23 -0.10
Had diarrhea in the last two weeks 0.15 0.19
Caregiver's education -0.32* -0.16+
Child's natural mother lives in same HH 0.28 0.14
Gender variables Joint asset ownership -0.43* -0.24*
Joint right to one or more assets 0.44* 0.19+
Joint decisions about credit 0.05 0.14
Household characteristics Household size -0.01 -0.03
Count of children under 5 in household 0.31* 0.33**
Gendered household type Adult males no adult female -0.72 -0.47
Adult female no adult male -0.63* 0.08
Share adults with more than primary education -0.63+ -0.35
Non-food assets 0.10 -0.06
District (Buhera) Chimanimani 0.47 0.49*
Chipinge 0.33 0.20
Bikita 0.28 0.47
Chivi 0.56 0.30
Zaka 0.55 0.29
Constant -2.92*** -2.78***
Observations 2267 2267 + p<0.1; * p<0.05; ** p<0.01; *** p<0.001
Table 14 presents regression results for household food security. The dependent variable is households reporting adequate food security (i.e. not moderately or severely food insecure) based on the FCS. Overall, the probability that a household reports adequate food security decreased (worsened) from baseline to endline, controlling for other factors.
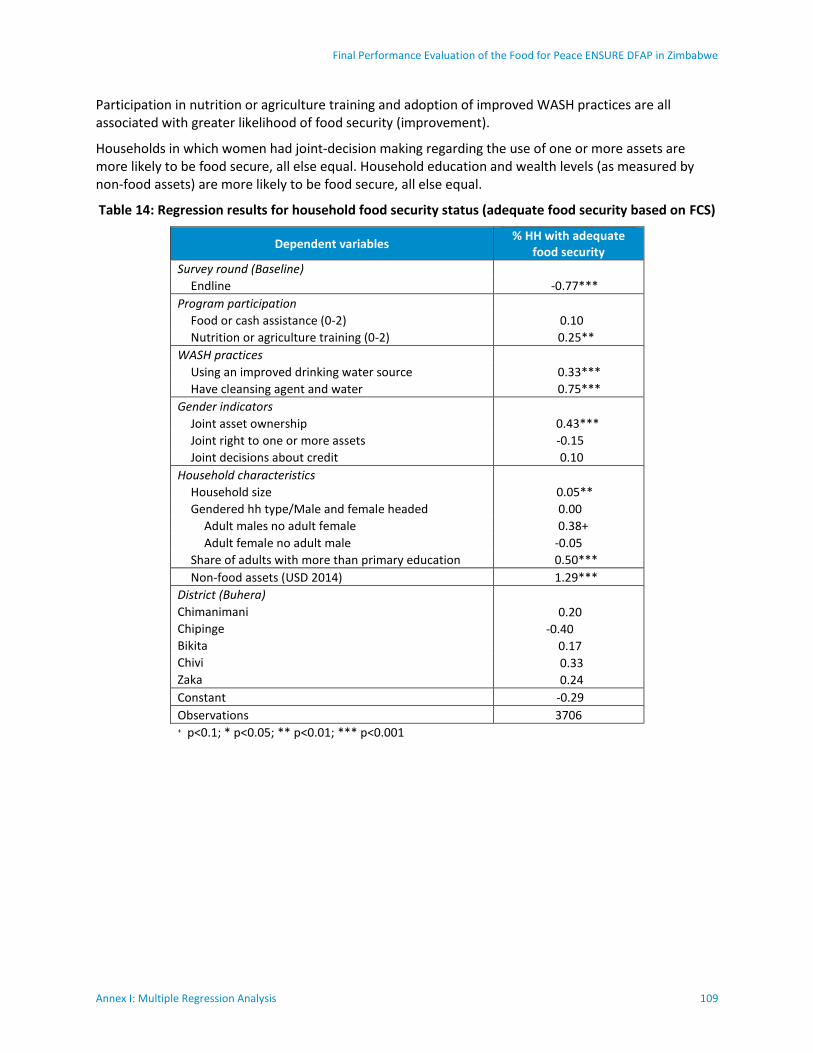
Final Performance Evaluation of the Food for Peace ENSURE DFAP in Zimbabwe
Annex I: Multiple Regression Analysis 109
Participation in nutrition or agriculture training and adoption of improved WASH practices are all associated with greater likelihood of food security (improvement).
Households in which women had joint-decision making regarding the use of one or more assets are more likely to be food secure, all else equal. Household education and wealth levels (as measured by non-food assets) are more likely to be food secure, all else equal.
Table 14: Regression results for household food security status (adequate food security based on FCS)
Dependent variables % HH with adequate
food security
Survey round (Baseline) Endline -0.77***
Program participation Food or cash assistance (0-2) 0.10
Nutrition or agriculture training (0-2) 0.25**
WASH practices Using an improved drinking water source 0.33***
Have cleansing agent and water 0.75***
Gender indicators Joint asset ownership 0.43***
Joint right to one or more assets -0.15
Joint decisions about credit 0.10
Household characteristics Household size 0.05**
Gendered hh type/Male and female headed 0.00
Adult males no adult female 0.38+
Adult female no adult male -0.05
Share of adults with more than primary education 0.50***
Non-food assets (USD 2014) 1.29***
District (Buhera) Chimanimani 0.20
Chipinge -0.40
Bikita 0.17
Chivi 0.33
Zaka 0.24
Constant -0.29
Observations 3706 + p<0.1; * p<0.05; ** p<0.01; *** p<0.001
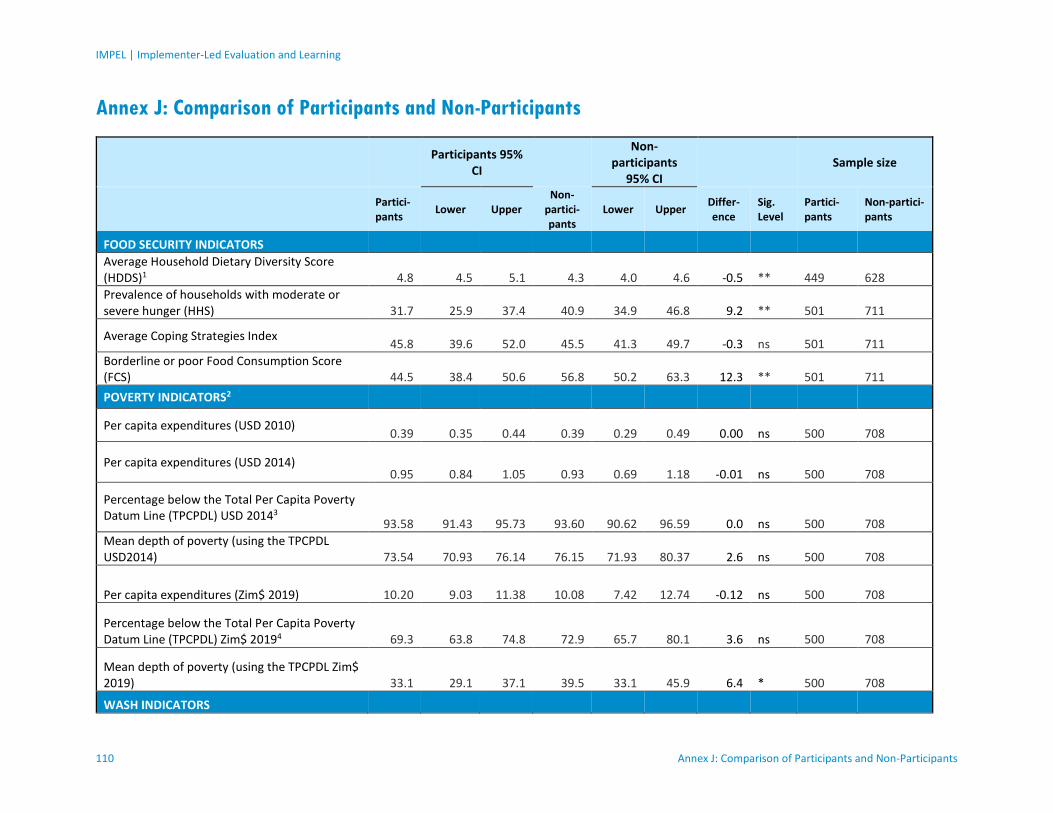
IMPEL | Implementer-Led Evaluation and Learning
110 Annex J: Comparison of Participants and Non-Participants
Annex J: Comparison of Participants and Non-Participants
Participants 95%
CI
Non-participants
95% CI Sample size
Partici-pants
Lower Upper Non-
partici-pants
Lower Upper Differ-ence
Sig. Level
Partici-pants
Non-partici-pants
FOOD SECURITY INDICATORS
Average Household Dietary Diversity Score (HDDS)1 4.8 4.5 5.1 4.3 4.0 4.6 -0.5 **
449
628
Prevalence of households with moderate or severe hunger (HHS) 31.7 25.9 37.4 40.9 34.9 46.8 9.2 **
501
711
Average Coping Strategies Index 45.8 39.6 52.0 45.5 41.3 49.7 -0.3 ns
501
711
Borderline or poor Food Consumption Score (FCS) 44.5 38.4 50.6 56.8 50.2 63.3 12.3 **
501
711
POVERTY INDICATORS2
Per capita expenditures (USD 2010) 0.39 0.35 0.44 0.39 0.29 0.49 0.00 ns
500
708
Per capita expenditures (USD 2014) 0.95 0.84 1.05 0.93 0.69 1.18 -0.01 ns
500
708
Percentage below the Total Per Capita Poverty Datum Line (TPCPDL) USD 20143
93.58 91.43 95.73 93.60 90.62 96.59 0.0 ns 500
708
Mean depth of poverty (using the TPCPDL USD2014) 73.54 70.93 76.14 76.15 71.93 80.37 2.6 ns
500
708
Per capita expenditures (Zim$ 2019) 10.20 9.03 11.38 10.08 7.42 12.74 -0.12 ns 500
708
Percentage below the Total Per Capita Poverty Datum Line (TPCPDL) Zim$ 20194 69.3 63.8 74.8 72.9 65.7 80.1 3.6 ns
500
708
Mean depth of poverty (using the TPCPDL Zim$ 2019) 33.1 29.1 37.1 39.5 33.1 45.9 6.4 *
500
708
WASH INDICATORS

Final Performance Evaluation of the Food for Peace ENSURE DFAP in Zimbabwe
Annex J: Comparison of Participants and Non-Participants 111
Participants 95%
CI
Non-participants
95% CI Sample size
Partici-pants
Lower Upper Non-
partici-pants
Lower Upper Differ-ence
Sig. Level
Partici-pants
Non-partici-pants
Percentage of households using an improved source of drinking water 48.3 41.8 54.8 56.3 50.7 61.8 7.9 *
502
717
Percentage of households using improved sanitation facilities 33.6 27.4 39.9 32.0 26.0 38.0 -1.6 ns
502
717
Percentage of households with soap and water at a handwashing station 11.3 7.1 15.5 10.7 7.4 14.0 -0.6 ns
499
708
Percentage of households practicing correct use of recommended household water treatment technologies 15.4 11.2 19.6 8.7 5.8 11.6 -6.7 **
502
717
Percentage of households practicing safe storage of drinking water 97.3 95.8 98.7 98.0 96.8 99.2 0.7 ns
502
717
Percentage of households with a handwashing station near a sanitation facility5 8.5 2.2 14.7 8.7 5.0 12.4 0.2 ns
308
466
AGRICULTURAL INDICATORS
Percentage of farmers who used financial services in the past 12 months 32.5 27.7 37.3 24.0 19.1 28.9 -8.5 *
692
911
Male farmers 29.8 24.0 35.6 26.5 20.1 32.8 -3.3 ns 304
414
Female farmers 34.7 29.0 40.5 22.0 16.5 27.5 -12.8 ** 388
497
Percentage of farmers who practiced value chain activities promoted by the project in the past 12 months 84.7 81.2 88.1 73.1 67.4 78.8 -11.6 ***
692
911
Male farmers 87.9 83.1 92.6 73.9 68.4 79.4 -14.0 *** 304
414
Female farmers 82.0 78.0 86.1 72.4 65.2 79.6 -9.6 ** 388
497
Percentage of farmers who used at least five sustainable agriculture (crop, livestock, NRM) 71.1 66.5 75.7 56.4 50.7 62.0 -14.7 ***
692
911

IMPEL | Implementer-Led Evaluation and Learning
112 Annex J: Comparison of Participants and Non-Participants
Participants 95%
CI
Non-participants
95% CI Sample size
Partici-pants
Lower Upper Non-
partici-pants
Lower Upper Differ-ence
Sig. Level
Partici-pants
Non-partici-pants
practices and/or technologies in the past 12 months
Male farmers 73.9 68.1 79.6 60.7 54.1 67.2 -13.2 ** 304
414
Female farmers 68.8 62.8 74.9 52.9 46.2 59.6 -15.9 *** 388
497
Percentage of farmers who used at least five sustainable crop practices and/or technologies in the past 12 months 58.3 52.5 64.1 43.8 38.1 49.6 -14.5 ***
692
911
Percentage of farmers who used at least three sustainable livestock practices and/or technologies in the past 12 months 26.9 22.8 31.1 21.7 17.9 25.4 -5.3 +
692
911
Percentage of farmers who used at least three sustainable NRM practices in the past 12 months 14.1 8.1 20.1 5.7 3.4 8.1 -8.4 ***
692
911
Percentage of farmers who used improved storage practices in the past 12 months
13.4 8.9 18.0 7.2 5.0 9.5 -6.2 * 636
845
Male farmers 13.2 8.0 18.5 5.9 3.6 8.3 -7.3 * 288
395
Female farmers 13.6 9.1 18.2 8.3 5.1 11.6 -5.3 + 348
450
WOMEN'S HEALTH AND NUTRITION INDICATORS
Prevalence of underweight women 4.2 2.1 6.2 3.5 1.9 5.2 -0.6 ns 395
519
Women’s Dietary Diversity Score (WDDS) 3.3 3.2 3.5 3.0 2.8 3.3 -0.3 * 459
594
Average number of antenatal care visits by pregnant women6 4.8 4.4 5.2 4.8 4.3 5.3 0.0 ns
151
104
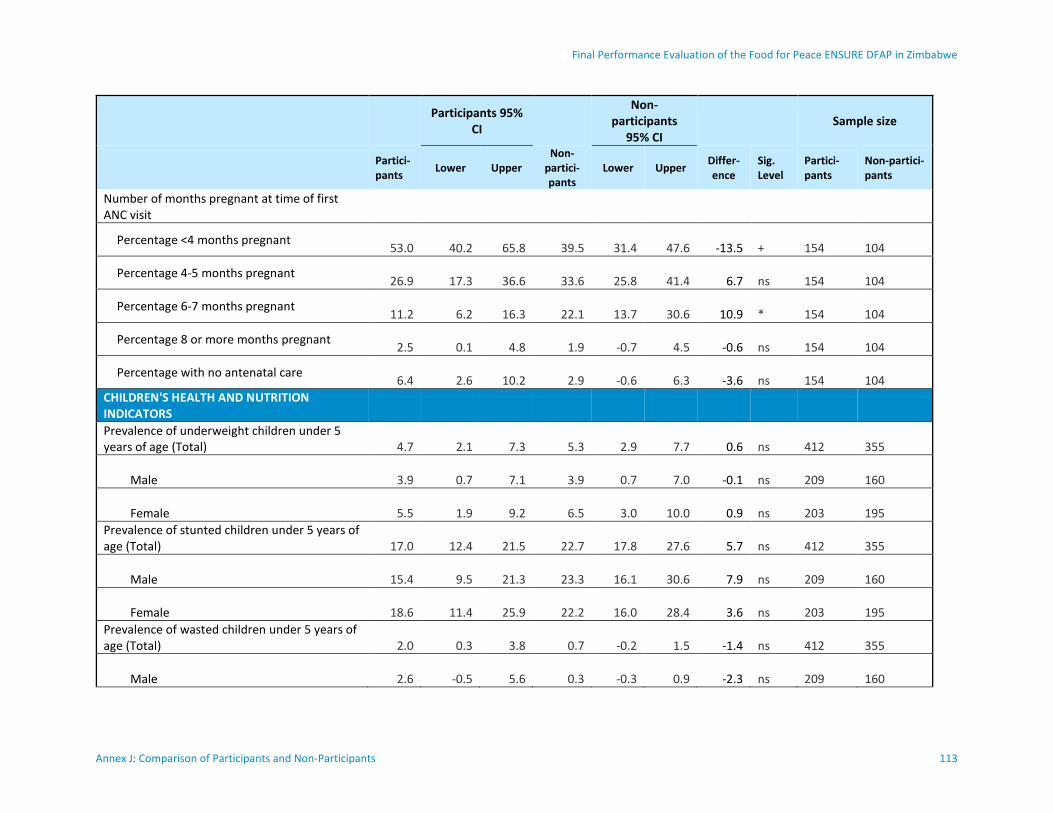
Final Performance Evaluation of the Food for Peace ENSURE DFAP in Zimbabwe
Annex J: Comparison of Participants and Non-Participants 113
Participants 95%
CI
Non-participants
95% CI Sample size
Partici-pants
Lower Upper Non-
partici-pants
Lower Upper Differ-ence
Sig. Level
Partici-pants
Non-partici-pants
Number of months pregnant at time of first ANC visit
Percentage <4 months pregnant 53.0 40.2 65.8 39.5 31.4 47.6 -13.5 +
154
104
Percentage 4-5 months pregnant 26.9 17.3 36.6 33.6 25.8 41.4 6.7 ns
154
104
Percentage 6-7 months pregnant 11.2 6.2 16.3 22.1 13.7 30.6 10.9 *
154
104
Percentage 8 or more months pregnant 2.5 0.1 4.8 1.9 -0.7 4.5 -0.6 ns
154
104
Percentage with no antenatal care 6.4 2.6 10.2 2.9 -0.6 6.3 -3.6 ns
154
104
CHILDREN'S HEALTH AND NUTRITION INDICATORS
Prevalence of underweight children under 5 years of age (Total) 4.7 2.1 7.3 5.3 2.9 7.7 0.6 ns
412
355
Male 3.9 0.7 7.1 3.9 0.7 7.0 -0.1 ns 209
160
Female 5.5 1.9 9.2 6.5 3.0 10.0 0.9 ns 203
195
Prevalence of stunted children under 5 years of age (Total) 17.0 12.4 21.5 22.7 17.8 27.6 5.7 ns
412
355
Male 15.4 9.5 21.3 23.3 16.1 30.6 7.9 ns 209
160
Female 18.6 11.4 25.9 22.2 16.0 28.4 3.6 ns 203
195
Prevalence of wasted children under 5 years of age (Total) 2.0 0.3 3.8 0.7 -0.2 1.5 -1.4 ns
412
355
Male 2.6 -0.5 5.6 0.3 -0.3 0.9 -2.3 ns 209
160

IMPEL | Implementer-Led Evaluation and Learning
114 Annex J: Comparison of Participants and Non-Participants
Participants 95%
CI
Non-participants
95% CI Sample size
Partici-pants
Lower Upper Non-
partici-pants
Lower Upper Differ-ence
Sig. Level
Partici-pants
Non-partici-pants
Female 1.5 -0.3 3.3 1.0 -0.5 2.4 -0.6 ns 203
195
Percentage of children under age 5 with diarrhea in the last two weeks (Total) 27.1 20.8 33.5 24.3 19.5 29.2 -2.8 ns
457
381
Male 27.4 21.0 33.7 30.3 21.6 39.0 2.9 ns 235
172
Female 26.9 17.0 36.7 19.4 14.3 24.4 -7.5 ns 222
209
Percentage of children under age 5 with diarrhea treated with ORT (Total) 72.6 65.1 80.0 73.7 63.4 83.9 1.1 ns
116
83
Male 78.3 69.0 87.6 76.7 65.1 88.2 -1.7 ns 64
46
Female 66.4 56.8 76.0 69.8 53.8 85.8 3.4 ns 52
37
Prevalence of exclusive breast-feeding of children under six months of age 67.5 55.6 79.4 53.0 34.8 71.2 -14.5 ns
43
45
Male NA NA 19
17
Female NA 41.8 19.2 64.4 24
28
Percentage of children 6-23 months who receive foods from 4 or more groups 18.4 12.4 24.5 10.0 3.3 16.7 -8.4 *
142
103
Male 21.1 12.3 29.9 8.1 0.6 15.5 -13.1 * 72
51
Female 15.6 9.3 21.9 11.9 1.7 22.1 -3.7 ns 70
52
Prevalence of children 6-23 months of age receiving a minimum acceptable diet (MAD)7 9.4 5.3 13.4 2.4 -0.5 5.3 -7.0 **
142
103
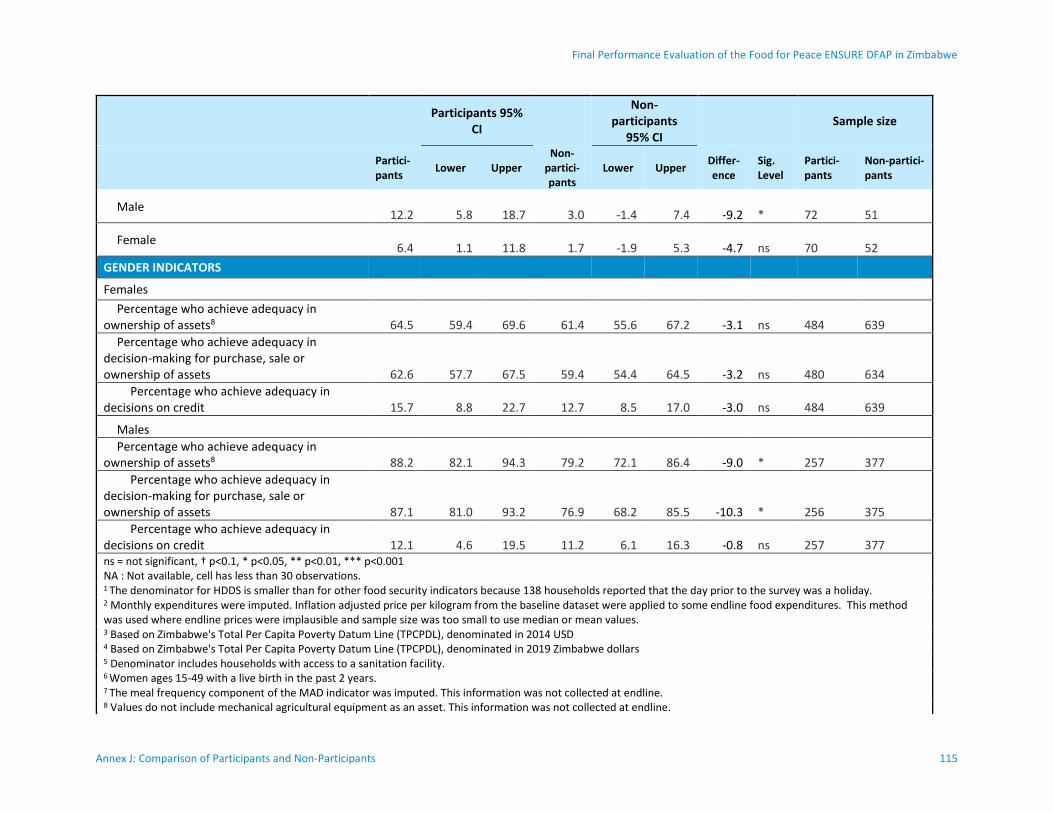
Final Performance Evaluation of the Food for Peace ENSURE DFAP in Zimbabwe
Annex J: Comparison of Participants and Non-Participants 115
Participants 95%
CI
Non-participants
95% CI Sample size
Partici-pants
Lower Upper Non-
partici-pants
Lower Upper Differ-ence
Sig. Level
Partici-pants
Non-partici-pants
Male 12.2 5.8 18.7 3.0 -1.4 7.4 -9.2 *
72
51
Female 6.4 1.1 11.8 1.7 -1.9 5.3 -4.7 ns
70
52
GENDER INDICATORS
Females
Percentage who achieve adequacy in ownership of assets8 64.5 59.4 69.6 61.4 55.6 67.2 -3.1 ns
484
639
Percentage who achieve adequacy in decision-making for purchase, sale or ownership of assets 62.6 57.7 67.5 59.4 54.4 64.5 -3.2 ns
480
634
Percentage who achieve adequacy in decisions on credit 15.7 8.8 22.7 12.7 8.5 17.0 -3.0 ns
484
639
Males
Percentage who achieve adequacy in ownership of assets8 88.2 82.1 94.3 79.2 72.1 86.4 -9.0 *
257
377
Percentage who achieve adequacy in decision-making for purchase, sale or ownership of assets 87.1 81.0 93.2 76.9 68.2 85.5 -10.3 *
256
375
Percentage who achieve adequacy in decisions on credit 12.1 4.6 19.5 11.2 6.1 16.3 -0.8 ns
257
377
ns = not significant, † p<0.1, * p<0.05, ** p<0.01, *** p<0.001 NA : Not available, cell has less than 30 observations. 1 The denominator for HDDS is smaller than for other food security indicators because 138 households reported that the day prior to the survey was a holiday. 2 Monthly expenditures were imputed. Inflation adjusted price per kilogram from the baseline dataset were applied to some endline food expenditures. This method was used where endline prices were implausible and sample size was too small to use median or mean values. 3 Based on Zimbabwe's Total Per Capita Poverty Datum Line (TPCPDL), denominated in 2014 USD 4 Based on Zimbabwe's Total Per Capita Poverty Datum Line (TPCPDL), denominated in 2019 Zimbabwe dollars 5 Denominator includes households with access to a sanitation facility. 6 Women ages 15-49 with a live birth in the past 2 years. 7 The meal frequency component of the MAD indicator was imputed. This information was not collected at endline. 8 Values do not include mechanical agricultural equipment as an asset. This information was not collected at endline.