final lab report bio 125
TRANSCRIPT
Insertion of Mutant PA618V into Saccharomyces Cerevisiae and Its Effects on HNPCC
Carrithers B., Carter T., Hill S., and Sims A.Molecular Biology and Genomics
Dr. Anna Powolny

Colorectal cancer (CRC) is on the rise as one of the most common cancers diagnosed in the United
States. Death rates associated with CRC include over 50,000 individuals because of genetic
mutations in DNA mismatch repair (MMR) system genes, MSH2 and MLH 1, which cause cancer.
These genetic mutations are commonly seen in the most inherited type of CRC: hereditary non-
polyposis colorectal cancer (HNPCC). HNPCC is characterized by an aneuploid tumor with
microsatellite instability (MIN); this is where the MSH2 gene in the DNA MMR system is defective.
MSH2 is highly conserved; therefore, in order to detect if a tumor in humans is benign or
malignant, a yeast organism is used as a model. Clinically relevant mutants (plasmids with MSH2
mutants) are used to simulate the mutation in DNA MMR and are placed into the yeast model. The
experiments conducted, which are used to simulate the mutation found in HNPCC, include plate
streaking of E.coli, plasmid isolation, enzyme restriction, agarose gel electrophoresis, polymerase
chain reaction (PCR), 5-FOA complementation assay, and SDS-PAGE and Western Blot to
determine if the inherited MSH2 gene mutation will affect its amount of protein in the yeast model,
its activity, and whether the mutant pA618V would be malignant or benign.
Introduction
Colorectal cancer (CRC) is the 3rd most common inherited cancer diagnosed in America today, which is
accompanied by a death rate of 50,000 individuals in 20031. There are two types of inherited colorectal
cancer: 1) Familiar Adenomatous Polyposis (FAP) and 2) Hereditary Non-Polyposis Colorectal Cancer
(HNPCC). FAP is characterized by an aneuploid tumor with chromosomal instability (CIN) and polyps
located in the distal end of the colon, while HNPCC is characterized by a diploid tumor with
microsatellite instability (MIN), no polyps, and located in the proximal end of the colon1,4. Hereditary
Non-Polyposis Colorectal Cancer (HNPCC), also know as Lynch Syndrome, is a colorectal cancer that is
the most common of colorectal cancers and accounts for about 10 percent of diagnoses each year1.
HNPCC was first discovered by Alfred Warthin in 19131, and it is derived from defects found in DNA
mismatch repair (MMR) genes1. The cause of these defects is errors within DNA replication. Without an
intact mismatch repair system, DNA begins to accumulate mutations2. Repetitive DNA (Microsatellite
DNA) that is highly unstable in MMR defective strains are hallmarks for HNPCC1. In a mismatch repair
system, there are two clinically relevant homologs that are used: MutS and MutL1. In these homologs,
there are several types of genes that are found in the DNA MMR system of both prokaryotes and
eukaryotes. Most of the mutations in the DNA MMR system that cause colorectal cancer include MSH2,
MSH3, MSH6 MLH1, PMS1, and PMS2, with MSH2 and MLH1 accounting for most HNPCC cases2.
From this background information, the hypothesis was formed to determine if the inherited MSH2 gene
mutation will affect its amount of protein in the yeast model and its activity. The tests and activities
completed include plate streaking of E.coli, plasmid isolation, enzyme restriction, agarose gel

electrophoresis, polymerase chain reaction (PCR), 5-FOA complementation assay, and SDS-PAGE and
Western Blot.
Materials and Methods
Bacteria Streaking: While wearing gloves, a pre-sterilized inoculating loop was taken and held under the
Bunsen burner flame at 45 degrees for a few seconds. The E. coli sample was opened and the loop was
then dipped into the sample. The culture lid was removed away from the face. Then, the inoculation loop
containing the E. coli sample was spread on the culture plate using a zigzag motion. These steps were
repeated three more times in three sections on the plate. The top was placed back over the culture and was
incubated for 48 hours and 20 degrees Celsius.
Plasmid Isolation: Three tubes, which contained a bacterial culture, were labeled pMSH2 (wild-type),
pRS413 (vector), and pA618V (mutant) and were centrifuged to collect bacterial cells at 4000 RPM for 5
minutes. The supernatant in each tube was decanted. To remove excess media, tubes were turned upside
down for 3 minutes on a paper towel to drain. 300µL of Cell Resuspension Solution was pipetted into
each tube to resuspend the pellet. 300µL of Cell Lysis Solution was pipetted into each tube and was
mixed by inverting four times. The suspended pellet was transferred into a new tube and 300µL of
Neutralization Solution was added to each tube. Then, the tubes were mixed by inverting four times and
were placed spun in the micro centrifuge at 14000 RPM for 10 minutes and were placed on ice.
Luer-Lock filtration mini columns were assembled and labeled pMSH2, pRS413, and pA618V.
The columns were placed into vacuum manifolds. 1 mL of Wizard MiniPrep DNA Purification Resin and
the supernatant from each tube were pipetted into their respective filtration columns, and the mixture was
pushed into the mini column with a plunger. 2 mL of Wash Solution was pipetted into each column and
was pushed through with a plunger. The mini columns were disassembled from their barrels and were
transferred to labeled 1.5 ml microcentrifuge tubes and were centrifuged for 2 minutes at 14000 RPM. 50
µL of 1x Tris was added to the mini-columns and was centrifuged at 14000 RPM for 1 minute, causing
the plasmid DNA to be collected into the microcentrifuge tubes. The tubes were capped and stored in a -
20 degree Celsius freezer.
Enzyme Restriction: While the plasmid DNA thawed out on ice, a master uncut mix was made using 8
µL buffer, 48 µL H2O, and 4 µL BSA. A master cut mix was made using 8 µL buffer #4, 48 µL H2O, 4
µL BSA, and 4 µL of Hha1 enzyme. Six microcentrifuge tubes were labeled: uncut pMSH2, cut pMSH2,
uncut pRS413, cut pRS413, uncut pA618V, and cut pA618V. The cut tubes will have the restriction
enzyme that will cut the plasmid, the uncut will not. In each labeled tube, 5 µL of the assigned plasmid
was inserted along with 15 µL of the cut/uncut mix. The microcentrifuge tubes were centrifuged for a few
seconds and incubated in a 37 degrees Celsius water bath for 50 minutes. The tubes were then stored in a
-20 degree Celsius freezer.
Agarose Gel: The gel rack was assembled with the comb into the electrophoresis rig. Molten 1% agarose
gel pre-stained with Ethidium bromide was poured into the gel rack and cooled for 20 minutes. The rack
was inverted, the comb was removed, and 1x TBE buffer was added over the gel. 10 µL of the 1 Kb DNA
ladder standard was pipetted into the first well, and the cut and uncut plasmid mixtures into the next six
wells with 2 µL of loading dye. The lid was placed over the rig and the electrodes were connected. The
rig was plugged into the power supply and set to 120 mV. The gel was run for 50 minutes and was taken
into the lab to get photographed using the GBox iChemi XR Genesys.
PCR Reaction: A serial dilution was made to dilute the solutions. 2 µL of extracted plasmid was taken
and added to 98 µL of water. Then 2 µL of that solution was added to 38 µL of water for a 1000x
dilution. Three tubes containing Polymerase Chain Reaction beads, (which are composed of stabilizers,
dNTPs, Taq DNA polymerase, reaction buffer, Tris HCl, KCl, and MgCl2) were labeled vector, wildtype,
and mutant. In the vector tube containing the PCR bead, 2 µL of primer, forward and reverse were
combined, 3.8 µL of the vector, and 19.2 µL of water was added for a final volume of 25 µL. In the
wildtype tube containing the PCR bead, 2 µL of primer, 2.3 µL of the wildtype, and 20.7 µL of water was
added for a final volume of 25 µL. In the mutant tube containing the PCR bead, 2 µL of primer, 2.3 µL of
the mutant, and 20.7 µL of water were added for a final volume of 25 µL. The tubes were placed in a Bio-
Rad thermocycler and the PCR process began. The samples incubated at 95 degrees Celsius for 5 minutes
to activate the Taq Polymerase, then one minute cycles of 45 degrees Celsius to anneal, 72 degrees
Celsius to elongate, and 95 degrees Celsius to elongate were repeated 34 times for a total of 35 one
minute cycles. The last elongation phase lasted for 10 minutes then the solutions were placed at 4 degrees
Celsius for 2 hours to cold soak. After the cold soak, the tubes were placed and stored in a -20 degree
Celsius freezer for 5 days.
Restriction Enzyme: 8 microcentrifuge tubes were labeled: pMSH2 cut, pA618V cut, pRS413 cut,
pMSH2 uncut, pA618V uncut, pRS413 uncut, Uncut mix, and Cut mix. To the cut mix tube, 4 µL of
enzyme HhaI and 4 µL of buffer #4 were added and spun in the microcentrifuge. To the uncut mix, tube
4µL of H2O and 4 µL of buffer #4 were added and spun in the microcentrifuge. 8 µL of PCR sample was
added along with 2 µL of cut mix to the pMSH2 cut tube, the pA618V cut tube, and the pRS413 cut tube.
8 µL of PCR sample was added along with 2 µL of the uncut mix to the pMSH2 uncut tube, the pA618V

uncut tube, and the pRS413 uncut tube. The six tubes were mixed and spun in the microcentrigue for a
few seconds then placed in the incubator at 37 degrees Celsius for 50 minutes. After the samples were
incubated, 2 µL of 6x loading buffer was added to each tube to prepare it for agarose gel electrophoresis.
Agarose Gel: The gel rack was assembled with the comb into the electrophoresis rig. Molten 2% agarose
gel pre-stained with Ethidium bromide was poured into the gel rack and cooled for 20 minutes. The rack
was inverted, the comb was removed, and 1x TBE buffer was added over the gel. 12 µL of the 100 bp
DNA ladder standard was pipetted into the first well, and the cut and uncut plasmid mixtures into the next
six wells. The lid was placed over the rig and the electrodes were connected. The rig was plugged into the
power supply and set to 120 mV. The gel was run for until it was 2/3 of the way down the gel and was
taken into the lab to get photographed using the GBox iChemi XR Genesys.
Yeast Transformation:
A 10 mL yeast sample containing no MSH2 and no ability to make its own histadine or tryptophan was
centrifuged for one minute at 10000 rpm. The supernatant was decanted and was resuspended in 750 µL
of sterile water and was centrifuged again. The supernatant was drained and the remaining cell pellet was
resuspended in 400 µL of plate solution. 0.5mL of suspended yeast, 20 µL 1M DDT, 10 µL boiled carrier
DNA, and 10 µL plasmid DNA was added into each tube. The contents were mixed and incubated for 30
minutes at 30 degrees Celsius. The cells were then heat shocked for 30 minutes at 42 degrees Celsius. The
mixture was centrifuged for one minute at 10000 rpm. The supernatant was removed and the pellet was
resuspended in 100 µL of sterile water. The entire volume of cells was placed on the surface of an SD-trp-
his plate and was spread evenly across the plate using inoculating loops.
FOA and preparation:
Empty tubes were obtained and labeled 1.0 pMSH2, 0.1 pMSH2, 0.01 pMSH2, 1.0 pRS413, 0.1 pRS413,
0.01 pRS413, 1.0 pA618V, 0.1 pA618V, and 0.01 pA618V. The transformed yeast cells were spun at
4000 rpm for 5 minutes and resuspended in 500µL of water, and were then placed into their
corresponding 1.0 labeled tubes. A serial dilutions was made for the 0.1 tubes, 50µL of the 1.0 yeast cells
was added to 450µL of water. For the 0.01 dilutions, 50µL of the 0.1 dilution was added to 450µL of
water. A square was drawn on an FOA plate and was divided into nine sections: 1.0 pMSH2, 0.1 pMSH2,
0.01 pMSH2, 1.0 pRS413, 0.1 pRS413, 0.01 pRS413, 1.0 pA618V, 0.1 pA618V, and 0.01 pA618V. 75
µL of each dilution was pipetted into the center of each corresponding square. The plates were flipped
after an hour so the transformed yeast would have time to absorb into the plate.
Yeast Protein Extraction:
100 µL of each of the cells were centrifuged at 13000 rpm for one minute. The cell pellets were then
resuspended in 100µL alkaline lysis buffer containing 0.1M NaOH, 0.05M EDTA, 2% SDS and 2%
BME. The mixtures were heated on a heating block at 90 degrees Celsius for ten minutes. Then the
solutions were neutralized by adding 4µL of 4M acetic acid. The samples were heated again for ten
minutes at 90 degrees Celsius. Then the samples were spun for five minutes at 14000 rpm. The
supernatant was transferred into fresh tubes and the samples were prepared for gel. 20 µL of sample
buffer was added to 20µL of protein extract. 30µL of the prepared samples were then loaded onto the
SDS-PAGE gel.
SDS Page and Western Blot:
3 µL of standard of pre-stained standard was placed into the first well and 30 µL of each sample was
loaded into the following wells. The gel was run for one hour at 120 V. Afterwards, the gel was
transferred to a nitrocellulose membrane using methanol and a transfer buffer that lubricated the sponge,
filter paper, membrane, and gel used in the transfer stack. The transfer was run at 200 milliamps for one
hour. The membrane was blocked for one hour at room temperature with 5% milk blocking solution. The
membrane was incubated with a 1:2000 diluted primary Anti Hemagglutinin rabbit polyclonal antibody at
4 degrees Celsius overnight. The membrane was then washed with TBST, three times for five minutes
each. The membrane was incubated with a secondary Horseradish Peroxidase HA tagged polyclonal
antibody at room temperature for one hour, and then washed with TBST, which contains Tris-Buffered
Saline and Tween 20. The membrane was developed using chemiluminesence.
Results
Streaking Bacteria
The purpose of streaking bacteria was to obtain isolated colonies of E.Coli bacteria. By spreading a large
amount of bacteria over the large surface area of the plate, the amount of bacteria was diluted until
individual cells were placed on the surface of the plate. From observation, single colonies of E.coli
bacteria arose and were used as cloning.

Figure 1. Agar plate of E. Coli bacteria, small colonies of bacteria grown.
Isolating Plasmid DNA from Host Bacterial Strains
During plasmid DNA isolation, cell lysis occurred to eliminate intracellular macromolecules allowing for
the Plasmid DNA to be more prominent. While mixing Cell Lysis Solution in each tube, the solutions
appeared clear and viscous. The formation of precipitation containing cellular debris and chromosomal
DNA was observed. As Shown in table 1, the concentration of the plasmid DNA extraction for pRS413
was 131.3 ng/uL, pMSH2 was 217.7 ng/uL, and the mutant pA618V was 218.0 ng/uL. The ratios for
pMSH2 and pA618V showed that there was no protein present in the extractions.
Table 1. Ratio of amount of Plasmid DNA in various mutant types.
Restriction Enzyme Digestion of Plasmid DNA and
Agarose Gel electrophoresis
Restriction enzymes are able to scan along DNA searching for various sequences of bases. The restriction
enzyme attaches to the DNA and cuts into each strand of the double helix and cuts the molecule into
fragments. Agarose gel electrophoresis was used to resolve the mixtures of the cut plasmid DNA. The
fragments were visually identified by the use of the UV transilluminator. Fading was seen at the lower
end of the photographic image, indicating that gel should have been ran for a slightly longer period of
Mutant Type Ratio Concentration
PRS413 1.7 131.3 ng/ul
PMSH2 1.88 217.7 ng/ul
PA618V 1.87 218.0 ng/ul

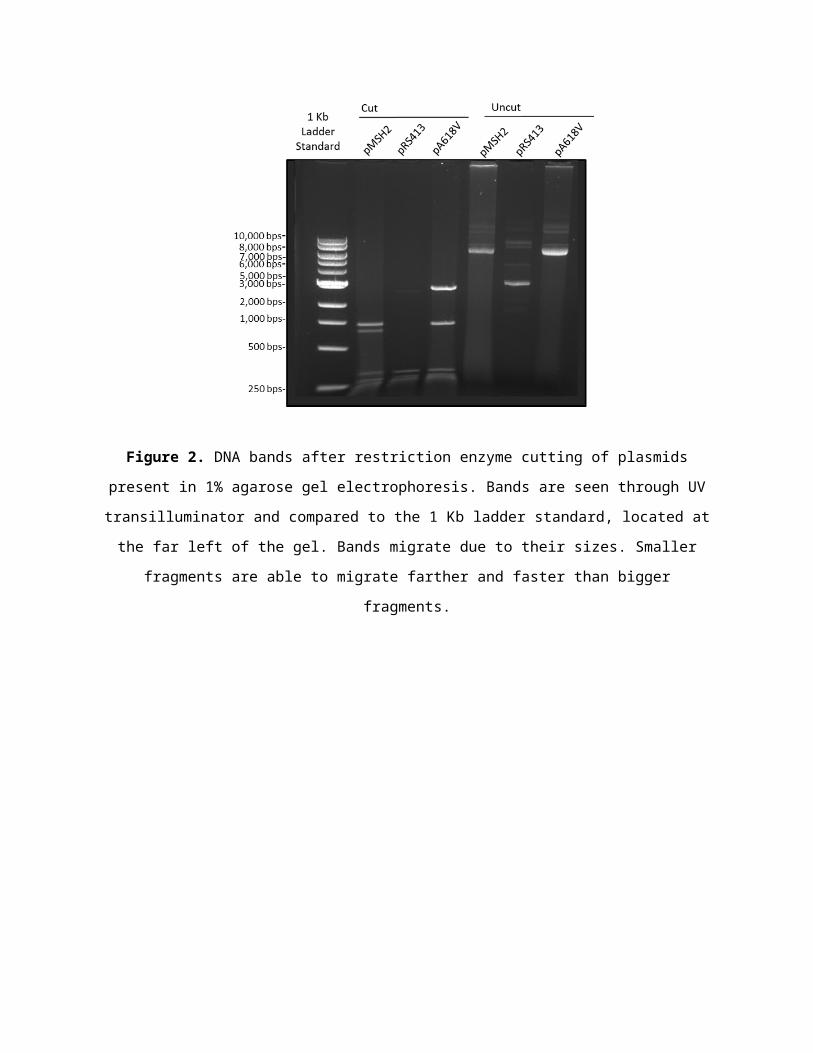
time. Sharp bands were observed, indicating that there was little to no protein present in plasmid samples.
There is evidence of supercoiling, represented by bands being located at the top. Based upon the
photographic image, it was concluded that digestion worked and that the mutant (pA618V) was different
than the wild type (pMSH2). As seen in Figure 2, the digestion was successful because the cut bands
migrated further than the uncut bands. Cut pA618V is distinguished from the cut wild-type (pMSH2)
band by the difference in location of the restriction enzyme site, showing that there is a mutation present
in the cut pA618V.
Figure 2. DNA bands after restriction enzyme cutting of plasmids present in 1% agarose gel
electrophoresis. Bands are seen through UV transilluminator and compared to the 1 Kb ladder standard,
located at the far left of the gel. Bands migrate due to their sizes. Smaller fragments are able to migrate
farther and faster than bigger fragments.

18 18 24 30 46 420
1,000
2,000
3,000
4,000
5,000
6,000
7,000
Standard Curve for Restriction Enzyme Gel Elec-trophoresis
Distance Traveled (in mm)Fragment Size (in bps)
Distance Traveled (in mm)
Frag
men
t Size
in b
ps)
pA618V pA618VpRS413pMSh2 pMSh2 pRS413
Figure 3. The standard curve, the 1 Kb ladder, is used to estimate the band sizes of DNA after restriction
enzyme cutting of plasmids and agarose gel electrophoresis (The uncut fragments are first, then the cut
fragments). Estimation of band sizes is as followed: cut pMSH2 (750-1,000 bps), cut pRS413 (250 bps),
cut pA618V (2,000-3,000 bps), uncut pMSH2 (6,000 bps), uncut pRS413 (3,000 bps), and uncut pA618V
(6,000 bps).
Polymerase Chain Reaction
In polymerase chain reaction, the mutant pA618V was amplified from a single copy of the target DNA
segment, MSH2. Based on our results, no bands were anticipated to appear in the vector, pRS413, but due
to contamination, bands are slightly visible. In the mutant, pA618V, the cut and uncut bands are located
in the same area, not distinguishing the bands from one another. The pMSH2 cut bands migrated down in
two fragments. The difference between the cut mutant and the cut wild type is the size of the gene. The
PCR gel shows the mutation that is present in the amplified mutant pA618V’s MSH2 gene is larger than
the amplified wild type pMSH2’s gene, indicating the difference in the gene sizes.
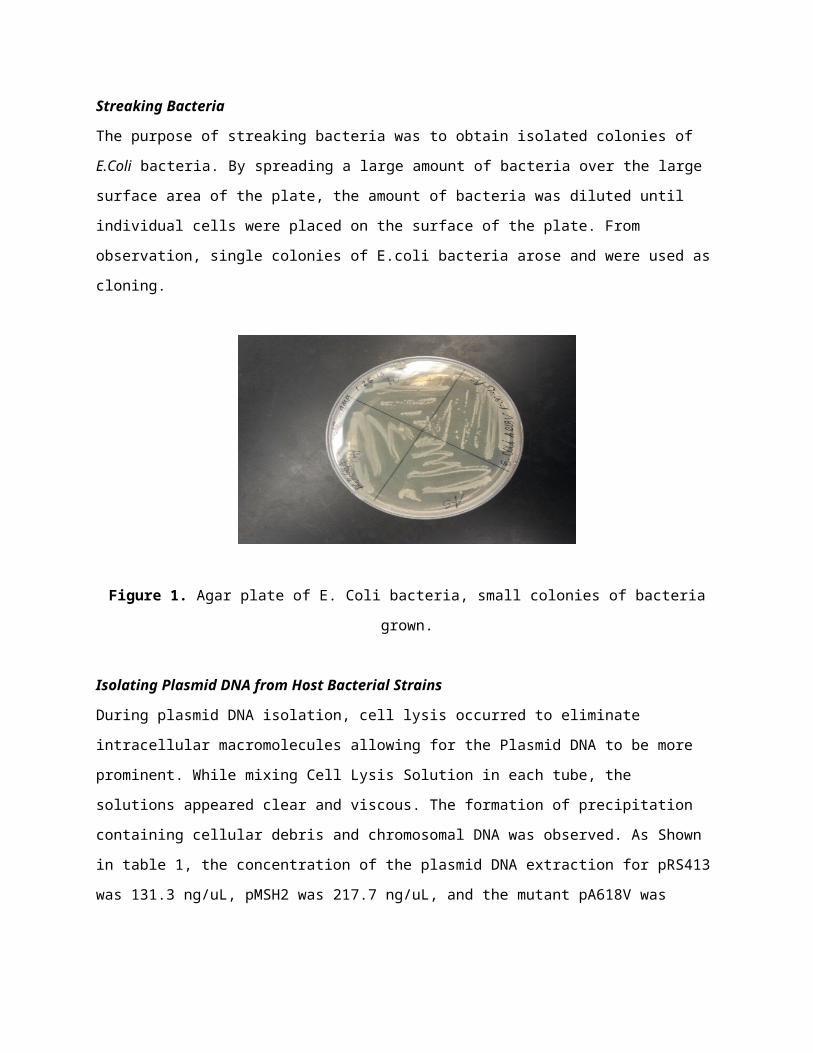
Figure 3. DNA bands after PCR in 2% agarose gel. Cut mutant, pA618V, is cut higher than the wild-type, pMSH2, showing that the mutant, pA618V, is different from the wild-type, pMSH2.
Yeast transformation
Yeast was plated with reporter plasmids that restored their ability to make Histidine and Tryptophan
allowing for the yeast colonies to arise. Based on the photographic images, there are no conclusive results
on MSH2; only transformation took place.
1) pMSH2 2) pRS413 3) pA618V
Complementation Assay
In this yeast transformation, the mutant pA618V was studied to determine the effects of pMSH2, wild-
type deletion. No exact results were confirmed due to discrepancies in determining whether the pRS413
and pMSH2 had been switched during labeling processes. The anticipating results would have included:
NO growth in the wild-type pMSH2, abundant growth in the vector pRS413, and from there, determine
Figure 4. The photographic image of yeast transformation after the restoration of the ability to make Histidine and Tryptophan.

whether mismatch repair had been restored in the mutant pA618V. Due to mislabeling, the wild-type
pMSH2 and vector pRS413 were switched. Our results now show growth in wild-type pMSH2, some
growth in vector pRS413, and abundant growth in our mutant pA618V. From the observations from the
5-FOA plating, it was concluded that out mutant, pA618V, was malignant as the DNA mismatch repair
system was not restored, allowing colonies to grow continuously with mutations present.
Figure 3. Complementation assay proves that mutant A618V produced more colonies than wild-type
pMSH2, therefore MMR system did not repair functionality.
Discussion
There are various mutations that possibly contribute to defects in the MSH2 gene causing HNPCC. In the
Characterization of Pathogenic hMSH2 Missense Alleles, fifty-four missense mutations were introduced
to the yeast, MSH2, and tested for mismatch repair on a molecular level. “The missense mutation is
introduced to the cognate yeast MSH2 coding sequence so that the MSH2 gene harboring the mutation is
distinguishable from the wild type by restriction endonuclease digestion”(Gammie 1, 35)1. Based upon
the results of the Gammie 1 report, the PCR amplification allowed for identification of the mutagenized
plasmids. Much like the Gammie 1 report, the confirmation of the mutation by Restriction Digestion and
PCR in this presented research, was confirmed by the same analysis of patterns in band sizes and
locations to the wild-types and mutated plasmids. In the Gammie mismatch repair assays, the
mutagenized plasmid, the pMSH2, and the PRS413 vector were transformed using the yeast reporter
strain AGY75 and the colonies that were observed from the tranformations were then tested for DNA
mismatch repair. In the immunoblotting, the secondary antibody used was horseradish peroxidase much
like what was used in the experimental design presented in this research. In the Characterization of
Pathogenic hMSH2 Missense Alleles, detrimental substitutions altered the levels of MSH2 contributing to
the stability of the form and function of MutS (Gammie 2, 715)5. In the research presented in this report,
mismatch repair was defective in the mutant, pA618V, on the 5-FOA plate, determining the mutation as
malignant. In the Characterization of Pathogenic hMSH2 Missense Alleles, “cells displayed an elevated
rate of resistance to 5-FOA, which was indicative of instability”. Overall, most of the missense mutations
in the Gammie report, except the pseudo-wild-type variants, significantly altered Msh2 functioning and
MMR. The characterization of mutations within mismatch repair allotted for understanding of the cellular
and molecular defects of the MSH2 gene and its clinical relevance to HNPCC.
Conclusion
The data presented in this report characterize an extensive set of experiments to determine mutations in
the mismatch repair gene, MSH2. We were able to distinguish the functionality of the mutation and
determine if the mutation significantly altered the functioning of the MSH2 gene. The research presented
can conclude that the absence of MSH2 can alter the functionality of mismatch repair and cause defects in
humans. Genetic testing for these human defects, such as HNPCC, is primarily determined by the
presence of MSH2. Defective mismatch repair is the inability to repair mismatches, small deletions and
insertions, which were tested in these experiments. Our results so far, do prove that the deletion and
mutation of MSH2 has affected the yeast cell and its ability to rep air, but due to complications in the
complementation assay no conclusions can be drawn and are still under study. Anticipating results back
from the mislabeling of the complementation assay plate, the prediction would be that pA618V would be
malignant, as growth is seen on the 5-FOA complementation assay.
References
1. Gammie, Alison E., and Naz Erdeniz. "Characterization of Pathogenic Human MSH2 Missense Mutations Using
Yeast as a Model System: A Laboratory Course in Molecular Biology." Cell Biology Education 3 (2003): 31-48.
Department of Molecular Biology, Princeton University, Princeton, NJ 08544-1014. Web. 01 May 2013.
2. "Hereditary Nonpolyposis Colon Cancer (HNPCC)." - Information About Cancer. Stanford Medicine, n.d. Web.
20 Feb. 2013.
3. "Lynch Syndrome." Genetics Home Reference. Apr. 2008. Web. 20 Feb. 2013.
4. Alberts, Stephen R., Deborah Citrin, and Miguel Rodriguez-Bigas. "Colon, Rectal, and Anal Cancers." - Cancer
Network. UBM Medica LLC, 8 Mar. 2013. Web. 21 Mar. 2013.
5. Gammie, Alison E., Naz Erdeniz, Julia Beaver, Barbara Delvin, Afshan Nanji, and Mark D. Rose. "Functional
Characterization of Pathogenic Human MSH2 Missense Mutations in Saccharomyces Cerevisiae." Department of
Molecular Biology, Princeton University, Princeton, New Jersey 08544-1014 (2007): 707-21. Web. 01 May
2013.