final june 2014 quarterly results 240714 - newcrest mining€¦ · 1group all-in sustaining cost...
TRANSCRIPT
Quarterly Report Newcrest Mining Limited For the three months ended 30 June 2014 (these figures are unaudited)
Newcrest Mining - Quarterly Report to 30 June 2014
Key Points Quarterly: Gold production of 636,736 ounces (85,146 ounces or 15% higher than the March 2014 quarter) Copper production of 22,871 tonnes (1,859 tonnes or 9% higher than the March 2014 quarter) Group All-In Sustaining Cost1 of A$913/oz (US$851/oz2) (8% lower than the March 2014 quarter) Group All-In Sustaining Cost margin of A$469/oz on average realised gold price of A$1,382/oz
Full year: Gold production of 2,396,023 ounces (a 14% increase on 2,109,784 ounces in the 2013 financial year) Copper production of 86,118 tonnes (a 7% increase on 80,366 tonnes in the 2013 financial year) Group All-In Sustaining Cost1 of A$976/oz (US$897/oz2) was 24% lower than the 2013 financial year Group All-In Sustaining Cost1 margin of A$434/oz was A$167/oz higher than the 2013 financial year,
notwithstanding the average realised gold price in the 2014 financial year of A$1,410/oz was A$140/oz lower Group free cash flow for the year is estimated to be approximately A$130 million (subject to finalisation of
audited financial statements) Expected asset impairment of A$1.5 to A$2.5 billion
Overview Newcrest Managing Director and Chief Executive Officer, Sandeep Biswas, described the improved operational results for the June 2014 quarter and full financial year as reflective of the Company’s focus on safety, cost reduction and cash generation.
“Newcrest is firmly focused on realising the full potential of each of the Company’s assets, prioritising operating discipline and maximising cash across all sites. All sites achieved production and cost guidance for the year, with some performing significantly better,” Mr Biswas said. “Looking ahead, the main focus will continue to be on the improvement of operational and safety performance. The sustainable generation of strong free cash flow will produce a higher return on invested capital and enable the Company to reduce debt and progressively return to paying dividends. Growth will be focused on profitable, high return projects.”
Gold production for the 2014 financial year of 2,396,023 ounces exceeded the top end of the guidance range (of 2.3 million ounces) and was 14% higher than the prior year. Full year copper production of 86,118 tonnes also exceeded the top end of the guidance range (of 85,000 tonnes) and was 7% higher than the prior year. The AISC for the 2014 financial year was A$976 (US$ 897) per ounce, 24% lower than the 2013 financial year of A$1,283 per ounce. The AISC margin in the 2014 financial year was A$434 (US$397) per ounce, A$167 per ounce higher than the prior year notwithstanding the average realised gold price in the 2014 financial year of A$1,410 was A$140 per ounce lower.
(1) All references to All-In Sustaining Cost (AISC) throughout this report are references to metrics as per World Gold Council Guidance Note on Non-GAAP Metrics, released 27 June 2013. Newcrest Group All-In Sustaining Cost will vary from quarter to quarter as a result of various factors including production performance, timing of sales, the level of sustaining capital and the relative contribution of each asset.
(2) All references to AISC, cash costs and total costs in US dollars throughout this report are converted to USD at an average A$:US$ exchange rate for the period, being $0.93 for the June 2014 quarter,$0.92 for the 2014 financial year and A$0.90 for the March 2014 quarter.

2 Newcrest Mining - Quarterly Report to 30 June 2014
In the June 2014 quarter the Company produced 636,736 ounces of gold and 22,871 tonnes of copper with an AISC of A$913 (US$851) per ounce. This represents a 15% increase in gold production and 8% reduction in AISC compared to the March 2014 quarter. Safety performance also improved in the June quarter with a total recordable injury frequency rate (TRIFR) of 2.1 compared to a TRIFR of 3.1 over the last twelve months.
Gold production for the June quarter increased at all sites except Bonikro. The key drivers of increased quarterly production were higher gold grades and plant throughput at Gosowong, increased mining rates at Ridgeway, continued ramp up at Cadia East and higher gold recoveries at Lihir.
The expansion of the Cadia East Panel Cave 2 footprint continued during the June quarter and the project is expected to achieve commercial production around the middle of the 2015 financial year.
Newcrest Group AISC of A$913 per ounce was 8% lower than the March 2014 quarter. This was primarily due to a reduction in site operating costs per ounce, which were lower than the previous quarter at all sites except Telfer, and lower production stripping activity.
In the context of the unit cost improvement achieved elsewhere in the Group, the unit cost performance of Lihir in the June quarter and the 2014 financial year was disappointing. The Company has a major review underway to identify and accelerate initiatives to improve Lihir’s operating and financial performance.
Guidance3 Newcrest’s 2014 financial year gold production of 2.4 million ounces exceeded the guidance range of 2.0 to 2.3 million ounces. Full year copper production of 86 thousand tonnes also exceeded the guidance of 75 to 85 thousand tonnes, while total capital expenditure of A$843 million was below the guidance range of A$895 to A$1,025 million. The 2014 financial year All-In Sustaining Cost (A$2.33 billion) and exploration expenditure (A$62 million) were also below their guidance ranges of A$2.45 to A$2.73 billion and A$80 to A$90 million respectively.
The Company announced on 12 June 2014 its expected guidance for Group production of gold and copper, Group All-In Sustaining Costs, and capital and exploration expenditure for the 2015 financial year, subject to final approval of the budget by the Board in August 2014.
Gold production for the September 2014 quarter is expected to be lower than the June 2014 quarterly production as a result of expected lower gold grades, particularly at Gosowong, and a planned autoclave shutdown at Lihir. This is also expected to result in a higher Group AISC per ounce in the September 2014 quarter than achieved in the June 2014 quarter. Gold production during the second half of the 2015 financial year is expected to be higher than the first half of the 2015 financial year.
(3) Achievement of guidance set out in this section and throughout this report is subject to market and operating conditions - see also Newcrest’s Forward Looking Statements disclaimer on page 22.

3 Newcrest Mining - Quarterly Report to 30 June 2014
Production Highlights Production Highlights
June 2014 Quarter
March 2014 Quarter
June 2013 Quarter
Group production - gold oz 636,736 551,590 642,032 - copper t 22,871 21,012 22,818
- silver oz 665,604 510,264 582,444 Cadia Valley production (4) - gold oz 154,050 133,245 140,267
- copper t 16,370 13,844 15,959 Telfer production - gold oz 128,372 127,489 161,755
- copper t 6,501 7,168 6,859 Lihir production - gold oz 174,601 164,359 201,213 Gosowong production - gold oz 124,967 70,562 92,896 Hidden Valley production (50%) - gold oz 29,886 26,241 23,229 Bonikro production - gold oz 24,859 29,694 22,672 Cash Cost – (after by-product credits) A$/oz prod 636 723 762
US$/oz prod 2 593 648 756
Total Costs – (after by-product credits) A$/oz prod 952 1,013 1,069 US$/oz prod 2 888 908 1,061 All-In Sustaining cost (1) A$/oz sold 913 988 N/A US$/oz prod 2 851 886 N/A Achieved gold price (5) A$/oz 1,382 1,450 1,434 Achieved copper price (5) A$/lb 3.31 3.49 3.34 Achieved silver price (5) A$/oz 21.11 22.08 18.68 Achieved exchange rate AUD:USD 0.933 0.896 0.993
Notes: (4) Cadia Valley includes pre-commissioning and development production from the Cadia East project of 4,955 ounces of gold and 467 tonnes of
copper in the June 2014 quarter, 5,244 ounces of gold and 458 tonnes of copper in the March 2014 quarter, and 1,383 ounces of gold and 183 tonnes of copper in the June 2013 quarter. Costs associated with this production are capitalised and are not included in the operating cost calculations throughout this report.
(5) Achieved metal prices are the A$ spot prices at the time of sale per unit of metal sold excluding the impact of price related finalisations for metals in concentrate.
All figures are 100% unless stated otherwise.
Operations
Cadia Valley, Australia Cadia Valley’s June 2014 quarter production was 154,050 ounces of gold and 16,370 tonnes of copper with an All-In Sustaining Cost of A$326 (US$304) per ounce. This compares with the March 2014 quarter performance of 133,245 ounces of gold and 13,844 tonnes of copper with an All-In Sustaining Cost of A$381 (US$342) per ounce.
Gold production was 16% higher than the previous quarter, primarily due to higher mining rates at both Ridgeway and Cadia East which enabled an 18% increase in mill throughput compared to the March 2014 quarter. Cadia Valley average gold grade and recoveries were broadly in line with the previous quarter, with lower Ridgeway gold grade offset by higher grade from Cadia East.
Copper production was 18% higher than the March 2014 quarter, attributable to the higher mill throughput. The average copper grade and recoveries were in line with the prior quarter.
Ore production from Cadia East was 8% higher than the March 2014 quarter primarily as a result of increased production from Panel Cave 2 following commissioning of the underground west crusher during the March 2014 quarter. Ridgeway ore production in the June 2014 quarter equated to an annualised rate of around 9Mtpa.
All-In Sustaining Cost decreased by 14% during the June 2014 quarter to A$326 per ounce primarily as a result of lower site operating costs per ounce (reflecting the Cadia East production ramp-up and increased mining rates at Ridgeway) and lower sustaining capital expenditure per ounce, partly offset by lower copper prices.

4 Newcrest Mining - Quarterly Report to 30 June 2014
Lihir, PNG Lihir’s June 2014 quarter production was 174,601 ounces of gold with an All-In Sustaining Cost of A$1,313 (US$1,225) per ounce. This compares with the March 2014 quarter performance of 164,359 ounces of gold with an All-In Sustaining Cost of A$1,344 (US$1,205) per ounce.
Gold production was 6% higher than the previous quarter primarily as a result of an increase in gold recoveries from 78.6% to 83.1%. Mill throughput and gold feed grades were in line with the previous quarter.
Total material movements of around eight million tonnes were in line with the previous quarter. Open pit mining continued in Phase 9 of the Minifie pit with a higher waste-to-ore ratio than the previous quarter. The proportion of ore feed to the processing plant sourced from existing stockpiles of around 83% was lower than the previous quarter.
All-In Sustaining Cost of A$1,313 per ounce was 2% lower than the March 2014 quarter with lower site operating costs and production stripping per ounce partly offset by higher sustaining capital expenditure per ounce.
In the context of unit cost improvement achieved elsewhere in the Group, the unit cost performance of Lihir in the June quarter and the 2014 financial year was disappointing. The Company has a major review underway to identify and accelerate initiatives to improve Lihir’s operating and financial performance. This includes an embedded improvement team to assist the recently appointed General Manager of Lihir, Mr Craig Jetson, and Executive General Manager responsible for Lihir, Mr David Woodall, as Newcrest seeks to improve performance and realise the potential of the asset.
The review of the Lihir landowner agreements has temporarily stopped. Currently, and while local elections for landowner representatives are underway, the Government (Mineral Resources Authority) is also working with stakeholders over matters relating to landowner representation, process and timing for the resumption of the review. Processes are in place to minimize the impact of any potential business interruption that may occur.
Telfer, Australia Telfer’s June 2014 quarter production was 128,372 ounces of gold and 6,501 tonnes of copper with an All-In Sustaining Cost of A$945 (US$881) per ounce. This compares with the March 2014 quarter performance of 127,489 ounces of gold and 7,168 tonnes of copper with an All-In Sustaining Cost of A$875 (US$784) per ounce.
Gold production was in line with the previous quarter, with the effect of lower mill throughput offset by marginally higher gold recoveries. Gold feed grades were broadly in line with the prior quarter. Copper production was 9% lower than the March 2014 quarter due to lower mill throughput and lower copper grade.
All-In Sustaining Cost of A$945 per ounce was 8% higher than the March 2014 quarter primarily due to higher sustaining capital expenditure in the current period, and lower copper production and prices.
Gosowong, Indonesia Gosowong’s June 2014 quarter production was 124,967 ounces of gold and 220,583 ounces of silver with an All-In Sustaining Cost of A$560 (US$522) per ounce. This compares with the March 2014 quarter performance of 70,562 ounces of gold and 66,005 ounces of silver with an All-In Sustaining Cost of A$846 (US$758) per ounce.
Gold production was 77% higher than the previous quarter primarily due to a 70% increase in gold grade to around 19 grams per tonne associated with mining in higher grade zones at both the Toguraci and Kencana underground mines during the quarter. Mill throughput was 6% higher than the previous quarter while gold recoveries were marginally lower. Gold grades are expected to vary from quarter to quarter depending on the stope sequencing.
All-In Sustaining Cost of A$560 per ounce was 34% lower than the March 2014 quarter primarily as a result of higher gold feed grades and lower sustaining capital expenditure in the current quarter.
Hidden Valley, PNG (50%) Hidden Valley’s June 2014 quarter production was 29,886 ounces of gold and 200,537 ounces of silver with an All-In Sustaining Cost of A$1,191 (US$1,110) per ounce of gold. This compares with the March 2014 quarter performance of 26,241 ounces of gold and 248,602 ounces of silver with an All-In Sustaining Cost of A$1,217 (US$1,091) per ounce of gold.
Gold production was 14% higher than the previous quarter due to a 12% increase in mill throughput and higher gold feed grades, partly offset by lower gold recoveries. Silver production was 19% lower than the previous quarter due to a higher proportion of ore feed sourced from the Hamata pit which has a lower silver grade than the Hidden Valley pit.
5 Newcrest Mining - Quarterly Report to 30 June 2014
All-In Sustaining Cost of A$1,191 per ounce was 2% lower than the March 2014 quarter due to declining site operating costs and reduced production stripping activity, partly offset by higher sustaining capital expenditure in the quarter and lower silver by-product credits.
Bonikro, Côte d’Ivoire Bonikro’s June 2014 quarter production was 24,859 ounces of gold with an All-In Sustaining Cost of A$973 (US$907) per ounce. This compares with the March 2014 quarter performance of 29,694 ounces of gold with an All-In Sustaining Cost of A$1,020 (US$914) per ounce.
Gold production was 16% lower than the previous quarter primarily due to a decline in gold grade and reduced mill throughput due to increased maintenance activity. Gold recoveries were broadly consistent with the previous quarter.
All-In Sustaining Cost per ounce decreased by 5% during the June 2014 quarter to A$973 per ounce primarily due to higher sales volume in the quarter.
Project Development
Cadia East Development of Cadia East Panel Cave 2 continued during the quarter with the on-going expansion of the undercut and extraction levels. Production drilling and blasting of the undercut and draw bells continued growing the footprint.
The Panel Cave 2 West Crusher and associated materials handling systems successfully ramped up to deliver cave production during the quarter. The excavation work for Panel Cave 2 East Crusher and infrastructure continued, with procurement well advanced and all engineering complete.
The final ventilation rise raise bore hole for the project was completed during the quarter, completing the long term ventilation circuit infrastructure.
Panel Cave 2 is expected to achieve commercial production around the middle of the 2015 financial year.
Wafi-Golpu, PNG (50%) Study work during the quarter continued to evaluate underground access options and a substantially lower capital expenditure development option for Wafi-Golpu. An updated pre-feasibility study is expected to be completed by the end of the 2014 calendar year.

6 Newcrest Mining - Quarterly Report to 30 June 2014
Exploration Exploration programs continued during the quarter around the company’s mining operations, development projects, and greenfield discovery prospects with six drill rigs in operation.
Morobe Mining Joint Ventures, PNG (50%) The current phase of Golpu resource definition drilling has been completed and final results have been incorporated into resource planning models to assist with on-going studies.
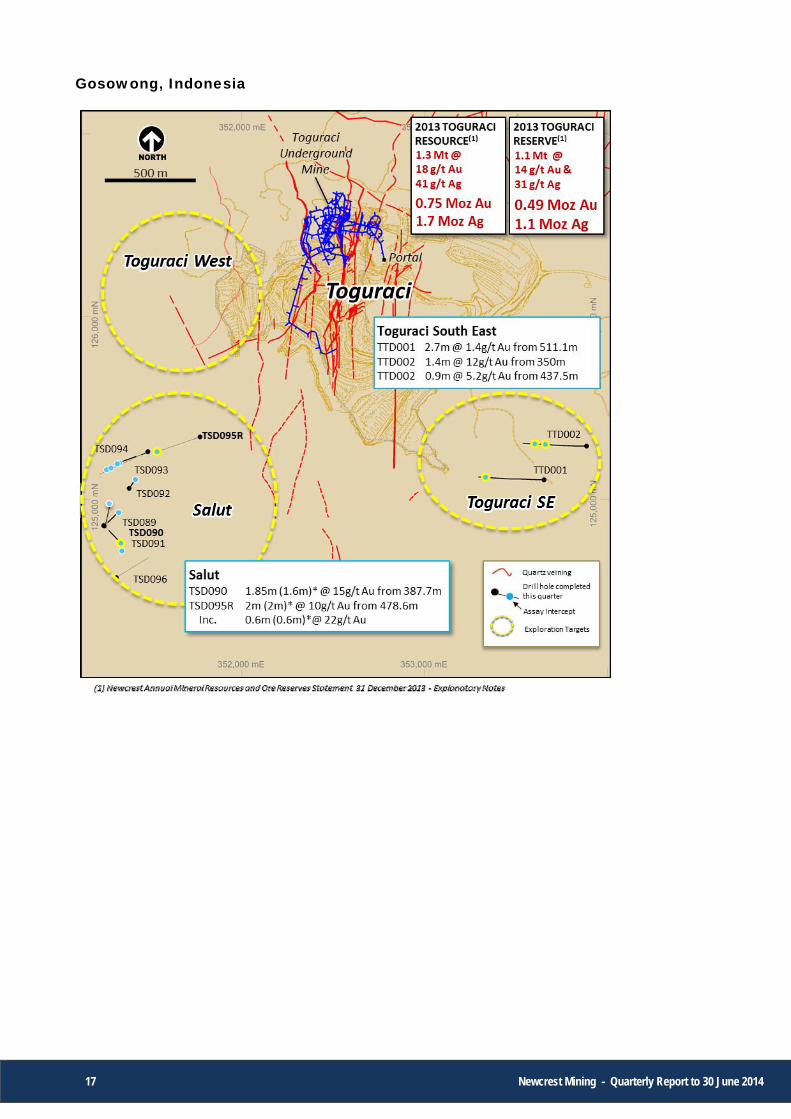
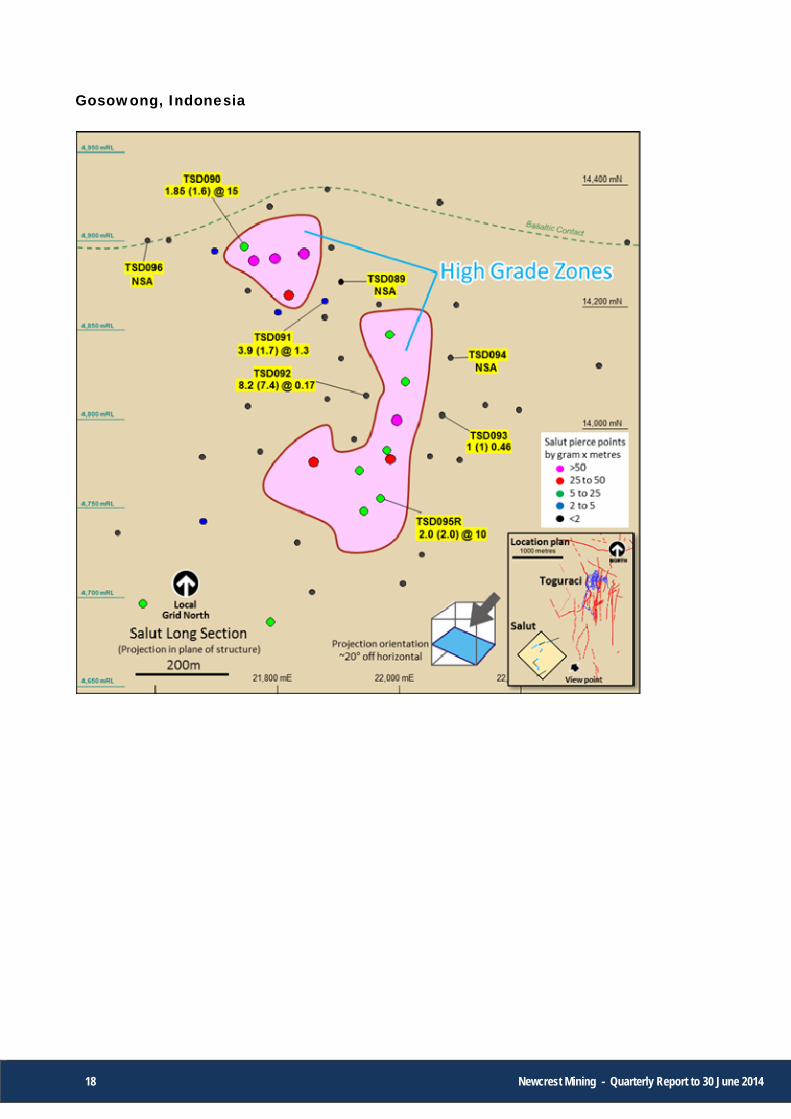
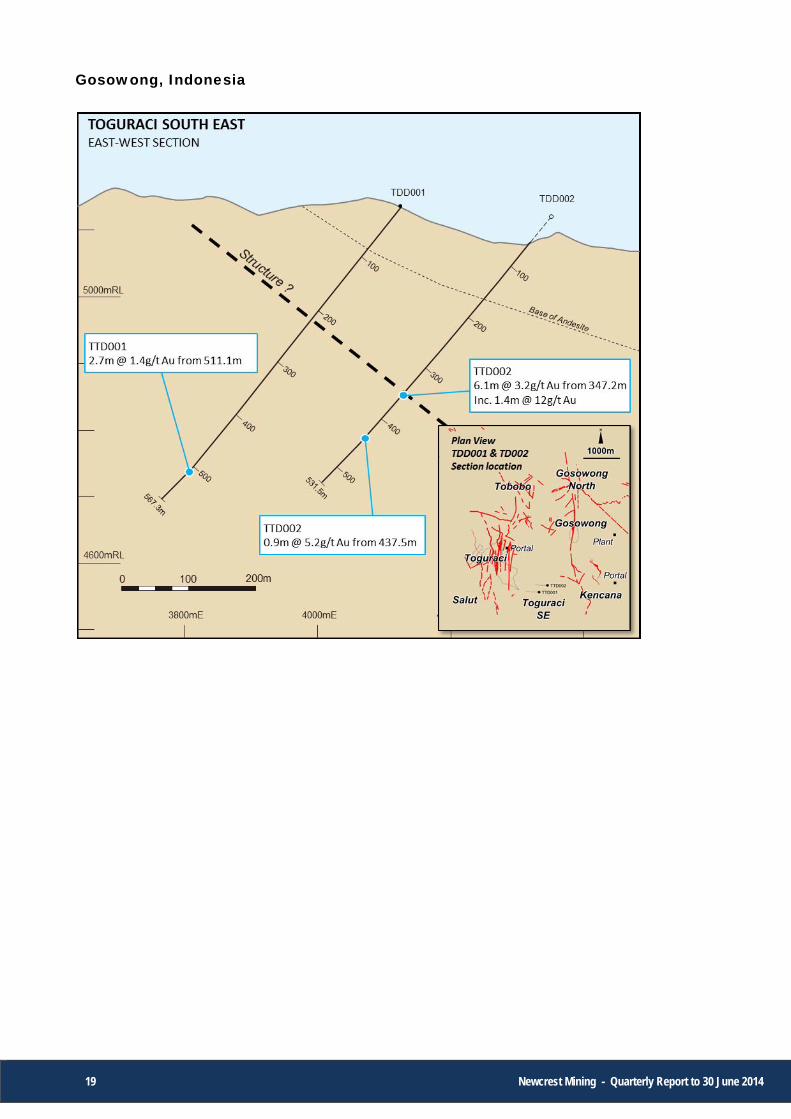
Gosowong, Indonesia The search for new discoveries around existing operations continued within the Toguraci area which contains a number of exploration targets including the Salut Vein, Toguraci South East and Toguraci West.
At Salut, drilling to define the extent of high-grade mineralisation and test new targets within the vicinity of the vein continued with seven holes completed during the quarter. Significant results include:
TSD090 1.85m (1.6m)* @ 15g/t Au from 387.7m;
TSD095R 2m (2m)* @ 10g/t Au from 478.6m, including 0.6m (0.6m)* @ 22g/t Au from 480m.
At Toguraci South East, situated 1.2km southeast of the Toguraci Operation, initial drilling has returned an encouraging result of 1.4m @ 12g/t Au from 350m in hole TTD002. Follow up drilling has commenced.
* denotes true width
Bonikro, Côte d’Ivoire At Bonikro, the next phase drilling program designed to test for additional high grade mineralisation within the vicinity of the Hiré resource commenced during the quarter.
Exploration of regional tenements continued to focus on target generation with stream sediment sampling, mapping and data compilation activities undertaken to assist with prospect prioritisation for follow-up work.
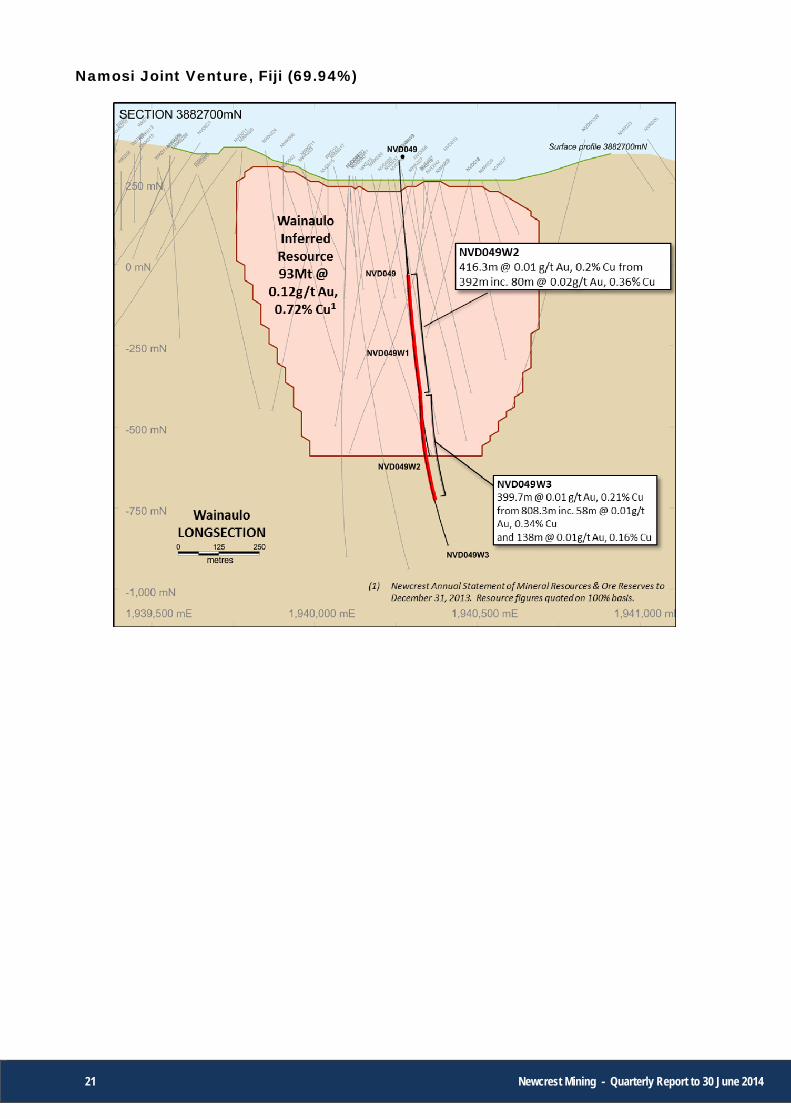
Namosi Joint Venture, Fiji (69.94%) The current phase drilling program in the Waivaka Corridor, designed to test for high grade extensions to the Wainaulo resource, was completed during the quarter. Drill results indicated that the Wainaulo high grade mineralisation is discontinuous along strike.
Further information Refer to the appendix to this release for further details on exploration activities during the period including JORC 2012 Appendix 1 – Drill Hole Data. This information is also available on Newcrest’s website at www.newcrest.com.au, and at www.sedar.com.

7 Newcrest Mining - Quarterly Report to 30 June 2014
Group Free cash flow Subject to finalisation of Newcrest’s audited financial statements for the year ended 30 June 2014, Group free cash flow for the 2014 financial year is expected to be approximately A$130 million. This is calculated as cash flow from operating activities less cash flow related to investing activities, and is after all capital expenditure, exploration and corporate costs (including interest and tax).
Expected asset impairment The Company is conducting its carrying value review of all assets as at 30 June 2014 in accordance with its usual policy and processes, including an assessment of the reasonableness of all physical, cost and economic assumptions used in these valuations.
The assessment of carrying values remains work in progress and is incomplete. While no decision has been made, the Board considers it likely that its review will indicate an impairment of the carrying value of assets in the range of A$1.5 billion to A$2.5 billion after tax, primarily in relation to Lihir but also at Telfer and Bonikro.
Refer the separate announcement on this today.
Executive Management changes As foreshadowed in the Company’s 23 April 2014 announcement, Sandeep Biswas succeeded Greg Robinson as Newcrest’s Managing Director and Chief Executive Officer with effect from 4 July 2014.
Mr Biswas announced the composition of the Company’s new, smaller executive leadership team on 10 July 2014, which included the appointment of Jane Thomas to the position of Executive General Manager Human Resources and Communications. Jane will join the Company after completing her notice period with her current employer.
ASIC investigation As announced by the Company on 2 July 2014, the Federal Court of Australia made a declaration of two contraventions of the continuous disclosure provisions of the Corporations Act by Newcrest and imposed an aggregate penalty of $1.2 million for the contraventions. In making its determination, the Court took into consideration the Agreed Statement of Facts and Admissions agreed between Newcrest and the Australian Securities and Investments Commission (ASIC) and the Joint Submissions, following the conclusion of ASIC’s investigation into Newcrest’s conduct leading up to its ASX announcement on 7 June 20136.
Class action As announced by the Company on 22 July 2014, Slater & Gordon Lawyers has commenced a representative proceeding in the Federal Court of Australia against Newcrest in relation to Newcrest’s market disclosure prior to Newcrest’s 7 June 2013 market release. The proceeding raises issues beyond the subject matter of the ASIC settlement referred to in Newcrest’s 28 June 2014 announcement. Newcrest intends to vigorously defend the proceedings. Sandeep Biswas Managing Director and Chief Executive Officer (6) Newcrest’s 7th June 2013 announcement related to the completion by Newcrest of a business and budget review and included, among other things, production and capital expenditure guidance in relation to Newcrest’s 2014 financial year.

8 Newcrest Mining - Quarterly Report to 30 June 2014
Gold Production Summary
Mine
Production (t 000’s) (7)
Tonnes Treated (000’s)
Head Grade
(g/t Au)
Gold Recovery
(%)
Gold Production
(oz)
Gold Sales (oz)
All-In Sustaining
Cost (AUD/oz)
Three months to 30 June 2014
Cadia Hill (stockpile) 0 0 0.00 - 0 0 Ridgeway 2,292 2,358 1.31 86.1 85,316 83,218 Cadia East (8) 2,330 2,292 1.15 81.3 68,734 66,768 Total Cadia Valley 4,622 4,650 1.23 83.9 154,050 149,986 326 Telfer Open Pit 6,479 3,711 0.70 79.9 67,760 Telfer Underground 1,384 1,293 1.48 87.5 54,699 Telfer Dump Leach 5,913 Total Telfer 7,863 5,004 0.90 83.1 128,372 142,669 945 Lihir 2,781 2,425 2.69 83.1 174,601 158,493 1,313 Gosowong 253 216 18.87 96.2 124,967 103,809 560 Hidden Valley (50%) 2,405 525 2.05 87.6 29,886 26,275 1,191 Bonikro 2,217 480 1.61 88.5 24,859 36,802 973 Total 20,141 13,300 1.71 86.1 636,736 618,034 913 Twelve Months to 30 June 2014
Cadia Hill (stockpile) 0 3,429 0.36 53.7 21,142 17,129 Ridgeway 8,611 8,660 1.47 84.3 345,364 337,984 Cadia East (8) 8,281 7,935 1.08 82.3 226,326 218,492 Total Cadia 16,893 20,024 1.12 81.9 592,832 573,605 326 Telfer Open Pit 32,501 16,238 0.73 77.1 293,155 Telfer Underground 5,221 5,056 1.47 87.8 209,821 Telfer Dump Leach 33,365 Total Telfer 37,723 21,294 0.90 81.2 536,342 539,672 1,005 Lihir 16,166 10,057 2.72 81.9 721,264 747,265 1,261 Gosowong 1,042 826 13.50 96.4 344,747 336,059 823 Hidden Valley (50%) 10,754 2,001 1.87 88.2 105,845 104,772 1,402 Bonikro 12,059 1,974 1.62 89.5 94,994 103,790 1,193 Total 94,636 56,176 1.55 84.2 2,396,023 2,405,163 976
Notes: (7) Mine production for open pit includes ore and waste. Underground includes only ore production. (8) Cadia East includes pre-commissioning and development production of 4,955 ounces and sales of 4,529 ounces of gold in the June 2014
quarter, and includes pre-commissioning and development production of 18,675 ounces and sales of 18,675 ounces of gold in the twelve months ended 30 June 2014.
All figures are 100% unless stated otherwise.

9 Newcrest Mining - Quarterly Report to 30 June 2014
Copper Production Summary
Copper Grade
(%) Copper Recovery
(%)
Concentrate Produced (tonnes)
Metal Production (tonnes)
Three months to 30 June 2014 Cadia Hill (stockpile) 0.00 0.0 0 0
Ridgeway 0.53 89.3 47,760 11,056
Cadia East (9) 0.28 83.0 25,716 5,313
Total Cadia Valley 0.40 87.2 73,476 16,370
Telfer Open Pit 0.09 73.9 17,294 2,551
Telfer Underground 0.34 89.2 26,325 3,950
Total Telfer 0.16 82.5 43,619 6,501
Total 0.28 85.8 117,096 22,871
Twelve months to 30 June 2014
Cadia Hill (stockpile) 0.13 70.4 17,221 3,022
Ridgeway 0.55 88.3 182,718 41,918
Cadia East (9) 0.24 81.9 75,294 15,672
Total Cadia Valley 0.35 85.5 275,233 60,612
Telfer Open Pit 0.09 73.5 85,541 11,296
Telfer Underground 0.34 82.9 84,644 14,210
Total Telfer 0.15 78.5 170,185 25,506
Total 0.25 83.3 445,418 86,118
Notes:
(9) Cadia East includes pre-commissioning and development production of 467 tonnes of copper in the June 2014 quarter, and 1,770 tonnes of copper in the twelve months ended 30 June 2014.
All figures are 100% unless stated otherwise.
Silver Production Summary
Head Grade (g/t)
Silver Recovery (%)
Tonnes Treated (000’s)
Silver Production (oz)
Three months to 30 June 2014 Cadia Valley (10) - - 4,650 127,665 Telfer (10) - - 5,004 100,027 Lihir (10) - - 2,425 12,932 Gosowong 36 87.3 216 220,583 Hidden Valley (50%) 17 71.7 525 200,537 Bonikro (10) - - 480 3,861 Total - - 13,300 665,604 Twelve months to 30 June 2014 Cadia Valley (10) - - 20,024 486,789 Telfer (10) - - 21,294 327,740 Lihir (10) - - 10,057 26,305 Gosowong 21 88.5 826 489,724 Hidden Valley (50%) 22 70.4 2,001 974,846 Bonikro (10) - - 1,974 18,806 Total - - 56,176 2,324,210
Notes: (10) Silver head grade and recovery not currently assayed. All figures are 100% unless stated otherwise.

10 Newcrest Mining - Quarterly Report to 30 June 2014
All-In Sustaining Cost per Ounce of Gold Sold
3 months to 30 June 2014 AUD/oz
12 months to 30 June 2014 AUD/oz
Cadia Valley(11)
Telfer Lihir Gosowong Hidden Valley
Bonikro Corporate
/ Other Group Cadia
Valley(11) Telfer Lihir Gosowong
Hidden Valley
Bonikro Corporate
/ Other Group
Gold Sales (oz) 149,986 142,669 158,493 103,809 26,275 36,802 618,034 573,605 539,672 747,265 336,059 104,772 103,790 2,405,163
On site operating costs (including adjustments to inventory)
742 1,024 911 455 1,074 889 - 826 801 1,022 889 594 1,263 1,008 - 880
Royalties 65 44 27 60 42 42 - 47 62 50 31 60 40 42 - 48
Third party smelting, refining and transport costs
163 157 4 11 33 3 - 80 156 128 4 11 37 5 - 70
By-product credits (785) (417) (1) (39) (161) (2) - (297) (808) (367) (1) (32) (216) (4) - (285)
Adjusted operating costs 184 808 942 486 988 932 - 655 210 834 924 633 1,124 1,051 - 712
Corporate general & administrative costs(12) - - 0 - - - 65 65 - - 5 - - - 44 45
Reclamation and remediation costs 5 10 5 5 15 4 - 6 6 7 4 19 17 8 - 8
Production stripping & underground mine development
- 7 156 - 22 - - 43 - 61 195 - 123 82 - 82
Capital expenditure (sustaining) 137 116 211 67 163 30 8 142 109 95 133 169 135 36 5 125
Exploration (sustaining) 1 3 (1) 1 3 7 - 2 1 6 0 2 2 15 - 3
All-In Sustaining Cost 326 945 1,313 560 1,191 973 72 913 326 1,005 1,261 823 1,402 1,193 49 976
All-In Sustaining Cost in US$ equivalent terms
304 881 1,225 522 1,110 907 67 851 299 923 1,159 756 1,288 1,096 45 897
Note: (11) Cadia Valley includes pre-commissioning and development sales from the Cadia East project of 4,529 ounces of gold and 498 tonnes of copper in the June 2014 quarter, and 18,675 ounces of gold and 1,770 tonnes of
copper in the twelve months ended 30 June 2014. Costs associated with this production are capitalised and are not included in the operating cost calculations throughout this report. (12) Corporate general & administrative costs includes share-based remuneration
All figures are 100%, other than Hidden Valley sales shown at 50%.All-In Sustaining Cost metrics per World Gold Council Guidance Note on Non-GAAP Metrics, released 27 June 2013.
11 Newcrest Mining - Quarterly Report to 30 June 2014
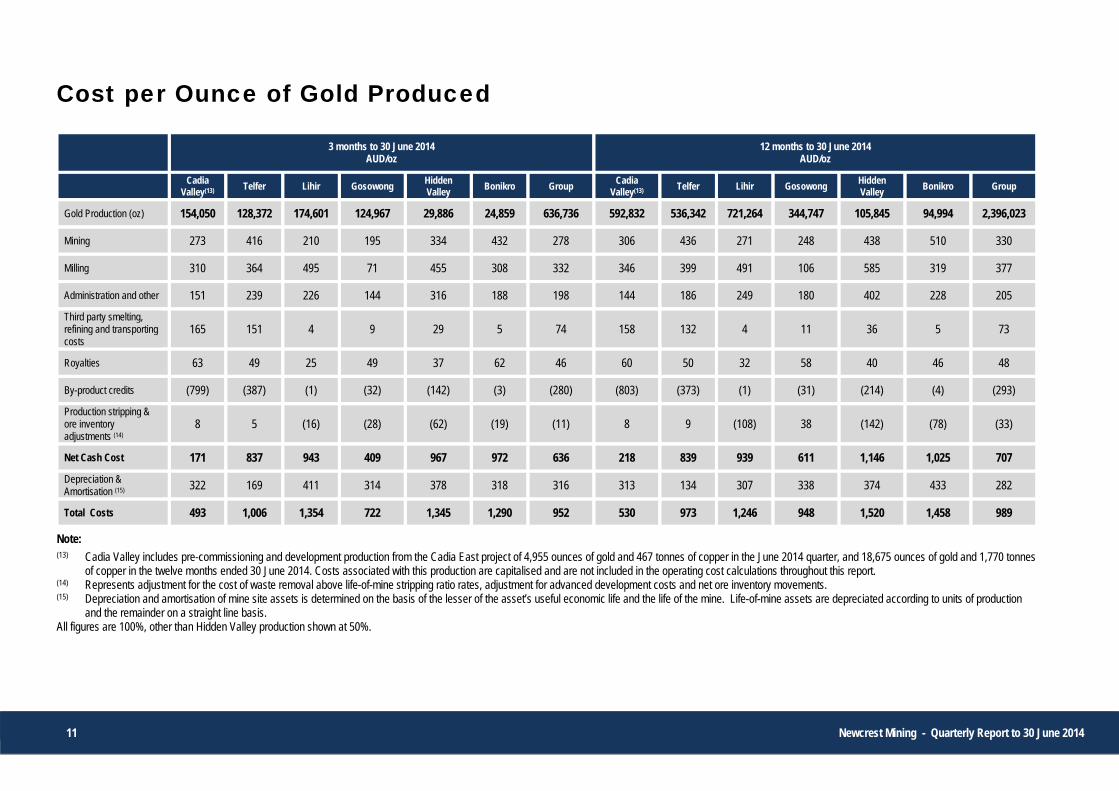
Cost per Ounce of Gold Produced
3 months to 30 June 2014
AUD/oz 12 months to 30 June 2014
AUD/oz
Cadia Valley(13)
Telfer Lihir Gosowong Hidden Valley
Bonikro Group Cadia
Valley(13) Telfer Lihir Gosowong
Hidden Valley
Bonikro Group
Gold Production (oz) 154,050 128,372 174,601 124,967 29,886 24,859 636,736 592,832 536,342 721,264 344,747 105,845 94,994 2,396,023
Mining 273 416 210 195 334 432 278 306 436 271 248 438 510 330
Milling 310 364 495 71 455 308 332 346 399 491 106 585 319 377
Administration and other 151 239 226 144 316 188 198 144 186 249 180 402 228 205
Third party smelting, refining and transporting costs
165 151 4 9 29 5 74 158 132 4 11 36 5 73
Royalties 63 49 25 49 37 62 46 60 50 32 58 40 46 48
By-product credits (799) (387) (1) (32) (142) (3) (280) (803) (373) (1) (31) (214) (4) (293)
Production stripping & ore inventory adjustments (14)
8 5 (16) (28) (62) (19) (11) 8 9 (108) 38 (142) (78) (33)
Net Cash Cost 171 837 943 409 967 972 636 218 839 939 611 1,146 1,025 707
Depreciation & Amortisation (15) 322 169 411 314 378 318 316 313 134 307 338 374 433 282
Total Costs 493 1,006 1,354 722 1,345 1,290 952 530 973 1,246 948 1,520 1,458 989
Note: (13) Cadia Valley includes pre-commissioning and development production from the Cadia East project of 4,955 ounces of gold and 467 tonnes of copper in the June 2014 quarter, and 18,675 ounces of gold and 1,770 tonnes
of copper in the twelve months ended 30 June 2014. Costs associated with this production are capitalised and are not included in the operating cost calculations throughout this report. (14) Represents adjustment for the cost of waste removal above life-of-mine stripping ratio rates, adjustment for advanced development costs and net ore inventory movements. (15) Depreciation and amortisation of mine site assets is determined on the basis of the lesser of the asset’s useful economic life and the life of the mine. Life-of-mine assets are depreciated according to units of production
and the remainder on a straight line basis. All figures are 100%, other than Hidden Valley production shown at 50%.
12 Newcrest Mining - Quarterly Report to 30 June 2014
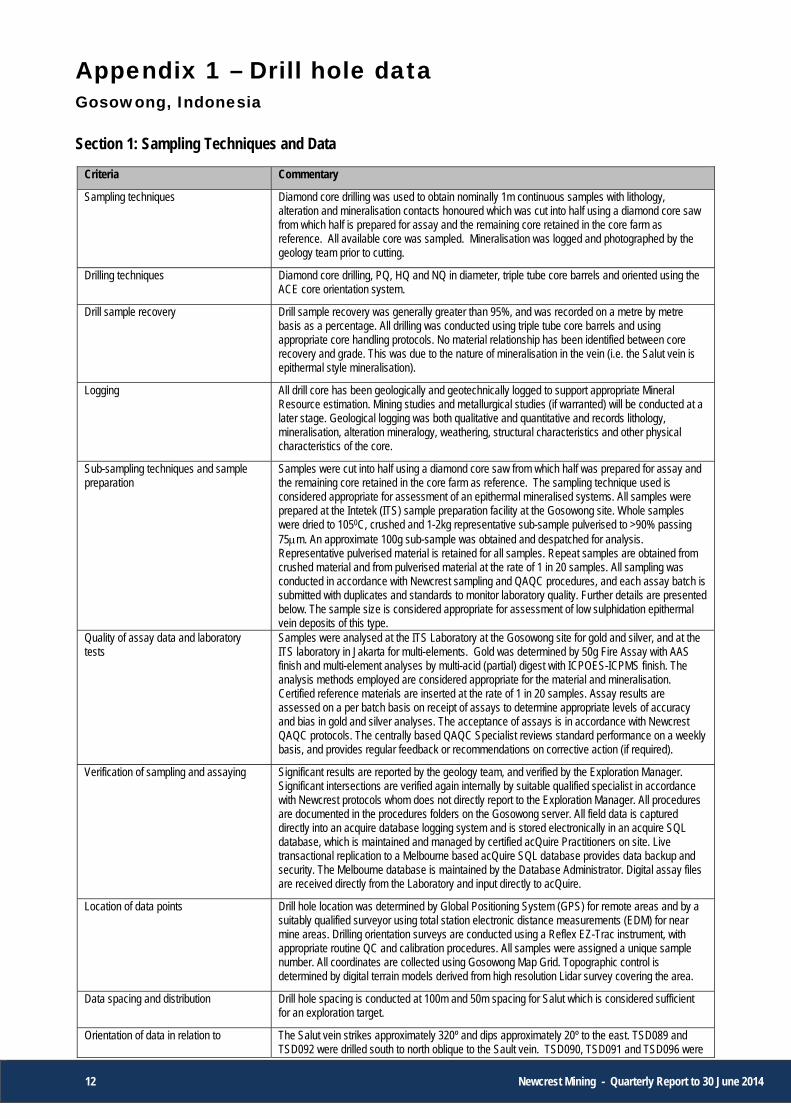
Appendix 1 – Drill hole data Gosowong, Indonesia Section 1: Sampling Techniques and Data
Criteria Commentary
Sampling techniques Diamond core drilling was used to obtain nominally 1m continuous samples with lithology, alteration and mineralisation contacts honoured which was cut into half using a diamond core saw from which half is prepared for assay and the remaining core retained in the core farm as reference. All available core was sampled. Mineralisation was logged and photographed by the geology team prior to cutting.
Drilling techniques Diamond core drilling, PQ, HQ and NQ in diameter, triple tube core barrels and oriented using the ACE core orientation system.
Drill sample recovery Drill sample recovery was generally greater than 95%, and was recorded on a metre by metre basis as a percentage. All drilling was conducted using triple tube core barrels and using appropriate core handling protocols. No material relationship has been identified between core recovery and grade. This was due to the nature of mineralisation in the vein (i.e. the Salut vein is epithermal style mineralisation).
Logging All drill core has been geologically and geotechnically logged to support appropriate Mineral Resource estimation. Mining studies and metallurgical studies (if warranted) will be conducted at a later stage. Geological logging was both qualitative and quantitative and records lithology, mineralisation, alteration mineralogy, weathering, structural characteristics and other physical characteristics of the core.
Sub-sampling techniques and sample preparation
Samples were cut into half using a diamond core saw from which half was prepared for assay and the remaining core retained in the core farm as reference. The sampling technique used is considered appropriate for assessment of an epithermal mineralised systems. All samples were prepared at the Intetek (ITS) sample preparation facility at the Gosowong site. Whole samples were dried to 1050C, crushed and 1-2kg representative sub-sample pulverised to >90% passing 75m. An approximate 100g sub-sample was obtained and despatched for analysis. Representative pulverised material is retained for all samples. Repeat samples are obtained from crushed material and from pulverised material at the rate of 1 in 20 samples. All sampling was conducted in accordance with Newcrest sampling and QAQC procedures, and each assay batch is submitted with duplicates and standards to monitor laboratory quality. Further details are presented below. The sample size is considered appropriate for assessment of low sulphidation epithermal vein deposits of this type.
Quality of assay data and laboratory tests
Samples were analysed at the ITS Laboratory at the Gosowong site for gold and silver, and at the ITS laboratory in Jakarta for multi-elements. Gold was determined by 50g Fire Assay with AAS finish and multi-element analyses by multi-acid (partial) digest with ICPOES-ICPMS finish. The analysis methods employed are considered appropriate for the material and mineralisation. Certified reference materials are inserted at the rate of 1 in 20 samples. Assay results are assessed on a per batch basis on receipt of assays to determine appropriate levels of accuracy and bias in gold and silver analyses. The acceptance of assays is in accordance with Newcrest QAQC protocols. The centrally based QAQC Specialist reviews standard performance on a weekly basis, and provides regular feedback or recommendations on corrective action (if required).
Verification of sampling and assaying Significant results are reported by the geology team, and verified by the Exploration Manager. Significant intersections are verified again internally by suitable qualified specialist in accordance with Newcrest protocols whom does not directly report to the Exploration Manager. All procedures are documented in the procedures folders on the Gosowong server. All field data is captured directly into an acquire database logging system and is stored electronically in an acquire SQL database, which is maintained and managed by certified acQuire Practitioners on site. Live transactional replication to a Melbourne based acQuire SQL database provides data backup and security. The Melbourne database is maintained by the Database Administrator. Digital assay files are received directly from the Laboratory and input directly to acQuire.
Location of data points Drill hole location was determined by Global Positioning System (GPS) for remote areas and by a suitably qualified surveyor using total station electronic distance measurements (EDM) for near mine areas. Drilling orientation surveys are conducted using a Reflex EZ-Trac instrument, with appropriate routine QC and calibration procedures. All samples were assigned a unique sample number. All coordinates are collected using Gosowong Map Grid. Topographic control is determined by digital terrain models derived from high resolution Lidar survey covering the area.
Data spacing and distribution Drill hole spacing is conducted at 100m and 50m spacing for Salut which is considered sufficient for an exploration target.
Orientation of data in relation to The Salut vein strikes approximately 320º and dips approximately 20º to the east. TSD089 and TSD092 were drilled south to north oblique to the Sault vein. TSD090, TSD091 and TSD096 were

13 Newcrest Mining - Quarterly Report to 30 June 2014
Criteria Commentary
Geological structure drilled from west to east oblique to the Salut vein. TSD093, TSD094 and TSD095 were drilled from east to west oblique to the Salut vein. TTD001 and TTD002 were drilled from east to west and the orientation of the intercepts is unknown.
Sample security Samples were assigned unique sample numbers. All cut core samples were placed in calico bags clearly marked with their assigned sample number, placed in polyweave sacks, sealed and transported by company transport from the core shed which is fenced and has 24 hour security to the on-site ITS sample preparation and laboratory facility for gold assay which is also fenced and has 24 hour security. Pulps were despatched by the on-site ITS personnel to the Jakarta ITS laboratory facility, for multi-element assay.
Audits or reviews The centrally based QAQC Specialist reviews standard performance on a weekly basis, and provides regular feedback or recommendations on corrective action (if required). Significant intersections are verified again internally by suitable qualified specialist in accordance with Newcrest protocols whom does not directly report to the Exploration Manager.
Section 2: Reporting of Exploration Results Criteria Commentary
Mineral tenement and land tenure status
Contract of Work (COW) held by PT. Nusa Halmahera Minerals. Newcrest holds a 75% interest in PT Nusa Halmahera Minerals with the remaining held by PT. Aneka Tambang. The CoW is located on the Halmahera Island, North Maluku Province of Indonesia and hosts the Gosowong, Toguraci, and Kencana epithermal gold deposits. The current term of the CoW ends in 2029.
Exploration done by other parties Exploration has been conducted by Newcrest and PT. Aneka Tambang in joint venture since mid-1992. Previous exploration activity has been documented by many workers, and notably includes the Directorate of Mineral Resources (SDM); PT. Citra Maluku Mining (CSR); technical cooperation project between the Federal Institute for Geoscience and Natural Resources (Germany) and Directorate of Mineral Resources (Indonesia); and PT. Rio Tinto Betlehem Indonesia (CRA) during their tenure and dating back to the 1975.
Geology The Salut vein deposit lies in the Toguraci mineralisation corridor, which is located 800m SW of the Toguraci Operation. Lithology comprises a Tertiary sequence of volcanic and volcaniclastic rocks of the Gosowong Formation, which has been intruded by dioritic porphyry intrusions. Gold mineralisation is associated with epithermal quartz veins hosted in NW trending structure cross-cutting the basaltic volcanics, andesitic volcanics and diorite.
Drill hole Information The approximate extent of the Salut vein defined by previous drilling is 1000m long and 250m vertically. The Salut vein strikes approximately 320º and dips approximately 20º to the east. Drilling is at a nominal drill spacing of 100x100m. The location of individual drill holes are contained in the intercepts table.
Data aggregation methods Intercepts reported are intervals of Au >1g/t with up to 2m of internal dilution. Where no individual intercepts >1g/t Au exist, the intercepts reported are intervals of Au >0.1g/t with up to 2m of internal dilution. Downhole and estimated true thickness are reported to one decimal place. Au and Ag grades are reported to two significant figures. Au, Ag and Cu grades are reported.
Relationship between mineralisation widths and intercept lengths
Down hole lengths are reported. True width, if known, is shown in brackets. The Salut vein strikes approximately 320º and dips approximately 20º to the east. TSD089 and TSD092 were drilled south to north oblique to the Sault vein. TSD090, TSD091 and TSD096 were drilled from west to east oblique to the Salut vein. TSD093, TSD094 and TSD095 were drilled from east to west oblique to the Salut vein. TTD001 and TTD002 were drilled from east to west and the orientation of the intercepts is unknown.
Diagrams Refer to diagrams on pages 18-20.
Balanced reporting 7 diamond holes were completed on the Salut vein during the quarter. All significant intercepts are reported.
Other substantive exploration data Nil.
Further work Drilling is presently ongoing to identify higher grade shoots within Salut and surrounding areas.
14 Newcrest Mining - Quarterly Report to 30 June 2014
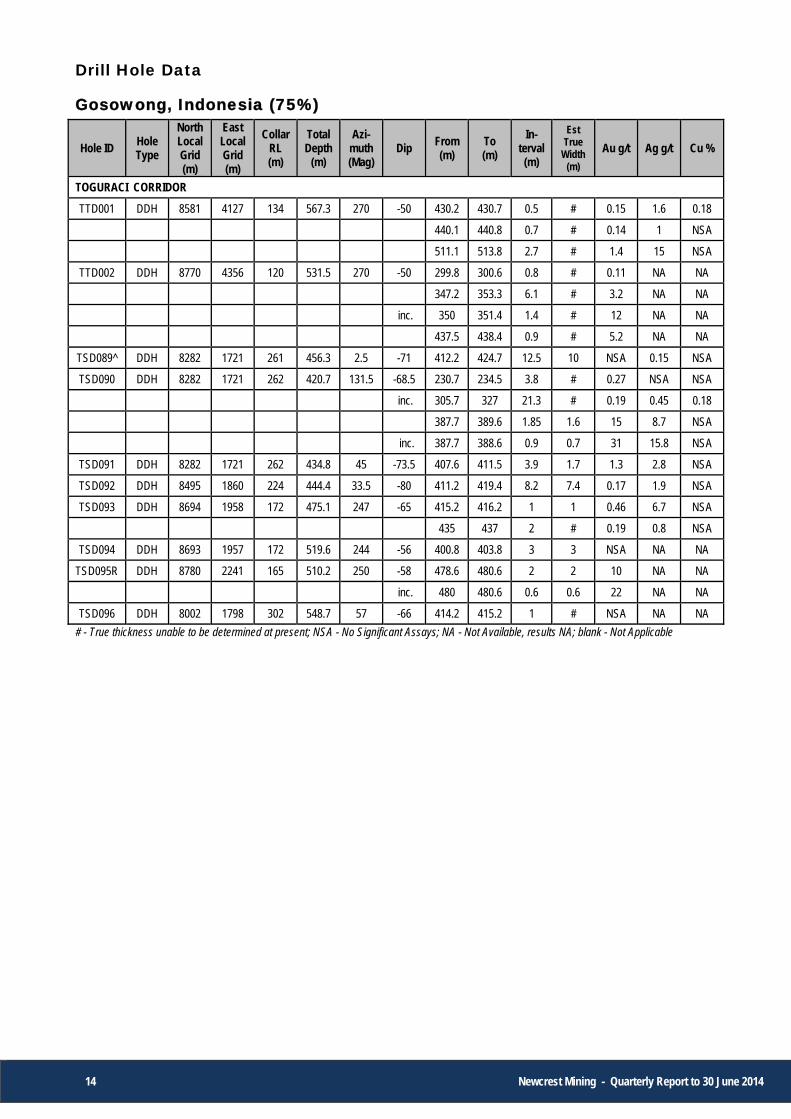
Drill Hole Data
Gosowong, Indonesia (75%)
Hole ID Hole Type
North Local Grid (m)
East Local Grid (m)
Collar RL (m)
Total Depth
(m)
Azi- muth (Mag)
Dip From (m)
To (m)
In- terval (m)
Est True
Width (m)
Au g/t Ag g/t Cu %
TOGURACI CORRIDOR
TTD001 DDH 8581 4127 134 567.3 270 -50 430.2 430.7 0.5 # 0.15 1.6 0.18
440.1 440.8 0.7 # 0.14 1 NSA
511.1 513.8 2.7 # 1.4 15 NSA
TTD002 DDH 8770 4356 120 531.5 270 -50 299.8 300.6 0.8 # 0.11 NA NA
347.2 353.3 6.1 # 3.2 NA NA
inc. 350 351.4 1.4 # 12 NA NA
437.5 438.4 0.9 # 5.2 NA NA
TSD089^ DDH 8282 1721 261 456.3 2.5 -71 412.2 424.7 12.5 10 NSA 0.15 NSA
TSD090 DDH 8282 1721 262 420.7 131.5 -68.5 230.7 234.5 3.8 # 0.27 NSA NSA
inc. 305.7 327 21.3 # 0.19 0.45 0.18
387.7 389.6 1.85 1.6 15 8.7 NSA
inc. 387.7 388.6 0.9 0.7 31 15.8 NSA
TSD091 DDH 8282 1721 262 434.8 45 -73.5 407.6 411.5 3.9 1.7 1.3 2.8 NSA
TSD092 DDH 8495 1860 224 444.4 33.5 -80 411.2 419.4 8.2 7.4 0.17 1.9 NSA
TSD093 DDH 8694 1958 172 475.1 247 -65 415.2 416.2 1 1 0.46 6.7 NSA
435 437 2 # 0.19 0.8 NSA
TSD094 DDH 8693 1957 172 519.6 244 -56 400.8 403.8 3 3 NSA NA NA
TSD095R DDH 8780 2241 165 510.2 250 -58 478.6 480.6 2 2 10 NA NA
inc. 480 480.6 0.6 0.6 22 NA NA
TSD096 DDH 8002 1798 302 548.7 57 -66 414.2 415.2 1 # NSA NA NA
# - True thickness unable to be determined at present; NSA - No Significant Assays; NA - Not Available, results NA; blank - Not Applicable
15 Newcrest Mining - Quarterly Report to 30 June 2014
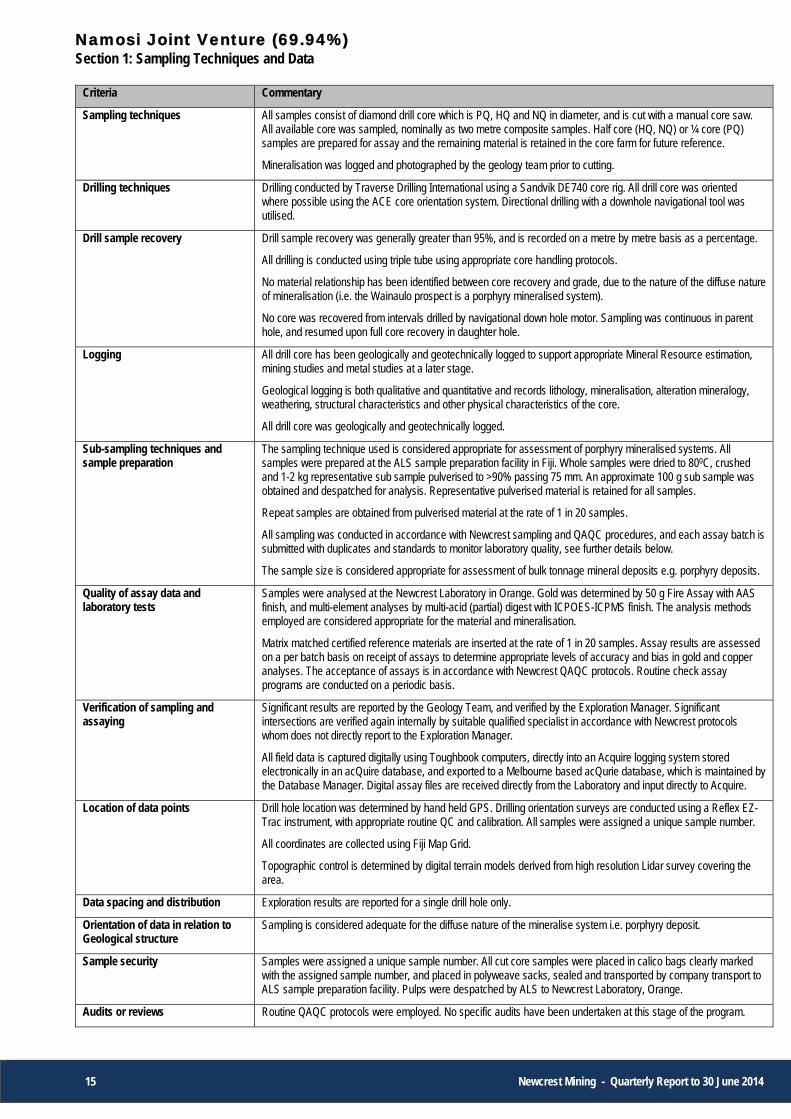
Namosi Joint Venture (69.94%) Section 1: Sampling Techniques and Data
Criteria Commentary
Sampling techniques All samples consist of diamond drill core which is PQ, HQ and NQ in diameter, and is cut with a manual core saw. All available core was sampled, nominally as two metre composite samples. Half core (HQ, NQ) or ¼ core (PQ) samples are prepared for assay and the remaining material is retained in the core farm for future reference.
Mineralisation was logged and photographed by the geology team prior to cutting.
Drilling techniques Drilling conducted by Traverse Drilling International using a Sandvik DE740 core rig. All drill core was oriented where possible using the ACE core orientation system. Directional drilling with a downhole navigational tool was utilised.
Drill sample recovery Drill sample recovery was generally greater than 95%, and is recorded on a metre by metre basis as a percentage.
All drilling is conducted using triple tube using appropriate core handling protocols.
No material relationship has been identified between core recovery and grade, due to the nature of the diffuse nature of mineralisation (i.e. the Wainaulo prospect is a porphyry mineralised system).
No core was recovered from intervals drilled by navigational down hole motor. Sampling was continuous in parent hole, and resumed upon full core recovery in daughter hole.
Logging All drill core has been geologically and geotechnically logged to support appropriate Mineral Resource estimation, mining studies and metal studies at a later stage.
Geological logging is both qualitative and quantitative and records lithology, mineralisation, alteration mineralogy, weathering, structural characteristics and other physical characteristics of the core.
All drill core was geologically and geotechnically logged.
Sub-sampling techniques and sample preparation
The sampling technique used is considered appropriate for assessment of porphyry mineralised systems. All samples were prepared at the ALS sample preparation facility in Fiji. Whole samples were dried to 800C, crushed and 1-2 kg representative sub sample pulverised to >90% passing 75 mm. An approximate 100 g sub sample was obtained and despatched for analysis. Representative pulverised material is retained for all samples.
Repeat samples are obtained from pulverised material at the rate of 1 in 20 samples.
All sampling was conducted in accordance with Newcrest sampling and QAQC procedures, and each assay batch is submitted with duplicates and standards to monitor laboratory quality, see further details below.
The sample size is considered appropriate for assessment of bulk tonnage mineral deposits e.g. porphyry deposits.
Quality of assay data and laboratory tests
Samples were analysed at the Newcrest Laboratory in Orange. Gold was determined by 50 g Fire Assay with AAS finish, and multi-element analyses by multi-acid (partial) digest with ICPOES-ICPMS finish. The analysis methods employed are considered appropriate for the material and mineralisation.
Matrix matched certified reference materials are inserted at the rate of 1 in 20 samples. Assay results are assessed on a per batch basis on receipt of assays to determine appropriate levels of accuracy and bias in gold and copper analyses. The acceptance of assays is in accordance with Newcrest QAQC protocols. Routine check assay programs are conducted on a periodic basis.
Verification of sampling and assaying
Significant results are reported by the Geology Team, and verified by the Exploration Manager. Significant intersections are verified again internally by suitable qualified specialist in accordance with Newcrest protocols whom does not directly report to the Exploration Manager.
All field data is captured digitally using Toughbook computers, directly into an Acquire logging system stored electronically in an acQuire database, and exported to a Melbourne based acQurie database, which is maintained by the Database Manager. Digital assay files are received directly from the Laboratory and input directly to Acquire.
Location of data points Drill hole location was determined by hand held GPS. Drilling orientation surveys are conducted using a Reflex EZ-Trac instrument, with appropriate routine QC and calibration. All samples were assigned a unique sample number.
All coordinates are collected using Fiji Map Grid.
Topographic control is determined by digital terrain models derived from high resolution Lidar survey covering the area.
Data spacing and distribution Exploration results are reported for a single drill hole only.
Orientation of data in relation to Geological structure
Sampling is considered adequate for the diffuse nature of the mineralise system i.e. porphyry deposit.
Sample security Samples were assigned a unique sample number. All cut core samples were placed in calico bags clearly marked with the assigned sample number, and placed in polyweave sacks, sealed and transported by company transport to ALS sample preparation facility. Pulps were despatched by ALS to Newcrest Laboratory, Orange.
Audits or reviews Routine QAQC protocols were employed. No specific audits have been undertaken at this stage of the program.

16 Newcrest Mining - Quarterly Report to 30 June 2014
Section 2: Reporting of Exploration Results
Criteria Commentary
Mineral tenement and land tenure status
Core drilling occurred within SPL1420 Namosi project, which is operated by the Newcrest managed Namosi Joint Venture, of which Newcrest hold a 69.94% equity. The tenement is located within the Namosi Province of Fiji, which hosts the Waisoi Copper-Gold Porphyry, which has been subject to ongoing feasibility studies.
The SPL1420 has been granted for the 5 year period to 31st March, 2015.
Exploration done by other parties
Exploration has been conducted by the Namosi Joint Venture since 2008. Previous exploration activity has been documented by many workers, and notably includes Nittetsu, Placer, WMC, Amax/CRA during their tenure and dating back to the 1970’s.
Geology The Wainaulo Deposit lies in the Waivaka Corridor, which is a 5 km long east-north-east trending zone of porphyry related mineralisation, and comprises a Tertiary sequence of volcanic and volcaniclastic rocks of the Medrasucu Group, which has been intruded dioritic porphyry intrusions. Copper and gold mineralisation is hosted in and adjacent to porphyry intrusions, and is dominated by vein-hosted and lesser fracture fill and disseminated styles. Bornite and chalcopyrite are the dominant copper sulphides observed in fresh rock.
Drill hole Information The approximate extents of the mineralised system defined by previous drilling (based on the first occurrence of copper sulphides) is 600 m wide, 970 m long and over 1000 m vertically (and open at depth). A Mineral Resource was estimated in 2010. Subsequent material drilling information and exploration results have been reported in subsequent Newcrest reports.
Data aggregation methods Intercepts reported are Cu >0.1% with up to 10m intervals of <0.1% Cu included. Also highlighted are intervals of Cu >0.3% with intervals of <0.3% Cu up to 10m included, and high grade intervals of 10 m or greater of Cu >1.0%. Au and Cu grades reported to two significant figures.
Several wedges/daughter holes were required to enable the hole to reach target. The NVD049W2 intercept and NVD049W3 intercept are not reported together as no core was recovered from an initial interval drilled by a navigational down hole motor in NVD049W3. As a result the NVD049W2 intercept terminates at the depth at which NVD049W3 samples start to maintain a continuous interval of samples.
Relationship between mineralisation widths and intercept lengths
Down hole lengths are reported. True width is not known.
Diagrams Refer diagrams on page 21 – 22.
Balanced reporting No drill holes completed in the quarter.
Other substantive exploration data
Nil.
Further work Continued depth and lateral extensions to test for higher grade about the existing Wainaulo Resource.
Drillhole Data
Namosi Joint Venture, Fiji (69.94%)
Hole ID
Hole Northing Easting RL Total Depth
(m)
Azimuth FMG grid
Dip From (m)
To (m) Interval
(m) Au g/t Cu %
Type FMG
grid (m) FMG
grid (m) (m)
NVD049W2 DDH 3882230 1940259 319 1400 7.7 -61.2 392 808.3 416.3 0.01 0.2
inc. 648 728 80 0.02 0.36
NVD049W3 DDH 3882230 1940259 319 1400 7.7 -61.2 808.3 1208 399.7 0.01 0.21
inc. 1114 1172 58 0.01 0.34
1234 1372 138 0.01 0.16
17 Newcrest Mining - Quarterly Report to 30 June 2014
Gosowong, Indonesia
18 Newcrest Mining - Quarterly Report to 30 June 2014
Gosowong, Indonesia
19 Newcrest Mining - Quarterly Report to 30 June 2014
Gosowong, Indonesia

20 Newcrest Mining - Quarterly Report to 30 June 2014
Namosi Joint Venture, Fiji (69.94%)
21 Newcrest Mining - Quarterly Report to 30 June 2014
Namosi Joint Venture, Fiji (69.94%)

22 Newcrest Mining - Quarterly Report to 30 June 2014
Corporate Information Board Members Peter Hay Non-Executive Chairman Sandeep Biswas Managing Director and CEO Gerard Bond Finance Director and CFO Philip Aiken Non-Executive Director Vince Gauci Non-Executive Director Winifred Kamit Non-Executive Director Richard Knight Non-Executive Director Rick Lee Non-Executive Director Tim Poole Non-Executive Director John Spark Non-Executive Director
Francesca Lee Company Secretary
Registered & Principal Office Level 9, 600 St Kilda Road, Melbourne, Victoria, Australia 3004 Telephone: +61 (0)3 9522 5333 Facsimile: +61 (0)3 9525 2996 Email: [email protected] Website: www.newcrest.com.au
Stock Exchange Listings Australian Stock Exchange (Ticker NCM) New York ADR’s (Ticker NCMGY) Port Moresby Stock Exchange (Ticker NCM)
Forward Shareholder Enquiries to Link Market Services Level 1, 333 Collins Street Melbourne, Victoria, 3000 Australia Telephone: 1300 554 474 +61 (0)2 8280 7111 Facsimile: +61 (0)2 9287 0303 Email: [email protected] Website: www.linkmarketservices.com.au Substantial Shareholder(s) at 30 June 2014 First Eagle Investment Management 9.15% Commonwealth Bank of Australia 9.07% Blackrock 8.95% Van Eck Associates Corporation 5.16% Issued Share Capital At 30 June 2014 issued capital was 766,510,971 ordinary shares. Quarterly Share Price Activity High Low Close A$ A$ A$ Apr – Jun 2014 11.16 9.54 10.52
Forward Looking Statements These materials include forward looking statements. Often, but not always, forward looking statements can generally be identified by the use of forward looking words such as “may”, “will”, “expect”, “intend”, “plan”, “estimate”, “anticipate”, “continue”, and “guidance”, or other similar words and may include, without limitation, statements regarding plans, strategies and objectives of management, anticipated production or construction commencement dates and expected costs or production outputs. Forward looking statements inherently involve known and unknown risks, uncertainties and other factors that may cause the company’s actual results, performance and achievements to differ materially from any future results, performance or achievements. Relevant factors may include, but are not limited to, changes in commodity prices, foreign exchange fluctuations and general economic conditions, increased costs and demand for production inputs, the speculative nature of exploration and project development, including the risks of obtaining necessary licenses and permits and diminishing quantities or grades of reserves, political and social risks, changes to the regulatory framework within which the company operates or may in the future operate, environmental conditions including extreme weather conditions, recruitment and retention of personnel, industrial relations issues and litigation. Forward looking statements are based on the company and its management’s good faith assumptions relating to the financial, market, regulatory and other relevant environments that will exist and affect the company’s business and operations in the future. The company does not give any assurance that the assumptions on which forward looking statements are based will prove to be correct, or that the company’s business or operations will not be affected in any material manner by these or other factors not foreseen or foreseeable by the company or management or beyond the company’s control. Although the company attempts and has attempted to identify factors that would cause actual actions, events or results to differ materially from those disclosed in forward looking statements, there may be other factors that could cause actual results, performance, achievements or events not to be as anticipated, estimated or intended, and many events are beyond the reasonable control of the company. Accordingly, readers are cautioned not to place undue reliance on forward looking statements. Forward looking statements in these materials speak only at the date of issue. Subject to any continuing obligations under applicable law or any relevant stock exchange listing rules, in providing this information the company does not undertake any obligation to publicly update or revise any of the forward looking statements or to advise of any change in events, conditions or circumstances on which any such statement is based. Ore Reserves and Mineral Resources Reporting Requirements As an Australian company with securities listed on the Australian Securities Exchange (“ASX”), Newcrest is subject to Australian disclosure requirements and standards, including the requirements of the Corporations Act and the ASX. Investors should note that it is a requirement of the ASX listing rules that the reporting of ore reserves and mineral resources in Australia comply with the 2012 Edition of the Australasian Code for Reporting of Exploration Results, Mineral Resources and Ore Reserves (the “JORC Code”) and that Newcrest’s ore reserve and mineral resource estimates comply with the JORC Code. Newcrest ceased its listing on the Toronto Stock Exchange (“TSX”) on 4 September 2013, but will remain subject to certain Canadian disclosure requirements and standards until it ceases to be an Ontario Securities Commission registrant. Prior to that, Newcrest will continue, in accordance with the requirements of National Instrument 43-101 - Standards of Disclosure for Mineral Projects of the Canadian Securities Administrators, to report its ore reserves and mineral resources estimates in compliance with the JORC Code, along with a reconciliation to the material differences between the JORC Code and the applicable definitions adopted by the Canadian Institute of Mining, Metallurgy and Petroleum (CIM Definition Standards). In relation to the December 2013 Resources and Reserves Statement, released to the ASX on 14 February 2014, the reconciliation is set out in Newcrest’s Canadian News Release dated 14 February 2014, and is available at www.sedar.com and at Newcrest’s website www.newcrest.com.au. Except as otherwise noted in that document, there are no material differences between the definitions of Measured, Indicated and Inferred Mineral Resources, and Proven and Probable Reserves, under the CIM Definition Standards and the equivalent or corresponding definitions in the JORC Code. Competent Person’s Statement The information in this report that relates to Exploration Targets, Exploration Results, Mineral Resources and Ore Reserves and other scientific and technical information, is based on information compiled by Mr C. Moorhead. Mr Moorhead is the Executive General Manager Minerals and a full-time employee of Newcrest Mining Limited. He is a shareholder in Newcrest Mining Limited and is entitled to participate in Newcrest’s executive equity long term incentive plan, details of which are included in Newcrest’s 2013 Remuneration Report. Ore Reserves growth is one of the performance measures under that plan. He is a Fellow of The Australasian Institute of Mining and Metallurgy. Mr Moorhead has sufficient experience which is relevant to the styles of mineralisation and types of deposits under consideration and to the activity which he is undertaking to qualify as a Competent Person as defined in The JORC Code 2012 and is a Qualified Person within the meaning of National Instrument 43-101 - Standards of Disclosure for Mineral Projects of the Canadian Securities Administrators (“NI 43-101”). Mr Moorhead consents to the inclusion in this report of the matters based on his information in the form and context in which it appears including sampling, analytical and test data underlying the results.
For further information, please contact:
Investor Enquiries Media Enquiries Steve Warner Kerrina Watson T: +61 3 9522 5493 T: +61 3 9522 5593 E: [email protected] E: [email protected]
This information is available on our website at www.newcrest.com.au and www.sedar.com