final for web input-output tables report 2012 · table framework links industries to industries (or...
TRANSCRIPT

National Accounts
Input-output tables
March 2015
Report No.: 04-04-02
Input-output table for South Africa, 2012
The South Africa I know, the home I understand

Input-output table for South Africa, 2012
Pali Lehohla Statistician-General
Report number: 04-04-02 Statistics South Africa March 2015

Statistics South Africa
Input-output table for South Africa, 2012
i
Input-output table for South Africa, 2012 Published by Statistics South Africa, Private Bag X44, Pretoria 0001 © Statistics South Africa, 2015 Users may apply or process this data, provided Statistics South Africa (Stats SA) is acknowledged as the original source of the data; that it is specified that the application and/or analysis is the result of the user's independent processing of the data; and that neither the basic data nor any reprocessed version or application thereof may be sold or offered for sale in any form whatsoever without prior permission from Stats SA. Input-output table for South Africa, 2012/ Statistics South Africa. Pretoria: Statistics South Africa, 2015 Report No.04-04-02 Title continuous in English only ISBN: 978-0-621-42502-4 A complete set of Stats SA publications is available at Stats SA Library and the following libraries:
National Library of South Africa, Pretoria Division National Library of South Africa, Cape Town Division Library of Parliament, Cape Town Bloemfontein Public Library Natal Society Library, Pietermaritzburg Johannesburg Public Library Eastern Cape Library Services, King William's Town Central Regional Library, Polokwane Central Reference Library, Mbombela Central Reference Collection, Kimberley Central Reference Library, Mmabatho
This report is available on the Stats SA website: www.statssa.gov.za Copies are available from: Printing and Distribution, Statistics South Africa Tel: 012 310 8044/310 8161 Fax: 012 321 7381 012 310 2973 Email: [email protected]

Statistics South Africa
Input-output table for South Africa, 2012
ii
Contents
Preface .................................................................................................................................................. v
Chapter 1: Introduction .......................................................................................................................... 1
Chapter 2: Input-output table for South Africa ........................................................................................... 4
Chapter 3: Conclusion and way forward .................................................................................................. 17
Annexure ............................................................................................................................................... 18
Glossary ................................................................................................................................................ 21
Related input-output tables publications ................................................................................................... 24

Statistics South Africa
Input-output table for South Africa, 2012
iii
List of tables Table 1: Industry-by-industry input-output table for South Africa, 2012 (R million) ........................................ 5
Table 2: Industry-by-industry input-output table industry list ........................................................................ 18
Table 3: Industry-by-industry input-output table final demand description .................................................... 20

Statistics South Africa
Input-output table for South Africa, 2012
iv
Abbreviations
CPC Central Product Classification
EU European Union
Eurostat Statistical Office of the European Community
GDP Gross domestic product
GVA Gross value added
I-O tables Input-output tables
ISIC International Standard Industrial Classification of all Economic Activities
nec Not elsewhere classified
nr Number
SIC Standard Industrial Classification of all Economic Activities
SNA The System of National Accounts
Stats SA Statistics South Africa
SU-tables Supply and use tables
VAT Value added tax

Statistics South Africa
Input-output table for South Africa, 2012
v
Preface The input-output table (I-O table) for 2012 was compiled using the new rebased and benchmarked National Accounts (according to the 2008 System of National Accounts (SNA)) that was published in November 2014. This constitutes a break in time series from the previously published I-O tables (2009 to 2011). Statistics South Africa (Stats SA) will compile a new full times series for the I-O tables (2009 to 2014) to be released in March 2016. The I-O table for 2012 provides a symmetric framework, based on the supply and use tables (SU-tables), from which the direct and indirect coefficients can be constructed. It provides an overview of the economy focusing on the inter-relations between industries, represented by a symmetric matrix which contains both supply and use data. The I-O tables for South Africa are compiled and published by Statistics South Africa (Stats SA) according to a framework that was developed based on best practices from other countries and the statistical office of the European Community (Eurostat). The I-O tables were developed to complement the existing SU-tables and to provide a more complete representation of National Accounts data.
PJ Lehohla Statistician-General Pretoria March 2015

Statistics South Africa
Input-output table for South Africa, 2012
1
Chapter 1: Introduction An I-O table is a theoretical framework that focuses on the relationship between industries and their production and use of products. It represents the economy in a matrix form by listing the consuming industries as columns, and the supplying industries as rows1. The I-O table is available separately in Microsoft Excel2 spreadsheets, downloadable from www.statssa.gov.za. It is recommended that the discussion document nr: D0404 is consulted for a better understanding of the development of the I-O tables for South Africa3. SU-tables form part of the National Accounts framework and these tables are regarded as the cornerstone of the System of National Accounts (SNA). SU-tables can be used to compile the gross domestic product (GDP) at both constant and current prices. SU-tables allow for detailed analysis of industries and products, although they use separate classifications for industries and products. The classifications used in the symmetric I-O table must coincide with the classifications used in the SU-tables (however, only one classification form is used for each type of I-O table). The industry-by-industry I-O table will use the industry classification of the country’s SU-tables. In the case of South Africa, this will be the Standard Industrial Classification of all Economic Activities 5th edition (SIC). The industry-by-industry I-O table allows for the analysis of industries within an economy, and shows the dependency of industries in relation to each other. Differences between SU-tables and I-O tables:
• SU-tables are industry-by-product matrices using both industry and product classifications;
• SU-tables are two separate tables, one describing the supply of commodities and the other describing the use of commodities; and
• An I-O table has both supply and use data in a single symmetric industry-by-industry matrix.
1 United Nations – Studies in Methods, Handbook of Input-Output table compilation and analysis, 1999 2 Microsoft Excel 2007 3 The discussion document nr: D0404 can be found on the Stats SA website (www.statssa.gov.za) as well as from the Printing and
Distribution section at Stats SA ([email protected] or 012 310 8044/8161).

Statistics South Africa
Input-output table for South Africa, 2012
2
Stats SA publishes a set of SU-tables annually. These tables are transformed in order to derive the series of I-O tables. The advantages of transforming the existing SU-tables were numerous4, including cost factors, and the success attained by Eurostat countries. For a detailed overview of the methodologies examined in the compilation of the I-O table for South Africa, please refer to the previous publication, published in March 20125. The industry-by-industry I-O tables are regarded as symmetric I-O tables because the row and column totals of each corresponding industry or product6 are equal. This implies that for each industry or product, input must equal output; hence total supply must equal total use. The total output of supply and use will therefore equal those within the existing SU-tables7. In order to transform SU-tables into an I-O table8, certain mathematical assumptions need to be applied to SU-tables data. According to Eurostat, the transformation can be based on four different core assumptions. Two of the assumptions focus on the transformation of SU-tables into an industry-by-industry I-O table, while the other two assumptions focus on transforming SU-tables into a product-by-product I-O table. It is also possible to use a combination of the two industry-based assumptions, or the two product-based assumptions to better fit an economy’s output or production structure. The four core assumptions used by Eurostat are9:
• Product technology assumption Model A – this model assumes that each product is produced in its own specific way, irrespective of the industry where it is produced. Negative values may occur;
• Industry technology assumption Model B – this model assumes that individual industries have unique ways of production, irrespective of any product mix produced. Negative values will not occur;
• Fixed industry-output structure assumption Model C – this model assumes each industry, despite its product mix, has a unique output structure. Negative values may occur; and
• Fixed product-output structure assumption Model D – this model assumes that each product has its own specific output structure, regardless of which industry produces it. Negative values will not occur.
Models A and B are used for the compilation of a product-by-product I-O table. The transformation to an industry-by-industry I-O table is primarily based on the output structure and models C and D are used10. Stats SA used Model C for the compilation of the draft I-O tables for South Africa. The total supply and total use by industry are still the same in the I-O table when compared with the SU-tables. The major conceptual difference between an I-O table and the SU-tables framework is that, within the SU-tables framework, the relationship between industries and products is examined, whereas an I-O table framework links industries to industries (or industry-production output), or in the case of a product-by-product I-O table, it links products to products (examining similar production units)11.
4 Statistics South Africa – The status of input-output tables for South Africa (D0404), March 2012 5 The publication can be found on the Stats SA website: www.statssa.gov.za 6 In the case of a product-by-product I-O table 7 Eurostat – Eurostat Manual of Supply, Use and Input-Output Tables, 2008 8 Either product-by-product or industry-by-industry 9 Eurostat – Eurostat Manual of Supply, Use and Input-Output Tables, 2008 10 Eurostat – Eurostat Manual of Supply, Use and Input-Output Tables, 2008 11 Eurostat – Eurostat Manual of Supply, Use and Input-Output Tables, 2008

Statistics South Africa
Input-output table for South Africa, 2012
3
For a more detailed examination of the mathematical steps for Model C and the other Models, please consult the discussion document published in March 2012 (discussion document nr: D0404). In a real-world scenario, the compilation of an I-O table is made more complex by rectangular SU-tables. In South Africa, the published SU-tables contain 171 industries and 104 products, while the unpublished SU-tables contain 292 industries and 105 products. For the compilation of the I-O tables for South Africa, the SU-tables have been aggregated to 50 industries by 50 products (from the original 292 industries and 105 products). The products are classified according to the Central Product Classification version 2 (CPC), whereas the industries are classified according to SIC (5th edition). South Africa has more industries than products in the current SU-tables and it is therefore necessary for South Africa to assign multiple industries to a single product, or in other words, aggregate the industries until they link to products12. This would reduce the number of industries represented and, in effect, allow products and industries to link directly. Unfortunately, the disadvantage of this would be mixing industry input-output structures and product technologies. Care must be taken when aggregating industries to make sure they are compatible. The annexure in this report contains the current I-O table industry classifications used within the I-O tables for South Africa. These two classifications require certain aggregations to directly link some industries and products, unlike the CPC (version 2) and the International Standard Industrial Classification of all Economic Activities (ISIC), 4th revision. The result is that the 50 industries by 50 products is the most reliable and accurate linking of SIC (5th edition) and CPC (version 2) possible.
12 In order to maintain the most accurate product and industry links some products are aggregated

Statistics South Africa
Input-output table for South Africa, 2012
4
Chapter 2: Input-output table for South Africa The industry-by-industry I-O table13 for South Africa for the reference year 2012 is presented in this report. The I-O tables for South Africa are available freely on the web for download in Microsoft Excel14 spreadsheet format (www.statssa.gov.za). The matrix consists of 50 industries and it is classified according to SIC (5th edition). Each industry is allocated an industry number. The industry number (ranging from 1 to 50) is aimed at making it easy to follow the various industries within the matrix. For a complete list of the industries classified, please see the annexure in this report (the industry descriptions have been shortened in Table 1 to allow for easier viewing). The direct and indirect coefficients included in the Microsoft Excel15 spreadsheets provide a platform for analysis on the I-O tables. The direct impact coefficient demonstrates the distribution of a unit of output between gross value added (GVA) and intermediate consumption. It further demonstrates the distribution of intermediate consumption per industry input and GVA distributed between compensation of employees, taxes, subsidies and gross operating surplus. The advantage of this is that it allows for an examination of the output of industries using fixed ratios, therefore allowing an investigation into relative consumption patterns in intermediate consumption and the distribution of gross value added. The indirect coefficient allows for the analysis of the value added return to any potential investment in a specific or multiple industries. The diagonal of this matrix shows the total value added return a specific industry would yield whereas the off diagonal shows the potential benefits to other industries due to the consumption effect of the increased output of that specific industry. The value added coefficient shows the distribution of input industries that contribute to value added per industry. For analysis using coefficients to be effective there needs to be an assumption of non-restricted or unlimited demand. Demand is not considered in the coefficients, and as such there must be an assumption that demand will always be able to absorb increased supply.
13 At basic prices 14 Microsoft Excel 2007 15 Microsoft Excel 2007

Statistics South Africa
Input-output table for South Africa, 2012
5
Table 1: Industry-by-industry input-output table for South Africa, 2012 (R million)
Industry number Industry description
I1 I2 I3 I4 I5 I6 I7 I8 I9 I10
I1 Agriculture 4 822 505 58 12 5 4 61 466 8 412 4 755 37 I2 Forestry 0 0 0 0 0 0 0 0 0 0 I3 Fishing 0 0 0 0 0 0 2 252 0 0 0 I4 Coal; lignite 21 0 0 9 3 933 615 521 92 218 60 I5 Metal ores 0 0 0 0 0 0 0 0 0 0 I6 Other mining; quarrying 2 174 229 25 168 468 128 355 0 16 0 I7 Food 9 049 947 109 3 0 1 46 333 4 602 25 0 I8 Beverages; tobacco 0 0 0 362 119 127 150 7 718 0 0 I9 Spinning; textiles 1 214 127 15 52 301 68 0 210 5 121 6 152 I10 Knitted fabrics, fur 0 0 0 146 512 126 0 0 44 1 375 I11 Leather; luggage 0 0 0 57 104 18 0 0 38 0 I12 Footwear 0 0 0 34 484 92 0 0 0 1 I13 Wood 737 54 3 96 806 696 2 796 1 863 137 55 I14 Paper 45 20 5 28 193 52 2 465 1 616 172 92 I15 Publishing; printing 8 4 1 4 21 4 51 4 16 5 I16 Coke oven; petroleum 7 616 797 95 773 4 694 765 22 0 0 0 I17 Basic chemicals; nuclear fuel 0 0 0 122 1 492 407 1 762 1 538 1 886 336 I18 Other chemicals 14 233 1 491 172 1 440 8 684 1 712 465 206 423 191 I19 Rubber 320 33 5 632 2 273 399 0 0 11 28 I20 Plastic 254 27 4 137 661 149 3 989 1 751 256 161 I21 Glass; glass products 21 2 0 19 75 15 182 1 760 1 0 I22 Non-metallic minerals 287 32 5 80 315 145 0 0 0 0 I23 Furniture 0 0 0 4 31 6 0 0 0 0 I24 Recycling; nec 0 0 0 27 638 139 40 6 5 6 I25 Basic iron; steel 125 13 0 98 967 229 0 0 107 2 I26 Precious; non-ferrous metals 36 4 0 31 308 97 2 0 68 0 I27 Structural metal products 3 691 380 39 1 228 6 180 1 607 0 27 27 39 I28 General; special machinery 3 401 356 37 2 057 13 088 2 519 0 0 0 0

Statistics South Africa
Input-output table for South Africa, 2012
6
Table 1: Industry-by-industry input-output table for South Africa, 2012 (R million) (continued)
Industry number Industry description
I1 I2 I3 I4 I5 I6 I7 I8 I9 I10
I29 Electrical machinery 195 20 3 666 1 788 382 0 0 6 0 I30 Electronic equipment 0 0 0 248 484 88 0 0 0 0 I31 Medical; other appliances 0 0 0 10 44 10 0 0 0 0 I32 Motor vehicles; coachwork 2 190 229 26 1 024 3 533 680 388 102 25 27 I33 Electricity, gas; hot water 3 296 346 39 1 666 18 716 1 286 2 360 247 500 183 I34 Distribution of water 602 64 8 471 4 531 431 283 1 066 27 13 I35 Construction 67 7 1 79 483 33 118 55 4 22 I36 Trade 11 379 1 191 138 2 054 10 171 2 208 18 531 6 514 2 879 2 437 I37 Hotels; restaurants 7 0 0 56 166 29 100 47 15 13 I38 Transport 15 564 1 629 188 18 722 22 141 7 296 10 937 2 468 911 623 I39 Post; Telecommunications 167 16 0 222 939 217 828 261 247 357 I40 Financial intermediation 4 613 150 417 1 096 1 680 2 718 988 294 258 380 I41 Insurance; pension funding 2 746 288 33 347 985 216 494 117 103 90 I42 Auxiliary financial 0 0 0 1 369 4 060 2 707 0 0 0 0 I43 Real estate activities 58 6 0 42 1 307 231 1 891 477 329 295 I44 Renting of machinery 0 0 0 0 0 0 421 55 24 17 I45 Research; development 0 0 0 0 0 0 0 0 0 0 I46 Business; computer activities 298 30 4 917 6 572 410 7 090 1 750 406 268 I47 Other community activities 0 0 0 0 0 0 0 0 0 0 I48 Education 0 0 0 0 36 6 168 87 19 18 I49 Health; social work 4 125 431 50 0 0 0 0 0 0 0 I50 Other services; nec 2 324 244 27 1 871 9 568 988 10 198 6 542 1 928 1 250 Total 95 685 9 669 1 505 38 926 133 554 30 058 177 648 49 889 21 006 14 535 Net taxes on products 3 087 327 35 691 3 317 583 2 032 4 074 1 120 1 481 Gross value added 59 213 7 551 2 943 66 557 167 507 36 252 64 111 28 912 4 337 4 969 Compensation of employees 18 197 2 286 1 138 17 447 78 317 13 296 35 097 12 874 3 443 4 822 Other taxes less subsidies (38) 148 18 623 1 499 279 202 469 58 91 Gross operating surplus 41 054 5 117 1 788 48 486 87 691 22 677 28 812 15 569 836 55 Total output 157 985 17 546 4 484 106 174 304 377 66 893 243 790 82 874 26 462 20 984

Statistics South Africa
Input-output table for South Africa, 2012
7
Table 1: Industry-by-industry input-output table for South Africa, 2012 (R million) (continued)
Industry number Industry description
I11 I12 I13 I14 I15 I16 I17 I18 I19 I20
I1 Agriculture 3 550 802 26 120 62 147 102 671 927 10 I2 Forestry 0 0 5 217 6 460 60 0 0 24 21 0 I3 Fishing 0 0 0 0 0 0 0 0 0 0 I4 Coal; lignite 4 1 151 2 808 22 10 428 311 89 58 10 I5 Metal ores 0 0 14 0 0 14 0 0 0 0 I6 Other mining; quarrying 0 0 400 2 234 72 587 5 180 2 737 0 408 I7 Food 1 0 2 286 0 0 671 2 661 0 0 I8 Beverages; tobacco 0 0 0 0 0 0 0 0 0 0 I9 Spinning; textiles 16 287 49 501 343 31 0 559 701 2 I10 Knitted fabrics, fur 0 0 0 0 0 0 0 0 0 0 I11 Leather; luggage 219 1 311 0 38 2 0 0 0 0 0 I12 Footwear 2 590 0 0 0 0 0 0 0 0 I13 Wood 5 43 7 343 1 238 68 881 318 1 829 12 65 I14 Paper 9 74 299 14 740 6 690 157 196 2 503 14 189 I15 Publishing; printing 0 3 8 119 1 617 10 7 80 3 20 I16 Coke oven; petroleum 0 0 17 246 28 765 3 039 936 173 36 I17 Basic chemicals; nuclear fuel 191 515 345 3 478 180 2 970 38 924 17 200 4 383 9 609 I18 Other chemicals 29 33 512 1 797 1 561 85 1 681 12 125 848 536 I19 Rubber 1 289 82 1 26 0 33 0 518 99 I20 Plastic 20 51 381 154 209 180 289 2 890 142 1 027 I21 Glass; glass products 0 0 79 0 15 5 6 817 0 4 I22 Non-metallic minerals 0 0 29 19 1 73 0 82 0 10 I23 Furniture 0 0 0 2 0 0 0 0 0 0 I24 Recycling; nec 1 2 57 13 235 5 39 39 3 10 I25 Basic iron; steel 2 19 311 0 2 129 139 143 325 94 I26 Precious; non-ferrous metals 0 0 112 84 107 266 13 156 0 28 I27 Structural metal products 72 78 401 66 272 0 814 40 144 507 I28 General; special machinery 0 0 37 0 0 0 2 0 0 5

Statistics South Africa
Input-output table for South Africa, 2012
8
Table 1: Industry-by-industry input-output table for South Africa, 2012 (R million) (continued)
Industry number Industry description
I11 I12 I13 I14 I15 I16 I17 I18 I19 I20
I29 Electrical machinery 0 0 0 0 0 0 2 0 0 0 I30 Electronic equipment 0 0 0 0 425 0 27 0 0 0 I31 Medical; other appliances 0 0 0 0 0 0 0 2 0 0 I32 Motor vehicles; coachwork 3 9 123 68 80 69 62 185 16 48 I33 Electricity, gas; hot water 23 46 447 1 270 198 948 8 344 3 660 218 309 I34 Distribution of water 2 4 27 61 14 77 99 55 16 22 I35 Construction 1 16 46 11 274 716 79 22 2 17 I36 Trade 437 755 2 172 5 822 3 198 6 355 9 762 10 184 1 691 2 722 I37 Hotels; restaurants 3 6 34 45 81 45 72 99 14 111 I38 Transport 150 378 2 277 2 890 1 790 3 530 3 463 6 175 627 1 085 I39 Post; Telecommunications 27 122 330 325 948 68 579 692 99 250 I40 Financial intermediation 73 93 369 137 401 102 155 1 121 114 283 I41 Insurance; pension funding 12 29 188 186 151 163 239 285 49 113 I42 Auxiliary financial 0 0 0 0 0 0 0 0 0 0 I43 Real estate activities 33 114 438 582 771 236 507 855 164 450 I44 Renting of machinery 2 5 32 326 73 39 82 109 24 18 I45 Research; development 0 0 0 0 0 0 0 0 0 0 I46 Business; computer activities 43 120 741 1 059 1 769 976 1 584 7 503 524 370 I47 Other community activities 0 0 0 0 0 0 0 0 0 0 I48 Education 5 5 23 98 61 5 98 164 26 31 I49 Health; social work 0 0 0 0 0 0 0 0 0 0 I50 Other services; nec 281 480 2 033 7 935 4 065 1 870 4 367 6 694 521 1 895 Total 5 217 6 280 25 153 52 988 26 034 103 935 81 289 83 388 12 376 20 392 Net taxes on products 36 820 184 718 346 431 1 333 1 154 293 226 Gross value added 648 1 413 15 874 17 645 12 222 27 726 13 815 23 376 3 604 11 058 Compensation of employees 498 1 309 7 384 7 413 11 796 4 247 9 894 20 464 2 592 10 562 Other taxes less subsidies (4) 51 121 29 232 498 (1 017) 401 11 (40) Gross operating surplus 155 53 8 369 10 202 194 22 982 4 938 2 511 1 001 536 Total output 5 901 8 513 41 211 71 350 38 603 132 092 96 436 107 917 16 274 31 676

Statistics South Africa
Input-output table for South Africa, 2012
9
Table 1: Industry-by-industry input-output table for South Africa, 2012 (R million) (continued)
Industry number Industry description
I21 I22 I23 I24 I25 I26 I27 I28 I29 I30
I1 Agriculture 17 71 25 1 622 9 70 53 136 89 0 I2 Forestry 0 0 281 17 0 0 0 0 0 0 I3 Fishing 0 0 0 98 0 0 0 0 0 0 I4 Coal; lignite 20 1 350 25 11 2 899 17 52 27 15 4 I5 Metal ores 0 0 0 292 38 157 10 525 2 594 2 325 2 601 772 I6 Other mining; quarrying 1 479 12 335 3 3 986 398 127 32 363 0 6 I7 Food 0 0 0 794 0 0 0 15 0 0 I8 Beverages; tobacco 0 0 0 0 0 0 0 0 0 0 I9 Spinning; textiles 0 1 471 309 0 0 15 97 31 43 I10 Knitted fabrics, fur 0 0 0 66 0 0 0 0 0 0 I11 Leather; luggage 0 0 384 21 0 0 0 0 0 0 I12 Footwear 0 0 0 0 0 0 0 0 0 0 I13 Wood 67 582 3 770 145 267 38 446 178 61 98 I14 Paper 37 362 122 491 75 26 89 170 108 40 I15 Publishing; printing 2 6 5 4 8 3 14 22 11 3 I16 Coke oven; petroleum 0 33 0 30 6 981 459 3 24 708 0 I17 Basic chemicals; nuclear fuel 101 329 546 982 1 350 5 436 216 806 1 112 157 I18 Other chemicals 32 625 274 88 644 54 703 244 259 5 I19 Rubber 0 1 50 593 0 0 19 318 4 47 I20 Plastic 78 155 323 512 103 28 80 349 825 74 I21 Glass; glass products 1 877 17 129 8 0 1 1 83 50 1 I22 Non-metallic minerals 0 3 434 14 166 109 9 52 42 23 0 I23 Furniture 0 0 220 0 4 0 0 0 0 0 I24 Recycling; nec 2 15 23 9 223 5 489 543 872 190 80 2 I25 Basic iron; steel 0 115 420 113 13 883 1 223 21 418 12 267 3 431 223 I26 Precious; non-ferrous metals 1 78 298 441 11 975 6 240 8 677 1 126 6 411 24 I27 Structural metal products 0 134 1 425 43 117 0 3 766 2 552 1 543 49 I28 General; special machinery 0 0 3 2 407 0 866 6 327 804 0

Statistics South Africa
Input-output table for South Africa, 2012
10
Table 1: Industry-by-industry input-output table for South Africa, 2012 (R million) (continued)
Industry number Industry description
I21 I22 I23 I24 I25 I26 I27 I28 I29 I30
I29 Electrical machinery 0 0 2 41 22 0 329 4 199 1 906 937 I30 Electronic equipment 0 0 0 35 16 0 117 6 448 5 811 4 261 I31 Medical; other appliances 0 0 0 3 0 0 0 0 0 0 I32 Motor vehicles; coachwork 36 86 31 69 94 19 765 345 259 7 I33 Electricity, gas; hot water 572 924 153 274 6 270 2 238 874 513 286 40 I34 Distribution of water 18 36 10 23 311 162 35 21 21 3 I35 Construction 2 10 2 12 93 43 76 43 13 19 I36 Trade 786 2 761 1 828 3 084 10 772 2 941 9 233 6 733 4 551 670 I37 Hotels; restaurants 9 49 13 36 27 10 66 117 75 17 I38 Transport 322 2 769 1 164 965 5 841 737 2 246 2 270 1 322 382 I39 Post; Telecommunications 76 219 205 183 276 97 830 921 346 124 I40 Financial intermediation 73 339 276 355 199 175 808 961 292 66 I41 Insurance; pension funding 29 103 90 77 419 77 247 268 144 30 I42 Auxiliary financial 0 0 0 0 0 0 0 0 0 0 I43 Real estate activities 82 206 422 340 331 110 1 025 884 367 181 I44 Renting of machinery 19 46 19 32 80 15 92 87 29 14 I45 Research; development 0 0 0 0 0 0 0 0 0 0 I46 Business; computer activities 241 679 447 398 2 220 293 1 022 945 1 029 153 I47 Other community activities 0 0 0 0 0 0 0 0 0 0 I48 Education 12 19 9 11 116 15 45 119 1 536 15 I49 Health; social work 0 0 0 0 0 0 0 0 0 0 I50 Other services; nec 406 2 033 1 429 953 8 424 1 859 3 390 3 382 2 525 389 Total 6 396 29 921 14 915 26 948 118 388 33 591 61 167 55 917 38 679 8 855 Net taxes on products 69 186 216 303 2 958 370 447 488 504 56 Gross value added 2 811 11 313 3 900 16 099 13 407 9 977 22 722 24 360 6 055 3 268 Compensation of employees 2 432 4 534 3 850 4 228 13 077 4 064 19 848 17 334 5 882 2 479 Other taxes less subsidies 34 70 37 93 284 41 22 (163) 146 9 Gross operating surplus 345 6 709 13 11 778 46 5 872 2 852 7 189 27 781 Total output 9 276 41 419 19 030 43 350 134 753 43 937 84 336 80 766 45 238 12 180

Statistics South Africa
Input-output table for South Africa, 2012
11
Table 1: Industry-by-industry input-output table for South Africa, 2012 (R million) (continued)
Industry number Industry description
I31 I32 I33 I34 I35 I36 I37 I38 I39 I40
I1 Agriculture 14 177 19 0 6 32 308 3 2 0 I2 Forestry 0 0 0 0 0 0 0 0 0 0 I3 Fishing 0 0 4 0 0 0 147 6 5 0 I4 Coal; lignite 0 8 25 717 1 416 0 0 45 142 111 0 I5 Metal ores 0 4 143 0 0 0 0 0 0 0 0 I6 Other mining; quarrying 0 93 61 28 10 029 0 20 1 064 834 0 I7 Food 0 0 185 0 0 1 794 3 775 224 176 0 I8 Beverages; tobacco 0 0 0 0 0 0 10 230 3 092 2 425 0 I9 Spinning; textiles 27 1 628 0 0 1 744 0 46 549 431 4 I10 Knitted fabrics, fur 0 0 45 0 0 2 089 21 235 184 2 I11 Leather; luggage 0 3 280 0 0 0 0 0 0 0 0 I12 Footwear 0 0 0 12 419 174 0 0 0 0 I13 Wood 8 1 043 213 43 3 977 2 535 62 1 435 945 0 I14 Paper 29 714 69 8 471 16 704 44 1 627 1 117 157 I15 Publishing; printing 3 27 45 5 80 14 108 93 337 294 376 I16 Coke oven; petroleum 0 16 1 639 125 8 463 10 170 124 26 532 20 803 325 I17 Basic chemicals; nuclear fuel 170 1 351 109 241 0 0 0 155 122 1 I18 Other chemicals 17 1 561 295 526 4 363 2 576 443 2 172 1 703 132 I19 Rubber 8 1 967 6 47 0 97 0 4 264 3 343 36 I20 Plastic 174 2 218 6 7 6 749 7 642 0 369 202 0 I21 Glass; glass products 181 732 75 21 1 008 40 36 63 49 0 I22 Non-metallic minerals 0 697 73 36 31 346 689 94 867 680 4 I23 Furniture 0 0 0 11 263 1 425 20 129 101 67 I24 Recycling; nec 4 55 10 3 32 1 176 30 469 345 1 398 I25 Basic iron; steel 106 15 453 671 133 14 636 0 0 1 094 858 0 I26 Precious; non-ferrous metals 103 10 795 0 56 0 0 0 25 19 0 I27 Structural metal products 96 4 208 812 495 31 596 4 673 154 857 672 71 I28 General; special machinery 83 2 704 765 529 2 514 5 235 12 903 708 6

Statistics South Africa
Input-output table for South Africa, 2012
12
Table 1: Industry-by-industry input-output table for South Africa, 2012 (R million) (continued)
Industry number Industry description
I31 I32 I33 I34 I35 I36 I37 I38 I39 I40
I29 Electrical machinery 128 1 642 4 516 290 12 822 996 60 1 152 903 38 I30 Electronic equipment 1 653 8 336 0 0 0 1 650 0 1 149 901 448 I31 Medical; other appliances 138 0 5 27 0 0 4 3 2 42 I32 Motor vehicles; coachwork 21 48 980 221 49 0 12 755 0 11 497 5 716 106 I33 Electricity, gas; hot water 64 1 232 7 060 268 610 3 792 740 2 759 410 523 I34 Distribution of water 5 54 22 17 067 112 3 035 105 505 75 73 I35 Construction 5 71 8 58 3 082 131 109 2 160 986 22 I36 Trade 456 23 821 2 587 571 35 307 26 361 4 129 20 223 14 609 735 I37 Hotels; restaurants 26 153 123 18 731 1 590 311 5 276 2 628 65 I38 Transport 243 6 403 3 061 535 12 008 24 105 2 332 21 723 9 984 851 I39 Post; Telecommunications 218 829 461 181 5 225 21 899 2 590 7 542 2 715 5 641 I40 Financial intermediation 460 508 2 076 797 3 386 22 062 1 079 5 076 1 497 2 461 I41 Insurance; pension funding 46 329 472 122 1 568 5 908 209 5 466 318 878 I42 Auxiliary financial 0 0 0 0 0 0 0 0 0 37 240 I43 Real estate activities 266 1 067 112 52 3 114 40 891 2 638 6 015 3 489 3 752 I44 Renting of machinery 16 95 17 90 2 339 3 353 65 4 392 685 663 I45 Research; development 0 0 0 0 0 0 0 0 0 0 I46 Business; computer activities 141 4 149 1 861 477 23 217 33 967 2 551 15 521 10 205 3 692 I47 Other community activities 0 0 0 0 0 0 0 957 535 77 I48 Education 18 94 91 279 0 1 160 85 2 320 271 4 686 I49 Health; social work 0 0 47 0 0 0 0 1 089 608 1 974 I50 Other services; nec 516 11 403 97 102 3 133 1 466 1 706 12 638 7 063 427 Total 5 442 162 037 53 656 24 722 224 349 276 282 34 417 174 079 99 726 66 972 Net taxes on products 47 4 443 673 77 4 105 4 230 4 577 9 265 7 487 89 Gross value added 1 832 26 372 84 019 21 493 91 428 327 849 25 692 201 216 66 540 144 651 Compensation of employees 1 140 23 917 23 194 6 347 43 614 157 693 10 703 61 098 24 138 65 776 Other taxes less subsidies 57 (37) (25) (277) 1 020 6 168 665 2 664 783 1 080 Gross operating surplus 636 2 492 60 850 15 423 46 794 163 988 14 324 137 454 41 618 77 795 Total output 7 321 192 852 138 348 46 292 319 882 608 361 64 686 384 561 173 753 211 711

Statistics South Africa
Input-output table for South Africa, 2012
13
Table 1: Industry-by-industry input-output table for South Africa, 2012 (R million) (continued)
Industry number Industry description
I41 I42 I43 I44 I45 I46 I47 I48 I49 I50
I1 Agriculture 0 0 64 6 2 95 269 53 203 3 815 I2 Forestry 0 0 0 0 0 0 0 0 0 38 I3 Fishing 0 0 11 1 0 16 95 8 31 321 I4 Coal; lignite 0 0 0 0 0 0 631 14 52 92 I5 Metal ores 0 0 0 0 0 0 0 0 0 9 I6 Other mining; quarrying 0 0 0 0 0 0 1 720 322 1 233 3 669 I7 Food 0 0 2 478 248 89 3 665 2 924 527 2 014 5 029 I8 Beverages; tobacco 0 0 0 0 0 0 1 363 41 156 6 000 I9 Spinning; textiles 1 0 0 0 0 0 357 47 179 1 513 I10 Knitted fabrics, fur 0 0 77 8 3 113 676 146 557 487 I11 Leather; luggage 0 0 0 0 0 0 72 32 122 102 I12 Footwear 0 0 0 0 0 0 255 70 269 209 I13 Wood 0 0 723 2 1 113 812 242 732 1 794 I14 Paper 22 8 3 631 319 116 4 964 1 108 431 1 504 1 213 I15 Publishing; printing 52 20 4 315 433 166 6 625 1 453 591 2 040 1 221 I16 Coke oven; petroleum 45 17 4 792 479 171 7 085 3 829 265 1 013 4 223 I17 Basic chemicals; nuclear fuel 0 0 11 1 0 16 268 301 1 151 937 I18 Other chemicals 18 7 1 815 182 65 2 683 10 312 748 2 861 3 704 I19 Rubber 5 2 124 12 4 184 440 31 119 423 I20 Plastic 0 0 545 1 0 85 44 37 48 2 179 I21 Glass; glass products 0 0 22 2 1 32 268 48 185 377 I22 Non-metallic minerals 1 0 156 16 6 230 844 50 193 3 053 I23 Furniture 9 4 601 60 21 889 186 140 535 380 I24 Recycling; nec 193 74 870 92 40 1 475 2 725 143 403 1 372 I25 Basic iron; steel 0 0 0 0 0 0 235 9 35 1 273 I26 Precious; non-ferrous metals 0 0 0 0 0 0 63 0 0 133 I27 Structural metal products 10 4 1 340 134 48 1 982 2 828 198 756 5 852 I28 General; special machinery 1 0 3 020 302 108 4 466 1 446 161 616 783

Statistics South Africa
Input-output table for South Africa, 2012
14
Table 1: Industry-by-industry input-output table for South Africa, 2012 (R million) (continued)
Industry number Industry description
I41 I42 I43 I44 I45 I46 I47 I48 I49 I50
I29 Electrical machinery 5 2 898 90 32 1 328 4 866 136 519 4 592 I30 Electronic equipment 62 24 0 0 0 0 15 222 1 638 6 262 3 739 I31 Medical; other appliances 6 2 872 87 31 1 289 509 38 147 100 I32 Motor vehicles; coachwork 15 6 863 260 47 2 175 14 376 1 636 6 476 4 471 I33 Electricity, gas; hot water 72 28 7 165 137 44 4 738 1 383 812 1 330 1 601 I34 Distribution of water 10 4 1 313 25 8 868 518 149 244 264 I35 Construction 3 1 1 082 43 26 1 457 397 36 89 346 I36 Trade 102 39 10 313 883 370 14 482 13 717 1 577 5 857 14 417 I37 Hotels; restaurants 9 3 607 252 32 1 938 1 072 491 258 885 I38 Transport 118 45 3 358 558 775 10 655 13 127 402 1 544 5 951 I39 Post; Telecommunications 780 297 4 259 829 367 17 475 22 932 1 865 5 516 6 699 I40 Financial intermediation 57 581 5 32 112 3 491 102 11 487 6 698 351 1 076 1 885 I41 Insurance; pension funding 4 046 46 2 129 215 35 2 471 2 934 139 977 1 292 I42 Auxiliary financial 5 147 68 461 0 0 0 0 0 0 0 14 480 I43 Real estate activities 519 198 7 440 440 142 13 262 6 002 1 595 6 421 6 443 I44 Renting of machinery 92 35 281 524 54 1 090 53 282 657 1 248 I45 Research; development 0 0 0 0 0 0 0 0 0 0 I46 Business; computer activities 510 194 9 247 961 247 11 035 33 045 11 845 15 316 18 214 I47 Other community activities 11 4 0 0 0 0 54 473 0 7 225 100 I48 Education 648 247 999 47 138 3 467 3 287 341 2 392 I49 Health; social work 273 104 9 054 503 350 12 053 11 457 2 767 361 3 479 I50 Other services; nec 59 22 12 045 691 464 16 104 2 272 1 432 596 5 089 Total 70 422 69 901 128 632 12 336 4 108 162 095 240 276 32 133 78 219 147 887 Net taxes on products 11 5 2 012 153 75 2 993 6 763 358 1 189 4 693 Gross value added 69 131 65 451 174 626 6 442 6 575 111 322 481 675 29 343 59 142 249 522 Compensation of employees 27 998 43 950 10 955 2 298 3 718 78 606 416 820 11 909 27 360 91 703 Other taxes less subsidies 1 351 792 18 669 128 (6) 881 5 009 951 1 306 693 Gross operating surplus 39 782 20 709 145 002 4 015 2 863 31 835 59 846 16 483 30 476 157 126 Total output 139 564 135 357 305 269 18 931 10 758 276 409 728 713 61 834 138 549 402 102

Statistics South Africa
Input-output table for South Africa, 2012
15
Table 1: Industry-by-industry input-output table for South Africa, 2012 (R million) (continued)
Industry number Industry description
Total Exports Imports Household General
Government Capital
formation Changes in inventories
Total output
I1 Agriculture 93 656 16 908 (9 811) 60 343 0 0 (3 112) 157 985 I2 Forestry 12 117 130 (101) 5 264 0 0 135 17 546 I3 Fishing 2 997 744 (92) 809 0 0 26 4 484 I4 Coal; lignite 51 999 53 785 (337) 961 0 0 (234) 106 174 I5 Metal ores 61 447 244 816 (3 130) 0 0 0 1 245 304 377 I6 Other mining; quarrying 122 912 38 057 (97 293) 592 0 0 2 625 66 893 I7 Food 88 626 12 245 (29 943) 171 329 0 0 1 533 243 790 I8 Beverages; tobacco 31 782 6 704 (2 884) 45 679 0 0 1 594 82 874 I9 Spinning; textiles 23 245 1 944 (9 373) 9 443 0 13 1 190 26 462 I10 Knitted fabrics, fur 6 910 604 (27 656) 42 470 0 0 (1 342) 20 984 I11 Leather; luggage 5 799 805 (2 695) 2 276 0 0 (283) 5 901 I12 Footwear 2 612 157 (8 149) 13 865 0 0 29 8 513 I13 Wood 39 382 3 765 (3 027) 967 0 0 125 41 211 I14 Paper 65 337 8 618 (9 216) 7 544 0 0 (932) 71 350 I15 Publishing; printing 34 347 465 (3 074) 6 408 0 1 456 38 603 I16 Coke oven; petroleum 118 355 12 566 (39 844) 34 802 0 364 5 849 132 092 I17 Basic chemicals; nuclear fuel 101 206 28 129 (35 399) 1 137 0 0 1 363 96 436 I18 Other chemicals 87 336 11 064 (46 068) 50 751 0 0 4 834 107 917 I19 Rubber 16 894 2 770 (10 090) 6 728 0 2 (30) 16 274 I20 Plastic 35 567 2 023 (8 914) 2 485 0 5 511 31 676 I21 Glass; glass products 8 309 426 (2 627) 2 892 0 0 276 9 276 I22 Non-metallic minerals 43 959 2 126 (7 125) 1 873 0 9 576 41 419 I23 Furniture 5 108 3 397 (5 065) 11 736 0 4 404 (551) 19 030 I24 Recycling; nec 28 610 14 938 (15 449) 14 811 0 955 (516) 43 350 I25 Basic iron; steel 90 299 52 319 (15 181) 0 0 0 7 316 134 753 I26 Precious; non-ferrous metals 47 777 43 391 (41 796) 0 0 180 (5 614) 43 937 I27 Structural metal products 82 025 12 622 (21 277) 5 639 0 726 4 600 84 336 I28 General; special machinery 54 720 31 578 (105 481) 1 261 0 76 831 21 856 80 766
Statistics South Africa
Input-output table for South Africa, 2012
16
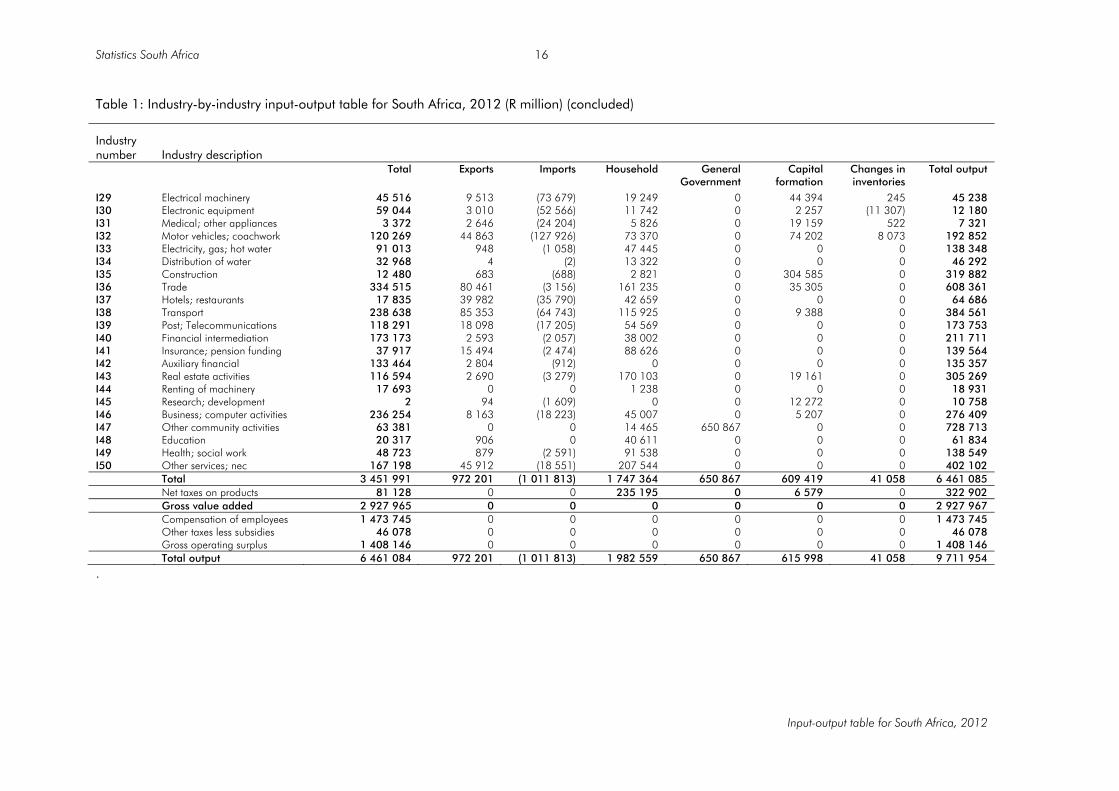
Table 1: Industry-by-industry input-output table for South Africa, 2012 (R million) (concluded)
Industry number Industry description
Total Exports Imports Household General
Government Capital
formation Changes in inventories
Total output
I29 Electrical machinery 45 516 9 513 (73 679) 19 249 0 44 394 245 45 238 I30 Electronic equipment 59 044 3 010 (52 566) 11 742 0 2 257 (11 307) 12 180 I31 Medical; other appliances 3 372 2 646 (24 204) 5 826 0 19 159 522 7 321 I32 Motor vehicles; coachwork 120 269 44 863 (127 926) 73 370 0 74 202 8 073 192 852 I33 Electricity, gas; hot water 91 013 948 (1 058) 47 445 0 0 0 138 348 I34 Distribution of water 32 968 4 (2) 13 322 0 0 0 46 292 I35 Construction 12 480 683 (688) 2 821 0 304 585 0 319 882 I36 Trade 334 515 80 461 (3 156) 161 235 0 35 305 0 608 361 I37 Hotels; restaurants 17 835 39 982 (35 790) 42 659 0 0 0 64 686 I38 Transport 238 638 85 353 (64 743) 115 925 0 9 388 0 384 561 I39 Post; Telecommunications 118 291 18 098 (17 205) 54 569 0 0 0 173 753 I40 Financial intermediation 173 173 2 593 (2 057) 38 002 0 0 0 211 711 I41 Insurance; pension funding 37 917 15 494 (2 474) 88 626 0 0 0 139 564 I42 Auxiliary financial 133 464 2 804 (912) 0 0 0 0 135 357 I43 Real estate activities 116 594 2 690 (3 279) 170 103 0 19 161 0 305 269 I44 Renting of machinery 17 693 0 0 1 238 0 0 0 18 931 I45 Research; development 2 94 (1 609) 0 0 12 272 0 10 758 I46 Business; computer activities 236 254 8 163 (18 223) 45 007 0 5 207 0 276 409 I47 Other community activities 63 381 0 0 14 465 650 867 0 0 728 713 I48 Education 20 317 906 0 40 611 0 0 0 61 834 I49 Health; social work 48 723 879 (2 591) 91 538 0 0 0 138 549 I50 Other services; nec 167 198 45 912 (18 551) 207 544 0 0 0 402 102 Total 3 451 991 972 201 (1 011 813) 1 747 364 650 867 609 419 41 058 6 461 085 Net taxes on products 81 128 0 0 235 195 0 6 579 0 322 902 Gross value added 2 927 965 0 0 0 0 0 0 2 927 967 Compensation of employees 1 473 745 0 0 0 0 0 0 1 473 745 Other taxes less subsidies 46 078 0 0 0 0 0 0 46 078 Gross operating surplus 1 408 146 0 0 0 0 0 0 1 408 146 Total output 6 461 084 972 201 (1 011 813) 1 982 559 650 867 615 998 41 058 9 711 954
.

Statistics South Africa
Input-output table for South Africa, 2012
17
Chapter 3: Conclusion and way forward I-O tables are an important part of the National Accounts framework. They complement the SU-tables framework by offering an alternative approach to display information contained within the SU-tables. Furthermore, I-O tables offer extensive analytical ability in both the industry-by-industry and product-by-product frameworks. Industry-by-industry I-O tables allow for analysis that aims to examine:
• Tax structures and reforms;
• The effect of a change in compensation of employees;
• The effects of fiscal policy; and
• The effects of monetary policy. The next I-O tables report for South Africa will be based on the new full times series for the I-O tables for the reference years 2009 to 2014 and is scheduled to be published at the end of March 2016. To ensure that future I-O tables in South Africa are responsive to user needs and provide an accurate reflection of their comments and suggestions, all stakeholders are invited to send comments to: Membrey Mogapi ([email protected]). .

Statistics South Africa
Input-output table for South Africa, 2012
18
Annexure Table 2 below is the industry list for the I-O table (it is based on the SU-tables’ SIC (5th version) classification). Table 3 shows a brief description of each of the final demand items in the I-O tables for South Africa. Table 2: Industry-by-industry input-output table industry list
Industry number SIC Code Description I1 SIC 11 Agriculture, hunting and related services I2 SIC 12 Forestry, logging and related services I3 SIC 13 Fishing, operation of fish hatcheries and fish farms I4 SIC 21 Mining of coal and lignite I5 SIC 23 & 24 Mining of gold, uranium and metal ores I6 SIC 25 Other mining and quarrying I7 SIC 301-4 Manufacture of food products I8 SIC 305-6 Manufacture of beverage and tobacco products I9 SIC 311-2 Spinning, weaving, finishing of textiles and manufacture of other textiles I10 SIC 313-5 Manufacture of knitted, crocheted fabrics, wearing apparel, fur articles and dyeing of
fur I11 SIC 316 Tanning and dressing of leather, manufacture of luggage, handbags, saddler and
harness I12 SIC 317 Manufacture of footwear I13 SIC 321-2 Manufacture of products of wood, cork, straw and plaiting materials; and sawmilling
and planing of wood I14 SIC 323 Manufacture of paper and paper products I15 SIC 324-6 Publishing, printing and service activities related to printing; and reproduction of
recorded media I16 SIC 331-2 Manufacture of coke oven products; and petroleum refineries/synthesisers I17 SIC 333-4 Processing of nuclear fuel; and basic chemicals I18 SIC 335-6 Manufacture of other chemical products, and man-made fibres I19 SIC 337 Manufacture of rubber products I20 SIC 338 Manufacture of plastic products I21 SIC 341 Manufacture of glass and glass products I22 SIC 342 Manufacture of non-metallic mineral products (nec) I23 SIC 391 Manufacture of furniture I24 SIC 392 & 395 Manufacture nec and recycling nec I25 SIC 351 & 353 Manufacture of basic iron and steel and casting of metals I26 SIC 352 Manufacture of precious metals and non-ferrous metals I27 SIC 354-5 Manufacture of structural metal products, tanks, reservoirs and steam generators, and
other fabricated metal products, metalwork service activities

Statistics South Africa
Input-output table for South Africa, 2012
19
Table 2: Industry-by-industry input-output table industry list (concluded)
Industry number SIC Code Description I28 SIC 356-9 Manufacture of general purpose machinery, special purpose machinery, household
appliances, and office, accounting and computing machinery I29 SIC 36 Manufacture of electrical machinery and apparatus nec I30 SIC 371-3 Manufacture of electronic valves, tubes, other electric components; television and radio
transmitters, apparatus for line telephony and line telegraphy; and television and radio receivers, sound or video recording or reproducing apparatus and associated goods
I31 SIC 374-6 Manufacture of medical appliances and instruments and appliances for measuring, checking, testing, navigating and other purposes; manufacture of optical instruments and photographic equipment; and watches and clocks
I32 SIC 381-387 Manufacture of motor vehicles, bodies (coachwork) for motor vehicles, locomotives, aircraft, spacecraft, trailers and semi-trailers; motor vehicle and engine parts and accessories; building and repairing ships and boats, and manufacture of transport equipment not elsewhere classified
I33 SIC 41 Electricity, gas, steam and hot water supply I34 SIC 42 Collection, purification and distribution of water I35 SIC 5 Construction I36 SIC 61 & 62 &
63 Wholesale and commission trade, retail trade; and sale, maintenance and repair of motor vehicles and motor cycles, retail trade in automotive fuel
I37 SIC 64 Hotels and restaurants I38 SIC 71 &72 & 73
& 74 Transport (land, water, air); and supporting and auxiliary transport activities, activities of travel agencies
I39 SIC 75 Post and telecommunications I40 SIC 81 Financial intermediation, except insurance and pension funding I41 SIC 82 Insurance and pension funding, except compulsory social security I42 SIC 83 Activities auxiliary to financial intermediation I43 SIC 84 Real estate activities I44 SIC 85 Renting of machinery and equipment, without operator, and of personal and household
goods I45 SIC 87 Research and development I46 SIC 86 & 88 Computer and related activities; and other business activities I47 SIC 94 Other community, social and personal service activities(including government) I48 SIC 92 Education I49 SIC 93 Health and social work I50 SIC 9 Other service activities nec

Statistics South Africa
Input-output table for South Africa, 2012
20
Table 3: Industry-by-industry input-output table final demand description
Name Description Exports Exports of goods and services Imports Imports of goods and services Household Final consumption expenditure incurred by households General Government Final consumption expenditure incurred by general government Capital formation Gross fixed capital formation Changes in inventories Changes in inventories

Statistics South Africa
Input-output table for South Africa, 2012
21
Glossary Basic prices The amount receivable by the producer from the purchaser
for a unit of a good or service as output minus any tax payable, and plus any subsidy receivable by the producer as a consequence of its production or sale. It excludes any transport charges invoiced separately by the producer.
Central Product Classification A classification based on the physical characteristics of goods or the nature of the services rendered. It covers products that are an output of economic activities, including transportable goods, non-transportable goods and services.
Compensation of employees The total remuneration, in cash or kind, payable by an employer to an employee in return for work done by the latter during the accounting period. It is recorded on a gross basis, before any deduction for income taxes, pensions, unemployment insurances or other social insurance schemes.
Gross domestic product The total value of goods and services produced within the geographic boundaries of a country for a specified period of time.
Gross fixed capital formation Shows the acquisition less disposal of produced assets for purposes of fixed capital formation, inventories or valuables.
Gross operating surplus/mixed income The balancing item in the generation of income account, i.e. the value added minus compensation of employees payable minus taxes on production payable plus subsidies receivable.
Gross value added The difference between the value of goods and services produced and the value of the intermediate goods and services consumed in the course of production.
Household final consumption expenditure
Includes all consumption expenditure made by households from their own cash resources (including all income in cash received), as well as all the counterpart of income in kind (except social transfers in kind) that those households might have received, such as remuneration in kind and other transfers in kind. Note: It also includes the value of all consumption of output for own final use, such as those provided by second homes on own account used for tourism purposes or what it has received through barter transactions.
Industry Groups of establishments engaged in the same or similar kinds of activity. Note: The definition of industries is based on the SNA and is in line with that contained in the Standard Industrial Classification of all Economic Activities, Fifth Edition, Report No. 09-90-02 of January 1993 (SIC).

Statistics South Africa
Input-output table for South Africa, 2012
22
I-O tables It is a theoretical framework that focuses on the relationship between industries and their production and use of products. An industry-by-industry I-O table represents the economy in a matrix form by listing consuming industries as columns and the supplying industries as rows.
Intermediate consumption Intermediate consumption consists of the value of the goods and services consumed as inputs by a process of production, excluding fixed assets. Consumption of fixed assets is recorded as consumption of fixed capital.
International Standard Industrial Classification of all Economic Activities
The United Nation’s version of a classification system used to classify businesses according to their economic activity.
National accounts Serves as a framework for statistical systems. It also serves as a point of reference in establishing standards for related statistics. The internationally agreed framework that guides the compilation of national accounts is contained in the SNA.
Net taxes on products The sum of taxes on products less subsidies. Taxes on products consist of taxes payable on goods and services when they are produced, delivered, sold or otherwise disposed of by their producers. Furthermore, they are payable per unit of a good or service produced. Important examples of taxes on products are excise and import duties and value added tax (VAT).
Production A process, carried out under the responsibility, control and management of an institutional unit, in which labour and assets are used to transform inputs of goods and services into outputs of other goods and services. All goods and services produced as outputs must be of such a nature that they can be sold on markets, or at least be capable of being provided by one unit to another, with or without charge.
Purchaser’s price The purchaser’s price is the amount paid by the purchaser,
excluding any VAT or similar tax deductible by the purchaser, in order to take delivery of a unit of a good or a service at the time and place required by the purchaser. The purchaser’s price of a good includes any transport charges paid separately by the purchaser to take delivery at the required time and place.
Standard Industrial Classification A South African version of a classification coding system used
to classify an enterprise according to its economic activity. Note: It is based on the United Nations' ISIC with a number of adaptations for local conditions.

Statistics South Africa
Input-output table for South Africa, 2012
23
Supply and use tables Matrices that record how supplies of different kinds of goods and services originate form domestic industries and imports and how those supplies are allocated between various intermediate or final uses, including exports.
System of national accounts An internationally-agreed standard system for macro-economic accounts. The latest version is described in the System of National Accounts 2008.

Statistics South Africa
Input-output table for South Africa, 2012
24
Related input-output tables publications Statistics South Africa, 2010. Final Supply and Use Tables: An input-output framework (SUT), 2005. Report No: 04-04-01. Pretoria: Statistics South Africa Statistics South Africa, 2012. The status of input-output tables for South Africa. Discussion document No: D0404. Pretoria, Statistics South Africa Statistics South Africa, 2013. Draft input-output table for South Africa, 2009. Discussion document No: D0404.1. Pretoria: Statistics South Africa Statistics South Africa, 2013. Gross Domestic Product (GDP), 2nd Quarter 2013. Publication No: P0441. Pretoria: Statistics South Africa Statistics South Africa, 2014. Input-output tables for South Africa, 2010 and 2011. Report No: 04-04-02. Pretoria: Statistics South Africa