final conda/woodall mountain mine field-scale permeable...
TRANSCRIPT
FINAL Conda/Woodall Mountain Mine Field-Scale Permeable Reactive Barrier Treatability Study Implementation Plan
October 2018 Prepared for: J.R. Simplot Company P.O. Box 912 1130 West Highway 30 Pocatello, ID 83204 Prepared by:
Formation Environmental, LLC
2500 55th Street, Suite 200
Boulder, Colorado 80301
NewFields
700 SW Higgins Ave, Suite 12
Missoula, Montana 59803
PRB Pilot Study Conceptual Implementation Plan Conda/Woodall Mountain Mine October 2018
S:\Jobs\0442-001-900-Simplot-Conda\RIFS_PilotStudy\PRB\DesignImplemtationPln\Final\FnlPRBtreatImplPln_10022018.docx
1
TABLE OF CONTENTS
Page
LIST OF TABLES ....................................................................................................................... 3
LIST OF FIGURES ..................................................................................................................... 4
LIST OF APPENDICES (PROVIDED ELECTRONICALLY) ....................................................... 4
LIST OF ACRONYMS ................................................................................................................ 5
1.0 INTRODUCTION ............................................................................................................. 7
1.1 Background .......................................................................................................... 7
1.2 Objective of Pilot Study ........................................................................................ 8
1.3 Document Organization ....................................................................................... 8
2.0 TECHNOLOGY OVERVIEW ......................................................................................... 10
3.0 STUDY SETTING CHARACTERISTICS ....................................................................... 12
3.1 Topographic and Climatic Conditions ................................................................. 12
3.2 Hydrogeological Conditions ............................................................................... 12
3.3 Seep and Groundwater Quality .......................................................................... 13
4.0 DATA QUALITY OBJECTIVES .................................................................................... 14
4.1 Problem and Decision Statements ..................................................................... 14
4.2 Inputs to the Decision and Decision Rules ......................................................... 14
4.3 Null Hypothesis and Limits on Decision Errors ................................................... 14
4.4 Optimizing the Sampling Design ........................................................................ 15
5.0 STUDY DETAILS .......................................................................................................... 16
5.1 Bench-Scale Studies .......................................................................................... 16 5.1.1 Batch Leach Tests .................................................................................. 16 5.1.2 Column Leach Studies ........................................................................... 17
5.2 Field-Scale Treatability Study Approach ............................................................ 18 5.2.1 Treatment Media .................................................................................... 19 5.2.2 Seep Treatment Cell .............................................................................. 19 5.2.3 Groundwater Treatment PRB ................................................................. 20
5.3 Monitoring and Process Control Measurements ................................................. 21
6.0 STUDY IMPLEMENTATION PROCEDURES ............................................................... 23
6.1 Construction ....................................................................................................... 23 6.1.1 Site Preparation Activities ....................................................................... 23 6.1.2 Cultural Resource Survey ....................................................................... 23 6.1.3 Construction of the Pilot Study ............................................................... 23
6.2 Best Management Practices .............................................................................. 25
6.3 Monitoring and Treatment Optimization ............................................................. 25
6.4 Investigation-Derived Waste Management ......................................................... 27
7.0 SAMPLING AND ANALYSIS PLAN ............................................................................. 28
7.1 Water Sampling and Analysis ............................................................................ 28
7.2 Reactive Media Sampling and Analysis ............................................................. 29
PRB Pilot Study Conceptual Implementation Plan Conda/Woodall Mountain Mine October 2018
S:\Jobs\0442-001-900-Simplot-Conda\RIFS_PilotStudy\PRB\DesignImplemtationPln\Final\FnlPRBtreatImplPln_10022018.docx
2
7.3 Sampling Equipment and Procedures ................................................................ 30 7.3.1 Equipment Testing and Calibration Procedures ...................................... 30 7.3.2 Equipment Decontamination................................................................... 30 7.3.3 Sampling Containers, Preservation and Storage .................................... 30
7.4 Sample Documentation and Handling ................................................................ 31 7.4.1 Sample Designation ............................................................................... 31 7.4.2 Sample Custody, Handling and Shipping................................................ 32
7.5 Quality Assurance and Quality Control ............................................................... 33 7.5.1 Data Quality Indicators ........................................................................... 33
7.5.1.1 Accuracy .................................................................................. 33
7.5.1.2 Precision .................................................................................. 34
7.5.1.3 Completeness .......................................................................... 34
7.5.1.4 Representativeness ................................................................. 35
7.5.1.5 Comparability ........................................................................... 35 7.5.2 Field Quality Control Samples ................................................................ 36
7.5.2.1 Field Duplicate Samples .......................................................... 36
7.5.2.2 Equipment Rinsate Blank Samples .......................................... 36 7.5.3 Laboratory Quality Control Samples ....................................................... 37
7.5.3.1 Method Blank Samples ............................................................ 38
7.5.3.2 Matrix Spike Samples .............................................................. 38
7.5.3.3 Laboratory Instrument Calibration ............................................ 38
7.5.3.4 Quality Assessment and Corrective Actions ............................. 39 7.5.4 Data Review ........................................................................................... 39 7.5.5 Data Management .................................................................................. 40
8.0 DATA ANALYSIS AND REPORTING ........................................................................... 41
8.1 Data Evaluation ................................................................................................. 41
8.2 Data Validation .................................................................................................. 41
8.3 Reporting ........................................................................................................... 43
9.0 ROLES AND SCHEDULE ............................................................................................. 45
10.0 REFERENCES .............................................................................................................. 46
PRB Pilot Study Conceptual Implementation Plan Conda/Woodall Mountain Mine October 2018
S:\Jobs\0442-001-900-Simplot-Conda\RIFS_PilotStudy\PRB\DesignImplemtationPln\Final\FnlPRBtreatImplPln_10022018.docx
3
LIST OF TABLES
Table 3-1 ……………………………...……. Meteorological Data From the Blackfoot Bridge Mine
Table 3-2 ...………………………………………………… Groundwater Well Construction Details
Table 3-3 ...………………………………………………………………. Groundwater Elevation Data
Table 3-4 ……………………………… Slug Test Summary and Hydraulic Conductivity Estimates
Table 3-5 ….…………… Shallow Groundwater and Seep Analytical and Field Data, 2015 - 2017
Table 5-1 ……………………………………………………………………. Batch Leach Test Results
Table 5-2 ……………………….. Summary of the 25 PV Effluent Data for Seep and Groundwater
Table 5-3 ……………………….. Summary of the 50 PV Effluent Data for Seep and Groundwater
Table 5-4 ………………………..………….………….……….. Spring 2017 Runoff Sample Results
Table 7-1 ………. Groundwater and Surface Water Analyte List, Methods, Preservation, and Data Quality Indicators
Table 7-2 … . Treatment Media and Pore Water Analyte List, Methods, Preservation, and Data Quality Indicators
Table 9-1 ………………..…………… Permeable Reactive Barrier Pilot Study General Schedule
PRB Pilot Study Conceptual Implementation Plan Conda/Woodall Mountain Mine October 2018
S:\Jobs\0442-001-900-Simplot-Conda\RIFS_PilotStudy\PRB\DesignImplemtationPln\Final\FnlPRBtreatImplPln_10022018.docx
4
LIST OF FIGURES
Figure 1-1 ………………..…………………… Conda/Woodall Mountain Phosphate Mine Location
Figure 1-2 ………………..………………Permeable Reactive Barrier Pilot Study Project Location
Figure 3-1 ………………..……………………Uncolsolidated Deposits Potentiometric Surface Map
Figure 3-2 …………………..…………………….. Generalized Hydrogeologic Cross-Section A – A’
Figure 3-3 …………………..…………………….. Generalized Hydrogeologic Cross-Section B – B’
Figure 3-4 …………………..…………………….. Generalized Hydrogeologic Cross-Section C – C’
Figure 3-5 …………………..…………………….. Generalized Hydrogeologic Cross-Section D – D’
Figure 3-6 …………………..…………………….. Generalized Hydrogeologic Cross-Section E – E’
Figure 3-7 ………………..……………Surface Water and Groundwater Total Selenium Results
Figure 6-1 …………………………………….Groundwater and Surface Water Sampling Locations
Figure 9-1…………………………………….Project Duties and Responsibilities
LIST OF APPENDICES (PROVIDED ELECTRONICALLY)
Appendix A – Well Boring Logs
Appendix B – Slug Test Results
Appendix C – Bench-Scale Report
Appendix D – Design Approach and Drawings
Appendix E – Standard Operating Procedures
Appendix F – Comments Responses and Resolutions
PRB Pilot Study Conceptual Implementation Plan Conda/Woodall Mountain Mine October 2018
S:\Jobs\0442-001-900-Simplot-Conda\RIFS_PilotStudy\PRB\DesignImplemtationPln\Final\FnlPRBtreatImplPln_10022018.docx
5
LIST OF ACRONYMS
AMMR Annual Maintenance and Monitoring Report
AMSL above mean sea level
AOC Administrative Order on Consent
ARAR Applicable or Relevant and Appropriate Requirements
ASTM American Society for Testing and Materials
AWQC Ambient Water Quality Criterion
bgs below ground surface
BLM Bureau of Land Management
BMP Best Management Practices
CCB Continuing Calibration Blank
CCV Continuing Calibration Verification
CERCLA Comprehensive Environmental Response Compensation and Liability Act
CLP Contract Laboratory Program
COC Chain of Custody
Conda Conda/Woodall Mountain Phosphate Mine
COPC Chemical of Potential Concern
CQA Construction Quality Assurance
CQC Construction Quality Control
CSR Construction Summary Report
DO Dissolved Oxygen
DOI Department of the Interior
DQI Data Quality Indicator
DQO Data Quality Objective
ECO Engineering Change Order
FS Feasibility Study
ft feet
ft.day feet per day
GW Groundwater
HRT Hydraulic Retention Times
ICB Initial Calibration Blank
ICP-MS Inductively Coupled Plasma Mass Spectrometry
ICV Initial Calibration Verification
IDEQ Idaho Department of Environmental Quality
IDW Investigation-Derived Waste
PRB Pilot Study Conceptual Implementation Plan Conda/Woodall Mountain Mine October 2018
S:\Jobs\0442-001-900-Simplot-Conda\RIFS_PilotStudy\PRB\DesignImplemtationPln\Final\FnlPRBtreatImplPln_10022018.docx
6
LCS Laboratory Control Sample
LCSD Laboratory Control Sample Duplicate
MCL Maximum Contaminant Level
MDL Method Detection Limit
mg/L milligrams per liter
mL milliliter
MOU Memorandum of Understanding
MS Matrix Spike
MSD Matrix Spike Duplicate
NFG National Functional Guidelines
NTCRA Non-Time Critical Removal Action
ODA Overburden Disposal Area
ORP Oxidation Reduction Potential
PRB Permeable Reactive Barrier
QA Quality Assurance
QC Quality Control
PRSC Post-Removal Site Control
PV Pore Volume
PVC Polyvinyl chloride
RAO Remedial Action Objectives
RCRA Resource Conservation and Recovery Act
RI Remedial Investigation
RM Reactive Media
RPD Relative Percent Difference
RSD Relative Standard Deviation
SAP Sampling and Analysis Plan
SHPO State Historical Preservation Office
Simplot J.R. Simplot Company
SOP Standard Operating Procedure
SW Surface Water
TCLP Toxicity Characteristic Leaching Procedure
Tribes Shoshone-Bannock Tribes
USEPA United States Environmental Protection Agency
USFWS United States Fish and Wildlife Service
PRB Pilot Study Conceptual Implementation Plan Conda/Woodall Mountain Mine October 2018
S:\Jobs\0442-001-900-Simplot-Conda\RIFS_PilotStudy\PRB\DesignImplemtationPln\Final\FnlPRBtreatImplPln_10022018.docx
7
1.0 INTRODUCTION
The J.R. Simplot Company (Simplot) as an owner and operator of the former Conda/Woodall
Mountain Phosphate Mine (Conda, Figure 1-1) has prepared this document to describe the
concept of implementing a Field-Scale Permeable Reactive Barrier (PRB) Pilot Study to evaluate
its effectiveness in treating contaminant levels in seep and groundwater at Conda. The Field-
Scale PRB Pilot Study will be conducted in the Pedro Creek headwaters area on water present
in the NES-5 Seep Collection Pond as well as the near-surface groundwater downgradient of the
pond (Figure 1-2).
Simplot voluntarily entered into an Administrative Order on Consent (AOC) in 2008 with the Idaho
Department of Environmental Quality (IDEQ), the United States Environmental Protection Agency
(USEPA), and the US Department of the Interior (DOI) Bureau of Land Management (BLM) to
conduct a Remedial Investigation/Feasibility Study (RI/FS). Pursuant to a July 17, 2000
Memorandum of Understanding (MOU) concerning contamination from the phosphate mining
operations in southeastern Idaho, IDEQ is the “Lead Agency,” with USEPA implementing
Comprehensive Environmental Response, Compensation and Liability Act (CERCLA). The BLM,
US Fish and Wildlife Service (USFWS), and the Shoshone-Bannock Tribes (Tribes) have elected
to participate as “Support Agencies.” The IDEQ, USEPA, BLM, USFWS, and the Tribes are
collectively referred to as the Agencies.
A range of water treatment systems were assessed during the development and screening of
alternatives for the ongoing Conda FS. Passive in-situ treatment of water was retained in the FS
Technical Memorandum 1 for further analysis (Formation 2017a). Passive biochemical treatment
as a technology for removing selenium from water has several advantages over active treatment
systems. Notably, it would not require a significant level of operation and maintenance like active
physicochemical treatments. This is an important consideration for some of the relatively remote
locations that exist on the east side of Conda. The information obtained from the Field-Scale PRB
Pilot Study will be used to support the comparative and detailed analysis of alternatives presented
in the Draft FS.
1.1 Background
Phosphate mining at Conda resulted in the disturbance of overburden materials naturally high in
concentrations of selenium and other trace metals. This material was placed in Overburden
Disposal Areas (ODAs), which have been identified as the primary sources of selenium and other
Chemicals of Potential Concern (COPC) releases to the environment. A comparison of the RI
data against Applicable or Relevant and Appropriate Requirements (ARARs) and risk-based
comparison values showed that selenium has the widest extent of release, and greatest order-of-
magnitude exceedances among the identified COPCs (Formation 2017a). All the identified
COPCs for the site will be monitored under the Field-Scale PRB Pilot Study, but selenium is
considered the primary indicator constituent for the study (Formation 2016).
PRB Pilot Study Conceptual Implementation Plan Conda/Woodall Mountain Mine October 2018
S:\Jobs\0442-001-900-Simplot-Conda\RIFS_PilotStudy\PRB\DesignImplemtationPln\Final\FnlPRBtreatImplPln_10022018.docx
8
Based on findings from the RI, groundwater with the highest concentrations of selenium and other
COPCs at Conda occurs in the seeps and shallow alluvial/colluvial aquifer downgradient of the
Pedro Creek ODA (Figure 1-2) (Formation 2016). This ODA was subject to a Non-Time-Critical
Removal Action (NTCRA) constructed in 2013 and 2014 (Formation 2015). While the NTCRA
has improved some conditions in the Pedro Creek Sub-Basin, selenium concentrations in the
NES-5 seep and alluvial/colluvial groundwater continue to be elevated (as high as 9.4 milligrams
per liter [mg/L] and 3.7 mg/L, respectively) post-construction (Formation 2017b). The proposed
location of the Field-Scale PRB Pilot Study was selected because this area has elevated selenium
concentrations and favorable topographical and geological conditions for construction of a PRB
(Figure 1-2).
1.2 Objective of Pilot Study
The principal objective for the Field-Scale PRB Pilot Study is to determine the effectiveness of
the system in treating selenium and other COPCs in groundwater to levels below the 0.05 mg/L
Maximum Contaminant Level (MCL) and identify any limitations of the technology. The following
are other objectives of this pilot study:
• Assess rate of treatment as well as the short- and long-term effectiveness.
• Optimize treatment parameters for the specific geochemical conditions.
• Assess generation of unwanted secondary products.
• Evaluate implementability and develop more accurate cost estimates of full-scale
treatment.
Performing this Pilot Study for a period of one year allows for evaluating the system’s
responsiveness to seasonally fluctuating COPC concentrations. These objectives are consistent
with the preliminary Remedial Action Objectives (RAOs) for groundwater remedies at Conda.
1.3 Document Organization
This document is comprised of the following sections:
• 1.0 Introduction – Background information and purpose of the PRB study;
• 2.0 Technology Overview – Description of the PRB technology;
• 3.0 Study Setting Characteristics – Overview of site characteristics relevant to the PRB
Pilot Study;
• 4.0 Data Quality Objectives (DQOs) – Description of data needed to evaluate the
effectiveness of the PRB;
• 5.0 Study Details – Summary of the bench-scale results, and the proposed Field-Scale
PRB Pilot Study design;
PRB Pilot Study Conceptual Implementation Plan Conda/Woodall Mountain Mine October 2018
S:\Jobs\0442-001-900-Simplot-Conda\RIFS_PilotStudy\PRB\DesignImplemtationPln\Final\FnlPRBtreatImplPln_10022018.docx
9
• 6.0 Study Implementation Procedures – Description of the preliminary PRB design, and
procedures for obtaining additional information for the final design;
• 7.0 Sampling and Analysis Plan (SAP) – Description of the sample collection, field
measurement, quality assurance and quality control (QA/QC), and related data review and
documentation procedures;
• 8.0 Data Analysis and Reporting – Description of data validation and result reporting;
• 9.0 Roles and Schedule – General summary of the project roles, responsibilities and
timeline; and
• 10.0 References – List of references cited.
PRB Pilot Study Conceptual Implementation Plan Conda/Woodall Mountain Mine October 2018
S:\Jobs\0442-001-900-Simplot-Conda\RIFS_PilotStudy\PRB\DesignImplemtationPln\Final\FnlPRBtreatImplPln_10022018.docx
10
2.0 TECHNOLOGY OVERVIEW
The PRB technology is an in-situ permeable system that uses reactive media designed to
passively treat intercepted contaminated groundwater. The type of reactive material selected for
the PRB depends on local hydrogeologic conditions and types of contaminants in the
groundwater. The reactive media is placed in a trench across the water-bearing zone to be
treated. The trench is aligned perpendicular to groundwater flow such as to intercept and treat
contaminated groundwater. Chemical reactions between the reactive media and contaminated
groundwater flowing through the media results in transformation or immobilization of the
contaminants.
Unlike conventional pump-and-treat systems, PRBs do not require treatment equipment reliant
on access to power and other infrastructure. The technology is capable of successfully treating
many inorganic contaminants. To treat selenium, PRBs rely on reactive media that use chemical
and microbially-mediated processes to chemically reduce and transform it from selenate (SeO4-2)
to selenite (SeO3-2) and ultimately to elemental selenium (Se0). Elemental selenium (Se0)
precipitates out of solution and is not bioavailable as an insoluble element. Materials suitable to
promote selenium treatment include inert sand (to maintain matrix permeability for the flow of
water), and a carbon source (e.g., wood chips, alfalfa hay, rice straw, etc.) for microbial utilization.
Carbon utilization results in oxygen depletion which creates anaerobic conditions resulting in the
chemical reduction of water soluble selenium species (selenate and selenite) to insoluble
elemental selenium which precipitates from solution. Various factors influence the reduction
speed of microbial processes, including pH, temperature, and salinity. For selenium reduction, a
target pH range between 6.5 and 9.5 is optimal (NAMC 2010). Selenate reduction decreases
with higher salinity (NAMC 2010).
PRBs have two basic subsurface configurations, either funnel-and-gate or trench designs (ITRC
2011, USEPA 1998, USEPA 2014). In a funnel-and-gate configuration, the system extends
laterally beyond the extent of the zone targeted for treatment and directs groundwater toward and
through the reactive media for treatment (ITRC 2011, USEPA 1998, USEPA 2014). The trench
PRB is installed perpendicular to the direction of groundwater flow for treatment (ITRC 2011,
USEPA 1998, USEPA 2014). The dimensions of the trench depend on the extent of groundwater
contamination, and the amount of reactive media necessary to provide the required Hydraulic
Retention Time (HRT) to achieve adequate treatment.
The hydraulic and chemical properties of both the aquifer and the reactive media are important
considerations for PRBs. The soil type, groundwater depth, flow direction, hydraulic conductivity,
plume dimensions and geochemical composition of the aquifer should be well understood to
ensure adequate capture and treatment. For the reactive media, it is important to understand the
hydraulic conductivity and chemical composition, as well as the potential for release of unwanted
chemicals. The reactive media should have a hydraulic conductivity at least as high as the
aquifer, so that the groundwater can easily flow through and not bypass the media. The reactive

PRB Pilot Study Conceptual Implementation Plan Conda/Woodall Mountain Mine October 2018
S:\Jobs\0442-001-900-Simplot-Conda\RIFS_PilotStudy\PRB\DesignImplemtationPln\Final\FnlPRBtreatImplPln_10022018.docx
11
media should also be able to maintain its hydraulic conductivity and reactivity throughout its
anticipated lifespan.
PRB Pilot Study Conceptual Implementation Plan Conda/Woodall Mountain Mine October 2018
S:\Jobs\0442-001-900-Simplot-Conda\RIFS_PilotStudy\PRB\DesignImplemtationPln\Final\FnlPRBtreatImplPln_10022018.docx
12
3.0 STUDY SETTING CHARACTERISTICS
As previously mentioned, Simplot proposes to perform the Field-Scale PRB Pilot Study to
evaluate the effectiveness in treating the range of selenium concentrations in water present in the
NES-5 Seep Collection Pond and near-surface groundwater downgradient from the pond (Figure
1-2). The conditions in the area of the study are described below, based on information from the
RI (Formation 2016), ongoing monitoring of the NTCRA under the Post-Removal Site Control
(PRSC) Plan (Formation 2017b), and a supplemental hydrogeological characterization performed
in October 2017 (Formation 2017c).
3.1 Topographic and Climatic Conditions
Surface elevations in the study area range from approximately 6,734 feet above mean sea level
(ft AMSL) in the drainage floor to approximately 6,770 ft AMSL along the flanks of the drainage
(Figure 1-2). The ground surface slopes eastward at approximately 20 to 30 percent.
Based on the data from a meteorological station located at the Blackfoot Bridge Mine (Table 3-
1), total annual precipitation ranges between approximately 28 to 43 inches. Summer
temperatures in the region are mild, normally ranging from 42 to 80 degrees Fahrenheit, with the
highest temperatures occurring in July. Winter temperatures normally range from 9 to 40 degrees
Fahrenheit, while spring and fall months range from 16 to 72 and 9 to 70 degrees Fahrenheit,
respectively.
3.2 Hydrogeological Conditions
Hydrogeological conditions in the PRB area were evaluated using information obtained from wells
GW-41-MA, GW-42-MD, and GW-58-MA through GW-62-MA (Figure 1-2 and Table 3-2). The
geology in the study area consists of unconsolidated alluvium/colluvium deposits, weathered and
unweathered Dinwoody Formation. The shallow groundwater elevation ranges from
approximately 6,718.2 ft AMSL to 6750.1 ft AMSL and is predominantly associated with sand and
gravel intervals in the unconsolidated deposits and upper portion of the weathered Dinwoody
Formation (Figure 3-1 and Table 3-3). This shallow water bearing zone appears to generally
correspond with the drainage-bed footprint, pinching out farther up the flanks of the draw. Water
bearing zones were not encountered at either GW-62-MA or PRB-BH-1 (Figure 3-1) in the fall of
2017. However, water was present in GW-62-MA in the spring of 2018, although the water levels
differ from other wells in the PRB area. This indicates that GW-62-MA is screened across
intermittently water-producing zones. At GW-60-MA, only a thin lens of water was encountered
above the unweathered Dinwoody contact. The groundwater potentiometric surface mimics the
topography, with flow in an eastward direction (Figure 3-1).
Hydrogeologic cross sections are shown on Figures 3-2 through 3-6. The thickness of the
unconsolidated deposits ranges from approximately 2 feet (GW-60-MA) to 48 feet (GW-59-MA).
PRB Pilot Study Conceptual Implementation Plan Conda/Woodall Mountain Mine October 2018
S:\Jobs\0442-001-900-Simplot-Conda\RIFS_PilotStudy\PRB\DesignImplemtationPln\Final\FnlPRBtreatImplPln_10022018.docx
13
The weathered Dinwoody Formation is predominantly composed of clay with angular chert and
siltstone fragments and thin discreet layers of angular gravel and silts (Appendix A). The
unweathered Dinwoody surface is present from approximately 12 feet below ground surface (bgs)
(GW-60-MA) to 50 feet bgs (GW-42-MD) and is comprised of gravelly siltstone.
Hydraulic conductivities of the unconsolidated deposits were estimated by performing mechanical
slug tests (provided in Appendix B) in accordance with American Society for Testing and Materials
(ASTM) D4044/D4044M (ASTM 2015a). Prior to slug testing, the wells were developed by bailing
and pumping until measured field parameters stabilized and the water became relatively clear
and free of sediments. Slug tests were conducted by rapidly inserting (falling head) and/or
removing (rising head) a solid slug of known volume from below the static water level in the well
to cause an instantaneous change in head. Water level recovery was measured and recorded
using a pressure transducer/data logger. Barometric pressures were also recorded during slug
testing to allow for barometric compensation of pressure readings. Multiple slug tests were
performed on each well after allowing the water level to re-equilibrate to verify coincidence in
recovery data. Calculated estimates of hydraulic conductivity ranged from 0.29 to 0.97 feet per
day (ft/day) (Table 3-4).0F
1 Slug tests were not performed on GW-60-MA, GW-61-MA, and GW-62-
MA due to insufficient water.
3.3 Seep and Groundwater Quality
Total selenium in the shallow groundwater near the Pedro Creek ODA have continued to exceed
the USEPA MCL in the years following the NTCRA construction (2015 to 2017 for the purposes
of this document), with concentrations that ranged from 0.0171 mg/L (GW-59-MA, fall 2017) to
7.18 mg/L (GW-41-MA, summer 2015) (Table 3-5). Post-construction selenium concentrations
at the groundwater seep NES-5 and Seep Pond have ranged from 3.95 mg/L (fall 2016) to 9.64
mg/L (spring 2016) (Table 3-5). Other COPCs that exceeded standards in the proposed study
area include: aluminum, cadmium, cobalt, iron, manganese, molybdenum, nickel, uranium, and
vanadium. The sulfate and total dissolved solids concentrations exceeded their respective
secondary standards (250 and 500 mg/L). Figure 3-7 summarizes the results for the fall 2017
and spring 2018 total selenium concentrations.
Major-ion chemistry data indicate that the groundwater is a calcium-sulfate type water. The
groundwater is high in hardness (between 865 and 2,580 mg/L as CaCO3), high in sulfate (692
and 2,210 mg/L) and high in total dissolved solids (between 1260 and 3460 mg/L), with circum-
neutral pH (average pH of 6.6). Groundwater temperatures range between 3.5 and 12 degrees
Celsius.
1 Slug tests were analyzed using the Bouwer – Rice (1976) and Hvorslev (1951) Slug Test Solutions assuming an unconfined
aquifer model using the Aqtesolv Aquifer Test Analysis software.
PRB Pilot Study Conceptual Implementation Plan Conda/Woodall Mountain Mine October 2018
S:\Jobs\0442-001-900-Simplot-Conda\RIFS_PilotStudy\PRB\DesignImplemtationPln\Final\FnlPRBtreatImplPln_10022018.docx
14
4.0 DATA QUALITY OBJECTIVES
The following sub-sections describe the types and quality of data needed to support the evaluation
of the PRB’s implementability and effectiveness, consistent with USEPA’s Guidance for
Conducting Treatability Studies under CERCLA (USEPA 1992).
4.1 Problem and Decision Statements
Problem Statement - Levels of COPCs in shallow groundwater at the NTCRA exceed
groundwater standards.
Decision Statement - Does the PRB system effectively and consistently remove COPCs to levels
below the groundwater MCL?
4.2 Inputs to the Decision and Decision Rules
To evaluate whether the PRB can effectively remove selenium and other COPCs, NES-5 Seep
Pond water and downgradient shallow alluvial groundwater will be tested, and the following inputs
are needed, and rules apply.
Decision Input - What are the COPC concentrations in both the influent and the treated effluent?
Decision Rule - If COPC concentrations in the treated effluent are consistently at levels at or
below the MCL, then the system is effective in removing COPCs.
4.3 Null Hypothesis and Limits on Decision Errors
The null hypothesis for this study is that the PRB cannot effectively remove COPCs to levels
below the MCL. The alternative is that this technology can reduce COPC concentrations to levels
below the MCL.
There are two types of decision errors, classified as a false rejection error (Type 1) and a false
acceptance error (Type 2). A Type 1 error is determining that COPC concentrations in the effluent
are below the MCL, indicating that the treatment is effective, when in fact COPC concentrations
in the effluent remain above the MCL and the treatment does not provide sufficient concentration
reductions. A Type 2 error is determining that COPC concentrations remain above the MCL in
the treated effluent, indicating ineffective treatment, when in fact COPC concentrations have
decreased to levels below the MCL and effective treatment occurs. A Type 1 error may result in
inadequate treatment and continued discharge of elevated COPC concentrations. A Type 2 error
may result in unnecessary further treatment.
PRB Pilot Study Conceptual Implementation Plan Conda/Woodall Mountain Mine October 2018
S:\Jobs\0442-001-900-Simplot-Conda\RIFS_PilotStudy\PRB\DesignImplemtationPln\Final\FnlPRBtreatImplPln_10022018.docx
15
To control decision errors, only quantitative data with acceptable accuracy and precision
documentation will be used for comparison to groundwater standards. Samples will be analyzed
by laboratories in good standing, using USEPA-approved methods with detection limits below the
standards. Measurement errors will be minimized by implementing standard operating
procedures for the sample collection, handling, preparation and analysis methods.
4.4 Optimizing the Sampling Design
The sampling design, strategy and QA/QC requirements are presented in Section 7. Additional
samples may be collected during the Field-Scale PRB Pilot Study, if and as necessary, to increase
the confidence of the decision.
PRB Pilot Study Conceptual Implementation Plan Conda/Woodall Mountain Mine October 2018
S:\Jobs\0442-001-900-Simplot-Conda\RIFS_PilotStudy\PRB\DesignImplemtationPln\Final\FnlPRBtreatImplPln_10022018.docx
16
5.0 STUDY DETAILS
This section summarizes the results of bench-scale studies conducted in support of the Field-
Scale PRB Pilot Study and presents the proposed pilot study approach.
5.1 Bench-Scale Studies
Simplot conducted bench-scale studies to evaluate treatment media and residence time
requirements for the Pilot Study. The following bench-scale testing was conducted:
• Batch leach testing to evaluate general properties of the proposed treatment media and
provide insight into anticipated effluent chemistry.
• Column reactor studies to determine the residence time required to effectively remove
selenium and other COPCs and achieve groundwater quality standards.
The bench-scale studies were conducted using water collected from the NES-5 Seep Pond and
alluvial groundwater collected downgradient of the pond. The treatment media evaluated in the
bench-scale studies consisted of 50 percent well-graded sand (granular support media), as well
as 12.5 percent chopped alfalfa hay and 37.5 percent woodchips/shavings by volume (organic
carbon source to enhance microbial activity). 1F
2 The sand is relatively inert, and its function is to
maintain the permeability of the treatment media as the organic components degrade. The alfalfa
and woodchips are short- and long-term sources of degradable organic material to support the
microbial community. The results of the bench-scale studies are described in a technical
memorandum provided in Appendix C and are briefly summarized below.
5.1.1 Batch Leach Tests
Batch leach tests were conducted on the individual components of the proposed treatment media
to identify potential unexpected by-products from the media/site-water interaction. A total of four
samples were tested (alfalfa hay, woodchips/shavings, sand, and a solution blank). Treatment
media samples were placed in capped bottles with equal proportions of contaminated water to
media mass (or surface area). After shaking the samples for 24 hours, the leachate in each
sample container was analyzed and results were compared to site water chemistry to determine
whether a difference exists. The tests were conducted using the NES-5 seep water because it
had a higher dissolved selenium concentration (3.37 mg/L) than the site groundwater (0.944
mg/L) based on the results of post-shipping water quality samples. Table 5-1 summarizes the
results of the batch leach tests.
Changes observed in water chemistry during the batch leach tests include the following:
2 This initial mixture is based on the findings in successful field-scale tests and full-scale implementation of bio-mulch
PRBs by P4 Production, LLC at their South Rasmussen Mine (NewFields 2016).

PRB Pilot Study Conceptual Implementation Plan Conda/Woodall Mountain Mine October 2018
S:\Jobs\0442-001-900-Simplot-Conda\RIFS_PilotStudy\PRB\DesignImplemtationPln\Final\FnlPRBtreatImplPln_10022018.docx
17
• The barium concentration in leachate from wood chips was higher than in seep water
(0.413 mg/L vs. 0.0243 mg/L).
• The copper concentration in the alfalfa batch leachate was 0.0629 mg/L compared to
below the laboratory reporting limit (0.01 mg/L) in seep water.
• The manganese concentration was lower in the seep water (0.046 mg/L) compared to 0.6,
1.3, and 0.08 mg/L in leachate samples from the alfalfa, wood chips, and sand,
respectively.
Greater than 99 percent of the selenium in the seep water was removed during the 24-hour batch
leach test of the alfalfa-seep water mixture (Table 5-1). This suggests that the alfalfa readily
releases soluble organic carbon, resulting in the initial reducing conditions necessary for selenium
reduction to take place. Selenium was not appreciably affected by the wood chips or sand
components of the media.
5.1.2 Column Leach Studies
Following the batch leach tests, column reactor studies were conducted to evaluate residence
time requirements for removal of selenium and other constituents. The columns were constructed
from 2-inch diameter Polyvinyl chloride (PVC) pipe and were 30 inches in length. The columns
were packed with the proposed ratio of sand, chopped alfalfa, and woodchips/shavings (50
percent sand, 12.5 percent alfalfa and 37.5 percent wood chips by volume). Two replicated
columns were run using seep water and two replicate columns were run using shallow
groundwater collected from the site. The seep water was spiked with sodium selenate to increase
the total selenium concentration in the water to 9.61 mg/L.
Prior to initiating the tests, the columns were saturated with site water, capped, and allowed to
equilibrate for several days to allow biological activity and reducing conditions to develop. Water
was then pumped through the columns in an up-flow configuration such that the total contact time
within the bed was approximately 12 hours. Samples were collected from the column influent,
effluent, and from three ports along the column bed after 25 and 50 pore volumes (PV) for
laboratory analysis. Tables 5-2 and 5-3 summarize the results of the column leach tests.
As shown in Tables 5-2 and 5-3, the 25 and 50 PV samples results indicate that the proposed
treatment media is capable of reducing selenium concentrations by more than 98 percent. The
25 PV and 50 PV effluent sample results for both the seep and groundwater columns were similar,
indicating that reducing conditions were established within the columns prior to 25 PV. For the
groundwater, total selenium concentrations in the influent ranged from 0.843 to 0.913 mg/L, while
the selenium concentrations in the effluent ranged from 0.007 to 0.021 mg/L (below the Idaho
groundwater quality standard of 0.05 mg/L) (Tables 5-2 and 5-3). For the seep water, total
selenium concentrations in the influent at 25 and 50 PV were 9.05 and 8.21 mg/L, while selenium

PRB Pilot Study Conceptual Implementation Plan Conda/Woodall Mountain Mine October 2018
S:\Jobs\0442-001-900-Simplot-Conda\RIFS_PilotStudy\PRB\DesignImplemtationPln\Final\FnlPRBtreatImplPln_10022018.docx
18
concentrations in the effluent were 0.056 to 0.067 mg/L, respectively (slightly above the primary
groundwater standard).
Total arsenic and iron were not detected above laboratory reporting limits in seep and
groundwater column influent samples but were detected in the 25 and 50 PV effluent samples
from the columns (Tables 5-2 and 5-3). In addition, manganese was detected in the 25 and 50
PV effluent samples from the seep and groundwater columns at concentrations that were one to
two orders of magnitude higher than the influent concentrations. These results indicate that these
constituents may be mobilized by reducing conditions generated by the treatment media.
However, it is anticipated that as the treated water mixes oxygenated groundwater downgradient
of the groundwater PRB (and conditions become less reducing) these constituents will become
immobile. Section 7 describes how the sampling will allow for monitoring of arsenic, iron, and
manganese mobilization.
Simplot doubled the HRT of the seep columns to 24 hours after the 50 PV samples were collected
to evaluate whether additional residence time would reduce total selenium concentrations in the
column effluent to below 0.05 mg/L. However, total selenium concentrations in the effluent of the
two seep columns remained slightly above the groundwater standard at concentrations of 0.0513
and 0.0572 mg/L after an additional 7 PV at the reduced flow rate. This indicates that an HRT of
more than 24 hours may be required to achieve the groundwater standard when influent total
selenium concentrations are near 9 mg/L.
5.2 Field-Scale Treatability Study Approach
Considering the efficacy of the treatment media in reducing selenium concentrations in both NES-
5 seep water and groundwater, Simplot proposes to evaluate a two-stage treatment system
(Appendix D) for the field-scale study. The proposed two-stage system would remove the seep-
pond exposure pathway and would also allow for greater HRT for the treatment of the shallow
groundwater. The two-stage treatment system includes the following:
1. Reactive media installed in the NES-5 Seep Collection Pond and adjacent sedimentation
basins (Seep Treatment Cell).
2. A PRB constructed in unconsolidated deposits and weathered bedrock downgradient of
the NES-5 Seep Pond to treat shallow groundwater (Groundwater Treatment PRB).
The NES-5 Seep Pond and adjacent sedimentation basins will be filled with treatment media and
covered to provide treatment of the seep water. Effluent from the Seep Treatment Cell,
anticipated to be at or below the selenium MCL, will be infiltrated into the downgradient
groundwater. The downgradient PRB will provide treatment of the shallow groundwater/re-
infiltrated seep mix. Based on the results of the bench-scale studies (Appendix C), it is anticipated
that effluent from the PRB will be below the MCL for selenium. The proposed approach for the

PRB Pilot Study Conceptual Implementation Plan Conda/Woodall Mountain Mine October 2018
S:\Jobs\0442-001-900-Simplot-Conda\RIFS_PilotStudy\PRB\DesignImplemtationPln\Final\FnlPRBtreatImplPln_10022018.docx
19
treatability study is shown in conceptual drawings provided in Appendix D and described further
below.
Simplot believes that the sediment basins have served their purpose and sediment transport from
the Pedro NTCRA is limited due to the effective vegetation cover. Continued inspection of the
NTCRA will document the amount of sediments that are being deposited in the check-dams and
dissipation structures.
5.2.1 Treatment Media
Based on the results of the bench-scale studies (Appendix C), the proposed treatment media for
the field-scale study will consist of the following materials (percent by volume):
• 50 percent granular support media (well graded sand obtained from Jack B Parson
Company in Soda Springs, Idaho)
• 12.5 percent chopped alfalfa hay
• 37.5 percent wood chips/shavings.
A test mix of the treatment media was submitted to a material testing laboratory to confirm the
hydraulic conductivity of the media is higher than the anticipated range of conductivities for the
surrounding native material (0.3 ft/day [silty sands] to 50 ft/day [possible for gravelly matrix above
water table]). Results of the analysis (provided in Appendix D) indicate that the treatment media
will have a hydraulic conductivity of approximately 65.2 ft/day.
5.2.2 Seep Treatment Cell
The NES-5 Seep Pond and Northeast Sedimentation Basin will be converted to a seep treatment
cell to evaluate the treatment of water with elevated selenium concentrations, such as the
groundwater discharging at the NES-5 seep.2F
3 As shown on the conceptual drawings in Appendix
D, the berm that separates the NES-5 seep collection basin from the sedimentation basin will
remain in place to provide initial treatment of the seep water. The treatment media in the Seep
Treatment Cell will be covered with Dinwoody Formation material, a minimum of 18-inches thick.
The cover, together with the fact that the treatment mix directly below the contact with the cover
will be unsaturated (considering the elevation of the effluent culvert) (Sheet 4, Appendix D) will
ensure that freezing in the saturated part of the cell will not be a concern. Treated effluent from
the seep pond will flow into the sedimentation-basin for additional treatment. The compacted clay
liner of the NES-5 Seep Pond will remain in place. The existing sedimentation basin spillway will
be modified to allow for treated water from the Seep Treatment Cell to be conveyed to an
3 Treatment media will be added to the basins without altering of structural features, such that the basins can be returned
to intended functions if the media cannot treat selenium to levels below MCL.
PRB Pilot Study Conceptual Implementation Plan Conda/Woodall Mountain Mine October 2018
S:\Jobs\0442-001-900-Simplot-Conda\RIFS_PilotStudy\PRB\DesignImplemtationPln\Final\FnlPRBtreatImplPln_10022018.docx
20
infiltration gallery which is tied into the downgradient Groundwater Treatment PRB. The modified
spillway will allow for the measurement of the effluent flow rate prior to discharging into the
infiltration gallery. The infiltration gallery will extend from the base of the sedimentation basin
spillway to the Groundwater PRB and will be approximately 2 to 10 feet deep, filled with clean
gravel with minimal fines, and enclosed by non-woven geotextile covered with Dinwoody material
(Sheet 4, Appendix D). The non-woven geotextile allows for water to seep out of the bottom of
the drain, beginning the process of re-infiltrating the treated seep water for treatment in the PRB.
The infiltration gallery will have a higher permeability then the PRB media, causing the water to
get distributed within the gallery and reducing the potential for short-circuited flow across the PRB.
The North Chute and North Channel that currently route runoff from the Pedro Creek ODA to the
Northeast Sedimentation Basin will be rerouted to direct runoff to the Pedro Creek drainage. In
May 2017, surface water samples were collected from the runoff in the North Chute and North
Channel. Total selenium concentrations in the runoff samples ranged from 0.0016 mg/L to 0.018
mg/L (Table 5-4). Selenium concentrations at the mouths of both the North Chute and North
Channel were below the Ambient Water Quality Criterion (AWQC) (Table 5-4). The runoff, as
well as any treated seep or groundwater discharging into the creek bed would be orders of
magnitude lower in selenium concentration then the seep and runoff mix overflowing from the
sedimentation basin (6.3 and 8.6 mg/L in 2017).
5.2.3 Groundwater Treatment PRB
The Groundwater Treatment PRB will be constructed downgradient of the Seep Treatment Cell
and aligned perpendicular to the general groundwater flow direction. The final dimensions of the
Groundwater Treatment PRB (length and depth) will be determined during construction based on
field conditions encountered (e.g., extent of water producing zones vertically and laterally). The
trench will be vertically keyed into silty/clayey weathered-Dinwoody-Formation material to prevent
groundwater flow from bypassing the PRB. Laterally, the trench will extend into dry silty/clayey
material (if present), or simply dry unconsolidated/consolidated deposits. Treatment media will
be placed in the trench to a depth of approximately 2 feet bgs to accommodate anticipated
seasonal fluctuation in groundwater elevations, and additional volume from the Seep Treatment
Cell effluent, as well as minimize freezing of the near-surface water in the media. Groundwater
levels in monitoring wells recently installed in the area ranged from approximately 9 to 20 feet bgs
in October 2017 and 2 to 23 feet bgs in May 2018. However, groundwater elevations in upgradient
monitoring well GW-41-MA have fluctuated by as much as 13 feet between spring and late
summer/early fall.
The hydraulic conductivity of the shallow water bearing zone in the area of the proposed
Groundwater Treatment PRB will control flux (flow) into and out from the treatment media. There
are a range of estimates of hydraulic conductivity in the shallow water bearing zone which leads
to a range of estimates of the rate of groundwater flux through the PRB. Slug test results suggest
that fine-grained sediments in the area have a hydraulic conductivity as low as 0.3 ft/day, while
PRB Pilot Study Conceptual Implementation Plan Conda/Woodall Mountain Mine October 2018
S:\Jobs\0442-001-900-Simplot-Conda\RIFS_PilotStudy\PRB\DesignImplemtationPln\Final\FnlPRBtreatImplPln_10022018.docx
21
coarser-grained alluvium channel deposits (such as observed above the water table in the PRB-
area borings) may have hydraulic conductivity as high as 50 ft/day (Freeze and Cherry 1979).
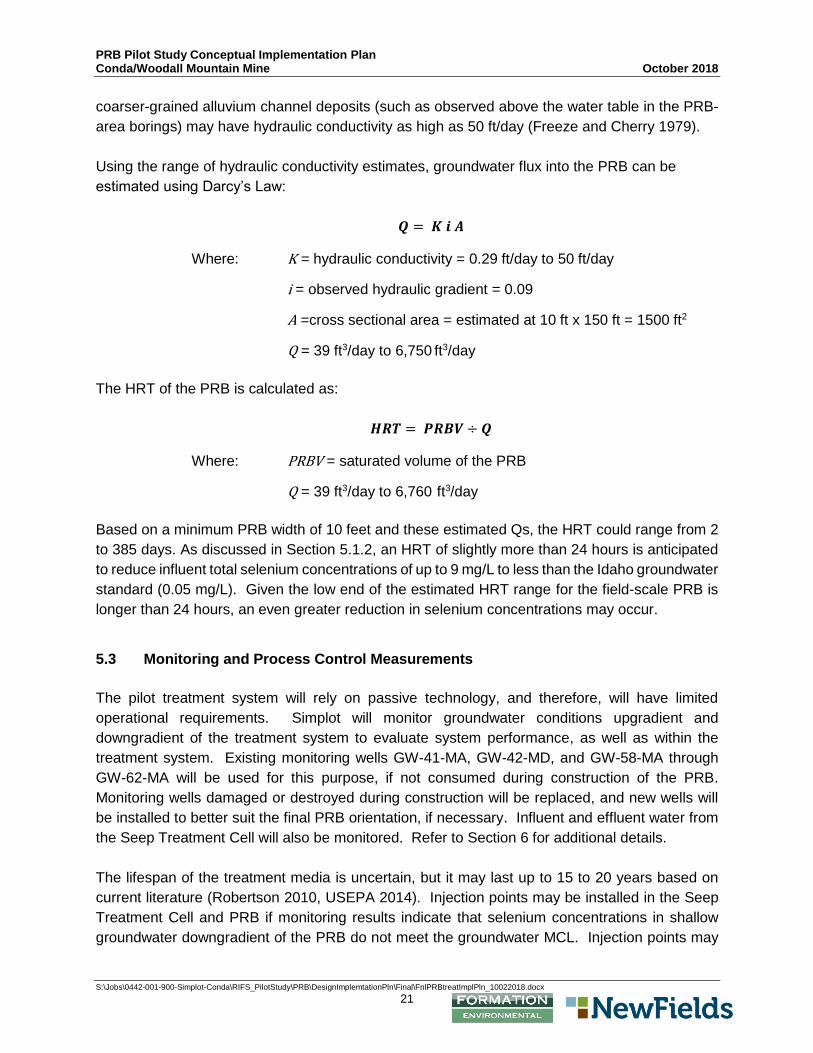
Using the range of hydraulic conductivity estimates, groundwater flux into the PRB can be
estimated using Darcy’s Law:
𝑸 = 𝑲 𝒊 𝑨
Where: K = hydraulic conductivity = 0.29 ft/day to 50 ft/day
i = observed hydraulic gradient = 0.09
A =cross sectional area = estimated at 10 ft x 150 ft = 1500 ft2
Q = 39 ft3/day to 6,750 ft3/day
The HRT of the PRB is calculated as:
𝑯𝑹𝑻 = 𝑷𝑹𝑩𝑽 ÷ 𝑸
Where: PRBV = saturated volume of the PRB
Q = 39 ft3/day to 6,760 ft3/day
Based on a minimum PRB width of 10 feet and these estimated Qs, the HRT could range from 2
to 385 days. As discussed in Section 5.1.2, an HRT of slightly more than 24 hours is anticipated
to reduce influent total selenium concentrations of up to 9 mg/L to less than the Idaho groundwater
standard (0.05 mg/L). Given the low end of the estimated HRT range for the field-scale PRB is
longer than 24 hours, an even greater reduction in selenium concentrations may occur.
5.3 Monitoring and Process Control Measurements
The pilot treatment system will rely on passive technology, and therefore, will have limited
operational requirements. Simplot will monitor groundwater conditions upgradient and
downgradient of the treatment system to evaluate system performance, as well as within the
treatment system. Existing monitoring wells GW-41-MA, GW-42-MD, and GW-58-MA through
GW-62-MA will be used for this purpose, if not consumed during construction of the PRB.
Monitoring wells damaged or destroyed during construction will be replaced, and new wells will
be installed to better suit the final PRB orientation, if necessary. Influent and effluent water from
the Seep Treatment Cell will also be monitored. Refer to Section 6 for additional details.
The lifespan of the treatment media is uncertain, but it may last up to 15 to 20 years based on
current literature (Robertson 2010, USEPA 2014). Injection points may be installed in the Seep
Treatment Cell and PRB if monitoring results indicate that selenium concentrations in shallow
groundwater downgradient of the PRB do not meet the groundwater MCL. Injection points may
PRB Pilot Study Conceptual Implementation Plan Conda/Woodall Mountain Mine October 2018
S:\Jobs\0442-001-900-Simplot-Conda\RIFS_PilotStudy\PRB\DesignImplemtationPln\Final\FnlPRBtreatImplPln_10022018.docx
22
also be installed if an increasing selenium concentration trend is present in downgradient
groundwater (indicating that available carbon in the treatment media has been consumed). Liquid
carbon amendments would be injected into the treatment media to enhance the performance of
the Seep Treatment Cell and Groundwater PRB and/or extend their useful life. Agency approval
would be obtained prior to installing the injection points and amendment injection.
The Groundwater PRB will be installed below ground and the Seep Treatment Cell will include a
soil cover, which will insulate the media against freezing conditions. Microbial reduction of
selenium is temperature dependent and will be slower during colder temperatures. However,
flows to the Seep Treatment Cell and Groundwater PRB will be also be lower during winter
months. This will result in longer residence times that may potentially offset the effects of the
colder temperatures. The effects of colder temperatures on the performance of the media will be
monitored during the study.
PRB Pilot Study Conceptual Implementation Plan Conda/Woodall Mountain Mine October 2018
S:\Jobs\0442-001-900-Simplot-Conda\RIFS_PilotStudy\PRB\DesignImplemtationPln\Final\FnlPRBtreatImplPln_10022018.docx
23
6.0 STUDY IMPLEMENTATION PROCEDURES
This section describes the approach for implementing the Field-Scale PRB Pilot Study.
6.1 Construction
It is anticipated that the Field-Scale PRB construction will begin in September 2018 when surface
water and groundwater are at their lowest flow or elevation, respectively. It is anticipated that the
construction will require three to four weeks to complete. Weather conditions could increase or
decrease the required time necessary to complete the construction. Best Management Practices
(BMP) will be implemented during and following construction to minimize erosion.
6.1.1 Site Preparation Activities
Site preparatory activities were begun in September 2017 to facilitate the supplemental
hydrogeological characterization activities. Activities included the construction of an access road
and clearing and grubbing in the proposed Groundwater Treatment PRB area. Ground cover
vegetation and topsoil was left in place as much as possible, to minimize the potential for sediment
transport into the Pedro Creek drainage. Silt fences were installed during the clearing and
grubbing process alongside some of the slash and tree trunks that were placed at the downslope
edge for use as erosion control. The silt fences will be inspected for integrity prior to commencing
excavation activities. In addition, the stormwater diversion channel will be constructed to a
functional level, prior to commencing excavation activities.
6.1.2 Cultural Resource Survey
No cultural resources were identified in the area during the site preparation work for the NTCRA
construction. However, if any paleontological or archaeological objects are discovered during the
construction, work will be immediately halted in the area of the discovery. A professional
archaeologist will be summoned to the site to assess the value of any object encountered and
make recommendations to the State Historic Preservation Office (SHPO). If the archeologist
determines that the find is an actual cultural resource, at the direction of the SHPO, the
construction will be suspended in the area of the discovery until it is appropriately documented or
removed. Construction will resume when authorized by the appropriate professionals and
Agencies.
6.1.3 Construction of the Pilot Study
All stormwater BMPs will be in place prior to commencing any earth work activities. The BMPs
are presented and discussed in Section 6.2 and in Appendix E. The drawings for the construction
of the pilot study are presented in Appendix D.
PRB Pilot Study Conceptual Implementation Plan Conda/Woodall Mountain Mine October 2018
S:\Jobs\0442-001-900-Simplot-Conda\RIFS_PilotStudy\PRB\DesignImplemtationPln\Final\FnlPRBtreatImplPln_10022018.docx
24
As previously mentioned, the pilot study will be field fitted to conditions encountered. Therefore,
the depicted alignment and dimensions of the PRB may change based on conditions encountered
during excavation. A geologist will be present during the excavation of the Groundwater PRB to
evaluate the lithology encountered and work with the engineer to determine the lateral and vertical
extent of the PRB. The vertical extent of the PRB will be based on the thicknesses of the silty-
clayey Dinwoody lenses encountered. The objective is to maximize the thickness of the PRB,
while having the bottom of the PRB terminate in material with the most clay content. The depth of
the PRB may vary across the length of the PRB. The length of the PRB will depend on the extent
of the saturated conditions in the unconsolidated deposits, with the trench extending 5 feet into
dry deposits (unconsolidated or consolidated). As built drawings will document final dimensions
and alignments of all features, as well as volumes of reactive media used.
The reactive media will be batch-mixed following procedures described in SOP 30 (Appendix E)
and visually evaluated for uniformity of distribution between the sand and organic material, prior
to being hauled and placed inside the PRBs. In addition the treatment mix will be tested for
hydraulic conductivity at a rate of one per 1,000 cubic yard. An excavator will be used to dig the
trench for the Groundwater Treatment PRB. If unstable wall conditions are encountered, the
trench will be either over-excavated to facilitate the installation of the treatment media, or a trench
box will be used. The trench will be backfilled with the treatment media as the excavation
progresses, to limit the potential for cave-in of the excavation walls, as well as the area of open
excavation where water can pool. A portion of the excavation will remain open to keep media out
of the area where the excavator is working.
The infiltration gallery, allowing treated seep water to infiltrate into the shallow groundwater for
further treatment by the PRB, will extend from below the basin embankment to the Groundwater
PRB (Sheets 3 and 4, Appendix D). The infiltration gallery will be constructed using coarse drain
rock, similar to the subsurface NES-5 seep collection drain. Minimum dimensions of the infiltration
gallery will be at least as large as the NES-5 seep collection drain, which is the source of influent
into the Seep Treatment Cell, and therefore will be capable of conveying flows exiting the Seep
Treatment Cell. The overflow drain from the Seep Treatment Cell (Sheet 5, Appendix D) will be
constructed to accept and convey 100 percent of the discharge from the Seep Treatment Cell into
the infiltration gallery.
The NES-5 Seep Pond, and the Northeast Sedimentation Basin central and north cells will be
dewatered as much as possible prior to placement of the treatment media. Water from these
features will be pumped into the infiltration gallery for the Groundwater Treatment PRB. If the
volume of water pumped out the pond and sedimentation basin and into the infiltration basin is
insufficient to adequately lower the water levels to allow for the placement of the treatment media,
the remainder of the water will be pumped into temporary storage tanks. Any water stored in
storage tanks will be fed back into the Seep Treatment Cell prior to construction of the cover. As
previously described, the NES-5 Seep Pond embankment and compacted clay lining will be left
in place.
PRB Pilot Study Conceptual Implementation Plan Conda/Woodall Mountain Mine October 2018
S:\Jobs\0442-001-900-Simplot-Conda\RIFS_PilotStudy\PRB\DesignImplemtationPln\Final\FnlPRBtreatImplPln_10022018.docx
25
Non-woven geotextile will be placed over the treatment media to prevent the entrainment of fines
into the PRB. The textile will be anchored at the edges of the treatment material using
manufacturer approved staples. The textile will be overlapped shingle style perpendicular to the
top grade of the treatment material. Dinwoody Formation material will be placed over the non-
woven geotextile. The Dinwoody Formation cover will be a minimum of 18-inches thick and will
be carefully placed to minimize disturbance of the non-woven geotextile.
The North Chute and North Channel will be re-routed into a diversion channel lined with a high-
density polyethylene (HDPE) textured liner (Sheet 3, Appendix D). The diversion channel will by-
pass the Seep Treatment Cell, and discharge into an energy dissipation structure prior to
conveying runoff into the Pedro Creek drainage below the Groundwater Treatment PRB.
Changes to the approved final design identified as necessary will be documented with
Engineering Change Orders (ECOs) and submitted to the Agencies for review, prior to
construction. If the Agencies determine that the ECO does not constitute a significant design
change, comments (if any) will be provided to Simplot. Simplot will incorporate the Agencies’
comments, issue a final ECO, and implement the change. If the Agencies determine that the
ECO constitutes a significant design change, comments on the draft ECO may be submitted to
Simplot. Simplot will address and/or incorporate the comments and will submit a final ECO to the
Agencies for signature prior to implementing the changes noted in the ECO. Simplot will work
with the Agency representative(s) to collaboratively resolve any substantive design changes
identified as necessary during the construction process.
6.2 Best Management Practices
BMPs will be implemented during construction to minimize the transport of fines and sediments
to Pedro Creek. BMPs will primarily include the placement of silt fence downgradient of the
construction site and re-routing any active flow from the Northeast Sedimentation Basin away
from the work area. As previously mentioned, the construction will be planned for late summer/
early fall when the area is relatively dry. Once construction has been completed, the area will be
hydromulched, seeded with native species, and straw wattles will be placed where needed to
reduce erosion. BMPs will inspected daily during construction. Following construction, inpections
will occur during the monthly sampling and will be documented on field forms (Appendix E) and
in field notebooks.
6.3 Monitoring and Treatment Optimization
The PRB is a passive treatment system and it is anticipated there will only be limited operational
needs. Treatment monitoring and optimization will include the following.
Visual Inspections – The Seep Treatment Cell, Infiltration Gallery, and Groundwater PRB and
associated features will be inspected monthly for operation as intended. The diversion channel
PRB Pilot Study Conceptual Implementation Plan Conda/Woodall Mountain Mine October 2018
S:\Jobs\0442-001-900-Simplot-Conda\RIFS_PilotStudy\PRB\DesignImplemtationPln\Final\FnlPRBtreatImplPln_10022018.docx
26
berms, culvert, channel, and EDS will be inspected for integrity. The erosion controls will be
inspected to ensure that they remain functional while the vegetation gets established. The
diversion channel berms, areas downgradient of the diversion channel discharge, and erosion-
control BMPs will also be inspected following a 10-year, 24-hour rainfall event, which would entail
events generating 2” of precipitation or greater over a 24-hr period (NOAA 2006). If conditions
indicate excessive erosion of the diversion berms and area downgradient of the EDS, Simplot will
work with the Agencies to evaluate corrective actions. In addition, the groundsurface in the areas
of the Infiltration Gallery, and Groundwater PRB will be surveyed for expressions of moisture,
which would indicate disruption of flow through the reactive media.
Groundwater- and Seep-Treatment Monitoring – Groundwater monitoring will be performed
monthly using wells installed within and around the treatment system (Figure 6-1 and Sheet 3,
Appendix D). Monitoring wells placed to the side of the Groundwater Treatment PRB will be used
to evaluate whether contaminated groundwater is circumventing the PRB (Figure 6-1).
The Seep Treatment Cell influent and effluent will be monitored to assess the changes in
concentrations. The Seep Treatment Cell influent will be monitored using a piezometer installed
into the top two feet of the seep’s subsurface drain (Figure 6-1 and Sheet 3, Appendix D). If it
proves difficult to advance a boring into the subsurface drain, a boring will be advanced
immediately adjacent to the drain and a piezometer completed within. The water will be sampled
to confirm that it is representative of the NES-5 seep. The Seep Treatment Cell effluent (water
quality and flow) will be monitored at the modified sedimentation basin spillway discharge point,
prior to entering the infiltration gallery. Additional details on the proposed construction of these
monitoring points is shown on the design drawings (Appendix D). Wells will also be installed
within the treatment system to assess treatment progress (Figure 6-1).
One new well will be constructed downgradient of the Groundwater PRB (Figure 6-1 and Sheet
3, Appendix D). Well GW-59-MA will be sampled at discrete intervals to evaluate whether
selenium concentrations differ between the water-producing intervals identified at this location.
This information will be used to inform the monitoring interval for the new well to be installed
downgradient of the Groundwater PRB. In addition, if conditions encountered during excavation
warrant adjustments to the PRB alignment and dimensions, then new wells will be installed as
necessary. The new wells will be completed as piezometers (2-inch schedule 40 PVC), with the
well screens (2-inch schedule 40 PVC 0.02” slot) spanning the encountered water producing
intervals and anticipated spring groundwater elevations (based on the spring 2018 water levels).
Wells will be installed in accordance with SOPs included in the Agency-approved Hydrogeological
Characterization Work Plan (Formation 2017c) and included in Appendix E.
Sampling and inspections will be conducted monthly following construction, except if snow
conditions preclude safe access and sampling. If visual inspections identify the presence of
surface flow in the Infiltration Gallery or Groundwater PRB areas due to them reaching capacity
to receive Seep Treatment Cell effluent, flow measurement, field paramers and samples for
PRB Pilot Study Conceptual Implementation Plan Conda/Woodall Mountain Mine October 2018
S:\Jobs\0442-001-900-Simplot-Conda\RIFS_PilotStudy\PRB\DesignImplemtationPln\Final\FnlPRBtreatImplPln_10022018.docx
27
laboratory analysis will be collected. Samples submitted to the laboratories will be analyzed for
the parameters specified in Table 7-1. If visual inspections indicate that the BMPS .
Groundwater levels will be monitored in the monitoring wells using in well data loggers and manual
measurements on a monthly basis until access is limited by snow.
6.4 Investigation-Derived Waste Management
The Investigation Derived Waste (IDW) will consist of excavated trench material (with water) and
decontamination water. The excavated trench material will be consolidated in the NTCRA Water
and Sediment Management Cell. The decontamination water will be disposed on-site. Spent
treatment media will be analyzed as described in Section 7 to determine the proper course of
disposal in accordance with regulations. All disposable sampling materials and personal
protective equipment, such as disposable scoops, filters, gloves, and other items used in sample
processing will be disposed of as municipal waste at a Subtitle D Landfill. Drilling and well
development IDW, including drill cuttings, will be managed as close to the drill site as practicable
and consolidated on Simplot property.
PRB Pilot Study Conceptual Implementation Plan Conda/Woodall Mountain Mine October 2018
S:\Jobs\0442-001-900-Simplot-Conda\RIFS_PilotStudy\PRB\DesignImplemtationPln\Final\FnlPRBtreatImplPln_10022018.docx
28
7.0 SAMPLING AND ANALYSIS PLAN
This section details the procedures for sampling and data collection to be conducted during the
Field-Scale PRB Pilot Study.
7.1 Water Sampling and Analysis
Sampling to evaluate the pilot’s performance will occur at the groundwater and surface water
locations depicted on Figure 6-1. Surface water samples collected during baseflow conditions in
Pedro Creek, when groundwater discharge is the source of water in the creek, will also be used
to evaluate treatment. If there is moisture expressing at the surface of the Groundwater Infiltration
Gallery or Groundwater PRB, in sufficient quantities to allow for sampling, samples will be
collected.
Groundwater and surface water samples will be collected by methods found in SOP 4 and SOP
6 (Appendix E). Groundwater level and total well depth measurements will be obtained prior to
purging the well, and water level measurements will be repeated immediately following sampling
to estimate groundwater recharge. Wells will be purged and sampled using low pumping rates to
minimize pumping-developed gradients and decrease residence times across the treatment
media.
A flow-through cell will be used to measure pH, specific conductance, temperature, dissolved
oxygen (DO) and oxidation-reduction potential (ORP) during the sampling. Samples will be
analyzed for total and dissolved metals as well as the parameters listed on Table 7-1. Water will
be pumped through a 0.45 micrometer in-line, high-capacity filter for the filtered sample volumes.
The in-line filter will be purged with approximately 50 milliliters (mL) of sample water before the
laboratory container is filled. Filters and tubing will be used for only one sample. Samples will be
submitted to a laboratory for analysis using the methods listed in Table 7-1. These methods are
consistent with those specified in the RI/FS Work Plan (New Fields 2008) but have been revised
to reflect any updated laboratory methods. Laboratory analyses will be performed in accordance
with QA/QC procedures specified in Section 7.5. The laboratory methods selected provide
quantitative data for direct comparison to Idaho groundwater quality standards. These methods
will also provide useful data for tracking COPC concentration trends and persistence of reducing
conditions3F
4 at individual monitoring locations, if any are observed.
As previously mentioned, samples will be collected monthly.
4 To evaluate whether COPCs mobilized due to reducing conditions remain present.
PRB Pilot Study Conceptual Implementation Plan Conda/Woodall Mountain Mine October 2018
S:\Jobs\0442-001-900-Simplot-Conda\RIFS_PilotStudy\PRB\DesignImplemtationPln\Final\FnlPRBtreatImplPln_10022018.docx
29
7.2 Reactive Media Sampling and Analysis
Eight-point composite samples of the treatment media mix will be collected at a rate of one per
1,000 cubic yards and submitted to a material testing laboratory for measurement of the hydraulic
conductivity using ASTM Method D 5856 (ASTM 2015b). Prior to testing, each composite sample
will be compacted to approximately 83 percent of maximum dry density (as measured by ASTM
Method D 698 [ASTM 2012]) to approximate field compaction efforts. A minimum of three
composite samples will be collected from treatment-mix batches designated for the Seep
Treatment Cells (Seep Pond and Sedimentation Cells) and Groundwater PRB, each.
To evaluate the potential longevity of the treatment media, Simplot will collect reactive media and
water quality samples at the start of the study and again at the end of the study. 4F
5 If the system is
determined to be effective, an additional six core samples will be collected from the Seep
Treatment Cell and Groundwater PRB, each, at the end of the study. The core samples from the
Seep Treatment Cell and the Groundwater PRB will be composited into single containers and
homogenized (i.e., one composite media sample will be generated for the Seep Treatment Cell
and one composite sample will be generated for the Groundwater PRB). As shown in Table 7-2,
the above-mentioned media samples will be analyzed for the following constituents:
• Total carbon to determine the rate of change of the organic material in the media.
• Total sulfur to determine the amount of carbon in the media used to reduce sulfur in the
influent water. Increases in total sulfur will indicate the accumulation of sulfur by carbon
metabolism.
• Mineralogy (by x-ray diffraction and scanning electron microscopy) to evaluate the nature
and stability of adsorbed and precipitated compounds in the media.
In addition, water quality samples will be collected from the influent, effluent, and center of the
Seep Treatment Cell and Groundwater PRB. A pre-packed well screen will be installed in the
center of the Seep Treatment Cell and Groundwater PRB for the purpose of collection of water
quality samples from within the treatment cell and PRB. The water quality samples will be
collected immediately following the initiation of the study and at the end of the study. As shown
in Table 7-2, the samples will be analyzed for biochemical and chemical oxygen demand to
evaluate changes in oxygen consumption in the reactive media with time. Total and dissolved
organic carbon will also be analyzed to help assess the rate of carbon (organic material)
consumption in the media.
The core samples collected at the completion of the study will also be analyzed by the Toxicity
Characteristic Leaching Procedure (TCLP) to determine the leached concentrations of the 8
5 If it is determined that the treatment system is not effective, then there will be no need to resample the media to evaluate
longevity. If the system is effective, and the Agencies determine that it can remain operational while the CERCLA process of evaluating its inclusion as a component of the remedy proceeds, then Simplot will work with the Agencies to determine the best timeframe for resampling the media to allow for evaluating its longevity.
PRB Pilot Study Conceptual Implementation Plan Conda/Woodall Mountain Mine October 2018
S:\Jobs\0442-001-900-Simplot-Conda\RIFS_PilotStudy\PRB\DesignImplemtationPln\Final\FnlPRBtreatImplPln_10022018.docx
30
Resource Conservation and Recovery Act (RCRA) metals (arsenic, barium, cadmium, chromium,
lead, mercury, selenium, and silver) and to support the process of determining appropriate
disposal alternatives (if necessary) in accordance with regulations.
7.3 Sampling Equipment and Procedures
Sampling equipment will include peristaltic pumps, tubing, water quality meters, a water level
indicator, as well as others.
7.3.1 Equipment Testing and Calibration Procedures
A water quality meter will be used in conjunction with a flow-through cell to monitor field
parameters during the purging and sampling of each well. A water level indicator will be used to
measure the water level before, during, and after sampling.
The water quality meter will be calibrated each day prior to use to ensure that the accuracy and
reproducibility of the results are consistent with the manufacturer’s specifications and the project's
data needs. The water level indicator and peristaltic pump will be examined to certify that they
are in good operating conditions. This includes checking the manufacturer’s operating manual
and the instructions for each instrument to ensure that maintenance requirements are being met.
A water quality meter with an optical DO sensor will be used due to the potential for sulfur
compounds to interfere with membrane DO sensors.
7.3.2 Equipment Decontamination
The sampling program minimizes potential for cross-contamination by using clean disposable
equipment and by drawing the samples directly from the water sources. Each groundwater
monitoring well will have dedicated tubing that will remain within the casing to further minimize
the potential for cross-contamination. The water quality meter will be decontaminated as outlined
in SOP 13 (Equipment Decontamination, Appendix E).
7.3.3 Sampling Containers, Preservation and Storage
Sample containers will be pre-cleaned and will be provided by the laboratory. Samples will be
preserved immediately following collection in order to prevent or minimize chemical changes that
could occur during transit and storage. Preservation and storage requirements are listed in
Tables 7-1 and 7-2.
PRB Pilot Study Conceptual Implementation Plan Conda/Woodall Mountain Mine October 2018
S:\Jobs\0442-001-900-Simplot-Conda\RIFS_PilotStudy\PRB\DesignImplemtationPln\Final\FnlPRBtreatImplPln_10022018.docx
31
7.4 Sample Documentation and Handling
Sample collection activities will be documented in field notebooks and on field forms according to
methods outlined in SOP 1 (Appendix E). Field-notebook and field-form entries will, at a minimum,
include the information listed below:
• Project name and number;
• Location of sample;
• Data and time of sample collection;
• Sample identification numbers;
• Field measurements;
• Observations and weather conditions; and
• Personnel present.
Changes or deletions in the field book or on the data sheets will be recorded with a single strike
mark through the changed entry, with the sampler’s initials and the date recording the new entry.
All entries must remain legible. Additional instructions on field documentation procedures can be
found in SOP 1 (Appendix E).
During each sampling event, field personnel will record conditions as observed on the field form
provided in Appendix E.
7.4.1 Sample Designation
Samples will be assigned unique sample identification numbers. These numbers are required for
tracking the handling, analysis, and reporting status of all samples collected during monitoring.
Each identification number will provide date, location, type, and media information for the
individual sample.
The first field in the identification number identifies the Site and sampling month and year. For
example, samples collected at Conda during the pilot study in October 2018 will all have the prefix
“CD1018”.
The second field in the identification number identifies the location of the sample. For example,
“GW60MA” would be groundwater monitoring well GW-60-MA.
The third field identifies the sample matrix type and includes a numerical digit describing the
intended sample use. The matrix types are defined as:
GW: Groundwater
SW: Surface Water
PRB Pilot Study Conceptual Implementation Plan Conda/Woodall Mountain Mine October 2018
S:\Jobs\0442-001-900-Simplot-Conda\RIFS_PilotStudy\PRB\DesignImplemtationPln\Final\FnlPRBtreatImplPln_10022018.docx
32
RM: Reactive Media
The numerical digits are defined as:
0 - Primary sample;
2 - Field duplicate sample;
3 - Equipment rinsate or QA/QC blank sample; and
4 – Split primary sample.
Note that additional codes may be added as the project proceeds. The additions will be
communicated immediately to the field staff, data management team and project chemist.
The last two-digit number is unique to the specific sample. Numbers will begin with 01 and
increase consecutively as sampling tasks are implemented. For example:
CD1018-GW60MA-GW001, is a primary water sample collected in October 2018 and is the first sample collected from that location;
CD1018-GW59MA-GW202, is a field duplicate water sample collected from GW-59-MA in October 2018 and is from the second sampling round in that month; and
CD1018-PC9-SW001, is a surface water sample collected in October 2018.
Sample labels will be filled out as completely as possible using waterproof ink. At a minimum,
each label will contain the following information:
• Site location;
• Sample identification number;
• Date and time of sample collection;
• Analyses required;
• Preservative; and
• Sample type.
Site-specific samples to be used for the matrix spike/matrix spike duplicates (MS/MSDs) will be
identified on the sample label and chain-of-custody forms.
7.4.2 Sample Custody, Handling and Shipping
All the collected soil samples will be handled according to SOP 5 (Appendix E) and analyzed for
the COPC parameters by the laboratory methods summarized in Tables 7-1 and 7-2. Samples
will be placed on ice in an insulated cooler, together with packing material to prevent breakage
during shipment. Samples will be maintained under strict chain-of-custody (COC) protocols. A
PRB Pilot Study Conceptual Implementation Plan Conda/Woodall Mountain Mine October 2018
S:\Jobs\0442-001-900-Simplot-Conda\RIFS_PilotStudy\PRB\DesignImplemtationPln\Final\FnlPRBtreatImplPln_10022018.docx
33
COC record form will be completed for each shipping container (i.e., cooler, ice chest or other
container) of samples to be delivered to the laboratory for analysis.
7.5 Quality Assurance and Quality Control
This section describes the QA/QC that will be implemented as part of the study to ensure the best
quality data possible.
7.5.1 Data Quality Indicators
The data quality indicators (DQIs) for data collected in support of the Field-Scale PRB Pilot Study
are accuracy, precision, completeness, representativeness and comparability. The DQI control
limits are provided below along with the acceptance criteria for data collected in support of the
Pilot Study.
7.5.1.1 Accuracy
Accuracy is the degree of difference between the measured or calculated value and the true
value. Data accuracy or analytical bias may be evaluated by the analysis of laboratory control
samples (LCS) and/or MS samples for inorganic analytes, with results expressed as a percentage
recovery measured relative to the true (known) concentration. The percentage recovery for LCS
samples is given by:
𝑅𝑒𝑐𝑜𝑣𝑒𝑟𝑦(%) =𝐴
𝑇× 100
Where:
• A = measured concentration of the LCS; and
• T = known concentration.
The percentage recovery for MS samples is given by:
𝑅𝑒𝑐𝑜𝑣𝑒𝑟𝑦(%) =𝐴 − 𝐵
𝑇× 100
Where:
• A = measured concentration of the spiked sample;
• B = measured concentration of un-spiked sample; and
• T = concentration of spike added.
Field equipment blanks and laboratory blanks may be analyzed to quantify artifacts introduced
during sampling, transport or analysis that may affect the accuracy of the data. In addition, initial
and continuing calibration verification samples (ICV and CCVs) and initial and continuing
PRB Pilot Study Conceptual Implementation Plan Conda/Woodall Mountain Mine October 2018
S:\Jobs\0442-001-900-Simplot-Conda\RIFS_PilotStudy\PRB\DesignImplemtationPln\Final\FnlPRBtreatImplPln_10022018.docx
34
calibration blanks (ICB and CCB) may be used to verify that the sample concentrations are
accurately measured by the analytical instrument throughout the analytical run.
The acceptance criteria for accuracy of analyte measurements for the COPC for each of the
sample types to be analyzed are summarized in Tables 7-1 and 7-2. For this project, acceptable
limits for LCS recovery are between 80 and 120 percent for groundwater and surface water
samples. Acceptable MS recovery limits range from 75 to 125 percent. Control limits may change
based on the laboratory that performs the analysis, and a particular laboratory’s control limits may
also be used for the LCS recovery.
7.5.1.2 Precision
Precision is the level of agreement among repeated measurements of the same characteristic.
Data precision is assessed by determining the agreement between replicate measurements of
the same sample and/or measurements of duplicate samples, which may include LCS and LCS
duplicate (LCSD) samples, MS and MSD samples, laboratory duplicate sample pairs or field
duplicate sample pairs.
Precision is evaluated by calculating the relative percent difference (RPD) as given by:
𝑅𝑃𝐷(%) =|2 (𝑆1 − 𝑆2)|
𝑆1 + 𝑆2× 100
Where:
• S1 = measured sample concentration; and
• S2 = measured duplicate concentration.
When analytes are present at concentrations below or near the quantitation limit, precision may
be evaluated using LCS/LCSD or MS/MSD RPD results.
A measurement of precision is required for all sample types and analyses. An analytical duplicate
is the preferred measure of analytical method precision. The acceptance criteria for precision of
analyte measurements for the COPCs for each of the sample types to be analyzed are
summarized in Tables 7-1 and 7-2. For this project, acceptable control limits for surface water
and groundwater samples are MS/MSDs with RPD less than 30 percent, analytical duplicates
with RPD below 20 percent, and field duplicates with RPD below 30 percent. Control limits are
subject to change based on the laboratory that performs the analyses.
7.5.1.3 Completeness
Completeness is a measure of the number of valid results obtained from a measurement system
compared to the number of results projected to be obtained under normal conditions. Valid

PRB Pilot Study Conceptual Implementation Plan Conda/Woodall Mountain Mine October 2018
S:\Jobs\0442-001-900-Simplot-Conda\RIFS_PilotStudy\PRB\DesignImplemtationPln\Final\FnlPRBtreatImplPln_10022018.docx
35
sample results are those that are in compliance with project QC objectives. Completeness is
affected by such factors as sample bottle breakage, acceptance/non-acceptance of analytical
results and compliance with QA/QC elements of the project.
Percentage completeness is given by:
𝐶(%) =𝑉
𝑃× 100
Where:
• C = percentage completeness;
• V = number of valid measurements/data points obtained; and
• P = number of measurements/data points planned.
It should be noted that, occasionally, certain data are more critical to successful completion of a
project than others; therefore, while attainment of an overall completeness goal is important, it is
equally important that various subsets of the data be appropriately characterized. The project’s
completeness goals are 95 percent.
7.5.1.4 Representativeness
Representativeness is a qualitative objective, defined as the degree to which data accurately and
precisely represent the characteristic of a population, the parameter variations at a sampling point,
the process condition, or an environmental condition. Representativeness is achieved by
collecting a sufficient number of unbiased samples and implementing a QC program for the
sample analyses and data interpretation. The sampling approaches developed for a project
should provide samples that are representative of actual site conditions. Representativeness of
analytical results may be evaluated based on blank results (field and laboratory), laboratory QC
results, sampling locations and methodologies, and sampling frequencies.
Representativeness of individual sample analyses will be described on the basis of results
obtained from associated field and laboratory QC samples. The representativeness of sample
analyses will be considered acceptable as long as any detectable concentrations of analytes in
associated blanks are less than 5 times the method detection limit reported by the laboratory.
7.5.1.5 Comparability
Comparability is the confidence with which one data set can be compared to another.
Comparability is achieved by the use of appropriate and consistent sampling methods and
analytical methods and performing data evaluations. Comparability is also dependent on similar
QA objectives. All data should be calculated and reported in units consistent with standard
PRB Pilot Study Conceptual Implementation Plan Conda/Woodall Mountain Mine October 2018
S:\Jobs\0442-001-900-Simplot-Conda\RIFS_PilotStudy\PRB\DesignImplemtationPln\Final\FnlPRBtreatImplPln_10022018.docx
36
reporting procedures so that the results of the analyses can be compared with those of other
laboratories, if necessary.
7.5.2 Field Quality Control Samples
The field QC will consist of the collection of QC samples, decontamination of field sampling
equipment, and adherence to SOPs. These elements are described below.
Equipment rinsates samples and field duplicate samples will be collected to evaluate the accuracy
and reproducibility of the field sampling methods. Data collected in the field may lack
reproducibility due to natural variability and/or the field sampling methods. One duplicate and one
equipment blank sample will be collected for every 20 primary samples to evaluate the
reproducibility of field sampling methods and assess any influence from sample equipment and
sample containers. Field duplicates are useful in documenting combined field and laboratory
precision.
7.5.2.1 Field Duplicate Samples
Field duplicates are collected to measure the sampling and analytical variability associated with
the sample results. A duplicate sample is usually collected simultaneously with or immediately
after the corresponding original sample has been collected. The field duplicates are analyzed for
the same suite of analytical parameters as the original sample but are placed in different bottles
and labeled appropriately for separate analysis. There are no EPA criteria for evaluation of field
duplicate sample comparability; however, the RPD between the original sample and field
duplicate can be calculated for each parameter and compared to the project's precision goal.
Field duplicate RPDs greater than the project-specified precision goal indicate a high variability
associated with the sampling and analysis methods used.
Field duplicates will be collected at a rate of one per 20 primary samples, or no less than one per
sample event if the number of samples collected in a sampling event is less than 20 samples
7.5.2.2 Equipment Rinsate Blank Samples
An equipment rinsate consists of analyte-free reagent water (i.e., ASTM Type II) poured through
the sampling device or filtration equipment, collected in a clean sampling bottle, preserved as
needed, and analyzed blindly as a field sample. Equipment rinsate samples may be used to
demonstrate that sampling devices have been adequately cleaned between uses and provide for
representative samples. Analysis of an equipment rinsate quantifies any artifacts introduced into
the sample during collection. Potential sources of bias or cross-contamination include sampling
gloves and sampling equipment that may incidentally come into contact with the sample.
PRB Pilot Study Conceptual Implementation Plan Conda/Woodall Mountain Mine October 2018
S:\Jobs\0442-001-900-Simplot-Conda\RIFS_PilotStudy\PRB\DesignImplemtationPln\Final\FnlPRBtreatImplPln_10022018.docx
37
Equipment rinsates are analyzed for the same suite of analytical parameters as the associated
samples.
Equipment rinsate samples will be collected at a rate of 1 per 20 samples, or 1 per sampling event
(if less than 20 samples are collected).
7.5.3 Laboratory Quality Control Samples
The analytical methods selected will ensure that laboratory analysis is sufficiently sensitive,
accurate and precise to meet the objectives of the sampling. The laboratories used will perform
the requested analyses in accordance with referenced EPA methods and will operate under an
internal QA Management Plan. The laboratory will provide the following information to support
their analysis results for each parameter analyzed:
• Sample preparation method reference;
• Analytical method reference;
• Method detection limit;
• Reporting or practical quantitation limit;
• Units;
• Shipment temperature;
• Analysis date;
• Method blank result;
• Laboratory duplicate results and relative percent difference;
• Laboratory control standard recovery;
• Matrix spike (MS) recovery;
• Matrix spike duplicate (MSD) recovery;
• MS/MSD relative percent difference;
• Initial and continuing calibration verification results (dated);
• Chain of custody record; and
• Sample condition upon receipt.
The accuracy of laboratory analysis results will be evaluated using the results for recovery from
LCSs and MS samples. The precision of laboratory analyses will be evaluated using results from
duplicate analyses of LCSs and MS samples and review of duplicate results.

PRB Pilot Study Conceptual Implementation Plan Conda/Woodall Mountain Mine October 2018
S:\Jobs\0442-001-900-Simplot-Conda\RIFS_PilotStudy\PRB\DesignImplemtationPln\Final\FnlPRBtreatImplPln_10022018.docx
38
The appropriate type and frequency of laboratory QC samples will be dependent on the sample
matrix, analytical method, and the laboratory’s SOP. Laboratory QC samples will be analyzed in
addition to the calibration samples with each QC batch.
The data will be reviewed and evaluated along with the sample results (including field duplicate
and bottle/preservation blank and/or equipment blank results) to confirm that the data meet the
DQOs. Any data not meeting the quality requirements of this plan will be flagged to identify them
to data users and appropriately qualified.
7.5.3.1 Method Blank Samples
Project target analytes should not be detected in laboratory blanks at concentrations greater than
the method detection limit (MDL). Blank contamination, if found, will be evaluated using USEPA
Contract Laboratory Program National Functional Guidelines for Data Review (USEPA 2017a,
USEPA 2017b). The guidelines specify that sample concentrations less than five times the
amount detected in associated blanks should be qualified as non-detected (“U”).
7.5.3.2 Matrix Spike Samples
Laboratory MS samples are used to evaluate potential sample matrix effects on the accurate
quantitation of an analyte using the prescribed analytical method. Percent recoveries of target
analytes from MS samples should fall within the prescribed control limits. However, if other
QA/QC results are acceptable, there is no requirement to qualify sample results. Matrix
interference and other effects may cause low or high percent recoveries in samples.
7.5.3.3 Laboratory Instrument Calibration
Instruments used by the laboratory will be calibrated in accordance with the laboratory’s QA Plan,
Method SOPs, instrument manufacturer’s guidelines, and any specified EPA-method
requirements. When laboratory measurement instruments do not meet the calibration criteria of
the laboratory QA Plan, Method SOP or EPA method, then the instrument will not be used for
analysis of samples submitted under this plan. Calibration records and demonstration of
acceptable calibration results will be required elements of the laboratory’s data reporting.
Calibration records shall be available for review during internal or external performance and
system audits of the laboratory.
PRB Pilot Study Conceptual Implementation Plan Conda/Woodall Mountain Mine October 2018
S:\Jobs\0442-001-900-Simplot-Conda\RIFS_PilotStudy\PRB\DesignImplemtationPln\Final\FnlPRBtreatImplPln_10022018.docx
39
7.5.3.4 Quality Assessment and Corrective Actions
Field and laboratory procedures will be reviewed by persons having no direct responsibilities for
the activities being performed to determine conformance with technical and QA procedures.
Corrective actions will be implemented for each nonconformance identified.
The Field Team Leader will be responsible for taking and reporting required corrective action
during field activities. A description of deviations from the SAP and any corrective action will be
entered in the field notebook. The Laboratory QA Manager will be responsible for taking required
corrective actions in response to any problems with data quality during laboratory activities.
7.5.4 Data Review
Field measurements will be checked for errors and compared to prior measurements for accuracy.
Anomalous or suspect values will be noted, and an explanation provided. Laboratory results will
be checked for completeness, in order to assure that all the requested analyses were performed
along with the correct methodologies and detection limits.
Complete raw data packages from the laboratory will be evaluated to assess compliance with
DQIs. Data will also be evaluated to assess whether the measurement performance criteria for
accuracy and precision have been achieved. Laboratory method blanks, MS samples, laboratory
duplicate samples, LCS, and holding times will be validated in accordance with USEPA Contract
Laboratory Program National Functional Guidelines for Organic Superfund Method Data Review
(USEPA 2017a) and USEPA Contract Laboratory Program National Functional Guidelines for
Inorganic Data Review (USEPA 2017b). The laboratory will provide a QC summary suitable for
this level of review.
Data review will include but will not be limited to:
• Reviewing COC forms and laboratory data sheets to verify that samples were analyzed
within specified holding times. Samples which do not satisfy holding time and preservation
requirements will be noted and the reliability of the data assessed.
• Reviewing whether the calibration requirements were met.
• Evaluating the accuracy of chemical data using results from LCS and MS samples
prepared by the laboratory. The laboratory will calculate the percent recoveries for these
results. If the recoveries are outside the limits presented in this plan, action will be taken
by the laboratory to improve the precision of analytical results.
• Evaluating the precision of the chemical data by comparing original and duplicate sample
results. The laboratory will calculate RPD values for the laboratory duplicate samples. If
RPD values are outside the limits presented in this plan, action will be taken by the
laboratory to improve the precision of the analytical results.
PRB Pilot Study Conceptual Implementation Plan Conda/Woodall Mountain Mine October 2018
S:\Jobs\0442-001-900-Simplot-Conda\RIFS_PilotStudy\PRB\DesignImplemtationPln\Final\FnlPRBtreatImplPln_10022018.docx
40
• Reviewing all of the data for potential transcription errors, detection limit discrepancies
(laboratory only), data omissions, and suspect or anomalous values. If such errors or
deficiencies are found, the laboratory and/or field sampler will be contacted and the
appropriate corrective action taken.
The validated data will be evaluated and compared against the measurement and data quality
objectives, and the data’s usability with respect to addressing the Pilot Study objectives will be
determined. Adherence to field and laboratory protocols will be reviewed to establish the
effectiveness. All data will be summarized in tables and trends and relationships evaluated and
presented to determine if the data provides strong evidence for a particular action.
7.5.5 Data Management
When the review is completed and it is determined that the data are complete and reasonable,
final entry of the information into the database will be completed. The analytical laboratory will
report data by paper copy and in electronic file format. Paper laboratory reports and associated
field documentation will be filed, and the electronic data will be stored in a computer database.
PRB Pilot Study Conceptual Implementation Plan Conda/Woodall Mountain Mine October 2018
S:\Jobs\0442-001-900-Simplot-Conda\RIFS_PilotStudy\PRB\DesignImplemtationPln\Final\FnlPRBtreatImplPln_10022018.docx
41
8.0 DATA ANALYSIS AND REPORTING
The data collected as part of this Pilot Study will be evaluated to determine if the DQOs are met
and to evaluate and report the effectiveness of the treatment system.
8.1 Data Evaluation
Laboratory reports will document sample custody, analytical results and QA/QC, adherence to
prescribed protocols, nonconformity events, corrective measures, and/or data deficiencies. The
laboratory data will be reviewed and evaluated for accuracy and precision to ensure that the data
are of sufficient quality to assess the treatment’s performance. The review will confirm that all
requested analyses were performed using the procedures specified in Section 7 of this plan. The
review will also include evaluation of data quality using results from the laboratory’s data quality
analyses, including analytical duplicates, MSDs, and control samples or standards. Any
deviations from this plan or concerns regarding data quality will be resolved by working with the
laboratory, which may include request for reanalysis of samples.
Field measurements will also be reviewed before those data are reported. The field notes,
measurement entries, and any calculations will be subject to a peer review. Errors identified
during the review will be corrected by the field staff with documentation of the correction date.
8.2 Data Validation
Data validation will be performed by a third party using the general protocols and processes
described in the following documents, as applicable to the method calibration and QC limits
specified in Section 6 of this plan and to the extent possible when non-Contract Laboratory
Program (CLP) methods are used:
• Contract Laboratory Program National Functional Guidelines for Inorganic Data Review
(NFG; USEPA 2017); and
• Guidance for Labeling Externally Validated Laboratory Analytical Data for Superfund Use
(USEPA 2009).
Data validation will be performed using a "tiered" approach. One-hundred percent (100 percent)
of the data packages will be evaluated and qualified for all quantitative QC elements (e.g., spike
recoveries, method and field blank contamination, duplicate sample percent Relative Standard
Deviation (RSD), and instrument stability and performance [e.g., initial and continuing calibration
results, instrument tuning and internal standard areas]) using hard-copy summary forms. This
validation of 100 percent of the data is considered Tier 1, and it is equivalent to a “Stage 2B
PRB Pilot Study Conceptual Implementation Plan Conda/Woodall Mountain Mine October 2018
S:\Jobs\0442-001-900-Simplot-Conda\RIFS_PilotStudy\PRB\DesignImplemtationPln\Final\FnlPRBtreatImplPln_10022018.docx
42
Validation,” as defined in the USEPA guidance for labeling externally validated data (USEPA
2009).5F
6
Tier 2 of the project’s data validation is equivalent to an "USEPA CLP Level IV" validation and
essentially the same as “Stage 4 Validation” (USEPA 2009). 6F
7 The Tier 2 validation includes all of
the Tier 1 elements as well as a complete evaluation of all the raw data. A minimum 10% of the
data packages will undergo Tier 2 validation. The data packages selected for Tier 2 validation will
be representative of the pilot study samples as a whole.
The selected laboratory will be required to provide a USEPA Level IV data report for the sample
sets targeted by Simplot for Tier 2/Level IV validation.
For the remaining data sets the laboratory will provide the following information in their data
reports:
• Field and laboratory sample identification;
• Sample result, method detection limit, and reporting limit, with appropriate units;
• Sample collection and receipt dates;
• Sample preparation and analysis date/time;
• Dilution factor;
• Preparation and analysis batch numbers or identification;
• Sample matrix;
• Analytical method(s) references;
• Percent moisture determination; and
• For solid-matrix samples, identify basis of reporting (i.e., wet-weight or dry-weight basis).
The following additional information will also be provided, as applicable for the reported analytical
methods:
• Case narrative;
• Copies of the signed COCs;
• Laboratory method/preparation blank;
• ICV, and CCV;
• ICB, and CCB;
• Interference check sample, if applicable;
6 EPA, 2009. Page 6: “A verification and validation based on completeness and compliance checks of sample receipt conditions and
BOTH sample-related and instrument-related QC results…” 7 Ibid, page 7: “A verification and validation based on completeness and compliance checks of sample receipt conditions, both
sample-related and instrument-related QC results, recalculation checks, AND the review of actual instrument outputs…”

PRB Pilot Study Conceptual Implementation Plan Conda/Woodall Mountain Mine October 2018
S:\Jobs\0442-001-900-Simplot-Conda\RIFS_PilotStudy\PRB\DesignImplemtationPln\Final\FnlPRBtreatImplPln_10022018.docx
43
• MS, and when applicable MSD, sample recovery and, when applicable, MS/MSD RPD;
• Post-digest spike sample recovery;
• Laboratory duplicate;
• LCS recovery;
• Inductively coupled plasma mass spectrometry (ICP-MS) serial dilution percent differences;
• MDLs;
• ICP inter-element correction factors;
• ICP and ICPMS linear ranges;
• Preparation log;
• Analysis run Log;
• ICPMS tunes;
• ICPMS internal standards relative intensity summary;
• Sample log-in sheet; and
• Deliverables inventory sheet.
The tiered data validation approach will be applied for at least one year following installation of
the PRB. After one year of data validation completed as described by this plan, validation findings
may be evaluated to determine whether any changes to the tiered approach are warranted. Both
increased and decreased levels of effort for ongoing data validation may be considered. Any
change in the level of effort associated with ongoing data validation will be identified by Simplot
and proposed to the Agencies for approval before adoption under this plan.
8.3 Reporting
Weekly email updates on the Field-Scale PRB Pilot Study construction and implementation will
be provided to the Agencies in the form of an email every Friday, or as soon as possible early the
next week. The weekly updates will include descriptions and photographs of the past week’s
activities, and the upcoming week’s planned activities.
A construction summary report (CSR) will be submitted 90 days after the completion of the PRB
construction. The CSR will include a narrative description of the construction activities,
photographs, and final as-built drawings.
During Year 1 of the Field-Scale PRB Pilot Study implementation, technical memoranda will be
provided 60 days after sampling events to provide field and laboratory data, along with a summary
of the observed PRB performance.

PRB Pilot Study Conceptual Implementation Plan Conda/Woodall Mountain Mine October 2018
S:\Jobs\0442-001-900-Simplot-Conda\RIFS_PilotStudy\PRB\DesignImplemtationPln\Final\FnlPRBtreatImplPln_10022018.docx
44
Within 90 days after completion of the last sampling event of Year 1, Simplot will prepare a
Treatability/Pilot Study Report documenting the findings of the study. Following the Agencies’
review of the report, Simplot will address comments and prepare and submit a final
Treatability/Pilot Study Report.
Ongoing monitoring of the Field-Scale PRB Pilot Study will continue after Year 1 under the Pedro
Creek NTCRA PRSC Plan. Annual performance of the PRB will be discussed in the Pedro Creek
NTCRA Annual Maintenance and Monitoring Report (AMMR). The lifespan of the treatment
media is uncertain but may last up to 15 to 20 years based on current literature (Robertson 2010;
USEPA 2014). The ongoing monitoring will evaluate both treatment efficiency, the need for carbon
amendment, and the timing of the breakthrough curve.

PRB Pilot Study Conceptual Implementation Plan Conda/Woodall Mountain Mine October 2018
S:\Jobs\0442-001-900-Simplot-Conda\RIFS_PilotStudy\PRB\DesignImplemtationPln\Final\FnlPRBtreatImplPln_10022018.docx
45
9.0 ROLES AND SCHEDULE
The construction will be performed by NewFields LLC. As the constructor, NewFields will be
responsible for the Construction Quality Control (CQC) as well as for conformance with the final
PRB requirements. The Construction Quality Assurance (CQA) inspection and testing will be
performed by Simplot, to certify that the PRB is being constructed in accordance with this
implementation plan. Project duties and responsibilities are described below and illustrated in an
organizational chart (Figure 9-1).
Project Management – NewFields’ Project Manager (Matthew Wright) , with support from
Formation Environmental (Robbert-Paul Smit), is responsible for overall management and
construction of the PRB. Simplot’s Project Manager’s (Jeffrey Hamilton) responsibilities include
scheduling, personnel management and management of various subcontractors. Formation
Environmental will support Simplot with the regulatory requirements. Simplot’s and Formation
Environmental’s Project Managers will serve as the primary contacts with the Agencies.
Project Engineer - The NewFields Project Engineer (Kevin Jennings) will be registered as a
Professional Engineer in the State of Idaho. The Project Engineer will be independent of the
construction contractor(s), but directly accountable for the successful completion of the PRB.
Construction Manager - The onsite Construction Manager (Brandon Hammond) will have overall
responsibility for managing the construction of the PRB and implementing the CQC program,
including providing daily construction reports documenting testing and construction activities. The
daily reports will be provided to the Project Engineer and the CQA Manager.
CQC Manager - The CQC Manager (Brandon Hammond) is responsible for overseeing all CQC
testing and supporting the Construction Manager. The CQC Manager will ensure that the
equipment operators are properly following design specifications on the final drawings.
CQA Manager - The CQA Manager (Nick Owens) will report directly to the Project Engineer
(Kevin Jennings). The CQA Manager will ensure that the PRB is properly constructed to design
specifications.
Regulatory Oversight – The Agencies will be responsible for providing oversight of the PRB
implementation activities. EPA, IDEQ, and BLM, or their designated representatives, will make
periodic inspections of the construction activities to assure that the PRB construction is
proceeding in substantial compliance with the approved final implementation plan. Simplot will
provide full and complete access to EPA, IDEQ, and BLM or their designated representatives
during periodic inspections, and as much as practicable, accompany them during these
inspections.
Table 9-1 presents a general schedule of events. A summary of the construction schedule and
work products that will be submitted are included in the schedule.
PRB Pilot Study Conceptual Implementation Plan Conda/Woodall Mountain Mine October 2018
S:\Jobs\0442-001-900-Simplot-Conda\RIFS_PilotStudy\PRB\DesignImplemtationPln\Final\FnlPRBtreatImplPln_10022018.docx
46
10.0 REFERENCES
American Society for Testing and Materials (ASTM). 2015a. ATSM Standard D4044/4044M,
Standard Test Method for (Field Procedure) for Instantaneous Change in Head (Slug) Tests for Determining Hydraulic Properties of Aquifers, West Conshohocken, PA, 2015, DOI: 1-.1520/D4044_D4044M-15.
ASTM. 2015b. Method D 5856-15. Standard Test Method for Measurement of Hydraulic
Conductivity of Porous Material Using a Rigid-Wall, Compaction-Mold Permeameter, West Conshohocken, PA, 2015, DOI: 10.1520/D5856-15.
ASTM. 2012. Method D698-12e2, Standard Test Methods for Laboratory Compaction
Characteristics of Soil Using Standard Effort (12,400 ft-lbf/ft3), West Conshohocken, PA, DOI: 10.1520/D0698-12E02.
Bouwer, H. and R.C. Rice, 1976. A slug test method for determining hydraulic conductivity of
unconfined aquifers with completely or partially penetrating wells, Water Resource Research, vol 12, no. 3, pp. 423-428.
Hvorslev, M.J., 1951. Time Lag and Soil Permeability in Ground-Water Observations, Bull. 26,
Waterways Exper. Sta. Corps of Engrs, U.S. Army, Vicksburg, Mississippi, pp. 1-50. Freeze, R.A., and Cherry, J.A., 1979, Groundwater: Englewood Cliffs, NJ, Prentice-Hall, p. 604.
Formation Environmental, LLC, 2017a. Conda/Woodall Mountain Mine, Draft Final Feasibility
Study, Development and Screening of Remedial Alternatives – Technical Memorandum
#1. Prepared for J.R. Simplot Company, November 2017.
Formation Environmental, LLC, 2017b Conda/Woodall Mountain Phosphate Mine, Pedro Creek
Sub-Basin Non-Time-Critical Removal Action, Final 2016 Post-Removal Site Control
Annual Maintenance and Monitoring Report. Prepared for J.R. Simplot Company,
November 2017.
Formation Environmental, LLC, 2017c Conda/Woodall Mountain Phosphate Mine, Permeable
Reactive Barrier Pilot Study, Final Site Preparation and Hydrogeological Characterization
Work Plan. Prepared for J.R. Simplot Company, September 2017
Formation Environmental, LLC, 2016 Conda/Woodall Mountain Mine, Final Remedial
Investigation Report. Prepared for Prepared for J.R. Simplot Company, December 2016.
Formation Environmental, LLC, 2015. Conda/Woodall Mountain Mine, Pedro Creek – Non-Time-
Critical Removal Action (NTCRA), Final Construction Summary. Prepared for J.R. Simplot
Company, July 2015.

PRB Pilot Study Conceptual Implementation Plan Conda/Woodall Mountain Mine October 2018
S:\Jobs\0442-001-900-Simplot-Conda\RIFS_PilotStudy\PRB\DesignImplemtationPln\Final\FnlPRBtreatImplPln_10022018.docx
47
Interstate Technology & Regulatory Council (ITRC), 2011. Technical/Regulatory Guidance,
Permeable Reactive Barrier: Technology Update. Prepared by the PRB: Technology
Update Team. June 2011.
NewFields Companies, LLC, 2016. Remedial Design and Implementation Plan, Horseshoe
Overburden Area, South Rasmussen Mine, Caribou County, Idaho. Prepared for P4
Production, LLC. Revised January.
NewFields Companies, LLC, 2008. Final Conda\Woodall Mountain Remedial Investigation and
Feasibility Study Work Plan. Prepared for J.R. Simplot Company. December 2008.
North American Metals Council (NAMC), 2010. Review of Available Technologies for the Removal
of Selenium from Water. June 2010.
National Oceanic and Atmospheric Administration (NOAA), 2006. Precipitation Frequency Atlas
of the Western United States, NOAA Atlas II Idaho, U.S. Weather Service.
Roberston, W.D., 2010. Nitrate removal rates in woodchip media of varying age. Ecological
Engineering, 36(2010): 1581-1587.
USEPA, 2017. National Functional Guidelines for Inorganic Superfund Methods Data Review.
Office of Superfund Remediation and Technology Innovation, Washington DC. January
2017.
USEPA, 2014. Reference Guide to Treatment Technologies for Mine-Influenced Water, Office of
Superfund Remediation Technology Innovation, Washington D.C.
USEPA, 2009. Guidance for Labeling Externally Validated Laboratory Analytical Data for
Superfund Use, January 2009.
U.S. Environmental Protection Agency (USEPA), 1998. Permeable Reactive Barrier
Technologies for Contamination Remediation. EPA/600/R-98/125. September 1998.
U.S. Environmental Protection Agency USEPA, 1992. Guidance for Conducting Treatability
Studies under CERCLA. http://www.epa.gov/superfund/policy/remedy/pdfs/540r-92071a-
s.pdf.

TABLES

FIGURES

APPENDIX A
Well Boring Logs
(Provided Electronically)

APPENDIX B
Slug Test Results
(Provided Electronically)

APPENDIX C
Bench-Scale Report
(Provided Electronically)

APPENDIX D
Design Approach and Drawings
(Provided Electronically)

APPENDIX E
Standard Operating Procedures
(Provided Electronically)

APPENDIX F
Comments Responses and Resolutions
(Provided Electronically)
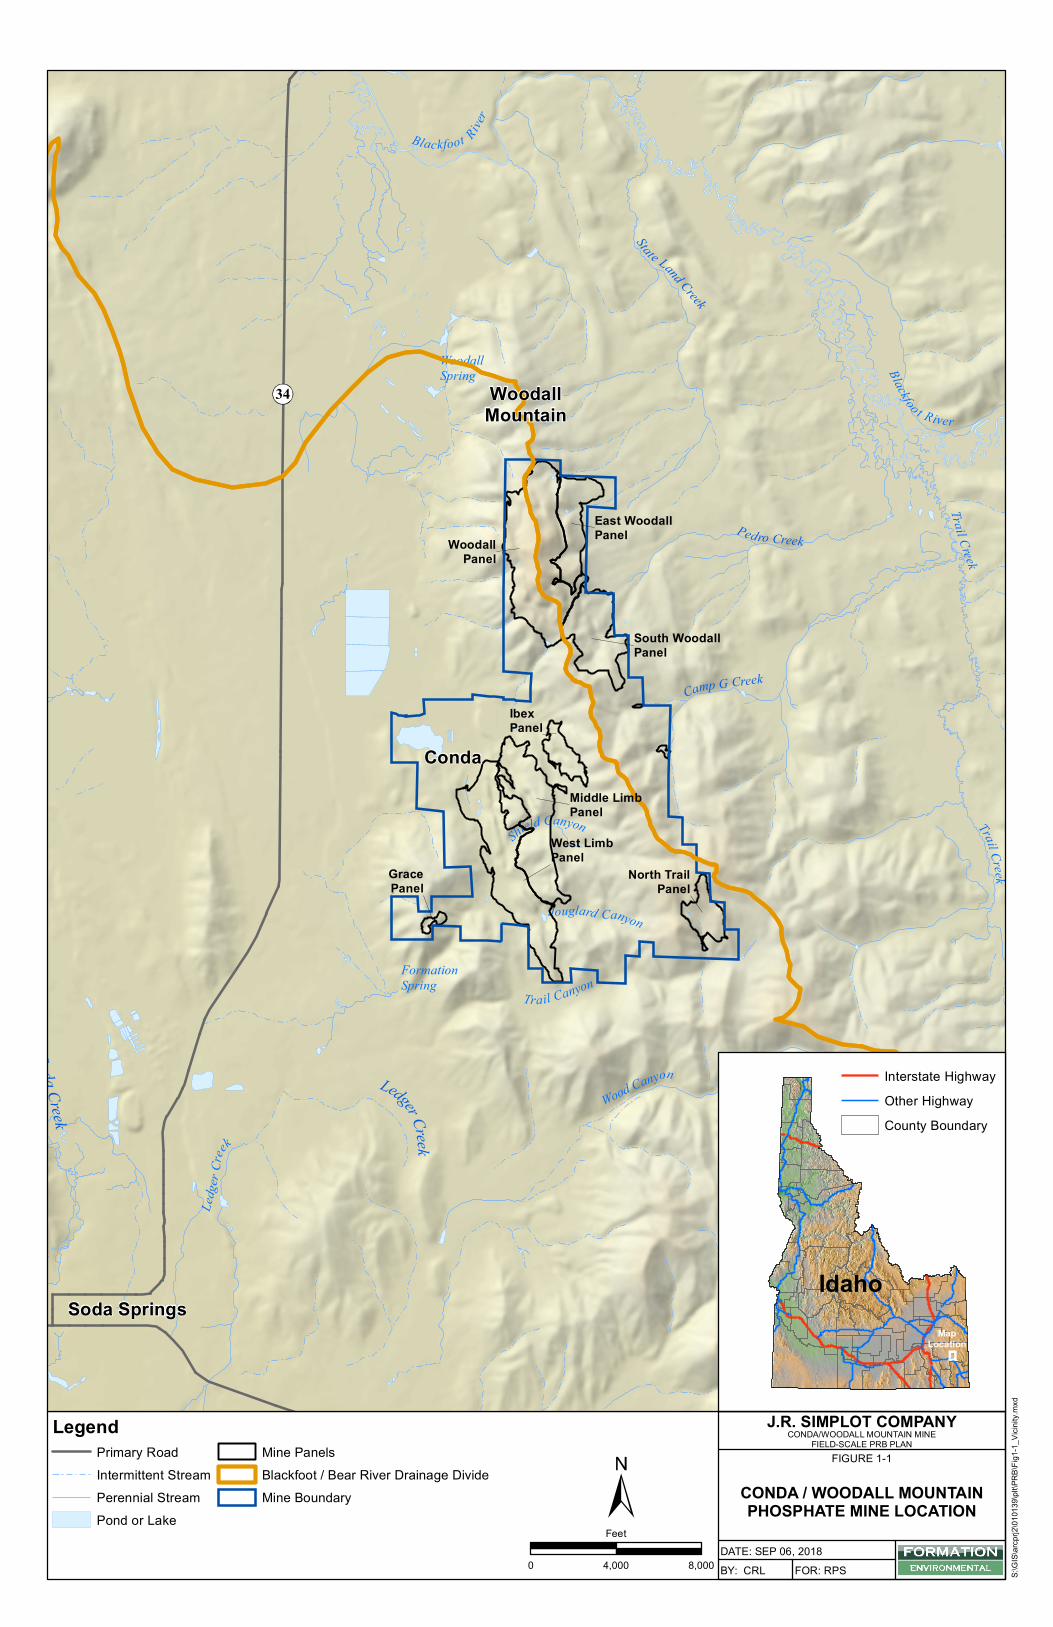
Jouglard Canyon
Wood Canyon
Ledg
erCr
eek
Sulphur Canyon
Trail Creek
Trail Creek
Blackfoo t River
Trail Canyon
WoodallSpring
Blackfoot River
FormationSpring
Shield Canyon
State Land Creek
Pedro Creek
Camp G Creek
Soda Springs
Conda
34
Aspen Range
Wooley Valley
WoodallMountain
Soda Creek
Ledger Creek
WoodallPanel
West LimbPanel
Middle LimbPanel
South WoodallPanel
East WoodallPanel
IbexPanel
North TrailPanel
GracePanel
LegendPrimary RoadIntermittent StreamPerennial StreamPond or Lake
Mine PanelsBlackfoot / Bear River Drainage DivideMine Boundary
S:\GI
S\arcp
rj2\01
0139
\plt\P
RB\Fi
g1-1_
Vicini
ty.mx
d
0 4,000 8,000
Feet
IdahoMap
Location
Interstate HighwayOther HighwayCounty Boundary
DATE: SEP 06, 2018BY: CRL FOR: RPS
J.R. SIMPLOT COMPANYFIGURE 1-1
CONDA/WOODALL MOUNTAIN MINEFIELD-SCALE PRB PLAN
CONDA / WOODALL MOUNTAINPHOSPHATE MINE LOCATION
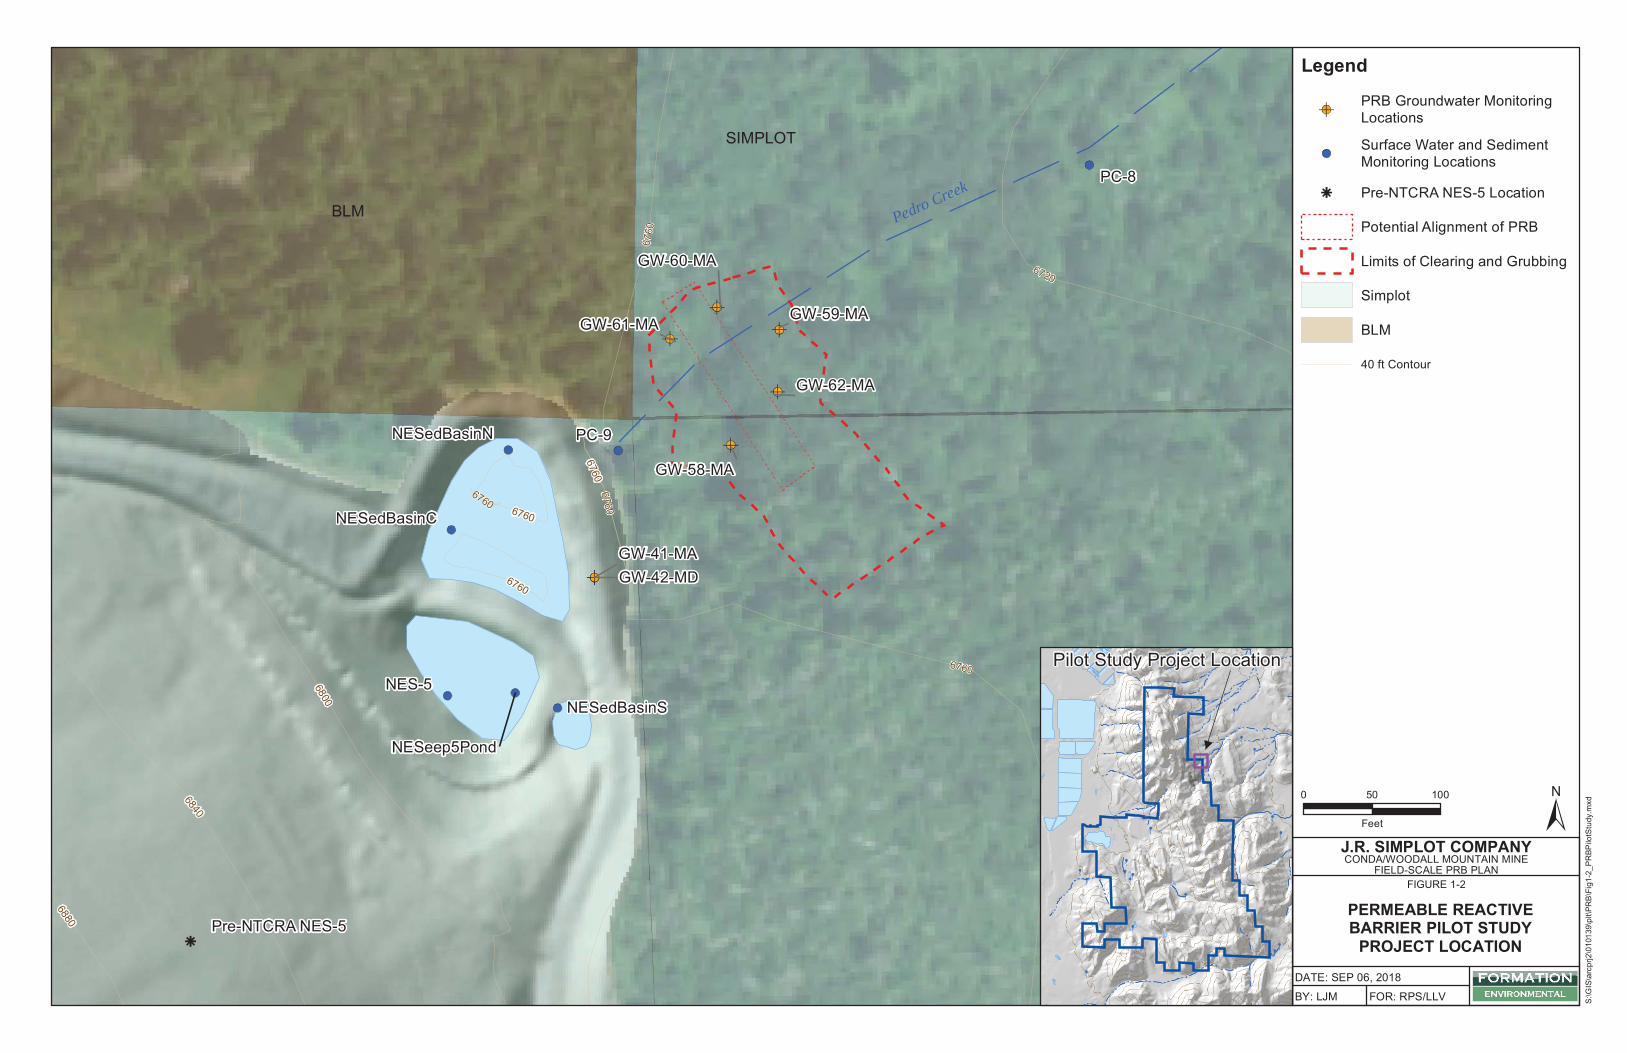
Pedro Creek
GW-58-MA
GW-59-MA
GW-60-MA
GW-61-MA
GW-62-MA
GW-41-MAGW-42-MD
NES-5
NESedBasinC
NESedBasinN
NESedBasinS
NESeep5Pond
PC-8
PC-9
Pre-NTCRA NES-5
6760
6760
6720
6760
6720
6760
6880
6840
6800
6760
6760
6760
S:\G
IS\a
rcpr
j2\0
1013
9\pl
t\PR
B\Fi
g1-2
_PR
BPilo
tStu
dy.m
xd
DATE: SEP 06, 2018
BY: LJM FOR: RPS/LLV
0 50 100
Feet
J.R. SIMPLOT COMPANY
FIGURE 1-2
CONDA/WOODALL MOUNTAIN MINEFIELD-SCALE PRB PLAN
PERMEABLE REACTIVEBARRIER PILOT STUDY
PROJECT LOCATION
Legend
PRB Groundwater MonitoringLocations
Surface Water and SedimentMonitoring Locations
Pre-NTCRA NES-5 Location
Potential Alignment of PRB
Limits of Clearing and Grubbing
Simplot
BLM
40 ft Contour
BLM
SIMPLOT
Pilot Study Project Location
0.745 mg/L - Maximum groundwater selenium concentration.
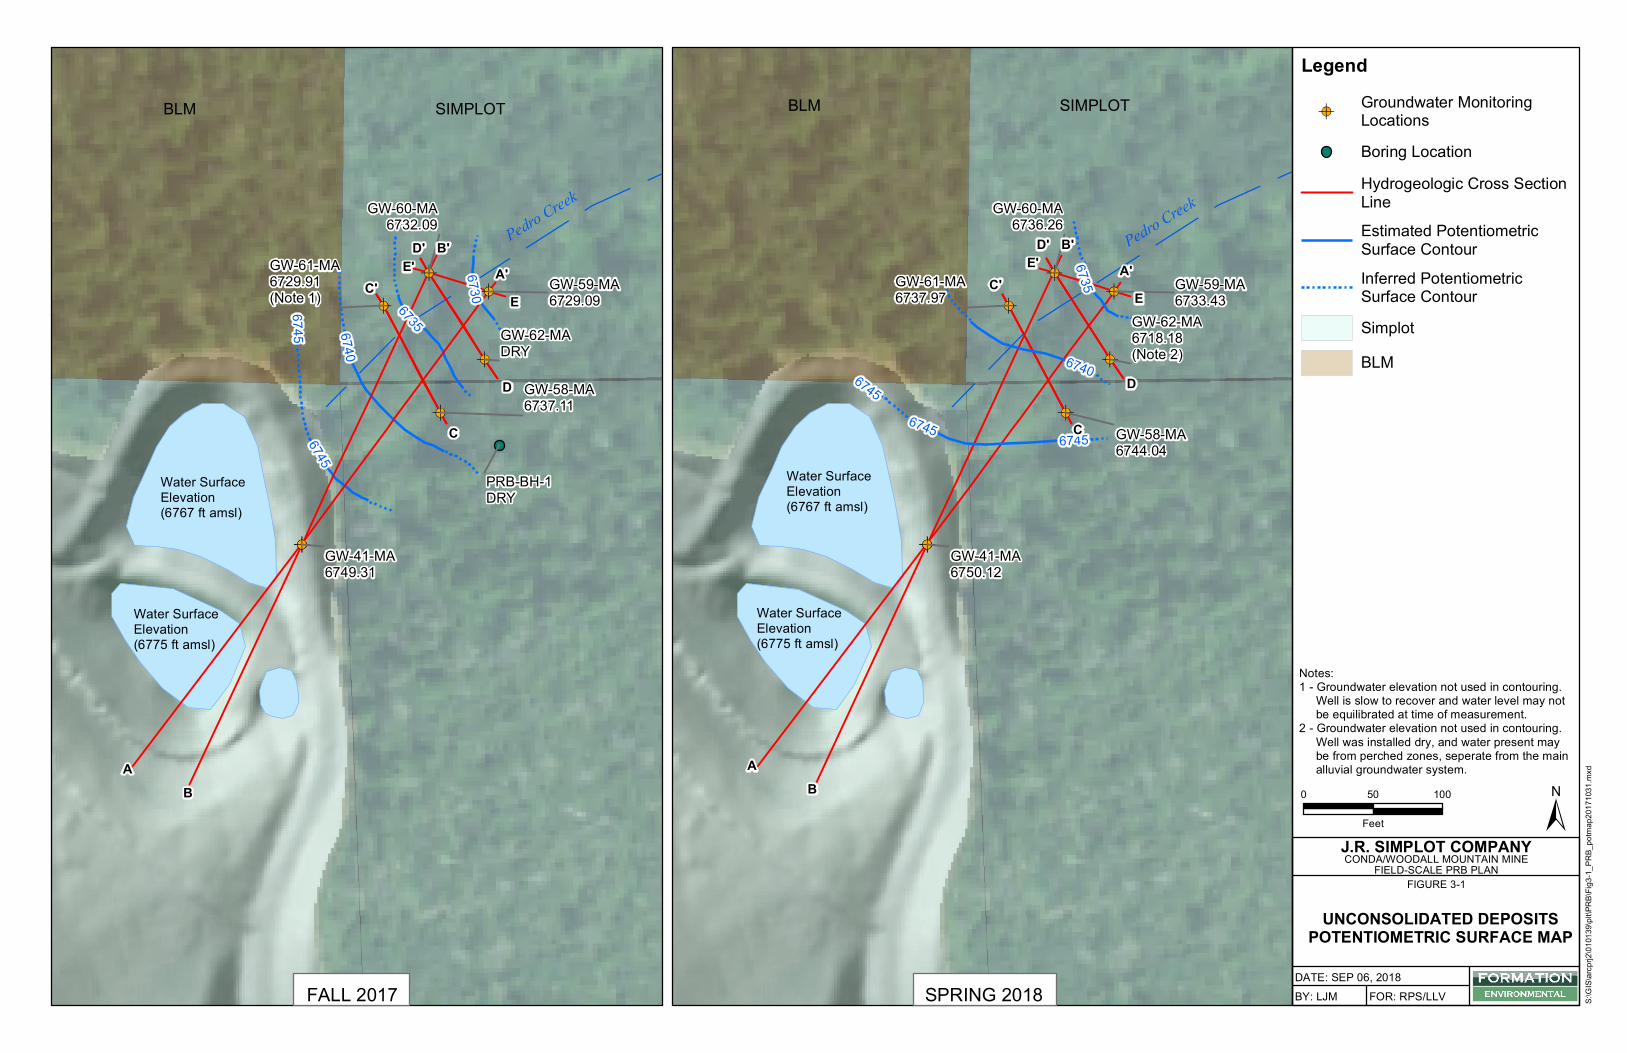
Water SurfaceElevation(6775 ft amsl)
Water SurfaceElevation(6767 ft amsl)
Pedro Creek
GW-41-MA6750.12
GW-58-MA6744.04
GW-59-MA6733.43
GW-60-MA6736.26
GW-61-MA6737.97
GW-62-MA6718.18(Note 2)
6745
674067456745
6735
Water SurfaceElevation(6775 ft amsl)
Water Surface Elevation(6767 ft amsl)
Pedro Creek
GW-41-MA6749.31
GW-58-MA6737.11
GW-59-MA6729.09
GW-60-MA6732.09
GW-61-MA6729.91(Note 1)
GW-62-MADRY
PRB-BH-1DRY
6740
6735
6730
67456745
S:\GI
S\arcp
rj2\01
0139
\plt\P
RB\Fi
g3-1_
PRB_
potm
ap20
1710
31.m
xd
DATE: SEP 06, 2018BY: LJM FOR: RPS/LLV
0 50 100
FeetJ.R. SIMPLOT COMPANY
FIGURE 3-1CONDA/WOODALL MOUNTAIN MINE
FIELD-SCALE PRB PLAN
UNCONSOLIDATED DEPOSITSPOTENTIOMETRIC SURFACE MAP
LegendGroundwater MonitoringLocationsBoring LocationHydrogeologic Cross SectionLineEstimated PotentiometricSurface ContourInferred PotentiometricSurface ContourSimplotBLM
BLM SIMPLOT
Notes: 1 - Groundwater elevation not used in contouring. Well is slow to recover and water level may not be equilibrated at time of measurement. 2 - Groundwater elevation not used in contouring. Well was installed dry, and water present may be from perched zones, seperate from the main alluvial groundwater system.A
A'
B
B'
E
D
C
D'E'
C'
BLM SIMPLOT
A
A'
B
B'
E
D
C
D'E'
C'
FALL 2017 SPRING 2018

GW-42-MD
GW-59-MA
GW-62-MA (Projected)
GW-58-MA(Projected)
GW-41-MA
6733.4
6718.2
6744.0
6750.1
6729.0
6736.5
6749.1
440
420
400
380
360
340
320
300
280
260
240
220
200
180
160
140
120
100806040206640
6645
6650
6655
6660
6665
6670
6675
6680
6685
6690
6695
6700
6705
6710
6715
6720
6725
6795
6790
6785
6780
6775
6770
6765
6760
6755
6750
6745
6740
6735
6730
GP
Siltstone
Siltstone
MLCL
Siltstone
GC/ML
ML
GC
ML
GC/ML
GC/ML
GM
GC/CL
CL
ML
Siltstone
MLGC
GP
GP
Siltstone
GC
CL
ML
CLGC
ML
Siltstone
FILL
GC
GP
S:\GI
S\arcp
rj2\01
0139
\plt\P
RB\Fi
g3-2_
Xsec
tA.mx
d
DATE: OCT 02, 2018BY: LJM FOR: RPS
0 50 100
FeetJ.R. SIMPLOT COMPANY
FIGURE 3-2CONDA/WOODALL MOUNTAIN MINE
FIELD-SCALE PRB PLAN
GENERALIZED HYDROGEOLOGICCROSS SECTION
A - A'
LegendGroundwater Elevation (10-31-17)
Groundwater Elevation (5-24-18)ApproximateWeathered/UnweatheredTransitionWell Screen
Generalized BoreholeLithology
FILL
Gravel (GP)
Gravelly Clay/Silt (GC/ML)
Gravelly Clay (GC)
Gravelly Clay/Clay (GC/CL)
Silt (ML)
Clay (CL)
Siltstone
Generalized Cross-SectionLithology
FillUnconsolidatedAlluvium/Colluvium/WeatheredDinwoody FormationUnweathered Dinwoody Formation(TRd)
SWA NE
A'
Note:GW-62-MA was dry on 10-31-2017. 2x Vertical Exaggeration

GW-41-MA
GW-61-MA(Projected)
GW-42-MD
GW-60-MA
6750.1
6738.0 6736.3
6728.6
6749.1
6729.1
440
420
400
380
360
340
320
300
280
260
240
220
200
180
160
140
120
100806040206640
6645
6650
6655
6660
6665
6670
6675
6680
6685
6690
6695
6700
6705
6710
6715
6720
6725
6730
6735
6790
6785
6780
6775
6770
6765
6760
6755
6750
6745
6740
CL
Siltstone
ML
ML
Siltstone
FILL
ML
GP
CL
GP
Sitstone
ML
SiltstoneCL
ML
CL
Siltstone
GC
S:\GI
S\arcp
rj2\01
0139
\plt\P
RB\Fi
g3-3_
Xsec
tB.mx
d
DATE: OCT 02, 2018BY: LJM FOR: RPS
0 50 100
FeetJ.R. SIMPLOT COMPANY
FIGURE 3-3CONDA/WOODALL MOUNTAIN MINE
FIELD-SCALE PRB PLAN
GENERALIZED CROSS SECTION
B-B'
LegendGroundwater Elevation (10-31-17)
Groundwater Elevation (5-24-18)ApproximateWeathered/UnweatheredTransitionWell Screen
Generalized BoreholeLithology
FILL
Gravel (GP)
Gravelly Clay/Silt (GC/ML)
Gravelly Clay (GC)
Gravelly Clay/Clay (GC/CL)
Silt (ML)
Clay (CL)
Siltstone
Generalized Cross-SectionLithology
FillUnconsolidatedAlluvium/Colluvium/WeatheredDinwoody FormationUnweathered Dinwoody Formation(TRd)
SWB NE
B'
2x Vertical Exaggeration
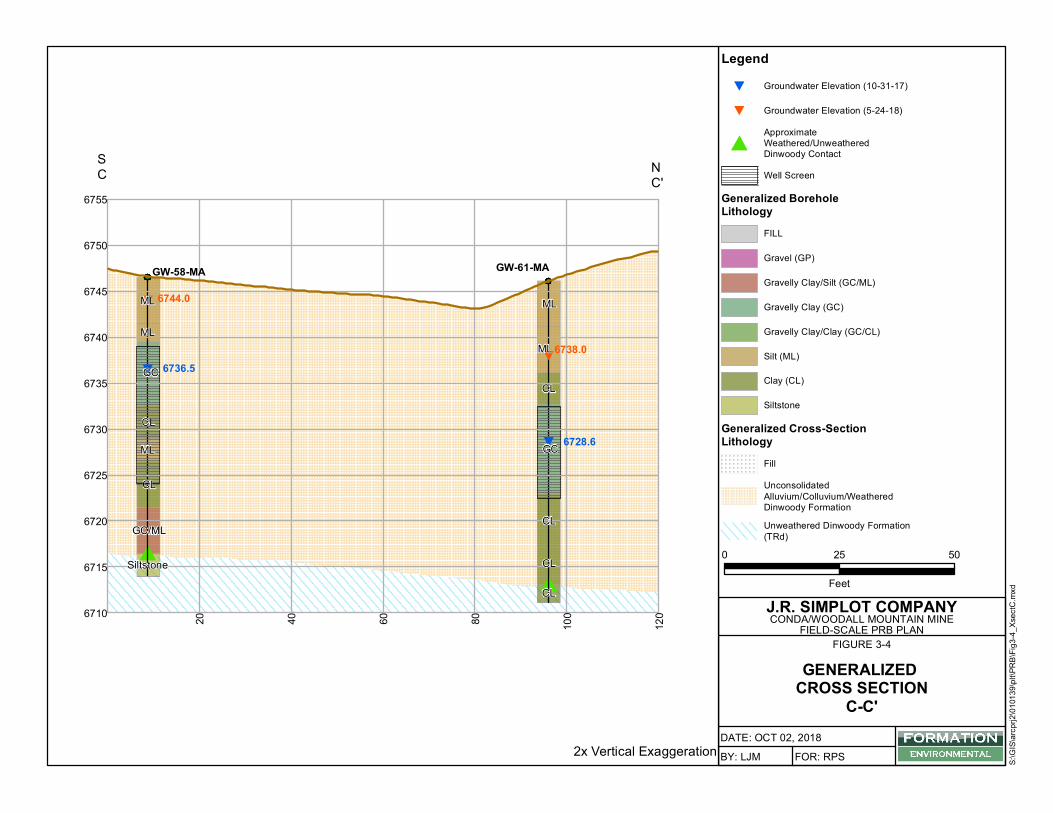
GW-61-MAGW-58-MA
6744.0
6738.0
6728.6
6736.5
120
100806040206710
6715
6720
6725
6730
6735
6755
6750
6745
6740
CL
CL
CL
ML
GC/ML
CL
GC
ML
ML
Siltstone
GC
CL
MLML
CL
S:\GI
S\arcp
rj2\01
0139
\plt\P
RB\Fi
g3-4_
Xsec
tC.m
xd
DATE: OCT 02, 2018BY: LJM FOR: RPS
0 25 50
FeetJ.R. SIMPLOT COMPANY
FIGURE 3-4CONDA/WOODALL MOUNTAIN MINE
FIELD-SCALE PRB PLAN
GENERALIZED CROSS SECTION
C-C'
LegendGroundwater Elevation (10-31-17)
Groundwater Elevation (5-24-18)ApproximateWeathered/UnweatheredDinwoody ContactWell Screen
Generalized BoreholeLithology
FILL
Gravel (GP)
Gravelly Clay/Silt (GC/ML)
Gravelly Clay (GC)
Gravelly Clay/Clay (GC/CL)
Silt (ML)
Clay (CL)
Siltstone
Generalized Cross-SectionLithology
FillUnconsolidatedAlluvium/Colluvium/WeatheredDinwoody FormationUnweathered Dinwoody Formation(TRd)
SC N
C'
2x Vertical Exaggeration
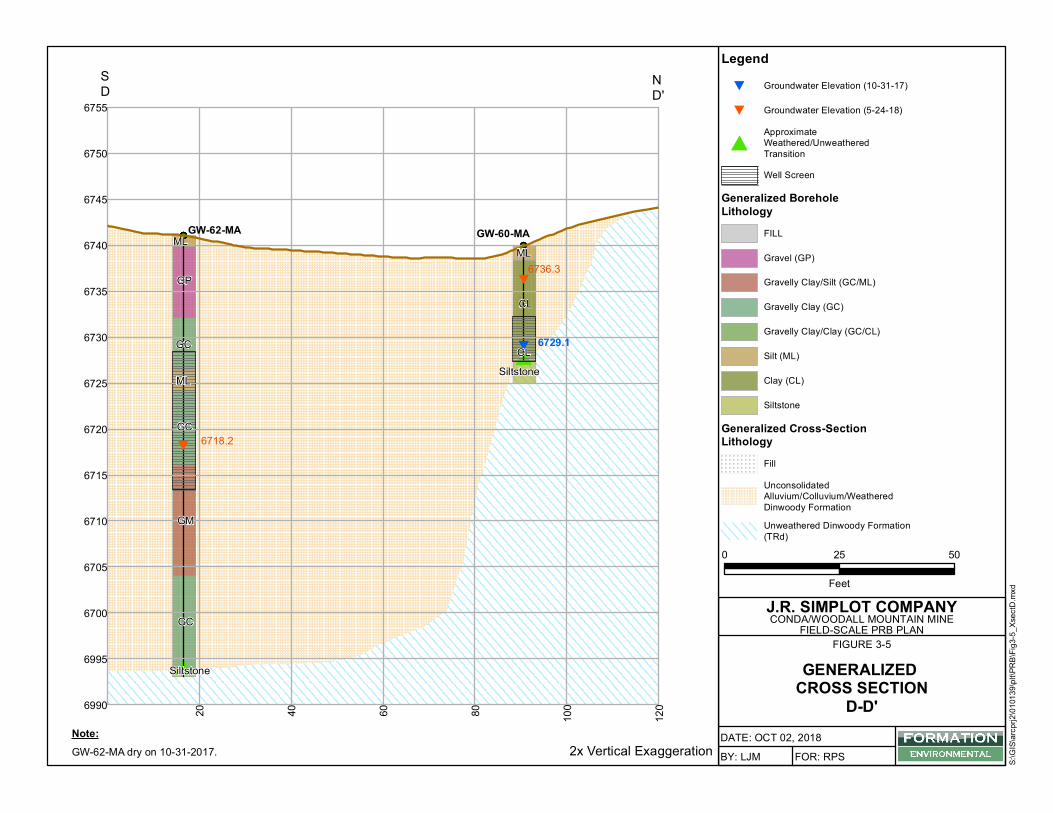
GW-62-MA GW-60-MA
6718.2
6736.3
6729.1
120
100806040206990
6995
6700
6705
6710
6715
6720
6725
6755
6750
6745
6740
6735
6730 GC
MLML
Siltstone
GM
GC
GP
ML
CLSiltstone
GC
CL
S:\GI
S\arcp
rj2\01
0139
\plt\P
RB\Fi
g3-5_
Xsec
tD.m
xd
DATE: OCT 02, 2018BY: LJM FOR: RPS
0 25 50
FeetJ.R. SIMPLOT COMPANY
FIGURE 3-5CONDA/WOODALL MOUNTAIN MINE
FIELD-SCALE PRB PLAN
GENERALIZED CROSS SECTION
D-D'
LegendGroundwater Elevation (10-31-17)
Groundwater Elevation (5-24-18)ApproximateWeathered/UnweatheredTransitionWell Screen
Generalized BoreholeLithology
FILL
Gravel (GP)
Gravelly Clay/Silt (GC/ML)
Gravelly Clay (GC)
Gravelly Clay/Clay (GC/CL)
Silt (ML)
Clay (CL)
Siltstone
Generalized Cross-SectionLithology
FillUnconsolidatedAlluvium/Colluvium/WeatheredDinwoody FormationUnweathered Dinwoody Formation(TRd)
SD N
D'
2x Vertical ExaggerationNote:GW-62-MA dry on 10-31-2017.

GW-59-MA
GW-60-MA
6736.36733.4
6729.16729.0
806040206685
6690
6695
6700
6705
6710
6715
6720
6725
6755
6750
6745
6740
6735
6730
GC/ML
GC/CL
CL
GC/ML
GP
Siltstone
ML
CL
CL
CLML
Siltstone
GC
S:\GI
S\arcp
rj2\01
0139
\plt\P
RB\Fi
g3-6_
Xsec
tE.mx
d
DATE: OCT 02, 2018BY: LJM FOR: RPS
0 25 50
FeetJ.R. SIMPLOT COMPANY
FIGURE 3-6CONDA/WOODALL MOUNTAIN MINE
FIELD-SCALE PRB PLAN
GENERALIZED CROSS SECTION
E-E'
LegendGroundwater Elevation (10-31-17)
Groundwater Elevation (5-24-18)ApproximateWeathered/UnweatheredTransitionWell Screen
Generalized BoreholeLithology
FILL
Gravel (GP)
Gravelly Clay/Silt (GC/ML)
Gravelly Clay (GC)
Gravelly Clay/Clay (GC/CL)
Silt (ML)
Clay (CL)
Siltstone
Generailzed Cross-SectionLithology
FillUnconsolidatedAlluvium/Colluvium/WeatheredDinwoody FormationUnweathered Dinwoody Formation(TRd)
SE N
E'
2x Vertical Exaggeration
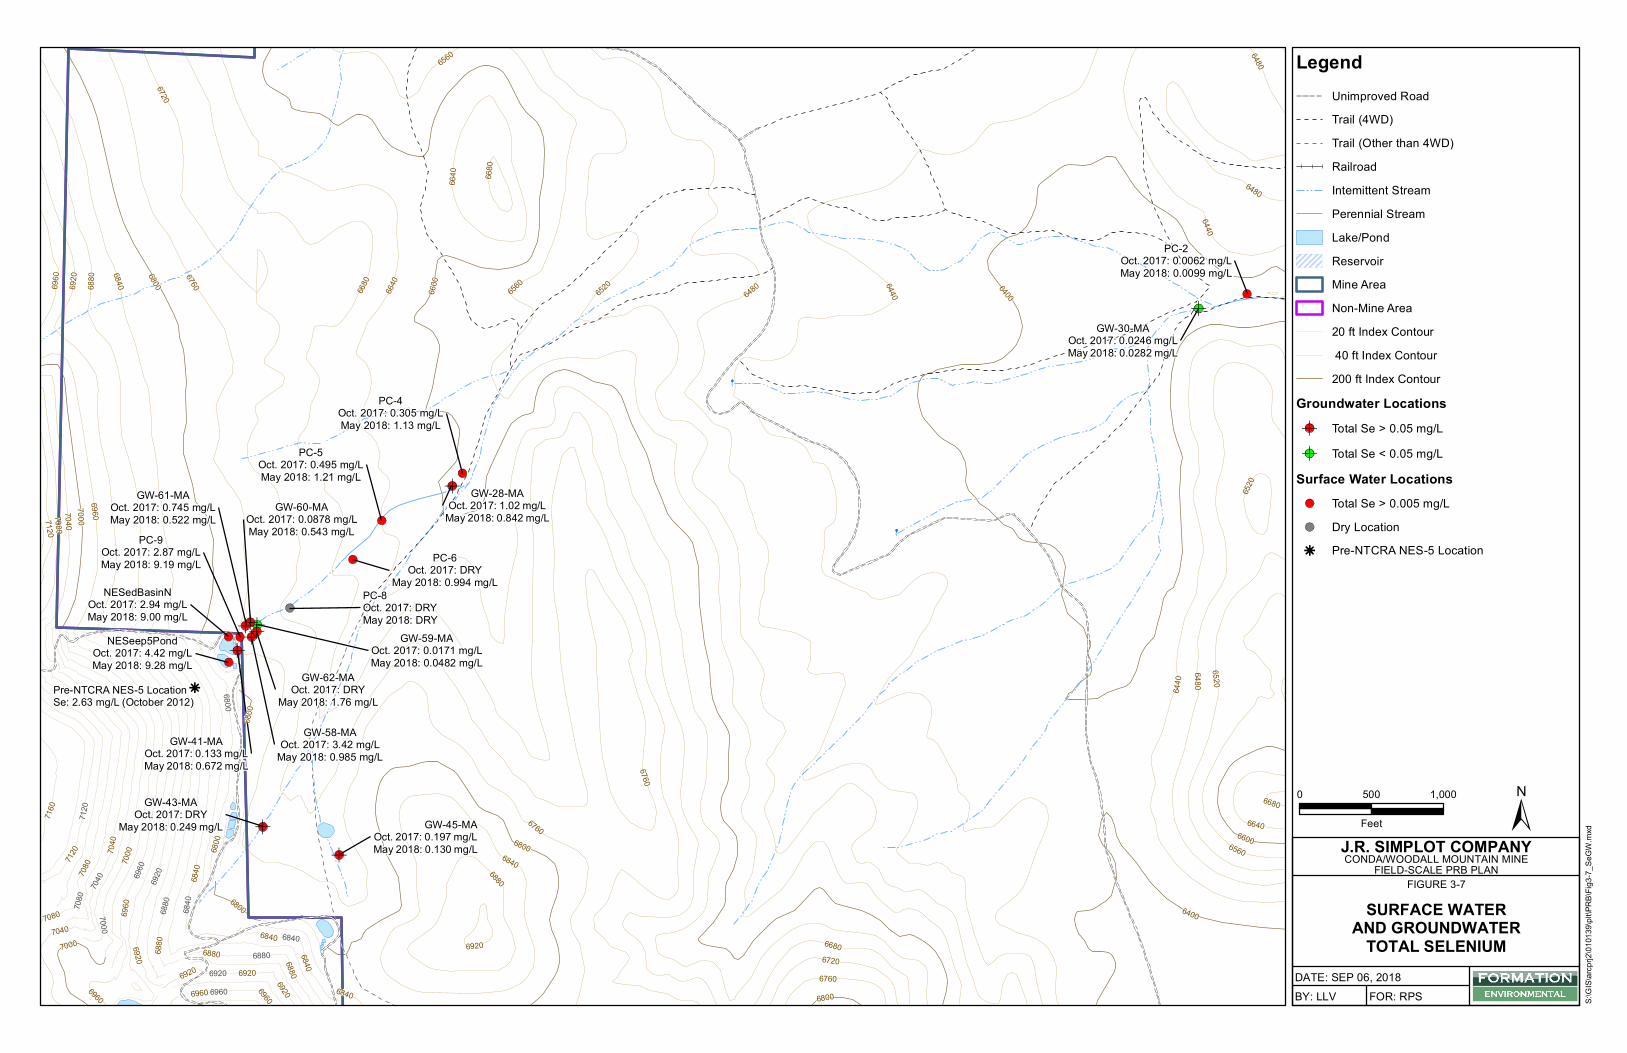
GW-58-MAOct. 2017: 3.42 mg/L
May 2018: 0.985 mg/L
GW-62-MAOct. 2017: DRY
May 2018: 1.76 mg/L
GW-59-MAOct. 2017: 0.0171 mg/LMay 2018: 0.0482 mg/L
GW-60-MAOct. 2017: 0.0878 mg/LMay 2018: 0.543 mg/L
GW-61-MAOct. 2017: 0.745 mg/LMay 2018: 0.522 mg/L
GW-30-MAOct. 2017: 0.0246 mg/LMay 2018: 0.0282 mg/L
GW-28-MAOct. 2017: 1.02 mg/L
May 2018: 0.842 mg/L
GW-41-MAOct. 2017: 0.133 mg/LMay 2018: 0.672 mg/L
GW-45-MAOct. 2017: 0.197 mg/LMay 2018: 0.130 mg/L
GW-43-MAOct. 2017: DRY
May 2018: 0.249 mg/L
PC-9Oct. 2017: 2.87 mg/LMay 2018: 9.19 mg/L
NESedBasinNOct. 2017: 2.94 mg/LMay 2018: 9.00 mg/L
NESeep5PondOct. 2017: 4.42 mg/LMay 2018: 9.28 mg/L
PC-2Oct. 2017: 0.0062 mg/LMay 2018: 0.0099 mg/L
PC-4Oct. 2017: 0.305 mg/LMay 2018: 1.13 mg/L
PC-5Oct. 2017: 0.495 mg/LMay 2018: 1.21 mg/L
PC-6Oct. 2017: DRY
May 2018: 0.994 mg/LPC-8Oct. 2017: DRYMay 2018: DRY
Pre-NTCRA NES-5 LocationSe: 2.63 mg/L (October 2012)
6960
6920
6880 6840
6800
6760 6680
6640
6600
6560
6520
6480 6440
6400
66806640
66006560
6400
71207080
70407000
6960
6880
6840
6800
6760
68006760
67206680
65206480
6440
70807040
7000
7120
7080
69606920
6680
6640
6480
6440
7160
7040
7000
6960
69606920
6880
6920 6880
6840
6720
6960
6800
6920
6920
6880
6840
6840
6840
6800
6800
6760
6560 6480
6520
7040
7120
7000
6960
6920
69206880
6880 68407080
6840
6800
6960
S:\GI
S\arcp
rj2\01
0139
\plt\P
RB\Fi
g3-7_
SeGW
.mxd
DATE: SEP 06, 2018BY: LLV FOR: RPS
0 500 1,000
FeetJ.R. SIMPLOT COMPANY
FIGURE 3-7CONDA/WOODALL MOUNTAIN MINE
FIELD-SCALE PRB PLAN
SURFACE WATERAND GROUNDWATER
TOTAL SELENIUM
LegendUnimproved RoadTrail (4WD)Trail (Other than 4WD)RailroadIntemittent StreamPerennial StreamLake/PondReservoirMine AreaNon-Mine Area20 ft Index Contour 40 ft Index Contour200 ft Index Contour
Groundwater LocationsTotal Se > 0.05 mg/LTotal Se < 0.05 mg/L
Surface Water LocationsTotal Se > 0.005 mg/LDry LocationPre-NTCRA NES-5 Location
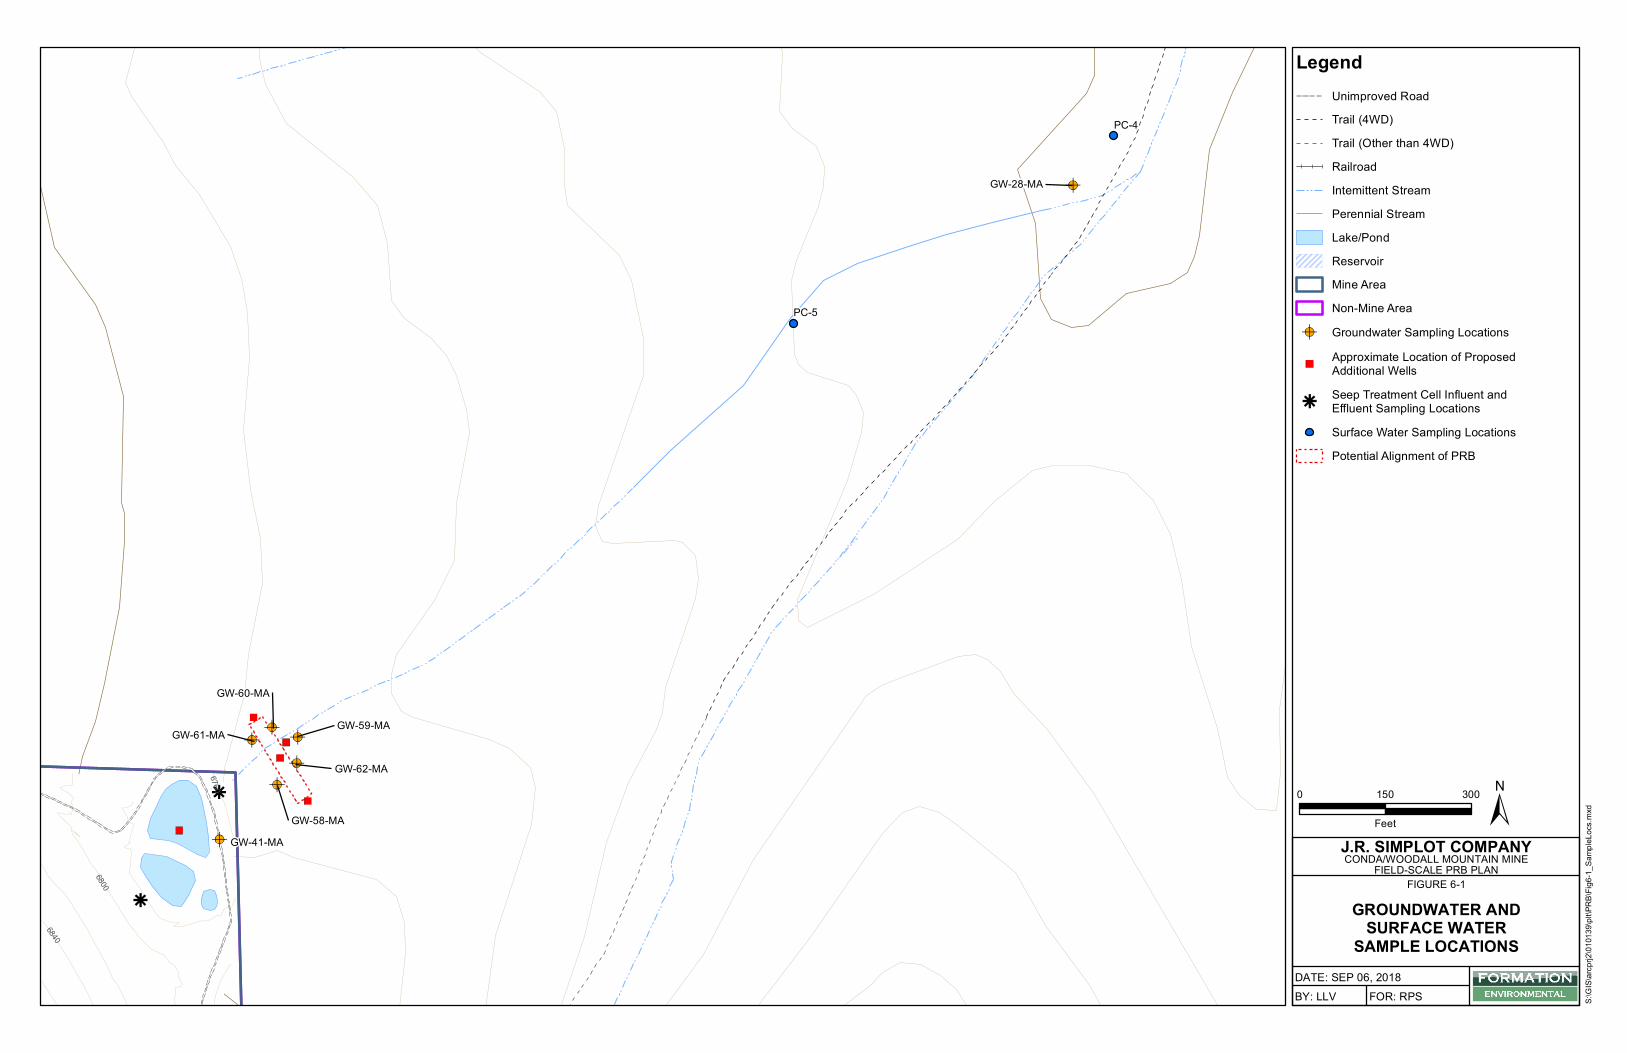
GW-58-MA
GW-62-MA
GW-59-MA
GW-60-MA
GW-61-MA
GW-28-MA
GW-41-MA
6840
6800
6760
PC-4
PC-5
S:\GI
S\arcp
rj2\01
0139
\plt\P
RB\Fi
g6-1_
Samp
leLoc
s.mxd
DATE: SEP 06, 2018BY: LLV FOR: RPS
0 150 300
FeetJ.R. SIMPLOT COMPANY
FIGURE 6-1CONDA/WOODALL MOUNTAIN MINE
FIELD-SCALE PRB PLAN
GROUNDWATER ANDSURFACE WATER
SAMPLE LOCATIONS
LegendUnimproved RoadTrail (4WD)Trail (Other than 4WD)RailroadIntemittent StreamPerennial StreamLake/PondReservoirMine AreaNon-Mine AreaGroundwater Sampling LocationsApproximate Location of ProposedAdditional WellsSeep Treatment Cell Influent andEffluent Sampling LocationsSurface Water Sampling LocationsPotential Alignment of PRB

S:\S
:\JO
BS
\0442-0
01-9
00
-SIM
PLO
T-C
ON
DA
\PE
DR
OC
RE
EK
_E
AR
LY
AC
TIO
N\D
ES
IGN
AN
DIM
PLE
ME
NT
AT
ION
\FIN
ALD
ES
IGN
IMLP
LA
N\F
IGU
RE
S\F
IG7-1
_R
OLE
S.P
PT
X
FIGURE 9-1
PROJECT DUTIES AND
RESPONSIBILITIES
DATE: SEPT 2018
BY:LJM FOR: RPS
J.R. SIMPLOT COMPANYCONDA/WOODALL MOUNTAIN MINE
FIELD-SCALE PRB PLAN
J.R. Simplot Project Manager
(Jeffrey Hamilton)
J.R. Simplot’s ContractorOnsite Construction and CQC Manager
(Brandon Hammond, [Kilroy, LLC])
Surveyors Operators CQC Technicians
Formation Environmental and NewFields Project Managers
(Robbert-Paul Smit and Matthew Wright)
NewFields Project Engineer(Kevin Jennings)
NewFields CQA Manager (Nick Owens)
3rd Party Testing and Laboratory
Services
CQA Team (NewFields and Formation staff)
Agencies
Subcontractors

Table 3-1
Meterological Data From the Blackfoot Bridge Mine
Field-Scale PRB Conceptual Plan
Conda/Woodall Mountain Mine
2012 2013 2014 2015 2016 2017
January 4.2 2.8 4.2 2.3 3.8 5.5
February 4.5 1.8 7.8 2.7 2.7 10.4
March 2.1 2.5 4.5 1.5 5.5 5.2
April 2.6 4.1 2.3 2.9 2.8 4.5
May 2.9 2.2 1.5 7.9 4.5 2.2
June 0.2 0 1.3 1.8 0.8 0.9
July 1.2 1.5 0.7 1.8 0.4 0.6
August 0.1 0.9 4.7 1.8 0 0.4
September 0.5 4 4.8 2.5 3.4 4.4
October 2.4 2.4 1.5 1.5 6.9 0.7
November 2.7 2.5 5.2 3.8 2.2 6.7
December 5.3 3.3 4.2 4 8.2 n/a
Total Precip (in) 28.7 28 42.7 34.5 41.2 41.5
S:\Jobs\0442-001-900-Simplot-Conda\RIFS_PilotStudy\PRB\DrftImplemtationPln\Tables\Tbl3-1Precip.xlsx 1 of 1
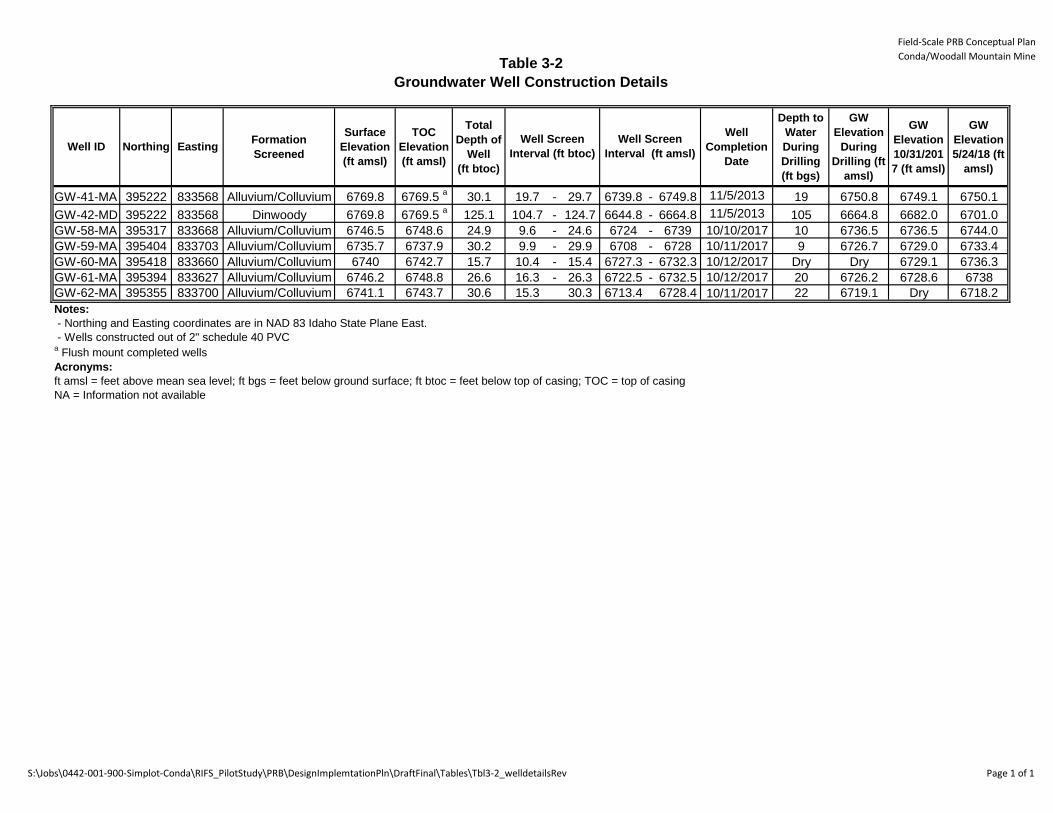
Table 3-2
Groundwater Well Construction Details
Field-Scale PRB Conceptual PlanConda/Woodall Mountain Mine
Well ID Northing EastingFormation
Screened
Surface
Elevation
(ft amsl)
TOC
Elevation
(ft amsl)
Total
Depth of
Well
(ft btoc)
Well
Completion
Date
Depth to
Water
During
Drilling
(ft bgs)
GW
Elevation
During
Drilling (ft
amsl)
GW
Elevation
10/31/201
7 (ft amsl)
GW
Elevation
5/24/18 (ft
amsl)
GW-41-MA 395222 833568 Alluvium/Colluvium 6769.8 6769.5 a
30.1 19.7 - 29.7 6739.8 - 6749.8 11/5/2013 19 6750.8 6749.1 6750.1
GW-42-MD 395222 833568 Dinwoody 6769.8 6769.5 a
125.1 104.7 - 124.7 6644.8 - 6664.8 11/5/2013 105 6664.8 6682.0 6701.0
GW-58-MA 395317 833668 Alluvium/Colluvium 6746.5 6748.6 24.9 9.6 - 24.6 6724 - 6739 10/10/2017 10 6736.5 6736.5 6744.0
GW-59-MA 395404 833703 Alluvium/Colluvium 6735.7 6737.9 30.2 9.9 - 29.9 6708 - 6728 10/11/2017 9 6726.7 6729.0 6733.4
GW-60-MA 395418 833660 Alluvium/Colluvium 6740 6742.7 15.7 10.4 - 15.4 6727.3 - 6732.3 10/12/2017 Dry Dry 6729.1 6736.3
GW-61-MA 395394 833627 Alluvium/Colluvium 6746.2 6748.8 26.6 16.3 - 26.3 6722.5 - 6732.5 10/12/2017 20 6726.2 6728.6 6738
GW-62-MA 395355 833700 Alluvium/Colluvium 6741.1 6743.7 30.6 15.3 30.3 6713.4 6728.4 10/11/2017 22 6719.1 Dry 6718.2
Notes:
- Northing and Easting coordinates are in NAD 83 Idaho State Plane East.
- Wells constructed out of 2" schedule 40 PVCa Flush mount completed wells
Acronyms:
ft amsl = feet above mean sea level; ft bgs = feet below ground surface; ft btoc = feet below top of casing; TOC = top of casing
NA = Information not available
Well Screen
Interval (ft btoc)
Well Screen
Interval (ft amsl)
S:\Jobs\0442-001-900-Simplot-Conda\RIFS_PilotStudy\PRB\DesignImplemtationPln\DraftFinal\Tables\Tbl3-2_welldetailsRev Page 1 of 1
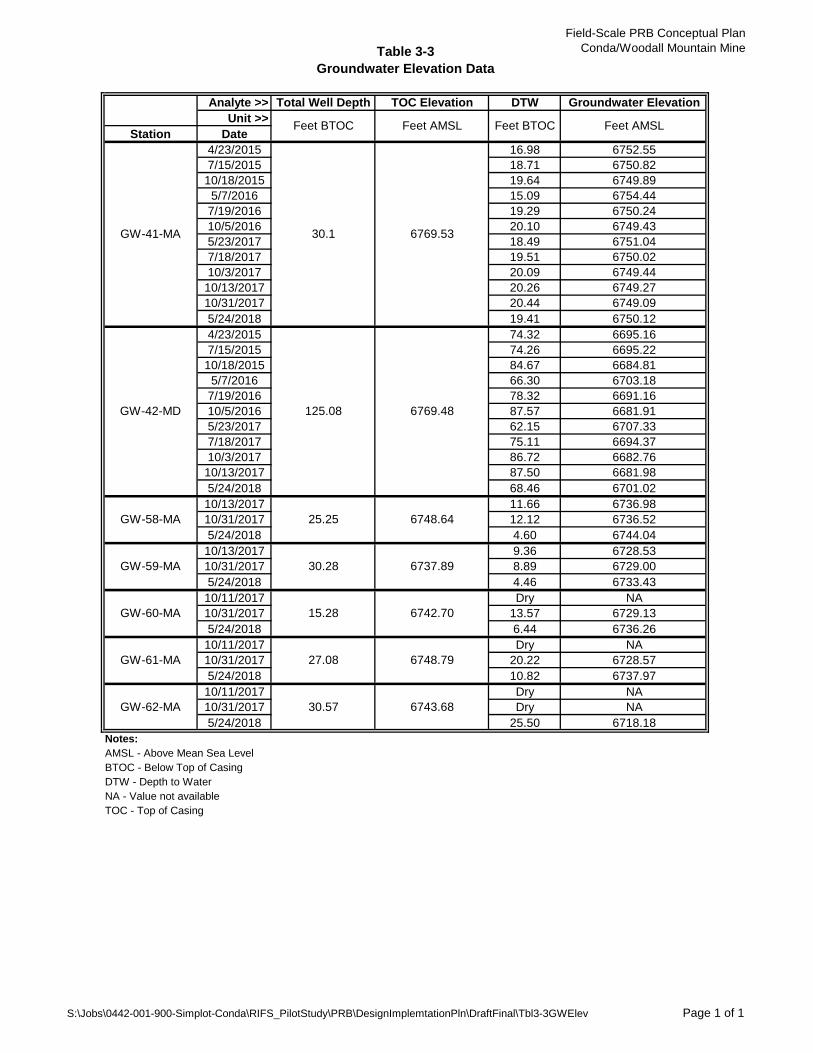
Table 3-3
Groundwater Elevation Data
Field-Scale PRB Conceptual Plan
Conda/Woodall Mountain Mine
Analyte >> Total Well Depth TOC Elevation DTW Groundwater Elevation
Unit >>
Station Date
4/23/2015 16.98 6752.55
7/15/2015 18.71 6750.82
10/18/2015 19.64 6749.89
5/7/2016 15.09 6754.44
7/19/2016 19.29 6750.24
10/5/2016 20.10 6749.43
5/23/2017 18.49 6751.04
7/18/2017 19.51 6750.02
10/3/2017 20.09 6749.44
10/13/2017 20.26 6749.27
10/31/2017 20.44 6749.09
5/24/2018 19.41 6750.12
4/23/2015 74.32 6695.16
7/15/2015 74.26 6695.22
10/18/2015 84.67 6684.81
5/7/2016 66.30 6703.18
7/19/2016 78.32 6691.16
10/5/2016 87.57 6681.91
5/23/2017 62.15 6707.33
7/18/2017 75.11 6694.37
10/3/2017 86.72 6682.76
10/13/2017 87.50 6681.98
5/24/2018 68.46 6701.02
10/13/2017 11.66 6736.98
10/31/2017 12.12 6736.52
5/24/2018 4.60 6744.04
10/13/2017 9.36 6728.53
10/31/2017 8.89 6729.00
5/24/2018 4.46 6733.43
10/11/2017 Dry NA
10/31/2017 13.57 6729.13
5/24/2018 6.44 6736.26
10/11/2017 Dry NA
10/31/2017 20.22 6728.57
5/24/2018 10.82 6737.97
10/11/2017 Dry NA
10/31/2017 Dry NA
5/24/2018 25.50 6718.18
Notes:
AMSL - Above Mean Sea Level
BTOC - Below Top of Casing
DTW - Depth to Water
NA - Value not available
TOC - Top of Casing
Feet AMSLFeet BTOC Feet BTOCFeet AMSL
GW-41-MA 30.1 6769.53
GW-42-MD 125.08 6769.48
GW-58-MA 25.25 6748.64
GW-59-MA 30.28 6737.89
GW-62-MA 30.57 6743.68
GW-60-MA 15.28 6742.70
GW-61-MA 27.08 6748.79
S:\Jobs\0442-001-900-Simplot-Conda\RIFS_PilotStudy\PRB\DesignImplemtationPln\DraftFinal\Tbl3-3GWElev Page 1 of 1
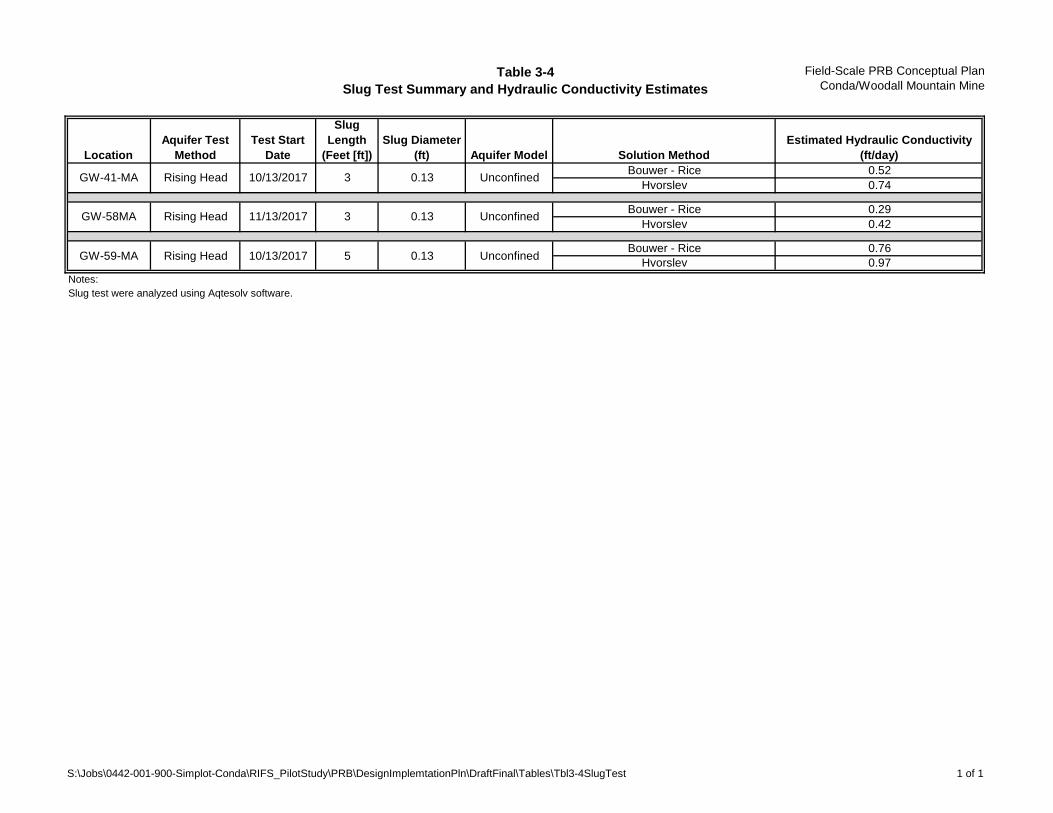
Table 3-4
Slug Test Summary and Hydraulic Conductivity Estimates
Field-Scale PRB Conceptual Plan
Conda/Woodall Mountain Mine
Location
Aquifer Test
Method
Test Start
Date
Slug
Length
(Feet [ft])
Slug Diameter
(ft) Aquifer Model Solution Method
Estimated Hydraulic Conductivity
(ft/day)
Bouwer - Rice 0.52
Hvorslev 0.74
Bouwer - Rice 0.29
Hvorslev 0.42
Bouwer - Rice 0.76
Hvorslev 0.97
Notes:
Slug test were analyzed using Aqtesolv software.
10/13/2017Rising HeadGW-59-MA
11/13/2017
Unconfined
Unconfined
Unconfined
0.135
0.133
0.133Rising HeadGW-58MA
10/13/2017Rising HeadGW-41-MA
S:\Jobs\0442-001-900-Simplot-Conda\RIFS_PilotStudy\PRB\DesignImplemtationPln\DraftFinal\Tables\Tbl3-4SlugTest 1 of 1

Table 3-5
Shallow Groundwater and Seep Analytical and Field Data, 2015 - May 2018
Field-Scale PRB Plan
Conda/Woodall Mountain Mine
Station
Sample
Date
Time
Analyte Units
Human
Health Livestock Result LabQ ValQ Result LabQ ValQ Result LabQ ValQ Result LabQ ValQ Result LabQ ValQ Result LabQ ValQ Result LabQ ValQ Result LabQ ValQ Result LabQ ValQ
Field Parameters
DTW Feet 16.98 18.71 19.64 15.09 19.29 20.1 18.49 19.51 20.09
ORP mV 116.8 229.3 133.9 198.7 135.1 -58.2 114.9 172.9 153.2
pH SU 5.2 7.98 7.06 6.82 6.91 7 6.32 6.63 6.35
Oxygen, Dissolved mg/L 7.07 5.09 0.31 0.41 2.65 0.43 0.95 0.22 0.49
Temperature C 8.7 10.45 12.29 6 11.56 12.28 7.63 10 11.4
Turbidity NTU 228 4.03 1.89 0.76 0.88 0.78 4.2 23.8
Conductivity at 25 C umhos/cm 2565 1622 3464 2783 2921 4139 2512 3157 3113
Metals and Metaloids
Aluminum, Dissolved mg/L 0.036 U 0.036 U UJ 0.036 U 0.036 U 0.055 U 0.055 U
Aluminum, Total mg/L 2 5 5.05 0.036 U UJ 0.036 U 0.036 U 0.055 U 0.055 U
Antimony, Dissolved mg/L 0.00053 J 0.0009 J UJ 0.00071 J 0.00048 J 0.00058 J 0.00056 J U
Antimony, Total mg/L 0.006 0.00074 J 0.0008 J J- 0.0007 J 0.00045 J 0.00056 J 0.00056 J U
Arsenic, Dissolved mg/L 0.0024 J 0.0026 J J- 0.0015 J 0.00087 J 0.00098 J 0.001 J 0.00067 J 0.00074 J 0.00099 J
Arsenic, Total mg/L 0.01 0.2 0.003 J 0.0026 J J- 0.0014 J 0.00085 J 0.0011 J 0.001 J 0.00068 J 0.00077 J J- 0.00099 J
Barium, Dissolved mg/L 0.0434 0.0424 J- 0.0425 0.0366 0.0414 0.0548
Barium, Total mg/L 2 0.2 0.0803 0.0428 J- 0.0432 0.0387 0.0425 0.0543
Beryllium, Dissolved mg/L 0.00094 U 0.00094 U UJ 0.00094 U 0.00099 U 0.00099 U 0.00099 U
Beryllium, Total mg/L 0.004 0.1 0.00094 U 0.00094 U UJ 0.00094 U 0.00099 U 0.00099 U 0.00099 U
Boron, Dissolved mg/L 0.0497 0.0741 J- 0.0659 0.0491 0.0732 0.0742
Boron, Total mg/L 0.4 5 0.0552 0.0788 J- 0.0664 0.0521 0.0742 0.0743
Cadmium, Dissolved mg/L 0.0028 0.0041 J- 0.001 0.0063 0.0054 0.0082 0.00484 0.00591 0.0157
Cadmium, Total mg/L 0.005 0.05 0.0085 0.0057 J- 0.0043 0.0067 0.0063 0.0078 0.00574 0.00638 0.0161
Chromium, Dissolved mg/L 0.0022 J 0.001 U UJ 0.0021 J 0.001 J 0.0015 U 0.0015 U 0.0019 U 0.0022 J 0.0026 J
Chromium, Total mg/L 0.1 1 0.0237 0.0024 J J- 0.0028 J 0.0014 J 0.0015 U 0.0015 U 0.0019 U 0.0019 U 0.0019 U
Cobalt, Dissolved mg/L 0.0011 J 0.0019 U UJ 0.0019 U 0.0019 U 0.001 U 0.001 U
Cobalt, Total mg/L 0.001 1 0.0022 J 0.0019 U UJ 0.0019 U 0.0019 U 0.001 U 0.001 U
Copper, Dissolved mg/L 0.0023 U 0.0023 U UJ 0.0023 U 0.0022 U 0.0026 U 0.0026 U
Copper, Total mg/L 1.3 0.5 0.0023 U 0.0023 U UJ 0.0023 U 0.0022 U 0.0026 U 0.0026 U
Iron, Dissolved mg/L 0.026 U 0.048 U UJ 0.1 0.048 U 0.039 U 0.039 U
Iron, Total mg/L 3.13 2 4.33 0.048 U UJ 0.0901 0.048 U 0.039 U 0.039 U
Lead, Dissolved mg/L 0.0038 U 0.003 U UJ 0.0073 J 0.0036 U 0.0036 U 0.0036 U
Lead, Total mg/L 0.015 0.1 0.0045 J 0.003 U UJ 0.0062 J 0.0042 J 0.0036 U 0.0036 U
Manganese, Dissolved mg/L 0.0023 U 0.0023 U UJ 0.15 0.458 0.514 0.854
Manganese, Total mg/L 0.25 0.05 0.185 J 0.0023 U UJ 0.155 0.484 0.506 0.766Mercury, Dissolved mg/L 0.00004 U 0.00004 U UJ 0.00004 U 0.000053 U UJ 0.000053 U 0.000053 U
Mercury, Total mg/L 0.002 0.01 0.00004 U 0.00004 U UJ 0.00004 U 0.000053 U UJ 0.000053 U 0.000053 U
Molybdenum, Dissolved mg/L 0.0675 0.0408 J- 0.0579 0.0358 0.0337 0.0402
Molybdenum, Total mg/L 0.01 0.3 0.0662 0.0471 J- 0.0584 0.0498 0.0329 0.0404
Nickel, Dissolved mg/L 0.0408 0.0581 J- 0.114 0.0886 0.116 0.151
Nickel, Total mg/L 0.209 1 0.0595 0.0596 J- 0.117 0.0943 0.117 0.152
Selenium, Dissolved mg/L 6.25 7.35 J- 0.263 4.89 J 0.992 1.29 2.45 0.442 0.129
Selenium, Total mg/L 0.05 0.05 6.84 7.18 J- 0.298 4.98 0.994 1.38 2.44 0.44 0.133Silver, Dissolved mg/L 0.0018 U 0.0021 U UJ 0.0021 U 0.0024 J 0.0025 J 0.0016 U
Silver, Total mg/L 0.052 0.0018 U 0.0021 U UJ 0.0021 U 0.0032 J 0.0024 J 0.0016 U
Thallium, Dissolved mg/L 0.000026 U 0.000069 J J- 0.000026 U 0.000034 U 0.000042 J 0.000049 J U
Thallium, Total mg/L 0.002 0.00014 J U 0.000048 J J- 0.000036 J U 0.000034 U 0.000055 J 0.000048 J U
Uranium, Dissolved mg/L 0.022 0.0339 J- 0.026 0.022 0.023 0.023
Uranium, Total mg/L 0.03 0.2 0.052 0.031 J- 0.026 0.023 0.023 0.023
Vanadium, Dissolved mg/L 0.0023 J 0.0071 J- 0.0024 J 0.0051 0.0046 0.0053 0.0037 0.0043 0.0029 J
Vanadium, Total mg/L 0.0086 0.1 0.019 0.0064 J- 0.0025 J 0.0047 0.0046 0.0054 0.0036 0.0042 0.0031
Zinc, Dissolved mg/L 0.075 J 0.0317 J- 0.02 0.026 0.028 0.035 0.019 0.037 0.069
Zinc, Total mg/L 3.13 25 0.082 0.077 J- 0.029 0.026 0.034 0.033 0.022 0.037 B 0.0689
CD1015-GW41MA-GW001
10/18/2015
9:10
CD0516-GW41MA-GW001
5/7/2016
12:32
CD0716-GW41MA-GW001
7/19/2016
CD0415-GW41MA-GW001
4/23/2015
12:06
CD0715-GW41MA-GW001
7/15/2015
15:30 11:01
CD1016-GW41MA-GW001
10/5/2016
15:43
CD0517-GW41MA-GW001
5/23/2017
16:44
CD0717-GW41MA-GW001
7/18/2017
12:02
CD1017-GW41MA-GW001
10/3/2017
9:10
GW-41-MA
S:\Jobs\0442-001-900-Simplot-Conda\RIFS_PilotStudy\PRB\DesignImplemtationPln\DraftFinal\Tables\Tbl3-5GWAnalytical 1 of 10
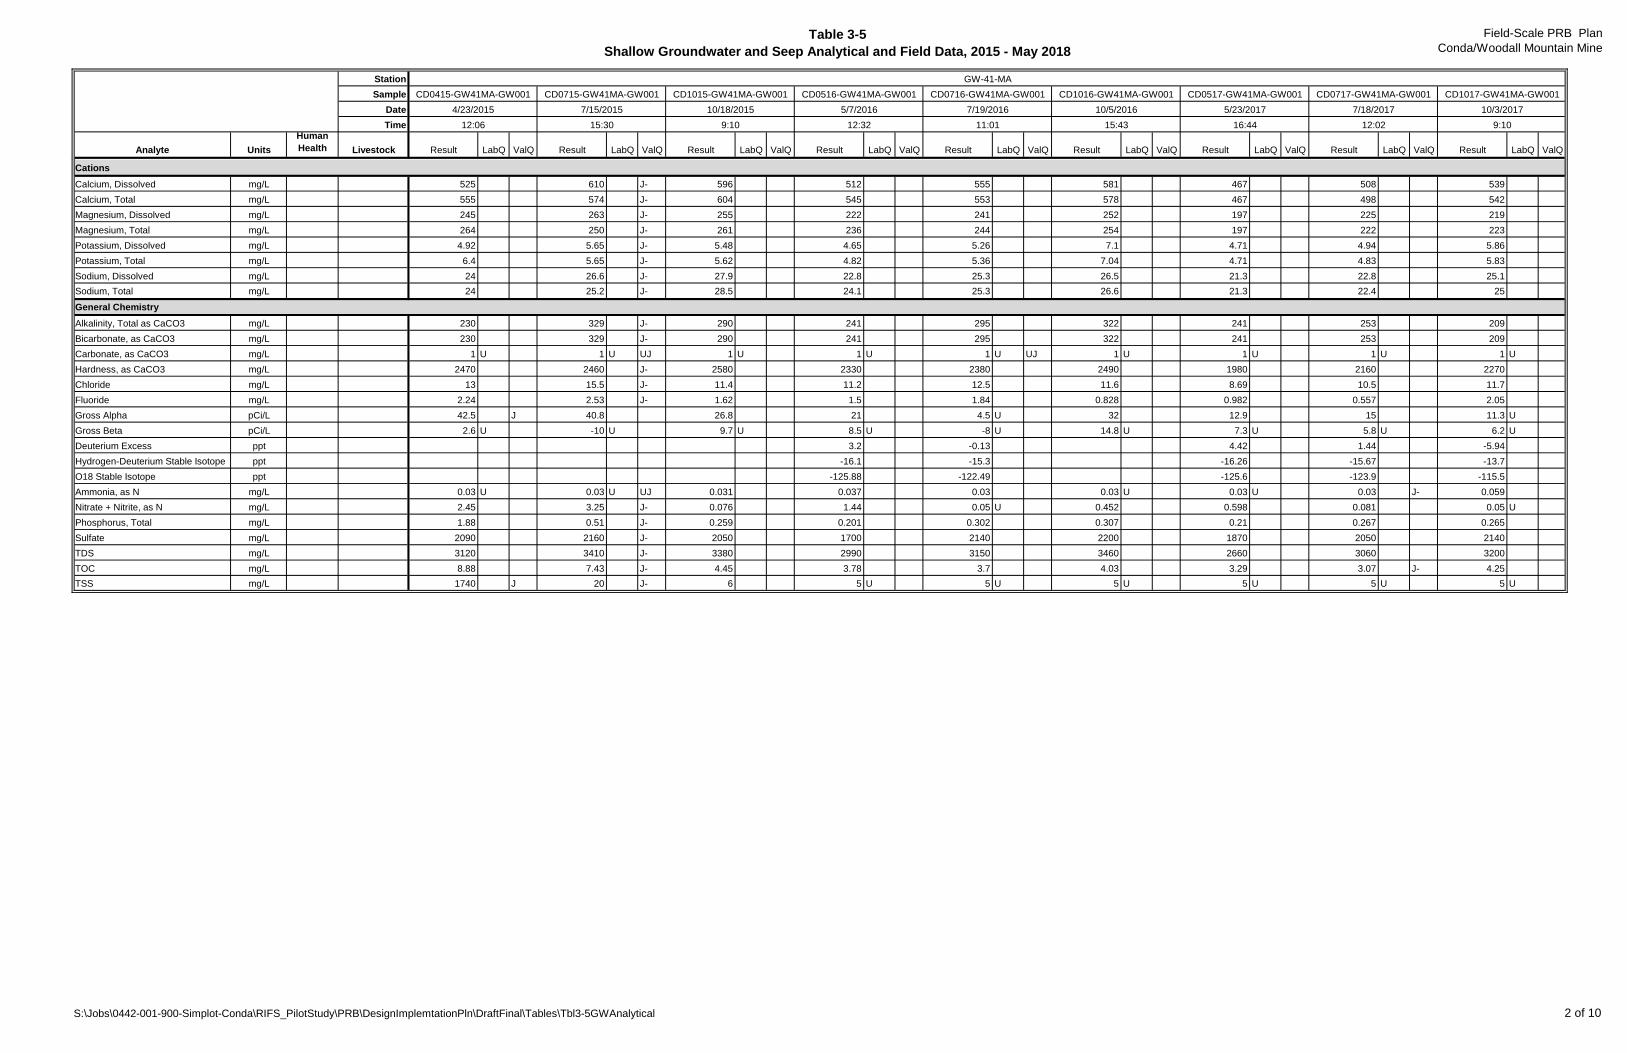
Table 3-5
Shallow Groundwater and Seep Analytical and Field Data, 2015 - May 2018
Field-Scale PRB Plan
Conda/Woodall Mountain Mine
Station
Sample
Date
Time
Analyte Units
Human
Health Livestock Result LabQ ValQ Result LabQ ValQ Result LabQ ValQ Result LabQ ValQ Result LabQ ValQ Result LabQ ValQ Result LabQ ValQ Result LabQ ValQ Result LabQ ValQ
CD1015-GW41MA-GW001
10/18/2015
9:10
CD0516-GW41MA-GW001
5/7/2016
12:32
CD0716-GW41MA-GW001
7/19/2016
CD0415-GW41MA-GW001
4/23/2015
12:06
CD0715-GW41MA-GW001
7/15/2015
15:30 11:01
CD1016-GW41MA-GW001
10/5/2016
15:43
CD0517-GW41MA-GW001
5/23/2017
16:44
CD0717-GW41MA-GW001
7/18/2017
12:02
CD1017-GW41MA-GW001
10/3/2017
9:10
GW-41-MA
Cations
Calcium, Dissolved mg/L 525 610 J- 596 512 555 581 467 508 539
Calcium, Total mg/L 555 574 J- 604 545 553 578 467 498 542
Magnesium, Dissolved mg/L 245 263 J- 255 222 241 252 197 225 219
Magnesium, Total mg/L 264 250 J- 261 236 244 254 197 222 223
Potassium, Dissolved mg/L 4.92 5.65 J- 5.48 4.65 5.26 7.1 4.71 4.94 5.86
Potassium, Total mg/L 6.4 5.65 J- 5.62 4.82 5.36 7.04 4.71 4.83 5.83
Sodium, Dissolved mg/L 24 26.6 J- 27.9 22.8 25.3 26.5 21.3 22.8 25.1
Sodium, Total mg/L 24 25.2 J- 28.5 24.1 25.3 26.6 21.3 22.4 25
General Chemistry
Alkalinity, Total as CaCO3 mg/L 230 329 J- 290 241 295 322 241 253 209
Bicarbonate, as CaCO3 mg/L 230 329 J- 290 241 295 322 241 253 209
Carbonate, as CaCO3 mg/L 1 U 1 U UJ 1 U 1 U 1 U UJ 1 U 1 U 1 U 1 U
Hardness, as CaCO3 mg/L 2470 2460 J- 2580 2330 2380 2490 1980 2160 2270
Chloride mg/L 13 15.5 J- 11.4 11.2 12.5 11.6 8.69 10.5 11.7
Fluoride mg/L 2.24 2.53 J- 1.62 1.5 1.84 0.828 0.982 0.557 2.05
Gross Alpha pCi/L 42.5 J 40.8 26.8 21 4.5 U 32 12.9 15 11.3 U
Gross Beta pCi/L 2.6 U -10 U 9.7 U 8.5 U -8 U 14.8 U 7.3 U 5.8 U 6.2 U
Deuterium Excess ppt 3.2 -0.13 4.42 1.44 -5.94
Hydrogen-Deuterium Stable Isotope ppt -16.1 -15.3 -16.26 -15.67 -13.7
O18 Stable Isotope ppt -125.88 -122.49 -125.6 -123.9 -115.5
Ammonia, as N mg/L 0.03 U 0.03 U UJ 0.031 0.037 0.03 0.03 U 0.03 U 0.03 J- 0.059
Nitrate + Nitrite, as N mg/L 2.45 3.25 J- 0.076 1.44 0.05 U 0.452 0.598 0.081 0.05 U
Phosphorus, Total mg/L 1.88 0.51 J- 0.259 0.201 0.302 0.307 0.21 0.267 0.265
Sulfate mg/L 2090 2160 J- 2050 1700 2140 2200 1870 2050 2140
TDS mg/L 3120 3410 J- 3380 2990 3150 3460 2660 3060 3200
TOC mg/L 8.88 7.43 J- 4.45 3.78 3.7 4.03 3.29 3.07 J- 4.25
TSS mg/L 1740 J 20 J- 6 5 U 5 U 5 U 5 U 5 U 5 U
S:\Jobs\0442-001-900-Simplot-Conda\RIFS_PilotStudy\PRB\DesignImplemtationPln\DraftFinal\Tables\Tbl3-5GWAnalytical 2 of 10

Table 3-5
Shallow Groundwater and Seep Analytical and Field Data, 2015 - May 2018
Field-Scale PRB Plan
Conda/Woodall Mountain Mine
Station
Sample
Date
Time
Analyte Units
Human
Health Livestock
Field Parameters
DTW Feet
ORP mV
pH SU
Oxygen, Dissolved mg/L
Temperature C
Turbidity NTU
Conductivity at 25 C umhos/cm
Metals and Metaloids
Aluminum, Dissolved mg/L
Aluminum, Total mg/L 2 5
Antimony, Dissolved mg/L
Antimony, Total mg/L 0.006
Arsenic, Dissolved mg/L
Arsenic, Total mg/L 0.01 0.2
Barium, Dissolved mg/L
Barium, Total mg/L 2 0.2
Beryllium, Dissolved mg/L
Beryllium, Total mg/L 0.004 0.1
Boron, Dissolved mg/L
Boron, Total mg/L 0.4 5
Cadmium, Dissolved mg/L
Cadmium, Total mg/L 0.005 0.05
Chromium, Dissolved mg/L
Chromium, Total mg/L 0.1 1
Cobalt, Dissolved mg/L
Cobalt, Total mg/L 0.001 1
Copper, Dissolved mg/L
Copper, Total mg/L 1.3 0.5
Iron, Dissolved mg/L
Iron, Total mg/L 3.13 2
Lead, Dissolved mg/L
Lead, Total mg/L 0.015 0.1
Manganese, Dissolved mg/L
Manganese, Total mg/L 0.25 0.05
Mercury, Dissolved mg/L
Mercury, Total mg/L 0.002 0.01
Molybdenum, Dissolved mg/L
Molybdenum, Total mg/L 0.01 0.3
Nickel, Dissolved mg/L
Nickel, Total mg/L 0.209 1
Selenium, Dissolved mg/L
Selenium, Total mg/L 0.05 0.05
Silver, Dissolved mg/L
Silver, Total mg/L 0.052
Thallium, Dissolved mg/L
Thallium, Total mg/L 0.002
Uranium, Dissolved mg/L
Uranium, Total mg/L 0.03 0.2
Vanadium, Dissolved mg/L
Vanadium, Total mg/L 0.0086 0.1
Zinc, Dissolved mg/L
Zinc, Total mg/L 3.13 25
Result LabQ ValQ Result LabQ ValQ Result LabQ ValQ Result LabQ ValQ Result LabQ ValQ Result LabQ ValQ Result LabQ ValQ Result LabQ ValQ
20.44 19.41 12.12 4.6 8.89 4.46 13.57 6.44
61.9 159.4 92.2 107.3 71.8 -84.4 55.5 59.7
6.03 6.43 5.75 6.29 6.87 6.47 6.86 6.75
1.27 0.12 8.23 0.53 11.51 0 7 4.4
11.1 7 7.59 7.2 9.7 8.9 9.8 12.9
0.54 26.43 51.4 158.64 24 4.76 9.65 4.77
3195 2824 3131 2924 3222 3141 2687 2593
0.04 U 0.04 U 0.05 U 0.04 U 0.05 U 0.04 U 0.05 U
0.04 U 1.92 4.79 1.81 0.05 U 0.04 U 0.05 U
0.00027 J 0.00042 J 0.00037 J 0.00014 J 0.00023 U 0.00037 J 0.00025 J
0.00022 J 0.00017 U 0.00066 J 0.00017 U 0.00023 U 0.00017 U 0.00026 J
0.00095 J 0.00065 J 0.00078 J 0.00073 J 0.00088 J 0.00124 J 0.00251 J 0.00098 J
0.00096 J 0.00064 J 0.00141 J 0.00212 J 0.00169 J 0.00137 J 0.00245 J 0.00101 J
0.0502 0.0413 0.0335 0.0402 0.0354 0.0663 0.0323
0.0473 0.0552 0.0686 0.0492 0.0352 0.0703 0.0325
0.001 U 0.001 U 0.0017 U 0.001 U 0.0017 U 0.001 U 0.0017 U
0.001 U 0.001 U 0.0017 J 0.001 U 0.0017 U 0.001 U 0.0017 U
0.062 0.055 0.041 0.05 0.056 0.047 0.035 J
0.059 0.059 0.047 0.055 0.055 0.047 0.035 J
0.0154 0.00577 0.00313 0.00261 0.00234 0.00022 0.00033 0.00022
0.0152 0.00577 0.00325 0.00342 0.00281 0.00483 0.00043 J 0.0004
0.0019 U 0.002 U 0.0019 U 0.002 U 0.0019 U 0.002 U 0.0019 U 0.002 U
0.0019 U 0.002 U 0.0073 0.0234 0.0092 0.002 U 0.0019 U 0.002 U
0.0028 J 0.0013 U 0.0016 U 0.0026 J 0.0025 J 0.0088 0.0089
0.0021 J 0.0013 U 0.0016 U 0.0024 J 0.0025 J 0.0115 0.009
0.0024 J 0.0044 J 0.0027 U 0.0025 J 0.0027 U 0.0023 U 0.0027 U
0.0023 J 0.0052 J 0.0068 J 0.0043 J 0.0027 U 0.0023 U 0.0027 U
0.045 U 0.056 U 0.045 U 0.066 J 0.045 U 0.307 0.045 U 0.073 J
0.045 U 0.056 U 1.41 3.68 1.55 0.296 0.151 0.121
0.0052 U 0.0052 U 0.0049 U 0.0052 U 0.0049 U 0.0052 U 0.0049 U
0.0052 U 0.0052 U 0.0064 J 0.0052 U 0.0049 U 0.0052 U 0.0049 U
7.64 1.1 0.091 0.0192 6.1 4.01 4.03 4.96
6.94 0.133 0.0889 6.2 4.1 5.08 4.920.000076 U 0.000076 U 0.000093 U 0.000076 U 0.000093 U 0.000076 U 0.000093 U
0.000076 U 0.000076 U 0.000093 U 0.000076 U 0.000093 U 0.000076 U 0.000093 U
0.022 0.029 0.013 0.059 0.03 0.008 0.003 J
0.021 0.029 0.013 0.062 0.031 0.007 J 0.003 J
0.18 0.0556 0.0524 0.101 0.0879 0.0154 0.0163
0.172 0.0586 0.0632 0.108 0.0902 0.0158 0.0161
0.104 0.694 3.31 0.975 0.0157 0.0775 0.12 0.545
0.11 0.672 J 3.42 0.985 J 0.0171 0.0482 J 0.0878 0.543 J
0.0024 U 0.0024 U 0.0019 U 0.0024 U 0.0019 U 0.0024 U 0.0019 U
0.0024 U 0.0024 U 0.0019 U 0.0024 U 0.0019 U 0.0024 U 0.0019 U
0.000092 J 0.000059 J 0.00008 U 0.000083 J 0.00008 U 0.00003 U 0.00008 U
0.00015 U 0.00015 U 0.000084 J 0.00015 U 0.00008 U 0.00015 U 0.00008 U
0.00779 0.0231 0.0158 0.0266 0.0135 0.0185 0.0143
0.00849 0.0233 0.0172 0.0271 0.0126 0.0157 0.0137
0.0026 J 0.0034 0.0032 0.0031 0.0022 J 0.0005 J 0.0027 J 0.0006 J
0.0027 J 0.0034 0.0091 0.0173 0.0088 0.0005 J 0.0029 J 0.0007 J
0.0657 0.0204 0.0157 0.0121 0.0195 0.0027 U 0.0105 0.0073
0.0646 0.0194 0.0267 0.0406 0.0528 0.0227 0.0095 0.007
CD1017-GW59MA-GW003
10/31/2017
12:51
CD1017-GW60MA-GW003
10/31/2017
14:07
10/31/2017
11:38
CD0518-GW41MA-GW001
5/24/2018
14:20
CD1017-GW41MA-GW003
10/31/2017
9:55
CD1017-GW58MA-GW003
GW-41-MA (continued)
5/24/2018
CD0518-GW58MA-GW001
10:25
5/24/2018
CD0518-GW59MA-GW001
12:04 12:30
5/24/2018
CD0518-GW60MA-GW001
GW-58-MA GW-59-MA GW-60-MA
S:\Jobs\0442-001-900-Simplot-Conda\RIFS_PilotStudy\PRB\DesignImplemtationPln\DraftFinal\Tables\Tbl3-5GWAnalytical 3 of 10
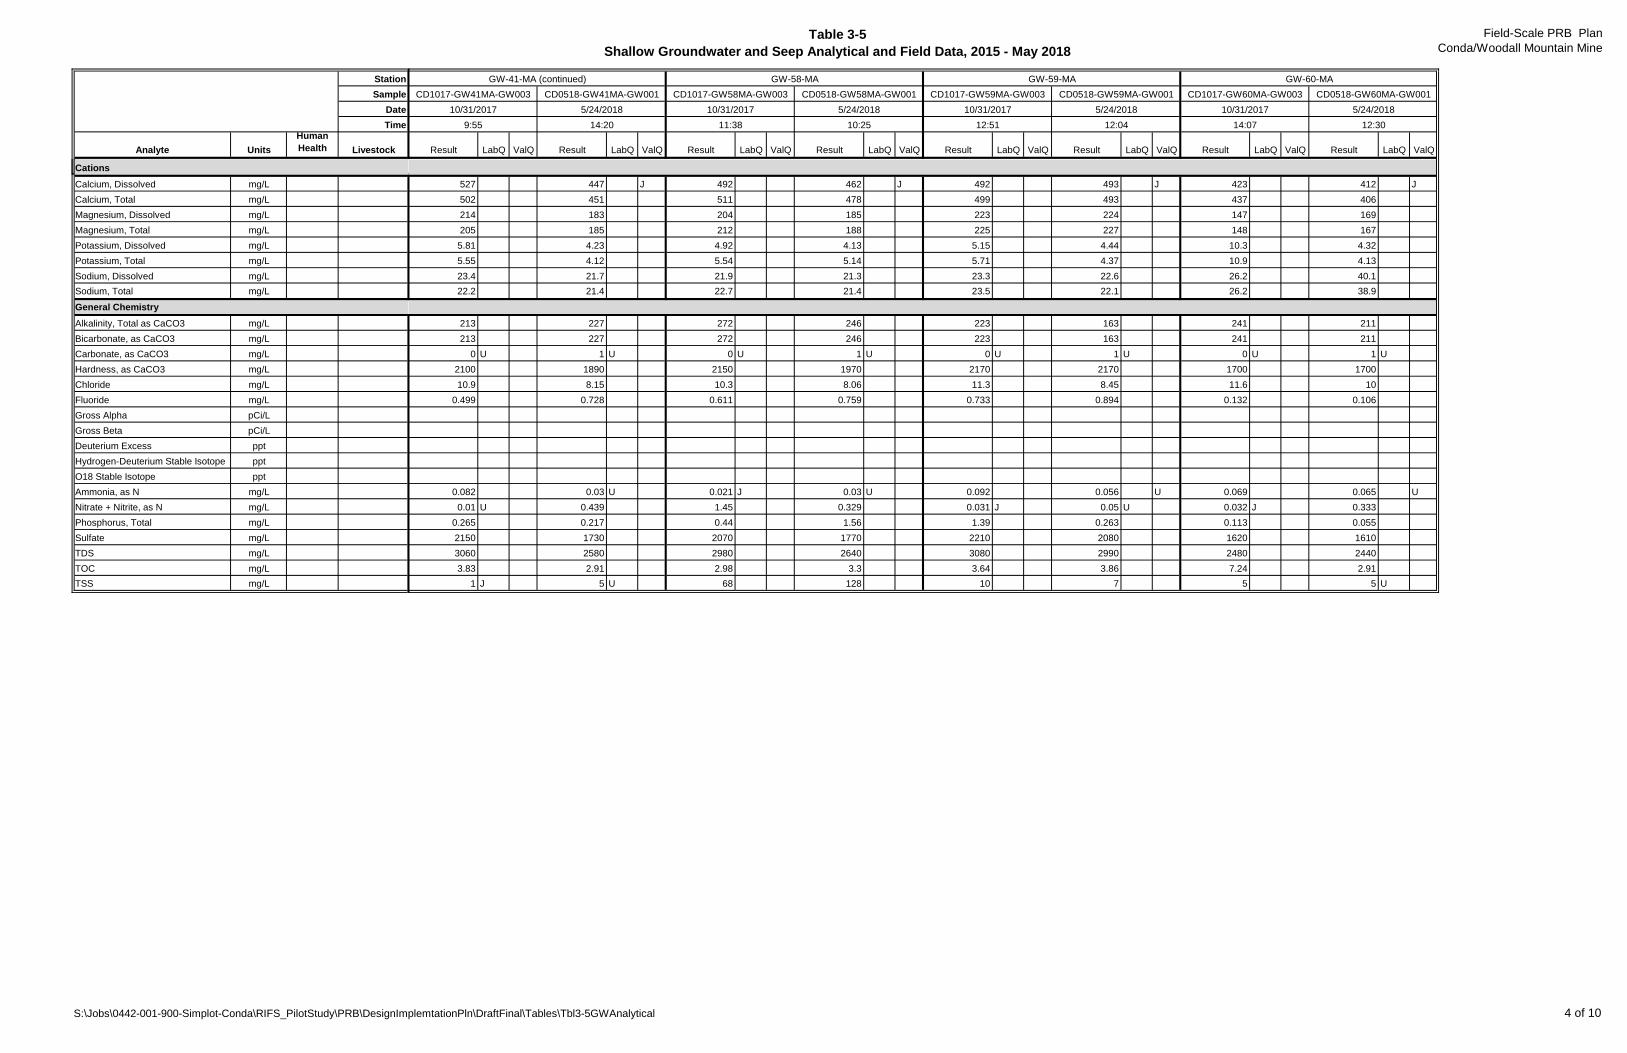
Table 3-5
Shallow Groundwater and Seep Analytical and Field Data, 2015 - May 2018
Field-Scale PRB Plan
Conda/Woodall Mountain Mine
Station
Sample
Date
Time
Analyte Units
Human
Health Livestock
Cations
Calcium, Dissolved mg/L
Calcium, Total mg/L
Magnesium, Dissolved mg/L
Magnesium, Total mg/L
Potassium, Dissolved mg/L
Potassium, Total mg/L
Sodium, Dissolved mg/L
Sodium, Total mg/L
General Chemistry
Alkalinity, Total as CaCO3 mg/L
Bicarbonate, as CaCO3 mg/L
Carbonate, as CaCO3 mg/L
Hardness, as CaCO3 mg/L
Chloride mg/L
Fluoride mg/L
Gross Alpha pCi/L
Gross Beta pCi/L
Deuterium Excess ppt
Hydrogen-Deuterium Stable Isotope ppt
O18 Stable Isotope ppt
Ammonia, as N mg/L
Nitrate + Nitrite, as N mg/L
Phosphorus, Total mg/L
Sulfate mg/L
TDS mg/L
TOC mg/L
TSS mg/L
Result LabQ ValQ Result LabQ ValQ Result LabQ ValQ Result LabQ ValQ Result LabQ ValQ Result LabQ ValQ Result LabQ ValQ Result LabQ ValQ
CD1017-GW59MA-GW003
10/31/2017
12:51
CD1017-GW60MA-GW003
10/31/2017
14:07
10/31/2017
11:38
CD0518-GW41MA-GW001
5/24/2018
14:20
CD1017-GW41MA-GW003
10/31/2017
9:55
CD1017-GW58MA-GW003
GW-41-MA (continued)
5/24/2018
CD0518-GW58MA-GW001
10:25
5/24/2018
CD0518-GW59MA-GW001
12:04 12:30
5/24/2018
CD0518-GW60MA-GW001
GW-58-MA GW-59-MA GW-60-MA
527 447 J 492 462 J 492 493 J 423 412 J
502 451 511 478 499 493 437 406
214 183 204 185 223 224 147 169
205 185 212 188 225 227 148 167
5.81 4.23 4.92 4.13 5.15 4.44 10.3 4.32
5.55 4.12 5.54 5.14 5.71 4.37 10.9 4.13
23.4 21.7 21.9 21.3 23.3 22.6 26.2 40.1
22.2 21.4 22.7 21.4 23.5 22.1 26.2 38.9
213 227 272 246 223 163 241 211
213 227 272 246 223 163 241 211
0 U 1 U 0 U 1 U 0 U 1 U 0 U 1 U
2100 1890 2150 1970 2170 2170 1700 1700
10.9 8.15 10.3 8.06 11.3 8.45 11.6 10
0.499 0.728 0.611 0.759 0.733 0.894 0.132 0.106
0.082 0.03 U 0.021 J 0.03 U 0.092 0.056 U 0.069 0.065 U
0.01 U 0.439 1.45 0.329 0.031 J 0.05 U 0.032 J 0.333
0.265 0.217 0.44 1.56 1.39 0.263 0.113 0.055
2150 1730 2070 1770 2210 2080 1620 1610
3060 2580 2980 2640 3080 2990 2480 2440
3.83 2.91 2.98 3.3 3.64 3.86 7.24 2.91
1 J 5 U 68 128 10 7 5 5 U
S:\Jobs\0442-001-900-Simplot-Conda\RIFS_PilotStudy\PRB\DesignImplemtationPln\DraftFinal\Tables\Tbl3-5GWAnalytical 4 of 10
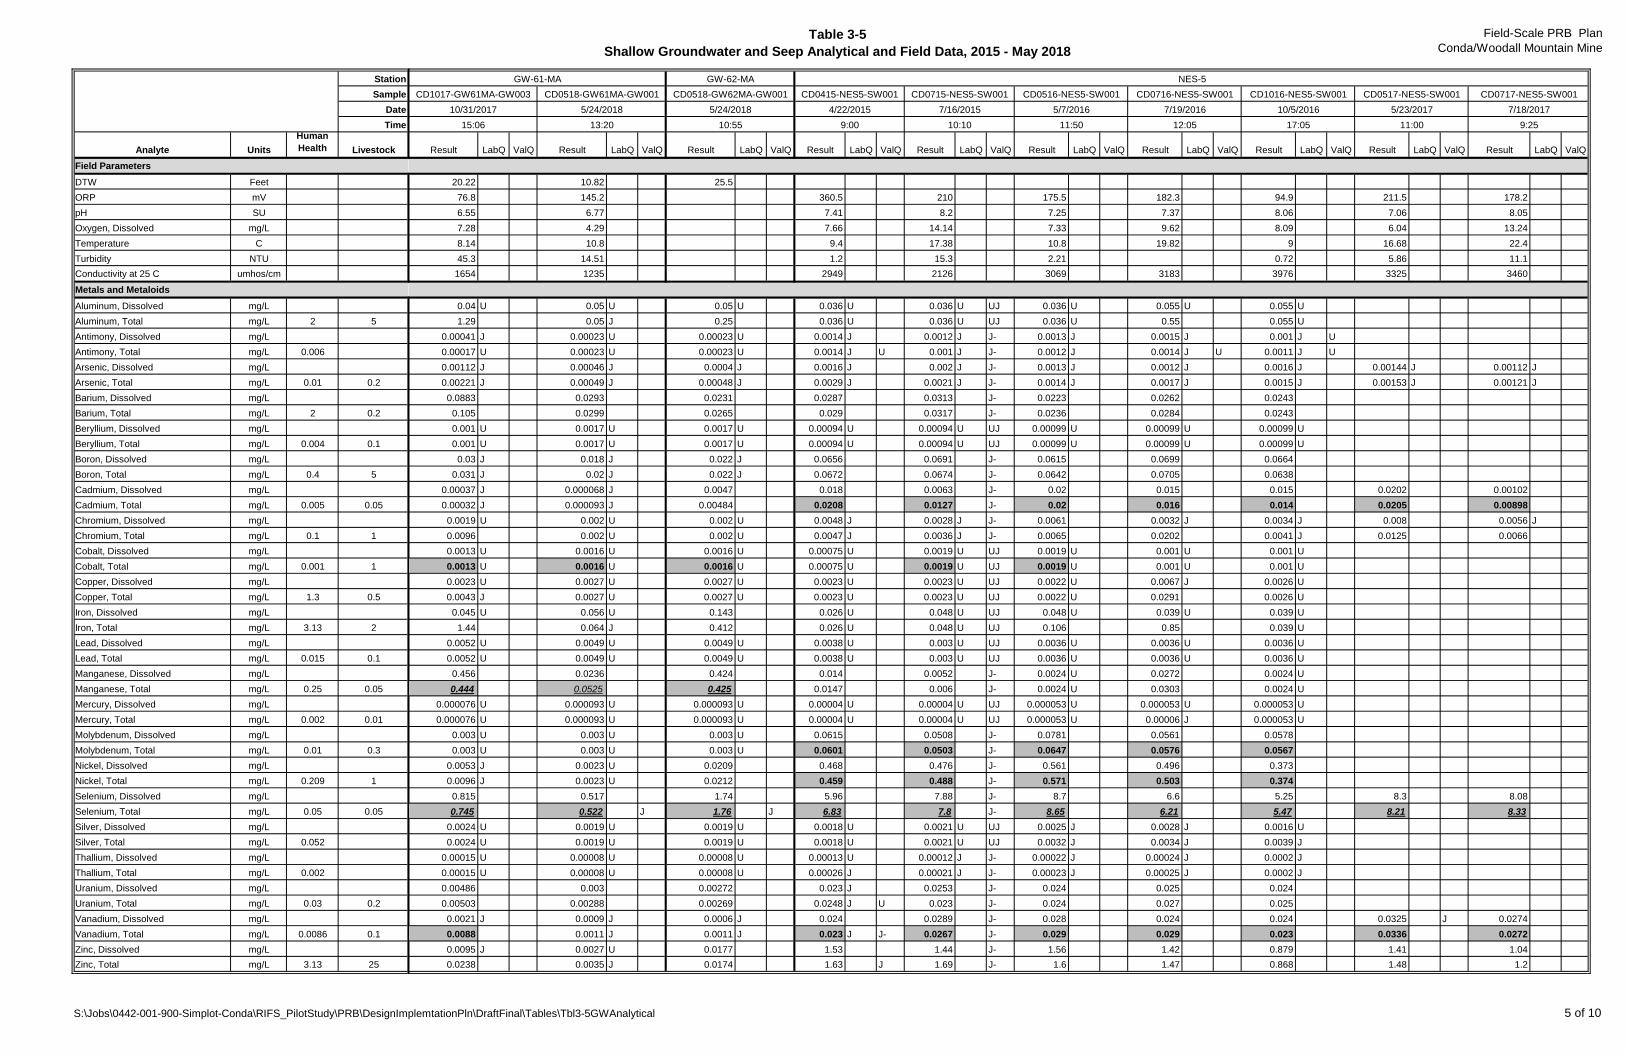
Table 3-5
Shallow Groundwater and Seep Analytical and Field Data, 2015 - May 2018
Field-Scale PRB Plan
Conda/Woodall Mountain Mine
Station
Sample
Date
Time
Analyte Units
Human
Health Livestock
Field Parameters
DTW Feet
ORP mV
pH SU
Oxygen, Dissolved mg/L
Temperature C
Turbidity NTU
Conductivity at 25 C umhos/cm
Metals and Metaloids
Aluminum, Dissolved mg/L
Aluminum, Total mg/L 2 5
Antimony, Dissolved mg/L
Antimony, Total mg/L 0.006
Arsenic, Dissolved mg/L
Arsenic, Total mg/L 0.01 0.2
Barium, Dissolved mg/L
Barium, Total mg/L 2 0.2
Beryllium, Dissolved mg/L
Beryllium, Total mg/L 0.004 0.1
Boron, Dissolved mg/L
Boron, Total mg/L 0.4 5
Cadmium, Dissolved mg/L
Cadmium, Total mg/L 0.005 0.05
Chromium, Dissolved mg/L
Chromium, Total mg/L 0.1 1
Cobalt, Dissolved mg/L
Cobalt, Total mg/L 0.001 1
Copper, Dissolved mg/L
Copper, Total mg/L 1.3 0.5
Iron, Dissolved mg/L
Iron, Total mg/L 3.13 2
Lead, Dissolved mg/L
Lead, Total mg/L 0.015 0.1
Manganese, Dissolved mg/L
Manganese, Total mg/L 0.25 0.05
Mercury, Dissolved mg/L
Mercury, Total mg/L 0.002 0.01
Molybdenum, Dissolved mg/L
Molybdenum, Total mg/L 0.01 0.3
Nickel, Dissolved mg/L
Nickel, Total mg/L 0.209 1
Selenium, Dissolved mg/L
Selenium, Total mg/L 0.05 0.05
Silver, Dissolved mg/L
Silver, Total mg/L 0.052
Thallium, Dissolved mg/L
Thallium, Total mg/L 0.002
Uranium, Dissolved mg/L
Uranium, Total mg/L 0.03 0.2
Vanadium, Dissolved mg/L
Vanadium, Total mg/L 0.0086 0.1
Zinc, Dissolved mg/L
Zinc, Total mg/L 3.13 25
Result LabQ ValQ Result LabQ ValQ Result LabQ ValQ Result LabQ ValQ Result LabQ ValQ Result LabQ ValQ Result LabQ ValQ Result LabQ ValQ Result LabQ ValQ Result LabQ ValQ
20.22 10.82 25.5
76.8 145.2 360.5 210 175.5 182.3 94.9 211.5 178.2
6.55 6.77 7.41 8.2 7.25 7.37 8.06 7.06 8.05
7.28 4.29 7.66 14.14 7.33 9.62 8.09 6.04 13.24
8.14 10.8 9.4 17.38 10.8 19.82 9 16.68 22.4
45.3 14.51 1.2 15.3 2.21 0.72 5.86 11.1
1654 1235 2949 2126 3069 3183 3976 3325 3460
0.04 U 0.05 U 0.05 U 0.036 U 0.036 U UJ 0.036 U 0.055 U 0.055 U
1.29 0.05 J 0.25 0.036 U 0.036 U UJ 0.036 U 0.55 0.055 U
0.00041 J 0.00023 U 0.00023 U 0.0014 J 0.0012 J J- 0.0013 J 0.0015 J 0.001 J U
0.00017 U 0.00023 U 0.00023 U 0.0014 J U 0.001 J J- 0.0012 J 0.0014 J U 0.0011 J U
0.00112 J 0.00046 J 0.0004 J 0.0016 J 0.002 J J- 0.0013 J 0.0012 J 0.0016 J 0.00144 J 0.00112 J
0.00221 J 0.00049 J 0.00048 J 0.0029 J 0.0021 J J- 0.0014 J 0.0017 J 0.0015 J 0.00153 J 0.00121 J
0.0883 0.0293 0.0231 0.0287 0.0313 J- 0.0223 0.0262 0.0243
0.105 0.0299 0.0265 0.029 0.0317 J- 0.0236 0.0284 0.0243
0.001 U 0.0017 U 0.0017 U 0.00094 U 0.00094 U UJ 0.00099 U 0.00099 U 0.00099 U
0.001 U 0.0017 U 0.0017 U 0.00094 U 0.00094 U UJ 0.00099 U 0.00099 U 0.00099 U
0.03 J 0.018 J 0.022 J 0.0656 0.0691 J- 0.0615 0.0699 0.0664
0.031 J 0.02 J 0.022 J 0.0672 0.0674 J- 0.0642 0.0705 0.0638
0.00037 J 0.000068 J 0.0047 0.018 0.0063 J- 0.02 0.015 0.015 0.0202 0.00102
0.00032 J 0.000093 J 0.00484 0.0208 0.0127 J- 0.02 0.016 0.014 0.0205 0.00898
0.0019 U 0.002 U 0.002 U 0.0048 J 0.0028 J J- 0.0061 0.0032 J 0.0034 J 0.008 0.0056 J
0.0096 0.002 U 0.002 U 0.0047 J 0.0036 J J- 0.0065 0.0202 0.0041 J 0.0125 0.0066
0.0013 U 0.0016 U 0.0016 U 0.00075 U 0.0019 U UJ 0.0019 U 0.001 U 0.001 U
0.0013 U 0.0016 U 0.0016 U 0.00075 U 0.0019 U UJ 0.0019 U 0.001 U 0.001 U
0.0023 U 0.0027 U 0.0027 U 0.0023 U 0.0023 U UJ 0.0022 U 0.0067 J 0.0026 U
0.0043 J 0.0027 U 0.0027 U 0.0023 U 0.0023 U UJ 0.0022 U 0.0291 0.0026 U
0.045 U 0.056 U 0.143 0.026 U 0.048 U UJ 0.048 U 0.039 U 0.039 U
1.44 0.064 J 0.412 0.026 U 0.048 U UJ 0.106 0.85 0.039 U
0.0052 U 0.0049 U 0.0049 U 0.0038 U 0.003 U UJ 0.0036 U 0.0036 U 0.0036 U
0.0052 U 0.0049 U 0.0049 U 0.0038 U 0.003 U UJ 0.0036 U 0.0036 U 0.0036 U
0.456 0.0236 0.424 0.014 0.0052 J- 0.0024 U 0.0272 0.0024 U
0.444 0.0525 0.425 0.0147 0.006 J- 0.0024 U 0.0303 0.0024 U
0.000076 U 0.000093 U 0.000093 U 0.00004 U 0.00004 U UJ 0.000053 U 0.000053 U 0.000053 U
0.000076 U 0.000093 U 0.000093 U 0.00004 U 0.00004 U UJ 0.000053 U 0.00006 J 0.000053 U
0.003 U 0.003 U 0.003 U 0.0615 0.0508 J- 0.0781 0.0561 0.0578
0.003 U 0.003 U 0.003 U 0.0601 0.0503 J- 0.0647 0.0576 0.0567
0.0053 J 0.0023 U 0.0209 0.468 0.476 J- 0.561 0.496 0.373
0.0096 J 0.0023 U 0.0212 0.459 0.488 J- 0.571 0.503 0.374
0.815 0.517 1.74 5.96 7.88 J- 8.7 6.6 5.25 8.3 8.08
0.745 0.522 J 1.76 J 6.83 7.8 J- 8.65 6.21 5.47 8.21 8.330.0024 U 0.0019 U 0.0019 U 0.0018 U 0.0021 U UJ 0.0025 J 0.0028 J 0.0016 U
0.0024 U 0.0019 U 0.0019 U 0.0018 U 0.0021 U UJ 0.0032 J 0.0034 J 0.0039 J
0.00015 U 0.00008 U 0.00008 U 0.00013 U 0.00012 J J- 0.00022 J 0.00024 J 0.0002 J
0.00015 U 0.00008 U 0.00008 U 0.00026 J 0.00021 J J- 0.00023 J 0.00025 J 0.0002 J
0.00486 0.003 0.00272 0.023 J 0.0253 J- 0.024 0.025 0.024
0.00503 0.00288 0.00269 0.0248 J U 0.023 J- 0.024 0.027 0.025
0.0021 J 0.0009 J 0.0006 J 0.024 0.0289 J- 0.028 0.024 0.024 0.0325 J 0.0274
0.0088 0.0011 J 0.0011 J 0.023 J J- 0.0267 J- 0.029 0.029 0.023 0.0336 0.0272
0.0095 J 0.0027 U 0.0177 1.53 1.44 J- 1.56 1.42 0.879 1.41 1.04
0.0238 0.0035 J 0.0174 1.63 J 1.69 J- 1.6 1.47 0.868 1.48 1.2
GW-62-MA
CD0518-GW61MA-GW001 CD0518-GW62MA-GW001 CD0415-NES5-SW001
4/22/2015
9:00
CD0715-NES5-SW001
7/16/2015
10:10
CD0516-NES5-SW001
5/7/2016
11:50
CD0716-NES5-SW001
7/19/2016
12:05
CD1016-NES5-SW001
10/5/2016
17:05
CD0517-NES5-SW001
5/23/2017
11:00
CD0717-NES5-SW001
7/18/2017
CD1017-GW61MA-GW003
10/31/2017
15:06 13:20 10:55
5/24/2018 5/24/2018
9:25
NES-5GW-61-MA
S:\Jobs\0442-001-900-Simplot-Conda\RIFS_PilotStudy\PRB\DesignImplemtationPln\DraftFinal\Tables\Tbl3-5GWAnalytical 5 of 10
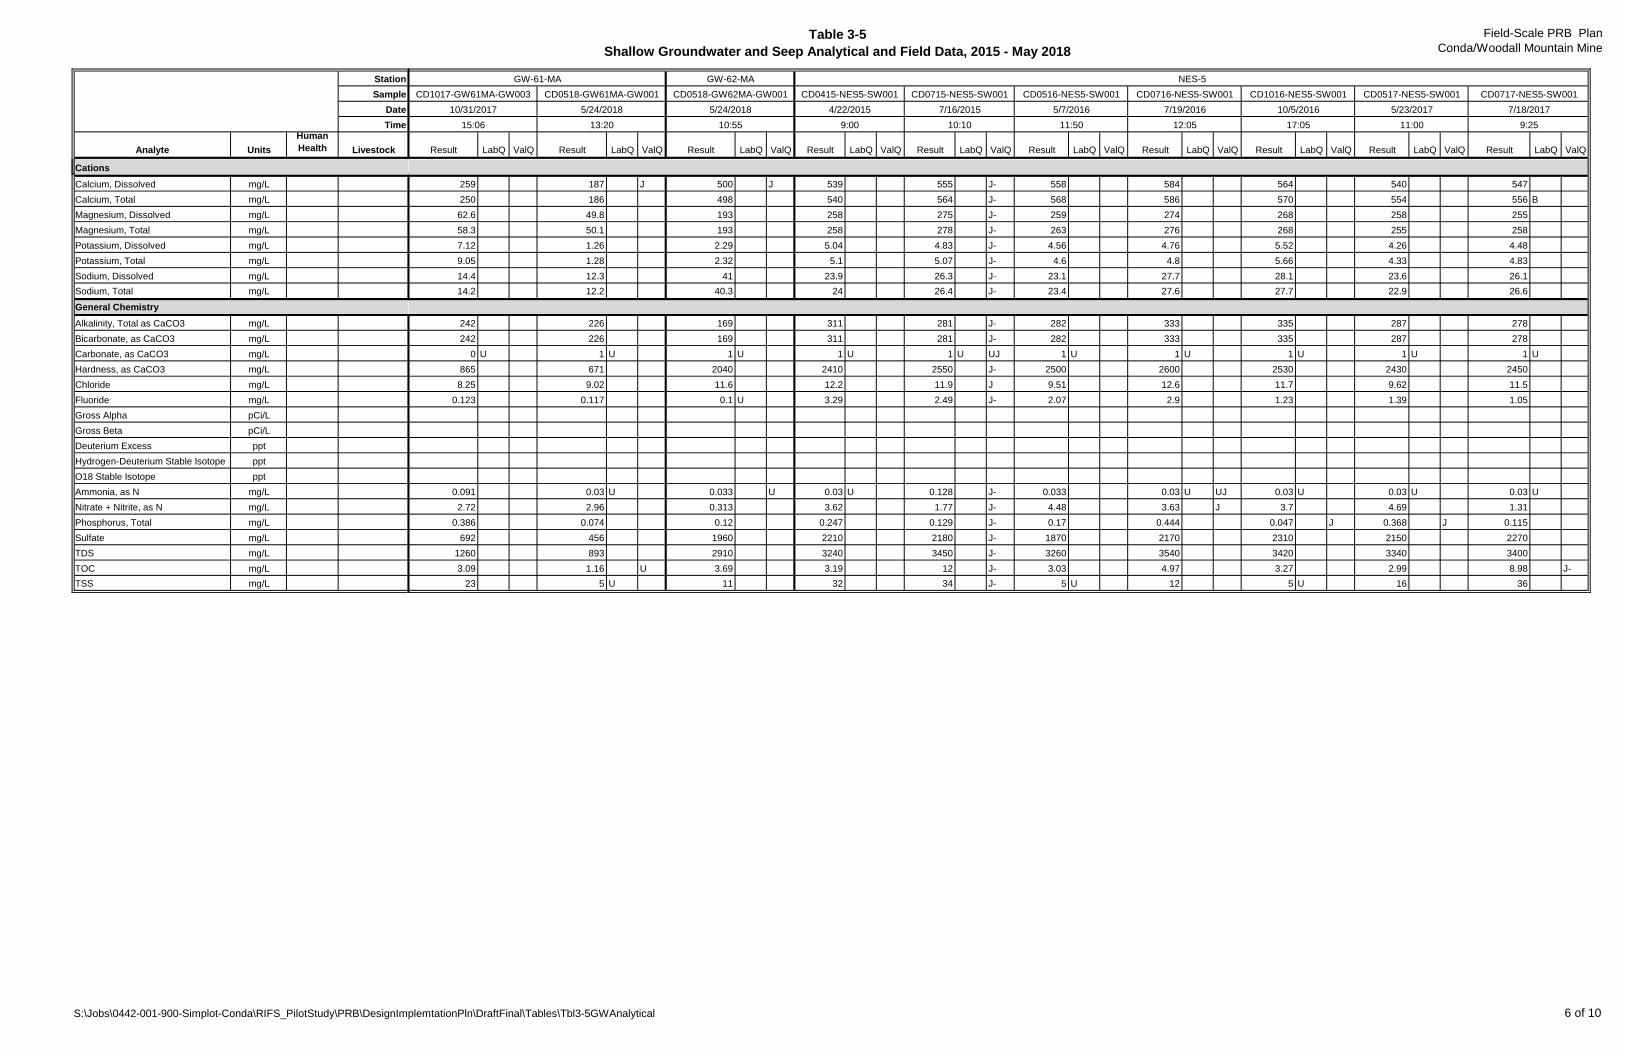
Table 3-5
Shallow Groundwater and Seep Analytical and Field Data, 2015 - May 2018
Field-Scale PRB Plan
Conda/Woodall Mountain Mine
Station
Sample
Date
Time
Analyte Units
Human
Health Livestock
Cations
Calcium, Dissolved mg/L
Calcium, Total mg/L
Magnesium, Dissolved mg/L
Magnesium, Total mg/L
Potassium, Dissolved mg/L
Potassium, Total mg/L
Sodium, Dissolved mg/L
Sodium, Total mg/L
General Chemistry
Alkalinity, Total as CaCO3 mg/L
Bicarbonate, as CaCO3 mg/L
Carbonate, as CaCO3 mg/L
Hardness, as CaCO3 mg/L
Chloride mg/L
Fluoride mg/L
Gross Alpha pCi/L
Gross Beta pCi/L
Deuterium Excess ppt
Hydrogen-Deuterium Stable Isotope ppt
O18 Stable Isotope ppt
Ammonia, as N mg/L
Nitrate + Nitrite, as N mg/L
Phosphorus, Total mg/L
Sulfate mg/L
TDS mg/L
TOC mg/L
TSS mg/L
Result LabQ ValQ Result LabQ ValQ Result LabQ ValQ Result LabQ ValQ Result LabQ ValQ Result LabQ ValQ Result LabQ ValQ Result LabQ ValQ Result LabQ ValQ Result LabQ ValQ
GW-62-MA
CD0518-GW61MA-GW001 CD0518-GW62MA-GW001 CD0415-NES5-SW001
4/22/2015
9:00
CD0715-NES5-SW001
7/16/2015
10:10
CD0516-NES5-SW001
5/7/2016
11:50
CD0716-NES5-SW001
7/19/2016
12:05
CD1016-NES5-SW001
10/5/2016
17:05
CD0517-NES5-SW001
5/23/2017
11:00
CD0717-NES5-SW001
7/18/2017
CD1017-GW61MA-GW003
10/31/2017
15:06 13:20 10:55
5/24/2018 5/24/2018
9:25
NES-5GW-61-MA
259 187 J 500 J 539 555 J- 558 584 564 540 547
250 186 498 540 564 J- 568 586 570 554 556 B
62.6 49.8 193 258 275 J- 259 274 268 258 255
58.3 50.1 193 258 278 J- 263 276 268 255 258
7.12 1.26 2.29 5.04 4.83 J- 4.56 4.76 5.52 4.26 4.48
9.05 1.28 2.32 5.1 5.07 J- 4.6 4.8 5.66 4.33 4.83
14.4 12.3 41 23.9 26.3 J- 23.1 27.7 28.1 23.6 26.1
14.2 12.2 40.3 24 26.4 J- 23.4 27.6 27.7 22.9 26.6
242 226 169 311 281 J- 282 333 335 287 278
242 226 169 311 281 J- 282 333 335 287 278
0 U 1 U 1 U 1 U 1 U UJ 1 U 1 U 1 U 1 U 1 U
865 671 2040 2410 2550 J- 2500 2600 2530 2430 2450
8.25 9.02 11.6 12.2 11.9 J 9.51 12.6 11.7 9.62 11.5
0.123 0.117 0.1 U 3.29 2.49 J- 2.07 2.9 1.23 1.39 1.05
0.091 0.03 U 0.033 U 0.03 U 0.128 J- 0.033 0.03 U UJ 0.03 U 0.03 U 0.03 U
2.72 2.96 0.313 3.62 1.77 J- 4.48 3.63 J 3.7 4.69 1.31
0.386 0.074 0.12 0.247 0.129 J- 0.17 0.444 0.047 J 0.368 J 0.115
692 456 1960 2210 2180 J- 1870 2170 2310 2150 2270
1260 893 2910 3240 3450 J- 3260 3540 3420 3340 3400
3.09 1.16 U 3.69 3.19 12 J- 3.03 4.97 3.27 2.99 8.98 J-
23 5 U 11 32 34 J- 5 U 12 5 U 16 36
S:\Jobs\0442-001-900-Simplot-Conda\RIFS_PilotStudy\PRB\DesignImplemtationPln\DraftFinal\Tables\Tbl3-5GWAnalytical 6 of 10
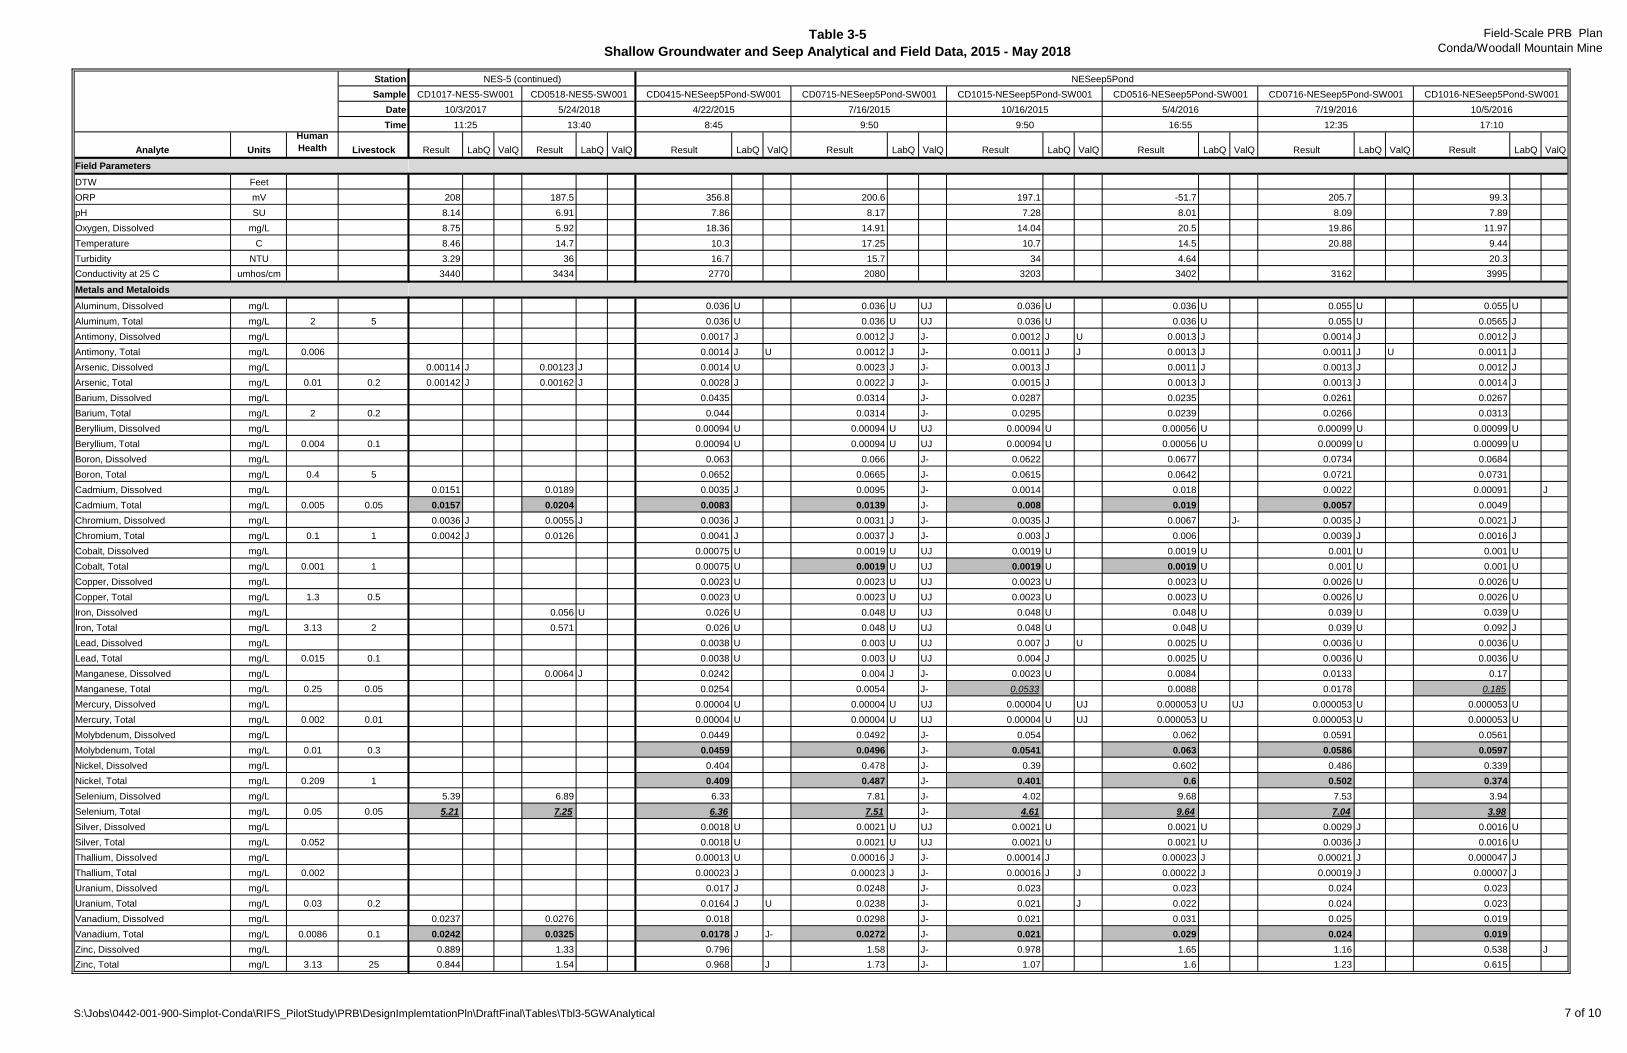
Table 3-5
Shallow Groundwater and Seep Analytical and Field Data, 2015 - May 2018
Field-Scale PRB Plan
Conda/Woodall Mountain Mine
Station
Sample
Date
Time
Analyte Units
Human
Health Livestock
Field Parameters
DTW Feet
ORP mV
pH SU
Oxygen, Dissolved mg/L
Temperature C
Turbidity NTU
Conductivity at 25 C umhos/cm
Metals and Metaloids
Aluminum, Dissolved mg/L
Aluminum, Total mg/L 2 5
Antimony, Dissolved mg/L
Antimony, Total mg/L 0.006
Arsenic, Dissolved mg/L
Arsenic, Total mg/L 0.01 0.2
Barium, Dissolved mg/L
Barium, Total mg/L 2 0.2
Beryllium, Dissolved mg/L
Beryllium, Total mg/L 0.004 0.1
Boron, Dissolved mg/L
Boron, Total mg/L 0.4 5
Cadmium, Dissolved mg/L
Cadmium, Total mg/L 0.005 0.05
Chromium, Dissolved mg/L
Chromium, Total mg/L 0.1 1
Cobalt, Dissolved mg/L
Cobalt, Total mg/L 0.001 1
Copper, Dissolved mg/L
Copper, Total mg/L 1.3 0.5
Iron, Dissolved mg/L
Iron, Total mg/L 3.13 2
Lead, Dissolved mg/L
Lead, Total mg/L 0.015 0.1
Manganese, Dissolved mg/L
Manganese, Total mg/L 0.25 0.05
Mercury, Dissolved mg/L
Mercury, Total mg/L 0.002 0.01
Molybdenum, Dissolved mg/L
Molybdenum, Total mg/L 0.01 0.3
Nickel, Dissolved mg/L
Nickel, Total mg/L 0.209 1
Selenium, Dissolved mg/L
Selenium, Total mg/L 0.05 0.05
Silver, Dissolved mg/L
Silver, Total mg/L 0.052
Thallium, Dissolved mg/L
Thallium, Total mg/L 0.002
Uranium, Dissolved mg/L
Uranium, Total mg/L 0.03 0.2
Vanadium, Dissolved mg/L
Vanadium, Total mg/L 0.0086 0.1
Zinc, Dissolved mg/L
Zinc, Total mg/L 3.13 25
Result LabQ ValQ Result LabQ ValQ Result LabQ ValQ Result LabQ ValQ Result LabQ ValQ Result LabQ ValQ Result LabQ ValQ Result LabQ ValQ
208 187.5 356.8 200.6 197.1 -51.7 205.7 99.3
8.14 6.91 7.86 8.17 7.28 8.01 8.09 7.89
8.75 5.92 18.36 14.91 14.04 20.5 19.86 11.97
8.46 14.7 10.3 17.25 10.7 14.5 20.88 9.44
3.29 36 16.7 15.7 34 4.64 20.3
3440 3434 2770 2080 3203 3402 3162 3995
0.036 U 0.036 U UJ 0.036 U 0.036 U 0.055 U 0.055 U
0.036 U 0.036 U UJ 0.036 U 0.036 U 0.055 U 0.0565 J
0.0017 J 0.0012 J J- 0.0012 J U 0.0013 J 0.0014 J 0.0012 J
0.0014 J U 0.0012 J J- 0.0011 J J 0.0013 J 0.0011 J U 0.0011 J
0.00114 J 0.00123 J 0.0014 U 0.0023 J J- 0.0013 J 0.0011 J 0.0013 J 0.0012 J
0.00142 J 0.00162 J 0.0028 J 0.0022 J J- 0.0015 J 0.0013 J 0.0013 J 0.0014 J
0.0435 0.0314 J- 0.0287 0.0235 0.0261 0.0267
0.044 0.0314 J- 0.0295 0.0239 0.0266 0.0313
0.00094 U 0.00094 U UJ 0.00094 U 0.00056 U 0.00099 U 0.00099 U
0.00094 U 0.00094 U UJ 0.00094 U 0.00056 U 0.00099 U 0.00099 U
0.063 0.066 J- 0.0622 0.0677 0.0734 0.0684
0.0652 0.0665 J- 0.0615 0.0642 0.0721 0.0731
0.0151 0.0189 0.0035 J 0.0095 J- 0.0014 0.018 0.0022 0.00091 J
0.0157 0.0204 0.0083 0.0139 J- 0.008 0.019 0.0057 0.0049
0.0036 J 0.0055 J 0.0036 J 0.0031 J J- 0.0035 J 0.0067 J- 0.0035 J 0.0021 J
0.0042 J 0.0126 0.0041 J 0.0037 J J- 0.003 J 0.006 0.0039 J 0.0016 J
0.00075 U 0.0019 U UJ 0.0019 U 0.0019 U 0.001 U 0.001 U
0.00075 U 0.0019 U UJ 0.0019 U 0.0019 U 0.001 U 0.001 U
0.0023 U 0.0023 U UJ 0.0023 U 0.0023 U 0.0026 U 0.0026 U
0.0023 U 0.0023 U UJ 0.0023 U 0.0023 U 0.0026 U 0.0026 U
0.056 U 0.026 U 0.048 U UJ 0.048 U 0.048 U 0.039 U 0.039 U
0.571 0.026 U 0.048 U UJ 0.048 U 0.048 U 0.039 U 0.092 J
0.0038 U 0.003 U UJ 0.007 J U 0.0025 U 0.0036 U 0.0036 U
0.0038 U 0.003 U UJ 0.004 J 0.0025 U 0.0036 U 0.0036 U
0.0064 J 0.0242 0.004 J J- 0.0023 U 0.0084 0.0133 0.17
0.0254 0.0054 J- 0.0533 0.0088 0.0178 0.1850.00004 U 0.00004 U UJ 0.00004 U UJ 0.000053 U UJ 0.000053 U 0.000053 U
0.00004 U 0.00004 U UJ 0.00004 U UJ 0.000053 U 0.000053 U 0.000053 U
0.0449 0.0492 J- 0.054 0.062 0.0591 0.0561
0.0459 0.0496 J- 0.0541 0.063 0.0586 0.0597
0.404 0.478 J- 0.39 0.602 0.486 0.339
0.409 0.487 J- 0.401 0.6 0.502 0.374
5.39 6.89 6.33 7.81 J- 4.02 9.68 7.53 3.94
5.21 7.25 6.36 7.51 J- 4.61 9.64 7.04 3.980.0018 U 0.0021 U UJ 0.0021 U 0.0021 U 0.0029 J 0.0016 U
0.0018 U 0.0021 U UJ 0.0021 U 0.0021 U 0.0036 J 0.0016 U
0.00013 U 0.00016 J J- 0.00014 J 0.00023 J 0.00021 J 0.000047 J
0.00023 J 0.00023 J J- 0.00016 J J 0.00022 J 0.00019 J 0.00007 J
0.017 J 0.0248 J- 0.023 0.023 0.024 0.023
0.0164 J U 0.0238 J- 0.021 J 0.022 0.024 0.023
0.0237 0.0276 0.018 0.0298 J- 0.021 0.031 0.025 0.019
0.0242 0.0325 0.0178 J J- 0.0272 J- 0.021 0.029 0.024 0.019
0.889 1.33 0.796 1.58 J- 0.978 1.65 1.16 0.538 J
0.844 1.54 0.968 J 1.73 J- 1.07 1.6 1.23 0.615
11:25
10/3/2017
CD1017-NES5-SW001
7/16/2015
CD1015-NESeep5Pond-SW001 CD0516-NESeep5Pond-SW001 CD0716-NESeep5Pond-SW001 CD1016-NESeep5Pond-SW001
NES-5 (continued) NESeep5Pond
9:50 9:50 16:55 12:35 17:10
10/16/2015 5/4/2016 7/19/2016 10/5/2016
CD0415-NESeep5Pond-SW001
13:40
CD0518-NES5-SW001
5/24/2018 4/22/2015
8:45
CD0715-NESeep5Pond-SW001
S:\Jobs\0442-001-900-Simplot-Conda\RIFS_PilotStudy\PRB\DesignImplemtationPln\DraftFinal\Tables\Tbl3-5GWAnalytical 7 of 10
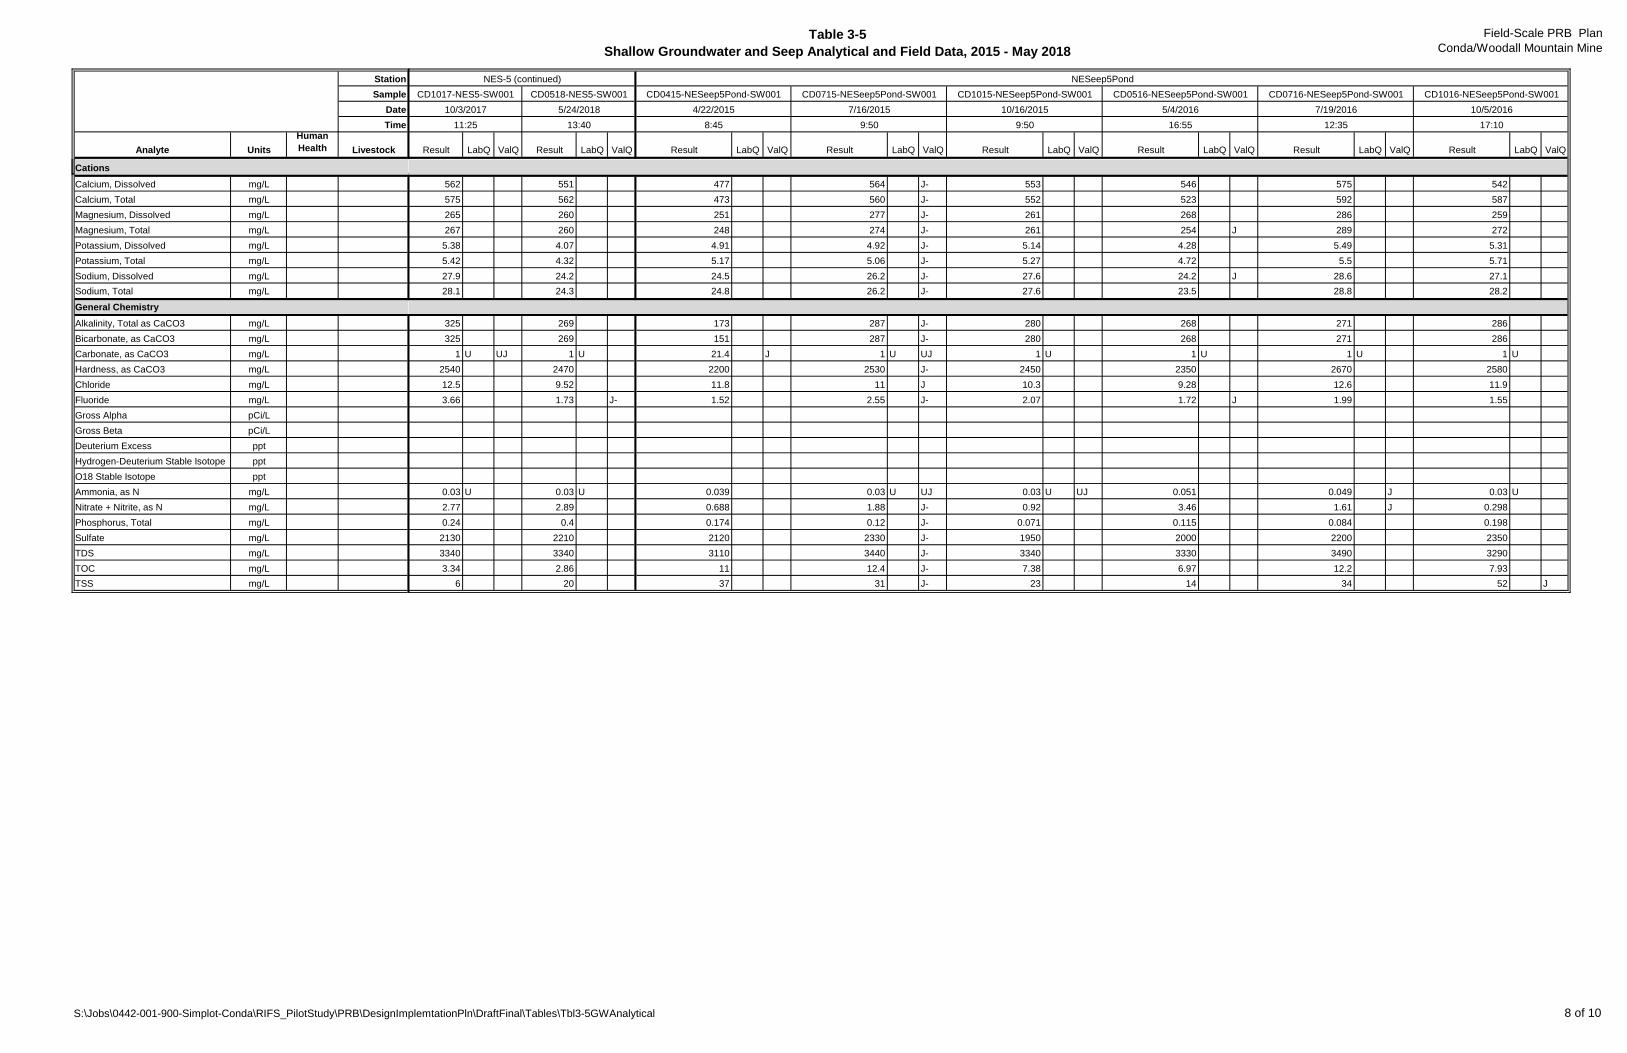
Table 3-5
Shallow Groundwater and Seep Analytical and Field Data, 2015 - May 2018
Field-Scale PRB Plan
Conda/Woodall Mountain Mine
Station
Sample
Date
Time
Analyte Units
Human
Health Livestock
Cations
Calcium, Dissolved mg/L
Calcium, Total mg/L
Magnesium, Dissolved mg/L
Magnesium, Total mg/L
Potassium, Dissolved mg/L
Potassium, Total mg/L
Sodium, Dissolved mg/L
Sodium, Total mg/L
General Chemistry
Alkalinity, Total as CaCO3 mg/L
Bicarbonate, as CaCO3 mg/L
Carbonate, as CaCO3 mg/L
Hardness, as CaCO3 mg/L
Chloride mg/L
Fluoride mg/L
Gross Alpha pCi/L
Gross Beta pCi/L
Deuterium Excess ppt
Hydrogen-Deuterium Stable Isotope ppt
O18 Stable Isotope ppt
Ammonia, as N mg/L
Nitrate + Nitrite, as N mg/L
Phosphorus, Total mg/L
Sulfate mg/L
TDS mg/L
TOC mg/L
TSS mg/L
Result LabQ ValQ Result LabQ ValQ Result LabQ ValQ Result LabQ ValQ Result LabQ ValQ Result LabQ ValQ Result LabQ ValQ Result LabQ ValQ
11:25
10/3/2017
CD1017-NES5-SW001
7/16/2015
CD1015-NESeep5Pond-SW001 CD0516-NESeep5Pond-SW001 CD0716-NESeep5Pond-SW001 CD1016-NESeep5Pond-SW001
NES-5 (continued) NESeep5Pond
9:50 9:50 16:55 12:35 17:10
10/16/2015 5/4/2016 7/19/2016 10/5/2016
CD0415-NESeep5Pond-SW001
13:40
CD0518-NES5-SW001
5/24/2018 4/22/2015
8:45
CD0715-NESeep5Pond-SW001
562 551 477 564 J- 553 546 575 542
575 562 473 560 J- 552 523 592 587
265 260 251 277 J- 261 268 286 259
267 260 248 274 J- 261 254 J 289 272
5.38 4.07 4.91 4.92 J- 5.14 4.28 5.49 5.31
5.42 4.32 5.17 5.06 J- 5.27 4.72 5.5 5.71
27.9 24.2 24.5 26.2 J- 27.6 24.2 J 28.6 27.1
28.1 24.3 24.8 26.2 J- 27.6 23.5 28.8 28.2
325 269 173 287 J- 280 268 271 286
325 269 151 287 J- 280 268 271 286
1 U UJ 1 U 21.4 J 1 U UJ 1 U 1 U 1 U 1 U
2540 2470 2200 2530 J- 2450 2350 2670 2580
12.5 9.52 11.8 11 J 10.3 9.28 12.6 11.9
3.66 1.73 J- 1.52 2.55 J- 2.07 1.72 J 1.99 1.55
0.03 U 0.03 U 0.039 0.03 U UJ 0.03 U UJ 0.051 0.049 J 0.03 U
2.77 2.89 0.688 1.88 J- 0.92 3.46 1.61 J 0.298
0.24 0.4 0.174 0.12 J- 0.071 0.115 0.084 0.198
2130 2210 2120 2330 J- 1950 2000 2200 2350
3340 3340 3110 3440 J- 3340 3330 3490 3290
3.34 2.86 11 12.4 J- 7.38 6.97 12.2 7.93
6 20 37 31 J- 23 14 34 52 J
S:\Jobs\0442-001-900-Simplot-Conda\RIFS_PilotStudy\PRB\DesignImplemtationPln\DraftFinal\Tables\Tbl3-5GWAnalytical 8 of 10
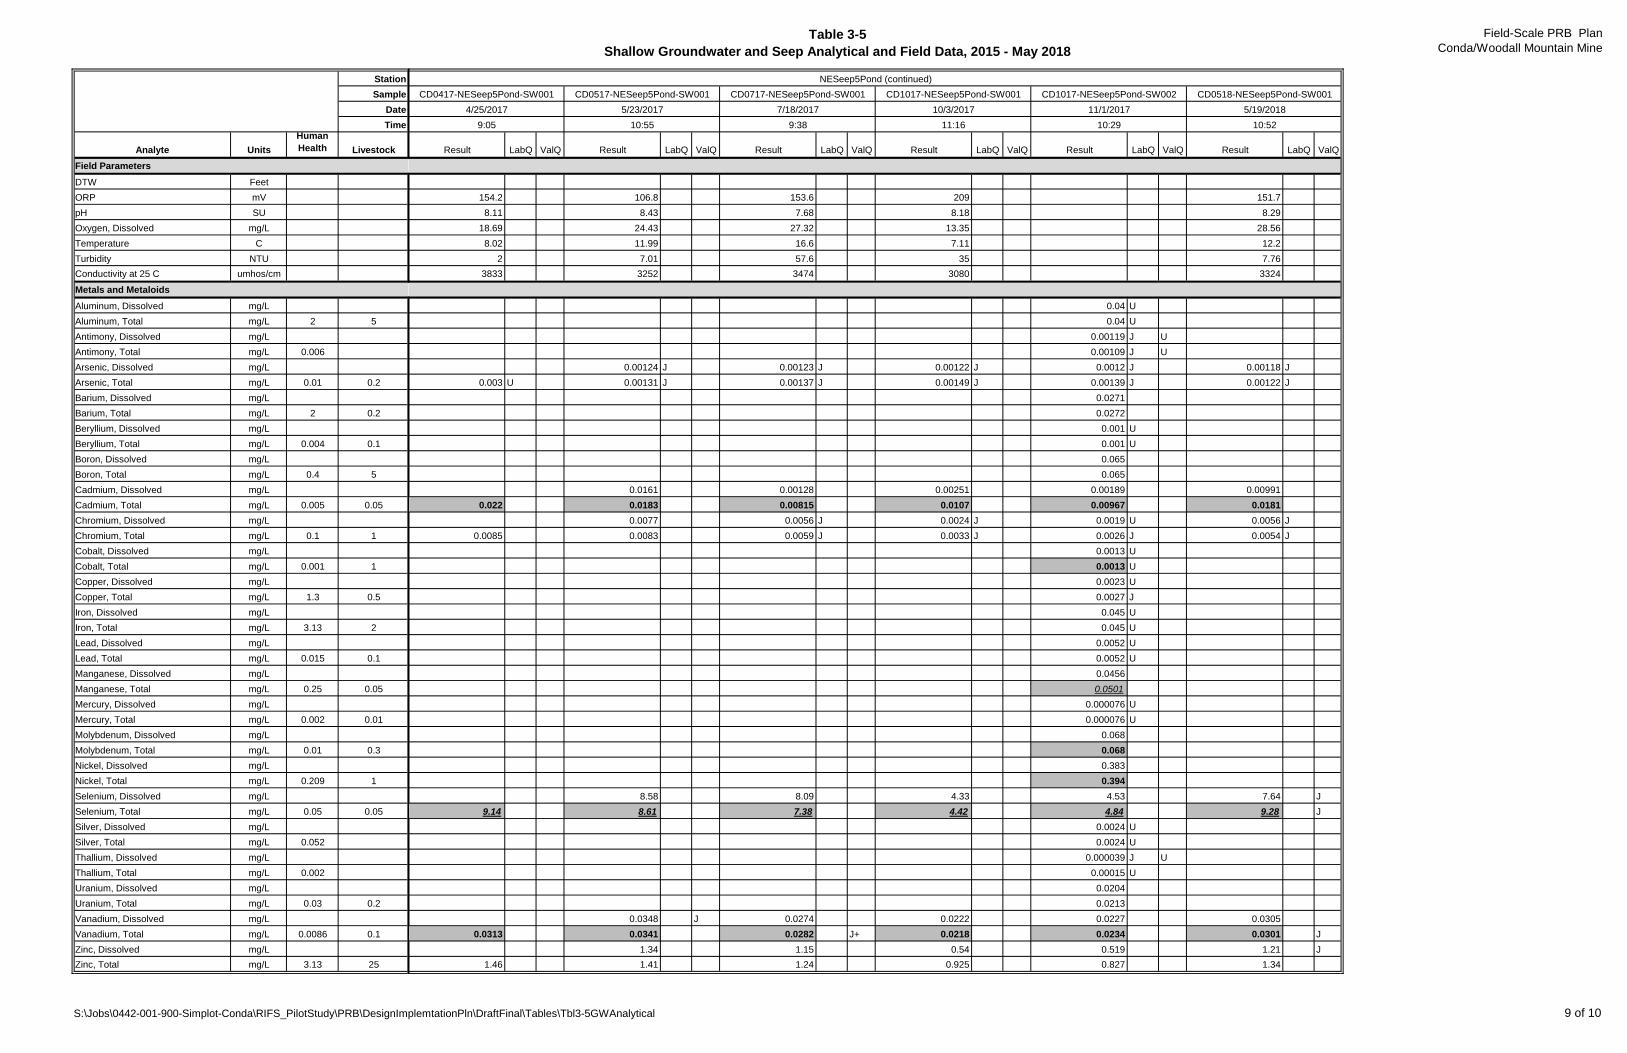
Table 3-5
Shallow Groundwater and Seep Analytical and Field Data, 2015 - May 2018
Field-Scale PRB Plan
Conda/Woodall Mountain Mine
Station
Sample
Date
Time
Analyte Units
Human
Health Livestock
Field Parameters
DTW Feet
ORP mV
pH SU
Oxygen, Dissolved mg/L
Temperature C
Turbidity NTU
Conductivity at 25 C umhos/cm
Metals and Metaloids
Aluminum, Dissolved mg/L
Aluminum, Total mg/L 2 5
Antimony, Dissolved mg/L
Antimony, Total mg/L 0.006
Arsenic, Dissolved mg/L
Arsenic, Total mg/L 0.01 0.2
Barium, Dissolved mg/L
Barium, Total mg/L 2 0.2
Beryllium, Dissolved mg/L
Beryllium, Total mg/L 0.004 0.1
Boron, Dissolved mg/L
Boron, Total mg/L 0.4 5
Cadmium, Dissolved mg/L
Cadmium, Total mg/L 0.005 0.05
Chromium, Dissolved mg/L
Chromium, Total mg/L 0.1 1
Cobalt, Dissolved mg/L
Cobalt, Total mg/L 0.001 1
Copper, Dissolved mg/L
Copper, Total mg/L 1.3 0.5
Iron, Dissolved mg/L
Iron, Total mg/L 3.13 2
Lead, Dissolved mg/L
Lead, Total mg/L 0.015 0.1
Manganese, Dissolved mg/L
Manganese, Total mg/L 0.25 0.05
Mercury, Dissolved mg/L
Mercury, Total mg/L 0.002 0.01
Molybdenum, Dissolved mg/L
Molybdenum, Total mg/L 0.01 0.3
Nickel, Dissolved mg/L
Nickel, Total mg/L 0.209 1
Selenium, Dissolved mg/L
Selenium, Total mg/L 0.05 0.05
Silver, Dissolved mg/L
Silver, Total mg/L 0.052
Thallium, Dissolved mg/L
Thallium, Total mg/L 0.002
Uranium, Dissolved mg/L
Uranium, Total mg/L 0.03 0.2
Vanadium, Dissolved mg/L
Vanadium, Total mg/L 0.0086 0.1
Zinc, Dissolved mg/L
Zinc, Total mg/L 3.13 25
Result LabQ ValQ Result LabQ ValQ Result LabQ ValQ Result LabQ ValQ Result LabQ ValQ Result LabQ ValQ
154.2 106.8 153.6 209 151.7
8.11 8.43 7.68 8.18 8.29
18.69 24.43 27.32 13.35 28.56
8.02 11.99 16.6 7.11 12.2
2 7.01 57.6 35 7.76
3833 3252 3474 3080 3324
0.04 U
0.04 U
0.00119 J U
0.00109 J U
0.00124 J 0.00123 J 0.00122 J 0.0012 J 0.00118 J
0.003 U 0.00131 J 0.00137 J 0.00149 J 0.00139 J 0.00122 J
0.0271
0.0272
0.001 U
0.001 U
0.065
0.065
0.0161 0.00128 0.00251 0.00189 0.00991
0.022 0.0183 0.00815 0.0107 0.00967 0.0181
0.0077 0.0056 J 0.0024 J 0.0019 U 0.0056 J
0.0085 0.0083 0.0059 J 0.0033 J 0.0026 J 0.0054 J
0.0013 U
0.0013 U
0.0023 U
0.0027 J
0.045 U
0.045 U
0.0052 U
0.0052 U
0.0456
0.05010.000076 U
0.000076 U
0.068
0.068
0.383
0.394
8.58 8.09 4.33 4.53 7.64 J
9.14 8.61 7.38 4.42 4.84 9.28 J
0.0024 U
0.0024 U
0.000039 J U
0.00015 U
0.0204
0.0213
0.0348 J 0.0274 0.0222 0.0227 0.0305
0.0313 0.0341 0.0282 J+ 0.0218 0.0234 0.0301 J
1.34 1.15 0.54 0.519 1.21 J
1.46 1.41 1.24 0.925 0.827 1.34
CD0417-NESeep5Pond-SW001 CD0517-NESeep5Pond-SW001 CD0717-NESeep5Pond-SW001 CD1017-NESeep5Pond-SW001 CD1017-NESeep5Pond-SW002
NESeep5Pond (continued)
10:52
CD0518-NESeep5Pond-SW001
5/19/20185/23/2017 7/18/2017 10/3/2017 11/1/2017
9:05 10:55 9:38 11:16 10:29
4/25/2017
S:\Jobs\0442-001-900-Simplot-Conda\RIFS_PilotStudy\PRB\DesignImplemtationPln\DraftFinal\Tables\Tbl3-5GWAnalytical 9 of 10
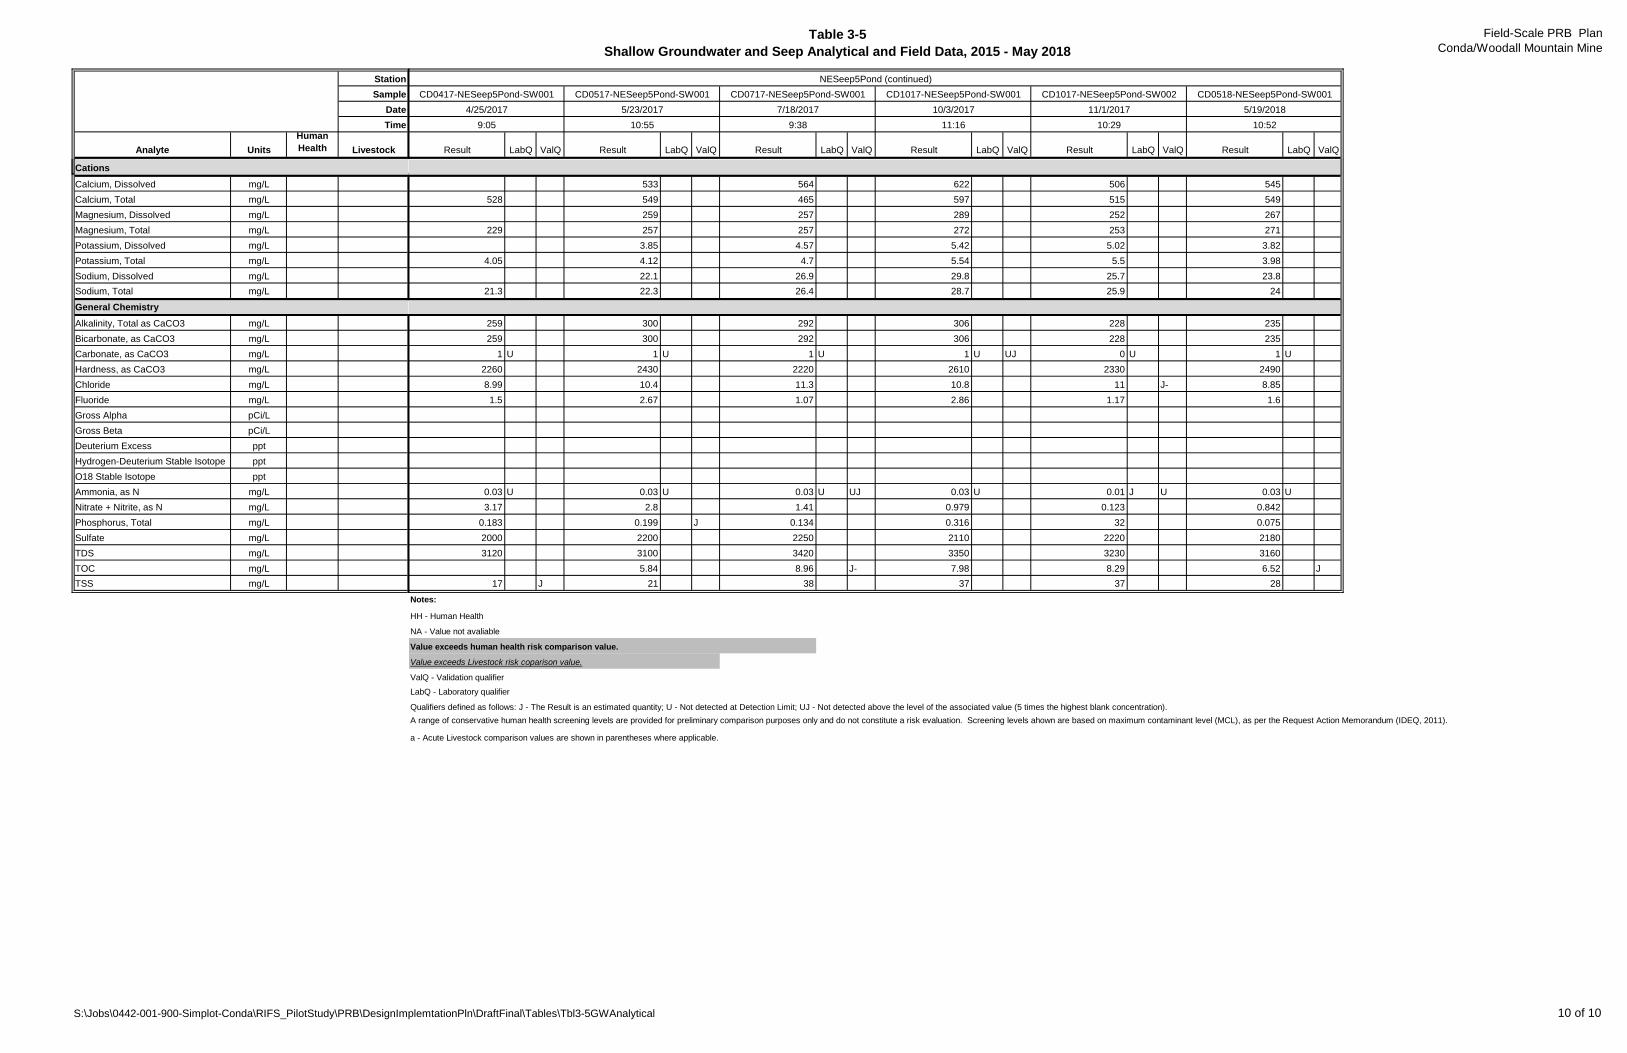
Table 3-5
Shallow Groundwater and Seep Analytical and Field Data, 2015 - May 2018
Field-Scale PRB Plan
Conda/Woodall Mountain Mine
Station
Sample
Date
Time
Analyte Units
Human
Health Livestock
Cations
Calcium, Dissolved mg/L
Calcium, Total mg/L
Magnesium, Dissolved mg/L
Magnesium, Total mg/L
Potassium, Dissolved mg/L
Potassium, Total mg/L
Sodium, Dissolved mg/L
Sodium, Total mg/L
General Chemistry
Alkalinity, Total as CaCO3 mg/L
Bicarbonate, as CaCO3 mg/L
Carbonate, as CaCO3 mg/L
Hardness, as CaCO3 mg/L
Chloride mg/L
Fluoride mg/L
Gross Alpha pCi/L
Gross Beta pCi/L
Deuterium Excess ppt
Hydrogen-Deuterium Stable Isotope ppt
O18 Stable Isotope ppt
Ammonia, as N mg/L
Nitrate + Nitrite, as N mg/L
Phosphorus, Total mg/L
Sulfate mg/L
TDS mg/L
TOC mg/L
TSS mg/L
Result LabQ ValQ Result LabQ ValQ Result LabQ ValQ Result LabQ ValQ Result LabQ ValQ Result LabQ ValQ
CD0417-NESeep5Pond-SW001 CD0517-NESeep5Pond-SW001 CD0717-NESeep5Pond-SW001 CD1017-NESeep5Pond-SW001 CD1017-NESeep5Pond-SW002
NESeep5Pond (continued)
10:52
CD0518-NESeep5Pond-SW001
5/19/20185/23/2017 7/18/2017 10/3/2017 11/1/2017
9:05 10:55 9:38 11:16 10:29
4/25/2017
533 564 622 506 545
528 549 465 597 515 549
259 257 289 252 267
229 257 257 272 253 271
3.85 4.57 5.42 5.02 3.82
4.05 4.12 4.7 5.54 5.5 3.98
22.1 26.9 29.8 25.7 23.8
21.3 22.3 26.4 28.7 25.9 24
259 300 292 306 228 235
259 300 292 306 228 235
1 U 1 U 1 U 1 U UJ 0 U 1 U
2260 2430 2220 2610 2330 2490
8.99 10.4 11.3 10.8 11 J- 8.85
1.5 2.67 1.07 2.86 1.17 1.6
0.03 U 0.03 U 0.03 U UJ 0.03 U 0.01 J U 0.03 U
3.17 2.8 1.41 0.979 0.123 0.842
0.183 0.199 J 0.134 0.316 32 0.075
2000 2200 2250 2110 2220 2180
3120 3100 3420 3350 3230 3160
5.84 8.96 J- 7.98 8.29 6.52 J
17 J 21 38 37 37 28
Notes:
HH - Human Health
NA - Value not avaliable
Value exceeds human health risk comparison value.
Value exceeds Livestock risk coparison value.
ValQ - Validation qualifier
LabQ - Laboratory qualifier
Qualifiers defined as follows: J - The Result is an estimated quantity; U - Not detected at Detection Limit; UJ - Not detected above the level of the associated value (5 times the highest blank concentration).
A range of conservative human health screening levels are provided for preliminary comparison purposes only and do not constitute a risk evaluation. Screening levels ahown are based on maximum contaminant level (MCL), as per the Request Action Memorandum (IDEQ, 2011).
a - Acute Livestock comparison values are shown in parentheses where applicable.
S:\Jobs\0442-001-900-Simplot-Conda\RIFS_PilotStudy\PRB\DesignImplemtationPln\DraftFinal\Tables\Tbl3-5GWAnalytical 10 of 10
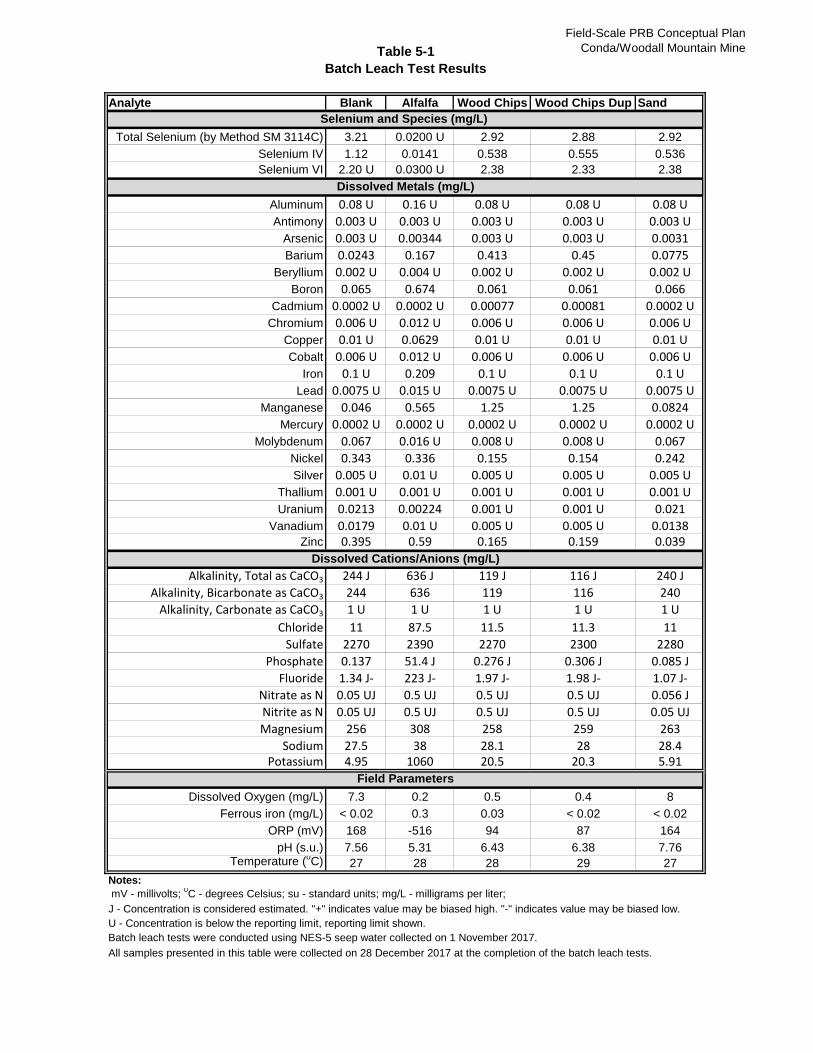
Table 5-1
Batch Leach Test Results
Field-Scale PRB Conceptual Plan
Conda/Woodall Mountain Mine
Analyte Blank Alfalfa Wood Chips Wood Chips Dup Sand
Total Selenium (by Method SM 3114C) 3.21 0.0200 U 2.92 2.88 2.92
Selenium IV 1.12 0.0141 0.538 0.555 0.536
Selenium VI 2.20 U 0.0300 U 2.38 2.33 2.38
Aluminum 0.08 U 0.16 U 0.08 U 0.08 U 0.08 UAntimony 0.003 U 0.003 U 0.003 U 0.003 U 0.003 U
Arsenic 0.003 U 0.00344 0.003 U 0.003 U 0.0031Barium 0.0243 0.167 0.413 0.45 0.0775
Beryllium 0.002 U 0.004 U 0.002 U 0.002 U 0.002 UBoron 0.065 0.674 0.061 0.061 0.066
Cadmium 0.0002 U 0.0002 U 0.00077 0.00081 0.0002 UChromium 0.006 U 0.012 U 0.006 U 0.006 U 0.006 U
Copper 0.01 U 0.0629 0.01 U 0.01 U 0.01 UCobalt 0.006 U 0.012 U 0.006 U 0.006 U 0.006 U
Iron 0.1 U 0.209 0.1 U 0.1 U 0.1 ULead 0.0075 U 0.015 U 0.0075 U 0.0075 U 0.0075 U
Manganese 0.046 0.565 1.25 1.25 0.0824Mercury 0.0002 U 0.0002 U 0.0002 U 0.0002 U 0.0002 U
Molybdenum 0.067 0.016 U 0.008 U 0.008 U 0.067Nickel 0.343 0.336 0.155 0.154 0.242Silver 0.005 U 0.01 U 0.005 U 0.005 U 0.005 U
Thallium 0.001 U 0.001 U 0.001 U 0.001 U 0.001 UUranium 0.0213 0.00224 0.001 U 0.001 U 0.021
Vanadium 0.0179 0.01 U 0.005 U 0.005 U 0.0138Zinc 0.395 0.59 0.165 0.159 0.039
Alkalinity, Total as CaCO3 244 J 636 J 119 J 116 J 240 JAlkalinity, Bicarbonate as CaCO3 244 636 119 116 240
Alkalinity, Carbonate as CaCO3 1 U 1 U 1 U 1 U 1 UChloride 11 87.5 11.5 11.3 11
Sulfate 2270 2390 2270 2300 2280Phosphate 0.137 51.4 J 0.276 J 0.306 J 0.085 J
Fluoride 1.34 J- 223 J- 1.97 J- 1.98 J- 1.07 J-Nitrate as N 0.05 UJ 0.5 UJ 0.5 UJ 0.5 UJ 0.056 JNitrite as N 0.05 UJ 0.5 UJ 0.5 UJ 0.5 UJ 0.05 UJMagnesium 256 308 258 259 263
Sodium 27.5 38 28.1 28 28.4Potassium 4.95 1060 20.5 20.3 5.91
Dissolved Oxygen (mg/L) 7.3 0.2 0.5 0.4 8
Ferrous iron (mg/L) < 0.02 0.3 0.03 < 0.02 < 0.02
ORP (mV) 168 -516 94 87 164
pH (s.u.) 7.56 5.31 6.43 6.38 7.76Temperature (
oC) 27 28 28 29 27
Notes:
mV - millivolts; 0C - degrees Celsius; su - standard units; mg/L - milligrams per liter;
J - Concentration is considered estimated. "+" indicates value may be biased high. "-" indicates value may be biased low.
U - Concentration is below the reporting limit, reporting limit shown.
Batch leach tests were conducted using NES-5 seep water collected on 1 November 2017.
All samples presented in this table were collected on 28 December 2017 at the completion of the batch leach tests.
Field Parameters
Dissolved Metals (mg/L)
Dissolved Cations/Anions (mg/L)
Selenium and Species (mg/L)

Table 5-2
Summary of the 25 PV Effluent Data for Seep and Groundwater
Field-Scale PRB Conceptual Plan
Conda/Woodall Mountain Mine
Analyte Units Seep InfluentSeep Effluent
Column A
Seep Effluent
Column B
Groundwater
Influent
Effluent
Groundwater
Column A
Effluent
Groundwater
Column B
Ferrous Iron mg/L 0.05 0.66 0.74 0.04 1.2 1.68
ORP mV 170 -183 -177 232 -183 -163
pH SU 7.91 6.67 6.68 6.88 6.55 6.56
Oxygen, Dissolved mg/L 4.5 0.4 0.6 4.3 0.5 0.5
Temperature C 22.3 22.9 22.6 22.5 23 22.9
Conductivity at 25 C mS/cm 3.28 3.23 3.16 3.04 2.94 3.04
Aluminum, Dissolved mg/L 0.08 UJ 0.08 U 0.08 U 0.08 UJ 0.08 U 0.08 U
Aluminum, Total mg/L 0.08 UJ 0.1 0.09 0.08 UJ 0.11 0.12
Antimony, Dissolved mg/L 0.003 U 0.003 U 0.003 U 0.003 U 0.003 U 0.003 U
Antimony, Total mg/L 0.003 U 0.003 U 0.003 U 0.003 U 0.003 U 0.003 U
Arsenic, Dissolved mg/L 0.00375 U 0.015 0.0157 0.00375 U 0.024 0.0237
Arsenic, Total mg/L 0.00375 U 0.0164 0.0155 0.00375 U 0.0242 0.0255
Cadmium, Dissolved mg/L 0.00025 U 0.00025 U 0.00025 U 0.00406 0.00025 U 0.00025 U
Cadmium, Total mg/L 0.00054 0.00041 0.00037 0.00415 0.0002 U 0.0002 U
Calcium, Dissolved mg/L 543 514 516 536 530 530
Calcium, Total mg/L 533 553 549 535 545 545
Iron, Dissolved mg/L 0.1 U 0.503 0.611 0.1 U 1.12 1.49
Iron, Total mg/L 0.1 U 0.705 0.829 0.1 U 1.29 1.96
Magnesium, Dissolved mg/L 257 255 251 208 215 215
Magnesium, Total mg/L 258 273 272 221 222 227
Manganese, Dissolved mg/L 0.0488 0.875 0.785 0.815 2.63 2.9
Manganese, Total mg/L 0.0496 0.911 0.83 1.04 2.66 3.01
Potassium, Dissolved mg/L 5.57 5.17 4.95 5.43 4.89 4.45
Potassium, Total mg/L 5.72 5.51 5.36 5.76 4.98 4.68
Sodium, Dissolved mg/L 32.2 31.3 30.9 24.5 24.7 24.7
Sodium, Total mg/L 32.4 33.1 32.9 25.7 25.1 25.8
Alkalinity, Total as CaCO3 mg/L 255 351 346 217 385 378
Bicarbonate, as CaCO3 mg/L 255 351 346 217 385 378
Carbonate, as CaCO3 mg/L 1 U 1 1 U 1 U 1 U 1 U
Chloride mg/L 11.7 13.6 J- 11.4 J- 11.5 10.2 J- 12 J-
Fluoride mg/L 2.24 1.31 1.31 0.817 0.573 0.556
Nitrate as N mg/L 0.05 U 0.05 U 0.05 UJ 0.388 J+ 0.05 U 0.05 U
Nitrite as N mg/L 0.05 U 0.05 U 0.05 UJ 0.05 U 0.05 U 0.05 U
Phosphate mg/L 0.149 J 0.01 J 0.01 UJ 0.159 J 0.126 J 0.049 J
Sulfate mg/L 2390 2600 J- 2270 J- 2140 2080 J- 1800 J-
Total Selenium (by Method SM 3114C) mg/L 10 0.186 J- 0.18 J- 1.09 0.0168 J- 0.0193 J-
Total Selenium (by Method EPA 200.8) mg/L 9.05 0.0613 J- 0.0562 J- 0.913 0.0081 J- 0.0121 J-
Selenium IV mg/L 2.62 0.0189 J- 0.017 J- 0.0724 0.0129 J- 0.0087 J-
Selenium VI mg/L 7.42 0.167 J- 0.163 J- 1.01 0.00389 J- 0.0106 J-
Dissolved Selenium mg/L 9.52 J- 0.0463 J- 0.0459 J- 0.926 J- 0.0082 J- 0.011 J-
Notes:
mS/cm - microSiemens per centimeter; mV - millivolts; 0C - degrees Celsius; su - standard units; mg/L - milligrams per liter;
J - Concentration is considered estimated. "+" indicates value may be biased high. "-" indicates value may be biased low.
U - Concentration is below the reporting limit, reporting limit shown.
Selenium and Species (mg/L)
Field Parameters
General Chemistry
Metals and Metalloids
S:\Jobs\0442-001-900-Simplot-Conda\RIFS_PilotStudy\PRB\DrftImplemtationPln\Tables\Tbl5-2-3ColumnSum.xlsx 1 of 1
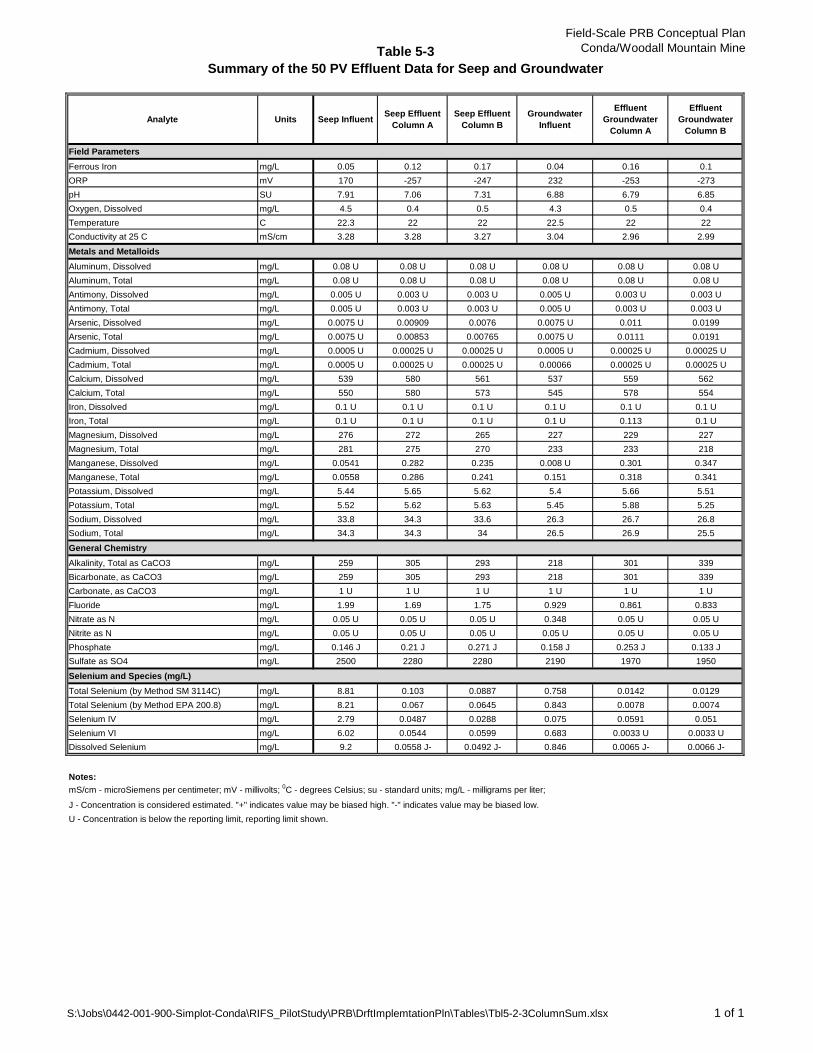
Table 5-3
Summary of the 50 PV Effluent Data for Seep and Groundwater
Field-Scale PRB Conceptual Plan
Conda/Woodall Mountain Mine
Analyte Units Seep InfluentSeep Effluent
Column A
Seep Effluent
Column B
Groundwater
Influent
Effluent
Groundwater
Column A
Effluent
Groundwater
Column B
Ferrous Iron mg/L 0.05 0.12 0.17 0.04 0.16 0.1
ORP mV 170 -257 -247 232 -253 -273
pH SU 7.91 7.06 7.31 6.88 6.79 6.85
Oxygen, Dissolved mg/L 4.5 0.4 0.5 4.3 0.5 0.4
Temperature C 22.3 22 22 22.5 22 22
Conductivity at 25 C mS/cm 3.28 3.28 3.27 3.04 2.96 2.99
Aluminum, Dissolved mg/L 0.08 U 0.08 U 0.08 U 0.08 U 0.08 U 0.08 U
Aluminum, Total mg/L 0.08 U 0.08 U 0.08 U 0.08 U 0.08 U 0.08 U
Antimony, Dissolved mg/L 0.005 U 0.003 U 0.003 U 0.005 U 0.003 U 0.003 U
Antimony, Total mg/L 0.005 U 0.003 U 0.003 U 0.005 U 0.003 U 0.003 U
Arsenic, Dissolved mg/L 0.0075 U 0.00909 0.0076 0.0075 U 0.011 0.0199
Arsenic, Total mg/L 0.0075 U 0.00853 0.00765 0.0075 U 0.0111 0.0191
Cadmium, Dissolved mg/L 0.0005 U 0.00025 U 0.00025 U 0.0005 U 0.00025 U 0.00025 U
Cadmium, Total mg/L 0.0005 U 0.00025 U 0.00025 U 0.00066 0.00025 U 0.00025 U
Calcium, Dissolved mg/L 539 580 561 537 559 562
Calcium, Total mg/L 550 580 573 545 578 554
Iron, Dissolved mg/L 0.1 U 0.1 U 0.1 U 0.1 U 0.1 U 0.1 U
Iron, Total mg/L 0.1 U 0.1 U 0.1 U 0.1 U 0.113 0.1 U
Magnesium, Dissolved mg/L 276 272 265 227 229 227
Magnesium, Total mg/L 281 275 270 233 233 218
Manganese, Dissolved mg/L 0.0541 0.282 0.235 0.008 U 0.301 0.347
Manganese, Total mg/L 0.0558 0.286 0.241 0.151 0.318 0.341
Potassium, Dissolved mg/L 5.44 5.65 5.62 5.4 5.66 5.51
Potassium, Total mg/L 5.52 5.62 5.63 5.45 5.88 5.25
Sodium, Dissolved mg/L 33.8 34.3 33.6 26.3 26.7 26.8
Sodium, Total mg/L 34.3 34.3 34 26.5 26.9 25.5
Alkalinity, Total as CaCO3 mg/L 259 305 293 218 301 339
Bicarbonate, as CaCO3 mg/L 259 305 293 218 301 339
Carbonate, as CaCO3 mg/L 1 U 1 U 1 U 1 U 1 U 1 U
Fluoride mg/L 1.99 1.69 1.75 0.929 0.861 0.833
Nitrate as N mg/L 0.05 U 0.05 U 0.05 U 0.348 0.05 U 0.05 U
Nitrite as N mg/L 0.05 U 0.05 U 0.05 U 0.05 U 0.05 U 0.05 U
Phosphate mg/L 0.146 J 0.21 J 0.271 J 0.158 J 0.253 J 0.133 J
Sulfate as SO4 mg/L 2500 2280 2280 2190 1970 1950
Total Selenium (by Method SM 3114C) mg/L 8.81 0.103 0.0887 0.758 0.0142 0.0129
Total Selenium (by Method EPA 200.8) mg/L 8.21 0.067 0.0645 0.843 0.0078 0.0074
Selenium IV mg/L 2.79 0.0487 0.0288 0.075 0.0591 0.051
Selenium VI mg/L 6.02 0.0544 0.0599 0.683 0.0033 U 0.0033 U
Dissolved Selenium mg/L 9.2 0.0558 J- 0.0492 J- 0.846 0.0065 J- 0.0066 J-
Notes:
mS/cm - microSiemens per centimeter; mV - millivolts; 0C - degrees Celsius; su - standard units; mg/L - milligrams per liter;
J - Concentration is considered estimated. "+" indicates value may be biased high. "-" indicates value may be biased low.
U - Concentration is below the reporting limit, reporting limit shown.
Selenium and Species (mg/L)
Metals and Metalloids
General Chemistry
Field Parameters
S:\Jobs\0442-001-900-Simplot-Conda\RIFS_PilotStudy\PRB\DrftImplemtationPln\Tables\Tbl5-2-3ColumnSum.xlsx 1 of 1
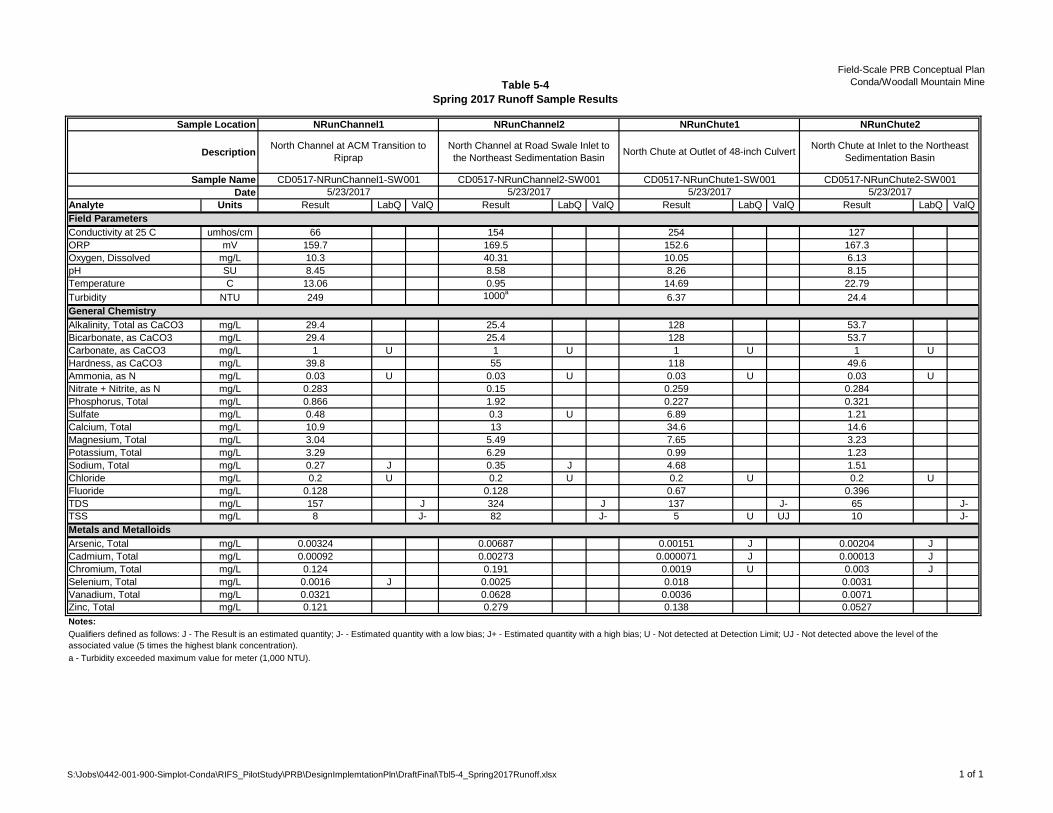
Table 5-4
Spring 2017 Runoff Sample Results
Field-Scale PRB Conceptual Plan
Conda/Woodall Mountain Mine
Sample Location
Description
Sample Name
Date
Analyte Units Result LabQ ValQ Result LabQ ValQ Result LabQ ValQ Result LabQ ValQ
Field Parameters
Conductivity at 25 C umhos/cm 66 154 254 127
ORP mV 159.7 169.5 152.6 167.3
Oxygen, Dissolved mg/L 10.3 40.31 10.05 6.13
pH SU 8.45 8.58 8.26 8.15
Temperature C 13.06 0.95 14.69 22.79
Turbidity NTU 249 1000a
6.37 24.4
General Chemistry
Alkalinity, Total as CaCO3 mg/L 29.4 25.4 128 53.7
Bicarbonate, as CaCO3 mg/L 29.4 25.4 128 53.7
Carbonate, as CaCO3 mg/L 1 U 1 U 1 U 1 U
Hardness, as CaCO3 mg/L 39.8 55 118 49.6
Ammonia, as N mg/L 0.03 U 0.03 U 0.03 U 0.03 U
Nitrate + Nitrite, as N mg/L 0.283 0.15 0.259 0.284
Phosphorus, Total mg/L 0.866 1.92 0.227 0.321
Sulfate mg/L 0.48 0.3 U 6.89 1.21
Calcium, Total mg/L 10.9 13 34.6 14.6
Magnesium, Total mg/L 3.04 5.49 7.65 3.23
Potassium, Total mg/L 3.29 6.29 0.99 1.23
Sodium, Total mg/L 0.27 J 0.35 J 4.68 1.51
Chloride mg/L 0.2 U 0.2 U 0.2 U 0.2 U
Fluoride mg/L 0.128 0.128 0.67 0.396
TDS mg/L 157 J 324 J 137 J- 65 J-
TSS mg/L 8 J- 82 J- 5 U UJ 10 J-
Metals and Metalloids
Arsenic, Total mg/L 0.00324 0.00687 0.00151 J 0.00204 J
Cadmium, Total mg/L 0.00092 0.00273 0.000071 J 0.00013 J
Chromium, Total mg/L 0.124 0.191 0.0019 U 0.003 J
Selenium, Total mg/L 0.0016 J 0.0025 0.018 0.0031
Vanadium, Total mg/L 0.0321 0.0628 0.0036 0.0071
Zinc, Total mg/L 0.121 0.279 0.138 0.0527
Notes:
a - Turbidity exceeded maximum value for meter (1,000 NTU).
5/23/2017 5/23/2017
Qualifiers defined as follows: J - The Result is an estimated quantity; J- - Estimated quantity with a low bias; J+ - Estimated quantity with a high bias; U - Not detected at Detection Limit; UJ - Not detected above the level of the
associated value (5 times the highest blank concentration).
NRunChute1 NRunChute2
North Chute at Outlet of 48-inch CulvertNorth Chute at Inlet to the Northeast
Sedimentation Basin
CD0517-NRunChute1-SW001 CD0517-NRunChute2-SW001
NRunChannel1
North Channel at ACM Transition to
Riprap
CD0517-NRunChannel1-SW001
5/23/2017
NRunChannel2
North Channel at Road Swale Inlet to
the Northeast Sedimentation Basin
CD0517-NRunChannel2-SW001
5/23/2017
S:\Jobs\0442-001-900-Simplot-Conda\RIFS_PilotStudy\PRB\DesignImplemtationPln\DraftFinal\Tbl5-4_Spring2017Runoff.xlsx 1 of 1
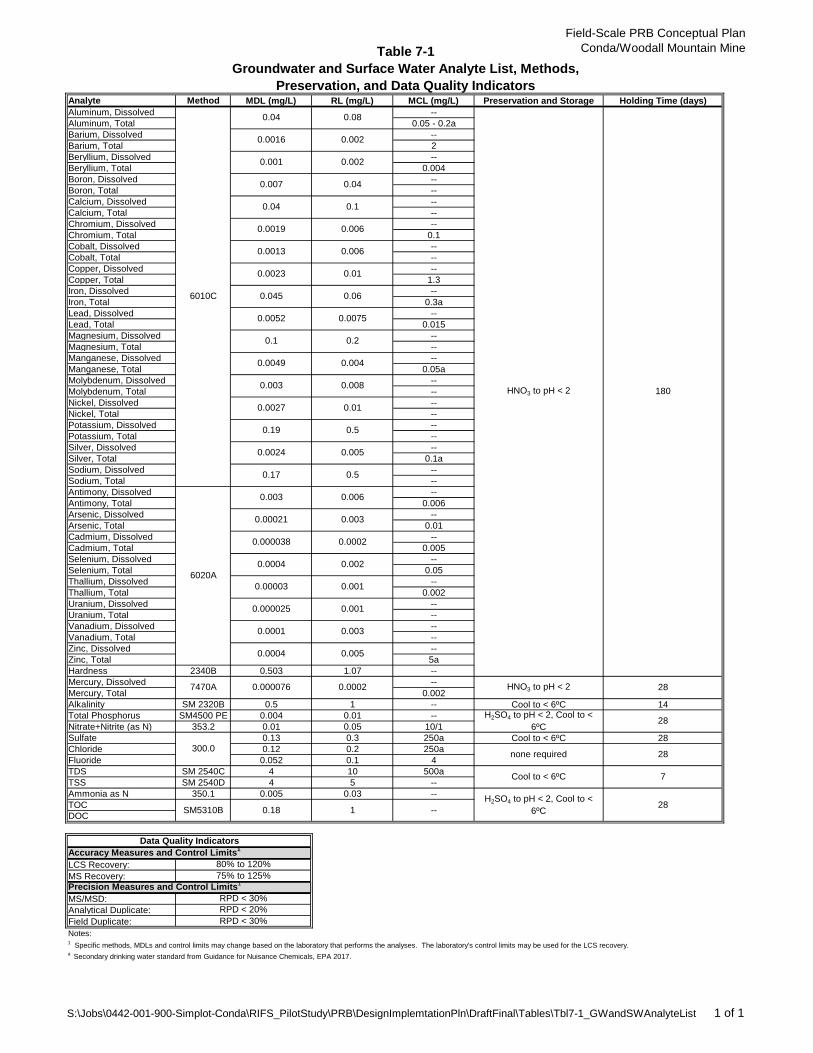
Table 7-1
Groundwater and Surface Water Analyte List, Methods,
Preservation, and Data Quality Indicators
Field-Scale PRB Conceptual Plan
Conda/Woodall Mountain Mine
Analyte Method MDL (mg/L) RL (mg/L) MCL (mg/L) Preservation and Storage Holding Time (days)
Aluminum, Dissolved --
Aluminum, Total 0.05 - 0.2a
Barium, Dissolved --
Barium, Total 2
Beryllium, Dissolved --
Beryllium, Total 0.004
Boron, Dissolved --
Boron, Total --
Calcium, Dissolved --
Calcium, Total --
Chromium, Dissolved --
Chromium, Total 0.1
Cobalt, Dissolved --
Cobalt, Total --
Copper, Dissolved --
Copper, Total 1.3
Iron, Dissolved --
Iron, Total 0.3a
Lead, Dissolved --
Lead, Total 0.015
Magnesium, Dissolved --
Magnesium, Total --
Manganese, Dissolved --
Manganese, Total 0.05a
Molybdenum, Dissolved --
Molybdenum, Total --
Nickel, Dissolved --
Nickel, Total --
Potassium, Dissolved --
Potassium, Total --
Silver, Dissolved --
Silver, Total 0.1a
Sodium, Dissolved --
Sodium, Total --
Antimony, Dissolved --
Antimony, Total 0.006
Arsenic, Dissolved --
Arsenic, Total 0.01
Cadmium, Dissolved --
Cadmium, Total 0.005
Selenium, Dissolved --
Selenium, Total 0.05
Thallium, Dissolved --
Thallium, Total 0.002
Uranium, Dissolved --
Uranium, Total --
Vanadium, Dissolved --
Vanadium, Total --
Zinc, Dissolved --
Zinc, Total 5a
Hardness 2340B 0.503 1.07 --
Mercury, Dissolved --
Mercury, Total 0.002
Alkalinity SM 2320B 0.5 1 -- Cool to < 6ºC 14
Total Phosphorus SM4500 PE 0.004 0.01 --
Nitrate+Nitrite (as N) 353.2 0.01 0.05 10/1
Sulfate 0.13 0.3 250a Cool to < 6ºC 28
Chloride 0.12 0.2 250a
Fluoride 0.052 0.1 4
TDS SM 2540C 4 10 500a
TSS SM 2540D 4 5 --
Ammonia as N 350.1 0.005 0.03 --
TOC
DOC
LCS Recovery:
MS Recovery:
MS/MSD:
Analytical Duplicate:
Field Duplicate:
Notes:
300.0
0.001
0.001
0.003
0.005
0.0002
0.00003
0.000025
RPD < 30%
Data Quality Indicators
75% to 125%
Accuracy Measures and Control Limits1
Precision Measures and Control Limits1
RPD < 30%
RPD < 20%
Cool to < 6ºC 7
80% to 120%
28H2SO4 to pH < 2, Cool to <
6ºCSM5310B 0.18 1 --
H2SO4 to pH < 2, Cool to <
6ºC28
none required 28
0.17
HNO3 to pH < 2 180
HNO3 to pH < 2 28
0.0001
0.0004
0.000076
0.0013
0.003
0.0002
0.002
0.08
0.0023
0.045
0.0052
0.1
0.04
0.0016
0.04
0.001
0.007
0.0019
0.002
0.002
0.04
0.1
0.006
0.0049
0.003
0.0027
0.19
0.0024
0.006
0.01
0.06
0.0075
0.2
1 Specific methods, MDLs and control limits may change based on the laboratory that performs the analyses. The laboratory's control limits may be used for the LCS recovery.
a Secondary drinking water standard from Guidance for Nuisance Chemicals, EPA 2017.
0.5
0.006
0.004
0.008
0.01
0.5
0.005
6010C
6020A
7470A
0.003
0.00021
0.000038
0.0004
S:\Jobs\0442-001-900-Simplot-Conda\RIFS_PilotStudy\PRB\DesignImplemtationPln\DraftFinal\Tables\Tbl7-1_GWandSWAnalyteList 1 of 1
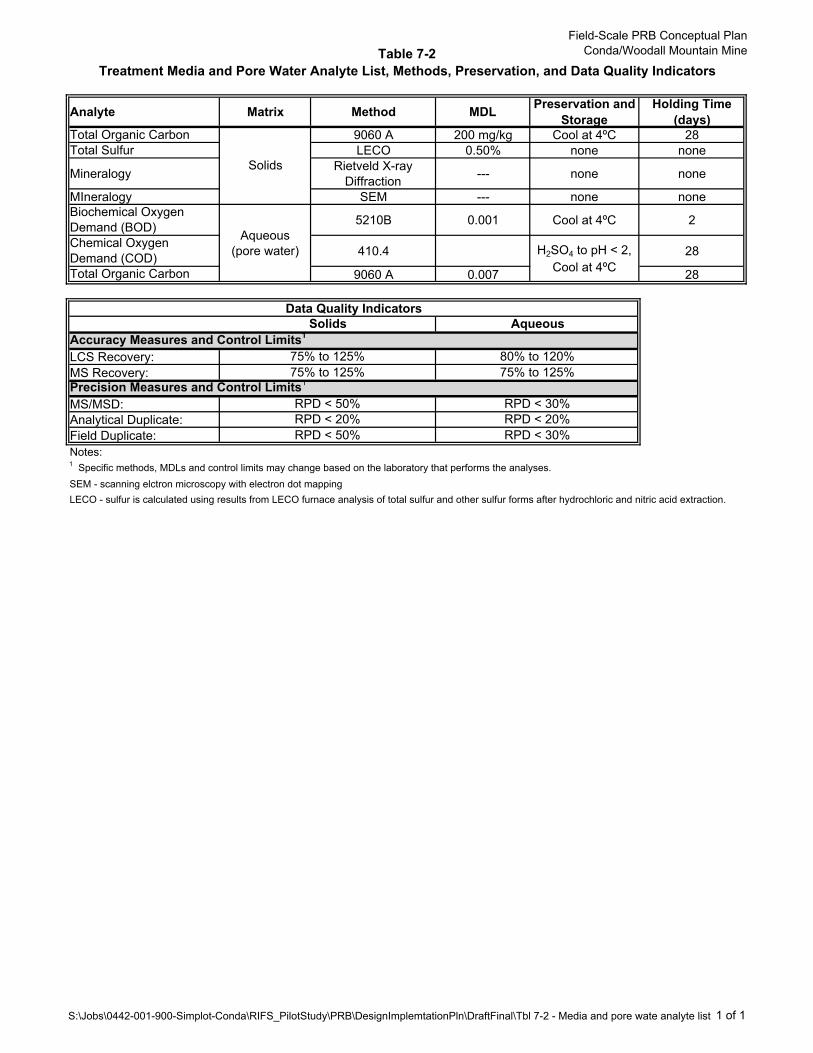
Table 7-2Treatment Media and Pore Water Analyte List, Methods, Preservation, and Data Quality Indicators
Field-Scale PRB Conceptual PlanConda/Woodall Mountain Mine
Analyte Matrix Method MDL Preservation and Storage
Holding Time (days)
Total Organic Carbon 9060 A 200 mg/kg Cool at 4ºC 28Total Sulfur LECO 0.50% none none
Mineralogy Rietveld X-ray Diffraction --- none none
MIneralogy SEM --- none noneBiochemical Oxygen Demand (BOD) 5210B 0.001 Cool at 4ºC 2
Chemical Oxygen Demand (COD) 410.4 28
Total Organic Carbon 9060 A 0.007 28
LCS Recovery:MS Recovery:
MS/MSD:Analytical Duplicate:Field Duplicate:Notes:1 Specific methods, MDLs and control limits may change based on the laboratory that performs the analyses. SEM - scanning elctron microscopy with electron dot mapping
Aqueous (pore water) H2SO4 to pH < 2,
Cool at 4ºC
LECO - sulfur is calculated using results from LECO furnace analysis of total sulfur and other sulfur forms after hydrochloric and nitric acid extraction.
Solids
75% to 125%75% to 125%
RPD < 50%RPD < 20%RPD < 50%
80% to 120%75% to 125%
RPD < 30%RPD < 20%RPD < 30%
Data Quality IndicatorsSolids Aqueous
Accuracy Measures and Control Limits1
Precision Measures and Control Limits1
S:\Jobs\0442-001-900-Simplot-Conda\RIFS_PilotStudy\PRB\DesignImplemtationPln\DraftFinal\Tbl 7-2 - Media and pore wate analyte list 1 of 1

Table 9-1
Permeable Reactive Barrier Pilot Study General Schedule
Field-Scale PRB Conceptual Plan
Conda/Woodall Mountain Mine
Task Date
Installation of Stormwater Controls and Mixing of Treatment Media Late September
Trenching for Groundwater PRB and placement of treatment media Early October
Construction of overflow drain and infiltration gallery Early - Mid October
Dewatering of the Northeast Seep 5 Pond and Northeast Sedimentation Basins Mid October
Placement of treatment media in Seep Treatment Cell and Dinwoody cover Mid - Late October
Installation and sampling of additional monitoring wells, if needed Late October
Weekly construction reportsSeptember through completion of
construction
Construction Summary Report with as-built drawings120 days after completion of
construction
Performance monitoringMonthly untill loss of access
during winter
Year 1 Data Summary Report March 2020
S:\Jobs\0442-001-900-Simplot-Conda\RIFS_PilotStudy\PRB\DesignImplemtationPln\Final\Tbl9-1_scheduleRev Page 1 of 1