THE SIGNIFICANCE OF WORKING CAPITAL MANAGEMENT IN
ENHANCING LIQUIDITY AND PROFITABILITY IN THE ELECTRICITY
DISTRIBITION SECTOR IN NAMIBIA: A CASE STUDY OF CENTRAL
NORTHERN ELECTRICITY DISTRIBUTION COMPANY (CENORED)
A THESIS SUBMITTED IN PARTIAL FULFILMENT OF THE
REQUIREMENTS FOR THE DEGREE OF MASTER OF BUSINESS
ADMINISTRATION FINANCE
OF
THE UNIVERSITY OF NAMIBIA
BY
ATANASIUS NGHIPANGELWA SHANINGWA
200241931
APRIL 2019
SUPERVISOR: DR. GERALD MUNYORO, BA (HONS), PGC, PGD, MSC,MSC, PHD
i
ABSTRACT
The study focused on the significance of working capital management in enhancing
liquidity and profitability in the electricity distribution sector in Namibia. The main
motivator for the researcher to conduct the study was the fact that the electricity
distribution sector has deteriorated sharply as the sector continues to be troubled by
heavy gearing. This has been aggravated by mounting debt, resulting in financial stress.
In this study, the positivism philosophy was adopted as well as the case study research
design. In addition, questionnaires were used to collect the data. Descriptive statistics
using the measures of central tendency and measures of variability namely: arithmetic
means, variances and standard deviations were used to analyse the data. The study
established that working capital management is significant to the electricity distribution
sector. It is pivotal to the health, performance and value enhancement of business
enterprises in the sector. In addition, it highlighted that the growth effect of working
capital management is particularly important in the Namibian electricity distribution
sector where demand is continually outstripping supply. Thus, the overall benefits of
working capital management that are linked to improved liquidity, profitability and
enhanced value creation and growth are indispensable to the electricity distribution
sector in Namibia. This is also because they enable the sector to make critical
infrastructural and technological investments to contain surging demand, and also to
attract more investors in this highly capital-intensive sector. In addition, it was
established that profit maximisation through working capital management enables a
company to realise its ultimate objective of maximising shareholders’ wealth. By so
doing, one attracts more investors to make further capital investments that would enable
the sector to contain the rising demand in electricity. This is also important because high
levels of profitability play a vital role in bringing external finance to the business as
creditors, investors and suppliers do not hesitate to invest in such a sector. In turn the
enhanced resource utilisation brought about by working capital management also leads
to value creation, thereby attracting more investors. Furthermore, the profitability
enhancement impact of working capital management enables the sector to plough back
its own profits into the required capital investments, thus reducing dependence on
expensive debt financing. It can also be concluded that working capital management

ii
guarantees business survival and continuity and this is key for the alleviation of power
shortages in the country, and the revival of the economy at large.
iii
Table Contents
LIST OF TABLES ............................................................................................................................... vi
LIST OF FIGURES ............................................................................................................................ vii
LIST OF ACRONYMS ...................................................................................................................... viii
DEDICATION ................................................................................................................................... ix
ACKNOWLEDGEMENT ..................................................................................................................... x
DECLARATION ................................................................................................................................ xi
CHAPTER ONE .................................................................................................................................1
INTRODUCTION ...............................................................................................................................1
1.1 Introduction ..............................................................................................................................1
1.2 The background of study ..........................................................................................................1
1.3 The background of Central Northern Electricity Distribution Company CENORED (Pty) Ltd ...4
1.4 Statement of the problem ........................................................................................................5
1.5 Objectives of the study .............................................................................................................6
1.6 Hypothesis ................................................................................................................................6
1.7 Significance of the Study ...........................................................................................................6
1.8 Scope of the Research ..............................................................................................................7
1.9 Limitation of the study ..............................................................................................................7
1.10 Thesis Structure ......................................................................................................................7
1.11 Chapter Summary ...................................................................................................................8
CHAPTER TWO ................................................................................................................................9
2.1 Introduction ..............................................................................................................................9
2.2 Background of the Study ...........................................................................................................9
2.3 The Electricity Market Function. ............................................................................................ 12
2.4 The Electricity Distribution Concept ...................................................................................... 14
2.5 The History of Electricity Distribution in Namibia ................................................................. 15
2.6 The Meaning of Working Capital ........................................................................................... 17
2.7 The impact of working capital on organisation performance ............................................... 21
2.9 The Working Capital Management Concept .......................................................................... 25
2.10 The Liquidity Concept .......................................................................................................... 27
2.11 Central bank liquidity ........................................................................................................... 29
2.12 The Profitability Concept ..................................................................................................... 30
iv
2.13 Working Capital Management Models ................................................................................ 32
2.14 Conceptual Framework ........................................................................................................ 36
2.15 Empirical Evidence. .............................................................................................................. 39
2.16 Research Gap ....................................................................................................................... 42
2.17 Chapter Summary ................................................................................................................ 44
CHAPTER THREE ........................................................................................................................... 45
3.1 Introduction ........................................................................................................................... 45
3.2 Research Philosophy .............................................................................................................. 45
3.3 Research Design ..................................................................................................................... 46
3.4 Population .............................................................................................................................. 48
3.5 Sample size............................................................................................................................. 48
3.6 Sampling Procedure ............................................................................................................... 50
3.7 Research Instruments ............................................................................................................ 51
3.8 Sources of Data ...................................................................................................................... 52
3.9 Data Collection Procedure ..................................................................................................... 52
3.10 Data Analysis Techniques and Procedure ............................................................................ 53
3. 11 Validity ................................................................................................................................ 54
3. 12 Reliability ............................................................................................................................. 54
3. 13 Ethical Considerations ......................................................................................................... 55
3.14 Chapter Summary ................................................................................................................ 55
CHAPTER FOUR ............................................................................................................................ 56
4.1 Introduction ........................................................................................................................... 56
4.2 Questionnaire responses ....................................................................................................... 56
4.3 Reliability ............................................................................................................................... 57
4.4 Age ......................................................................................................................................... 58
4.5 Education ............................................................................................................................... 59
4.6 Experience at CENORED PTY LTD ........................................................................................... 60
4.7 Years in department .............................................................................................................. 61
4.8 Factor Analysis ....................................................................................................................... 62
4.9 Variance analysis .................................................................................................................... 63
4.10 Major findings ...................................................................................................................... 67
4.11 Summary .............................................................................................................................. 71
CHAPTER FIVE .............................................................................................................................. 72
v
5.1 Introduction ........................................................................................................................... 72
5.2 Recommendations ................................................................................................................. 72
5.4 Conclusion .............................................................................................................................. 73
REFERENCES........................................................................................................................... 74
APPENDICES ................................................................................................................................. 89
APPENDIX 1: QUESTIONNAIRE ..................................................................................................... 89
APPENDIX 2: CONSENT LETTER .................................................................................................... 92
APPENDIX 3: LANGUAGE & COPY –EDITING CERTIFICATE ........................................................... 93
vi
LIST OF TABLES
Table 2.1: Namibian Policies for Improving the Electricity Situation .......................................... 15
Table 4.1: Questionnaire responses ............................................................................................ 56
Table 4.3: Reliability Statistics ..................................................................................................... 57
Table 4.4: Age Demographics ...................................................................................................... 58
Table 4.5: Level of Education ....................................................................................................... 59
Table 4.6: Experience at CENORED (Pty) Ltd ............................................................................... 60
Table 4.7: Year in Department Analysis ....................................................................................... 62
Table 4.8: Factor Analysis ............................................................................................................ 62
Table 4.9: Analysis of Variances ................................................................................................... 63
vii
LIST OF FIGURES
Figure 2.1: The Electricity Market ................................................................................................ 13
Figure 2.2 Business Working Capital Classification ...................................................................... 21
Figure 2.3: The Liquidity-Profitability Trade-Off .......................................................................... 34
Figure 4.1: Returned Questionnaires Composition ..................................................................... 57
Figure 4.2: Age Percentages ........................................................................................................ 59
Figure 4.3: Level of Education ...................................................................................................... 60
Figure 4.4: Experience at Cenored (Pty) Ltd ................................................................................ 61
Figure 4.5 Year in Department ..................................................................................................... 61

viii
LIST OF ACRONYMS
CCC Cash Conversion Cycle
ECB Electricity Control Board
ESI Electricity Supply Industry
GDP Gross Domestic Product
NAMPOW
ER Namibia Power Co-Operation
NDP III National Development Plan III
QC Quality Control
ROA Return on Assets
ROE Return on Equity
SME Small and Medium Enterprise
SPSS Statistical Package for Social Science
UAE United Arab Emirates
USA United States of America
WC Working Capital
WCM Working Capital Management
WCP Working Capital Policy
WIP Work - in Progress

ix
DEDICATION
Firstly, I dedicate my dissertation work to my family and friends. I express special
gratitude to my loving parents, Elina Nghifindaka and Alfred Shaningwa whose words
of encouragement and push for tenacity ring in my ears.
Secondly, I am dedicating this thesis to my beloved late sister Amalia Shaningwa who
meant a lot and continues to mean so much to me. Although she is no more, her
memories continue to regulate my life.
Last but not least, I dedicate this work to my wife Paulina and my wonderful daughters
Kimora and Kayla for being there for me throughout the entire MBA programme and for
being the best cheer leaders.

x
ACKNOWLEDGEMENT
My profound gratitude goes to the Central Northern Electricity Distribution Company
(CENORED) Pty Ltd for granting me permission to carry out my study in their
organisation. I give special thanks to all the Lecturers at the Namibia Business School
(NBS) for their time and support throughout my MBA programme.
I am especially grateful to my supervisor Dr. Gerald Munyoro for leading me well and
sharing with me great ideas regarding my thesis. Thank you for your support and helpful
suggestions.
Last but not least, I owe so much to my whole family for their undying support and their
unwavering belief that I can achieve so much. Unfortunately, I cannot thank everyone
who was with me in prayers by name but, I just want them to know that they count so
much. Thank you.

xi
DECLARATION
I, ATANASIUS NGHIPANGWELWA SHANINGWA hereby declares that the work
contained in this project is my own original work and has not previously in it’s entirety
or part been submitted to any institution of higher learning. All the sources used are
listed in the references list.
No part of this project may be reproduced, stored in any retrieval system, or transmitted
in any form, or by means (e.g. electronic, mechanical, photocopying, or otherwise)
without the prior permission of the author, or the University of Namibia in that behalf.
I, Atanasius Nghipangelwa Shaningwa, grants the University of Namibia the right to
reproduce this project in whole or in part, in any manner or format, which the University
of Namibia may deem it, for any person or institution requiring it for study and research;
provided that the University of Namibia shall waive this right if the whole project has
been or is being published in a manner satisfactory to the University.
Signed………………………….. Date………………
1
CHAPTER ONE
INTRODUCTION
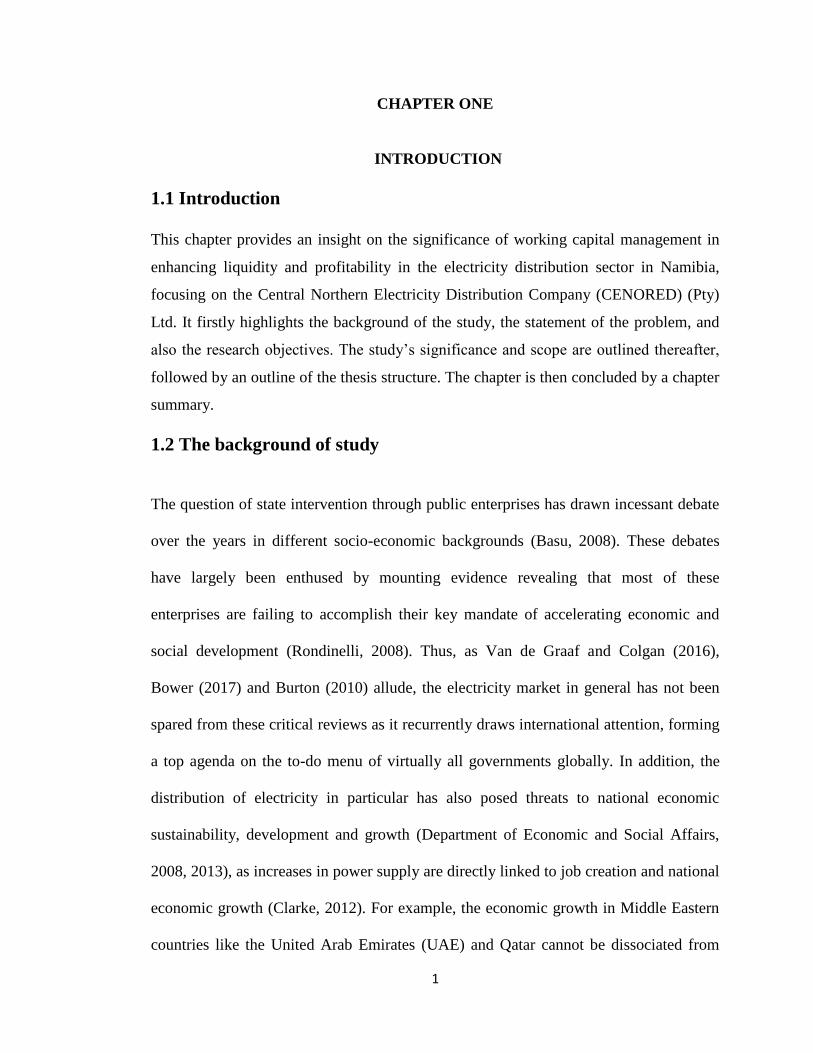
1.1 Introduction
This chapter provides an insight on the significance of working capital management in
enhancing liquidity and profitability in the electricity distribution sector in Namibia,
focusing on the Central Northern Electricity Distribution Company (CENORED) (Pty)
Ltd. It firstly highlights the background of the study, the statement of the problem, and
also the research objectives. The study’s significance and scope are outlined thereafter,
followed by an outline of the thesis structure. The chapter is then concluded by a chapter
summary.
1.2 The background of study
The question of state intervention through public enterprises has drawn incessant debate
over the years in different socio-economic backgrounds (Basu, 2008). These debates
have largely been enthused by mounting evidence revealing that most of these
enterprises are failing to accomplish their key mandate of accelerating economic and
social development (Rondinelli, 2008). Thus, as Van de Graaf and Colgan (2016),
Bower (2017) and Burton (2010) allude, the electricity market in general has not been
spared from these critical reviews as it recurrently draws international attention, forming
a top agenda on the to-do menu of virtually all governments globally. In addition, the
distribution of electricity in particular has also posed threats to national economic
sustainability, development and growth (Department of Economic and Social Affairs,
2008, 2013), as increases in power supply are directly linked to job creation and national
economic growth (Clarke, 2012). For example, the economic growth in Middle Eastern
countries like the United Arab Emirates (UAE) and Qatar cannot be dissociated from
2
their electric power consumption per capita growth, and this has been the situation over
the years (Qader, 2009).
Similarly, in the African context, Nigeria is facing extreme energy deficiencies despite
being endowed with abundant gas, water and mineral resources (Tallapragada, 2009),
which is blamed on the dearth of investment, nefarious policies, poor performance,
deepening poverty, low human development indicators and lack of strategic planning in
the sector. The World Bank (2011) and Elusakin (2013) further illuminate that this
situation is typical of many developing countries that include Namibia.
It is vital to note that electricity distribution in numerous countries that include Namibia
is usually carried out by various electricity distribution companies like the Central
Northern Electricity Distribution Company (CENORED) (Pty) Ltd, a system that Eskom
(2015) beholds as key in ensuring the smooth supply and consumption of electricity.
Thus, Abdelhay and Malik (2011) describe electricity distribution as an important part of
the three-stage delivery process of electric power, which also includes generation and
transmission. With the world population steadily increasing from 6.8 billion people in
2011 to 7.4 billion in 2015, Ross (2015) recognises that the challenges faced by the
electricity distribution industry are bound to increase. This is considering that the
industry is plagued with poor infrastructure, wear and tear of distribution grids and
climate change, which is further compounded by the rising demand for the commodity.
Expounding on this: Bouttes 2011) and Munyoro (2016) underscored that these surges in
power demand are attributed to rapid urbanisation. Hence, this also implies that the
problems faced by electricity distribution companies around the world, though common,
occur at different intensities in different countries, and Namibia is no exception. For
3
example, despite being a developed nation, the United Kingdom is equally distressed by
electricity distribution, and they view this problem not only as a mechanical problem,
but also as a managerial challenge (Watson et al., 2001).
In response to the above-mentioned challenges, the government of India has
recommended electricity distribution companies to be efficient, resilient, and financially
robust to ensure growth and poverty reduction (Ministry of Power, 2005). However,
almost all investment-climate surveys done so far in the sector point to poor availability
and quality of electricity, which in turn pose critical constraints to commercial and
manufacturing activities, as well as national competitiveness. However, despite the
considerable progress realised in implementing efficient electricity distribution policies
in Namibia over the past decade, the distribution segment continues to post significant
losses and liquidity challenges. These challenges deter the country from meticulously
accomplishing the electricity distribution sector goals. This explains why electricity
distribution in the country has deteriorated sharply, as the sector continues to be weighed
down by heavy borrowing and other mounting debts (Alagh, 2013). Moreover, these
persistent losses have subjected the electricity distribution sector to further challenges
that include limited access to modern infrastructure, inadequate power generating
capacity, inefficient usage and ineffective regulation.
Furthermore, the sector incurs high technical losses from vandalism, lacks insufficient
transmission and distribution facilities, has poorly trained manpower at its disposal,
faces problems of inefficient use of electricity by consumers. It also lacks capital for
investment that is coupled by a precipitous decline in creditworthiness (World Bank
4
Group Energy Sector Strategy, 2009). Consequently, the challenges associated with the
highlighted electricity crisis, particularly the current subdued levels of electricity and
energy consumption per capita that fall short of the recommended global development
standards, and also the dismal state of socio-economic conditions in the Namibian
economy, have led to high financial stress in the electricity distribution sector (Alagh,
2013). Accordingly, this study aims to ascertain the significance of working capital
management in enhancing liquidity and profitability in the electricity distribution sector
in Namibia, focusing on the Central Northern Electricity Distribution Company
(CENORED) (Pty) Ltd.
1.3 The background of Central Northern Electricity Distribution
Company CENORED (Pty) Ltd
The Central Northern Electricity Distribution Company CENORED (Pty) Ltd is the third
licensed regional electricity distribution company to be established in Namibia, after
NORED and Erongo RED that were established in 2002 and 2004 respectively
(https://www.namibian.com.na,retrived,21/02/2016). CENORED’s license area covers
the Otjozondjupa and Kunene regions, and it commands a customer base of 40 000
people, distributing electricity to various towns and settlement areas of central and
northern Namibia over an area of approximately 120 000 square kilometres
(www.thevillager.com.na). CENORED was established in 2002 by the local and
regional authorities in its area of operation as well as the Namibia Power Co-operation
(NAMPOWER), all of which are shareholders in the company. CENORED’s specific
5
areas of operation include Tsumeb, Grootfontein, Otavi, Otjiwarongo, Outjo, Khorixas,
Kamanjab, Okahandja and Gobabis (www.cenored.com.na).
1.4 Statement of the problem
Despite registering considerable progress in implementing efficient electricity
distribution policies in Namibia over the past two decades, the distribution segment
continues to post significant losses and utility finance challenges that deter it from
meticulously accomplishing its goals (Sadelec, 2000; EMCON Consulting Group, 2002;
Ljung, 2007; Kapika and Eberhard, 2013). Consequently, electricity distribution has
deteriorated sharply as the sector continues to be troubled by heavy gearing, that is also
aggravated by mounting debts (World Bank, 2011; Namnewsnetwork, 2015;
africanenergyresources.com). These, continuous losses have exposed the electricity
distribution sector to a myriad of challenges that include: limited access to infrastructure,
inadequate power generating capacity, inefficient usage capacity, ineffective regulation,
high technical losses and vandalism.
Moreover, the sector is also subjected to insufficient transmission and distribution
facilities, poorly trained manpower, inappropriate industries and market structures,
inefficient use of electricity by consumers, lack of capital for investment and a
precipitous decline in the creditworthiness of the sector (World Bank, 2011)
Consequently, these challenges, particularly the current subdued level of electricity and
energy consumption per capita that falls short of recommended global development
standards, an coupled with the dismal state of socio-economic conditions in the
Namibian economy, have resulted in high financial stress in the sector
(http://www.mme.gov.na, retrieved, 21/02/2016).
6
This study aims to ascertain the significance of working capital management in
enhancing liquidity and profitability in the electricity distribution sector in Namibia,
focusing on Central Northern Electricity Distribution Company (CENORED) (Pty) Ltd.
1.5 Objectives of the study
The study aims to fulfil the following objectives:
i) To establish the significance of working capital management to the electricity
distribution in Namibia.
ii) To evaluate the impact of working capital management on the liquidity and
profitability of the electricity distribution in Namibia.
iii) To provide recommendations to all stakeholders.
1.6 Hypothesis
The study also seeks to test the following hypothesis:
: Working capital management is not significant to the enhancement of
liquidity and profitability of the electricity distribution sector in Namibia.
: Working capital management is significant to the enhancement of liquidity
and profitability of the electricity distribution sector in Namibia.
1.7 Significance of the Study
This research intends to help the electricity distribution sector to determine if working
capital management is significant to the enhancement of liquidity and the profitability of
the electricity distribution sector in Namibia. The study will focus on the Central
Northern Electricity Distribution Company (CENORED) (Pty) Ltd of Namibia.
Furthermore, the research provides a platform on which electricity distribution
companies are benefiting from working capital management, especially on how working
7
capital management is affecting the liquidity and profitability in the electricity
distribution sector in Namibia and how best this can be addressed by the relevant
authorities.
Likewise, the Namibian government will benefit from this study through obtaining ideas
on how to address the resource constraints being faced by the electricity distribution
sector in Namibia and the region at large. The study will also serve as a platform of
reference for other researchers. Furthermore, the research will increase the University of
Namibia’s body of knowledge, thus augmenting its usefulness as a reference point by
various scholars locally and internationally.
1.8 Scope of the Research
The research will concentrate on the significance of working capital management on the
liquidity and profitability of the electricity distribution companies in Namibia, focusing
on the Central Northern Electricity Distribution Company (CENORED) (Pty) Ltd.
1.9 Limitation of the study
The researcher is limiting the study only to Central Northern Electricity Distribution
Company CENORED (Pty) Ltd and not all regional electricity distribution companies in
Namibia within the same industry. The limitation is based on time constraint and
financial resources allocated for the study.
1.10 Thesis Structure
This research document is made up of five chapters. The first chapter introduces the
background of the study, the research problem and the significance of the research. It
also highlights the study’s scope, objectives and the research questions to be answered to
8
fulfil the set objectives. Chapter two encompasses the review of literature on the study
area through both theoretical and empirical evidence. The third chapter outlines the
research methodology employed in carrying out the research, whilst chapter four looks
at the presentation, analysis and interpretation of the data collected in the research.
Chapter five, the last chapter of the research highlights the conclusions drawn from the
research findings, provides recommendations to all stakeholders and also recommends
the areas for further study.
1.11 Chapter Summary
This chapter highlighted the background of the electricity distribution industry in
Namibia, shedding light on the prevailing electricity distribution financing gap in the
country. It also revealed the challenges faced in the distribution of electricity. The
research objectives and subsequent questions were also outlined in the chapter, further
highlighting the significance and scope of the research, and ultimately the thesis
structure. The next chapter will focus on a review of literature related to the study.
9
CHAPTER TWO
LITERATURE REVIEW
2.1 Introduction
This chapter focused on the reviewing of literature from various sources related to the
subjects of working capital management, profitability and liquidity. It initially
highlighted the background of the study, and subsequently provided the theoretical and
empirical evidence on the study’s focus areas. The conceptual framework was similarly
provided and the research gap clearly specified. The chapter concluded with the chapter
summary, highlighting all the issues that would have been covered in the body of the
chapter.
2.2 Background of the Study
The issue of electricity distribution has generally been a very delicate issue that has
habitually attracted international attention in recent years, justifying why it formed a top
agenda on the to-do menu of virtually all governments globally (Burton, 2010; Van de
Graaf and Colgan, 2016; Bower, 2017). Consequently, concerned policy makers in
various governments are having sleepless nights (Department of Economic and Social
Affairs, 2008) because this issue of electricity distribution is directly linked to economic
sustainability and development (Department of Economic and Social Affairs, 2013).
This is supported by Clarke (2012), who suggests that the increase in power supply is
perceived as a strategic way of creating jobs and improving national economic growth.
However, African countries like Cameroon and Nigeria have been facing huge energy
deficiencies, yet they are endowed with substantial energy resources in the form of gas,
10
water and minerals (Tallapragada, 2009). These serious shortages of electricity in
developing countries that also include Namibia (World Bank, 2011) have generally been
blamed on various factors that include the lack of investment, nefarious policies, poor
performance, deepening poverty, low human development indicators and lack of
strategic planning in the electricity distribution sector.
It is key in this study to note that electricity distribution in various countries is usually
carried out by different electricity distribution companies. For example, in Namibia, the
Central Northern Electricity Distribution Company (CENORED) (Pty) Ltd is one of the
companies that distribute the electricity commodity in the country. Although the role
that these companies play is crucial in balancing the supply and consumption of
electricity (Eskom, 2015), they are mostly besieged by underfunding problems that make
it difficult for them to meet their operation costs as well as demand. This is further
aggravated by the fact that electricity distribution companies’ costs tend to surpass their
revenues, a situation that is ascribed to the fact that electricity tends to be subsidised in
most countries. Notwithstanding the highlighted challenges faced by the electricity
distribution sector, Abdelhay and Malik (2011) endorse the electricity distribution
function as an important stage in the three-stage delivery of electric power, which also
includes generation and transmission.
Thus, in the face of the increasing world population, Ross (2015) stresses that the
challenges being faced by the electricity distribution industry are bound to multiply, as
the sector continues to be hounded by poor infrastructure, the wear out of distribution
grids and climate change, which is also compounded by the increase in the demand for
electricity. Moreover, as noted by Bouttes et al., (2011), the increase in power demand
11
is also attributed to rapid urbanisation that is being caused by the movement of people
from rural areas to urban areas (Munyoro et al., 2016). Hence, this infers that the
problems being faced by the electricity distribution sector around the world, even though
common, occur at different intensities in different countries, and Namibia is no
exception. For example, the United Kingdom is equally facing these electricity
distribution challenges, and its policy makers perceive the problem not only as a
mechanical problem, but also as a managerial challenge as highlighted by (Watson et al.,
2001).
In response to the above-mentioned challenges, the government of India has highlighted
on the need for the electricity distribution sector to be efficient, resilient, and financially
robust in order to ensure sustainability that is essential for economic growth and poverty
reduction (Ministry of Power, 2005). This is not surprising given that almost all
investment-climate surveys done so far point to poor availability and quality of
electricity as the critical constraints to commercial and manufacturing activity, as well as
national competitiveness. Thus, despite all the considerable progress registered in
implementing efficient electricity distribution policies in Namibia over the past decade,
the electricity distribution sector in the country continues to be inundated by significant
losses and utility finance challenges that inhibit it from realizing the electricity
distribution sector goals. According to Alagh (2013), these challenges have led to the
massive deterioration of electricity distribution, which is worsened by the fact that the
sector continues to rely on heavy borrowing.
12
Consequently, the electricity distribution sector has been subjected to additional
challenges that include limited access to infrastructure, inadequate power generating
capacity, inefficient capacity utilization, ineffective regulation, high technical losses and
vandalism. Moreover, the sector encounters problems of insufficient transmission and
distribution facilities, poorly trained manpower, inappropriate industries and market
structure, inefficient use of electricity by consumers, lack of capital for investment and a
precipitous decline in creditworthiness (https://www.worldbank.org,retrived,
22/02/2016). Thus, as Alagh (2013) alludes, these challenges that have led to an acute
electricity crisis in Namibia, have also resulted in a severe financial strain in the sector at
large. Hence the need to ascertain the significance of working capital management in
enhancing the liquidity and profitability of the electricity distribution sector in Namibia.
Working capital management is an activity that is espoused as an indispensable element
in the analysis of a firm’s performance while conducting day to day operations. The
study will specifically focus on the Central Northern Electricity Distribution Company
(CENORED) (Pty) Ltd.
2.3 The Electricity Market Function.
Alagh (2013) suggests that an electricity market is an arrangement to transfer electric
energy from producers to consumers. According to Watson et al., (2001), this
transmission of electric energy requires special infrastructure that is commonly known
as a power system. Elusakin (2013) further confers that this electricity market consists of
a few producers, who are the owners and operators of the power plants, and also possess
the liberty to sell electricity to local consumers, power pools or anyone. In this same
13
market, there are also retailers and traders whose role is to buy and sell electricity from
producers or other retailers to consumers or other retailers. According to Abdelhay and
Malik (2011), these retailers can provide a price insurance to the consumers and
simultaneously increase competition in the electricity market, although they are exposed
to large economic risks (Elusakin, 2013). At the bottom of the electricity market
hierarchy, there are consumers who are the end users of electricity, and also have the
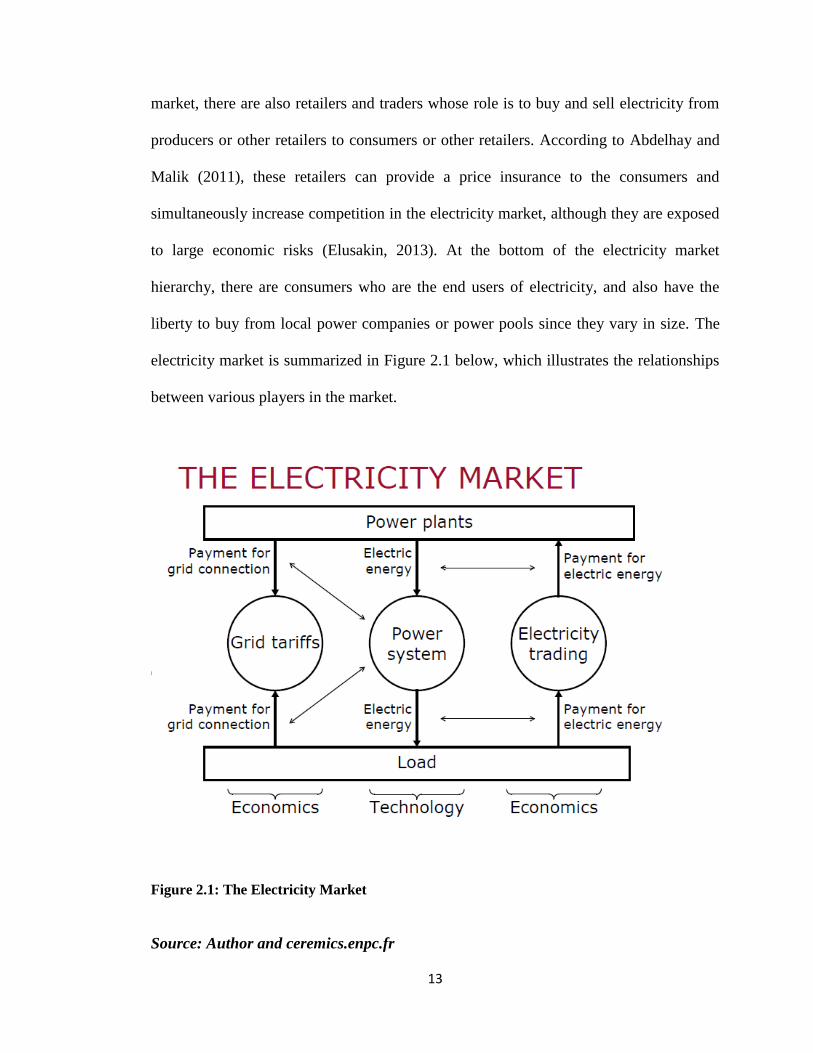
liberty to buy from local power companies or power pools since they vary in size. The
electricity market is summarized in Figure 2.1 below, which illustrates the relationships
between various players in the market.
Figure 2.1: The Electricity Market
Source: Author and ceremics.enpc.fr
14
2.4 The Electricity Distribution Concept
The evolution of electrical transmission and distribution systems in recent years has
evolved into something smarter, and has been conceptualized as the smart grid (Elusakin
2013). According to Watson et al., (2001), this smart grid can be seen as a programme
for making the grid more economical, efficient, resilient and sustainable in the long term
under dynamic scenarios. Moreover, of importance to note is the fact that electricity
cannot be stored, hence the need to come up with a framework that caters for generation
and distribution needs of the electricity.
As suggested by Abdelhay and Malik (2011), in order to assess the potential of smart
grid innovations, models of varying complexes and scale need to be designed and tested
under multiple scenarios. Some of the cross-domain processes and mechanisms that
could be modelled include the dynamic response of demand to price signals,
transmission pricing and congestion management, technology adoption under subsidized
regimes, active network management under high penetration of distributed generation,
market reforms and new trading strategies (Watson et al., 2001). However, traditional
equation-based and statistical modelling methods present limitations when it comes to
representing the complex real world with interactions that are typically dynamic, non-
linear, history dependent, multi-scale and multidimensional in nature. This is especially
as entities involved do not only interact amongst themselves, but also with their
environment (Elusakin 2013). In addition, these entities may be heterogeneous and
evolving with time to make their own intelligent decisions to maximize payoffs.
15
2.5 The History of Electricity Distribution in Namibia
Namibia was under the German rule before attaining independence in 1990
(https://www.Nytimes.com;https://www.bbc.com;https://www.sahistory,org.za;
https://www.britannica.com),retrived on 22/07/2016. It was during this colonial era that
the country suffered racial ills such as energy imbalances that denied over 80% of the
population from accessing electricity (helda.helsinki.fi; https://www.kas.de;
www.theguardian.com),retrived on 35/03/2016. With such a setup, there was a better
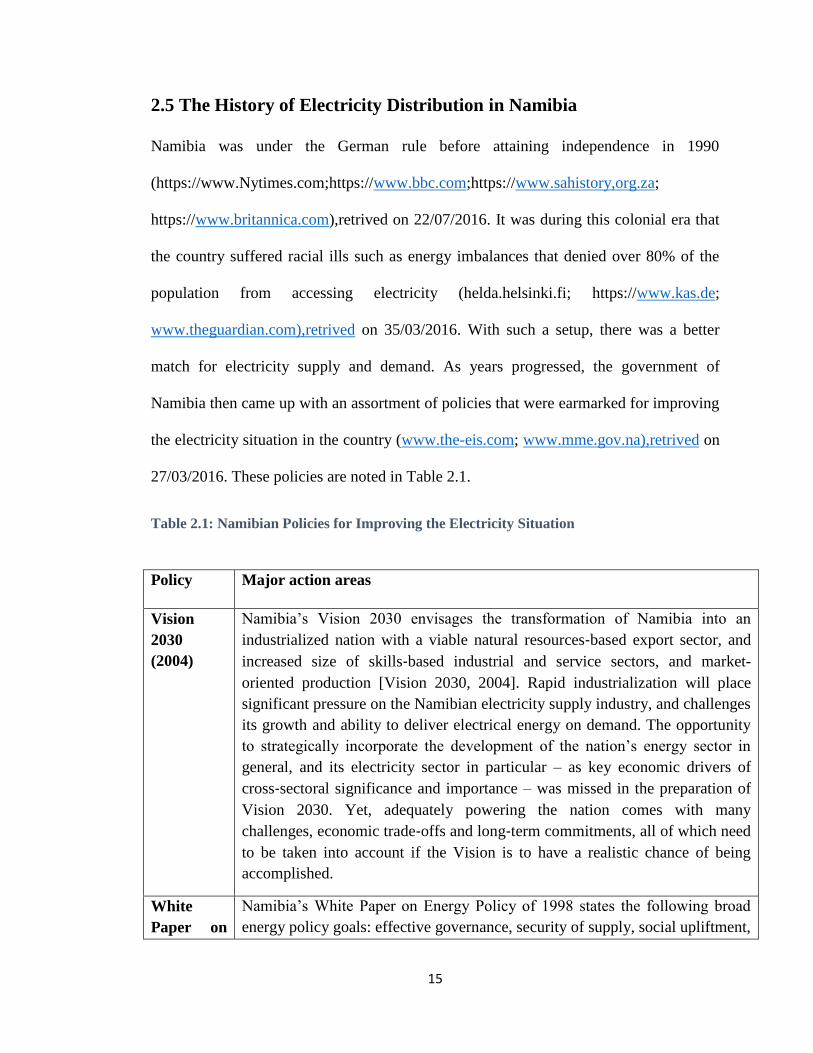
match for electricity supply and demand. As years progressed, the government of
Namibia then came up with an assortment of policies that were earmarked for improving
the electricity situation in the country (www.the-eis.com; www.mme.gov.na),retrived on
27/03/2016. These policies are noted in Table 2.1.
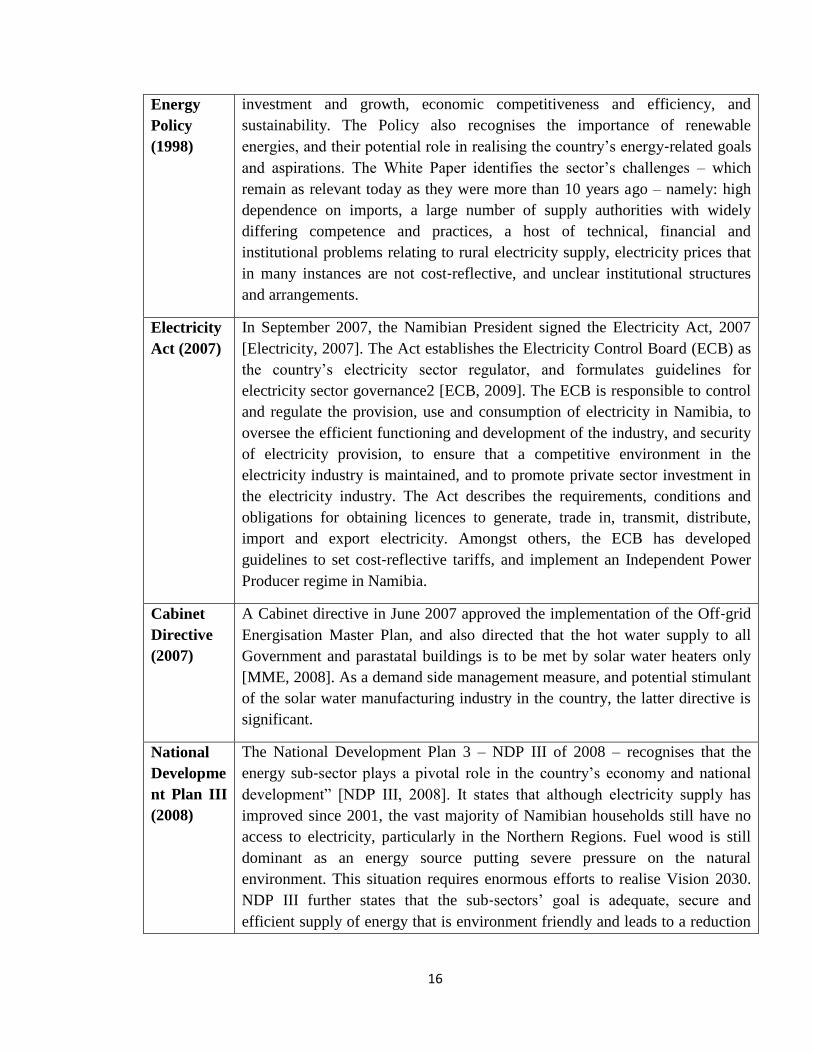
Table 2.1: Namibian Policies for Improving the Electricity Situation
Policy Major action areas
Vision
2030
(2004)
Namibia’s Vision 2030 envisages the transformation of Namibia into an
industrialized nation with a viable natural resources‐based export sector, and
increased size of skills‐based industrial and service sectors, and market-
oriented production [Vision 2030, 2004]. Rapid industrialization will place
significant pressure on the Namibian electricity supply industry, and challenges
its growth and ability to deliver electrical energy on demand. The opportunity
to strategically incorporate the development of the nation’s energy sector in
general, and its electricity sector in particular – as key economic drivers of
cross‐sectoral significance and importance – was missed in the preparation of
Vision 2030. Yet, adequately powering the nation comes with many
challenges, economic trade‐offs and long‐term commitments, all of which need
to be taken into account if the Vision is to have a realistic chance of being
accomplished.
White
Paper on
Namibia’s White Paper on Energy Policy of 1998 states the following broad
energy policy goals: effective governance, security of supply, social upliftment,
16
Energy
Policy
(1998)
investment and growth, economic competitiveness and efficiency, and
sustainability. The Policy also recognises the importance of renewable
energies, and their potential role in realising the country’s energy‐related goals
and aspirations. The White Paper identifies the sector’s challenges – which
remain as relevant today as they were more than 10 years ago – namely: high
dependence on imports, a large number of supply authorities with widely
differing competence and practices, a host of technical, financial and
institutional problems relating to rural electricity supply, electricity prices that
in many instances are not cost‐reflective, and unclear institutional structures
and arrangements.
Electricity
Act (2007)
In September 2007, the Namibian President signed the Electricity Act, 2007
[Electricity, 2007]. The Act establishes the Electricity Control Board (ECB) as
the country’s electricity sector regulator, and formulates guidelines for
electricity sector governance2 [ECB, 2009]. The ECB is responsible to control
and regulate the provision, use and consumption of electricity in Namibia, to
oversee the efficient functioning and development of the industry, and security
of electricity provision, to ensure that a competitive environment in the
electricity industry is maintained, and to promote private sector investment in
the electricity industry. The Act describes the requirements, conditions and
obligations for obtaining licences to generate, trade in, transmit, distribute,
import and export electricity. Amongst others, the ECB has developed
guidelines to set cost‐reflective tariffs, and implement an Independent Power
Producer regime in Namibia.
Cabinet
Directive
(2007)
A Cabinet directive in June 2007 approved the implementation of the Off‐grid
Energisation Master Plan, and also directed that the hot water supply to all
Government and parastatal buildings is to be met by solar water heaters only
[MME, 2008]. As a demand side management measure, and potential stimulant
of the solar water manufacturing industry in the country, the latter directive is
significant.
National
Developme
nt Plan III
(2008)
The National Development Plan 3 – NDP III of 2008 – recognises that the
energy sub‐sector plays a pivotal role in the country’s economy and national
development” [NDP III, 2008]. It states that although electricity supply has
improved since 2001, the vast majority of Namibian households still have no
access to electricity, particularly in the Northern Regions. Fuel wood is still
dominant as an energy source putting severe pressure on the natural
environment. This situation requires enormous efforts to realise Vision 2030.
NDP III further states that the sub‐sectors’ goal is adequate, secure and
efficient supply of energy that is environment friendly and leads to a reduction
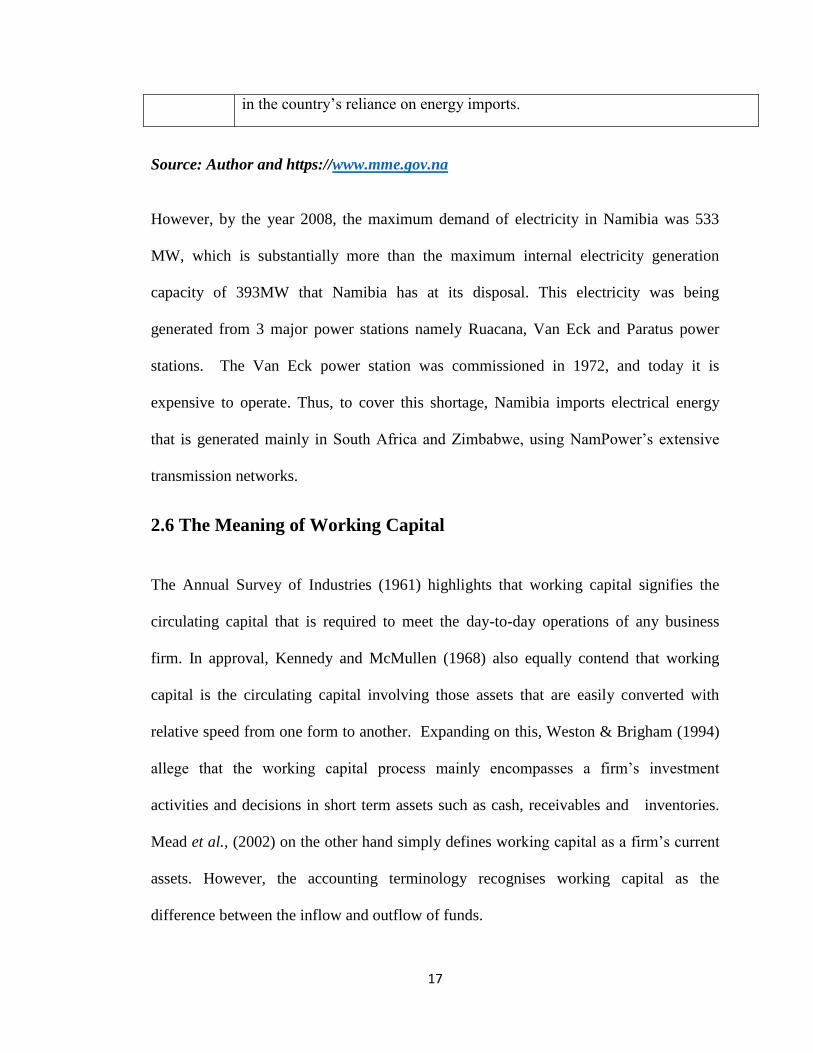
17
in the country’s reliance on energy imports.
Source: Author and https://www.mme.gov.na
However, by the year 2008, the maximum demand of electricity in Namibia was 533
MW, which is substantially more than the maximum internal electricity generation
capacity of 393MW that Namibia has at its disposal. This electricity was being
generated from 3 major power stations namely Ruacana, Van Eck and Paratus power
stations. The Van Eck power station was commissioned in 1972, and today it is
expensive to operate. Thus, to cover this shortage, Namibia imports electrical energy
that is generated mainly in South Africa and Zimbabwe, using NamPower’s extensive
transmission networks.
2.6 The Meaning of Working Capital
The Annual Survey of Industries (1961) highlights that working capital signifies the
circulating capital that is required to meet the day-to-day operations of any business
firm. In approval, Kennedy and McMullen (1968) also equally contend that working
capital is the circulating capital involving those assets that are easily converted with
relative speed from one form to another. Expanding on this, Weston & Brigham (1994)
allege that the working capital process mainly encompasses a firm’s investment
activities and decisions in short term assets such as cash, receivables and inventories.
Mead et al., (2002) on the other hand simply defines working capital as a firm’s current
assets. However, the accounting terminology recognises working capital as the
difference between the inflow and outflow of funds.
18
In recognition of the above accounting terminology, Tagduan & Nicolaescu (2011)
define working capital as the percentage of permanent capital used to finance company’s
current assets. Similarly, Aravindam & Ramanathan (2013) also define working capital
as the cash invested in company’s daily operations. Consequently, Guthman (1953)
upholds working capital as the lifeblood of any business as it constitutes cyclically
flowing streams of funds through the business. In agreement, Too et al., (2016) further
explain that working capital is commonly used for the capital required for day-to-day
working in a business concern, such as for purchasing raw materials, for meeting day-
today expenditure on salaries, wages, rents rates and advertising among others.
Basically, there are two concepts of working capital which are quantitative and
qualitative, with some people defining the two concepts as gross and net concepts
(Guthman 1953). Smith (1937) termed the quantitative concept as circulating capital,
which perceives working capital as the total of current assets that are also regarded as
gross working capital. On the other hand, the qualitative concept gives an idea regarding
source of financing capital, and views working capital as the excess of current assets
over current liabilities.
Guthman (1953) agrees with the qualitative concept as he perceives working capital as
the excess of current assets over current liabilities, although he specifically refers to it as
net working capital. Thus, in the qualitative concept, net working capital represents the
amount of current assets that would remain if all the current liabilities are paid. In
addition, Weston and Bingham (1994) confer that these concepts of working capital
have their unique points of importance. Hence, they argue that if the objective is to
measure the size and extent to which current assets are being used, the gross concept is
19
useful, whilst the net concept is pertinent and preferable when evaluating the liquidity
position of an undertaking.
Aravindan & Ramanathan (2013) confer that by calculating working capital through
establishing the difference between current assets and currents liabilities, a firm is
granted the possibility to acknowledge the amount of capital which is allocated to
operating needs. Moreover, obtaining working capital through the difference between
permanent capitals (equity and non-current liabilities) and non-current assets enables a
firm to ascertain if it uses the excess of permanent capitals to finance its current assets.
Thus, if the difference is negative, it signifies that a percentage of the non-current assets
is being financed by the short period financing, which consequently enhances the
company’s bankruptcy risk (Mota, 2013). Hence, Martins et al., (2009) recommend
companies to have the same maturity for capitals used to finance assets and for the assets
themselves, as the transformation of the assets into cash takes more time than is
previously forecasted, which obliges the company to need a positive working capital at
all times.
Furthermore, Kennedy and McMullen (1968) postulate that current assets have a short
life span, implying that they can easily be converted into cash within a twelve-month
financial period. On the other hand, current liabilities are short-term obligations that are
also payable within an accounting cycle such as accounts opened with suppliers of raw
materials. According to Caballero et al., (2010), it is also important to highlight that in
order to find the “perfect” level of working capital for a determined company, several
factors have to be taken into account, which include the type of business, the company’s
dimension, the suppliers’ relation, the market where the company acts, the growth
20
opportunities that the company could have and the operations’ seasonality. Having said
that, it is also essential to highlight a business’ working capital tends to vary as time
progresses due to external factors such as demand and economic changes.
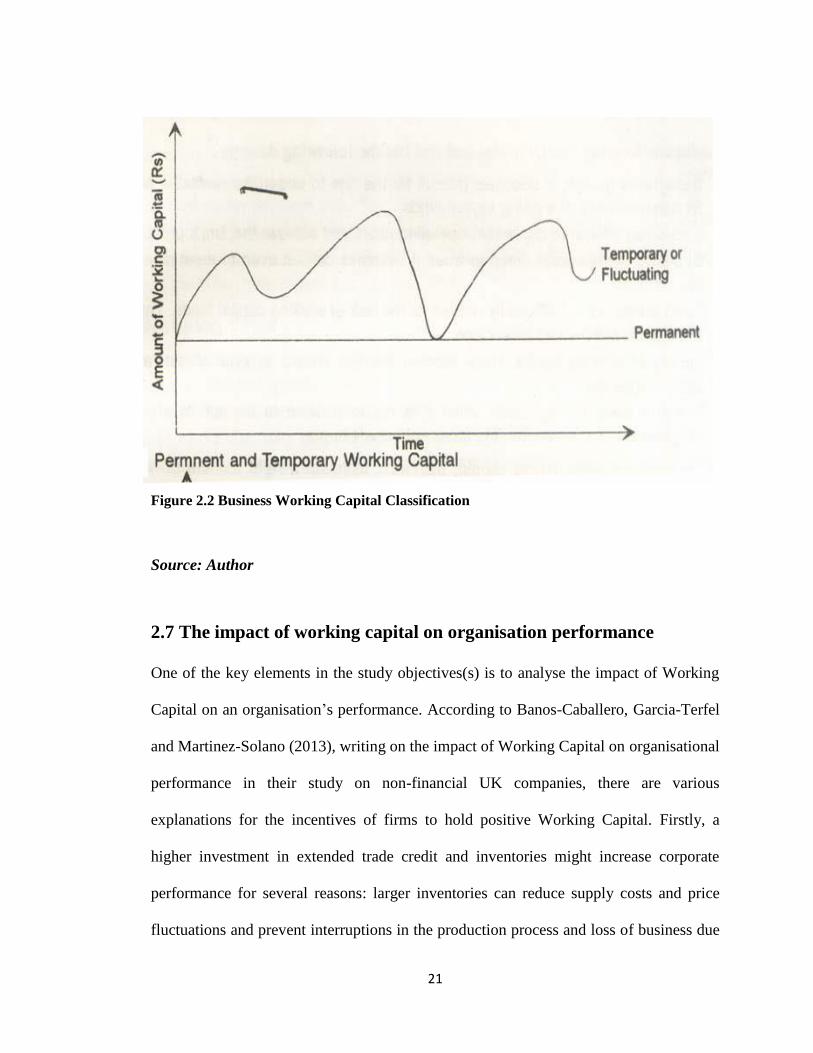
As depicted in Figure 2.2, businesses tend to have fixed working capital and fluctuating
working capital. Fluctuating working capital is usually short term in nature, for example
a short-term bank loan (Kennedy and McMullen, 1968), whilst fixed working capital is
long term. Likewise, such fluctuations exist in the electricity industry and hence, the
levels of working capital required in the business vary all the time. Of great importance
to also note is the availability and delivery of this working capital to a business in need,
because failure to adhere to these variables may negatively affect the business.
Subsequently, Kavitha (2007) states that the cheapest and best sources of cash exist as
working capital right within a business, and also emphasizes that the good management
of working capital will generate cash, which will help to improve the business and
reduce risks. Thus, as Bei & Wijewardana (2012) and Gill & Biger (2013) propound,
both inadequate and excess working capital affect firm profitability, and thus effective
working capital management (WCM) and working capital policy (WCP) are critical to
business success.
21
Figure 2.2 Business Working Capital Classification
Source: Author
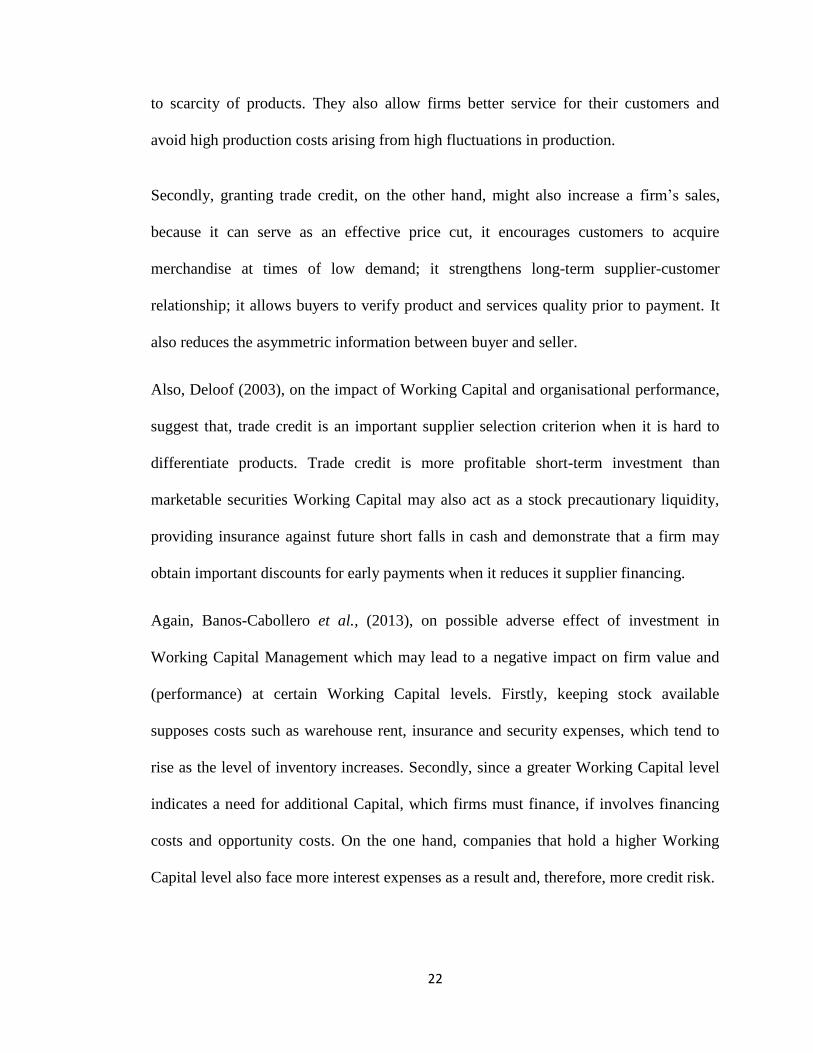
2.7 The impact of working capital on organisation performance
One of the key elements in the study objectives(s) is to analyse the impact of Working
Capital on an organisation’s performance. According to Banos-Caballero, Garcia-Terfel
and Martinez-Solano (2013), writing on the impact of Working Capital on organisational
performance in their study on non-financial UK companies, there are various
explanations for the incentives of firms to hold positive Working Capital. Firstly, a
higher investment in extended trade credit and inventories might increase corporate
performance for several reasons: larger inventories can reduce supply costs and price
fluctuations and prevent interruptions in the production process and loss of business due
22
to scarcity of products. They also allow firms better service for their customers and
avoid high production costs arising from high fluctuations in production.
Secondly, granting trade credit, on the other hand, might also increase a firm’s sales,
because it can serve as an effective price cut, it encourages customers to acquire
merchandise at times of low demand; it strengthens long-term supplier-customer
relationship; it allows buyers to verify product and services quality prior to payment. It
also reduces the asymmetric information between buyer and seller.
Also, Deloof (2003), on the impact of Working Capital and organisational performance,
suggest that, trade credit is an important supplier selection criterion when it is hard to
differentiate products. Trade credit is more profitable short-term investment than
marketable securities Working Capital may also act as a stock precautionary liquidity,
providing insurance against future short falls in cash and demonstrate that a firm may
obtain important discounts for early payments when it reduces it supplier financing.
Again, Banos-Cabollero et al., (2013), on possible adverse effect of investment in
Working Capital Management which may lead to a negative impact on firm value and
(performance) at certain Working Capital levels. Firstly, keeping stock available
supposes costs such as warehouse rent, insurance and security expenses, which tend to
rise as the level of inventory increases. Secondly, since a greater Working Capital level
indicates a need for additional Capital, which firms must finance, if involves financing
costs and opportunity costs. On the one hand, companies that hold a higher Working
Capital level also face more interest expenses as a result and, therefore, more credit risk.
23
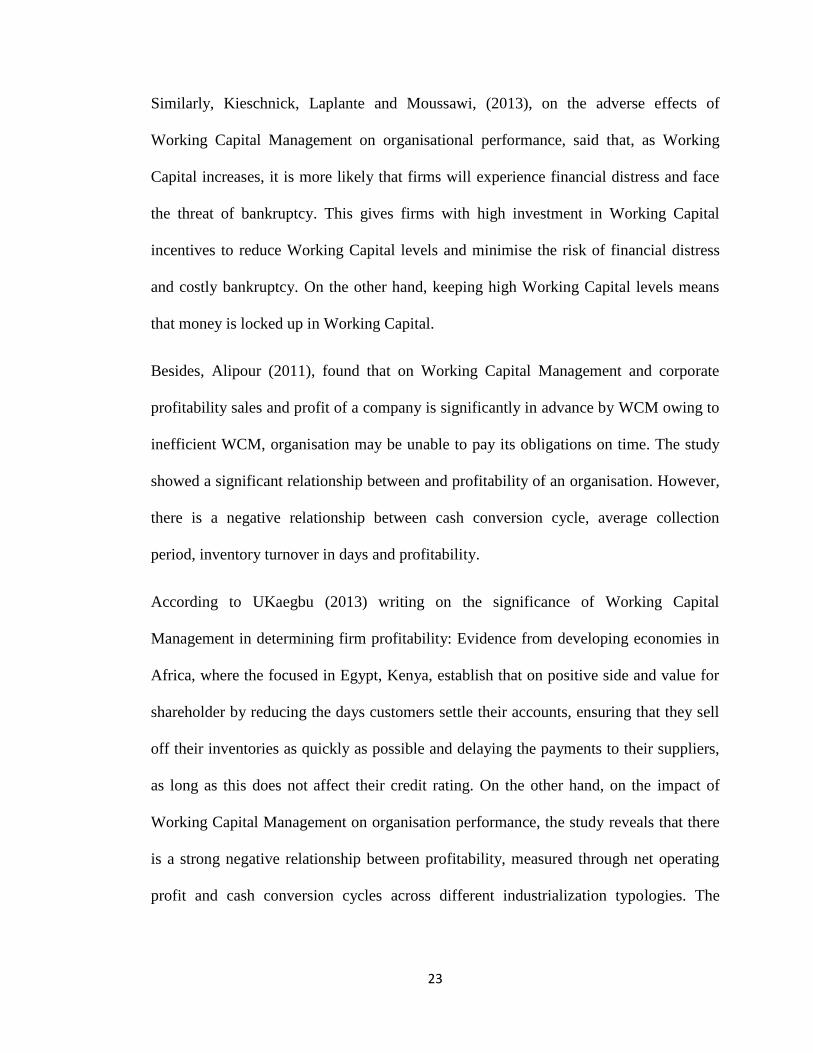
Similarly, Kieschnick, Laplante and Moussawi, (2013), on the adverse effects of
Working Capital Management on organisational performance, said that, as Working
Capital increases, it is more likely that firms will experience financial distress and face
the threat of bankruptcy. This gives firms with high investment in Working Capital
incentives to reduce Working Capital levels and minimise the risk of financial distress
and costly bankruptcy. On the other hand, keeping high Working Capital levels means
that money is locked up in Working Capital.
Besides, Alipour (2011), found that on Working Capital Management and corporate
profitability sales and profit of a company is significantly in advance by WCM owing to
inefficient WCM, organisation may be unable to pay its obligations on time. The study
showed a significant relationship between and profitability of an organisation. However,
there is a negative relationship between cash conversion cycle, average collection
period, inventory turnover in days and profitability.
According to UKaegbu (2013) writing on the significance of Working Capital
Management in determining firm profitability: Evidence from developing economies in
Africa, where the focused in Egypt, Kenya, establish that on positive side and value for
shareholder by reducing the days customers settle their accounts, ensuring that they sell
off their inventories as quickly as possible and delaying the payments to their suppliers,
as long as this does not affect their credit rating. On the other hand, on the impact of
Working Capital Management on organisation performance, the study reveals that there
is a strong negative relationship between profitability, measured through net operating
profit and cash conversion cycles across different industrialization typologies. The
24
negative association implies that, when the cash conversion cycle increases, the
profitability of the firm declines.
Also, Organdie (2012), an analysis of Nigerian companies showed that, a well designed
and implemented WCM is expected to contribute positively to the creation of
organisations value.
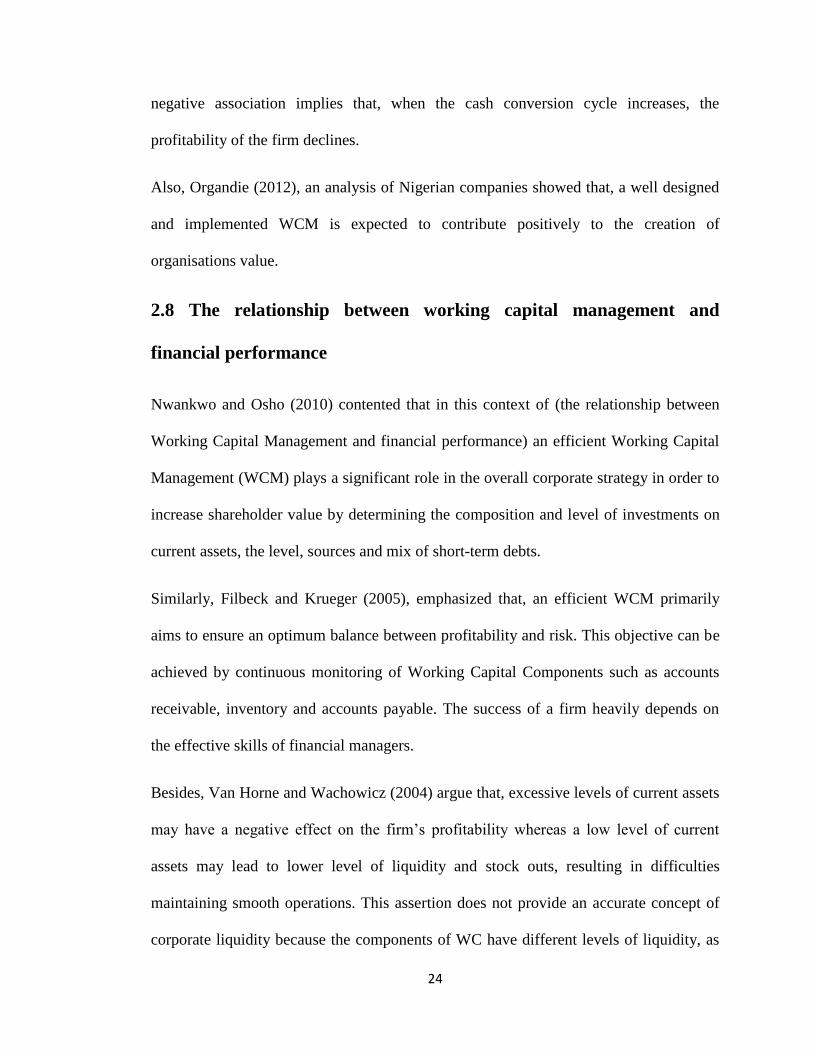
2.8 The relationship between working capital management and
financial performance
Nwankwo and Osho (2010) contented that in this context of (the relationship between
Working Capital Management and financial performance) an efficient Working Capital
Management (WCM) plays a significant role in the overall corporate strategy in order to
increase shareholder value by determining the composition and level of investments on
current assets, the level, sources and mix of short-term debts.
Similarly, Filbeck and Krueger (2005), emphasized that, an efficient WCM primarily
aims to ensure an optimum balance between profitability and risk. This objective can be
achieved by continuous monitoring of Working Capital Components such as accounts
receivable, inventory and accounts payable. The success of a firm heavily depends on
the effective skills of financial managers.
Besides, Van Horne and Wachowicz (2004) argue that, excessive levels of current assets
may have a negative effect on the firm’s profitability whereas a low level of current
assets may lead to lower level of liquidity and stock outs, resulting in difficulties
maintaining smooth operations. This assertion does not provide an accurate concept of
corporate liquidity because the components of WC have different levels of liquidity, as
25
some of the components (for example cash investment in marketable securities and
treasury bills) have financial essence with a high liquidity. Other components have non –
financial essence with a low liquidity (for example receivable, payable accounts and
inventory).
The above sources are significant to this study as various authors from their findings in
different continents and countries helped the researcher to construct the questionnaire.
This helped to establish if these elements supported the case for and against submissions
on the impact of Working Capital Management on organisational performance in
CENORED in Namibia.
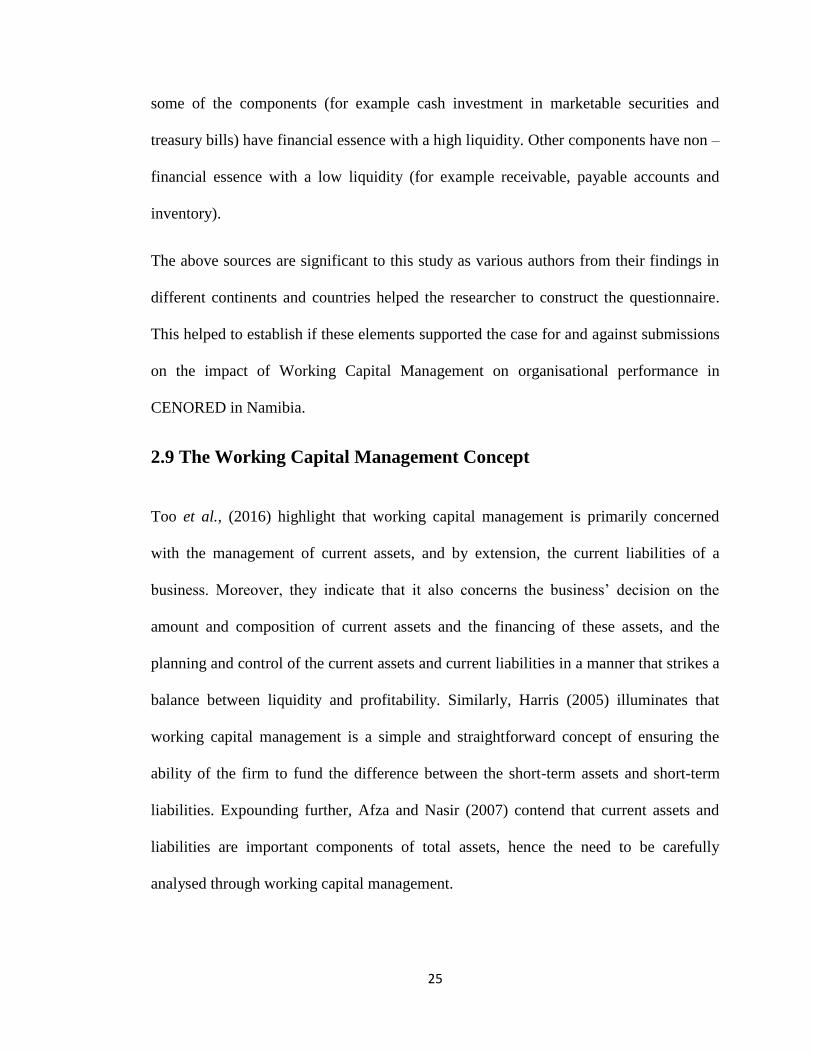
2.9 The Working Capital Management Concept
Too et al., (2016) highlight that working capital management is primarily concerned
with the management of current assets, and by extension, the current liabilities of a
business. Moreover, they indicate that it also concerns the business’ decision on the
amount and composition of current assets and the financing of these assets, and the
planning and control of the current assets and current liabilities in a manner that strikes a
balance between liquidity and profitability. Similarly, Harris (2005) illuminates that
working capital management is a simple and straightforward concept of ensuring the
ability of the firm to fund the difference between the short-term assets and short-term
liabilities. Expounding further, Afza and Nasir (2007) contend that current assets and
liabilities are important components of total assets, hence the need to be carefully
analysed through working capital management.
26
Moreover, Smith (1980) equally argues that because of their importance, a careful and
systematic investigation of these assets is necessary as they play a vital role in the
profitability of firms, its risk and value. Thus, Too et al., (2016) accentuate that the goal
of the working capital management process is to ensure that a firm is able to continue its
operations with sufficient cash flow to satisfy both maturing and short-term debts, and
also upcoming operational expenses. Its decisions are purportedly based on cash flows
and profitability. Lamberson (1995) also equally propagates that working capital
management involves the planning and controlling of current assets and liabilities in a
manner that eliminates the risk of inability to meet short-term obligations and avoid
excessive investments in assets.
Ching et al., (2011) exhibit the importance of working capital management by declaring
that when implemented efficiently and effectively, it can create a business’ true
competitive advantage. Arguing likewise, Joshi (1994) proclaims that working capital
management is a sensitive area in the field of financial management, as in line with
Horne and Wachowicz (2000)’s opinions, if it is not enough, shortages and problems in
the day-to-day operations may arise. Furthermore, Too et al., (2016) correspondingly
contend that working capital management is a very important component of corporate
finance because it directly affects the liquidity, profitability and growth of a business.
Moreover, Atrill (2006) stresses that working capital management is also important to
the financial health of businesses of all sizes, as the amounts invested in working capital
are often high in proportion to the total assets employed.
This management of short-term assets is regarded as important as the management of
long-term financial assets, since it directly contributes to the maximization of a business
27
profitability, liquidity and total performance. Moreover, several researchers like Padachi
(2006) and Kotut (2003) established that the efficient management of working capital is
pivotal to the health and performance of all business enterprises, hence, they recommend
firms to employ the use of efficient working capital management practices as a strategy
of improving their value.
According to Too et al., (2016), the investigation on the working capital management
practice is focused on four paradigms that include cash management practices,
receivables management practices, inventory management practices and the
management of current liabilities. Hence, Duah (2015) alludes that the key to
understanding a company’s working capital cycle is to know where payments are
collected and made, and to identify areas where the cycle is stretched and can potentially
be reduced. Since most studies have generally dwelt on the importance of working
capital management in enhancing company profitability and liquidity, these concepts are
elaborated on further.
2.10 The Liquidity Concept
Liquidity can be understood in terms of cashflows as opposed to stocks, and thus, it
refers to the unhindered cashflows among the agents of the financial system, with a
particular focus on cashflows among the central bank, commercial banks and markets.
However, Williamson (2008) views liquidity as the ability to realize these cashflows.
Also, the Farlex Financial Dictionary (2012) defines liquidity as a large position in cash
or in assets that are easily convertible to cash. Priya and Nimalathasan (2014) perceive
liquidity from a purely accounting perspective, and state that it means how quickly an
28
asset can be transformed into cash. When referring to company liquidity, it signifies its
ability to meet its current liabilities, and is usually measured by different financial ratios
(www.investorwords.com). Bhunia (2010) consequently highlights that the study of
liquidity is of major importance to both the internal and the external analysts because of
its close relationship with day-to-day operations of a business.
Ware (2015) equally contends that liquidity is a necessity for the survival of the firm,
further underscoring that in the contentious comparison of liquidity with profitability,
liquidity gets higher priority because no firm will continue to exist if it has no liquidity.
Thus, as Agarwal and Mishra (2007) allude, firms which do not make profit may be
treated as under par but not having liquidity may cease to operate over a period.
According to Panigrahi (2013), when there is a poor management of working capital,
funds may be unnecessarily tied up in idle assets, consequently reducing the liquidity of
the company and the inability to invest in productive assets like plant and machinery.
Thus, the existence of an adequate liquidity and its careful management can make
substantial difference between the success and failure of an enterprise. Bhunia (2010)
similarly stresses that liquidity plays a significant role in the successful functioning of a
business firm, which should thus ensure that it does not suffer from lack-of or excess
liquidity to meet its short-term compulsions.
According to Brealey (2012), liquidity can be expressed in terms of liquidity ratios
namely current ratio, quick (acid test) ratio and cash ratio. Current ratio is the ratio of the
current assets to the current liabilities, which measures the margin of liquidity. The rapid
29
decreases in the current ratio sometimes signify trouble, but can also be misleading.
Ngwili (2013) and Brealey (2012) also identify another liquidity ratio, the quick (acid
test) ratio, which is an indicator of a company’s short-term liquidity and is calculated as
current assets net of inventories divided by current liabilities. Thus, it measures a
company’s ability to meet its short-term obligations with its most liquid assets that
exclude inventories. Ngwili (2013) further highlights that the higher the quick ratio, the
better the company's liquidity position and vice versa.
Another liquidity ratio identified by Brealey (2012) is the cash ratio, which is the ratio of
a company's total cash and cash equivalents to its current liabilities. The cash ratio is
most commonly used as a measure of company liquidity. Ngwili (2013) alleges that a
company’s most liquid assets are its holdings of cash and marketable securities, and that
is why analysts also look at the cash ratio to determine how quickly it can repay its
short-term debt. Thus, a strong cash ratio is useful to creditors when deciding how much
debt, if any, they would be willing to extend to the asking party.
2.11 Central bank liquidity
Central bank liquidity is the ability of the central bank to supply the liquidity needed to
the financial system. Bindseil (2005) underscores that it is usually measured as the
liquidity supplied to the economy by the central bank, specifically the cash flows of
monetary base from the central bank to the financial system. It relates to the central
bank’s operations liquidity, which refers to the amount of liquidity provided through
central bank auctions to the money market according to the monetary policy stance.
Therefore, the central bank provides liquidity equal to the sum of the autonomous
30
factors plus the reserves. Also, the central bank manages its market operations so that
the inter-bank short-term lending rates remain closely aligned to the target policy rate.
2.12 The Profitability Concept
According to Nimalathasan (2009), profit is the primary objective of a business, which is
an absolute measure of earning capacity. Profit is defined as the excess of return over
outlay (Iyer, 1995). In point of view of the heavy investment which is obligatory for the
success of most enterprises, profit in the accounting sense tends to become a long-term
objective which measures not only the success of the product, but also of the
development of the market for it (Nishanthini and Nimalathasan, 2013). Profit is
determined by matching revenue against cost associated with it, and only those costs are
placed against revenue. Nimalathasan (2009) also promulgates that additional profit is
the report card of the past, and the inventive gold star for the future.
Profitability is also regarded as the ability of a given investment to earn a return from its
use, and is the relative measure of earning capacity (Nishanthini and Nimalathasan,
2013; Nimalathasan, 2009). It thus provides evidence concerning the earnings potential
of a company and how effectively a firm is being managed. If the firm fails to make
profit, the capital invested is eroded, and if this situation is prolonged the enterprise
ultimately ceases to exist. Consequently, Bindseil (2005) suggests that profitability
shows how efficiently management can make profits by using resources availed to them
in the market. Moreover, Harvard & Upton (2001) highlight that profitability is the
ability of a given investment to earn a return from its use. However, Smith (1953) is of
the view that profitability is not synonymous with efficiency, but rather an index of
31
efficiency, which is thus regarded as a measure of efficiency and management’s guide to
greater efficiency. Profitability measures profit generated from the business and is
measured in percentage terms, for example as a percentage of investments, sales, or
assets. According to Gitman (2002), high percentages of profitability play a vital role in
bringing external finance to the business because creditors, investors and suppliers do
not hesitate to invest in such a company. Also, enhanced resources utilization leads to
value creation, which is pursued by most investors.
Profitability is measured through profitability ratios, and according to Brealey (2012),
they include the Net profit margin, Return On Assets (ROA), Return On Equity (ROE)
and pay-out ratio. The net profit margin calculated as net income divided by revenues, or
net profits divided by sales measures the proportion of sales that finds its way into
profits. Ngwili (2013) highlights that profit margin is very useful when comparing
companies in similar industries, as a higher profit margin indicates a more profitable
company that has better control over its costs compared to its competitors. Furthermore,
the return on assets ratio is calculated by dividing a company's annual earnings by its
total assets, which measures the performance of the firm and also an indicator of how
profitable a company is relative to its total assets (Brealey, 2012). According to Ngwili
(2013), ROA gives an idea as to how efficient management is at using its assets to
generate earnings. Thus, the higher the ROA number, the better, because the company is
earning more money on less investment.
According to Brealey (2012), the Return on equity ratio is calculated as net income
divided by shareholders equity, measuring a corporation's profitability by revealing how
32
much profit a company generates with the money shareholders have invested. Ngwili
(2013) further underscores that ROE is useful for comparing the profitability of a
company to that of other firms in the same industry. The other important profitability
ratio is the Pay-out ratio, which is calculated as dividends divided by earnings,
measuring the proportion of earnings that are paid out as dividends. Ngwili (2013)
further notes that the pay-out ratio is a key financial metric used to determine the
sustainability of a company’s dividend payments, as a lower pay-out ratio is generally
preferable to a higher pay-out ratio. Managers don’t like to cut dividends if there is a
shortfall in earnings.
2.13 Working Capital Management Models
There are several working capital management theories that form part of available
literature, and these are discussed in detail below.
i) The Trade-Off Model
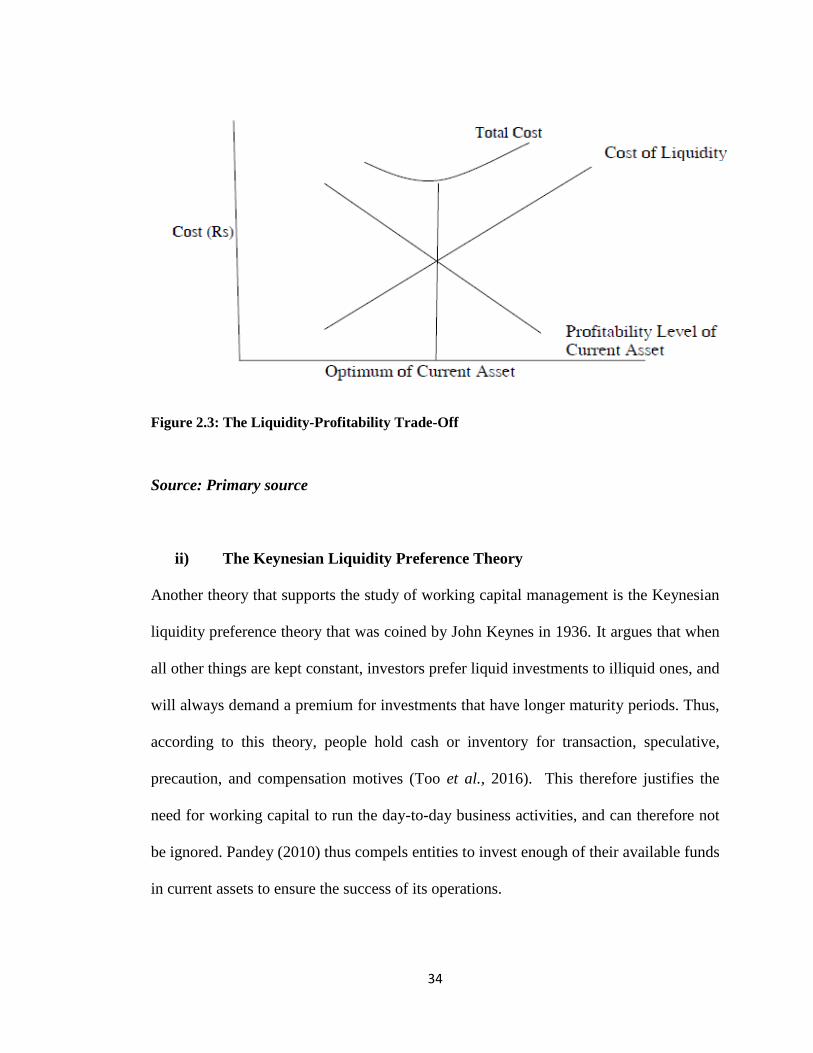
Too et al., (2016) assert that the Trade-off model demonstrates that firms decide their
optimal level of cash holding by comparing the marginal cost and benefits of holding
cash. Thus, any change in working capital management in a business will influence
either liquidity or profitability. This is observed by Harvard& Upton (2001), who
contend that working capital management is a razor edge exercise for financial managers
of an enterprise, as they have to take decisions carefully to ensure that the firm’s twin
objectives of profitability and solvency are not affected. In addition, Bindseil (2005)
notes that if a firm maintains a huge amount of current assets, its profitability will be
affected although it protects its liquidity, which is also the case if a firm maintains low
current assets that weaken liquidity whilst enhancing profitability. Echoing, Van Horne
33
and Wachowicz (2000) emphasize that excessive levels of current assets can easily
result in a firm realizing a substandard return on investment, whilst firms with too few
current assets may incur shortages and difficulties in maintaining smooth operations.
Also reinforcing these arguments, Too et al., (2016) promulgate that preserving liquidity
and profitability of the firm is an important objective, as increasing profit at the expense
of liquidity can bring serious problems to the firm and vice-versa.
Consequently, Too et al., (2016) further recommend firms to diligently invest in
working capital management as it directly affects the liquidity and profitability of a firm.
Moreover, since the ultimate objective of any firm is to maximize shareholders wealth,
which can be achieved through profit maximization, a firm that wishes to accomplish
this goal must strike a balance between current assets and current liabilities, thus
keeping abreast of the liquidity and profitability trade-off (Too et al., 2016). This trade-
off between liquidity and profitability is shown in Figure 2.3. In short, if a company
does not care about profit, it cannot survive for a longer period, whilst if it does not care
about liquidity, it may face the problem of insolvency or bankruptcy. However, for some
scholars, liquidity plays a more important role because a company with low liquidity
purportedly has a better capacity to serve the economy than a company without liquidity
(Chatterjee, 2012)
34
Figure 2.3: The Liquidity-Profitability Trade-Off
Source: Primary source
ii) The Keynesian Liquidity Preference Theory
Another theory that supports the study of working capital management is the Keynesian
liquidity preference theory that was coined by John Keynes in 1936. It argues that when
all other things are kept constant, investors prefer liquid investments to illiquid ones, and
will always demand a premium for investments that have longer maturity periods. Thus,
according to this theory, people hold cash or inventory for transaction, speculative,
precaution, and compensation motives (Too et al., 2016). This therefore justifies the
need for working capital to run the day-to-day business activities, and can therefore not
be ignored. Pandey (2010) thus compels entities to invest enough of their available funds
in current assets to ensure the success of its operations.
35
iii) The Aggressive Theory
According to Too et al., (2016), the aggressive theory is applied where the firm plans to
assume high risk, and also where short term funds are used to a very high degree to
finance current and fixed assets. This approach is purportedly characterized by low
interest rates. However, Too et al., (2016) further proclaims that it is important to note
that that the risk associated with short term debt is higher than long term debt, which
applies mostly to companies/ firms operating in a stable economy and is quite certain
about future cash flows. Thus, a company with an aggressive working capital policy
offers short credit periods to customers, holds minimal inventory and has a small amount
of cash in hand. This policy in the end increases the risk of defaulting due to the fact that
a company might face lack of resources to meet its short-term liabilities, but however
gives a high return as it is associated with high risk.
Robles (2016) also highlights that in the aggressive working capital policy, the working
capital management policy assumes more risk, implying a lower investment in working
capital accounts which also means lower levels of inventories, the shortening of trade
credit to customers and also the postpone payment to suppliers. This policy thus means
greater profitability and also a greater risk for companies. This inverse relationship
between working capital management and profitability is proved through the studies of
Hager (1976), where the researcher postulates that firms holding lower levels of working
capital accounts tend to reduce the cost of holding unproductive assets, such as
marketable securities. In a contrary direction, these firms allegedly tend to increase their
payables, thus reducing the company’s financing needs.
36
iv) The Agency Cost of Free Cash Flow Theory
The agency cost of free cash flow theory was put forth by Michael Jensen in 1986, and
brings out the fact that organisations suffer agency costs as a result of free cash flow as
managers are always tempted to pile up cash under their control and make investment
decisions which might not be in the best interest of shareholders (Too et al., 2016).
These corporate managers are regarded as the agents of shareholders, a relationship that
is often weighed down by conflicting interests. Jensen (1986) thus highlights that free
cashflow is cash in excess of that required to fund all projects that have positive net
present values when discounted at relevant cost of capital. Thus, efficient working
capital management is essential in order to avoid situations whereby managers
mismanage the resources of the organisation for their own interests (Too et al., (2016).
2.14 Conceptual Framework
In light of the highlighted challenges being faced in the Namibian electricity distribution
sector that include poor infrastructural investments, low industry capacity utilisation and
the general shortage of the commodity which leads to reliance on imports, among others,
the study has adopted a conceptual framework that is explained henceforth and
diagrammatically illustrated in Figure2.4. By employing the working capital
management practices of cash management, inventory management, receivables
management and payables management, CENORED (Pty) Ltd will realise
improvements in its cashflows, that is liquidity. Improved liquidity will enable the
company to smoothen its operations as it will be able to timeously honour its obligations
to creditors. The ability to promptly pay obligations like loan interests to banks will help
the company to create a good reputation for itself, and hence become more creditworthy.
37
Moreover, maintaining good relations with other suppliers will enable the company to be
granted favourable terms of payment that will be essential in improving its liquidity.
Also, the ability to negotiate favourable terms for its payables will improve its liquidity
further.
Working capital management also stresses on the adoption of receivables management
techniques that include the aggressive management of debtors. This effective
management of debtors will enable CENORED to timeously collect payments from its
debtors, which will improve its liquidity. Moreover, working capital management
encourages companies to shorten their collection periods, which is also an excellent
technique for improving company liquidity. Hence, the ability of the company to invest
in further essential infrastructure and also in improving the capabilities of its workforce
will enable CENORED to improve its capacity utilisation, and consequently its sales. A
competitive workforce will also be able to explore new markets for the company to
serve, thus increasing revenues further.
Improved sales will also mean improved profits for CENORED, which essentially
equates to improved shareholder value and more capital available for further investments
into the company, particularly innovations like the smart grid and smart meters
highlighted elsewhere in the chapter. This will enable the company to conveniently serve
today’s sophisticated customers, who are particular about tailor made services will make
CENORED an electricity supplier of choice. Moreover, the ability of the company to
create value for its customers will enable it to attract more investors for further growth.
As CENORED’s performance improves as highlighted above, its success will spill over
into the Namibian economy at large. For example, the industry has purportedly been
38
affected by electricity shortages, thus its improved availability will mean increased
capacity utilisation. This will also mean more jobs for the citizens and their improved
livelihoods. Also, increased electricity production capacity also implies that the nation
will cease to rely on imports, thus correcting the balance of trade position. This is also
the same with increased production in industry, which means that the country will
become more self-reliant in production, and able to export an assortment of excess
products to other countries.
The presence of a thriving industry in Namibia also means that the economy will earn
more from corporate taxes, thus improving its fiscal position. Furthermore, critical
sector that are heavily reliant on electricity like health will also thrive, thus improving
the population’s livelihoods in general. This, coupled with reduced unemployment levels
as the people get access to more jobs will also result in improved GDP per capita, that
improve the country’s economic position at regional and international level.
39
2.15 Empirical Evidence.
On theoretical framework and empirical studies on Work Capital Management in
organization(s) Van Horne and Wachowicz (2004) said that, firms manage Working
Capital using three approaches: conservative Aggressive and Moderate models. The
conservative approach is where firm tends to use mostly long-term sources of finance for
its operations and use short-terms sources in urgent circumstances. On the other hand,
the aggressive approach is having fewer current assets- for example, cash, inventories
and trade receivables in proportion of total assets. This may lead to liquidity.
Again, Van Horne and Wachowicz (2004), a moderate approach trends between the
aggressive and conservative approaches a moderate approach makes a distinction
between fluctuating current assets and permanent current assets with the suggestion that
short term sources of finance should be used to finance fluctuating current assets.
Likewise, long –term source of finance should be used to finance should be used to
finance permanent current assets. However, it is important to note that working capital
management policies need to consider the nature of the company because different
businesses will have different Working Capital Management requirements.
Mona (2012) investigated the impact of aggressive and conservative policies on 57
Jordanian firms’ profitability and value between 2001 and 2009. Measuring conservative
policy as the level of current assets relative to total assets, he found the ration to be 0.49
and the regression method of estimation that follow an aggressive investment policy
using long-term investment have a negative effect on firm profitability and value.
Although their sample size was small, similar findings were found by Afza and Nazir
(2007).
40
Again, Afza and (2007) investigated the relationship between the aggressive and
conservative Working Capital policies for 17 industrial groups and a large sample of 263
public limited companies listed on the Karachi Stock Exchange (KSE) using cross-
sectional data for the period 1998-2003. Using analysis of Variance (ANOVA) and the
least significant difference (LSD) test, the study found significant differences among
their Working Capital investment and financial policies across different industries
moreover, rank order correlation confirmed that these insignificant differences were
remarkably stable over the six-year study period. Finally, ordinary least regression
analysis indicated a negative relationship between the profitability measures of firms and
the degree of aggressiveness of Working Capital investment and financing policies. The
implication of the two studies is that firms should pay greater attention to their liquidity
position. This involves having sufficient cash because poor cash management may land
a firm in financial trouble as it will not be able to pay its current bills and eventually the
firm may face technical insolvency in the short run. In the long run, bankruptcy may
result if poor cash management persists.
Also, Ukaegbu (2013) investigated, 102 firms in Africa specifically firm Egypt, Nigeria,
Kenya and South Africa 20 each from 3 countries and 42 from South Africa. The most
recent period for this investigation is 2005-2009. This selection was based on
indications, African countries are divided into five groups: forerunners; achievers;
catching up: falling-behind and infant stage according to UNCTAD (2011). The chosen
countries are classified as: forerunners (Egypt); achievers (South Africa); and falling
behind (Kenya and Nigeria) respectively.
41
The study using moderate model, the independent working capital variables include
number of days accounts payable, number of day inventories, the number of days
accounts receivables and cash conversion cycle. Taking accounts payable as a proxy to
determine the firms’ payment policy to its suppliers. It is computed as (accounts payable
X 360)/ cost of sales. Also we take number of days inventories to determine the firms’
inventory policy. It is calculated as (inventories X 360) / cost of sales. In addition, the
study determined the firms’ collection policy as a proxy of the number of days accounts
receivable. It is computed as (accounts receivable X 360)/ turnover. Besides, in order to
check whether one regression is sufficient for each country, chow test to test for
structural stability across the four countries. There is no suggestion of any presence of
structural break or instability.
The results showed that with descriptive statistics of 102 non-financial firms across
Egypt, Kenya, Nigeria and South Africa for a period of five years from 2005 to 2009, it
reveals firms in Kenya are more profitable, with a mean of 40% then the peer firms in
other countries in our sample. This is despite the fact that Kenya is ranked behind South
Africa and Egypt in terms of industrialisation level. However, there are some firms in
South Africa and Egypt which more profitable with a maximum gross operating profit of
68% and 56% respectively. Finally, the findings established that, 13-day Cash
Conversion Cycle for firms in Kenya which indicates how efficient they are managing
Working Capital compared with firms in Egypt.
The study intended to establish the Working Capital Managements impact in an
organization. The empirical evidence from various countries including Africa states is
42
significant to the study as; the issues raised in the findings are Occurrences in
CENORED in Namibia, which was used as a cased study.
2.16 Research Gap
The Namibian government has put in place various policies such as the white paper on
energy (1998), ESI restructuring (2000), Single buyer market design (2002), Electricity
Act (2007) and the National development plan (2008) to eliminate electricity supply
gaps. However, these policies are failing to address the persistent electricity scarcity,
which according to Robinson (2013) can be attributed to lack of generation capacity to
supply power to grid-connected regions, the absence of proper grid infrastructure to
deliver this power and also regulatory impediments to providing steady revenue to
maintain and invest in new generation capacity. Thus, as Alagh (2013) alludes, these
challenges that have led to an acute electricity crisis in Namibia, have also resulted in a
severe financial strain in the sector at large. Also, the highlighted challenges, coupled
with the lack of systematic planning in the power distribution sector have resulted in a
system with high transmission and distribution losses (averaging 18%), implying that the
sector cannot be viable and self-sustaining (Davidson and Mwakasonda, 2003).
Considering the above, the researcher proposes the adoption of working capital
management, an activity that is espoused as an indispensable element in the analysis of a
firm’s performance while conducting day-to-day operations. Moreover, researchers like
Padachi (2006) and Kotut (2003) established that the efficient management of working
capital is pivotal to the health and performance of all business enterprises, hence, they
recommended for firms to employ the use of efficient working capital management
practices as a strategy of improving their value. However, the study of working capital
43
management has generally been overlooking the public utilities sector, as the majority of
available studies mainly focused on listed companies (for example Nyakundi, 2003;
Mathuva, 2009; Gill, Biger and Mathur, 2010; Zawaira and Mutenheri, 2014) and
manufacturing companies (for example Ghosh and Maji, 2003; Singh and Pandey, 2008;
Ngendakumana et al., 2015).
Moreover, there are a few studies that focus on the impact of working capital
management on the performance of the electricity distribution sector, in particular, for
example Leon (2013); Azhar (2015); Dilli et al., (2016) among others, that reveal a
conspicuous scarcity of literature on the Namibian electricity distribution sector’s
practice of working capital management. Available studies on the Namibian electricity
distribution sector have mainly focused on sector reforms, for example World Bank
(2005), Anderson (2006), USAID (2018); energy development (PWC, 2013; Rama,
2014; Manyando, 2016). However, providing a closer research to this study, an Econ
One Research (2002) looked at the Namibian electricity distribution sector focusing on
Northern Electricity Distribution Company’s role on rural infrastructure development.
Also providing another almost similar study, Amadhila (2017) focused on the impact of
working capital management on Namibian state-owned enterprises in general. Therefore,
no available study has specifically focused on the impact of working capital
management on the CENORED (Pty) Ltd.’s liquidity and profitability. This is the gap
that the study aims to fill.

44
2.17 Chapter Summary
The chapter provided literature of past studies by various researchers on the study’s
subject area. The background of the study, theoretical and empirical evidence and also
the conceptual framework was highlighted and the research gap was identified. The next
chapter will focus on the Research Methodology employed in conducting the study.
45
CHAPTER THREE
RESEARCH METHODOLOGY
3.1 Introduction
This chapter covers a discussion on the research methods and strategies that were used
in carrying out this study. This covered the research philosophy, research design,
research population, sample techniques, sample size, research instrument and issues such
as validity of the research and ethics among other issues. It also covered the justification
for the study and beneficiaries of the study. The chapter concludes by presenting the
chapter summary.
3.2 Research Philosophy
The research philosophy used in this chapter was the positivism philosophy. Likewise,
the research philosophy is defined as the belief regarding the way data in the study was
gathered, analysed and used by the researcher as noted by Zikmund et al., (2013). In
fact, positivism philosophy states that knowledge is based on natural phenomena and
their properties and relations. Thus, positivism research philosophy is popular and
widely used in studies that have causal relationship analysis according to Bryman & Bell
(2015). Consequently, this study is more inclined to the positivism philosophy, hence the
reason why positivism was incorporated in this study. Similarly, the researcher used
positivism philosophy because he was seeking facts (positivism) from the target
respondents on the significance of working capital management with the study focusing
on Central Northern Electricity Distribution Company (CENORED) (Pty) Ltd of
46
Namibia. Furthermore, the philosophy of positivism was used in this study because it
requires that the researcher assumes the position of a natural scientist who develops
hypotheses that will be tested and confirmed, making use of facts instead of impressions
(Saunders et al., 2009). For that reason, the researcher developed a hypothesis which
was tested using factual collected data from the officials of Central Northern Electricity
Distribution Company (CENORED) (Pty) Ltd. In addition, the literature, further show
that positivists take a controlled and structural approach in conducting research
(Churchill, 1996; Carson et al.,, 2001; Kaboub, 2008) by identifying a clear research
topic as was the case in this study, constructing appropriate hypotheses and by adopting
a suitable research methodology which was accordingly done efficaciously in this study
as noted by Churchill (1996), Carson et al., (2001) and Kaboub (2008).
3.3 Research Design
A case study research design was used in conducting this study. Thus, a research design
is a master plan of the research that specifies how the study will be carried out and it
indicates the methods that were used to collect and analyse data during a research
(Bryman & Bell, 2015). Furthermore, Burns and Grove (2003) define a research design
as a blueprint for conducting a study with maximum control over factors that may
interfere with the validity of the findings. In addition, Parahoo (1997), Sharjahan (2005)
and Saunders et al., (2007) indicate that a research design is an operation or plan that
stipulates the kind of information that is to be collected, from what source, using what
kind of procedure and also how it will be analysed. Additionally, Polit et al., (2001)
posit that a research design is the researcher’s overall strategy that enables him or her to
47
answer the research question or testing the research hypothesis, whilst Denzin and
Lincoln (2011) simply recognize it as a strategy of inquiry.
George and Bennet (2005); Yin (2009); Rose et al., (2015) view the case study research
design that was used to conduct this study as an empirical inquiry that investigates a
contemporary phenomenon within its real-life. The case study approach facilitated the
investigation of contract farming within the Zimbabwean context (Munyoro et al.,
2017), to enable the establishment of its contribution to agricultural development.
Cresswell (2014), additionally, indicates that case studies are a design of inquiry found
in many fields especially evaluation, in which the researcher develops an in-depth
analysis of a case, often a program, event, activity, process, or one or more individuals.
Accordingly, working capital management was the program that was evaluated in this
study through the in-depth analysis of the significance of working capital management
in the Central Northern Electricity Distribution Company (CENORED) Pty Ltd of
Namibia.
Furthermore, the case study design enabled the incorporation of the views of the
officials of the Central Northern Electricity Distribution Company (CENORED) (Pty)
Ltd of Namibia without the researcher influencing their attitudes, whilst permitting the
exploration of behavioural patterns as argued by Yin (2009). Additionally, the case
study design through the explanatory strategy offered in-depth details and understanding
of the various impacts of independent variables to dependent variables in the study
(Ihuah and Eaton, 2013).
48
3.4 Population
In carrying out a research, the researcher must be able to define the study population
before sampling can be done (Cooper, et al., 2006). The reason for this is that the
characteristics of the population determines the sample size, sampling frame and
sampling methods to be employed in drawing the sample for study. For example, census
can be used where the population is too small to use a sample. The reason for the need to
have a better understanding of the population is to make sure that the sample that will be
used in a research is a true representation of the population. Thus, Parahoo (1997)
defines population as the total number of units from which data can be collected such as
individuals, artefacts, events or organisations. Whereas, Burns and Grove (2003) define
population as all the elements that meet the criteria for inclusion in a study.
Furthermore, a research population is seen as the totality of elements relevant to the
study (Cooper, et al., 2006), from which a sample can be drawn. Therefore, this study’s
population could be well-defined as all officials from the Central Northern Electricity
Distribution Company (CENORED) (Pty) Ltd of Namibia. In this case the population
for this study was made up of 101 officials. This comprised of staff from the following
units: Technical and Engineering (63), Corporate Services (15), Finance (20) and Office
of the Chief Executive Officer (3).
3.5 Sample size
A sample is defined as a finite part of a statistical population whose properties are
studied to gain information regarding the whole environment Webster (1985).
Furthermore, Polit et al., (2001) and Tailor (2005) basically deduced a sample as a
fraction or subgroup of a population indicated above, whereas Fridah (2002) regards it
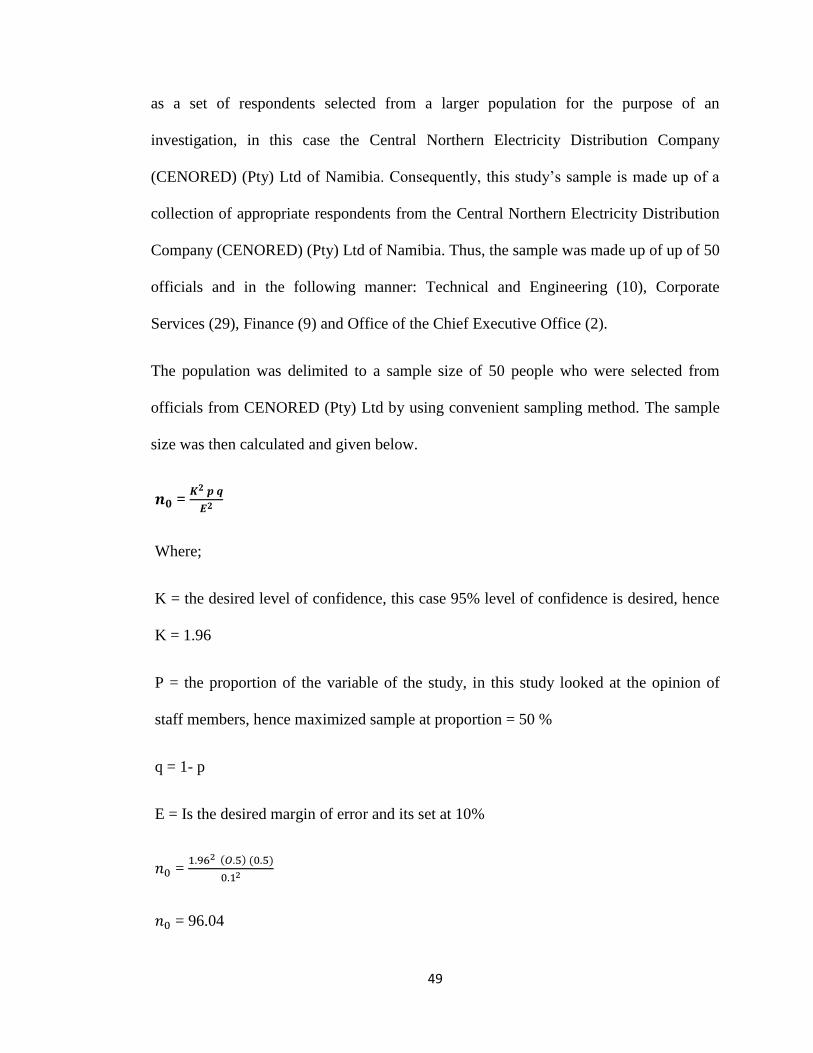
49
as a set of respondents selected from a larger population for the purpose of an
investigation, in this case the Central Northern Electricity Distribution Company
(CENORED) (Pty) Ltd of Namibia. Consequently, this study’s sample is made up of a
collection of appropriate respondents from the Central Northern Electricity Distribution
Company (CENORED) (Pty) Ltd of Namibia. Thus, the sample was made up of up of 50
officials and in the following manner: Technical and Engineering (10), Corporate
Services (29), Finance (9) and Office of the Chief Executive Office (2).
The population was delimited to a sample size of 50 people who were selected from
officials from CENORED (Pty) Ltd by using convenient sampling method. The sample
size was then calculated and given below.
=
Where;
K = the desired level of confidence, this case 95% level of confidence is desired, hence
K = 1.96
P = the proportion of the variable of the study, in this study looked at the opinion of
staff members, hence maximized sample at proportion = 50 %
q = 1- p
E = Is the desired margin of error and its set at 10%
= ( ) ( )
= 96.04
50
Adjusting the sample to the population size 170 staff members
n = (
)
n = 96.04 (
)
n = 49.22
Therefore, the sample size is 50 persons
3.6 Sampling Procedure
Sampling is defined as the act, process, or technique of selecting a suitable sample, or a
representative part of a population for the purpose of determining parameters or
characteristics of the whole population as noted by Fridah (2009). This study adopted
the convenience sampling method, a non-probability sampling technique that is used on
the basis of convenience due to time, cost and other resource constraints as argued by
Dornyei (2007). Besides, convenience sampling also involves respondents who are
willing to participate in a study besides involving the drawing of samples that are easily
accessible (Teddlie and Yu, 2009), hence in this study, the choice of respondents was
based largely on their accessibility and willingness to participate in the study.
Additionally, the convenience sampling technique enabled the researcher to concentrate
on reachable, supportive and accommodating officials of the Central Northern
Electricity Distribution Company (CENORED) (Pty) Ltd of Namibia in order to
complete the study within the time limit stipulated in the university regulations.
51
3.7 Research Instruments
A research instrument is a tool used to collect data, which is designed to measure
knowledge, attitude and skills of respondents as noted by Parahoo (2007). This study
made use of questionnaires in collecting data from the officials of the Central Northern
Electricity Distribution Company (CENORED) (Pty) Ltd of Namibia. Accordingly, a
questionnaire is defined as a pre-formulated set of questions designed to gather
information from respondents to accomplish the goals of a research study as argued by
Sekaran and Bougie (2012). Additionally, a questionnaire is regarded as a data
collection instrument, which consists of a series of questions for the purpose of
gathering data from respondents (Abuwi, 2013). For the purpose of effectiveness, semi-
structured questionnaires that included both structured and non-structured questions
were used in this study. Saunders et al., (2009) and Cresswell (2014) suggest that the
reason for using non-structured questions was to further explain the phenomenon that
were limited by structured questions. Furthermore, questionnaires are seen as a very
convenient way of collecting useful and effective data from a large number of
individuals with limited effort and time which can produce valid and significant results
if the questions are clear, precise and are asked consistently across all respondents as
suggested by Mathers et al., (2009) and Sekaran and Bougie (2012). Furthermore,
questionnaires handle the issue of anonymity well, thus allowing respondents to give
unbiased answers without fear of victimization (Cresswell and Clark, 2011). It is
important to note that the researcher did test the questionnaire before it was used to
improve its reliability.
52
3.8 Sources of Data
There are two main sources of data collection in research namely: primary and
secondary sources (Zikmund, et al., 2013). A primary data source is that data that the
researcher gets as first hand from the study units. It is also defined as the source used by
the researcher for the specific purpose of the study and not for any other purposes. On
the other hand, secondary is data collected by the researcher that was initially collected
by other persons and for other purposes such as books, journals and articles. This study
made use of both primary and secondary sources of data. Primary data was collected
from the selected respondents. Secondary data was collected from textbooks, journals,
company records and various websites and this was used mainly in compiling the
study’s literature review.
3.9 Data Collection Procedure
In summary, the following is how the researcher collected the data for analysis in this
study and primary and secondary sources of data were used. Challenges and background
information was researched with published literature and this took into consideration
peer-reviewed articles, case studies and company reports. Secondary data was used to
analyse and evaluate the significance of working capital management in the Central
Northern Electricity Distribution Company (CENORED) Pty Ltd of Namibia.
Quantitative data was collected using structured questions in a questionnaire. Qualitative
information was collected through the non-structured questions of the questionnaire,
thus allowing for the study to take a mixed-methods approach to the research methods
and design even though it was biased towards positivism approach. The questionnaire
53
was distributed to the officials of the Central Northern Electricity Distribution Company
(CENORED) Pty Ltd of Namibia.
The researcher developed one questionnaire for all the officials from the Central
Northern Electricity Distribution Company (CENORED) Pty Ltd of Namibia. The
questions covered all the topics on the significance of working capital management in
the Central Northern Electricity Distribution Company (CENORED) Pty Ltd of
Namibia. In order to achieve a high response rate, the researcher administered the
questionnaire personally by hand delivering all the questionnaires. The researcher
collected the data for analysis after a 2-week period.
3.10 Data Analysis Techniques and Procedure
Two main data analysis processes were conducted on the quantitative data. Descriptive
statistics using the measures of central tendency and measures of variability, namely:
arithmetic means, variances and standard deviations were used. Correlation analysis and
regression analysis were also used to examine the significance of working capital
management in the Central Northern Electricity Distribution Company (CENORED) Pty
Ltd of Namibia. Statistical Package for the Social Sciences (SPSS) was used to analyse
quantitative data. Qualitative data was categorised according to a qualitative question in
the questionnaire and involved an iterative process in order to emerge with themes
(Seidel, 1998; Munyoro, 2014). The responses were coded in terms of certain subjects
and themes (Seidel, 1998; Gibbs, 2002; Munyoro, 2014). The researcher analysed the
meaning of the responses that were given in non-structured questions and linked them to
54
the research objectives and literature (Seidel, 1998; Gibbs, 2002; Munyoro, 2014). Each
research question was generated from the literature.
3. 11 Validity
Validity is a term that describes the extent to which an instrument measures what it
purports to measure (Zikmund et al., 2010). In short, legitimation is essential in any
study and refers to the difficulty in obtaining findings or making inferences that are
credible, trustworthy, dependable, transferable or confirmable as noted by Kimberlin and
Winterstein (2008) and Copper and Schindler (2011). Thus, in this study, the
employment of positivism was used to increase the confidence in the results that were
obtained (Abowitz and Toole, 2010) from the collection of the study. Consequently, the
use of short and straightforward questions that were strictly linked to the study’s
objectives, including crosschecking and verification and were also aimed at enhancing
the validity of findings of this study.
3. 12 Reliability
Reliability is the extent to which data collection techniques yield consistent results
overtime, implying that if the research instrument is used repeatedly it should yield the
same results (Saunders, 2009) and (Golafshani, 2003). In this study Cronbach’s Alpha
co-efficient was used to authenticate the questionnaire’s reliability. This scale
measurement tool is used to determine the internal consistency factor within and among
study variables (Hair et al., 2003). This study attained a 0.890 score which is above the
0.70 acceptable score.
55
3. 13 Ethical Considerations
This study was carried out under stringent ethical considerations. Research ethics are
referred to as the appropriateness of the behavior of the researcher in connection with
the rights of the enlisted respondents, subjects and those affected by the research work
(Saunders et al., 2009). Thus, research ethics includes the protection of participants from
any harm, informed consent, the right to privacy and confidentiality and also
professional conduct as noted by Choga and Njaya (2011). In this regard, the researcher
explained the purpose of the study to the respondents before handing over the
questionnaires and conducting focus group interviews, indicating that participation was
voluntary and that participants had the right to withdraw anytime they deemed fit as
suggested by Munyoro (2014) and respondents were assured of confidentiality and
anonymity (Creswell, 2009).
3.14 Chapter Summary
In this chapter, the researcher discussed the research methodology that was used in this
study. Particular attention was given to the research design, research philosophy,
research population and sampling methods that were used in this study. The chapter also
discusses ethical considerations that were observed in this study. In the following
chapter, the researcher presents the findings of the study.
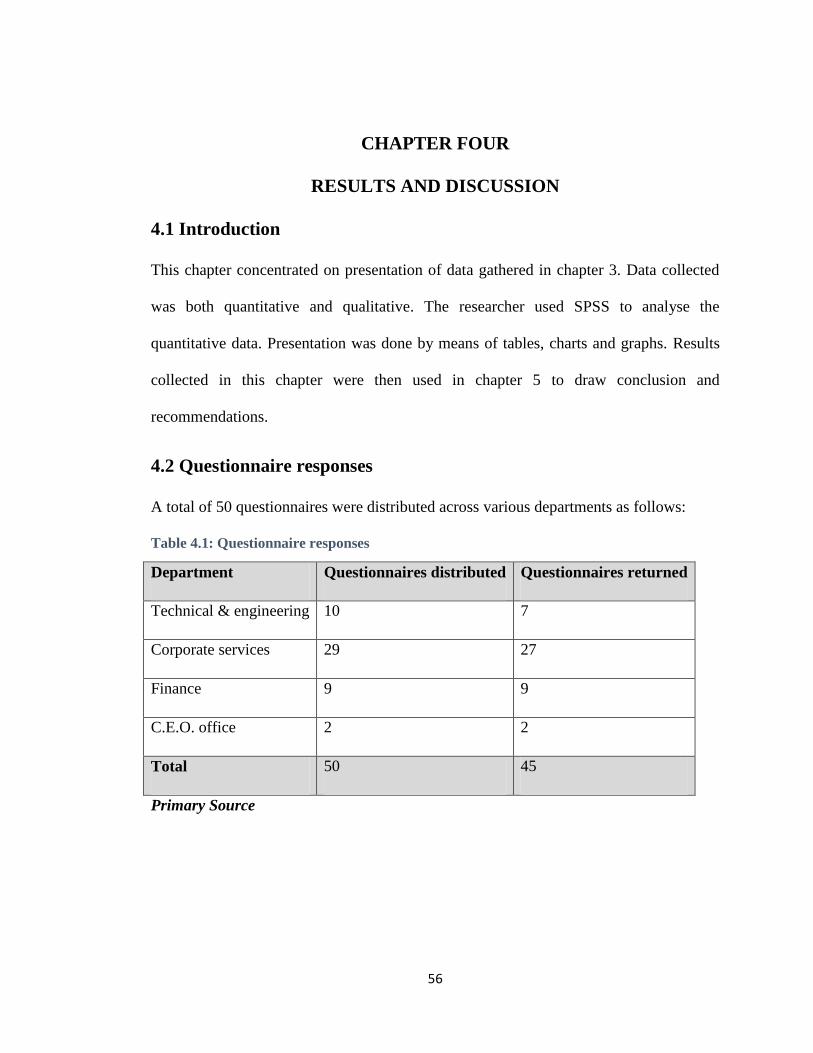
56
CHAPTER FOUR
RESULTS AND DISCUSSION
4.1 Introduction
This chapter concentrated on presentation of data gathered in chapter 3. Data collected
was both quantitative and qualitative. The researcher used SPSS to analyse the
quantitative data. Presentation was done by means of tables, charts and graphs. Results
collected in this chapter were then used in chapter 5 to draw conclusion and
recommendations.
4.2 Questionnaire responses
A total of 50 questionnaires were distributed across various departments as follows:
Table 4.1: Questionnaire responses
Department Questionnaires distributed Questionnaires returned
Technical & engineering 10 7
Corporate services 29 27
Finance 9 9
C.E.O. office 2 2
Total 50 45
Primary Source
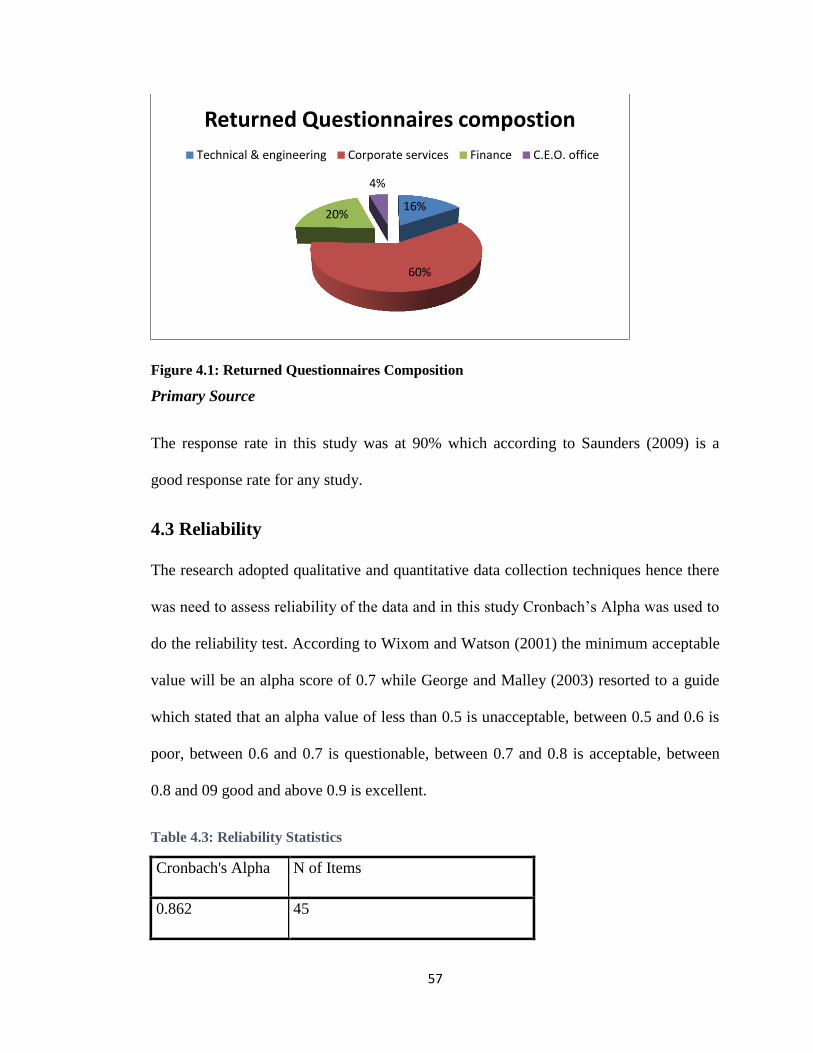
57
Figure 4.1: Returned Questionnaires Composition
Primary Source
The response rate in this study was at 90% which according to Saunders (2009) is a
good response rate for any study.
4.3 Reliability
The research adopted qualitative and quantitative data collection techniques hence there
was need to assess reliability of the data and in this study Cronbach’s Alpha was used to
do the reliability test. According to Wixom and Watson (2001) the minimum acceptable
value will be an alpha score of 0.7 while George and Malley (2003) resorted to a guide
which stated that an alpha value of less than 0.5 is unacceptable, between 0.5 and 0.6 is
poor, between 0.6 and 0.7 is questionable, between 0.7 and 0.8 is acceptable, between
0.8 and 09 good and above 0.9 is excellent.
Table 4.3: Reliability Statistics
Cronbach's Alpha N of Items
0.862 45
16%
60%
20%
4%
Returned Questionnaires compostion
Technical & engineering Corporate services Finance C.E.O. office
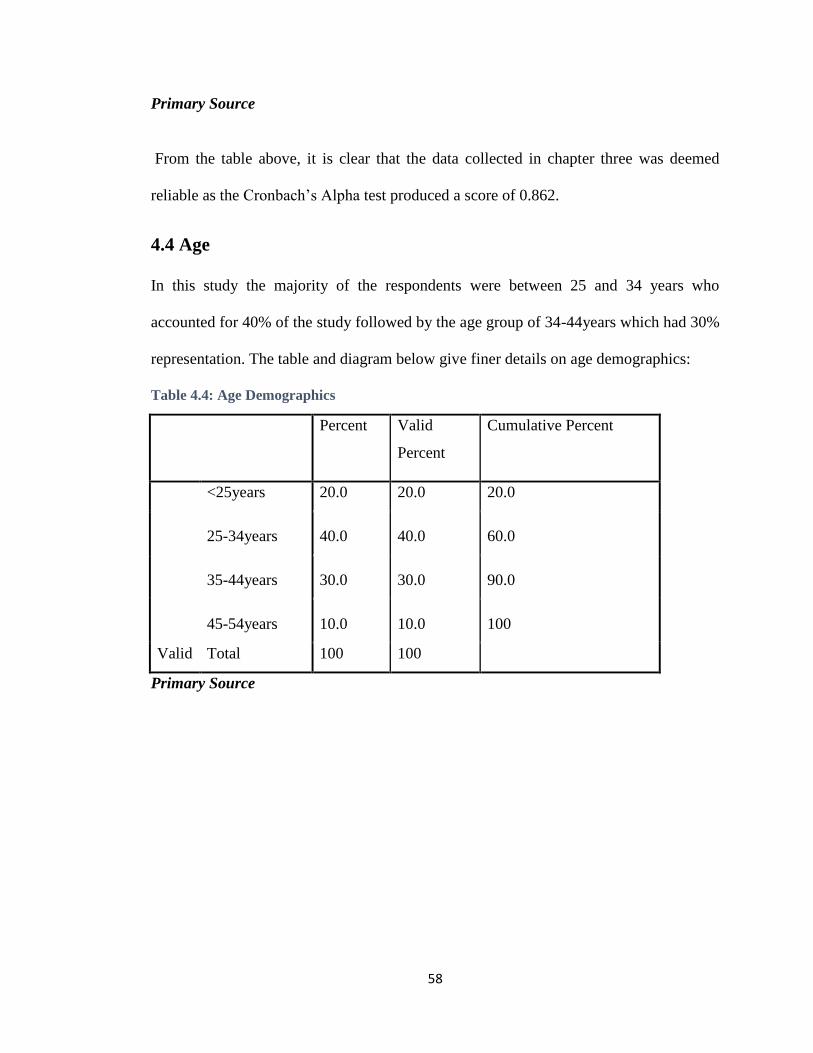
58
Primary Source
From the table above, it is clear that the data collected in chapter three was deemed
reliable as the Cronbach’s Alpha test produced a score of 0.862.
4.4 Age
In this study the majority of the respondents were between 25 and 34 years who
accounted for 40% of the study followed by the age group of 34-44years which had 30%
representation. The table and diagram below give finer details on age demographics:
Table 4.4: Age Demographics
Percent Valid
Percent
Cumulative Percent
Valid
<25years 20.0 20.0 20.0
25-34years 40.0 40.0 60.0
35-44years 30.0 30.0 90.0
45-54years 10.0 10.0 100
Total 100 100
Primary Source
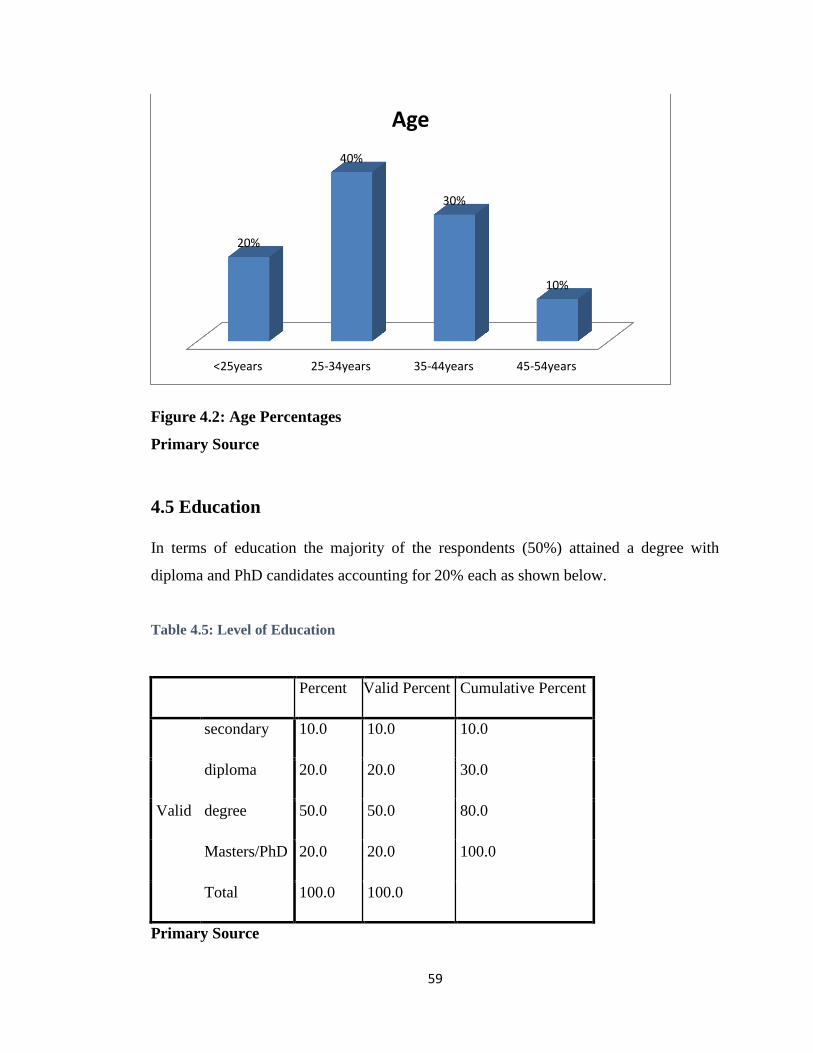
59
Figure 4.2: Age Percentages
Primary Source
4.5 Education
In terms of education the majority of the respondents (50%) attained a degree with
diploma and PhD candidates accounting for 20% each as shown below.
Table 4.5: Level of Education
Percent Valid Percent Cumulative Percent
Valid
secondary 10.0 10.0 10.0
diploma 20.0 20.0 30.0
degree 50.0 50.0 80.0
Masters/PhD 20.0 20.0 100.0
Total 100.0 100.0
Primary Source
<25years 25-34years 35-44years 45-54years
20%
40%
30%
10%
Age
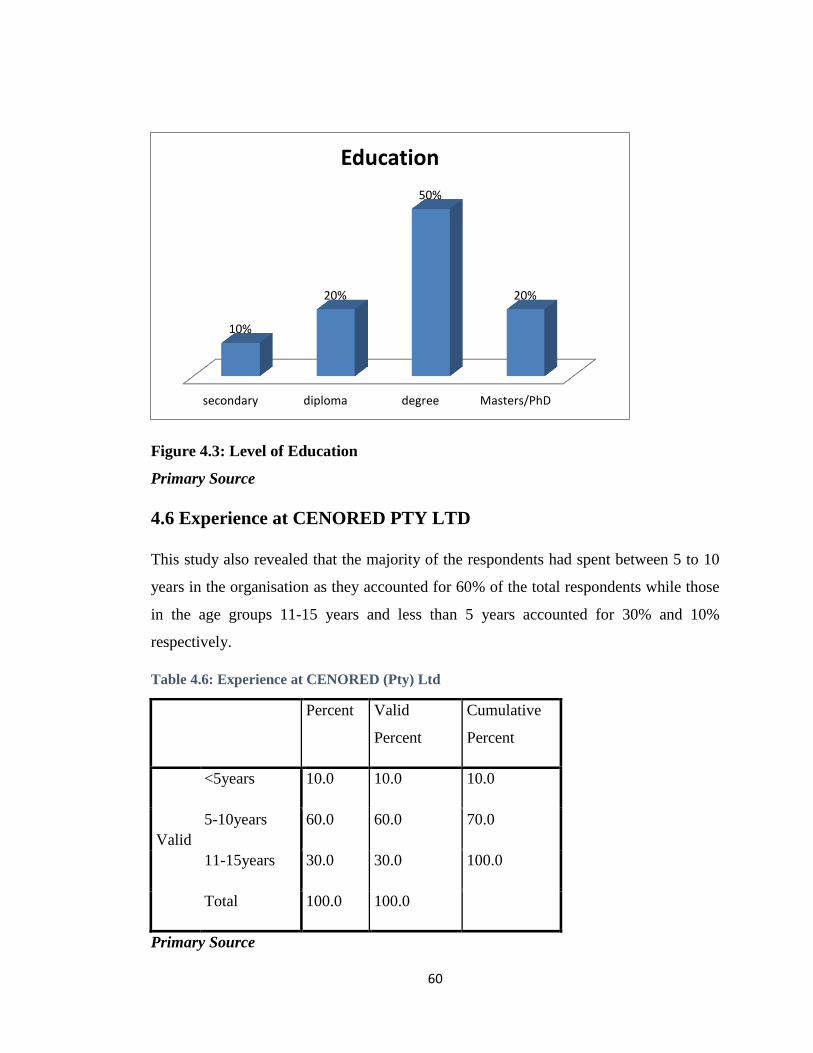
60
Figure 4.3: Level of Education
Primary Source
4.6 Experience at CENORED PTY LTD
This study also revealed that the majority of the respondents had spent between 5 to 10
years in the organisation as they accounted for 60% of the total respondents while those
in the age groups 11-15 years and less than 5 years accounted for 30% and 10%
respectively.
Table 4.6: Experience at CENORED (Pty) Ltd
Percent Valid
Percent
Cumulative
Percent
Valid
<5years 10.0 10.0 10.0
5-10years 60.0 60.0 70.0
11-15years 30.0 30.0 100.0
Total 100.0 100.0
Primary Source
secondary diploma degree Masters/PhD
10%
20%
50%
20%
Education
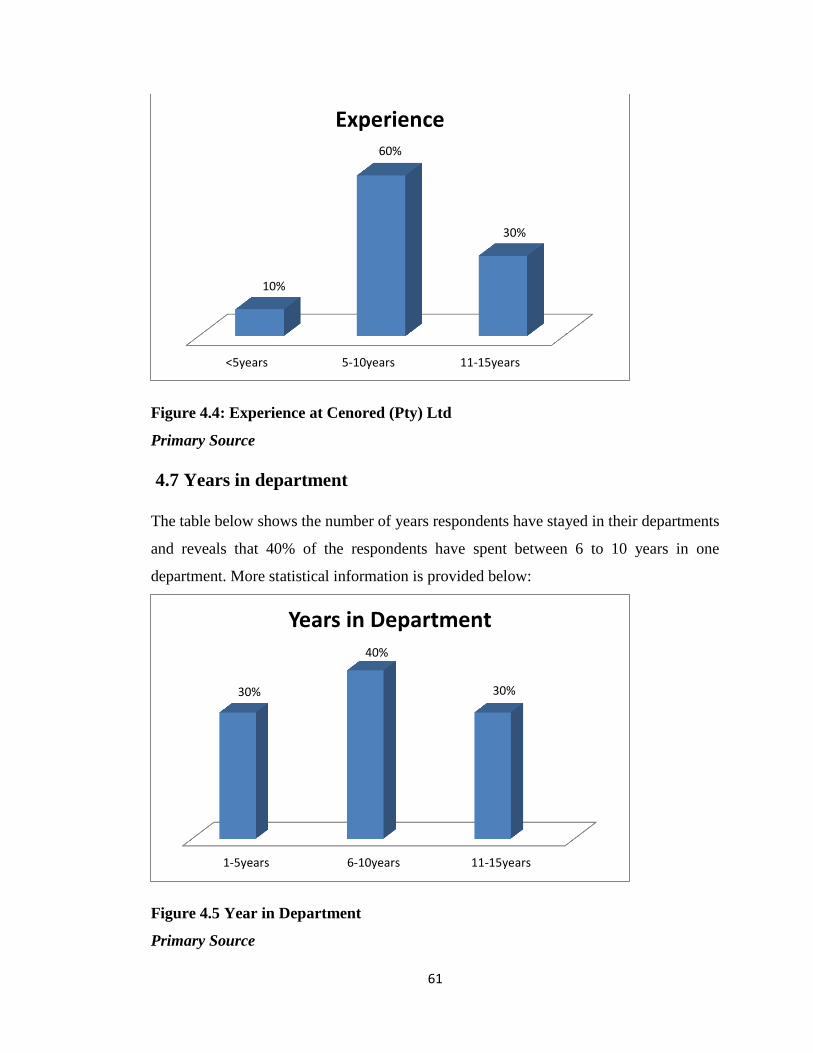
61
Figure 4.4: Experience at Cenored (Pty) Ltd
Primary Source
4.7 Years in department
The table below shows the number of years respondents have stayed in their departments
and reveals that 40% of the respondents have spent between 6 to 10 years in one
department. More statistical information is provided below:
Figure 4.5 Year in Department
Primary Source
<5years 5-10years 11-15years
10%
60%
30%
Experience
1-5years 6-10years 11-15years
30%
40%
30%
Years in Department
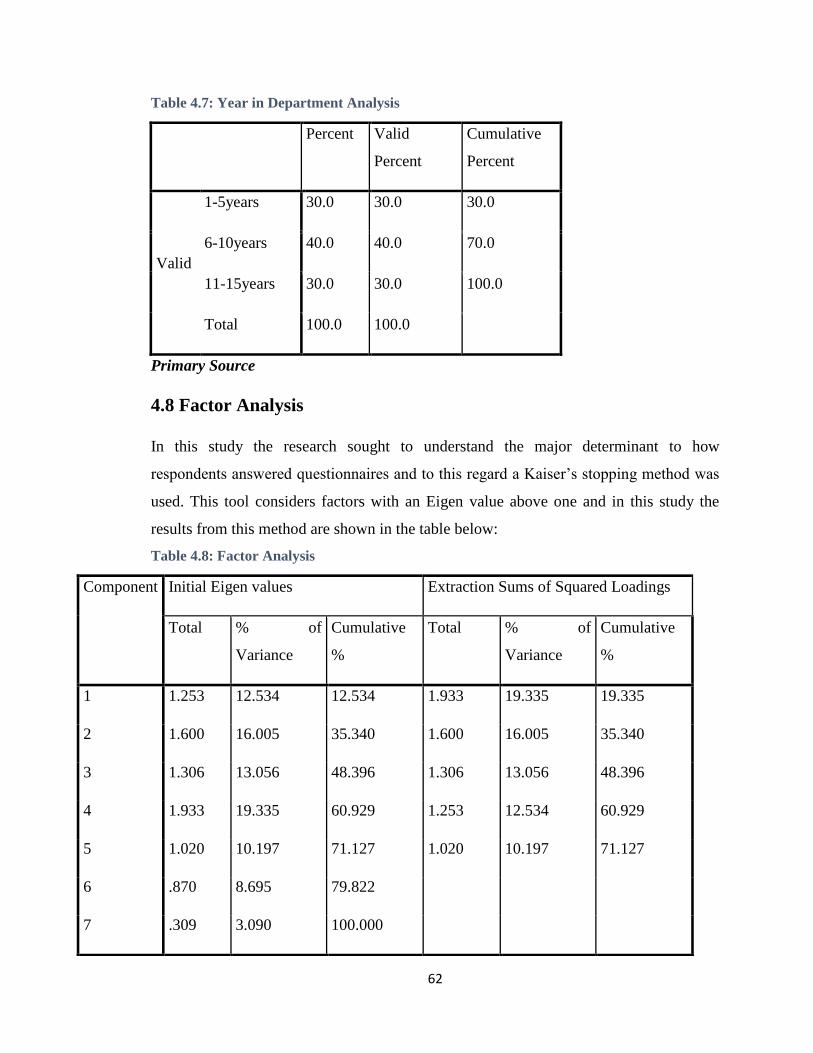
62
Table 4.7: Year in Department Analysis
Percent Valid
Percent
Cumulative
Percent
Valid
1-5years 30.0 30.0 30.0
6-10years 40.0 40.0 70.0
11-15years 30.0 30.0 100.0
Total 100.0 100.0
Primary Source
4.8 Factor Analysis
In this study the research sought to understand the major determinant to how
respondents answered questionnaires and to this regard a Kaiser’s stopping method was
used. This tool considers factors with an Eigen value above one and in this study the
results from this method are shown in the table below:
Table 4.8: Factor Analysis
Component Initial Eigen values Extraction Sums of Squared Loadings
Total % of
Variance
Cumulative
%
Total % of
Variance
Cumulative
%
1 1.253 12.534 12.534 1.933 19.335 19.335
2 1.600 16.005 35.340 1.600 16.005 35.340
3 1.306 13.056 48.396 1.306 13.056 48.396
4 1.933 19.335 60.929 1.253 12.534 60.929
5 1.020 10.197 71.127 1.020 10.197 71.127
6 .870 8.695 79.822
7 .309 3.090 100.000
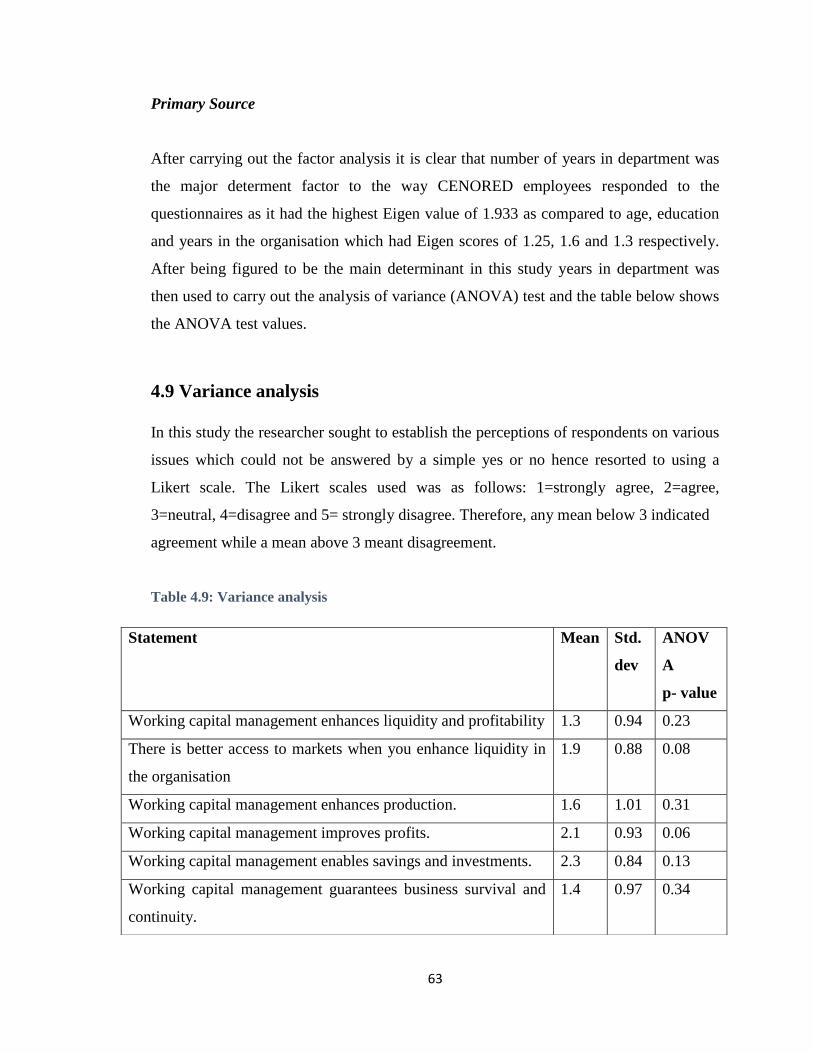
63
Primary Source
After carrying out the factor analysis it is clear that number of years in department was
the major determent factor to the way CENORED employees responded to the
questionnaires as it had the highest Eigen value of 1.933 as compared to age, education
and years in the organisation which had Eigen scores of 1.25, 1.6 and 1.3 respectively.
After being figured to be the main determinant in this study years in department was
then used to carry out the analysis of variance (ANOVA) test and the table below shows
the ANOVA test values.
4.9 Variance analysis
In this study the researcher sought to establish the perceptions of respondents on various
issues which could not be answered by a simple yes or no hence resorted to using a
Likert scale. The Likert scales used was as follows: 1=strongly agree, 2=agree,
3=neutral, 4=disagree and 5= strongly disagree. Therefore, any mean below 3 indicated
agreement while a mean above 3 meant disagreement.
Table 4.9: Variance analysis
Statement Mean Std.
dev
ANOV
A
p- value
Working capital management enhances liquidity and profitability 1.3 0.94 0.23
There is better access to markets when you enhance liquidity in
the organisation
1.9 0.88 0.08
Working capital management enhances production. 1.6 1.01 0.31
Working capital management improves profits. 2.1 0.93 0.06
Working capital management enables savings and investments. 2.3 0.84 0.13
Working capital management guarantees business survival and
continuity.
1.4 0.97 0.34
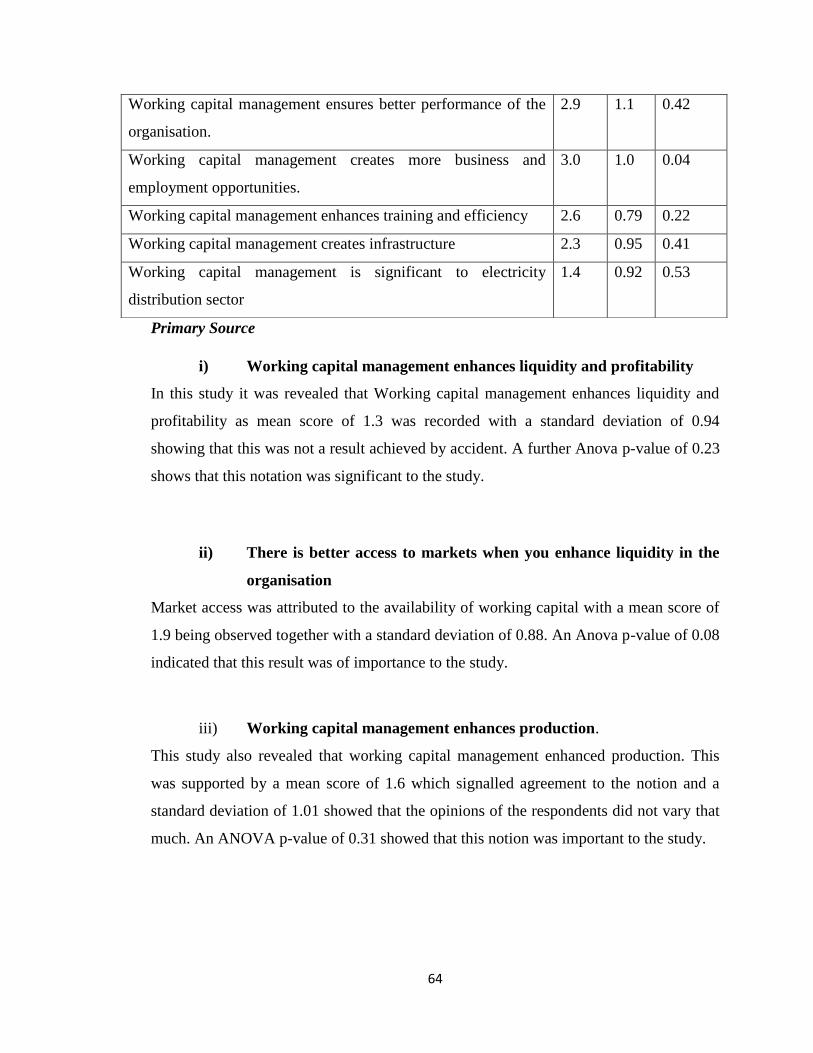
64
Primary Source
i) Working capital management enhances liquidity and profitability
In this study it was revealed that Working capital management enhances liquidity and
profitability as mean score of 1.3 was recorded with a standard deviation of 0.94
showing that this was not a result achieved by accident. A further Anova p-value of 0.23
shows that this notation was significant to the study.
ii) There is better access to markets when you enhance liquidity in the
organisation
Market access was attributed to the availability of working capital with a mean score of
1.9 being observed together with a standard deviation of 0.88. An Anova p-value of 0.08
indicated that this result was of importance to the study.
iii) Working capital management enhances production.
This study also revealed that working capital management enhanced production. This
was supported by a mean score of 1.6 which signalled agreement to the notion and a
standard deviation of 1.01 showed that the opinions of the respondents did not vary that
much. An ANOVA p-value of 0.31 showed that this notion was important to the study.
Working capital management ensures better performance of the
organisation.
2.9 1.1 0.42
Working capital management creates more business and
employment opportunities.
3.0 1.0 0.04
Working capital management enhances training and efficiency 2.6 0.79 0.22
Working capital management creates infrastructure 2.3 0.95 0.41
Working capital management is significant to electricity
distribution sector
1.4 0.92 0.53
65
iv) Working capital management improves profits.
Working capital was also observed to improve profits within an organisation as a mean
score of 2.1 was recorded with a standard deviation of 0.93 showing that the responses
were in the same range. A further ANOVA p-value of 0.06 indicated that this notion was
important to the study.
v) Working capital management enables savings and investments
Also, in this study working capital was deemed to enable savings and investments. This
was supported by a mean score of 2.3 and a standard deviation of 0.84 while an
ANOVA p- value of 0.13 iced the cake by showing the importance of this notion to the
study.
vi) Working capital management guarantees business survival and
continuity.
From the data gathered in this data in can be concluded that working capital
management guarantees business survival and continuity. As seen in the analysis of
variance, a mean score of 1.4 and a standard deviation of 0.97 were recorded.
Furthermore, an ANOVA p-value of 0.34 indicated the significance of this notion to the
study at hand.
vii) Working capital management ensures better performance of the
organisation
On this notion a mean score of 2.9 was recorded indicating that the respondents were in
agreement to this notion while a standard deviation of 1.1 showed that the responses
varied widely from the mean. However, an ANOVA p-value of 0.42 showed that this
notion was important to the study.
66
viii) Working capital management creates more business and employment
opportunities
This study revealed that respondents were undecided on whether working capital
management creates more business and employment opportunities or not. This is
supported by a mean score of 3 and a standard deviation of 1 showing that the majority
of the respondents were of the same view. However, an ANOVA p-value of 0.04
suggested that this notion was not important to the topic under discussion.
ix) Working capital management enhances training and efficiency
Working capital was noted to enhance training and efficiency as a mean score of 2.6 was
recorded and supported by a standard deviation of 0.79. Furthermore, an ANOVA p-
value of 0.22 indicated that this notion was of great significance to the study at hand.
x) Working capital management creates infrastructure
Also, in this study it was observed that working capital management helped in creation
of infrastructure. This was supported by a mean score of 2.3 and a standard deviation of
0.95 while an ANOVA p-value of 0.41 highlighted the significance of this notion to the
study at hand.
xi) Working capital management is significant to electricity distribution
sector
Having carried out a thorough assessment of the data gathered this research concluded
that working capital management was significant to electricity distribution sector as
indicated by a mean score of 1.4 and a standard deviation of 0.92 enforcing that this
result was not a mere coincident but rather a true reflection of the opinions of the
respondents. In addition, an ANOVA p-value of 0.53 proved that this notion was
important to the study at hand.
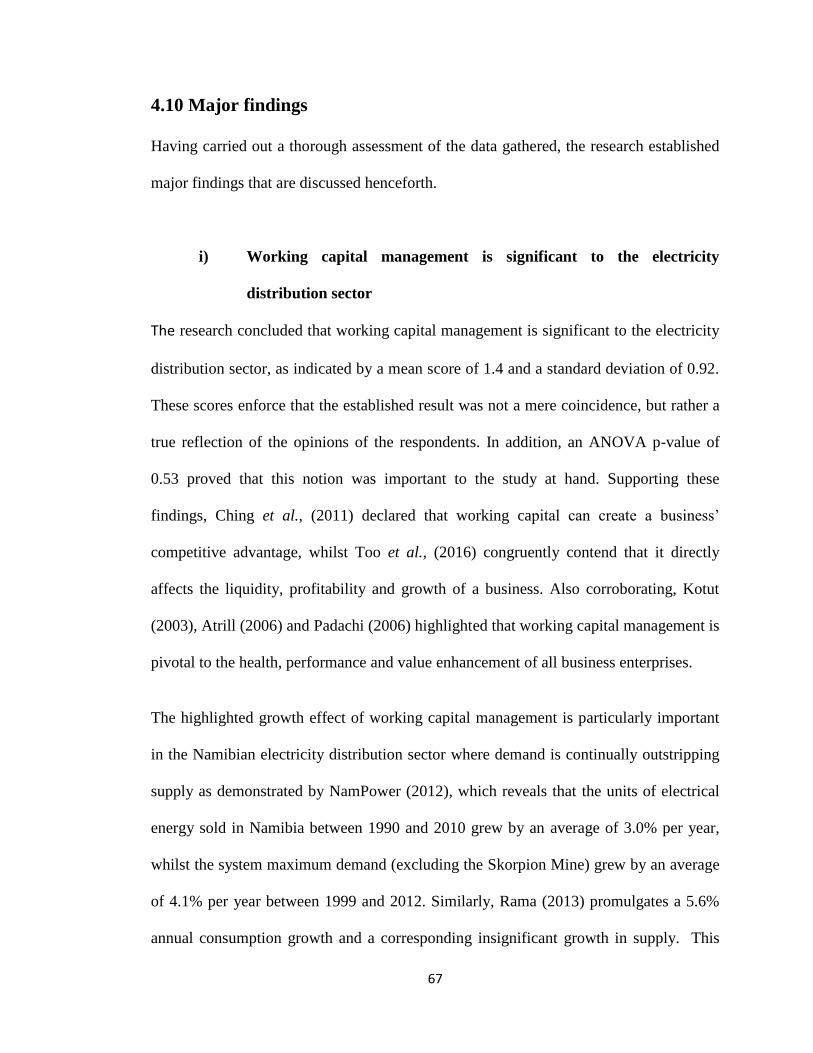
67
4.10 Major findings
Having carried out a thorough assessment of the data gathered, the research established
major findings that are discussed henceforth.
i) Working capital management is significant to the electricity
distribution sector
The research concluded that working capital management is significant to the electricity
distribution sector, as indicated by a mean score of 1.4 and a standard deviation of 0.92.
These scores enforce that the established result was not a mere coincidence, but rather a
true reflection of the opinions of the respondents. In addition, an ANOVA p-value of
0.53 proved that this notion was important to the study at hand. Supporting these
findings, Ching et al., (2011) declared that working capital can create a business’
competitive advantage, whilst Too et al., (2016) congruently contend that it directly
affects the liquidity, profitability and growth of a business. Also corroborating, Kotut
(2003), Atrill (2006) and Padachi (2006) highlighted that working capital management is
pivotal to the health, performance and value enhancement of all business enterprises.
The highlighted growth effect of working capital management is particularly important
in the Namibian electricity distribution sector where demand is continually outstripping
supply as demonstrated by NamPower (2012), which reveals that the units of electrical
energy sold in Namibia between 1990 and 2010 grew by an average of 3.0% per year,
whilst the system maximum demand (excluding the Skorpion Mine) grew by an average
of 4.1% per year between 1999 and 2012. Similarly, Rama (2013) promulgates a 5.6%
annual consumption growth and a corresponding insignificant growth in supply. This
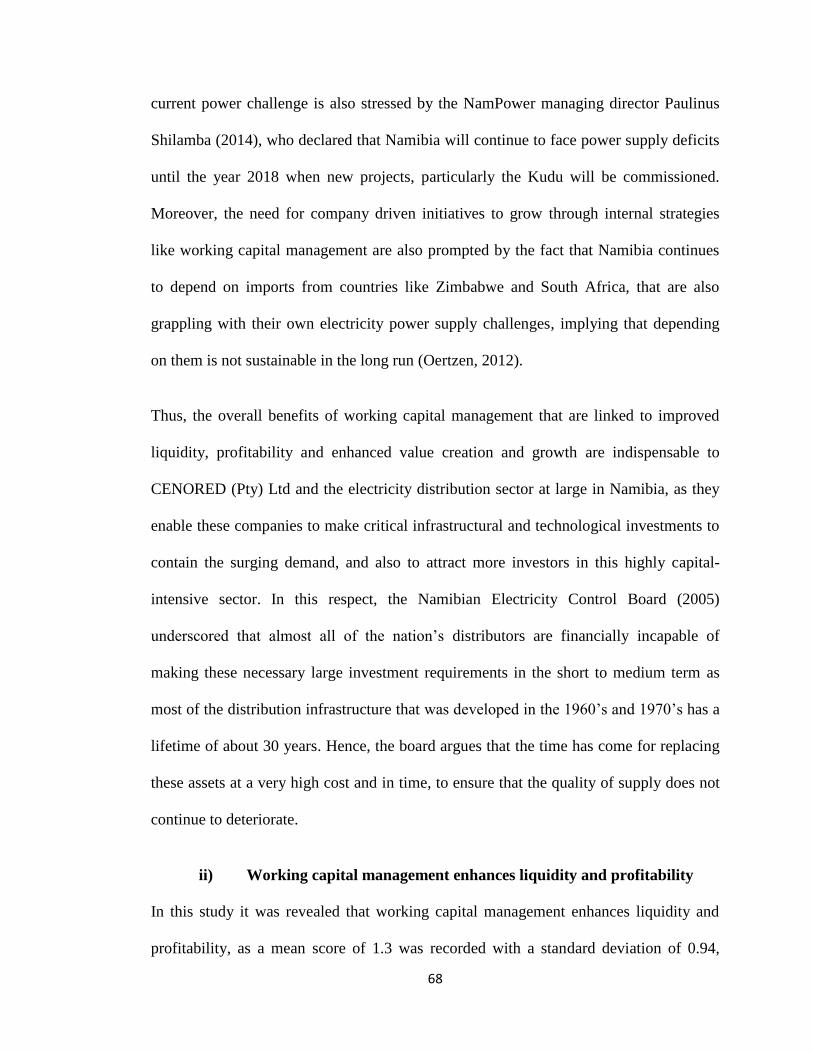
68
current power challenge is also stressed by the NamPower managing director Paulinus
Shilamba (2014), who declared that Namibia will continue to face power supply deficits
until the year 2018 when new projects, particularly the Kudu will be commissioned.
Moreover, the need for company driven initiatives to grow through internal strategies
like working capital management are also prompted by the fact that Namibia continues
to depend on imports from countries like Zimbabwe and South Africa, that are also
grappling with their own electricity power supply challenges, implying that depending
on them is not sustainable in the long run (Oertzen, 2012).
Thus, the overall benefits of working capital management that are linked to improved
liquidity, profitability and enhanced value creation and growth are indispensable to
CENORED (Pty) Ltd and the electricity distribution sector at large in Namibia, as they
enable these companies to make critical infrastructural and technological investments to
contain the surging demand, and also to attract more investors in this highly capital-
intensive sector. In this respect, the Namibian Electricity Control Board (2005)
underscored that almost all of the nation’s distributors are financially incapable of
making these necessary large investment requirements in the short to medium term as
most of the distribution infrastructure that was developed in the 1960’s and 1970’s has a
lifetime of about 30 years. Hence, the board argues that the time has come for replacing
these assets at a very high cost and in time, to ensure that the quality of supply does not
continue to deteriorate.
ii) Working capital management enhances liquidity and profitability
In this study it was revealed that working capital management enhances liquidity and
profitability, as a mean score of 1.3 was recorded with a standard deviation of 0.94,
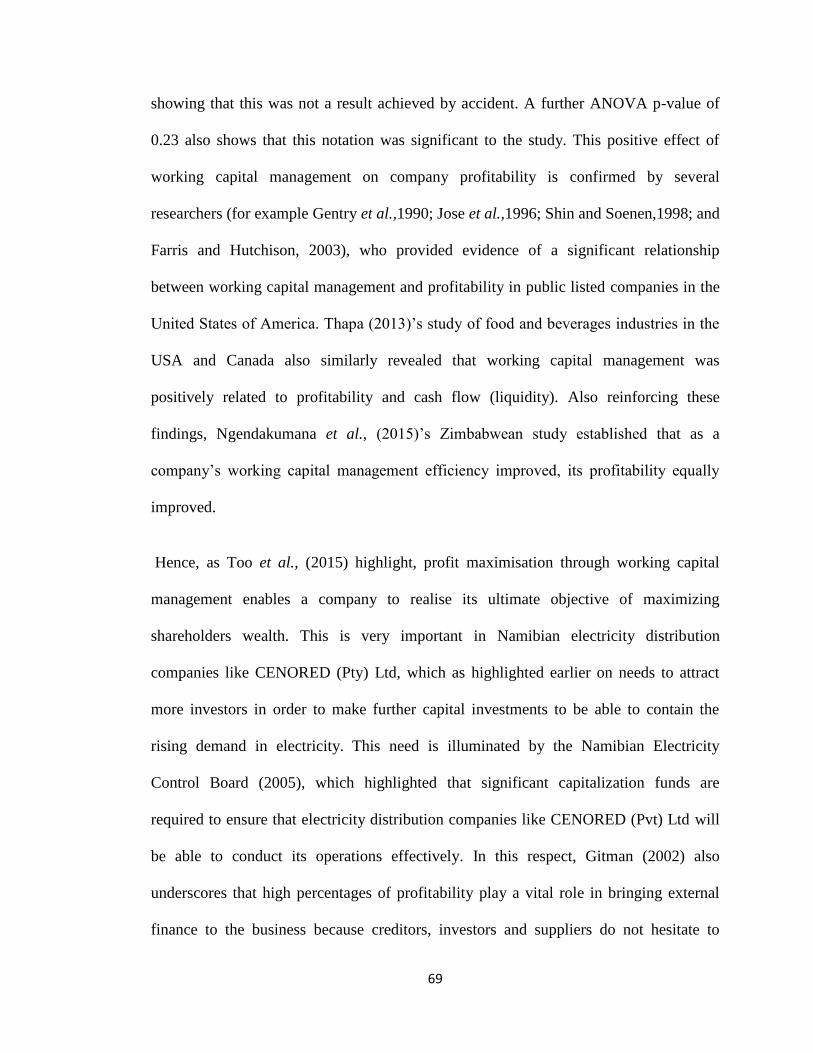
69
showing that this was not a result achieved by accident. A further ANOVA p-value of
0.23 also shows that this notation was significant to the study. This positive effect of
working capital management on company profitability is confirmed by several
researchers (for example Gentry et al.,1990; Jose et al.,1996; Shin and Soenen,1998; and
Farris and Hutchison, 2003), who provided evidence of a significant relationship
between working capital management and profitability in public listed companies in the
United States of America. Thapa (2013)’s study of food and beverages industries in the
USA and Canada also similarly revealed that working capital management was
positively related to profitability and cash flow (liquidity). Also reinforcing these
findings, Ngendakumana et al., (2015)’s Zimbabwean study established that as a
company’s working capital management efficiency improved, its profitability equally
improved.
Hence, as Too et al., (2015) highlight, profit maximisation through working capital
management enables a company to realise its ultimate objective of maximizing
shareholders wealth. This is very important in Namibian electricity distribution
companies like CENORED (Pty) Ltd, which as highlighted earlier on needs to attract
more investors in order to make further capital investments to be able to contain the
rising demand in electricity. This need is illuminated by the Namibian Electricity
Control Board (2005), which highlighted that significant capitalization funds are
required to ensure that electricity distribution companies like CENORED (Pvt) Ltd will
be able to conduct its operations effectively. In this respect, Gitman (2002) also
underscores that high percentages of profitability play a vital role in bringing external
finance to the business because creditors, investors and suppliers do not hesitate to
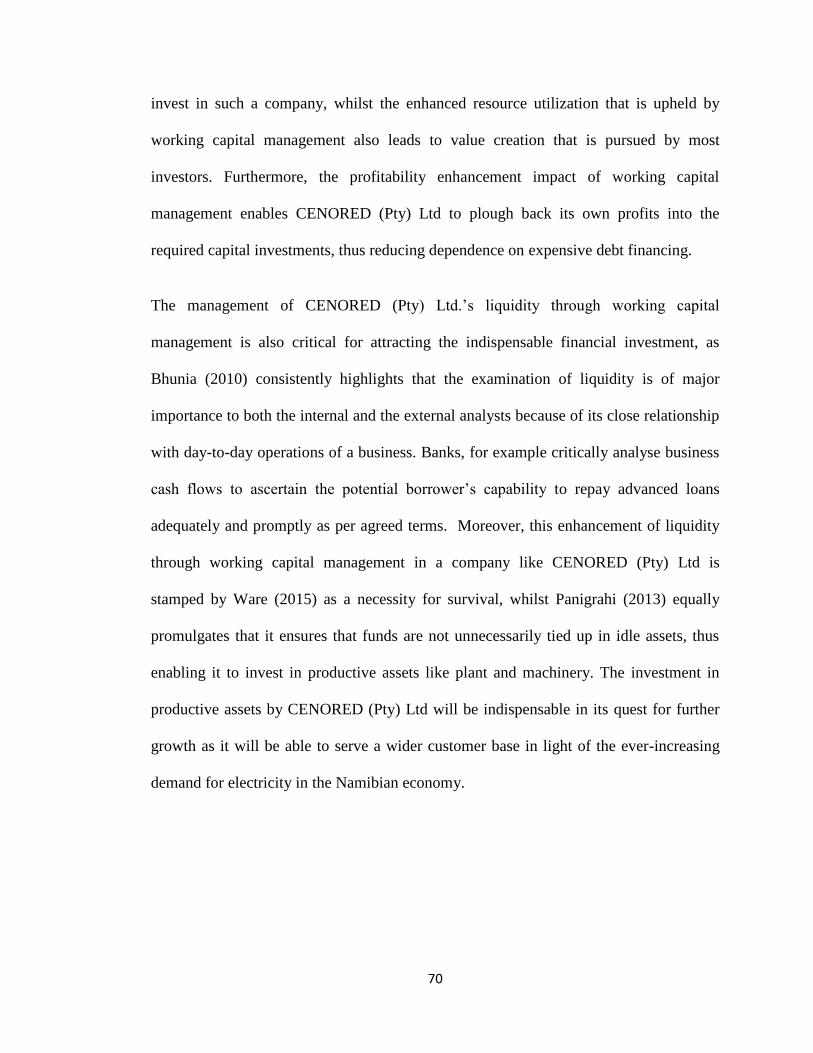
70
invest in such a company, whilst the enhanced resource utilization that is upheld by
working capital management also leads to value creation that is pursued by most
investors. Furthermore, the profitability enhancement impact of working capital
management enables CENORED (Pty) Ltd to plough back its own profits into the
required capital investments, thus reducing dependence on expensive debt financing.
The management of CENORED (Pty) Ltd.’s liquidity through working capital
management is also critical for attracting the indispensable financial investment, as
Bhunia (2010) consistently highlights that the examination of liquidity is of major
importance to both the internal and the external analysts because of its close relationship
with day-to-day operations of a business. Banks, for example critically analyse business
cash flows to ascertain the potential borrower’s capability to repay advanced loans
adequately and promptly as per agreed terms. Moreover, this enhancement of liquidity
through working capital management in a company like CENORED (Pty) Ltd is
stamped by Ware (2015) as a necessity for survival, whilst Panigrahi (2013) equally
promulgates that it ensures that funds are not unnecessarily tied up in idle assets, thus
enabling it to invest in productive assets like plant and machinery. The investment in
productive assets by CENORED (Pty) Ltd will be indispensable in its quest for further
growth as it will be able to serve a wider customer base in light of the ever-increasing
demand for electricity in the Namibian economy.
71
iii) Working capital management guarantees business survival and
continuity.
From the data gathered in this study, it can also be concluded that working capital
management guarantees business survival and continuity. As seen in the analysis of
variance, a mean score of 1.4 and a standard deviation of 0.97 were recorded.
Furthermore, an ANOVA p-value of 0.34 indicated the significance of this notion to the
study at hand. These findings coincide with Bhunia (2010)’s argument that the positive
impact of working capital management on liquidity empowers companies to avoid
insolvency or bankruptcy, which normally leads to the premature closure of companies.
Chatterjee (2012) also equally contends that this also affords a business an enhanced
capacity to serve the economy. The enhanced survival prospects of companies in the
Namibian electricity distribution sector through working capital management are key for
the alleviation of the previously highlighted power shortages in the country, and the
revival of the entire economy at large.
4.11 Summary
This chapter provided a detailed analysis of data gathered in chapter three. The data was
then put into meaningful information by means of graphs, charts and tables. These
results will be used in chapter 5 to come up with major conclusions and provide
recommendations to various stakeholders.
72
CHAPTER FIVE
CONCLUSIONS AND RECOMMENDATIONS
5.1 Introduction
This chapter concludes the research by providing a narrative of the findings of the whole
research. The chapter will provide major conclusions with regards to this study, before
providing recommendations to various relevant stakeholders in the electricity
distribution industry.
5.2 Recommendations
The following recommendations are prescribed to various concerned stakeholders in the
Namibian electricity distribution sector:
i) Electricity distribution companies
There is need for electricity distribution companies to come up with smart grid networks
in their distribution of electricity so that there is simultaneous production and
consumption of the product. This is because electricity cannot be stored, and hence, all
generated electricity should have ready consumers in order to avoid load losses.
Moreover, there is need for the companies to effectively manage their receivables and
payables in a manner that is recommended by the working capital management practice
that is to shorten collection periods and delay payments as much as possible. This was
proven to be effective by Deloof (2003)’s study in Belgium, where the empirical results
concluded that profitability can increase by reducing the length of the accounts
receivable period, whilst waiting longer to honour payables.
73
ii) Government
The government should revise the regulation policy on electricity distribution and
transmission to also accommodate the producers of electricity. This is mainly because
electricity has been heavily subsidised at the expense of generation and distribution
companies who in time are finding it difficult to meet the financial demands of the
sector. Thus, there is need for government intervention to cushion operators on the
financing of the sector.
iii) Researchers
To future researchers, there is need to also look into other variables affecting the
electricity distribution sector such as government policies, industrial growth and
consumption of various sources of energy, such that a comparison can be made in the
future to see which factor most affects or is significant to the electricity distribution
sector.
5.4 Conclusion
This chapter provided a narrative of the findings of the whole study coming up with the
conclusion that working capital management is significant in enhancing liquidity and
profitability in the electricity distribution sector. This chapter further provided
recommendations to key stakeholders who are relevant to the topic under study.
74
REFERENCES
Abawi, K. (2013). Data collection instruments (questionnaire and interview Geneva).
Geneva foundation for medica E-UMY repository.
Abdelhay, A. S., & Malik, O. P. (2011). Electric distribution concept. Wiley press.
Abowitz, D. A., & Toole, T. M. (2010). Mixed method research: Fundamental issues of
design, validity and reliability in construction research. Journal of Construction
Engineering and Management.
Abuzar, M.A.E. (2004). Liquidity – profitability trade off: An empirical investigation in
an emerging market. International Journal of Commerce and management, Vol.
14 no.2 pp. 48 -61.
Afza, T. C., & Nazir, M.S (2007). Working Capital Management Practices of Firms:
Empirical evidence from Pakistan. In proceedings of 9th
South Asian
Management Forum (SAMF), North South University, Dhaka. pp. 334-343.
Agarwal, N. P., & Mishra, B. K. (2007). Working capital management. Jaipur, India:
RBSA Publishers.
Aktas, N., Croci, E., & Petmezas, D. (2015). Is working capital management value
enhancing? Evidence from firm performance and investments. Journal of
Corporate Finance, Vol. 30, pp. 98-113.
Alagh, Y.K. (2013). The future of Indian agriculture: National book trust. India: New
Dehli, pp. 220.
Alipour, M. (2011). Working capital management and corporate profitability: Evidence
from Iran. World Applied Sciences Journal, Vol. 12 No.7, pp. 1093-1099.
Anand, M., & Gupta, C. P. (2002). Working capital performance of corporate India: An
Empirical Survey for the Year 2000-2001: Management and Accounting
75
Research, January-June 2002 and profitability in Malaysia. International Journal
of Business and Management, Vol. 5 No. 11.
Aravindan, R., & Ramanathan, K. V. (2013). Working capital estimation/ management.
A financial modelling approach. Advances in Management, 6 (9)4.
Atrill, P. (2006). Financial management for decision makers. New York: Financial
Times.
Atseye, F. A., Ugwu, J. I., & Takon, S. M. (2015). Determinants of working capital
management theoretical review. International Journal of Economics, Commerce
and Management. United Kingdom, Feb 2015 Licensed under Creative Common
Page 1. Retrieved from http://ijecm.co.uk/ ISSN 2348 0386.
Azam, M., & Haider, S. I. (2011). Impact of working capital management on firms
Performance: Evidence from non-financial institutions of KSE-30 index.
Interdisciplinary Journal of Contemporary Research in Business, Vol. 3 No. 5.
Azeem, M. M., & Marsap, A. (2015). Determinant factors and working capital
requirement. International Journal of Economics and Finance, Vol. 7 No. 2, pp.
1916-1971.
Azhar, S. (2015). Impact of liquidity and management efficiency on profitability. An
empirical study of selected power distribution utilities in India. Journal of
Entrepreneurship, Business and Economics, Vol. 3 No. 1, pp. 31-49.
Baños-Caballero, S., García-Teruel, P., & Solano, P. (2010). Working capital
management in SMEs’. Accounting and Finance, Vol. 50, pp. 511-527.
Baños-Caballero, S., García-Teruel, P., & Solano, P. (2014). Working capital
management, corporate performance, and financial constraints. Journal of
Business Research, Vol. 67, pp. 332–338. 10.1016/j.jbusres.2013.01.016.
76
Biger, N., Mathur, N., & Gill, A. (2010). The relationship between working capital
management and profitability: Evidence from the United States. Business and
Economics Journal, pp. 1-9.
Bindseil, U. (2005). Monetary policy implementation: Theory, past and present.
Amazon.
Bhunia, A. (2010). A study of liquidity trends on private sector steel companies in India.
Asian Journal of Management Research, ISSN 2229 – 3795, pp. 618 -628.
Block, S. B., Hirk, G. A., & Short, J. D. (1992). Fundamentals of financial management.
New Delhi: Dow Jones and Company Chicopee.
Bower, J. L. (2017). Managing resource allocation: Personal reflections from a
managerial perspective. Journal of Management, Vol. 43 No. (8), pp. 2421-2429.
Brealey, R., Myers, S., & Allen, F. (2006). Working capital management (pp 813).
Brigham, E. F., & Houston, J. F. (2004). Fundamental of financial management. Ohio:
South-West Division of Thompson Learning Incorporation.
Bryman, A., & Bell, E. (2015). Business research methods and investigative approach
In: Introduction to quantitative research methods. London: SAGE.
Burns, N., & Grove, S., K. (2003). Understanding nursing research (3rd
ed.).
Philadelphia: Saunders Company.
Burton, M. E. (2010). Saturn’s internal planetary magnetic field. UK: John Moore
University.
Carson, D.J., Gilmore, A., Perry, C., & Gronhaung, K. (2001). Qualitative Marketing
Research. London: Sage.
Chatterjee, S. (2012). The impact of working capital on the profitability. Evidence from
the Indian firms.
77
Ching, H. Y., Novazzi, A., & Gerab, F. (2011). Relationship between working capital
management and profitability in Brazilian limited companies. Journal of Global
Business and Economics, Vol. 3 No. 11.
Choga, F. & Njaya, T. (2011). Business research methods. Harare: Zimbabwe Open
University.
Chowdhury, A., & Amin, M. (2007). Working capital management practiced in
pharmaceutical companies listed in Dhaka Stock Exchange. BRAC University
Journal, Vol. 4 No. 2, pp.75-86.
Churchill, G. A. (1996). Basic Marketing Research (3rd
ed.). Fort Worth, TX: The
Dryden Press.
Clarke, S. (2012). Teaching thermal analysis: Overcoming challenges and developing.
Copper, D. R., & Schindler, P. S. (2011). Business research methods (11th
ed.). New
York: McGraw-Hill/Irwin.
Cote, J. M., & Latham, C. K. (1999). The merchandising ratio: A comprehensive
measure of working capital strategy. Issues Account. Education, Vol. 14 No. 2,
pp. 255-267.
Cresswell, J. W., & Clark, V.L. (2011). Designing and conducting mixed methods
research (2nd
ed.). Thousand Oaks, CA: Sage.
Cresswell, J. W. (2014). Research design: Qualitative, quantitative and mixed methods
approaches. USA: Sage Publications.
Davidson & Mwakasonda. (2003). Southern Africa sub-regional study. South Africa and
Zimbabwe Electricity access sub-theme Energy & Development Research Centre
University of Cape Town.
78
Deloof, M. (2003). Does working capital management affect profitability of Belgian
firms. Journal of Business Finance & Accounting, Vol. 30 No. (3), pp. 573-587.
Denzin, N., & Lincoln, Y. (2011). Handbook of critical and indigenous methodologies.
Department of Economic and Social Affairs, (2008), Government of Namibia.
Dong, H. P., & Su, R. (2010). The relationship between working capital management
and profitability. International Research Journal of Finance and Economic, Vol.
49.
Dornyei, Z. (2007). Research methods in applied linguistics. Oxford: Oxford University
Press.
Dowson, C. (2002). Practical research methods: A user friendly guide to mastering
research. Oxford: Oxford University Press.
Duah, R. T. (2015). The effect of working capital management on firms profitability: A
case study of listed manufacturing firms on the Ghana stock exchange.
Elusakin, J. (2013, January 6). Privatization and electricity problem in Nigeria. National
Mirror Newspaper, pp.18.
Enquist, J., Graham, M.C., & Nikkinen, J. (2014). The impact of working capital
management on firm profitability in different business cycles. Finland Journal of
Research in International Business and Finance, pp. 36-49.
Eskom. (2015). Annual Report 2001: Embracing sustainable development. Sandton,
Eskom.
Ernst & Young. (2014). All tied up working capital management report 2014. UK: Ernst
& Young Global Limited.
Farris, M., & Hutchison, P. (2003). Measuring cash-to-cash performance. The
International Journal of Logistics Management, Vol. 14. pp. 83-91.
79
Filbeck, G., & Krueger, T. M. (2005). An analysis of working capital management
results across industries. American Journal of Business, Vol. 20 No. (2), pp. 11-
20.
Fridah, M.W. (2009). Sampling in research. Retrieved from: http://www.indiana.
edu/educy520/sec5982/week_2/mugo02sampling.pdf.
Gentry, J.A., Vaidyanathan, R., & Lee, H.W. (1990). A weighted cash conversion cycle.
Finan. Manage, Vol. 19:pp. 90-99.
George, A. L., & Bennet, A. (2005). Case studies and theory development. Harvard:
MIT Press, pp. 205-232.
Ghosh, S. K., & Maji, S. G. (2003). Working capital management efficiency: A study on
the Indian cement industry. The institute of costs and works accountants of India.
Gibbs, G. (2002). Quantitative data analysis: Explorations with NVIVO.
Gill, A., Bieger, N., & Mathur, N. (2010). The relationship between working capital
management and profitability. Evidence from the United States. Business and
Economics Journal.
Gitman, L. J. (2007). Principles of managerial finance. USA: Prentice Hall.
Golofshani, N. (2003). Understanding reliability and validity in qualitative research. The
qualitative report, Vol. 8 No. (4), pp. 597-606.
Guthman, H. G. (1953). Analysis of financial statements. New York.
Hager, H.C. (1976). Cash management and the cash cycle. Manage. Acc., Vol. 57,
pp.79-88.
Hair, J., Bush, R., & Ortinau, D. (2003). Marketing research: Within a changing
information environment. New York (NY): McGraw-Hill/Irwin.
80
Hampton, J. (2002). Financial decision-making concepts, problems and cases (4th
ed.).
New York: New Age.
Harris, A. (2005). Working capital management. Difficult but rewarding. Financial
executive, Vol. 21 No. 4, pp. 52-53.
Hussey, R. (1997). Business research: A practical guide for undergraduate & post
graduate students. New York: MacMillan Press.
Ihuah, P., & Eaton, D. (2013). The pragmatic research approach. A framework for
sustainable management of public housing estates in Nigeria.
Jensen, M. C. (1986). Agency costs of free cash flow, corporate finance, and takeovers.
The American Economic Review, Papers and proceedings of the ninety-eighth
annual meeting of the American Economic Association, Vol. 76, No. 2.
Jose, M., Lancaster, C., & Stevens, J. (1996). Corporate return and cash conversion
cycle. J. Econom finance, Vol. 20: pp. 1-34.
Joshi, P. V. (1994). Working capital management under inflation, (1st ed.). Anmol
Publishers, pp. 20-93.
Kaboub, F. (2008). Positivist paradigm. Retrieved from http://personal.
denison.edu/~kaboubf/Pub/2008-Positivist-Paradigmpdfon.
Kapika, J., & Eberhard, A. (2013). Power sector reforms and regulation in Africa:
Lessons from Kenya, Tanzania, Uganda, Zambia, Namibia and Ghana.
Kargar, J., & Blumenthal, R. A. (1994). Leverage impact on working capital in small
businesses. TMA Journal, Vol. 14, pp. 46-46.
Kaura, M. N., & Subramaniam, B. (2002). Inter firm comparison of financial
performance of cement companies in India. ASCI Journal of Management, Vol. 9
No. 1.
81
Kennedy R.D., & McMullen, S. (1968). Financial Statements: Form analysis and
interpretations.
Kienschnick, R., LaPlante, M., & Moussawi, R. (2013). Corporate working capital
management: determinants and consequences.
Kimberlin C., & Winterstein, G. (2008). Validity and reliability of measurement
instruments used in research. Hepworth.
Kotut, P. K. (2003). Working capital management practices by Kenyan firms: A case
study of firms listed in the NSE. Unpublished MBA project. Egerton University.
Lamberson, M. (1995). Changes in working capital of small firms in relation to changes
in economic activity. Mid-American Journal of Business.
Lazaridis, I. S., & Tryfondisi, D. (2005). The relationship between working capital
management and profitability of listed companies in the Athens Stock Exchange.
Business and Economics Society International.
Leon, S. A. J. (2013). The impact of working capital management on profitability of the
listed firms in Sri Lanka. Global Journal of Commerce and Management
Perspective, Vol. 2, No. 6, pp. 98-102.
Maness, T. S., & Zietlow, J. T. (2005). Short-term financial management (3rd
ed.).
New Delhi: McGraw Hill.
Mathers, N. (2009). Surveys and questionnaires.
Mathuva, D. (2009). Capital adequacy, cost income ratio and the performance of
commercial banks. The Kenyan scenario. The International Journal of Applied
Economics and Finance, Vol. 3, pp. 35-47.
Mead, D. C. (1998). Micro and small businesses tackle poverty and growth (but in
different proportions), Paper presented at the conference on Enterprise in Africa:
82
Between poverty and growth. Centre for African Studies, University of
Edinburgh.
Mengesha, W. (2014). Impact of working capital management on firm’s performance:
The case of selected metal manufacturing companies in Addis Ababa, Master’s
thesis. Addis Ababa: Jimma University College of Business and Economics.
Ministry of Power (2005). Government of Namibia.
Mohamad, N., Noriza, B., & Saad, B. (2010). Working capital management: The effect
of market valuation and profitability. Malaysia.
Moyer, R., Mcguigan, C. J. R., & Kretlow, W. J. (2003). Contemporary financial
management (9th
ed.). London: Thomson Press.
Mun, G. S., & Jang, S. (2015). Working capital, cash holding, and profitability of
restaurant firms. International Journal of Hospitality Management, Vol. 48, pp.
1-11.
Munyoro, G., Chikombingo, M., & Nyandoro, Z. (2016). The motives of Zimbabwean
entrepreneurs. A case study of Harare, Africa Development and Resources
Research Institute Journal, Ghana, Vol. 25 No. 7. pp. 3.
Munyoro, G., Langton, I., & Chenyika, W. (2017). The role of entrepreneurship in
sustaining non-governmental organizations operations in Zimbabwe: A case
study of Harare.
Namnews network. (2015). Retrieved from africanenergyresources.com
Ngendakumana, L., Jagero, N., & Gondo, F. (2015). The impact of working capital
management on the profitability of Smart Bags Limited manufacturing firm in
Zimbabwe. British Journal of Economics, Management & Trade, Vol. 6 No. (2):
pp.102-111.
83
Ngwili, K. P. (2013). The relationship between liquidity and profitability of insurance
companies. Kenya.
Nimalathasan, B. (2010). Working capital management and its impact on profitability:
Manager, University of Bucharest, Vol. 12. Pp. 76-82.
Nishanthini, A., & Nimalathasan, B. (2013). Determinants of profitability. A case study
of listed manufacturing companies in Sri Lanka.
Nyabwanga, R. (2012). Effect of working capital management practices on financial
performance: A study of small scale enterprises in Kisii South District, Kenya.
African Journal of Business Management, Vol. 6. No. 10.
Nyakundi, M. (2003). A Survey of working capital management among public
companies in Kenya. Unpublished MBA project, School of Business, University
of Nairobi.
Nyathi, A. (2015). Managing industrial relations at a work place: The role of trade
unions & workers committee. A case study of Tanganda Tea Company, Gweru:
Midlands State University.
Ogundipe, S. E., Idowu, A., & Ogundipe, L. O. (2012). Working capital management,
firms' performance and market valuation in Nigeria. International Journal of
Social, Management, Economics and Business Engineering, Vol. 6 No.1, pp. 19-
23.
Olufisayo, O. A. (2011). Effects of working capital on profitability of selected quoted
firms in Nigeria, Global Business Review, Vol. 13 No. 3, pp. 367–381.
Padachi, K. (2006). Trends in working capital management and its impact on firms’
performance an analysis of Mauritian small manufacturing firms. International
review of business research papers, Vol. 2 No.2, pp. 45-48.
84
Padachi, K. (2007). Trends in working capital management and its impact on firms
performance: An analysis of Mauritian small manufacturing firms. Intl. Rev.
business res. papers, Vol. 2 No. 2, pp. 45-58.
Pandey, S., & Singh, J.P. (2008). Impact of working capital management in the
profitability of Hindalco Industries Limited. The IUP Journal of Financial
Economics, Vol. 1,pp. 62-72.
Panigrahi, A., & Sharma, A. (2013). Working capital management and firms’
performance: An analysis of selected Indian cement companies. Asian Journal of
Research in Business Economics and Management.
Parahoo, K. (1997). Nursing research: Principles process and issues. Basingstoke:
Macmillan.
Paramasivan, C., & Subramanian, T. (2009). Financial management. New York: New
Age.
Parasanna, C. (1984). Financial management theory and practice. New Delhi: McGraw
Hill.
Pass, C. L., & Pike, R. H. (2007). An overview of working capital and corporate
financing. Managerial finance, Vol. 10 No. (3), pp. 1-11.
Polit. D. F., Beck, C. T., & Hungler, B. P. (2001). Essentials of nursing research:
methods, appraisal and utilization (5th
ed.). Lippincott, Williams &Wilkins,
Philadelphia.
Priya, K., & Nimalathasan, B. (2014). Liquidity management and profitability: A case
study of listed manufacturing Companies in Sri Lanka. International Journal of
Technological Exploration and Learning (IJTEL),Vol 2 (4), pp.161-165.
85
Qader, M. (2009). Electricity consumption and GHG emission in GCC countries.
University of Bahrain.
Oertzen. (2009). Namibia’s energy future.
Raheman, A., & Nasr, M. (2007). Working capital management and profitability: Case
of Pakistani firms. Intl. Rev. Business Research Papers, Vol. 3 No. 1: pp. 279-
280.
Rama, A. & Vijaya, A. (2013). A study of working capital management of cement
industries in India. International Referred Journal of Engineering and Science,
Vol. 2 No. 8. pp. 12-17.
Rauscher, S., & Wheeler, J. R.C. (2011). The importance of working capital
management for hospital profitability: Evidence from bond-issuing, not-for-
profit US hospitals. Health care management review, Vol. 37, pp. 339-46.
Robinson, J. (2013). The accumulation of capital. Palgrave Macmillan.
Robles, B. J. (2016). Economic inclusion and financial education in culturally diverse
communities. Leveraging cultural capital and whole family learning, New
directions for adult and continuing education, pp. 57-66.
Rondinelli, D. (2008). Decentralization, territorial power and the state: A critical
response. Development and change, Vol. 21, pp. 491 - 500.
Rose, N. S., Rendell, P. G., McDaniel, M. A., Aberle, I., & Kliegel, M. (2015). Age and
individual differences in prospective memory during a “Virtual Week”. The roles
of working memory, vigilance, task regularity, and cue focality. psychol, aging,
Vol. 25, pp. 595–605. 10.1037/A0019771.
Ross, S. A., Westerfield, R. W., Jaffe, J., & Jordan, B. D. (2008). Modern financial
management (8th
ed.). New York: McGraw- Hill.
86
Sadelec. (2000). NEPAD vision and the INGA hydroelectric scheme. Energy research
centre.
Salawu, R. O. (2007). Capital industry practice and aggressive conservative working
capital policies.
Şamiloğlu, F., & Demirgüneş, K. (2008). The effect of working capital management on
firm profitability: Evidence from Turkey. The International Journal of Applied
Economics and Finance, Vol. 2, pp. 44-50.
Saunders, M. N. K., Lewis, P., & Thornhill, A. (2007). Research methods for business
students (4th
ed.). Prentice Hall.
Saunders, M. N. K., Lewis, P., & Thornhill, A. (2009). Research methods for business
students (5th
ed.). Harlow: Pearson Education.
Scherr, F. C. (1989). Modern working capital management, text and cases. London:
Prentice-Hall International.
Seidel, J. V. (1998). Qualitative data analysis (originally published as Qualitative Data
Analysis, in The Ethnograph v 5.0: A Users Guide, Appendix E, 1998, Colorado
Springs, Colorado: Qualis Research). Retrieved from
http://www.qualisresearch.com/qda_paper.htm.
Sekaran, U., & Bougie, R. (2012). Research methods for business (5th
ed.). ISBN.
Shin, H. H., & Soenen, L. (1998). Efficiency of working capital and corporate
profitability: Finance practice. Student Literature.
Singh, J. P., & Pandey, S. (2008). Impact of working capital management in the
profitability of Hindalco Industries Limited, ICFAI University. Journal of
Financial Economics, Vol. 6 No. 4, pp. 62-72.
87
Smith, K. V. (1980). Profitability versus liquidity trade-offs in working capital
management, in reading on the management of working capital. St Paul: West
Publishing Company.
Tallapragada, P. V. (2009). The energy challenge in Sub-Saharan Africa: a guide for
advocates and policy makers. Oxfarm.
Taylor, G. R. (2005). Integrating quantitative and qualitative methods in research.
Maryland: University Press of America Inc.
Teddlie, C., & Yu, F. (2009). Mixed methods research on learning.
Thapa, P. D. P. (2013). How does the profitability get affected by working capital
management in food and beverage Industry. Journal of Advanced Research in
Management 4, pp. 79-88.
Ukaegbu, B. (2014). The significance of working capital management in determining
firm profitability evidence from developing economies in Africa. Research in
International Business and Finance, pp. 311-16.
Upton, W. (2001). Financial accounting series, special report business and reporting
challenges from the new economy.
Van Horne, J., & Wachowitz, J. M. (2000). Fundamentals of financial management (10th
ed.). New Jersey: Education Prentice-Hall International.
Vataliya, K. S. (2009). Financial accounting: Advance methods, techniques & practices.
Ware, E. (2015). Liquidity management and its effect on profitability in tough economy:
A case of companies listed on the Ghana Stock Exchange. International Journal
of Research in Business Studies and Management, Vol. 2 No 11, pp. 34-66.
Watson, D., & Head, A. (2004). Corporate finance: Principles & practice. Financial
Times. Harlow, Prentice Hall
88
Webster, M. (1985). Webster`s ninth new collegiate dictionary, Meriam - Webster Inc.
Weinraub, H. J., & Visscher, S. (1998). Industry practice relating to aggressive
conservative working capital policies. Journal of Financial and Strategic
Decisions, Vol. 11 No. 2
Weston, J.F. & Brigham, F.E. (1994). Managerial finance (1st ed.). New York: Dryden
Press.
Williamson, O. E. (2008). Outsourcing: Transaction cost economics and supply chain
management, Wiley.
Wixom, B.H., & Watson, H.J. (2001). An empirical investigation of the factors affecting
data warehousing success. MIS quarterly, pp.17-41.
World Bank. (2011). World development report-agriculture for development.
Washington, DC, pp. 365.
World Bank. (2014), Electric power consumption (kWh per capita).
Yin, R. K. (2009). Case study research design and methods (3rd
ed.). Applied social
research methods series, Vol. 5.
Zawaira, T., & Mutenheri, E. (2014). The association between working capital
management and profitability of non-financial companies listed on the
Zimbabwe stock exchange. International Journal of Management and Social
Sciences, Vol. 3.

89
APPENDICES
APPENDIX 1: QUESTIONNAIRE
The significance of working capital management in enhancing liquidity and
profitability in the electricity distribution sector in Namibia: A Case Study of
Central Northern Electricity Distribution Company (CENORED) (Pty) Ltd.
May you kindly complete the following questionnaire by ticking the response that you
think is the most appropriate. Any further comments can be added at the end of the
questionnaire. Please note that the purpose of this research is purely academic and the
responses will be treated as private and confidential.
1. Age: <25years……. 25-34years……. 35-44years……. 45-54years ……..
>55years………
2. Education Level: Secondary School…….. Diploma…..... Degree……..
MSc/PhD………...
3. Number of years in the CENORED (Pty) Ltd: <5 years…. 5-10 years… 11-15
years…..More than 15 years…….
4. Number of years under your department: 1-5 years………..6-10 years………. 11-15
years……More than 15 years
5. What is your department: Technical and Engineering…. Corporate Services….
Finance….Office of the Chief Executive ……
Statement Strongly
Agree
Agree Neutral Disagree Strongly
Disagree
6. Working capital
management enhances
liquidity and profitability
7. There is better access
to markets when you
enhance liquidity in the
organisation
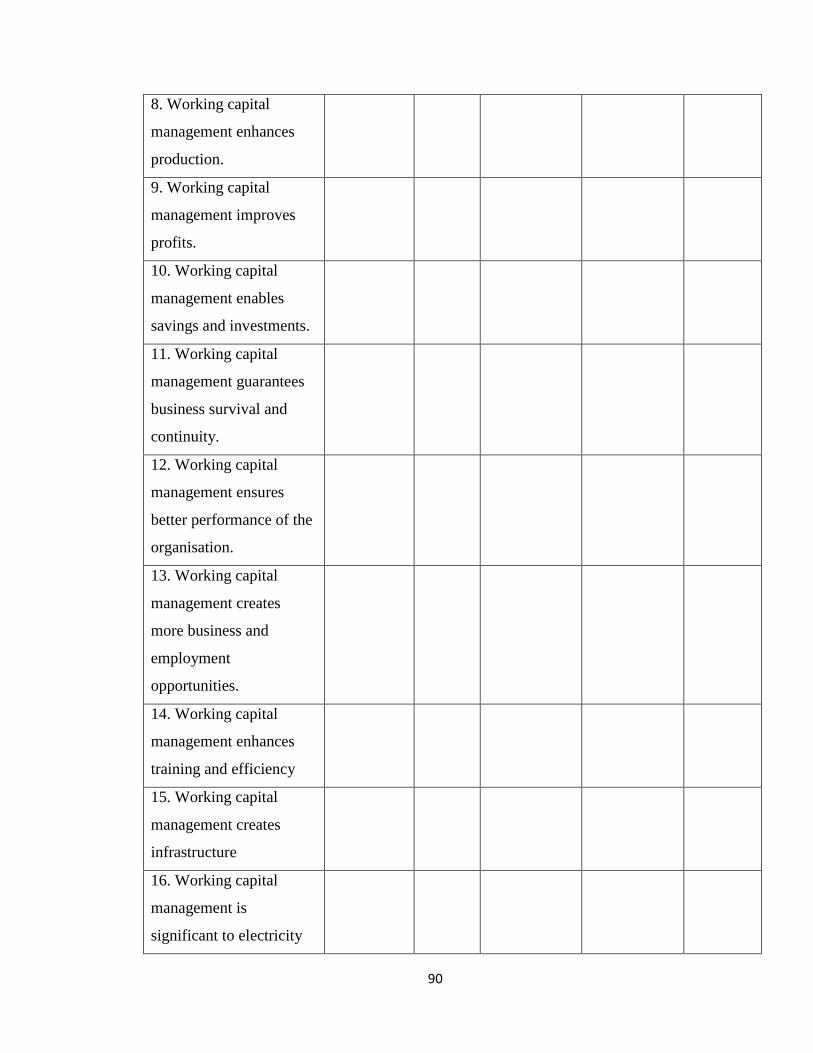
90
8. Working capital
management enhances
production.
9. Working capital
management improves
profits.
10. Working capital
management enables
savings and investments.
11. Working capital
management guarantees
business survival and
continuity.
12. Working capital
management ensures
better performance of the
organisation.
13. Working capital
management creates
more business and
employment
opportunities.
14. Working capital
management enhances
training and efficiency
15. Working capital
management creates
infrastructure
16. Working capital
management is
significant to electricity

91
distribution sector
Comments…………………………………………………………………………………
……………………………………………………………………………………………
……………………………………………………………………………………………
……………………………………………………………………………………………
Thank you for your cooperation.

92
APPENDIX 2: CONSENT LETTER
93
APPENDIX 3: LANGUAGE & COPY –EDITING CERTIFICATE


