Download - The impacts of watershed management on land use and land cover dynamics in Eastern Tigray (Ethiopia)
1
The impacts of watershed management on land use and land cover
dynamics in Eastern Tigray (Ethiopia)
Fikir Alemayehu1,2*
, Nurhussen Taha1, Jan Nyssen
3, Atkilt Girma
1, Amanuel Zenebe
1,
Mintesinot Behailu1, Jozef Deckers
4, Jean Poesen
4
1Department of Land Resource Management and Environmental Protection, Mekelle
University, P O Box 231, Mekelle, Ethiopia
2Melca Mehaber, P.O.Box 110533,Addis Ababa,Ethiopia
3 Department of Geography, Ghent University, Krijgslaan 281 S8, B-9000 Gent,
Belgium
4Department of Earth and Environmental Sciences, Katholieke Universiteit Leuven,
Celestijnenlaan 200E, B-3001 Leuven, Belgium
Abstract
Integrated watershed management (IWSM) was implemented to address issues of
poverty and land resource degradation in the 14 500 ha upper Agula watershed, in
semiarid Eastern Tigray (Ethiopia), an area known for poverty and resource
degradation caused by natural and man-made calamities. The purpose of this study
was to assess the impact of IWSM and determine the land use and cover dynamics
that it has induced.
The change in land use and cover was assessed by integrating remote sensing and
geographic information systems (GIS). Two sets of aerial photographs (taken in 1965
and 1994 at scale of 1:50,000) and Landsat ETM+ image (taken in 2000 with 30 m
resolution) were used to produce the land use/land cover map and assess land use
change.
The results reveal significant modification and conversion of land use and cover of
the watershed over the last four decades (1965-2005). A significant portion of the
watershed was continuously under intensively cultivated (rainfed) land. The area
under irrigation increased from 7 ha to 222.4 ha post intervention. The area under
dense forest increased from 32.4 ha to 98 ha.
* Corresponding author: [email protected]
Fikir Alemayehu, Nurhussen Taha, Nyssen, J., Atkilt Girma, Amanuel Zenebe, Mintesinot Behailu,
Deckers, J., Poesen, J., 2009. The impacts of watershed management on land use and land cover
dynamics in Eastern Tigray (Ethiopia). Resources, Conservation & Recycling, 53: 192-198.
2
The study further shows that IWSM decreased soil erosion, increased soil moisture,
reduced sedimentation and run off, set the scene for a number of positive knock-on
effects such as stabilization of gullies and river banks, rehabilitation of degraded lands.
IWSM also resulted in increased recharge in the subsurface water.
This study reconfirms the importance of IWSM as a key to improve the land use
cover of the watershed towards poverty alleviation and sustainable livelihood.
Key words: Integrated watershed management, land use and cover change, remote
sensing, geographic information system (GIS), soil and water conservation,
catchment management
1 Introduction
Land use describes the way and the purposes for which human beings employ the land
and its resources. Land cover refers to physical characteristics of the land including
human-made structures, which make up the earth’s landscape. Historically, land use
and cover changes have occurred primarily in response to population growth,
technological advances, and economic opportunity (Turner et al., 1995). Human
activities have directly or indirectly modified the natural environment. This is due to
the fact that production demands by humans cannot be fulfilled without modification
or conversion of land cover. Of the challenges facing the earth over the next century,
land use and cover changes are likely to be the most significant (Mustard et al., 2005).
On a global scale, forest, woodland, and grassland have been converted to other uses
during the last three centuries one way or another, to support and satisfy the
increasing demands of the society and economy (Agarwal et al., 2000). Human
intervention caused change in land use such as land clearing, agricultural
intensification, and urbanization, are currently the most consequential components of
global change (Munasinghe and Shearer, 1995).
.
3
The consequence of modern society’s demand for more production to meet its
consumption will inevitably result in major modification and conversion of land cover.
Pressures to further convert or manage natural ecosystems for human needs as well as
capturing more of the global net primary productivity are also likely to increase
(Mustard et al., 2005).
Understanding the implication of past, present and future patterns of human land use
for biodiversity and ecosystem function is increasingly important in landscape
ecology (Turner et al., 2003). Historical land use and cover patterns are a means to
evaluate the complex causes and responses in order to better project future trends of
human activities and land use/land cover change. If land use/land cover changes are
not carried out scientifically, the negative impacts on both the environment and the
socio-economic settings are not easily measurable (Gete, 2000). The study of land
use/land cover to yield valuable information for analysis of the environmental impacts
of human activities, climate change, and other forces (Belay, 2002). This has been
particularly important, as changes in land use become more rapidly affecting the
livelihoods of societies. Thus, understanding land use and land cover dynamics of an
area plays a significant role to take corrective measures on land and its use for
sustainable productivity.
This paper presents the land use and land cover dynamics observed after the
implementation of integrated watershed management in Northern Ethiopia. Watershed
management practices are changes in land use, and vegetation cover, with the main
objective of rehabilitation of degraded lands, protection of soil and water systems.
The aim of integrated watershed management is to improve the standard of living of
the population living within the watersheds: decrease population pressure and increase
land productivity so that sustainable livelihoods and land use practices can be secured
4
for the population (McCormick et al. 2003). Integrated watershed management
(IWSM) is a multi-objective and multi-disciplinary approach to solving natural
resource management and food security problems in rural communities, particularly
in dry and semi-arid areas where rainfall is scarce (Igbokwe and Adede, 2001). The
overall aim of integrated watershed management is, therefore, to ensure sustainable
natural resource use and equitable growth of communities.
The replicability of land resource management can be justified, if the intervention
approach and the impacts are well assessed and studied. Thus, the research addresses
the impacts of integrated watershed management and the changes that have followed
on land use and land cover dynamics. The aims of this paper are therefore (a) to
assess the land use and cover change that occurred between 1965 and 1994, and
between 1994 and 2005; and (b) to assess the effects of the watershed management on
curbing land degradation and improving agricultural production.
2 Materials and methods
2.1 Site description
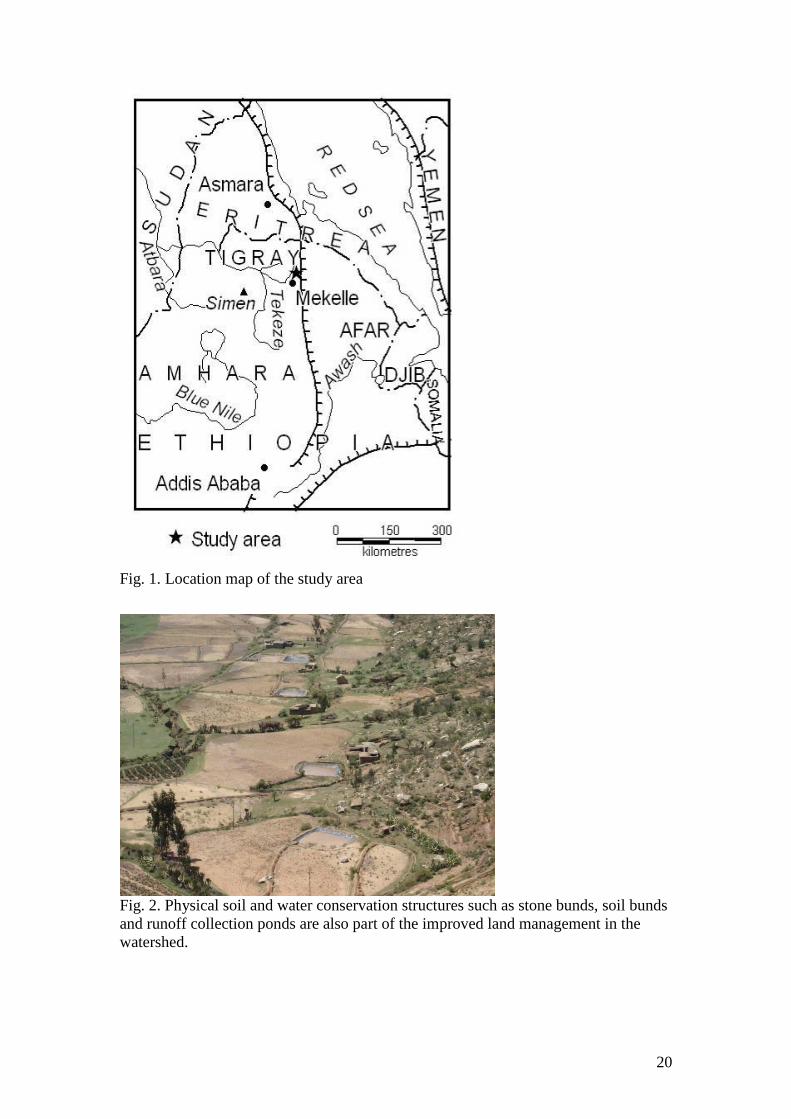
The upper Agula watershed where the study was carried out lies between 13°45' to
13°55' N and 39°42' to39°48' E in Eastern Tigray (Fig. 1). The total area of the study
site is 14 500 ha. The area falls in the semi-arid agro-climatic zone having highly
dissected and rugged terrain. The altitude of the study area ranges from 2040 to 2840
m a.s.l. Agro-ecologically it is classified as highland and midland areas with mean
annual air temperature of 22.8 o
C and maximum 27.2oC and an annual precipitation
ranging from 515 mm to 872 mm (Gebremedhin, 2004). The area has a bimodal
rainfall pattern. The small rains occur between November and March and the major
rainy season from June to September. The small rains are not reliable and insufficient
5
for crop production. Soils are predominantly light coloured, sandy mainly of
metamorphic origin (Gebremedhin, 2004). Subsistence agriculture is the major stay
of livelihood of the people. The major crops of the study area are barley (Hordeum
vulgare), wheat (Triticum sativum), teff (Eragrostis teff) and millet (Eleusine
coracana).
The erratic rainfall coupled with poor soils and a low ground cover and a high human
and livestock population pressure on land resources have contributed to a multitude of
serious problems, such as degradation of vegetation cover, accelerated soil erosion,
crop yield decline and human suffering. To address these serious and urgent problems
Integrated Watershed Management measures are underway in Upper Agula watershed
since 1998. The project has been implemented by Eastern Tigray Development
Programme with the support of Irish Aid. It was a three years resource management
and development project. The purpose of this intervention was to adopt integrated
watershed management as a technological intervention averting the land degradation
and restoring a farming system with a scope for modern agriculture (Fig. 2). The
components of the intervention include: physical and biological soil and water
conservation, (including gully stabilization, hill side terracing, exclosures and planting
on hill slopes (forage grass and (multi-use) trees) , irrigation, horticulture, beekeeping,
and improved crop technology. The budget for the implementation of various
activities was 166,666 € (Igbokwe and Adede, 2001).
6
2.2 Data source and analysis of time series images
The research focuses mainly on detecting changes, delineatin, and mapping areas that
have experienced land use/land cover change over a forty year time period (1965-
2005) using aerial photographs and Landsat imagery.
The data for land use/cover were obtained from aerial photographs of 1965 and 1994,
with an approximate scale of 1:50,000. In order to detect the change after intervention,
a satellite image (Landsat with 30 m resolution taken on February 2000) was analysed.
Contour lines were digitized from 1:50,000 topographic maps with 20 m contour
interval. The digitized contours were interpolated to produce a Digital Elevation
Model (DEM) in ILWIS GIS software. DEM was used to transform the aerial photos
to orthophoto for the delineated area.
Aerial photographs, satellite images, and topographic maps were geo-referenced using
50 ground control points collected from GPS readings. From the geo-referenced aerial
photographs an orthophoto mosaic was created. Processing of images was carried out
using ILWIS GIS software and Arc view (version 3.2) software.
Preliminary aerial photo interpretation and classification of each land use/land cover
type was delineated from aerial photos (1965 and 1994) using mirror stereoscope.
Normalized Difference Vegetation Index NDVI was produced from TM band 4 and
TM band 3 that is (TMB4-TMB3)/ (TMB4+TMB3) to enhance the land cover of the
study area. The land use/land cover classes from the Landsat image were produced
from visual interpretation and digitized on screen using ILWIS GIS software.
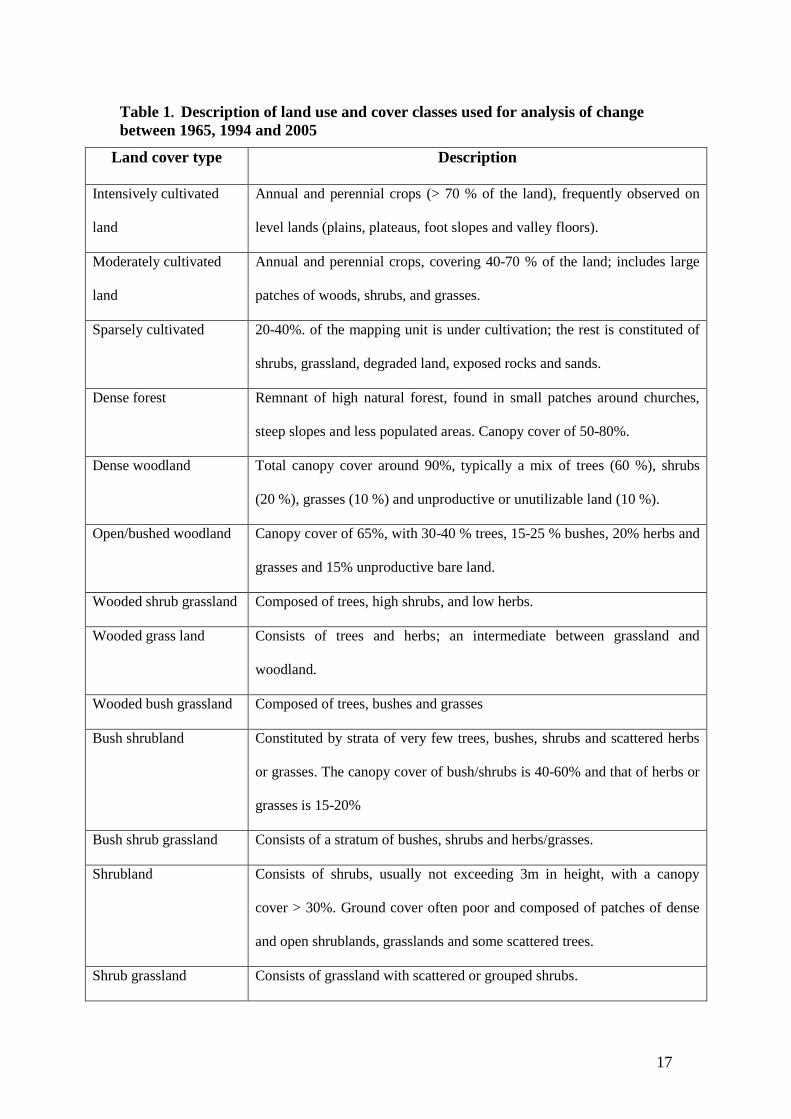
The description given for land use land cover classification was adapted from the
Land use and land cover of Tigray region prepared by BoANRD (2001) (Table 1).
However intensive field survey was carried out to check the preliminary interpretation
7
and necessary corrections were taken. The field assessments were conducted with
help of mobile pocket computer (IPAQ GPS mounted) which holds the geometrically
corrected aerial photographs and satellite image interpretation maps. The field survey
helped to update the (2000) Landsat image in order to generate the current land use
and cover map for 2005.
In addition to data collected from image processing, focused group discussions were
organised to obtain information around specific topics allowing different groups of
people to express their opinion and views and reflect on key issues such as natural
resources management, land use and land cover dynamics and environmental change.
Moreover a total number of 90 households were selected for this study. After
acquiring the list of households, a systematic random sampling procedure used to
select a total of 90 sample households. For the purpose of this study both structured
and semi-structured (with open and close end questions) questionnaires were prepared
to conduct the research. The survey had a set of questions related to demographic
characteristics, crop and livestock proportion, household assets on (land holding,
livestock, beehives e.t.c.), land use and management, were the main issues included
(both before and after intervention with a marked year).
3 Results
3.1 Land use and land cover change detection over the period 1965-2005
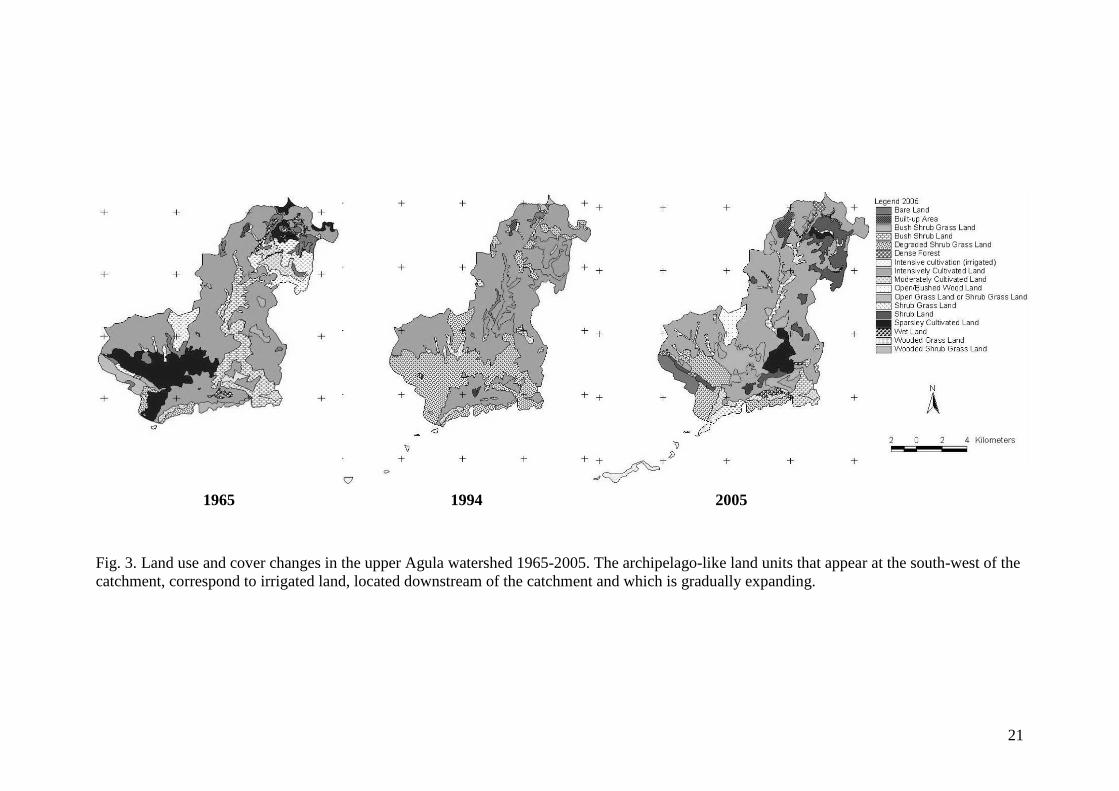
Eighteen major land use and cover types were identified. (Table 2 and Fig. 3). During
the period 1965-2005 intensively cultivated land constituted more than 50 % of the
catchment (Table 2 and Fig. 4). Detection of land use and cover for a period of four
decades showed a change on dense forest, bush shrub land, shrub land, built up area
8
and wetland (Fig. 4). The area under assured well irrigation increased from 7.1 ha to
222.4 ha after the intervention. Correspondingly, the area under dense forest increased
from 32.5 ha to 98 ha (Fig. 5).
In 1994 important changes in land use and cover were observed: wooded shrub
grassland, shrub grassland, bare land and wet land ceased to exist. On the other hand
new land cover types emerged in 1994. These include dense woodland (5.6 ha),
open/bushed woodland (10.9 ha) and wooded grassland (192.4 ha). (Table 2).
However, in 2005 the land cover types wetland and bare land re-emerged (Table 2
and Fig 3. and Fig. 4).
3.2. Observed changes on vegetation, soil, groundwater and farm produce
following the watershed management
The conservation efforts implemented in 1998 were to reduce soil erosion and to
maintain or improve the productive capacity of soil resources. Thus, following the
IWSM interventions, observations focussed on reduction of soil loss, vegetation cover,
soil moisture increase and land productivity. The combination of different soil and
water conservation measures had the potential to reduce surface run-off and erosion,
this in turn increase infiltration. Before the intervention, most of the study area used to
be affected by recurrent flooding hazard coming from the upper slopes and sediment
deposition took place; 50% of the respondents living in the middle of the catchment
were affected. After the implementation the problem of flood hazard and
sedimentation in the middle watershed was completely solved.
Since 2003, 115 wells have been developed in the study area. Most of the wells are
found on the middle catchment, where the ground water gives a good response to
increased infiltration on the upper slopes. Here, water is available within 1-2 m, while
9
in the lower catchment water depth is between 8-10 m. The availability of wells has
opened up an opportunity for 97 households to grow crop and vegetables twice a year.
On the eastern slopes of the catchment, honey production is important. This is related
to the increased availability of water (development of new water resources), and
improvements in the ecology of the adjacent area through exclosure measures. Before
intervention traditional hives were used by respondents, and the honey obtained was
in the range 4-5 kg/harvest. After the intervention, respondents indicated that honey
obtained from modern beehives has increased tremendously and has now reached 20-
25kg/harvest and farmers are able to harvest twice a year.
Before the intervention very few households had knowledge on how to make different
kinds of physical structures of SWC to prevent soil erosion. After the intervention,
most households in the survey (89%) have adopted and practice stone-faced trench
bunds and hillside terracing. These conservation measures are easily replicable and
cheap and the practice is spreading to other areas at a fast rate. 50% of farmers are
preparing compost in the house or on their plots so as to keep the fertility of the soil.
75% of households are planting trees on their own plots or around the homestead with
the purpose of protecting farm fertility and supplementing incomes. 45.6% of
households now have access to irrigable land, 60% of them have improved their
houses into tin-roofed structures and 60% of respondents now have food available
from 5-8 months.
Adoption of conservation agronomic practices in the watershed resulted in better
productive performance of crops over time due to decrease in soil erosion and
enrichment of the soil. The three most important crops (teff wheat and barley) have
all shown marked yield increases between 1997 and 2004. Specifically, average teff
yields have increased from 0.3 t/ha to 0.6 t/ha, wheat has increased from 0.5 t/ha to
10
0.8 t/ha and barley has increased from 0.45 t/ha to 0.75 t/ha. Combined with increased
fertilizer use, the adoption of conservation agronomic practices in the watershed
resulted in better productive performance of crops due to decreases in soil erosion, in
flooding and to enrichment of the soil.
4. Discussion and conclusions
4.1. Causes of land use and land cover changes between 1965 and 1994
Remote sensing and GIS based change detection studies have predominantly focused
on providing the knowledge of how much, where, what type of land use and land
cover change has occurred (Weng, 2002). The aerial photo interpretation reveals that
there was an expansion of cropland between 1965 and 1994. During this period
sparsely cultivated land, wooded shrub grass land and shrub grass land have vanished.
This is due to population pressure which results in the expansion of agricultural land
and settlement. The predominant motive for land use change is production of food and
fibre (Mustard et al., 2005). As stated by the farmers, the catchment was covered
mainly by natural vegetation until the 1960s, with dominance of Juniperus and Acacia.
Still the remnants of these trees are found around churches and communal areas in
small patches. Furthermore, growing pressure from human and livestock population
and the repeated drought conditions caused forest devastation for fuel wood trade as a
means of income to overcome the drought period.
The 1965 aerial photographs show the presence of wetland in plain areas following
valley bottoms and along rivers in the catchment. Farmers confirmed that they used
the wetland for grazing purposes. However, this land cover feature had disappeared in
1994 due to mainly removal of vegetation cover. Change in vegetation cover can alter
11
surface fluxes of energy and water and modify surface climate (Mustard et al., 2005).
Consequently, human induced soil degradation was exacerbated.
4.2. Causes of land use and land cover change between 1994 and 2005
The rehabilitation of vegetation in many places of the catchment has improved the
forest cover. Farmers also confirmed during focus group discussions, that the
vegetation cover has increased and the change that has been observed at present was
the result of the intervention i.e. the establishment of exclosures. Riparian trees along
the valley bottoms following the rivers which had not been observed in 1994 have
developed in 2005. This was well observed during the field surveys. The trees were
planted during the forestation activities to stabilize gullies.
Though their numbers are small, remnants of natural forests are found around
churches and on steep slopes. The degraded shrub grassland which covered a large
portion of the watershed in 1994 was generally converted into other cover types such
as shrub-grassland. This was observed during field surveys in which the vegetation
cover that was very small and scattered in 1994 has at present grown up and changed
into shrub-land, bush shrub grassland and bush-grassland. In some areas trees 3 m tall
and above were observed. Hence the improvement of the vegetation cover has
certainly been the result of the extensive soil and water conservation work that had
been implemented in the study area. The 1994 aerial photograph analysis results show
that intensively cultivated land constituted a larger portion of the catchment (55.11%),
when compared with 1965 (51.1%) and 2005 (51.7%). The above changes explain the
reduced bush and shrub cover in 1994.
On the other hand, a remarkable increment was observed in built up areas compared
with 1994. This change was the result of the expansion of the two towns Atsbi and
12
Haike Meshal. The two towns were still small on 1994 and recently both towns are
expanding at the expense of cultivable and grazing land.
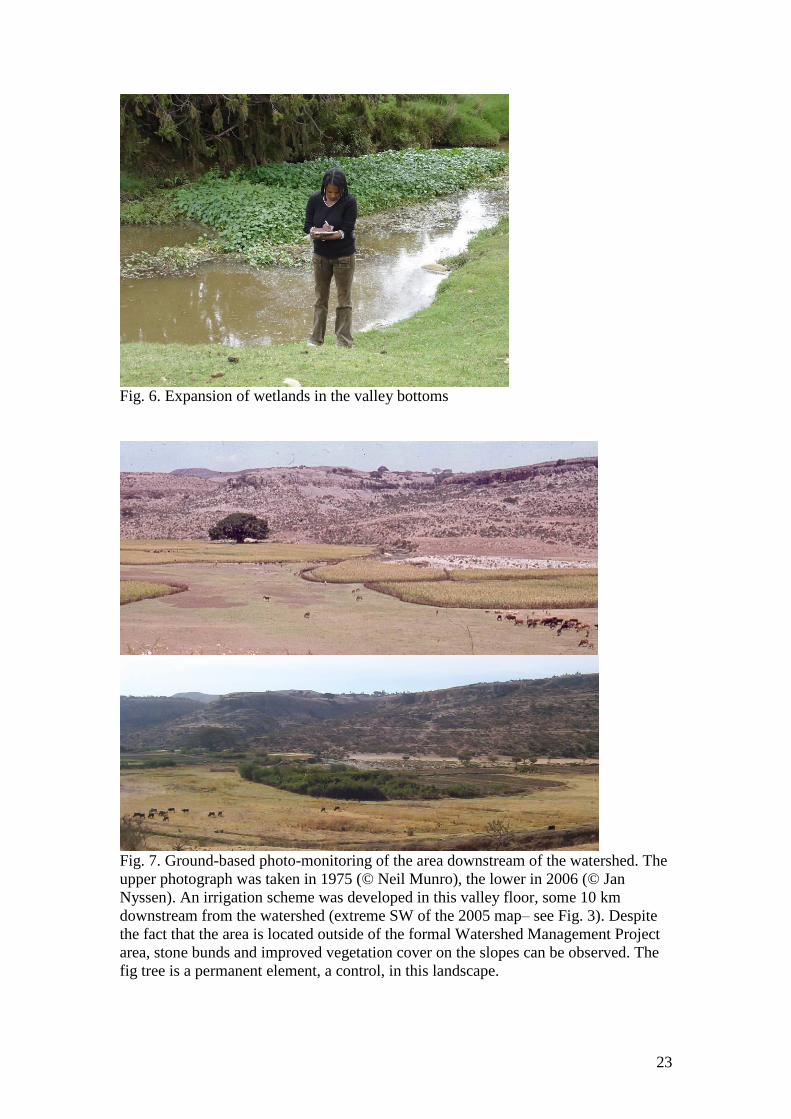
The wetland that had disappeared in 1994 re-emerged in 2005 (Fig. 6.). The wetland
has indeed developed as a consequence of extensive gully treatment to prevent
flooding and erosion. A review by Nyssen et al. (2004) indicates the benefits of soil
and water conservation (SWC) measures in controlling runoff and soil erosion.
Wetland development of the flat plain area in the lower and middle catchment is
attributed to SWC structures such as check dams in gullies and trenches dug to
intercept and store runoff. Farmers stated this cover type is a recent phenomenon
following the stabilization of gullies. The emergence of wetland is attributed to the
improvement of vegetation cover and the intensive soil conservation measures
undertaken in the upper watershed. This change is taken as an indicator of the success
of the SWC measures, because following the emergence of wetland there has been an
increase of the groundwater table which is tapped through shallow wells.
4.3. The impacts of IWSM on land use and cover change
The erratic rainfall coupled with poor soil and ground cover and high human and
livestock population pressure on land resources have contributed to a number of
serious problems, such as degradation of vegetation cover, accelerated soil erosion,
crop yield decline and human suffering.
The major observed changes during the last four decades were the conversion of
forest land, bush, shrub, and woodland to cropland, grazing land, and built-up areas.
A similar land use and cover study made by Solomon (1994) in southern Ethiopia
indicated that the influence of land use and cover depends very much on the nature of
the land and the level of management techniques used. The rapid changes in land use
13
and cover of the study area has been driven by factors such as population pressure,
expansion of rural towns, large-scale overgrazing, and recurrent drought and poor
land management. Marked land use/land cover dynamics are also observed in dense
forest, wetland, shrub-land, and intensively cultivated (irrigation) land.
The positive impact of the watershed management in the study area could be
explained in terms of reduced soil erosion rates, increased soil moisture availability
which could be deduced from the increased in crop production, reduced sedimentation
and flooding problems in the lower parts of the watershed, stabilized gullies and river
banks, rehabilitation of degraded lands and improved ecological balance in general.
Similar studies elsewhere in northern Ethiopia (Woldeamlak, 2003; Liu et al., 2008;
Munro et al., 2008; Nyssen et al., 2008) reported the effectiveness of sustained
conservation efforts at catchment level in controlling soil erosion and in improving
hydrology and land productivity. The improvement of vegetation cover in the
watershed decreased the depth to the groundwater which could be managed and used
for irrigation.
4.4. Conclusion
The studied watershed underwent remarkable changes in land use and covers during
four decades and the changes exhibit a dynamic nature. Throughout the period 1965-
2005 more than half of the watershed was occupied by intensively cultivated land.
Over the forty years observation period, the area under assured well irrigation
increased from 7.1 ha to 222.4 ha (see also Fig. 7). The area under dense forest
increased from 32.5 ha to 98 ha.
14
Major observed changes after the implementation of integrated watershed
management are: reduced soil erosion, and increased soil moisture availability which
could be explained by the increase in crop production, increased ground water
recharge (as observed in the abundance of shallow wells), reduced sedimentation and
run off problems in the lower parts of the watershed, stabilized gullies and river banks,
rehabilitation of degraded lands and improved ecological balance, introduction of
modern beehives and increase in honey production.
To conclude, ecological changes caused by the destruction of natural vegetation,
removal of soil by erosion and drying out of rivers as the result of mismanagement of
land have been reversed as a result of the integrated watershed management
intervention. While the IWSM intervention researched shows encouraging results for
both vegetation cover and farmer livelihoods, in order to be sustainable, it is essential
to maintain a high level of farmers participation. The study highly recommends the
up-scaling of such intervention in similar agro-ecologies.
Acknowledgements
The authors wish to thank Habtamu Mulatu, Fekadu Getnet, Ermiyas Ayenekulu and
Steven Fisher for their useful comments and suggestions that helped to improve this
paper. Funding for this study was provided by the VLIR - Mekelle University IUC
Programme. Farmers and authorities from Hayke Meshal and surrounding villages are
greatly acknowledged for their hospitality.
References
Agarwal, C., Green, M.G., Grove, J.M., Evans, T.P., and Schweik, C.M., 2000. A
Review and assessment of land use change models. Dynamics of space, time,
and human choice. Center for the Study of Institutions, Population, and
Environmental Change, Indiana University, and USDA Forest Service,
Northeastern Research Station, South Burlington, VT, USA, 90 p.
15
Belay Tegene, 2002 Land use/land cover changes in the Derekolli catchment of the
South Welo zone of Amhara region, Ethiopia. EASSRR, Vol.XVII, no.1, 20 p.
Bureau of Agriculture and Natural Resources, 2001. Land use land cover of Tigray.
Land Use Planning and Regulatory Division. Mekelle, Tigray, Ethiopia, 213 p.
Gebremedhin, T., 2004. Assessing and mapping areas susceptible to water erosion
using integrated remote sensing GIS tools and minimal ground survey in the
Atsibi sub-Watershed. A case study in Tigray region, Ethiopia. International
Institute for Geo-information Science and Earth Observation, Enschede, The
Netherlands.
Gete Zeleke, 2000. Landscape dynamics and soil erosion process modeling in the
North- Western Ethiopian highlands. PhD thesis, Institute of Geography,
University of Berne, Switzerland.
Igbokwe, K.N., and Adede, J., 2001. Integrated watershed management in Eastern
Tigray-Ethiopia. Mid term impact evaluation report, Nairobi, Kenya, 72 p.
Liu, B.M., Collick, A.S., Gete Zeleke, Enyew Adgo, Easton, Z.M., and Steenhuis,
T.S., 2008. Rainfall-discharge relationships for a monsoonal climate in the
Ethiopian highlands. Hydrological Processes 22(7), 1059-1067.
McCormick, P.G., Kamara, A.B., and Girma Tadesse, (eds), 2003. Integrated water
and land management research and capacity building priorities for Ethiopia.
Proceedings MoWR/EARO/IWMI/ILRI international workshop at ILRI,
Addis Ababa, Ethiopia, 2-4 December 2002. IWMI (International Water
Management Institute), Colombo, Sri Lanka, and ILRI (International
Livestock Research Institute), Nairobi, Kenya.
Munasinghe, M., Shearer, W., 1995. Defining and measuring sustainability. The
Biogeochemical Foundation. The United Nations University (UNU) and the
World Bank, Washington, D.C.
Munro, R.N., Deckers, J., Mitiku Haile, Grove, A.T., Poesen, J., Nyssen, J., 2008.
Soil landscapes, land cover change and erosion features of the Central Plateau
region of Tigrai, Ethiopia: Photo-monitoring with an interval of 30 years.
Catena, 75: 55-64.
Mustard, J. F., Defries, R.S., Fisher, T., Moran, E., 2005. Land use and land cover
change pathways and impacts. In: Gutman, G., Janetos, A.C., Justice, C.O.,
Moran, E.F., Mustard, J.F., Rindfuss, R.R., Skole, D., Turner, B.L., Cochran,
M.A. (eds.). Land Change Science: Observing, Monitoring, and
16
Understanding Trajectories of Change on the Earth's Surface. Kluwer
Academic Publishers, Dordrecht, The Netherlands: 411-429.
Nyssen, J., Getachew Simegn, Nurhussen Taha, 2008. A permanent upland farming
system under mutation: drivers of land use change in Bela-Welleh catchment
(Wag, northern Ethiopian highlands). Soil and Tillage Research, in press.
Solomon Abate, 1994. Land use dynamics, soil degradation and potential for
sustainable use in Metu Area, Illubabor Region, Ethiopia. University of Berne
Switzerland, Institute of Geography. 119 pages.
Turner, B.L., Skole, D., Sanderson, S., Fischer, G., Fresco, L., Leemans, R., 1995.
Land Use Land Cover Change Science/Research Plan. Publications IHDP
Report series, Report number 07. (www.ihdp.uni-
bonn.de/html/publications/report07/luccsp.htm)
Turner, M.G., Person, S.M., Bolstad, P., and Wear, N.D., 2003. Effects of land-cover
Change on spatial pattern of forest communities in the Southern Appalachian
Mountains (USA). Landscape Ecology 18, 449-464.
Weng, Q., 2001. Land use change analysis in the Zhujiang Delta of China using
satellite remote sensing, GIS and stochastic modeling. Journal of
Environmental Management 64, 273-284.
Woldeamlak, B., 2003. Land Degradation and Farmers' Acceptance and Adoption of
Conservation technologies in the Digil watershed, Northwestern highlands Of
Ethiopia. Social Science Research Report Series (OSSRE), No. 29, 48 p.
17
Table 1. Description of land use and cover classes used for analysis of change
between 1965, 1994 and 2005
Land cover type Description
Intensively cultivated
land
Annual and perennial crops (> 70 % of the land), frequently observed on
level lands (plains, plateaus, foot slopes and valley floors).
Moderately cultivated
land
Annual and perennial crops, covering 40-70 % of the land; includes large
patches of woods, shrubs, and grasses.
Sparsely cultivated 20-40%. of the mapping unit is under cultivation; the rest is constituted of
shrubs, grassland, degraded land, exposed rocks and sands.
Dense forest Remnant of high natural forest, found in small patches around churches,
steep slopes and less populated areas. Canopy cover of 50-80%.
Dense woodland Total canopy cover around 90%, typically a mix of trees (60 %), shrubs
(20 %), grasses (10 %) and unproductive or unutilizable land (10 %).
Open/bushed woodland Canopy cover of 65%, with 30-40 % trees, 15-25 % bushes, 20% herbs and
grasses and 15% unproductive bare land.
Wooded shrub grassland Composed of trees, high shrubs, and low herbs.
Wooded grass land Consists of trees and herbs; an intermediate between grassland and
woodland.
Wooded bush grassland Composed of trees, bushes and grasses
Bush shrubland Constituted by strata of very few trees, bushes, shrubs and scattered herbs
or grasses. The canopy cover of bush/shrubs is 40-60% and that of herbs or
grasses is 15-20%
Bush shrub grassland Consists of a stratum of bushes, shrubs and herbs/grasses.
Shrubland Consists of shrubs, usually not exceeding 3m in height, with a canopy
cover > 30%. Ground cover often poor and composed of patches of dense
and open shrublands, grasslands and some scattered trees.
Shrub grassland Consists of grassland with scattered or grouped shrubs.
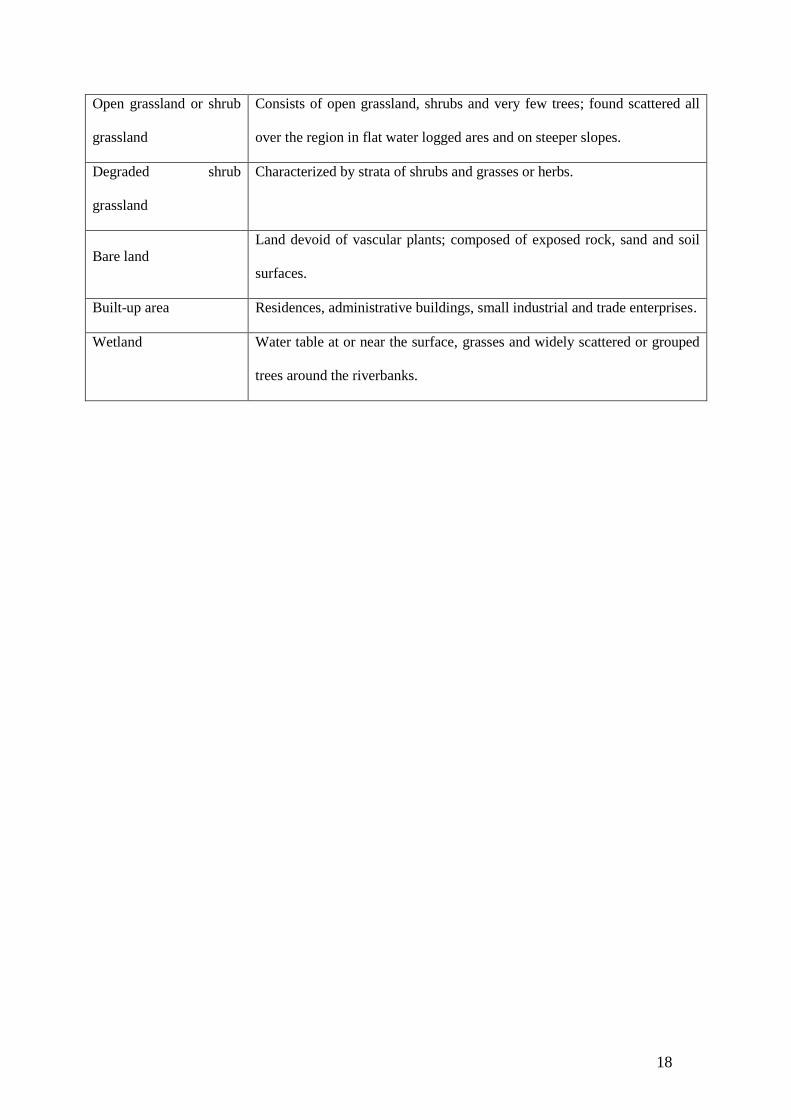
18
Open grassland or shrub
grassland
Consists of open grassland, shrubs and very few trees; found scattered all
over the region in flat water logged ares and on steeper slopes.
Degraded shrub
grassland
Characterized by strata of shrubs and grasses or herbs.
Bare land
Land devoid of vascular plants; composed of exposed rock, sand and soil
surfaces.
Built-up area Residences, administrative buildings, small industrial and trade enterprises.
Wetland Water table at or near the surface, grasses and widely scattered or grouped
trees around the riverbanks.
19
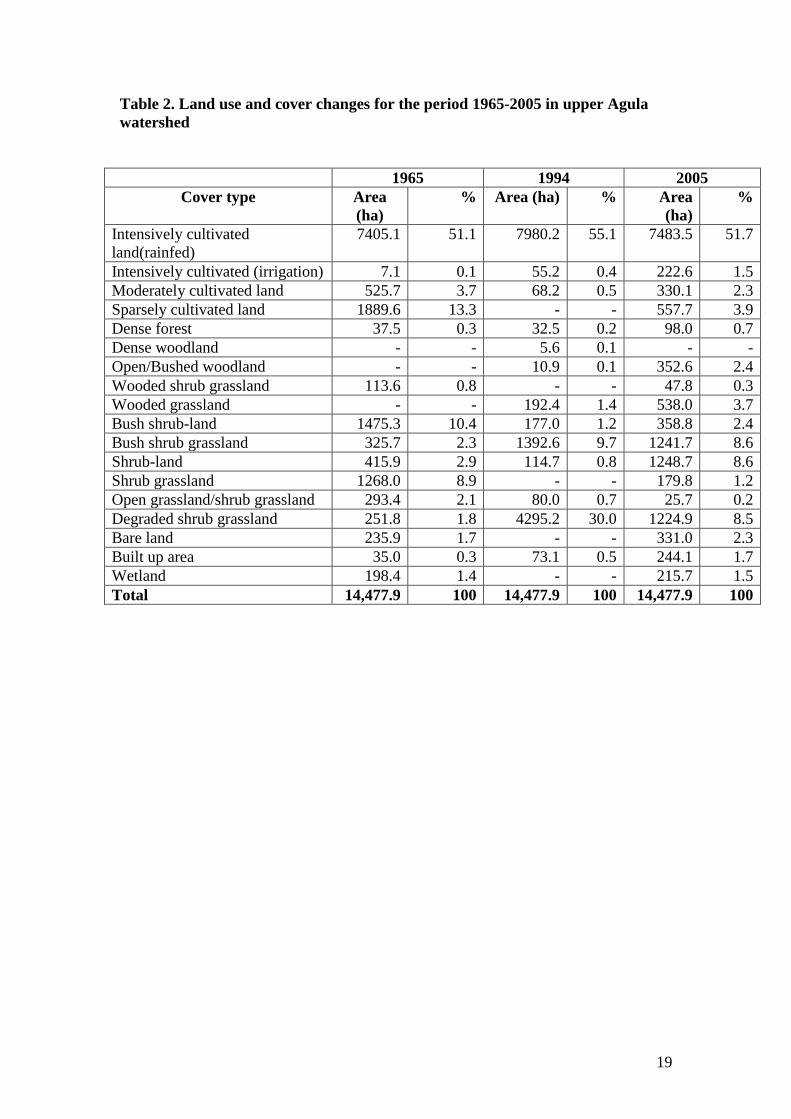
Table 2. Land use and cover changes for the period 1965-2005 in upper Agula
watershed
1965 1994 2005
Cover type Area
(ha)
% Area (ha) % Area
(ha)
%
Intensively cultivated
land(rainfed)
7405.1 51.1 7980.2 55.1 7483.5 51.7
Intensively cultivated (irrigation) 7.1 0.1 55.2 0.4 222.6 1.5
Moderately cultivated land 525.7 3.7 68.2 0.5 330.1 2.3
Sparsely cultivated land 1889.6 13.3 - - 557.7 3.9
Dense forest 37.5 0.3 32.5 0.2 98.0 0.7
Dense woodland - - 5.6 0.1 - -
Open/Bushed woodland - - 10.9 0.1 352.6 2.4
Wooded shrub grassland 113.6 0.8 - - 47.8 0.3
Wooded grassland - - 192.4 1.4 538.0 3.7
Bush shrub-land 1475.3 10.4 177.0 1.2 358.8 2.4
Bush shrub grassland 325.7 2.3 1392.6 9.7 1241.7 8.6
Shrub-land 415.9 2.9 114.7 0.8 1248.7 8.6
Shrub grassland 1268.0 8.9 - - 179.8 1.2
Open grassland/shrub grassland 293.4 2.1 80.0 0.7 25.7 0.2
Degraded shrub grassland 251.8 1.8 4295.2 30.0 1224.9 8.5
Bare land 235.9 1.7 - - 331.0 2.3
Built up area 35.0 0.3 73.1 0.5 244.1 1.7
Wetland 198.4 1.4 - - 215.7 1.5
Total 14,477.9 100 14,477.9 100 14,477.9 100
20
Fig. 1. Location map of the study area
Fig. 2. Physical soil and water conservation structures such as stone bunds, soil bunds
and runoff collection ponds are also part of the improved land management in the
watershed.
21
1965 1994 2005
Fig. 3. Land use and cover changes in the upper Agula watershed 1965-2005. The archipelago-like land units that appear at the south-west of the
catchment, correspond to irrigated land, located downstream of the catchment and which is gradually expanding.
22
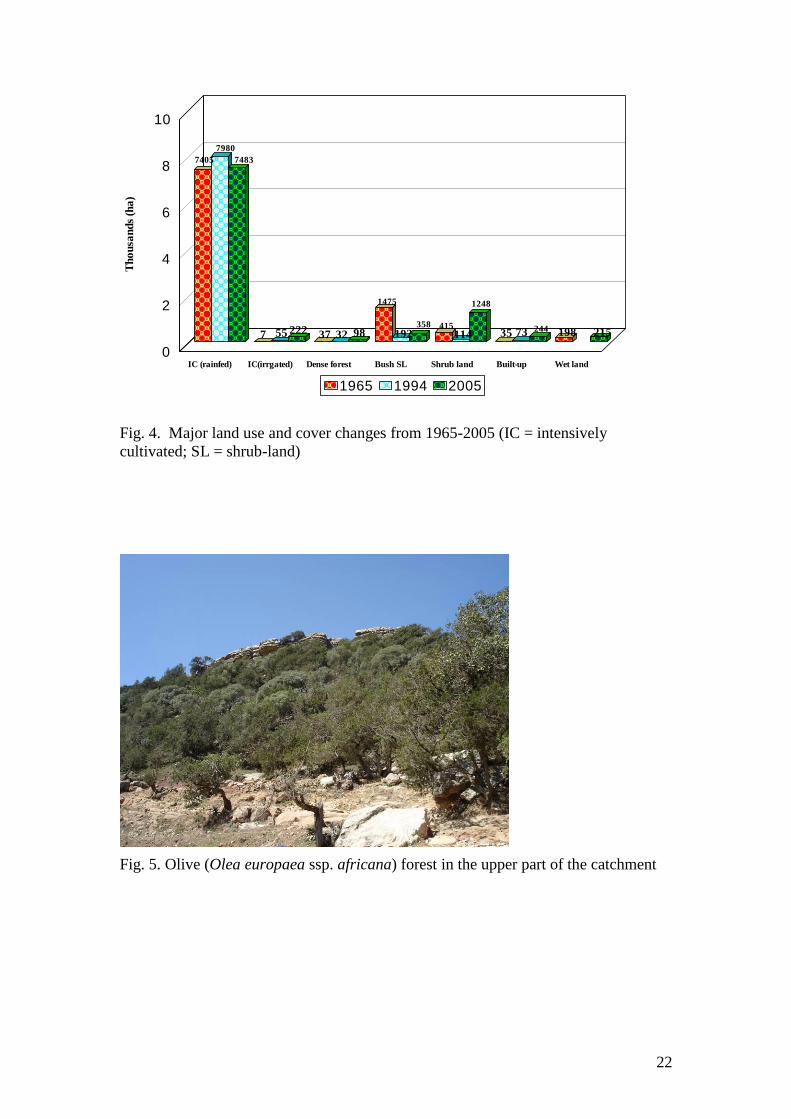
IC (rainfed) IC(irrgated) Dense forest Bush SL Shrub land Built-up Wet land
0
2
4
6
8
10T
ho
usa
nd
s (h
a)
1965 1994 2005
7405
7980
7483
222
1475
192358 415
114
1248
244 198 2157 37 32 98 35 7355
Fig. 4. Major land use and cover changes from 1965-2005 (IC = intensively
cultivated; SL = shrub-land)
Fig. 5. Olive (Olea europaea ssp. africana) forest in the upper part of the catchment
23
Fig. 6. Expansion of wetlands in the valley bottoms
Fig. 7. Ground-based photo-monitoring of the area downstream of the watershed. The
upper photograph was taken in 1975 (© Neil Munro), the lower in 2006 (© Jan
Nyssen). An irrigation scheme was developed in this valley floor, some 10 km
downstream from the watershed (extreme SW of the 2005 map– see Fig. 3). Despite
the fact that the area is located outside of the formal Watershed Management Project
area, stone bunds and improved vegetation cover on the slopes can be observed. The
fig tree is a permanent element, a control, in this landscape.


