impact of land cover change on water quality and stream flow in lake hawassa watershed of ethiopia
TRANSCRIPT
Agricultural Sciences, 2014, 5, 647-659 Published Online July 2014 in SciRes. http://www.scirp.org/journal/as http://dx.doi.org/10.4236/as.2014.58068
How to cite this paper: Kebede, W., Tefera, M., Habitamu, T. and Alemayehu, T. (2014) Impact of Land Cover Change on Water Quality and Stream Flow in Lake Hawassa Watershed of Ethiopia. Agricultural Sciences, 5, 647-659. http://dx.doi.org/10.4236/as.2014.58068
Impact of Land Cover Change on Water Quality and Stream Flow in Lake Hawassa Watershed of Ethiopia Wolka Kebede*, Mengistu Tefera, Taddese Habitamu, Tolera Alemayehu Wondo Genet College of Forestry and Natural Resources, Hawassa University, Hawassa, Ethiopia Email: *[email protected] Received 3 March 2014; revised 31 May 2014; accepted 27 June 2014
Copyright © 2014 by authors and Scientific Research Publishing Inc. This work is licensed under the Creative Commons Attribution International License (CC BY). http://creativecommons.org/licenses/by/4.0/
Abstract Quantifying the hydrologic response of land use/land cover change (LULCC) is of paramount im-portance to improve land management. This study was carried out to analyze the effect of LULCC on water quality and quantity. LULCC of the watershed in 1986, 1999 and 2011 was analyzed from Landsat satellite images using supervised classification. Time series and point data were collected from the upper and lower sections of Wedesa, Wesha and Hallo Rivers. Water quality parameters (turbidity, suspended solid (SS), total dissolved solid (TDS), pH, electric conductivity (EC), total organic carbon (TOC), ammonia, nitrate and phosphate) were analyzed in the laboratory. A consi-derable decline in forest and an increase in woodland were observed in the watershed during the indicated periods. Turbidity, SS, TDS and EC were significantly higher (P < 0.05) in the lower sec-tion of the rivers compared to the upper ones. Ammonia, nitrate and phosphate were higher in the lower section of some rivers compared to the upper ones. In general, water quality in the upper watershed of the three rivers was better than the lower one with respect to considered parame-ters, which might be related to the observed LULCC. Most water quality parameters varied (P < 0.05) seasonally in both the upper and lower sections of the rivers. Despite the irregular rainfall pattern and increased water consumption from the catchment, the annual discharge of the Ti-kur-Wuha River to Lake Hawassa shows an increasing trend. We concluded that the discharge is not only related to the upstream LULCC but also to the management of the Cheleleka wetland. However, further investigation is required to determine the dominant factors affecting inflow discharge to Lake Hawassa.
Keywords Discharge, Ethiopia, Lake Hawassa, Water Quality, Wetland
*Corresponding author.
W. Kebede et al.
648
1. Introduction The surface flow of watershed hydrology can be influenced by interactions between environmental conditions such as land use/land cover change (LULCC) and climatic characteristics. LULCC plays a key role in control-ling the hydrologic response of watersheds in a number of important ways [1]-[3]. Quantifying hydrologic res-ponses is crucial in developing countries with fast environmental and socio-economic drivers [4] for LULCC. Owing to these drivers, water quality and quantity have also become issues of global concern [5]. Even though conflicting reports exist on the impact of LULCC on seasonal and annual discharge of rivers [1]-[3] [6], most reports show that an agricultural catchment resulted in a higher peak flow and faster response time compared to a forested catchment. Decadal LULCC contributed to an increment of wet-season flooding, soil erosion and dry- season water shortages [7]. These hydrological responses are related to changes in infiltration and evapo-trans- piration rates [8] resulting in seasonal and long-term discharge variability of rivers. Moreover, decline in vegeta-tion cover and subsequent soil degradation can cause many of the threats related to water-flow extremes (peak and base flow) in varying seasons [1]-[3] [9].
The river water chemistry, which reflects water quality, can be influenced by land uses that determine nutrient export [10] and import [11]. However, interactions between land use/cover, water quality and watershed hy-drology are complex and vary with location and type of land use/cover [1]-[3] [12]. Thus, site-specific investi-gations are required.
Ethiopia is a country endowed with abundant water resources in its 12 basins. National annual surface runoff is estimated to be 123 Gm3 [7]. In recent decades, natural forest cover has declined and is blamed for contribut-ing to land degradation and water flow extremes. The impact of LULCC on hydrological responses was ob-served in the Choke mountain range [4], and Koga watershed on the Blue Nile basin [7]. These studies found significant changes in daily discharge, annual runoff and peak flow partly as a result of LULCC and/or degrada-tion of the watersheds due to destruction of natural vegetation cover, expansion of croplands and over-grazing.
The Eastern sub-watershed of Lake Hawassa watershed is dominated by hilly-mountainous terrain combined with flat wetlands in the lower section. Patches of natural forest remain in the upper watershed together with some plantations of mainly exotic species. Some studies conducted in the area so far verified significant land cover change over the last 40 years [13], including a major decrease in forest cover. However, little is known, on the subsequent impact of LULCC on water quality and stream flow dynamics. Thus, analyzing quality and dis-charge trends of water resources in relation to LULCC and rainfall is highly important for both the ecosystem and the people. Therefore, the objective of this study was to examine the hydrologic response of LULCC at the local scale. More specifically, the objectives were: 1) to analyze time series trends of LULCC; 2) to relate flow rate with land use/land cover change and rainfall pattern; 3) to analyze seasonal water quality dynamics in dif-ferent sections of the rivers within the watershed. We hypothesized that environmental and socio-economic drivers have resulted in LULCC, which ultimately changed the hydrologic characteristics of the watershed.
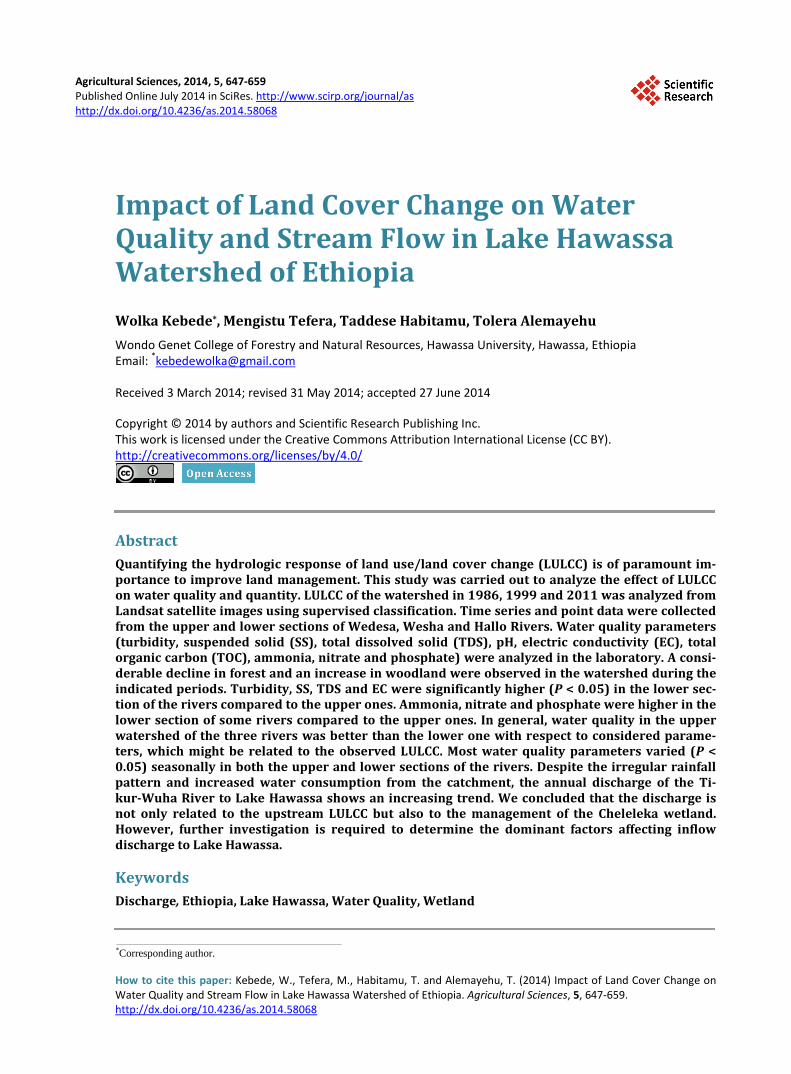
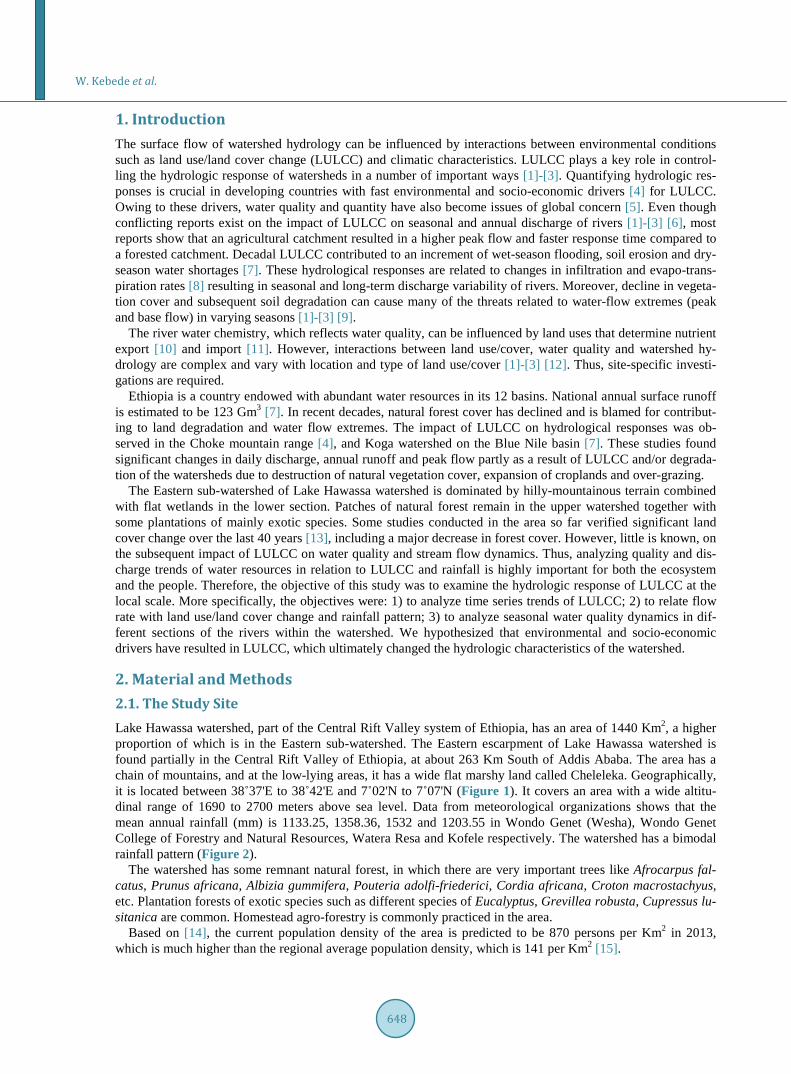
2. Material and Methods 2.1. The Study Site Lake Hawassa watershed, part of the Central Rift Valley system of Ethiopia, has an area of 1440 Km2, a higher proportion of which is in the Eastern sub-watershed. The Eastern escarpment of Lake Hawassa watershed is found partially in the Central Rift Valley of Ethiopia, at about 263 Km South of Addis Ababa. The area has a chain of mountains, and at the low-lying areas, it has a wide flat marshy land called Cheleleka. Geographically, it is located between 38˚37'E to 38˚42'E and 7˚02'N to 7˚07'N (Figure 1). It covers an area with a wide altitu-dinal range of 1690 to 2700 meters above sea level. Data from meteorological organizations shows that the mean annual rainfall (mm) is 1133.25, 1358.36, 1532 and 1203.55 in Wondo Genet (Wesha), Wondo Genet College of Forestry and Natural Resources, Watera Resa and Kofele respectively. The watershed has a bimodal rainfall pattern (Figure 2).
The watershed has some remnant natural forest, in which there are very important trees like Afrocarpus fal-catus, Prunus africana, Albizia gummifera, Pouteria adolfi-friederici, Cordia africana, Croton macrostachyus, etc. Plantation forests of exotic species such as different species of Eucalyptus, Grevillea robusta, Cupressus lu-sitanica are common. Homestead agro-forestry is commonly practiced in the area.
Based on [14], the current population density of the area is predicted to be 870 persons per Km2 in 2013, which is much higher than the regional average population density, which is 141 per Km2 [15].
W. Kebede et al.
649
Figure 1. The study site.
Figure 2. Climate diagram of the study site.
Middle and lower sections of Cheleleka watershed has been known for cash crop production, including su-
garcane and Catha edulis, which have replaced other forms of land use like natural forests, shrub-land and other agricultural crops. At the upper part of the watershed, Ensete ventricosum and cereals (Triticum aestivum and Hordeum vulgare) have been dominantly cultivated.
In this watershed, nine rivers namely Bele-Lango, Wesha, Werka, Hallo, Shenkora, Gomesho, Wedesa, Ab-osa, and Gelchacha flow and feed the Cheleleka wetland. However, three major ones were selected for this study purposively based on their sizes and spatial locations to represent the sub-catchment.
W. Kebede et al.
650
2.2. Methodology Time series and point data were collected for the investigation of water quality parameters. One discharge monitoring point was used as the data source for flow rate, and three period satellite images were used to assess land cover changes.
LULCC was assessed and mapped by interpreting Landsat satellite images from January 1986, 1999 and 2011 in ERDAS IMAGINE 9.1 and ArcGIS 9.3 software. Supervised classification procedures were applied. Varia-tions in land use/land cover were analyzed using descriptive statistics.
Climate data, mainly rainfall, was collected from metrological offices and Wondo Genet College of Forestry and Natural Resources. For water quality analysis, three rivers (Wesha, Hallo, and Wedesa) were purposively selected considering geographic location and observed discharge. For this purpose, each river’s watershed was divided into two sections, the upper and lower watershed, by taking the down slope end of the Abaro-Wijigira mountain chain as the dividing line between the upper and lower sections of the watershed. Biophysical charac-teristics of the upper watershed vary from the lower one due to topography, climate, altitude, human interference and land uses. The selected sampling points were at the down slope of the Abaro-Wijigira mountain chain for the upper watershed and at the inlets of Cheleleka wetland for the lower watershed. In February (dry season), three water samples were collected from each of the upper and lower watershed (section) of Wesha and Wedesa rivers. Since Hallo River has no water at the lower watershed during the dry season (DS) because of increased utilization for irrigation at the middle watershed, it was not sampled in this season. Thus, in DS 12 samples (2 Rivers * 2 section * 3 replications) were taken. In June, which marks the transition period (TP) from a short rainy season to a long rainy season, 18 samples (3 Rivers * 2 sections * 3 replications) were collected. In Sep-tember, which is in peak rainy season (RS), 18 samples (3 Rivers * 2 sections * 3 replications) were collected.
All samples were taken using plastic jars commonly used to seal purified drinking water. The samples were taken from the center of each river at each section, just below the surface of flowing water, by directing the opening of the sampler upslope. Samples were analyzed at Water Works Design and Supervision Enterprise la-boratory in Addis Ababa. The analyzed parameters were turbidity, suspended solids (SS), total dissolved solid (TDS), electrical conductivity (EC), pH, ammonia, total organic carbon (TOC), nitrate and phosphate.
Tikur-Wuha is the only permanent river that flows directly to Lake Hawassa from Cheleleka wetland. Nine rivers directly flow to the Cheleleka wetland.
So far, Tikur-Wuha is the only river that has been gauged in Lake Hawassa watershed. This flow rate data was obtained from Ethiopian Ministry of Water Resources and Energy. According to their data, the runoff from the eastern highlands that eventually drains via Tikur-Wuha into Lake Hawassa has an average annual inflow of 143 Mm3 of water with a 4.53 m3/s flow rate. The inflow has an annual sediment load of 1.7 Mm3 with an an-nual sediment yield of 1600 tones/km2/yr.
In addition, for flow rate dynamics of the three rivers, discussions were conducted with 24 key informants (8 in each river). The key informants were mainly elder people who lived many years in the area. Geographic dis-tribution of key informants within the specific river was also considered to explore experience from the wider area. For the ease of explanation, analyses, and observation, discussions were held in the field at the sides of each river. Variations in water quality due to seasons as well as between the upper and lower sections of rivers were analyzed using one-way ANOVA and T-test.
3. Result 3.1. Land Use/Land Cover Supervised classification of Landsat images acquired at different times has been performed to identify spatio- temporal patterns of the land use/land cover classes in the sub-watershed. Due to our familiarity to the study area, the interpreter identified five information classes of interest for supervised classification. Description of the LULCC classes is shown in Table 1.
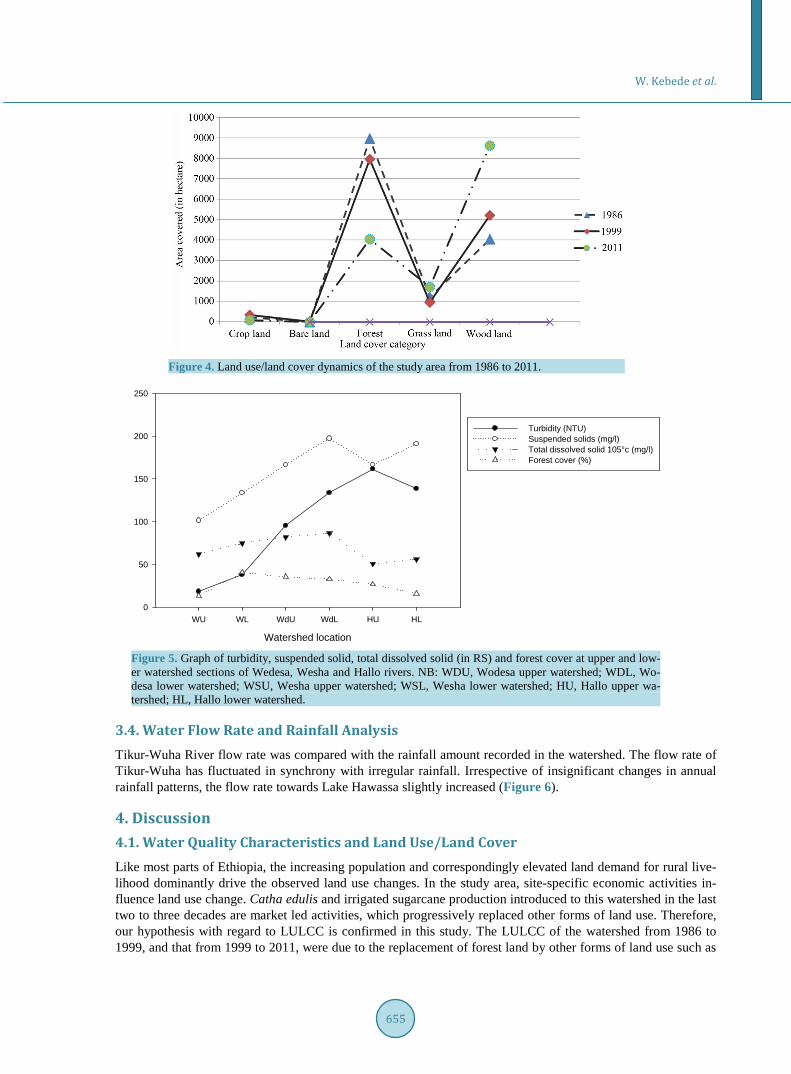
Based on results of the supervised classification of the three time images of the sub-watershed, between 1986 and 1999 (after 13 years), there was a 56.6% increase in cropland, 11.3% decrease in forest, 21.9% decrease in grassland and 28.7% increase in woodland (Table 2).
Between 1999 and 2011, there were 75.9% decrease in cropland, 49.2% decrease in forest, 79.7% increase in grassland, and 65.5% increase in woodland.
W. Kebede et al.
651
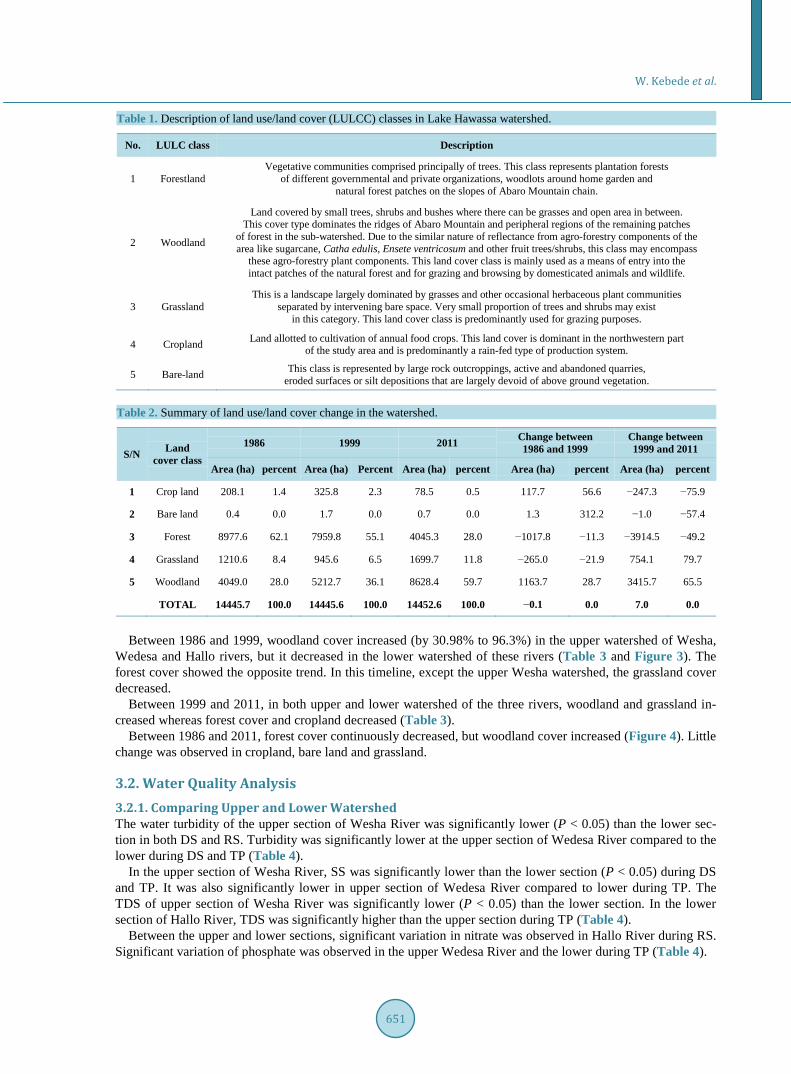
Table 1. Description of land use/land cover (LULCC) classes in Lake Hawassa watershed.
No. LULC class Description
1 Forestland Vegetative communities comprised principally of trees. This class represents plantation forests
of different governmental and private organizations, woodlots around home garden and natural forest patches on the slopes of Abaro Mountain chain.
2 Woodland
Land covered by small trees, shrubs and bushes where there can be grasses and open area in between. This cover type dominates the ridges of Abaro Mountain and peripheral regions of the remaining patches
of forest in the sub-watershed. Due to the similar nature of reflectance from agro-forestry components of the area like sugarcane, Catha edulis, Ensete ventricosum and other fruit trees/shrubs, this class may encompass
these agro-forestry plant components. This land cover class is mainly used as a means of entry into the intact patches of the natural forest and for grazing and browsing by domesticated animals and wildlife.
3 Grassland This is a landscape largely dominated by grasses and other occasional herbaceous plant communities
separated by intervening bare space. Very small proportion of trees and shrubs may exist in this category. This land cover class is predominantly used for grazing purposes.
4 Cropland Land allotted to cultivation of annual food crops. This land cover is dominant in the northwestern part of the study area and is predominantly a rain-fed type of production system.
5 Bare-land This class is represented by large rock outcroppings, active and abandoned quarries, eroded surfaces or silt depositions that are largely devoid of above ground vegetation.
Table 2. Summary of land use/land cover change in the watershed.
S/N Land cover class
1986 1999 2011 Change between 1986 and 1999
Change between 1999 and 2011
Area (ha) percent Area (ha) Percent Area (ha) percent Area (ha) percent Area (ha) percent
1 Crop land 208.1 1.4 325.8 2.3 78.5 0.5 117.7 56.6 −247.3 −75.9
2 Bare land 0.4 0.0 1.7 0.0 0.7 0.0 1.3 312.2 −1.0 −57.4
3 Forest 8977.6 62.1 7959.8 55.1 4045.3 28.0 −1017.8 −11.3 −3914.5 −49.2
4 Grassland 1210.6 8.4 945.6 6.5 1699.7 11.8 −265.0 −21.9 754.1 79.7
5 Woodland 4049.0 28.0 5212.7 36.1 8628.4 59.7 1163.7 28.7 3415.7 65.5
TOTAL 14445.7 100.0 14445.6 100.0 14452.6 100.0 −0.1 0.0 7.0 0.0
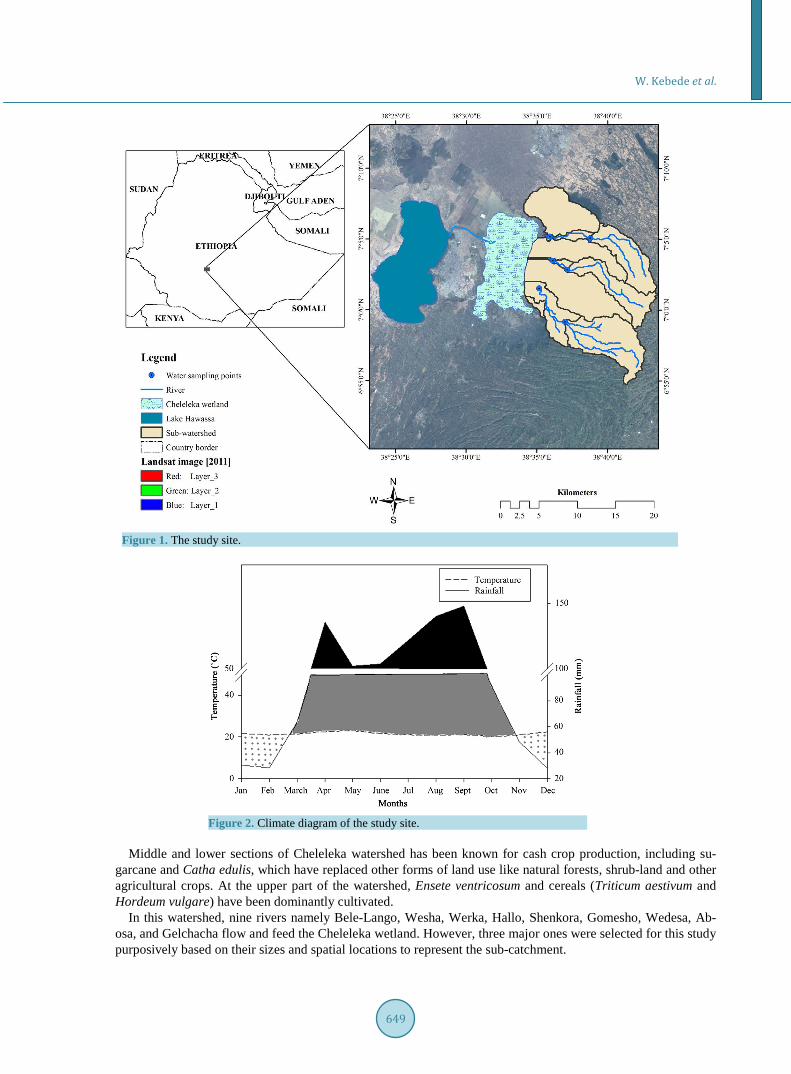
Between 1986 and 1999, woodland cover increased (by 30.98% to 96.3%) in the upper watershed of Wesha,
Wedesa and Hallo rivers, but it decreased in the lower watershed of these rivers (Table 3 and Figure 3). The forest cover showed the opposite trend. In this timeline, except the upper Wesha watershed, the grassland cover decreased.
Between 1999 and 2011, in both upper and lower watershed of the three rivers, woodland and grassland in-creased whereas forest cover and cropland decreased (Table 3).
Between 1986 and 2011, forest cover continuously decreased, but woodland cover increased (Figure 4). Little change was observed in cropland, bare land and grassland.
3.2. Water Quality Analysis 3.2.1. Comparing Upper and Lower Watershed The water turbidity of the upper section of Wesha River was significantly lower (P < 0.05) than the lower sec-tion in both DS and RS. Turbidity was significantly lower at the upper section of Wedesa River compared to the lower during DS and TP (Table 4).
In the upper section of Wesha River, SS was significantly lower than the lower section (P < 0.05) during DS and TP. It was also significantly lower in upper section of Wedesa River compared to lower during TP. The TDS of upper section of Wesha River was significantly lower (P < 0.05) than the lower section. In the lower section of Hallo River, TDS was significantly higher than the upper section during TP (Table 4).
Between the upper and lower sections, significant variation in nitrate was observed in Hallo River during RS. Significant variation of phosphate was observed in the upper Wedesa River and the lower during TP (Table 4).
W. Kebede et al.
652
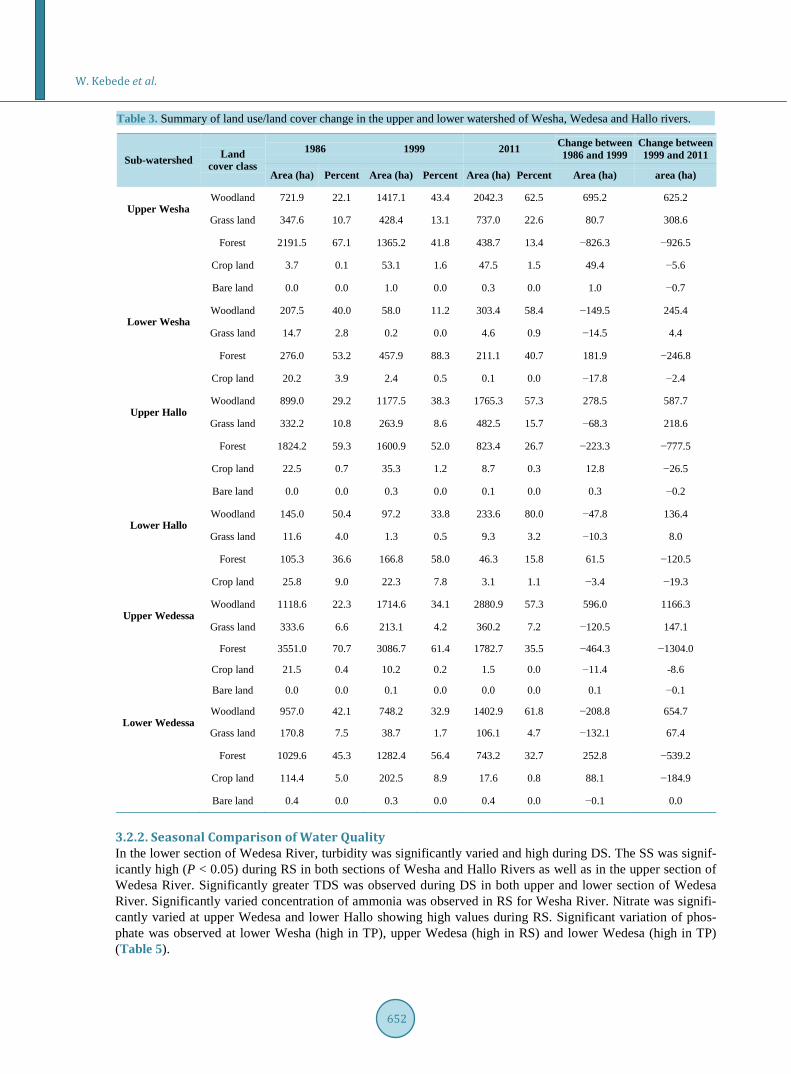
Table 3. Summary of land use/land cover change in the upper and lower watershed of Wesha, Wedesa and Hallo rivers.
Sub-watershed Land cover class
1986 1999 2011 Change between 1986 and 1999
Change between 1999 and 2011
Area (ha) Percent Area (ha) Percent Area (ha) Percent Area (ha) area (ha)
Upper Wesha Woodland 721.9 22.1 1417.1 43.4 2042.3 62.5 695.2 625.2
Grass land 347.6 10.7 428.4 13.1 737.0 22.6 80.7 308.6
Forest 2191.5 67.1 1365.2 41.8 438.7 13.4 −826.3 −926.5
Crop land 3.7 0.1 53.1 1.6 47.5 1.5 49.4 −5.6
Bare land 0.0 0.0 1.0 0.0 0.3 0.0 1.0 −0.7
Lower Wesha Woodland 207.5 40.0 58.0 11.2 303.4 58.4 −149.5 245.4
Grass land 14.7 2.8 0.2 0.0 4.6 0.9 −14.5 4.4
Forest 276.0 53.2 457.9 88.3 211.1 40.7 181.9 −246.8
Crop land 20.2 3.9 2.4 0.5 0.1 0.0 −17.8 −2.4
Upper Hallo Woodland 899.0 29.2 1177.5 38.3 1765.3 57.3 278.5 587.7
Grass land 332.2 10.8 263.9 8.6 482.5 15.7 −68.3 218.6
Forest 1824.2 59.3 1600.9 52.0 823.4 26.7 −223.3 −777.5
Crop land 22.5 0.7 35.3 1.2 8.7 0.3 12.8 −26.5
Bare land 0.0 0.0 0.3 0.0 0.1 0.0 0.3 −0.2
Lower Hallo Woodland 145.0 50.4 97.2 33.8 233.6 80.0 −47.8 136.4
Grass land 11.6 4.0 1.3 0.5 9.3 3.2 −10.3 8.0
Forest 105.3 36.6 166.8 58.0 46.3 15.8 61.5 −120.5
Crop land 25.8 9.0 22.3 7.8 3.1 1.1 −3.4 −19.3
Upper Wedessa Woodland 1118.6 22.3 1714.6 34.1 2880.9 57.3 596.0 1166.3
Grass land 333.6 6.6 213.1 4.2 360.2 7.2 −120.5 147.1
Forest 3551.0 70.7 3086.7 61.4 1782.7 35.5 −464.3 −1304.0
Crop land 21.5 0.4 10.2 0.2 1.5 0.0 −11.4 -8.6
Bare land 0.0 0.0 0.1 0.0 0.0 0.0 0.1 −0.1
Lower Wedessa Woodland 957.0 42.1 748.2 32.9 1402.9 61.8 −208.8 654.7
Grass land 170.8 7.5 38.7 1.7 106.1 4.7 −132.1 67.4
Forest 1029.6 45.3 1282.4 56.4 743.2 32.7 252.8 −539.2
Crop land 114.4 5.0 202.5 8.9 17.6 0.8 88.1 −184.9
Bare land 0.4 0.0 0.3 0.0 0.4 0.0 −0.1 0.0
3.2.2. Seasonal Comparison of Water Quality In the lower section of Wedesa River, turbidity was significantly varied and high during DS. The SS was signif-icantly high (P < 0.05) during RS in both sections of Wesha and Hallo Rivers as well as in the upper section of Wedesa River. Significantly greater TDS was observed during DS in both upper and lower section of Wedesa River. Significantly varied concentration of ammonia was observed in RS for Wesha River. Nitrate was signifi-cantly varied at upper Wedesa and lower Hallo showing high values during RS. Significant variation of phos-phate was observed at lower Wesha (high in TP), upper Wedesa (high in RS) and lower Wedesa (high in TP) (Table 5).
W. Kebede et al.
653
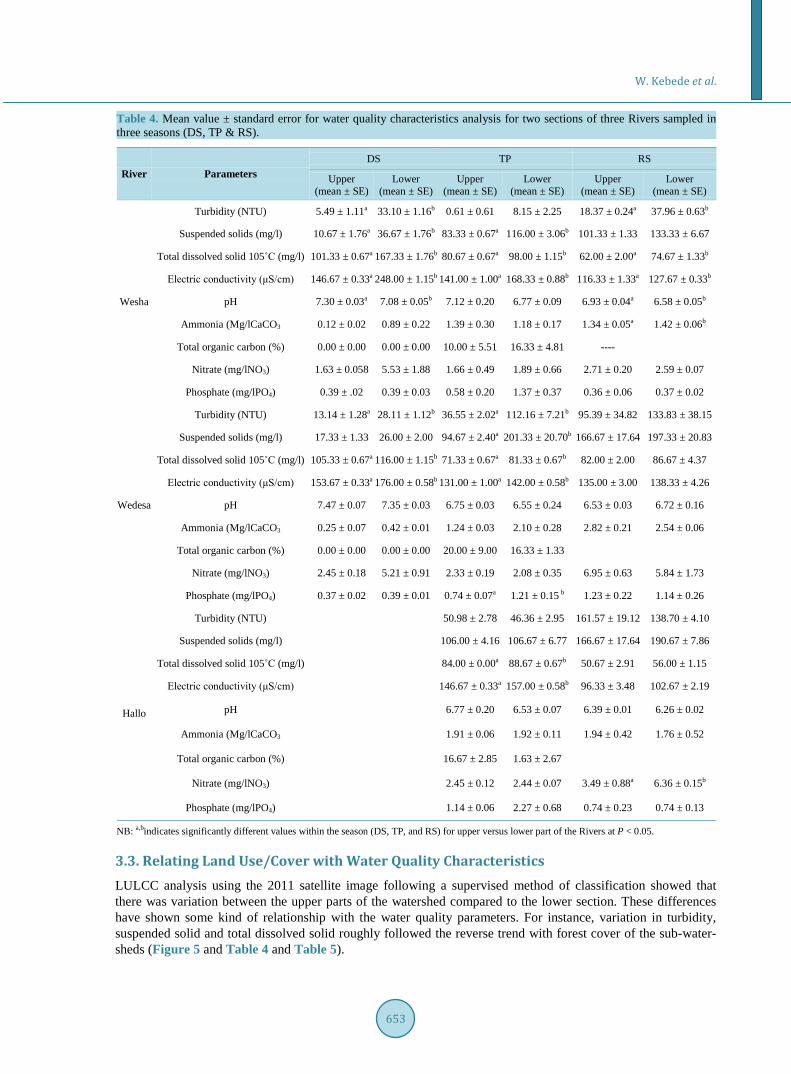
Table 4. Mean value ± standard error for water quality characteristics analysis for two sections of three Rivers sampled in three seasons (DS, TP & RS).
River Parameters DS TP RS
Upper (mean ± SE)
Lower (mean ± SE)
Upper (mean ± SE)
Lower (mean ± SE)
Upper (mean ± SE)
Lower (mean ± SE)
Wesha
Turbidity (NTU) 5.49 ± 1.11a 33.10 ± 1.16b 0.61 ± 0.61 8.15 ± 2.25 18.37 ± 0.24a 37.96 ± 0.63b
Suspended solids (mg/l) 10.67 ± 1.76a 36.67 ± 1.76b 83.33 ± 0.67a 116.00 ± 3.06b 101.33 ± 1.33 133.33 ± 6.67
Total dissolved solid 105˚C (mg/l) 101.33 ± 0.67a 167.33 ± 1.76b 80.67 ± 0.67a 98.00 ± 1.15b 62.00 ± 2.00a 74.67 ± 1.33b
Electric conductivity (μS/cm) 146.67 ± 0.33a 248.00 ± 1.15b 141.00 ± 1.00a 168.33 ± 0.88b 116.33 ± 1.33a 127.67 ± 0.33b
pH 7.30 ± 0.03a 7.08 ± 0.05b 7.12 ± 0.20 6.77 ± 0.09 6.93 ± 0.04a 6.58 ± 0.05b
Ammonia (Mg/lCaCO3 0.12 ± 0.02 0.89 ± 0.22 1.39 ± 0.30 1.18 ± 0.17 1.34 ± 0.05a 1.42 ± 0.06b
Total organic carbon (%) 0.00 ± 0.00 0.00 ± 0.00 10.00 ± 5.51 16.33 ± 4.81 ----
Nitrate (mg/lNO3) 1.63 ± 0.058 5.53 ± 1.88 1.66 ± 0.49 1.89 ± 0.66 2.71 ± 0.20 2.59 ± 0.07
Phosphate (mg/lPO4) 0.39 ± .02 0.39 ± 0.03 0.58 ± 0.20 1.37 ± 0.37 0.36 ± 0.06 0.37 ± 0.02
Wedesa
Turbidity (NTU) 13.14 ± 1.28a 28.11 ± 1.12b 36.55 ± 2.02a 112.16 ± 7.21b 95.39 ± 34.82 133.83 ± 38.15
Suspended solids (mg/l) 17.33 ± 1.33 26.00 ± 2.00 94.67 ± 2.40a 201.33 ± 20.70b 166.67 ± 17.64 197.33 ± 20.83
Total dissolved solid 105˚C (mg/l) 105.33 ± 0.67a 116.00 ± 1.15b 71.33 ± 0.67a 81.33 ± 0.67b 82.00 ± 2.00 86.67 ± 4.37
Electric conductivity (μS/cm) 153.67 ± 0.33a 176.00 ± 0.58b 131.00 ± 1.00a 142.00 ± 0.58b 135.00 ± 3.00 138.33 ± 4.26
pH 7.47 ± 0.07 7.35 ± 0.03 6.75 ± 0.03 6.55 ± 0.24 6.53 ± 0.03 6.72 ± 0.16
Ammonia (Mg/lCaCO3 0.25 ± 0.07 0.42 ± 0.01 1.24 ± 0.03 2.10 ± 0.28 2.82 ± 0.21 2.54 ± 0.06
Total organic carbon (%) 0.00 ± 0.00 0.00 ± 0.00 20.00 ± 9.00 16.33 ± 1.33
Nitrate (mg/lNO3) 2.45 ± 0.18 5.21 ± 0.91 2.33 ± 0.19 2.08 ± 0.35 6.95 ± 0.63 5.84 ± 1.73
Phosphate (mg/lPO4) 0.37 ± 0.02 0.39 ± 0.01 0.74 ± 0.07a 1.21 ± 0.15 b 1.23 ± 0.22 1.14 ± 0.26
Hallo
Turbidity (NTU) 50.98 ± 2.78 46.36 ± 2.95 161.57 ± 19.12 138.70 ± 4.10
Suspended solids (mg/l) 106.00 ± 4.16 106.67 ± 6.77 166.67 ± 17.64 190.67 ± 7.86
Total dissolved solid 105˚C (mg/l) 84.00 ± 0.00a 88.67 ± 0.67b 50.67 ± 2.91 56.00 ± 1.15
Electric conductivity (μS/cm) 146.67 ± 0.33a 157.00 ± 0.58b 96.33 ± 3.48 102.67 ± 2.19
pH 6.77 ± 0.20 6.53 ± 0.07 6.39 ± 0.01 6.26 ± 0.02
Ammonia (Mg/lCaCO3 1.91 ± 0.06 1.92 ± 0.11 1.94 ± 0.42 1.76 ± 0.52
Total organic carbon (%) 16.67 ± 2.85 1.63 ± 2.67
Nitrate (mg/lNO3) 2.45 ± 0.12 2.44 ± 0.07 3.49 ± 0.88a 6.36 ± 0.15b
Phosphate (mg/lPO4) 1.14 ± 0.06 2.27 ± 0.68 0.74 ± 0.23 0.74 ± 0.13
NB: a,bindicates significantly different values within the season (DS, TP, and RS) for upper versus lower part of the Rivers at P < 0.05.
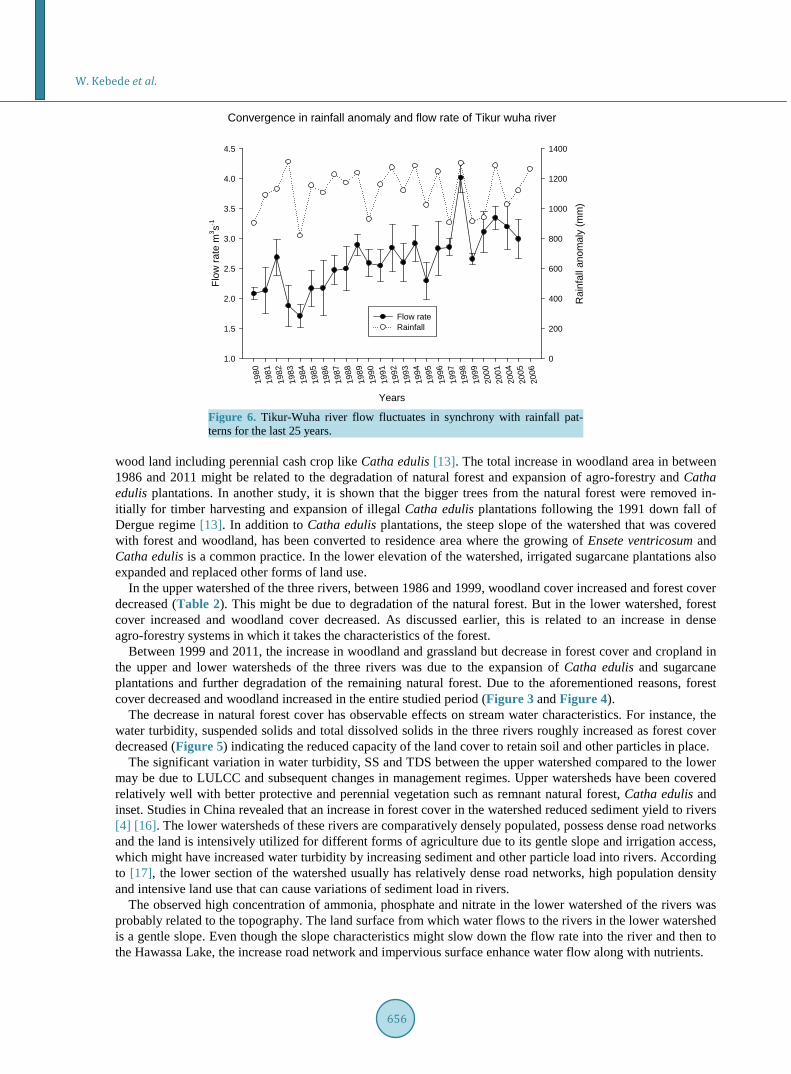
3.3. Relating Land Use/Cover with Water Quality Characteristics LULCC analysis using the 2011 satellite image following a supervised method of classification showed that there was variation between the upper parts of the watershed compared to the lower section. These differences have shown some kind of relationship with the water quality parameters. For instance, variation in turbidity, suspended solid and total dissolved solid roughly followed the reverse trend with forest cover of the sub-water- sheds (Figure 5 and Table 4 and Table 5).
W. Kebede et al.
654
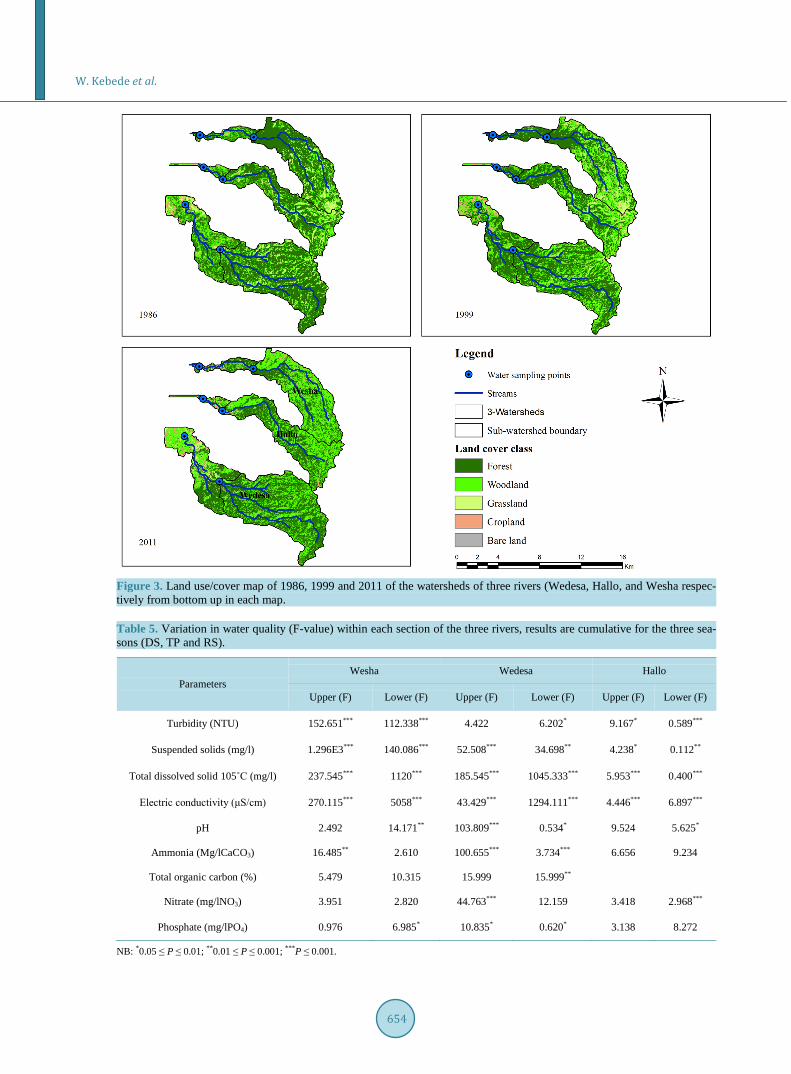
Figure 3. Land use/cover map of 1986, 1999 and 2011 of the watersheds of three rivers (Wedesa, Hallo, and Wesha respec-tively from bottom up in each map.
Table 5. Variation in water quality (F-value) within each section of the three rivers, results are cumulative for the three sea-sons (DS, TP and RS).
Parameters Wesha Wedesa Hallo
Upper (F) Lower (F) Upper (F) Lower (F) Upper (F) Lower (F)
Turbidity (NTU) 152.651*** 112.338*** 4.422 6.202* 9.167* 0.589***
Suspended solids (mg/l) 1.296E3*** 140.086*** 52.508*** 34.698** 4.238* 0.112**
Total dissolved solid 105˚C (mg/l) 237.545*** 1120*** 185.545*** 1045.333*** 5.953*** 0.400***
Electric conductivity (μS/cm) 270.115*** 5058*** 43.429*** 1294.111*** 4.446*** 6.897***
pH 2.492 14.171** 103.809*** 0.534* 9.524 5.625*
Ammonia (Mg/lCaCO3) 16.485** 2.610 100.655*** 3.734*** 6.656 9.234
Total organic carbon (%) 5.479 10.315 15.999 15.999**
Nitrate (mg/lNO3) 3.951 2.820 44.763*** 12.159 3.418 2.968***
Phosphate (mg/lPO4) 0.976 6.985* 10.835* 0.620* 3.138 8.272
NB: *0.05 ≤ P ≤ 0.01; **0.01 ≤ P ≤ 0.001; ***P ≤ 0.001.
W. Kebede et al.
655
Figure 4. Land use/land cover dynamics of the study area from 1986 to 2011.
Figure 5. Graph of turbidity, suspended solid, total dissolved solid (in RS) and forest cover at upper and low-er watershed sections of Wedesa, Wesha and Hallo rivers. NB: WDU, Wodesa upper watershed; WDL, Wo-desa lower watershed; WSU, Wesha upper watershed; WSL, Wesha lower watershed; HU, Hallo upper wa-tershed; HL, Hallo lower watershed.
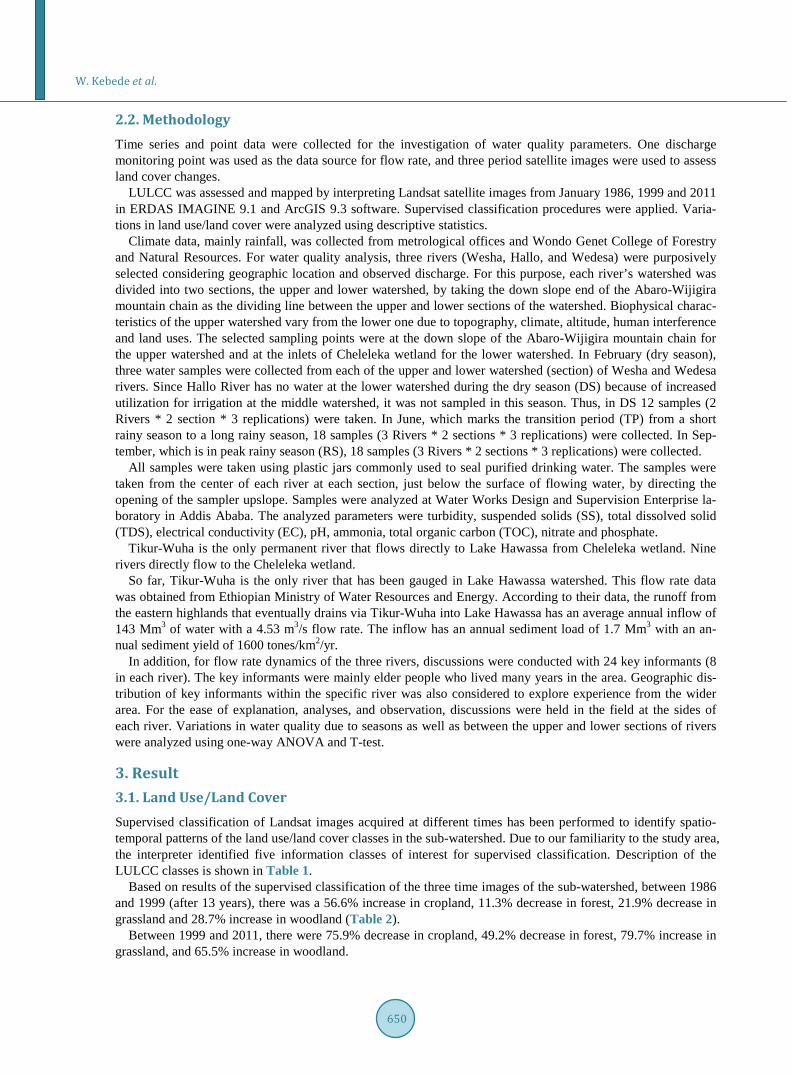
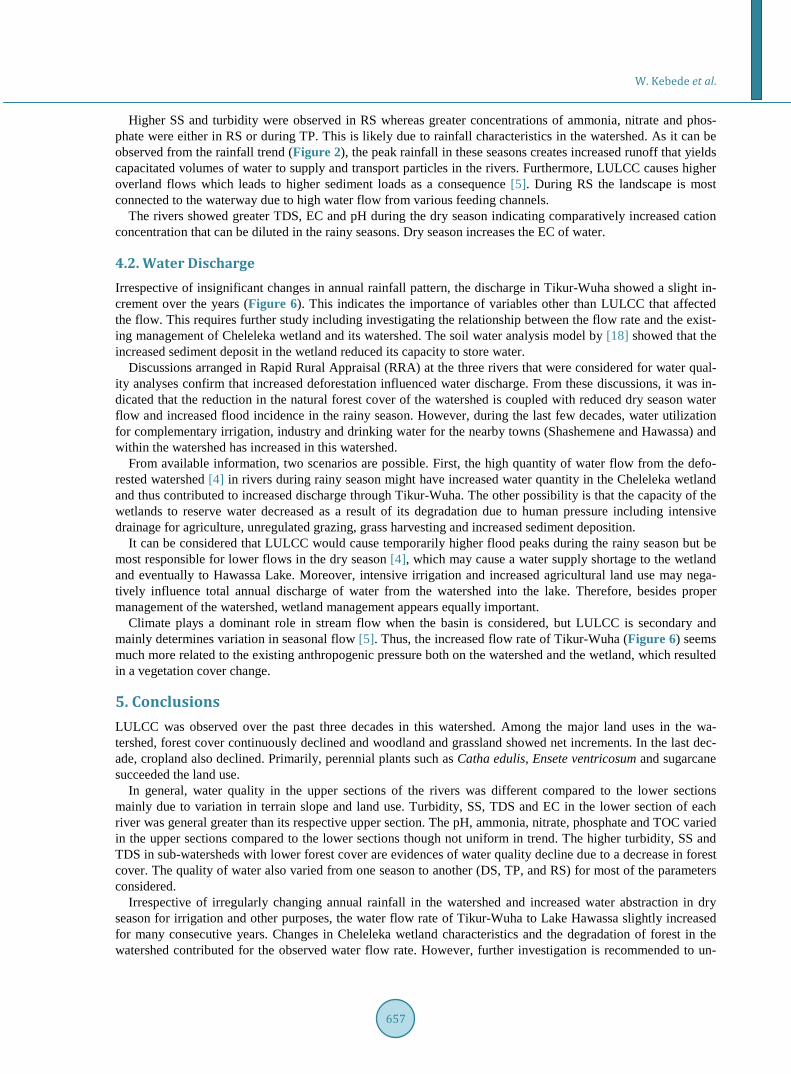
3.4. Water Flow Rate and Rainfall Analysis Tikur-Wuha River flow rate was compared with the rainfall amount recorded in the watershed. The flow rate of Tikur-Wuha has fluctuated in synchrony with irregular rainfall. Irrespective of insignificant changes in annual rainfall patterns, the flow rate towards Lake Hawassa slightly increased (Figure 6).
4. Discussion 4.1. Water Quality Characteristics and Land Use/Land Cover Like most parts of Ethiopia, the increasing population and correspondingly elevated land demand for rural live-lihood dominantly drive the observed land use changes. In the study area, site-specific economic activities in-fluence land use change. Catha edulis and irrigated sugarcane production introduced to this watershed in the last two to three decades are market led activities, which progressively replaced other forms of land use. Therefore, our hypothesis with regard to LULCC is confirmed in this study. The LULCC of the watershed from 1986 to 1999, and that from 1999 to 2011, were due to the replacement of forest land by other forms of land use such as
Watershed location
WU WL WdU WdL HU HL0
50
100
150
200
250
Turbidity (NTU)Suspended solids (mg/l)Total dissolved solid 105°c (mg/l)Forest cover (%)
W. Kebede et al.
656
Figure 6. Tikur-Wuha river flow fluctuates in synchrony with rainfall pat-terns for the last 25 years.
wood land including perennial cash crop like Catha edulis [13]. The total increase in woodland area in between 1986 and 2011 might be related to the degradation of natural forest and expansion of agro-forestry and Catha edulis plantations. In another study, it is shown that the bigger trees from the natural forest were removed in-itially for timber harvesting and expansion of illegal Catha edulis plantations following the 1991 down fall of Dergue regime [13]. In addition to Catha edulis plantations, the steep slope of the watershed that was covered with forest and woodland, has been converted to residence area where the growing of Ensete ventricosum and Catha edulis is a common practice. In the lower elevation of the watershed, irrigated sugarcane plantations also expanded and replaced other forms of land use.
In the upper watershed of the three rivers, between 1986 and 1999, woodland cover increased and forest cover decreased (Table 2). This might be due to degradation of the natural forest. But in the lower watershed, forest cover increased and woodland cover decreased. As discussed earlier, this is related to an increase in dense agro-forestry systems in which it takes the characteristics of the forest.
Between 1999 and 2011, the increase in woodland and grassland but decrease in forest cover and cropland in the upper and lower watersheds of the three rivers was due to the expansion of Catha edulis and sugarcane plantations and further degradation of the remaining natural forest. Due to the aforementioned reasons, forest cover decreased and woodland increased in the entire studied period (Figure 3 and Figure 4).
The decrease in natural forest cover has observable effects on stream water characteristics. For instance, the water turbidity, suspended solids and total dissolved solids in the three rivers roughly increased as forest cover decreased (Figure 5) indicating the reduced capacity of the land cover to retain soil and other particles in place.
The significant variation in water turbidity, SS and TDS between the upper watershed compared to the lower may be due to LULCC and subsequent changes in management regimes. Upper watersheds have been covered relatively well with better protective and perennial vegetation such as remnant natural forest, Catha edulis and inset. Studies in China revealed that an increase in forest cover in the watershed reduced sediment yield to rivers [4] [16]. The lower watersheds of these rivers are comparatively densely populated, possess dense road networks and the land is intensively utilized for different forms of agriculture due to its gentle slope and irrigation access, which might have increased water turbidity by increasing sediment and other particle load into rivers. According to [17], the lower section of the watershed usually has relatively dense road networks, high population density and intensive land use that can cause variations of sediment load in rivers.
The observed high concentration of ammonia, phosphate and nitrate in the lower watershed of the rivers was probably related to the topography. The land surface from which water flows to the rivers in the lower watershed is a gentle slope. Even though the slope characteristics might slow down the flow rate into the river and then to the Hawassa Lake, the increase road network and impervious surface enhance water flow along with nutrients.
Convergence in rainfall anomaly and flow rate of Tikur wuha river
Years
1980
1981
1982
1983
1984
1985
1986
1987
1988
1989
1990
1991
1992
1993
1994
1995
1996
1997
1998
1999
2000
2001
2004
2005
2006
Flow
rate
m3 s-1
1.0
1.5
2.0
2.5
3.0
3.5
4.0
4.5
Rai
nfal
l ano
mal
y (m
m)
0
200
400
600
800
1000
1200
1400
Flow rateRainfall
W. Kebede et al.
657
Higher SS and turbidity were observed in RS whereas greater concentrations of ammonia, nitrate and phos-phate were either in RS or during TP. This is likely due to rainfall characteristics in the watershed. As it can be observed from the rainfall trend (Figure 2), the peak rainfall in these seasons creates increased runoff that yields capacitated volumes of water to supply and transport particles in the rivers. Furthermore, LULCC causes higher overland flows which leads to higher sediment loads as a consequence [5]. During RS the landscape is most connected to the waterway due to high water flow from various feeding channels.
The rivers showed greater TDS, EC and pH during the dry season indicating comparatively increased cation concentration that can be diluted in the rainy seasons. Dry season increases the EC of water.
4.2. Water Discharge Irrespective of insignificant changes in annual rainfall pattern, the discharge in Tikur-Wuha showed a slight in-crement over the years (Figure 6). This indicates the importance of variables other than LULCC that affected the flow. This requires further study including investigating the relationship between the flow rate and the exist-ing management of Cheleleka wetland and its watershed. The soil water analysis model by [18] showed that the increased sediment deposit in the wetland reduced its capacity to store water.
Discussions arranged in Rapid Rural Appraisal (RRA) at the three rivers that were considered for water qual-ity analyses confirm that increased deforestation influenced water discharge. From these discussions, it was in-dicated that the reduction in the natural forest cover of the watershed is coupled with reduced dry season water flow and increased flood incidence in the rainy season. However, during the last few decades, water utilization for complementary irrigation, industry and drinking water for the nearby towns (Shashemene and Hawassa) and within the watershed has increased in this watershed.
From available information, two scenarios are possible. First, the high quantity of water flow from the defo-rested watershed [4] in rivers during rainy season might have increased water quantity in the Cheleleka wetland and thus contributed to increased discharge through Tikur-Wuha. The other possibility is that the capacity of the wetlands to reserve water decreased as a result of its degradation due to human pressure including intensive drainage for agriculture, unregulated grazing, grass harvesting and increased sediment deposition.
It can be considered that LULCC would cause temporarily higher flood peaks during the rainy season but be most responsible for lower flows in the dry season [4], which may cause a water supply shortage to the wetland and eventually to Hawassa Lake. Moreover, intensive irrigation and increased agricultural land use may nega-tively influence total annual discharge of water from the watershed into the lake. Therefore, besides proper management of the watershed, wetland management appears equally important.
Climate plays a dominant role in stream flow when the basin is considered, but LULCC is secondary and mainly determines variation in seasonal flow [5]. Thus, the increased flow rate of Tikur-Wuha (Figure 6) seems much more related to the existing anthropogenic pressure both on the watershed and the wetland, which resulted in a vegetation cover change.
5. Conclusions LULCC was observed over the past three decades in this watershed. Among the major land uses in the wa-tershed, forest cover continuously declined and woodland and grassland showed net increments. In the last dec-ade, cropland also declined. Primarily, perennial plants such as Catha edulis, Ensete ventricosum and sugarcane succeeded the land use.
In general, water quality in the upper sections of the rivers was different compared to the lower sections mainly due to variation in terrain slope and land use. Turbidity, SS, TDS and EC in the lower section of each river was general greater than its respective upper section. The pH, ammonia, nitrate, phosphate and TOC varied in the upper sections compared to the lower sections though not uniform in trend. The higher turbidity, SS and TDS in sub-watersheds with lower forest cover are evidences of water quality decline due to a decrease in forest cover. The quality of water also varied from one season to another (DS, TP, and RS) for most of the parameters considered.
Irrespective of irregularly changing annual rainfall in the watershed and increased water abstraction in dry season for irrigation and other purposes, the water flow rate of Tikur-Wuha to Lake Hawassa slightly increased for many consecutive years. Changes in Cheleleka wetland characteristics and the degradation of forest in the watershed contributed for the observed water flow rate. However, further investigation is recommended to un-
W. Kebede et al.
658
derstand the dominant parameters affecting hydrologic characteristics of Lake Hawassa watershed. The forest cover of the watershed has decreased. However, since land use change often influences the hy-
drology in complex ways, extrapolating results from such studies to other systems requires cautious testing.
Acknowledgements Wondo Genet College of Forestry and Natural Resources, Hawassa University, provided financial support for field data collection and laboratory analysis. The authors’ thank Tatum Branaman for language editing.
References [1] Elfert, S. and Bormann, H. (2010) Simulated Impact of Past and Possible Future Land Use Changes on the Hydrologi-
cal Response of the Northern German Lowland “Hunte” Catchment. Journal of Hydrology, 383, 245-255. http://dx.doi.org/10.1016/j.jhydrol.2009.12.040
[2] Ghaffari, G., Keesstra, S., Ghodousi, J. and Ahmadi, H. (2010) SWAT-Simulated Hydrological Impact of Land-Use Change in the Zanjanrood Basin, Northwest Iran. Hydrological Processes, 24, 892-903. http://dx.doi.org/10.1002/hyp.7530
[3] Nejadhashemi, A.P., Wardynski, B.J. and Munoz, J.D. (2011) Evaluating the Impacts of Land Use Changes on Hydro-logic Responses in the Agricultural Regions of Michigan and Wisconsin. Hydrology and Earth System Sciences, 8, 3421-3468. http://dx.doi.org/10.5194/hessd-8-3421-2011
[4] Koch, F.J., Ann, V.G., Stefan, U., Sirak, T. and Teferi, E. (2012) The Effects of Land Use Change on Hydrological Responses in the Choke Mountain Range (Ethiopia). A New Approach Addressing Land Use Dynamics in the Model SWAT. International Environmental Modelling and Software Society, International Congress on Environmental Mod-elling and Software, Germany.
[5] Guo, H., Hu, Q. and Jiang, T. (2008) Annual and Seasonal Stream Flow Responses to Climate and Land-Cover Changes in the Poyang Lake Basin, China. Journal of Hydrology, 355, 106-122. http://dx.doi.org/10.1016/j.jhydrol.2008.03.020
[6] Lana-Renault, N., Latron, J., Karssenberg, D., Serrano-Muela, P., Regüés, D. and Bierkens, M.F.P. (2011) Differences in Stream Flow in Relation to Changes in Land Cover: A Comparative Study in Two Sub-Mediterranean Mountain Catchments. Journal of Hydrology, 411, 366-378. http://dx.doi.org/10.1016/j.jhydrol.2011.10.020
[7] Solomon, G. (2006) Relating Stream Flow to Forest Cover Change and Community Perception in the Koga Watershed, Upper Basin of the Blue Nile. Master’s Thesis, Hawassa University, Wondo Genet College of Forestry, Hawassa.
[8] Costa, M.H., Botta, A. and Cardille, J.A. (2003) Effects of Large-Scale Changes in Land Cover on the Discharge of the Tocantins River, Southeastern Amazonia. Journal of Hydrology, 283, 206-217. http://dx.doi.org/10.1016/S0022-1694(03)00267-1
[9] Amatya, D.M. and Radecki-Pawlik, A. (2007) Flow Dynamics of Three Experimental Forested Watersheds in Coastal South Carolina (USA). Acta Scientiarum Polonorum, Formatio Circumiectus, 6, 3-17.
[10] Poor, C.J. and Jeffrey, J.M.D. (2007) The Effects of Land Use on Stream Nitrate Dynamics. Journal of Hydrology, 332, 54-68. http://dx.doi.org/10.1016/j.jhydrol.2006.06.022
[11] Ahearn, D.S., Sheibley, R.W., Dahlgren, R.A., Anderson, M., Johnson, J. and Tate, K.W. (2005) Land Use and Land Cover Influence on Water Quality in the Last Free-Flowing River Draining the Western Sierra Nevada, California. Journal of Hydrology, 313, 234-247. http://dx.doi.org/10.1016/j.jhydrol.2005.02.038
[12] Warburton, M.L., Schulze, R.E. and Jewitt, G.P.W. (2012) Hydrological Impacts of Land Use Change in Three Di-verse South African Catchments. Journal of Hydrology, 414-415, 118-135. http://dx.doi.org/10.1016/j.jhydrol.2011.10.028
[13] Gessesse, D. (2007) Forest Decline in South Central Ethiopia: Extent, History, and Process. Dissertation, Stockholm University, Sweden.
[14] Zerihun, M. (1999) Natural Resource Competition and Inter Ethnic Relations in Wondo Genet, South Central Ethiopia. M.Sc. Thesis, Addis Ababa University, Addis Ababa.
[15] CSA (Central Statistical Authority) (2007) Population Census Report of Ethiopia. Addis Ababa, Ethiopia. [16] Tang, L., Yang, D., Hu, H. and Gao, B. (2011) Detecting the Effect of Land-Use Change on Stream Flow, Sediment
and Nutrient Losses by Distributed Hydrological Simulation. Journal of Hydrology, 409, 172-182. http://dx.doi.org/10.1016/j.jhydrol.2011.08.015
[17] Edwards, A.C. and Withers, P.J.A. (2008) Transport and Delivery of Suspended Solids, Nitrogen and Phosphorus from Various Sources to Freshwaters in the UK. Journal of Hydrology, 350, 144-153.

W. Kebede et al.
659
http://dx.doi.org/10.1016/j.jhydrol.2007.10.053 [18] Caroline, H. (2013) Impacts of Land Use Changes on the Hydrology of Wondo Genet Catchment in Ethiopia. Thesis
Submitted for Partial Fulfillment of the Requirements of MSc Degree in Earth Surface and Water, Utrecht University, Utrecht.
Scientific Research Publishing (SCIRP) is one of the largest Open Access journal publishers. It is currently publishing more than 200 open access, online, peer-reviewed journals covering a wide range of academic disciplines. SCIRP serves the worldwide academic communities and contributes to the progress and application of science with its publication. Other selected journals from SCIRP are listed as below. Submit your manuscript to us via either [email protected] or Online Submission Portal.