Motion of actin filaments in the presence of myosin heads and ATP
S. Burlacu and J. BorejdoBaylor Research Institute, Baylor University Medical Center, Dallas, Texas 75226 USA
ABSTRACT We measured, by fluorescence correlation spectroscopy, the motion of actin filaments in solution during hydrolysis of ATP byacto-heavy meromyosin (acto-HMM). The method relies on the fact that the intensity of fluorescence fluctuates as fluorescently labeledactin filaments enter and leave a small sample volume. The rapidity of these number fluctuations is characterized by the autocorrelationfunction, which decays to 0 in time that is related to the average velocity of translation of filaments. The time of decay of the autocorrela-tion function of bare actin filaments in solution was 10.59 ± 0.85 s. Strongly bound (rigor) heads slowed down the diffusion. Directobservation of filaments under an optical microscope showed that addition of HMM did not change the average length or flexibility ofactin filaments, suggesting that the decrease in diffusion was not due to a HMM-induced change in the shape of filaments. Rather,slowing down of translational motion was caused by an increase in the volume of the diffusing complex. Surprisingly, the addition of ATPto acto-HMM accelerated the motion of actin filaments. The acceleration was the greatest at the low molar ratios of HMM:actin. Directobservation of filaments under an optical microscope showed that in the presence of ATP the average length of filaments did not changeand that the filaments became stiffer, suggesting that acceleration of diffusion was not due to an ATP-induced increase in flexibility offilaments. These results show that some of the energy of splitting of ATP is imparted to actin filaments and suggest that 0.06 ± 0.02 ofHMM interferes with the diffusion of actin filaments during hydrolysis of ATP.
INTRODUCTION
In the "classical" hypothesis of muscle contraction, themyosin head hydrolyses ATP while it is dissociated fromactin (Lymn and Taylor, 1971). Heads carrying theproducts of hydrolysis bind to filaments either "weakly"or "strongly." Only strongly bound heads continuealong the ATPase cycle whereby the products ofhydroly-sis are released (Podolsky, 1980; Goldman et al., 1984).The release is believed to be associated with the orienta-tional change of SI (Huxley, 1969) and is followed bydissociation from actin. In solution, the interaction be-tween myosin and actin has no effect on translationalmotion of myosin heads (Borejdo, 1979; Borejdo andBurlacu, 1992a). In this work we test whether the inter-action has an effect on translational motion ofactin fila-ments.Oosawa et al. ( 1973) measured motion ofF-actin dur-
ing splitting of ATP by HMM using quasi-elastic lightscattering (QELS). They saw a decrease in the width ofthe spectrum of scattered light when ATP was being hy-drolyzed and concluded that F-actin became more flexi-ble during hydrolysis. On the other hand, Fraser et al.( 1975) reported that the spectrum of quasi-elasticallyscattered light remained unchanged during maximal ac-tivation ofHMM ATPase by actin. Tirosh et al. (1990)reported the broadening of spectrum of quasi-elasticallyscattered light from acto-HMM during hydrolysis. Inter-pretation of QELS data is complicated by the fact thatQELS records the light scattered by both F-actin andHMM and this is particularly troublesome at high pro-tein concentrations. Yanagida et al. ( 1984) directly ob-served diluted actin filaments in an optical microscope
Address correspondence to Dr. Julian Borejdo, Baylor UniversityMedical Center, 3812 Elm Street, Dallas, TX 75226.
and concluded that in the presence ofHMM and ATPfilaments executed more rapid bending motions andwere often broken into short segments.We studied the effect ofthe cyclic interaction ofHMM
with actin on the motion of actin filaments by themethod of fluorescence correlation spectroscopy (FCS).This avoids complication ofQELS associated with lightscattering by both proteins. This method relies on thefact that when fluorescently labeled actin filaments dif-fuse through a small volume they give rise to fluctuationsin fluorescent light intensity because the observed num-ber of filaments changes in time as they enter and leavethe volume. The rapidity ofnumber fluctuations is char-acterized by the autocorrelation function (ACF), whichdecays with a characteristic time related to the transla-tional diffusion coefficient ofthe diffusing species (Elsonand Magde, 1974; Magde et al., 1974). Analysis offluctu-ations is a method of choice because fluctuations are
large (average number ofmolecules in sample volume issmall), FCS measures motion only of labeled F-actinand the motion of very dilute solutions ofF-actin can bedetected. The results show that actin filaments havingstrongly bound heads moved slower than bare actin. Sur-prisingly, when ATP was added to the HMM-actin com-
plex at low molar ratio, the diffusion of actin filamentswas accelerated. The acceleration was not caused by a
decrease in the average length or by an increase in theflexibility of filaments. Rather, the increase in the rate ofdiffusion was due to the fact that some of the energy ofhydrolysis ofATP by acto-HMM was imparted to actinfilaments. The acceleration was progressively dimin-ished at increasing molar ratio HMM:actin. From therelationship between the characteristic time of diffusionand molar ratio we estimated that 0.06 + 0.02 ofHMMretarded diffusion of filaments in the presence of ATP.
Biophys. J. Biophysical SocietyVolume 63 December 1992 1471-1482
0006-3495/92/12/1471/12 $2.000006-3495/92/12/1471/12 $2.00 1471
MATERIALS AND METHODS
Optics and electronicsThe experimental microscope system used to measure the fluctuationsin fluorescence intensity caused by the translating actin filaments wasthe same as described before (Borejdo and Burlacu, 1992b), exceptthat the motion occurred in solution (in three dimensions) rather thanon the surface of a cover slip (in two dimensions). To observe themotion, the experimental cells were constructed by gluing by a super-glue (Adhesive Solutions, Sydney, Australia) two narrow strips of acoverslip to a glass slide. The strips were separated by about 1 cm. Theexperimental chamber was constructed by gluing a coverslip to the topofthe strips. The chamber ( 100 AL) was filled with the solution to bestudied and sealed with a colorless nail polish. The concentration ofactin was 50 nM. Sample volume was defined by the laserbeam and thefield diaphragm. To make sure that the same sample volume was al-ways sampled, the image of the coverslip was obtained first and theobjective (Plan X40, N.A. = 0.65; Carl Zeiss, Oberkochen, Germany)was then lowered by a fixed distance. Thus the objective was alwaysfocused on the same plane lying between coverslip and the microscopeslide. A circular field diaphragm (diameter in the image plane, D = 10,gm) was centered on the intensity maximum of the image of the laserbeam.
S/N ratioThe fact that the motion occurs in three dimensions and that the confo-cal arrangement is used (i.e., the field diaphragm is incorporated) com-plicates the interpretation of the data. When moving molecules areconfined to the plane of focus ofthe objective (i.e., when movement istwo-dimensional), each fluorophore within the acceptance angle oftheobjective contributes equally to the measured signal (in spite ofthe factthat the original FCS experiment (Magde et al., 1974) was carried outin solution, the diffusion was really two-dimensional because the inci-dent laser beam was focused by a long focal-length lens). In our earlierwork (Borejdo and Burlacu, 1992b) the diffusion was truly two-dimen-sional. Under the conditions used in the present experiment, however,this is no longer true: the fluorophores located farther from the focalplane of the objective contribute less to the total fluorescence intensity(Qian and Elson, 1991). The rate of detection of fluorescent photonsper molecule of dye during one bin width, a, which determines thesignal-to-noise ratio (S/N, Magde et al., 1974) is now related to thelaser light flux by the collection efficiency function, which is dependenton the diameter of the diaphragm, acceptance angle of the objective,and the intensity profile of the exciting laser beam. Analytical expres-sions for the collection efficiency function exist (Qian and Elson,1991 ), but we did not use them for the purpose of an estimation ofS/N. Instead, we estimated a as ifthe diffusion occurred in two dimen-sions. The justification for this is given in a section describing diffusionof microspheres. As shown in Borejdo and Burlacu ( 1992b) in thetwo-dimensional diffusion of F-actin the parameter of is
a = <n>/(400LK<N>) (1)
where <n > is the rate of arrival ofphotons during one bin width, 400 isthe number ofrhodamine molecules per 1 Mm of actin filament (equalto number of actin monomers/ 1 Mm), L. is the average length of actinfilament and (N> is the average number ofactin filaments in the experi-mental volume. <N> observed by the photomultiplier is equal to thereciprocal ofthe mean rms fluctuation, ,, (Elson and Magde, 1974)-<N> = 1/,. In the typical experiment (Fig. 5) 0 was 4.3%. Therefore<N> was typically 23. In the same experiment <n> was 23,036. Ln =2.37 (Fig. 10 A) and therefore a = <n>/(400<N>LJ) = 1.05. This is alarge number, and is obtainable only because we are observing slowmotions of a small number of molecules.Koppel ( 1974) and Magde et al. ( 1974) have shown that when a is
greater than or equal to 1, then
S/N = (M6TI2TD)"I2 (2)
where M is the total number ofbins collected, 5T is the bin width, andTD is the characteristic time ofthe autocorrelation function. In a typicalexperiment, M = 4096, br = 200 ms, and TD = 7 s giving S N = 7.6.
Systematic errorsThese could arise because ofphotobleaching offluorescence. However,all our solutions contained a deoxygenating system (Englander et al.,1987), the light flux was low (incident intensity was typically 0.15mW), and a continuous exchange ofbleached actin molecules for un-bleached ones occurred. The quantum yield for photobleaching, whichwas measured by following the decrease in emitted light intensity ofactin filaments attached to a cover slip was less than 10". Lifetime forbleaching was about 500 s, much longer than the characteristic time fortranslation of actin filaments (see below).
Data analysisThis was done as described previously (Borejdo and Burlacu, 1992b),except that the number of "sweeps" was now 6. Also, all sweeps whereexperimental rms fluctuations exceeded by 30 times the fluctuations ofwhite noise signal having the same <in> were rejected in order to elimi-nate contributions to the signal from dust particles, which sometimestraversed the experimental volume. For example, in the experimentillustrated in Fig. 5 the mean count was 23,063 counts/bin. If thiscount were contributed by a signal with a white noise characteristic,then fluctuation would have been 151 counts/bin. All sweeps havingrms fluctuation of more than 4,530 counts/bin would have been re-
jected.
MaterialsTRITC-phalloidin, ATP, DTT, the enzymes used in the deoxygenatingsolution and apyrase were from Sigma Chemical Co. (St. Louis, MO).Fluorescent beads (Fluoresbrite) were from Polysciences Inc.(Warrington, PA). Nitrocellulose was from Ernest F. Fullam Inc.(Latham, NY).
SolutionsDiffusion was measured in A-buffer containing 25 mM K-Acetate, 25mM TRIS-Acetate buffer (pH 7.5), 4 mM Mg2SO4, I mM DTT, 1
mM EGTA, and oxygen scavenging system (Englander et al., 1987).When indicated, solution also contained 2 mM MgATP. Phalloidinwas prepared as follows: 0.1 mg was dissolved in 0.1 ml of50% metha-nol and diluted ten times with 25 mM K-Acetate, 25 mM Tris-Acetate(pH 7.5).
Protein preparation and labelingActin and HMM were prepared according to Spudich and Watt ( 1971)and Weeds and Pope (1977), respectively. F-actin was labeled withTRITC-phalloidin by adding 0.05 mg/ml protein to equimolar con-
centration of the dye and incubating overnight on ice. After staining,F-actin was diluted with A-buffer to 50 nM. Proteins were checked bySDS-PAGE and by the ability to induce motions in vitro motility assay.
Measurements of lengths of actinfilamentsThe spatial resolution ofthe optical microscope is 0.19 Mlm. The imageson the video monitor were magnified 2,750 times and any luminousobject that was shorter than 1.1 mm on the monitor screen wascounted but its length was not measured. The width ofa single filamentis smaller than the resolution of the optical microscope and is visibledue to the "magnification anisotropy" (Houseal et al., 1989).The individual frames were grabbed from the VCR using an MVY
1472 Biophysical Journal Volume 63 December 19921 472 Biophysical Journal Volume 63 December 1992
50000
40000
A
30000 F
0 100 200 300 400
time (s)
300 400
20000
10000
0
0 100 200
time (s)
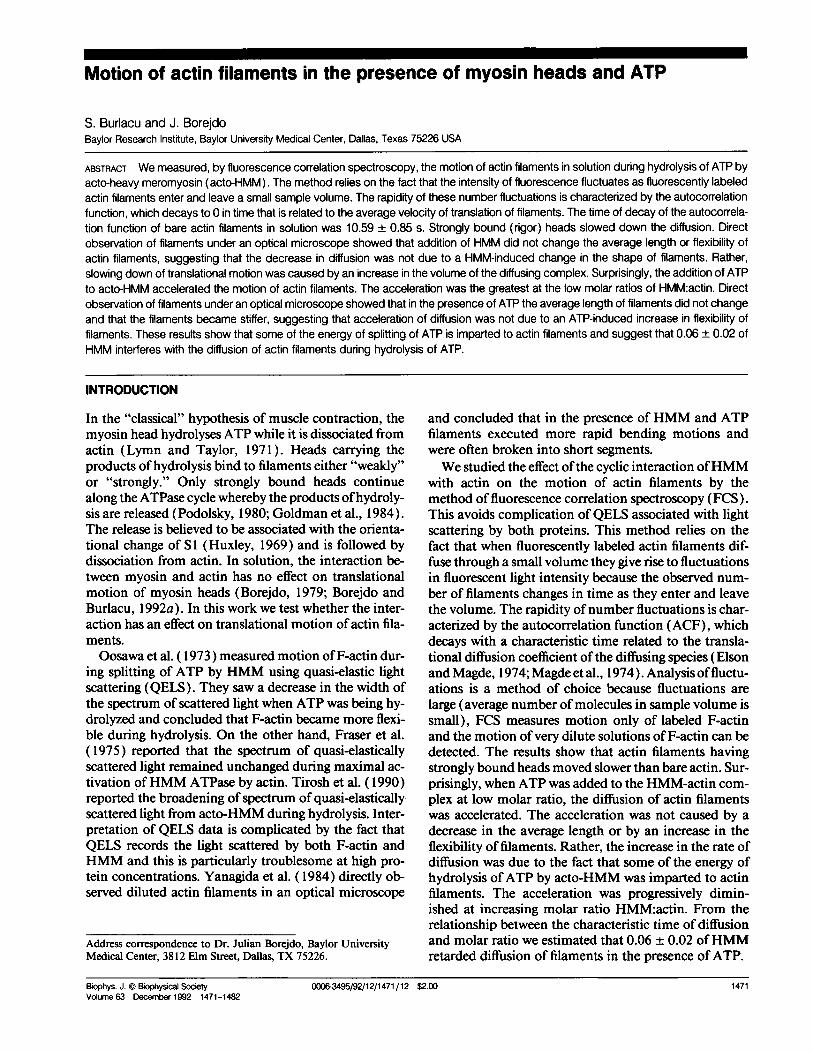
FIGURE 1 Fluctuations in the concentration of I um diameter micro-spheres (A) photocurrent. The straight line is the linear regression ofalldata points. The average photocounts value was Kn > = 9752, SD = 235(B) absolute fluctuations of the signal in A (the absolute value of thedifference between each data point and the corresponding regressionvalue).
frame grabber (MetraByte Corp, Taunton, MA) operated by an ATtype computer. The images were contrast enhanced by a video analysisprogram (Java 1.4; Jandel Scientific, Corte Madera, CA), equalizedusing Gray F/X gray scale editor (Xerox Imaging Systems, Sunnyvale,CA) and printed on Video Printer (Sony Corp., Teaneck, NJ) or Lino-tronic 300 typesetter. Contour lengths of filaments were measured byusing the "distance" function of Java image analysis program. Thehistograms were obtained by counting "by range" filaments of a givenlength. They were plotted using SigmaPlot 4.1 (Jandel Scientific).
RESULTS
Diffusion of microspheresIn a confocal microscope system such as used here, thedecay time of the ACF of a three-dimensional diffusionofparticles depends on the relative size ofthe diaphragmand the diameter of the laser beam (Qian and Elson,1991 ). For example, when the diaphragm is smaller thanthe "beamwaist" ofthe laser, then the diffusion along theline of excitation becomes important, and the shape ofthe ACF, as derived from two-dimensional analysis, isno longer valid. Detailed analysis of the optics of themeasurement system is therefore required in order toobtain exact expression for the ACF (Qian and Elson,1990). Our experiment is further complicated by the factthat the size of diffusing objects is comparable to thedepth of focus ofthe objective. To find the best way to fit
the data obtained under our experimental conditions, wecarried out empirical calibrations using particles withwell characterized diffusion coefficients. Calibrationshows that in our experiments the best fit is offered bytwo exponents.We measured the ACF of a monodisperse suspension
of particles of size similar to actin filaments. We usedfluorescent polystyrene latex microspheres 1 ± 0.05 ,umin diameter diluted with water to about 5-50 x 106 parti-cles/mm3. Fig. 1 A shows a typical photocurrent signalof spheres. Fluctuations in the photocurrent arise be-cause spheres move by Brownian motion in and out ofthe field of view defined by the diaphragm. The meanrate ofarrival ofphotons <n> was 9,762 counts/bin. Theabsolute fluctuation (Fig. 1 B) was 2,352 counts/bin(relative fluctuation A = 24%). If the signal had whitenoise characteristics, the fluctuation would have been(9762)1/2 = 99 counts/s (1%; Rabiner and Gold, 1975).In this experiment the observed fluctuation was 24 timesgreater than the fluctuation expected from the whitenoise signal. was large because the number of spheresin the field of view was small.The average normalized ACF of all nine microsphere
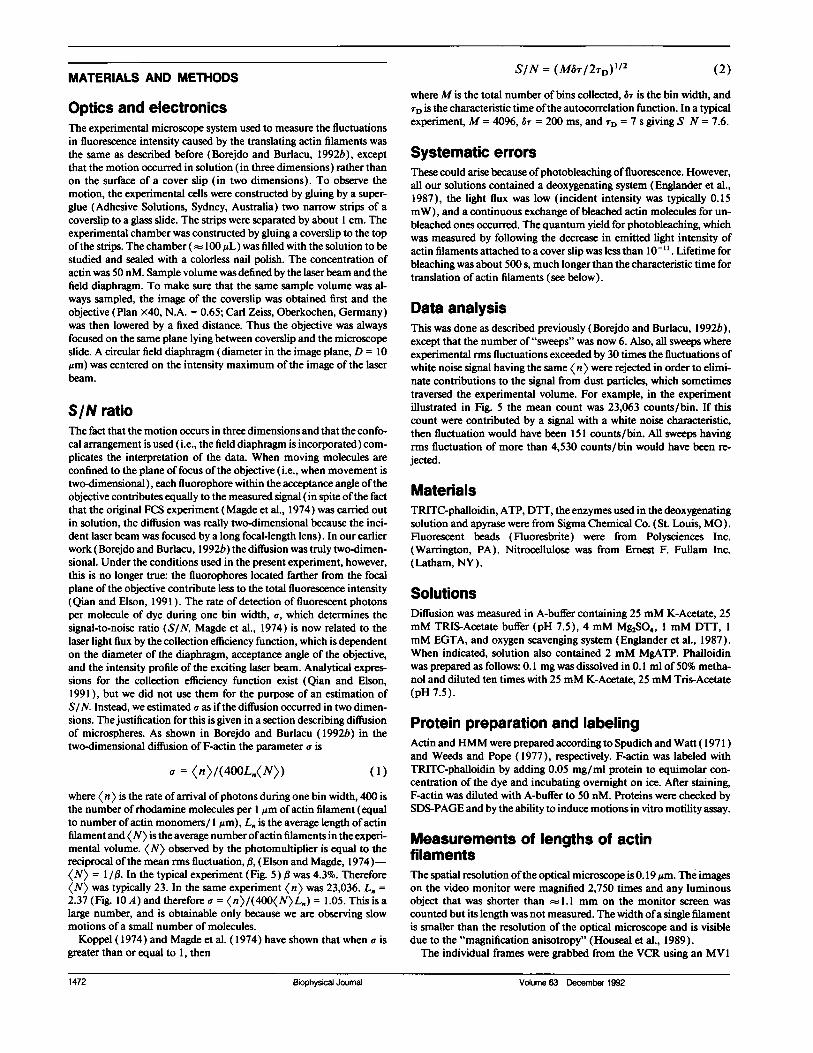
experiments is shown in Fig. 2. The rapid decay occurredin about 3 s and was followed by a slow decay. The over-
all decay was fitted well by a double exponential (seebelow). All ACFs had a periodic component. We suspectthat oscillations were due to the presence of the dia-phragm, i.e., to the fact that when particle diffused out ofthe sample volume the fluorescence decayed rapidlytoO.The characteristic time ofthe decay ofthe correlation,
TD, is a measure of the rapidity of motion. We have ex-tracted TD from the autocorrelation function in fourways: (a) manually-rT was defined as the time atwhich normalized ACF declined to 0.5, (b) by a singleexponential fit ACF = A exp(-r/TD); (c) by a doubleexponential fit ACF = A exp(-T/TD) + B exp(-r/rx);and (d) by a hyperbolic fit ACF = A[1 + T/rD]-' where
a
LL.
a
00a
L.2
0 10 20 30 40 50
deloy time (s)
FIGURE 2 Normalized autocorrelation function of 1 um microspheres(average of9 experiments): experimental curve (solid line), hyperbolicfit (large dashed line), double exponential fit (small dashed line), sin-gle exponential fit (dotted line).
Burtacu and Boreiclo Motion of Actin Filaments
D"I
c
0
-Ct
Dm
Burlacu and Borejdo Motion of Actin Filaments 1 473
1.5
1.0
0.5
41
cp
'a
Ec
0.0
-0.5
-1.0 L-IC 0 1 0 20 30 40 50
deloy time (s)
60
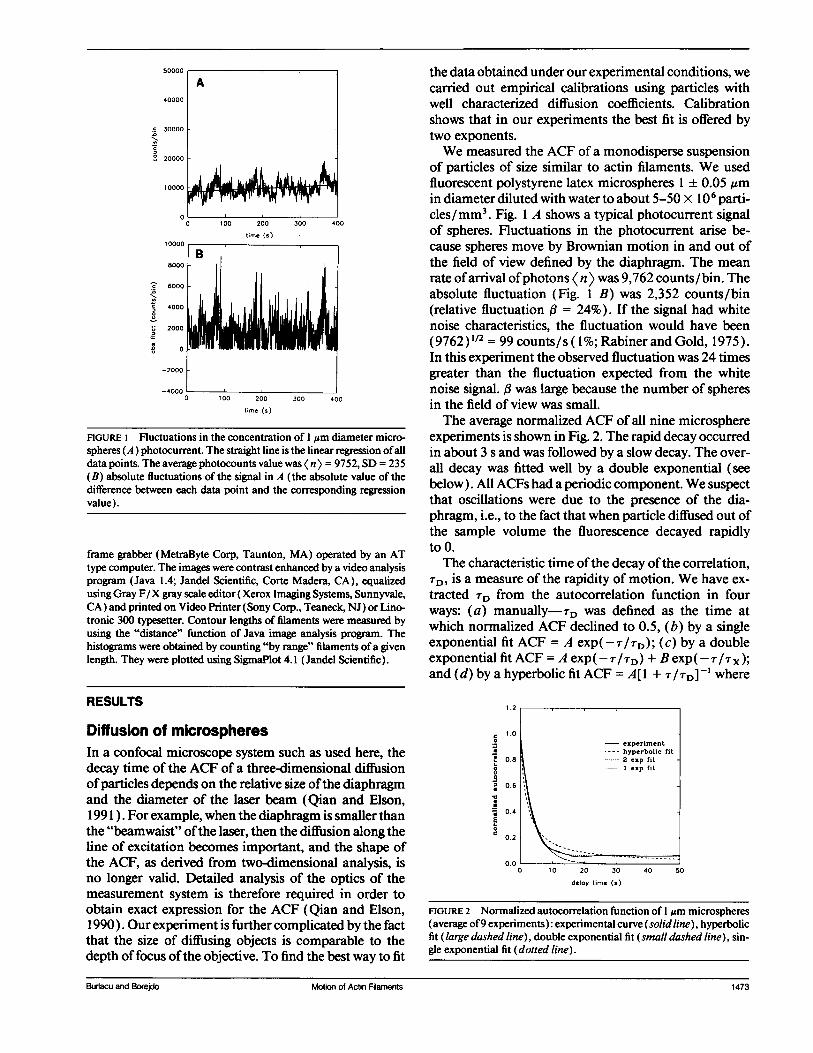
FIGURE 3 The normalized difference between the fitting curves andthe experimental autocorrelation function (see text for details). Sym-bols used are the same as in Fig. 2.
A, B, and Tx are constants and TD is the characteristictime. As a figure of merit for the goodness of fit we usedthe normalized residual N:N = square root ofthe sum ofsquares of residuals of the Marquardt-Levenberg fit.Manual fit to the average of all sphere experiments gaveTD = 2.50 s. Double exponential fit gaveA > B, TD < TX,TD = 3.35 s, N = 0.12. Single exponential fit gave TD =
4.16 s, N = 1.18. Hyperbolic fit gave TD = 1.92 s, N =
0.80. Fig. 3 is a plot ofnormalized differences Y = (yfit -Yexp)/Yexp versus the delay time r for three different fits.Double exponential fit was the best because Y was thesmallest and because it did not systematically increase atthe long delay times. This was also true for ACFs ofactinpreparations (see Fig. 7). In what follows, the character-istic time TD was always given as a decay of a first expo-nent in the double exponential fit to ACF. Because themagnitude of the second exponent was small and be-cause Tx was large, we speculate that the first exponentreflected the diffusion in the plane perpendicular to thedirection of propagation of light, and the second expo-nent diffusion along the direction ofpropagation oflight.The mean TD for all sphere experiments was TD =
3.18 ± 0.20 s (mean ± SEM ofnine experiments; it is notexactly equal to the characteristic time ofthe mean ACFfrom Fig. 2, because r ofthe mean ACF mean of r's).Minimum and maximum values were 2.30 and 3.65 s,respectively. The coefficient of variation was 18.9%.
In the two-dimensional case TD = w2/4DD, where DDis the diffusion coefficient for solute D (Elson andMagde, 1974). Therefore the diffusion coefficient forspheres DD = w2/4rD is 0.31 x 10 8 ± 0.02 cm2s-' (w =
2 ,um). The theoretical value for the diffusion coefficientof spheres 1 ,um in diameter at room temperature is0.42 x 10-8 cm2 sec-' (Tanford, 1963) in good agree-ment with observations.
This agreement, together with the fact that in our ex-
periments the radius of the diaphragm (5 ,um) was 2.5times greater than the beamwaist ofthe laser (2 ,m, cal-culated value) indicates that the two-dimensional analy-
sis of our three-dimensional experiment is valid (Qianand Elson, 1991 ).
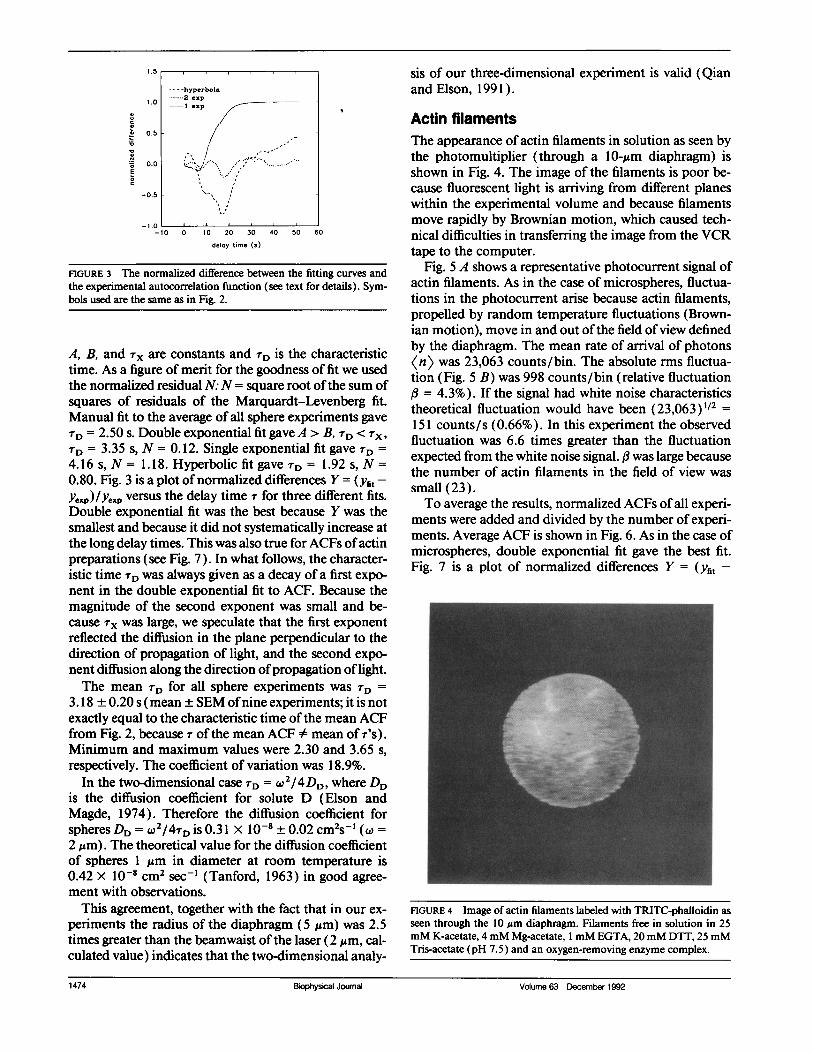
Actin filamentsThe appearance of actin filaments in solution as seen bythe photomultiplier (through a 10-,um diaphragm) isshown in Fig. 4. The image of the filaments is poor be-cause fluorescent light is arriving from different planeswithin the experimental volume and because filamentsmove rapidly by Brownian motion, which caused tech-nical difficulties in transferring the image from the VCRtape to the computer.
Fig. 5 A shows a representative photocurrent signal ofactin filaments. As in the case of microspheres, fluctua-tions in the photocurrent arise because actin filaments,propelled by random temperature fluctuations (Brown-ian motion), move in and out ofthe field ofview definedby the diaphragm. The mean rate of arrival of photonsKn> was 23,063 counts/bin. The absolute rms fluctua-tion (Fig. 5 B) was 998 counts/bin (relative fluctuation, = 4.3%). If the signal had white noise characteristicstheoretical fluctuation would have been (23,063)1/2 =
151 counts/s (0.66%). In this experiment the observedfluctuation was 6.6 times greater than the fluctuationexpected from the white noise signal. : was large becausethe number of actin filaments in the field of view was
small (23).To average the results, normalized ACFs of all experi-
ments were added and divided by the number of experi-ments. Average ACF is shown in Fig. 6. As in the case ofmicrospheres, double exponential fit gave the best fit.Fig. 7 is a plot of normalized differences Y = (Yfit -
FIGURE 4 Image of actin filaments labeled with TRITC-phalloidin as
seen through the 10 jAm diaphragm. Filaments free in solution in 25mM K-acetate, 4mM Mg-acetate, I mM EGTA, 20mM DTT, 25 mMTris-acetate (pH 7.5) and an oxygen-removing enzyme complex.
Biophysical Journal Volume 63 December 1992
- - - -hyperbola----..2 exp
1 exp
II,
II
,I
,I
0
1474 Biophysical Journal Volume 63 December 1992
50000
40000
.c 30000D
° 20000
10000
0
0
1 0000
8000
I 200 400 600 8t
time (s)
B
c 6000
c 4000
-t,, 2000
o 0
-2000 1
-40000 200 400 600 800
time (s)
FIGURE 5 (A) Typical photocurrent for a sample of 50 nM actin fila-ments conplexed with TRITC-phalloidin. The straight line is the linearregression ofall data. <n> = 23,063 and SD = 998. (B) absolute fluctua-tions of the signal in A (the absolute value of the difference betweeneach data point and the corresponding regression value).
ye,p)/yep versus the delay time r for 3 different fits. Dou-ble exponential fit was the best because Ywas the small-est and because it did not systematically increase at thelong delay times. N = square root of the sum of squaresofresiduals ofthe Marquardt-Levenberg was 0.58, 1.48,0. 17 for hyperbolic, single exponential, and double expo-nential fit, respectively. For double exponential fit, A >B, TD 4 TX, TD = 10.59 s.The mean rD for all actin filaments was TD = 10.59 +
0.85 s (mean ± SEM of nine experiments; as in the case
1.2
1.0 experimentexp fit
.o 2 fit
0.8 --- hyperbolic fit
0.6
~0.
76
20 30 40
deloy time (s)
c
EI
- - - -hyperbola1.0 -.. 2 exp
--I exp
0.5-
0.0 .5....-,-''--.....-..._
-0.5-20 0 20 40 60 80 100
delay time (s)
120
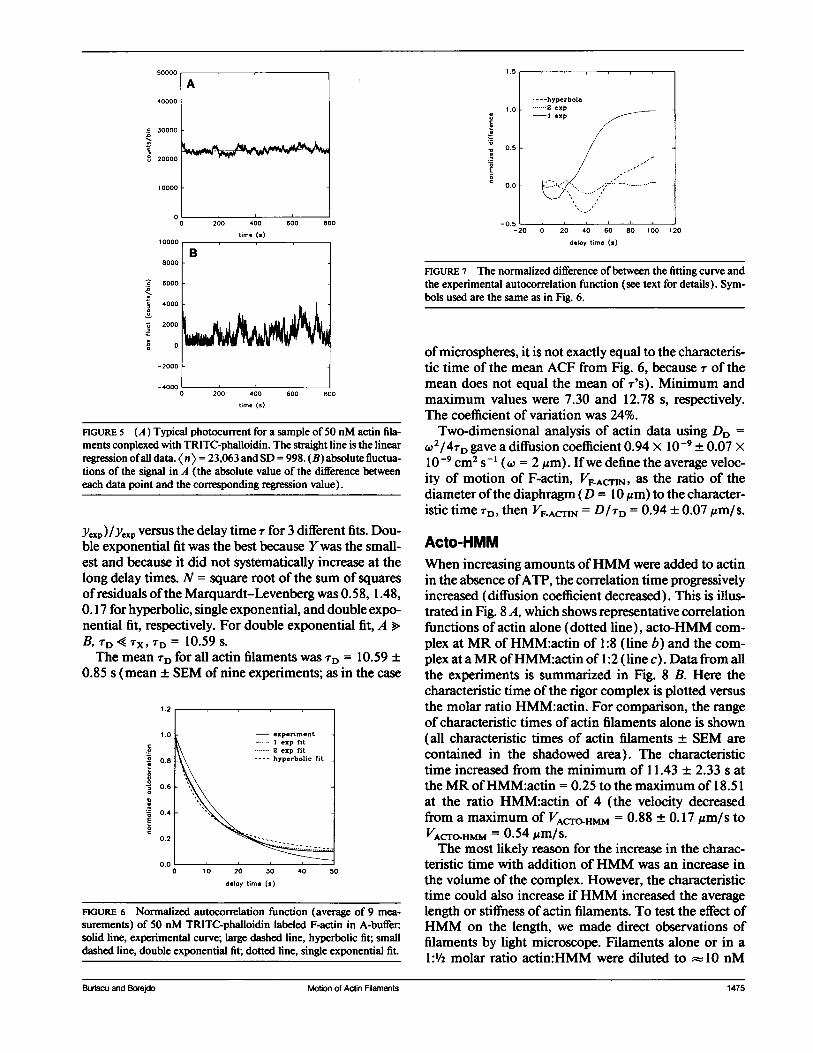
FIGURE 7 The normalized difference ofbetween the fitting curve andthe experimental autocorrelation function (see text for details). Sym-bols used are the same as in Fig. 6.
ofmicrospheres, it is not exactly equal to the characteris-tic time of the mean ACF from Fig. 6, because r of themean does not equal the mean of T'S). Minimum andmaximum values were 7.30 and 12.78 s, respectively.The coefficient of variation was 24%.Two-dimensional analysis of actin data using DD =
WI/4TD gave a diffusion coefficient 0.94 x 10⁻⁹ ± 0.07 x10⁻⁹ cm2 s-' (w = 2 Aim). Ifwe define the average veloc-ity of motion of F-actin, VFACrIN, as the ratio of thediameter ofthe diaphragm (D = 10 ,um) to the character-istic time TD, then VF ACTh = D/TD = 0.94 ± 0.07 ,Am/s.
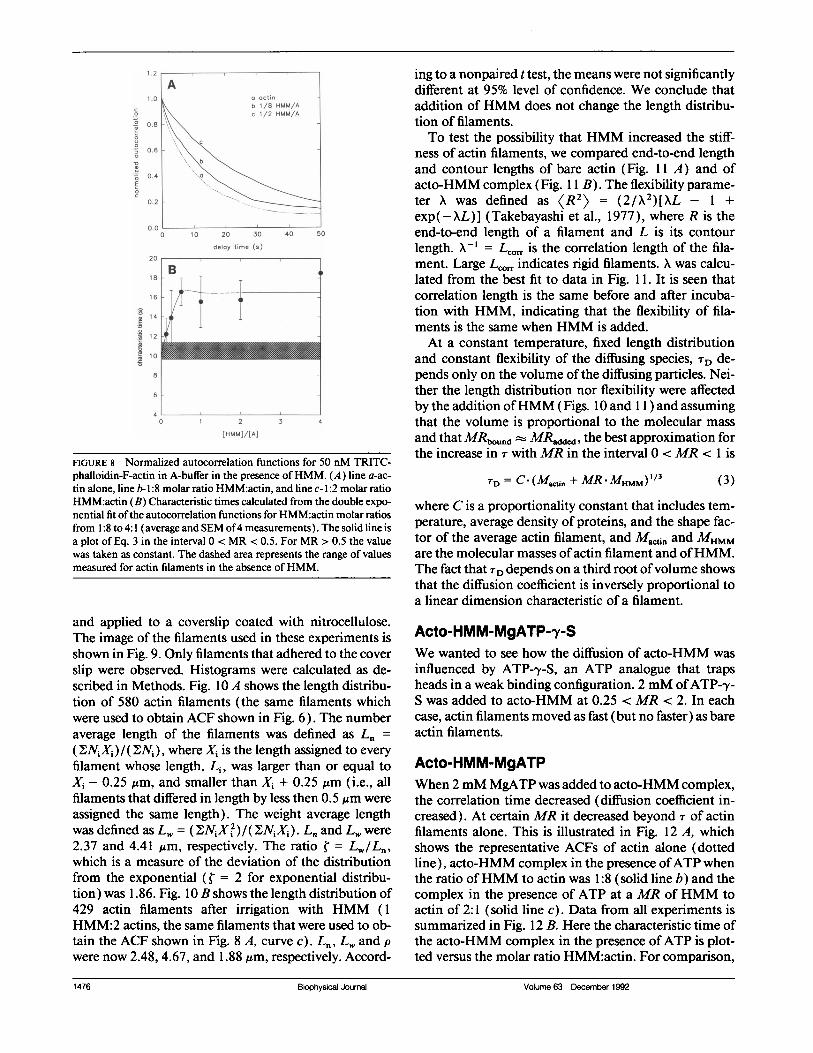
Acto-HMMWhen increasing amounts ofHMM were added to actinin the absence ofATP, the correlation time progressivelyincreased (diffusion coefficient decreased). This is illus-trated in Fig. 8 A, which shows representative correlationfunctions of actin alone (dotted line), acto-HMM com-
plex at MR of HMM:actin of 1:8 (line b) and the com-plex at aMR ofHMM:actin of 1:2 (line c). Data from allthe experiments is summarized in Fig. 8 B. Here thecharacteristic time ofthe rigor complex is plotted versusthe molar ratio HMM:actin. For comparison, the rangeof characteristic times of actin filaments alone is shown(all characteristic times of actin filaments + SEM arecontained in the shadowed area). The characteristictime increased from the minimum of 11.43 ± 2.33 s atthe MR ofHMM:actin = 0.25 to the maximum of 18.51at the ratio HMM:actin of 4 (the velocity decreasedfrom a maximum of VACrO.HMM = 0.88 ± 0.17 rm/s toVACTOHMM = 0.54 um/s.The most likely reason for the increase in the charac-
teristic time with addition of HMM was an increase inthe volume of the complex. However, the characteristictime could also increase ifHMM increased the averagelength or stiffness of actin filaments. To test the effect ofHMM on the length, we made direct observations offilaments by light microscope. Filaments alone or in a
1:'/2 molar ratio actin:HMM were diluted to 10 nM
Motion of Actin Filaments 1475
FIGURE 6 Normalized autocorrelation function (average of 9 mea-surements) of 50 nM TRITC-phalloidin labeled F-actin in A-buffer:solid line, experimental curve; large dashed line, hyperbolic fit; smalldashed line, double exponential fit; dotted line, single exponential fit.
1-
Burlacu and Borejdo 1475Motion of Actin Filaments
1.2
1.0
° 0.8
, 0.6
z
0.4
E
0.2
0.0
delay time (s)20
18
16
1 4
12
1 0
2 3 4
[HMM]/[A]
FIGURE 8 Normalized autocorrelation functions for 50 nM TRITC-phalloidin-F-actin in A-buffer in the presence ofHMM. (A) line a-ac-tin alone, line b- 1:8 molar ratio HMM:actin, and line c- 1:2 molar ratioHMM:actin (B) Characteristic times calculated from the double expo-nential fit ofthe autocorrelation functions for HMM:actin molar ratiosfrom 1:8 to 4:1 (average and SEM of4 measurements). The solid line isa plot of Eq. 3 in the interval 0 < MR < 0.5. For MR > 0.5 the valuewas taken as constant. The dashed area represents the range of valuesmeasured for actin filaments in the absence ofHMM.
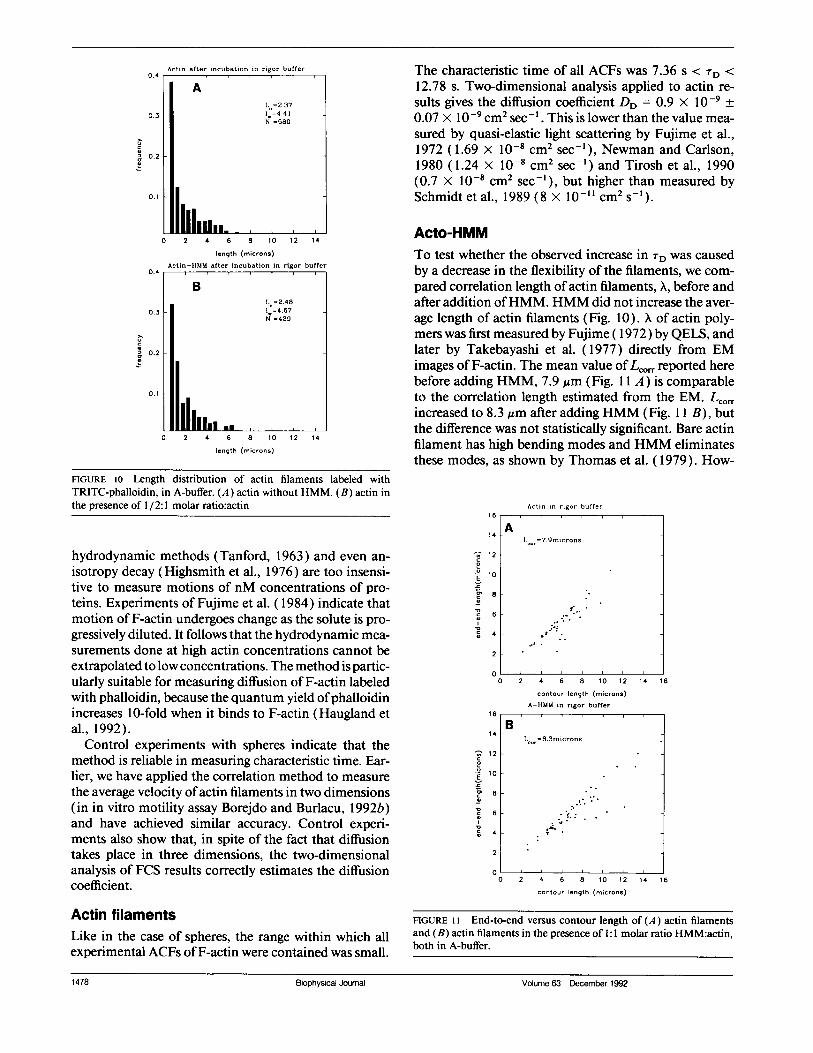
and applied to a coverslip coated with nitrocellulose.The image of the filaments used in these experiments isshown in Fig. 9. Only filaments that adhered to the coverslip were observed. Histograms were calculated as de-scribed in Methods. Fig. 10 A shows the length distribu-tion of 580 actin filaments (the same filaments whichwere used to obtain ACF shown in Fig. 6). The numberaverage length of the filaments was defined as Ln =
(2NjXj)/(;N), where Xi is the length assigned to every
filament whose length, Li, was larger than or equal toXi - 0.25 Am, and smaller than Xi + 0.25 Am (i.e., allfilaments that differed in length by less then 0.5 ,um wereassigned the same length). The weight average lengthwas defined as L. = (NjX3)1(2NjXj). Ln and LW were
2.37 and 4.41 Am, respectively. The ratio = LW/LA,which is a measure of the deviation of the distributionfrom the exponential (D = 2 for exponential distribu-tion) was 1.86. Fig. 10 B shows the length distribution of429 actin filaments after irrigation with HMM (1HMM:2 actins, the same filaments that were used to ob-tain the ACF shown in Fig. 8 A, curve c). Ln, Lw and p
were now 2.48, 4.67, and 1.88 ,um, respectively. Accord-
ing to a nonpaired t test, the means were not significantlydifferent at 95% level of confidence. We conclude thataddition of HMM does not change the length distribu-tion of filaments.To test the possibility that HMM increased the stiff-
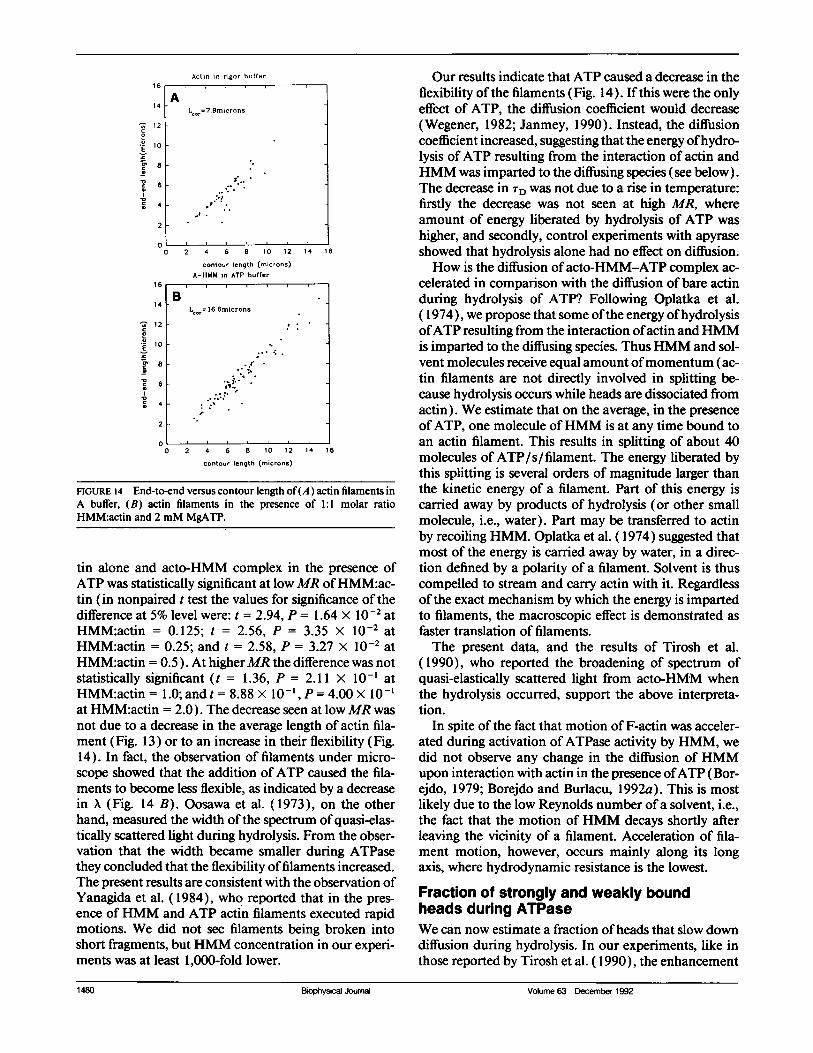
ness of actin filaments, we compared end-to-end lengthand contour lengths of bare actin (Fig. 11 A) and ofacto-HMM complex (Fig. 11 B). The flexibility parame-ter X was defined as KR2> = (2/X2)MXL - 1 +exp(-XL)] (Takebayashi et al., 1977), where R is theend-to-end length of a filament and L is its contourlength. X-1 = L,,., is the correlation length of the fila-ment. Large L., indicates rigid filaments. X was calcu-lated from the best fit to data in Fig. 11. It is seen thatcorrelation length is the same before and after incuba-tion with HMM, indicating that the flexibility of fila-ments is the same when HMM is added.At a constant temperature, fixed length distribution
and constant flexibility of the diffusing species, TD de-pends only on the volume ofthe diffusing particles. Nei-ther the length distribution nor flexibility were affectedby the addition ofHMM (Figs. 10 and 11 ) and assumingthat the volume is proportional to the molecular massand that MRb,,Ufd MRaddo,d the best approximation for
the increase in r with MR in the interval 0 < MR < 1 is
TD = _(Ma.in + MR MHMM) /3 (3)
where C is a proportionality constant that includes tem-perature, average density of proteins, and the shape fac-tor of the average actin filament, and M.,.j12 and MHMMare the molecular masses ofactin filament and ofHMM.The fact that TD depends on a third root ofvolume showsthat the diffusion coefficient is inversely proportional toa linear dimension characteristic of a filament.
Acto-HMM-MgATP-y-SWe wanted to see how the diffusion of acto-HMM was
influenced by ATP-"y-S, an ATP analogue that trapsheads in a weak binding configuration. 2 mM ofATP-y-S was added to acto-HMM at 0.25 < MR < 2. In eachcase, actin filaments moved as fast (but no faster) as bareactin filaments.
Acto-HMM-MgATPWhen 2 mM MgATP was added to acto-HMM complex,the correlation time decreased (diffusion coefficient in-creased). At certain MR it decreased beyond r of actinfilaments alone. This is illustrated in Fig. 12 A, whichshows the representative ACFs of actin alone (dottedline), acto-HMM complex in the presence ofATP whenthe ratio ofHMM to actin was 1:8 (solid line b) and thecomplex in the presence of ATP at a MR ofHMM toactin of 2:1 (solid line c). Data from all experiments issummarized in Fig. 12 B. Here the characteristic time ofthe acto-HMM complex in the presence ofATP is plot-ted versus the molar ratio HMM:actin. For comparison,
1476 Biophysical Journal Volume 63 December
1 476 Biophysical Journal Volume 63 December 1992
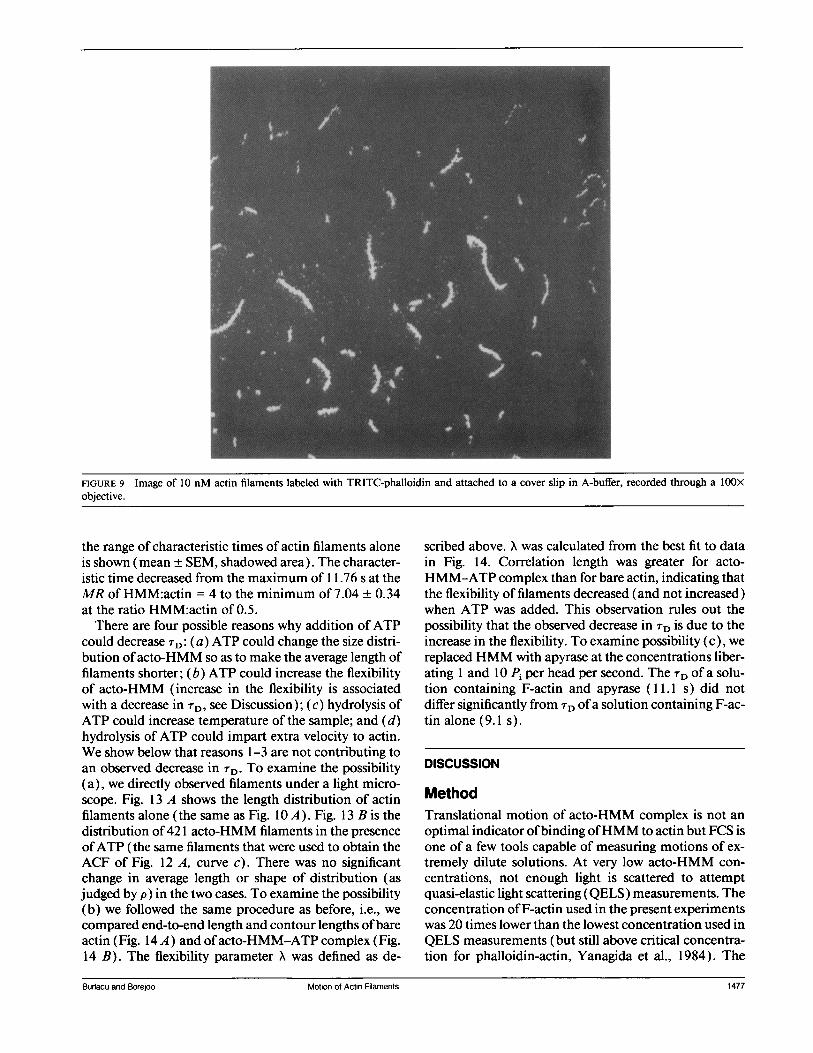
FIGURE 9 Image of 10 nM actin filaments labeled with TRITC-phalloidin and attached to a cover slip in A-buffer, recorded through a IOOXobjective.
the range of characteristic times of actin filaments aloneis shown (mean ± SEM, shadowed area). The character-istic time decreased from the maximum of 1.76 s at theMR of HMM:actin = 4 to the minimum of 7.04 ± 0.34at the ratio HMM:actin of 0.5.
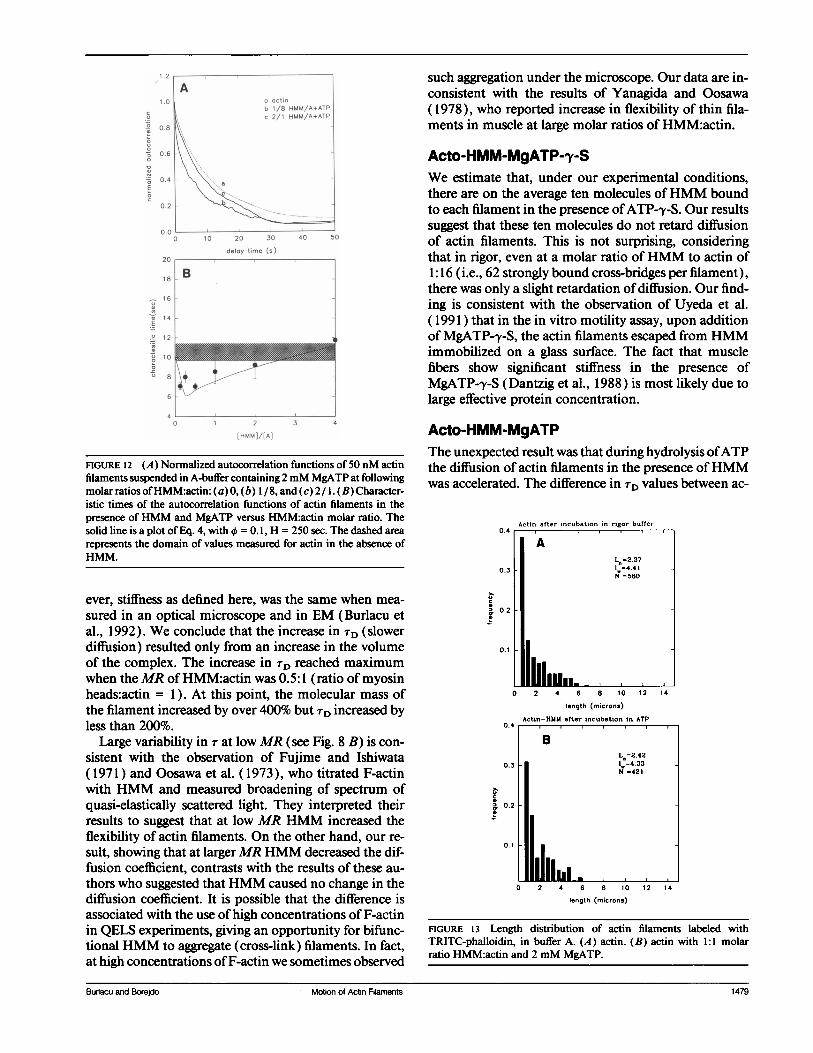
There are four possible reasons why addition of ATPcould decrease TD: (a) ATP could change the size distri-bution ofacto-HMM so as to make the average length offilaments shorter; (b) ATP could increase the flexibilityof acto-HMM (increase in the flexibility is associatedwith a decrease in TD, see Discussion); (c) hydrolysis ofATP could increase temperature of the sample; and (d)hydrolysis of ATP could impart extra velocity to actin.We show below that reasons 1-3 are not contributing toan observed decrease in 'TD. To examine the possibility(a), we directly observed filaments under a light micro-scope. Fig. 13 A shows the length distribution of actinfilaments alone (the same as Fig. 10 A). Fig. 13 B is thedistribution of421 acto-HMM filaments in the presenceofATP (the same filaments that were used to obtain theACF of Fig. 12 A, curve c). There was no significantchange in average length or shape of distribution (asjudged by p) in the two cases. To examine the possibility(b) we followed the same procedure as before, i.e., wecompared end-to-end length and contour lengths ofbareactin (Fig. 14 A) and ofacto-HMM-ATP complex (Fig.14 B). The flexibility parameter X was defined as de-
scribed above. X was calculated from the best fit to datain Fig. 14. Correlation length was greater for acto-HMM-ATP complex than for bare actin, indicating thatthe flexibility of filaments decreased (and not increased)when ATP was added. This observation rules out thepossibility that the observed decrease in TD is due to theincrease in the flexibility. To examine possibility (c), wereplaced HMM with apyrase at the concentrations liber-ating 1 and 10 Pi per head per second. The TD of a solu-tion containing F-actin and apyrase (11.1 s) did notdiffer significantly from TD ofa solution containing F-ac-tin alone (9.1 s).
DISCUSSION
MethodTranslational motion of acto-HMM complex is not anoptimal indicator ofbinding ofHMM to actin but FCS isone of a few tools capable of measuring motions of ex-tremely dilute solutions. At very low acto-HMM con-centrations, not enough light is scattered to attemptquasi-elastic light scattering (QELS) measurements. Theconcentration ofF-actin used in the present experimentswas 20 times lower than the lowest concentration used inQELS measurements (but still above critical concentra-tion for phalloidin-actin, Yanagida et al., 1984). The
Burtacu and Borejdo Motion of Actin FilamentsBurlacu and Borejdo Motion of Actin Filaments 1477
Actin after incubation in rigor buffer0.4
AL =2.37
0.3 _ = 4.41N =580
0.2
0. 1
0.1 2 46,,,.., 8, 1 1 140 2 4 6 8 10 1 2 14
0.4
0.3
c
0.2
0.1
length (microns)
ctin-HMM after incubation in rigor
4 6 8 10 12 14
length (microns)
FIGURE 10 Length distribution of actin filaments labeled withTRITC-phalloidin, in A-buffer. (A) actin without HMM. (B) actin inthe presence of 1/2:1 molar ratio:actin
hydrodynamic methods (Tanford, 1963) and even an-
isotropy decay (Highsmith et al., 1976) are too insensi-tive to measure motions of nM concentrations of pro-teins. Experiments of Fujime et al. (1984) indicate thatmotion of F-actin undergoes change as the solute is pro-gressively diluted. It follows that the hydrodynamic mea-surements done at high actin concentrations cannot beextrapolated to low concentrations. The method is partic-ularly suitable for measuring diffusion of F-actin labeledwith phalloidin, because the quantum yield ofphalloidinincreases 10-fold when it binds to F-actin (Haugland etal., 1992).
Control experiments with spheres indicate that themethod is reliable in measuring characteristic time. Ear-lier, we have applied the correlation method to measurethe average velocity ofactin filaments in two dimensions(in in vitro motility assay Borejdo and Burlacu, 1992b)and have achieved similar accuracy. Control experi-ments also show that, in spite of the fact that diffusiontakes place in three dimensions, the two-dimensionalanalysis of FCS results correctly estimates the diffusioncoefficient.
Actin filamentsLike in the case of spheres, the range within which allexperimental ACFs ofF-actin were contained was small.
The characteristic time of all ACFs was 7.36 s < TD <12.78 s. Two-dimensional analysis applied to actin re-
sults gives the diffusion coefficient DD = 0.9 X 10⁻⁹ +
0.07 x 10⁻¹ cm2 sec-'. This is lower than the value mea-sured by quasi-elastic light scattering by Fujime et al.,1972 (1.69 x 10⁻⁸ cm2 sec-'), Newman and Carlson,1980 (1.24 x 10⁻⁸ cm2 sec-') and Tirosh et al., 1990(0.7 x 10⁻⁸ cm2 sec'), but higher than measured bySchmidt et al., 1989 (8 x 10⁻¹" cm2 s-').
Acto-HMMTo test whether the observed increase in TD was causedby a decrease in the flexibility of the filaments, we com-pared correlation length ofactin filaments, X, before andafter addition ofHMM. HMM did not increase the aver-age length of actin filaments (Fig. 10). X of actin poly-mers was first measured by Fujime (1972) by QELS, andlater by Takebayashi et al. (1977) directly from EMimages of F-actin. The mean value ofLcOT reported herebefore adding HMM, 7.9,um (Fig. 11 A) is comparableto the correlation length estimated from the EM. LCOITincreased to 8.3,um after adding HMM (Fig. 11 B), butthe difference was not statistically significant. Bare actinfilament has high bending modes and HMM eliminatesthese modes, as shown by Thomas et al. (1979). How-
.2E
c'
.9_
EIxxe5
Actin in rigor buffer16
A14-
L =7.9micronscor
12 -
10
8
4 _
2
C0 2 4 6 8 10 12 14 16
contour length (microns)A-HMM in rigor buffer
16
B14-
Lcor=8.3microns12 -
10 _
8
6
4
2
00 2 4 6 8 10 12 14 1i
contour length (microns)
FIGURE 11 End-to-end versus contour length of (A) actin filamentsand (B) actin filaments in the presence of 1:1 molar ratio HMM:actin,both in A-buffer.
1478 Biophysical Journal Volume 63 December 1992
6
6
1 478 Biophysical Journal Volume 63 December 1992
delay time (s)
B _
_.
0 1 2
[HMM]/[A]
such aggregation under the microscope. Our data are in-consistent with the results of Yanagida and Oosawa( 1978), who reported increase in flexibility of thin fila-ments in muscle at large molar ratios of HMM:actin.
Acto-HMM-MgATP-y-SWe estimate that, under our experimental conditions,there are on the average ten molecules ofHMM boundto each filament in the presence ofATP-y-S. Our resultssuggest that these ten molecules do not retard diffusionof actin filaments. This is not surprising, consideringthat in rigor, even at a molar ratio of HMM to actin of1:16 (i.e., 62 strongly bound cross-bridges per filament),there was only a slight retardation of diffusion. Our find-ing is consistent with the observation of Uyeda et al.( 1991 ) that in the in vitro motility assay, upon additionof MgATP-y-S, the actin filaments escaped from HMMimmobilized on a glass surface. The fact that musclefibers show significant stiffness in the presence ofMgATP-y-S (Dantzig et al., 1988) is most likely due tolarge effective protein concentration.
3 4
FIGURE 12 (A) Normalized autocorrelation functions of 50 nM actinfilaments suspended in A-buffer containing 2mM MgATP at followingmolar ratios ofHMM:actin: (a) 0, (b) 1/8, and (c) 2/ 1. (B) Character-istic times of the autocorrelation functions of actin filaments in thepresence ofHMM and MgATP versus HMM:actin molar ratio. Thesolid line is a plot of Eq. 4, with X = 0.1, H = 250 sec. The dashed arearepresents the domain of values measured for actin in the absence ofHMM.
Acto-HMM-MgATPThe unexpected result was that during hydrolysis ofATPthe diffusion of actin filaments in the presence ofHMMwas accelerated. The difference in TD values between ac-
0.4
0.3
ever, stiffness as defined here, was the same when mea-
sured in an optical microscope and in EM (Burlacu etal., 1992). We conclude that the increase in TD (slowerdiffusion) resulted only from an increase in the volumeof the complex. The increase in TD reached maximumwhen theMR of HMM:actin was 0.5:1 (ratio of myosinheads:actin = 1). At this point, the molecular mass ofthe filament increased by over 400% but TD increased byless than 200%.
Large variability in r at lowMR (see Fig. 8 B) is con-sistent with the observation of Fujime and Ishiwata(1971) and Oosawa et al. (1973), who titrated F-actinwith HMM and measured broadening of spectrum ofquasi-elastically scattered light. They interpreted theirresults to suggest that at low MR HMM increased theflexibility of actin filaments. On the other hand, our re-
sult, showing that at largerMR HMM decreased the dif-fusion coefficient, contrasts with the results of these au-
thors who suggested thatHMM caused no change in thediffusion coefficient. It is possible that the difference isassociated with the use of high concentrations of F-actinin QELS experiments, giving an opportunity for bifunc-tional HMM to aggregate (cross-link) filaments. In fact,at high concentrations ofF-actin we sometimes observed
3 0.2
0.1
2 4 6 8 10 12 14
length (microns)
Actin-HMM after incubation in ATP
2 4 6 8 10 12 14
length (microns)
FIGURE 13 Length distribution of actin filaments labeled withTRITC-phalloidin, in buffer A. (A) actin. (B) actin with 1:1 molarratio HMM:actin and 2 mM MgATP.
Burlacu and Borejdo Motion of Actin Filaments
c
O c
I
Eu
E
.2_
r-
20
18
16
14
12
10
8
6
4I
u1
0
Burlacu and Borejdo Motion of Actin Filarnents 1 479
0cp.2
cr
cp
cp
c
Actin in rigor buffer16
A1 4_
L =7.9microns
12cor12-
10 2
8
6
41
2
0o 2 4 6 8 10 12 14 16
contour length (microns)A-HMM in ATP buffer
16 1l
B14 -
L =16.6micronscor
12 -
10 _
8
4
2
00 2 4 6 8 10 12 14 16
contour length (microns)
FIGURE 14 End-to-end versus contour length of(A) actin filaments inA buffer, (B) actin filaments in the presence of 1:1 molar ratioHMM:actin and 2 mM MgATP.
tin alone and acto-HMM complex in the presence ofATP was statistically significant at lowMR ofHMM:ac-tin (in nonpaired t test the values for significance of thedifference at 5% level were: t = 2.94, P = 1.64 x 10⁻² atHMM:actin = 0.125; t = 2.56, P = 3.35 X 10⁻² atHMM:actin = 0.25; and t = 2.58, P = 3.27 X 10⁻² atHMM:actin = 0.5). At higherMR the difference was notstatistically significant (t = 1.36, P = 2.11 x 10-' atHMM:actin = 1.0; and t = 8.88 X 0-, P = 4.00 X 10-'at HMM:actin = 2.0). The decrease seen at low MR wasnot due to a decrease in the average length of actin fila-ment (Fig. 13) or to an increase in their flexibility (Fig.14). In fact, the observation of filaments under micro-scope showed that the addition ofATP caused the fila-ments to become less flexible, as indicated by a decreasein X (Fig. 14 B). Oosawa et al. (1973), on the otherhand, measured the width ofthe spectrum of quasi-elas-tically scattered light during hydrolysis. From the obser-vation that the width became smaller during ATPasethey concluded that the flexibility offilaments increased.The present results are consistent with the observation ofYanagida et al. (1984), who reported that in the pres-ence of HMM and ATP actin filaments executed rapidmotions. We did not see filaments being broken intoshort fragments, butHMM concentration in our experi-ments was at least 1,000-fold lower.
Our results indicate that ATP caused a decrease in theflexibility ofthe filaments (Fig. 14). Ifthis were the onlyeffect of ATP, the diffusion coefficient would decrease(Wegener, 1982; Janmey, 1990). Instead, the diffusioncoefficient increased, suggesting that the energy ofhydro-lysis of ATP resulting from the interaction of actin andHMM was imparted to the diffusing species (see below).The decrease in rD was not due to a rise in temperature:firstly the decrease was not seen at high MR, whereamount of energy liberated by hydrolysis of ATP washigher, and secondly, control experiments with apyraseshowed that hydrolysis alone had no effect on diffusion.How is the diffusion ofacto-HMM-ATP complex ac-
celerated in comparison with the diffusion of bare actinduring hydrolysis of ATP? Following Oplatka et al.( 1974), we propose that some ofthe energy ofhydrolysisofATP resulting from the interaction ofactin andHMMis imparted to the diffusing species. ThusHMM and sol-vent molecules receive equal amount ofmomentum (ac-tin filaments are not directly involved in splitting be-cause hydrolysis occurs while heads are dissociated fromactin). We estimate that on the average, in the presenceofATP, one molecule ofHMM is at any time bound toan actin filament. This results in splitting of about 40molecules of ATP/s/filament. The energy liberated bythis splitting is several orders of magnitude larger thanthe kinetic energy of a filament. Part of this energy iscarried away by products of hydrolysis (or other smallmolecule, i.e., water). Part may be transferred to actinby recoiling HMM. Oplatka et al. ( 1974) suggested thatmost of the energy is carried away by water, in a direc-tion defined by a polarity of a filament. Solvent is thuscompelled to stream and carry actin with it. Regardlessofthe exact mechanism by which the energy is impartedto filaments, the macroscopic effect is demonstrated asfaster translation of filaments.The present data, and the results of Tirosh et al.
(1990), who reported the broadening of spectrum ofquasi-elastically scattered light from acto-HMM whenthe hydrolysis occurred, support the above interpreta-tion.
In spite of the fact that motion of F-actin was acceler-ated during activation of ATPase activity by HMM, wedid not observe any change in the diffusion of HMMupon interaction with actin in the presence ofATP (Bor-ejdo, 1979; Borejdo and Burlacu, 1992a). This is mostlikely due to the low Reynolds number of a solvent, i.e.,the fact that the motion of HMM decays shortly afterleaving the vicinity of a filament. Acceleration of fila-ment motion, however, occurs mainly along its longaxis, where hydrodynamic resistance is the lowest.
Fraction of strongly and weakly boundheads during ATPaseWe can now estimate a fraction ofheads that slow downdiffusion during hydrolysis. In our experiments, like inthose reported by Tirosh et al. ( 1990), the enhancement
1450 Biophysical Journal Volume 63 December 19921480 Biophysical Journal Volume 63 December 1992
of diffusion disappeared at molar ratios higher than one.It suggests that the enhancement is a combination ofthetwo effects: a rigor-like (strong) binding, which slowsdown the diffusion, and the acceleration due to the ex-plosive splitting of ATP. The rigor binding slows downthe diffusion according to Eq. 3, except that now only afraction X ofHMM is strongly bound to F-actin at anytime (we assume that this fraction is the same at eachMR). Decrease in TD is assumed to be proportional tothe number ofinteractingHMM molecules X . MR.H isa constant that describes a decrease in characteristic timeof actin filaments resulting from the interaction with 1HMM in the presence of ATP. In the presence of ATPwe thus get:
TD = C(Mwi + 4MR*MHMM)"13 - MR. H. (4)
There are two parameters in Eq. 4- X and H; neverthe-less the data of Fig. 12 B can be fitted to Eq. 4 because Xand H have separate effects on the fit. Changing 4 (atconstant H) changes only the slope of the fit (withoutaffecting the intercept), and changingH (for constant 4)shifts the intercept of the fit (without affecting theslope). The best fit was obtained with 4 = 0.06 ± 0.02and H = 250 ± 25 s.
We thank Prof. W. W. Webb, Dr. I. Brust-Maschel and Prof. A.Oplatka for valuable comments.
This work was supported by a grant from the National Institutes ofHealth (AR-40095-01).
Received for publication 5 May 1992 and in finalform 3August 1992.
REFERENCESBorejdo, J., and M. F. Morales. 1977. Fluctuations in tension during
contraction of single muscle fibers. Biophys. J. 20:315-334.Borejdo, J. 1979. Motion of myosin fragments during actin activatedATPase. Fluorescence correlation spectroscopy study. Biopolymers.18:2807-2820.
Borejdo, J., and S. Burlacu. 1992a. Diffusion of heavy meromyosin inthe presence of F-actin and ATP. J. Muscle Res. Cell Motil. 13:106-116.
Borejdo, J., and S. Burlacu. 1992b. Velocity of movement of actinfilaments in in vitro motility assay measured by fluorescence correla-tion spectroscopy. Biophys. J. 61:1267-1280.
Burlacu, S., P. A. Janmey, and J. Borejdo. 1992. Distribution of actinfilament lengths measured by fluorescence microscopy. Am. J. Phys-iol. (Cell Physiol.) 262:C569-C577.
Dantzig, J. A., J. W. Walker, D. R. Trentham, and Y. E. Goldman.1988. Relaxation ofmuscle fibers with adenosine 5'-[Gamma-thio]-triphosphate (ATP[y-S]) and by laser photolysis of cagedATP[Gamma-S]: Evidence for Ca2+-dependent affinity of rapidlydetaching zero-force cross bridges. Proc. Natl. Acad. Sci. USA.85:6176-6720.
Elson, E. L., and D. Magde. 1974. Fluorescence correlation spectros-copy. I. Conceptual basis and theory. Biopolymers. 13:1-28.
Elson, E. L., and W. W. Webb. 1975. Concentration correlation spec-troscopy. Annu. Rev. Biophys. Bioeng. 4:311-334.
Elson, E. L., and H. Qian. 1989. Interpretation of fluorescence correla-
tion spectroscopy and photobleaching recovery in terms of molecu-lar interactions. Methods Cell Bio. 30:307-332.
Englander, S. W., D. B. Calhoun, and J. J. Englander. 1987. Biochemis-try without oxygen. Anal. Biochem. 161:300-306.
Fraser, A. B., E. Eisenberg, W. W. Kielley, and F. D. Carlson. 1975.The interaction ofheavy meromyosin and subfragment- 1 with actin.Physical measurements in the presence and absence of adenosinetriphosphate. Biochemistry. 14:2207-2214.
Fujime, S., and S. Ishiwata. 1971. Dynamic study of F-actin by quasi-elastic scattering of laser light. J. Mol. Bio. 62:251-265.
Fujime, S. 1972. Quasi-Elastic Scattering ofLaser Light-A New Toolfor the Dynamic Study of Biological Macromolecules. Adv. Biophys.3:1-39.
Fujime, S., S. Ishiwata, and T. Maeda. 1972. F-actin-heavy meromyo-sin complex studied by optical homodyne and heterodyne methods.Biochem. Biophys. Acta. 283:351-363.
Goldman, Y. E., M. G. Hibberd, and D. R. Trentham. 1984. Initiationof active contraction by photogeneration of adenosine-5'-triphos-phate in rabbit psoas muscle fibers. J. Physiol. 354:605-624.
Harada, Y., K. Sakudara, T. Aoki, D. D. Thomas, and T. Yanagida.1990. Mechanochemical coupling in actomyosin energy transduc-tion studied by in vitro movement assay. J. Mol. Biol. 216:49-68.
Haugland, R. P., Z. Huang, R. P. Haugland, V. Paragas, W. You, andS. Wells. 1992. Interaction ofphalloidin with actin. Proc. Conf Mus-cle as a Machine: Energy Transduction in the Contractile System.Bethesda, MD. April 13-15, 1992. (Abstr.)
Highsmith, S., R. A. Mendelson, and M. F. Morales. 1976. Affinity ofmyosin SI for F-actin, measured by time resolved fluorescence an-isotropy. Proc. Natl. Acad. Sci. USA. 73:133-137.
Houseal, T. W., C. Bustamante, R. Stump, and M. F. Maestre. 1989.Real time imaging of single DNA molecule with fluorescence micro-scope. Biophys. J. 56:507-516.
Huxley, H. E. 1969. The mechanism of muscular contraction. Science(Wash. DC). 164:1356-1366.
Janmey, P. A., S. Hvidt, G. F. Oster, J. Lamb, T. P. Stossel, and J. H.Hartwig. 1990. Effect of ATP on actin filament stiffness. Nature(Lond.). 347:95-99.
Koppel, D. E. 1974. Statistical accuracy in fluorescence correlationspectroscopy. Phys. Rev. A. 10: 1938-1945.
Kron, S. J., and J. A. Spudich. 1986. Fluorescent actin filaments moveon myosin fixed to a glass surface. Proc. Natl. Acad. Sci. USA.83:6272-6276.
Lymn, R. W., and E. W. Taylor. 1971. Mechanism of adenosine tri-phosphate hydrolysis by actomyosin. Biochemistry. 10:4617-4624.
Magde, D., E. L. Elson, and W. W. Webb. 1974. Fluorescence correla-tion spectroscopy. II. An experimental realization. Biopolymers.13:29-61.
Newman, J., and F. D. Carlson. 1980. Dynamic light scattering evi-dence for the flexibility of native muscle thin filaments. Biophys. J.29:37-47.
Oosawa, F., S. Fujime, S. Isiwata, and K. Mihashi. 1973. Dynamicproperty of F-actin and thin filament. Cold Spring Harbor Lab.37:277-285.
Oplatka, A., H. Gadasi, R. Tirosh, Y. Lamed, A. Muhlrad, and N.Liron. 1974. Demonstration of mechanochemical coupling in sys-tems containing actin, ATP and non-aggregating active myosin deriv-atives. J. Mechanochem. Cell Motil. 2:295-306.
Podolsky, R. J. 1980. The rate-limiting step in muscle contraction.Basic Res. Cardiol. 75:34-39.
Qian, H., and E. L. Elson. 1990. Characterization of confocal laserbased microscope by digital image analysis-an optical sectioningmicroscopy approach. In Optical Microscopy for Biology. B. Her-man and K. Jacobson, editors. Alan R. Liss, New York. 119-130.
Qian, H., and E. L. Elson. 1991. Analysis of confocal laser-microscope
Burlacu and Borejdo Motion of Actin Filaments 1481
optics for 3-D fluorescence correlation spectroscopy. Appl. Optics.30:1185-1195.
Rabiner, L., and B. Gold. 1975. In Theory and Application of DigitalSignal Processing, Prentice-Hall, Englewood Cliffs, NJ. 367.
Schmidt, C. F., M. Barmann, C. Isenberg, and E. Sackmann. 1989.Chain dynamics, mesh size, and diffusive transport in networks ofpolymerized actin. A quasielastic light scattering and microfluores-cence study. Macromolecules. 22:3638-3649.
Spudich, J., and S. Watt. 1971. The regulation ofrabbit skeletal musclecontraction. I. Biochemical studies ofthe interaction ofthe tropomy-osin-troponin complex with actin and the proteolytic fragments ofmyosin. J. Biol. Chem. 246:4866-4871.
Takebayashi, T., Y. Morita, and F. Oosawa. 1977. Electronmicrosco-pic investigation ofthe flexibility ofF-actin. Biochem. Biophys. Acta.492:357-363.
Tanford, C. 1963. In Physical Chemistry of Macromolecules, JohnWiley and Sons, New York. 362.
Tirosh, R., W. Z. Low, and A. Oplatka. 1990. Translational motion ofactin filaments in the presence ofheavy meromyosin and MgATP asmeasured by Doppler broadening of laser light scattering. Biochem.Biophys. Acta. 1037:274-280.
Thomas, D. D., J. C. Seidel, and J. Gergely. 1979. Rotational dynamicsof spin-labeled F-actin in the submillisecond time range. J. Mol.Biol. 132:257-273.
Uyeda, T. Q. P., H. M. Warrick, S. J. Kron, and J. A. Spudich. 1991.Quantitized velocities at low myosin densities in an in vitro motilityassay. Nature (Lond.). 352:307-311.
Yanagida, T., and F. Oosawa. 1978. Polarized fluorescence from e-ADP incorporated into F-actin in a myosin free single fiber: confor-mation of F-actin and changes induced in it by heavy meromyosin.J. Mol. Biol. 126:507-524.
Yanagida, T., M. Nakase, K. Nishiyama, and F. Oosawa. 1984. Directobservation of motion of single F-actin filaments in the presence ofmyosin. Nature (Lond.). 307:58-60.
Yanagida, T., T. Arata, and F. Oosawa. 1985. Sliding distance of actinfilament induced by myosin cross-bridge during one ATP hydrolysiscycle. Nature (Lond.). 316:366-369.
Wegener, W. A. 1982. Bead models ofsegmentally flexible macromole-cules. J. Chem. Phys. 76:6425-6430.
Weeds, A. G., and B. Pope. 1977. Studies on the chymotryptic diges-tion of myosin. Effects ofdivalent cations on proteolytic susceptibil-ity. J. Mol. Biol. 111: 129-157.
1482 Biophysical Journal Volume 63 December 1992


