Download - MERCURY SPECIES IN NATURAL GAS CONDENSATE
University of Plymouth
PEARL https://pearl.plymouth.ac.uk
04 University of Plymouth Research Theses 01 Research Theses Main Collection
1999
Mercury species in natural gas
condensate
Shafawi, Azman Bin
http://hdl.handle.net/10026.1/1693
University of Plymouth
All content in PEARL is protected by copyright law. Author manuscripts are made available in accordance with
publisher policies. Please cite only the published version using the details provided on the item record or
document. In the absence of an open licence (e.g. Creative Commons), permissions for further reuse of content
should be sought from the publisher or author.
MERCURY SPECIES IN NATURAL GAS CONDENSATE
By
AZMAN BIN SHAFAWI BSC (Hons), MSc
A thesis submitted to the University of Plymouth
in partial fiilfilment for the degree of
DOCTOR OF PHILOSOPHY
Department of Environmental Sciences,
University of Plymouth,
Drake Circus,
Plymouth,
PL4 8AA.
In collaboration with;
Petroliam Nasional Bhd, PETRONAS
MALAYSIA,
and
P.S. Analytical Ltd.
United Kingdom
JANUARY 1999
LIBRARY STORE
90 0398913 3
mm- Roo3989l35_ s
Date
Class No. Conll.No.
3 A U G 1999
X - 7 o 3 S o q | - f ) o URRARY S E R V I C E S
REFERENCE ONLY
ABSTRACT
MERCURY SPECIES IN NATURAL GAS CONDENSATE
AZMAN BIN SHAFAWI
The presence of ultra-trace levels of mercury in industrial gas and condensate streams is a cause of both environmental and production conceriL The toxic nature of the element, in all forms, together with its ability to shut-down large processing plants dictates a need for its accurate and precise measurement.
The study which investigated the recoveiy of various mercury species, spiked into synthetic and real condensate sanqples using conventional and new digestion and/or extraction techniques showed recovery was dependent upon the speciation. Using the most efficient technique, L<ysteme with persulphate, recoveries of over 90 % were obtained for diphenyl mercury, ethyl and phenyl mercury chlorides and mercury chloride. The recovery of 15% for the in^rtant dimethyl mercury species limits the use of this technique.
A novel technique has been developed for the determination of total mercury in con^lex liquid hydrocarbons. San^les (up to 1.0 ml) were vaporised (400**C) and swept through a gold-coated silica trap maintained at 200°C, which retained all mercury species and discarded the matrix. The trap when heated to 900°C released the mercury for measurement by atomic fluorescence spectrometry (AFS). The recoveries for eight mercury species spiked (10 to 50 ng ml into toluene and condensate were generally over 90 %. The instrumental limit of detection (LOD) was 11 pg. The total mercury content of gas condensates, gasolines and heavy oils were determined.
Gas chromatogr^hy coupled, via a pyrolysis inter&ce, with AF detection was able to determme mercury species in gas condensate, at picogram levels (LOD: 2.5 to 7 pg) using a direct sample injection procedure. For a given column system the positive identification and quantification of up to eight mercury species was obtained. A maximum injector temperature of 125 *'C was recommended, to avoid the conversion of species. Mass balance calculations show a strong correlation between the total mercury content and the sum of the lower dialkyl mercury species, for all condensate samples studied.
Three commercially available mercury removal systems. A, B and C produced a reduction in the mercury content of hydrocarbon streams under pilot plant conditions. The two stage system, 'A' , produced a minimum of 30 % conversion fi-om organomercury to elemental mercury after the hydrogenation reaction in stage 1. While elemental mercury was adsorbed by the stage 2 reactor, the organomercury species were not removed. The single stage adsorber 'B' showed 100 % removal efficiency for three dialkyl mercury species in liquid hydrocarbon streams. The removal efficiency for adsorber ' C was species dependent. Two common condensate species gave values of 50 to 80 % removal efficiency while the third species showed time-dependent bleed-off.
iii
CONTENTS
Copyright Statement i Title Page ii Abstract iii List of contents iv List of tables X i List of figures XV Acknowledgement xix Author's Declaration XX
CHAPTER 1 : INTRODUCTION 1
1.1 Petroleum Industry 1
1.1.1 Natxiral gas and natural gas condensate 1
1.1.2 Characteristics of natural gas condensate 2
1.1.3 Natural gas condensate usage 5
1.2 Mercury in natural gas and the petrochemical industry 5
1.2.1 Mercury in natural gas industry 6
1.2.2 Mercury in the petrochemical industry 8
1.2.3 'Acceptable limits' for mercury content in process stream 9
1.2.4 Corrosion effect fi-om mercury upon process plant 10 1.2.4.1 Mercury- induced stress cracking 11 1.2.4.2 Mercury-catalysed oxidation by water 12
1.2.5 The petroleum industry and environmental impacts from mercury 14
1.2.6 Regulations and guideline levels for mercury
in the environment 17
1.3 Trace Mercury Determination 19
1.3.1 Mercury vapour generation technique 20 1.3.1.1 Reduction-aeration 20 1.3.1.2 Direct heating 21 1.3.1.3 Electrolytic amalgamation 21
I V
1.3.1.4 Direct amalgamation 21
1.3.2 Preconcentration technique prior to vapour generation 22 1.3.2.1 Amalgamation 1.3.2.2 Con^lexing agents 22
1.3.3 Mercury Speciation 22 1.3.3.1 Speciation by chromatography coupled with AAS 23 1.3.3.2 Speciation by chromatography coupled with AFS 24
1.3.4 The determination of mercury in natural gas condensate 24 1.3.4.1 Total mercury in natural gas condensate 26 1.3.4.2 Mercury speciation in natural gas condensate 28
1A Mercury removal methods in the petroleum and petrochemical industry
1.4.2.3 JGC processes 1.4.2.4 Other processes
1.5.2.2 Instrumentation
1.6 Aims and objectives of this study
31
1.4.1 Mercury removal from natural gas 31
1.4.2 Mercury removal from natural gas condensate 31 1.4.2.1 The DSM process 31 1.4.2.2 EFP-RAM processes 33
33 33
1.5 Atomic Fluorescence Spectrometry 34
1.5.1 Background 34
1.5.2 Atomic fluorescence-principle and instrumentation 35 35 37 39
1.5.2.1 Principle 1.5.2.1.1 Fluorescence of mercury atom 37
40 1.5.3 Interferences 1.5.3.1 Gas phase interferences 1.5.3.2 Liquid phase interferences 41
1.5.4 Advantages and limitations of AF 42
43
CHAPTER 2 : THE DETERMINATION OF TOTAL MERCURY IN NATURAL GAS CONDENSATE BY DIGESTION AND EXTRACTION-COLD VAPOUR ATOMIC FLUORESCENCE SPECTROMETRY 45
2.1 Introduction 45
2.1.1 Objective of the study 48
2.2 Experimental
2.2.1 Mercury species
222 Reagents
2.3 Instrumentation
48
48
49
49
2.4 Sanqsle digestion and extraction procedure used in the study 52
2.4.1 CaHbration 52
2.4.2 Preliminary studies using acid-persulphate digestion 52
2.4.3 (a) Preliminary studies using I " /lO 3" digestion 53 2.4.3 (b) Further studies using \ 'f\0{ digestion 53
2.4.4 Complexation with dithizone, followed by extraction using thiosulphate and oxidative digestion with acid-persulphate
53 2.4.5 Extraction with thiosulphate, followed by
oxidative digestion with acid-persulphate 54
2.4.6 Extraction using L-cysteine followed by oxidative digestion with acid-persulphate 54
2.4.7 Mercury measurement 55
2.5 Results and discussion 56
2.5.1 Acid-persulphate digestion 57
2.5.2(a) Digestion with r AO 3" 59 2.5.2 (b) Extended experiment using above procedure 60
V I
2.5.3 Complexation with dithizone, followed by extraction with thiosulphate and oxidative digestion with acid-persulphate 61
2.5.4 Extraction with thiosulphate, followed by oxidative digestion with acid-persulphate 61
2.5.5 Extraction by L-cysteine ^2 2.5.5.1 Concentration of dimethyl mercury (DMM) 64 2.5.5.2 Factorial design ^ 2.5.5.3 Effect of pH of L-cysteine 64
2.6 Conclusions
3.1 Introduction
66
CHAPTER 3 : THE DETERMINATION OF TOTAL MERCURY IN LIQUID HYDROCARBONS AND CONDENSATES BY VAPORISATION AND TRAPPING WITH ATOMIC FLUORESCENCE DETECTION 69
69
3.2 Preliminary study using a sample vaporisation technique with elevated temperature trapping of mercury 72
3.2.1 Experimental 72
3.2.2 Results and discussion 74 3.2.2.1 Preliminary study using the sample vaporistion
technique with an off-line detection system 74
3.3 Development of an efScient vaporisation and trapping instrument for mercury determination with on-line fluorescence detection 76
3.3.1 Experimental 76 3.3.1.1 Reagents 76
3.3.2 Instrumentation 77 3.3.2.1 Vaporisation chamber 77 3.3.2.2 Adsorption trap module 77 3.3.2.3 Valve switching sequences 78 3.3.2.4 Filter 78
3.3.3 Experimental procedure 79
V I I

3.3.3.1 Cahljration procedure 82
3.3.4 Results and Discussion 85 3.3.4.1 Performance characteristics of the trap system 85 3.3.4.2 Effect of argon sweep gas flow rate 89 3.3.4.3 Efifect of volimie of saiiq)le injected
upon recovery 90 3.3.4.4 Double size trap 91 3.3.4.5 Recoveries of mercury species added
into *real' condensate samples 94 3.3.4.6 Precision of the experimental technique 98 3.3.4.7 Conostan mercury standard for oil analyses 99 3.3.4.8 Detection limits 101 3.3.4.9 Total mercury content in commercial
condensate 101
3.4 The determination of total mercury in real condensate and hydrocarbon samples by the vaporisation technique 103
3.4.1 Total mercury in condensate samples 103
3.4.2 Gasoline with ultra trace mercury content 108
3.4.3 Total mercury content in heavy oils 109 3.4.3.1 Effect of matrix on the precision 109
3.5 Conclusions 114
CHAPTER 4 : MERCURY SPECIATION IN NATURAL GAS CONDENSATE BY GAS CHROMATOGRAPHY COUPLED WITH ATOMIC FLUORESCENCE SPECTROMETRY 116
4.1 Introduction 116
4.2 Experimental 121
4.2.1 Instrumentation and optimisation study 121
4.2.2 Chemicals and reagents 122
4.2.3 Gas condensate samples 122
V I M

4.3 Resuhs and discussion 125
4.3.1 The efiFects of injector temperature 125
4.3.2 Optimisation of colxunn gas flow rate 126
4.3.3 Eflfect of make -up gas 131
4.3.4 Resohrtion of organomercury halides by non-polar
column 131
4.3.5 Retention times for mercury species on RTx-1 column 134
4.3.6 Chromatographic perfonnance using a polar cohmm 134
4.3.7 Retention times for mercury species on Cp-wax column 135
4.3.8 Calibrations of mercury species 135
4.3.9 Limits of detection 140
4.3.10 Speciation analysis of actual condensate 141 4.3.10.1 The RTx-1 non-polar column 141
4.3.10.2 The Cp-wax polar column 146
4.3.11 Mass balance calculations 150
4.4 Conclusions 151
CHAPTER 5 : THE PRELIMINARY EVALUATION OF AN ADSORBENT-BASED MERCURY REMOVAL SYSTEM FOR GAS CONDENSATE 153
5.1 Introduction
5.2 Experimental
153
5.1.1 Characteristics of the mercury-removal system 154
5.1.2 Mercury-removal fix>m natxu^ gas condensate 155 5.1.2.1 Sulphide-containing ion exchange resin material 155 5.1.2.2 Sulphide-containing alumina 155 5.1.2.3 Other systems 156
5.1.3 Aims of the study 156
157
5.2.1 Chemicals 5.2.2 Identification of mercury removal adsorbents/catalyst 157
5.2.3 Testing procedure ^ '
I X
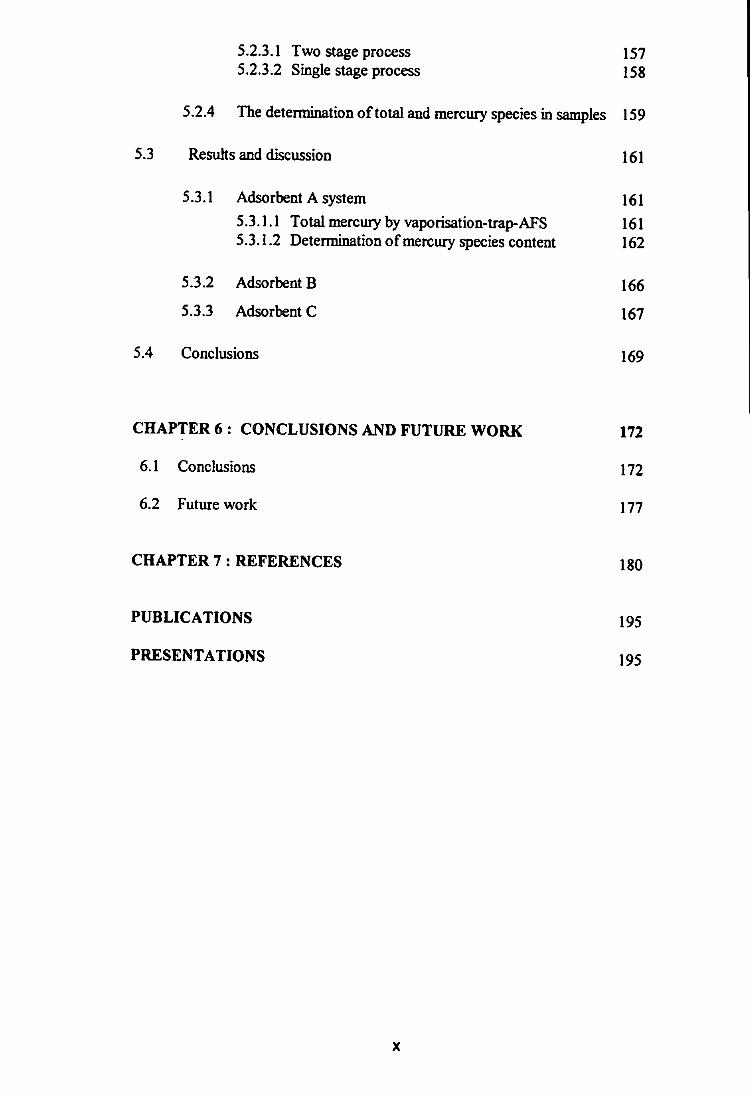
5.2.3.1 Two stage process 157 5.2.3.2 Single stage process 158
5.2.4 The determination of total and mercury species in samples 159
5.3 Results and discussion 161
5.3.1 Adsorbent A system 161 5.3.1.1 Total mercury by vaporisation-trap-AFS 161 5.3.1.2 Determination of mercury species content 162
5.3.2 Adsorbent B 166
5.3.3 Adsorbent C 167
5.4 Conclusions 169
CHAPTER 6 : CONCLUSIONS AND FUTURE WORK 172
6.1 Conclusions 172
6.2 Future work 177
CHAPTER 7 : REFERENCES 180
PUBLICATIONS 195
PRESENTATIONS 195
LIST OF TABLES
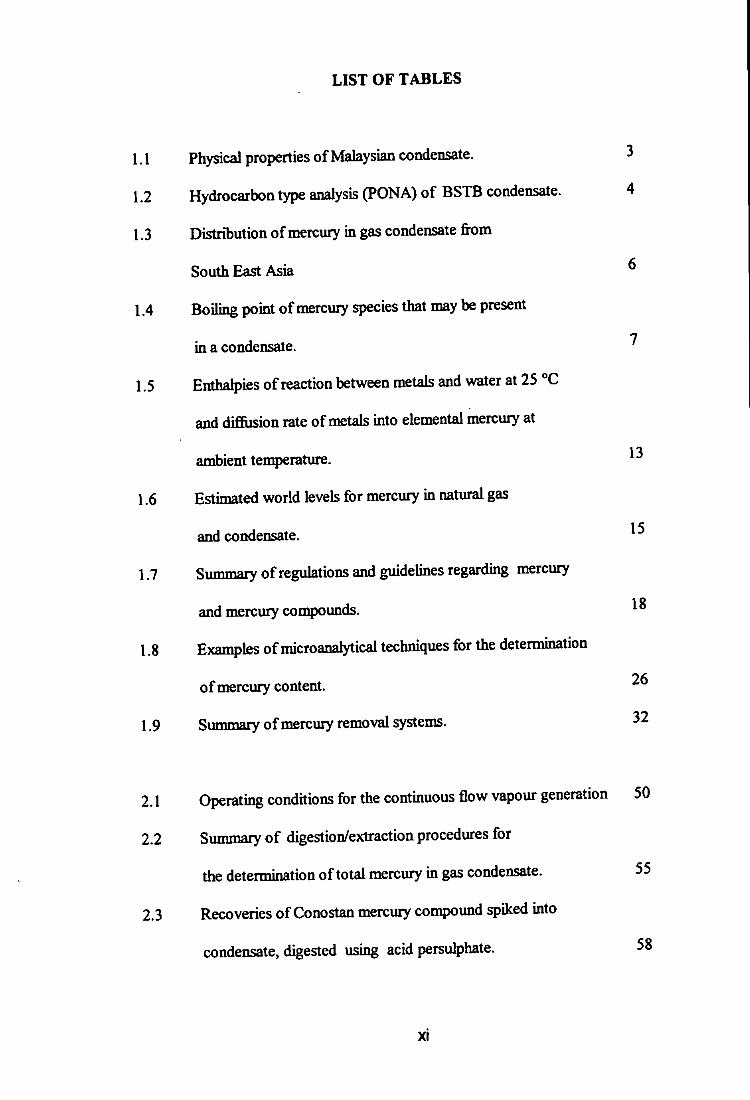
1.1 Physical properties of Malaysian condensate. 3
1.2 Hydrocarbon type analysis (PONA) of BSTB condensate. 4
1.3 Distribution of mercury in gas condensate fi-om
South East Asia 6
1.4 Boiling point of mercury species that may be present
b a condensate. 1
1.5 Enthalpies of reaction between metals and water at 25 °C
and diffiision rate of metals into elemental mercury at
ambient temperature.
1.6 Estinoated world levels for mercury in natural gas
and condensate.
1.7 Summary of regulations and guideUnes regarding mercury
and mercury compounds.
1.8 Examples of microanalytical techniques for the determination
of mercury content.
1.9
13
15
18
26
Summary of mercury removal systems. ^2
2.1 Operating conditions for the continuous flow vapour generation 50
2.2 Summary of digestion/extraction procedures for
the determination of total mercury in gas condensate. 55
2.3 Recoveries of Conostan mercury compound spiked into
condensate, digested using acid persulphate. 58
X I

60
61
2.4 Recoveries of DPM and Conostan organomercury
compound spiked into condensate sanf le and hydrocarbon
samples after digestion by acidic iodideAodate. 59
2.5 Recoveries of mercury species spiked into condensate
and digested with iodide/iodate.
2.6 Recoveries of DMM, DPM, EMC and PMC species
spiked into condensate - treatment with dithizone,
thiosulphate and acid persulphate aqueous phase.
2.7 Recoveries of DMM, DPM, EMC and PMC species
spiked into condensate - extracted with thiosulphate
followed with oxidative digestion with acid persulphate. 62
2.8 Recoveries of mercury species treated with I-cysteine. 63
2.9 Recoveries of DMM and PMC spked into toluene. 63
2.10 Ionic forms of 1-cysteine at different pH*s. 64
2.11 Recoveries at different pH of l-cysteine. 65
3.1 Recoveries of DMM and DPM spiked into n-pentane. 75
3.2 Summary of operating conditions. 83
3.3 Recoveries for DMM and DPM added into toluene
- eflTect of volume injected (single size trap). 91
3.4 Recoveries for DMM and DPM added into toluene
- effect of volume injected (double size trap). 92
3.5 Summary of recoveiy performance. 97
3.6 Total mercury content in commercial condensates. 102
3.7 Total mercury content for condensate samples 1 to 4. 104
3.8 Total mercury in gasoline samples. 109
xii
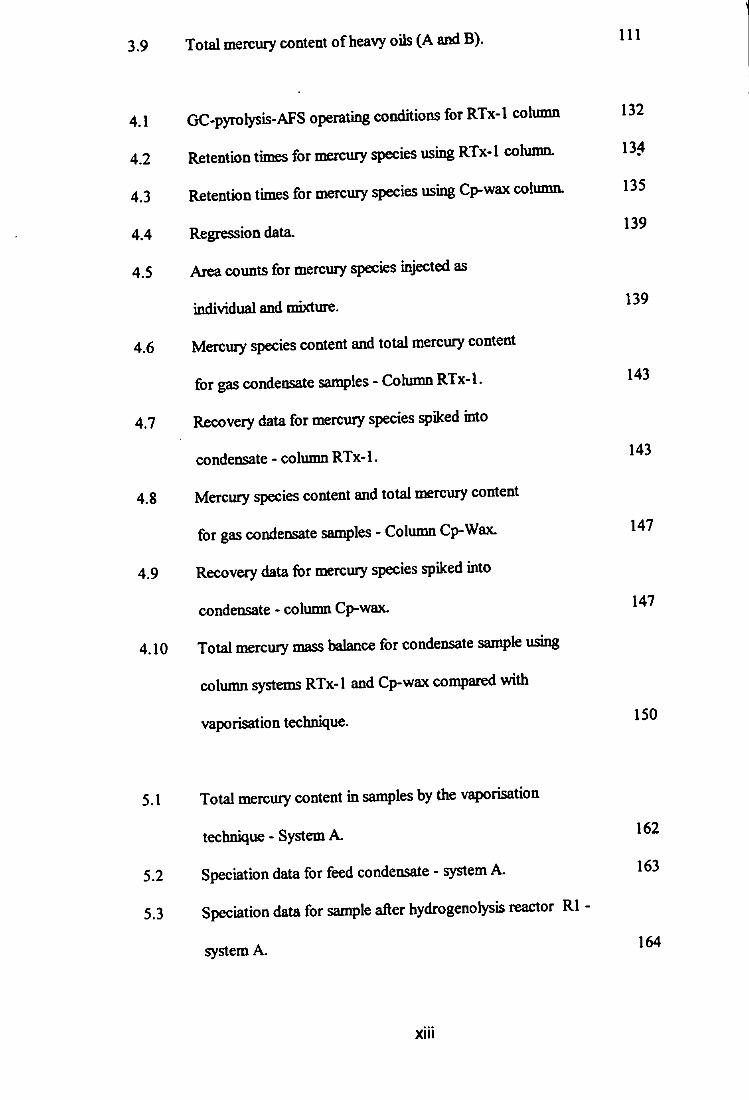
3.9 Total mercury content of heavy oils (A and B). I l l
4.1 GC-pyrolysis-AFS operating conditions for RTx-1 cohmm 132
4.2 Retention times for mercury species using RTx-1 cohmm. 134
4.3 Retention times for mercury species using Cp-wax cohmm. 135
4.4 Regression data.
4.5 Area counts for mercury species injected as
individual and mixture.
4.6 Mercury species content and total mercury content
for gas condensate samples - Cohmin RTx-1.
4.7 Recovery data for mercury species ^iked into
condensate - column RTx-1.
4.8 Mercury species content and total mercury content
for gas condensate samples - Column Cp-Wax.
4.9 Recovery data for mercury species spiked into
condensate - column Cp-wax.
4.10 Total mercury mass balance for condensate sample using
column sj^ems RTx-1 and Cp-wax compared with
vaporisation technique.
5.1 Total mercury content in samples by the vaporisation
technique - System A.
5.2 Speciation data for feed condensate - system A-
5.3 Speciation data for sample after hydrogenolysis reactor Rl
system A.
139
139
143
143
147
147
150
162
163
164
X I I I

5.4 Speciation data for sample after the mercury traping reactor R3 -
system A. 164
5.5 Mercury species before and after removal system
for adsorbent B. 166
5.6 Mercury species before and after removal system
for adsorbent C. 168
X I V
LIST OF FIGURES
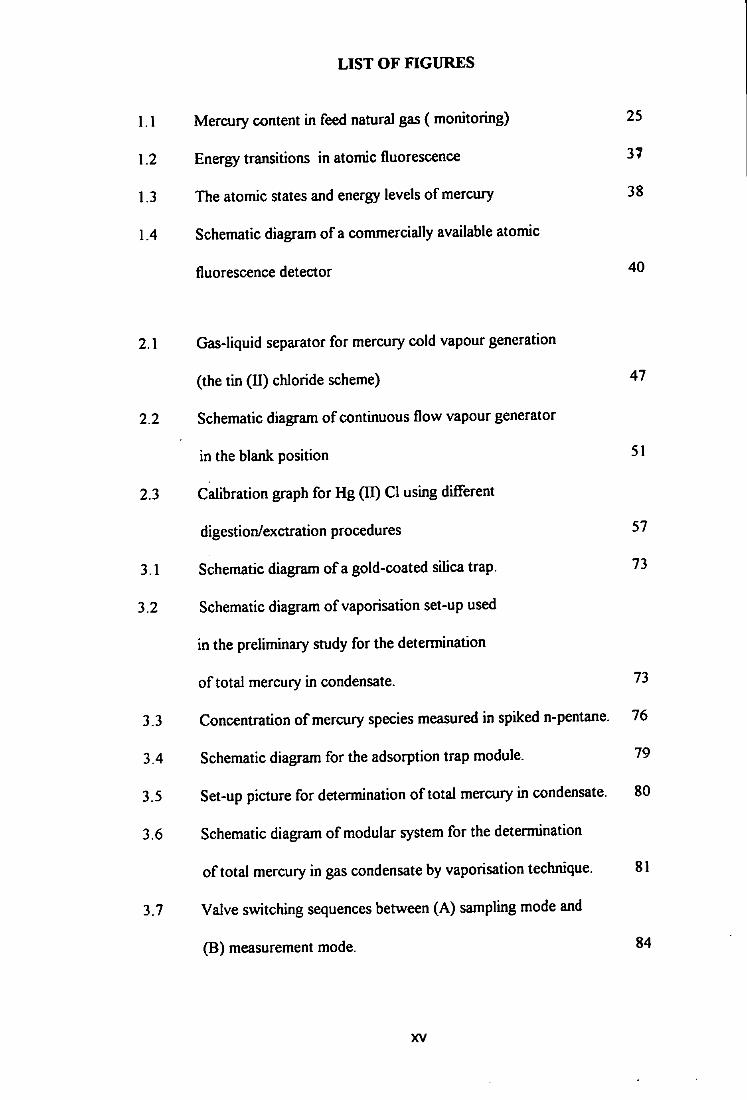
1.1 Mercury content in feed natural gas ( monitoring) 25
1.2 Energy transitions in atomic fluorescence 37
1.3 The atomic states and energy levels of mercury 38
1.4 Schematic diagram of a commercially available atomic
fluorescence detector 40
2.1 Gas-liquid separator for mercury cold vapour generation
(the tin (U) chloride scheme) 47
2.2 Schematic diagram of continuous flow vapour generator
in the blank position 51
2.3 Calibration graph for Hg (II) CI using different
digestion/exctration procedures 57
3 .1 Schematic diagram of a gold-coated silica trap. 73
3.2 Schematic diagram of vaporisation set-up used
in the preliminary study for the determination
of total mercury in condensate. 73
3 .3 Concentration of mercury species measured in spiked n-pentane. 76
3 .4 Schematic diagram for the adsorption trap module. 79
3.5 Set-up picture for determination of total mercury in condensate. 80
3 .6 Schematic diagram of modular system for the determination
of total mercury in gas condensate by vaporisation technique. 81
3.7 Valve switching sequences between (A) sampling mode and
(B) measurement mode. 84
X V
3.8 Calibration graphs for gold coated silica traps at
room temperature and at 200 ° C. 86
3.9 Stability of the trap in holding mercury at 200 C. 87
3.10 Calibration comparisons for several dialkyl mercury
compounds and elemental mercury. 87
3.11 Examples of volatograms of 10 ng ml
(DMM, DEM, DBM AND DPM) and
Volatogram of DMM at different concentrations. 88
3 .12 Effect of argon sweep gas flow rate upon signal response. 89
3.13 Summary of recovery performance of DMM and DPM added
into toluene - effect of volume injected between single and
double size traps. 93
3.14 Calibration comparison between single and double size traps 93
3.15 Distillation curve (ASTM D86) of BSTB condensate. 95
3.16 A typical chromatogram showing the hydrocarbon distribution
in gas condensate (PONA - ASTM D 5134). 96
3.17 Vapour-liquid phase envelope for BSTB condensate. 97
3.18 Summary of recoveries study. 98
3.19 Total mercury content in toluene and condensate TC 123. 99
3.20 Recovery of DEM, MC and EMC in condensate. 100
3.21 Recovery of Conostan in condensate. 100
3 .22 Total mercury in commercial condensate. 102
3.23 Volatogram of condensate sample 3 - 0.5 ml injected. 105
3.24 Volatogram of condensate sample 3 - 0.25 ml injected. 105
3.25 Volatogram of condensate sample 4 - 0.5 ml injected. 106
X V I
3.26 Volatogram of condensate sample 4 - 0.5 ml injeaed
(1:1 dilution) 106
3 .27 Volatogram of condensate sample 3 - 0.25 ml injected
(l:ldilution) 107
3.28 Volatogram of condensate sample 3 - 0.5 ml injected
(l:ldUution) 107
3.29 Volatogram of condensate sample 4 - 0.25 ml injected
(1:2 dilution) 108
3 .30 Volatogram of heavy oil B, 5 times dilution. 111
3 .31 Volatogram of heavy oil B, 20 times dilution. 112
3.32 Volatogram of heavy oil B, 50 times dilution. 112
3.33 Volatogram of heavy oil A, 100 times dilution. 113
4.1 A diagram of the pyrolyser unit. 123
4.2 A diagram of the injector system. 123
4.3 Instrumental set-up for mercury speciation natural gas condensate. 124
4.4 Effect of injector temperature - elemental mercury formation. 126
4.5 Chromatogram for effect of injector temperature. 128
4.6 Chromatogram for effect of carrier gas flow rate. 129
4.7 Effect of column gas flow rate. 130
4.8 Van Deemter plot for RTx-1 column for DMM. DEM and DPM. 130
4.9 The effect of argon make-up gas upon mercury signal. 131
4.10 Chromatogram for dialkyl mercury, organomercury halide
and mixture of them - RTx-1 column. 133
4.11 Chromatogram for dialkyl mercury, organomercury halide
and mixture of them - Cp-Wax column. 136
xvii

4.12 Calibration graphs for Hg DMM, DEM, DBM and DPM
using Cp-Wax column. 138
4.13 Calibration comparison of DEM using RTx-1 and
Cp-Wax colum. 118
4.14 Area counts comparison for DMM species injected
individuallyand from mixture. 140
4.15 Chromatograms for speciation of mercury in condensate
samples - Column RTx-1. 144
4.16 Chromatogram of mixtures (DMM, DEM, and DPM),
BS 3/4 condensate and mixtures of both - Column RTx-1. 145
4.17 Chromatograms for speciation of mercury in condensate
samples - Column Cp-Wax. 148
4.18 Chromatogram of mixtures (DMM, DEM, DBM and DPM),
BS 3/4 condensate and mixtures of both - Column Cp-Wax. 149
5.1 A schematic of the two stage mercury removal pilot plant. 160
5.2 A schematic of the single stage mercury removal pilot plant. 161
5.3 Mercury chromatograms for feed, hydrogenolysis reactor
and trapping reactor - system A. 165
5.4 Chromatogram for mercury species before and after
removal system B. 167
5 .5 Example of mercury chromatograms before and after
removal unit for adsorbent C. 169
XVIII
ACKNOWLEDGEMENTS
I would like to ofifer my sincere thanks to Dr M. E. Foulkes and Professor Les Ebdon for
their guidance and support over the last three years. Also thanks to Professor P.B.
Stockwell aiKi Dr Warren T. Corns for their support and advice. Many thank you to Dr
Andy Fidier, you are great.
I am very grateful to PETRONAS, Malaysia, for the studentship grant for this work and
maintenance expenses for me and my femily throughout the study period.
A super love to my wife Rozy, and all my children; Farid, Ainaa, Lina and Fuad for their
patient, understanding and moral support. Not forgotten my lovely kitten Sammy
Finally, many thanks to all staff in the University of Plymouth especially to aU laboratory
stafiFfor their assistance throughout my study.
AZMANSHAFAWI
XIX
AUTHOR DECLARATION
At no time during the registration for the degree of Doctor of PhUosophy has the author
been registered for any other university award.
This study was fully financed with the aid of a sponsorship grant firom PETRONAS
company, Malaysia, under their Staff Development Programme and has been conducted in
the Department of Environmental Sciences of the University of Plymouth.
Signed Date .J^LLZJI
XX
CHAPTER 1
INTRODUCTION
CHAPTER 1
INTRODUCTION
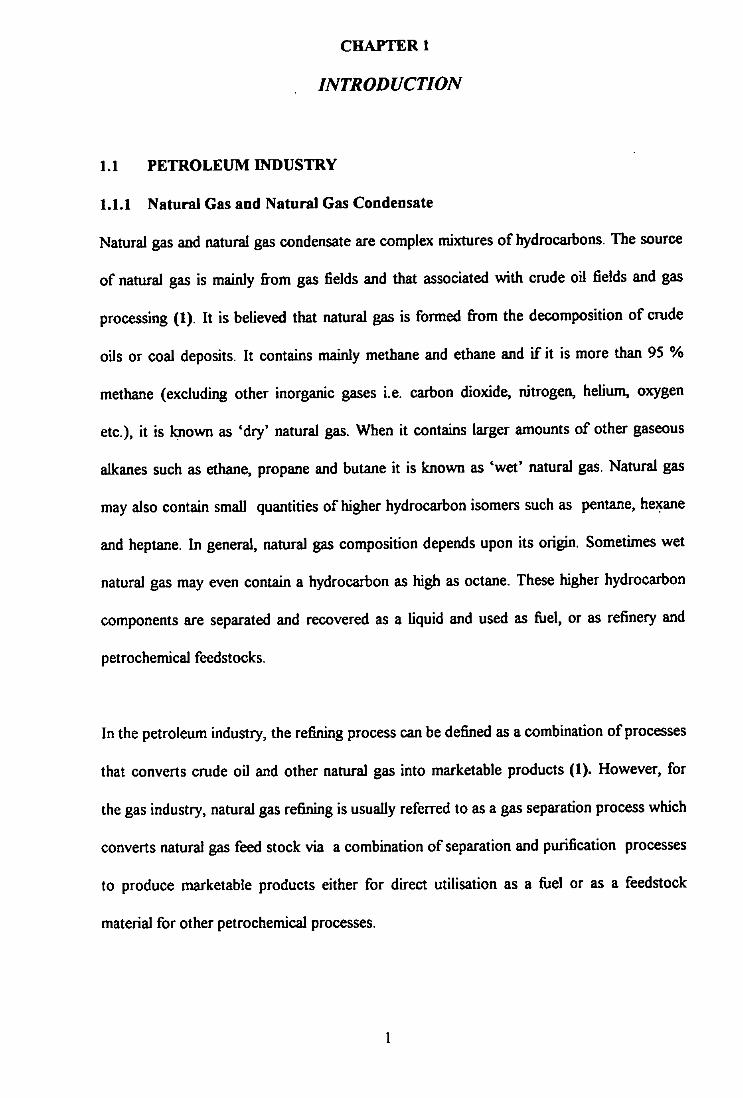
1.1 PETROLEUM INDUSTRY
l . L l Natural Gas and Natural Gas Condensate
Natural gas and natural gas condensate are complex mixtures of hydrocarbons. The source
of natural gas is mainly from gas fields and that associated with crude oil fields and gas
processing (1). It is believed that natural gas is formed from the decomposition of crude
oils or coal deposits. It contains mainly methane and ethane and i f it is more than 95 %
methane (excluding other inorganic gases i.e. carbon dioxide, nitrogen, helium, oxygen
etc.), it is known as *dry' natural gas. When it contains larger amounts of other gaseous
aikanes such as ethane, propane and butane it is known as 'wet' natural gas. Natural gas
may also contain small quantities of higher hydrocarbon isomers such as pentane, hexane
and heptane. In general, natural gas composition depends upon its origin. Sometimes wet
natural gas may even contain a hydrocarbon as high as octane. These higher hydrocarbon
components are separated and recovered as a liquid and used as fuel, or as refinery and
petrochemical feedstocks.
In the petroleum industry, the refining process can be defined as a combination of processes
that converts crude oil and other natural gas into marketable products (1). However, for
the gas industry, natural gas refining is usually referred to as a gas separation process which
converts natural gas feed stock via a combination of separation and purification processes
to produce marketable products either for direct utilisation as a fiiel or as a feedstock
material for other petrochemical processes.
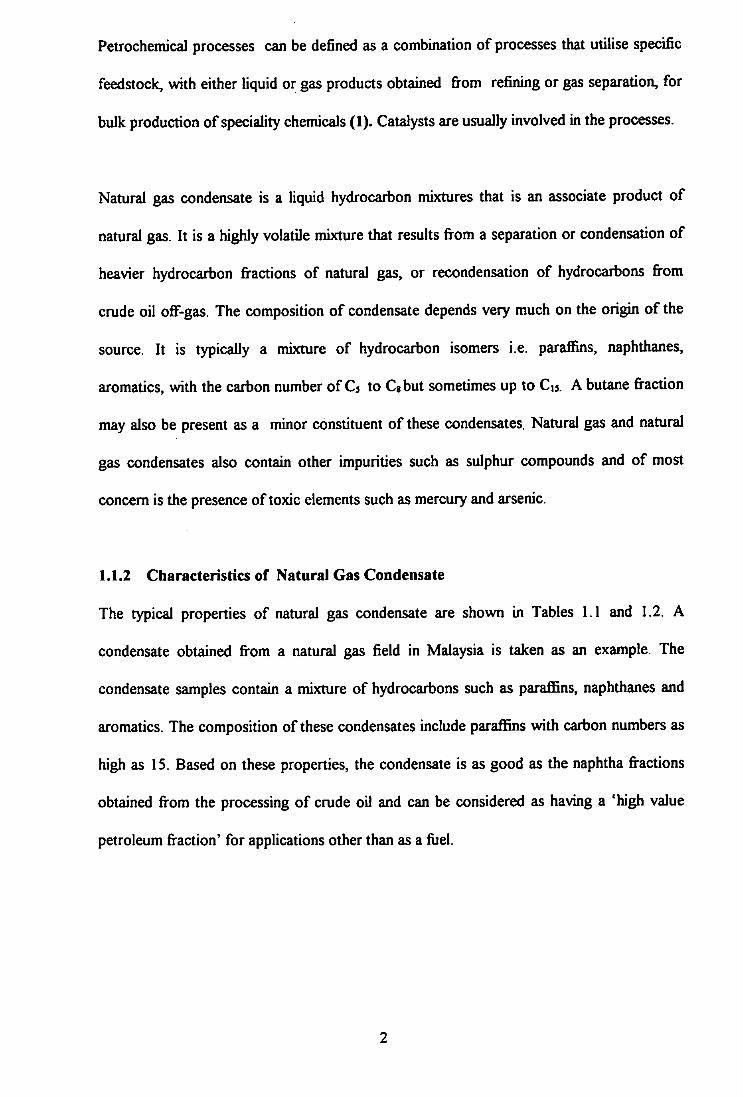
Petrochemical processes can be defined as a combination of processes that utilise specific
feedstock, with either liquid or gas products obtained fi-om refining or gas separation, for
bulk production of speciality chemicals (1). Catalysts are usually involved in the processes.
Natural gas condensate is a liquid hydrocarbon mixtures that is an associate product of
natural gas. It is a highly volatile mixture that results fi-om a separation or condensation of
heavier hydrocarbon fi-actions of natural gas, or recondensation of hydrocarbons fi-om
crude oil oflf-gas. The composition of condensate depends very much on the origin of the
source. It is typically a mbcture of hydrocarbon isomers i.e. paraffins, naphthanes,
aromatics, with the carbon number of C 3 to Cjbut sometimes up to C15. A butane fi-action
may also be present as a minor constituent of these condensates. Natural gas and natural
gas condensates also contain other impurities such as sulphur compounds and of most
concern is the presence of toxic elements such as mercury and arsenic.
i.1.2 Characteristics of Natural Gas Condensate
The typical properties of natural gas condensate are shown in Tables 1.1 and 1.2. A
condensate obtained fi-om a natural gas field in Malaysia is taken as an example. The
condensate samples contain a mixture of hydrocarbons such as parafiBns, naphthanes and
aromatics. The composition of these condensates include parafi&ns with carbon numbers as
high as 15. Based on these properties, the condensate is as good as the naphtha fi-actions
obtained fi'om the processing of crude oil and can be considered as having a 'high value
petroleum fi-action' for applications other than as a fijel.

Tests Results
Methods Tests Unit Condensate 1 Condensate 2 Methods Recovery Recovery
Initial boiling point- IBP °C 32.1 31.0
5 % vol. recovered 44.3 44.0
10 % vol. recovered °C 48.4 48.7
20 % vol. recovered "C 54.8 56.4
30 % vol. recovered °C 61.7 64.6
40 % vol. recovered °C 70.1 74.4
50 % vol. recovered 80.6 86.5 ASTM D 86
60 % vol. recovered °C 93.1 100.4
70 % vol. recovered °C 107.6 116.1
80 % vol. recovered °C 128.4 140.5
90 % vol. recovered °C 167.5 192.7
95 % vol. recovered °C 219.3 246.5
Final boiling point -FBP °C 264.6 285.5
Percent recovered % vol. 98.0 97.6
Percent loss % vol. 0.4 0.7
Residue % vol. 1.6 1.7
Recovery ^ 200° C % vol. 93.9 91.5
Density 15* C k g l ' 0.7141 0.7245 ASTM D1298-85
API, Gravity @ 60 • F - 66 59 64.78 Calculated
Basic sediment & Water % vol. 0.00 0.00 ASTM D4007-81
Table 1.1: Physical properties of some Malaysian condensates

NO Hydrocarbon Type Carbon No Content (wt •/.)
Condensate 1 Condensate 2
I P A R A F F I N S P3 085 0.74
P4 678 6.24
P5 952 855
P6 946 85
P7 10.74 9 30
P8 7.86 708
P9 386 389
PIO 1.63 2 17
F l l 11 1.77
P12 0.85 2.2
P13 0.54 1.69
P14 0.22 1.94
PI 5 plus 0.16 4.49
T O T A L P A R A F F I N S 53.57 58 56
2 O L E F I N S 03-012+ 0.0 0.0
T O T A L O L E F I N S 0.0 0.0
3 NAPHTHANES N3 - -N4 - -
N5 0.94 087
N6 503 3.75
N7 17.13 13 69
N8 2.53 1.83
N9 2.82 2.47
T O T A L NAPHTHANES 2845 22.61
4 A R O M A T I C S A3 -
A4 -
A5 - -
A6 1 55 1.38
A7 533 4.70
A8 6.28 592
A9 3.76 4 1
AlO 0.65 1.35
A l l 021 071
A12 0.2 0.67
T O T A L A R O M A T I C S 17.98 1883
Table 1.2 : Hydrocarbon type analysis (PONA analysis) of BSTB condensate
4

1.1.3 Natural Gas Condensate Usage
As a hydrocarbon mixture and having properties almost similar to petroleum naphtha
fractions, the condensate is obviously a very valuable feedstock. It can be used in a variety
of applications either as a blending stock to crude oil for refinery processing or it can also
be used as a feedstock to various petroleum/petrochemical processes (1). One of the most
important is as a feedstock for catalytic cracking or thermal cracking, for the production of
intermediate products such as hydrogen, methane, ethane, ethene, ethylene, propane,
propene, C» hydrocarbons, high grade petrol and residues (fuel oil), and for catalytic
reforming processes for the production of aromatics and alicyclic compounds. The
intermediate products from these two building block processes can be used in various
secondary refinery and petrochemical processes or as a final product, depending on either
economic or market demands.
1.2 MERCURY IN NATURAL GAS AND THE PETROCHEMICAL
INDUSTRY
Mercury contamination is considered to be a 'critical severity" risk with a 'frequent to
probable' probability of occurrence (2). On a risk factor scale 1 to 9 (9 = very low risk), the
lack of a property placed and operating mercury trapping unit in natural gas plants,
petrochemical and refinery complexes is considered to be a risk factor of 2 or 3(3). Thus
within the design and operation of gas, liquefied natural gas (LNG), refinery and
petrochemical facilities, which operate v^th mercury-tainted feeds, a safety management
scheme strongly recommends the implementation of known protective measures to lower
the risk factor.
Knowledge of the total mercury content and of the different species present in natural gas
condensate is extremely important. Mercury in most forms is highly toxic, particularly when
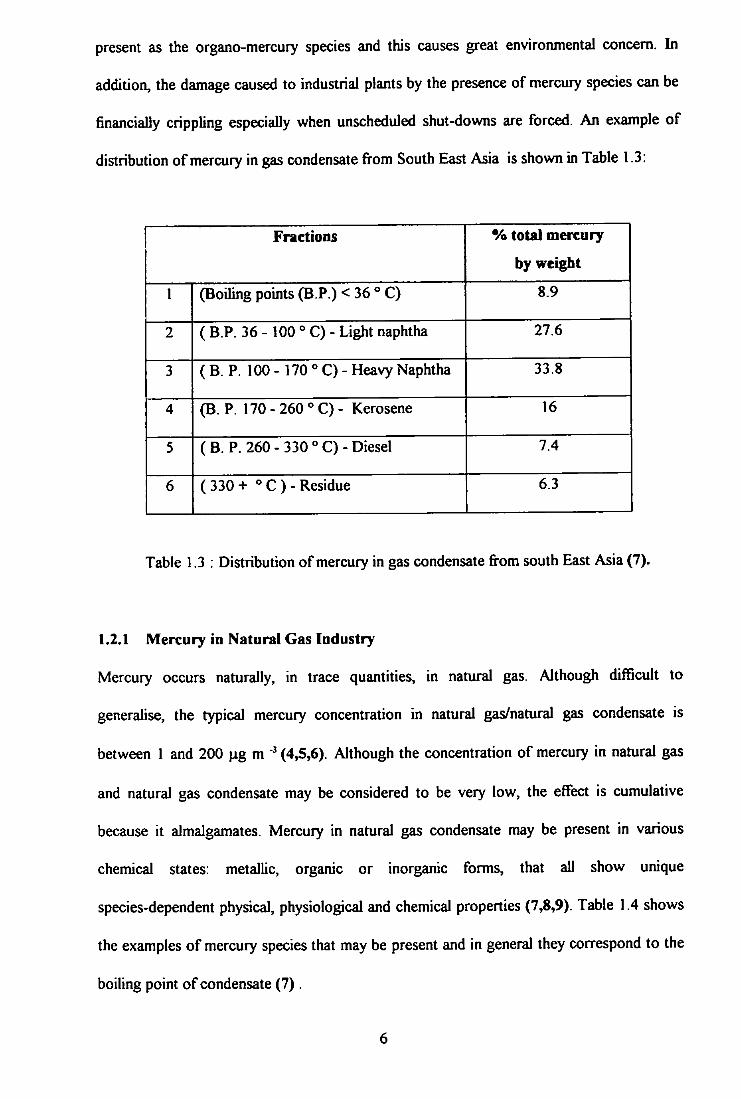
present as the organo-mercury species and this causes great envirorunental concern. In
addition, the damage caused to industrial plants by the presence of mercury species can be
financially crippling especially when unscheduled shut-downs are forced. An example of
distribution of mercury in gas condensate fi-om South East Asia is shown in Table 1.3:
Fractions % total mercury
by weight
1 (Boiling points (B P.) <36°C) 8.9
2 ( B.P. 36 - 100 ° C) - Light naphtha 27.6
3 (B. P. 100 - 170 ° C) - Heavy Naphtha 33.8
4 (B. P. 170 - 260 ° C) - Kerosene 16
5 (B. P. 260 - 330 °C)-Diesel 7.4
6 (330+ ^'C)-Residue 6.3
Table 1.3 : Distribution of mercury in gas condensate fi-om south East Asia (7).
1.2.1 Mercury in Natural Gas Industry
Mercury occurs naturally, in trace quantities, in natural gas. Although difficult to
generalise, the typical mercury concentration in natural gas/natural gas condensate is
between 1 and 200 ng m (4^,6). Although the concentration of mercury in natural gas
and natural gas condensate may be considered to be very low, the effect is cumulative
because it almalgamates. Mercury in natural gas condensate may be present in various
chemical states: metallic, organic or inorganic forms, that all show unique
species-dependent physical, physiological and chemical properties (7^,9). Table 1.4 shows
the examples of mercury species that may be present and in general they correspond to the
boiling point of condensate (7).
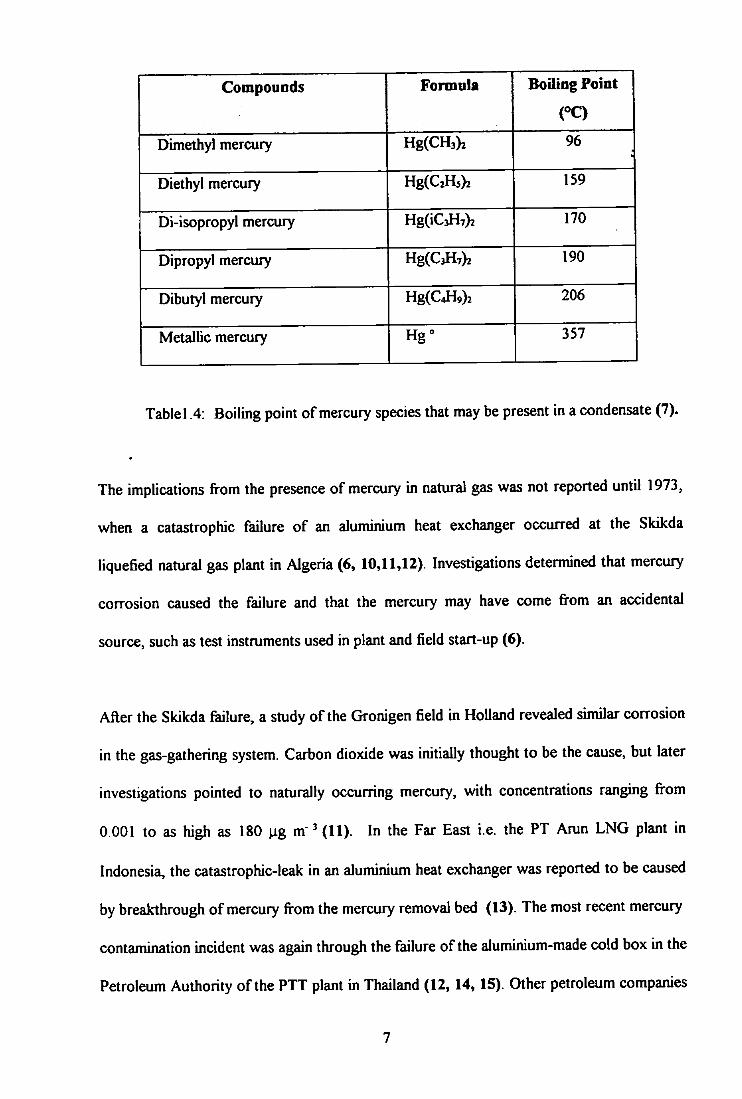
Compounds Formula Boiling Point
Dimethyl mercury Hg(CH3)2 96
Diethyl mercury Hg(C2H,)2 159
Di-isopropyl mercury 170
Dipropyl mercury Hg(C3H7)2 190
Dibutyl mercury Hg(C4H9)2 206
Metallic mercury Hg° 357
Table 1.4: Boiling point of mercury species that may be present in a condensate (7).
The implications fi'om the presence of mercury in natural gas was not reported until 1973,
when a catastrophic failure of an aluminium heat exchanger occurred at the Skikda
liquefied natural gas plant in Algeria (6, 10,11,12). Investigations determined that mercury
corrosion caused the failure and that the mercury may have come fi-om an accidental
source, such as test instruments used in plant and field start-up (6),
After the Skikda failure, a study of the Gronigen field in Holland revealed similar corrosion
in the gas-gathering system. Carbon dioxide was initially thought to be the cause, but later
investigations pointed to naturally occurring mercury, with concentrations ranging fi-om
0.001 to as high as 180 ^ig m" ^ (11). In the Far East i.e. the PT Arun LNG plant in
Indonesia, the catastrophic-leak in an aluminium heat exchanger was reported to be caused
by breakthrough of mercury ft^om the mercury removal bed (13). The most recent mercury
contamination incident was again through the failure of the aluminium-made cold box in the
Petroleum Authority of the PTT plant in Thailand (12, 14,15). Other petroleum companies
such as PETRONAS in Malaysia are also experiencing the presence of mercury in their
natural gas and gas condensate. A mercury analysis and distribution study carried out in
1984 in the oflfshore fields indicated that the natural gas contained between 1 to 57 m
of mercury.
In a maintenance shutdovm of one of their gas plants in February 1991, approximately
1.2kg of elemental mercury (accumulated through a three year period since the last
turn-around) was collected in the liquefied petroleum gas (LPG) molecular sieve
regeneration system (16, 17). The mercury was suspected to be carried over in LPG
products and was trapped in the molecular sieve during LPG treatment. However, to date
no catasuophic failure has been reported by this company.
The presence of mercury in oil and gas is recognised world-wide and has been reported
for fields in Australia (18), the Commonwealth of Independent States (12, 19), Western
and Southern Africa, Chile and Venezuela (20), Canada, in several states in the US
(Kansas, Texas, Utah, Colorado, Oklahoma, and Wyoming) (21, 22), as well as The Irish
Sea, Japan and China (22).
1.2.2 Mercury in The Petrochemical Industry
As with the gas industry, several petrochemical companies, using natural gas liquids
containing mercury, have also had some unfortunate experiences of damaging cryogenic
heat exchangers at their petrochemical complex arising through mercury induced corrosion
in the low temperature separation trains (12, 23, 24). In addition, the upgrading of
mercury-contaminated natural gas condensates by steam cracking has led to severe mercury
poisoning of down-stream selective hydrogenation catalysts in many countries throughout
the worid (23). For example, palladium-based catalysts are used for selective hydrogenation
8

of acetylenic species in steam cracking of C2. C 3 , C 4 and other cuts. The few \ig mercury
species which can be present in the very wide boiling range in a condensate steam cracker
feed, are concentrated into the light fiactions of the cracker effluent. It was reported that
condensate feed containing 60 i)g ml of mercury shortened the selective hydrogenation
catalyst cycle period fi'om 1000 days to less than 30 days (12). The catalyst deactivation
was accompanied by this greatly reduced catalyst life-time because of active metal
(palladium) sintering which occurs when eliminating the mercury during catalyst
regeneration. It was also noted that the regeneration gas used, was also contaminated with
mercury. Other petrochemical processes directly or indirectly utilise a catalyst with
precious metals such as platinum, palladium, nickel etc. as an active surface. The presence
of mercury in any stream of a petrochemical process may easily poison the process. At least
one study has addressed the subject of adsorption and desorption of mercury on platinum
and palladium surfaces (25).
1.2.3 'Acceptable limits' for Mercury Content in Process Streams
The presence of mercury in the feed to gas and peuochemical plants will increase the risk
of corrosion of plant equipment and contamination of the environment. In general, the
lower the mercury content of the feed sueam, the better. However, lower limits which are
industrially accepted standard are as follows:
Natural gas 0.01 m
Natural gas liquids less than 5 g
These values are below the level considered to be dangerous to humans. The OSHA
regulations stipulate that the time weighted average (TWA) mercury content in air should
not exceed 50 m in an 8 hour working shift for a 40 hour week (26). For the purpose
of comparison, the mercury level in the respiration air fi-om an individual having an
9
amalgam filling is as high as \0 \ig m'^ (27). Thus, although the concern for mercury from
hydrocarbon streams is an environmental issue, the driving forces are plant safety and
operations issues (12).
As stated, the presence of mercury in natural gas can cause severe corrosion of plant heat
exchangers and poisoning of expensive catalysts used in downstream processing units. Both
lead to severe operational problems. In order to protect the equipment used in the
liquefaction process, it is necessary to reduce the mercury content to between 10 and 20 x\g
m , i.e. by a factor of 10
1.2.4 Corrosion efTect from mercury upon process plant
Trace amounts of mercury in LNG should concentrate in the heavier liquid phases, such as
the butanes and above. However, the more damaging mercury concentrations will most
likely occur in the cycled gas stream where losses are made up from the plant products,
methane through to pentanes (10).
Since mercury-induced corrosion occurs only in the presence of liquid water, the
temperature at which corrosion occurs must be between approximately O C and the highest
temperature at which a water dew-point can occur. There is only one condition of
operation in which this temperature can occur, i.e. when the plant is allowed to warm
above 0 ' C, for example for shut-downs.
The characteristics of mercury corrosion (10,13) are as follows:
• Attack on exchanger tubes is often on the refrigerant side.
• Elemental mercury is found and not compounds of mercury.
• The corrosion product is usually oxide or hydroxide.
• Liquid water must be present.
• Corrosion is more likely with the electropositive metals.
10
Mercury induced corrosion of aluminium cold-box equipment can proceed via two
mechanisms, mercury-induced stress cracking and mercury-catalysed oxidation by water (6,
10,11,12,13). The mechanism of all corrosion caused by the presence of metallic mercury
takes place in the following sequence:
• Elemental mercury amalgamates with the surface layer of the metal being
corroded.
• The minute amount of base metal alloyed with the elemental mercury is
exposed intimately, a short-circuited corrosion cell is formed between the
mercury and the base metal with liquid water as an electrolyte.
• In the presence of pure water and inert gases, the base metal in the
amalgam is corroded gradually by reaction with water.
If an acid anhydride, such as CO2 or H2S is present, the corrosion product is the metal
carbonate or sulphide.
1.2.4.1 Mercury-induced stress cracking.
Mercury forms amalgams (alloys) with almost all metals and leads to embrittlement of the
metals. Some brazed aluminium heat exchangers are known to have a magnesium-rich
phase at the aluminium metal grain boundaries (due to precipitation during welding). When
liquid mercury is brought into contact with this anodic phase, dissolution occurs by the
following reaction:
4Hg + AlsMgz ^ 2MgHg2 + 3 Al (1.1)
Dissolution of the grain boundary is accelerated rapidly when stress is applied to the
attacked region. Stress-cracking occurs by the propagation of a crack from the point of
11

mercury attack on the magnesium-rich phase through the connecting grain boundaries. The
embrittJement may occur with the metals that have a high diffusion rate into mercury.
1.2.4.2 Mercury-catalysed oxidation by water
The enthalpies of reaction and Gibbs free energies of formation of various oxides from
reaction between metals and water at 25 °C are given in Table 1.5. The net enthalpy and
net free energy change for aluminium are highly negative. The reaction with water is
exothermic and goes to completion at, essentially, room temperature. The reason that
aluminium is not normally attacked by water is its tightly adhering oxide film (alumina), a
protective layer, which is not present when aluminium is amalgamated with mercury in an
anaerobic atmosphere (15). Small fissures in this layer render the clean metal surface
susceptible to local oxidation by water. These chemical reactions, for aluminium, can be
described by the following equations:
Alx(s) + Hgy( l ) -> Al(x.2)(s) + H g y A l 2 ( I ) (1 .2)
H g y A l 2 ( l ) + 3 H 2 0 ( l , v ) - ^ Hgy( l ) + A l 2 0 3 ( s ) + 3 H 2 ( g ) (1.3)
Other metals, such as copper, require heat for the reaction to be sustained and will not
proceed to completion. Therefore, copper would not be expected to be attacked by liquid
water even in an amalgam, except at elevated temperatures. However, over a long period
of time, copper will be weakened by amalgamation, through alteration of its crystal
structure (10).
The corrosion resistance of stainless steel is dependent on the hard, tough, chromium oxide
film that is formed. Here, it can be can postulated that metallic mercury forms an amalgam
12
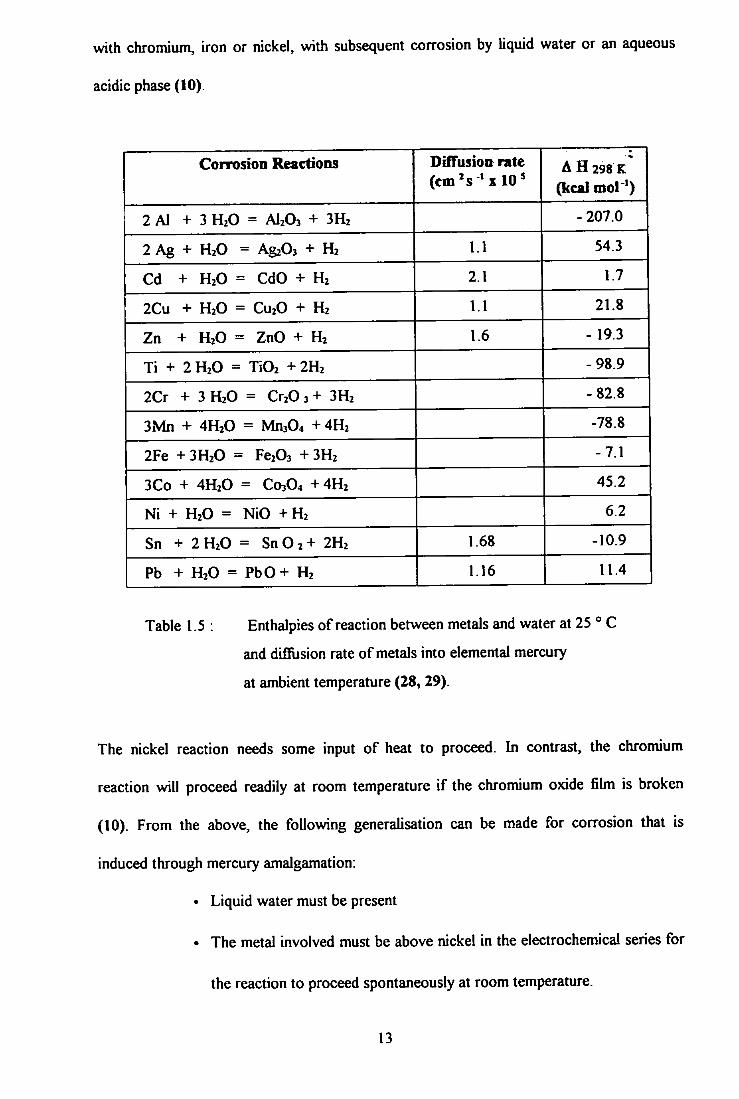
with chromium, iron or nickel, with subsequent corrosion by liquid water or an aqueous
acidic phase (10).
Corrosion Reactions DifTusion rate (em's 'x 10^
A H 298 K
(kcal mol ')
2 Al + 3 H2O = AI2O3 + 3H2 - 207.0
2 Ag + H2O = AgzOs + H2 1.1 54.3
Cd + H2O = CdO + H2 2.1 1.7
2Cu + H2O = CU2O + H2 1.1 21.8
Zn + H2O = ZnO + H2 1.6 - 19.3
Ti + 2 H2O = TiOi + 2H2 -98.9
2Cr + 3 H2O = Cr20 3 + 3H2 -82.8
3Mn + 4H2O = Mn304 + 4H2 -78.8
2Fe + 3H2O = Fe203 + 3H2 -7.1
3Co + 4H2O = C03O4 +4H2 45.2
Ni + H2O = NiO +H2 6.2
Sn + 2H2O = S n 0 2 + 2H2 1.68 -10.9
Pb + H2O = PbO+ H2 1.16 11.4
Table 1.5 : Enthalpies of reaction between metals and water at 25 ° C
and difilision rate of metals into elemental mercury
at ambient temperature (28, 29).
The nickel reaction needs some input of heat to proceed. In contrast, the chromium
reaction will proceed readily at room temperature i f the chromium oxide fihn is broken
(10). From the above, the following generalisation can be made for corrosion that is
induced through mercury amalgamation:
• Liquid water must be present
• The metal involved must be above nickel in the electrochemical series for
the reaction to proceed spontaneously at room temperature.
13

1.2.5 The Petroleum Industry and Environmental Impacts from Mercury
The oil industry and its products impinge on ail aspects of the environment. The seas, from
its extraction and transportation; the land, from the impacts of extraction, pipelines,
processing plants and use; and the atmosphere, from its gaseous products and by-products.
It is implicated in "high profile' pollution, from accidents and ecosabotage at wells and
refineries, the decommissioning of marine installations, major spills at sea, through to the
contribution from its gaseous products to the greenhouse effect and respiratory diseases
(30).
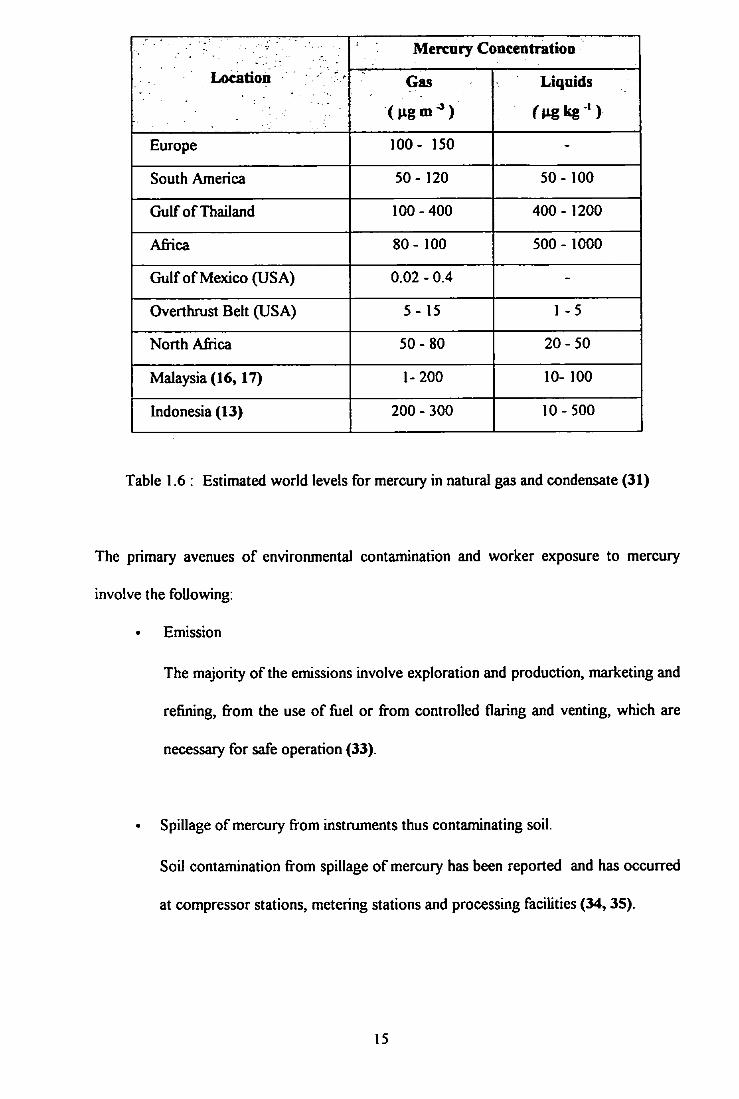
Mercury is a naturally occurring contaminant in geological hydrocarbons and is distributed
freely throughout production, processing, transportation and consumption systems. As
shown in Table 1.6, hydrocarbons from different geological locations contain mercury in
microgram levels. The values shown are an estimation (31) and may change from time to
time, depending on geological factors and production practices.
Production and processing of gas and gas condensates containing mercury, invariably leads
to contamination of equipment and can generate waste in the form of sludge and spent
adsorbent material (31). The toxic contaminants from these activities can enter into the
environmental cycle and food chains easily, through emission during processing stages or
unregulated disposal of wastes or accidents.
The incident, in 1965 in Minamata Bay in Japan led to almost 50 deaths with hundreds
being seriously ill caused by mercury poisoning (32). The problem was traced to a
discharge by a chemical company. Other incidents involving mercury in the petroleum and
petrochemical industry have been discussed earlier in this chapter.
14
Mercury Concentratioo
Location - Gas
( H g m ^ )
Liquids
rugkg ' )
Europe 100- 150 -
South America 50- 120 50-100
Gulf of Thailand 100-400 400-1200
Africa 80- 100 500 - 1000
Gulf of Mexico (USA) 0.02 - 0.4 -
Overthrust Belt (USA) 5- 15 1 -5
North Africa 50-80 20-50
Malaysia (16,17) 1-200 10- 100
Indonesia (13) 200 - 300 10-500
Table 1.6 : Estimated world levels for mercury in natural gas and condensate (31)
The primary avenues of environmental contamination and worker exposure to mercury
involve the following:
Emission
The majority of the emissions involve exploration and production, marketing and
refining, from the use of fuel or from controlled flaring and venting, which are
necessary for safe operation (33).
• Spillage of mercury from instruments thus contaminating soil.
Soil contamination from spillage of mercury has been reported and has occurred
at compressor stations, metering stations and processing facilities (34,35).
15

Accumulation of spent mercury-adsorption material and spent catalysts (31).
Adsorbents are used to remove mercury from gas and/or liquid streams. The
sorbent materials are packed in beds designed to optimise contact. Over time,
they become expended and require replacement. The spent adsorbent therefore,
constitutes a secondary waste for a processor that employs this technology.
Equipment contamination by deposition of mercury from feedstocks.
Aluminium cryogenic equipment used in LNG and olefin processes can
accumulate mercury by deposition from gases and liquids as they are cooled. The
accumulation can cause equipment degradation in the form of cracking that causes
leaks (36).
Accumulation of sludge in condensate transportation vessels and storage tanks
and pipeline pigging debris (31).
Mercury can deposit in pipelines, transportation vessels and storage tanks.
Waste waters and formation waters, from processing well systems may contain
mercury compounds.
Treatment for mercury and other toxic species is essential, to ensure these waters
are free from contaminants, when discharged to the environment or for recycling
into the process stream.
16

1.2.6 Regulation and guideline levels for mercury in the environment
Mercury and mercury compounds are neurotoxins and are heavily regulated (Table 1.7)
(31,37,38) with a trend that has been towards increased stringency. There are many pages
of federal regulations that may apply to mercury waste originating from produced gas or
gas processing. It is important to consider how a hazardous waste is produced when
establishing legislation.
Sampling and analysis of elemental mercury spills are complicated by the non-uniform
dispersal of mercury in soil. The analysis of contaminated materials for determination of
waste classification or treatment efficacy, has historically used an EPA approach that was
not equally sensitive to all mercury species. The current situation is in transition, but
analysis for *total mercury' is becoming the only allowable method to classify mercury
containing-material (31).
17

Agency
WHO
Regulations
OSHA
Description
Guideline for drinking water mercury (all forms) Provisional tolerable weekly intake
Permissible exposure limit (PEL) Time-weighted average (TWA)
Organomercury compounds Mercury vapour
Ceiling limit Mercury (aryl and inorganic)
Short term exposure limit Organo (alkyi mercury compound)
Value
0.001 mgl - '
0.3 mg total mercury 0.2 mg methyl mercury
0.01 mgm"^ 0.05 mgm -
0.01 mgm"^
0.03 mgm '
Guidelines
NIOSH Recommended exposure limit (REL) for occupational exposure to mercury (TWA) Immediate dangerous to life or health (IDHL) level
Mercury Organo (alkyl) mercury compounds
Short-term exposure limit (STEL) mercury as Hg(skin)
Alkyl compounds
0.05 mg m
28 mgm ' 10 mgm "
0.03 mgm
EPA . Ambient water quality criteria to protect ^ human health:
Ingestion ofwater and aquatic organisms 146 ngl * Ingestion of aquatic organism only 146 ngl *
Carcinogenic classification Oral reference dose (RfD)
Mercury, inorganic only Mercury, alkyi and inorganic Methyl mercury Phenyl mercury acetate
Group D
0-3 Mg kg * day * 0-3 ng kg 'day ' 0 3 ixg kg ' day -' 0.08 Mg kg * day -'
Table 1.7: Summary of regulations and guidelines regarding mercury
and mercury compounds (31,37,38).
18
1.3 T R A C E M E R C U R Y DETERMINATION
In general the expression "trace' can be considered as a concentration below 100 \ig g *.
Element-specific detection techniques such as atomic absorption spectrometry (AAS),
atomic emission spectrometry (AES), and atomic fluorescence spectrometry (AFS) are
widely used for the determination of mercury.
Atomic absorption spectrometry is the term used when radiation usually in the range 180
to 800 nm, is absorbed by the atom under measurement. The term emission spectrometry is
applied to the measurement of light emitted from a flame or a plasma by chemical species
after the absorption of energy as heat or as chemical energy (i.e. chemiluminescence). I f
only the emission from atoms is observed, the term atomic emission spectrometry is
preferred. The re-emission of radiation from an atom having previously absorbed light is
termed atomic fluorescence. Atomic fluorescence spectrometry is discussed in more detail
in section 1.5.
The determination of mercury by cold vapour atomic absorption detection was first
published in 1968 (39). Since then, the determination of mercury at \ig m l l eve l s or less
has received considerable interest. The in:^rtance of san^ling and san^le storage as well
as methods of analysis have also been acknowledged. The use of AAS has emphasised the
sensitivity and ease of application (40). Atomic absorption was used as a replacement
technique to an earlier calorimetry technique (41). Non-flame atomic absorption and
fluorescence spectrometry, with sample introduction which includes pyrolysis, ftimace
techniques, combustion, and reduction-aeration (cold vapour, (CV)), were simple and
sensitive, but experienced difficulties in giving accurate determinations in natural samples
(42). The determinations were mainly in environmental materials, but some coverage of the
analysis of food and biological materials was also undertaken (43).
19
1.3.1 Mercury Vapour Generation Technique
Vapour generation is a technique that provides an ideal sample introduction procedure for
atomic spectrometry. It has been applied to the determination of trace elements in a wide
range of matrices. The advantages of the technique include the following; separation of the
analyte from the matrix (to minimise later matrix interference), high eflSciency of sample
introduction, a large sample volume can be used and this yields excellent relative detection
limits, the method is easily automated and chemical speciation determination is possible
(44). Several vapour generation methods have been used to bring mercury into the vapour
phase (45). These are described in the sections below:
1.3.1.1 Reduction-aeration (cold vapour generation) (45)
This is the most convenient and widely used method for sample introduction of mercury.
Mercury has a vapour pressure of 0.16 Pa at 20 °C, corresponding to a concentration of
-14 n ^ m in air and mercury has a tendency to form a stable molecule in the flame (46).
Mercury in aqueous solution (in an inorganic form, either originally or from conversion of
organo mercury by oxidation or acid digestion) is treated with a reducing agent and is then
swept out of the solution in its elemental vapour form by bubbling a suitable gas through it.
The most typical reducing agent used is tin (11) chloride, although tin (II) sulphate has also
been used. Sodium borohydride also has been used by a few workers but raises certain
safety implications. In addition, the evolution of large amounts of hydrogen increases
quenching i f AFS detection is employed.
Examples of total mercury determined by the CV-AAS technique following acid digestion
of the sample material include the analysis of; sewage sludge, sediment and soil; (47) moss
and humus (48), marine biological materials (49); environmental and marine biological
samples (50), blood (51), urine (52), urine with correlation with dental amalgam restoration
20
(53), human bone (54), dogfish muscle and marine harbour sediment (56); crude oils and
natural gas condensate (57) and dry fish (58, 59). Tin (II) was used as reductant in the
majority of these procedures but a significant minority used borohydride.
For CVAFS, the examples include the analysis of; water and soil samples (56);
environmental samples after microwave digestion (61); river water samples (62); urine
samples (63) and sea water samples using an on-line oxidation, flow injection method (64).
1.3.1.2 Direct beating
In this method, the sample is first 'ashed' and then 'pyrolysed' under controlled
temperature conditions. The technique always suffers from matrix interferences due to the
high volatility of mercury that restricts the ashing temperature.
1.3.1.3 Electrolytic amalgamation
This involves mercury being plated on to a copper cathode during electrolysis. The cathode
is then heated in a similar manner to that described in section 1.3.1.2, to release the
mercury (45).
1.3.1.4 Direct amalgamation
In this method mercury vapour is collected on a silver or gold collector from which it is
released by heating. The method may be employed after those methods described in
sectionsl.3.1.1 or 1.3.1.2 as a pre-concentration technique.
A gold-coated sand trap was reported to be the only collector to efficiently retain the
mercury content of air samples in a comparison with activated charcoal and silver-coated
sand (65, 66). The trap was not affected by sulphur compounds or other airborne
21
interfering substances, the nature of the mercury compound or the flow rate of the air
samples.
1.3.2 Preconcentration techniques prior to vapour generation.
1.3.2.1 Amalgamation
Preconcentration of mercury can be performed easily using traps or collectors. Mercury
vapour is collected in these traps and later released for detection using a heating step. This
allows not only preconcentration, but also the possibility of separating interfering
substances fi^om the sample before measurement.
Pre-concentration techniques have been used in the determination of mercury, by CVAAS,
in water, air, sediments and other environmental samples. Examples include gold
amalgamation (67-75); a gold-platinum collector (90 % Au, 10 % Pt) (76) and a gold
-platinum coil in wet natural gas (8,77,78). Preconcentration via amalgamation with
atomic fluorescence detection has also been achieved. Examples include, amalgamation on
silver wire (79), gold wires or wool (80 - 82) and gold-platinum wire (83).
1.3.2.2 Complexing agents
Example of pre-concentration techniques using chemicals/reagents prior to vapour
generation include the chelating ion exchanger Spheron Thiol (84), mercury
chelate-forming reagents such as diethyl dithiocarbamate and pyrollidin-l-dithioformate,
dithizone (85) and other sulphur containing compounds such as 1-cysteine (86).
1.3.3 Mercury Speciation
The determination of different mercury compounds (Hg**, Hg*, Hg^*, organomercury
halides, etc.) can be carried out either on-line with species detection or off-line with total
22

mercury determination. The speciation of mercury compounds is important because of the
varying level of toxicity associated with the different forms in which mercury can occure
(46).
Chromatographic techniques coupled with various element specific detection system are the
most commonly used methods for speciation. These techniques include gas
chromatography (GC), high performance liquid chromatography (HPLC), and ion
chromatography
1.3.3.1 Speciation by chromatography coupled with AAS
A GC separation method for organomercury compounds with quartz fiimace AAS
detection was reported (87). The species CH3 Hg * was ethylated in an aqueous ethanolic
solution with NaB(C2 H 3 ) 4 to prevent the species co-eluting with dimethyl mercury (DMM)
or Hg°. The same derivatization has also been reported (88) to determine CHjHg* (as
CzHjHgCHs) in fish after dissolution in alkaline methanolic solution.
A preconcentration step with a dithiocarbamate resin before GC separation has been
described by Emteborg et al. (89). The separation of CH3 Hg" from Hg^* in rain samples
has been achieved by using an anion-exchange column (90). Sarzanini et ai reported the
used of cation exchange ion-chromatography to separate mercury compounds after in-situ
cysteine complexation (86). Liquid chromatography (LC) was coupled with CV-AAS with
continuous flow reduction by tin (II) chloride for the mercury alkane-thiolates and N a B R i
for reduction of inorganic, methyl- and ethyl mercuric compounds was reported by Fujita et
al. (91). The use of vesicles of didodecyldimethylammonium bromide as a mobile phase for
separation of CHjHg"^ and Hg^* by HPLC-CV-AAS has improved the CV generation of
mercury (92). Separation of several mercury compounds by reversed phase HPLC has also
23

been reported. Prior to detection, the ligand and matrix were destroyed by potassium
persulphate (K2S20g). Real condensate samples have been analysed but suffered from
severe sample matrix interference (9). The use of a silver trap and gold trap, in an attempt
to differentiate between inorganic and organic forms of mercury in natural gas has been
conducted (77). Some improvements in the speciation of mercury in natural gas condensate
have also been achieved using on-line gold-platinum wire amalgamation trap or solid-phase
micro-extraction with capillary gas chromatography-microwave-induced plasma-atomic
emission spectrometry (78). However, the efficiency of the gold-platinum wire trap has
been reported earlier, only able to give 50 % recovery of dimethyl mercury (77).
1.3.3.2 Speciation by chromatography coupled with AFS
Gas chromatography (GC) was coupled with CVAFS by Bloom and Fitzgerald (93) for the
detemiination of mercury species after preconcentration from air on a Carbotrap column.
Gas chromatography was also employed by Jones ei ai (94) for total and organic mercury
determination in water, soil and tissue samples. Water samples were brominated and
preconcentrated onto sulphydryl cotton fibres and organic mercury was extracted into
methylene chloride before being separated. Jian and McLeod (95) performed speciation on
a column of sulphydryl cotton for rapid sequential determination of CH3 Hg^ and Hg^* in
natural water by FI-CV-AFS.
1.3.4 The Determination ofMercury in Natural Gas Condensate
Knowing the exact concentration of mercury in the plant feeds and its destinations in the
plant is one key to preventing contamination. Further assurance can be obtained by analysis
for mercury in all industrial plant products and effluents on a routine basis. This is
important since the gas and liquid feeds to gas processing plants (GPP) originate from
different oil and gas fields. The mercury concentration can vary from time to time
24

depending on the distribution ratio of the gas and oil coming on stream. Hence, any
prediction for mercury concentration in the feed gas for the GPP is more difficult to make.
Figure 1.1 (16) shows that the concentration of the mercury in the feed stream to a GPP
varied throughout the duration of the 300 day monitoring exercise.
The determination of mercury in natural gas and natural gas condensate was not properly
and systematically carried out before the 1980's. This led to an underestimation of the
actual mercury content of the gas processing stream, hence resulting in the problems
encountered.
The determination of mercury in natural gas and gas condensates is made difficult by the
very low concentrations involved and the complexity of the sample matrix. This dictates
that either a highly sensitive detector or a large sample volume or both is needed. A variety
of techniques with different sensitivities are presently available for the determination of
mercury in general samples and some are listed in Table 1.8.
MERCURY CONCENTRATION FOU WLEJ SEPARATOR CAS
S 8
6
4
2 111
Figure 1.1: Mercury content in feed natural gas (monitored for a duration of
about 300 days)
25
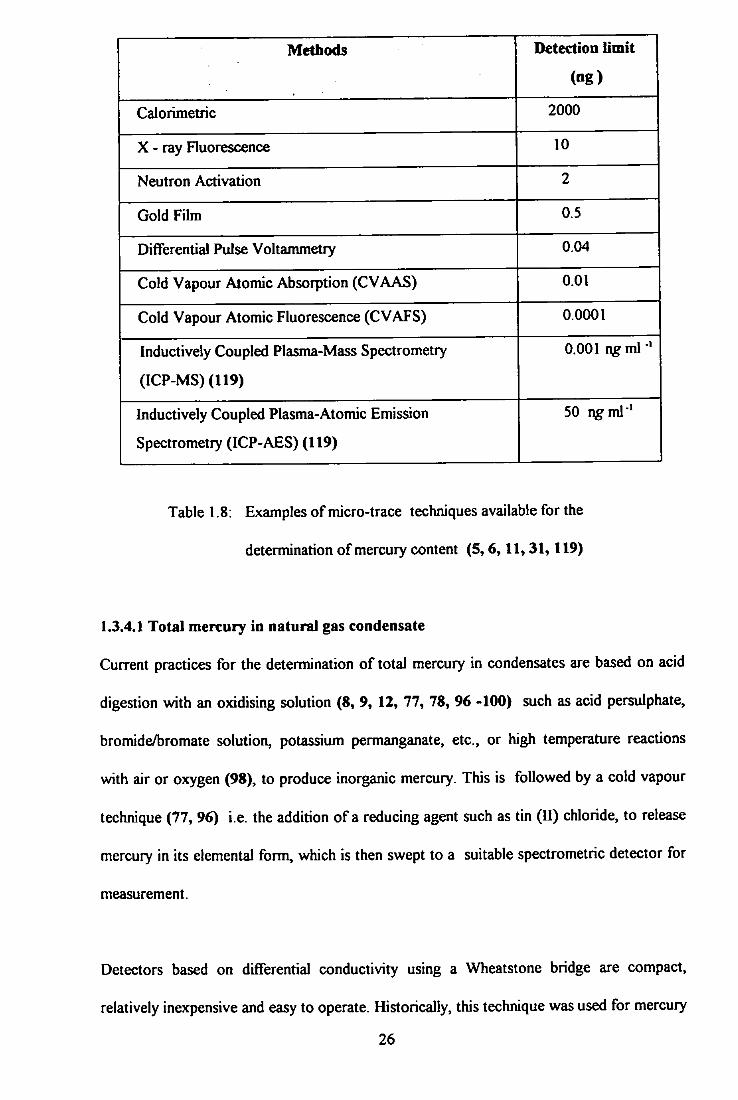
Methods Detection limit
(ng)
Calorimetric 2000
X - r a y Fluorescence 10
Neutron Activation 2
Gold Fihn 0.5
Dififerential Pulse Voltammetry 0.04
Cold Vapour Atomic Absorption (CVAAS) 0.01
Cold Vapour Atomic Fluorescence (CVAFS) 0.0001
Inductively Coupled Plasma-Mass Spectrometry
(ICP-MS)(119)
0,001 ngml
Inductively Coupled Plasma-Atomic Emission
Spectrometry (ICP-AES) (119)
50 r\gml *
Table 1.8: Examples of micro-trace techniques available for the
determination o f mercury content (5,6,11,31,119)
1.3.4.1 Total mercury in natural gas condensate
Current practices for the determination of total mercury in condensates are based on acid
digestion with an oxidising solution (8, 9, 12, 77, 78, 96 -100) such as acid persulphate,
bromide/bromate solution, potassium permanganate, etc., or high temperature reactions
with air or oxygen (98), to produce inorganic mercury. This is followed by a cold vapour
technique (77, 96) i.e. the addition of a reducing agent such as tin (II) chloride, to release
mercury in its elemental form, which is then swept to a suitable spectrometric detector for
measurement.
Detectors based on differential conductivity using a Wheatstone bridge are compact,
relatively inexpensive and easy to operate. Historically, this technique was used for mercury
26

measurement by a majority of gas plant operators in the 1980's. The major disadvantage is
that the detector is very sensitive to impurities which may not have been filtered out of the
sample such as carbonyl sulphide, water, carbon dioxide and other absorbed gases. Thus,
this technique is susceptible to massive overestimates of the mercury content in samples
and analytically, of dubious quality.
Detectors based on conventional AAS or a dedicated instniraent designed for the purpose
offer far superior performance. Since this method is based on the absorption of a specific
wavelength of light by atomic mercury, spectral interference is very unlikely. This
instrument is very reliable, gives reproducible results and has a good detection limit. One
disadvantage is that it is a very expensive outlay for use as a dedicated detector compared
with other techniques.
The technique of AFS is more sensitive than AAS. These instrument offer high precision
and accuracy, are easy to operate and are less expensive than AAS, but they do required
argon gas for operation The technique of AFS is discussed in detail in section 1.5.
The determination of total mercury in petroleum and petroleum products was first
achieved in early 1975 (97). The method involved an acid decomposition in a closed
system, and the use of Wickbold oxy-hydrogen combustion. The decomposed or digested
samples by the above method were then analysed by a cold vapour atomic absorption
technique. The long winded method was said to be capable of detecting mercury to a
concentration level of 5 - 10 x\g g'\ Other digestion methods include; the use of
concentrated nitric acid and potassium persulphate (98), high pressure-ashing using a
quartz tube wet oxidation procedure with concentrated nitric and hydrochloric acid added,
for the digestion step (99). Most recently, the recoveries of dimethylmercury and diphenyl
27
mercury added into heptane/condensate samples were 98 % and 95 % respectively (57)
when a digestion with acidic bromine water to convert organomercury species to ionic was
used.
All of the above used acidic tin (II) chloride, added into the aqueous layer of digested
samples to reduce mercury from the ionic form to elemental mercury. The mercury released
(cold vapour technique) was detected by atomic absorption spectrometry. However, these
methods required large amounts of reagents and are often complicated and time consuming,
thereby increasing the risk of analytical errors and raising detection limits through high and
variable blank levels (8, 77).
Recently, a dedicated analyser for the determination of mercury in naphtha has been
developed (96) (the NIC mercury analyser-SP-3D). The method is applied over a detection
range of 0.1 to 10,000 ng m[ '\ The analyser consists of a controller, a mercury atomiser
(asher) and a mercury detector. The sample is decomposed by heating in the instrument in
the presence of a special additive. The mercury vapour in the gaseous product is retained
in the mercury collector as a gold amalgam. The mercury is liberated by heating the
collector to 700 **C. The vaporised mercury is carried to an absorption cell with pure carrier
gas and detected by the cold vapour atomic absorption technique. One disadvantage of the
instrument is that only about 100 mg of sample can be processed at a time resulting in
problems for samples with low mercury concentration and in representative sampling.
Sample throughput is also limited.
1.3.4.2 Mercury speciation in natural gas condensate
The determination of different mercury compounds, or 'speciation', in gas condensate is of
interest not only because of the ecotoxicological aspect but also because of the interest in
28

those problems associated with the processing, utilisation and movement of gas condensate
which contains mercury (9). Effects such as pollution, the failure of process equipment, the
poisoning of catalysts, worker exposures etc., make speciation work necessary. At present
it is not well known which chemical forms of mercury are present in natural gases and gas
condensates and, in addition, methods for the detennination of total mercury
concentrations must be regarded to be of unproven reliability because of a lack of adequate
standard reference materials and poor accuracy (6).
In recent years, many methods have been developed for the speciation of mercury in
various types of samples. However, there has been limited success with complex organic
liquid matrices due to the analytical chalangges those samples offer. Among these methods
two basic categories can be distinguished (9); first, a distinction is seen between inorganic
mercury and organic mercury on the basis of special separation techniques (9,77,78, 86 -
95) and second, the identification of inorganic mercury can be distinguished from organic
mercury by chemical treatments such as reducing reagents (SnCl2) (101,102).
The present techniques available for the determination of specific-species of mercury are
based on the combination of a separation technique such as GC or HPLC with different
detectors (9, 77, 78, 86 - 95). The main detectors used are electron capture detector
(ECD), optical emission spectrometry (OES), AAS and AFS.
The first attempt at speciation of mercury in gas condensate was perfonned using HPLC
coupled with CVAAS (9). Various mercury species in an aqueous system were separated
by reversed phase HPLC using gradient elution to investigate the preliminary condition
required. Prior to measurement, the organic ligand and the matrix were destroyed using
potassium persulphate and the mercury reduced to its elemental form by NaBRj. However,
29
when applied to real gas condensate, serious instabilities and interferences occurred. The
technique was only suitable for semiquantitative determination and was unable to determine
all the possible species present in the real condensate sample.
An extraction scheme, used to isolate various organic and inorganic mercury species prior
to Grignard derivatization of the ionic forms (to produce non-polar, butylated derivatives)
and species-specific detection by GC-MEP-AES, was also suggested (77). However, the
efficiency o f the extraction procedures for organomercury were often very poor and so,
quantification was not reliable.
The determination of mercury species in gas condensate by on-line amalgamation traps
(gold/platinum wires) for the collection of mercury species separated by capillary GC for
detection by MIP-AES was able to remove the carbon background emission and allowed
the determination of dimethyl mercury in condenste down to a detection limit of 0.24 I V
Untreated condensate, or condensate reacted with butybnagnesium chloride, can be
injected into a gas chromatograph without the need for dilution or sample clean-up (78).
Problems associated v^th species separation were noted while artifacts due to
derivatization must also be considered.
Most recently the speciation of mercury in condensate was achieved by using GC-ICP-MS.
Five species of mercury i.e. elemental mercury, mercury (II) chloride, DMM, methyl ethyl
mercury (MEM) and DEM were identified. However no organomercury halide species
were detected in the majority of samples analysed (187).
30
1.4 M E R C U R Y R E M O V A L METHODS IN T H E P E T R O L E U M AND
P E T R O C H E M I C A L INDUSTRY.
Mercury removal systems for both gas and liquid streams are available commercially.
However, a plant with removal fecilities is still experiencing mercury contamination'in their
process steams. This is because of the limited information concerning the mercury species
present in the streams. This lack of information leads to technical diflBculties in deciding
the most suitable mercury removal system.
L4.1 Mercury Removal From Natural Gas
Eliminating mercury from natural gas requires the use of a mercury trapping material.
These products vary in utilisation as a function of the gas compositions, i.e. hydrocarbon
dry or wet, the level of water saturation, process conditions and the process scheme. In
general, it is recommended to remove mercury as far upstream as possible. A sunmiary of
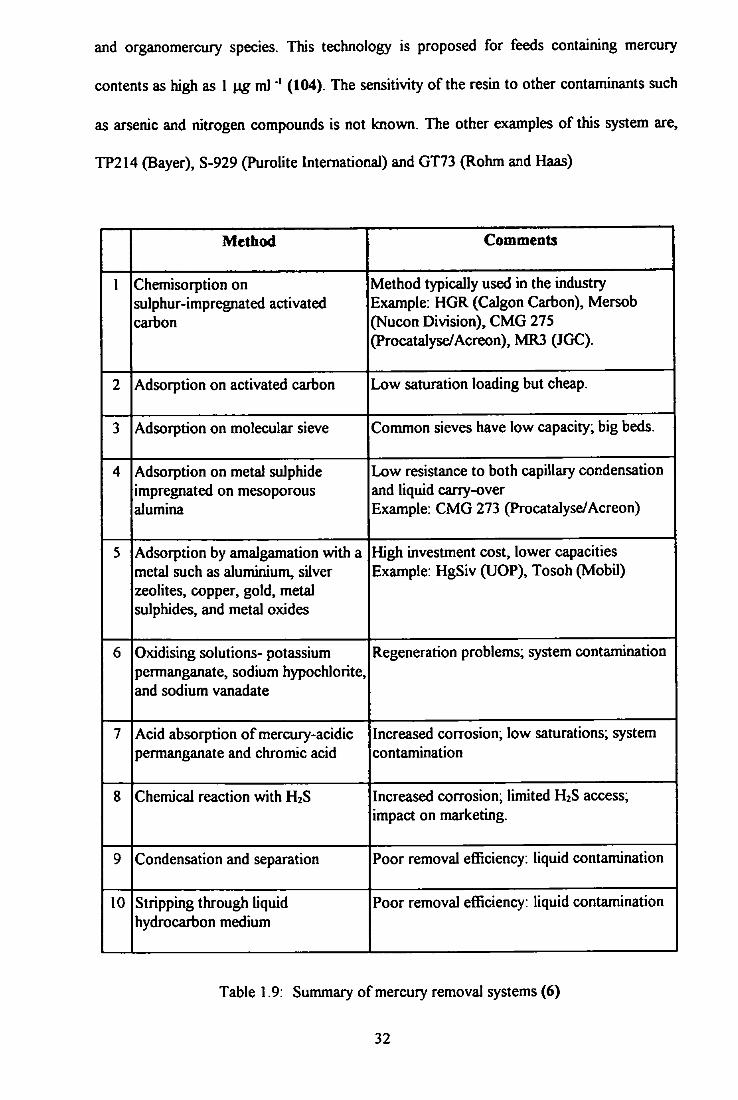
mercury removal systems for natural gas are presented in Table! .9 (3,6,7,10-14,31,103).
1.4.2 Mercury Removal from Natural Gas Condensate.
Mercury removal from natural gas condensate is very different to that of natural gas
because of the liquid phase operation and because of the types of mercury present in the
condensate. At this time three technologies are claimed to be eflfective for the removal of
total mercury from feeds which are destined to be upgraded by steam cracking or
aromatization (reforming). There are several manufacturers, but most of the products are
still under development i.e. at the pilot plant stage.
1.4.2.1 The *DSM' process
DSM has stated that sulphide-containing resin materials are effective for the direct removal
of mercury from condensate (23). The resin is claimed to be effective for both elemental
31
and organomercury species. This technology is proposed for feeds containing mercury
contents as high as 1 ml"' (104). The sensitivity of the resin to other contaminants such
as arsenic and nitrogen compounds is not known. The other examples of this system are,
TP214 (Bayer), S-929 (Purolite International) and GT73 (Rohm and Haas)
Method Comments
1 Chemisorption on sulphur-impregnated activated carbon
Method typically used in the industry Example: HGR (Calgon Carbon), Mersob (Nucon Division), CMG 275 (Procatalyse/Acreon), MR3 (JGC).
2 Adsorption on activated carbon Low saturation loading but cheap.
3 Adsorption on molecular sieve Common sieves have low capacity; big beds.
4 Adsorption on metal suJphide impregnated on mesoporous alumina
Low resistance to both capillary condensation and liquid carry-over Example: CMG 273 (Procatalyse/Acreon)
5 Adsorption by amalgamation with a metal such as aluminium, silver zeolites, copper, gold, metal sulphides, and metal oxides
High investment cost, lower capacities Example: HgSiv GJOP), Tosoh (Mobil)
6 Oxidising solutions- potassium permanganate, sodium hypochlorite, and sodium vanadate
Regeneration problems; system contamination
7 Acid absorption of mercury-acidic permanganate and chromic acid
Increased corrosion; low saturations; system contamination
8 Chemical reaction with H2S Increased corrosion, limited H2S access; impact on marketing.
9 Condensation and separation Poor removal efficiency: liquid contamination
10 Stripping through liquid hydrocarbon medium
Poor removal efficiency: liquid contamination
Table 1.9: Summary of mercury removal systems (6)
32

1.4.2.2 The Institut Francais du-Petrole (IFP)-RAM processes.
The RAM processes are designed to convert all non-metallic forms of mercury into the
elemental form before feedstock enters the process side of the plant for upgrading to fiiel
and petrochemical intermediates (7, 105). The process operates in two stages. The first
suge of the process comprises a reactor loaded with a hydrogenolysis catalyst, MEP841
(Procatalyse). Both ionic and organomercury species are stated to be converted to metallic
mercury, in the presence of hydrogen which is subsequently trapped in the second stage.
The second stage operates at a temperature below 100 °C in the presence of CMG 273
(Procatalyse) which is the elemental mercury trapping material. However the efficiency of
the first reactor in converting trace concentration of ionic and organomercury compounds
in complex mixtures of hydrocarbons (condensate) into elemental mercury is not well
known.
1.4.2.3 Japanese Gasoline Corporation (JGC) process
The JGC technology system (106) is also a two step process which involves the catalytic
decomposition of ionic and organomercury compounds to metallic mercury in the strict
absence of hydrogen but it employs relatively higher temperatures (more than 200 °C). The
catalyst used in this decomposition stage is 'MR13 catalyst'. The mercury trapping step
(second stage) is carried out at lower temperatures using sulphided CoMo hydrotreating
catalyst (MR3).
1.4.2.4 Other processes.
There are several other manufactures who also claim to be producing a mercury removal
system for gas condensate. However most of them are still at the pilot plant stage or under
development stage. Examples include Katalco (5156, 5157), Calgon (HGR), UOP and
UCC.
33
1.5 ATOMIC F L U O R E S C E N C E S P E C T R O M E T R Y
1.5.1 Background
Atomic fluorescence spectrometry is an analytical technique used to determine the
concentration of elements in samples (107). This technique was studied as early as 1902 by
Wood, (108) and by Nichols and Howes (109) who looked at fluorescence in flames.
Neither of these studies dealt with the possible analytical applications of atomic
fluorescence. Winefordner and Vickers, in 1964 (110), investigated the possibility of using
atomic fluorescence as a practical analytical technique. They used metal vapour discharge
tubes as sources and were able to obtain sensitivities of better than 1 |ig ml *' for mercury,
zinc, cadmium and thallium in an acetylene-oxygen flame. The development of a continuous
source added another dozen elements to the list of possibilities (111). Since then, several
studies have been carried out on the development of AFS both in the area of analytical
capability/analytical application for real samples and in the refining of instrumentation
including conventional source excited AFS (112-115).
The determination of mercury using AFS was pioneered by Thon^son et aL in the 1970s
(116) . The instrument described was a dispersive system based on a modified FAAS and
offered a detection limit of 0.02 \ig l '. Non-dispersive AFS has also been investigated
(117) . However the increased light gathering power of non-dispersive system is often offset
by background scatter from the flame atom cell. This was overcome by Godden and
Stockwell (118) who developed a filter fluorimeter that took advantage of the fact that
mercury in atomic form is a vapour at room temperature and therefore does not require a
flame to generate atomic species. As mercury vapour is monoatomic, a flame for mercury
atomisation is uimecessary if the mercury in the sample can be converted to the elemental
form. The low aflfinity of mercury for oxygen, nitrogen and argon allows maintenance of
mercury vapour at relatively high concentration in these gases (43). Four main methods
34
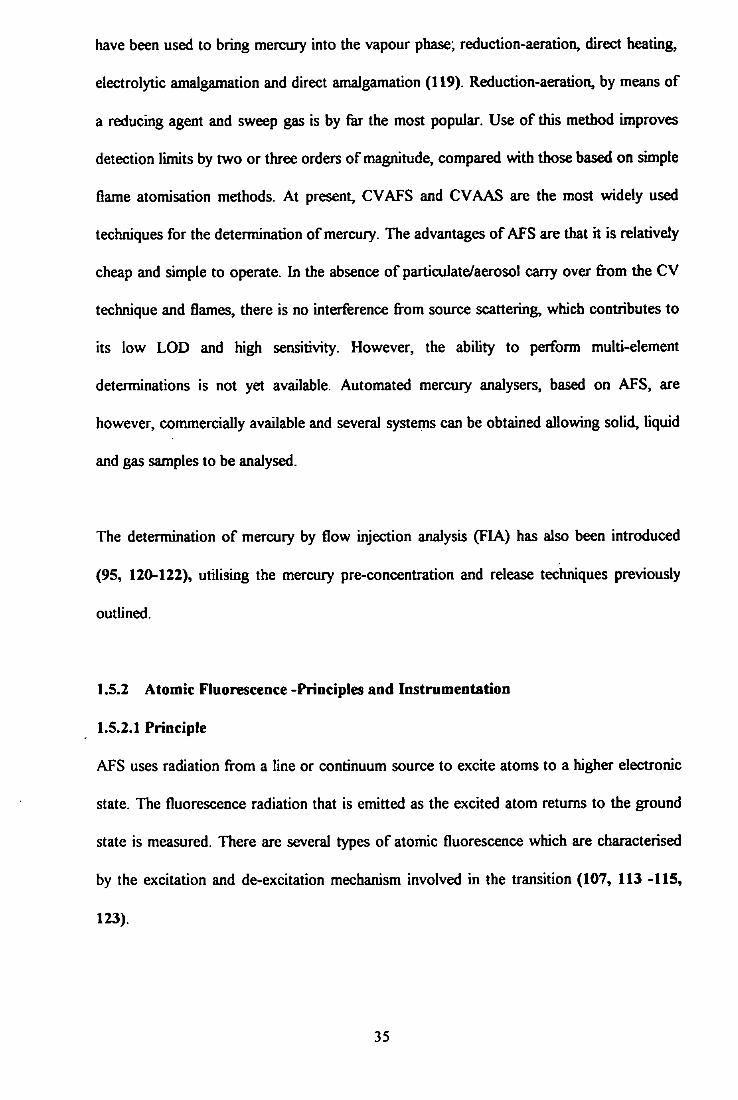
have been used to bring mercury into the vapour phase; reduction-aeration, direct heating,
electrolytic amalgamation and direct anmlgamation (119). Reduction-aeration, by means of
a reducing agent and sweep gas is by far the most popular. Use of this method improves
detection limits by two or three orders of magnitude, compared with those based on simple
flame atomisation methods. At present, CVAFS and CVAAS are the most widely used
techniques for the determination of mercury. The advantages of AFS are that h is relatively
cheap and simple to operate. In the absence of particulate/aerosol carry over from the CV
technique and flames, there is no interference from source scattering, which contributes to
its low LOD and high sensitivity. However, the ability to perform multi-element
determinations is not yet available. Automated mercury analysers, based on AFS, are
however, commercially available and several systems can be obtained allowing solid, liquid
and gas samples to be analysed.
The determination of mercury by flow injection analysis (FIA) has also been introduced
(95, 120-122), utilising the mercury pre-concentration and release techniques previously
outlined.
1.5.2 Atomic Fluorescence -Principles and Instrumentation
1.5.2.1 Principle
AFS uses radiation from a line or continuum source to excite atoms to a higher electronic
state. The fluorescence radiation that is emitted as the excited atom returns to the ground
state is measured. There are several types of atomic fluorescence which are characterised
by the excitation and de-excitation mechanism involved in the transition (107, 113 -115,
123)
35

The basic types of fluorescence are given in Figure 1.2:
Resonance fluorescence
The fluorescence radiation is of the same wavelength as the absorbed radiation.
This type of fluorescence is used most often for quantitative analysis.
Stokes- Direct line fluorescence
Occurs when an electron in an excited stale emits radiation and returns to a higher
energy level than the one from which the electron originally absorbed radiation. The
wavelength of the emitted radiation is longer than the wavelength of the absorbed
radiation.
Stoke- Stepwise line fluorescence
Different upper levels are involved in the excitation and de-excitation process and
again the wavelength of emitted radiation is longer than the wavelength of the
absorbed radiation.
Thermal assisted fluorescence
This occurs i f the excitation process involves radiation excitation followed by
ftirther thermal excitation.
The intensity of the atomic fluorescence radiation is proportional to the intensity of the
absorbed radiation and to the concentration of the analyte atom. The intensity of atomic
fluorescence is diminished by collisions between excited atoms and other molecules in the
atomisation source. This process is called quenching.
36
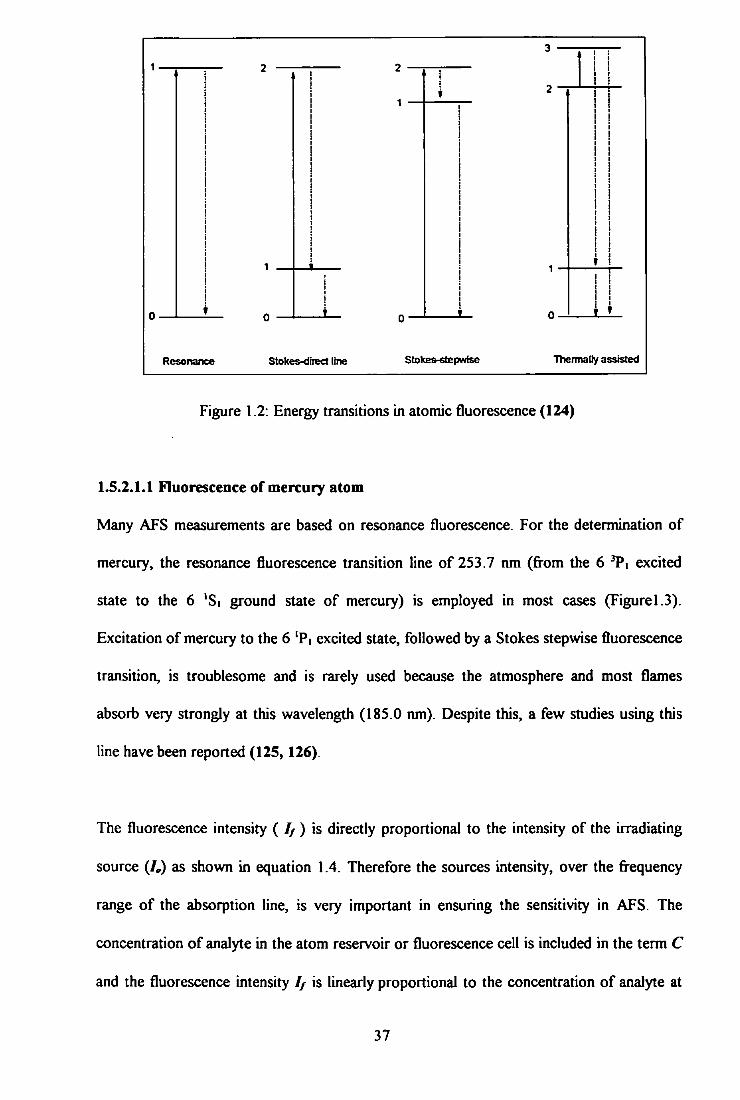
i !
1 1 r 1
! 1
— r I r
Resonance Stakes-direct Une Stokes-etepwtse Thermalty assisted
Figure 1.2: Energy transitions in atomic fluorescence (124)
1.5.2.1.1 Fluorescence of mercury atom
Many AFS measurements are based on resonance fluorescence. For the determination of
mercury, the resonance fluorescence transition line of 253.7 nm (from the 6 ^Pi excited
state to the 6 *Si ground state of mercury) is employed in most cases (Figurel.3).
Excitation of mercury to the 6 'P | excited state, followed by a Stokes stepwise fluorescence
transition, is troublesome and is rarely used because the atmosphere and most flames
absorb very strongly at this wavelength (185.0 nm). Despite this, a few studies using this
line have been reported (125,126).
The fluorescence intensity ( 7^) is directly proportional to the intensity of the irradiating
source (/^) as shown in equation 1.4. Therefore the sources intensity, over the frequency
range of the absorption line, is very important in ensuring the sensitivity in AFS. The
concentration of analyte in the atom reservoir or fluorescence cell is included in the term C
and the fluorescence intensity / / is linearly proportional to the concentration of analyte at
37

low concentration (45, 115, 123). Any quenching species in the atom reservoir or
fluorescence ceU affect the fluorescence intensity. The intensity of mercury fluorescence has
been shown to be enhanced i f a poor quencher such as Ar or He is used instead of N2 or air
as a carrier gas in the AFS method (125,126).
kiP loC (l-4)(45)
where k
<P =
COTStant (1/431) 1 = path laigth in the directicn of the detecticHi system, m 471 = number of steradians in sphere (fluorescaice is isotropic), sr
fluoresceice (quantum) efficiaicy
lo = intensity of the source at the absorption Une wavelength
C = concentration of atoms.
cV 10.44
101
'So % 'D. *F, Tripte
% % % "D, »D, »F.
20000
30000
40 000
so 000
60 000
70000
80 000
Figure 1.3: The atomic states and energy levels of mercury (43)
38

1.5.2.2 Instrumentation
A typical single-element atomic fluorescence spectrometer consists of an excitation source,
an atomiser, a wavelength selector, a detector and a readout/computer. The components
are identical to those used for AAS, but in a different arrangement, i.e. with the excitation
source and emission detector at right angles around the analyte atom *ceir.
For AFS, the ideal source would be stable and would provide intense radiation at the
excitation wavelength for the element of interest. The most often used conventional light
sources are the hollow-cathode lamp (HCL) (127, 128), the electrodeless discharge lamp
(EDL) (129), vapour discharge lamp (130) and continuum-source lamp. Major advances in
instrumentation have been achieved by the replacement of conventional excitation sources
with lasers that provide sufficient intensity to saturate atomic transitions, and hence provide
the maximum fluorescence signal (127,131).
The atom cell converts the sample into gaseous atoms. Commonly used atom cells for AFS
include flames, plasmas and electrothermal atomisers. For mercury, the cold vapour
technique is preferred and in this case, the atom cell is little more then a channelling
reservoir for mercury atoms which allows the intense source to be directed at the analyte.
A wavelength-selection device serves to discriminate against light of all wavelengths except
for the fluorescence wavelength of the analyte. Monochromators have been employed
widely as wavelength selectors for AFS because of the ease of wavelength selection.
However, in some dedicated systems, interference or similar filters have been used.
39

The photomultiplier tube (PMT) has remained a popular detector in AFS because of its
sensitivity and long linear dynamic range. A schematic diagram of a commercially available
AFS detection system is shown in Figure 1.4.
Excitation source (mercury lamp)
Focusing optics
Collection optics
Interference filter (253.7 nm)
Solar blind PMT Amplifier, readout and
computer data processing
Figure 1.4 : Schematic diagram of a commercially available
atomic fluorescence detector.
1.5.3 Interferences
AFS with line source excitation is free from spectral interferences. The use of a continuum
source increases the risk of emission of fluorescence radiation from elements other than the
analyte within the bandpass of the monochromator or filter. Background emission from the
atomiser can be compensated for using a modulation technique (107).
Since, in resonance AFS, the measured radiation has the same wavelength as that of the
excitation source, it is difficult to distinguish scattering from fluorescence. Non-resonance
40

AFS does not suffer from this drawback, as the fluorescence signal is measured at a
wavelength different from that of the excitation source. Matrix interferences in AFS are due
mostly to light scattered from particles present in the atomiser and ion molecular
fluorescence of matrix compounds (107).
The possible interferences encountered in the determination of mercury by AFS are divided
into those occurring in the gas phase ("gas phase interferences") and those occurring in the
liquid phase or during the mercury vaporisation stage ("liquid phase interferences") (43).
1.5.3.1 Gas phase interferences.
This type of interference consists of quenching of the mercury fluorescence and absorption
of the mercury excitation line in the 253.7 nm region. Argon is the best carrier gas for
fluorescence measurements because of its small cross-section for quenching (125, 126,
137). Replacement of air by argon resulted in approximately a 100-fold increase in
fluorescence signal (95, 122, 126 132-134); replacement of nitrogen by argon resulted in
an increase of the fluorescence signal by factors of 4 to 15 (125). Other gases such as, H2,
CO, D2, C H 4 and CO2 also caused quenching (131-132). Mercury atoms excited at the
253.7 nm line, should be de-excited much more rapidly by H2 than by N2. Thus tin (11), is a
better reductant compared with NaBRj for AFS. Organic solvents with a high vapour
pressure, such as acetone, benzene and ethanol caused a decrease in the mercury
fluorescence signal (125). The vapour of unsaturated and aromatic organic compounds that
absorbed at the 253.7 nm region also interfered with the fluorescence signal (138).
1.5.3.2 Liquid phase interferences.
Many inorganic species do not interfere with the determination of mercury by cold vapour
methods, and the mercury vaporisation step undergoes a near-complete separation from
41

other constituent in the solution. Depressive interferences can be caused by noble metals
such as Au, Ft, Pd and Ag (139, 140) and by certain transition metal ions. The effects are
concentration dependent.
Some substances, producing very stable complexes with mercury ions, interfere with the
reduction step to its elemental form unless the complexes are decomposed before
reduction. Interferences effects can also be seen by the presence o f bromide, iodide,
cysteine, sulphide, thiosulphate and Se (IV) (141-144).
1.5.4 Advantages and limitations of atomic fluorescence.
Some advantages (112) of the technique include the following:
• Increasing the radiation intensity should linearly increase the fluorescence intensity.
• Fluorescence intensity, as a flinction of concentration of fluorescing atoms, is linear
at low concentration levels, making the procedure especially usefiil for trace element
determination.
• Fluorescence spectra are simple, so high resolution spectrometers are unnecessary. In
contrast to atomic absorption, a radiation source producing a narrow spectral line is
usually required.
• linear range covers 3-4 order of magnitude
The limitations (112) of atomic fluorescence includes the following:
• Self-absorption effects occur at higher concentrations, producing a non-linear
response with concentration.
• Reactions in a flame sample cell are similar to those observed in atomic absorption
and these can cause problem in the preparation of a standard analytical curve.
42
• Quenching of fluorescence in certain sample systems can reduce the sensitivity of the
method.
• The quantum efiBciency varies with flame temperature and flame composition: thus,
as with any analytical method based on comparison with standards, adequate control
of these factors must be observed.
1.6 AIMS AND O B J E C T I V E S O F TfflS STUDY
A knowledge of the total mercury content and the different species in natural gas and
natural gas condensate is extremely important. Mercury in most forms is highly toxic,
particularly when present as the organomercury species and is a cause of great
environmental concern. In addition, the damage caused to industrial plants by the presence
of mercury species can be financially crippling especially when unscheduled shut-downs are
forced.
A recent paper (77) stated that 'At present it is not well known in which chemical forms
mercury is present in natural gas and natural gas condensate, and, in addition, methods for
the determination of total mercury concentrations must be regarded to be of unproven
reliability due to lack of adequate standard reference materials and poor accuracy'. No
reliable or precise quantitative analytical methodology has been published for even total
mercury due to difficulties of low species concentration (total mercury can be < 1 \igm '^
for natural gas and < 1 ml for gas condensate).
43
The aims of this project are:
1. To develop an accurate and precise, and i f possible, a simple, rapid and robust
procedure for the determination of *total' mercury in gas condensate and other
complex liquid hydrocarbons. This will involve studies of :
• digestion and/or extraction techniques for mercury with cold vapour
generation and atomic fluorescence detection. Various characterised digestion
and/or extraction techniques will be tested together with some modified and
new procedures. The use of an AF detection technique, due to the superiority
of its sensitivity toward mercury.
• The novel technique of vaporisation and trapping of mercury species at
elevated temperatures with atomic fluorescence detection.
• Spiking of real gas condensates and other complex hydrocarbons with known
mercury species and measurement of recoveries.
2. To develop a technique to identify, the mercury species in gas condensate and liquid
hydrocarbons. One area of interest is the use of coupled techniques e.g. gas
chromatography with atomic fluorescence detection. For this coupling, a pyrolysis
interface is required.
3. To use the developed techniques, for total mercury and species measurement, to
evaluate fully the efficiencies of several, commercially available mercury removal
systems (adsorbents) for gas and gas condensate plants. The use of a pilot plant
facility which simulates real 'plant' conditions will be required to perform the study.
44

CHAPTER 2
THE DETERMINATION OF TOTAL MERCURY IN NATURAL GAS CONDENSATE BY DIGESTION AND EXTRACTION - COLD VAPOUR ATOMIC FLUORESCENCE SPECTROMETRY
CHAPTER 2
TEIE DETERMINATION OF TOTAL MERCURY I N NATURAL
GAS CONDENSATE BY DIGESTION AND EXTRACTION -
COLD VAPOUR ATOMIC FLUORESCENCE SPECTROMETRY
2.1 INTRODUCTION
The accurate determination of mercury at the ng m l l e v e l in organic material samples has
become increasingly important, as its potential as a hazard to both health and industrial
safety has become more widely recognised.
Mercury occurs naturally in trace quantities in air (6), natural gas, natural gas condensate
and other petroleum samples (4-25). Although difiScult to generalise, the typical mercury
concentration is in the 1 to 1000 |ig m range. While the mercury content is seemingly
low in gas and gas condensate, the large quantities processed in 24 hours result in very
large absolute amounts of mercury entering the environment. The subsequent health
implications are compounded by the fact that mercury is a cumulative poison.
Several method-based digestions have been reported (47-64,147-152) and various
combustion techniques (97, 99) have been used to decompose organic material prior to
obtaining the mercury in aqueous solution for the final measurement. However, these
materials have generally been a relatively containing much higher concentration of mercury
while the matrix of these samples are less complex than those found in petroleum samples.
In order to determine the 'total' mercury concentration, it is necessary to oxidise any
organomercury compounds (cleavage of the mercury-carbon bond) prior to the reduction
step. One favoured method used with aqueous samples is the oxidation using an acid
bromate with bromide mixture (153, 154). A variety of combinations of acids (HCI,
45

H2SO4, HN03, HCI04) and oxidants; MnO/, SiOt^ Cfj O? ' and H2O2 (permanganate,
persulphate, dichromate and peroxide respectively) have been utilised (155 -158). It is of
note however, that these procedures are not generally used with hydrocarbon samples.
Prior to analysis, any excess oxidant is removed, for example using hydroxyl anunonium
chloride. The presence of certain oxidants can produce an interference eflFect due to
fluorescence quenching and/or suppression of the reduction reaction (141-144).
Before the 1980's, the determination of total mercury in natural gas condensate was not
performed routinely. No standard validated method was available for the petroleum
industry and those methods that were used, would not be considered rigorous and
systematically. The determination is difficult due to the low concentration of mercury,
complexity of the matrix and the highly volatile nature of the samples. Currently, total'
mercury levels are estimated routinely but no suitable mercury standard reference material,
fully validated, is available. The methods used are based upon digestion (8, 9, 12, 77, 78)
or ashing (95, 97, 99). As noted previously the mercury species content of condensate is
still under review but may be present in the forms of dialkyl, alkyl halide, inorganic salt and
sulphur bonded mercury. The absent of in-depth study of this matrix in the literature has
resulted in various methods being adopted, and therefore producing different mercury
values from the same or similar samples.
Historically, the most extensively used method for measurement of mercury has been Cold
Vapour Atomic Absorption Spectrometry (CVAAS )(46 - 59) and Cold Vapour Atomic
Fluorescence Spectrometry (CVAFS)(60 - 64) both with preconcentration (65 - 85) and
without preconcentration (46 - 64). In CV systems, the mercury in the samples is first
oxidised to inorganic mercury (II) using a suitable oxidant and then reduced to elemental
mercury by addition of excess reducing agent. Due to the appreciable vapour pressure of
46
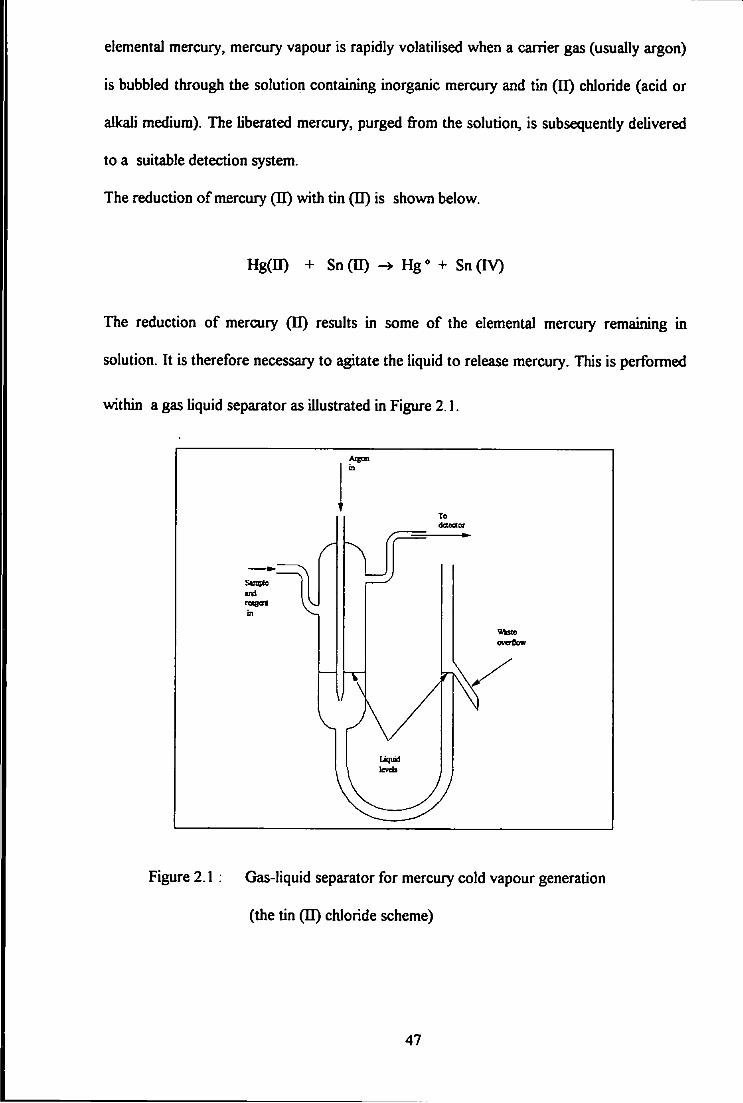
elemental mercury, mercury vapour is rapidly volatilised when a carrier gas (usually argon)
is bubbled through the solution containing inorganic mercury and tin (II) chloride (acid or
alkali medium). The liberated mercury, purged from the solution, is subsequently delivered
to a suitable detection system.
The reduction of mercury (II) with tin (II) is shown below.
Hg(II) + Sn(II) ^ Hg-* + Sn(IV)
The reduction of mercury (II) results in some of the elemental mercury remaining in
solution. It is therefore necessary to agitate the liquid to release mercury. This is performed
within a gas liquid separator as illustrated in Figure 2.1.
Figure 2.1 : Gas-liquid separator for mercury cold vapour generation
(the tin (II) chloride scheme)
47
2.1.1 OBJECTIVE OF THE STUDY
The major area of importance is the digestion technique, used to release and extract
mercury. Recoveries for * total' mercury will be studied using different digestion techniques
with various known species, spiked into both synthetic and real base condensates, EflBcient
digestion techniques should then allow a suitable, detection system to be integrated.
A study of several wet digestion procedures will be carried out in order to evaluate the
efifectiveness of the procedure for treating gas condensate samples prior to total mercury
measurement.
The determination of total mercury from digested and/or extracted samples (in aqueous
form) can be carried out by continuous vapour generation atomic fluorescence
spectrometry after reduction by acidic or alkaline tin (II) chloride.
2.2 EXPERIMENTAL
2.2.1 Mercury species
Six mercury species were used in the spiking experiments of control and ' real ' base
condensate samples, dimethyl mercury (DMM), (Strem Chemical, Massachusetts, USA),
methyl mercury chloride (MMC), ethyl mercury chloride (EMC), phenyl mercury chloride
(PMC) (Johnson Matthey, Royston, Herts, UK), diPhenyl Mercury (DPM) (Aldrich,
Dorset, UK) and Conostan metallo-organic mercury standard (MBH, Analytical Ltd.,
Bamet, England).
48

2.2.2 Reagents
All reagents were of analytical grade unless otherwise stated. SnCb, NaOH, n-hexane,
toluene, HNO3, HCl, H2SO4, hydroxyl ammonium chloride and ascorbic acid were obtained
fi-om Merck, Dorset, UK., and propanol was obtained from Aldrich England. High purity
de-ionised water purified by a Milli-Q analytical reagent grade water purification system
(Millipore, Chester, Cheshire, UK) was used throughout either for preparation of solutions
or for cleaning of glassware.
Individual mercury and organomercury stock solutions (HgCh, (CH3)2Hg, CzHjHgCl,
CeHsHgCl, (C^sj^Hg and Conostan metallo-organic mercury standard
(dialkyldithiocarbamate) were prepared by dissolving the compounds in AnalaR toluene. To
prepare the stock solution (1000 ng m l a s Hg) for CzHjHgCl, CeHsHgCi, and HgCb, the
species were initially dissolved in a small quantity of propanol prior to dilution in toluene.
Standard HgCh solutions were prepared by diluting the stock solution in 10 % v/v nitric
acid. Tin (n)chloride (5% m/v) was used as reductant. All stock solutions were stored in a
dark bottle and kept in the refiigerator at 4 °C. The stock solutions were prepared freshly
every two weeks. Working analytical solutions were prepared everytime the procedures
were carried out.
2.3 INSTRUMENTATION
A PS Analytical Ltd. (PS Analytical, Orpington, Kent, UK), automated continuous flow
vapour generation system (PSA 10.004) was used to generate gaseous mercury from
samples. A schematic diagram is shown in Figure 2.2. Detection and measurement of
mercury was achieved using an atomic fluorescence spectrometer (PSA 10.023 Merlin).
The basic instrumentation is described in Chapterl, section 1.5 (Figure 1.4). The switching
valve that alternates between sample and reagent blank solutions was computer controlled
49
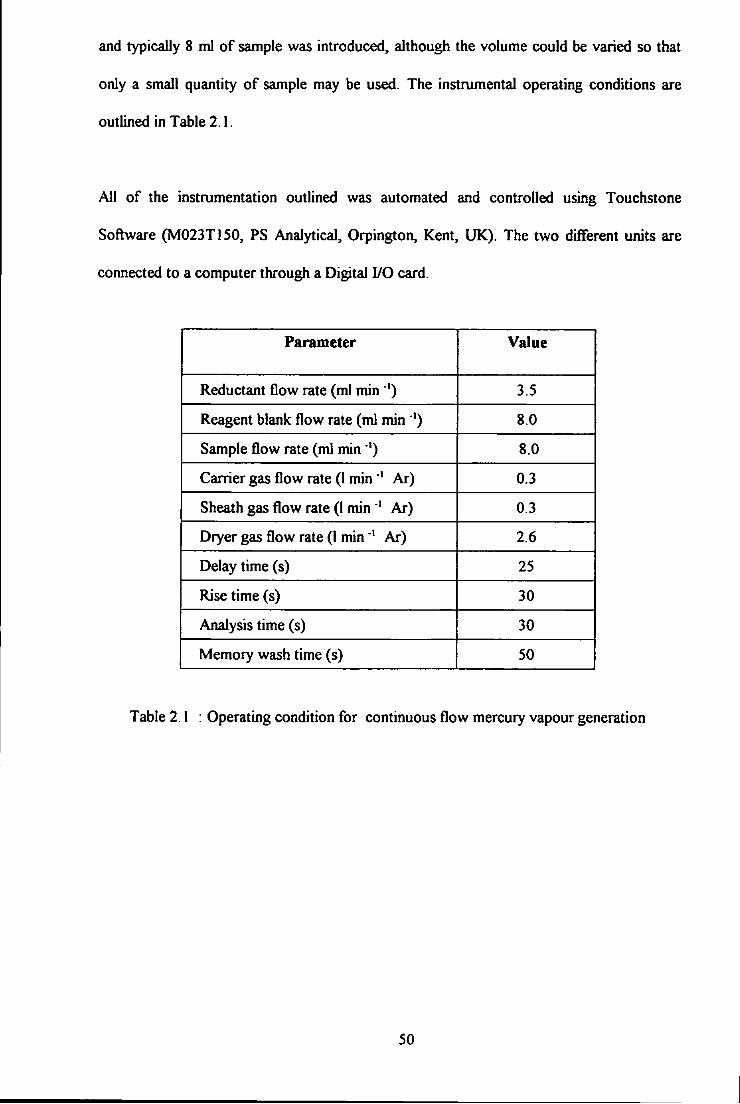
and typically 8 ml of sample was introduced, although the volume could be varied so that
only a small quantity of sample may be used. The instrumental operating conditions are
outlined in Table 2.1.
All of the instrumentation outlined was automated and controlled using Touchstone
Software (M023T150, PS Analytical, Orpington, Kent, UK). The two different units are
connected to a computer through a Digital I/O card.
Parameter Value
Reductant flow rate (ml min *) 3.5
Reagent blank flow rate (ml min' ') 8.0
Sample flow rate (ml min '*) 8.0
Carrier gas flow rate (I min Ar) 0.3
Sheath gas flow rate (1 min Ar) 0.3
Dryer gas flow rate (1 min * Ar) 2.6
Delay time (s) 25
Rise time (s) 30
Analysis time (s) 30
Memory wash time (s) 50
Table 2.1 : Operating condition for continuous flow mercury vapour generation
50

Sn CI.
Blank
Sample
[ 1
Argon earner gas rotameter
Gas- liquid separator
Figure 2.2 : Schematic diagram of continuous flow vapour generator (shown in the blank position, dotted line represents the flow o f the sample solution)
Dryer gas our
Dryer gas in
To Detector

2.4 SAMPLE DIGESTION AND EXTRACTION PROCEDURE USED I N
THE STUDY
A series of different digestion and extraction procedures were employed. In each case 5 ml
of sample (hydrocarbon matrix and/or base condensate, designation used in the study; BC -
Base Condensate, SBC-Spiked Base Condensate, HC-Hydrocarbon Mixture, SHC- Spiked
Hydrocarbon Mixture, T-Toluene and ST-Spiked Toluene), was treated in such a way to
produce intimate contact with each of five aqueous digestion and/or extraction routes. This
would allow transfer of the mercury-containing species to the aqueous layer prior to its
reduction for cold vapour generation.
2.4.1 Calibration
Calibration was performed by spiking Hg(lT)Chloride into the matrix matched aqueous
phase fi-om each digestion/extraction procedures and continuing through the vapour
generation step and AFS measurement.
2.4.2 Preliminary studies using acid-persulphate digestion
Samples of condensate (5 ml), spiked with Conostan organometallic mercury compound
(10 and 20 r g ml as Hg) were digested with 10 ml of nitric acid (cone.) and potassium
persulphate (O.lg or 0.2 g) in a three necked round bottom flask fitted with a reflux
condenser. The samples were stirred and heated to 40 °C for 2 hours. The flask was
allowed to cool before the condenser was rinsed with MiUi-Q de-ionised water. The lower
aqueous layer was separated into a 50 ml volumetric flask and diluted to volume with
Milli-Q water. A reagent blank was prepared by substituting toluene for the condensate
sample. Tin(n)chloride (5% m/v) in both acidic and alkaline media was used as reducing
agent.
52

2.4.3 (a) Preliminary studies using I ' flO 3 ' digestion
For the iodination reaction, 10 ml of hydrochloric acid (sp. gr, 1.18) was added to 5 ml of
sample condensate and to condensate samples spiked with DPM and Conostan
organometallic mercury compound (both 10 ng ml ' as Hg) in a 50 ml volumetric flask. An
aliquot, 5 ml (1:1) of iodide/iodate (0.05 M each) was added and the flask was shaken. The
excess iodine was removed by the addition of 3 ml of ascorbic acid (10 % m/v). The lower
aqueous layer was separated into a 50 ml volumetric flask and diluted to volume with
Milli-Q water. A reagent blank was prepared by substituting toluene for condensate. Tin
(D) chloride (5% m/v) in alkaline medium (4M NaOH) was used as the reducing agent.
2.4.3 (b) Further studies using I ' / lO 3 ' digestion
The above procedure was extended to include DMM, DPM, EMC and PMC species in the
spiking experiments.
2.4.4 Complexation with Dithizone, foUowed by eitraction using thiosulphate
and oxidative digestion with acid-persulfate
A 3 ml aliquot of citrate buffer [citric acid (21 g I ' ) and sodium hydroxide (8 g I ').
adjusted to pH 2 with O.IM hydrochloric acid] was added to 5 ml of condensate
sample/condensate sample spiked individually with the organic mercury compounds D M M ,
DPM, EMC and PMC (10 ng ml * as Hg). The mixture was mixed with 5 ml dithizone in
chloroform (1 nrunol I ' ) . The dithizone-mercury complexes were destroyed by shaking
with 3 ml of a 1:1 (w/v) mixture of 5% of sodium nitrate and acid solution consisting of
hydrochloric acid (O.IM), sulphuric acid (O.IM) and sodium chloride (O.IM) until the
colour of the solution changed fi*om green to yellow. The organomercurial complexes were
extracted into the aqueous phase with 3 ml of sodium thiosulphate solution (2 mmol I ')
buffered with ammonium acetate (0.05 mol I * ) . The aqueous layer was separated and
53

whilst shaking, 5 ml of oxidising solution consisting of sulphuric acid (0.25 mol 1'*), copper
(II) sulphate (0.008 mol 1*' ) and 2.5 % (m/v) potassium persulphate was added. The
aqueous layer was diluted to volume (50 ml volumetric flask ) with Milli-Q water. A
reagent blank was prepared using the same procedure but without sample. Alkaline (4M
NaOH) tin ( I I ) chloride (5% m/v) was used as reducing agent.
2.4.5 Extraction with thiosulphate, followed by oxidative digestion with
acid-persulphate
Samples of condensates (5 ml) spiked individually with organomercurial compounds;
DMM, DPM, EMC and PMC (10 «g ml 'as Hg) were extracted into the aqueous phase
with 3 ml of sodium thiosulphate solution (2 nmiol 1 * ) buffered with ammonium acetate
(0.05 mol 1 *). The aqueous layer was separated and filtered into 50 ml volumetric flask.
A 5 ml of oxidising solution consists of sulphuric acid (0.25 mol I * ' ) , copper (II) sulphate
(0.008 mol I ) and 2.5 % (m/v) potassium persulphate was added in to the flask and
shaken. The aqueous layer was separated 50 ml volumetric flask and make up to mark with
Milli-Q water. A reagent blank was prepared with the same procedure but without sample.
Tin ( I I ) chloride (5% m/v) in alkaline medium was used as reducing agent.
2.4.6 Extraction using L-cysteine followed by oxidative digestion with
acid-persulphate
Samples of condensates (5 ml) spiked individually with mercury compounds; Mercury (H)
Chloride (MC), DMM, DPM, MMC, EMC and PMC (10 wg ml ' as Hg) were extracted
into aqueous phase with 5 ml of L-cysteine solution (0.025 M). The aqueous layer was
separated into 50 ml volumetric flask. A 10 ml portion of oxidising solution consisting of
sulphuric acid (0.25 mol 1 ' ), copper (11) sulphate (0.008 mol I ' ) and 2.5 % (m/v)
potassium persulphate was added to the flask and shaken. Excess oxidant in the samples
54
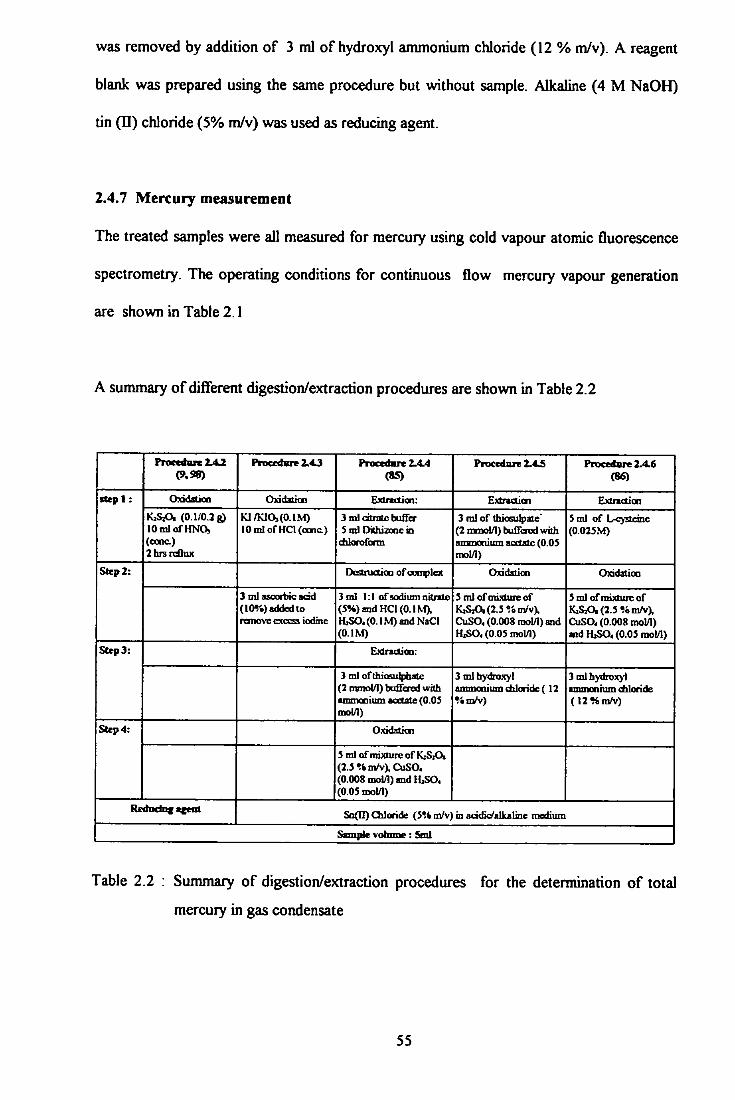
was removed by addition of 3 ml of hydroxyl ammonium chloride (12 % m/v). A reagent
blank was prepared using the same procedure but without sample. Alkaline (4 M NaOH)
tin (D) chloride (5% m/v) was used as reducing agent.
2.4.7 Mercury measurement
The treated samples were all measured for mercury using cold vapour atomic fluorescence
spectrometry. The operating conditions for continuous flow mercury vapour generation
are shown in Table 2.1
A summary of different digestion/extraction procedures are shown in Table 2.2
ProccitBR2A2 IVoccdsjv 2.4J ProctdMTt 2.4.4 (85)
ProcMlan 2.4.5 Proccdore 2.4.6 (86)
itepl : OxidstiaD Oxidation Extradion: Extraction Extredion itepl :
KiSiOb (0.1/0.3 e) lOmlofHNQi (oooc) 2brs reflux
KI/KlOj(0.IM) 10 ml of HCl (oanc)
3 ml dtrate bufifer S ml DkhizDoc in
dilorofbrm
3 ml of thiosulpaie' (2 mmol/1) buffered with ammonium «<^«tf (0.05 mol/I)
5 ml of I^Tte ine (0.025M)
Step 2: Ocstructioa of complex OxidiOion Oxidation Step 2:
3 ml ascorbic add (lO^i) added to remove excess iodine
3 ml 1:1 of sodium nkrale (5%) and HCl (0.1 Kl). HiSO4(0.1M)andNaCI (DIM)
5 ml of mixture of K,S,0,(2.5 %m^^X CuSOi (0.008 mol/1) and HSO4 (0.05 mol/1)
5 ml of mixture of KlSIO,(2.5%m^'X CUSO4 (0.008 rooM) ndH2SO«(0.05 mol/1)
Strp3: Exlraotioo: Strp3:
3 ml of thiosulphate (2 mmot/1) buffered with annnooium aoctMe (0.03 mol/1)
3 ml bydroxyl ammooium diloride ( 12 n m / v )
3 ml hydroxyl ammonium diloride (llHmh)
Step 4: Oxidatian Step 4:
3 ml of mixture of K^SjC^ (2J%m^'XCuSO, (O.OOS mol/1) and lljSO* (0.05 mol/1)
Redodiifl accnt Sn(ll) Chloride (5?i m/v) m oddxyalkalme medium
Sample vohime: Sml
Table 2.2 : Summary of digestion/extraction procedures for the determination of total
mercury in gas condensate
55

2.5 RESULTS AND DISCUSSION
As five different digestion/extraction procedures were studied, the performance of each
aqueous phase matrix upon mercury calibration required evaluation. For base line
calibration, mercury (II) chloride was used. A series of 6 mercury (U) chloride standards
was prepared (0 to 10 ng ml *) by diluting in Milli-Q water and the mercury concentration
versus signal was recorded. Tin (II) chloride reductant was used to reduce the Hg(II) to its
elemental form, prior to its determination by continuous mercury vapour generator AF
Spectrometry. Five other calibration procedures involving the addition of persulphate, nitric
acid, L-cysteine and various combinations were also performed. These were used to
monitor performance and identify the suitability of the calibration sets for the five
digestion/extraction procedures.
The result of the different calibration procedures indicates that when 'inorganic' mercury
species is used for the calibration, the tin (II) chloride reductant efficiently released
mercury. The overall performance (Figure 2.3) shows the consistency of the cahbration
procedures with r ^ greater than 0.99. The presence of various oxidants and extractants in
the system does not significantly affect the performance of the calibration provided that
excess oxidant had been destroyed with, for example, hydroxyl ammonium chloride, prior
to the measurement step.
56
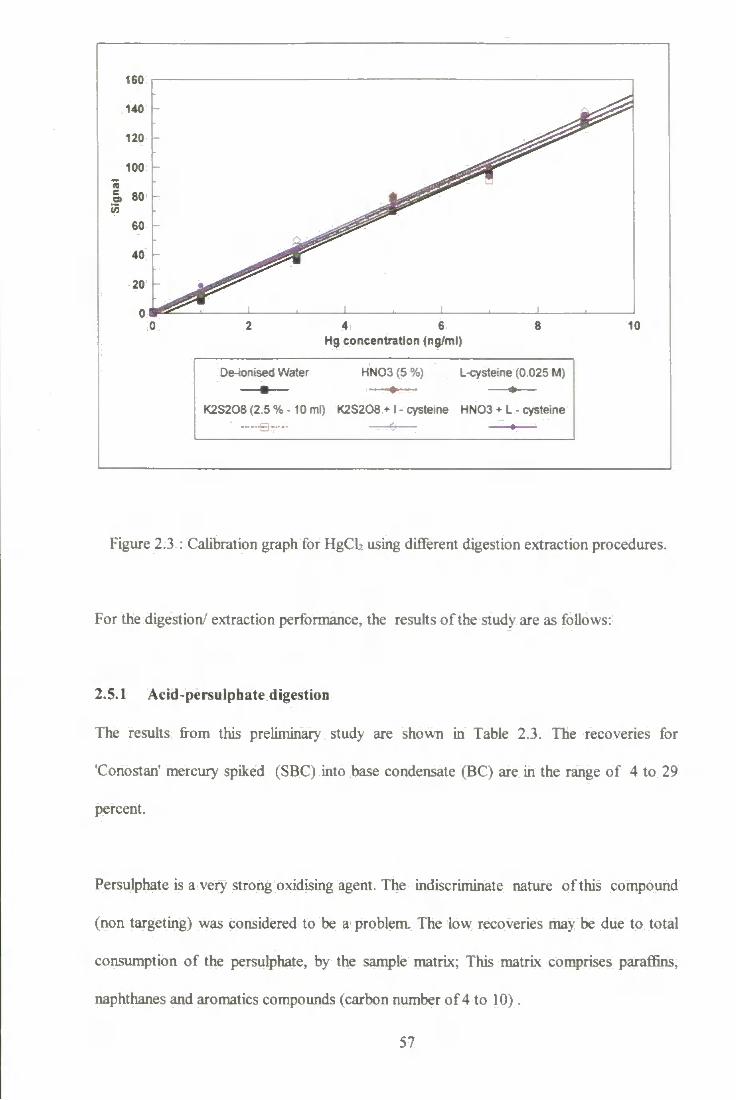
4 6 Hg concentration (ng/ml)
De-ionised Water HN03(5%) L-cysteine (0 025 M)
K2S208 (2.5 % -10 ml) K2S208 * I - cysteine HN03 > L - cysteine
10
Figure 2.3 : Calibration graph for HgCb using different digestion extraction procedures.
For the digestion/ extraction performance, the results of the study are as follows:
2.5.1 Acid-persulphate digestion
The results from this preliminary study are shown in Table 2.3. The recoveries for
'Conostan' mercury spiked (SBC) into base condensate (BC) are in the range of 4 to 29
percent.
Persulphate is a very strong oxidising agent. The indiscriminate nature of this compound
(non targeting) was considered to be a problem. The low recoveries may be due to total
consumption of the persulphate, by the sample matrix; This matrix comprises parafiins,
naphthanes and aromatics compounds (carbon number of 4 to 10).
57

Samples/
condoisate
Hg added
(Conbstao )
Hg found *
(ngm\')
%
Recovery Note
BCl 0 1.9 + 0.4 - O.lg K i S i O t added (acidic tin (H))
BC2 0 2.4 + 0.8 - 0.2g K i S i O t added (acidic tin (II))
SBCI * 10 2.8 ±0.5 8.4 0.1g K i S i O s added (acidic tin (II))
SBC2 • 10 2.3 ±0.6 3.7 O.lg KiSzOs added heat at (40 *Q (acidic tin (II))
SBC3 * 20 4.5 ±0.9 13.8 0.1g IC2S2O1 added (acidic tin (II))
SBC4 * 20 3.6 ±0.9 8.7 O.lg K2S2OS added heat at (40 *Q (acidic tin (II))
SBC5 * 20 7.6 + 0.5 28.6 O.lgKiSiOg added heatat(40*C-2hrs) (alkaUnetin (II))
SBC6 * 20 6.3 ±0.9 21.9 O.lg IC2S2O8 added heatat(40*C-4hrs) (alkaline tin (D))
Note: Average results of four replicates analysis
* Recoveries corrected for base condensate mercury content
Table 2.3 : Recoveries of Conostan mercury compound spiked into
condensates digested using persulphate
This exhaustion of persulphate was confirmed by experiment. A known excess of iodide
was added to the aqueous layer after the digestion procedure was completed in order to
reacts with any excess persulphate prior to quantification. The excess iodine formed can
then be back titrated with standard thiosulphate. From this experiment no iodine was found
indicating that all the persulphate was used up by the matrix.
58

From the above results, potassium persulphate although known to be a very strong
OMctising agent, was considered not to be suitable for the direct digestion of the condensate
sample.
2.5.2(a) Digestion witfa I flO 5
The results from this preliminary study ( I ' / lO 3 *) are shown in Table 2.4. The recoveries
(blank corrected) for mercury species added, DPM and Conostan spiked (SHC, SBC and
SCHC, SCBC) in hydrocarbon (HC) and base condensate (EC) show the first indication of
species dependance (DPM recovery > 100 %, conostan < 4 %. The hydrocarbon mixture
use consisted of 5 components i.e., n-pentane (10 % v/v), n-hexane (25 % v/v ) , n- heptane
( 25 % v/v), cyclo hexane (25 % v/v), and toluene (15 % v/v) being similar to the major
hydrocarbon range found in real condensate. Despite the simplification of the matrix little
difiference in terms of recovery was seen between HC and EC.
Sample Hg
added (ngml
Hg fonnd (ng ml ' ) Recovery (%)
Note Sample Hg
added (ngml Acidic tin
(5%) Alkaline tin (5%)
Acidic tin (5%)
Alkaline tin (5%)
Note
HC 0 0.3 + 0.09 0.1+0.03 - -
BC 0 0.2 + 0.01 0.3+0.02 - -
SHC 10 0.2 + 0.02 13.4 + 0.6 0 133.0±6.1 Spiked with DPM
SBC 10 0.2 + 0.0 10.7+1.3 0 106.7+13.0
Spiked with DPM
SCHC 10 0.2 + 0.0 0.4 + 0.09 0 4.0 + 0.9 Spiked with Conostan
SCBC 10 0.2 + 0.0 0.4 + 0.07 0 4.0 + 0.8
Spiked with Conostan
Table 2.4; Recovery of DPM and Conostan organomercury compournl spiked condensate
and hydrocarbon samples after digestion with 5 ml of acidic iodide/iodate
solution (0.05M)
59
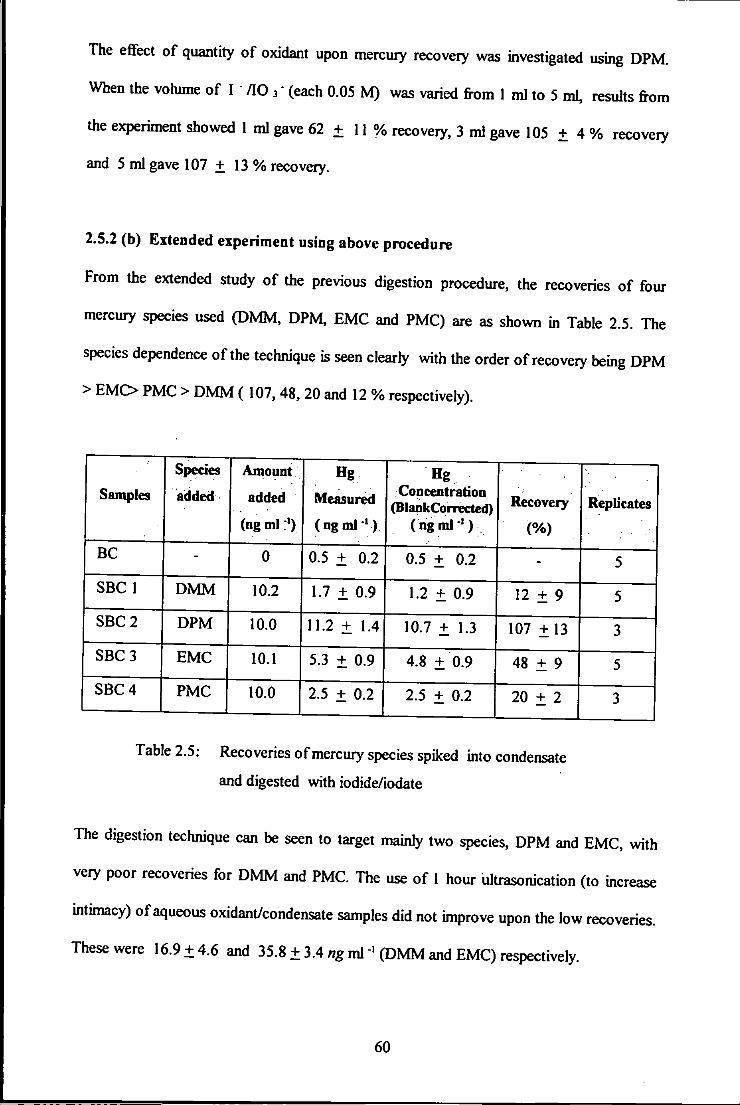
The efifect of quantity of oxidant upon mercury recovery was investigated using DPM.
When the vohime of I " / lO 3" (each 0.05 M) was varied from 1 ml to 5 ml, results from
the experiment showed 1 ml gave 62 + 11 % recovery, 3 ml gave 105 + 4 % recovery
and 5 ml gave 107 + 13 % recovery.
2.5.2 (b) Extended experiment using above procedure
From the extended study of the previous digestion procedure, the recoveries of four
mercury species used (DMM, DPM, EMC and PMC) are as shown in Table 2.5. The
species dependence of the technique is seen clearly with the order of recovery being DPM
> EMC> PMC > D M M ( 107,48, 20 and 12 % respectively).
Samples
Species
added
Amount
added
(ng ml
Measured
(ngml ^ )
Hg Concentration
(BlankConrected) (ngml-')
Recovery
(%)
Replicates
BC - 0 0.5 + 0.2 0.5 + 0.2 - 5
SBC 1 D M M 10.2 1.7 + 0.9 1.2 ± 0.9 12 ± 9 5
SBC 2 DPM 10.0 11.2 + 1.4 10.7 + 1.3 107 ± 1 3 3
SBC 3 EMC 10.1 5.3 ± 0.9 4.8 ± 0.9 48 ± 9 5
SBC 4 PMC 10.0 2.5 + 0.2 2.5 ± 0.2 20 + 2 3
Table 2.5: Recoveries of mercury species spiked into condensate
and digested with iodide/iodate
The digestion techiuque can be seen to target mainly two species, DPM and EMC, with
very poor recoveries for D M M and PMC. The use of 1 hour ultrasonication (to increase
intimacy) of aqueous oxidant/condensate samples did not improve upon the low recoveries.
These were 16.9 ± 4 . 6 and 35.8 ± 3.4 «g ml ' (DMM and EMC) respectively.
60
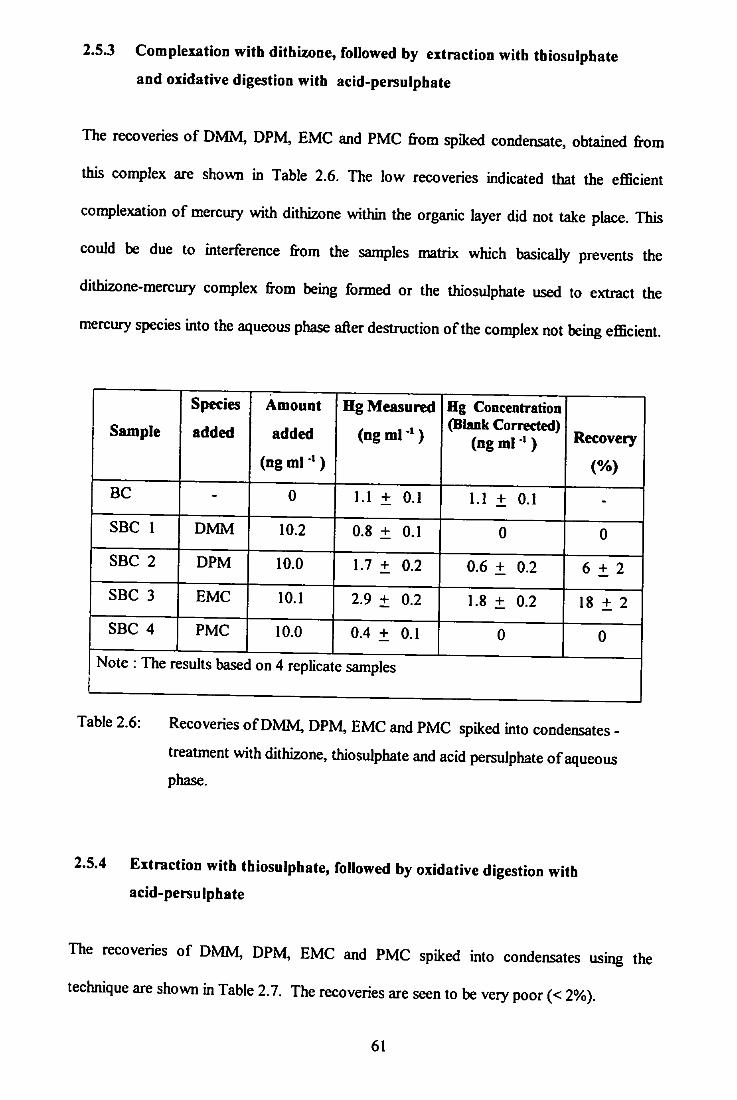
2.5.3 ComplexatioD with dithizone, followed by extraction with tbiosulphate
and oxidative digestion with acid-persulphate
The recoveries of DMM, DPM, EMC and PMC from spiked condensate, obtained from
this complex are shown in Table 2.6. The low recoveries indicated that the efiBcient
complexation of mercury with dithizone within the organic layer did not take place. This
could be due to interference from the samples matrix which basically prevents the
dithizone-mercury complex from being formed or the thiosulphate used to extract the
mercury species into the aqueous phase after destruction of the complex not being efi&cienl.
Sample
Species
added
Amount
added
(ngml ' )
Hg Measured
(ngml
Hg Concentration (Blank Corrected)
(ng ml ) Recovery
(%)
BC - 0 1.1 ± 0.1 1.1 + 0.1 -
SBC 1 D M M 10.2 0.8 + 0.1 0 0
SBC 2 DPM 10.0 1.7 ± 0.2 0.6 + 0.2 6 + 2
SBC 3 EMC 10.1 2.9 ± 0.2 1.8 + 0.2 18 + 2
SBC 4 PMC 10.0 0.4 + 0.1 0 0
Note : The results based on 4 replicate samples
Table 2.6: Recoveries of DMM, DPM, EMC and PMC spiked into condensates -
treatment with dithizone, thiosulphate and acid persulphate of aqueous
phase.
2.5.4 Extraction with thiosulphate, followed by oxidative digestion with
acid-persulphate
The recoveries of DMM, DPM, EMC and PMC spiked into condensates using the
technique are shown in Table 2.7. The recoveries are seen to be very poor (< 2%).
61

An experiment where sodium diethyldithiocarbamate (NaDDC, 0.5 % w/v) prepared by
dissolution of an appropriate amount in a pH 9 solution made of 0.02 ammonium hydroxide
+ 0.01 M acetic acid) was replaced thiosulphate in the above procedure gave, similar result
(very poor recoveries)
Sample
Species
added
Amount
added
(ngml »)
Hg Measured
(ng ml • )
Hg Concentration (Blank Corrected)
(ng ml »)
Recovery
(%) Replicates
BC - 0 0.8 + 0.1 0.8 ± 0.1 - 3
SBC 1 DMM 10.2 0.3 ± 0.1 0 0 3
SBC 2 DPM 10.0 0.2 ± 0.0 0 0 3
SBC 3 EMC 10.1 1.1 ± 0.1 0.2 ± 0.1 2 3
SBC 4 PMC 10.0 0.2 ± 0.1 0 0 3
Table 2.7 : Recoveries of DMM, DPM, EMC and PMC - treated with thiosulphatt
followed by oxidative digestion with acid-persulphate
2.5.5 Extraction with L-cysteine
The recoveries of five mercury species i.e. MC, DMM, EMC, PMC and DPM spiked
individually into the condensate samples are shown in Table 2.8. These values show that
the above procedure is more effective in the extraction o f certain mercury species
compared with previous procedures. The recoveries for DPM, EMC and MC were 100 %
in spiked base condensate (SBC). However the recovery of DMM, MMC and PMC were
15 %, 15 % and 33 % respectively. As DMM is an important species, likely to be present
in condensates (78, 178), the procedure could not be considered.
62
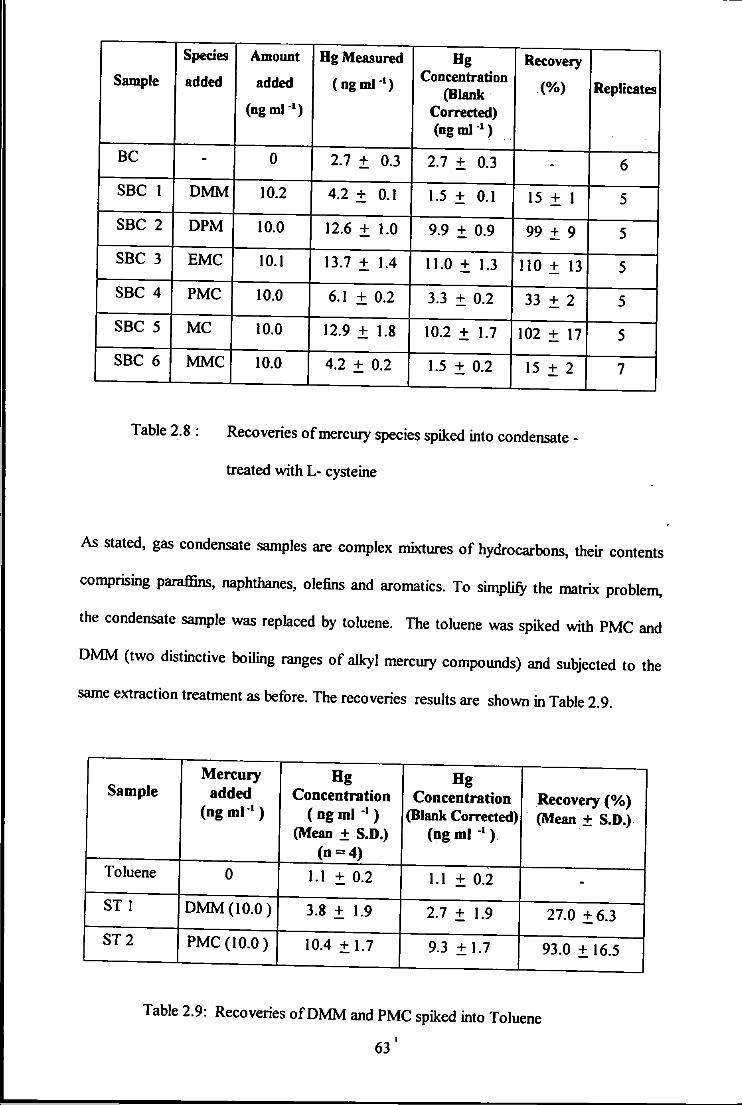
Sample
Species
added
Amount
added
(ngml^)
Hg Measured
(ngmJ-') Hg
Concentration (Blank
Corrected) (ngmlM
Recovery
(%) Replicates
BC - 0 2.7 + 0.3 2.7 + 0.3 - 6
SBC 1 D M M 10.2 4.2 + 0.1 1.5 + 0.1 15 + 1 5
SBC 2 DPM 10.0 12.6 + 1.0 9.9 + 0.9 99 + 9 5
SBC 3 EMC 10.1 13.7 + 1.4 Il.O + 1.3 110 + 13 5
SBC 4 PMC 10.0 6.1 + 0.2 3.3 + 0.2 33 + 2 5
SBC 5 MC 10.0 12.9 + 1.8 10.2 + 1.7 102 + 17 5
SBC 6 MMC 10.0 4.2 + 0.2 1.5 + 0.2 15 + 2 7
Table 2.8 : Recoveries of mercury species spiked into condensate -
treated with L- cysteine
As stated, gas condensate samples are complex mixtures of hydrocarbons, their contents
comprising paraffins, naphthanes, olefins and aromatics. To simplify the matrix problem,
the condensate sample was replaced by toluene. The toluene was spiked with PMC and
D M M (two distinctive boiling ranges of alkyi mercury compounds) and subjected to the
same extraction treatment as before. The recoveries results are shown in Table 2.9.
Sample Mercury
added (ng m l ' )
Hg Concentration
(ngml ' ) (Mean + S.D.)
(n=4)
Hg Concentration
(Blank Corrected) (ng ml ")
Recovery (%) (Mean ± S.D.)
Toluene 0 I . l + 0.2 1.1 + 0.2 -
ST 1 D M M (10.0) 3.8 + 1.9 2.7 + 1.9 27.0 +6.3
ST 2 PMC (10.0) 10.4 +1.7 9.3 +1.7 93.0 +16.5
Table 2.9: Recoveries of D M M and PMC spiked into Toluene
63 '
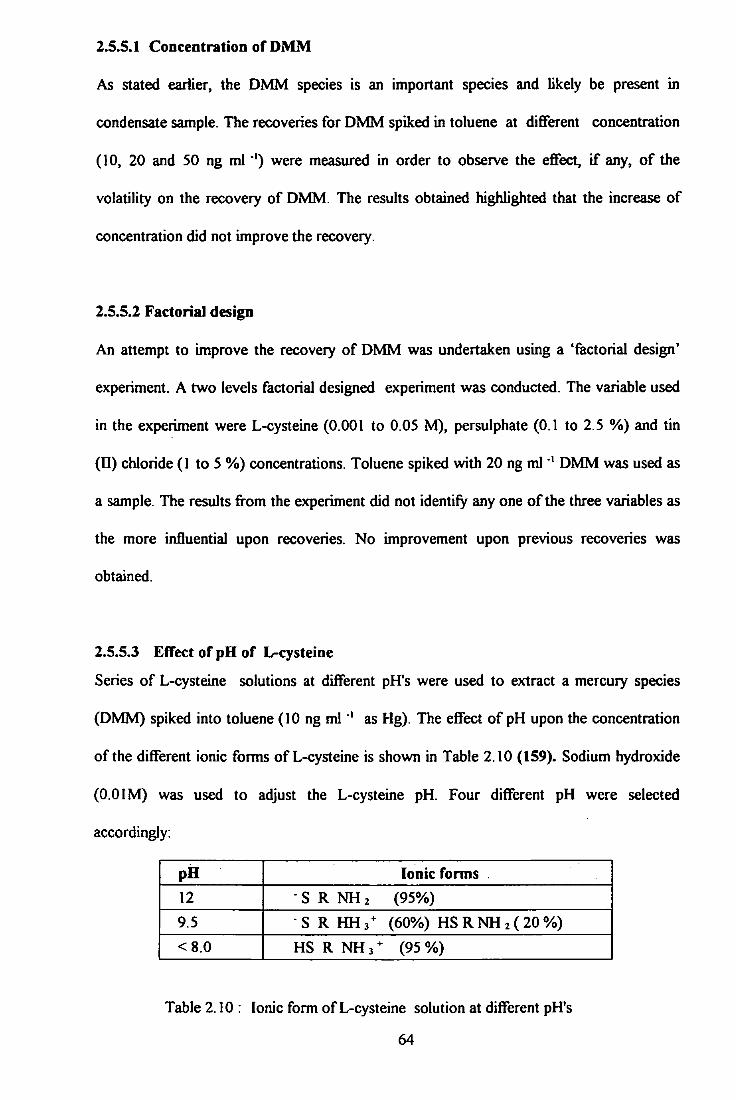
2.5.5.1 Concentration of DMM
As stated earlier, the DMM species is an important species and likely be present in
condensate sample. The recoveries for DMM spiked in toluene at different concentration
(10, 20 and 50 ng ml"') were measured in order to observe the effect, i f any, of the
volatility on the recovery of DMM. The resuhs obtained highlighted that the increase of
concentration did not improve the recovery.
2.5.5.2 Factorial design
An attempt to improve the recovery of DMM was undertaken using a 'factorial design'
experiment. A two levels factorial designed experiment was conducted. The variable used
in the experiment were L-cysteine (0.001 to 0.05 M), persulphate (0.1 to 2.5 %) and tin
(n) chloride (1 to 5 %) concentrations. Toluene spiked with 20 ng ml * DMM was used as
a sample. The results from the experiment did not identify any one of the three variables as
the more influential upon recoveries. No improvement upon previous recoveries was
obtained.
2.5.5.3 Effect of pH of L-cysteine
Series of L-cysteine solutions at different pITs were used to extract a mercury species
(DMM) spiked into toluene (10 ng ml ' as Hg). The effect of pH upon the concentration
of the different ionic forms of L-cysteine is shown in Table 2.10 (159). Sodium hydroxide
(0.0 IM) was used to adjust the L-cysteine pH. Four different pH were selected
accordingly:
pH Ionic forms 12 • S R NH 2 (95%) 9.5 S R HH^^ (60%) H S R N H 2 ( 2 0 % )
<8.0 HS R N H j ^ (95%)
Table 2.10 : Ionic form of L-cysteine solution at different pFTs
64

The recovery for D M M at different pH were measured and the results are shown in Table
2.11. While the pH is shown to be important, the maximum recoveries was still limited to
34 % (pH 8.65).
pHof L-cysteine % recovery
5.97 0
7.95 19.0±3.5
8.65 33.7 + 5.2
11.95 22.0+ 5.0
Note: Sample used : 5 ml L-cysteine (0.025M) : 5 ml Persulphate (2.5% mA') : 10 ml Alkaline tin (D) : 5%
Table 2.11: Recoveries study at different pH
The study also highlighted the batch to batch variation (variable mercury content) of
unspiked base condensate. Different batches of condensate analysis gave dififerent results,
i.e. batches 1, 2 and 3 gave respectively 2.8 + 0.3 , 1.0 + 0.1 and 8.3 + 0.9 ng ml V
This may be due to the 'base' condensate containing some particulate matter-wilh adsorbed
mercury, sediment sludge etc.,. To minimise variation in analytical results, filtration or
centrifugal may be considered in obtaining a homogenous sample. However, it would be
preferred i f the minimum of sample pre-treatment/ handling was employed to avoid losses.
65

2.6 CONCLUSIONS
The recoveries for various organic and inorganic mercury species, spiked into synthetic and
real condensate samples using different digestion and/or extraction techniques fi-om was
studied. These procedures have previously been employed for the determination of various
inorganic and organomercury halides, present in mainly aqueous systems.
The five digestion and/or extraction techniques used were (i) acid-persulphate digestion,
(ii) digestion with iodine, liberated in-situ with I ' / lO 3 ( i i i ) complexation with dithizone
followed by extraction v ath thiosulphate and oxidative digestion with acid-persulphate,
(iv) extraction with thiosulphate, followed by an oxidative digestion with acid-persulphate
and (v) extraction using L-cysteine.
The results of the study showed that the efficiency of some of the digestion and/or
extraction procedures carried out was dependent upon the speciation.
The recovery of a 'Conostan' mercury standard (mercury diethyl dithiocarbamate) fi-om the
persulphate digestion technique was in the range 4 to 29 %. Further experiments indicated
that the persulphate added for the digestion step had been consumed by the sample matrix
rather than targeting mercury species.
A 100 % recovery of di-phenyl mercury was achieved using the acidic iodine digestion
technique. For other mercury species, i.e. ethyl mercury chloride, phenyl mercury chloride
and di-methyl mercury, the recoveries by the same technique were 48 %, 20 % and 12 %
respectively.
66
The two extraction procedures involving thiosulphate, i.e. with and without a complexation
step using dithizone, were both found to be unsuitable for gas condensate samples since
they yielded low recoveries of various mercury species. With the complexation step using
dithizone, recoveries of the DMM, DPM, EMC and PMC were 0 %, 6 %, 18 % and 0 %
respectively. The recoveries obtained with extraction by thiosulphate alone were less than
2%.
Extraction using L-cysteine (0.025M) followed by oxidation with potassium persulphate
(2.5% m/v) showed very encouraging results. The recoveries of the DPM, EMC and MC
species were 100 %. While, the recovery of PMC was also high (over 90 % ) , that of
D M M was only 15 %. This latter species is considered to be a major contributor to the
total mercury in condensate samples. Only a procedure which would bring about a
significant improvement in D M M recoveries (> 90 %) could be considered useful.
There was no improvement in the recovery values, obtained from the spiking of increasing
concentrations of D M M into toluene, using the above extraction technique.
The results from a 'factorial design' experiment did not identify any one variable i.e.
concentration of L-cysteine, persulphate and tin (II) chloride, as being the most influential
upon recoveries of DMM. No improvement upon previous recovery values was obtained.
Experiments performed to change the concentration of different ionic forms of L-cysteine
available for complexation using different pH values showed that recoveries for D M M
were still Umited to a maximum of 34 % at pH 8.65.
67
Overall, it was concluded that the favoured procedures used for digestion and/or extraction
of mercury species from water and sediment samples, were of Umited application to
samples such as gas condensate.
Recovery problems encountered in the extraction and/or digestion of mercury species in
gas condensate may arise because of the following:
• A natural gas condensate sample is unique in its properties and these depend upon
its origin, and its processing and treatment steps.
• The complex matrix of a gas condensate can lead to various interferences during
the digestion and/or extraction procedure. One example is the effect from a 10** ; 1
ratio of unsaturated matrix to mercury species which limits the efficiency of certain
procedures.
• The highly volatile nature of both the condensate and the mercury species can result
in mercury loss of analytes during the determination. Heating during a procedure
can also induce losses.
It is important to note that, to date, no fully validated, certified reference material is
available for mercury species in a hydrocarbon-based sample. The absence of a CRM,
needed to serve the analytical requirements of a large and environmentally important
industry, is a reflection of the difficulty this sample-type offers. This absence also results in
a plethora of techniques available for mercury species measurement in hydrocarbon-based
samples, many of which are pooriy designed, poorly tested and pooriy presented.
68

CHAPTER 3
T H E DETERMINATION O F T O T A L M E R C U R Y IN LIQUID HYDROCARBONS AND GAS CONDENSATE B Y VAPORISATION AND TRAPPING A T E L E V A T E D T E M P E R A T U R E S T O G E T H E R WITH ATOMIC F L U O R E S C E N C E S P E C T R O M E T R Y

CHAPTER 3
T H E DETERMINATION O F T O T A L M E R C U R Y IN LIQUID
HYDROCARBONS AND CONDENSATE BY VAPORISATION
AND TRAPPING WITH ATOMIC F L U O R E S C E N C E D E T E C T I O N .
3.1 INTRODUCTION
It was seen in Chapter 2 that digestion/extraction techniques (8, 9, 12, 77, 78, 96 -100)
used for the determination of total mercury in gas condensate samples are inefficient, with
the efficiency being dependent upon the species present and the complexity of the matrix. It
is known however, that mercury species are efficiently adsorbed onto gold, gold-coated
materials and the platinum group metals (amalgamation) (66, 77). The possibility of
utilising this characteristic as a means of removing the interferent matrix prior to release
and measurement was investigated.
Unlike condensate samples, the determination of total mercury in natural gas can be carried
out accurately and to very low limit of detection by collecting the species onto special gold
coated sand traps at room temperature. The trapped/adsorbed mercury is released when
heated to a high temperature (~ 900 °C) and swept through into the atomic fluorescence
detector by argon gas for measurement (161-162).
Depending upon the type of trap system, the adsorption technique can have some
restrictions. In the presence of heavier hydrocarbons and/or *wet' conditions, the adsorbent
collection efficiencies are affected. It was reported that using Au/Pt coated wire, kept at
SO C to prevent matrix condensation, adsorption efficiency of 100 % for elemental mercury
is achievable. However only 50% of dimethyl mercury is recovered from the same gas
69

matrix (8,9,77). The trap system therefore displays species dependency, under the
conditions used.
The performance of different adsorbents in collecting mercury species, such as activated
charcoal, silver and gold coated sand has been studied by E>umarey et al, (66). Elemental
mercury, inorganic mercury (HgCk), organomercury halides (MMC and EMC) and the
di-alkyl mercury compounds (DMM and DEM) generated in a stream of air (vapour form)
were 100% collected when using gold coated sand. The study also reported that activated
charcoal and silver coated sand was not recommended as the collection is not quantitative
and depends on the sampling flow rate, the 'ageing time' of the collector, the mercury
species used and the interferent nature of the matrix. In general the gold sand trap capable
is capable of collecting various species provided the gas or the sample is dry and contains
minimum interferents.
Recently, the performance of a newly developed gold impregnated silica (Amasil) trap
indicated that the efficiency of the trap or collector was not affected by sampling in humid
air (relative humidity of 95%) (163).
Prior to the determination of mercury by an element specific detector such as AFS or
AAS, the collector or trap is required to be heated to a temperature high enough to ensure
decomposition of the compounds and the release of mercury in its elemental form. The
thermal desorption behaviour of several mercury species released fi'om a gold trap,
elemental mercury is controlled by the decomposition process (164). To obtain
desorption and decomposition, the collector or trap must be heated to at least 500 'C (66,
164-166). Mercury species will not be decomposed or released fi-ora the gold collector/trap
i f a temperature of 250 °C (93) is not reached. At 345 °C, 60 % of elemental mercury is
70
as
fiiU
released i f oxygen is used as carrier but for argon or nitrogen, a temperature of 250°C is
sufficient. At 267 °C the recovery of D M M is 0 % , and at 345 °C the recovery for MMC is
also 0 %. For DPM a temperature as high as 557 °C is required for complete
decomposition (164). This would suggest that the trapping mechanism does not produce
elemental mercury directly during the adsorption process.
The aim of this study was to develop a simple, accurate, rapid and precise technique for
the determination of total mercury in condensate samples. The excellent sensitivity of
atomic fluorescence spectrometry has been utilised in this study, using a commercially
available system, for the determination of total mercury. To address the matrix interference
and species-dependent recovery problem obtained using conventional digestion and/or
extraction techniques, a new trapping technique was designed and constructed.
The technique is based on vaporisation of the sample and trapping of mercury at an
elevated temperature prior to its determination by atomic fluorescence spectrometry. The
performance of the technique was evaluated from recovery data for total mercury using
various known species from spiking experiments. The use of real condensate samples for
analysis was carried out.
71
3.2 PRELIMINARY STUDY USING A SAMPLE VAPORISATION
TECHNIQUE W I T H ELEVATED TEMPERATURE TRAPPING
OF MERCURY
3.2.1 EXPERIMENTAL
In this preliminary investigation, n-pentane was employed as a 'synthetic' condensate. A
known amount of D M M and DPM, 20 to 50 ng ml ' were spiked into the n-pentane. A one
millilitre sample (spiked n-pentane) was injected into a 3 necked round bottom flask, at
room temperature and heated slowly (approximately 20°C min **) in an oven to 200 "C. This
temperature was maintained for about 10 minutes to ensure the sample vaporised
completely. The sample vapour generated was swept by argon gas through a gold coated
silica (Amasil) trap maintained at 200 T by a resistance wire heater jacket. The flow rate of
the argon was set to between 300 and 400 ml min "V To avoid losses of analyte, a minimum
amount of tubing was used for the connection of glassware.
After sample vaporisation, the gold-coated silica trap was disconnected and transferred to a
commercial mercury analyser unit (Sir Galahard Mk n , PS Analytical), for the
determination of mercury. After samples had been collected using the method described
above (remote sampling), the trap was placed into a heating module, where it was flushed
with argon to ensure that no traces of air or any matrix vapour remain. The module then
heated up and vaporised the mercury, which was carried by a stream of argon to a second
permanent gold sand trap, where it was adsorbed. The second permanent trap then went
through its heating cycle, releasing the mercury at 800 to 900 °C which was swept into the
fluorescence detector where a response was measured. A detailed description of the
instrument system has been described elsewhere (161, 162). A schematic diagram of the
preliminary instrumental arrangement is shown in Figure 3.2.
72

tyiartzwool
I
Silica tubo
Gold«oated silica
Sfivn erara
Figure 3 . 1 : Schematic diagram of gold-coated silica trap
Heaasd jacket (200 deg C)
Gctd-coatBti cdca
Oven temperature cydod between room tomporaturo a nd 200 deg. C
.Ftowmetef
Btftaust vert
CondcrtsitB Coolef/trap
ATBcn
Figure 3.2 : Schematic diagram of vaporisation set-up used in the preliminary
study for the determination of total mercury in condensate
73

3.2.2 Results and Discussion
3.2.2.1 Preliminary study using the sample vaporisation technique with an
off-line detection system
From the results of the preliminary study, it was found that the determination of total
mercury in both a simple (n-pentane) and a complex liquid hydrocarbon mixture such as gas
condensate, can be carried out using a sample vaporisation procedure with trapping of two
mercury species at an elevated temperature of 200 °C. Based on these findings, the
potential of this new technique is evident. The recovery of D M M was some 100 % but
DPM only yielded 75 % recovery when spiked into n-pentane. These resuhs are shown in
Table 3.1 and Figure 3.3. The low recovery of DPM is considered to be due to a low
vaporisation temperature (boiling point of DPM is 352.1°C @ 760 mm Hg). The
temperature used to volatilise the samples was limited to 200 °C to prevent the Teflon
connection/tubing from degrading rapidly.
Some inconsistency in the results arose which was considered to be due to difficulty in
controlling the heating rate of the oven used to vaporise the sample. The highly volatile
nature of the sample in the warm oven leads to some problems through losses during the
transfer of sample to the vaporisation vessel. The determination of mercury by oflf-line
procedures is also time consuming especially as a cooling period is required before
removing the trap and cooling of the oven before injection of the next sample.
To improve both the recovery and precision of this new technique, the sample introduction
system had to be improved to eliminate losses during injection of volatile samples. Efficient
and precisely controlled heating and cooling of the oven must be considered in order to
regulate the heating temperature.
74
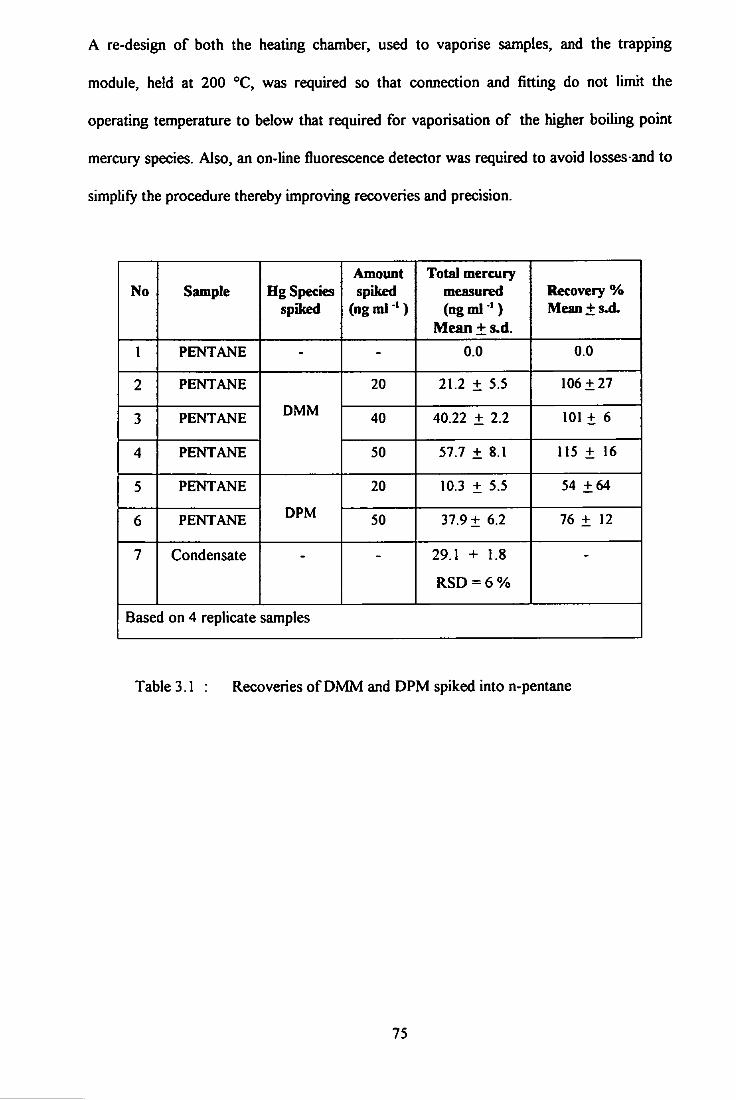
A re-design of both the heating chamber, used to vaporise samples, and the trapping
module, held at 200 °C, was required so that connection and fitting do not limit the
operating temperature to below that required for vaporisation of the higher boiling point
mercury species. Also, an on-line fluorescence detector was required to avoid losses and to
simplify the procedure thereby improving recoveries and precision.
No Sample Hg Species spiked
Amount spiked
Total mercury measured (ngml- ')
Mean + s.d.
Recovery % Mean+ suL
1 PENTANE - - 0.0 0.0
2 PENTANE
DMM
20 21.2 ± 5.5 106 ±27
3 PENTANE DMM 40 40.22 ± 2.2 101+ 6
4 PENTANE
DMM
50 57.7 + 8.1 115 ± 16
5 PENTANE
DPM
20 10.3 ± 5.5 54+64
6 PENTANE DPM 50 37.9 ± 6.2 76 ± 12
7 Condensate —
"
29.1 + 1.8
RSD = 6 %
Based on 4 replicate samples
Table 3.1 : Recoveries of D M M and DPM spiked into n-pentane
75
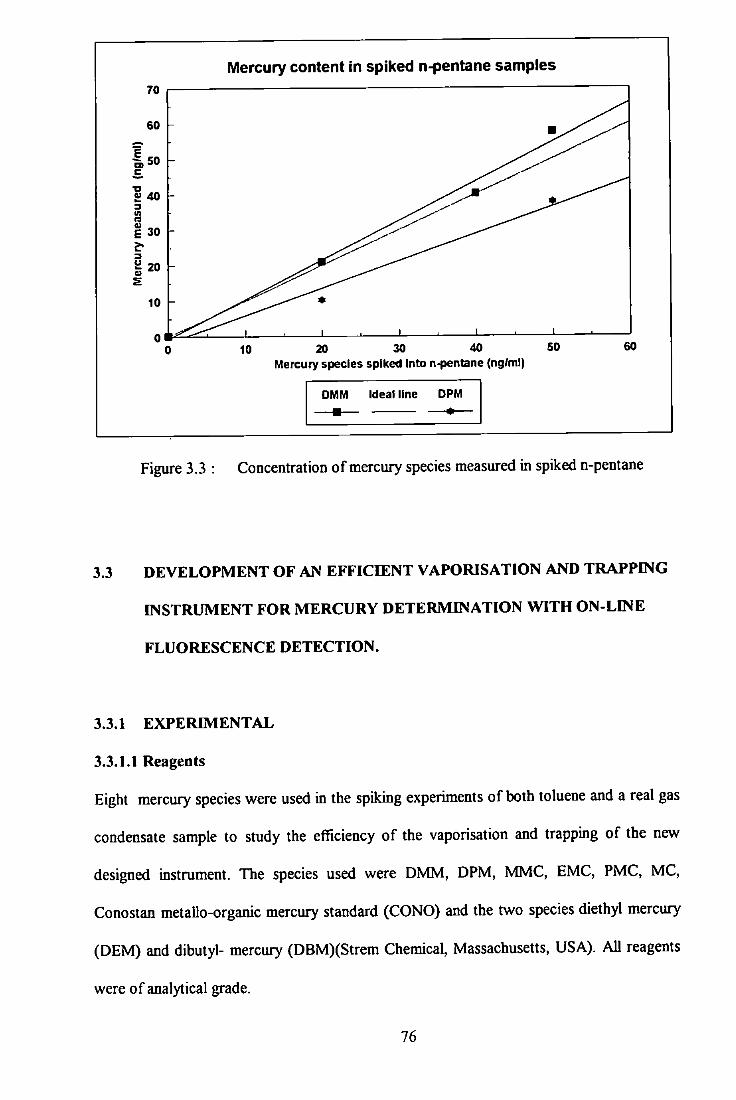
Mercury content in spiked n-pentane samples 70
60
I so
1 40 in a I 30
S20
10
0 20 30 40
Mercury species spiked Into n-pentane (ng/ml) 60
OMM Ideal line DPM
B
Figure 3.3 : Concentration of mercury species measured in spiked n-pentane
3.3 DEVELOPMENT OF AN EFFICIENT VAPORISATION AND TRAPPING
INSTRUMENT FOR MERCURY DETERMINATION W I T H ON-LINE
FLUORESCENCE DETECTION.
3.3.1 EXPERIMENTAL
3.3.1.1 Reagents
Eight mercury species were used in the spiking experiments of both toluene and a real gas
condensate sample to study the efficiency of the vaporisation and trapping of the new
designed instrument. The species used were DMM, DPM, MMC, EMC, PMC, MC,
Conostan metallo-organic mercury standard (CONO) and the two species diethyl mercury
(DEM) and dibutyl- mercury (DBM)(Strem Chemical, Massachusetts, USA). All reagents
were of analytical grade.
76
The organomercury stock solutions DMM, DEM, DPM and Conostan Metallo-Organic
Mercury standard were prepared by dissolving the compounds in toluene. To prepare the
stock solutions (1000 | ig ml *) for MMC, EMC, PMC and MC, the species were initially
dissolved in a small quantity of propanol prior to dilution in toluene. All stock solutions
were stored *m a dark bottle and kept in a refrigerator at 4 °C. The stock solutions were
prepared freshly every two weeks. Working analytical solutions were prepared freshly for
each daily set of experiments.
3.3,2 Instnimentation
A photograph of the layout is shown in Figure 3.5 and a schematic diagram of the
instrumentation is shown in Figure 3.6
3^.2.1 Vaporisation chamber.
The chamber consists of a 250 ml three necked round bottom flask which was maintained
at 400 °C ± \0 °C using an electrothermal heating mantle. The separate necks were
connected to the heated trap line and an argon purge gas line while the third neck was
fitted with a double septum for sample introduction by an injection technique. The top part
of the chamber was insulated with aluminium foil to reduce heat loss. The tubing from the
chamber to the gold-coated silica trap was maintained at 200 °C by heating tape and a
variac supply. The latter prevented condensation of the vaporised sample before it reached
the heated trap.
3.3.2.2 Adsorption trap module
The new adsorption trap module (Figure 3.4) consisted of a gold-coated silica (Amasil, 30
mg) bounded by Quartz wool writhin a silica tube and surrounded by a nichrome heating
wire (to release mercury at 900 °C). This tube was retained within a specially designed
77
cooling chamber (flushed using air to return the inner silica tube to 200 °C fi-om 900 °C).
The trap was positioned within a small oven (Kenwood, Hants, UK) maintained at 200
+ 5'*C.
3.3.2.3 Valve switching sequences
Control switching of the purging, cooling and carrier gas lines was performed by a
computer driven 'Galahad' system (P.S. Analytical, Kent, UK). A schematic diagram of the
switching arrangement for the sampling mode (pre-concentration) and for the measurement
mode (detection) is shown in Figure 3.7.
3.3.2.4 Filter
To improve baseline stability and prevent trace organic material entering the detector
system, a filter was inserted into the gas line prior to the detector. This filter which
comprises two ashless. No. 1 filter papers in a 2 cm diameter demountable holder
(Whatman Int. Ltd., Maidstone, UK) did not aflfect the performance of the calibration or
any subsequent analyses. This was changed every fifty run or earlier i f shown to be
necessary.
78

Voltage supply Cooling r^flow
Gold-coated silica
Cooling h flow Nichrome heating wire
Figure 3 .4 : Schematic diagram for the adsoiption trap module
3.3.3 Experimental procedure
Known mercury species were spiked individually at different concentrations (measured as
mercury) in condensate and control samples (condensate or toluene). An accurately
measured volume of sample (usually 0.25 ml) was injected using a gas-tight syringe
(Dynatech Precision, Baton Rouge, Louisiana, USA) into the three necked a vaporisation
chamber now held at a temperature of 400 °C. Normally some 5 to 10 minutes were
required to vaporise the sample completely; a parameter which was studied later. The
sample vapour generated was continuously swept by argon gas, at between 300 and 400ml
per minute, through to the gold-coated silica trap maintained at 200 °C within the small
oven. The sample matrix (paraffins, aromatics, naphthanes) was consequently carried in its
vapour phase away from the trap and directed to a waste collector. The mercury species
79

which were first adsorbed on the gold coated silica trap, were subsequently released (as
elemental mercury) by heating to a temperature of 900 °C and swept through to an Atomic
fluorescence detector (Merlin, P.S. Analytical, Orpington, Kent, UK). Recovery
experiments based upK^n the standard additions technique, together with condensate sample
analyses (various condensate fractions, oils etc.) were performed.
In order to acquire the 'optimum' conditions for use, a number of instrumental operating
parameters were varied and their effects investigated. In particular the effects of sample
volume, argon gas sweep rate, temperature of trapping and the size of trap used, upon
recovery were studied. In addition, the retention efficiency for different species and their
bleed-off" effects were studied.
V „ Y
O C O a : •
Figure 3.5 : Set-up for determination of total mercury in condensate
80
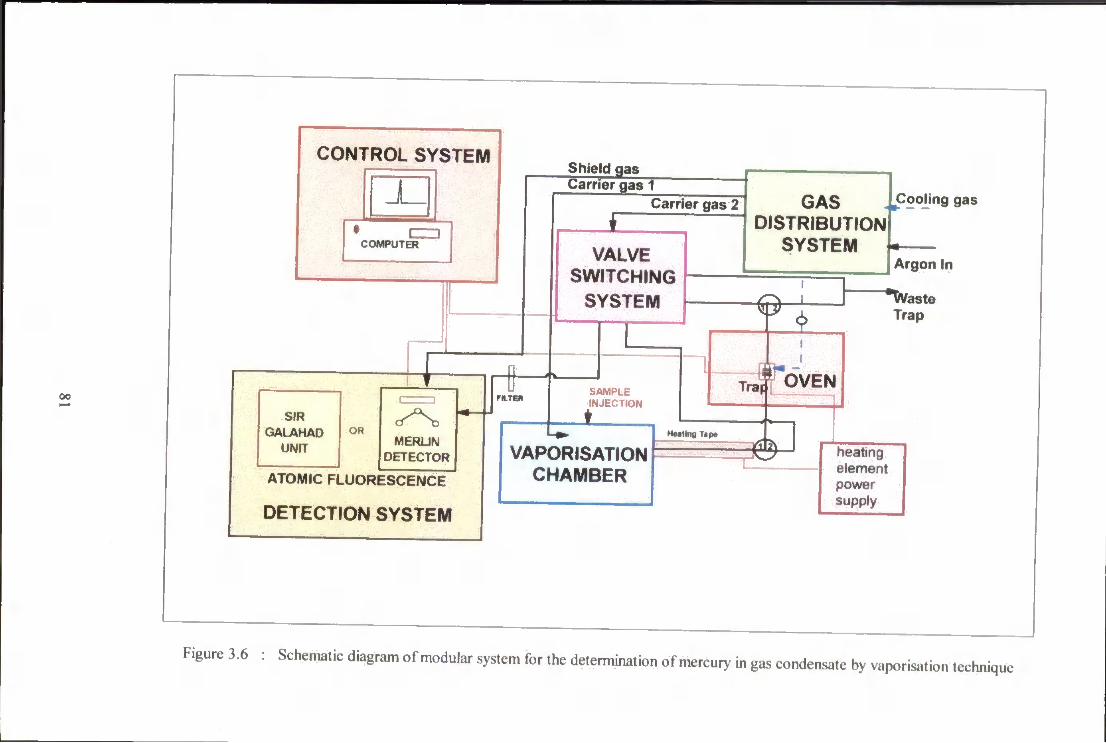
CONTROL SYSTEM
i COMPUTER
SIR 1 1
< ^
GALAHAD OR
1 1
< ^
UNrr MERLIN UNrr DETECTOR
ATOMIC FLUORESCENCE
DETECTION SYSTEM
Shield gas Carrier gasl
Carrier gas 2
VALVE SWITCHING
SYSTEM
SAMPLE INJECTION
1 VAPORISATION
CHAMBER
Hfialing Tap*
GAS DISTRIBUTION
SYSTEM
kjooHng gas
Argon In
^ a s t e Trap
Trad OVEN
heating element power supply
Figure 3.6 : Schematic diagram of modular system for the determination of mercury in gas condensate by vaporisation technique
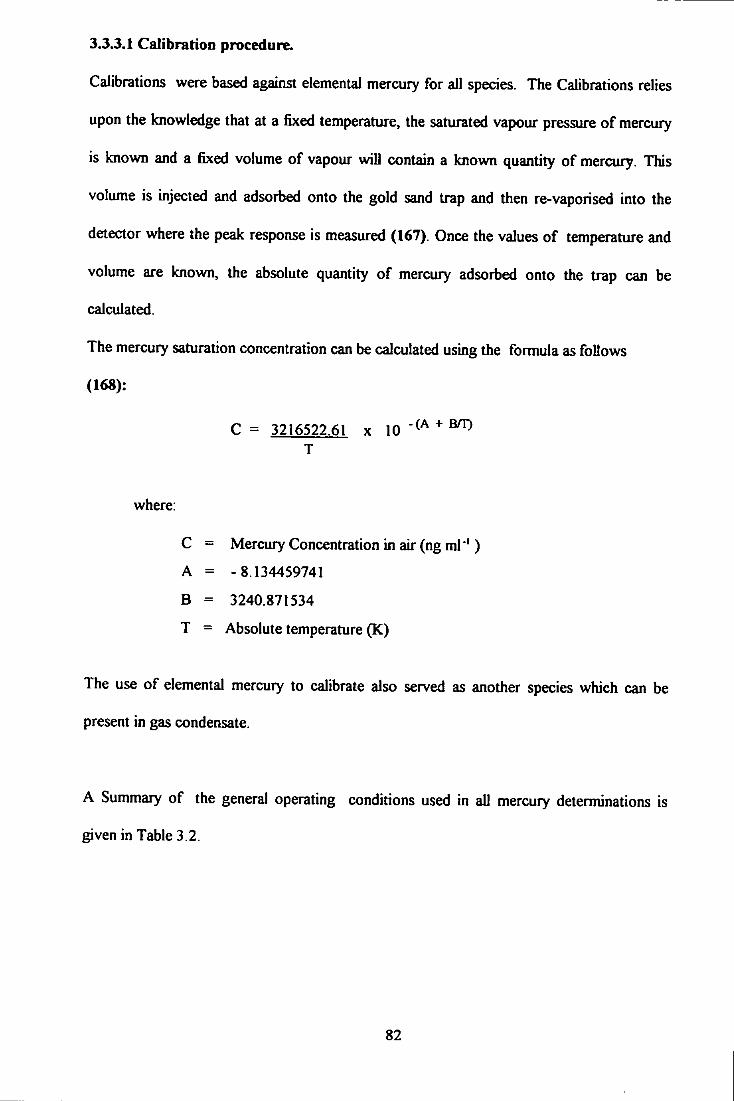
3.3.3.1 Calibration procedure.
Calibrations were based against elemental mercury for all species. The Calibrations relies
upon the knowledge that at a fixed temperature, the saturated vapour pressure of mercury
is known and a fixed volume of vapour will contain a known quantity of mercury. This
volume is injected and adsorbed onto the gold sand trap and then re-vaporised into the
detector where the peak response is measured (167). Once the values of temperature and
volume are known, the absolute quantity of mercury adsorbed onto the trap can be
calculated.
The mercury saturation concentration can be calculated using the formula as follows
(168):
C = 3216522.61 x 10 '^^ ^ T
where:
C = Mercury Concentration in air (ng ml"')
A = -8.134459741
B = 3240.871534
T = Absolute temperature (K)
The use of elemental mercury to calibrate also served as another species which can be
present in gas condensate.
A Summary of the general operating conditions used in all mercury determinations is
given in Table 3.2.
82

Vaporisation Chamber Temperature (° C) 400
Vaporisation Time (min.) 5 - 1 0 *
Argon carrier for Vaporisation (ml min *) 300 - 400
Argon flow rate for the detector (ml min '*) 500
Detector Sheath gas flow rate (ml min '*) 250
Gold Trap Flushing time (sec.) 30
Gold Trap Vaporisation time (sec.) 15
Gold Trap vaporisation temperature ("* C) 900
Gold Trap Cooling period (min) 2
Note : * Longer vaporisation times may be required if the samples are heavier than typical condensate
Table 3.2: Summary of operating conditions
83

Argon carrier
Detector
Vaporisation chamber
Waste
Trap
Sample injector port
(A) Sampling Mode
Argon carrier
Vaporisation chamber
Waste i
J Trap
Sample injector port
(B) Measurement Mode
Figure 3.7 : Valve switching sequence between (A) sampling mode (pre-concentration)
and (B) measurement mode
84

3.3.4 RESULTS AND DISCUSSION
3.3.4.1 Performance characteristics of the trap system
The stability of mercury adsorbed onto the gold coated silica trap was evaluated by
carrying out calibrations at room temperature and at 200 **C. The results, shown in Figure
3.8 indicate that at 200 °C the mercury cahl^ration is both stable and quantitative. It is also
noted that an improvement in sensitivity is obtained over collection of species at room
ten:q)erature.
The performance of the trap in holding the mercury species (bleed-ofif eflfects) at 200 °C
was investigated. The san^le (0.25 ml), containing 20 ng ml of a mercury species was
vaporised and swept through the trap by argon gas (350 ml min '*) at different time settings
from 5 minutes to 1 hour. The results, summarised in Figure 3.9, show that no significant
bleeding occurred up to 30 minutes (96 % to 103 % recovery ) and that the trap was
eflScient in holding the mercury species at 200 **C. Longer time periods (> 30 minutes) gave
slightly increased recoveries due to contribution from the very low mercury content o f
argon carrier gas being trapped. It was observed that traps did not suffer from memory
effects and that the life time of a trap was also inq)roved because of the higher trapping
temperatures enqjloyed (200 X)).
Calibration procedures using several species o f mercury in hexane indicated that the same
performance and accuracy obtained with reference to elemental mercury was achieved. The
comparison shows that the trap is capable o f trapping eflSciently several species (DMM,
DEM, D B M and DPM) vaporised through the trapping module at elevated temperature.
Calibration using elemental mercury is recommended since it is single and eliminated any
chemical preparation. The conq)arison of all species is shown in Figure 3.10. The higher
ten^)erature of the vaporisation chamber (400 °C compared with 200 °C previously)
85

resulted in the higher boiling point species being vaporised efiBciently and retained within
time period set for trapping.
Examples of volatogram from the calibration comparison for 10 ng ml ' DMM, DEM,
DBM, and DBM spiked into hexane are as shown in Figure 3.11 together with a calibration
for the single species DMM in toluene.
Stability of Calibration Curve With Temperature
30 40 50 Hg Concentration (ng/ml)
60 70
Room Temp 200 Deg C
80
Figure 3.8: Calibration graphs for the gold coated silica traps
at room temperature and at 200 °C
86

Vaporisation Performance (Bleeding Test)
(Function of Time) 140
120
100
« 80
^ 60
40
20
0 10 20 30
Time (minutes) 6C 90
Recoven {%) Hg Measured (ng) Actual cone, (ng/ml)
Figure 3.9 : Stability of the trap in holding mercury species at 200 ''C
200
150
100
Vaporisation Method Calibration Comparison
Elemental Mg. DMM. DEM, DBM AND DPM
Concentration (ng/ml)
Elemental Hg DMM — • • - A
DEM DBM DPM
15
Figure 3.10: Calibration comparison for several dialkyl mercury compounds
and elemental mercurv 87

100 2D0 time (sec)
lOngmI 'DMM in hexane
• I " " I 100 200 tune (sec)
10 ng ml"' DEM in hexane
100 200 time (sec)
10 ng ml DBM in hexane
100 200 time (sec)
lOngml 'DPM in hexane
100 2)0 time (sec)
10 ng ml DMM in toluene
100 2D0 time (sec)
30 ng ml DMM in toluene
r t I I
100 200 time (sec)
50 ng ml ' DMM in toluene
B
Figure 3.11 : A - Example of volatograms for 10 ng ml * DMM, DEM, DBM and DPM and B - Volatograms of D M M (10, 30 and 50 ng ml *')
Note : X axis = Time (seconds) and Y axis = Fluorescence signal
88

3.3.4.2 Effect of argon sweep gas flow rate
The argon flow rate that sweeps the vaporised san^le to the gold-coated silica trap was
varied from 100 ml min ' to 500 ml min For each flow rate set-up, 0.25 ml of n-hexane
spiked with 10 ng m l D E M was injected. The fluorescence signal from the mercury
measurement was monitored for each flow rate. The results indicated that, there was little
difference in the sensitivity of the signal for the flow rates up to 400 ml min"' of argon
carrier gas. However the sensitivity o f the signal decreased when the flow rate increase to
500 ml min * and above (less contact time or resident time). Correlation between argon
sweep gas flow rate and signal is shown in Figure 3.12.
180
160
140
5S 130
0)120 CO
110
100
90 100 200 300 400 600
Argon flow rate (ml/mln)
I 600 700
Figure 3.12: Effects of argon sweep gas flow rate upon signal response
89
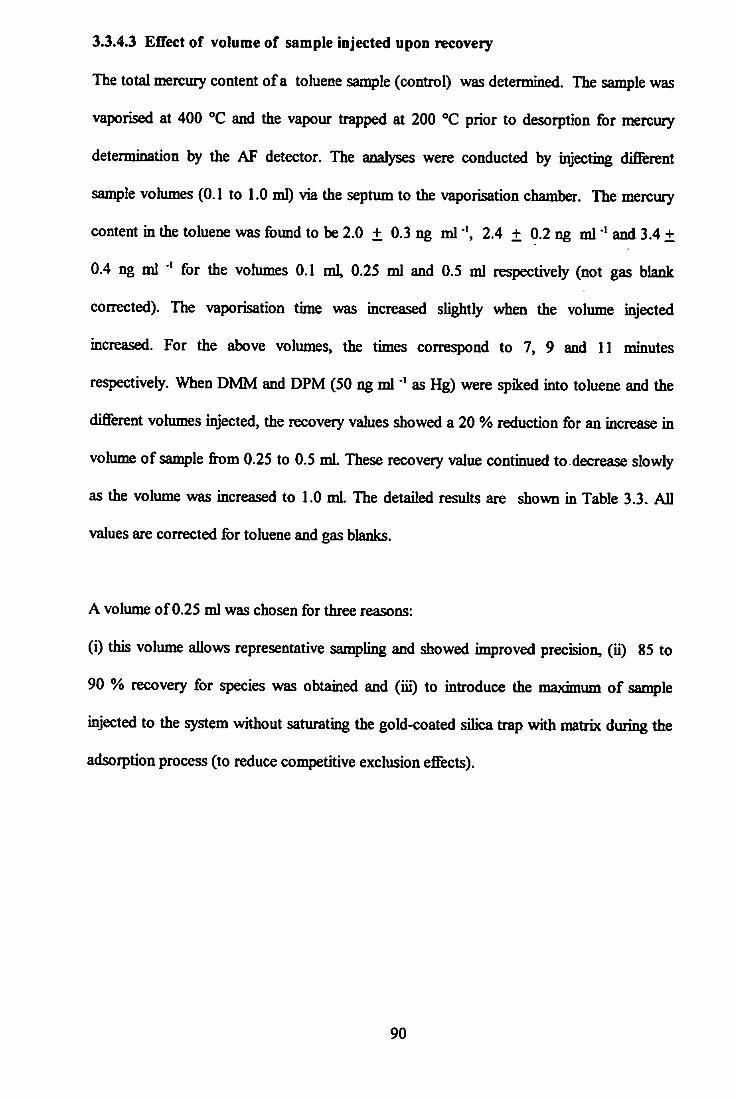
3.3.4.3 Effect of volume of sample injected upon recovery
The total mercury content of a toluene sample (control) was determined. The sample was
vaporised at 400 °C and the vapour trapped at 200 prior to desorption for mercury
determination by the AF detector. The analyses were conducted by injecting different
sample vohmies (0.1 to 1.0 ml) via the septum to the vaporisation chamber. The mercury
content in the toluene was found to be 2.0 + 0.3 ng ml 2.4 + 0.2 ng ml and 3.4 +
0.4 ng ml for the vohmies 0.1 ml, 0.25 ml and 0.5 ml respectively (not gas blank
corrected). The vaporisation time was mcreased slightly vAien the volume injected
increased. For the above volumes, the times correspond to 7, 9 and 11 minutes
respectively. When DMM and DPM (50 ng m l a s Hg) were spiked into tohiene and the
different vohimes injected, the recovery values showed a 20 % reduction for an increase in
volume of sample from 0.25 to 0.5 mL These recovery value continued to decrease slowly
as the volume was increased to 1.0 ml. The detailed results are shown in Table 3.3. All
values are corrected for tohiene and gas blanks.
A volume of 0.25 ml was chosen for three reasons:
(i) this volume allows representative sanq)ling and showed improved precision, (ii) 85 to
90 % recovery for species was obtained and (iii) to introduce the mayimiim of sang)le
injected to the system without saturating the gold-coated silica trap with matnx during the
adsorption process (to reduce competitive exclusion effects).
90

Sample Hg species
spiked (ng ml-')
Volume of Sample
(ml)
Concentration measured
(ngmlV) Mean + s;d.
Recovery (%)
Mean + s.d.
Toluene 0.1 2.0 + 0.3 -
Toluene 0.25 2.4 + 0.2 -
Toluene 0.5 3.4 + 0.4 -
ToluCTie 1 3.5 ±0.3 -
Tol 50DMM
DMM
50
0.1 44.9 + 2.2 8 6 ± 5
To) 50DMM DMM
50 0.25 43.3 ±0.4 82±1
Tol 50DMM
DMM
50 0.5 36.5 ±0.5 6 6 ± 1
Tol 50DMM 1 29.6 + 0.2 54+0
Tol 50DPM
DPM
50
0.1 66.3 ± 1.9 129 ± 4
Tol 50DPM DPM
50 0.25 45.9 ± 0.8 87 ± 2
Tol 50DPM
DPM
50 0.5 34.5 ± 2.3 62 ± 5
Tol 50DPM 1 27.0 ± 2.5 49 jh 5
Table 3.3 : Recoveries of DMM and DPM added into toluene -
Effect of volume injected (single size trap)
3.3.4.4 Double size trap
In order to reduce competitive effects within the trapping module by the matrix and
mercury species while increasing the capability to improve efiSciency of collection in
absolute terms, the effect of increasing the quantity of trapping material upon recoveries
was investigated. To this end a double sized trap (60 mg trapping material) was chosen.
The effect of trap size upon recoveries was much reduced when a double size gold-coated
silica trap was employed. Up to 1.0 ml of sample gave the same recovery for the species as
that of a 0.25 ml injection. This recovery data is shown graphically in Figure 3.13.
91
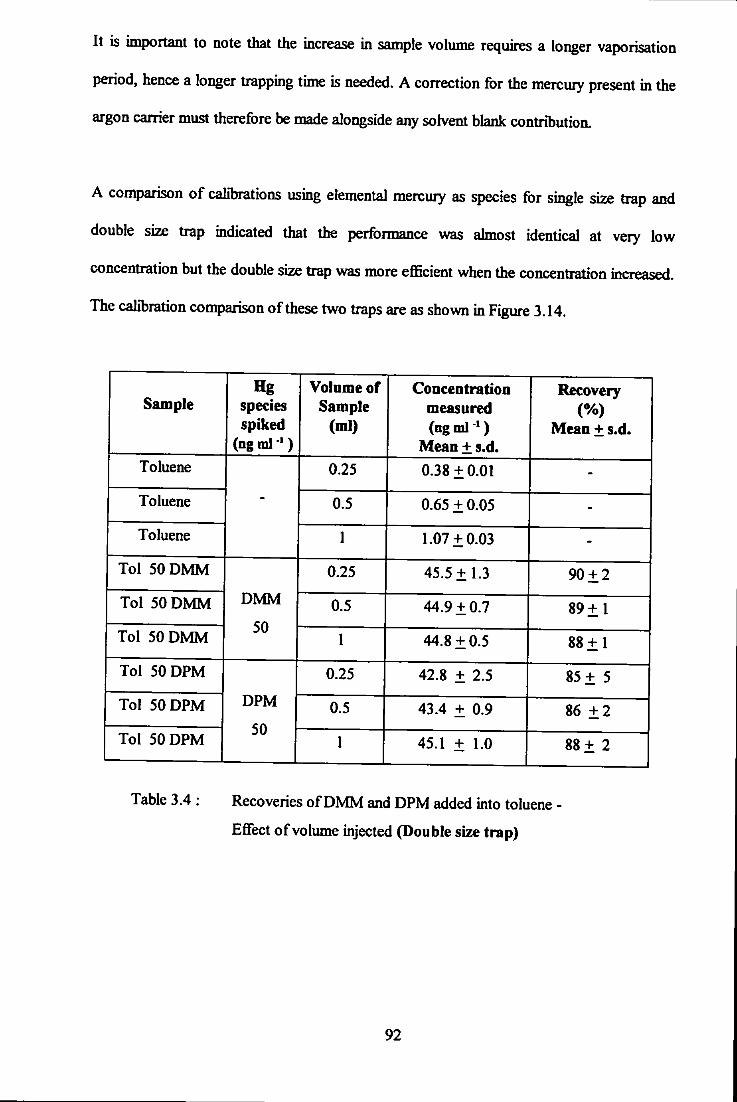
It is important to note that the increase in sample volume requires a longer vaporisation
period, hence a longer trapping time is needed. A correction for the mercury present in the
argon carrier must therefore be made alongside any solvent blank contribution,
A comparison of calibrations using elemental mercury as species for single size trap and
double size trap indicated that the performance was almost identical at very low
concentration but the double size trap was more efficient when the concentration increased.
The cah*bration conqsarison of these two traps are as shown in Figure 3.14.
Sample Hg
species spiked
(ngml ' )
Volume of Sample
(ml)
Concentration measured (ngml «)
Mean + s.d.
Recovery (%)
Mean + s.d.
Toluene
-0.25 0.38 + 0.01 -
Toluene - 0.5 0.65 ±0.05 -
Toluene
-
1 1.07 + 0.03 -
Tol 50DMM
DMM
50
0.25 45.5 + 1.3 90 + 2
Tol 50DMM DMM
50 0.5 44.9 + 0.7 89+1
Tol 50DMM
DMM
50 1 44.8 + 0.5 88+1
Tol 50DPM
DPM
50
0.25 42.8 ± 2.5 85+5
To! 50DPM DPM
50 0.5 43.4 + 0.9 86 +2
Tol 50DPM
DPM
50 1 45.1 + 1.0 8 8 + 2
Table 3.4 : Recoveries of DMM and DPM added into toluene -
Effect of volume injected (Double size trap)
92
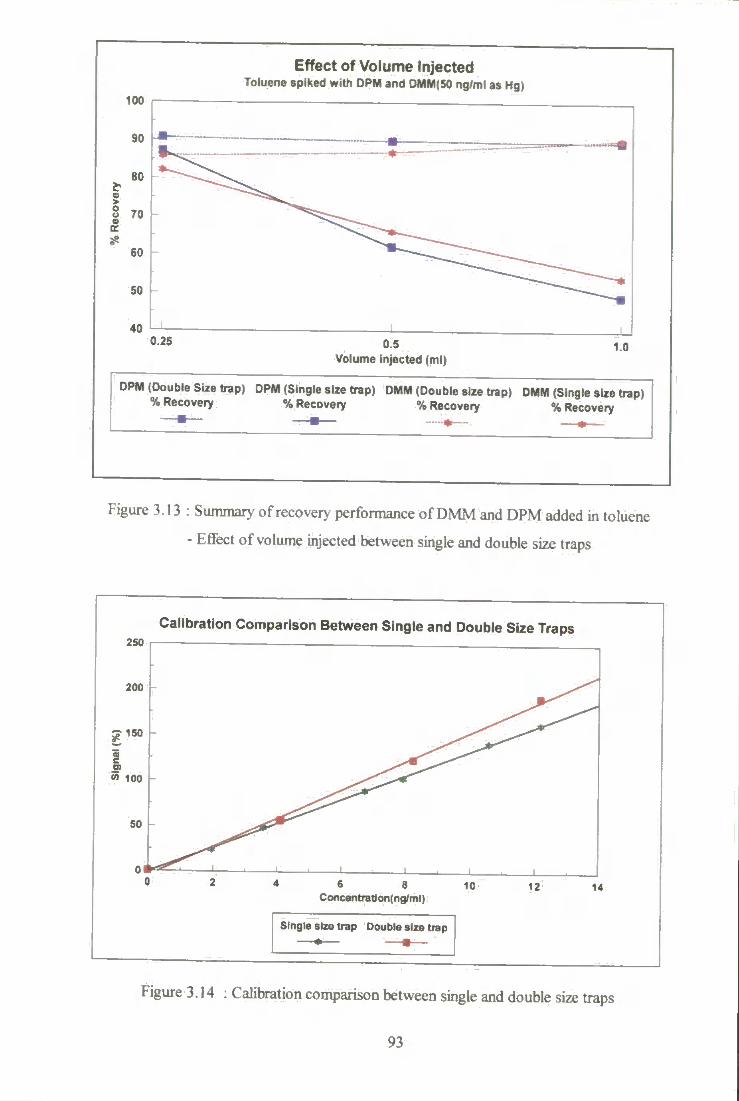
100
Effect of Volume Injected Toluene spiked with DPM and DMM(50 ng/ml as Hg)
0.5 Volume injected (ml)
DPM (Double Size trap) DPM (Single size trap) DMM (Double size trap) DMM (Single size trap) % Recovery % Recovery % Recovery % Recovery
Figure 3.13: Summary of recover>' performance of DMM and DPM added in toluene
- Effect of volume injected between single and double size traps
Calibration Comparison Between Single and Double Size Traps 250
rr 150
w 100
Concentration( ng/ml)
Single size trap Double size trap
Figure 3.14 : Calibration comparison between single and double size traps
93
33.4.5 Recoveries for mercury species added into'real'condensate samples
The recovery of mercury species spiked into 'real* gas condensate samples was evahiated
Two commercial gas condensate samples labelled as BSTB 1/2 and BSTB 3/4, light gas
condensates from different sites were used as a base condensate. The vaporisation
tenq)erature used was 400 °C and was sufficient to v^r i se the samples conq)letety in 10
minutes.
Using the American Standard Testing Material (ASTM) method D86, distillation of
hydrocarbon mixtures, the volatility properties were investigated. The distillation curves are
shown in Figure 3.15. This shows that the condensate has an Initial Boiling Point (IBP) of
about 30 °C and a Final Boiling Point (FBP) of almost 300 ''C. The two condensates
composition, determined using gas chromatography (high performance cross linked
dimethyl siloxane fused silica capillary cohmm, PONA analysis-ASTM D 5134) was foimd
to consist of about 80 isomers/componenls for the sanq)le BSTB 1/2 and 100 conqx)nents
for sample BSTB 3/4; with the following ratio; Paraffins - 58 % wt ( C 3 to Cn), Naphthanes
- 23 % wt (Cs to C 9 ) and Aromatics- 19 % wt (Q to C 1 2 ) . The chromatogram for BSTB
1/2, as an example, is shown in Figure 3.16. The calculation using HYSIS engineering
simulation software estimates that the dew point for a condensate with the above
conqx>sitions at pressure of 101.325 kPa (1 atmosphere), and a ten^rature of 82.49 **C is
sufficient to maintain the condensate matrix in the vapour phase (Figure 3.17). The choice
of a trap temperature of 200 'C ensures an absence of condensate matrix in the liquid
phase, a reduction in blinding of the gold-coated silica active sites by the matrix and a
subsequent increase in efficiency of mercury retention.
Seven species of mercury i.e. DMM, DEM, MMC, EMC. DPM, PMC and MC were
spiked individually at different concentrations i.e. 10, 30 and 50 ng ml (as Hg), into real
94

gas condensates (BSTB). In each experiment, the total mercury content of a condensate
sample was determined and then blank corrected to give the recovery value.
A summarv of the results is shown in Table 3.5. Considering the nature of the condensates,
which are a very complex mixture of volatile hydrocarbons, full and near to full recoveries
were obtained for five out of the seven species (average values >95 %) . One of the two
remaining species gave a reduced but reproduce value, DPM, of 74 to 77 % while the other
species, PMC, ranged between 77 and 85 %. For each given species, the linearity of the
recovery data, in the concentration range covered, was better than r ^ = 0.99. The total
mercury recoveries for mixtures of the seven species added in equal quantities i.e. all 10, or
30, or 50 ng ml are also shown in Table 3.5 and Figure 3.18. These percentage
recoveries were in the range 88 to 97 %.
300
250
200
150
100
Condensate Distillation Curve (ASTM D 86 Method)
J \ i L J L IBP 5 10 20 30 40 50 60 70 80 90 95 FBP
Recovery (%)
BSTB 1/2 BSTB 3/4 — • — — e —
Figure 3.15 : Distillation curves ( ASTM D 86) of BSTB condensates
95
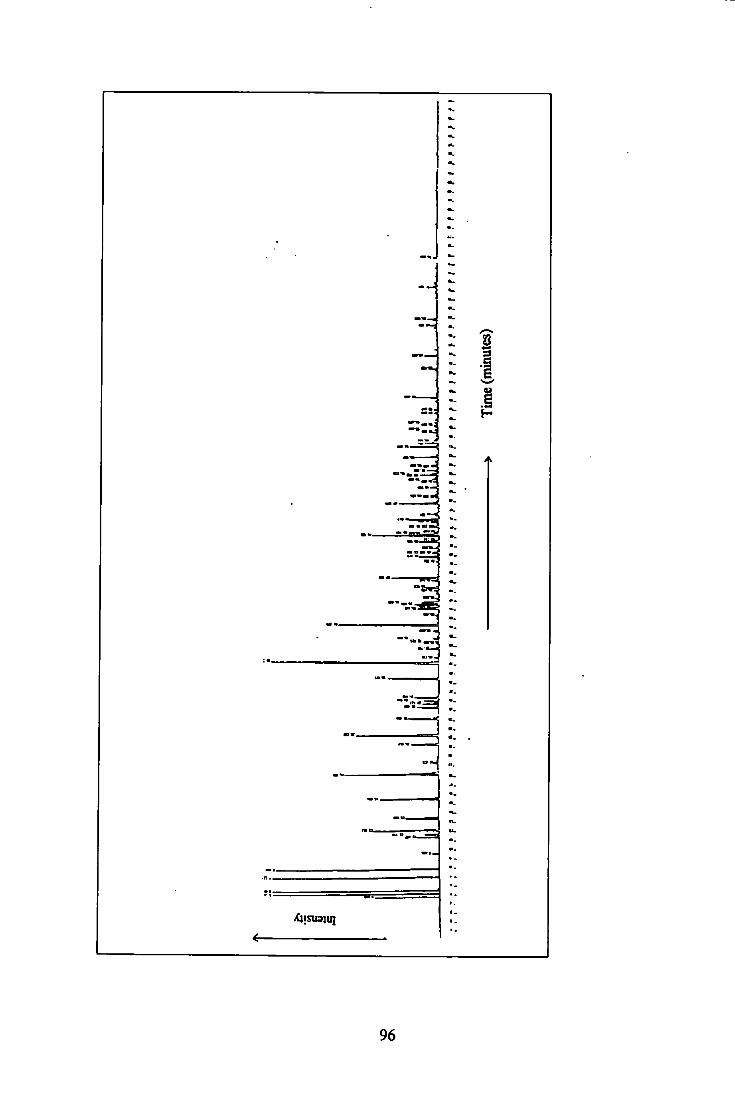
tarn.
<U!Si»jin
96
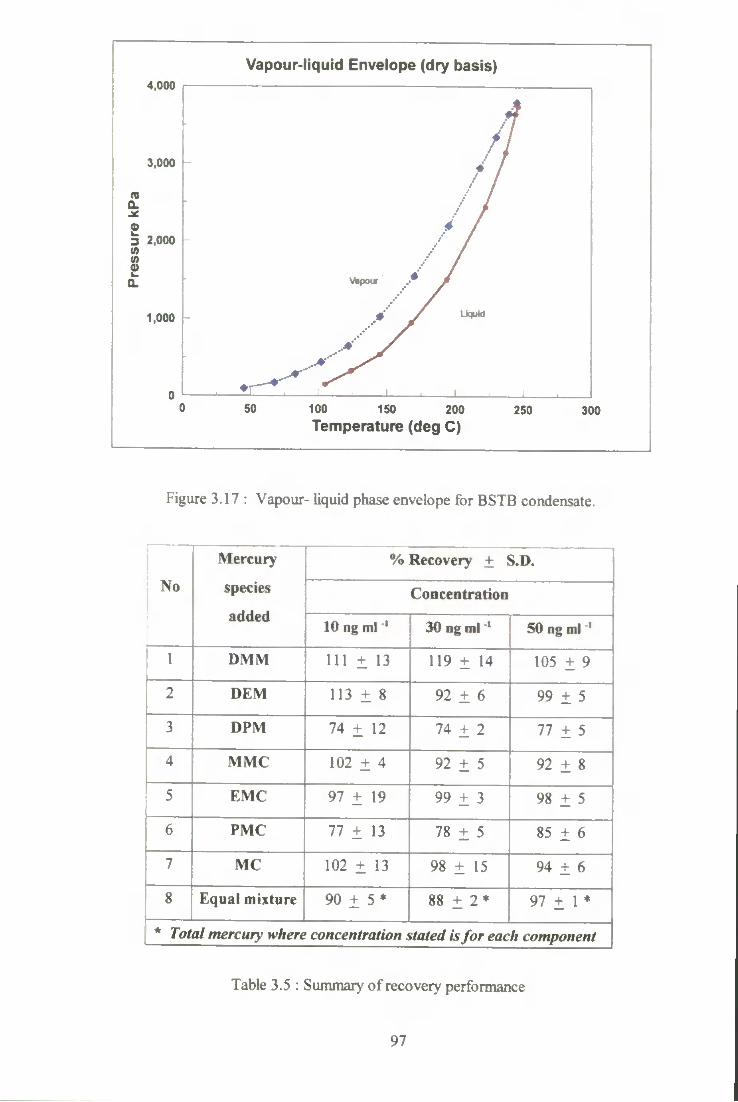
4.000
3.000
03
3 2.000
o
1.000
Vapour-liquid Envelope (dry basis)
100 1 50 200 Temperature (deg C)
250 300
Figure 3.17 : Vapour- liquid phase envelope for BSTB condensate.
No
Mercury
species
added
% Recovery + S.D.
No
Mercury
species
added Concentration No
Mercury
species
added 10 ngml * 30 ng ml * 50 ng ml '
1 DMM 111 + 13 119 + 14 105 + 9
2 DEM 113 + 8 92 + 6 99 + 5
3 DPM 74 + 12 74 + 2 77 + 5
4 MMC 102 + 4 92 + 5 92 + 8
5 EMC 97 + 19 99 + 3 98 + 5
6 PMC 77 + 13 78 + 5 8 5 + 6
7 MC 102 + 13 98 ± 15 94 + 6
8 Equal mixture 90 ± 5 • 88 + 2* 97 + 1 *
* Total mercury where concentration stated is for each component
Table 3.5 : Summary of recovery performance
97

Recovery study
DMM DEM DPM HMC EMC PMC Hg Speciea SPIKED {ng/ml)
MC MIX
lOngfrnI H SOngftnl • SOngftrt
Figure 3.18: Summary of Recoveries study
3.3.4.6 Precision of the experimental technique
To determine the precision of the experimental set-up, the total mercury content was
measured 10 times in (i) toluene, (ii) a commercial condensate (TCI23) and (iii) a
condensate (TCI23) with three different type of mercury compound, each added at the
lOng ml •* Hg level. The three types of mercury compound were based upon organohalide,
di-alkyl and inorganic species. These were represented by EMC, DEM and MC.
The mercury content for the toluene (0.25 ml injected) was 6.4 + 0.2 ng ml For the
condensate TCI23 alone, the mercury value was 7.45 ± 0.34 ng ml"*. The relative standard
deviation (RSD) for the analyses were 3.7 % and 4.8 % respectively. The consistency of
the analyses i.e. toluene and condensate alone are shown in Figure 3.19.
98

For the condensate TCI 23 spiked with 10 ng ml ' (as Hg) of the three species, the total
mercury content was determined as 17.55 ± 0.35 ng ml ' (EMC), 17.28 ± 0.62 ng ml •
(DEM) and 18.04 ± 0.86 ng ml ' (MC) showing the RSD to be between 2 and 5 %. It is
of note that the recovery values for these spiking experiments with condensate were 105,
101 and 98 % respectively (RSD between 4 and 7 %). A summar>' of the recoveries for the
three types of mercur>' species added to TC 123 condensate is as shown in Figure 3.20.
3.3.4.7 Conostan mercury standard for oil analyses
For the determination of mercury in higher boiling point oils and similar petroleum
products, a suitable mercury standard is required which can be used for the standard
addition technique. Conostan mercury- standard is employed in oil analysis and is a mercurv
dialkyldithiocarbamate compound (Hg-S bonded) dissolved in white base (paraffin) oil.
This species was spiked 10 times into condensate at the 10 ng ml ' level. These results are
shown in Figure 3.21 and demonstrate that the recovery was 88 + 5 % .
Total Mercury in Toluene and Condensate (TC 123)
5 6 no of ropllcatos
T C 1 2 3 Toluene 7.5 + 0.3 ng/ml 6.4 * 0.2 ng/ml
Figure 3.19 : Total mercury content in Toluene and TCI23 Condensate
99
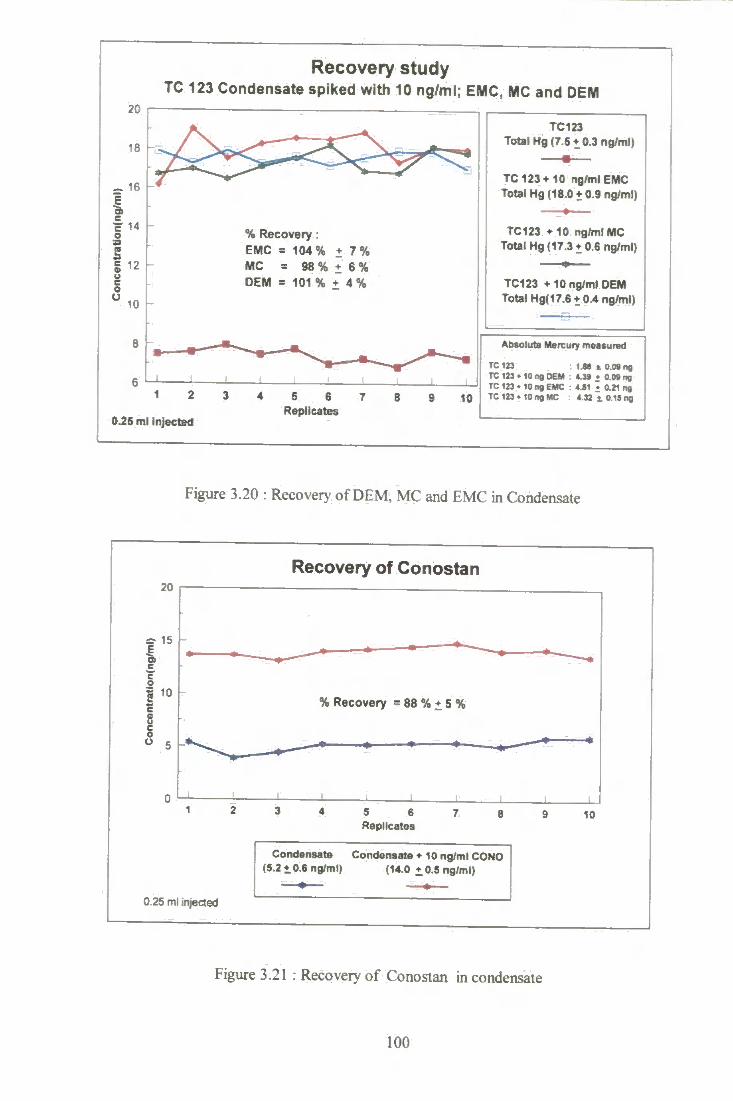
Recovery study TC 123 Condensate spiked with 10 ng/ml; EMC, MC and DEM
20
^ 16
c 14 o
g 12
10
1 2
0.25 ml injected
% Recovery : EMC = 104% + 7% MC = 98 % 1 6 % DEM = 101 % + 4 %
4 5 6 Replicates
TC123 Total Hg (7.6 • 0.3 ng/ml)
TC 123* 10 ng/ml EMC Total Hg (18.0 10.9 ng/ml)
TCI23 -HO ng/ml MC Total Hg (17.3 1:0.6 ng/ml)
TC123 +10 ng/ml DEM Total Hg(17.6 + 0.4 ng/ml)
10
Absoluts Msrcury msssursd
TC 123 : 1 M t 0.09 ng TC 123 * 10 ng OEM 4.39 * 0.09 ng TC 123 • 10 ng EMC : 4J1 • 0.21 ng TC123»10ngMC : 4.32 t 0.16 ng
Figure 3.20 : Recovery of DEM, MC and EMC in Condensate
20
15
I 10
o o c o « 5
0 25 ml in/ected
Recovery of Conostan
% Recovery = 88 % ±S%
5 6 Replicates
Condensate Condensate • 10 ng/ml CONO (5.2 10 .6 ng/ml) (14.0 • 0.5 ng/ml)
10
Figure 3.21 . Recovery of Conostan in condensate
100
3.3.4.8 Detection limits
The detection limits that can be obtained from the current method depend to some extent
upon the conq)lexity of the condensate ssmplt Le. the volatility of both the condensate and
the mercury species in the sample, together with the effect of any sample matrix interacting
with the trap. From recovery data given in Figure 3.20, the absolute detection limits for the
method (based on three times the standard deviation) were 180 pg for tohiene and 270 pg
for TCI23 condensate. For three different mercury species added to the TO 123
condensate, the absolute detection limits were 270 pg for DEM, 450 pg for MC and 630 pg
for EMC. When based on the system alone, without sample introduction but monitoring
the carrier gas (argon) the absolute limit of detection is reduced to 11 pg (n = 6).
3.3.4.9 Total mercury content in commercial condensate
Five types of natural gas condensate, obtained from several sources were analysed for total
mercury. The results indicated that the concentration of the mercury is independent of
'location' and type' of condensate. The total mercury concentrations of the condensate
samples BSTB 1/2, BSTB 3/4, TC 123, TC 604 and TC 102 are shown in Table 3.6. The
relative standard deviation for the analyses are in the range 4 to 7 % for a 0.25 ml manual
sample injection. The consistency of the determinations are shown in Figure 3.22.
101
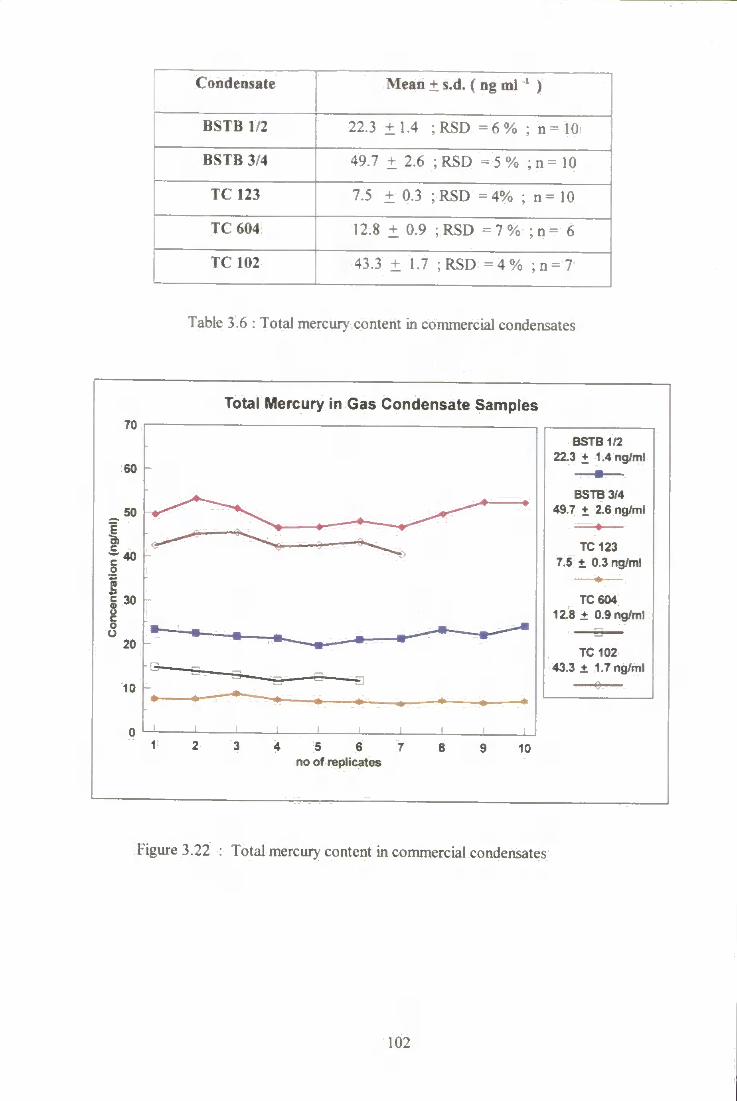
Condensate Mean ± s.d. ( ng ml ' )
BSTB 1/2 22.3 ±1.4 ;RSD = 6% ; n= 10
BSTB 3/4 49.7 ± 2.6 ;RSD = 5% ;n = 10
TC 123 7.5 ± 0.3 ;RSD =4% ; n = 10
TC 604 12.8 ± 0.9 ;RSD = 7% ;n= 6
TC 102 43.3 ± 1.7 ;RSD = 4% ; n = 7
Table 3.6 : Total mercur\' content in commercial condensates
70
60
Total Mercury in Gas Condensate Samples
4 5 6 7 no of replicates
10
BSTB 1/2 22.3 + 1.4ng/ml
BSTB 3/4 49.7 + 2.6 ng/ml
TC123 7.5 t 0.3 ng/ml
TC604 12.8 ± 0.9 ng/ml
TC102 43.3 ± 1.7 ng/ml
Figure 3.22 : Total mercury content in commercial condensates
102
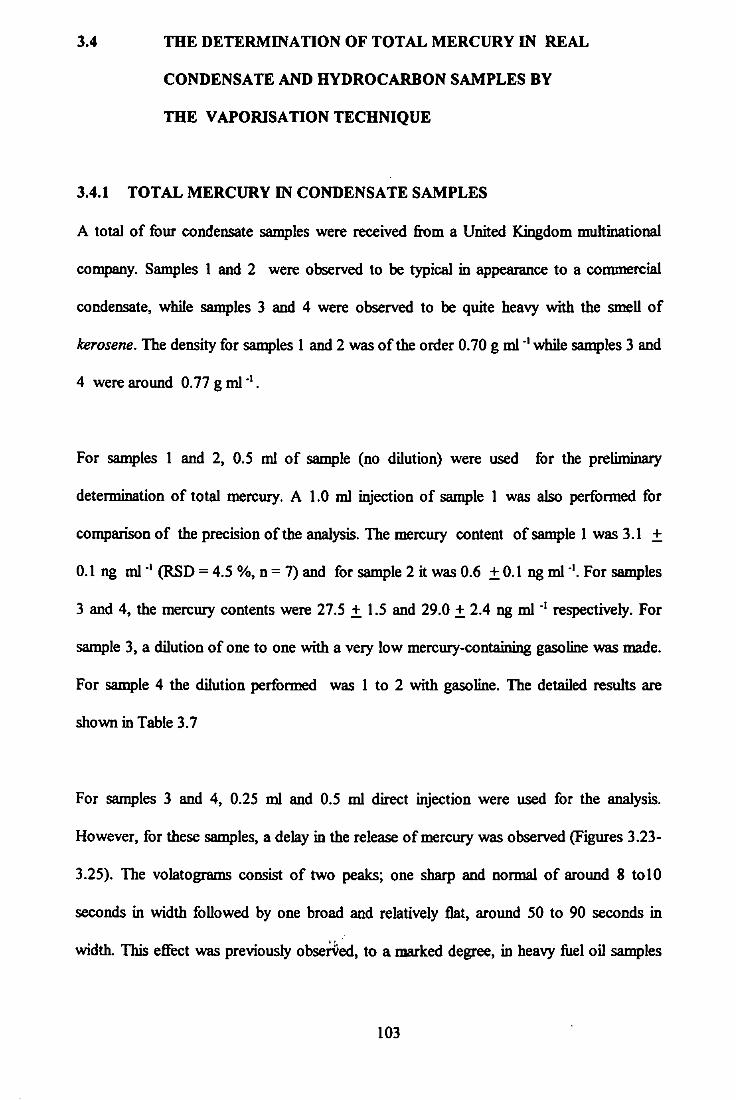
3.4 THE DETERMINATION OF TOTAL MERCURY IN REAL
CONDENSATE AND HYDROCARBON SAMPLES BY
THE VAPORISATION TECHNIQUE
3.4.1 TOTAL MERCURY IN CONDENSATE SAMPLES
A total of four condensate san^les were received from a United Kingdom multinational
company. Samples 1 and 2 were observed to be typical in appearance to a commercial
condensate, while samples 3 and 4 were observed to be quite heavy with the smell of
kerosene. The density for samples 1 and 2 was of the order 0.70 g ml ' while san:q)les 3 and
4 were around 0.77 g ml**.
For samples 1 and 2, 0.5 ml of sample (no dilution) were used for the preliminary
determination of total mercury. A 1.0 ml injection of sample 1 was also performed for
comparison of the precision of the analysis. The mercury content of sanqjle 1 was 3.1 +
0.1 ng ml * (RSD = 4.5 %, n = 7) and for san^le 2 it was 0.6 +0.1 ng ml For samples
3 and 4, the mercury contents were 27.5 + 1.5 and 29.0 + 2.4 ng ml * respectively. For
sample 3, a dilution of one to one with a very low mercury-containing gasoline was made.
For sample 4 the dilution performed was 1 to 2 with gasoline. The detailed results are
shown in Table 3.7
For san^les 3 and 4, 0.25 ml and 0.5 ml direct injection were used for the analysis.
However, for these samples, a delay in the release of mercury was observed (Figures 3.23-
3.25). The volatograms consist of two peaks; one sharp and normal of around 8 tolO
seconds in width followed by one broad and relatively flat, around 50 to 90 seconds in
width. This effect was previously observed, to a marked degree, in heavy fiiel oD san^les
103
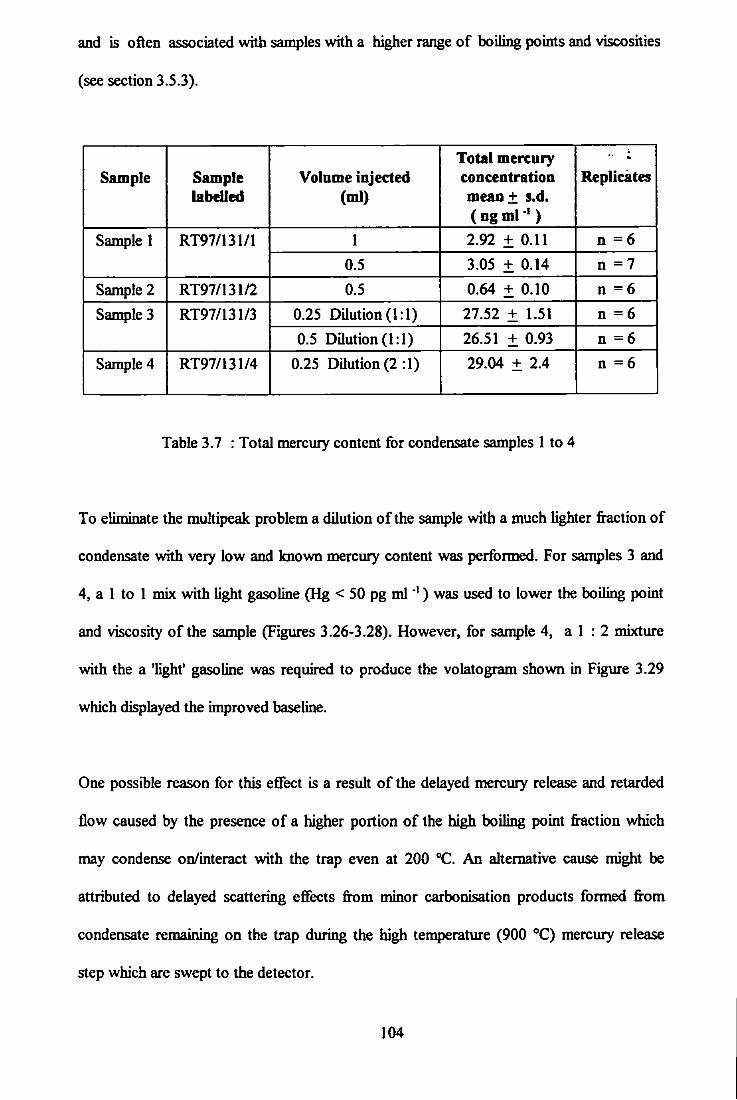
and is often associated with samples whh a higher range of boiling points and viscosities
(see section 3.5.3).
Sample Sample UbeUed
Volume injected (ml)
Total mercury concentration mean+ s.d. (ngml »)
Replicates
Sample 1 RT97/131/1 1 2.92 + 0.11 n =6 Sample 1 RT97/131/1 0.5 3.05 ± 0.14 n =7
Sanq)le 2 RT97/131/2 0.5 0.64 + 0.10 n =6 Sample 3 RT97/131/3 0.25 DUution(l:l) 27.52 ± 1.51 n =6 Sample 3 RT97/131/3
0.5 Daution(l:l) 26.51 + 0.93 n =6 Sample 4 RT97/131/4 0.25 DUution(2:l) 29.04 + 2.4 n =6
Table 3.7 : Total mercury content for condensate samples 1 to 4
To eliminate the multipeak problem a dilution of the san jle with a much lighter fraction of
condensate with very low and known mercury content was performed. For samples 3 and
4, a 1 to 1 mix with light gasoline (Hg < 50 pg ml *) was used to lower the boiling point
and viscosity of the sample (Figures 3.26-3.28). However, for sample 4, a 1 : 2 mixture
with the a 'light* gasoline was required to produce the volatogram shown in Figure 3.29
which displayed the improved baseline.
One possible reason for this effect is a result of the delayed mercury release and retarded
flow caused by the presence of a higher portion of the high boiling point fraction which
may condense on/interact with the trap even at 200 °C. An alternative cause might be
attributed to delayed scattering eflfects from minor carbonisation products formed from
condensate remaining on the trap during the high temperature (900 ®C) mercury release
step which are swept to the detector.
104
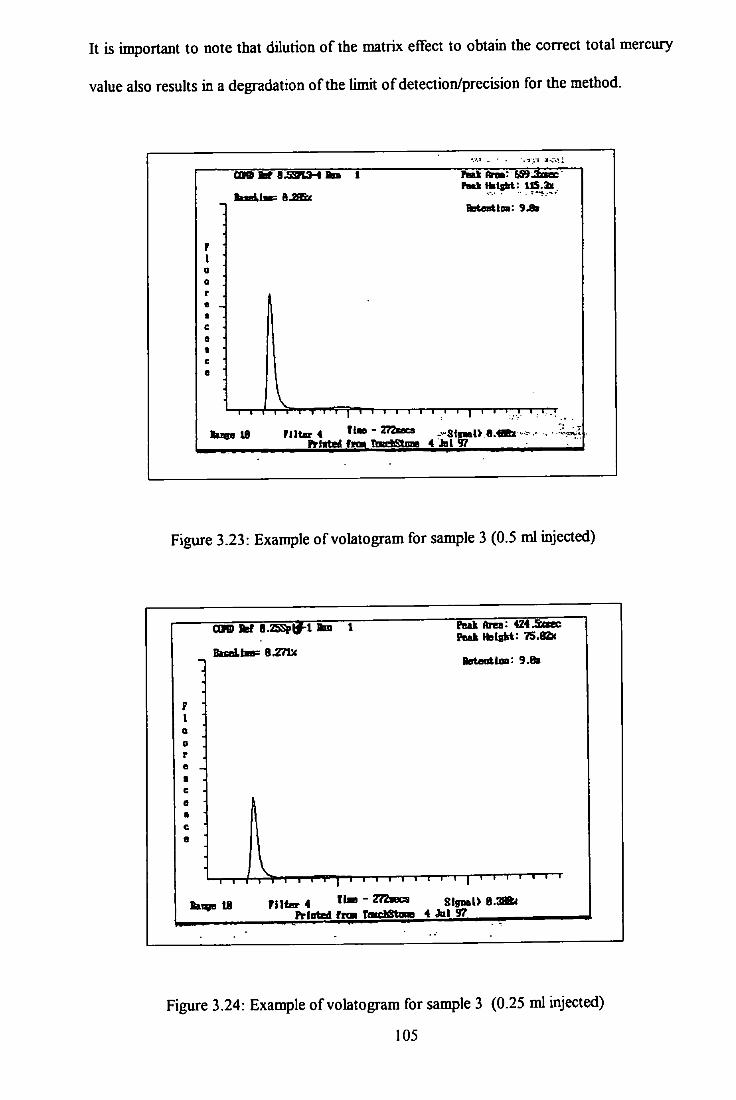
It is important to note that dilution of the matrix effect to obtain the correct total mercury
value also results in a degradation of the Umit of detection/precision for the method.
f 1
Peak t n : fJS9J3aeo Pwk Ifalsbt: IQ.ax
tetastlcBi: 9.81
V 1—I r I T*T" T 'T ' T ] I I I I I I I I I I ! . 1 1
_ M f t r i Ifan TBartStDM 4 Jal ^
Figure 3.23: Example of volatogram for sample 3 (0.5 ml injected)
COD V 6.2SS|>tf-l Bm 1
B.Z71X
F 1
o -I
Peak Area: 4Z4.Sttec Peak HBISH: 75.fl2c
Betaalloa: 9.Cb
I I I I I I I I I I I I I ' I ' Bai«e I B FUter 4 ' S I B « 1 > 8 . 3 »
Printed f f q i tbHJf l tooB 4 Jai 97
Figure 3.24: Example of volatogram for sample 3 (0.25 ml injected)
105

-GQND Asf B.S^14-10 Am 1 Pttktfta*- 968:teac ' :
BstortloB* 8*Si
r I • ' •••• ^ ' -R:
a r fl -« c • a D
C
e ' V 1 1 T 1 1 1 1 1 1 ,| 1 1 !*• 1 1 1 1 1 1 1 1 1 1 1 1 1 1
^ IB Flltep 4 " 272»cs Ptlnted frai TnurWgtnwa
Sl9iiat> 1.6BBSC 3 Jal97
Figure 3.25 : Example of volatogram for sample 4 (0.5 ml injected)- no dilution
COKD M a.5(2X)S4-2 ftu 1
T—r
Psak HBlsht: 35.U:<
HotoBtloa: 8.Si
T I I t I I I • > I • < ' ' ' ' 1
Bai^alB m t « r 4 T l« - 272aBCS ^ 8 i™l> B.ZHb Printrf froi ro«Ji8faiOD 3 Ait 9?
Figure 3.26 : Example of volatogram for sample 4 (0.5 ml injected) - dilution 1 : 1
106

coo M B^(2X)S3-4 Ban 1
BBsdaaB= BJBBBC
Peak Area: SZl.lxsec
BBtoniloo* 9.Bi
1 I r I T - i I 1 I I I I I I I I I I ' I '
Muted inm toccMtogB 4 JBU97^
Figure 3.27: Example of volatogram for sample 3 (0.25 ml injected) - dilution 1 : 1
c m M B^C2X>S3-8 ftn 1 Peak ftrea: it9.2»ec Peak Hsight: eS.GBsc
RBtentloD: 9.8*
I r 1 T
TtM - Z72SBC8
PK-lotoa it%m ttaucWtnnn 6 Jdt 97 RAT«B 10 Piltar4 Signal) 9.ZBte
Figure 3.28: Example of volatograra for sample 3 (0.5 ml injected)
(dUution 1 : 1)
107
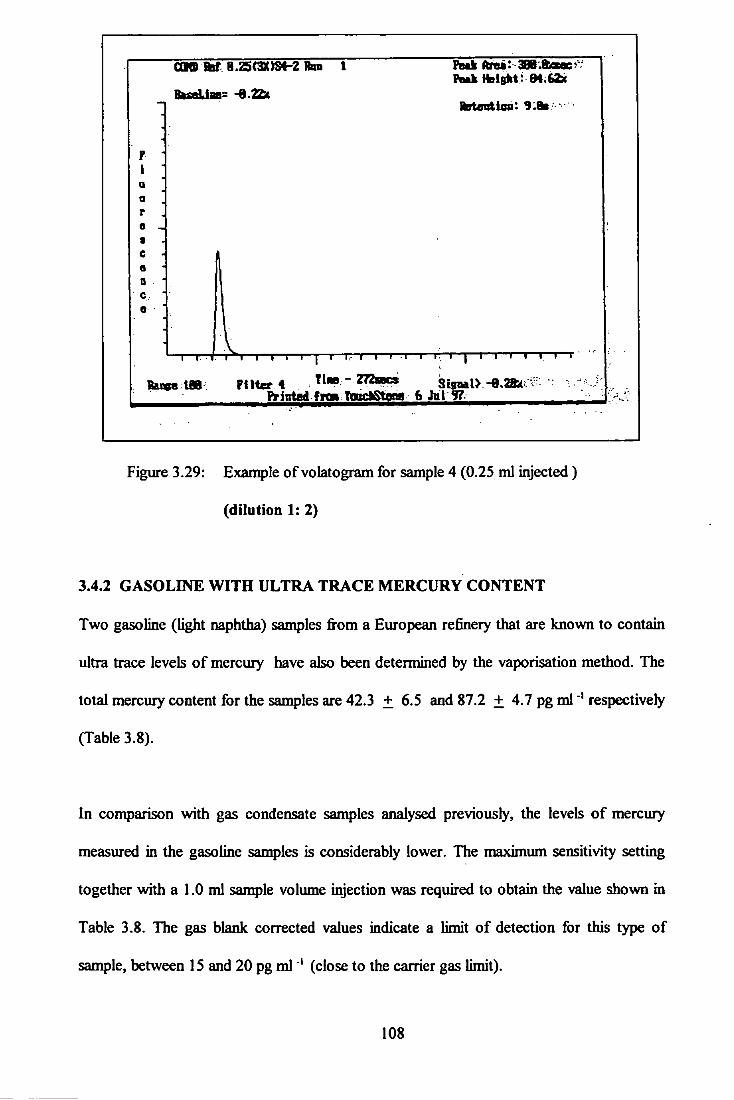
CORD M B.25(3X)S4-2 Ron 1
Bksd.iB8= -B.22C
? 1 0 o r a -4 % c a 0 c e
fatentloa: 9.ai
T—r T — I — I — I — p n — r * T — I I 1 — I — r - i — p I I I I I — r
PUter 4 Tim - 272»C3
Printed f r o TottcfcStona 6 Jal ^
Figure 3.29: Example of volatogram for sample 4 (0.25 ml injected)
(dilution 1: 2)
3.4.2 GASOLINE WITH ULTRA TRACE MERCURY CONTENT
Two gasoline (light naphtha) samples from a European refinery that are known to contain
ultra trace levels of mercury have also been determined by the vaporisation method. The
total mercury content for the samples are 42.3 + 6.5 and 87.2 + 4.7 pg ml ' respectively
(Table 3.8).
In comparison with gas condensate samples analysed previously, the levels of mercury
measured in the gasoline samples is considerably lower. The maximum sensitivity setting
together with a 1.0 ml sample volume injection was required to obtain the value shown in
Table 3.8. The gas blank corrected values indicate a limit of detection for this type of
sample, between 15 and 20 pg ml(close to the carrier gas limit).
108

Sample Mercury contents
(pg ml limit of detection
(pg ml Replicates
Gasoline 1 42.3 ±6.5 19.5 10
Gasoline 2 87.2 + 4.7 14.1 7
Table 3.8 : Total mercury in gasoline samples
3.4.3 TOTAL MERCURY CONTENT IN HEAVY OILS
3.4.3.1 Effect of matrix on the precision
As a study to investigate whether a heavier fraction oil sample could also be analysed for its
mercury content with this system, two commercial Tieavy gas oil' samples, A and B, with
boiling points of between 260 °C and 538 °C were obtained.
The san: )les were found to be of the very heavy dark coloured fuel oil type. Severe
matrix effects were evident when direct injection and low ratio dilution ( 1 : 4 ) injections
with toluene of the oil was performed. This resulted in multq)eaked, mercury-delayed
volatograms. Hence for this analysis, several dilution ratios with toluene were carried out
i.e. fectors of 5, 20 and 50. Sample B was chosen for the above dilution exercise. For
sample A, a dilution of 100 times was used (since this sample was found to be more viscous
than sample B). In each case 0.25 ml of sample was used.
The results show that for the 5 times dilution, the measurement suffered from poor peak
shape, a raised tail and base line. The total mercury measured was relatively higher than
normally encountered, in the ^ig ml range. This result is shovm in Table 3.9 and an
example of the peak signal for a 5 times dilution is as shown in Figure 3.30.
109
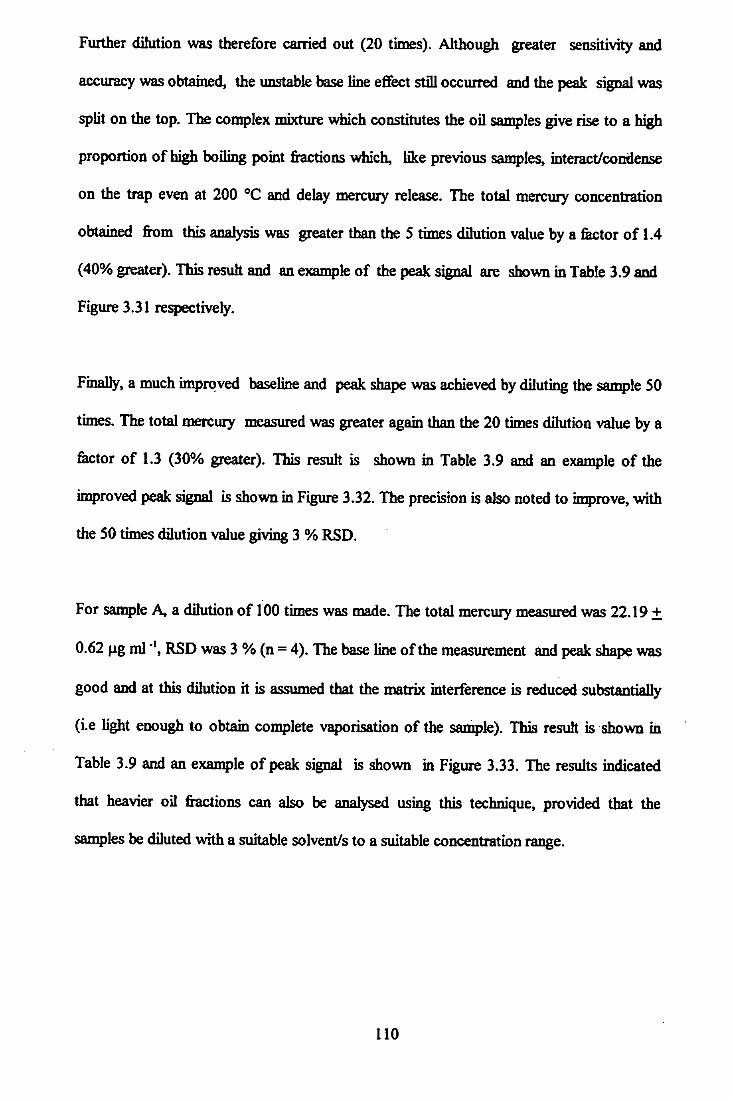
Further dilution was therefore carried out (20 times). Although greater sensitivity and
accuracy was obtained, the unstable base line efifect still occurred and the peak signal was
split on the top, T l ^ complex mixture which constitutes the oil samples give rise to a high
proportion of high boiling point fractions which, like previous sanq)les, interact/condense
on the trap even at 200 'C and delay mercury release. The total mercury concentration
obtained from this analysis was greater than the 5 times dilution value by a &ctor of 1.4
(40% greater). This resuh and an exan^le of the peak signal are shown in Table 3.9 and
Figure 3.31 respectively.
Finally, a much improved baseline and peak shape was achieved by diluting the san:q>le 50
times. The total mercury measured was greater again than the 20 times dilution value by a
fector of 1.3 (30% greater). This result is shown in Table 3.9 and an example of the
in^roved peak signal is shown in Figure 3.32. The precision is also noted to improve, with
the 50 times dilution vahie giving 3 % RSD.
For san^le A« a dilution of 100 times was made. The total mercuiy measured was 22.19 +
0.62 ^g ml RSD was 3 % (n = 4). The base line of the measurement and peak shape was
good and at this dilution it is assumed that the matrix interference is reduced substantially
(i.e light enough to obtain con: )lete vaporisation of the sai^le). This result is shown in
Table 3.9 and an exan^le of peak signal is shown in Figure 3.33. The results indicated
that heavier oil fractions can also be analysed using this technique, provided that the
sanQ>les be diluted with a suitable solvent/s to a suitable concentration range.
110
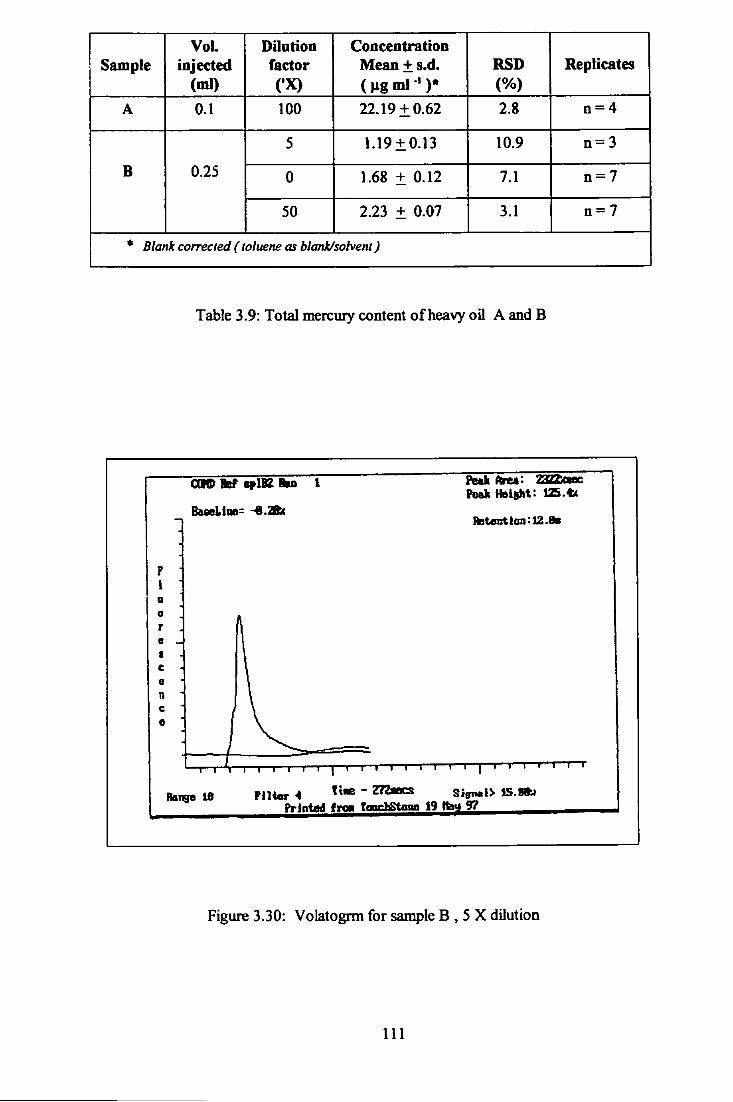
Sample VoL
injected (mJ)
Dnation factor (•X)
Concentration Mean + s.d. (Hgml ' )*
RSD (%)
Replicates
A 0.1 100 22.19 + 0.62 2.8 n = 4
B 0.25
5 1.19 + 0.13 10.9 n=3
B 0.25 0 1.68 + 0.12 7.1 n = 7 B 0.25
50 2.23 ± 0.07 3.1 n=7
* Blank corrected (toluene as blank/solvent)
Table 3.9: Total mercury content of heavy oil A and B
com W aplBZ %D 1
BaseLino= -%Jm Peak Height: 125.4x
RDteDtlon:12.8s
1 I ' i I I I I I I I I I I I I I ' ' ' ' • '
X\m - ZTZiocs Printed froa ToachStinia 19 97
Rdi^ IB F»t«r 4 - * SJff».l> IS. if t i
Figure 3.30: Volatogrm for sample B , 5 X dilution
111
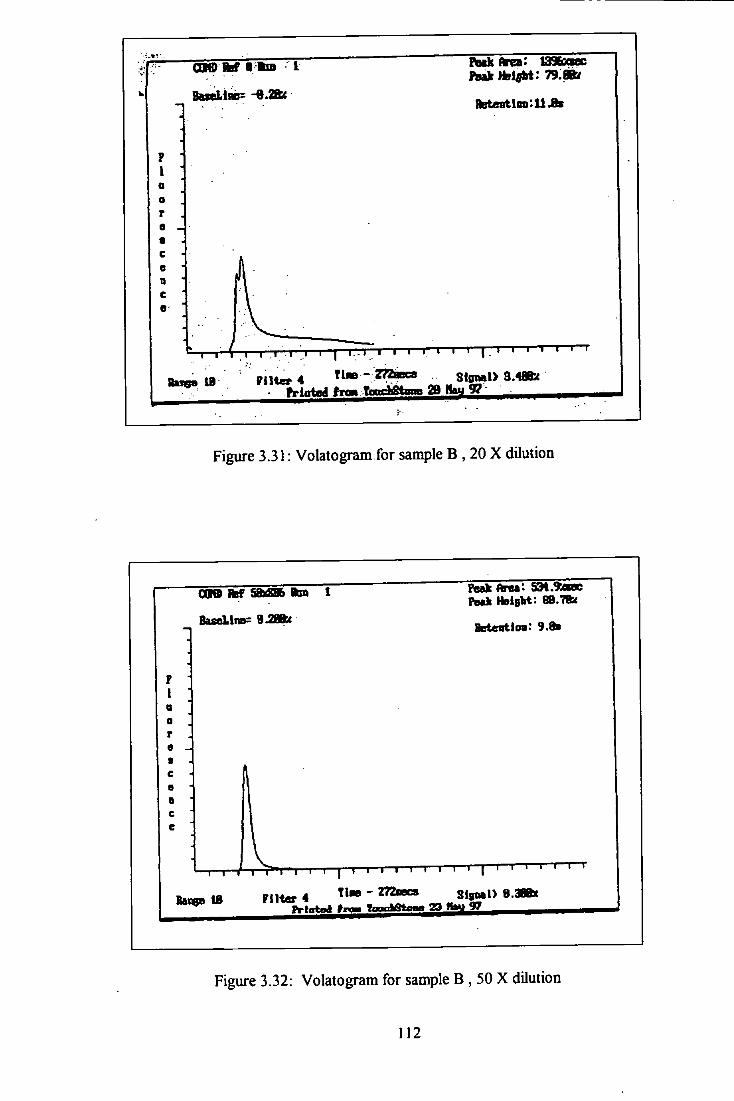
BB«iLlBB= -e.2Bx
Folk Area: 139teeo Pbak»faUrH: 79.ttr
SeteBtloD-.UA
I I ( \ I I I • I I ' * . i I • I I » ' I ' ' ' ' ' ' '
IB PniM'4 T l » B - 27Zaoc8 S1gral> a.4BBx
Figure 3.31: Volatogram for sample B , 20 X dilution
COO M to 1
BaseLliB^
Foak A m : SM.Sxsoc
Brtentloa: 9.8i
Bai e 10 P l l t e 4 " _ Sfgjil> 8
Figure 3.32: Volatograra for sample B , 50 X dilution
112
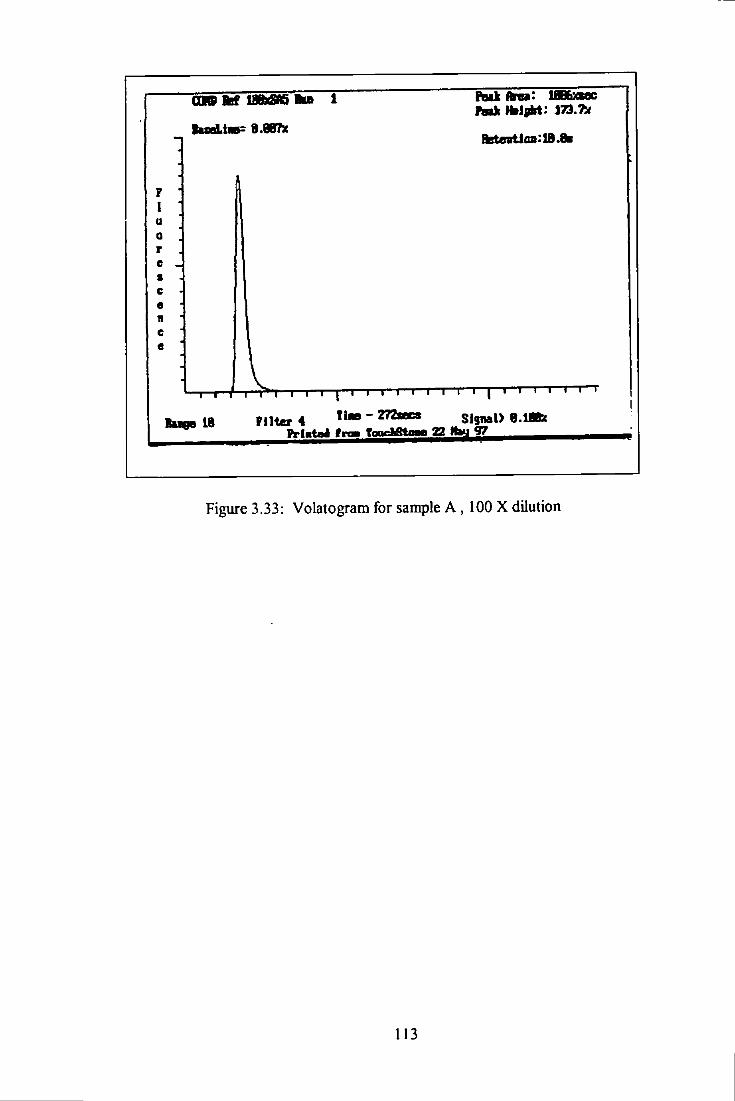
Bet0BU(iB:iB.8B
I I I I T TlMB - 272SBCS
I I 1 I
IB Filter 4 " Signal) B.lBfct Mmtoi tram TopcMtn-i 22 »hu 97
Figure 3.33: Volatogram for sample A , 100 X dilution
113

3.5 CONCLUSIONS
A relatively rapid, simple accurate and precise technique has been developed for the
determination of total mercury in gas condensates and other liquid hydrocarbons. The
technique comprised a 250 ml glass vaporisation vessel, held at 400 °C into c h a snxnpk
was injected (0.1 to 1.0 ml). The samplt vapour was directed with argon carrier gas via a
heated transfer line, to a gold-coated silica trap maintained at 200 ^C. it was shown that all
nine mercury species used in the study were adsorbed eflSciently and retamed on the trap,
while the complex hydrocarbon matrix was carried away to waste. When the trap
temperature was raised to 900 **C, elemental mercury was rapidly released and carried, with
argon gas, to the atomic fluorescence detector for measurement.
For the high efficiencies of species adsorption to be maintained when higher sanqjle
volumes were used (>0.25 ml), a double-sized trap was required together with longer
vaporisation times (5 to 10 minutes). Despite scavenger tubes being on-line for all argon
gas flows, mercury blanks in the gas had to be considered on a time fector basis. An argon
carrier flow rate of less than 400 ml min ** was found to be necessary.
Recovery values of over 90 % were generally obtained for eight mercury species spiked
into tohiene and 'real* condensate in the 10 to 50 ng ml ** range. These species were DMM,
DEM, DPM, MMC, EMC, PMC, MC and CONG. Precision studies using spiked
condensate (DEM) gave a limit of detection of 270 pg (absolute) equivalent to 1 ng ml
(0.25 ml sanqjle).
Five san^les of 'real* gas condensate gave total mercury values in the range 7.5 to 50 ng
ml '. The technique was extended to look at mercury content of the 'light fraction' of
114
gasolines at the ultra-trace level (< ng ml''). Sample volumes of 1.0 ml were required and
values for total mercury in the two sanq)les ranged from 42 to 87 pg ml ' \
It was noted that v^en 'higher fraction' oils were introduced directly as samples to the
vaporisation chamber, the high boiling point components could cause interferences in the
release of mercury from the trap later on in the cycle. Dilution of 20 to 100 times with a
suitable solvent such as tohiene was necessary to increase the volatility of the sample and to
reduce the high mercury content of the sample to the range required. The heavy gas oil
samples gave values of 2 to 22 jig ml ** for total mercury content, approximately 22,000
times higher than the gas condensate samples and some 4 x 10 ^ times higher than the
gasoline samples. This displays the wide range in concentration and flexibility of sample
that the technique can tolerate.
115

CHAPTER 4
M E R C U R Y SPECIATION IN NATURAL GAS CONDENSATE B Y GAS CHROMATOGRAPHY COUPLED WITH ATOMIC F L U O R E S C E N C E SPECTROMETRY.
CHAPTER 4
MERCURY SPECIATION IN NATURAL GAS CONDENSATE
BY GAS CHROMATOGRAPHY COUPLED WFIH ATOMIC
FLUORESCENCE SPECTROMETRY
4,1 INTRODUCTION
Knowledge of total mercury content and the different species present in natural gas
condensate is extremely in^rtant. Mercury in most forms is highly toxic and, particularly
when present as the organomercury species, is a cause of great environmental concern.
The types of mercury species in environmental samples are in the forms of inorganic
mercury, organomercury halide and dialkyl- and diaryl-mercury.
The damage caused to industrial plants particularly petrochemical plants by the presence of
certain mercury species can be financially crippling especially when unscheduled
shut-downs are forced. Information on the species content is vital for the development,
improvements and monitoring of the performance of newly developed or commercially
available mercury removal systems. This is due to the mercury species content being unique
to each condensate, i.e. the species contents depend very much on the origin of the
condensate aiMl stage of process.
The effect &om mercury in petroleum products upon the industry was first reported in 1973
in Algeria, The inqjlications were discussed in detail in chapter 1, sections 1.2.1 and 1.2.2.
Mercury may be present in natural gas condensate in its metallic form and/or as
organometallic oon^unds with boiling point con^)arable to that of the range of the
116

condensate (7,12) shown in Table 1.4, Chapter 1. The elemental mercury content in liquid
hydrocarbon or gas condensate may be in the range of about 10 % or less of the total
mercury in the sangjles due to the high volatility and the low sohibility of elemental
mercury (12),
Other species such as organomercury halide and inorganic salts (polar compounds) may
also be present but at a lower concentration in the non-poiar condensate matrix. The
presence of these species is likely to be associated with nnpurities, such as particulate
matter (which are likely to adsorb mercury species) or the moisting or free water in the
sample.
To date, a complete and rapid technique for the identification and quantification of all the
mercury species content in natural gas condensate is not well established. Various papers
report the speciation of mercury in hydrocarbons and gas condensate but most are targeted
at single or a few species of interest (9,77,78).
The majority of papers are focused on aqueous-based and related environmental sanqjles
rather than the complex and hydrophobic, liquid hydrocarbon sample type. For separation
of the species, chromatographic techniques are most commonly used including gas
chromatography, high performance liquid chromatography and ion chromatography. For
detection of mercury, the detection systems used are either electron captured detector
(ECD), microwave induced plasma-atomic emission spectrometry (MIP-AES), atomic
absorption spectrometry (AAS) or atomic fluorescence spectrometry (AFS). The analytical
technique most commonly used in earlier studies for determination of organomercury
compounds in environmental sanq)les was gas chromatography using electron capture
detection (GC-ECD) (169-174). Speciation techniques have involved derivatization by
117

butylation (175-176), aqueous phase ethylation (93, 172, 182) or hydridization (180) prior
to chromatographic separation and coupled with microwave-induced plasma (MIP),
GC-MS, GC-ICP-MS, GC-MIP-AES. CVAAS and CVAFS, for mercury detectioa These
procedures can be time consuming, can lead to contamination of analytes and losses during
the procedure and the derivatized products may not necessarily reflect the actual
concentration of the various organic mercury species native to the samples.
The determination of methyl mercury and ethyl mercury compounds in sediments by
capillary GC-AFS that eliminates any derivatization techniques was reported. The
procedure was a direct solvent extraction of organomercury conq>ounds from sediments
with dichloromethane after digestion with acidic potassium bromide and copper sulphate
followed by GC -AFS (177). Atomic fluorescence offers the potential of greater accuracy,
reliability and sinqjlicity of operation conq)ared with the other detection techniques
mentioned above (93,170,181).
Other examples of the utilisation of gas chromatography mclude, the determination of
mercury species in air by GC coupled with AFS using a carbotrap column (93) and the
determination of mercury species in humic rich water by GC-MIP-AES after conq lexation
with diethyldithiocarbamate and butylation with a grignard reagent (89).
Speciation through separation using liquid chromatography (LC) or high performance
liquid chromatography (HPLC) before determination of mercury by cold vapour AAS has
been a preferred method used in environmental and water san: )les. Examples include the
speciation of MC, MMC and EMC in waste water using a STR-ODS-H (5|im) column
after preconcentration with Develosil-ODS and elution with cysteine-acetic acid (185);
speciation of inorganic and methyl-mercuiy* by on-line preconcentration by silica Cis
118

cohimn after con^lexation with chelate forming reagents (diethyldithiocarbamate,
pyrolidin-l-yl-dithioformate and diphenyl thiocarbazone) coupled with CVAAS (186) and
LC coupled with CVAAS with continuous flow reduction for alkanes thiolates and NaBH4
reduction of inorganic, methyl and ethyl mercuric con^unds (91). A HPLC-CV-AAS ft)r
the separation of methyl-, ethyl-, phenyl- and inorganic mercury in water after con:q)lexion
with cysteine on LiChro-CART RP-18 column also has been reported (86).
Many coupled chromatographic-atomic spectrometric methods have been applied to the
detection and determination of organomercurial compounds mostly in environmental
saxnples of aqueous base and origin (72, 87, 93, 172, 178, 181 - 185). Few in depth
investigations have been carried out for speciation of mercury in petroleum based samples
A method for determination of mercury species in gas condensate by on-line coupled
high-performance liquid chromatography and cold-vapor atomic absorption spectrometry
has been reported (9). Various organo- mercury species were first separated by
reversed-phase HPLC using an aqueous-based gradient ehitioa Before the final
measurement, the organic ligands and the matrix were destroyed by oxidation with
KaCr207. Mercury was detected with cold-vapour atomic absorption spectrometry.
However, when applied to natural gas condensate, only inorganic mercury (E) was
detected and severe matrix interference was reported. Chemical rearrangements between
the mercury species was also observed.
The determination of dimethyl mercury species in natural gas condensate was reported (78)
that used an on-line amalgam trap or solid phase micro extraction with capillary
CJC-MIP-AES detection. This procedure eliminated background interference from carbon
compounds passing through the plasma that occur when a direct measurement approach is
carried out. Monomethyl mercury and inorganic mercury require derivatization (butylation)
119
prior to the determinatiort More recently mercury speciation in natural gas condensate
using GC-ICP-MS has been achieved, using a treated DB-1701 capillary cohimn (187).
The condensate samples analysed contained Hg**, HgCb, DMM, methjd-ethyl mercury
(MEM) and DEM. Little or no organomercury halide was detected.
The aim of the study is to develop a simple and rapid procedure for the accurate
determination of all mercury species that may be present in natural gas condensate. This
chapter describes the determination of mercury species in natiural gas condensate by using
gas chromatography coupled via a pyrolysis unit with atomic fluorescence detectiorL The
technique utilised the advantages of gas chromatography as the separation method and the
highly sensitive and easy operation of atomic fluorescence detection for mercury speciation
work. The utilisation of a single gas (argon) to replace the dual type carrier gas (177) Le.
helium and argon, was studied. Direct injection, without any pre-treatment, derivatization
or extraction of the sample, has been used. This was to avoid problems associated with the
san^le types and species having a relatively low boiling point (< 250 °C) and stability.
This chapter also mvestigates the optimisation of parameters of the method, the ability of
the method to identify all species that may be present in the gas condensate, evaluates the
efSciency of certain capillary cohimns, and conq ares data for a mass balance of the total
concentrations of mercury obtained &om the speciation analysis of condensate samples
with the total mercury content determined by the vaporisation method discussed, in detail,
in Chapter 3 (188).
120

4.2 EXPERIMENTAL
4.2.1 InstrumeDtation and optimisation study
The set-up of the instrument system, and the construction of the injector assembly and
pyrolysis unit are as shown in Figures 4.1 to 4.3.
The GC unit was a PYE Unicam model 104 gas chromatogr^h. The Injection system was
constructed with a deactivated silica-lined adapter for splitless injectioa Two columns
were used, (i) a 30 metres x 0.53 mm i.d. megabore fused silica cohmm coated with 1
micron non-polar crossed link poly dimethyl siloxane stationary phase (RTx-1) (Benner
Circle, Bellefonte, Pennsylvania, USA) and (ii) 1 micron Carbowax 20M, 25 metres x 0.53
mm Ld. Cp-wax 52CB column (Chron^ac, Middleburg, The Netherland).
The column was inserted through a pyrolysis unit (Model CAL 9900, PS Analytical,
Orpington, Kent, UK) \ ^ c h was maintained at 800 ''C and the outlet connected to the
atomic fluorescence detector (Merlin, PS Analytical, UK) using 1.65 mm and 3.18 mm Ld.
Teflon tubing. In between the heating block of the pyrolysis unit and the GC oven, a 6.35
mm i.d. copper tubing fitted with a heater was installed to prevent a cold spot and hence
avoid any condensation of eluted species. The copper column also acted as a support for
the fi^gile column link. A single gas, argon was used as colimm carrier gas, make-up gas
and shield gas for the detector. The signals fi-om the detector were recorded by an
integrator HP 3395 (Hewlett Packard, WiUmington, DE, USA).
For the study 1 microlitre volumes of sample were injected. The same volume was used
throughout the study.
121

In order to acquire the optimum conditions for use, a number of instrumental operating
parameters were varied and their efiFects investigated. In particular, the effect of injector
temperature, cohunn flow rate, make-up gas, resohition of species using polar and
non-polar columns, calibration using individual species (including Hg**), and a comparison
of their response conq5arison and limits of detection. The speciation of real condensate
samples by direct injection, with and without spiking were investigated.
The oven temperatures profile for the chromatographic separation of the mercury was
based on the operating programme used in the determination of hydrocarbon-types in
naphtha or gas condensate (ASTM D5134, PONA analysis). By using an established
method for separation of the hydrocarbons components in condensate, any problem related
to resolution and separation (chromatographic problem) of the sarq>le matrix can be
reduced.
4.2.2 Chemicals and Reagents
Di-methyl mercury (DMM), diethyl mercury (DEM), dibutyl mercury (DBM) (Strem
Chemical, Massachusetts, USA), methyl mercury chloride (MMC), ethyl mercury chloride
(EMC), phenyl mercury chloride (PMC) (Johnson Matthey, Royston, Herts, UK),
di-phenyl mercury (DPM) (Sigma Aldrich, Dorset, UK), and mercury (II) chloride (MC)
(BDH, Dorset, England) were used in the experimental procedures for caUbration and for
spiking into AnalaR n-hexane and tohiene solvents (Merck, Poole, Dorset, UK) and ' real'
condensate samples.
4.2.3 Gas condensate samples
Six condensate samples were injected directly into the optimised column systems to
determine their mercury species contents. The samples originated fi-om a number of
122
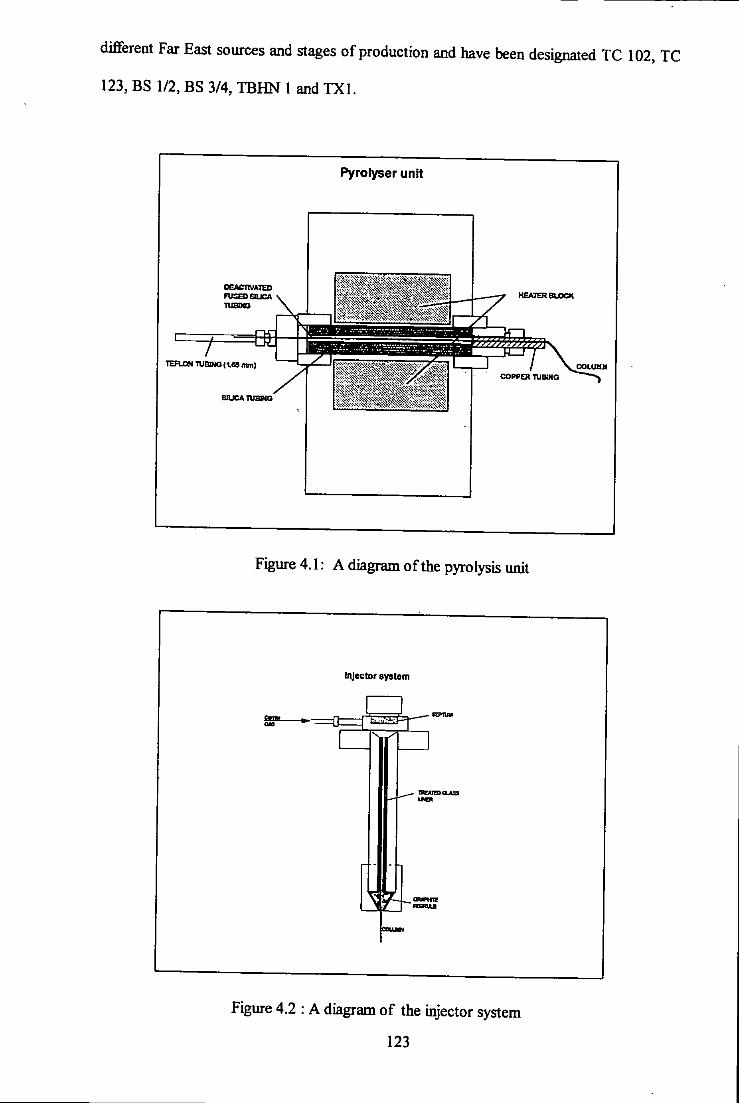
diflFerent Far East sources and stages of production and have been designated TC 102, TC
123, BS 1/2, BS 3/4, TBHN 1 and T X l .
TEFLON TUBIMO (168 mm)
SOJCATiram
Pyroryser unit
HEATER BLOCK
COPPER •nJBtHO
Figure 4.1: A diagram of the pyrolysis unit
Injector oystem
JSlLJ
Figure 4.2 : A diagram of the injector system
123
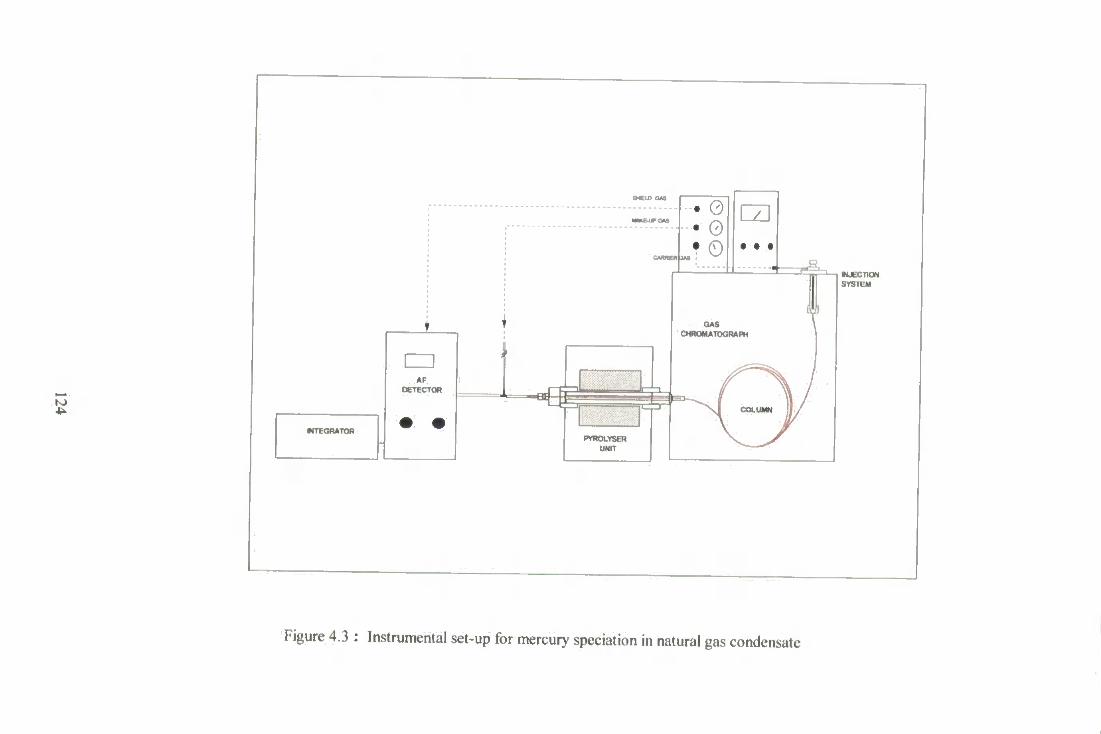
MTEGRATOR
NJECTTON
Figure 4.3 : Instrumental set-up for mercury speciation in natural gas condensate

4.3 RESULTS AND DISCUSSION
4.3.1 The effects of injector temperature
The effects of injector temperature were investigated. An equal mixture of three organo
mercury species D M M , DEM and DPM 10 pg j i l ' each as Hg in n-hexane was used for
the study. The area, area percentage, peak width and retention times were monitored. The
dialkyl mercury species were chosen for the study because those species are most likely to
be present in the non-polar hydrocarbon matrix. Other species, such as elemental mercury
and the organomercury halides were also tested but after the optimisation studies. The
latter polar species may also be present in the sample however, their solubilities are low in
non-polar hydrocarbon liquid/condensate. I f present, they are most likely to be associated
with any moisture or free water in the sample matrix and/or any particulate or suspended
impurities.
A mixture of the three organomercuiy species (10 pg j i l * each as Hg ) in n-hexane were
injected (volume 1 ^1) at several dififerent ten^ratures. The oven temperature profile was
set at an initial tenperature of 40 °C (10 min. hold time) and final oven temperature of
SOO' C (20 minutes) with a ramp rate of 4 min For an injector temperature of 220 °C,
4 peaks were obtained in the chromatogram instead of three. The extra peak was confirmed
as elemental mercury fix)m comparisons with mercury vapour mjections. It's presence was
due to the degradation of certain mercury species, especially the DEM whose area changed
the most, to form elemental mercury when introduced through the heated splitless injector
liner. The formation of free mercury from degradation of organomercury species was
reduced \ 1ien the injector temperature was reduced, and was totally eliminated when the
injector ten^rature was set at 125 °C. The eflfect of the injector tenq)erature on the
formation o f elemental mercury is shown in Figure 4.4. The chromatograms from the series
of experiments are shown in Figure 4.5.
125

Effect of Injector Temperature Area count
$,000,000
iJOOOJOOO
120 140 160 180 200 Inloctor Ttamporaturt (dog C)
220 240
H9
Figure 4.4 : Effect of injector temperature on elemental mercury formation
from dialkyl mercury
4.3.2 Optimisation of column gas flow rate
Different column gas flow rate settings of 3, 6, 10, 15 and 20 ml min ' argon were
investigated. The results show that there were no significant effects on the area or area
percentage or peak shape/width. The retention times of the peaks were reduced when the
higher flow rates were applied. These results are displayed in the chromatograms, Figure
4.6 and graphically in Figure 4.7.
To obtain the optimum column gas flow, the chromatography of three species (DMM,
DEM and DPM species (10 pg ^1 ' as Hg) were monitored at different linear velocities.
The theoretical plates number (N) was calculated using equation 4.1. Plate height (HETP)
values were obtained from the equation 4.2 for the species. The Van Deemter plot for
each species indicated that the optimum gas velocity and hence flow for the three
organomercury species, of widely differing boiling point, was in the range of 23 to 45.4 cm
sec * or 3 to 6 ml min for argon. The Van Deemter plot is shown in Figure 4.8.
126

N = 5 . 5 4 ( t r / W i y 2 ) 4.1
where.
N = theoretical plates number
tr = retention time of the con^wund (s)
W 1/2 = peak width at half height of the peak (s)
HETP = L / N 4.2
where,
HETP = plate height
L = length of column (metres)
N = theoretical plate number
The importance of using argon gas as 'carrier' should be discussed. While many GC
systems use helium, it is of note that when AFS is employed as the detection system, some
suppression of mercury signal is experienced fi'om the presence of helium. To reduce this
effect, argon gas is used to 'dilute' the helium at the post column make-up and detector
stages. To negate the efiect of helium and to simplify the system, an all argon gas supply
was used and studied.
127

Time (min)
220OC
L Time (min)
160OC
Scale:
. . 0
Time (min)
10 20
J J
Time (min)
180 *>€
Time (min)
!
X i 1
i •* I .
9 i DPU
Time (min)
150 ^C
E a
ll 1^ OUM DEM Time (min)
125 *»€
Note: Injector Temp Make-up gas Shield gas 0\-entcmp
Column
I25*C-220°C 300 ml mio*' eOOmlmin-" Lnitia] 40 X (10 min)
Program rate 4 ^ C/min Final temperatmc: set at 300 °C
RTx -1 (30 metres, i.d0.53mm, di methyl silicone 100%,)
Figure 4. 5 : Chromatograms for efiFect of injector ten^rature
128

60il/niin
lOml/min
IS ml/nun
Time (min) T 1 1 \ 1 1 r 0 12 16 20 24
DMU OOA cm TIME (MIN)
1 r \ 1 \ 1 r 0 4 8 12 16 20 24
1 OMM OEM
TIME (MIN)
T 1 1 1 1 1 r 0 4 8 12 16 20 24
TIME (MIN)
20ttd/nm
1 r — I 1 1 1 r 0 4 8 12 16 20 24
HUM OBM
TIME (MIN)
Note: Injector Temp : 125 *C Make-up gas : 300 ml min
Shieldgas : 600inlmiD-' Oven temp : Initial 40 °C (10 min). Program rate 4 * C/ min. Final temperature; 300 *C Column : RTx - 1 (30 metres, i.40.53mm, di methyl silicone 100%),
Figure 4.6 : Chromatograms for the effect of carrier (column) gas flow-rate
129

25
f E I 15
i 10
Effect of Column Flow Rate Retention time
10 12 14 16 column flow rite (ml/min)
t zero (calc) DMM DEM DPM
•
18 20 22
Figure 4.7: Effect of column gas flow rate
Q-
LU
0.8
0.6
0.4
0.2
Van Deemter Curve DMM. DEM and DPM Species
RTx-1 coiumn (0 53 mm i d and 30 metres)
50 100 150 Linear Velocity (cm/sec)
DMM
• DEM
• DPM
200
Figure 4.8 : Van Deemter plot for RTx-1 column for DMM, DEM and DPM
130
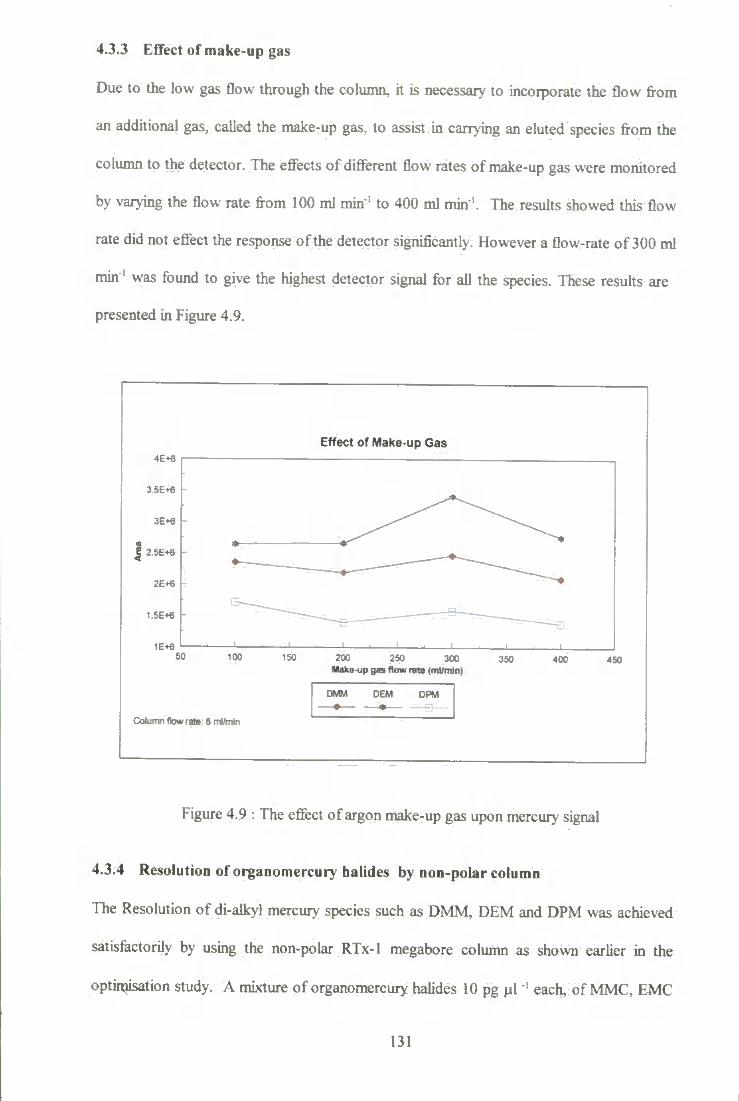
4.3.3 Effect of make-up gas
Due to the low gas flow through the column, it is necessary to incorporate the flow from
an additional gas, called the make-up gas, to assist in carrying an eluted species from the
column to the detector. The effects of different flow rates of make-up gas were monitored
by varying the flow rate from 100 ml min ' to 400 ml min*'. The results showed this flow
rate did not effect the response of the detector significantly. However a flow-rate of 300 ml
min ' was found to give the highest detector signal for all the species. These results are
presented in Figure 4.9.
4E+6
35E+6
3E*6 h
25E+6
2E*6
1 5E*€
1E*« 50
Column now rate 6 mMrrin
Effect of Wake-up Gas
15G 200 250 300 Make-up gas flow rate (ml/min)
350 400 •150
DMM
*
DEM DPM
Figure 4.9 : The effect of argon make-up gas upon mercur>' signal
4.3.4 Resolution of organomercury halides by non-polar column
The Resolution of di-alkyl mercur>' species such as DMM, DEM and DPM was achieved
satisfactorily by using the non-polar RTx-1 megabore column as shown earlier in the
optimisation study. A mixture of organomercury halides 10 pg | i l ' each, of MMC, EMC
131
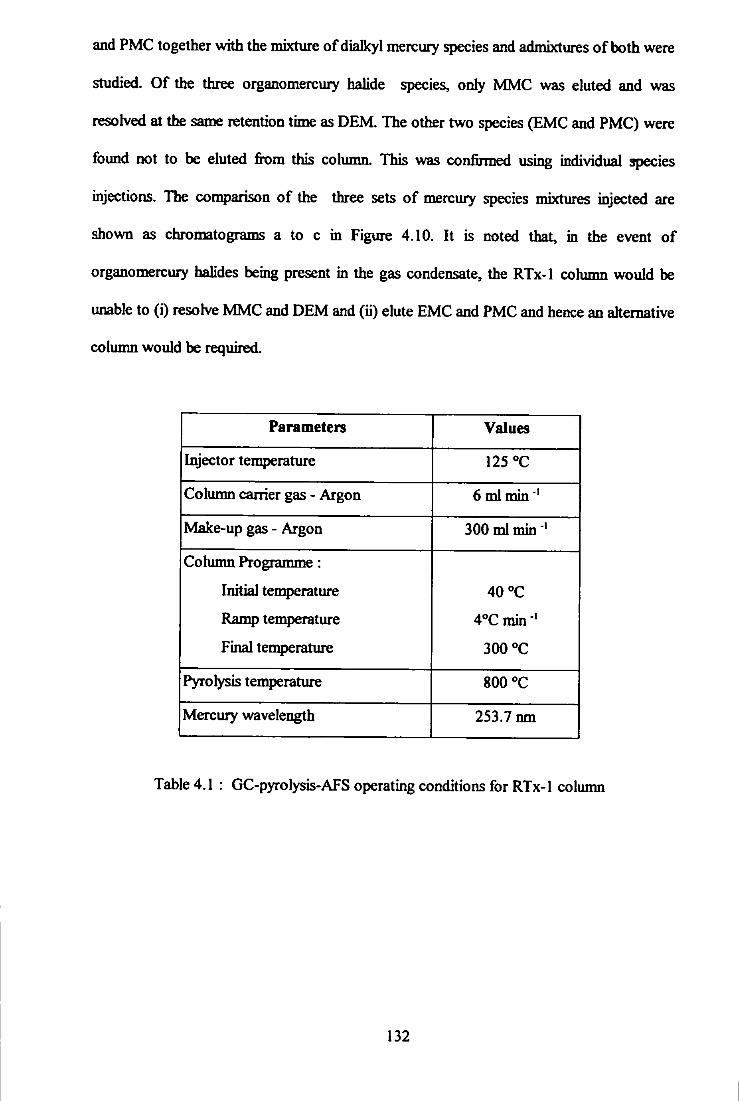
and PMC together with the mixture of dialkyl mercury species and admixtures of both were
studied. Of the three organomercury halide species, only MMC was eluted and was
resolved at the same retention time as DEM. The other two species (EMC and PMC) were
found not to be eluted fit)m this cohmm. This was confirmed using individual species
injections. The comparison of the three sets of mercury species mixtures injected are
shown as chromatograms a to c in Figure 4.10. I t is noted that, in the event of
organomercury halides being present in the gas condensate, the RTx-1 cohimn would be
unable to (i) resolve MMC and DEM and (ii) ehite EMC and PMC and hence an alternative
column would be required
Parameters Values
Iiyector temperature 125 'C
Column carrier gas - Argon 6 ml min '
Make-up gas - Argon 300 ml min
Column Programme:
Initial temperature
Ramp temperature
Final temperature
40 °C
4°Cmin-»
300 °C
Pyrolysis temperatiare 800 °C
Mercury wavelength 253.7 nm
Table 4.1 : GC-pyrolysis-AFS operating conditions for RTx-1 column
132

DMM DEM
a - MixttatafDMM^DEMModDm
DPM
JL 24 30
- J L
TIME (MIN)
b - Mhtnre of MMQ EMC md PMC
i r 1
18 24 30
TIME (MIN)
i L
DMM
5
12
c - Mxitiireof(a)cad(b)
DPM
TIME (MIN)
24
Figure 4.10: Chromatograms for (a) di alkyl mercury, (b) organomercury halide and (c) mixture of a + b.
133

4.3.5 Retention times for mercury species on RTx-1 column
Using the standard cahTjrations previously acquired from the performance experiments.
Table 4.1, the retention times for the mercury species that could be eluted were determined
using RTx-1 cohima These are shown in Table 4.2.
y Spwes. >' RetentiOD time (min)
Hg° 2.022 ±0.051
D M M 6.049 ±0.198
DEM/MMC 11.944 ±0.221
DBM 19.766 ±0.152
DPM 23.789 ±0.251
EMC/PMC not eluted
Table 4.2 : Retention times for mercury species using RTx-1 column and
conditions shown in Table 4.1
4.3.6 Chromatographic performance using a polar column
The colimin used was a Cp-Wax megabore capillary column with an internal diameter o f
0.53 mm and 25 metres length. The performance of the column was tested by injecting
known amounts of various di alkyl mercury and organomercury halide species spiked into
hexane. The results obtained from the analyses showed that the polar column was able to
elute the seven mercury species injected and to separate the mercury species including the
organomercury halides with the exception of MMC which was co-eluted with diethyl
mercury. As this is a polar column, the non-polar species i.e. DMM, DEM, DBM were
eluted according to their boiling point but with a reduced retention time compared with
their retention time on the non-polar RTx-1 column. In con^arison, the polar column
exhibits improved performance by being able to resolve not only the dialkyl mercury
134

species quicker but also by elution and resolution of the organomercury halide species.
Example of the chromatograms for the set mixtures of organomercury species spiked into
the liquid hydrocarbon and injected onto the polar Cp-wax column are shown in Figure
4 . I I .
4.3.7 Retention time for mercury species on the Cp-wax column
Using the standard calibrations previously acquired from the performance experiments
Table 4.1, the retention times for the mercury species that could be eluted were determined
using Cp-wax column. These are shown in Table 4.3.
Species - Retention time (mih);
Hg° 0.902 + 0.031
D M M 1.607 + 0.085
DEM/MMC 3.345 +0.221
DBM 6.798 + 0.561
DPM 16.314 + 0.197
EMC 34.650 + 0.308
PMC 39.597 + 0.463
Table 4.3 : Retention time for mercury species using the Cp-wax column
and conditions shown in Table 4.1
4.3.8 Calibrations of mercury species
A series of concentrations of individual organomercury species i.e. DMM, DEM and DBM,
together with Hg°, were analysed to obtain the relationship between the detector response
(area counts) and concentration of species injected, using the polar column Cp-wax. The
results indicated that the slopes obtained for all the species were ahnost identical to the
calibration slope of Hg°. As the AF technique detects only elemental mercury, this
135
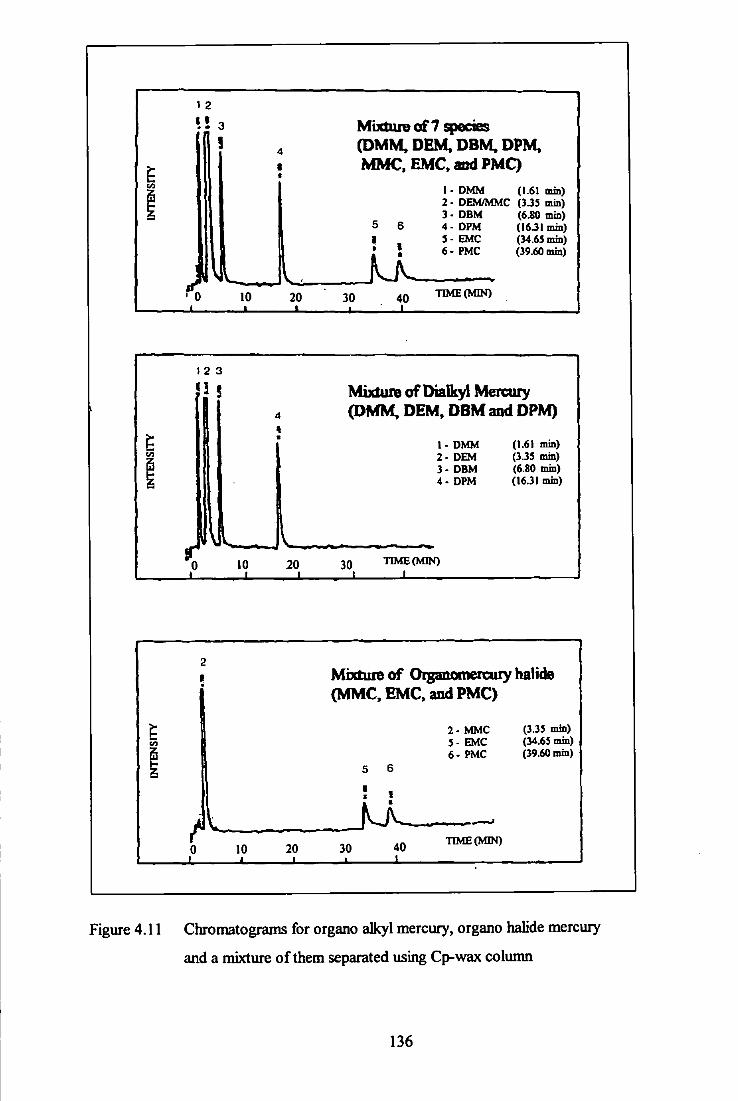
Mixture of 7 species (DMM, DEM. DBM. DPM, MMC, EMCsidPMC)
DMM DEMMMC DBM DPM EMC
(1.61 mm) (3JS min) (6.S0 min) (16J1 mm) (34.65 min) (39.60 min) 6- PMC
TIME (MIN)
1 2 3
} 1 I Mixture of Dialkyl Mercury
4 (DMM, DEM, DBM and DPM) 1 1 •
1 - DMM (1.61 min) C/3 2- DEM (3.35 min) Q 3- DBM (6.80 min)
4- DPM (16.31 min)
1
I I . { 1
10 20 3Q TIME (MIN) 1 '
Mixture of Oiganomercury halide (MMC, EMC, and PMC)
2 - MMC (3.35 mm) 5 - EMC (34.65 mm) 6-PMC (39.60 mm)
TIME (MIN)
Figure 4.11 Chromatograms for organo alkyi mercury, organo halicie mercury
and a mixture of them separated using Cp-wax column
136
indicated that the organomercury species were con^>letely recovered (i.e. not retained by
the column) and afterwards were completely converted into elemental mercury by the
pyrolysis unh at a temperature of 800 °C before detection. The caHbration results for the di
alkyl mercury species and for elemental mercury are presented in Figure 4.12.
Since the calibrations of the individual organomercury species exhibit an almost identical
slope to the cahTjration using elemental merciuy, this indicates that the species are almost
completely eluted from the colimm and display the same high recovery values. Based on
this, the response of the organomercury species relative to elemental mercury can be
considered as 1 and therefore elemental mercury may be used for the calibration and
quantitative determination of unknown species in san^les..
To compare both the non-polar and polar column performances, a series of concentrations
of diaDcyl mercury (DEM) and elemental mercury were injected using both types of
columns. The operating conditions of the GC system were identical for both sets of runs.
The results shown in Figure 4.13 indicate that both columns produced linear cahTsrations
with near identical slopes. The regression data are summarised in Table 4.4.
The precision of the experimental set-up was carried out by injecting 6 times for each
mercury species (DMM, DEM and DBM) in hexane individually (30 pg|xl as mercury)
and a mbrture of the three species with same concentration (30 pg\i\ * each). The area
counts were measured. The column used was the Cp-wax megabore colunm. The results
indicated that the RSD for n = 6 was in the range of 2.8 to 7.7 %. The area counts for the
experiment are summarised in Table 4.5 and the comparison for DMM species individually
and from a mixture as an example shown in Figure 4.14.
137

Calibration curves Column CP-WAX
2E+7
1.5E+7
5E46
OE-fO 20 30 40 50
Hg Concentration (pg/ul) 60 70
DMM DEM DBM Hg
RATE; 12*C/minto250X
Figure 4.12 : Calibration graphs for Hg^ DMM, DEM and DBM using Cp-Wax column
MERCURY SPECIES IN HEXANE CaUbrations Comparison
Columns: CP-WAX and RTx-1 2E+7
1.5E+7
e 1E+7 <
OE+0
20 30 40 SO Hg Concentration (pg/ul)
60 70
Elem. Hg C p ^ a x DEM
RTx-1 DEM
- -» -RATH: 12 •Omin to 250 'C/300 *C
Figure 4.13 : Calibration comparison of DEM using Cp-Wax and RTx-1 column
138

.J .-••..y.p if.;-. . 7 . .J .-••..y.p if.;-. . 7 .
•A., "i--'. . • r DEM(RTx-l)
slope 270,159 254,356 270,372
intercept 41,765 - 73823 -316182
0.99 0.99 0.99
Table 4.4 : Regression data
Species N
.'C- >^V^ 'Areawunis^i^isldL'^C-x^W^*:)^'
Species N
Individual 7.6 + 0.4
(RSD = 5.3%)
7.3 + 0.4
(RSD = 5.5%)
7.5 + 0.5
(RSD = 6.7 %)
Mixture 7.8 + 0.4
(RSD = 5.1 %)
7.2 + 0,2
(RSD = 2.8 %)
7.8 ± 0.6
(RSD = 7.7 %)
Note : n = 6 ; column Cp-wax
Table 4.5 : Area counts for mercury species injected as individual and as mixture.
139

2E+7
8 1E+7 <
5 E * 6
OE+0
MERCURY S P E C I E S IN HEXANE Calibration curves^Comparison : mix and single)
Column CP-WAX (0.53 i.d.)-25 metres
30 40 Hg Concentration (pg/ul)
50
Single Mixture DMM DMM
RATE 12 'C/min to 250 'C/350 ' C
60 70
Figure 4.14: Area counts comparison for DMM injected individually and from mixture
4.3.9 Limits of detection
Limits of detection of the mercurv species were determined from the calibration experiment
using both types of column and several species of mercury injected individually with their
series of concentrations ranging from 10 to 60 p g ^ l a s mercury. Each concentration was
injected 6 times. The limit of detection was based on the intercept plus three times the
standard deviation of random error of the intercept and the slope (Y = Yb+ 3 Sy/x)(160).
The absolute detection limits of the Hg°, DMM, DEM and DPM using the RTx-1 column
are 5 pg, 8 pg, 3 pg and 6 pg respectively, whilst the detection limits of Hg°, DMM, DEM
and DBM using the Cp-Wax column are 5 pg, 4 pg, 6 pg and 6 pg respectively. When
based on individual species and concentrations injected six times, their absolute limits of
detection are similar, laying in the range 2.5 to 7 pg.
140

4.3.10 Speciation analysis of actual condensates
Analyses of actual natural gas condensate samples were carried out using both types of
cohmm. Diflferenl condensate samples gave diflferent ratios of mercury species. These
ranged from elemental mercury, through the dialkyl mercury series, up to d^hen^
mercury. Some species such as DMM, DEM, DBM and DPM were identified positively by
matching their retention times with pure species mixtures injected or by spiking
experiments. The other peaks could be attributed to other members of the homologous
series of organomercuiy conq)Ounds because they eluted in proportion to their boiling
point.
Quantification of the mercury species in the gas condensate samples was based on
calibration curves (peak area against concentration of either organomercury species or
elemental mercury). The calibration using elemental mercury was based upon the
knowledge that at a fixed temperature, the saturated vapour pressure of mercury is known
and a fixed volume of vapour will contain a known quantity of mercury (168). A gas tight
syringe was used for the introduction of the elemental vapour to the GC injector. The
elemental mercury calibration was chosen because it yielded the same response as that for
the other organomercury species during the calibration procedures under identical
conditions.
4.3.10.1 The RTx-1 Don-polar column
Five real gas condensates injected into the non-polar Rtx-1 column produced the range of
mercury species shown in Table 4.6. Each condensate was injected at least four times.
While a number of species were found to be close to their limit of detection, tentative
values were assigned in order to estimate the total mercury content from species for later
141

comparison in the mass balance. Only those peaks that were reproducibly present over the
four or more runs were considered valid.
The presence of a peak between the retention time of DEM and DBM standards was
observed. Based upon the retention characteristic of the diaOcyl mercury homologous
series, this peak may be attributed to dipropyl mercury (DPrM). This following of the
retention times versus the homologous series can be seen in the literature (187).
With the exception of condensate TXl , the major species observed were DMM, DEM and
DPrM. Few workers have attenqjted foil mercury speciation of gas condensate and most
have targeted specific species only (e.g. DMM, MMC, etc., (9,78)). However, the presence
of DMM and DEM is noted by other workers (78, 187), Sample TXl is unusual,
compared with the other condensate, in that the major component is identified as DPM and
has a high elemental mercury (30 % m/m). This condensate however, is from a totally
different source and may reflect the origins and uiqjrocessed nature (raw saiiq>le) of this
condensate.
Indeed, the presence and proportions of mercury species in gas condensate is highly
dependent upon source, stage of production, sampling, storage of sample and age of
san^le. While it is stated that these column systems are unable to resolve DEM and MMC,
a recent study has shown that the latter species is only a very minor component in gas
condensate (187).
Chromatograms of the condensate sanq?les are shown in Figure 4.15. Figure 4.16 shows a
condensate san^le, BS 3/4, with and without spiking with selected mercury species. The
recovery data from this experiment are shown in Table 4.7.
142
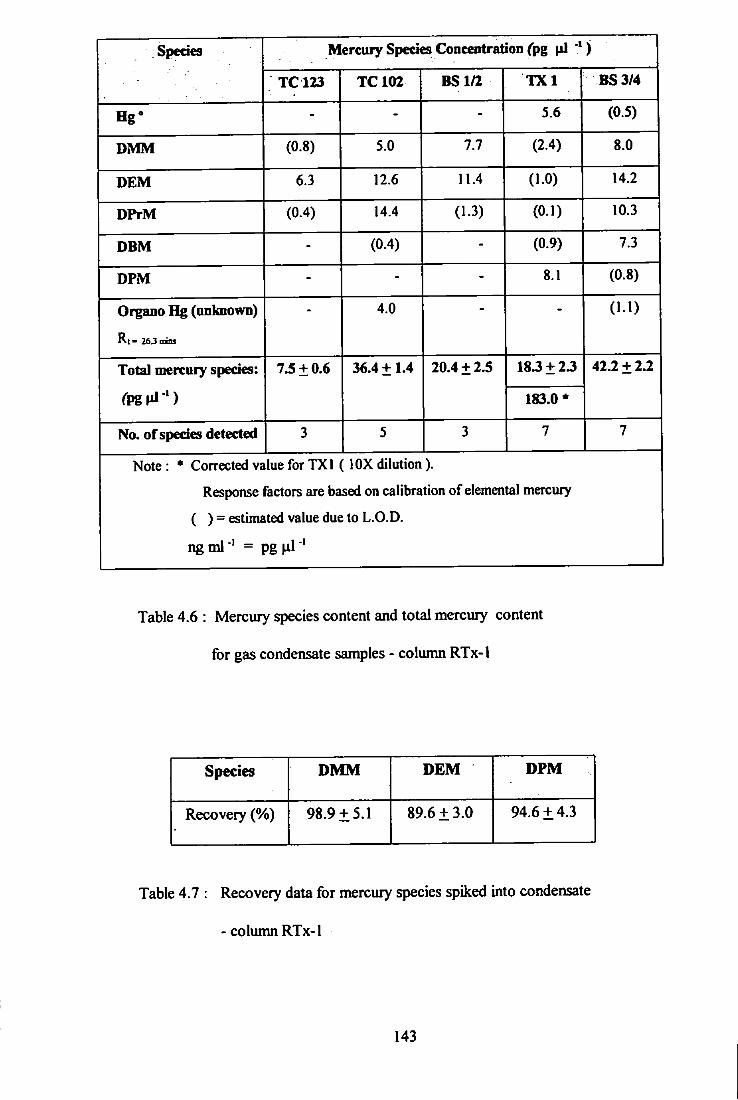
Spedes Mercury Spedes Concentration (pg ^ l ' ) Spedes
TC123 TC 102 BSl/2 T X I BS3/4
eg- - - - 5.6 (0.5)
DMM (0.8) 5.0 7.7 (2.4) 8.0
DEM 6.3 12.6 11.4 (1.0) 14.2
DPrM (0.4) 14.4 (1.3) (0.1) 10.3
DBM - (0.4) - (0.9) 7.3
DPM - - - 8.1 (0.8)
Organo Hg (onknown) •
4.0 (1.1)
Total mercury spedes:
r p g ^ i ' )
7.5 ±0.6 36.4 + 1.4 20.4 + 2.5 18J + 23
183.0*
42.2 + 2.2
No. of spedes detected 3 5 3 7 7
Note : * Corrected value for TXI ( lOX dilution). Response factors are based on calibration of elemental mercury
( ) = estimated value due to L.O.D.
ng ml = pg | i l *
Table 4.6 : Mercury species content and total mercury content
for gas condensate samples - column RTx-1
Species DMM D£M DPM
Recovery (%) 98.9 + 5.1 89.6 + 3.0 94.6 + 4.3
Table 4.7 : Recovery data for mercury species spiked into condensate
-column RTx-1
143
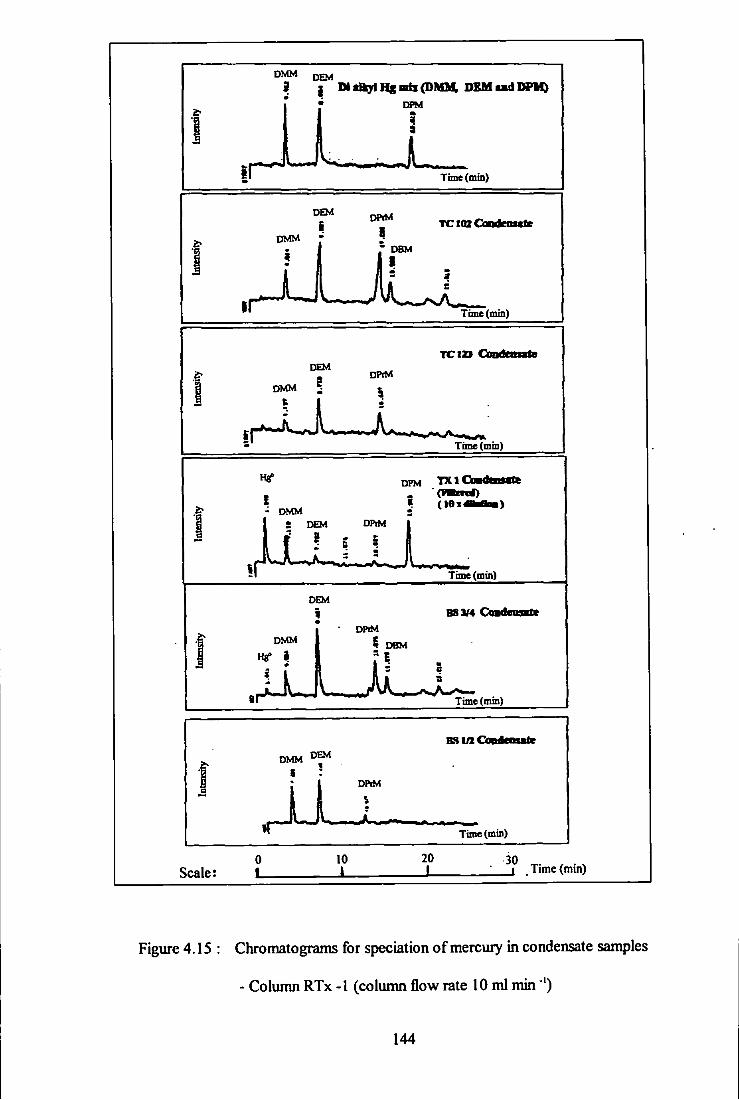
DMM OEM
I 2 U«B9lH«Bds(DMH DSMaBdI»>M)
u L Time (mm)
DEM
I DMM •
TC f 02 Coodentcte
Time (min)
Time (min)
DPM T X l
« ( l e i m i i )
Time (min)
• DMM
BS3M O a d e s s t f t
Time (min)
BSiACootesate DMM DEM
Time (min)
Scale: 10 20
J - 30 _ j _ Time (min)
Figure 4.15: Chromatograms for speciation of mercury in condensate san jles
- Column RTx - I (column flow rate 10 ml min ')
144
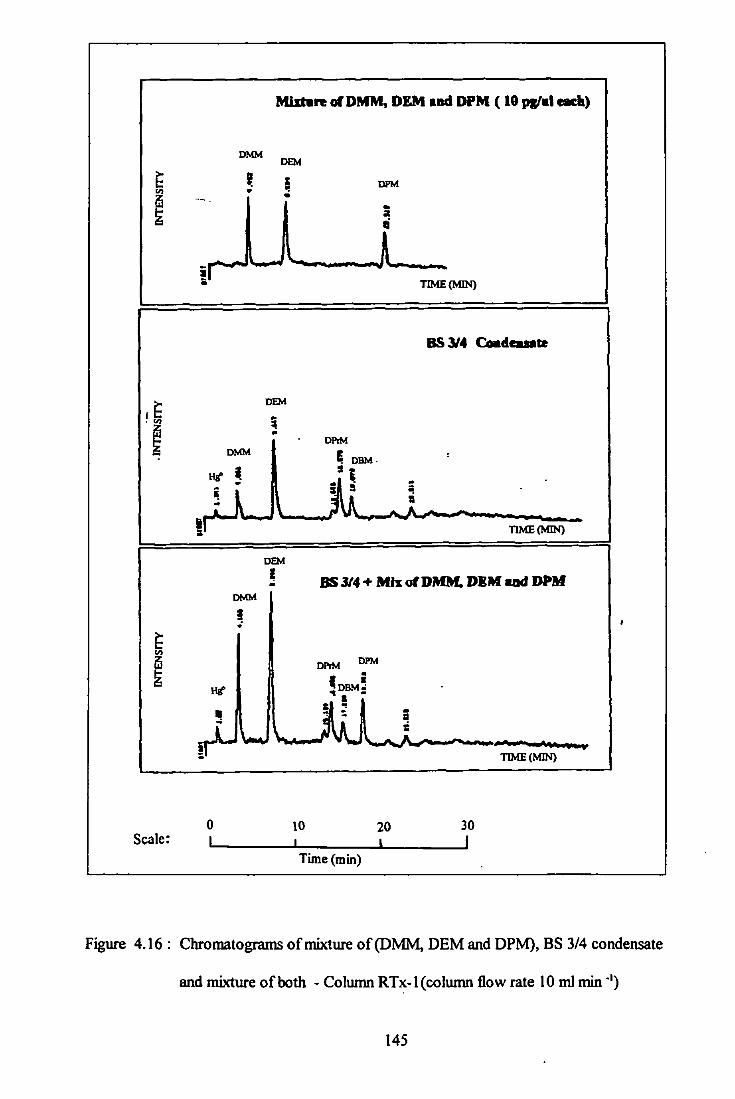
Mlzt«n of DMM, DEM and DPM ( 10 ps^al each)
DMM DEM
DPM
X TIME(MIN)
BS3/4 Coadcuiite
DMM DPrM
TIME(MIN)
DEM
BS 3/4-f Mix of DMM. DCM and DPM DMM
DPiM DPM
?DBM!
TIME{MIN)
Scale: i 10 20 30
J Time (min)
Figure 4.16: Chromatogramsof mixture of (DMM, DEM and DPM), BS 3/4 condensate
and mixture of both - Column RTx-1 (column flow rate 10 ml min *')
145

4.3.10.2 The Cp-wax polar column
The results torn running a similar set of gas condensate san^les using Cp-wax column for
mercury speciation are shown in Table 4.8. Again the major components shown to be
DMM, DEM and DPrM. One sample TBHNl, is a condensate not fix)m natural gas origm
but from crude oil and is identified as naphtha condensate. As a result this sanq>le shows a
higher proportion of heavier dialkyl mercury species and include DBM.
The sample designated BS 3/4 is also noted to be heavier fiction of gas condensate. The
presence of a higher boiling point fractions is again reflected in the distributions of mercury
species Le. the higher proportions of DBM and DPM.
Chromatograms of the condensate san^le are as shown in Figure 4.17. Figure 4.18 shows
a condensate sample, BS 3/4, with and without spiking with selected mercury species. The
recovery data from this experiment are shown in Table 4.9.
146

Spedes Mercury Spedes Concaiitration <pg\i} '^) Spedes
TC123 TC102 BSl/2 TBHNl BS3/4
Hg- (1.2) 4.4 (1.1) (0.6) (2.3)
DMM 3.5 2.9 4.9 8.3 8.5
DEM 6.5 14.4 10.9 22.8 19.3
DPrM (2.4) 11.1 3.9 33.7 13.9
DBM - (2.2) - 13.1 5,9
Organo Hg (unknown)
R| = 14.7 nms (1.0) — - (1.7)
DPM - - - - -
Total mercury species: 13.6+1.1 36.1 +1.8 20.8 ± 3.4 78.5 + 5,1 51.6 + 3.2
No. of spedes detected 4 6 4 5 6
Note : Response factors are based on calibration of elemental mercury ( ) = estimated value due to L.O.D. ng m l = pg ^1
Table 4.8 : Mercury species content and total mercury content
for gas condensate samples - column Cp-wax
Species DMM DEM DBM
Recovery (%) 90.1+5.5 98.0 + 4.5 91.6±3.2
Table 4.9 : Recovery data for mercury species spiked into condensate
-colimin Cp-wax
147
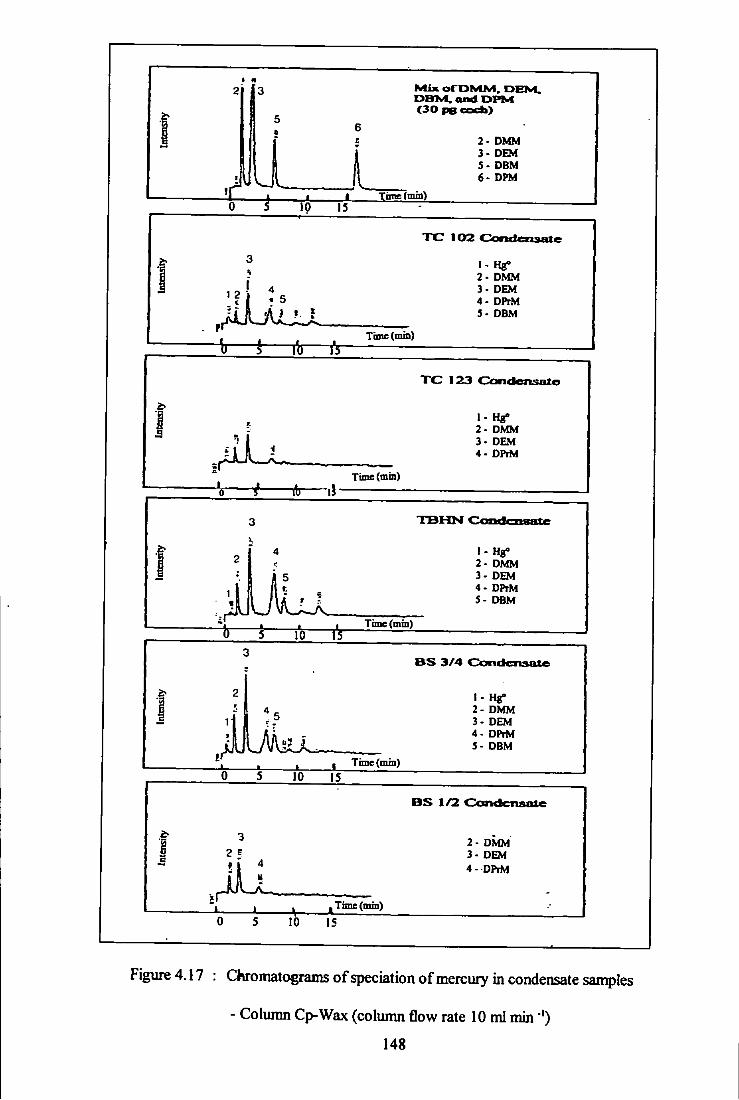
1
it w
i
Mix. orOMM. DBM, DBTwI,amlDPM (30pBcocli>
2' D M M 3 - D E M 5- D B M 6- D P M
10 15 Time (min)
T C : 102 C : o n c l e n s a t e
1- Hg» 2- D M M 3 - D E M 4 - D P t M 3 . D B M
Time (min)
T C 1 2 3 O s n d e n s a t e
1- Hg» 2- D M M 3 . D E M 4- D P t M
i rti—x\ Time (min)
T B H N C o n d e n s a t e
2- DMM 3 - DEM 4 - DPrM 5- DBM
Time (roip)
3 B S 3 / 4 O o n d e n a a t e
1 2 I - Hg-1 T 4 ^ 2- DMM
i f ^ 5 3 - DEM 4 - DPrM S- DBM
If 1 • »
1 Time (min) 0 5 10 15
3 2 f 9 '
B S 1/2 C o n d e n s a t e
2- OMM 3 . DEM 4 - DPrM
, Time (min)
10 15
Figure 4.17 : Chromatograms of speciation of mercury in condensate samples
- Column Cp-Wax (column flow rate 10 ml min ')
148
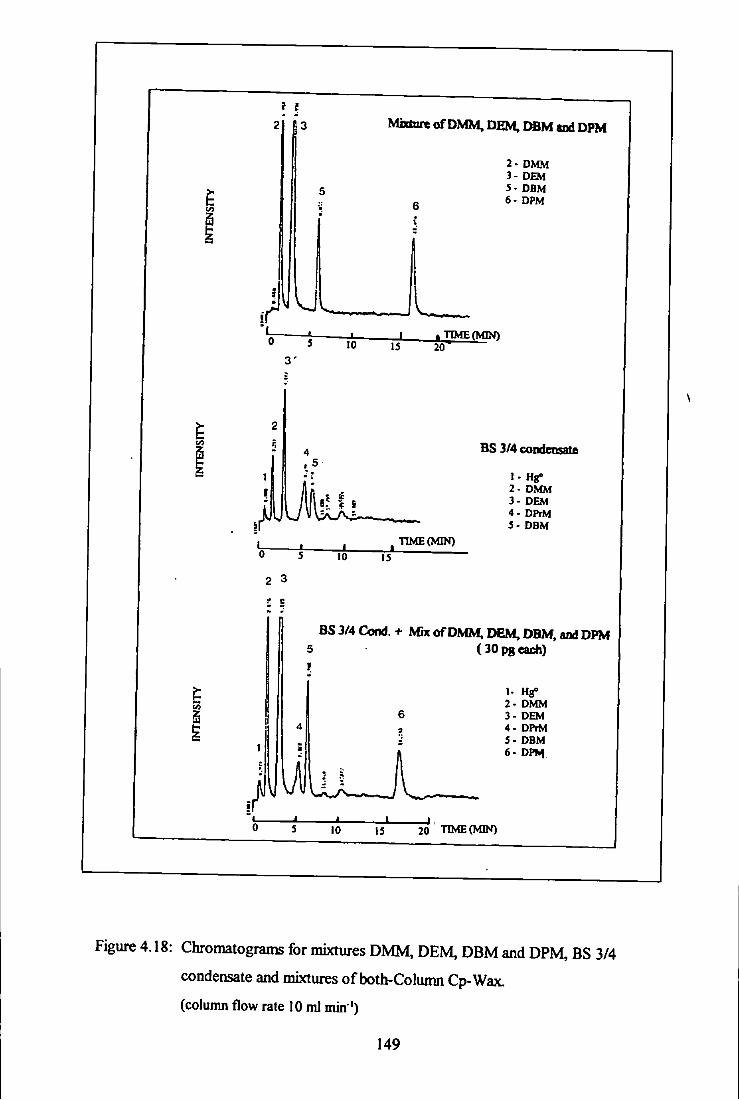
Mixture of DMM, DEM, M M and DPM
5
2- DMM 3- DEM 5- DBM 6- DPM
ID 15 i__^mffi(NnN)
20
4 r 5
HS3/4coiidensaifi
I - Hg-2- DMM 3- DEM 4 - DPrM 5- DBM
TIME (MIN) 0 5
2 3
!• C
10 IS
•
BS3/4Cond.+ MixofDMM,MM,DBM,andDPM (SOpgcach)
1- Hg° 2- DMM 3- DEM 4 . DPrM 5- DBM 6- DPI»i
10 IS "20 TIME(MIN)
Figure 4.18: Chromatograms for mixtures DMM, DEM, DBM and DPM, BS 3/4
condensate and mixtures of both-Column Cp-Wax.
(column flow rate 10 ml min ')
149

4.3.11 Mass balance calculations
The total mercury, calculated from the sum of individual species for each condensate was
compared with its 'total' mercury content determined by the new vaporisation-trap-AFS
technique reported in Chapter 3 (188). This latter technique is based on a simple and
reliable procedure for the determination of total mercury in natural gas condensate which
eliminates the use of chemical/additives and conq)licated digestion procedures. The
determinations were carried out by the direct vaporisation of samples at 400 **C with
subsequent adsorption of mercury species by a gold-coated silica trap maintained at 200*'C.
To release metallic mercury, the trap was heated to 900 X and the analyte determined by
atomic fluorescence spectrometry. Taking into consideration the complexity of the san^le
together with, high volatility of both the matrix and mercury species , the total mercury
results obtained from both techniques are reasonable agreement. These results, for both
column systems, are shown in Table 4.10. One anomaly is seen. This is sample TC 123
using the CP-wax colutmn with gave an abnormally high total mercury content from
summation of the individual species. However, the major species seen in the sample, DEM
is the same using both column systems, and both are in quantitative agreement (6,3 and 6,5
pg ^r*, Table 4.6 and 4.8 respectively).
Species Mercury Spedes Concentration (pg jil ' = ng ml ' ) Species
TC123 TC 102 BS 1/2 T X I BS3/4 TBHNl RTx-1 7.5 + 2.3 36.4 + 7.1 20.4 + 4.8 183.0 + 32 42.2 + 8.9 -
Cp-wax 13.6 + 3.4 36.1 +6.5 20.8 + 5.2 - 51.6 + 8.4 78.5 + 10.2
Vaporisation technique
7.5 ± 0.3 43.3 + 1.7 22.3 ±1.4 187.2 ±16.1 49.7 + 2.6 82.2 ±4.5
Table 4.10 : Total mercury mass balance for condensate samples using colum
systems RTx-1 and Cp-wax con:Q)ared with vaporisation technique
150
4.4 CONCLUSIONS
The direct determination of mercury species in hydrocarbon liquids and gas condensate
samples was carried out successfully by using both polar or non-polar megabore capillary
columns. Of the two, the polar cohmm exhibited slightly superior performance in tenns of
the ehition of organomercury halide species. The use of megabore capillary cohmms
permitted larger vohmies of hydrocarbon samples to be mjected and therefore improved
sample loading. The injector port, which was maintained at 125 ''C consisted of a
deactivated silica liner for direct sample injections. This temperature was the highest that
could be used safely without degradation or conversion of mercury species taking place.
Gas chromatogr^hy when coupled, via a pyrolysis unit with an AF detector, was able to
determine mercury species directly in natural gas condensate at the picogram level The
instrumentation is relatively simple and easy to operate. No pre-treatment of the sanq)les
was required prior to mercury determination. The results obtained were reliable for a given
cohmm system and gave positive identification of organomercury species with the
exception of DEM and MMC that co-elute.
The quantification of the species concentration can be made by using both calibration
against elemental mercury and individual mercury species since the response of all species
are nearly identical.
Mass balance calculations show a strong correlation between the total mercury content of a
san^le obtained fi-om the vaporisation technique and the summation of all species eluted by
GC-Pyrolysis-AFS.
The major species observed in condensate samples were DMM, DEM and the assumed
DPrM. The presence and proportions of mercury species in gas condensate is highly 151
dependent upon the source, the stage of production, the sampling technique used, storage
of the sample and age of the sanq5le.
152
CHAPTER 5
T H E PRELIMINARY EVALUATION OF AN ADSORBENT-BASED M E R C U R Y R E M O V A L SYSTEM FOR GAS CONDENSATE

CHAPTERS
THE PRELIMINARY EVALUATION OF AN ADSORBENT-BASED
MERCURY REMOVAL SYSTEM FOR GAS CONDENSATE
5.1 INTRODUCTION
Mercury removal systems for both gas and liquid hydrocarbon streams are commercially
available. However, removal systems for natural gas condensates have not been thoroughly
tested under real plant conditions. Only a few units have been installed in real plants and
most of these were on a trial basis. One plant which possessed a mercury removal &cility
stiD experienced mercury contamination in their process steams i.e. only mercury metal
vapour was targeted. This was due to little or no information (103) of the n^rcury species
present in the streams. This lack of information leads to difficulties in deciding the most
suitable renooval system on both technical and economic grounds. In general, this limited
knowledge on mercury in condensate arises because:
• The amount of mercury and the types of mercury species present are not easily
determined. This is due to the nature of the samples. Natural gas condensates are
very volatile complex mixtures. In addition, the mercury species are volatile and
can be transformed into different fonns of mercury, brought about by changes in
their environment such as temperature, pressure and the presence of active
particles or impurities.
• The techniques en^)loyed for the determination of mercury content in different
process streams are not standardised, validated or well documented.
It is also noted that the problem arise at the process plant and laboratory level because:
153

• The removal system selected may not perform to expectation when installed in an
actual, real plant environment due to unexpected interferences and the more
challenging natxire of the real plant environment.
• Among the plant's operators and laboratory stafl^ some may not be aware of the
finer technical details required in mercury removal and determination, while others
may not confide their expertise
5.1.1 Characteristics of the mercury-removal system
The characteristics required of any mercury removal system are as follows: (10,11,13)
• The removal agent must be highly active towards all forms of mercury,
preferably bondmg irreversibly to the agent (not to be re-released to the treated
stream).
• The removal agent must remain active, Le. the active sur&ce must be resistant
to blinding (or masking) by components in the stream being treated.
The removal agent must not be harmful to the end use of the products, or.
potentially harmful to down-stream components, i.e. by leaching of chemicals
or particulates.
The system should ideally be flexible to the demanding and uncertain nature of
conditions of feed and process streams.
The removal agent should be inexpensive, readily available.
The removal agent should hold the mercury in either a solid form, or in a liquid
form fit>m which it could be precipitated by a readily available agent and then
filtratered and disposed.
154

5.1.2 Mercury-removal from natural gas condensate.
The removal of mercury from natural gas condensate is very different to that from natural
gas because it is in the liquid phase during the operation and the main types of mercury
present in the condensate are organometallic (> 80 % - refer to Ch^ter 4). At psesent,
three 'technologies* are said to be effective for the renK>val of total mercury fix>m feeds,
destined for steam cracking or aromatisation (reforming). There are several manu&cturers,
but most of the products are still under devebpment i.e. at the pilot plant stages. The
removal systems can be divided into several types:
5.U.1 Sulphide-containing ion exchange resin material (23).
This system first developed by DSM of Holland claimed to be effective for the removal of
elemental and organomercury halide. However, when considering the ion exchange
characteristics, the effectiveness of the system m removing dialkyl mercury species, which
are known to be non-ionic coii^x)unds, is not known.
The other examples of these system are, TP214 (Bayer), S-929 (Purolite International) and
GT73 (Rohm and Haas)
5.1.2.2 Sulphide-containing alumina
One example of this system is that developed by Procatalyse, France. This system is only
capable of adsorbing elemental mercury. In order for the removal system to include other
species, e.g. organomercury species, a primary or pre-processing stage is required. This
should convert all forms of mercury into the metallic species. Hence, this process is in two
stages (7,105). The first stage of the process con^rises a reactor loaded with a
'hydrogenolysis' catalyst, MEP841 (Procatalyse), operating under suitable conditions, in
the presence of hydrogen, to convert both ionic and organomercury species present in the
condensate into metallic mercury. This is subsequently trapped on the su^hide-containing
155

alumina in the second stage. However the efficiency of the first reactor to ultra convert
trace concentrations of ionic and organomercury compounds into elemental mercury is in
doubt because of the lack of speciation information post-processing. This is particularly
important when the condensate contains alkyl mercury as the major species.
Another exan^le of the two stage commercial removal system is that manufectured by the
Japanese Gasoline Corporation, known as the JGC process (106).
5.1.2.3 Other systems.
There are several manufecturers who also produce mercury-removal systems for gas
condensate. However, these are still in the development stage. Two examples are:
i. Su^jhur-containing molecular sieve by Katalco (5156, 5157).
ii. Sulphur-containing activated carbon by Calgon (HGR).
5.1.3 Aims of the study
The aim of this study was to assess the efficiency of three commercially available mercury
removal systems in removing several mercury species particularly the alkyl mercury forms
i.e. DMM, DEM and DBM fi-om liquid hydrocarbon and gas condensate. This chapter
presents the pilot plant performance of several commercially available adsorbents. Due to
confidentiality, the commercial name of the removal system caimot be revealed. The
adsorbents were designated adsorbent A, B, and C. In order to critically assess the
efficiency of the B and C removal systems, the experiments were san^le controlled using
n-hexane with various species of organoalkyi mercury. Due to the specific two stage
process of the AA removal system, the feed sample required had to be a real condensate.
156
5.2 EXPERIMENTAL
5.2.1 Chemicals
DMM, DEM and DBM (Strem Chemical, Massachusetts, USA) were used in the
experiments either for calibration or for spiking into *real' condensate samples or AnalaR
n-hexane as a replacement for the condensate san^le.
5.2.2 Identification of mercury removal adsorbents/catalyst
Two classes of mercury-removal system were identified. The classification was based on
the number of stages that the process required. The adsorbent system designated A
required a 2 stage process, Le. hydrogenation prior to mercury removal The adsorbent
systems B and C only required a single stage Le. direct adsorptioa
For the A system, a hydrogenolysis catalyst was used to convert organo and inorganic
mercury to elemental mercury and a sulphide-containing alumina was used for the removal
of elemental mercury.
The B mercury-removal system, was a carbon based adsorbent which contained sulphur as
the active material The C mercury-removal system was a molecular sieve based adsorbent
with undisclosed active material.
5.2.3 Testing Procedure.
5.2.3.1 Two stages process (Adsorbent AA)
A schematic diagram for the pilot plant is shown in Figure 5.1. The pilot unit contains
three reactors. The hydrogenolysis reactor Rl is fed with an upward flow of condensate
and loaded with hydrogenolysis catalyst (32 ml, four beds of catalyst) in order to transform
the various mercury species to metallic mercury. The two other reactors, R2 and R3
157

contain the trapping media (32 ml) and are used in separate liquid and gas lines for
removing elemental mercury.
Activation of the hydrogenolysis catalyst is required prior to processing and this is achieved
by reducing the catalyst with hydrogea The effect of this reduction is to remove the
chloride precursor. The operating conditions for the activation process are as follows:
Pressure 30 bar
Temperature 300 C
Hydrogen flow 3 litres hour '\
Liquid condensate flow 128 ml hour
Duration 12 hours
At the end of the activation procedure, the reactor temperature is reduced to 150 *C under
the same hydrogen flow rate and the condensate feed is injected when the temperature is
stabilised. The hydrogenolysis reactor is maintained at 200 °C and the flow rate for the
actual samples was set to 128 ml hr * (Liquid Space Hourly Velocity (LSHV) 4 hour ).
For mercury removal, reactors R2 and R3 are at the same flow rate as the Rl reactor, but
maintained ambient temperatures.
The system was conditioned for 48 hours before the collection of condensate feed sa£q)les,
samples after the Rl reactor and products fi-om the R3 reactor.
5.2.3.2 Single stage process
Two types of adsorbent were tested using the single stage pilot plant. These were
adsorbents B and C. The schematic diagram for the pilot plant is shown in Figure 5.2. The
pilot plant consists of a single reactor Rl (diameter 4 cm, length 40 cm) and variable flow
158
liquid pump. The processes were operated at ambient temperature. The amount of
adsorbent loaded in the reactor was 100 mL The adsorbent was packed between two phigs
of carbonmdum packing material. Prior to the actual run, the system was conditioned for
six hours by introduction of mercury free n-hexane. The feed flow rate was set at 400 ml
hr (LSHV about 4 hr '*). After completk)n of the conditioning stage, n-hexane spiked
with organomercuiy species was introduced as feed. The system was stabilised for another
two hours before collection of samples from both feed and product stages were taken
(every two hours for mercury species determmation).
The mercury removal process was carried out for a total of 8 hours. After this process, a
mercury-fiw n-hexane feed was introduced and the reactor tube was reversed. Sanq)les
taken after the reactor were monitored for mercury species content. The e;q)eriments were
only performed to assess the capability of the adsorbents at removing particular mercury
species, i.e. the organomercury con^unds. The adsorbing capacity or break through curve
was not determined due to time constraints and specification limitations.
5.2.4 The determination of total and mercury species in samples
The determination of mercury species in the sanq)les was carried out using gas
chromatography coupled with pyroIysis-AFS. The details of this technique were discussed
in Chapter 4.
For the adsorbent A system, the GC column used for speciation analysis of samples was an
RTx-1 non-polar capillary column (Ld. 0.53 mm, 30 metre length and 1.0 ^im fihn
thickness). The operating conditions used were those given in Chapter 4, Table 4.1. For
adsorbents B and C, the column used was a WCOT Uhimetal, with Cp-SnnDist stationary
phase,1.2 ^m thickness, i.d. 0.53 mm, 10 metre length (Chrompac, Middleburg, The
159

Netherland). The operating conditions used for this column are shown in Table 5.5. The
determination of the total mercxuy content in san^les fed to the adsorbent A system was
carried out using the vaporisation and trapping technique discussed in Chapter 3
PRODUCT 1
Sout A
FEED
PacMng nurtDrial
GAS r — M
PRODUCT 2 R2
OVEN
SEPARATOR
Adsorbent
LIQUID
PRODUCT 3
HydroQen
Figure 5.1 : A schematic diagram of the two stage mercury-removal pilot plant
(lab scale)
160
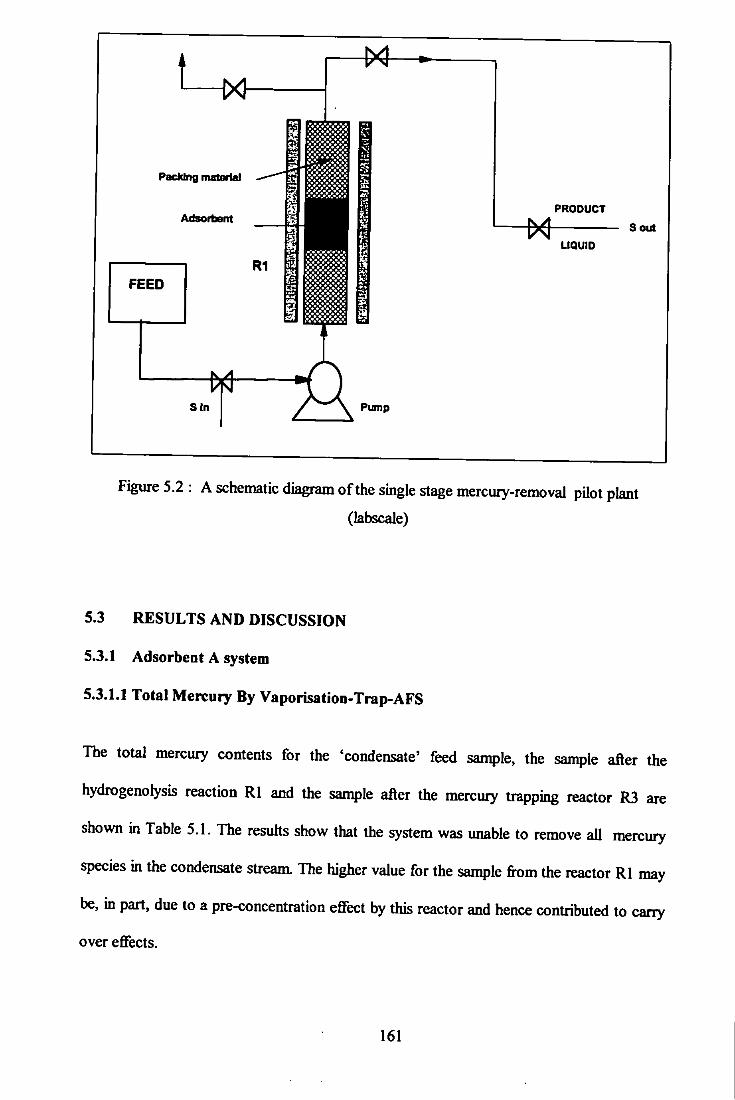
Packing material
Adsorbent
FEED
s in
PRODUCT
^ Sout LIQUID
Pump
Figure 5.2 : A schematic diagram of the single stage mercury-removal pilot plant
(labscale)
5.3 RESULTS AND DISCUSSION
5.3.1 Adsorbent A system
5.3.1.1 Total Mercury By Vaporisation-Trap-AFS
The total mercury contents for the 'condensate' feed sample, the sample after the
hydrogenolysis reaction Rl and the sample after the mercury trapping reactor R3 are
shown in Table 5.1. The resuhs show that the system was unable to remove all mercury
species in the condensate stream. The higher value for the sample from the reactor Rl may
be, in part, due to a pre-concentration effect by this reactor and hence contributed to carry
over effects.
161

Feed Aver^±S.D.
(ngml • )
After hydrogenolysis reactor Ayenge±SJ>,
(ngml*)
After mercury trapping reactor
Average+ S.D. (ng ml -1)
26 .2+IJ 70.9 + 8.1 • 17,8+1.4
Based on 6 and 10 • replicates
Table 5.1 : Total Mercury Content in samples by the vaporisation technique-
system A
5.3.1.2 Determination of mercury species content
The feed sample was found to contain 4 different mercury species as shown in Table 5.2.
Two of these were identified as DMM and DEM. From the retention times the other two
organomercury species were attributed to alkyl mercury species between DMM and DEM
(possibly Methyl Ethyl Mercury (MEM) and Methyl Propyl Mercury (MPM))(187). These
species was not determined due to the absence of suitable standards and do not correspond
to other species determined using this cohmm system Le. Hg°, DPrM, DBM, MMC, EMC,
DPM and PMC. The presence of MEM in gas condensate has recently been identified
(187).
The samples after the hydrogenolysis reactor also nominally contain four species. Table 5.3,
three of these were identified as elemental mercury, DMM and DEM. The fourth species
was also attributed to a dialkyi mercury species (possibly MEM). These results show that
the elemental mercury present was a conversion product fi-om an organomercury species.
However, the conversion was found to be only about 30 % of the total mercury in the
sample. One other reason for the low elemental mercury could be that elemental mercury
was carried over to the gas stream (via R2) instead of remaining in the liquid streano.
162

As stated previously, condensate can contain about 20 % wt of unsaturated hydrocarbons
in the form of aromatic and olefin compounds. One possibility is that the hydrogenation
process in reactor 1, targets the unsaturated compounds rather than the organomercury
itself. Hence the efficiency of conversion of the organomercury species to the elemental
form is reduced by these components. One hnportant drawback to this two stage process is
that the feed condensate has to be hydrogenated. This changes the grade of condensate, in
particular the aromatic content, vAdch defines its quality. A downgraded product is
therefore created in order for partial mercury removal to be achieved.
The mercury species found in the samplt after the mercury trapping reactor. Table 5.4,
were DMM, DEM and the two other previously attributed alkyl mercury species. No
elemental mercury was detected. This indicated that the elemental mercury firom the first
reaction had been adsorbed by the second trapping reactor. Examples of the
chromatograms for the three sample stages including the standard mercury species are
shown in Figure 5.3.
Peak
No
RT(miii)
- , ±0.5iiiin
FE£D CONDENSATE Peak
No
RT(miii)
- , ±0.5iiiin Area%
Mercury Content
calculated based on
Ttrtal mercury analygis
(ngml ' )
Spedes
1 1.7 0 0
2 5.5 10.3 + 0.5 2.7 DMM
3 9.5 43.4 + 5.1 11.3 Dialkyl Hg Species
4 12.5 29.2 ± 5.1 7.7 DEM
5 13.5 17.1 + 1.8 4.5 Dialkyl Hg Species
Total 26.2
S.D. base on 4 replicate analyses
Table 5.2 : Speciation data for feed condensate- system A
163

Peak; CONDENSATE'AFTERi> ;
:j HYDROGENOLYSES REACTOR (Rl) ,''v.7-- ."-I - ' '- • • •'- -. rC* rV-^"'"' •• ' , ' ' - - - " ? ; - , . •
lf;< Spedes' J f
.'• o . * • ' • -J
Peak;
'- --- *
- "-•• >" - ? -.Vv '-"'.v '" -w- o.'"-' • - ' • / * * • - ' - i
;^:'Mcmu7 Content
caknlated based on'
Total D K i T a ^ analysb
,''v.7-- ."-I - ' '- • • •'- -. rC* rV-^"'"' •• ' , ' ' - - - " ? ; - , . •
lf;< Spedes' J f
.'• o . * • ' • -J
1.7 33.4 + 3.2 23.7 Hg°
2 5.5 8.1 + 1.1 5.8 DMM
3 9.5 39.0 + 2.9 27.6 DialkyI Hg Species
4 12.5 19.5 + 1.4 13.8 DEM
5 13.5 0 0 DialkyI Hg Species
Total 70.9
S.D. base on 4 replicate analyses
Table 5.3 : Speciation data for samples after the hydrogenolysis reactor Rl
(system A)
No '
•/
• TV
V GOraENSATC AFTER
' 'wy;>RffiRcyR\^RE^
'V: 7->--"l Species "V.v >; • ; . . ; • ; .^
No '
•/
• TV
y-h. * V - : ^
• Mercuiy
calcalatc^ basc^ bn l '
Total merau^
'V: 7->--"l Species "V.v >; • ; . . ; • ; .^
1 1.7 0 0 Hg°
2 5.5 11.3 + O.I 2 DMM
3 9.5 50.3 1 0.7 9.0 DialkyI Hg Species
4 12.5 38.4 + 1.7 6.8 DEM
5 13.5 0 0 DialkyI Hg Species
Total 17.8
S.D. base on 4 replicate analyses
Table 5.4 : Speciation data for sample after the mercury trapping reactor R3
(system A)
164
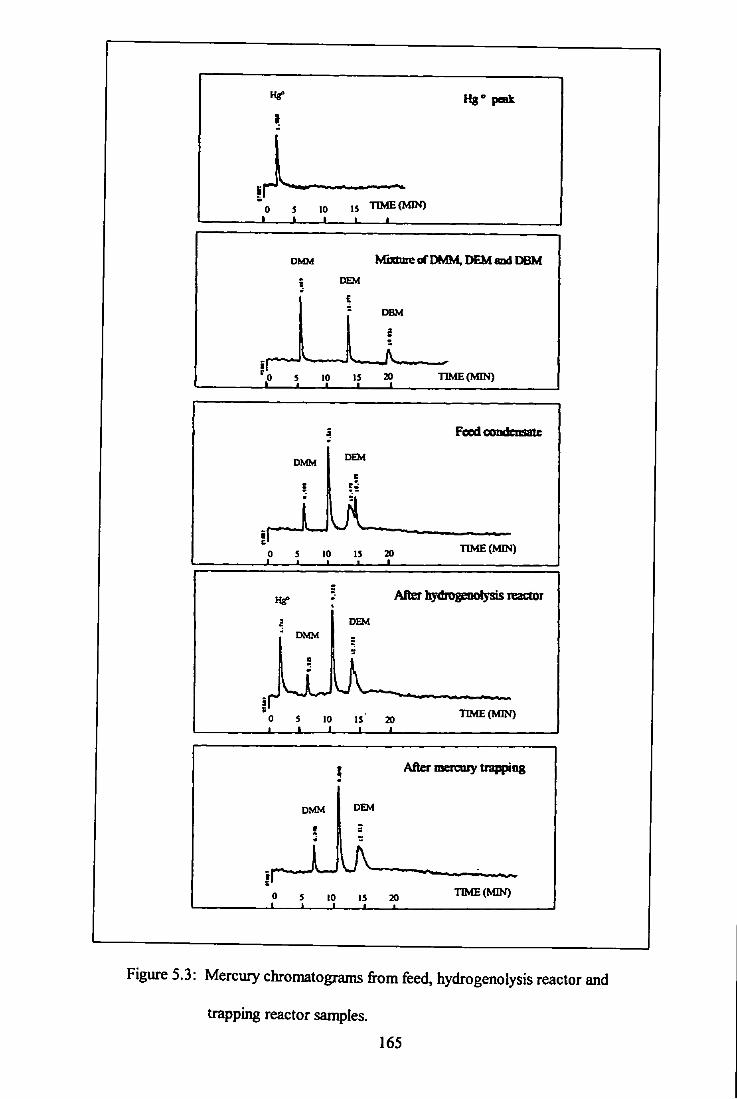
Hg» peek
\ 1
i r 0 5 ^Q ,5 T1ME{MIN)
I I I !
DMM Mixture of DMH DEM and DBM 2 DEM
DBM
— L L 0 5 10 1$ 20
J 1 1 I L TIME(MIN)
Food coifcdt ^^ c
5 10 15 20 - I 1 1 1 _
TIME(MIN)
DMM
After bydrogOKrfysis reactor
TIME (MIN)
1 After mercniy trapping
DMM DEM
t
1 ^
^ ^ ' 0 5 10 1 1 1
,3 TIME (NUN) - . 1 1
Figure 5.3: Mercury chromatograms from feed, hydrogenolysis reactor and
trapping reactor samples.
165

5.3.2 Adsorbent B
Adsorbent B was a carbon based product impregnated with a sulphur compound. The
species identification in the feed san^les and product (after trapping) san^les are shown in
Table 5.5. Three species of organomercury (DMM, DEM and DBM) were spiked into the
n-hexane (20, 30 and 20 ng ml ' respectively as Hg). There were no peaks detected in the
product samples after the reactor i.e. the removal of mercury species spiked into the feed
stream was 100 % efiBcient. Examples of the chromatograms before and after the reactor
are shown in Figure 5.4.
ADSORBENT: B ( Carbon Based )
Sampling No
Feed Product
Sampling No Area ( x I C )
Sampling No Peakl
(DMM)
Peak 2
(DEM)
Peak3
(DBM)
Peakl
(DMM)
Peak 2
(DEM)
Peaks
(DBM)
Sample 1 ll.OOhrs
9.1 16.4 9.7 0 0 0
Sample 2 13.00 hrs
8.9 15.9 8.1 0 0 0
Sample 3 15.00 hrs
7.9 15.4 9.1 0 0 0
San^le 4 17.00 hrs
6.8 14.9 9.4 0 0 0
Overall 8.2 + I . I 15.7 ±0.7 8.9 ± 0.7 0 0 0
Column used
Column flow rate: Oven temperanire:
WCOT Ultimetal, with Cp-SimDist stationary phase (1.2 ^m thidmess, i.d. 0.53mm, 10 metre length)
5 ml min Argon 35 *>C (5 min) to 300 °C (5 X min ' )
Table 5.5 : Mercury species before and after removal system for adsorbent B
166
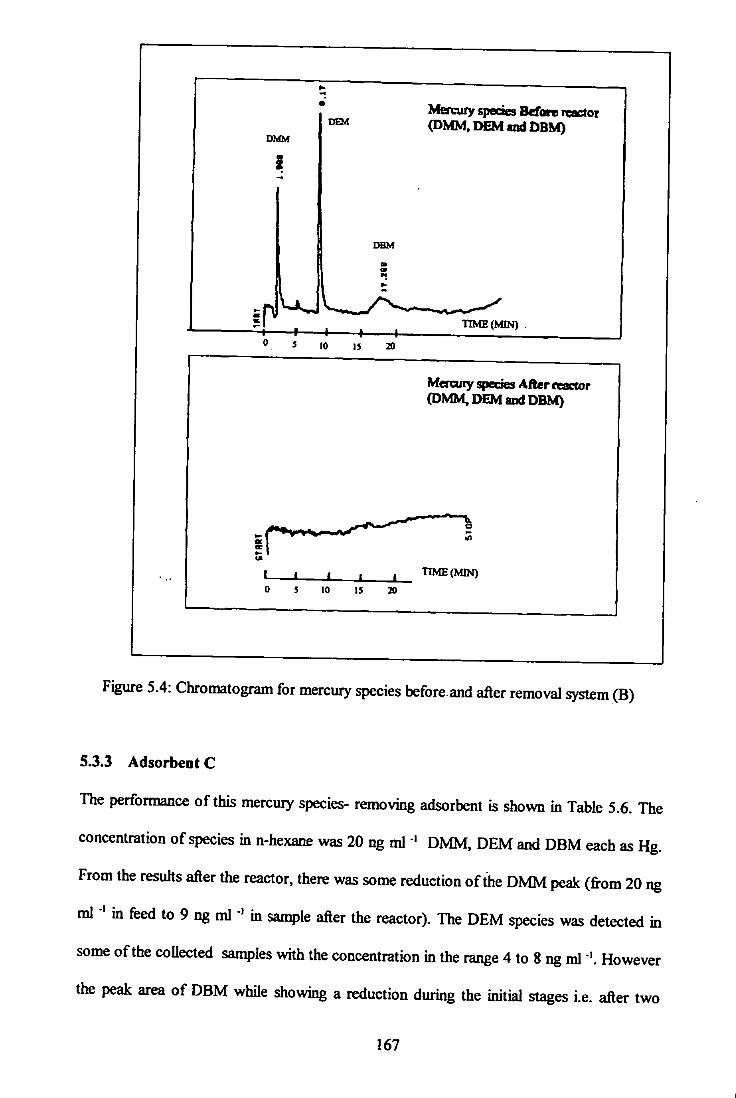
DMM
• 4
•
DEM Mennuy species Before rector (DMM, DEM and DBM)
{
DBM
e> <m
1
f
1 »•
1 k 1 _ TIME (MIN) .
0 5 10 1$ 20
Mercuiy species AAer reactor (DMM, DEM and DBM)
t — I I ' » 0 3 10 15 20
TIME (MIN)
Figure 5.4: Chromatogram for mercury species before and after removal system (B)
5.3.3 Adsorbent C
The performance of this mercury species- removing adsorbent is shown in Table 5.6. The
concentration of species in n-hexane was 20 ng ml ' DMM, DEM and DBM each as Hg.
From the results after the reactor, there was some reduction of the DMM peak (from 20 ng
ml * in feed to 9 ng ml * in sample after the reactor). The DEM species was detected in
some of the collected samples with the concentration in the range 4 to 8 ng mlHowever
the peak area of DBM while showing a reduction during the initial stages i.e. after two
167
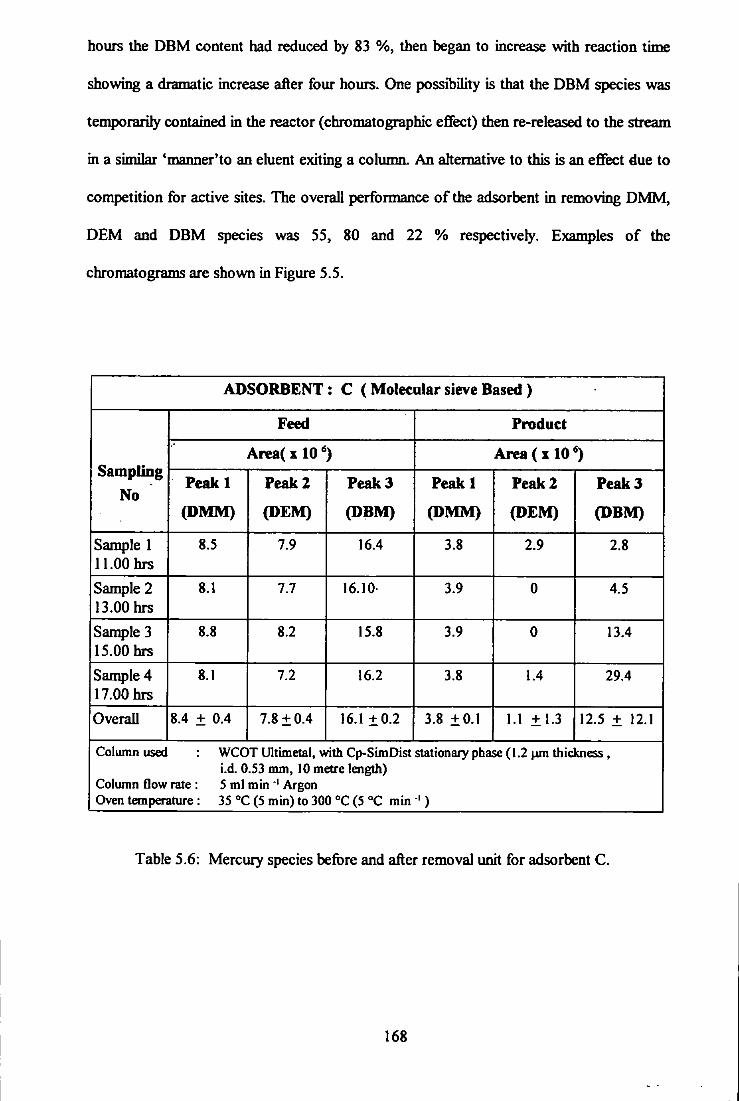
hours the DBM content had reduced by 83 %, then began to increase with reaction time
showing a dramatic increase after four hours. One possibility is that the DBM species was
tenqx)rarily contained in the reactor (chromatogr^hic effect) then re-released to the stream
in a similar 'manner'to an ehient exiting a column. An alternative to this is an effect due to
competition for active sites. The overall performance of the adsorbent in removing DMM,
DEM and DBM species was 55, 80 and 22 % respectively. Examples of the
chromatograms are shown in Figure 5.5.
ADSORBENT: C ( Molecular sieve Based )
Feed Product
Sampling No
Area( x 10 ) Area (x 10') Sampling
No Peakl Peak 2 Peak 3 Peakl Peak 2 Peak 3
Sampling No
(DMM) (DEM) (DBM) (DMM) (DEM) (DBM)
Sample 1 ll.OOhrs
8.5 7.9 16.4 3.8 2.9 2.8
Sample 2 13.00 hrs
8.1 7.7 16.10- 3.9 0 4.5
Sample 3 15.00 hrs
8.8 8.2 15.8 3.9 0 13.4
Sample 4 17.00 hrs
8.1 7.2 16.2 3.8 1.4 29.4
Overall 8.4 ± 0.4 7.8 ±0.4 16.1 ±0.2 3.8 ±0.1 1.1 ±1.3 12.5 ± 12.1
Column used
Column flow rate : Oven tonperature:
WCOT Ultimetal, with Cp-SimDist stationary phase (1.2 ^m thickness, i.d. 0.53 mm, 10 metre laigth) 5 ml min ' Argon 35 °C (5 min) to 300 X (5 °C min ' )
Table 5.6: Mercury species before and after removal unit for adsorbent C.
168

DMM Mercuiy species Before reactor (DMM, tmA and DBM)
DEM
DBM
TIME (NUN)
DMM
t4
Merony Species After reactw (DMM, DEM end DBM)
DBM DEM
TIME (NUN)
Figure 5.5 : Example of mercury chromatograms before and after removal unit
for adsorbent C
5.4 CONCLUSION
Ail three pilot plant-tested mercury-removal systems A, B and C showed a reduction in the
mercury content of the final products. For the adsorbent system A, the hydrogenolysis
reactor was able to convert some of the organomercury present in the gas condensate feed
to its elemental form However the amount of elemental mercury measured was only about
30 % of the total mercury content. Incomplete conversion of the organomercury species to
mercury metal may be due to competition between the organomercury species and the
169
unsaturated compounds in the matrix during the hydrogenation reaction. One other reason
could be that elemental mercury was carried over to the gas stream mstead of remaining in
the liquid stream. The result from the first reactor (hydrogenation) also showed a higher
total mercury content conq)ared with the feed condensate. This could be due to a
pre-concentration effect resuhing in mercury cany- over by the liquid condensate stream
to the adsorber. The second reactor (mercury trapping) was able to adsorb elemental
mercury present in the stream (the product from the first reactor) but was unable to remove
the organomercury content fix)m the condensate stream.
For the single stage adsorbent system B, the eflficiency in removing spikes of DMM, DEM
and DBM from the n-hexane hydrocarbon sample was very high. Removal of the species
was 100 % with no indication of mercury present in the product. For adsorbent system C,
efficiency of removal for the different mercury species spiked into the n-hexane was
variable. Over 50 % of DMM was removed using the adsorbent, while the DEM showed a
range of 60 to 80 % removal The DBM was initially adsorbed eflBciently (>80% at two
hours) but was rapidly released back into the product stream after foiu- hours.
The above results indicated that speciation of the mercury content is vital in the evaluation
of an adsorbent systems eflficiency. The performance of an adsorbent was dependent upon
the type of adsorbent and, for the A and C systems, the mercury species present in the feed
streanL The determination of total mercury only in feed and product samples in the system
will not give all the necessary information for an unbiased evaluation to be made of the
performance of an adsorbent.
The results obtained, while indicative of the adsorbents performance are no guarantee of
their efficiency using a real sample and should only be used as a guide. Those adsorbents
170
which show a suitable potential for removing mercury species, will require longer pilot
plant studies using real gas condensate as the feed over a longer monitoring plant period.
171

CHAPTER 6
CONCLUSIONS AND FUTURE WORK
CHAPTER 6
CONCLUSIONS AND FUTURE WORK
6.1 CONCLUSIONS
The study which investigated the recovery of various organic and inorganic mercury
species, spiked into synthetic and real condensate samples using different digestion and/or
extraction techniques, showed that recovery was dependent upon the speciation.
Using a persulphate digestion technique, the recovery of an organomercury standard was
less than 30 %. Further experiments bdicated that the persu^hate added for the digestion
step had been consumed by the sample matrix rather than targeting the mercury species.
When usmg the iodide/iodate digestion technique, only one mercury species, DPM, gave
full recoveries. Other mercury species, EMC, PMC and DMM gave recovery values of less
than 50 %.
The extraction procedures involving complexation with dithizone and/or thiosulphate were
found to be unsuitable for *real' condensate sanq)Ies. Very low recoveries, less than 18%,
of various mercury species were obtained.
The combined extraction and digestion technique involving L-cysteine and potassium
persulphate gave encouraging results with recoveries of over 90 % for the species DPM,
EMC, MC and PMC. However, one species of considerable interest in gas condensate is
DMM and using this procedure a recovery value of 15 % was observed. Further studies of
the critical extraction and digestion parameters Med to improve the recovery value for
DMM.
172
It was concluded that the fevoured procedures previously used for digestion and/or
extraction of mercury species fi-om water and sediment sauries together with some
modified and new procedures were of limited application to gas condensates. This was
in-part, if not entirely, due to the complex and volatile nature of the non-polar organic
liquid sample which contained only ultra-trace levels of different mercury species.
A relatively simple, rapid, accurate and precise technique for the determination of total
mercury in gas condensate and other liquid hydrocarbon samples has been developed. A
glass chamber, maintained at 400 *C was used to vaporise samples which were carried in
argon, via a heated* transfer line, to a gold-coated silica trap held at 200 °C. At this
temperature the mercury species were adsorbed efGciently and retained on the trap while
the conqjlex volatile matrix was swept to waste. Elemental mercury was released rapidly
when the trap tenq>erature was raised to 900 °C and swept with argon gas to an atomic
fluorescence detector for measurement.
Experiments which investigated the optimum operating conditions, sample volumes and
certain design characteristics of the technique showed that the double-sized trap was
required to retain mercury species eflBciently for san^le volumes up to 1.0 ml. An argon
carrier flow rate of 300 ml min ' was used to transport the matrix and the mercury vapour
in the system. The sample vaporisation time was dependent upon the sample volume and
sample type (usually 5 to 10 minutes for 0.25 to 0.5 ml of condensate).
The recoveries for eight different mercury species spiked in toluene and in 'real' gas
condensate (10 to 50 ng mi were generally over 90 %. The types of species studied were
dialkyl and diaryl mercury, alkyl mercury chloride, aryl mercury chloride, mercury chloride
and organo-thio mercury. The absolute limit of detection for a mercury species spiked into
173
gas condensate, for example DEM, was found to be 270 pg. This corresponded to,
approximately 1 ng ml for a 0.25 ml sample injectioa When injection errors were
removed, the limit of detection corresponded to 11 pg (absohite).
Five 'real' gas condensate samples gave total mercury values between 7.5 and 50 ng ml 'K
When the technique was extended to look at the mercury content of light fraction
'gasolines' at ultra-trace level (< 1 ng ml * mercury) san^le vohmies of 1.0 ml were
required. Total mercury values ranged from 42 to 87 pg mT' for different 'gasolines'. In
order to measure the mercury content of 'higher fraction' oils, saniq les were required to be
mixed with a suitable solvent e.g. toluene. This was to increase their vaporisation rate and
to remove the tr^based interference effect fit)m the very high boiling point comqwnents of
the matrix. It was also evident that the mercury content of the 'heavy' oil sample was much
higher than gas condensates (ranging from 2 to 22 |ig ml and a dihition step was
necessary for this sample type. Sample dilutions in the range 20 to 100 times were found to
be effective.
Gas chromatography when coupled, via a pyrolysis unit, with an AF detector was able to
determine mercury species directly in natural gas condensate at the picogram level The
instrumentation is relatively simple and easy to operate. No pre-treatment of the sanq)les
was required prior to mercury determinatioa The results obtained were reliable for a given
column system and gave positive identification of the organomercury species, DMM,
DEM, DBM, DPM, MMC, EMC, and PMC. It was noted that the species DEM and
MMC co-eluted when both were present in a synthetic mixture.
174
Direct sample injection were performed into a deactivated silica liner maintained at 125 *'C
in the injector port. This temperature was the highest that could safely be used without
degradation or conversion of mercury species taking place.
The direct determination of mercury species in hydrocarbon liquids and gas condensate
sanqjies was carried out successfiiUy by using both polar or non-polar megabore capillary
cohmins. The use of megabore capillary coliunns permitted larger volimies of hydrocarbon
sanqjles to be injected and therefore improved sample loading and the limits of detection
for mercury species (2.5 to 7 pg, absolute, for 1.0 | i l injections of a range of species).
The slopes of the cahljration graphs from different organomercury species were found to be
nearly identical to that of elemental mercury. This response effect allowed unidentified
species to be quantified in terms of their mercury contribution.
The major species observed in condensate samples were DMM, DEM and the assumed
DPrM. Mass balance calculations show a strong correlation between the total mercury
content of a sample obtained from the vaporisation technique and the summation of all
species determined by GC-Pyrolysis-AFS.
The presence and proportions of certain mercury species in gas condensate are highly
dependent upon the source, the stage of production, the sampling technique used, storage
of the sample and age of the sample.
All three pilot plant-tested mercury-removal systems A, B and C showed a reduction in the
mercury content of the final products. In the two stage system. A, the hydrogenolysis
reactor converted some of the organomercury present in the gas condensate feed to its
175
elemental form. However the elemental mercury measured in the liquid product from this
first reactor was only about 30 % of the total mercury content. Inconqjlete conversion of
the organomercury species to mercury metal by this reactor may be due to con^tition
between the organomercury species and the unsaturated compoimds in the matrix during
the hydrogenation reaction. The second reactor, for mercury trapping, was able to adsorb
elemental mercury present in the liquid stream (the product from the first reactor) but was
unable to remove the organomercury content fi^m the condensate stream.
For the single stage adsorbent system B, the efficiency in removing the species DMM,
DEM and DBM from n-hexane hydrocarbon samples was 100 % with no indication of
mercury present in the product stream over an eight hours contmuous nm.
For the adsorbent system C, the efficiency of removal for different mercury species in
n-hexane was variable. While DMM and DEM showed a consistent removal range of 50 to
80 %, the DBM was efficiently adsorbed, but only for a short period (> 80 % at two hours)
and it was rapidly released back into the product stream after four hours.
Speciation of the mercury content of gas condensates is vital in the evaluation of an
adsorbent systems efficiency. The determination of total mercury only in feed and product
samples m the system will not give all the necessary informatioiL
176

6.2 FUTURE WORK
The vaporisation and trapping technique at elevated tenq>eratures, discussed in Chapter 3,
was very successfiil for the determination of total mercury in natural gas condensate
samples and other liquid hydrocarbons. This technique could be extended to inchide other
samples types that are related to the petroleum industry as well as to general environmental
samples. For the former this could inchide heavy crude and fiiel oils, waste waters and
shidges; all of which are produced in very large volumes during the processing of gas and
oil. Many of these sample types are discharged to the environment after only limited
treatment and the monitoring of toxic elements, especially mercury, in these samples is
very important. For its determination, some modifications of the technique will be required,
especially with regard to the sample mtroduction system
The high 'total mercury' content of the heavier oils may be due to the presence of
sulphur-bonded species. One possible route to the speciation of its mercury content could
be bom the use of suitably high ratio mixing with solvent (1:500) prior to direct injection
into the GC-pyro-AFS system.
Although not tried to date with the vaporisation technique, an extension should be made to
include (i) organic liquid extractions of solid samples, and (ii) aqueous samples directly, in
order to determine their total mercury content. The ability to determine the mercury species
in these organic extractants is also possible given the results bom the column speciation
studies in Chapter 4.
The performance of two types of megabore column, polar and non-polar were evaluated in
Chapter 4 in terms of their ability to separate and identify mercury species in natural gas
condensate. Both columns were able to separate several dialkyl mercury species that were
177
likely to be present in natural gas condensate while only the polar cohunn could be used for
separation of several organomercury halide species. However, it was foimd that the MMC
species was ehited at the same retention time as DEM for both cohmm. Although the
presence of MMC in gas condensate is still in debate (and if present, is it only a very minor
constituent) a study of other column types should be made to bring about their separatioa
The use of cohmms with different stationary phases/different polarity, pre-treatment or
chemical modification may be introduced. One important modification to the operating
conditions should, however, be tried first with the current polar column. That is the use of a
cryogenic oven to extend the programme fecility and take greater advantage of the physical
properties of the species.
The distribution and concentration of total mercury and its species in a condensate line
from a processing plant has not been performed to date because of the analytical problem
discussed in this thesis, a comprehensive Le. mass balance, study can now be carried out
using the technkjue developed and discussed in Chapter 3 and 4. This infonnation is very
important, not only for processing purposes, but also for monitoring the safety in: )Iications
for the food chain and the environment.
The eflficieiKies of different commercially available adsorbents in removing mercury from
condensates, on a laboratory/pilot scale are varied and are dependent upon the type of
adsorbent, the mercury species present and the type of feed. Of the three mercury removal
systems tested to date, only 'adsorbent B' showed the required removal efficiencies (100%)
for the major mercury species expected in condensates. However, this trial was performed
using a substitute, liquid hydrocarboa Pilot tests using real gas condensate should be
performed, prior to any larger scale studies together with break-through capacities and life
time efficiencies. Other conunercial adsorbents can be evaluated and all can be ranked in
178
terms of their efficiency for mercury removal frx)m condensates under real plant conditions
together with their cost nnplications. Such an undertaking could not be considered feasible
prior to the research and development contained in this thesis.
It was found, fix)m the studies shown in Chapter 2, that the digestion and/or extraction
techniques, used for the determination of total mercury in hydrocarbon san^les were
species dependent. These reactions were based upon both known and new liquid-liquid
phase systems. However, the results from Chapter 5 indicate that an adsorber, such as the
type 'BB' (sulphur on carbon), could have some promise as a solid-phase extractor for
total mercury measurement. A study of this material and similar types should be made to
evaluate their use as a solid-phase 'total mercury remover' from hydrocarbon, condensate
and aqueous san^les. Both batch and cohmin systems could be employed, with separation
if necessary, prior to a suitable aqueous digestion or stripping technique being used to
release the mercury for its total detenninatioa
179
CHAPTER 7
REFERENCES
CHAPTER?
REFERENCES
1 Wiseman, P., "Introduction to Industrial Organic Chemistry", 2nd. Editions,
Applied Science Publisher Ltd., London 1979.
2 Meyer, M., and Staibie, F., "10th. International Conference on LNG", Kuala
Lumpur, Malaysia, Session 3, paper 3, May. May 1992.
3 Barthel, Y., Cameron, C.J., Gracco, F., Orieux, A. and Sarrazin, P., "Mercury
Removal From Wet Natural Gas", 10th. Continental Meeting Gas Processor
Association, May 1993.
4 Haselden, G.G., "The Challange of LNG in the 1980's ", Mech. Eng., March
1981,103,46-53.
5 Bodle, W.W., Attari, A , and Serauskas, R- "Considerations for Mercury in LNG
Operations", Inst, of Gas Tech., 6th. Int. Conference on LNG, Kyoto Japan,
Paper 1, April 1980.
6 Bigham, M.D., " Field Detection and Implications of Mercury in Natural Gas",
SPEProd Eng., May 1990, 120-124.
7 Sarrazin, P., Cameron, C.J., Barthel, Y., and Morrison, M.E., Oil and Gas
Journal, Jm 1993, 86.
8 Freeh, W., Baxter, D.C., Dyvik, G., and Dybdahl, B., J. Anal. At. Spectrom,, Oct
1995,10, 769.
9 Schickling, C, and Broekaert, J. A. C, Appl. Organomet. Chem., 1995,9, 29.
180
10 Leeper, J. E., "Mercury Corrosion in LNG Plant", Energy Processing/CamdsLy
Jan-Feb 1981,46-51.
11 Leeper. J. E., " Mercury - LNG Problem", Hydroc. Proccs., Nov. 1980.
12 Cameron, C.J. Didilion, B., Benayoun, D., and Dorbon, M.," Mercury; A Trace
Contaminant in Natural Gas and Natural Gas Liquids", Eurogas 96, June 1996.
13 Situmorang, M.S.M., and Muchlis, M., " Mercury Problems in The Arun LNG
Plant", Sth. International Conference on LNG, Los Angeles, June 1986, session
2, paper 5.
14 Shigemura, Y., Hasegawa, T., Cameron, C. J., Sanazin, P., Barthel, Y., and
Courty, P., 3rd. International Petrochemical Conference, Sept. 1991, Singapore.
15 Cameron, C.J. Barthel, Y., and Sarrazin, P., 7ird Annual Convention of the Gas
Process. Assoc., 1994, New Orleans.
16 Shafewi, A., AbdHamid, H . , " Mercury Removal from Malaysian Natural Gas",
Petronas project report No. 203, Unpublished.
17 Kayat, Z., Miskon, S., and Ali, A.K, "Design Consideration for Mercury
Removal System", Nada Petronas, 1994, Ui Dublished.
18 Bogani, F., 10th. International Conference on LNG, paper 4, session 2, May
1992, Kuala Lumpur.
19 Reid, J.A., and McPhaul, D.R., 8tL Annual Ethylene Producer Conference.
American Institute of Chemical Engineering (AICE) Spring National Meeting,
paper 21c, 1996, New Orleans.
181
20 Torconis, B., and Jimerez, A., 75th. Annual Convention of the Gas Processor
Association, 1996, Denver, Pre-print.
21 Lund, D., Oil and Gas Journal, May 1996, 70.
22 Anon, Oil and Gas Journal, May 1996, 76.
23 Frenken, P., and Hubbers, T., American Inst, of Chemical Eng, Spring National
Meeting, proceeding paper 27a, April 1991, Houston.
24 English, JJ., American Inst, of Chemical Eng,, Spring National Meeting,
proceeding paper 74c, April 1989, Houston.
25 Afifrossman, S., and Paton, "Interaction of Mercury with Pt and Pd surfeces", J.
Soc. Chem. Ind. (London), Monograph 28, 1968, 151.
26 U.S. Dept. of Labour Occupation Safety and Health Adminstration, Title 29,
Code of Federal Regulation Part 1910.1000.
27 Markovs, J., 45UL Annual Laurence Reid Gas Conditioning Conference, Proceed
ing 133, March 1996, Norman Oklahoma.
28 Grayson, M. , and Eckroth, D., Kirk-Othmer Encyclopedia of Chemical Technol-
ogyy Wiley-Interscience, New York, 15,1981,143.
29 Weast, R.C., and Astle, M.J., "C^C Handbook of Chemistry and Physic", 63rd.
edition, CRC Press Inc., 1982-83, D34.
30 Calow, P., "Ecotoxicology : What are we trying to protect", Env, Toxicology and
Chem, 1994,13,1549.
31 Wilhelm, S.M., and McArthur, A., "Removal and Treatment of Mercury
Contamination at Gas Processing Plant", Soc. of Pet, Eng„ (SPE No. 29721).
182
32 Heaton, A., "An Introduction to Industrial Chemistry", 3rd Ed.. Blackie
Academic and Professional, Chapman and Hall, Glasgow, 1996.
33 Orszulic. S.T., "Environ^ntal Technology in the Oil industry", Blackie Academic
and Professional, 1st. ed., 1997.
34 Evan, J .M, Charlton, D.S., Stephan, D.J., "Mercury Disposal and Clean-up
Option in LNG Industry", A.G.A. Distribtition/Transmission Con/, 1993,
Orlando.
35 Stephan, D.J., Fraky, R.H., Henke, ICR., Schmit, C.R., "A Review of Remedia
tion Tech. Applicable to Mercury Contamination at Natural Gas Industry Sites",
Gas Research Inst., September 1993.
36 Wilhem, S.M.. McArthur, A., and Kane, R.D., "Methods to Combat Liquid Metal
Embrittlement in Cryogenic Aluminium Heat Exchanger", 73rd. GPA
Convention, 1994, New Orleans.
37 Bridges, J.C., "Federal Regulatory Prespective", Report No. GRI92/0214, GRI,
1992.
38 "Toxicok)gy Profile for Mercury", Agency for Toxic Substances and Disease
Registry (ATSDR), US PubUc Heahh Service and EPA, 1989.
39 Hatch,W.R., and Otto, W.L., Anal. Chem., 1968,40, 2085.
40 Chilov, S.. Talanta, 1975,22,205-32.
41 Analytical Methods Committee, Society for Analytical Chemistry, Analysty 1965,
90,515-30.
42 Ure, A. M . , Anal Chim. Acta, 1975,76,1-26.
183
43 Morita, H., Tanaka, H., and Shimoura, S., Spectrochim. Acta, 1995. 50 B, No. 1,
69- 84.
44 Yan,X.P.andZheMing.N., Anal Chim Acta 1994,291, 89-105.
45 Ebdon, L., "An Introduction to Atomic Absorption Spectroscopy", Hyden,
London, 1982
46 Clevenger, W.L., Smith, B. W., and Winefordner, J.D., Critical Rev, in Anal
Chem.,1997, 27(1). 1-26.
47 Guo. T., Baasner, J., J. Autom. Chem., 1996,18(6) 221.
48 hippo, H., Jauhiainen, T.. Peramaki, P., At. Spetrosc, 1997.18 (3), 102.
49 Karakouska, E., Pulis, P., (Tech. Univ. Kosice, Kosice, Slovakia), Presented at 2
nd. European Furnace Symposium, St. Petersburg, Rusia, May 1996.
50 Murphy, J., Jones, P. and Hill, S.J., Spectrochim. Acta, Part B, 1996. 51 B (14).
1876.
51 Guo, T. Baasner, J., J. Autom. Chem., 1996,18(6), 217
52 Steeg, U., Pohl, B., Labor-Med„ 1996.19(3), 110.
53 Chien, Y.C., Feldman, C. A., Zohn, H. K.. and Weisel, CP.. 5c/. Total Environ.,
1996,188, 39.
54 Baranowska, I . , Szmyd, E.. Baranowska, K., and Czemicki, f L , Pol. J. Environ.
Stud., 1996.5(1), 27.
55 Zhou, C. Y., Wong, M.K., Koh, L.L. . and Wee, Y.C., Anal. Sci., 1996, 12(3),
471.
184
56 Lamble, K. J., and Hill, S.J., J. Anal. At. spectrom., 1996, H , 1099.
57 Heyward, M.P., Hurle, RX., and Sauerhammer, B., Anal. Commun. 1997, 34
(10), 279.
58 Aduna de Paz, L. , Alegria, A., Barbera, R., Farre, R., and Largarda, M.J., Food
Chem., 1997, 58(1-2), 169.
59 Talebi, S.M., Jahanbazy, N . , (Dept. Chem., Univ. Isfehan, Isfehan, Iran),
Presented at Int. Congress on Anal. Chem., Moscow, Rusia, June 15-21, 1997.
60 Hutton, R.C., Preston, B., Analyst, 1980,105, 981-4.
61 Swift, R.P., Cambell, J.E., Spectroscopy, 1993,8, 38-47.
62 Janjic, J., and Kiurski, J., Water Res., 1994,28,233-5.
63 Corns, W.T., Stockwell, P.B., and Jameel, M , Analyst, 1994,119,2481-4.
64 Bloxham, M.J., Hill, S.J.. and Worsfold, P. J., J. Anal. At Spectr., 1996, 11,
511-4.
65 Dumarey, R., Heindryckx, R., Dams, R., and Hoste, J., Anal. Chim. Acta, 1979,
107, 159-67.
66 Dumarey, R., Dams, K , and Hoste, J., J. Anal. Chem., 1985, 57,2638-43.
67 Yoshida, Z., Motojima, K., Anal. Chim. Acta, 1979,106, 405-10.
68 Fitzgerald, W.F., Gill, G.A., Anal. Chem., 1979,51, 1714-20.
69 Oafeson, J., Anal. Chim. Acta, 1974, 68,207-11.
70 Temmerman, E., Dumarey, R., and Dams, R., Anal. Lett., 1985,18,203-16.
185

71 Gill, G. A.. Fitzgerald, W. F., Mar. Chem., 1987, 20, 227-43.
72 Hanna, C. P., Tyson, J. F., and Mcintosh, S., Anal. Chem., 1993, 65, 653-6.
73 Hovat, M. , Lupsina, V., and Pihlar, B., Anal. Chim. Acta, 1996,243,71 -9.
74 Brandvold, D.K., Martinez, P., and matlock, C , Anal. Instr., 1993,21,63-7.
75 Ombaba, J. M . , Microchem. J., 1996, 53, 195-200.
76 Weltz, B., Melcher, M. , Sinemus, H.S., and Maier, D., At. Spectrosc, 1984, 5,
37-42.
77 Freeh, W., Baxter, D.C., Bakke, B., Snell, J.P., and Thommassen, Y., Anal.
Comm., 1996,33 , 7H-9H.
78 Snell, J.P., Freeh, W., and Thommassen, Y., Analyst, 1996,121, 1055.
79 Muscat, V. I . , Vickers, T. J., and Andren, A., Anal. Chem., 1972,44,218-21.
80 Ferrara, R., Seritti, A., Barghigianni, C , and Petrosino, A., Anal. Chim. Acta,
1980,117, 391-5.
81 Chan, C. Y., and Sadana, R. S., Anal. Chim. Acta, 1993,282, 109-15.
82 Poissant, L. , Harvey, B., and Casinir, A,, Env. Technol., 1996,17, 891-6.
83 Cossa, D., Sanjuan, J., Cloud, J., Stoekwell, P.B., and Corns, W. T., / . Anal. At.
Spectr., 1995,10, 287-91.
84 Mcltosh. S., At. Spectrosc., 1993,14,47-9.
85 Gracia, M . F., Gracia, R. P., Gracia, N . B., and Sanz-Mendel, A., Talanta, 1994,
41, 1833-9.
186

86 Sarzanini, C , Sacchero, G., Aceto, M. , AboUino, O., and Mestasti, E., Anal.
Chim. Acta, 1994.284, 661-7.
87 Rapsomanikis, S., Craig, P. J., Anal. Chim, Acta, 1991.248. 563-7.
88 Fischer, R., Rapsomanikis, S., and Andreae, M. , O., Anal. Chem,, 1993, 65,
763-6.
89 Emteborg, H. . Sinemus, H. W., Radziuk, B., Baxter, D. C , and Freeh, W.,
Spectrochim. Acta, Part B. 1996,51, 829-37.
90 Ahmed, R., May, K., and Stoeppler, M . , Fresenius Z Anal Chem, 1987. 326.
510-6.
91 Fujita, M , and Takabatake, E., Anal. Chem,, 1983, 55,454-7.
92 Azipun, B., Fernandez, M . L., Blanco, E.. and Sanz-Mendel, A.. J. Anal. At.
Spectr, 1994.9,1279-84.
93 Bloom, N , and Fitzgerald, W. F., Anal. Chem. Acta, 1988,208, 151-61.
94 Jones, R- D., Jacobson, M . E., Jaflfee, R., West-Thomas, J., Arfetrom, C , and
Alii , A., Water. Air, Soil Pollut., 1995, 80. 1285-94.
95 Jian, W., and McLeod, C. W., Talanta, 1992,39, 1537-42.
96 "Determination of Mercury in Naphtha", UOP Method PJ5-P5,UOP, 1995.
97 Knauuer, H.E., and Milliman.G.E., Anal Chem., July 1975. 47, 8.
98 "Determination of Mercury in Stabilised Condensate. Woodside Offshore Petro
leum Pty., 1993, procedure No. 367.
187

99 Determination of Mercury in Oil and Condensate using HPA-wet oxidation-
CVAAS, unpublished.
100 Hintehnann, H. , and Wilken, R-D.. Appl. organomet. Chem., 1993,7, 173.
101 Barguigiani, C , Ristori, T., and Bauleo, Environ. Tech,, 1991,12, 1175.
102 Waldock, M.J., Thain, J.E., and MiUer, D., Can. J. Fish Aquat. & / . , 1987, 44.
140.
103 Cameron, C , Benayoun, D., Dorbon, M. , Michelot, S., and Robertson, M ,
"How much mercury and what types of mercury are in natural gas and associated
condensate; How can mercuiy be eliminated", Presented in Seminar on Catalysis,
ITB Bandung, Indonesia, 24 th Oct. 1995.
104 Anon, European Chemical News, July 1990, 32.
105 Sarrazin, P., Cameron, C , Barthel, Y, and Morrison, M.E., American Inst, of
Chem. Eng. Spring Meeting, New Orleans, March 1992, Proceeding 86 a.
106 Goto. T., Furuta, A., and Sato, K., JGC Corporation, Chiyoda-ku, Japan, Techni
cal Letter, Unpublished.
107 Vandecasteele, C. and Block, C.B., " Modem Method for Trace Element Deter
mination", John Wiley and Son, 1993.
108 Wood,R.W. . />M.M7^. . 1902,3, 128.
109 Nichols, E.L. and Howes, H.L., Pf^sc. rev., 1924, 23, 472.
110 Winefordoner, J.D., and Vickers, T.J., Anal. Chem., 1964,36, 161.
188
111 Veillon, C , Mansfield, J.M., Parsons, M . L., and Winefordner, J.D., Anal. Chem.,
1966,38. 204.
112 Schrenk, W.G., "Analytical Atomic Spectroccopy", Plenum Press, new York,
1975.
113 Omenetto, N . , and Winefordner, J. D., Prog. Anal. At. Spectrosc, 1979, 2, 1.
114 Omenetto, N . , and Winefordner, J. D., Frog Anal. At. Spectrosc, 1985, 8,371.
115 Butcher, DJ. , Dougherty, J. P., McCaffrey, J.T., PreU Jr., F.R., Wahon, A.P.,
Michel, R-M., Omenetto, N . , and Winefordner, J. D., Prog Anal At. Spectrosc.,
1987,10. 359.
116 Thompson, K.C.. and Godden, K G . . Analyst, 1975,100, 544.
117 Hutton, R-C, and Preston, B., Analyst, 1980,105, 981.
118 Godden, R.G., and Stockwell, P.B., J. Anal At. Spectrom., 1989,4, 301
119 Ebdon, L., Fisher, A., Hill, S. J., and Evan, H.(Editor)," Analytical Atomic
Spectrometry", John Willey, West Sussex, England, 1998.
120 Morita, H., Kimoto, T, and Shimomura, S., Anal Lett., 1983,16, 1187.
121 Tanaka, H., Kouno, M. , Morita, H., Okomoto, K., and Shimomura, S., Anal
Sd., 1992, 8, 857.
122 Tanaka, H., Kouno, M. , Morita, H., Okomoto, K., and Shimomura, S., Anal 5c/.,
1993,9, 859.
123 Winefordner, J.D., J. Chem. Ed., 1978,55, 72.
189

124 Bauer, H.H., Christian, G.D., and OHeilly, J.E.. Instrumental Analysis, Allyn and
Bacon, Boston, 1978.
125 Nakahara, T., Tanaka, T, and Musha, S., Bull Chem. Soc. Jpn., 1978,51,2020.
126 Muscat, V . I . , and Vickers, T.J., Anal Chim. Acta, 1971, 57,23.
127 Omenetto, N . , Spectrochim. Acta, Part B, 1989,440, 131.
128 Sullivan, J.V., and Walsh, A., Spectrochim. Acta, 1965, 21, 721.
129 Browner, R.F., Patel, B. M. , Glenn, T. H., Rutta, M . E., and Winefordner, J.D.,
Spectrosc. Lett,, 1972, 5, 311.
130 Omenetto, N . , Rosi, G., Anal Chem., 1968, 40,195.
131 Frazer, L. M. , and Winefordner, J. D., Anal Chem., 1972,44, 1444.
132 Jian, W., and McLeod, C.W., Anal Proceed., 1991,28, 293.
133 Caupeil, J.C., Hendrickse, P.W., and Bongers, J.S., Anal Chim. Acta, 1976, 81,
53.
134 Kirkbright, G.R, West, T.S., and Wilson, P.J., Anal Chim. Acta., 1978, 66, 130.
135 Horiguchi, H., and Tsuchiya, S., Bull Chem. Soc. Jpn., 1971,44,3221.
136 CaUear, A.B., and McGurk, J., Chem. Phys. Lett. 1970, 7,491.
137 Robinson, J.W., Araktingi, Y.E., Anal Chim. Acta, 1973,63, 29.
138 Vermeir, G., Vandecasteele C . and Dams, K , Anal Chim. Acta, 1991, 242, 203.
139 Omang, S.H., and Paus, P.E., Anal Chim, Acta, 1971, 56, 393.
140 Koirtyohann, S.R., and Khalil, M . , Anal Chem,, 1976, 48, 136.
190
141 Lindstedt, G., Analyst, 1970, 95, 264.
142 Morita, H., Sugimoto, M. , and Shimomura, S., Anal. Sci., 1990,6,91.
143 Ahmad, R., and Stoeppler, M. , Analyst, 1986, 111, 137.
144 Andrade, J.C.D., Pasquini, C , Baccan, N . , and Loon, J. C. V., Spectrochim.
Acta, 1983,38B, 1329.
145 Morrison, J., Oil and Gas J., April 1972, 72.
146 Shah, K.R., FUby, R.H., and Haller, W. A., J. Radioanal. Chem., 1970.
147 Omang, S. H., Anal. Chim. Acta, 1973, 63, 247.
148 Smart, N . A., and Hill, A. R. C , Analyst, 1969, 94,143.
149 Kunkel, E., Fresenius'Z., Anal. Chem., 1972,258, 338.
150 Diever, D., and Woodrift, R., Anal. Chem., 1974, 46, 597.
151 Bretthauer, E. W., Moghissi, A. A., Snyder, S. S., and Mathew, N.W., Anal.
Chem., 1974,46,445.
152 Lo, P., and Bush, B., J. Assoc. o f f . Anal Chem., 1973, 56, 1509.
153 Farey, B. J., Nelson, L. H., and Rolph, M . G., Analyst, 1978,103,656.
154 Yorkshire Water Authority Methods of Analysis, 1988, 5th. Ed., Yorkshire
Water, Leed, Section 9.
155 Baxter, D. C , and Freeh, W., Anal Chim. Acta, 1990,236, 377.
156 Goto, M. , Shibakawa, T., Arita, J., and Ishii, D., Anal. Chim. Acta, 1982, 140,
179.
191
157 Iverfeldt, A., Mar. Chem., 1988, 23, 441.
158 Freimann, P., and Schmidt, D., Fresenius'Z, Anal Chem., 1982. 299. 97.
159 Friedman, M . , "The Chemistry and Biochemistry o f Sulfliydryl Group in Amino
Acids, Peptides and Proteins" Pergamon Press, Oxford, 1973.
160 Miller, J.C., and Miller, J. N . , "StaUstic for Analytical Chemistry*', 3rd. E., 1994.
161 Stockwell, P.B., Rabl, P., and Pafifrath, M . , Process Control and Quality, 1991,
1,293.
162 Stockwell, P.B., and Corns, W.T., Hydrocarbon Asia, Oct. 1993, 36.
163 Sallsten, G., and Nolkrantz, IC, Analyst, 1998,123, 665-668.
164 Baeyens, W., and Leermakers, M. , J, Anal Atom. Spectra,, 1989,4, 635.
165 Parris, G. E., Blain, W.R.. and Brickman, F. E., Anal Chem., 1977,49, 378.
166 Bamford, C. H. , and Tipper, C. H. F., Editors, "Con^rehensive Chemical Kinet
ics", Vol.4, Decomposition of Inorganic and Organomercury Compounds,
Elsevier, Amsterdam, 1972.
167 Dumarey, R-, Temmerman, E., Dam, R., and Hoste, J., Anal Chim. Acta, 1985,
170, 337-343.
168 Weast, R. C , Editor, CRC, Handbook of Chemistry and Physic, CRC Press Inc.
1971.
169 Rubi, E., Lorenzo, R. A. Casais, C , Carro, A. M. , and Cela, R., J. Chromatogr.,
1992, 605, 69.
170 Bryan, G. W., and Longston, W. J., Environ. PoUut., 1972, 76, 89.
192

171 Lansens, P., Casais, C , Meuleman, C , and Baeyens, W., J. ChromatogTy 1991,
586,329.
172 Cappon, C. J., and Smith, J. C.,AnaL Chem., 1977,49, 365.
173 Lee. Y. H., and Mowrer, J., Anal Chim. Acta, 1989,121,259.
174 Reilly, J. O., J. Chromatogr., 1982,239,437.
175 Bulska, E., Baxter, D. C , and Freeh, W., Anal. Chim. Acta, 1991,249, 545.
176 Bulska, E., Emteborg, H., Baxter, D. C , Freeh, W., Ellingsen, D., and Thomas-
sen, Y.,Analyst, 1992, 117. 657.
177 AUi, A., Jaflfe, R.. and Jones, R-, J, of High Res. Chromatogr., 1994.17. 745.
178 Bloom, N . , Can. J. Fish Aquat. Sci., 1998,46,1131.
179 Snell, J., Quan, J., Johansson, M. , Smit. K, and Freeh, W., Analyst, 1998. 123,
905.
180 Craig, P. J., Mennie, D.. Ostah, N . , Donard, O.F.X.. and Martin, F., Analyst,
1992,117, 821.
181 Swift, R. P., and Camble, J. E., Spectroscopy, 1993,8,40.
182 Rapsomanikis, S., Donard, O.F.X.. and Weber, J. H., Anal. Chem. 1986, 58, 35.
183 Gui-bin, J.. Zha- ming. N . . Shun-rong, W., and Heng-bin, J., Fresenius'Z. Anal
Chem., 1989,334,27.
184 Sakamoto, H., Tomiyasu, T., and Yonehave, N . , Anal. Sci., 1992,8, 35.
185 Munat E., Haraguchi, H., Ishii, D., Takeuchi, T., and Goto, M . . Anal Chim.
Acta, 1990,235, 339.
193
186 Gracia, M.E.. Gracia, R-P.. . Gracia, N.B. and Sanz-mendel, A., Talanta, 1994.
41. 1833-1839..
187 Tao, H. , Murakami, T., Tominaga, M , and Miyazaki, A., J. Anal Atom.
Spectrom., 1998.13. 1085-1093.
188 Shafewi, A.. Foulkes, M . E., Ebdon, L., Corns, W. T.. and Stockwell, P. B..
Analyst, in press.
194

PUBUCATIONS
1. Sha&wi, A., Fouflces, M.E., Ebdon, L. . Stockwell, P.B., and Corns, W.T., "The
Determination of Total Mercury in Natural Gas Condensate by Atomic Fluorescence
Spectrometry', Analyst, Qn press)
2. Shafewi, A., Foulkes, M.E., Ebdon. L., Stockwell, P.B., and Corns, W.T.,
'Mercury Speciation in Natural Gas Condensate by Gas Chromatography Coupled
with Atomic Fluorescence Spectrometry', submitted to J, Anal At. Spectrom,
\ Shafewi, A., Foulkes, M.E., Ebdon, L. , Stockwell, P.B., and Corns, W.T., 'The
Preliminary Evahiation of Adsorbent-Based Mercury Removal system for Gas,
submitted to Anal Chim, Acta.
PRESENTATIONS
1. A study of The Total Mercury and mercury Species Content of natural Gas an Gas
Condensate, presented at Eighth Biennial National Atomic Spectroscopy
Syni^sium, University of East Anglia, 17-19 July, 1996
2. A Simplistic and Reliable Methodfor The Determination of Mercury in
Condensate, presented at The Pittsburgh Conference (PITTCON '98),
New Orleans, USA, 1-5 March, 1998.
195
3. Determination of Mercury Levels in Petrochemicals by Atomic Fluorescence
Spectrometry, presented at Ninth Biennial National Atomic Spectroscopy
Symposium, University of Bath, 8-10 July, 1998.
4. The Determination of Total Mercury and Merctay Species in Natural Gas
Condensate: Yesterday, Today and Tommorrow, presented at 'Malaysian Gas
Processor and Oil Refiner Workshop'. Petroleum Research Institute, Petronas,
Kuaki Lumpur, Malaysia, 26 August 1998.
196


