condensate density penalty modification study
TRANSCRIPT
Condensate Density Penalty Modification Study
Prepared for the Canadian Association of Petroleum Producers
December 2001
Gail Flaherty Donald Murray
Advantage Insight Group Inc.
Advantage Insight Group Inc.
2
Executive Summary 1
In the spring of 2001, a CAPP Steering Committee reviewing the Condensate
Equalization identified shortcomings in the current (Oct/1997) formula for the density
equalization of condensate value. This action was prompted by a greater than threefold
jump in Condensate Density penalties since October 2000, that had occurred as the
result of wide crude oil light-heavy price differentials. It was recognized that the current
blend model used in condensate equalization did not capture the viscosity blending
characteristics of the available diluents. As a result, heavier diluents were being
excessively penalized.
Advantage Insight Group Inc. (AIG) was contracted to develop a new density penalty
curve that reflected the economic relationship between variations in the source diluent
density and the blend diluent volume required to meet pipeline specifications.
The Steering Committee selected two representative heavy oils (bitumen) and ten
diluents for viscosity testing of bitumen/diluent blend combinations. Based on the
laboratory data, a new correlation was developed which incorporated both diluent
density and reference temperature in the calculation of the target heavy oil blend
density required to meet the 350 centistoke (cSt) pipeline viscosity specification.
Two base assumptions were made in the development of the proposed new
methodology for equalizing the value of condensate based on density:
• The blender will be indifferent to diluent density if his per barrel bitumen
realization remains the same.
1 This study was conducted in 2001 and the conclusions were adopted by Industry for implementation January 2002. This final report was delivered to CAPP in May 2002.
Advantage Insight Group Inc.
3
• The value of a given heavy oil stream changes as the relative proportions of
bitumen and diluent in the stream changes.
The result of applying the above two assumptions is the following proposed Condensate
Density Penalty calculation:
Condensate Density Penalty Slope = - (Blending Efficiency Slope + Blend Value Slope)
Where
• Blending Efficiency Slope reflects the variation with density in the calculated
value of the diluent required to maintain a constant bitumen realization.
And
• Blend Value Slope reflects the variation in crude oil blend stream value with
diluent content.
The Blend Efficiency slope is calculated in the following manner:
• Bitumen realization (on per m3 of bitumen basis) is calculated for the current
month using Enbridge allowance pricing for diluent and heavy crude and the
average density of Enbridge’s Edmonton condensate (CRW) receipts.
• The corresponding diluent value required to maintain a constant bitumen
realization is calculated for series of bitumen blends made with a range of diluent
densities
• The Blend Efficiency slope is obtained from the linear regression of the individual
diluent value/density points.
Similarly, the Blend Value slope is calculated as follows:
• Using the bitumen realization previously calculated and the diluent allowance
pricing, the value of a series of blends created using a range of diluent densities
is calculated.
• The Blend Value slope is obtained from the linear regression of these blend
values with density.
Advantage Insight Group Inc.
4
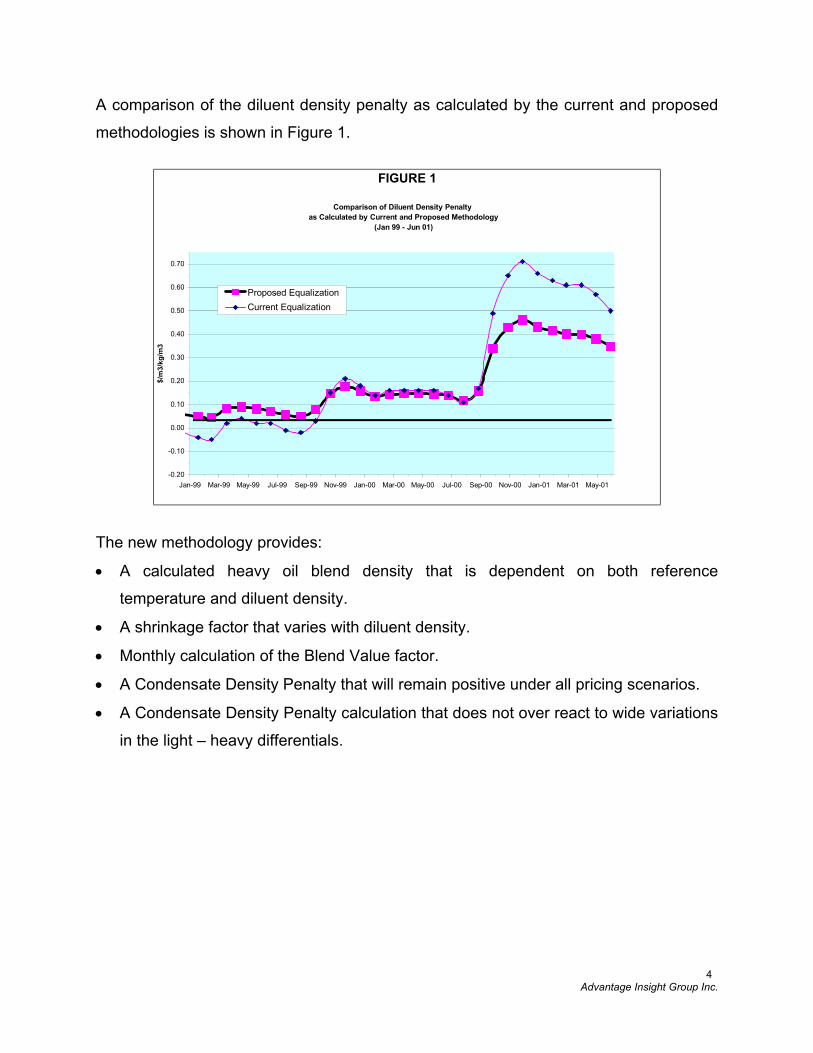
A comparison of the diluent density penalty as calculated by the current and proposed
methodologies is shown in Figure 1.
FIGURE 1
Comparison of Diluent Density Penalty as Calculated by Current and Proposed Methodology
(Jan 99 - Jun 01)
-0.20
-0.10
0.00
0.10
0.20
0.30
0.40
0.50
0.60
0.70
Jan-99 Mar-99 May-99 Jul-99 Sep-99 Nov-99 Jan-00 Mar-00 May-00 Jul-00 Sep-00 Nov-00 Jan-01 Mar-01 May-01
$/m
3/kg
/m3
Proposed EqualizationCurrent Equalization
The new methodology provides:
• A calculated heavy oil blend density that is dependent on both reference
temperature and diluent density.
• A shrinkage factor that varies with diluent density.
• Monthly calculation of the Blend Value factor.
• A Condensate Density Penalty that will remain positive under all pricing scenarios.
• A Condensate Density Penalty calculation that does not over react to wide variations
in the light – heavy differentials.

Advantage Insight Group Inc.
5
Advantage Insight Group Inc.
6
Table of Contents
Executive Summary ............................................................................................. 2
Table of Contents................................................................................................. 6
1.0 Introduction ................................................................................. 8
2.0 Background ............................................................................... 10
3.0 Project Scope & Laboratory Methodology ................................. 16
4.0 Data Analysis ............................................................................ 18
5.0 Development of Revised Equalization Methodology ................. 22
6.0 Proposed Modifications to System ............................................ 24
7.0 Example Calculation.................................................................. 30
8.0 Conclusions............................................................................... 36
9.0 Abbreviations/Definitions........................................................... 38
10.0 Bibliography .............................................................................. 40
Appendix 1 Laboratory Data ........................................................................ I-1
Appendix 2 Analysis Protocol...................................................................... II-1
Appendix 3 Graphs of Data........................................................................ III-1
Appendix 4 The Math .................................................................................IV-1
Appendix 5 Advantage Insight Group Inc....................................................V-1

Advantage Insight Group Inc.
7
Advantage Insight Group Inc.
8
1.0 Introduction
In early spring of 2001, a sub committee of the Crude Oil Committee of the Canadian
Association of Petroleum Producers (CAPP) reviewing the Condensate Equalization,
identified that the current formula2 for equalizing condensate density derived in 1997
may not be sending the right market signals for optimizing the use of condensate as a
heavy oil diluent. This had become an issue as heavy crude oil production increased
and when in some periods insufficient diluent had been available. Of particular concern
was the current methodology’s response to the extremes of light-heavy price
differentials. Narrow differentials yielded a negative density penalty which was capped
at zero, while the recent wide differentials experienced since October 2000, had
resulted in a greater than threefold increase in the density penalty. There was concern
that the jump in the density penalty was driving heavier density diluents from the
condensate pool exacerbating shortages in diluent supply.
To address these concerns the committee commissioned Advantage Insight Group Inc.
to test and provide analyses of a number of condensate streams and representative
crudes to determine the viscosity characteristics of the crude/condensate mixes. The
information derived from this analysis was to be used to evaluate whether the existing
condensate equalization formula is accurate or needs to be modified to reflect the
physical data.
The committee also had concerns that the refinery value that has been used as part of
the existing diluent equalization calculation did not reflect the true refinery value of the
materials being put into the diluent pool. Advantage Insight Group was asked to assess
the methodology used to arrive at a refining value for diluent and to make
2 Prior to October 1997, the condensate equalization procedure did not include a density adjustment. Driven by an increased Industry awareness of variations in the blending efficiency of source condensates, an Industry Equalization Condensate Committee after much negotiation with condensate suppliers and users introduced the current density component of the condensate equalization.

Advantage Insight Group Inc.
9
recommendations on how that methodology could be modified to better reflect the true
value of the individual materials being put into the stream.
Advantage Insight Group Inc.
10
2.0 Background
Crude transported by the major ex-Alberta pipelines must meet density and viscosity
specifications (940 kg/m3 density maximum, and 350 cSt viscosity maximum at pipeline
specified reference temperature). Natural gas liquids (condensate) have been the main
source of diluent blended into the heavier crudes to achieve these specifications. In
general, the lower the condensate density, the less volume of condensate that is
required to meet the specification.
A condensate equalization procedure has been developed by Industry to compensate
producers/shippers for density differences resulting from the commingling of their
condensate volumes in a common pipeline or terminal. This procedure is administered
monthly, based on the industry’s common condensate stream aggregated with Enbridge
at Edmonton.
The existing3 equalization procedure seeks to marry two concepts; “Blending Value”
and “Refining Value”. Blending Value is meant to represent the value of the condensate
as a diluent. Refining Value is meant to represent the value of the condensate as a
refinery feedstock. In most cases, these two terms are opposing. Lighter gravity
condensates are more effective diluents, while heavier condensates can have more
value to the refiner.
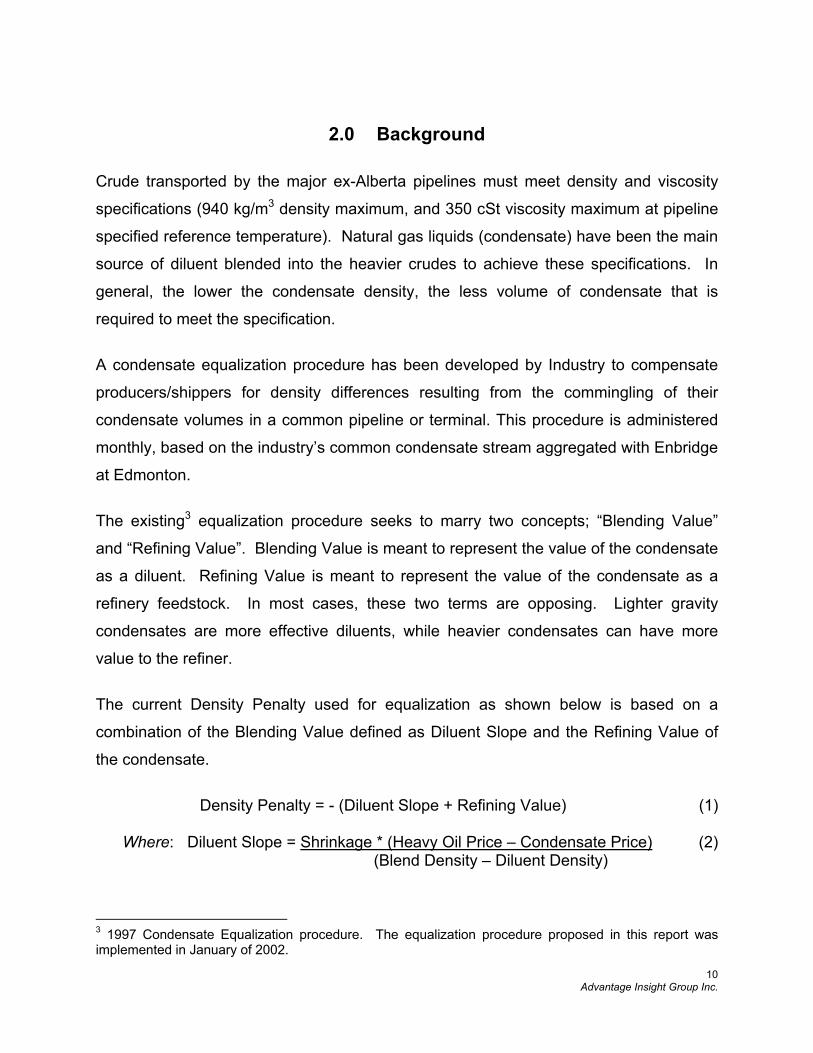
The current Density Penalty used for equalization as shown below is based on a
combination of the Blending Value defined as Diluent Slope and the Refining Value of
the condensate.
Density Penalty = - (Diluent Slope + Refining Value) (1)
Where: Diluent Slope = Shrinkage * (Heavy Oil Price – Condensate Price) (2) (Blend Density – Diluent Density)
3 1997 Condensate Equalization procedure. The equalization procedure proposed in this report was implemented in January of 2002.
Advantage Insight Group Inc.
11
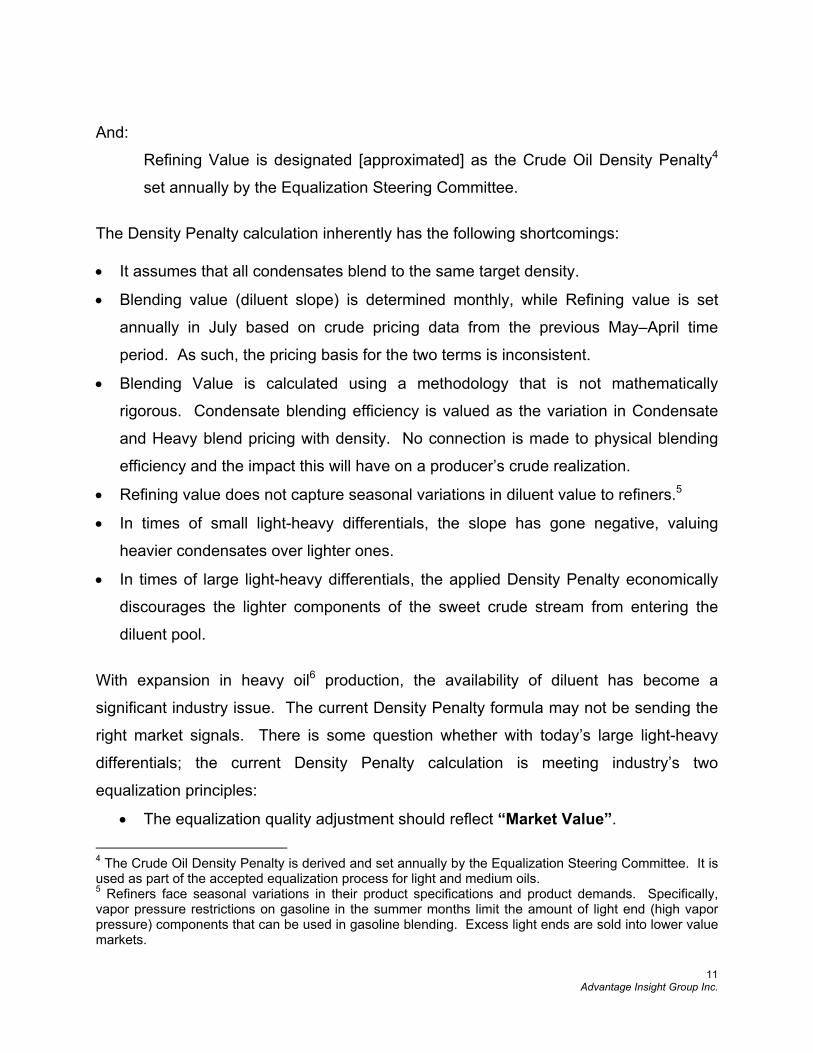
And:
Refining Value is designated [approximated] as the Crude Oil Density Penalty4
set annually by the Equalization Steering Committee.
The Density Penalty calculation inherently has the following shortcomings: • It assumes that all condensates blend to the same target density.
• Blending value (diluent slope) is determined monthly, while Refining value is set
annually in July based on crude pricing data from the previous May–April time
period. As such, the pricing basis for the two terms is inconsistent.
• Blending Value is calculated using a methodology that is not mathematically
rigorous. Condensate blending efficiency is valued as the variation in Condensate
and Heavy blend pricing with density. No connection is made to physical blending
efficiency and the impact this will have on a producer’s crude realization.
• Refining value does not capture seasonal variations in diluent value to refiners.5
• In times of small light-heavy differentials, the slope has gone negative, valuing
heavier condensates over lighter ones.
• In times of large light-heavy differentials, the applied Density Penalty economically
discourages the lighter components of the sweet crude stream from entering the
diluent pool.
With expansion in heavy oil6 production, the availability of diluent has become a
significant industry issue. The current Density Penalty formula may not be sending the
right market signals. There is some question whether with today’s large light-heavy
differentials; the current Density Penalty calculation is meeting industry’s two
equalization principles:
• The equalization quality adjustment should reflect “Market Value”.
4 The Crude Oil Density Penalty is derived and set annually by the Equalization Steering Committee. It is used as part of the accepted equalization process for light and medium oils. 5 Refiners face seasonal variations in their product specifications and product demands. Specifically, vapor pressure restrictions on gasoline in the summer months limit the amount of light end (high vapor pressure) components that can be used in gasoline blending. Excess light ends are sold into lower value markets.
Advantage Insight Group Inc.
12
• The equalization process should not create or distort market opportunities or
activities.
Current Equalization System Deficiencies:
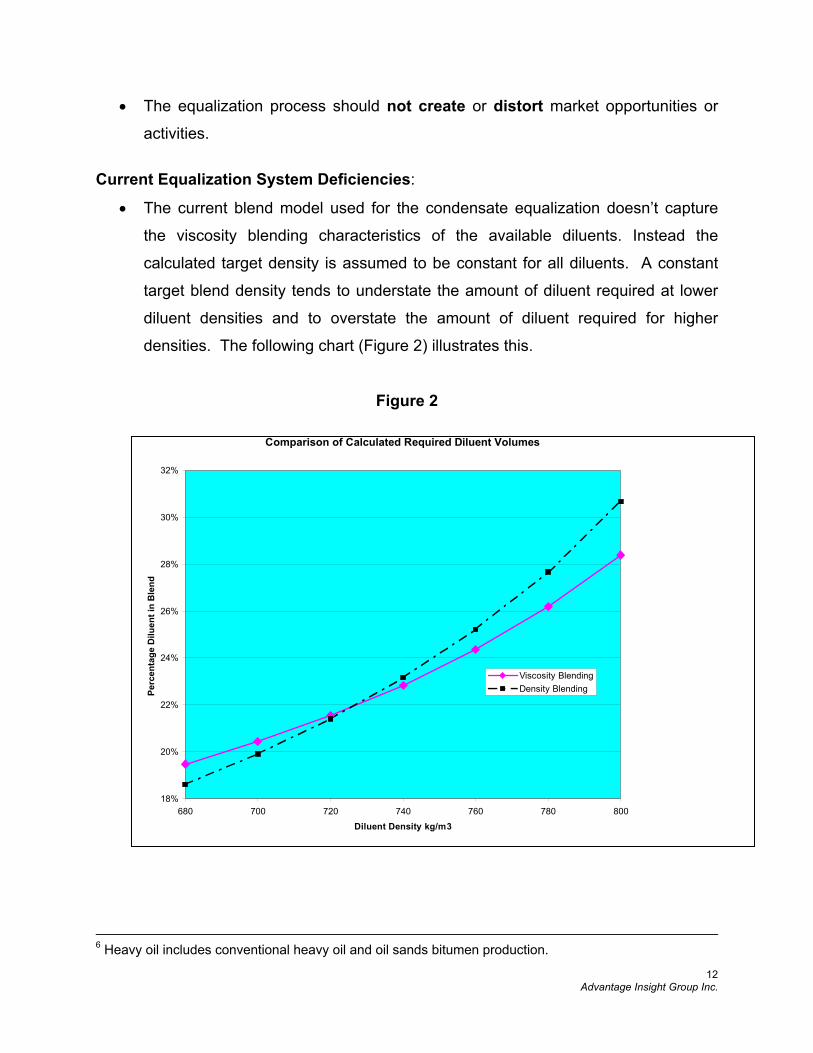
• The current blend model used for the condensate equalization doesn’t capture
the viscosity blending characteristics of the available diluents. Instead the
calculated target density is assumed to be constant for all diluents. A constant
target blend density tends to understate the amount of diluent required at lower
diluent densities and to overstate the amount of diluent required for higher
densities. The following chart (Figure 2) illustrates this.
Figure 2
6 Heavy oil includes conventional heavy oil and oil sands bitumen production.
Comparison of Calculated Required Diluent Volumes
18%
20%
22%
24%
26%
28%
30%
32%
680 700 720 740 760 780 800Diluent Density kg/m3
Perc
enta
ge D
iluen
t in
Ble
nd
Viscosity BlendingDensity Blending
Advantage Insight Group Inc.
13
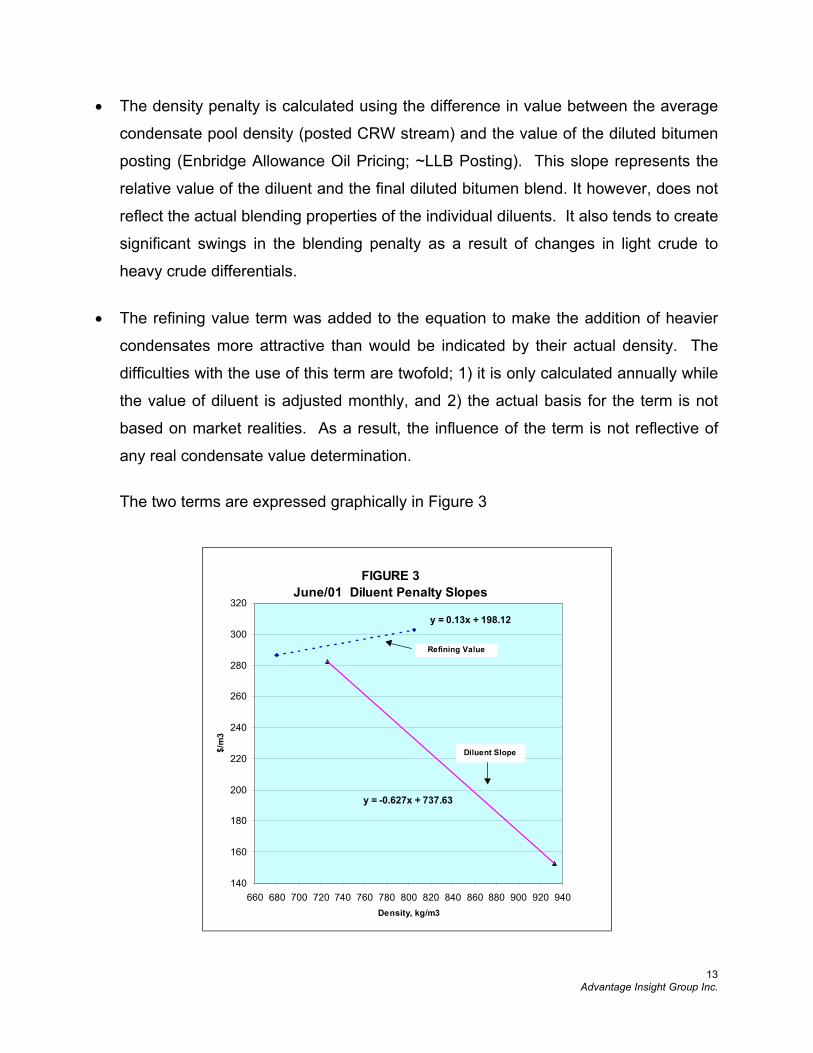
• The density penalty is calculated using the difference in value between the average
condensate pool density (posted CRW stream) and the value of the diluted bitumen
posting (Enbridge Allowance Oil Pricing; ~LLB Posting). This slope represents the
relative value of the diluent and the final diluted bitumen blend. It however, does not
reflect the actual blending properties of the individual diluents. It also tends to create
significant swings in the blending penalty as a result of changes in light crude to
heavy crude differentials.
• The refining value term was added to the equation to make the addition of heavier
condensates more attractive than would be indicated by their actual density. The
difficulties with the use of this term are twofold; 1) it is only calculated annually while
the value of diluent is adjusted monthly, and 2) the actual basis for the term is not
based on market realities. As a result, the influence of the term is not reflective of
any real condensate value determination.
The two terms are expressed graphically in Figure 3
FIGURE 3June/01 Diluent Penalty Slopes
y = -0.627x + 737.63
y = 0.13x + 198.12
140
160
180
200
220
240
260
280
300
320
660 680 700 720 740 760 780 800 820 840 860 880 900 920 940Density, kg/m3
$/m
3
Refining Value
Diluent Slope
Advantage Insight Group Inc.
14
The current method of equalization has worked well when condensate-heavy crude
differentials have been small and crude prices have been relatively stable. The
methodology has not worked well however, when the differentials have widened and
crude prices have varied significantly. This occurs because the weighting of the two
terms Blending Value (diluent slope) and Refinery Value in the Density Penalty
changes. In periods of wide differentials the magnitude of the Blend Value term
increases and it dominates the fixed Refinery value term. In the extreme, equalized
heavier condensates realize a lower value in the condensate pool than in the crude
pool. This has the impact of removing condensate volume from the pool, reducing
condensate supply and as a consequence increasing the price of condensate relative to
light crude oil. Since part of this shift in condensate equalization premium results from
an increase in the light heavy crude differential, the overall effect on the heavy crude
producer can be an increase in the price that he pays for condensate at the same time
as he is experiencing a reduction in his heavy oil price.

Advantage Insight Group Inc.
15
Advantage Insight Group Inc.
16
3.0 Project Scope & Laboratory Methodology
The scope of the project was to develop a density slope penalty curve that reflects the
economic relationship between variations in source diluent density and the blended
volume required to meet pipeline specifications.
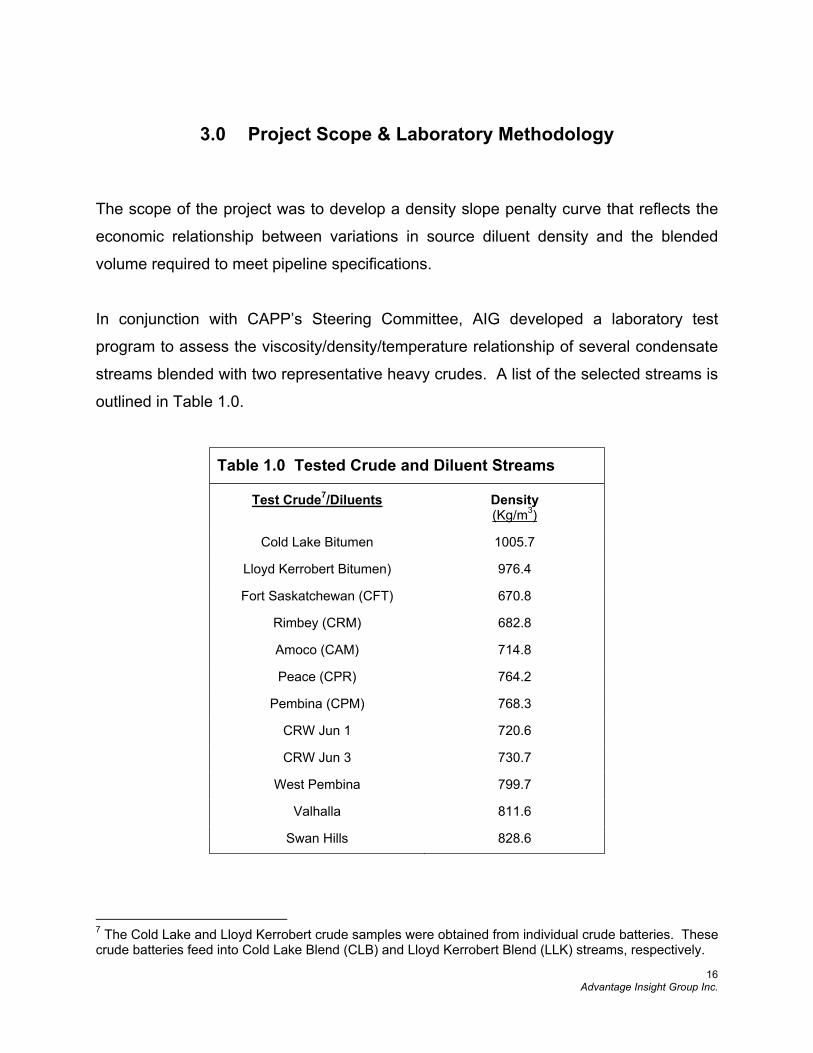
In conjunction with CAPP’s Steering Committee, AIG developed a laboratory test
program to assess the viscosity/density/temperature relationship of several condensate
streams blended with two representative heavy crudes. A list of the selected streams is
outlined in Table 1.0.
Table 1.0 Tested Crude and Diluent Streams
Test Crude7/Diluents Density (Kg/m3)
Cold Lake Bitumen 1005.7
Lloyd Kerrobert Bitumen) 976.4
Fort Saskatchewan (CFT) 670.8
Rimbey (CRM) 682.8
Amoco (CAM) 714.8
Peace (CPR) 764.2
Pembina (CPM) 768.3
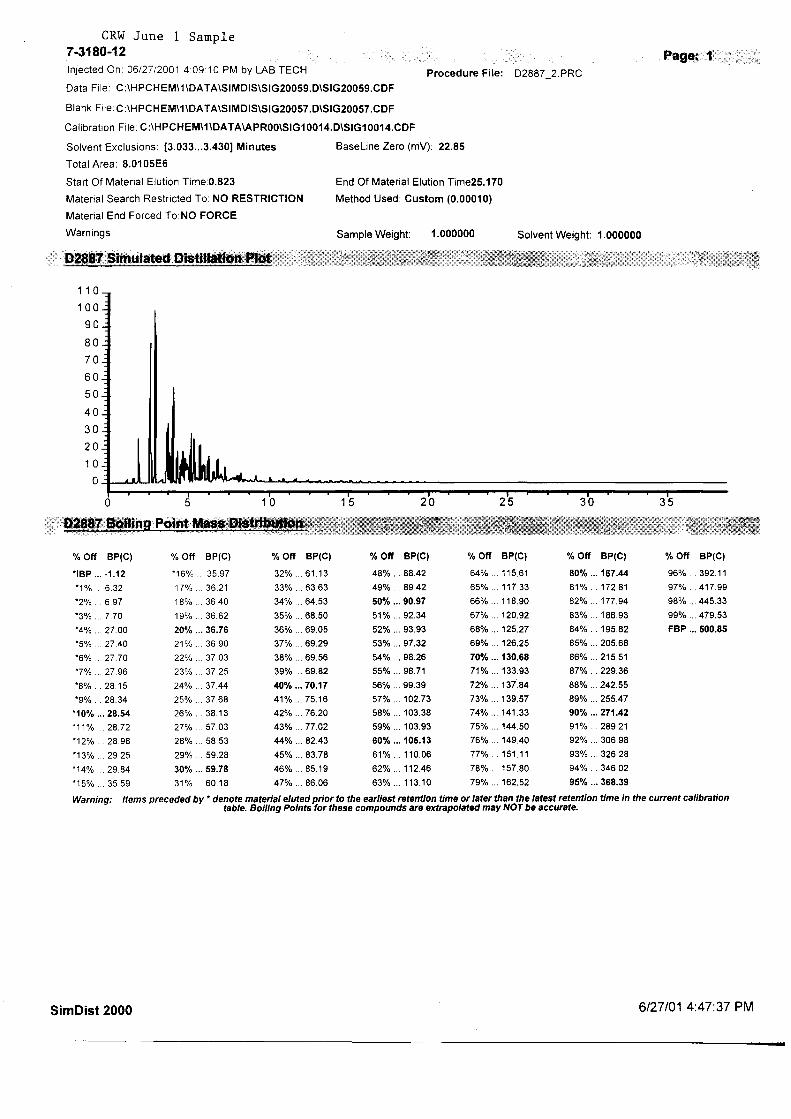
CRW Jun 1 720.6
CRW Jun 3 730.7
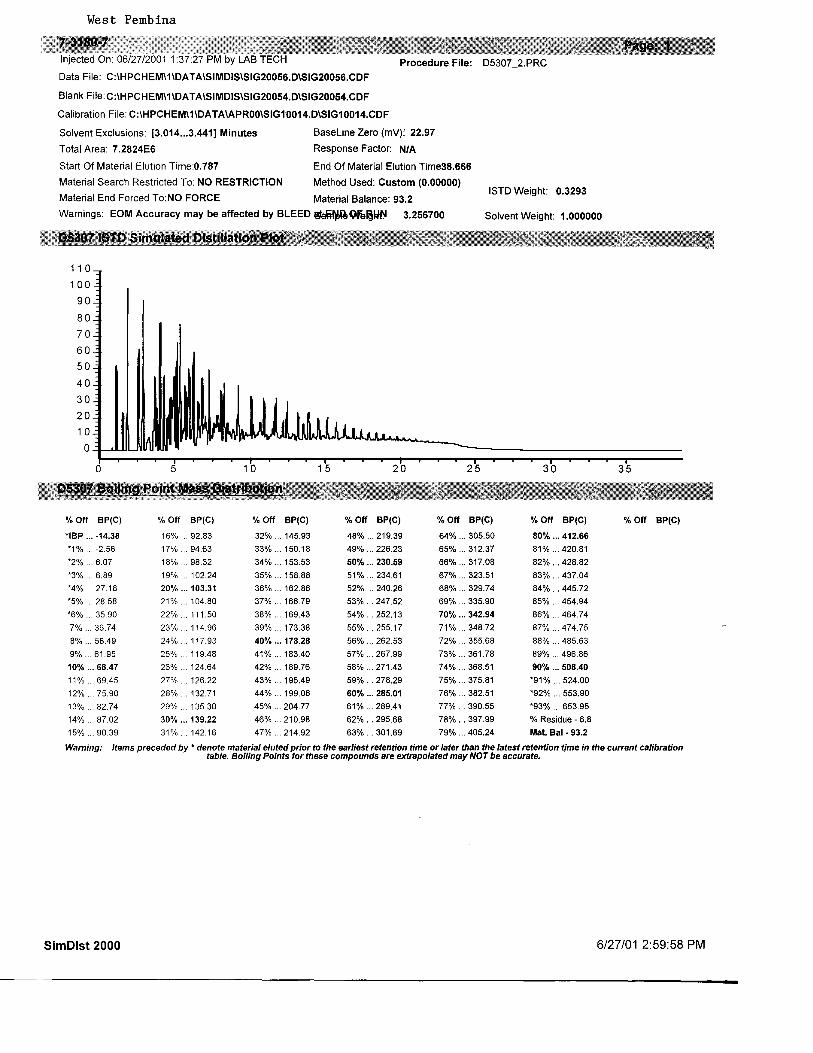
West Pembina 799.7
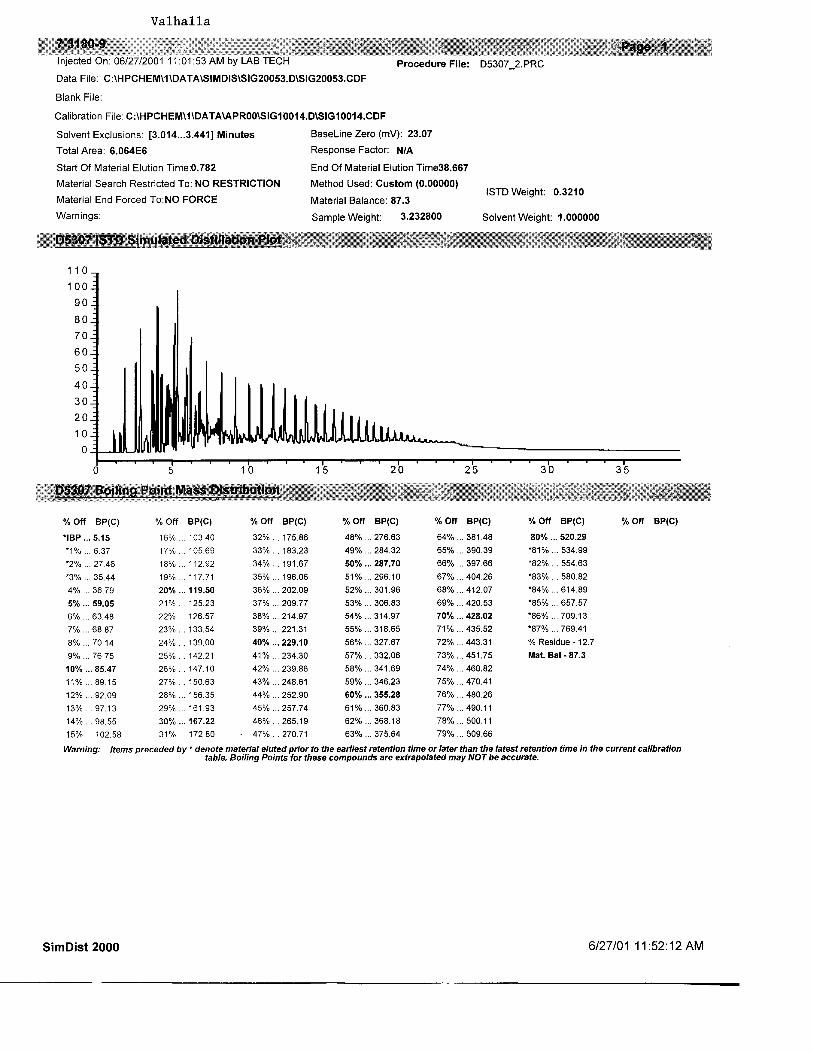
Valhalla 811.6
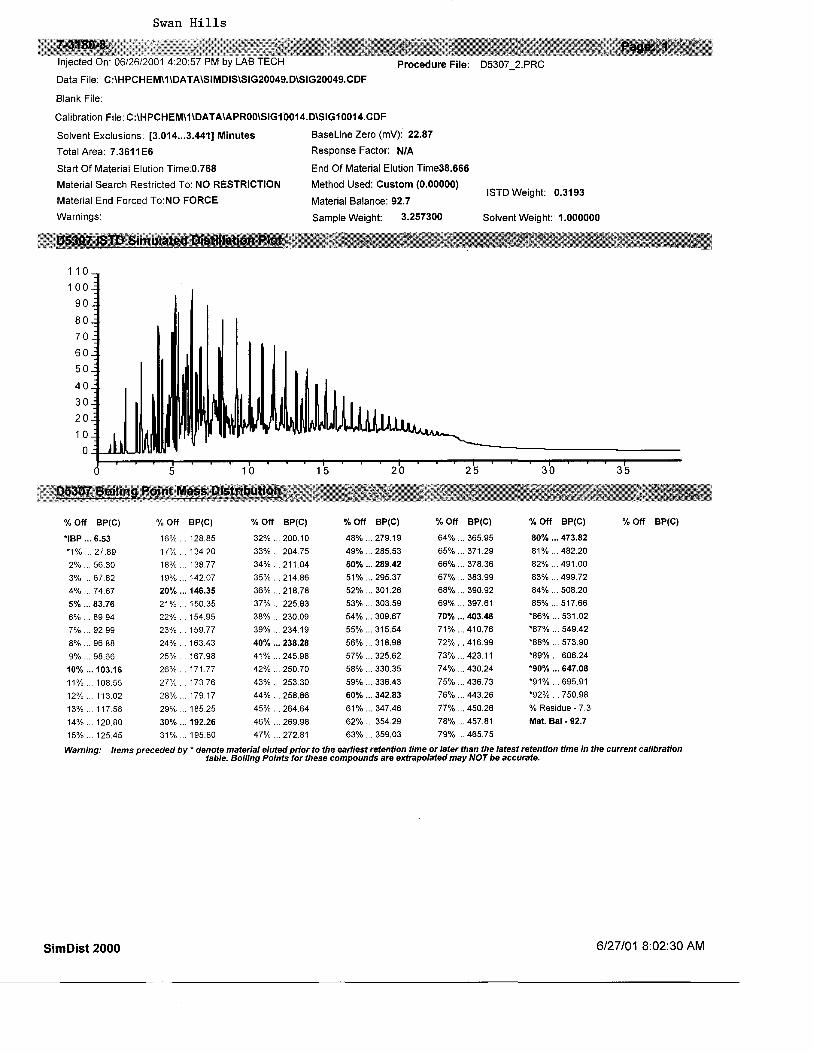
Swan Hills 828.6
7 The Cold Lake and Lloyd Kerrobert crude samples were obtained from individual crude batteries. These crude batteries feed into Cold Lake Blend (CLB) and Lloyd Kerrobert Blend (LLK) streams, respectively.
Advantage Insight Group Inc.
17
Each crude was mixed with each diluent to produce 3 blends at blend densities
approximating 912, 930 and 940 kg/m3. Each blend was analyzed for viscosity (ASTM
D445) at three (3) temperatures 7, 12 and 20°C. Samples were tested twice and
retested if the viscosity between the two results varied by more than 6 cSt. In addition,
four crude/diluent combinations were remixed and retested as a quality control
measure. Details of the sample program, laboratory methodology and results are
included in Appendix 1.
Advantage Insight Group Inc.
18
4.0 Data Analysis
Using statistical analysis a linear viscosity/temperature plot was generated for each
crude/diluent blend set as per ASTM D341. All data points, including the quality control
rechecks, were used in the ASTM D341 calculations. Next, from the above-mentioned
plots, the temperature that corresponded to a viscosity of 350 cSt was determined for
each density blend, within the blend set. This temperature/blend density data was then
linearly regressed to generate the 350 cSt density/temperature relationship for each
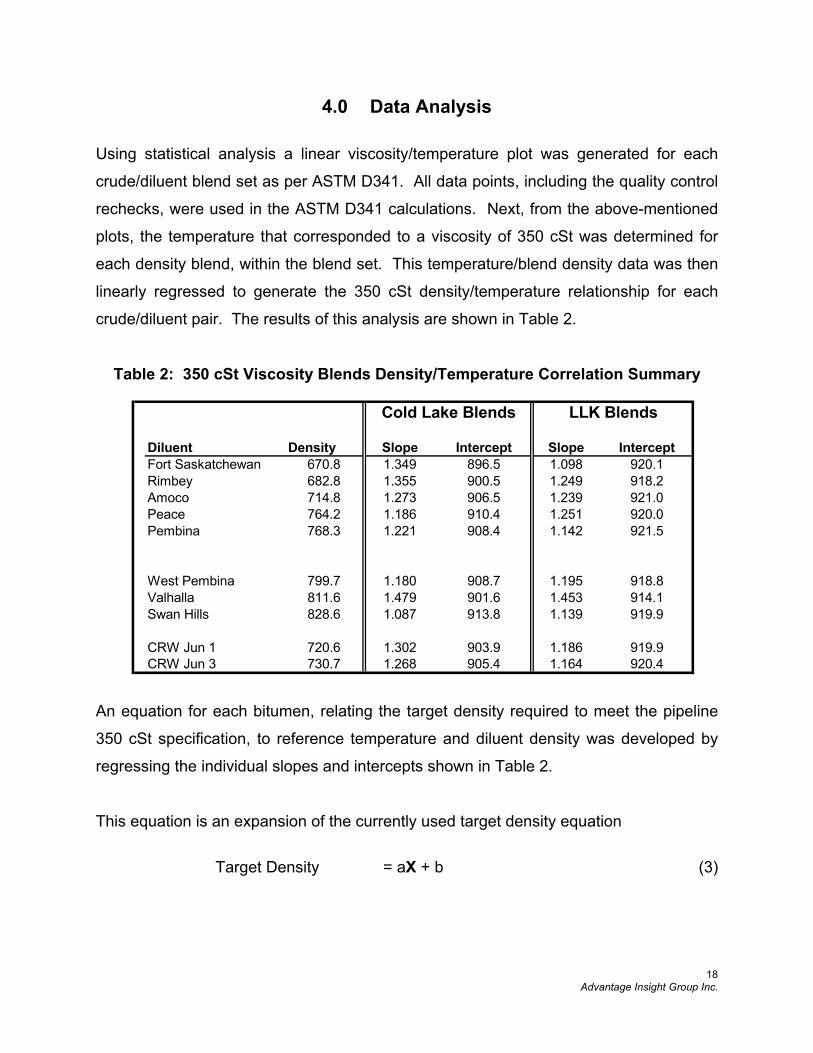
crude/diluent pair. The results of this analysis are shown in Table 2.
Table 2: 350 cSt Viscosity Blends Density/Temperature Correlation Summary
An equation for each bitumen, relating the target density required to meet the pipeline
350 cSt specification, to reference temperature and diluent density was developed by
regressing the individual slopes and intercepts shown in Table 2.
This equation is an expansion of the currently used target density equation
Target Density = aX + b (3)
Diluent Density Slope Intercept Slope InterceptFort Saskatchewan 670.8 1.349 896.5 1.098 920.1Rimbey 682.8 1.355 900.5 1.249 918.2Amoco 714.8 1.273 906.5 1.239 921.0Peace 764.2 1.186 910.4 1.251 920.0Pembina 768.3 1.221 908.4 1.142 921.5
West Pembina 799.7 1.180 908.7 1.195 918.8Valhalla 811.6 1.479 901.6 1.453 914.1Swan Hills 828.6 1.087 913.8 1.139 919.9
CRW Jun 1 720.6 1.302 903.9 1.186 919.9CRW Jun 3 730.7 1.268 905.4 1.164 920.4
Cold Lake Blends LLK Blends
Advantage Insight Group Inc.
19
Where X = Reference Temperature Replacing the slope coefficient “a” and the intercept coefficient “b” by linear equations
a = (a1Z +b1) (4) and b = (a2Z + b2) (5)
yields the final form of the density equation (3):
Target Density = (a1Z +b1) * X + a2Z + b2 (6)
Where X = Reference Temperature Z = Diluent density
And; a, b, a1, b1, a2, b2 are constants
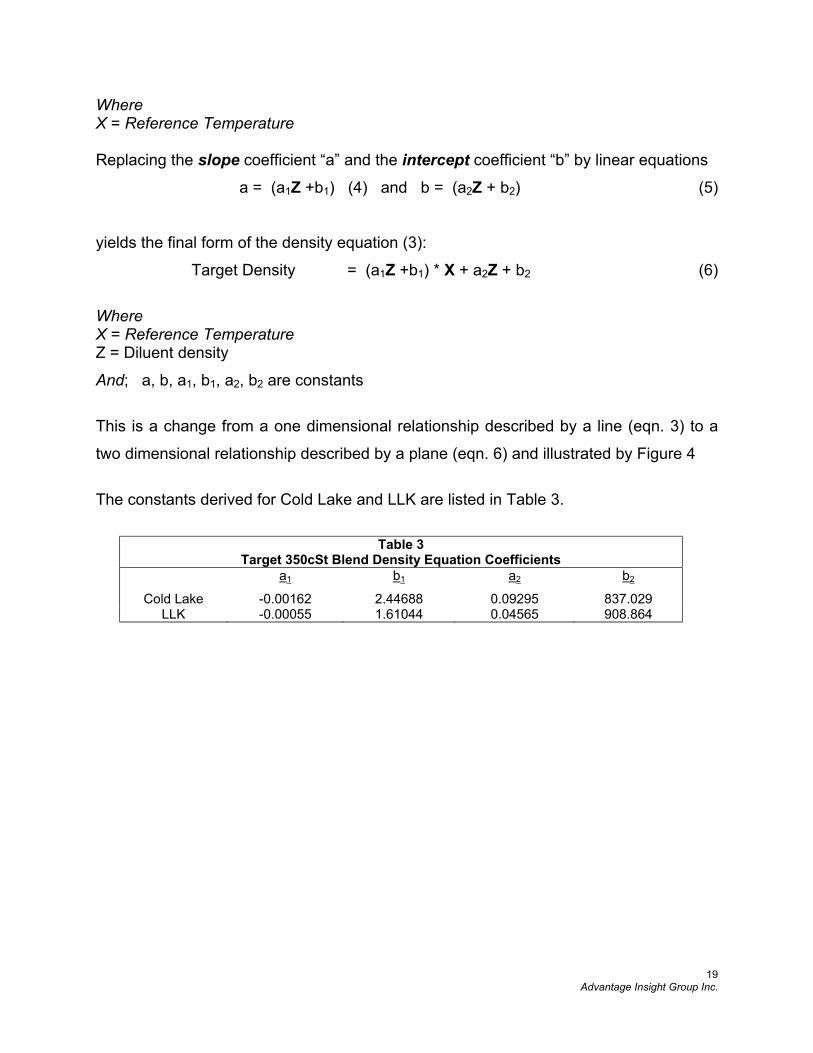
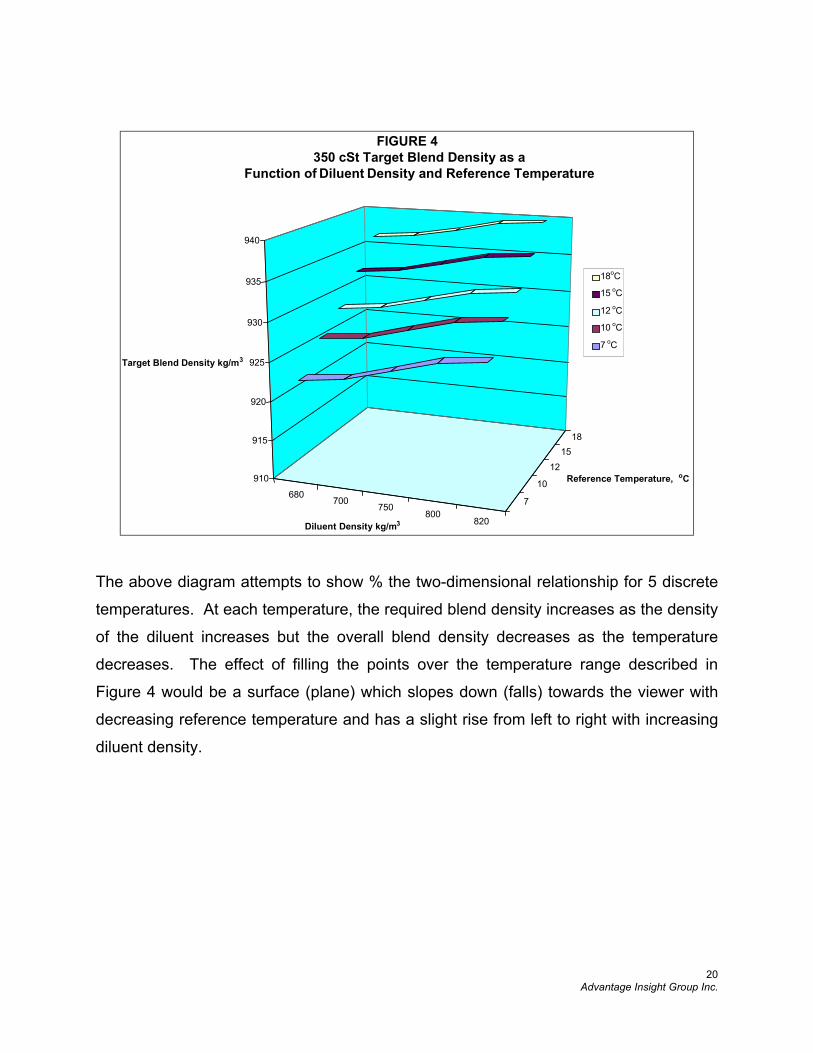
This is a change from a one dimensional relationship described by a line (eqn. 3) to a
two dimensional relationship described by a plane (eqn. 6) and illustrated by Figure 4
The constants derived for Cold Lake and LLK are listed in Table 3.
Table 3
Target 350cSt Blend Density Equation Coefficients a1 b1 a2 b2
Cold Lake -0.00162 2.44688 0.09295 837.029 LLK -0.00055 1.61044 0.04565 908.864
Advantage Insight Group Inc.
20
680700
750800
820
1815
12
10
7
910
915
920
925
930
935
940
Target Blend Density kg/m3
Diluent Density kg/m3
Reference Temperature, oC
FIGURE 4350 cSt Target Blend Density as a
Function of Diluent Density and Reference Temperature
18oC
15 oC
12 oC
10 oC
7 oC
The above diagram attempts to show % the two-dimensional relationship for 5 discrete
temperatures. At each temperature, the required blend density increases as the density
of the diluent increases but the overall blend density decreases as the temperature
decreases. The effect of filling the points over the temperature range described in
Figure 4 would be a surface (plane) which slopes down (falls) towards the viewer with
decreasing reference temperature and has a slight rise from left to right with increasing
diluent density.

Advantage Insight Group Inc.
21
Advantage Insight Group Inc.
22
5.0 Development of Revised Equalization Methodology
The development of the proposed system for equalization started with an analysis of the
viscosity/temperature relationship of the bitumen condensate pairings. From that
laboratory work, a mathematical relationship was developed for the requirement for
diluent in a typical bitumen shipment. Using this blended data, a new correlation for
density equalization was developed that reflected only the relative effects of the different
diluents, and did not consider the value of the diluted bitumen blend. In essence this
system was based on the premise that for the producer, the netback on bitumen was his
real interest and any condensate density/value relationship that provided him with an
equal return on his bitumen was acceptable to him.
The refinery value term was examined and it was determined that the existing term had
no relationship to the relative values of different condensates at the refinery. In fact,
when analyzing the information available from US markets, it was unclear whether there
was any significant market differentiation between condensate and crude oil even
though it could be shown that the value to a refiner of condensate for gasoline
production should favor the use of heavier condensates.
What refiners did value though, was the volume of diluent in a bitumen blend,
particularly when the refiner could predict the amount of diluent that he would receive
with his blend. Since heavier condensates create a blend that contains more
condensate per barrel of diluted bitumen, that blend will be worth more if its composition
is predictable to the refiner.
Using this premise, a new refinery term was incorporated into the equalization formula
that reflects the higher value of the bitumen blend when heavier condensate is used.
While this value will only be achieved by the producer, if the higher condensate volume
is identified by the refiner, and correspondingly reflected in the bitumen stream posting,
it is a real value increase that will be experienced over time.
Advantage Insight Group Inc.
23
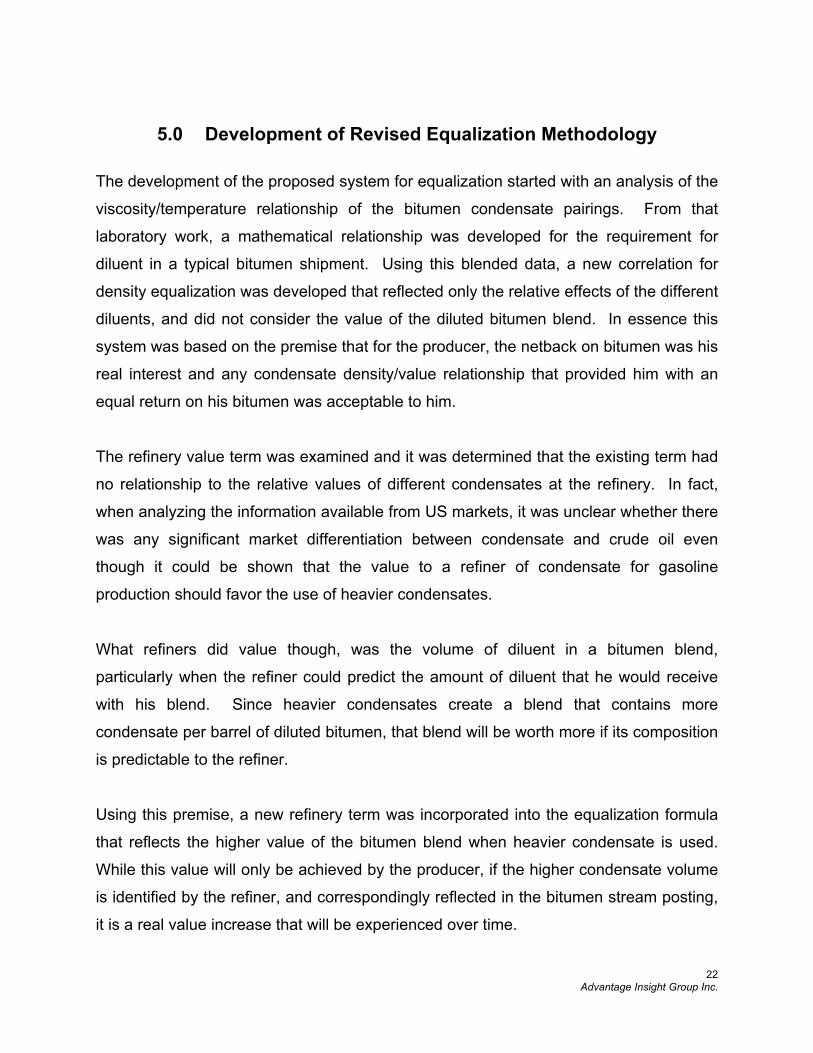
The result of the integration of these two new terms is a formula that looks remarkably
similar to the one that has been in place for several years but the behavior of the
proposed methodology is significantly different. Figure 5 shows a comparison of the
condensate equalization as it was applied over the period January 1999 to June 2001
and if the proposed methodology had been in effect over the same period. As can be
seen from the figure, the new system would tend to stabilize the equalization.
FIGURE 5
Comparison of Diluent Density Penalty as Calculated by Current and Proposed Methodology
(Jan 99 - Jun 01)
-0.20
-0.10
0.00
0.10
0.20
0.30
0.40
0.50
0.60
0.70
Jan-99 Mar-99 May-99 Jul-99 Sep-99 Nov-99 Jan-00 Mar-00 May-00 Jul-00 Sep-00 Nov-00 Jan-01 Mar-01 May-01
$/m
3/kg
/m3
Proposed EqualizationCurrent Equalization
Advantage Insight Group Inc.
24
6.0 Proposed Modifications to Equalization System
The development of a new diluent equalization scheme commenced with the
development of a complete set of laboratory data that identified the blending properties
of each diluent with each of the major bitumens being shipped today. For each of these
bitumen condensate pairs, equations were developed that reflected the blend viscosity
behavior of the diluted bitumen mix at the full range of reference temperatures that
would be experienced over the year. From the individual equations, an amalgamated
equation was derived that would track the behavior of the total diluent and bitumen pool.
In order to apply value to the behavior of the various diluents, two key assumptions
were made regarding the value of the diluted bitumen stream. These are:
The blender will be indifferent to diluent density if his per barrel bitumen realization remains the same.
And
The value of a given heavy oil stream changes as the relative proportion of bitumen and diluent in the stream changes.
Using the above two assumptions as a base, Advantage Insight Group Inc. is proposing
the following equation for condensate equalization:
Density Penalty = - (Blending Efficiency + Blend Value) (7)
Where
Blending Efficiency reflects the variation with density in the calculated value of
the diluent required to maintain a constant bitumen realization.
And
Blend Value reflects the variation in stream value with diluent content.
Advantage Insight Group Inc.
25
The “Blend Efficiency” term in equation (7) is a slope derived in the following manner:
• The bitumen realization (on a per m3 of bitumen basis) is calculated for the
current month using Enbridge allowance pricing for both diluent and heavy crude
and the average CRW pool density. Note: This is exactly the same information used
to generate the “Diluent Slope” term of the current condensate equalization.
• The corresponding diluent value required to maintain a constant bitumen
realization is calculated for a series of diluent densities.
• The “Blend Efficiency” slope is obtained from the regression of the individual
diluent value/density points
Similarly, the “Blend Value” term in equation (7) is a slope derived as follows:
• Using the bitumen realization calculated for the “Blend Efficiency” term and the
diluent allowance pricing, the value of a series of blends created using a range of
diluent densities is calculated.
• The “Blend Value” slope is obtained from the regression of the blend values with
diluent density.
In conclusion, the proposed new Density Penalty as expressed by equation (7) is
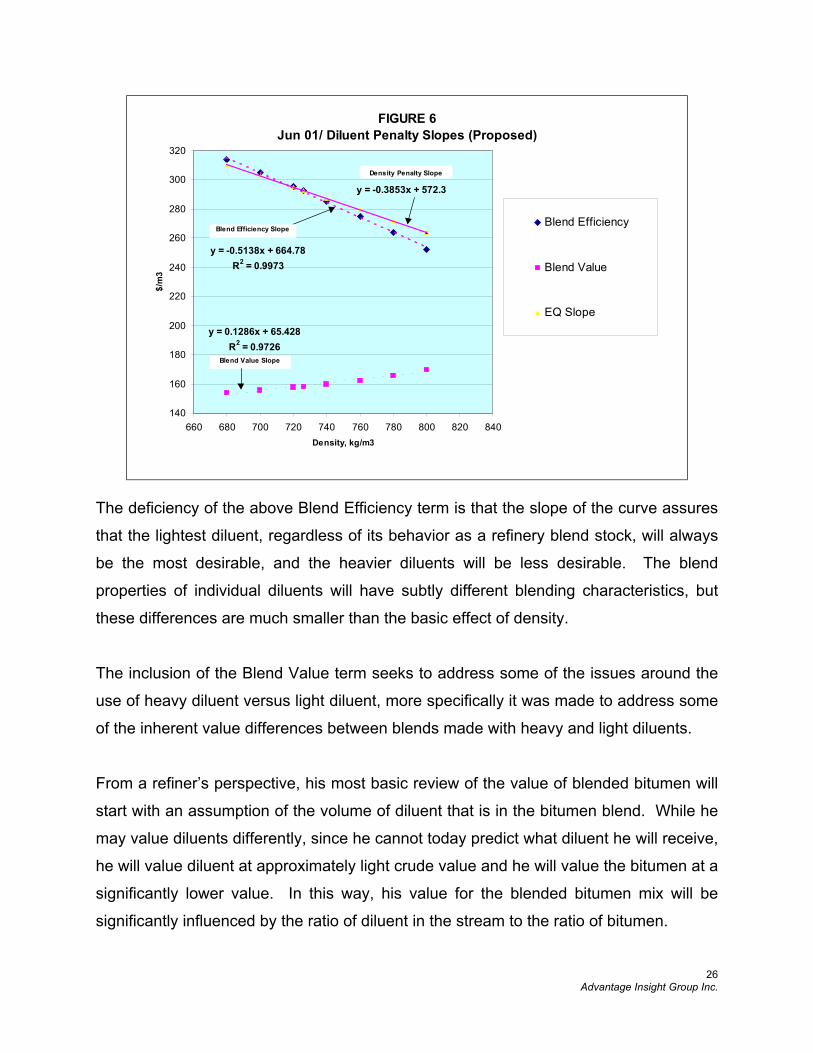
calculated by the addition of the Blend Efficiency and Blend Value slopes. Figure 6
illustrates this graphically.
Advantage Insight Group Inc.
26
FIGURE 6Jun 01/ Diluent Penalty Slopes (Proposed)
y = -0.5138x + 664.78R2 = 0.9973
y = 0.1286x + 65.428R2 = 0.9726
y = -0.3853x + 572.3
140
160
180
200
220
240
260
280
300
320
660 680 700 720 740 760 780 800 820 840Density, kg/m3
$/m
3
Blend Efficiency
Blend Value
EQ Slope
Blend Efficiency Slope
Blend Value Slope
Density Penalty Slope
The deficiency of the above Blend Efficiency term is that the slope of the curve assures
that the lightest diluent, regardless of its behavior as a refinery blend stock, will always
be the most desirable, and the heavier diluents will be less desirable. The blend
properties of individual diluents will have subtly different blending characteristics, but
these differences are much smaller than the basic effect of density.
The inclusion of the Blend Value term seeks to address some of the issues around the
use of heavy diluent versus light diluent, more specifically it was made to address some
of the inherent value differences between blends made with heavy and light diluents.
From a refiner’s perspective, his most basic review of the value of blended bitumen will
start with an assumption of the volume of diluent that is in the bitumen blend. While he
may value diluents differently, since he cannot today predict what diluent he will receive,
he will value diluent at approximately light crude value and he will value the bitumen at a
significantly lower value. In this way, his value for the blended bitumen mix will be
significantly influenced by the ratio of diluent in the stream to the ratio of bitumen.
Advantage Insight Group Inc.
27
If heavier diluent is used for blending, the amount of diluent that is required for any
given blend specification is greater than is required using light diluent. Thus the blender
that is using heavy diluent as his blend stock is adding value to the stream by using a
heavier diluent and this heavier diluent should reflect this greater contribution to the
stream value.
To reflect this increased value a second term was added to the equalization equation
that reflected the increase in blend value that results from the use of heavier diluent.
This term was calculated by assuming that a value could be determined using the
average condensate quality and price and the blended bitumen posting. Using this
bitumen value and assuming that the heavier diluents would be valued at the posted
diluent price, a diluent value curve could be created that showed the improvement in the
value of the diluted bitumen stream as more of the heavy condensates are added to the
diluent pool.
The result of this is a condensate equalization scheme that mirrors the original
equalization with two terms that partially offset each other, but with economics that are
based both on the physical blending properties of the diluents on the real economics of
blending bitumen and diluent.
It must be noted that the two terms in the diluent equalization equation do not both
reflect the immediate value of the diluted bitumen product. The first term, or the diluent
density term, reflects the momentary value of the diluent that is added to the bitumen,
while the second term reflects the future value of the stream if the refiners can be
convinced that the overall composition of the blended bitumen is changing.
Advantage Insight Group Inc.
28
Factors affecting diluent value are:
• its market value as a stream,
• the value of the resulting heavy oil blend,
• the equalization adjustment, and
• any effects of condensate chemical properties on its blending behavior.

Advantage Insight Group Inc.
29
Advantage Insight Group Inc.
30
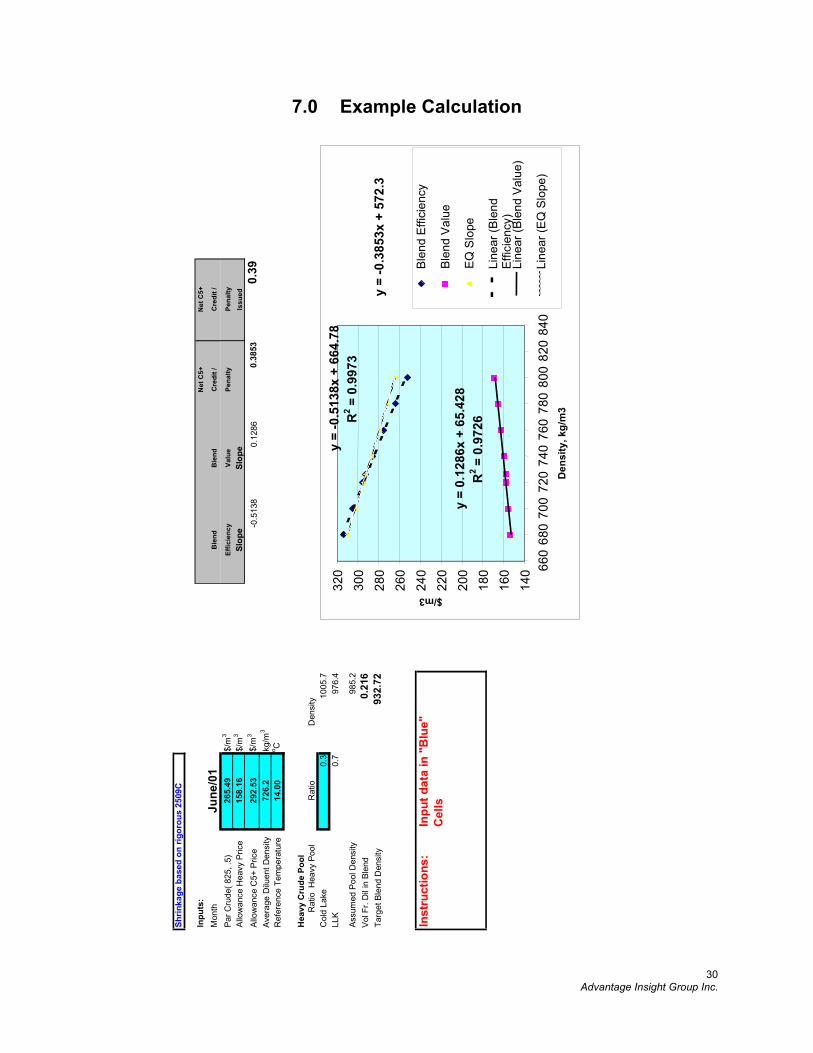
7.0 Example Calculation
Shrin
kage
bas
ed o
n rig
orou
s 25
09C
Inpu
ts:
Net
C5+
Net
C5+
Mon
thJu
ne/0
1B
lend
Ble
ndC
redi
t /C
redi
t /
Par C
rude
( 825
, .5)
265.
49$/
m3
Effic
ienc
yVa
lue
Pena
ltyPe
nalty
Allo
wan
ce H
eavy
Pric
e15
8.16
$/m
3Sl
ope
Slop
eIs
sued
Allo
wan
ce C
5+ P
rice
292.
53$/
m3
-0.5
138
0.12
860.
3853
0.39
Aver
age
Dilu
ent D
ensi
ty72
6.2
kg/m
3
Ref
eren
ce T
empe
ratu
re14
.00
o C
Hea
vy C
rude
Poo
lR
atio
Hea
vy P
ool
Rat
ioD
ensi
tyC
old
Lake
0.3
1005
.7LL
K0.
797
6.4
Assu
med
Poo
l Den
sity
985.
2Vo
l Fr.
Dil
in B
lend
0.21
6Ta
rget
Ble
nd D
ensi
ty93
2.72
Inst
ruct
ions
:In
put d
ata
in "
Blu
e"C
ells
y =
-0.5
138x
+ 6
64.7
8R
2 = 0
.997
3
y =
0.12
86x
+ 65
.428
R2 =
0.9
726
y =
-0.3
853x
+ 5
72.3
140
160
180
200
220
240
260
280
300
320 66
068
070
072
074
076
078
080
082
084
0D
ensi
ty, k
g/m
3
$/m3
Blen
d Ef
ficie
ncy
Blen
d Va
lue
EQ S
lope
Line
ar (B
lend
Effic
ienc
y)Li
near
(Ble
nd V
alue
)
Line
ar (E
Q S
lope
)
Advantage Insight Group Inc.
31
Above is an example of the input to the spreadsheet model used for the proposed condensate equalization methodology and the calculated result for June 2001.
Inputs
Par Crude (825,0.5) This is information is not pertinent to the condensate
equalization calculation but can be used to calculate the relative value of varying density diluents as a fraction of par crude.
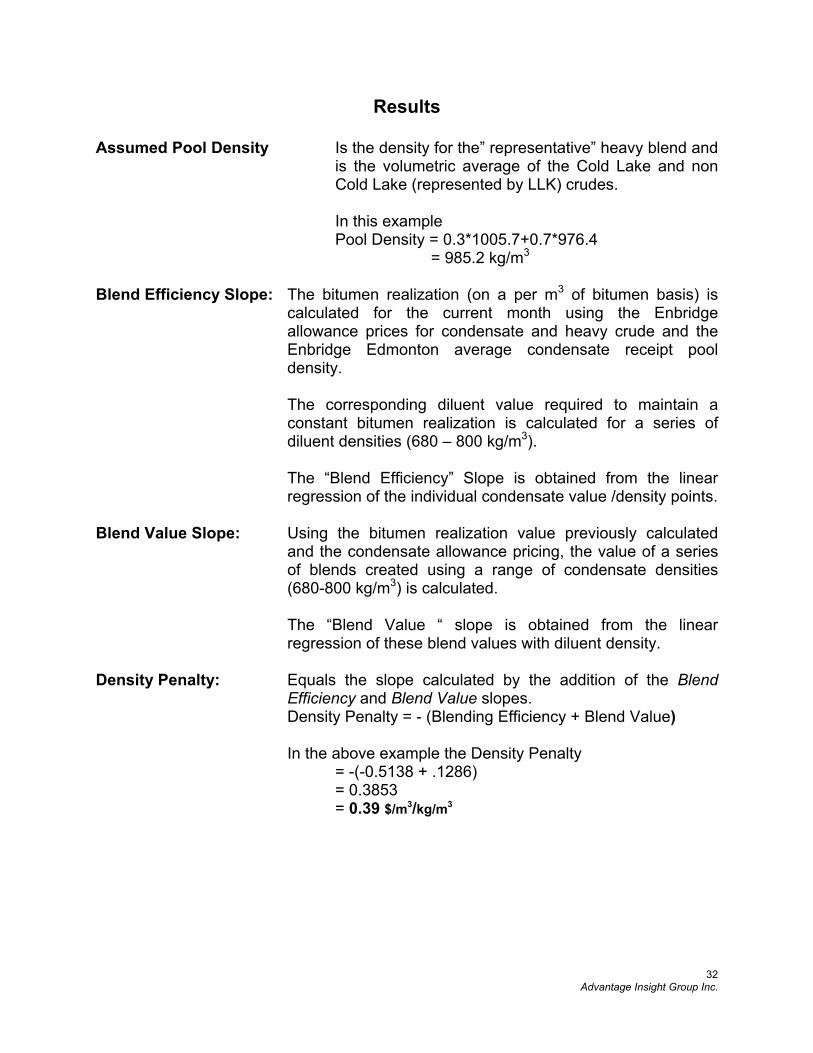
Allowance Heavy Price Enbridge’s Heavy Oil Allowance Price Allowance C5+ Price Enbridge’s Condensate Allowance Price Average Diluent Density The average density of Enbridge’s condensate stream
receipts at Edmonton. Reference Temperature The linear average of Enbridge’s semi-monthly pipeline
viscosity reference temperature Heavy Crude Pool Represents the proportion of Cold Lake bitumen blends to
other heavy oil/bitumen blends. This ratio is set annually by the Condensate Equalization Committee based on the respective volume of Cold Lake Blend and other heavy blends transported in the pipeline systems, as reported by the Crude Oil Logistics Committee (COLC).
Advantage Insight Group Inc.
32
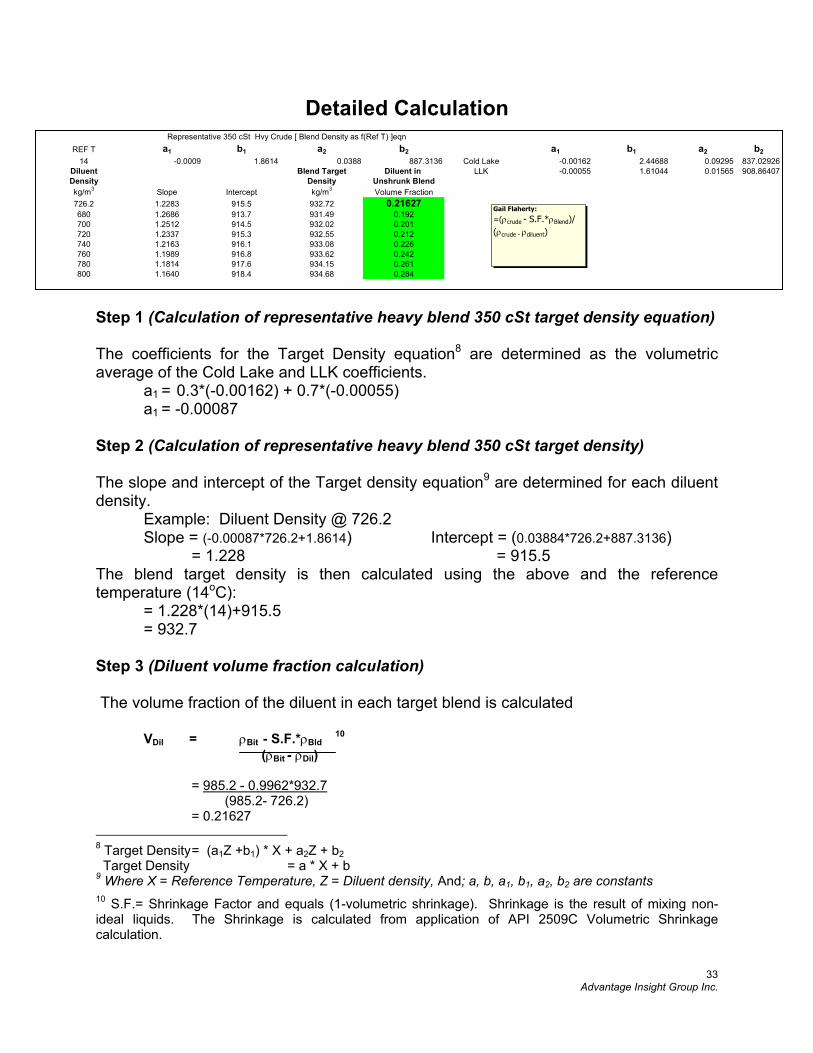
Results
Assumed Pool Density Is the density for the” representative” heavy blend and is the volumetric average of the Cold Lake and non Cold Lake (represented by LLK) crudes.
In this example Pool Density = 0.3*1005.7+0.7*976.4 = 985.2 kg/m3 Blend Efficiency Slope: The bitumen realization (on a per m3 of bitumen basis) is
calculated for the current month using the Enbridge allowance prices for condensate and heavy crude and the Enbridge Edmonton average condensate receipt pool density.
The corresponding diluent value required to maintain a
constant bitumen realization is calculated for a series of diluent densities (680 – 800 kg/m3).
The “Blend Efficiency” Slope is obtained from the linear
regression of the individual condensate value /density points. Blend Value Slope: Using the bitumen realization value previously calculated
and the condensate allowance pricing, the value of a series of blends created using a range of condensate densities (680-800 kg/m3) is calculated.
The “Blend Value “ slope is obtained from the linear
regression of these blend values with diluent density. Density Penalty: Equals the slope calculated by the addition of the Blend
Efficiency and Blend Value slopes. Density Penalty = - (Blending Efficiency + Blend Value)
In the above example the Density Penalty
= -(-0.5138 + .1286) = 0.3853 = 0.39 $/m3/kg/m3
Advantage Insight Group Inc.
33
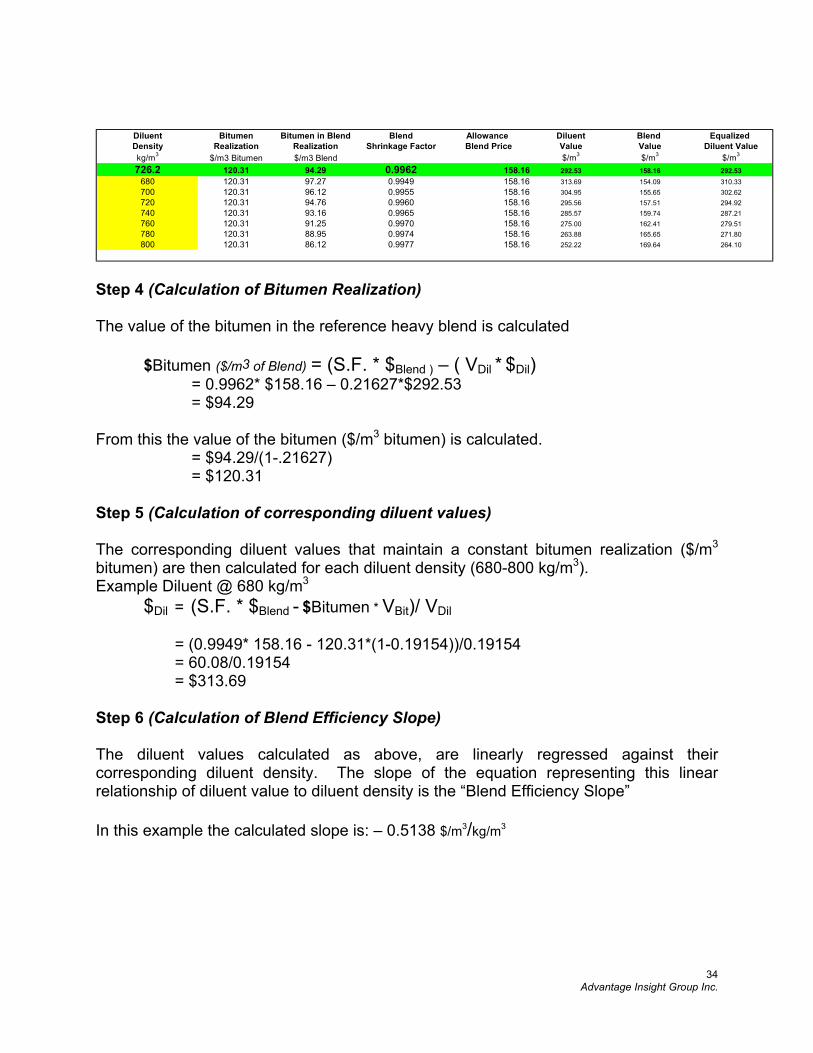
Detailed Calculation
Step 1 (Calculation of representative heavy blend 350 cSt target density equation) The coefficients for the Target Density equation8 are determined as the volumetric average of the Cold Lake and LLK coefficients. a1 = 0.3*(-0.00162) + 0.7*(-0.00055) a1 = -0.00087 Step 2 (Calculation of representative heavy blend 350 cSt target density) The slope and intercept of the Target density equation9 are determined for each diluent density.
Example: Diluent Density @ 726.2 Slope = (-0.00087*726.2+1.8614) Intercept = (0.03884*726.2+887.3136) = 1.228 = 915.5 The blend target density is then calculated using the above and the reference temperature (14oC): = 1.228*(14)+915.5 = 932.7 Step 3 (Diluent volume fraction calculation) The volume fraction of the diluent in each target blend is calculated
VDil = ρBit - S.F.*ρBld 10
(ρBit - ρDil)
= 985.2 - 0.9962*932.7 (985.2- 726.2) = 0.21627
8 Target Density = (a1Z +b1) * X + a2Z + b2 Target Density = a * X + b 9 Where X = Reference Temperature, Z = Diluent density, And; a, b, a1, b1, a2, b2 are constants 10 S.F.= Shrinkage Factor and equals (1-volumetric shrinkage). Shrinkage is the result of mixing non-ideal liquids. The Shrinkage is calculated from application of API 2509C Volumetric Shrinkage calculation.
REF T a1 b1 a2 b2 a1 b1 a2 b214 -0.0009 1.8614 0.0388 887.3136 Cold Lake -0.00162 2.44688 0.09295 837.02926
Diluent Blend Target Diluent in LLK -0.00055 1.61044 0.01565 908.86407Density Density Unshrunk Blendkg/m3 Slope Intercept kg/m3 Volume Fraction726.2 1.2283 915.5 932.72 0.21627680 1.2686 913.7 931.49 0.192700 1.2512 914.5 932.02 0.201720 1.2337 915.3 932.55 0.212740 1.2163 916.1 933.08 0.226760 1.1989 916.8 933.62 0.242780 1.1814 917.6 934.15 0.261800 1.1640 918.4 934.68 0.284
Representative 350 cSt Hvy Crude [ Blend Density as f(Ref T) ]eqn
Gail Flaherty:
=(ρcrude - S.F.*ρBlend)/(ρcrude - ρdiluent)
Advantage Insight Group Inc.
34
Diluent Bitumen Bitumen in Blend Blend Allowance Diluent Blend Equalized Density Realization Realization Shrinkage Factor Blend Price Value Value Diluent Valuekg/m3 $/m3 Bitumen $/m3 Blend $/m3 $/m3 $/m3
726.2 120.31 94.29 0.9962 158.16 292.53 158.16 292.53680 120.31 97.27 0.9949 158.16 313.69 154.09 310.33700 120.31 96.12 0.9955 158.16 304.95 155.65 302.62720 120.31 94.76 0.9960 158.16 295.56 157.51 294.92740 120.31 93.16 0.9965 158.16 285.57 159.74 287.21760 120.31 91.25 0.9970 158.16 275.00 162.41 279.51780 120.31 88.95 0.9974 158.16 263.88 165.65 271.80800 120.31 86.12 0.9977 158.16 252.22 169.64 264.10
Step 4 (Calculation of Bitumen Realization) The value of the bitumen in the reference heavy blend is calculated
$Bitumen ($/m3 of Blend) = (S.F. * $Blend ) – ( VDil * $Dil) = 0.9962* $158.16 – 0.21627*$292.53 = $94.29 From this the value of the bitumen ($/m3 bitumen) is calculated. = $94.29/(1-.21627) = $120.31 Step 5 (Calculation of corresponding diluent values) The corresponding diluent values that maintain a constant bitumen realization ($/m3 bitumen) are then calculated for each diluent density (680-800 kg/m3). Example Diluent @ 680 kg/m3 $Dil = (S.F. * $Blend - $Bitumen * VBit)/ VDil = (0.9949* 158.16 - 120.31*(1-0.19154))/0.19154 = 60.08/0.19154 = $313.69 Step 6 (Calculation of Blend Efficiency Slope) The diluent values calculated as above, are linearly regressed against their corresponding diluent density. The slope of the equation representing this linear relationship of diluent value to diluent density is the “Blend Efficiency Slope” In this example the calculated slope is: – 0.5138 $/m3/kg/m3
Advantage Insight Group Inc.
35
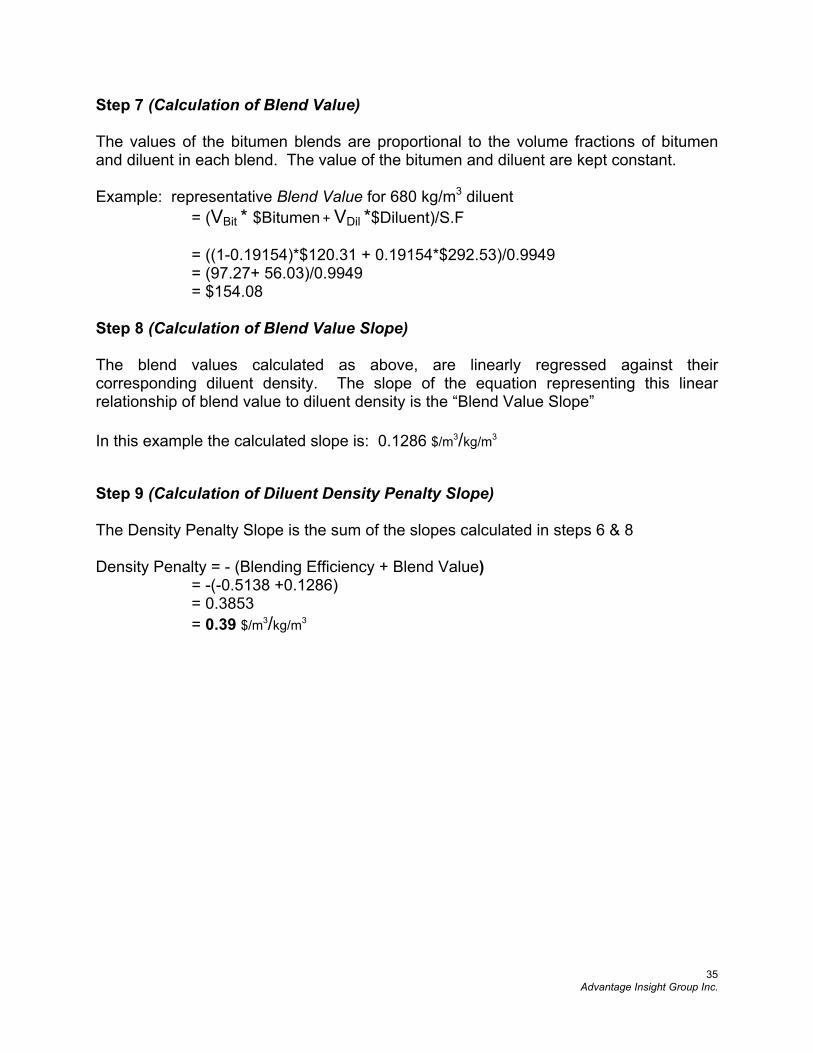
Step 7 (Calculation of Blend Value) The values of the bitumen blends are proportional to the volume fractions of bitumen and diluent in each blend. The value of the bitumen and diluent are kept constant. Example: representative Blend Value for 680 kg/m3 diluent
= (VBit * $Bitumen + VDil *$Diluent)/S.F
= ((1-0.19154)*$120.31 + 0.19154*$292.53)/0.9949 = (97.27+ 56.03)/0.9949 = $154.08 Step 8 (Calculation of Blend Value Slope) The blend values calculated as above, are linearly regressed against their corresponding diluent density. The slope of the equation representing this linear relationship of blend value to diluent density is the “Blend Value Slope” In this example the calculated slope is: 0.1286 $/m3/kg/m3
Step 9 (Calculation of Diluent Density Penalty Slope) The Density Penalty Slope is the sum of the slopes calculated in steps 6 & 8 Density Penalty = - (Blending Efficiency + Blend Value) = -(-0.5138 +0.1286) = 0.3853 = 0.39 $/m3/kg/m3
Advantage Insight Group Inc.
36
8.0 Conclusions
The viscosity blending behavior of crude/diluent blends can be represented by a two
term equation relating blend target density to both reference temperature and diluent
density.
The proposed methodology does not change the base concepts or form of the original
condensate equalization but rather expands upon them. The new methodology gives
an exact definition to the diluent slope penalty based on the premise of equal bitumen
realization. The calculation of bitumen realization is backed by laboratory data and
consistent mathematics. The Refinery Value term is replaced by a Blend Value term
that captures what is known today. Refiners track reference temperature and will vary
their posting based on an assumption of the diluent/crude ratio in the blend. The end
results of the proposed modifications are as follows:
• A calculated heavy oil blend density that is dependent on both reference
temperature and diluent density.
• A shrinkage factor that varies with diluent density.
• Monthly calculation of the Blend Value factor.
• A Condensate Density Penalty that will remain positive under all likely pricing
scenarios.
• A Condensate Density Penalty calculation that does not over react to variations in
the light – heavy differentials.
Advantage Insight Group Inc.
37
In conclusion the Proposed Condensate Density Penalty Calculation:
Condensate Density Penalty Slope= - (Blending Efficiency Slope + Blend Value Slope)
Where
• Blending Efficiency Slope reflects the variation with density in the calculated
value of the diluent required to maintain a constant bitumen realization.
And
• Blend Value Slope reflects the variation in stream value with diluent content.
is an improvement to the current Condensate Density Penalty Calculation and if
implemented will address the concerns identified by Industry.
Advantage Insight Group Inc.
38
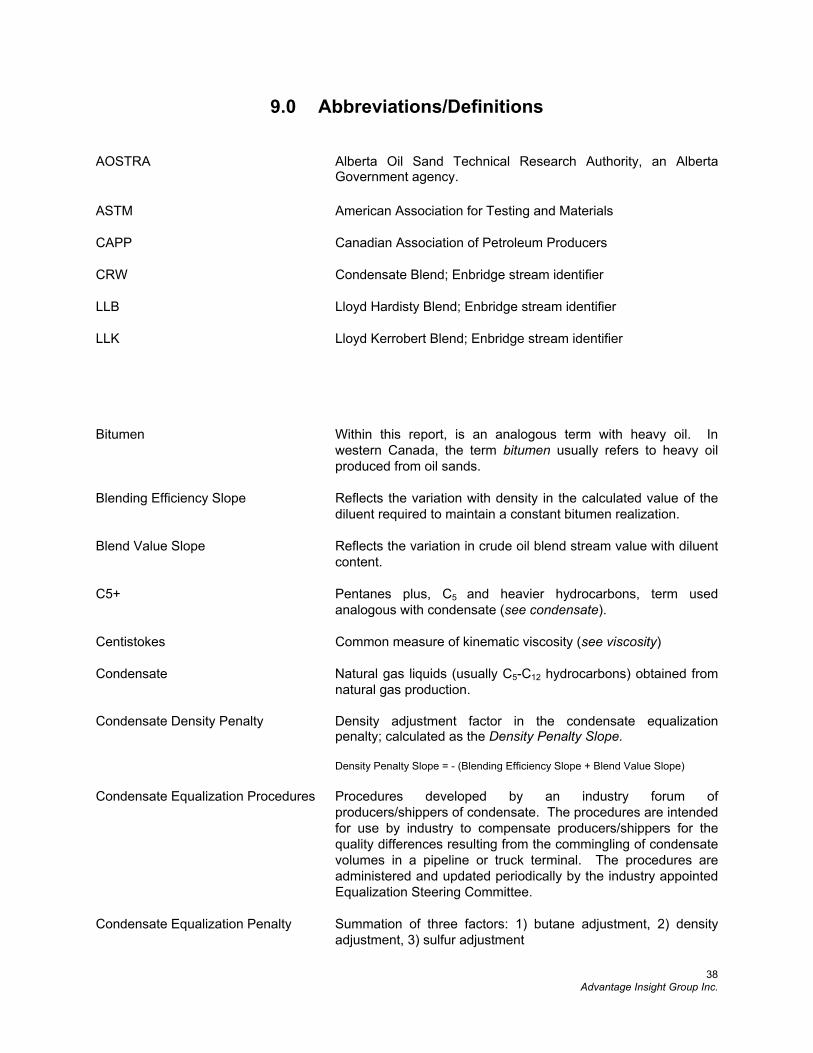
9.0 Abbreviations/Definitions AOSTRA Alberta Oil Sand Technical Research Authority, an Alberta
Government agency. ASTM American Association for Testing and Materials
CAPP Canadian Association of Petroleum Producers
CRW Condensate Blend; Enbridge stream identifier
LLB Lloyd Hardisty Blend; Enbridge stream identifier
LLK Lloyd Kerrobert Blend; Enbridge stream identifier
Bitumen Within this report, is an analogous term with heavy oil. In western Canada, the term bitumen usually refers to heavy oil produced from oil sands.
Blending Efficiency Slope Reflects the variation with density in the calculated value of the diluent required to maintain a constant bitumen realization.
Blend Value Slope Reflects the variation in crude oil blend stream value with diluent content.
C5+ Pentanes plus, C5 and heavier hydrocarbons, term used analogous with condensate (see condensate).
Centistokes Common measure of kinematic viscosity (see viscosity)
Condensate Natural gas liquids (usually C5-C12 hydrocarbons) obtained from natural gas production.
Condensate Density Penalty Density adjustment factor in the condensate equalization penalty; calculated as the Density Penalty Slope.
Density Penalty Slope = - (Blending Efficiency Slope + Blend Value Slope)
Condensate Equalization Procedures Procedures developed by an industry forum of producers/shippers of condensate. The procedures are intended for use by industry to compensate producers/shippers for the quality differences resulting from the commingling of condensate volumes in a pipeline or truck terminal. The procedures are administered and updated periodically by the industry appointed Equalization Steering Committee.
Condensate Equalization Penalty Summation of three factors: 1) butane adjustment, 2) density adjustment, 3) sulfur adjustment
Advantage Insight Group Inc.
39
Diluent Hydrocarbon added to heavy crude/bitumen to reduce viscosity. Common practice is to use natural gas condensate as the diluent source. Other sources of diluent can include but are not necessarily limited to: light conventional produced hydrocarbon oils, refinery naphtha (gasoline) and synthetic crude oils.
Shrinkage The volume lost/gained when mixing (blending) non-ideal fluids.
Shrinkage Factor The resultant blend volume fraction obtained when blending non-Ideal fluids.
Viscosity The viscosity of a liquid is a measure of the liquid’s internal friction or its resistance to flow. It is a measure of a liquid’s readiness to flow when acted upon by an external force.
Viscosity - Absolute Also called dynamic viscosity is defined as the shear stress at a point divided by the velocity gradient at the point. Restated, it is the force required to move a plane surface of one square centimeter over another plane surface at the rate of one centimeter per second when the two surfaces are separated by a layer of liquid one centimeter in thickness. The unit of absolute viscosity is the poise. (P). Absolute viscosities are often reported in centipoises (cP). One poise equals one hundred centipoises.
Viscosity - Kinematic The absolute viscosity of a fluid divided by its density. The unit of kinematic viscosity is the stoke (St). Common practice in the petroleum industry is to use the hundredth part of a stoke or centistoke (cSt) to express kinematic viscosity.
Advantage Insight Group Inc.
40
10.0 Bibliography Condensate Equalization Sub-Committee, The Canadian Condensate Equalization Process, Procedure Guide, Developed March 1991, Revised October 1997
Volumetric Shrinkage Resulting From Blending Volatile Hydrocarbons with Crude Oils API Publication 2509C; Second Edition, December 1967, Reaffirmed, October 1992 ASTM D341-93 (1998) Standard Viscosity – Temperature Charts for Liquid Petroleum Products ASTM D445-01 Standard Test Method for Kinematic Viscosity of Transparent and Opaque Liquids (the Calculation of Dynamic Viscosity) Chapter 8 “Viscosity”, Article, source unknown
A Review of Analytical Methods for Bitumens and Heavy Oils
AOSTRA Technical Publication Series #5, 1988
Technical Handbook on Oil Sands, Bitumens and Heavy Oils AOSTRA Technical Publication Series #6, 1989
Syncrude Analytical Methods Manual for Bitumen Upgrading AOSTRA Technical Publications Series #11, 1991
McGraw – Hill Dictionary of Scientific and Technical Terms, 2nd Edition

Advantage Insight Group Inc.
41
I-1 Advantage Insight Group Inc.
Appendix 1 Laboratory Data
Core Laboratories Reservoir Fluids Report - Calgary
Diluent Blending Project for
CAPP / Advantage Insight Group
File Number: 52137-2001-3180 Date: December 18, 2001 Report Distribution: Gail Flaherty (Calgary) - 2 copies
APPROVED BY:
Ken Chong, PhD Manager, Reservoir Fluids Group Phone # 250-4016 Email [email protected]
Please contact the above person should there be any questions concerning the contents of this report. Atmospheric samples will be kept a maximum of 30 days. The analysis, opinions or interpretations contained in this report are based upon observations and material supplied by the client for whose exclusive and confidential use this report has been made. The interpretations or opinions expressed represent the best judgement of Core Laboratories. Core Laboratories assumes no responsibility and makes no warranty or representations, expressed or implied, as to the productivity, proper operations, or profitableness however of any oil, gas, coal or other mineral, proper well or sand in connection with which such report is used or relied upon for any reason whatsoever.
COMPANY CAPP / Advantage Insight Group PAGE 1 WELL DATE 01-12-18 PROJECT Diluent Blending Project FILE 52137-2001-3180
Scope of the Work
CAPP / Advantage Insight Group requested Core Laboratories prepare various diluent-bitumen blends to target densities. The prepared blends in addition to the diluents and bitumens were subject to characterization. This report summarizes the laboratory findings. Sample Descriptions
Two bitumens and ten diluents were included in the study. Blends were prepared for all bitumen-diluent pairs. In addition, two synthetic diluents were prepared and blended with one of the bitumens. Below is a summary of samples received.
Sample Description
Bitumen Cold Lake
Bitumen Nexen Wascana
Diluent CPR Peace 0192
Diluent CAM Amoco 0484
Diluent CFT Fort Saskatchewan 0200
Diluent CPM Pembina 0373
Diluent West Pembina Imperial 3-28-49-11W5
Diluent Swan Hills Anderson 5-34-66-10W5 battery
Diluent Valhalla Anderson 10-14-76-10W5 battery
Diluent CRW 700 June 3rd sample
Diluent CRW 700 June 1st sample
Diluent CRM Rimbey 207
Synthetic diluent 1 CFT (20%), CRM (19%), CAM (7%), CPR (18%), CPM (36%)
Synthetic diluent 2 Synthetic diluent 1 (75%), Swan Hills (25%)
Synthetic diluent components in volume %
COMPANY CAPP / Advantage Insight Group PAGE 2 WELL DATE 01-12-18 PROJECT Diluent Blending Project FILE 52137-2001-3180
Data Locations Methodology comments .............................................................................................Page 2 Bitumen characterization ............................................................................................Page 3 Diluent characterization.......................................................................................... Page 4-6 Cold Lake blend characterization ......................................................................... Page 7-11 Nexen blend characterization.............................................................................. Page 12-17 Simulated distillation data .....................................................................................Appendix Methodology Comments In preparing the diluent-bitumen blends, methodology was employed to address the volatility and aging issues. Diluent samples were kept in cold storage until needed. Blends were prepared by mass using stoppered glass cylinders. To ensure relative consistency between the time of blend preparation and measurements, the timing of blend preparation and measurements was kept consistent – e.g. diluent-bitumen blend samples prepared in the morning, followed by density and viscosity measurements in the afternoon. In addition, to ensure consistency, one technician was assigned to this project. Characterization of the samples were as per industry standard procedures. Below is a summary of the methods employed. Test Method Density ASTM D5002 Sulfur ASTM D4294 Viscosity ASTM D445 Asphaltenes ASTM D4055 RVP ASTM D5191 FIA ASTM D1319 Simulated distillation ASTM D2887 and D5307
Company CAPP / Advantage Insight Group Page 3Project Diluent Blending ProjectFile 52137-2001-3180
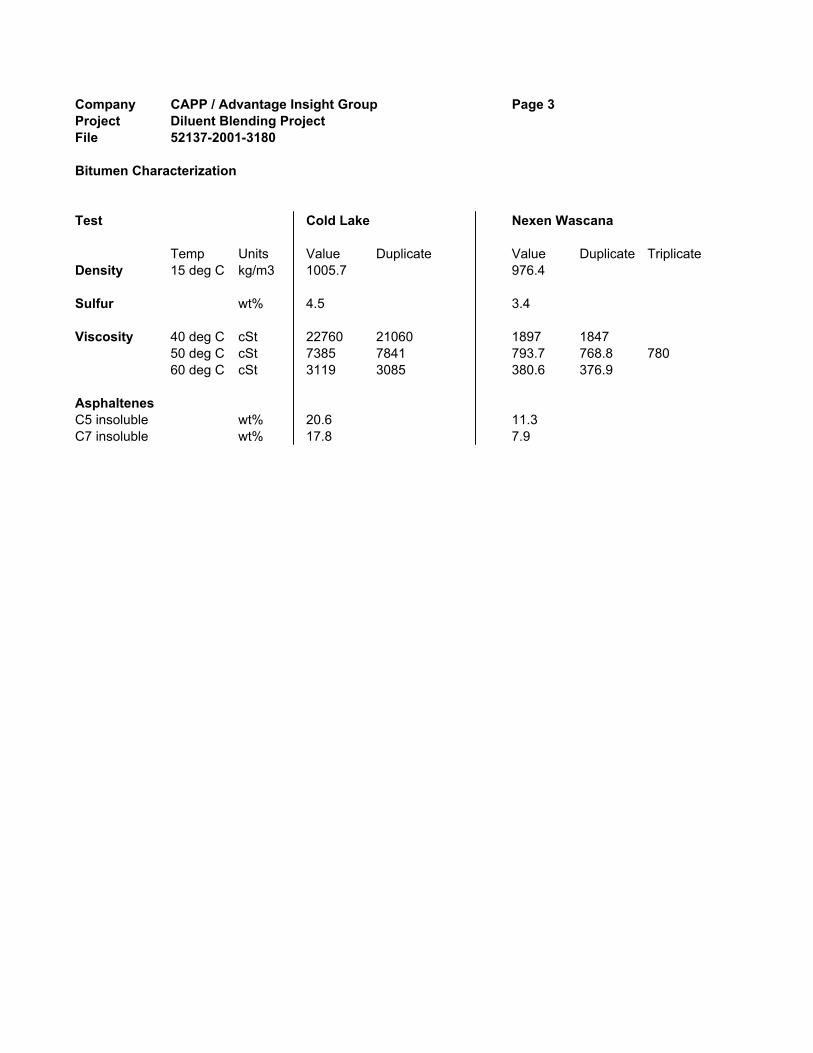
Bitumen Characterization
Test Cold Lake Nexen Wascana
Temp Units Value Duplicate Value Duplicate TriplicateDensity 15 deg C kg/m3 1005.7 976.4
Sulfur wt% 4.5 3.4
Viscosity 40 deg C cSt 22760 21060 1897 184750 deg C cSt 7385 7841 793.7 768.8 78060 deg C cSt 3119 3085 380.6 376.9
AsphaltenesC5 insoluble wt% 20.6 11.3C7 insoluble wt% 17.8 7.9
Company CAPP / Advantage Insight Group Page 4Project Diluent Blending ProjectFile 52137-2001-3180
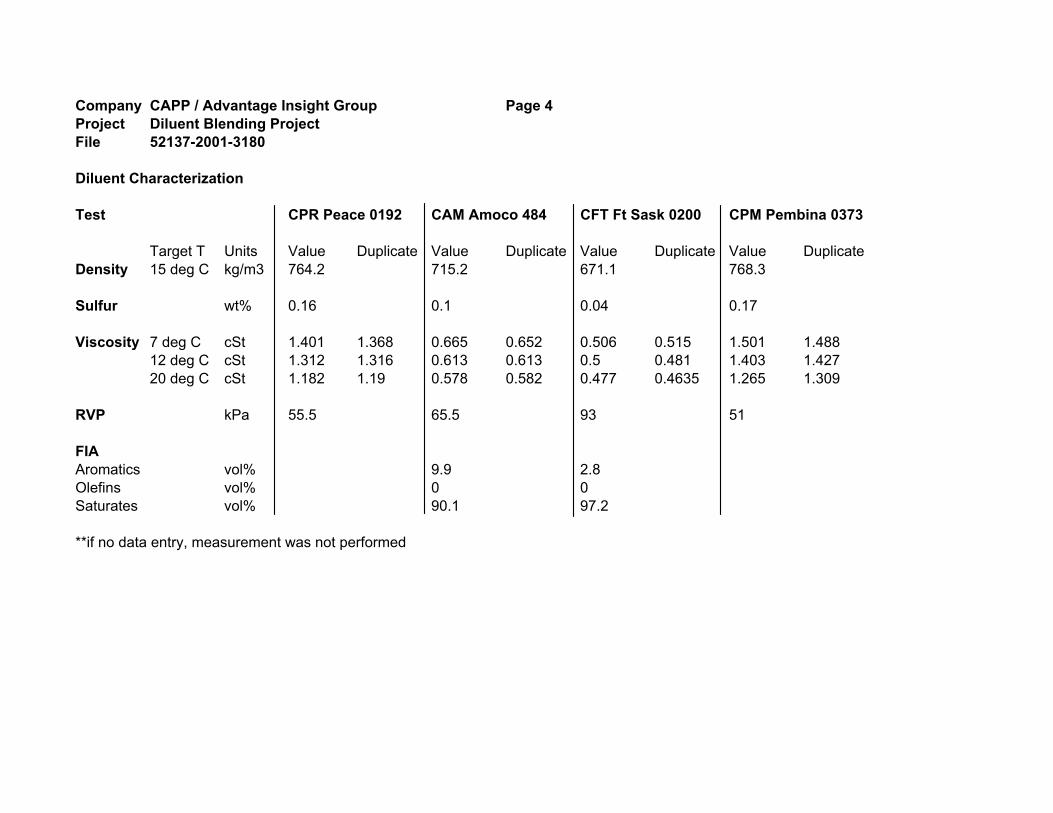
Diluent Characterization
Test CPR Peace 0192 CAM Amoco 484 CFT Ft Sask 0200 CPM Pembina 0373
Target T Units Value Duplicate Value Duplicate Value Duplicate Value DuplicateDensity 15 deg C kg/m3 764.2 715.2 671.1 768.3
Sulfur wt% 0.16 0.1 0.04 0.17
Viscosity 7 deg C cSt 1.401 1.368 0.665 0.652 0.506 0.515 1.501 1.48812 deg C cSt 1.312 1.316 0.613 0.613 0.5 0.481 1.403 1.42720 deg C cSt 1.182 1.19 0.578 0.582 0.477 0.4635 1.265 1.309
RVP kPa 55.5 65.5 93 51
FIAAromatics vol% 9.9 2.8Olefins vol% 0 0Saturates vol% 90.1 97.2
**if no data entry, measurement was not performed
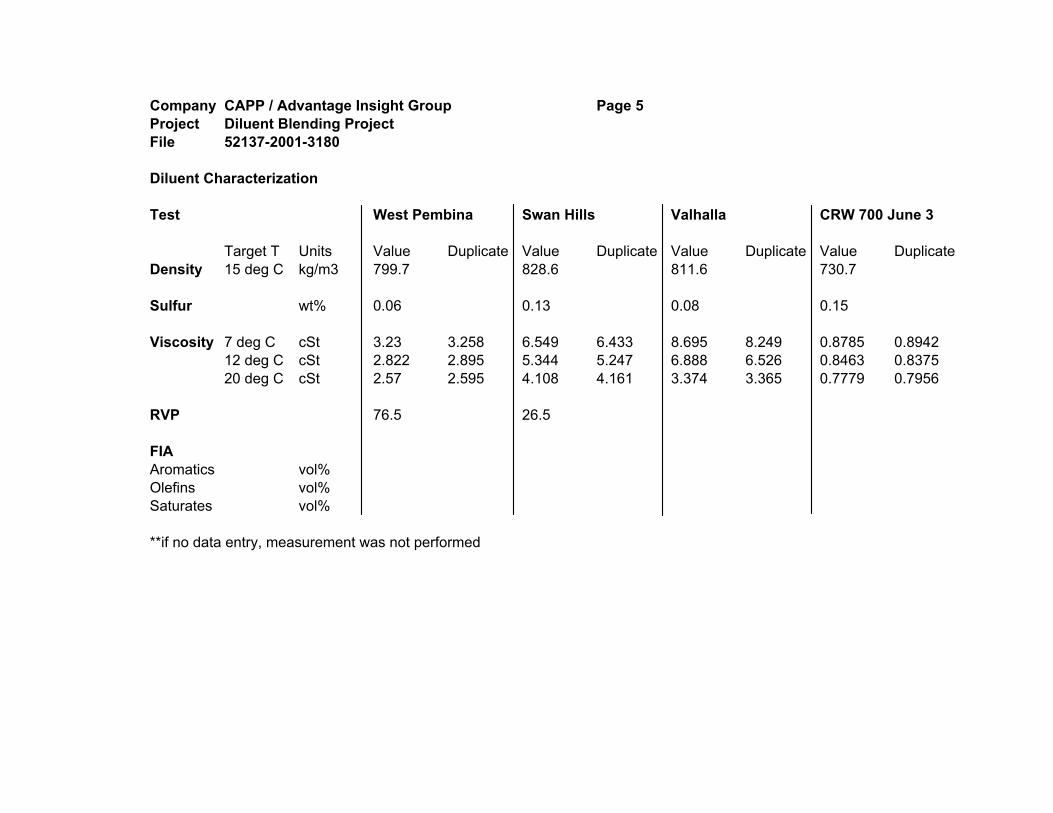
Company CAPP / Advantage Insight Group Page 5Project Diluent Blending ProjectFile 52137-2001-3180
Diluent Characterization
Test West Pembina Swan Hills Valhalla CRW 700 June 3
Target T Units Value Duplicate Value Duplicate Value Duplicate Value DuplicateDensity 15 deg C kg/m3 799.7 828.6 811.6 730.7
Sulfur wt% 0.06 0.13 0.08 0.15
Viscosity 7 deg C cSt 3.23 3.258 6.549 6.433 8.695 8.249 0.8785 0.894212 deg C cSt 2.822 2.895 5.344 5.247 6.888 6.526 0.8463 0.837520 deg C cSt 2.57 2.595 4.108 4.161 3.374 3.365 0.7779 0.7956
RVP 76.5 26.5
FIAAromatics vol%Olefins vol%Saturates vol%
**if no data entry, measurement was not performed
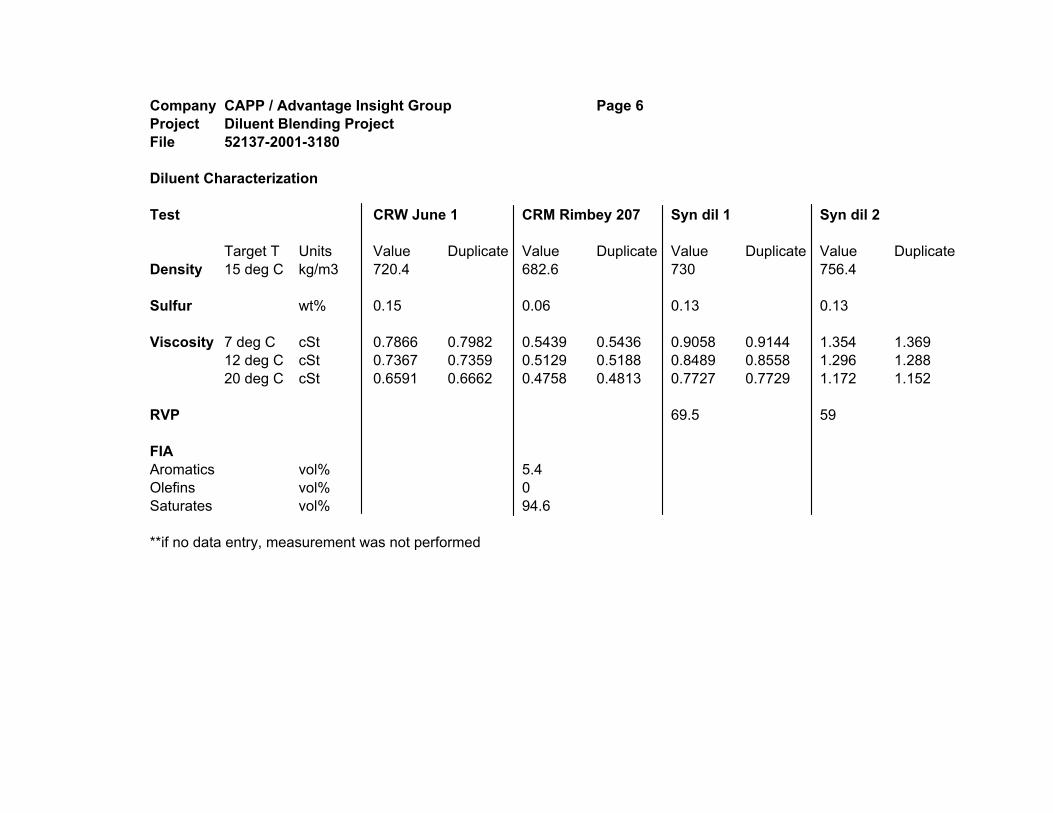
Company CAPP / Advantage Insight Group Page 6Project Diluent Blending ProjectFile 52137-2001-3180
Diluent Characterization
Test CRW June 1 CRM Rimbey 207 Syn dil 1 Syn dil 2
Target T Units Value Duplicate Value Duplicate Value Duplicate Value DuplicateDensity 15 deg C kg/m3 720.4 682.6 730 756.4
Sulfur wt% 0.15 0.06 0.13 0.13
Viscosity 7 deg C cSt 0.7866 0.7982 0.5439 0.5436 0.9058 0.9144 1.354 1.36912 deg C cSt 0.7367 0.7359 0.5129 0.5188 0.8489 0.8558 1.296 1.28820 deg C cSt 0.6591 0.6662 0.4758 0.4813 0.7727 0.7729 1.172 1.152
RVP 69.5 59
FIAAromatics vol% 5.4Olefins vol% 0Saturates vol% 94.6
**if no data entry, measurement was not performed
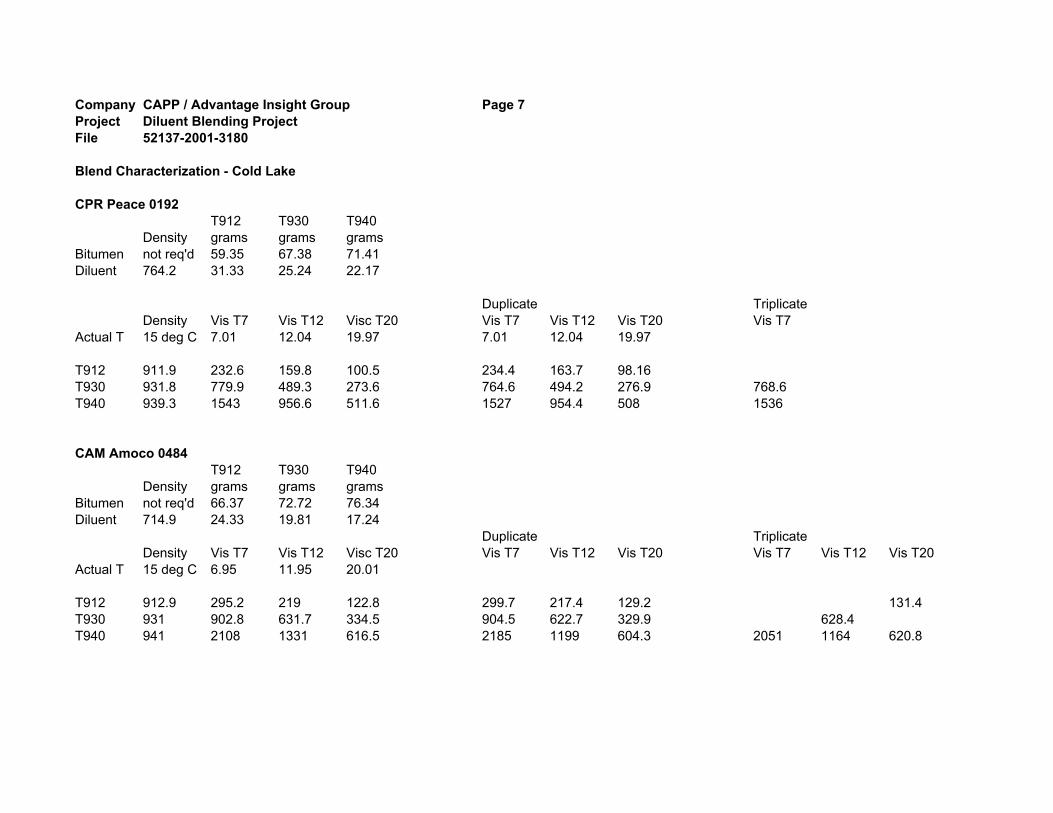
Company CAPP / Advantage Insight Group Page 7Project Diluent Blending ProjectFile 52137-2001-3180
Blend Characterization - Cold Lake
CPR Peace 0192T912 T930 T940
Density grams grams gramsBitumen not req'd 59.35 67.38 71.41Diluent 764.2 31.33 25.24 22.17
Duplicate TriplicateDensity Vis T7 Vis T12 Visc T20 Vis T7 Vis T12 Vis T20 Vis T7
Actual T 15 deg C 7.01 12.04 19.97 7.01 12.04 19.97
T912 911.9 232.6 159.8 100.5 234.4 163.7 98.16T930 931.8 779.9 489.3 273.6 764.6 494.2 276.9 768.6T940 939.3 1543 956.6 511.6 1527 954.4 508 1536
CAM Amoco 0484T912 T930 T940
Density grams grams gramsBitumen not req'd 66.37 72.72 76.34Diluent 714.9 24.33 19.81 17.24
Duplicate TriplicateDensity Vis T7 Vis T12 Visc T20 Vis T7 Vis T12 Vis T20 Vis T7 Vis T12 Vis T20
Actual T 15 deg C 6.95 11.95 20.01
T912 912.9 295.2 219 122.8 299.7 217.4 129.2 131.4T930 931 902.8 631.7 334.5 904.5 622.7 329.9 628.4T940 941 2108 1331 616.5 2185 1199 604.3 2051 1164 620.8
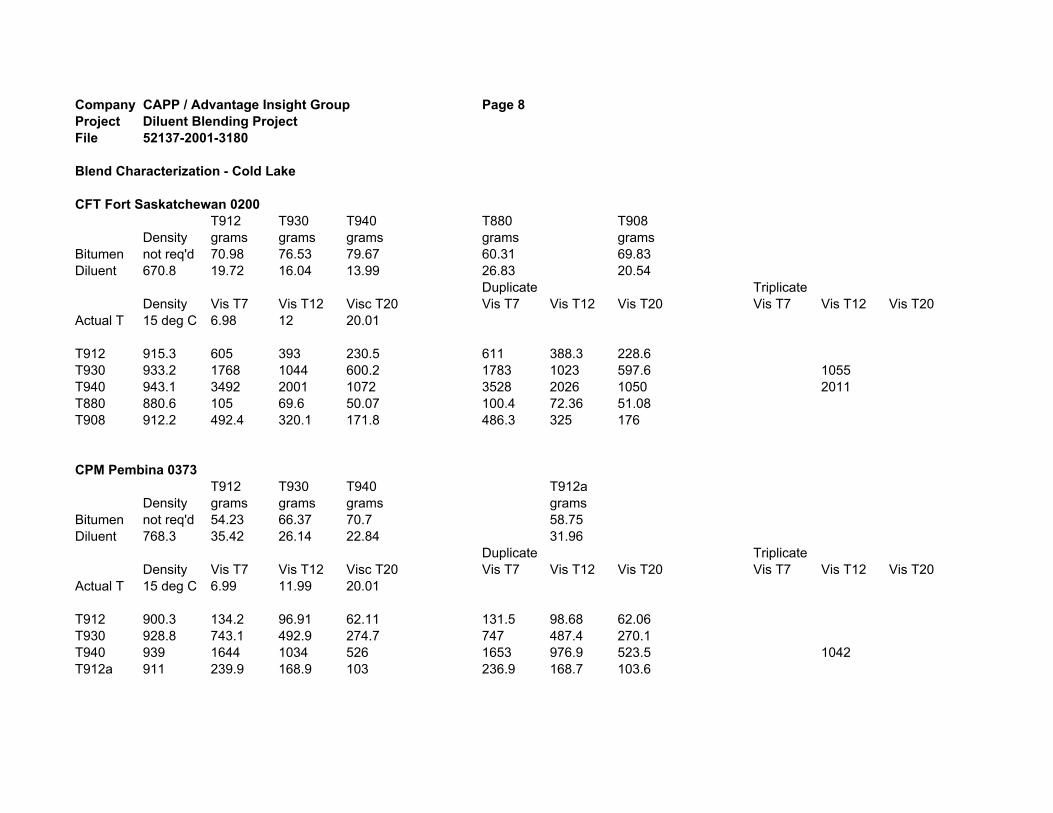
Company CAPP / Advantage Insight Group Page 8Project Diluent Blending ProjectFile 52137-2001-3180
Blend Characterization - Cold Lake
CFT Fort Saskatchewan 0200T912 T930 T940 T880 T908
Density grams grams grams grams gramsBitumen not req'd 70.98 76.53 79.67 60.31 69.83Diluent 670.8 19.72 16.04 13.99 26.83 20.54
Duplicate TriplicateDensity Vis T7 Vis T12 Visc T20 Vis T7 Vis T12 Vis T20 Vis T7 Vis T12 Vis T20
Actual T 15 deg C 6.98 12 20.01
T912 915.3 605 393 230.5 611 388.3 228.6T930 933.2 1768 1044 600.2 1783 1023 597.6 1055T940 943.1 3492 2001 1072 3528 2026 1050 2011T880 880.6 105 69.6 50.07 100.4 72.36 51.08T908 912.2 492.4 320.1 171.8 486.3 325 176
CPM Pembina 0373T912 T930 T940 T912a
Density grams grams grams gramsBitumen not req'd 54.23 66.37 70.7 58.75Diluent 768.3 35.42 26.14 22.84 31.96
Duplicate TriplicateDensity Vis T7 Vis T12 Visc T20 Vis T7 Vis T12 Vis T20 Vis T7 Vis T12 Vis T20
Actual T 15 deg C 6.99 11.99 20.01
T912 900.3 134.2 96.91 62.11 131.5 98.68 62.06T930 928.8 743.1 492.9 274.7 747 487.4 270.1T940 939 1644 1034 526 1653 976.9 523.5 1042T912a 911 239.9 168.9 103 236.9 168.7 103.6
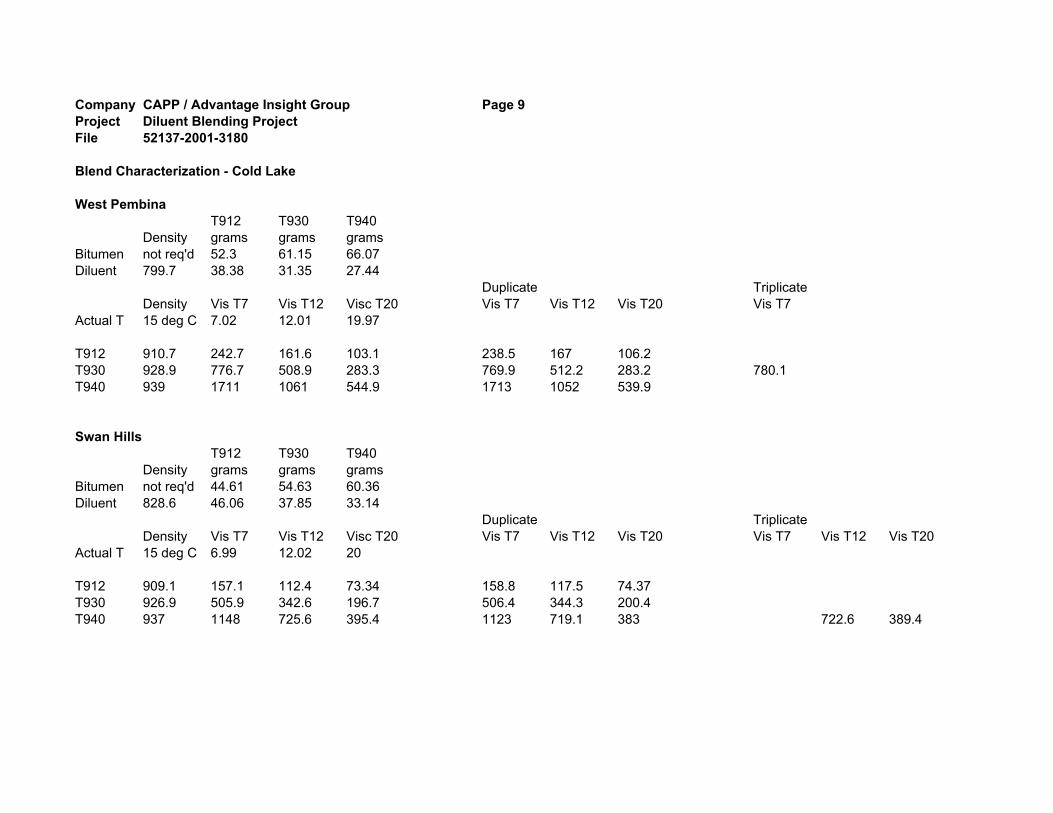
Company CAPP / Advantage Insight Group Page 9Project Diluent Blending ProjectFile 52137-2001-3180
Blend Characterization - Cold Lake
West PembinaT912 T930 T940
Density grams grams gramsBitumen not req'd 52.3 61.15 66.07Diluent 799.7 38.38 31.35 27.44
Duplicate TriplicateDensity Vis T7 Vis T12 Visc T20 Vis T7 Vis T12 Vis T20 Vis T7
Actual T 15 deg C 7.02 12.01 19.97
T912 910.7 242.7 161.6 103.1 238.5 167 106.2T930 928.9 776.7 508.9 283.3 769.9 512.2 283.2 780.1T940 939 1711 1061 544.9 1713 1052 539.9
Swan HillsT912 T930 T940
Density grams grams gramsBitumen not req'd 44.61 54.63 60.36Diluent 828.6 46.06 37.85 33.14
Duplicate TriplicateDensity Vis T7 Vis T12 Visc T20 Vis T7 Vis T12 Vis T20 Vis T7 Vis T12 Vis T20
Actual T 15 deg C 6.99 12.02 20
T912 909.1 157.1 112.4 73.34 158.8 117.5 74.37T930 926.9 505.9 342.6 196.7 506.4 344.3 200.4T940 937 1148 725.6 395.4 1123 719.1 383 722.6 389.4
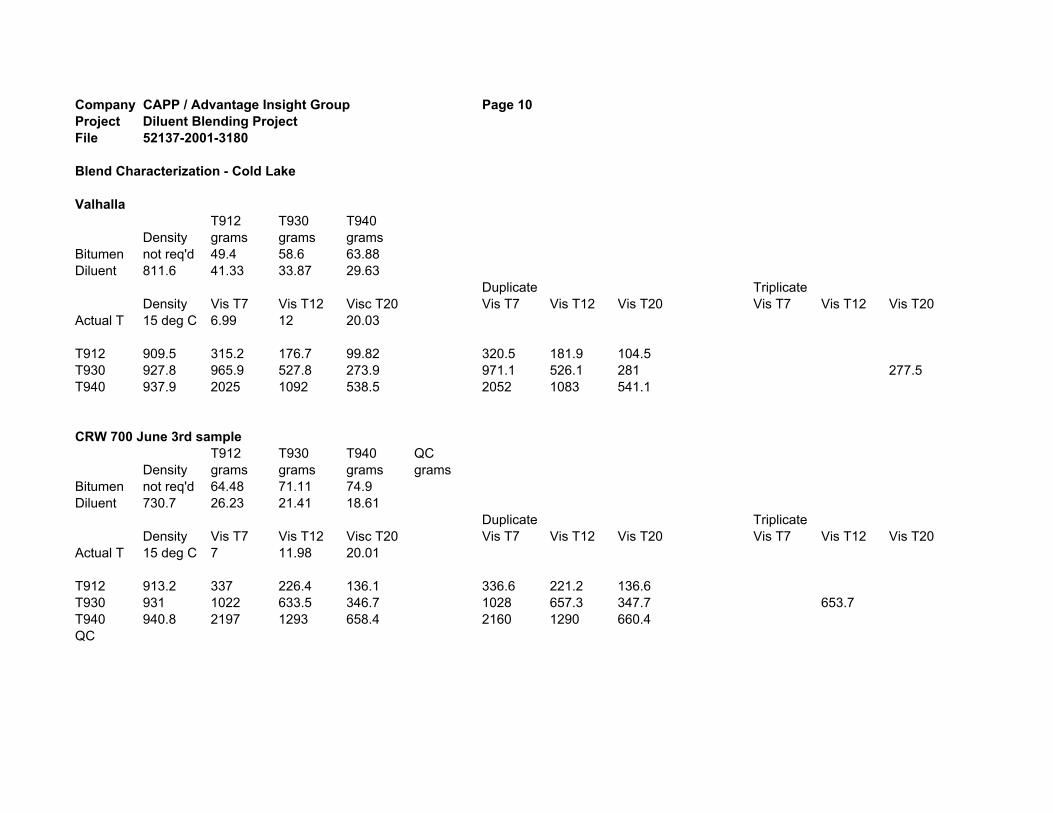
Company CAPP / Advantage Insight Group Page 10Project Diluent Blending ProjectFile 52137-2001-3180
Blend Characterization - Cold Lake
ValhallaT912 T930 T940
Density grams grams gramsBitumen not req'd 49.4 58.6 63.88Diluent 811.6 41.33 33.87 29.63
Duplicate TriplicateDensity Vis T7 Vis T12 Visc T20 Vis T7 Vis T12 Vis T20 Vis T7 Vis T12 Vis T20
Actual T 15 deg C 6.99 12 20.03
T912 909.5 315.2 176.7 99.82 320.5 181.9 104.5T930 927.8 965.9 527.8 273.9 971.1 526.1 281 277.5T940 937.9 2025 1092 538.5 2052 1083 541.1
CRW 700 June 3rd sampleT912 T930 T940 QC
Density grams grams grams gramsBitumen not req'd 64.48 71.11 74.9Diluent 730.7 26.23 21.41 18.61
Duplicate TriplicateDensity Vis T7 Vis T12 Visc T20 Vis T7 Vis T12 Vis T20 Vis T7 Vis T12 Vis T20
Actual T 15 deg C 7 11.98 20.01
T912 913.2 337 226.4 136.1 336.6 221.2 136.6T930 931 1022 633.5 346.7 1028 657.3 347.7 653.7T940 940.8 2197 1293 658.4 2160 1290 660.4QC
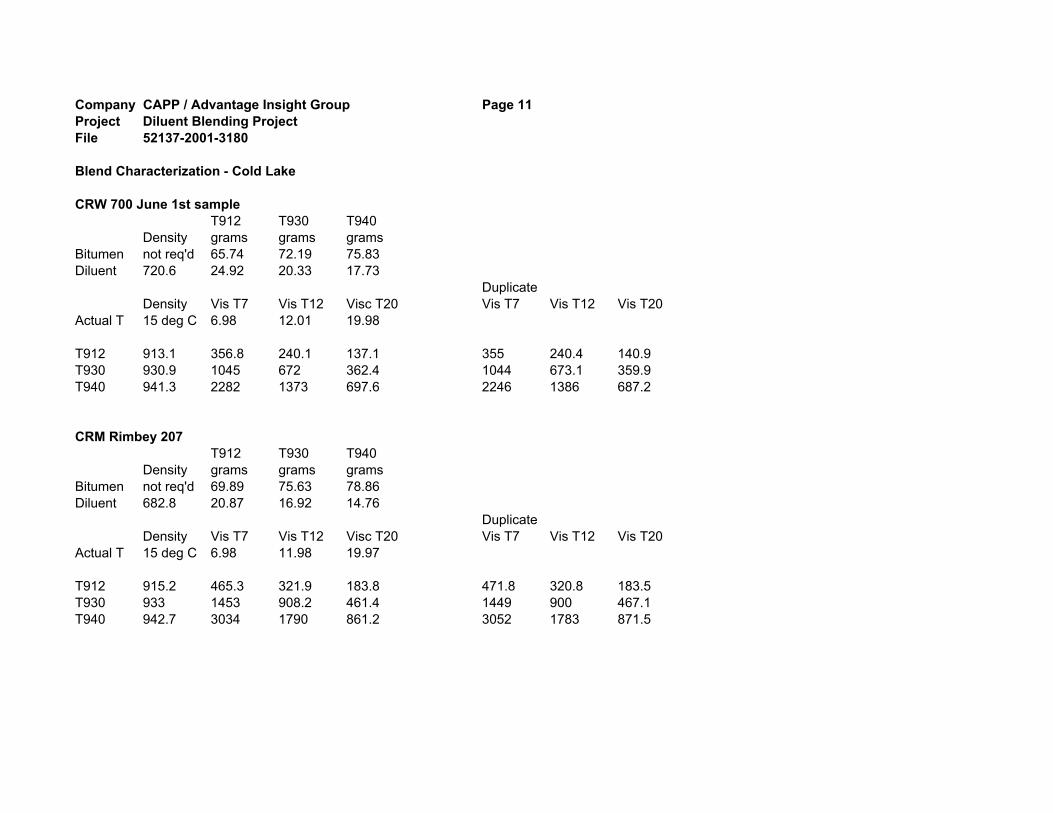
Company CAPP / Advantage Insight Group Page 11Project Diluent Blending ProjectFile 52137-2001-3180
Blend Characterization - Cold Lake
CRW 700 June 1st sampleT912 T930 T940
Density grams grams gramsBitumen not req'd 65.74 72.19 75.83Diluent 720.6 24.92 20.33 17.73
DuplicateDensity Vis T7 Vis T12 Visc T20 Vis T7 Vis T12 Vis T20
Actual T 15 deg C 6.98 12.01 19.98
T912 913.1 356.8 240.1 137.1 355 240.4 140.9T930 930.9 1045 672 362.4 1044 673.1 359.9T940 941.3 2282 1373 697.6 2246 1386 687.2
CRM Rimbey 207T912 T930 T940
Density grams grams gramsBitumen not req'd 69.89 75.63 78.86Diluent 682.8 20.87 16.92 14.76
DuplicateDensity Vis T7 Vis T12 Visc T20 Vis T7 Vis T12 Vis T20
Actual T 15 deg C 6.98 11.98 19.97
T912 915.2 465.3 321.9 183.8 471.8 320.8 183.5T930 933 1453 908.2 461.4 1449 900 467.1T940 942.7 3034 1790 861.2 3052 1783 871.5
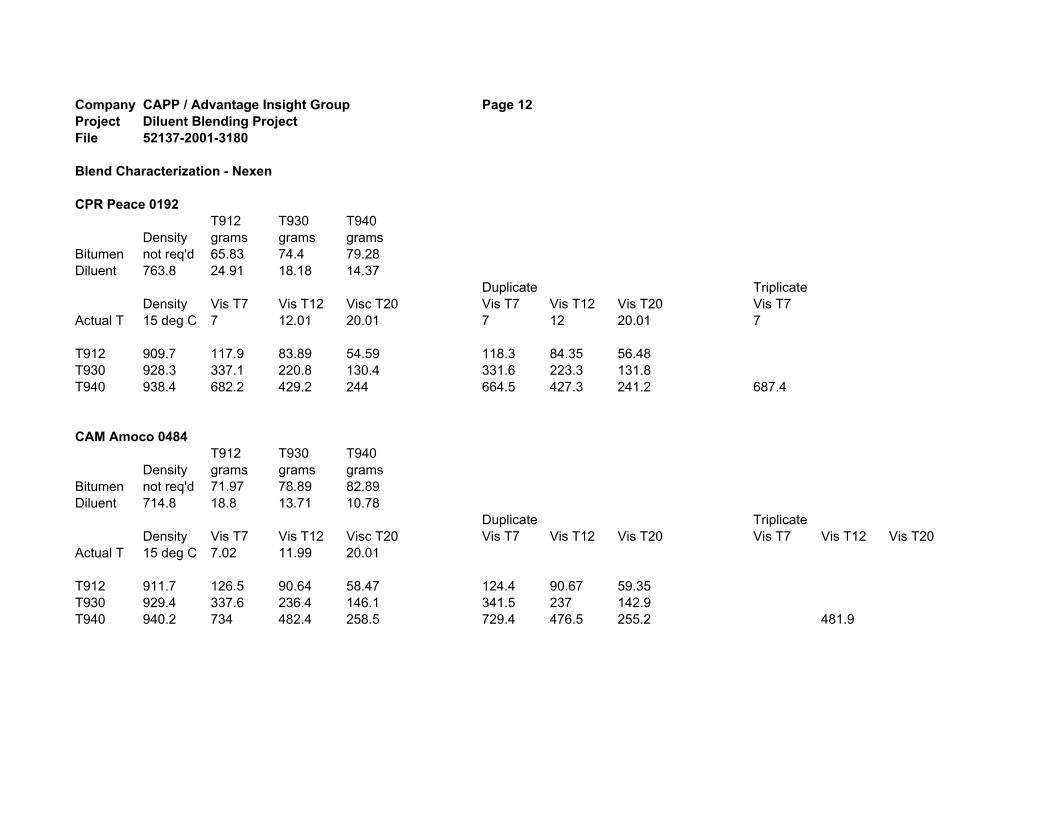
Company CAPP / Advantage Insight Group Page 12Project Diluent Blending ProjectFile 52137-2001-3180
Blend Characterization - Nexen
CPR Peace 0192T912 T930 T940
Density grams grams gramsBitumen not req'd 65.83 74.4 79.28Diluent 763.8 24.91 18.18 14.37
Duplicate TriplicateDensity Vis T7 Vis T12 Visc T20 Vis T7 Vis T12 Vis T20 Vis T7
Actual T 15 deg C 7 12.01 20.01 7 12 20.01 7
T912 909.7 117.9 83.89 54.59 118.3 84.35 56.48T930 928.3 337.1 220.8 130.4 331.6 223.3 131.8T940 938.4 682.2 429.2 244 664.5 427.3 241.2 687.4
CAM Amoco 0484T912 T930 T940
Density grams grams gramsBitumen not req'd 71.97 78.89 82.89Diluent 714.8 18.8 13.71 10.78
Duplicate TriplicateDensity Vis T7 Vis T12 Visc T20 Vis T7 Vis T12 Vis T20 Vis T7 Vis T12 Vis T20
Actual T 15 deg C 7.02 11.99 20.01
T912 911.7 126.5 90.64 58.47 124.4 90.67 59.35T930 929.4 337.6 236.4 146.1 341.5 237 142.9T940 940.2 734 482.4 258.5 729.4 476.5 255.2 481.9
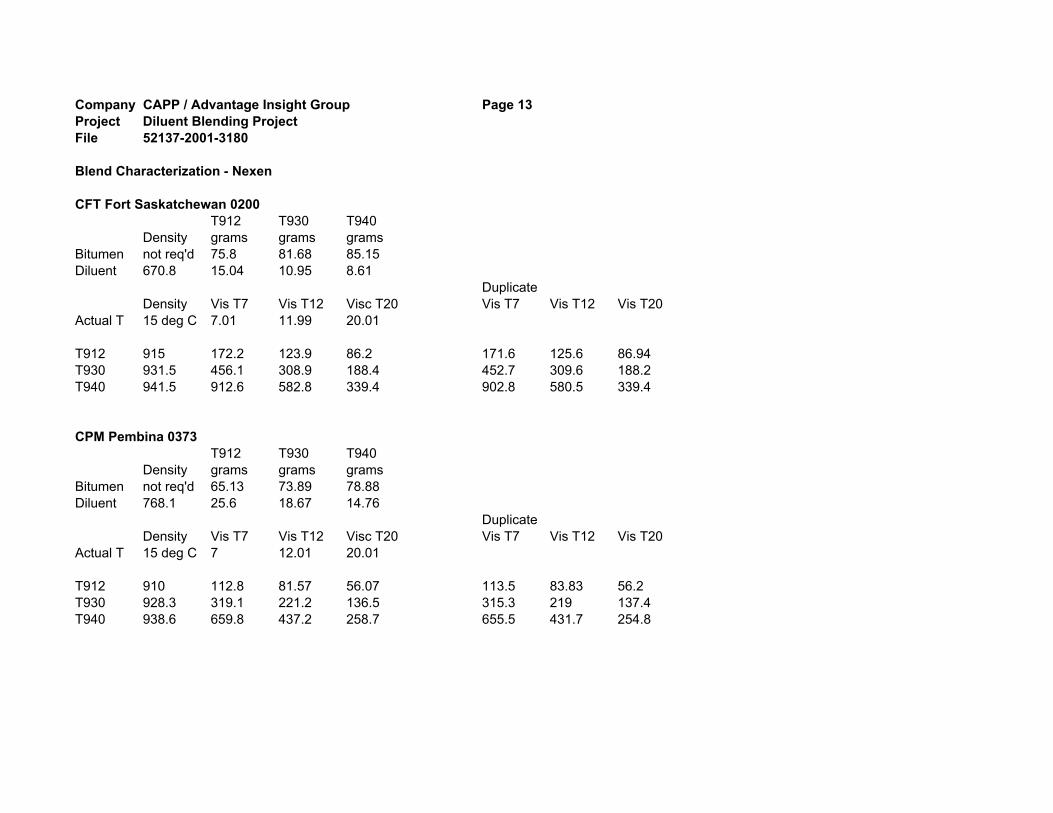
Company CAPP / Advantage Insight Group Page 13Project Diluent Blending ProjectFile 52137-2001-3180
Blend Characterization - Nexen
CFT Fort Saskatchewan 0200T912 T930 T940
Density grams grams gramsBitumen not req'd 75.8 81.68 85.15Diluent 670.8 15.04 10.95 8.61
DuplicateDensity Vis T7 Vis T12 Visc T20 Vis T7 Vis T12 Vis T20
Actual T 15 deg C 7.01 11.99 20.01
T912 915 172.2 123.9 86.2 171.6 125.6 86.94T930 931.5 456.1 308.9 188.4 452.7 309.6 188.2T940 941.5 912.6 582.8 339.4 902.8 580.5 339.4
CPM Pembina 0373T912 T930 T940
Density grams grams gramsBitumen not req'd 65.13 73.89 78.88Diluent 768.1 25.6 18.67 14.76
DuplicateDensity Vis T7 Vis T12 Visc T20 Vis T7 Vis T12 Vis T20
Actual T 15 deg C 7 12.01 20.01
T912 910 112.8 81.57 56.07 113.5 83.83 56.2T930 928.3 319.1 221.2 136.5 315.3 219 137.4T940 938.6 659.8 437.2 258.7 655.5 431.7 254.8
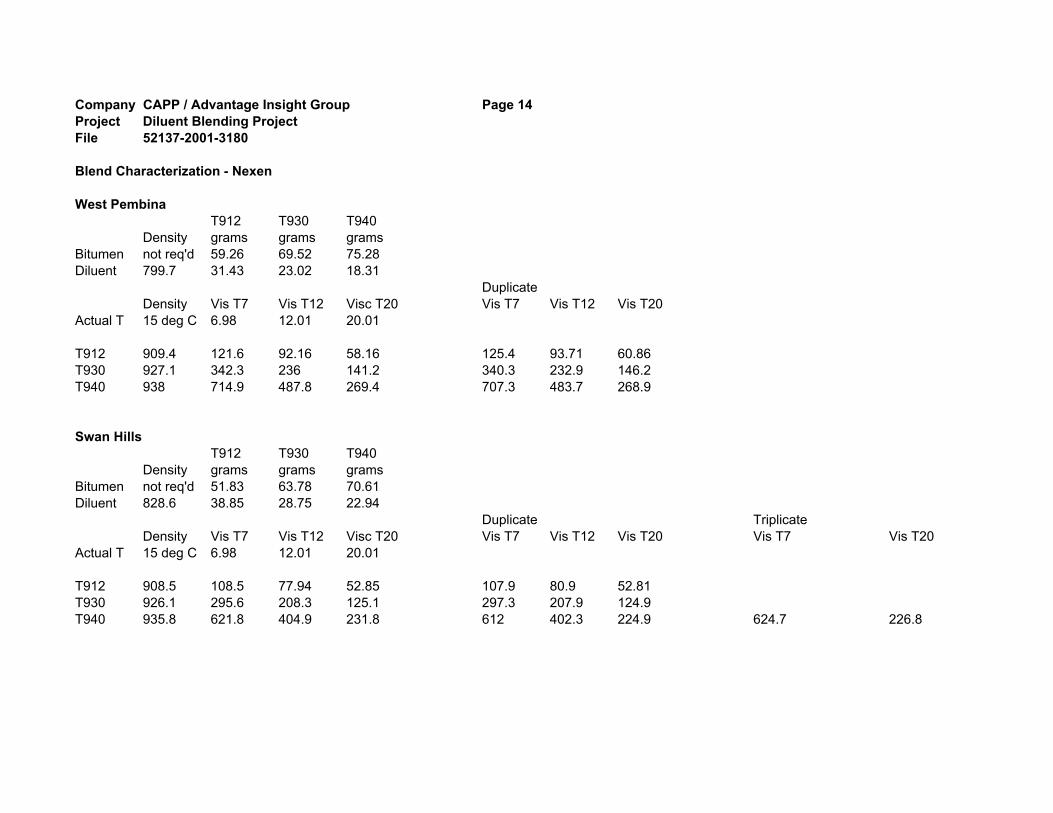
Company CAPP / Advantage Insight Group Page 14Project Diluent Blending ProjectFile 52137-2001-3180
Blend Characterization - Nexen
West PembinaT912 T930 T940
Density grams grams gramsBitumen not req'd 59.26 69.52 75.28Diluent 799.7 31.43 23.02 18.31
DuplicateDensity Vis T7 Vis T12 Visc T20 Vis T7 Vis T12 Vis T20
Actual T 15 deg C 6.98 12.01 20.01
T912 909.4 121.6 92.16 58.16 125.4 93.71 60.86T930 927.1 342.3 236 141.2 340.3 232.9 146.2T940 938 714.9 487.8 269.4 707.3 483.7 268.9
Swan HillsT912 T930 T940
Density grams grams gramsBitumen not req'd 51.83 63.78 70.61Diluent 828.6 38.85 28.75 22.94
Duplicate TriplicateDensity Vis T7 Vis T12 Visc T20 Vis T7 Vis T12 Vis T20 Vis T7 Vis T20
Actual T 15 deg C 6.98 12.01 20.01
T912 908.5 108.5 77.94 52.85 107.9 80.9 52.81T930 926.1 295.6 208.3 125.1 297.3 207.9 124.9T940 935.8 621.8 404.9 231.8 612 402.3 224.9 624.7 226.8

Company CAPP / Advantage Insight Group Page 15Project Diluent Blending ProjectFile 52137-2001-3180
Blend Characterization - Nexen
ValhallaT912 T930 T940
Density grams grams gramsBitumen not req'd 56.54 67.4 73.53Diluent 811.6 34.16 25.16 20.06
DuplicateDensity Vis T7 Vis T12 Visc T20 Vis T7 Vis T12 Vis T20
Actual T 15 deg C 6.99 12 20
T912 909.2 161.4 102.4 65.07 161.3 98.78 64.94T930 927.5 394.9 259.1 152.7 395.9 259.9 153.6T940 937.6 784.9 490.8 277.2 784.1 491.9 276.3
CRW 700 June 3rd sampleT912 T930 T940
Density grams grams gramsBitumen not req'd 70.22 77.72 81.95Diluent 730.7 20.56 14.93 11.76
Duplicate TriplicateDensity Vis T7 Vis T12 Visc T20 Vis T7 Vis T12 Vis T20 Vis T7 Vis T12 Vis T20
Actual T 15 deg C 7 12 20
T912 911.5 128.3 97.33 63.93 132.9 97.04 64.51T930 929.8 378.7 254.7 154.7 376.7 259 151.7T940 940.1 801.1 500.2 282.9 799.7 503.5 285 774

Company CAPP / Advantage Insight Group Page 16Project Diluent Blending ProjectFile 52137-2001-3180
Blend Characterization - Nexen
CRW 700 June 1st sampleT912 T930 T940
Density grams grams gramsBitumen not req'd 71.39 78.51 82.53Diluent 720.6 19.4 14.13 11.18
DuplicateDensity Vis T7 Vis T12 Visc T20 Vis T7 Vis T12 Vis T20
Actual T 15 deg C 7.01 11.97 20.01
T912 912 137.3 99.19 64.96 137.8 102.7 66.96T930 930.2 386 269.6 157.6 381.4 267.4 161.1T940 940.2 781.8 518.4 290.2 784.3 523.6 294.3
CRM 207T912 T930 T940
Density grams grams gramsBitumen not req'd 74.9 81.15 84.57Diluent 682.8 15.91 11.54 9.15
Duplicate TriplicateDensity Vis T7 Vis T12 Visc T20 Vis T7 Vis T12 Vis T20 Vis T7 Vis T12 Vis T20
Actual T 15 deg C 6.98 11.98 19.97
T912 913.6 164.1 117.6 72.86 163.1 117.9 76.31T930 931.4 436.6 304.5 175.8 439.6 301.1 176.1T940 941.1 877.4 576.9 323.2 902 572.3 317.2 855.3

Company CAPP / Advantage Insight Group Page 17Project Diluent Blending ProjectFile 52137-2001-3180
Blend Characterization - Nexen
Synthetic diluent 1T912 T930 T940
Density grams grams gramsBitumen not req'd 70.62 77.93 82.15Diluent 729.7 20.23 14.78 11.6
DuplicateDensity Vis T7 Vis T12 Visc T20 Vis T7 Vis T12 Vis T20
Actual T 15 deg C 7.02 12.02 20
T912 912.2 140.6 101.4 65.73 142.2 102.2 67.64T930 929.9 383.1 261.1 156.2 377.8 264.8 156.9T940 940.3 796.3 523 289.3 789.6 514.4 284.5
Synthetic diluent 2T912 T930 T940
Density grams grams gramsBitumen not req'd 67.45 75.56 80.27Diluent 756.1 23.38 17.09 13.47
DuplicateDensity Vis T7 Vis T12 Visc T20 Vis T7 Vis T12 Vis T20
Actual T 15 deg C 7.02 12.02 20
T912 912.3 138.1 101.5 63.78 138.3 102.3 65.49T930 929.8 376.1 260.6 155.6 381.4 260.9 154.6T940 940 782.5 520.3 286.7 771 515.2 281.1
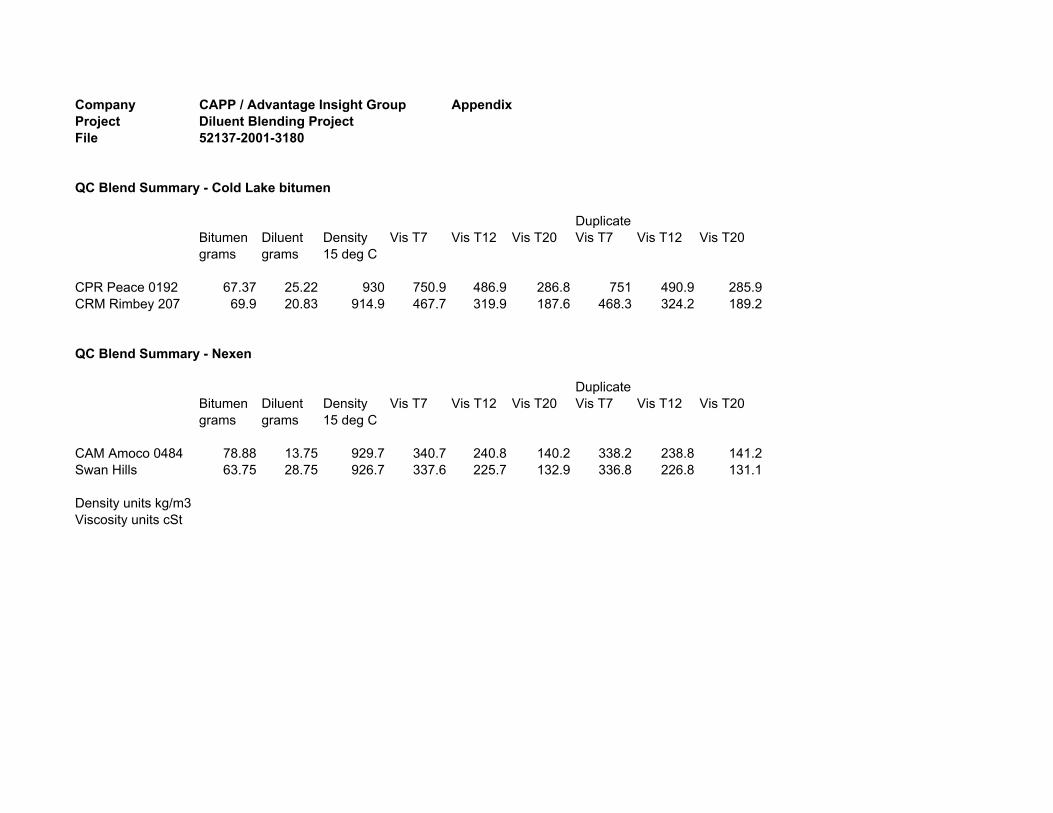
Company CAPP / Advantage Insight Group AppendixProject Diluent Blending ProjectFile 52137-2001-3180
QC Blend Summary - Cold Lake bitumen
DuplicateBitumen Diluent Density Vis T7 Vis T12 Vis T20 Vis T7 Vis T12 Vis T20grams grams 15 deg C
CPR Peace 0192 67.37 25.22 930 750.9 486.9 286.8 751 490.9 285.9CRM Rimbey 207 69.9 20.83 914.9 467.7 319.9 187.6 468.3 324.2 189.2
QC Blend Summary - Nexen
DuplicateBitumen Diluent Density Vis T7 Vis T12 Vis T20 Vis T7 Vis T12 Vis T20grams grams 15 deg C
CAM Amoco 0484 78.88 13.75 929.7 340.7 240.8 140.2 338.2 238.8 141.2Swan Hills 63.75 28.75 926.7 337.6 225.7 132.9 336.8 226.8 131.1
Density units kg/m3Viscosity units cSt
Company CAPP / Advantage Insight Group AppendixProject Diluent Blending ProjectFile 52137-2001-3180
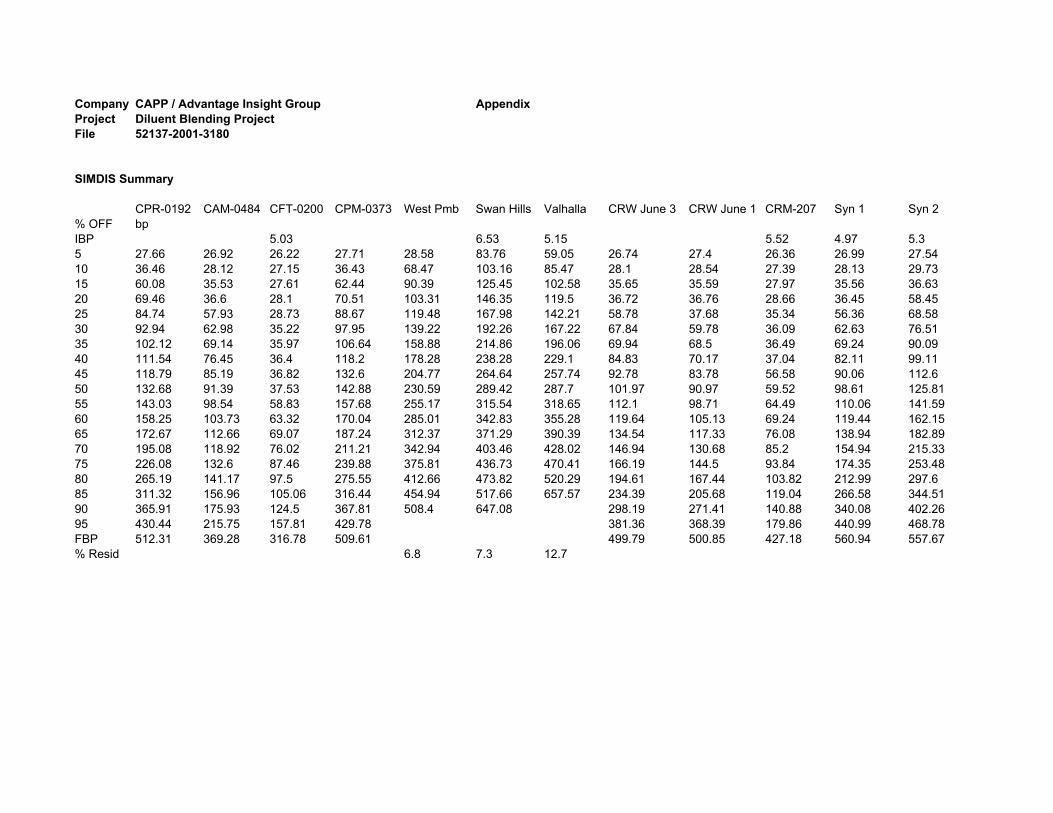
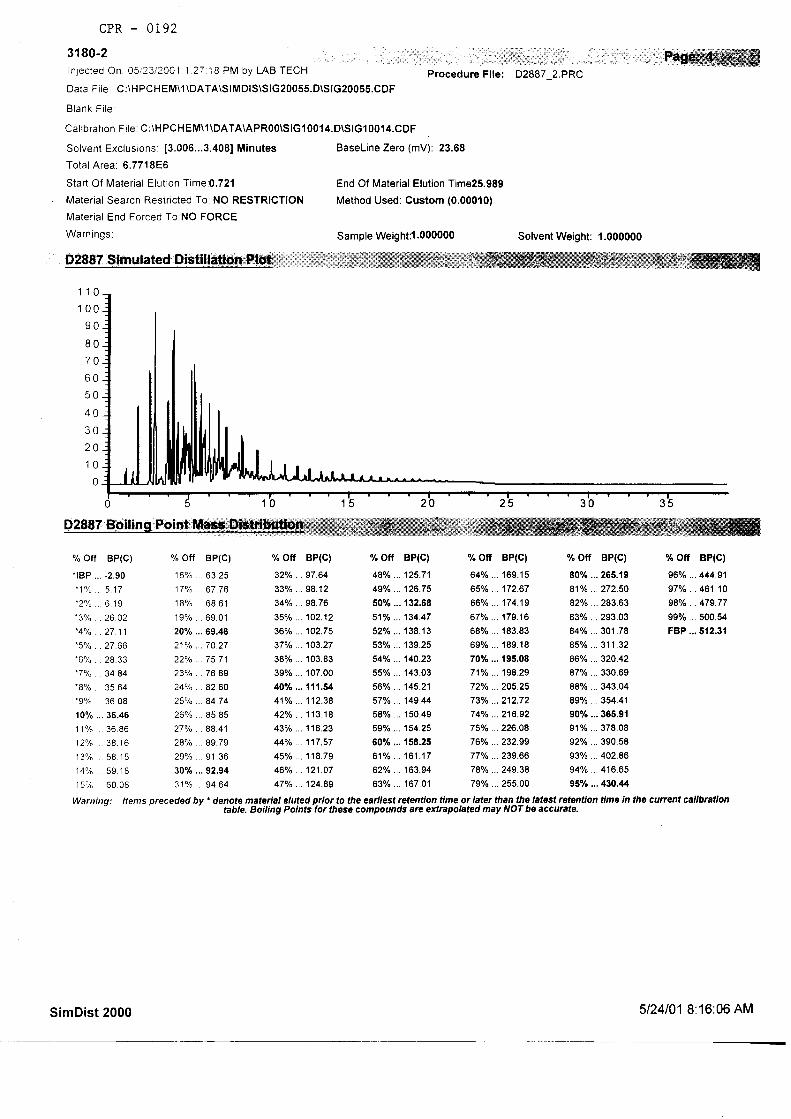
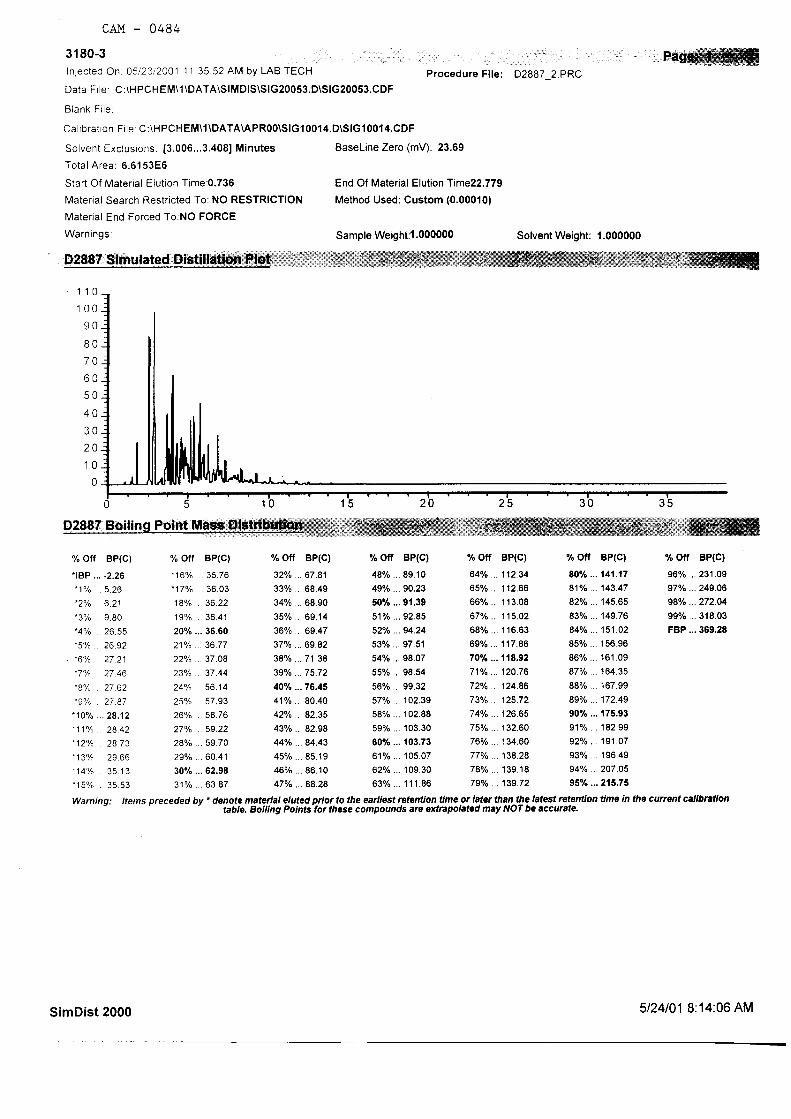
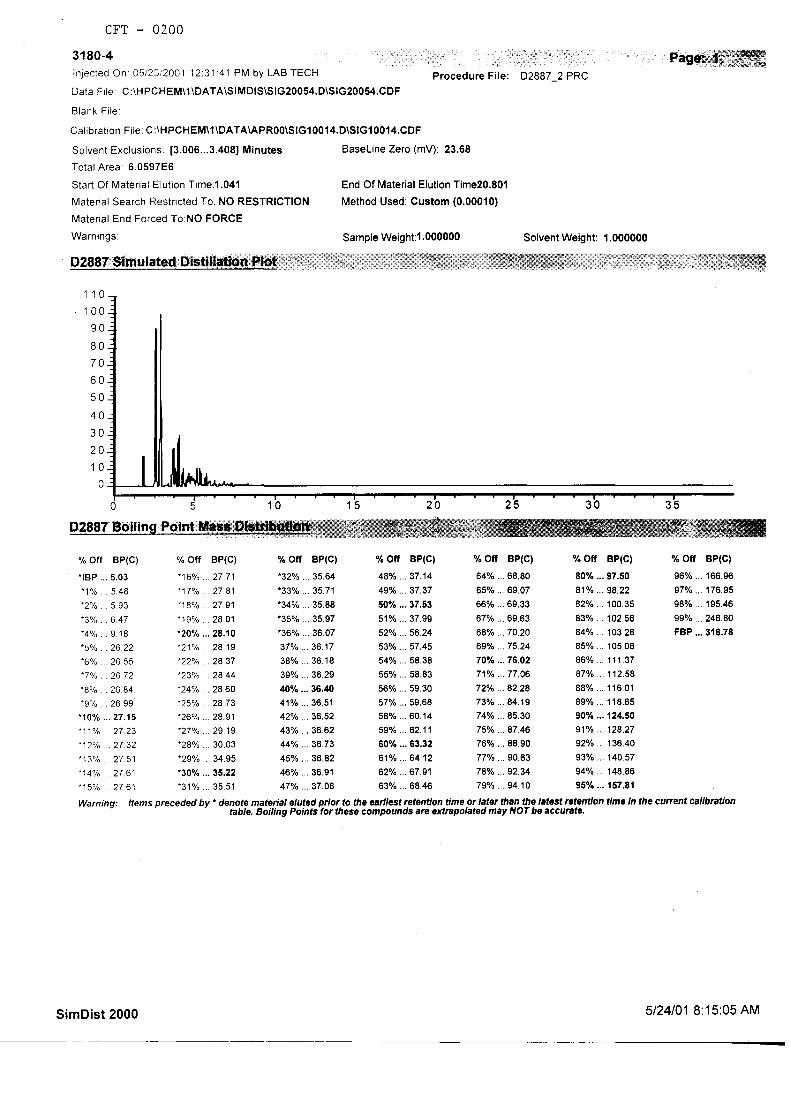
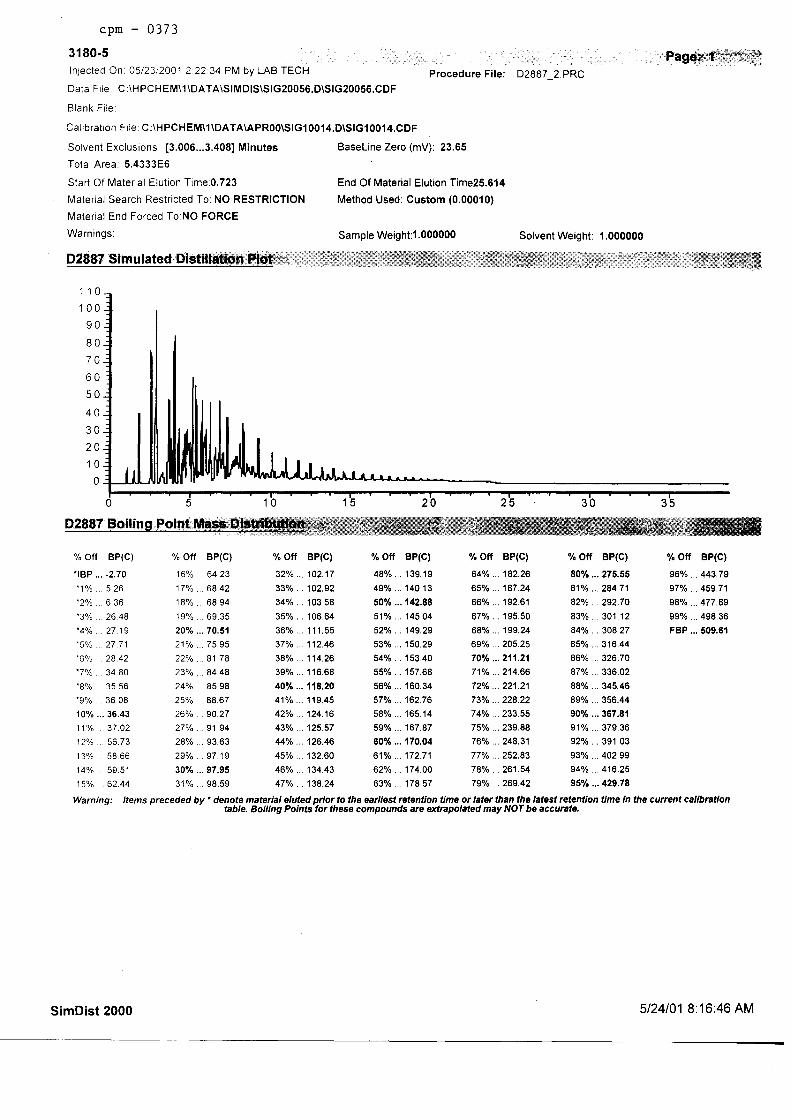
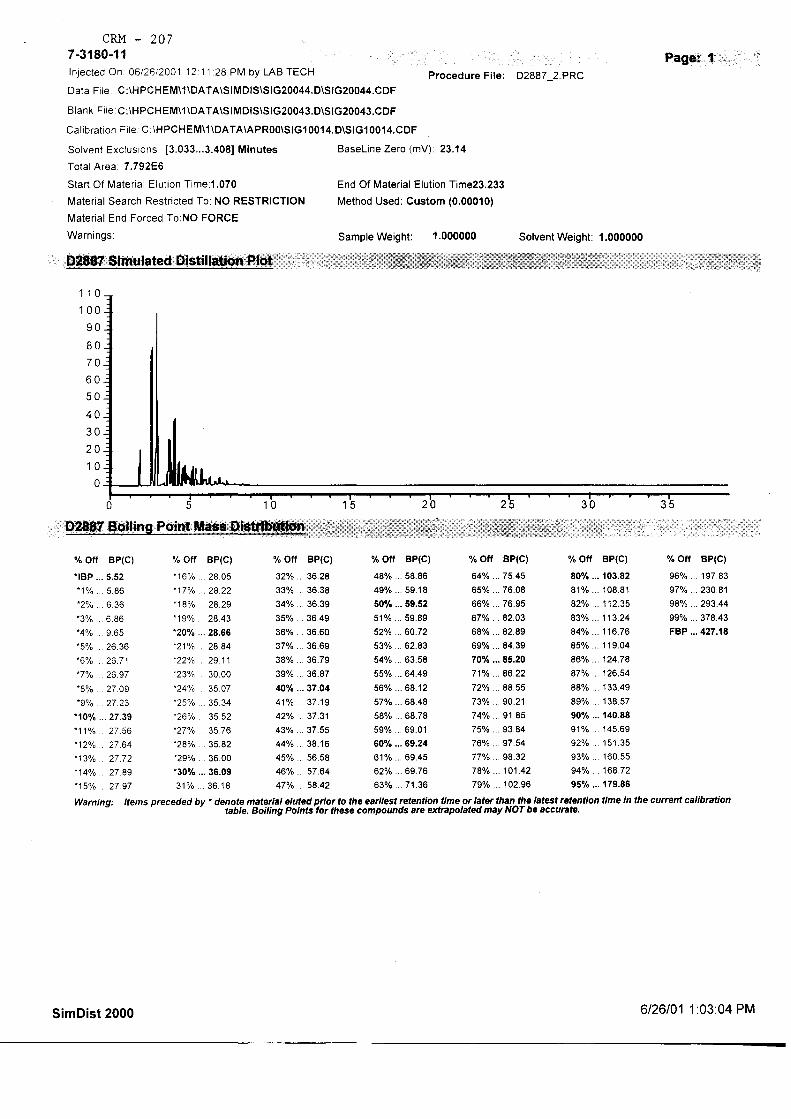
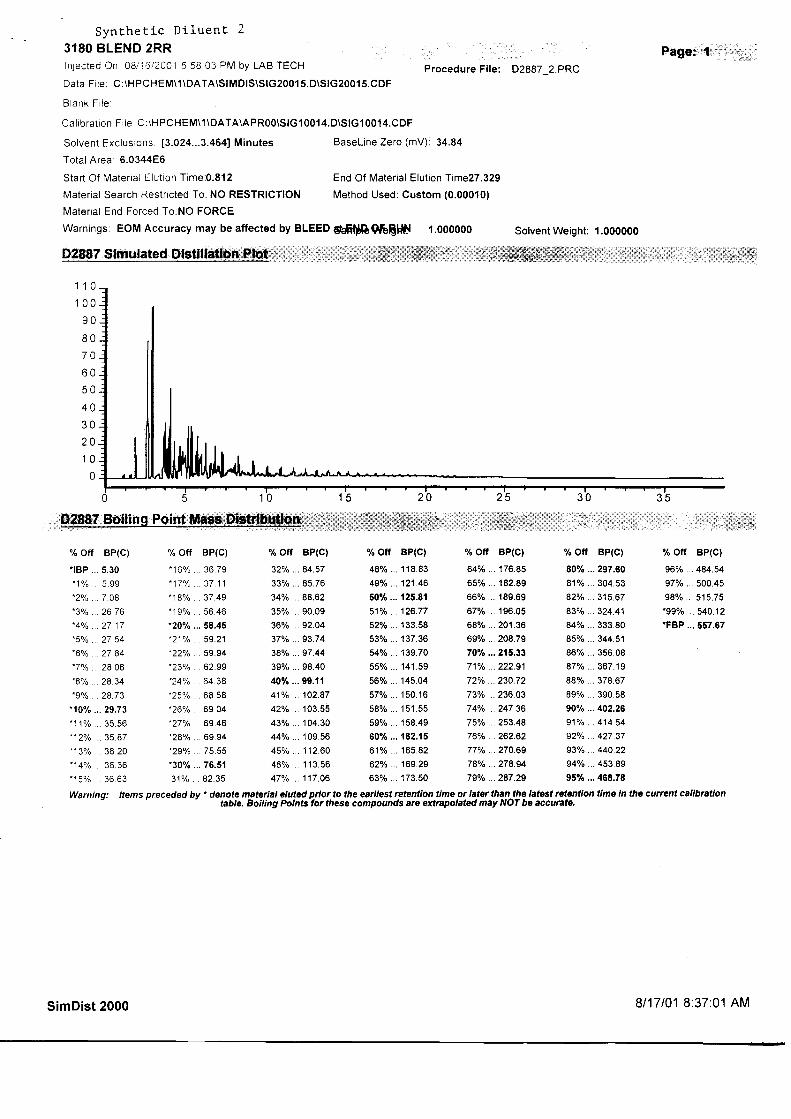
SIMDIS Summary
CPR-0192 CAM-0484 CFT-0200 CPM-0373 West Pmb Swan Hills Valhalla CRW June 3 CRW June 1 CRM-207 Syn 1 Syn 2% OFF bpIBP 5.03 6.53 5.15 5.52 4.97 5.35 27.66 26.92 26.22 27.71 28.58 83.76 59.05 26.74 27.4 26.36 26.99 27.5410 36.46 28.12 27.15 36.43 68.47 103.16 85.47 28.1 28.54 27.39 28.13 29.7315 60.08 35.53 27.61 62.44 90.39 125.45 102.58 35.65 35.59 27.97 35.56 36.6320 69.46 36.6 28.1 70.51 103.31 146.35 119.5 36.72 36.76 28.66 36.45 58.4525 84.74 57.93 28.73 88.67 119.48 167.98 142.21 58.78 37.68 35.34 56.36 68.5830 92.94 62.98 35.22 97.95 139.22 192.26 167.22 67.84 59.78 36.09 62.63 76.5135 102.12 69.14 35.97 106.64 158.88 214.86 196.06 69.94 68.5 36.49 69.24 90.0940 111.54 76.45 36.4 118.2 178.28 238.28 229.1 84.83 70.17 37.04 82.11 99.1145 118.79 85.19 36.82 132.6 204.77 264.64 257.74 92.78 83.78 56.58 90.06 112.650 132.68 91.39 37.53 142.88 230.59 289.42 287.7 101.97 90.97 59.52 98.61 125.8155 143.03 98.54 58.83 157.68 255.17 315.54 318.65 112.1 98.71 64.49 110.06 141.5960 158.25 103.73 63.32 170.04 285.01 342.83 355.28 119.64 105.13 69.24 119.44 162.1565 172.67 112.66 69.07 187.24 312.37 371.29 390.39 134.54 117.33 76.08 138.94 182.8970 195.08 118.92 76.02 211.21 342.94 403.46 428.02 146.94 130.68 85.2 154.94 215.3375 226.08 132.6 87.46 239.88 375.81 436.73 470.41 166.19 144.5 93.84 174.35 253.4880 265.19 141.17 97.5 275.55 412.66 473.82 520.29 194.61 167.44 103.82 212.99 297.685 311.32 156.96 105.06 316.44 454.94 517.66 657.57 234.39 205.68 119.04 266.58 344.5190 365.91 175.93 124.5 367.81 508.4 647.08 298.19 271.41 140.88 340.08 402.2695 430.44 215.75 157.81 429.78 381.36 368.39 179.86 440.99 468.78FBP 512.31 369.28 316.78 509.61 499.79 500.85 427.18 560.94 557.67% Resid 6.8 7.3 12.7


II-1 Advantage Insight Group Inc.
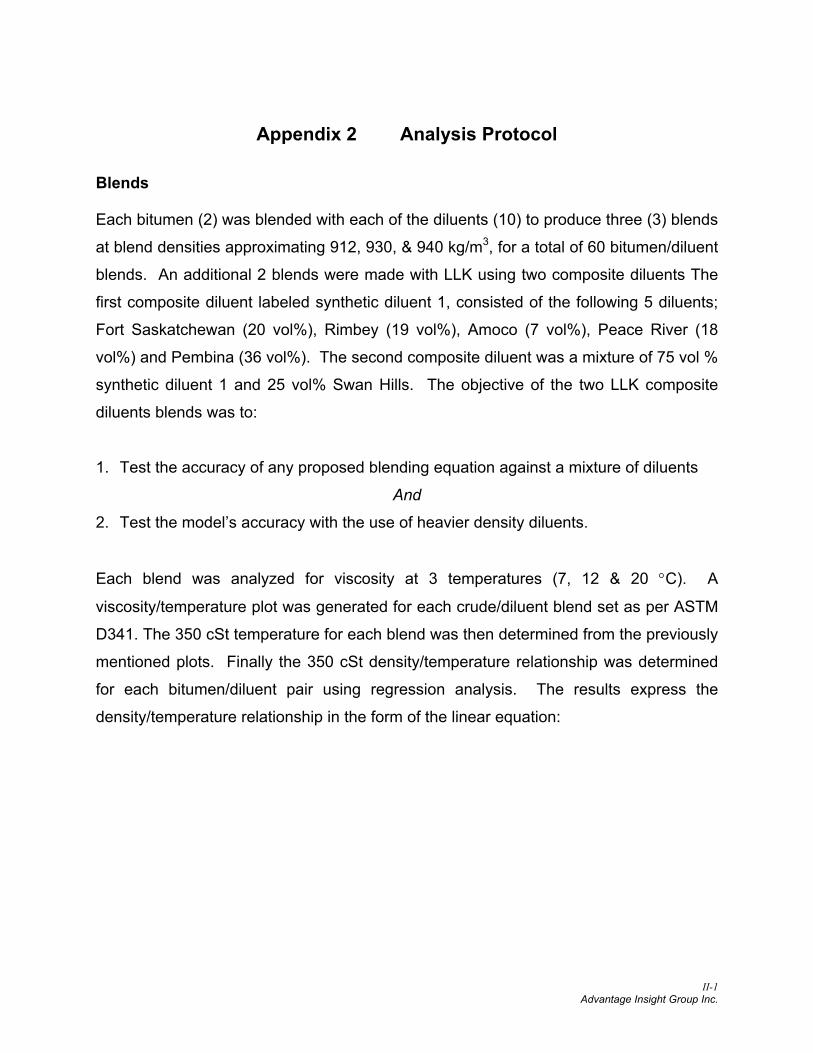
Appendix 2 Analysis Protocol
Blends
Each bitumen (2) was blended with each of the diluents (10) to produce three (3) blends
at blend densities approximating 912, 930, & 940 kg/m3, for a total of 60 bitumen/diluent
blends. An additional 2 blends were made with LLK using two composite diluents The
first composite diluent labeled synthetic diluent 1, consisted of the following 5 diluents;
Fort Saskatchewan (20 vol%), Rimbey (19 vol%), Amoco (7 vol%), Peace River (18
vol%) and Pembina (36 vol%). The second composite diluent was a mixture of 75 vol %
synthetic diluent 1 and 25 vol% Swan Hills. The objective of the two LLK composite
diluents blends was to:
1. Test the accuracy of any proposed blending equation against a mixture of diluents
And
2. Test the model’s accuracy with the use of heavier density diluents.
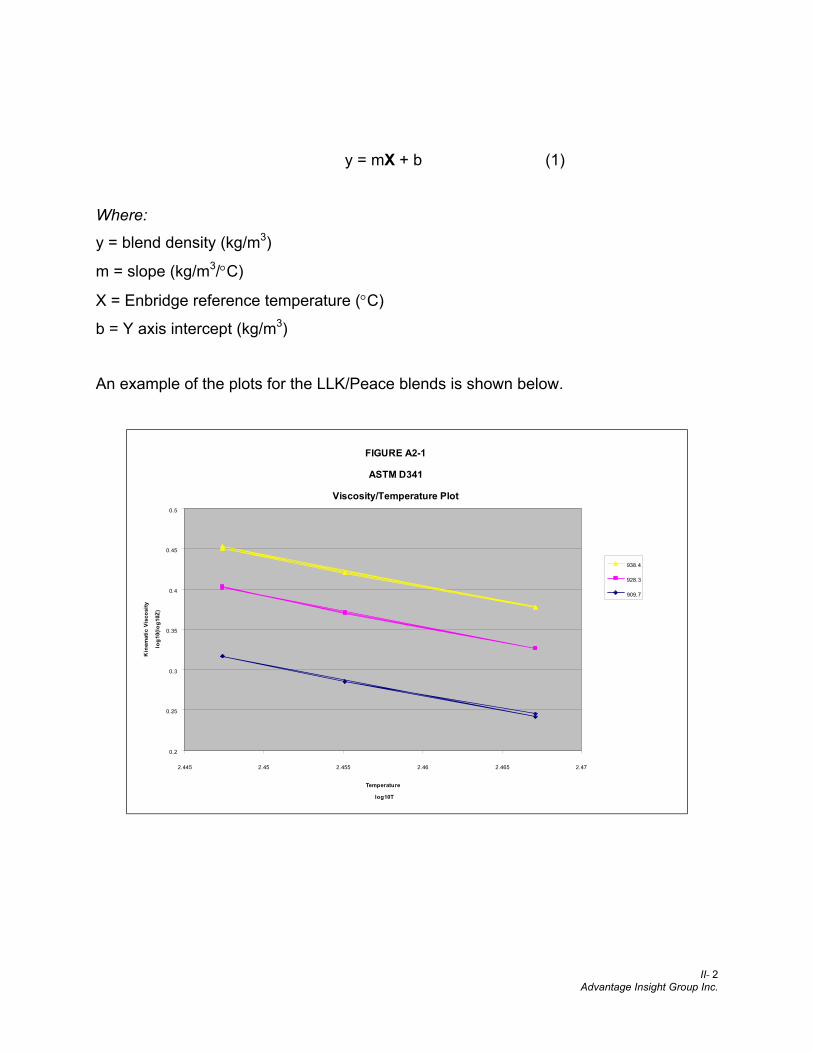
Each blend was analyzed for viscosity at 3 temperatures (7, 12 & 20 °C). A
viscosity/temperature plot was generated for each crude/diluent blend set as per ASTM
D341. The 350 cSt temperature for each blend was then determined from the previously
mentioned plots. Finally the 350 cSt density/temperature relationship was determined
for each bitumen/diluent pair using regression analysis. The results express the
density/temperature relationship in the form of the linear equation:
II- 2 Advantage Insight Group Inc.
y = mX + b (1)
Where:
y = blend density (kg/m3)
m = slope (kg/m3/°C)
X = Enbridge reference temperature (°C)
b = Y axis intercept (kg/m3)
An example of the plots for the LLK/Peace blends is shown below.
FIGURE A2-1
ASTM D341
Viscosity/Temperature Plot
0.2
0.25
0.3
0.35
0.4
0.45
0.5
2.445 2.45 2.455 2.46 2.465 2.47
Temperature
log10T
Kin
emat
ic V
isco
sity
log1
0(lo
g10Z
)
938.4
928.3
909.7
II- 3 Advantage Insight Group Inc.
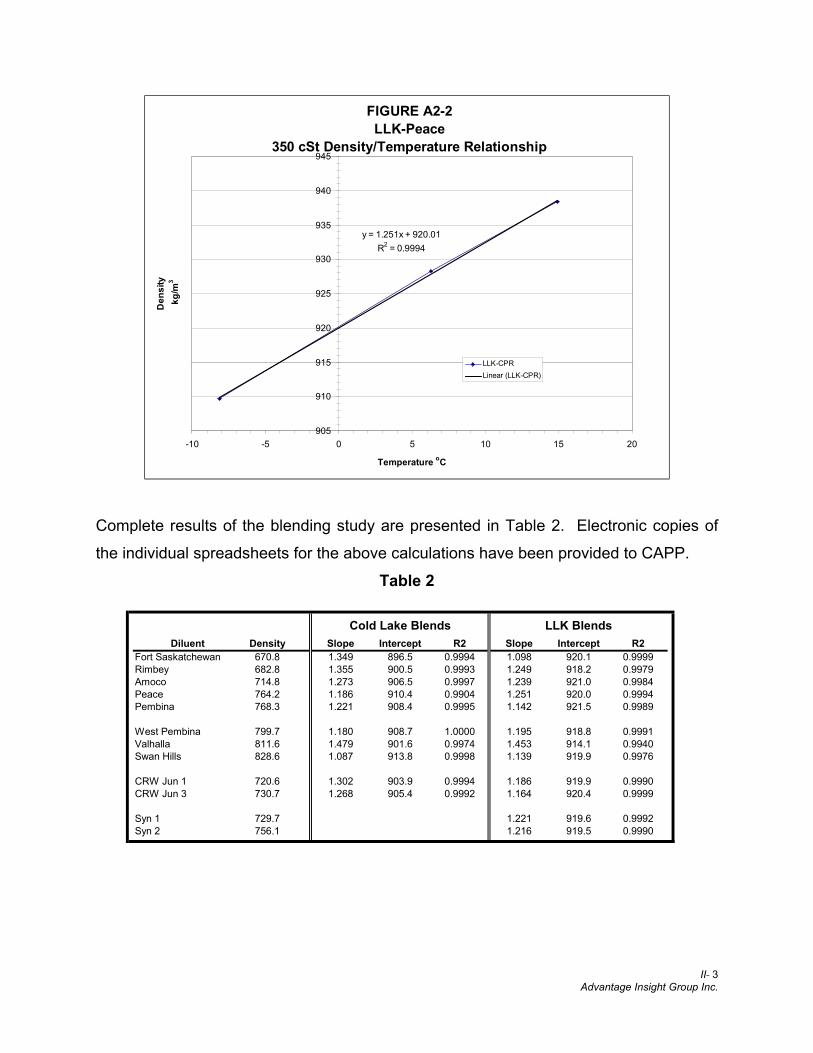
FIGURE A2-2LLK-Peace
350 cSt Density/Temperature Relationship
y = 1.251x + 920.01R2 = 0.9994
905
910
915
920
925
930
935
940
945
-10 -5 0 5 10 15 20
Temperature oC
Den
sity
kg/
m3
LLK-CPRLinear (LLK-CPR)
Complete results of the blending study are presented in Table 2. Electronic copies of
the individual spreadsheets for the above calculations have been provided to CAPP.
Table 2
Diluent Density Slope Intercept R2 Slope Intercept R2
Fort Saskatchewan 670.8 1.349 896.5 0.9994 1.098 920.1 0.9999Rimbey 682.8 1.355 900.5 0.9993 1.249 918.2 0.9979Amoco 714.8 1.273 906.5 0.9997 1.239 921.0 0.9984Peace 764.2 1.186 910.4 0.9904 1.251 920.0 0.9994Pembina 768.3 1.221 908.4 0.9995 1.142 921.5 0.9989
West Pembina 799.7 1.180 908.7 1.0000 1.195 918.8 0.9991Valhalla 811.6 1.479 901.6 0.9974 1.453 914.1 0.9940Swan Hills 828.6 1.087 913.8 0.9998 1.139 919.9 0.9976
CRW Jun 1 720.6 1.302 903.9 0.9994 1.186 919.9 0.9990CRW Jun 3 730.7 1.268 905.4 0.9992 1.164 920.4 0.9999
Syn 1 729.7 1.221 919.6 0.9992Syn 2 756.1 1.216 919.5 0.9990
Cold Lake Blends LLK Blends
III-1 Advantage Insight Group Inc.
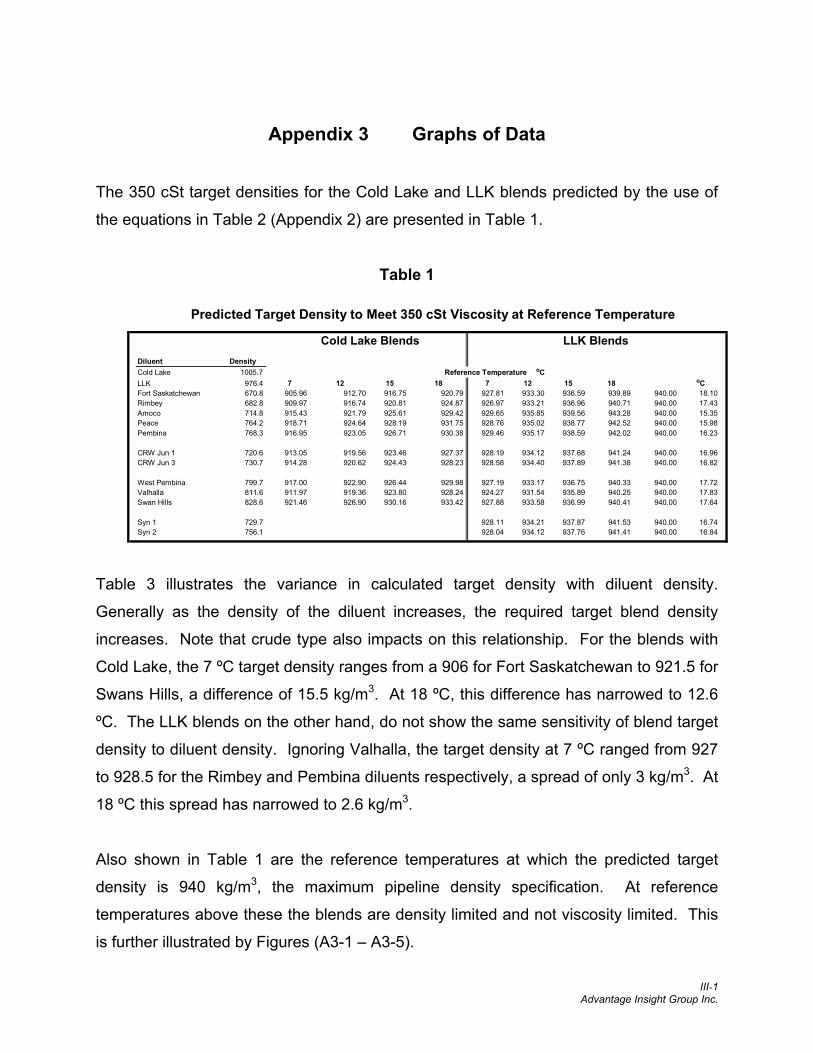
Appendix 3 Graphs of Data
The 350 cSt target densities for the Cold Lake and LLK blends predicted by the use of
the equations in Table 2 (Appendix 2) are presented in Table 1.
Table 1
Table 3 illustrates the variance in calculated target density with diluent density.
Generally as the density of the diluent increases, the required target blend density
increases. Note that crude type also impacts on this relationship. For the blends with
Cold Lake, the 7 ºC target density ranges from a 906 for Fort Saskatchewan to 921.5 for
Swans Hills, a difference of 15.5 kg/m3. At 18 ºC, this difference has narrowed to 12.6
ºC. The LLK blends on the other hand, do not show the same sensitivity of blend target
density to diluent density. Ignoring Valhalla, the target density at 7 ºC ranged from 927
to 928.5 for the Rimbey and Pembina diluents respectively, a spread of only 3 kg/m3. At
18 ºC this spread has narrowed to 2.6 kg/m3.
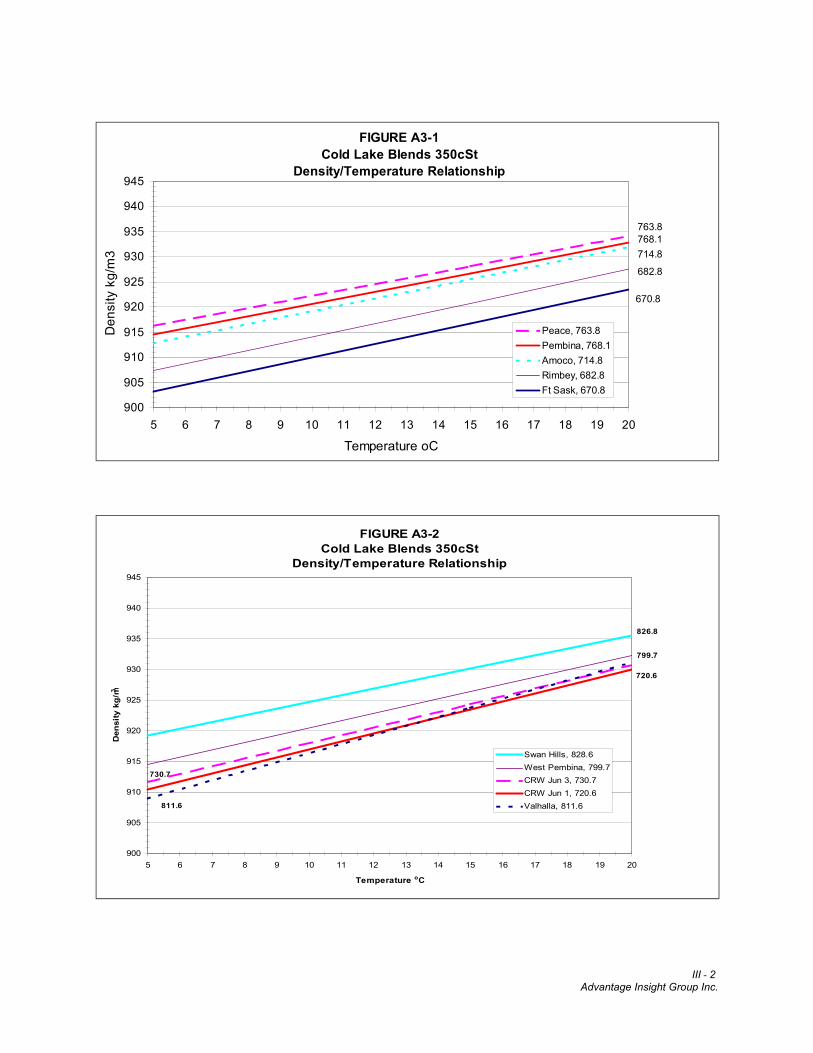
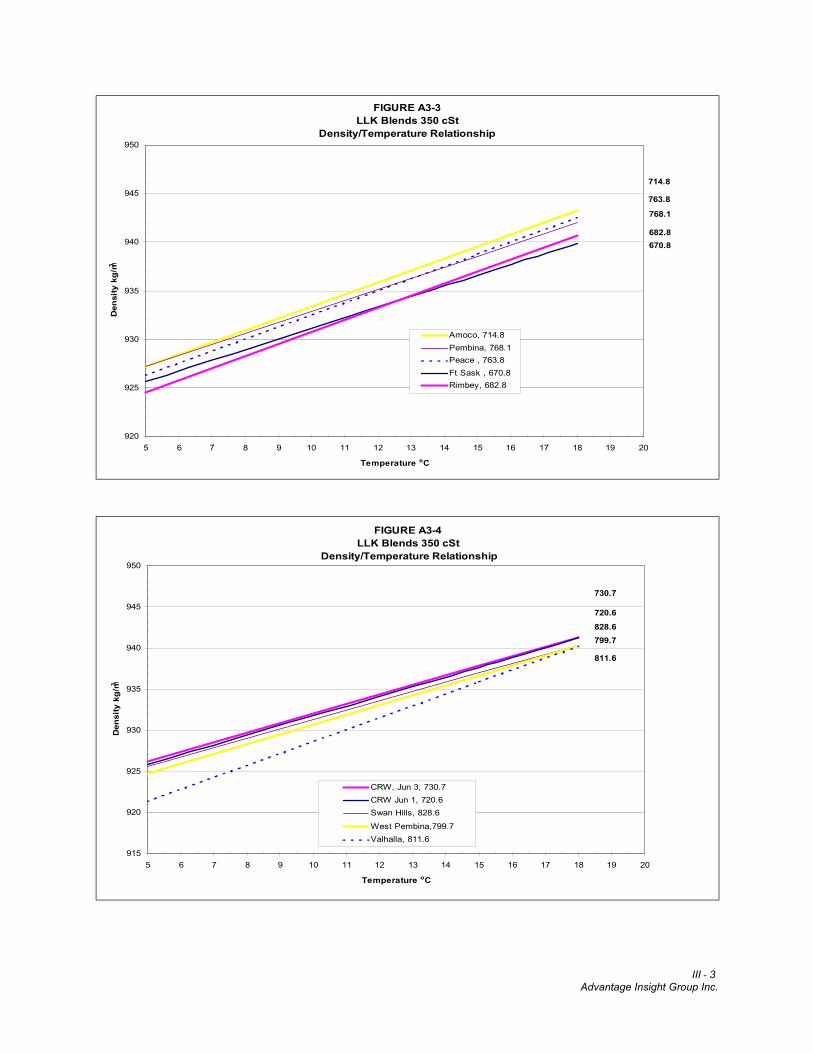
Also shown in Table 1 are the reference temperatures at which the predicted target
density is 940 kg/m3, the maximum pipeline density specification. At reference
temperatures above these the blends are density limited and not viscosity limited. This
is further illustrated by Figures (A3-1 – A3-5).
Diluent Density Cold Lake 1005.7 LLK 976.4 7 12 15 18 7 12 15 18 o C Fort Saskatchewan 670.8 905.96 912.70 916.75 920.79 927.81 933.30 936.59 939.89 940.00 18.10 Rimbey 682.8 909.97 916.74 920.81 924.87 926.97 933.21 936.96 940.71 940.00 17.43 Amoco 714.8 915.43 921.79 925.61 929.42 929.65 935.85 939.56 943.28 940.00 15.35 Peace 764.2 918.71 924.64 928.19 931.75 928.76 935.02 938.77 942.52 940.00 15.98 Pembina 768.3 916.95 923.05 926.71 930.38 929.46 935.17 938.59 942.02 940.00 16.23 CRW Jun 1 720.6 913.05 919.56 923.46 927.37 928.19 934.12 937.68 941.24 940.00 16.96 CRW Jun 3 730.7 914.28 920.62 924.43 928.23 928.58 934.40 937.89 941.38 940.00 16.82 West Pembina 799.7 917.00 922.90 926.44 929.98 927.19 933.17 936.75 940.33 940.00 17.72 Valhalla 811.6 911.97 919.36 923.80 928.24 924.27 931.54 935.89 940.25 940.00 17.83 Swan Hills 828.6 921.46 926.90 930.16 933.42 927.88 933.58 936.99 940.41 940.00 17.64 Syn 1 729.7 928.11 934.21 937.87 941.53 940.00 16.74 Syn 2 756.1 928.04 934.12 937.76 941.41 940.00 16.84
LLK Blends
Reference Temperature o C
Cold Lake Blends Predicted Target Density to Meet 350 cSt Viscosity at Reference Temperature
III - 2 Advantage Insight Group Inc.
FIGURE A3-1Cold Lake Blends 350cSt
Density/Temperature Relationship
900
905
910
915
920
925
930
935
940
945
5 6 7 8 9 10 11 12 13 14 15 16 17 18 19 20
Temperature oC
Den
sity
kg/
m3
Peace, 763.8Pembina, 768.1Amoco, 714.8Rimbey, 682.8Ft Sask, 670.8
670.8
768.1714.8
763.8
682.8
FIGURE A3-2Cold Lake Blends 350cSt
Density/Temperature Relationship
900
905
910
915
920
925
930
935
940
945
5 6 7 8 9 10 11 12 13 14 15 16 17 18 19 20
Temperature oC
Den
sity
kg/
m3
Swan Hills, 828.6West Pembina, 799.7CRW Jun 3, 730.7CRW Jun 1, 720.6Valhalla, 811.6
720.6
799.7
811.6
826.8
730.7
III - 3 Advantage Insight Group Inc.
FIGURE A3-3LLK Blends 350 cSt
Density/Temperature Relationship
920
925
930
935
940
945
950
5 6 7 8 9 10 11 12 13 14 15 16 17 18 19 20
Temperature oC
Den
sity
kg/
m3
Amoco, 714.8Pembina, 768.1Peace , 763.8Ft Sask , 670.8Rimbey, 682.8
670.8682.8
768.1
714.8
763.8
FIGURE A3-4LLK Blends 350 cSt
Density/Temperature Relationship
915
920
925
930
935
940
945
950
5 6 7 8 9 10 11 12 13 14 15 16 17 18 19 20
Temperature oC
Den
sity
kg/
m3
CRW, Jun 3, 730.7CRW Jun 1, 720.6Swan Hills, 828.6West Pembina,799.7Valhalla, 811.6
828.6
811.6
799.7
720.6
730.7
III - 4 Advantage Insight Group Inc.
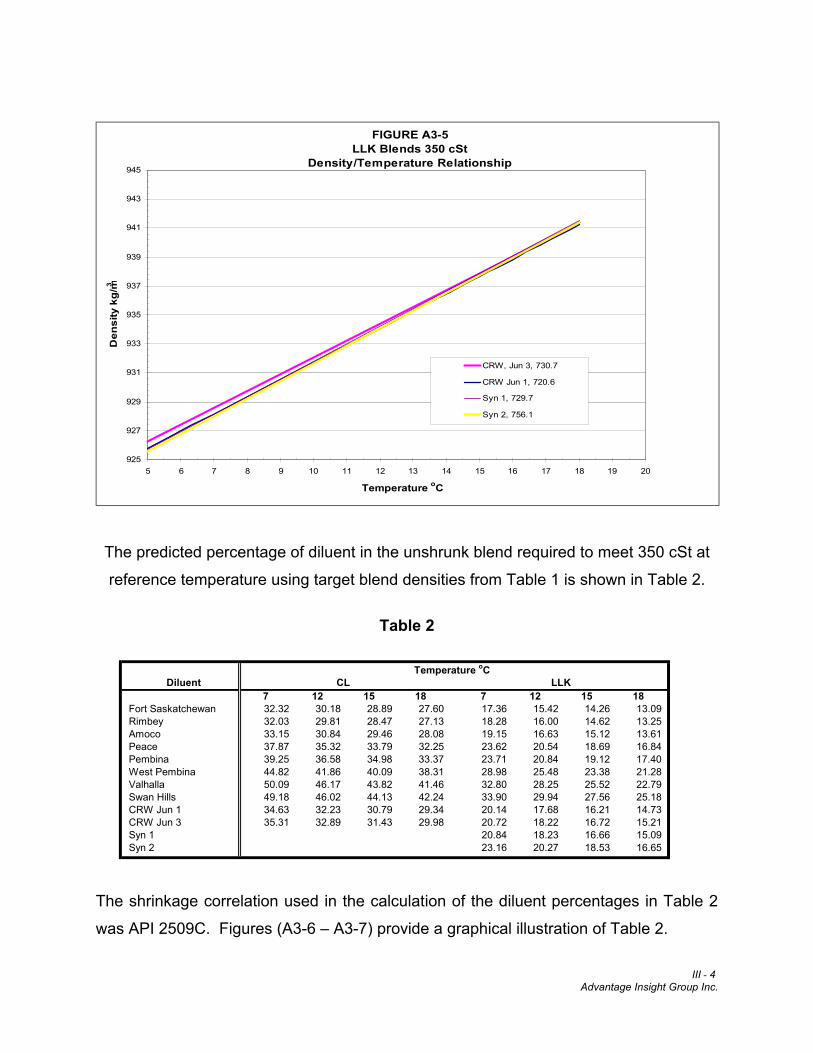
FIGURE A3-5LLK Blends 350 cSt
Density/Temperature Relationship
925
927
929
931
933
935
937
939
941
943
945
5 6 7 8 9 10 11 12 13 14 15 16 17 18 19 20
Temperature oC
Den
sity
kg/
m3
CRW, Jun 3, 730.7
CRW Jun 1, 720.6
Syn 1, 729.7
Syn 2, 756.1
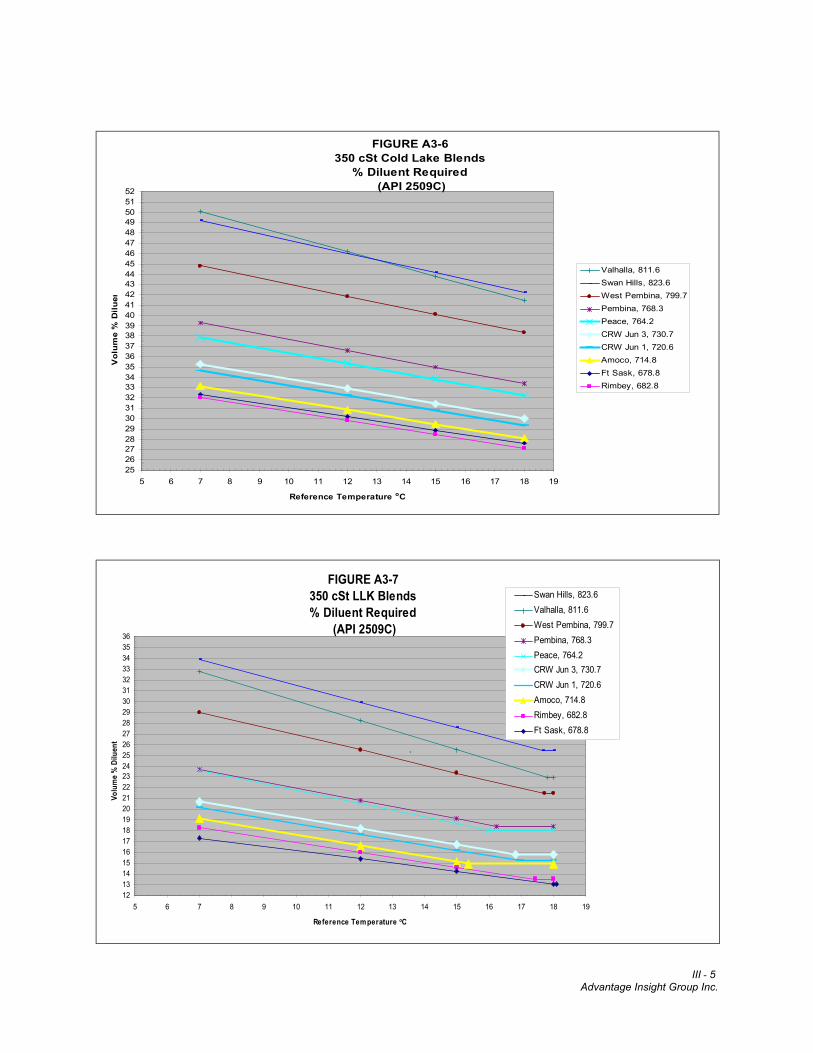
The predicted percentage of diluent in the unshrunk blend required to meet 350 cSt at
reference temperature using target blend densities from Table 1 is shown in Table 2.
Table 2
The shrinkage correlation used in the calculation of the diluent percentages in Table 2
was API 2509C. Figures (A3-6 – A3-7) provide a graphical illustration of Table 2.
Diluent7 12 15 18 7 12 15 18
Fort Saskatchewan 32.32 30.18 28.89 27.60 17.36 15.42 14.26 13.09Rimbey 32.03 29.81 28.47 27.13 18.28 16.00 14.62 13.25Amoco 33.15 30.84 29.46 28.08 19.15 16.63 15.12 13.61Peace 37.87 35.32 33.79 32.25 23.62 20.54 18.69 16.84Pembina 39.25 36.58 34.98 33.37 23.71 20.84 19.12 17.40West Pembina 44.82 41.86 40.09 38.31 28.98 25.48 23.38 21.28Valhalla 50.09 46.17 43.82 41.46 32.80 28.25 25.52 22.79Swan Hills 49.18 46.02 44.13 42.24 33.90 29.94 27.56 25.18CRW Jun 1 34.63 32.23 30.79 29.34 20.14 17.68 16.21 14.73CRW Jun 3 35.31 32.89 31.43 29.98 20.72 18.22 16.72 15.21Syn 1 20.84 18.23 16.66 15.09Syn 2 23.16 20.27 18.53 16.65
Temperature oCCL LLK
III - 5 Advantage Insight Group Inc.
FIGURE A3-6350 cSt Cold Lake Blends
% Diluent Required (API 2509C)
25262728293031323334353637383940414243444546474849505152
5 6 7 8 9 10 11 12 13 14 15 16 17 18 19
Reference Temperature oC
Vol
ume
% D
iluen
Valhalla, 811.6Swan Hills, 823.6West Pembina, 799.7Pembina, 768.3Peace, 764.2CRW Jun 3, 730.7CRW Jun 1, 720.6Amoco, 714.8Ft Sask, 678.8Rimbey, 682.8
FIGURE A3-7350 cSt LLK Blends% Diluent Required
(API 2509C)
12131415161718192021222324252627282930313233343536
5 6 7 8 9 10 11 12 13 14 15 16 17 18 19
Reference Temperature oC
Volu
me
% D
iluen
t
Swan Hills, 823.6Valhalla, 811.6West Pembina, 799.7Pembina, 768.3Peace, 764.2CRW Jun 3, 730.7CRW Jun 1, 720.6Amoco, 714.8Rimbey, 682.8Ft Sask, 678.8
`
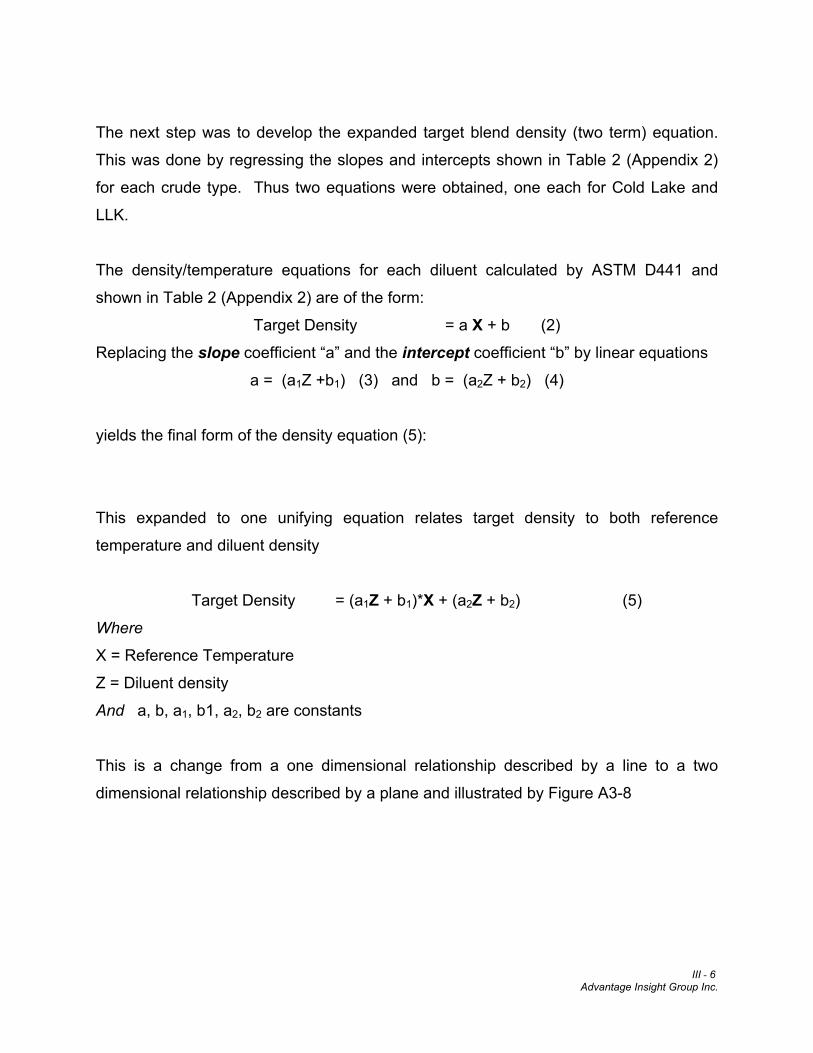
III - 6 Advantage Insight Group Inc.
The next step was to develop the expanded target blend density (two term) equation.
This was done by regressing the slopes and intercepts shown in Table 2 (Appendix 2)
for each crude type. Thus two equations were obtained, one each for Cold Lake and
LLK.
The density/temperature equations for each diluent calculated by ASTM D441 and
shown in Table 2 (Appendix 2) are of the form:
Target Density = a X + b (2)
Replacing the slope coefficient “a” and the intercept coefficient “b” by linear equations
a = (a1Z +b1) (3) and b = (a2Z + b2) (4)
yields the final form of the density equation (5):
This expanded to one unifying equation relates target density to both reference
temperature and diluent density
Target Density = (a1Z + b1)*X + (a2Z + b2) (5)
Where
X = Reference Temperature
Z = Diluent density
And a, b, a1, b1, a2, b2 are constants
This is a change from a one dimensional relationship described by a line to a two
dimensional relationship described by a plane and illustrated by Figure A3-8
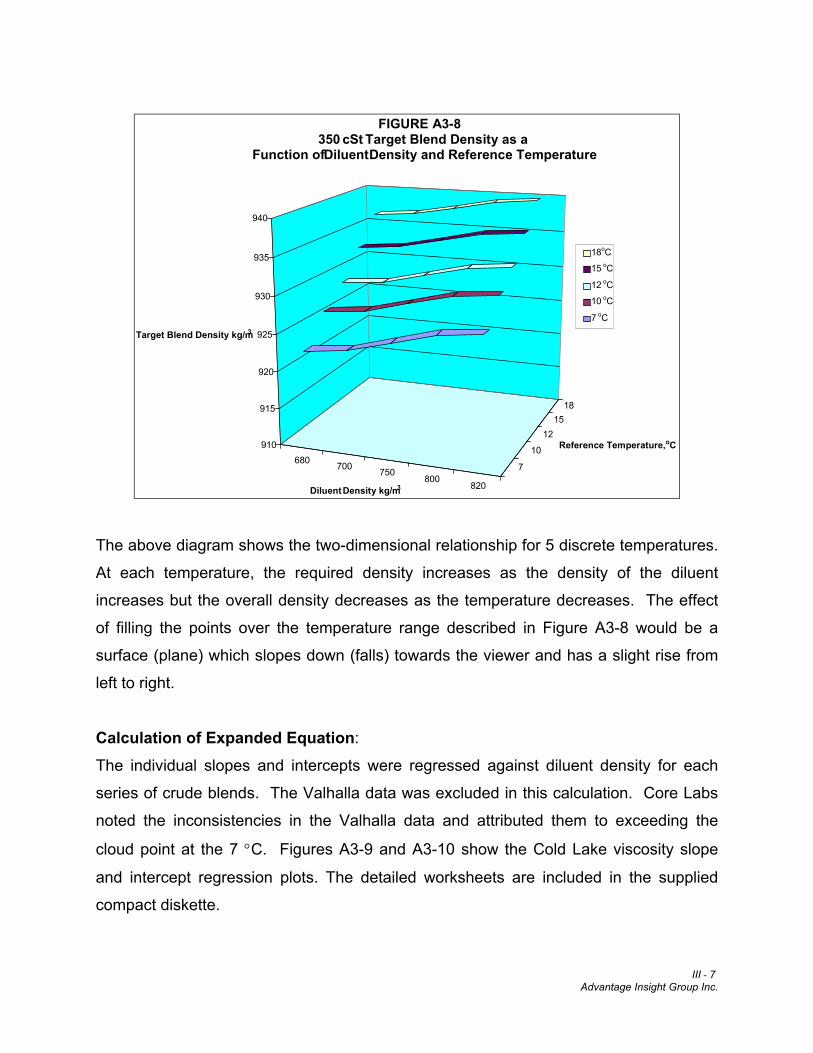
III - 7 Advantage Insight Group Inc.
680 700 750800
820
1815
12
10
7
910
915
920
925
930
935
940
Target Blend Density kg/m3
Diluent Density kg/m3
Reference Temperature,oC
FIGURE A3-8350 cSt Target Blend Density as a
Function of Diluent Density and Reference Temperature
18oC
15 oC
12 oC
10 oC
7 oC
The above diagram shows the two-dimensional relationship for 5 discrete temperatures.
At each temperature, the required density increases as the density of the diluent
increases but the overall density decreases as the temperature decreases. The effect
of filling the points over the temperature range described in Figure A3-8 would be a
surface (plane) which slopes down (falls) towards the viewer and has a slight rise from
left to right.
Calculation of Expanded Equation:
The individual slopes and intercepts were regressed against diluent density for each
series of crude blends. The Valhalla data was excluded in this calculation. Core Labs
noted the inconsistencies in the Valhalla data and attributed them to exceeding the
cloud point at the 7 °C. Figures A3-9 and A3-10 show the Cold Lake viscosity slope
and intercept regression plots. The detailed worksheets are included in the supplied
compact diskette.
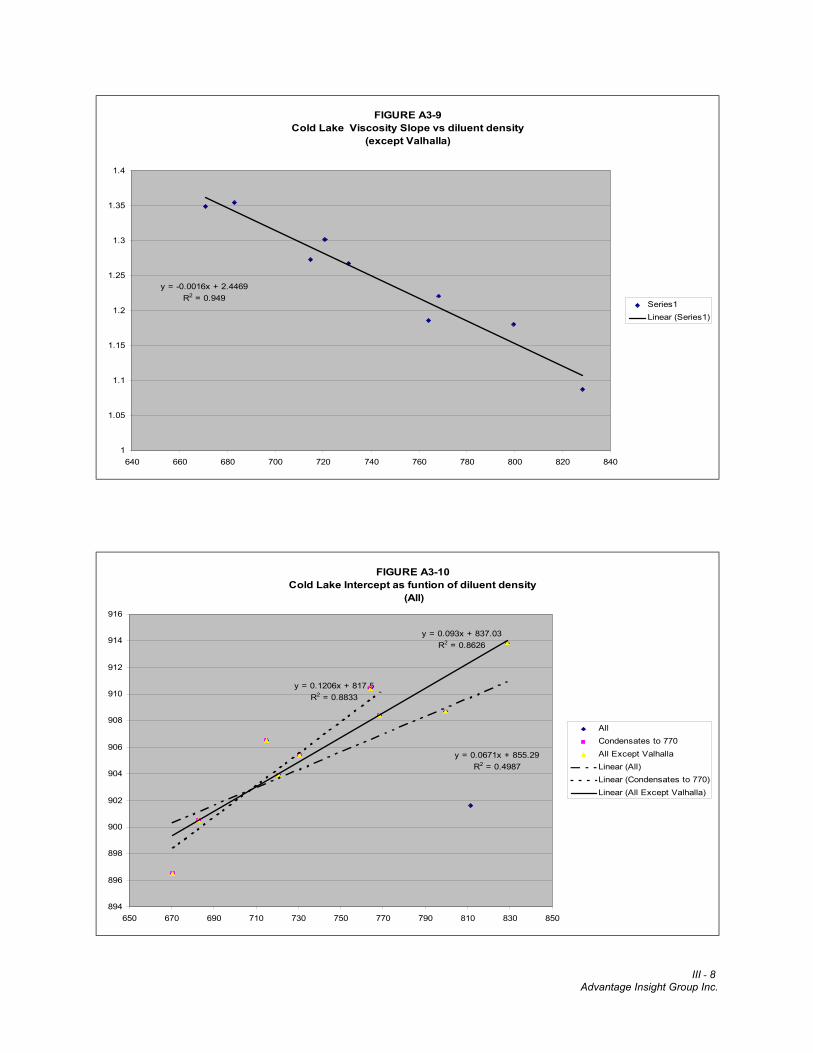
III - 8 Advantage Insight Group Inc.
FIGURE A3-9Cold Lake Viscosity Slope vs diluent density
(except Valhalla)
y = -0.0016x + 2.4469R2 = 0.949
1
1.05
1.1
1.15
1.2
1.25
1.3
1.35
1.4
640 660 680 700 720 740 760 780 800 820 840
Series1Linear (Series1)
FIGURE A3-10Cold Lake Intercept as funtion of diluent density
(All)
y = 0.0671x + 855.29R2 = 0.4987
y = 0.1206x + 817.5R2 = 0.8833
y = 0.093x + 837.03R2 = 0.8626
894
896
898
900
902
904
906
908
910
912
914
916
650 670 690 710 730 750 770 790 810 830 850
AllCondensates to 770All Except ValhallaLinear (All)Linear (Condensates to 770)Linear (All Except Valhalla)
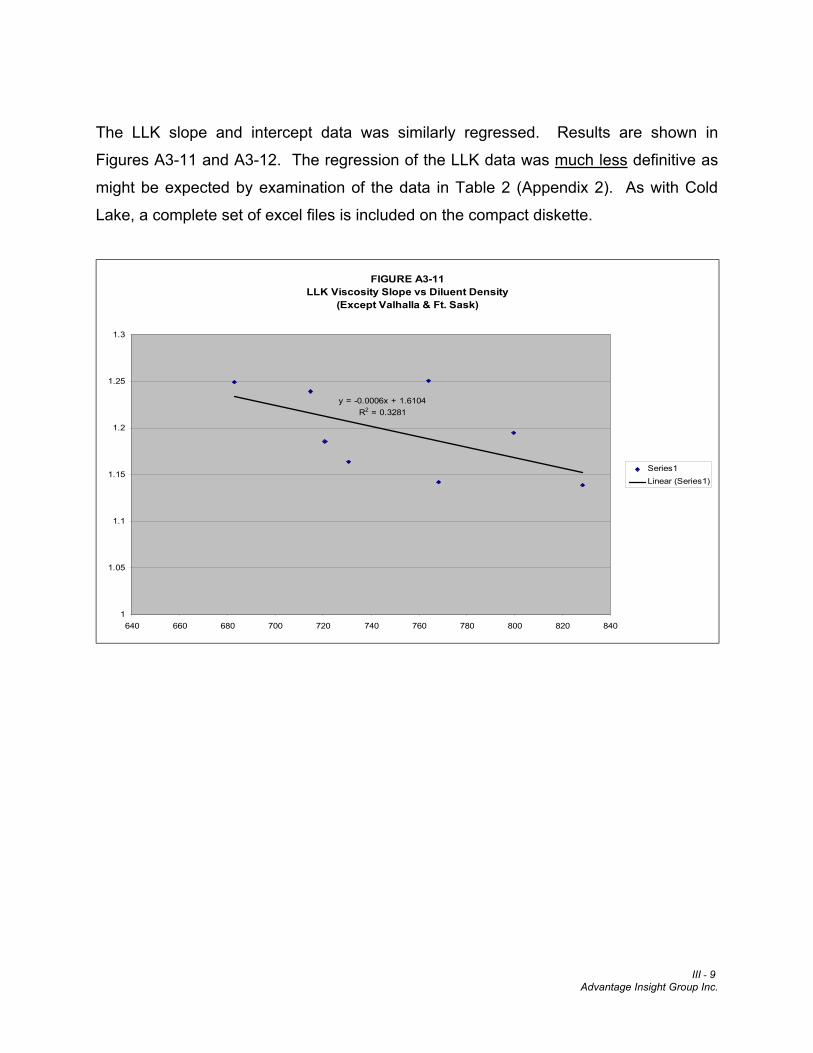
III - 9 Advantage Insight Group Inc.
The LLK slope and intercept data was similarly regressed. Results are shown in
Figures A3-11 and A3-12. The regression of the LLK data was much less definitive as
might be expected by examination of the data in Table 2 (Appendix 2). As with Cold
Lake, a complete set of excel files is included on the compact diskette.
FIGURE A3-11LLK Viscosity Slope vs Diluent Density
(Except Valhalla & Ft. Sask)
y = -0.0006x + 1.6104R2 = 0.3281
1
1.05
1.1
1.15
1.2
1.25
1.3
640 660 680 700 720 740 760 780 800 820 840
Series1Linear (Series1)
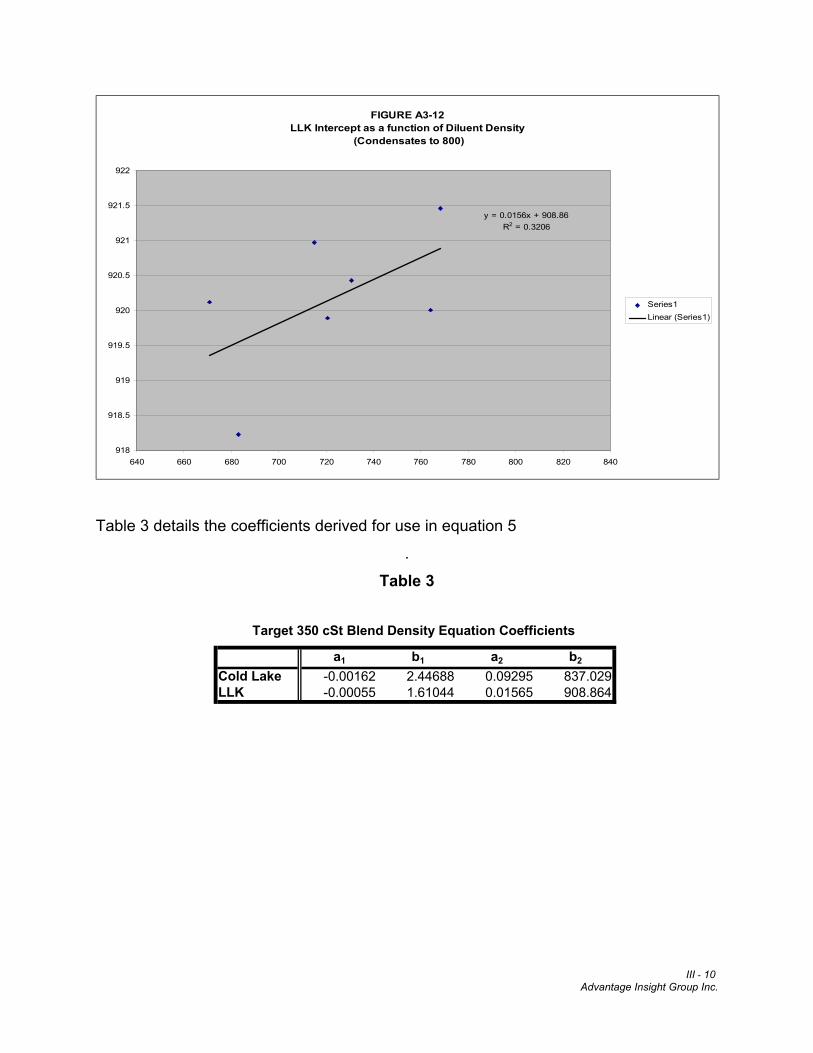
III - 10 Advantage Insight Group Inc.
FIGURE A3-12LLK Intercept as a function of Diluent Density
(Condensates to 800)
y = 0.0156x + 908.86R2 = 0.3206
918
918.5
919
919.5
920
920.5
921
921.5
922
640 660 680 700 720 740 760 780 800 820 840
Series1Linear (Series1)
Table 3 details the coefficients derived for use in equation 5
.
Table 3
a1 b1 a2 b2
Cold Lake -0.00162 2.44688 0.09295 837.029LLK -0.00055 1.61044 0.01565 908.864
Target 350 cSt Blend Density Equation Coefficients
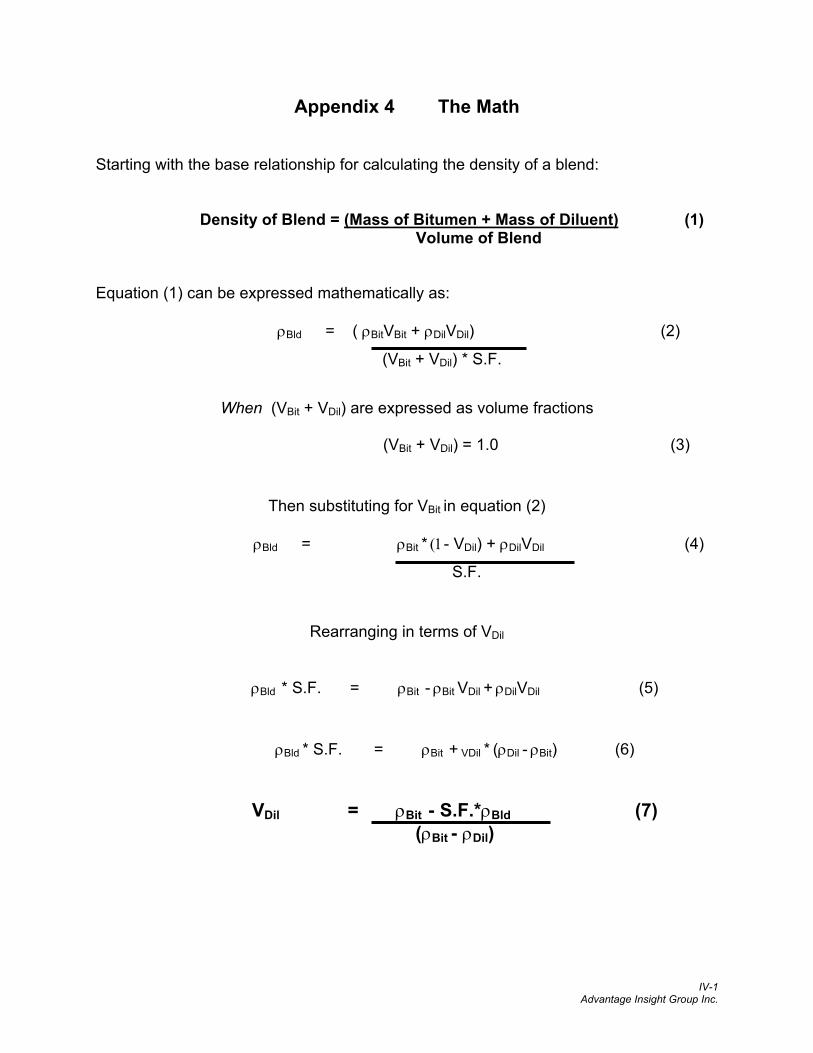
IV-1 Advantage Insight Group Inc.
Appendix 4 The Math
Starting with the base relationship for calculating the density of a blend:
Density of Blend = (Mass of Bitumen + Mass of Diluent) (1) Volume of Blend
Equation (1) can be expressed mathematically as:
ρBld = ( ρBitVBit + ρDilVDil) (2)
(VBit + VDil) * S.F.
When (VBit + VDil) are expressed as volume fractions
(VBit + VDil) = 1.0 (3)
Then substituting for VBit in equation (2)
ρBld = ρBit * (1- VDil) + ρDilVDil (4)
S.F.
Rearranging in terms of VDil
ρBld * S.F. = ρBit - ρBit VDil + ρDilVDil (5)
ρBld * S.F. = ρBit + VDil * (ρDil - ρBit) (6)
VDil = ρBit - S.F.*ρBld (7)
(ρBit - ρDil)
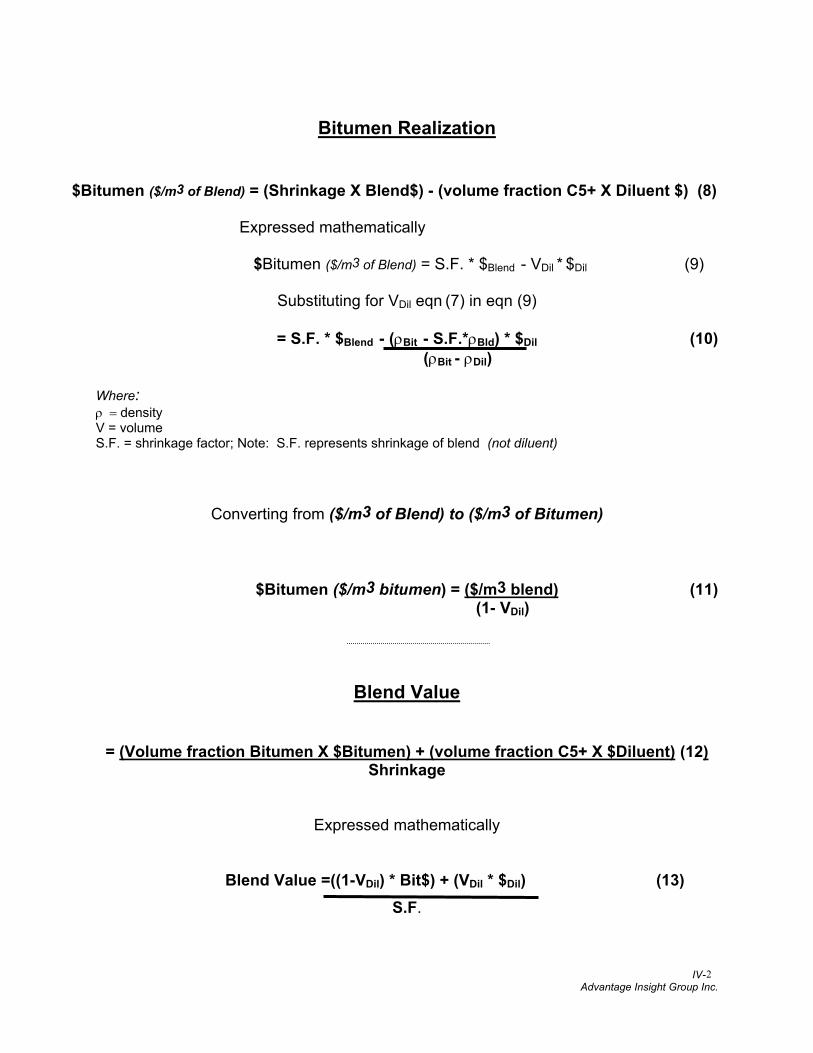
IV- Advantage Insight Group Inc.
2
Bitumen Realization
$Bitumen ($/m3 of Blend) = (Shrinkage X Blend$) - (volume fraction C5+ X Diluent $) (8)
Expressed mathematically
$Bitumen ($/m3 of Blend) = S.F. * $Blend - VDil * $Dil (9)
Substituting for VDil eqn (7) in eqn (9)
= S.F. * $Blend - (ρBit - S.F.*ρBld) * $Dil (10) (ρBit - ρDil)
Where: ρ = density V = volume S.F. = shrinkage factor; Note: S.F. represents shrinkage of blend (not diluent)
Converting from ($/m3 of Blend) to ($/m3 of Bitumen)
$Bitumen ($/m3 bitumen) = ($/m3 blend) (11) (1- VDil)
Blend Value
= (Volume fraction Bitumen X $Bitumen) + (volume fraction C5+ X $Diluent) (12) Shrinkage
Expressed mathematically
Blend Value =((1-VDil) * Bit$) + (VDil * $Dil) (13) S.F.
V-1 Advantage Insight Group Inc.
Appendix 5
Advantage Insight Group Inc Advantage Insight Group Inc. is a Calgary based consulting company that provides services to the North American refining and pipelines industry as well as the Canadian heavy oil industry. This consulting includes technology evaluation, economics, and logistics analysis. The company’s broad experience in upgrading, transporation and refining allows it to provide particular insight into the interfaces between these traditionally separated sectors of the energy industry. The consultants who comprise Advantage Insight have an extensive background in refining, transportation systems, and heavy oil both in North America and throughout the world. Projects have included economic evaluations of new refinery opportunities, evaluations of the economic impact of product specification changes, a review of pipeline contracts, development of a national infrastructure for the sale of regulated refined products, and a review of heavy oil upgrading technology options. While most of the company personnel have a background in engineering and the technical aspects of the industry, the focus of the company’s work is in the economics and logistics aspects of the industry.