Download - Invited Feature - Palmer Lab

Invited Feature
Evaluating River Restoration1
This Invited Feature comprises a collection of papers evaluating the ecological outcomes ofchannel reconfiguration restoration projects in the eastern United States and western Europe. Toprovide background and context, the first paper (Bernhardt and Palmer) begins by providing a briefsummary of recent publications that have reviewed the scientific basis or ecological outcomes ofmultiple river restoration projects. The types of projects discussed in these previous publications arediverse, but we focus primarily on publications that have evaluated channel reconfiguration projects.The other six papers in this collection present new findings and insight into the effectiveness of
channel-based restoration projects. Unfortunately, the conclusions of these papers are sobering.Empirical evaluation of a variety of channel-based restoration projects discovered little evidence ofecologically successful outcomes. Violin et al. find that urban stream restoration efforts in thesoutheastern United States had no demonstrable effect on habitat diversity or on macroinvertebratecommunities. More disheartening, Louhi et al. find that several restored streams in Finland havestream invertebrate communities that are depauperate relative to unrestored upstream referencereaches even 15 years following restoration. Sundermann et al. find that most of the restored streamsthey sampled in Germany show no measurable improvement in macroinvertebrate communities, andthe few that do are close to intact, forested catchments.Sudduth et al. report that restored urban streams in North Carolina have significantly higher
temperatures than unrestored urban streams as a result of removing riparian trees to facilitaterestoration projects. Filoso and Palmer show that efforts to reduce the flux of nitrogen to coastalwaters through hydrogeomorphic stream restoration approaches are rarely successful. Jahnig et al.document the existence of different perceptions of restoration success and show that, according todata from river restoration projects in Germany, water managers tend to be overly positive in theirself-evaluation of restoration projects.On the bright side, the papers in this Invited Feature provide insightful perspectives for learning
from past efforts and implementing adaptive restoration. The last part of the paper by Bernhardtand Palmer discusses four factors that should inform future restoration efforts and considers thesocial context within which such efforts must be made.
—EMILY S. BERNHARDT
Duke UniversityGuest Editor
—MARGARET A. PALMER
University of MarylandGuest Editor
� 2011 by the Ecological Society of America
1 Reprints of this 91-page Invited Feature are available for $10.00 each, either as PDF files or as hardcopy. Prepayment is required. Order reprints from the Ecological Society of America, Attention: ReprintDepartment, 1990 M Street, N.W., Suite 700, Washington, D.C. 20036 ([email protected]).
1925
Ecological Applications, 21(6), 2011, pp. 1926–1931� 2011 by the Ecological Society of America
River restoration: the fuzzy logic of repairing reachesto reverse catchment scale degradation
EMILY S. BERNHARDT1,4
AND MARGARET A. PALMER2,3
1Department of Biology, Duke University, Durham, North Carolina 27708 USA2University of Maryland Center for Environmental Science, Solomons, Maryland 20688 USA3Department of Entomology, University of Maryland, College Park, Maryland 20742 USA
Abstract. River restoration is an increasingly common approach utilized to reverse pastdegradation of freshwater ecosystems and to mitigate the anticipated damage to freshwatersfrom future development and resource-extraction activities. While the practice of riverrestoration has grown exponentially over the last several decades, there has been littleempirical evaluation of whether restoration projects individually or cumulatively achieve thelegally mandated goals of improving the structure and function of streams and rivers. Newefforts to evaluate river restoration projects that use channel reconfiguration as a methodologyfor improving stream ecosystem structure and function are finding little evidence formeasurable ecological improvement. While designed channels may have less-incised banks andgreater sinuousity than the degraded streams they replace, these reach-scale efforts do notappear to be effectively mitigating the physical, hydrological, or chemical alterations that areresponsible for the loss of sensitive taxa and the declines in water quality that typicallymotivate restoration efforts. Here we briefly summarize this new literature, including thecollection of papers within this Invited Feature, and provide our perspective on the limitationsof current restoration.
Key words: catchment land use; evaluation; natural channel design; river restoration; streams; waterquality.
INTRODUCTION
The water quality and biodiversity of freshwaters are
declining globally. While high-profile examples like the
historic ‘‘flaming Cuyahoga River of Ohio’’ or the
desperately polluted Ganges may grab the headlines, the
bulk of the damage to our global rivers falls into two
categories: degradation resulting from major alterations
to the landscape or from excessive water withdrawals
and construction of dams (Nilsson et al. 2005, Dudgeon
et al. 2006). While both types of degradation occur
worldwide, the former is a common motivation for river
restoration in wet climates such as in the eastern United
States and much of Europe where high flows and
polluted runoff may accompany land use change. The
latter drives restoration efforts particularly in arid or
semiarid climates including much of the western United
States, the Middle East, Australia, and parts of Africa.
Just as the source of degradation differs between these
two types, so too do the restoration approaches.
Efforts to restore biodiversity and ecological function
in rivers that have been dammed or subjected to flow
diversions have included reestablishing part of the
historic flow regime, removing levees to recover flood-
plain functionality, scheduling water releases from
reservoirs to restore native vegetation and riparian
functions, and in some cases even removing flow
blockages or reconnecting river reaches that have been
fragmented (Bednarek 2001, Stromberg 2001, Doyle et
al. 2005, Richter and Thomas 2007). While reducing
diversions and removing dams have not uniformly been
successful in restoring native flora and fauna, there are
certainly success stories (e.g., Rood et al. 2003, Hall et
al. 2010). Many of these involved restoring flows to river
reaches that were ‘‘water starved’’ or had blockages that
significantly limited upstream fish dispersal (Rood et al.
2005, Catalano et al. 2007) but were otherwise not
seriously stressed by other factors such as uncontrolled
runoff or non-point-source pollution.
Efforts to restore biodiversity and ecological function
in streams and rivers degraded by substantial land use
change or by human activities such as agriculture,
development, and channelization have proved to be
much more difficult, and reports of effectiveness
monitoring (pre- and post-restoration quantitative
sampling) of restoration outcome are rare (Bernhardt
et al. 2005, Palmer et al. 2005). Yet, human activities
Manuscript received 9 August 2010; revised 2 December2010; accepted 3 December 2010; final version received 31January 2011. Corresponding Editor: C. Nilsson. For reprintsof this Invited Feature, see footnote 1, p. 1925.
4 E-mail: [email protected]
1926
INVITED FEATUREEcological Applications
Vol. 21, No. 6

leading to non-point-source pollution and channel
degradation are among the most common motivations
for undertaking stream restoration (Walsh et al. 2005,
Bernhardt and Palmer 2007) often involving significant
channel reconfiguration efforts. Typically these restora-
tion projects focus on increasing channel stability and
in-stream habitat by altering channel form and structure
along a river reach (Niezgoda and Johnson 2005) with
the hopes of restoring stream ecosystems (Rosgen 1996,
Hey 2006). These channel-based or ‘‘hydromorpholog-
ical’’ restoration projects are extremely common world-
wide (e.g., Jahnig et al. 2009), and new research efforts
to evaluate their ecological effectiveness are just begin-
ning to be published (e.g., Tullos et al. 2009, Baldigo et
al. 2010, Miller and Kochel 2010, Miller et al. 2010).
This Invited Feature presents a series of papers that
evaluate the ecological outcomes of channel reconfigu-
ration restoration projects in the eastern United States
and western Europe. To provide background and
context, we first provide a very brief summary of recent
publications that have reviewed the scientific basis or
ecological outcomes of multiple river restoration proj-
ects. The types of projects discussed in these publications
are diverse, but we focus primarily on publications that
have evaluated channel reconfiguration projects.
Overviews of projects directed at restoring environ-
mental flows or riparian zones are available elsewhere
(e.g., see special journal issues associated with
Arthington et al. [2010] and Mayer et al. [2010]).
Background
The literature on restoration effectiveness is growing.
Several recent papers have attempted to synthesize
reports of restoration evaluations (Roni et al. 2008,
Miller and Kochel 2010, Miller et al. 2010, Palmer et al.
2010, Whiteway et al. 2010). After reviewing a wide
variety of stream restoration projects (345 studies), Roni
et al. (2008) concluded that few firm conclusions could
be reached ‘‘because of the limited information provided
on physical habitat, water quality, and biota and
because of the short duration and limited scope of most
published evaluations.’’ Whiteway et al. (2010) offer a
more optimistic perspective, finding that, of 211 river
restoration projects aimed at restoring salmonid fish, the
majority of projects led to an increase in the abundance
or biomass of fish although, we note, that most projects
do not distinguish aggregation effects from population-
level increases. Baldigo et al. (2010) used a thorough
before–after–control–impact (BACI) assessment design
and found than in four of six ‘‘natural channel design’’
projects, increases in salmonid biomass were also
accompanied by small increases in young-of-the-year
trout, suggesting the potential for population-level
effects. Because such changes were negligible or absent
in two of the projects they studied, Baldigo et al. (2010)
emphasize that positive ecological responses from
channel design projects should not be presumed and
that increases in channel stability do not necessarily lead
to improved fish habitat. It is important to recognize
that most projects analyzed in these syntheses were less
than a decade post-construction. The lack of demon-
strable ecological improvements may thus be due either
to a lack of effective physical, chemical, or hydrologic
remediation or merely to a lack of time for recovery.
Even if restoration efforts could be reliably expected to
generate ecological improvements within subsequent
decades, such time lags between implementation and
ecological recovery must temper expectations that
restoration efforts can effectively and quickly mitigate
river degradation elsewhere.
Many evaluations of stream restoration projects rely
on diversity and species composition of macroinverte-
brates as an indicator of ecological outcome and while a
growing number of publications report on the outcome
of one or a few projects (e.g., Yu et al. 2010), there are
also some recent syntheses. Palmer et al. (2010) found
that, of 78 channel restoration projects, only two
documented a significant improvement in macroinverte-
brate species richness or compositional shift toward
reference conditions. While they did not measure
invertebrate response, the work by Miller and Kochel
(2010) was sufficiently comprehensive (monitored 26
restoration projects), that it is worth noting here. Their
geomorphic monitoring programs led them to conclude
that attempts to restore rivers through channel reconfi-
guration are extremely difficult because they can lead to
major channel adjustments and failures of in-stream
structures: ‘‘there is little evidence from the examined
projects in North Carolina that reconfiguring straight-
ened and/or incised channels along highly dynamic
rivers will speed the rate of recovery’’ (Miller and Kochel
2010:1690).
Contributing papers
Unfortunately, the conclusions of papers comprising
this Invited Feature are sobering. Empirical evaluation
of a variety of channel-based restoration projects
documented little evidence of ecologically successful
outcomes. Violin et al. (2011) found that urban stream
restoration efforts in the southeastern United States had
no demonstrable effect on habitat diversity or on
macroinvertebrate communities. More disheartening,
several restored streams in Finland were found to have
stream invertebrate communities that were depauparate
relative to unrestored upstream reference reaches even
15 years following restoration (Louhi et al. 2011).
Restored urban streams in North Carolina were found
to have significantly higher temperatures than unre-
stored urban streams as a result of removing riparian
trees to facilitate restoration projects (Sudduth et al.
2011). Filoso and Palmer (2011) show that efforts to
reduce the flux of nitrogen to coastal waters through
hydrogeomorphic stream restoration approaches are
rarely successful. Instead, N-removal capacity may
depend more on N concentrations than restoration
treatment, and projects are unlikely to provide signifi-
September 2011 1927EVALUATING RIVER RESTORATION
cant N-reducing benefits unless the ‘‘restoration’’ project
involved converting the stream to a very different type of
ecosystem such as a wetland–stream complex (i.e., the
end result is a system that may not even have the
ecological characteristics of a stream anymore). Despite
a lack of measurable ecological improvement (sensu
Palmer et al. 2005), most restoration practitioners
consider their projects to be successful (Bernhardt et
al. 2007, Jahnig et al. 2011).
ADAPTIVE RESTORATION
With a rapidly expanding body of literature evaluat-
ing river restoration effectiveness, we can move from
asking ‘‘Why don’t we know more about river restora-
tion success?’’ (Bernhardt et al. 2005, Palmer et al. 2005)
to asking ‘‘Why aren’t river restoration projects more
effective?’’ We offer some thoughts that were in part
informed by the papers in this Invited Feature, but we
want to emphasize the value of past monitoring efforts.
The published assessments of restored streams and river
reaches have provided a great deal of information that
can inform future project designs. Documented failures
with good data are fodder for understanding what went
wrong and why—indeed, as we emphasized in Palmer et
al. (2005), learning from past efforts can be considered
one of at least three forms of restoration success (i.e., in
addition to ecological improvements and meeting stake-
holder needs). As countries around the world move
forward in developing restoration plans, we suggest that
future projects should be informed by results from past
efforts and ecological theory (O’Donnell and Galat
2007, Woolsey et al. 2007). In calling for ‘‘restoration
reform,’’ Palmer (2009) discusses in depth factors that
should drive river future restoration efforts, and Beechie
et al. (2010) provide insightful perspectives on moving
toward more process-based restoration. Here we men-
tion four of those factors and perspectives that papers in
this Invited Feature help illuminate.
First, much more emphasis needs to be placed on site
selection for restoration projects: spatial context may be
one of the most important factors controlling stream
restoration outcome. Sundermann et al. (2011) found
that most of the restored streams they sampled in
Germany showed no measurable improvement in
macroinvertebrate communities; the few that did were
close to intact, forested catchments. They suggest that
the proximity of a restored stream reach to potential
sources of colonists is an important determinant of
restoration success, or, in other words, that the
provision of habitat is insufficient if target taxa must
disperse long distances within degraded channels or
across altered landscapes to colonize a restored site.
Another interpretation of these same data might be that
river reaches in catchments with less total disturbance
have a higher potential to recover from targeted efforts.
Additionally, Filoso and Palmer (2011) show that
position within a catchment (upland vs. lowland
restoration project) may have a major impact on the
nitrogen removal capacity of restored Coastal Plain
reaches in urban areas. They found that, during high
flows when most of the N is exported, lowland reaches
with gentle slopes and wider valleys have higher
hydraulic retention and, therefore, capacity to retain N.
Second, given that a number of studies have now
found no ecological improvement from channel
reconfiguration projects and, in some cases, even found
evidence of increased degradation (e.g., Tullos et al.
2009), future restoration approaches should keep earth-
moving activities to a minimum, particularly if they
include the removal of trees. The studies by Louhi et al.
(2011) and Sudduth et al. (2011) both present evidence
that restoration activities themselves actually lead to
degradation that is not necessarily short lived. In a series
of timber-floated streams in Finland, Louhi et al. (2011)
found that a critical habitat, native bryophyte patches,
did not recover, and thus limited the recovery of stream
invertebrates that typically inhabit these patches.
Potential colonists were present above the restored
reaches, and thus this was not a case of dispersal
limitation. Sudduth et al. (2011) document a very
different type of habitat degradation post-restoration.
They show that the urban streams they studied were
significantly warmer with more sunlight penetrating the
water post-restoration. The most extensive and expen-
sive types of restoration projects (natural channel
design, floodplain reconnection) require, at a minimum,
significant earth-moving and temporary piping or
rerouting of stream flow. Empirical evaluation of 24
restoration sites led Tullos et al. (2009) to conclude that
channel reconfiguration acts as a ‘‘disturbance filter’’
such that taxa sensitive to disturbance were character-
istic of their control reaches, whereas insensitive taxa
were characteristic of restored reaches. They attributed
this to the disturbance effect on food resources and
channel stability. Acknowledging that this could be a
temporary impact (Tullos et al. [2009] projects were 1–4
years old), the results of Sudduth et al. (2011; projects 1–
6 years old), Louhi et al. (2011; some projects 12 years
old), and Palmer et al. (2010; some projects 16 years old)
suggest that the unintended consequences of restoration
may persist for some time.
Third, restoration of streams and rivers should not be
expected to alleviate problems generated throughout a
catchment. The very problems that lead to stream
degradation typically are catchment-scale problems
(e.g., large amounts of impervious cover or land in
agriculture). Projects that are small in scope simply
cannot handle the level of impacts, and yet the vast
majority of restoration projects are small and isolated.
Even for projects that are large, streams simply cannot
always ‘‘repair’’ problems created at broad scales. For
example, Filoso and Palmer (2011) found that, across
the restored sites they studied, nitrogen (N) export to
downstream waters was reduced in restored reaches by a
maximum of 11% during base-flow conditions, and 24%
during high flows. However, this amounted to only ;5%
INVITED FEATURE1928Ecological Applications
Vol. 21, No. 6
of the total N input into the catchment. Further, these
‘‘high’’ N removal values are for a stream that was
converted to a stream–wetland complex. Some of the
more traditionally restored stream reaches actually
contributed more N to downstream waters than control
reaches. As we have previously argued, these results
highlight the need to reduce N sources on the land and
improve land-based ‘‘best management practices’’
(BMPs; Bernhardt and Palmer 2007, Bernhardt et al.
2008).
Fourth, future efforts must shift from a focus on
geomorphic structure and form to a focus on restoration
of the hydrologic, geomorphic, and biological processes
that maintain healthy stream ecosystems. There is a
widespread practice of applying structural approaches to
restore ecological communities rather than process-
based approaches (Roni et al. 2002, 2008), and one of
the most widely applied and controversial restoration
approaches, natural channel design, focuses exclusively
on matching the pattern, profile, and dimension of
stream channels to pre-degradation or reference con-
ditions (Rosgen 1994, Lave 2009). There are a few types
of restoration activities that are explicitly designed to
restore river processes. Most notably the dam and levee
removal projects we mentioned at the outset of our
article are designed to reinstate disrupted hydrological
and sediment-flux processes along river networks or
between rivers and their floodplains (Bednarek 2001,
Hart et al. 2002, Stanley and Doyle 2003). Although not
currently classified as river restoration, efforts to retain
and detain storm waters in urban or agricultural
catchments can similarly help restore a more natural
flow regime. A variety of catchment BMPs and infra-
structure improvements aimed at reducing contaminant
loading to streams can also ‘‘restore’’ more natural
chemical fluxes to degraded stream ecosystems. The
current overemphasis on structural improvements to
channels in restoration is likely a result of river
restoration approaches emerging out of classic hydraulic
engineering (see discussion in Lave [2009]).
CONCLUSIONS AND SOCIAL CONTEXT
In the same way that national and international plans
for adaptive fisheries management have been difficult to
implement (Francis et al. 2007, Walters 2007), adaptive
restoration that allows for changes in the design and
conceptualization of river and catchment projects will be
very difficult to implement. Just as scientists are hesitant
to break free of accepted theories, practitioners and
managers are hesitant to experiment with new ap-
proaches. Additionally, regulatory agencies often incor-
porate restoration method requirements into policy
instruments (Lave 2009), and changes to such policies
often lag a decade or more behind the science. Efforts to
streamline the regulatory process can also severely
constrain opportunities for developing, implementing,
and testing innovative approaches to improving the
conditions of degraded streams. For example, require-
ments that stream restoration be ‘‘in kind’’ currently
prevent catchment managers from spending restoration
dollars for out-of-channel improvements in water
management that might ultimately better protect water
and habitat quality. If regulatory agencies insisted upon
evidence of desirable outcomes (e.g., improved water
quality, restored environmental flows or dampened
floods, improvements in the diversity or abundance of
target taxa) rather than requiring particular approaches
or evidence of structural changes to the channel, this
would provide opportunities for experimentation and
the development of a broader array of tools and
approaches for reversing and preventing degradation
of river ecosystems.
We are optimistic that the recent spate of publications
on restoration outcomes is making a difference. Both of
us are aware of new efforts in the United States, Europe,
and Australia to prioritize and plan restoration efforts at
catchment scales, and we believe this reflects not only
new scientific findings, but perhaps more importantly an
increase in social pressure and environmental awareness.
Streams and rivers reflect what we do on the land, and
rather than working at the end of the pipe (the stream),
community groups and managers may need to be
focusing their energies on protecting streams and rivers
from continued degradation by keeping storm waters,
nutrients, and contaminants contained within catch-
ments. Recognizing the extreme fragility of healthy
streams and the nearly insurmountable challenges to
stream restoration in the catchments where most people
live and work must give us pause—and force us to raise
the bar when deciding whether to fill, pipe, or otherwise
further degrade stream ecosystems. Finally, we have to
recognize that, in many catchments, river restoration
(i.e., channel projects) will never be ‘‘good enough.’’ In
highly altered agricultural, urban, and suburban land-
scapes, elevated supplies of storm waters, nutrients, and
contaminants to stream ecosystems impose serious
constraints on what can be achieved both structurally
and functionally through stream engineering. Instead,
effective ‘‘restoration’’ in catchments with agricultural or
urban development must first focus on slowing and
interrupting the heightened hydrologic connectivity
between heavily altered catchments and draining
streams, thereby improving water quality and reducing
peak flows. Protecting and promoting healthy riparian
vegetation and reinstating the reduced hydrologic
connectivity between streams and their floodplains are
important and necessary next steps. Such measures may
be sufficient to promote biological recovery in impacted
streams; however, structural enhancements within the
stream channel will likely be necessary to create and
reinstate appropriate habitat diversity.
ACKNOWLEDGMENTS
The authors thank Dave Strayer and an anonymous reviewerfor their constructive review and improvement of this article.The authors also thank Christy Violin and Elizabeth Sudduthfor comments on an earlier version of the manuscript.
September 2011 1929EVALUATING RIVER RESTORATION

LITERATURE CITED
Arthington, A. H., R. J. Naiman, M. E. McClain, and C.Nilsson. 2010. Preserving the biodiversity and ecologicalservices of rivers: new challenges and research opportunities.Freshwater Biology 55:1–16.
Baldigo, B. P., A. G. Ernst, D. R. Warren, and S. J. Miller.2010. Variable responses of fish assemblages, habitat, andstability to natural-channel-design restoration in CatskillMountain streams. Transactions of the American FisheriesSociety 139:449–467.
Bednarek, A. T. 2001. Undamming rivers: a review of theecological impacts of dam removal. EnvironmentalManagement 27:803–814.
Beechie, T. J., D. A. Sear, J. D. Olden, G. R. Pess, J. M.Buffington, H. Moir, P. Roni, and M. M. Pollock. 2010.Process-based principles for restoring river ecosystems.BioScience 60:209–222.
Bernhardt, E. S., L. E. Band, C. J. Walsh, and P. E. Berke.2008. Understanding, managing, and minimizing urbanimpacts on surface water nitrogen loading. Annals of theNew York Academy of Sciences 1134:61–96.
Bernhardt, E. S., et al. 2005. Can’t see the forest for the stream?In-stream processing and terrestrial nitrogen exports.BioScience 55:219–230.
Bernhardt, E. S., and M. A. Palmer. 2007. Restoring streams inan urbanizing world. Freshwater Biology 52:738–751.
Bernhardt, E. S., E. B. Sudduth, M. A. Palmer, J. D. Allan,J. L. Meyer, G. Alexander, J. Follastad-Shah, B. Hassett, R.Jenkinson, R. Lave, J. Rumps, and L. Pagano. 2007.Restoring rivers one reach at a time: results from a surveyof US river restoration practitioners. Restoration Ecology15:482–493.
Catalano, M. J., M. A. Bozek, and T. D. Pellett. 2007. Effectsof dam removal on fish assemblage structure and spatialdistributions in the Baraboo River, Wisconsin. NorthAmerican Journal of Fisheries Management 27:519–530.
Doyle, M. W., E. H. Stanley, D. L. Strayer, R. B. Jacobson,and J. C. Schmidt. 2005. Effective discharge analysis ofecological processes in streams. Water Resources Research41:W11411.
Dudgeon, D., A. H. Arthington, M. O. Gessner, Z. I.Kawabata, D. J. Knowler, C. Leveque, R. J. Naiman,A. H. Prieur-Richard, D. Soto, M. L. J. Stiassny, and C. A.Sullivan. 2006. Freshwater biodiversity: importance, threats,status and conservation challenges. Biological Reviews81:163–182.
Filoso, S., and M. Palmer. 2011. Assessing stream restorationeffectiveness at reducing nitrogen export to downstreamwaters. Ecological Applications 21:1989–2006.
Francis, R. C., M. A. Hixon, M. E. Clarke, S. A. Murawski,and S. Ralston. 2007. Fisheries management: ten command-ments for ecosystem-based fisheries scientists. Fisheries32:217–233.
Hall, A. A., S. B. Rood, and P. S. Higgins. 2010. Resizing ariver: a downscaled, seasonal flow regime promotes riparianrestoration. Restoration Ecology. [doi: 10.1111/j.1526-100X.2009.00581.x]
Hart, D. D., T. E. Johnson, K. L. Bushaw-Newton, R. J.Horwitz, A. T. Bednarek, D. F. Charles, D. A. Kreeger, andD. J. Velinsky. 2002. Dam removal: challenges and oppor-tunities for ecological research and river restoration.BioScience 52:669–681.
Hey, R. D. 2006. Fluvial geomorphological methodology fornatural stable channel design. Journal of the American WaterResources Association 42:357–374.
Jahnig, S. C., A. W. Lorenz, and D. Hering. 2009. Restorationeffort, habitat mosaics, and macroinvertebrates—does chan-nel form determine community composition? AquaticConservation: Marine and Freshwater Ecosystems 19:457–169.
Jahnig, S. C., A. W. Lorenz, D. Hering, C. Antons, A.Sundermann, E. Jedicke, and P. Haase. 2011. River restora-tion success: a question of perception. EcologicalApplications 21:2007–2015.
Lave, R. 2009. The controversy over natural channel design:substantive explanations and potential avenues for resolu-tion. Journal of the American Water Resources Association45:1519–1532.
Louhi, P., H. Mykra, R. Paavola, A. Huusko, T. Vehanen, A.Maki-Petays, and T. Muotka. 2011. Twenty years of streamrestoration in Finland: little response by benthic macro-invertebrate communities. Ecological Applications 21:1950–1961.
Mayer, P. M., A. H. Todd, J. A. Okay, and K. A. Dwire. 2010.Introduction to the featured collection on riparian ecosys-tems and buffers1. Journal of the American Water ResourcesAssociation 46:207–210.
Miller, J. R., and R. C. Kochel. 2010. Assessment of channeldynamics, in-stream structures and post-project channeladjustments in North Carolina and its implications toeffective stream restoration. Environmental Earth Sciences59:1681–1692.
Miller, S. W., P. Budy, and J. C. Schmidt. 2010. Quantifyingmacroinvertebrate responses to in-stream habitat restoration:applications of meta-analysis to river restoration.Restoration Ecology 18:8–19.
Niezgoda, S. L., and P. A. Johnson. 2005. Improving the urbanstream restoration effort: identifying critical form andprocesses relationships. Environmental Management35:579–592.
Nilsson, C., C. A. Reidy, M. Dynesius, and C. Revenga. 2005.Fragmentation and flow regulation of the world’s large riversystems. Science 308:405–408.
O’Donnell, T. K., and D. L. Galat. 2007. River enhancement inthe upper Mississippi River basin: approaches based on riveruses, alterations, and management agencies. RestorationEcology 15:538–549.
Palmer, M. A. 2009. Reforming restoration: science in need ofapplication and applications in need of Science. Estuaries andCoasts 32:1–17.
Palmer, M. A., et al. 2005. Standards for ecologically successfulriver restoration. Journal of Applied Ecology 42:208–217.
Palmer, M. A., H. L. Menninger, and E. Bernhardt. 2010. Riverrestoration, habitat heterogeneity and biodiversity: a failureof theory or practice? Freshwater Biology 55:205–222.
Richter, B. D., and G. A. Thomas. 2007. Restoring environ-mental flows by modifying dam operations. Ecology andSociety 12(1):12.
Roni, P., T. J. Beechie, R. E. Bilby, F. E. Leonetti, M. M.Pollock, and G. R. Pess. 2002. A review of stream restorationtechniques and a hierarchical strategy for prioritizingrestoration in Pacific northwest catchments. NorthAmerican Journal of Fisheries Management 22:1–20.
Roni, P., K. Hanson, and T. Beechie. 2008. Global review ofthe physical and biological effectiveness of stream habitatrehabilitation techniques. North American Journal ofFisheries Management 28:856–890.
Rood, S. B., C. R. Gourley, E. M. Ammon, L. G. Heki, J. R.Klotz, M. L. Morrison, D. Mosley, G. G. Scoppettone, S.Swanson, and P. L. Wagner. 2003. Flows for floodplainforests: a successful riparian restoration. BioScience 53:647–656.
Rood, S. B., G. M. Samuelson, J. H. Braatne, C. R. Gourley,F. M. R. Hughes, and J. M. Mahoney. 2005. Managing riverflows to restore floodplain forests. Frontiers in Ecology andthe Environment 3:193–201.
Rosgen, D. L. 1994. A classification of natural rivers. Catena22:169–199.
Rosgen, D. L. 1996. Applied river morphology. WildlandHydrology, Pagosa Springs, Colorado, USA.
INVITED FEATURE1930Ecological Applications
Vol. 21, No. 6
Stanley, E. H., and M. W. Doyle. 2003. Trading off: theecological removal effects of dam removal. Frontiers inEcology and the Environment 1:15–22.
Stromberg, J. C. 2001. Restoration of riparian vegetation in thesouth-western United States: importance of flow regimes andfluvial dynamism. Journal of Arid Environments 49:17–34.
Sudduth, E. B., B. A. Hassett, P. Cada, and E. S. Bernhardt.2011. Testing the Field of Dreams Hypothesis: functionalresponses to urbanization and restoration in stream ecosys-tems. Ecological Applications 21:1972–1988.
Sundermann, A., S. Stoll, and P. Haase. 2011. River restorationsuccess depends on the species pool of the immediatesurroundings. Ecological Applications 21:1962–1971.
Tullos, D. D., D. L. Penrose, G. D. Jennings, and W. G. Cope.2009. Analysis of functional traits in reconfigured channels:implications for the bioassessment and disturbance of riverrestoration. Journal of the North American BenthologicalSociety 28:80–92.
Violin, C. R., P. Cada, E. B. Sudduth, B. A. Hassett, D. L.Penrose, and E. S. Bernhardt. 2011. Effects of urbanization
and urban stream restoration on the physical and biologicalstructure of stream ecosystems. Ecological Applications21:1932–1949.
Walsh, C. J., T. D. Fletcher, and A. R. Ladson. 2005. Streamrestoration in urban catchments through re-designing storm-water systems: looking to the catchment to save the stream.Journal of the North American Benthological Society24:690–705.
Walters, C. J. 2007. Is adaptive management helping to solvefisheries problems? Ambio 36:304–307.
Whiteway, S. L., P. M. Biron, A. Zimmermann, O. Venter, andJ. W. A. Grant. 2010. Do in-stream restoration structuresenhance salmonid abundance? A meta-analysis. CanadianJournal of Fisheries and Aquatic Sciences 67:831–841.
Woolsey, S., et al. 2007. A strategy to assess river restorationsuccess. Freshwater Biology 52:752–769.
Yu, G. A., Z. Y. Wang, K. Zhang, X. H. Duan, and T. C.Chang. 2010. Restoration of an incised mountain streamusing artificial step-pool system. Journal of HydraulicResearch 48:178–187.
September 2011 1931EVALUATING RIVER RESTORATION
Ecological Applications, 21(6), 2011, pp. 1932–1949� 2011 by the Ecological Society of America
Effects of urbanization and urban stream restoration on the physicaland biological structure of stream ecosystems
CHRISTY R. VIOLIN,1,5 PETER CADA,2,6 ELIZABETH B. SUDDUTH,3 BROOKE A. HASSETT,3 DAVID L. PENROSE,4 AND
EMILY S. BERNHARDT3
1Department of Biology, University of North Carolina, Chapel Hill, North Carolina 27599 USA2Nicholas School of the Environment, Duke University, Durham, North Carolina 27708 USA
3Department of Biology, Duke University, Durham, North Carolina 27708 USA4Department of Biological and Agricultural Engineering, North Carolina State University, Raleigh, North Carolina 27695 USA
Abstract. Streams, as low-lying points in the landscape, are strongly influenced by thestormwaters, pollutants, and warming that characterize catchment urbanization. Riverrestoration projects are an increasingly popular method for mitigating urban insults. Despitethe growing frequency and high expense of urban stream restoration projects, very fewprojects have been evaluated to determine whether they can successfully enhance habitatstructure or support the stream biota characteristic of reference sites. We compared thephysical and biological structure of four urban degraded, four urban restored, and fourforested streams in the Piedmont region of North Carolina to quantify the ability of reach-scale stream restoration to restore physical and biological structure to urban streams and toexamine the assumption that providing habitat is sufficient for biological recovery. To besuccessful at mitigating urban impacts, the habitat structure and biological communities foundin restored streams should be more similar to forested reference sites than to their urbandegraded counterparts. For every measured reach- and patch-scale attribute, we found thatrestored streams were indistinguishable from their degraded urban stream counterparts.Forested streams were shallower, had greater habitat complexity and median sediment size,and contained less-tolerant communities with higher sensitive taxa richness than streams ineither urban category. Because heavy machinery is used to regrade and reconfigure restoredchannels, restored streams had less canopy cover than either forested or urban streams.Channel habitat complexity and watershed impervious surface cover (ISC) were the bestpredictors of sensitive taxa richness and biotic index at the reach and catchment scale,respectively. Macroinvertebrate communities in restored channels were compositionallysimilar to the communities in urban degraded channels, and both were dissimilar tocommunities in forested streams. The macroinvertebrate communities of both restored andurban degraded streams were correlated with environmental variables characteristic ofdegraded urban systems. Our study suggests that reach-scale restoration is not successfullymitigating for the factors causing physical and biological degradation.
Key words: benthic macroinvertebrate; biotic recovery; habitat restoration; species composition; streamrestoration; urbanization.
INTRODUCTION
The world’s human population is primarily urban,
and future population growth will occur predominantly
in urban centers (United Nations 2008). Thus, an
increasing proportion of our freshwater ecosystems will
become impacted by urbanization, and a larger fraction
of humanity will rely on waterways degraded by a
common set of urban impacts. The physical, biogeo-
chemical, and biological stream impairments that occur
specifically in urbanized watersheds have been labeled
the ‘‘urban stream syndrome’’ (Walsh et al. 2005b).
Physical and hydrological consequences of watershed
urbanization are well documented and include altered
base flow and unstable hydrology with frequent, short-
duration, high-peak floods (Booth and Jackson 1997,
Paul and Meyer 2001, Meyer et al. 2005, Walsh et al.
2005b). These changes typically lead to channel incision
and simplification (Shields et al. 2003, Niezgoda and
Johnson 2005, Sudduth and Meyer 2006), and homog-
enization of benthic habitats (Federal Interagency
Stream Restoration Working Group 1998, Malmqvist
and Rundle 2002, Walsh et al. 2005b).
Manuscript received 5 August 2010; revised 16 December2010; accepted 20 December 2010. Corresponding Editor: C.Nilsson. For reprints of the Invited Feature, see footnote 1, p.1925.
5 E-mail: [email protected] Present address: Tetra Tech, Research Triangle Park,
North Carolina 27709 USA.
1932
INVITED FEATUREEcological Applications
Vol. 21, No. 6

Coincident with hydrological and geomorphological
modification, urban streams have elevated nutrient and
contaminant concentrations. Hyperconnectivity with the
surrounding landscape through roads, storm drains, and
leaky and overflowing sanitary sewers efficiently routes
watershed contaminants into urban channels (Bernhardt
et al. 2008). Pollutant concentrations increase not only
due to increased inputs from point and non-point
sources but also as a result of decreased nutrient
removal efficiency in hydrologically disconnected ripar-
ian zones and streambeds (Groffman and Crawford
2003, Grimm et al. 2005, Meyer et al. 2005).
The inverse relationship between urbanization and
native biodiversity and species composition is well
established and persists across a range of taxa (Blair
1996, Germaine and Wakeling 2001, Clark et al. 2007,
Grimm et al. 2008, McKinney 2008). Macroinvertebrate
communities are strongly affected by land use patterns
(Lenat and Crawford 1994, Sponseller et al. 2001, Allan
2004). Watershed impervious surface cover is generally
associated with a decrease in invertebrate species richness
and increasing dominance of highly tolerant taxa (Morse
et al. 2003, Roy et al. 2003, Moore and Palmer 2005,
Collier et al. 2009, Cuffney et al. 2010). Development
that is within riparian areas or that is directly hydro-
logically connected to stream channels (e.g., road cross-
ings and pipes) can be particularly detrimental to stream
communities (Wang and Kanehl 2003, Moore and
Palmer 2005, Walsh and Kunapo 2009), and there is
thus great interest in riparian reforestation and manage-
ment for urban stream ecosystem protection (Bernhardt
and Palmer 2007). While the impacts of watershed
urbanization on stream biota are well documented, it is
far from clear what combination of reach and watershed
scale management is necessary and sufficient to promote
community recovery in urban streams.
In the face of channel incision and bank erosion,
water quality degradation, and habitat and biodiversity
loss, degraded urban waterways are often targeted for
restoration. Stream restoration or rehabilitation encom-
passes a variety of strategies by which human impacts
are mitigated and previous damage is addressed, with
the overarching goal of returning the stream to as close
to pre-impacted conditions as possible (National
Research Council 1992). Urban stream restoration
presents unique problems: there is minimal space for
rehabilitation, and land acquisition is both expensive
and complicated because it generally involves multiple
landowners. These challenges typically lead to fewer
linear feet being restored and higher per-project costs
compared to rural and agricultural stream restoration
projects (Bernhardt and Palmer 2007). In fact, for many
regions of the United States, the majority of restoration
dollars are invested in a small number of urban stream
projects (Hassett et al. 2005, Sudduth et al. 2007).
Stream restoration projects are customarily imple-
mented with the specific goals of water quality improve-
ment and provision of aquatic habitat (Bernhardt et al.
2007, Sudduth et al. 2007), yet few projects have been
adequately evaluated to determine whether these goalsare met (Charbonneau and Resh 1992, Palmer et al.
1997, 2005, Moerke et al. 2004, Moerke and Lamberti2004, Bernhardt et al. 2005). Given the frequency with
which urban stream restoration is employed to mitigatehabitat and water quality degradation and the expensesand challenges involved, it is worth understanding
whether these efforts are measurably improving habitatand community structure.
The underlying assumption of stream restoration isthat altering channel geomorphology to resemble pre-
degradation conditions will lead to the recovery ofnative aquatic organisms. This assumption is based on
prior work demonstrating that fish or macroinvertebratetaxonomic richness and spatial heterogeneity are pos-
itively correlated (Gorman and Karr 1978, Angermeierand Winston 1998, Vinson and Hawkins 1998, Brown
2003). Although experimental manipulations have dem-onstrated that high substrate variability does not per se
lead to higher species richness or faster recovery (Brookset al. 2002, Spanhoff et al. 2006), stream restoration
design employs habitat provision, or increased habitatheterogeneity as the primary mechanism for restoring
biotic communities (Brooks et al. 2002). Evidence tosupport the assumption that successfully restoringphysical structure is sufficient for community restoration
(the ‘‘field of dreams’’ hypothesis) is lacking (Palmer etal. 1997, 2010, Moerke et al. 2004).
We set out to evaluate the effectiveness of four naturalchannel design (NCD) projects, a common urban stream
restoration approach (sensu Rosgen 1994, 1996) inmitigating urban stream degradation. NCD reconfigures
the pattern, profile, and dimensions of a degradedchannel to emulate an unimpacted ideal (Rosgen 2007).
This method utilizes heavy machinery to regrade andreshape a degraded channel and employs hard structures
such as log vanes or cross vanes to control grade, installsroot wads to stabilize banks, adds coarse bed material to
create riffles, and revegetates reconfigured or newlycreated riparian areas.
Effective restoration should recapture the habitatstructure and biological communities of forested streams,
ideally approaching a stable approximation of ‘‘reference’’conditions. We tested whether a series of urban restora-
tion projects were achieving or moving toward this goal byexamining whether habitat structure and macroinverte-
brate community composition in the restored reaches ofurban streams were different from similarly situated urbandegraded stream reaches and whether the habitat and
community structure of these restored reaches moreclosely matched conditions in nearby forested streams
than their unrestored urban counterparts.
METHODS
Site selection
Through consultation with staff of the North
Carolina Ecosystem Enhancement Program (EEP) and
September 2011 1933EVALUATING RIVER RESTORATION
the North Carolina Stream Restoration Institute (SRI)
we selected four urban natural channel design restora-
tion projects that practitioners and regulators felt were
particularly well-designed and implemented. Our goal in
selecting restoration projects was not to select a random
sample, but rather to choose a set of projects that
represented the best-case scenario for urban restoration
based on expert practitioners’ opinions. Each restored
stream reach was then matched with a similarly situated
unrestored urban stream and a forested stream in the
Raleigh-Durham area in the Piedmont region of North
Carolina. The full comparison thus included 12 study
sites: four forested (F) sites, within small streams
draining forested catchments; four urban restored (R)
sites, within recently implemented natural channel
design restoration projects; and four urban degraded
(U) sites located in urban parks where future restoration
activities are likely (Fig. 1; Appendix A). This suite of
sites was selected to determine the potential for
ecological restoration to restore the physical and
biological structure and ecosystem function of stream
ecosystems.
Site descriptions
Four sampling blocks were created from the group of
12, each containing one urban degraded, one urban
restored, and one forested stream of similar catchment
sizes and underlying geology (Table 1). The study area
spans the Northern Outer Piedmont, Slate Belt, and
Triassic basin ecoregions, and many sites drain multiple
ecoregions (Table 1). Soil characteristics affect baseflows
and consequently stream size and permanence. Triassic
Basin and Slate Belt streams have low summer baseflows
due to low clay permeability and low water yield from
slate substrate (Griffith et al. 2002). Reduced summer
baseflows are not seen in Northern Outer Piedmont
streams where streams tend to be larger and less prone
to drying. For physical and functional metrics, all
streams within a sampling block were sampled within
one week with no intervening major storm events. In this
way, the blocking factor accounts for both differences in
watershed size, and staged timing of field analyses.
Our study included four restored stream reaches, each
of which was restored using NCD between 1999 and
2005. The Abbott stream restoration project was
implemented in 1999 on a tributary to Walnut Creek,
in Raleigh, North Carolina. The goal of this restoration
project was ‘‘to restore the stream to the stable
dimension, pattern, and profile for a C4 stream type as
classified using Rosgen’s stream classification method-
ology (Rosgen 1996). . . . This type of restoration will
reestablish the channel on a previous floodplain, or in
this case, the basin of an old pond. Appropriate channel
dimensions (width and depth), pattern (sinuosity, belt
width, riffle–pool spacing), and profile (bed slope) of the
new channel will be determined from reference reaches’’
(North Carolina Department of Transportation 1999).
Rocky Branch is a stream located on the urban North
Carolina State University campus in Raleigh and was
restored in 2001. The goals of this restoration project
included, ‘‘Restore a stable self-maintaining morpho-
logical pattern in the stream channel; Stabilize stream
banks using vegetation; Create and improve habitat for
fish and aquatic invertebrates; Improve the quality of
stormwater entering the creek through restoring and
enhancing riparian buffers and establishing stormwater
control within the creek’s watershed; Provide safe and
enjoyable access to the stream and passage through the
campus by completing the greenway path adjacent to the
creek.’’ (Doll 2003). Restored in 2004, Sandy Creek
flows through the urban Duke University campus in
Durham. The Sandy Creek project goals were to, ‘‘Re-
contour and restore more than 600 meters of degraded
stream to hydrologically reconnect the stream with the
adjacent floodplain to improve biogeochemical trans-
formations and stream water quality’’ (Richardson and
Pahl 2005). Third Fork Creek is a stream flowing
through an urban park near downtown Durham and
was restored in 2005. The goals of this project were to,
‘‘Restore stable channel morphology that is capable of
moving the flows and sediment provided by its water-
shed; reduce sediment-related poor water quality im-
pacts resulting from lateral bank erosion and bed
degradation; improve aquatic habitat diversity through
the reestablishment of riffle–pool bed variability and the
use of in-stream structures; restore vegetative riparian
buffers utilizing native plant species; and improve
natural aesthetics in an urban park setting.’’ (KCI
Associates 2003).
All of our urban stream reaches were located in urban
parks or protected areas to facilitate access, and are
similar to the pre-restoration conditions of our restored
study sites. Two of our urban stream sites (reaches of
Goose Creek and Ellerbe Creek) were chosen because
the North Carolina Ecosystem Enhancement Program
listed them as priority stream restoration sites (both
were restored after this research effort). Our study reach
on Upper Mud Creek is located within the protected
Duke Forest, immediately downstream of a 1980s-era
subdivision. Cemetery Creek is located on city property
in Raleigh and drains an older, high-density, urban
neighborhood.
Forested sites were selected from ‘‘reference’’ sites
previously used for stream restoration projects as well as
sites within Duke Forest. Lower Mud Creek and the
Tributary to Mud Creek are located in Duke Forest, in
Durham. Stony Creek is located in Duke Forest near
Hillsborough. Pot’s Branch is located in Umstead State
Park near Raleigh. Because of the land use history of the
North Carolina Piedmont, these are not pristine
reference sites, but rather post-agriculture reforested
streams with primarily forested watersheds; thus there
may be legacy effects of prior agricultural land use on
geomorphology, vegetation, sediment, and biota
(Maloney et al. 2008). There are no primary growth
forests of sufficient size to have a permanent stream,
INVITED FEATURE1934Ecological Applications
Vol. 21, No. 6
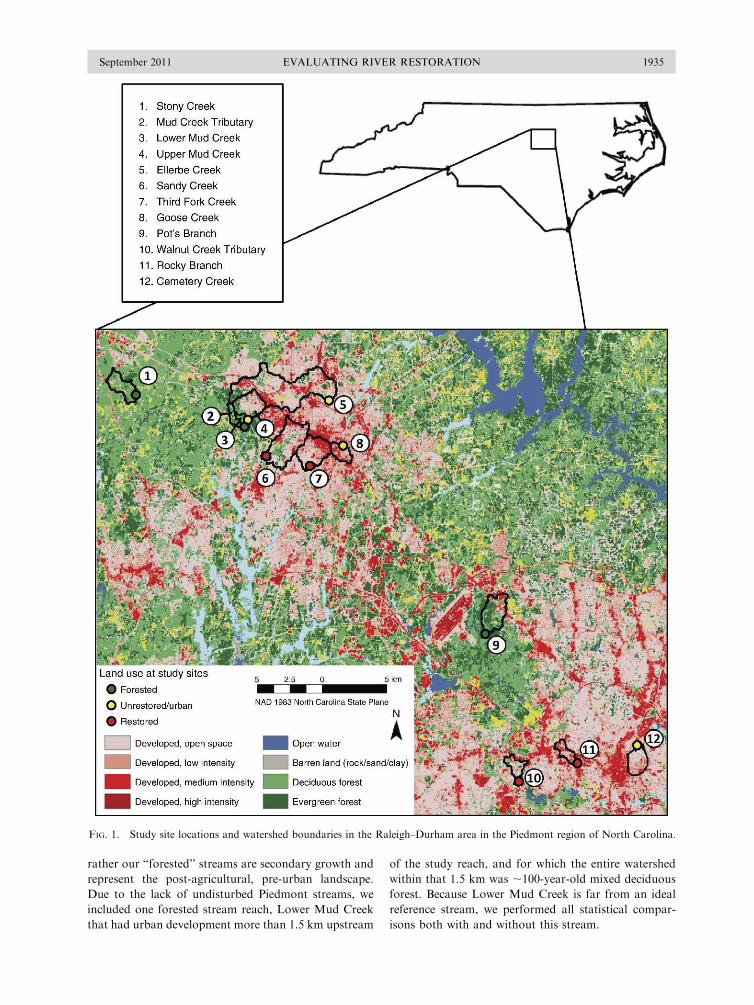
rather our ‘‘forested’’ streams are secondary growth and
represent the post-agricultural, pre-urban landscape.
Due to the lack of undisturbed Piedmont streams, we
included one forested stream reach, Lower Mud Creek
that had urban development more than 1.5 km upstream
of the study reach, and for which the entire watershed
within that 1.5 km was ;100-year-old mixed deciduous
forest. Because Lower Mud Creek is far from an ideal
reference stream, we performed all statistical compar-
isons both with and without this stream.
FIG. 1. Study site locations and watershed boundaries in the Raleigh–Durham area in the Piedmont region of North Carolina.
September 2011 1935EVALUATING RIVER RESTORATION
Land use characterization
We acquired the 1/3 arc-second (10 m) digital
elevation model for Durham, Orange, and Wake
counties in North Carolina from the USGS Seamless
Server and performed analysis using the ArcHydro
extension of ArcGIS (ESRI, Redlands, California,
USA) to calculate flow direction and flow accumulation,
and define streams based on a 1000-pixel threshold and
delineate watersheds for all sites. Land use and
impervious surface cover within study watersheds were
analyzed based on 2001 National Land Cover Dataset
(NLCD), and the associated Impervious Surface Cover
data set from the USGS Seamless Server (Homer et al.
2004). We classified riparian land use in a 30-m buffer
around each stream segment using the same technique.
NLCD was reclassified into four categories: developed,
agriculture, undeveloped, and water and for each
watershed we calculated the percentage of each land
use type and percentage of impervious surface cover.
The percentage of catchment developed and catchment
impervious cover (ISC) were used as predictor variables
in subsequent analyses.
Habitat surveys
In each stream, we delineated experimental reaches
encompassing at least one hour of travel time under
June 2006 base-flow conditions. We selected the up-
stream end of each reach by locating an area of
constricted flow with the greatest downstream extent
of channel uninterrupted by tributary inputs or road
crossings. Reach travel time was determined by calcu-
lating water travel times using a rhodamine dye release.
We used rhodamine tracers because traditional salt
tracers proved problematic in several of our urban
streams due to high spatial and temporal variation in
stream water chloride concentrations. Our study reaches
were standardized by water residence time and varied in
length from 35 to 200 m. We delineated our study
reaches in this manner in order to correctly measure
ecosystem function variables (see Sudduth et al. 2011).
Habitat surveys were performed in July and August of
2006. We created habitat maps (see Appendix B for
examples) of all experimental reaches by determining the
longitudinal boundaries and channel widths of riffle,
run, pool, and debris dam habitats within each reach
(Vermont Water Quality Division 2009). We used a
stadium rod and level to survey longitudinal slope for
the entire reach and to generate cross-sectional profiles
for five randomly selected points within the reach. Reach
canopy cover was measured at each cross section using a
spherical densiometer. We conducted pebble count
surveys of 100 randomly selected sediment particles
spaced evenly throughout the study reach (Wolman
1954) to estimate variation in sediment grain size within
each stream reach.
Hydrologic data
We created fine-scale flow-habitat maps by measuring
velocity and depth values at five evenly spaced points
across the active channel, with a sixth measurement in the
thalweg, at 30 cross-section locations evenly spaced
longitudinally in each reach. InOctober 2006, we deployed
Solinst leveloggers (Solinist Canada, Georgetown,
Ontario, Canada) in each stream reach to collect contin-
uousmeasurementsofwater level.WeusedHEC-RAS(US
ArmyCorps ofEngineers) to estimate dischargewater level
and surveyed channel dimensions (software available
online).7 We used these data to create a flashiness index
(Baker et al. 2004) for use as a predictive variable in
macroinvertebrate community analyses.
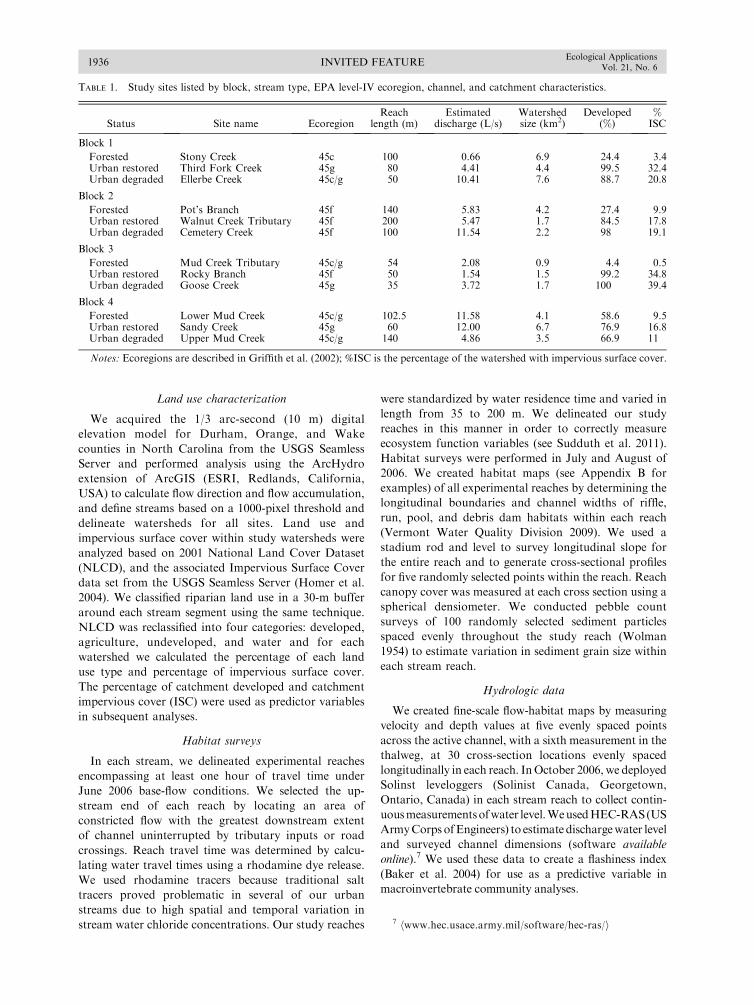
TABLE 1. Study sites listed by block, stream type, EPA level-IV ecoregion, channel, and catchment characteristics.
Status Site name EcoregionReach
length (m)Estimated
discharge (L/s)Watershedsize (km2)
Developed(%)
%ISC
Block 1
Forested Stony Creek 45c 100 0.66 6.9 24.4 3.4Urban restored Third Fork Creek 45g 80 4.41 4.4 99.5 32.4Urban degraded Ellerbe Creek 45c/g 50 10.41 7.6 88.7 20.8
Block 2
Forested Pot’s Branch 45f 140 5.83 4.2 27.4 9.9Urban restored Walnut Creek Tributary 45f 200 5.47 1.7 84.5 17.8Urban degraded Cemetery Creek 45f 100 11.54 2.2 98 19.1
Block 3
Forested Mud Creek Tributary 45c/g 54 2.08 0.9 4.4 0.5Urban restored Rocky Branch 45f 50 1.54 1.5 99.2 34.8Urban degraded Goose Creek 45g 35 3.72 1.7 100 39.4
Block 4
Forested Lower Mud Creek 45c/g 102.5 11.58 4.1 58.6 9.5Urban restored Sandy Creek 45g 60 12.00 6.7 76.9 16.8Urban degraded Upper Mud Creek 45c/g 140 4.86 3.5 66.9 11
Notes: Ecoregions are described in Griffith et al. (2002); %ISC is the percentage of the watershed with impervious surface cover.
7 hwww.hec.usace.army.mil/software/hec-ras/i
INVITED FEATURE1936Ecological Applications
Vol. 21, No. 6
Functional measures
Nutrient and organic matter dynamics were measured
concurrently in the same study reaches (for methods andresults, see Sudduth et al. 2011). Functional measureswere used as potential predictor variables in ordination
analyses.
Macroinvertebrate sampling
Macroinvertebrate sampling was conducted at the 12
study sites between May and September 2006 (‘‘sum-mer’’ sample) and February and March 2007 (‘‘winter’’
sample) from the same reach as physical and functionalmeasurements were taken. Macroinvertebrate commun-
ities were sampled once each season using the NorthCarolina Department of Water Quality Qual 4 semi-
quantitative protocol (North Carolina Division ofWater Quality 2006 [hereafter NC DWQ]). This
sampling protocol is designed to assess macroinverte-brate diversity in small streams (drainage area ,7.7
km2) and is conducted so that sampling effort isconsistent among study sites. Each sample consisted of
one 2–3 minute, 1-m2, 1-mm mesh, kick-net sample froma characteristic riffle; one 500-lm mesh triangular sweepnet of stream marginal habitats such as root mats and
bank vegetation; an approximately 500-g leaf packsample collected from rock or snag habitats; and visual
assessments of habitats not easily sampled with theabove methods (e.g., large rocks or logs). Samples were
field sorted and specimens were preserved in 95%
ethanol. Non-chironomid taxa were identified at 453
magnification to the lowest possible taxonomic level,typically species (Pennak 1953, Brigham et al. 1982,
Merritt et al. 2008). Chironomidae were mounted onslides in CMC-10 medium (Master’s Chemical
Company, Wood Dale, Illinois, USA), and identifiedat 4003 magnification to genus or species (Epler 2001).
Following the NC DWQ protocol, we classified taxa asabundant (.10 individuals), common (three to nine
individuals), or rare (one or two individuals). One of thewinter urban degraded samples, Goose Creek, was lost,
however field notes conclusively indicate the absence ofEphemeroptera, Plecoptera, and Trichoptera (EPT) taxa
in this sample. Thus, this sample was included in EPTrichness analyses.
Data analyses
Physical data analyses.—Habitat complexity was
determined by counting the number of transitionsbetween different aquatic habitats (riffle, run, pool,
and debris dam classifications) for each experimentalreach. The transition counts were normalized for all
reaches by converting the counts to number oftransitions per 100 m reach length. The average number
of transitions and standard error was determined foreach stream type (F, R, and U). Velocity and point
depth measurement averages for each reach werecalculated and used to obtain an average and coefficient
of variation for each stream type.
The ratio of active channel width to the active channel
depth at the thalweg was determined from the field survey
cross-section data for each experimental reach. Also, the
maximum (smallest width : depth ratio value for each
stream) and minimum (largest width : depth ratio value
for each stream) incision value from the field survey data
were calculated. The average and coefficient of variation
of percent canopy cover were determined from spherical
densiometer measurements. Physical metrics were com-
pared among stream types using one-way ANOVA with
stream type as a single factor (GraphPad Prism v4;
GraphPad Software Inc., La Jolla, California, USA).
Where the overall effect was significant, we performed
post hoc pairwise comparisons (Student-Newman-Keuls)
to test for differences among stream types and calculated
the magnitude of effect as x2, the variance component of
the factor in the ANOVA relative to the total variance
(Graham and Edwards 2001).
Macroinvertebrate data analyses.—In addition to total
species richness, we calculated richness of the orders
Ephemeroptera, Plecoptera, and Trichoptera, (EPT) as a
measure of pollution-sensitive taxa richness. We also
calculated the biotic index (BI) for each site as a measure
of overall macroinvertebrate community pollution
tolerance. BI was calculated as a weighted mean of taxa
tolerance values relative to their abundance, and higher
BI values indicate a more pollution-tolerant assemblage
(NC DWQ 2006). Individual taxon tolerance values
were taken from the NC DWQ benthos standard
operating protocol (Lenat 1993, NC DWQ 2006).
Taxa for which BI information was not available
represented a small minority of taxa and were excluded
from the BI calculations. We compared community
metrics among stream types using one-way analysis of
variance (ANOVA) with stream type as a factor. Where
the overall affect of stream type was significant, post-hoc
pairwise comparisons and effect size calculations were
performed as for physical metrics.
We used least-squares linear regression to quantify
correlative relationships between macroinvertebrate
metrics and environmental physical and functional
variables. As sites were grouped into sampling blocks
a priori according to watershed and geological variables,
all analyses should include sampling block as a variable.
However, as block was not found to be an important
predictor of any of our habitat or macroinvertebrate
community metrics (data not shown), it was not
included in our analyses in order to maximize our
power to detect differences among site types.
We examined seasonal macroinvertebrate species
compositional similarity among sites using nonmetric
multidimensional scaling (NMS) ordination of sites in
species space, using Bray-Curtis similarities of square
root transformed abundance values (PC-ORD v. 5;
McCune and Mefford 2006). Solutions were obtained
from 500 runs (250 randomized, 250 with real data)
using random starting coordinates. We created joint
plots incorporating a second matrix of physical and
September 2011 1937EVALUATING RIVER RESTORATION
functional variables. We set a minimum r2 of 0.30 toidentify geomorphological and functional parameters
correlated with macroinvertebrate community structureat different sites.
We assessed the importance of time since restorationto macroinvertebrate recovery by evaluating separatelycollected macroinvertebrate monitoring data from
Rocky Branch both within the restoration and at anunmanipulated upstream reference, and from Sal’s
Branch, a forested reference site in Umstead Park,North Carolina. Monitoring data were collected using
the same NC DWQ Qual-4 protocol as for this study.Pre-restoration samples were collected for Rocky
Branch in December 2000 and post-restoration datawere collected in December 2003, November 2004,December 2005, and December 2006. Reference data
were collected from Sal’s Branch in March 2002, March2003, and May 2004. We evaluated the importance of
time since restoration to total species richness, EPTrichness, and community BI for Rocky Branch. We
calculated the change in each community metric bysubtracting the pre-restoration value from the post-
restoration value for each monitoring year (DRest ¼Metricpost[yr i]�Metricpre). We accounted for commun-ity structure changes due to factors other than restora-
tion by performing the same calculation for theupstream reference (DUp ¼Metricup[yr i] � Metric up pre)
and then calculated the effect of restoration by takingthe difference of the two (Restoration Response¼ DRest
� DUp). This is similar to the ‘‘raw effect score’’ for taxonabundance calculations from impact assessment studies
(Weiss and Reice 2005), but applied to community-levelmetrics. We evaluated species compositional similarityamong these samples using the same NMS ordination
protocol as above.
RESULTS
To test our overarching hypothesis that positive
restoration outcomes would lead urban restored streamsto become more similar to minimally impacted sites, we
compared physical and biological attributes among the
three stream types. Excluding Lower Mud Creek did notchange the conclusions of any of our relationships of
physical metrics among stream types and there was noconsistent pattern in the effect of removing this site.However, in every case, removing Lower Mud Creek
from biological analyses increased the strength of theobserved relationship (Fig. 3), and for some analyses,
resulted in a stronger overall effect of stream type(Tables 3–4). For all analyses, we show comparisons
with and without Lower Mud Creek included as aforested site.
Habitat
Urban streams had significantly deeper channels,
smaller substrate sizes, and less reach-scale habitatvariation (transitions between riffles, runs, and pools)
than their forested counterpart (Table 2, Fig. 2). Foreach of these metrics, urban restored streams were
indistinguishable from their urban degraded counter-parts and significantly different from the forested
streams. We found a significant difference betweenurban degraded and urban restored reaches in only asingle habitat metric; restored urban streams had
significantly lower riparian canopy cover than theirunrestored counterparts.
Our hydrologic metrics did not differ between streamtypes. Stream velocities and flow heterogeneity were
highly variable within stream types. There was nodifference in either average or maximum degree of
incision among stream types (Table 2).
Biological structure
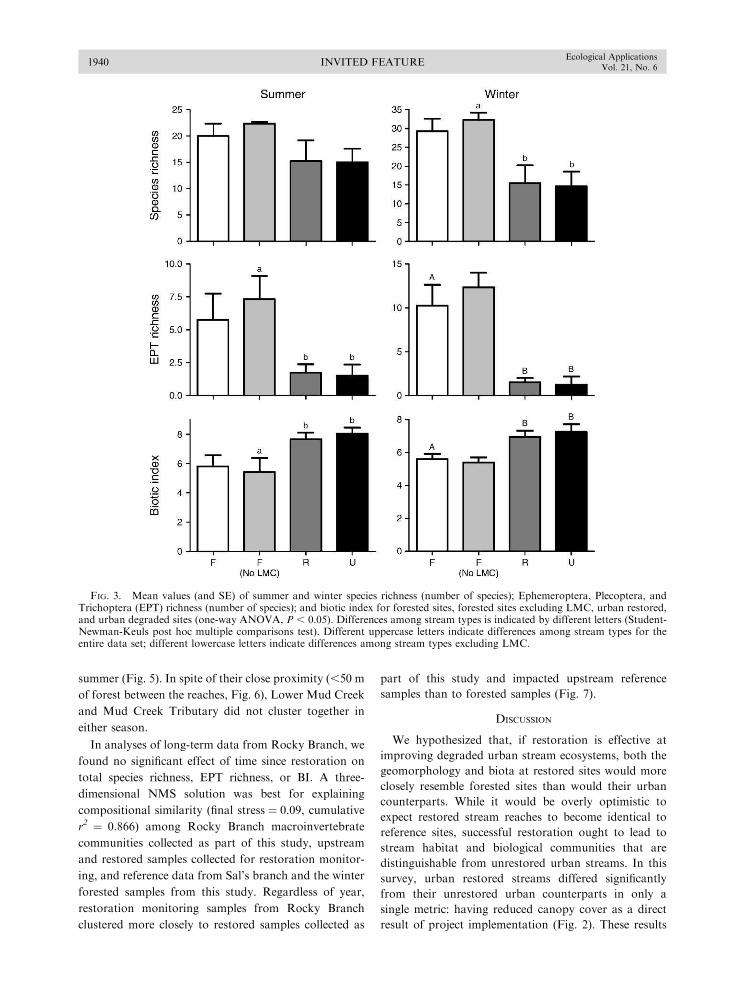
Macroinvertebrate community richness was similaracross stream types in summer, while in our winter
sampling our three forested sites (excluding LMC) hadsignificantly higher taxa richness than their restored or
urban counterparts (Table 3, Fig. 3). In both seasons,species of Chironomidae made up 56.6% (64.5% [mean
6 SE]) and 44.9% (6 2.6%) of the taxa found in urbanand restored streams respectively, and only 26.7% (6
5.0%) of the taxa in the forested streams (Appendix C).
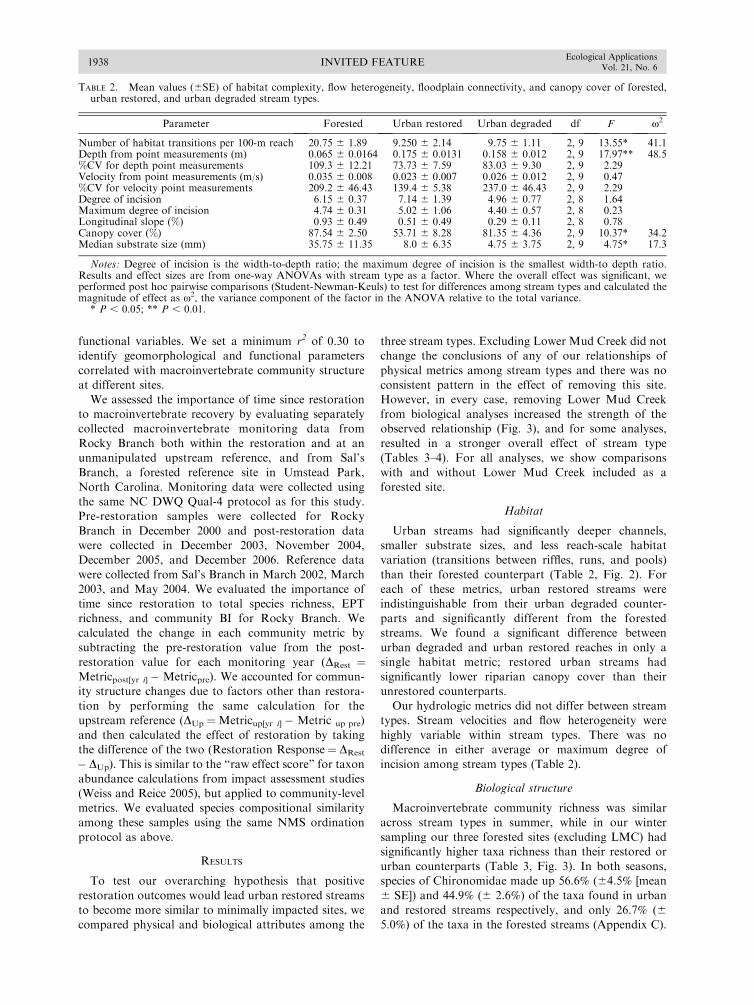
TABLE 2. Mean values (6SE) of habitat complexity, flow heterogeneity, floodplain connectivity, and canopy cover of forested,urban restored, and urban degraded stream types.
Parameter Forested Urban restored Urban degraded df F x2
Number of habitat transitions per 100-m reach 20.75 6 1.89 9.250 6 2.14 9.75 6 1.11 2, 9 13.55* 41.1Depth from point measurements (m) 0.065 6 0.0164 0.175 6 0.0131 0.158 6 0.012 2, 9 17.97** 48.5%CV for depth point measurements 109.3 6 12.21 73.73 6 7.59 83.03 6 9.30 2, 9 2.29Velocity from point measurements (m/s) 0.035 6 0.008 0.023 6 0.007 0.026 6 0.012 2, 9 0.47%CV for velocity point measurements 209.2 6 46.43 139.4 6 5.38 237.0 6 46.43 2, 9 2.29Degree of incision 6.15 6 0.37 7.14 6 1.39 4.96 6 0.77 2, 8 1.64Maximum degree of incision 4.74 6 0.31 5.02 6 1.06 4.40 6 0.57 2, 8 0.23Longitudinal slope (%) 0.93 6 0.49 0.51 6 0.49 0.29 6 0.11 2, 8 0.78Canopy cover (%) 87.54 6 2.50 53.71 6 8.28 81.35 6 4.36 2, 9 10.37* 34.2Median substrate size (mm) 35.75 6 11.35 8.0 6 6.35 4.75 6 3.75 2, 9 4.75* 17.3
Notes: Degree of incision is the width-to-depth ratio; the maximum degree of incision is the smallest width-to depth ratio.Results and effect sizes are from one-way ANOVAs with stream type as a factor. Where the overall effect was significant, weperformed post hoc pairwise comparisons (Student-Newman-Keuls) to test for differences among stream types and calculated themagnitude of effect as x2, the variance component of the factor in the ANOVA relative to the total variance.
* P , 0.05; ** P , 0.01.
INVITED FEATURE1938Ecological Applications
Vol. 21, No. 6
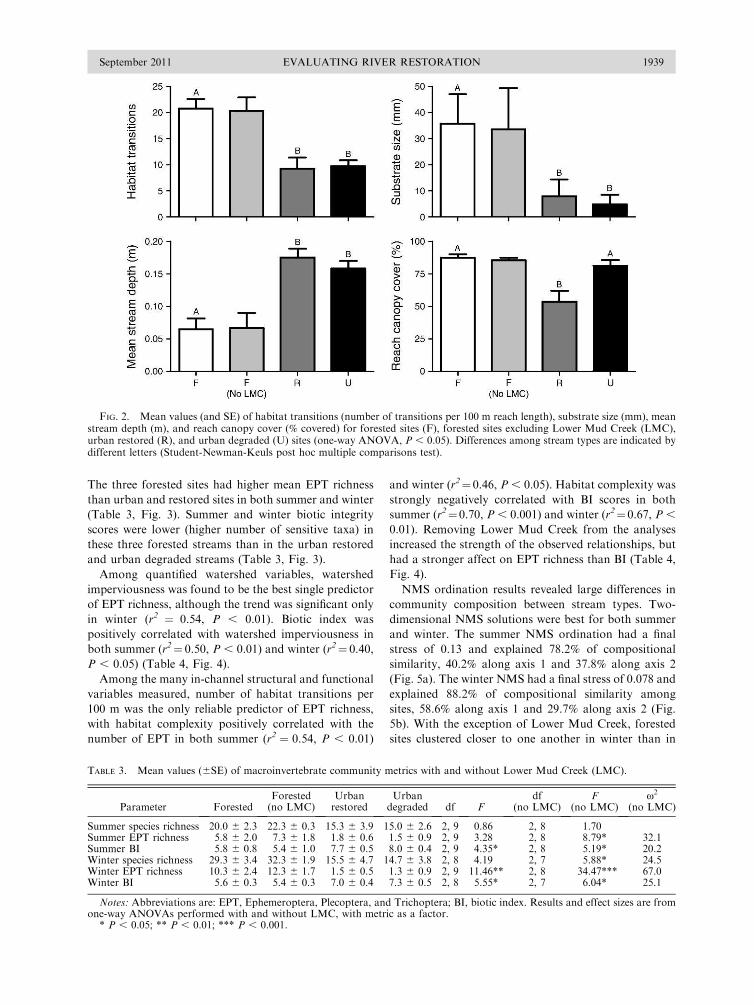
The three forested sites had higher mean EPT richness
than urban and restored sites in both summer and winter
(Table 3, Fig. 3). Summer and winter biotic integrity
scores were lower (higher number of sensitive taxa) in
these three forested streams than in the urban restored
and urban degraded streams (Table 3, Fig. 3).
Among quantified watershed variables, watershed
imperviousness was found to be the best single predictor
of EPT richness, although the trend was significant only
in winter (r2 ¼ 0.54, P , 0.01). Biotic index was
positively correlated with watershed imperviousness in
both summer (r2¼ 0.50, P , 0.01) and winter (r2¼ 0.40,
P , 0.05) (Table 4, Fig. 4).
Among the many in-channel structural and functional
variables measured, number of habitat transitions per
100 m was the only reliable predictor of EPT richness,
with habitat complexity positively correlated with the
number of EPT in both summer (r2 ¼ 0.54, P , 0.01)
and winter (r2¼ 0.46, P , 0.05). Habitat complexity was
strongly negatively correlated with BI scores in both
summer (r2¼ 0.70, P , 0.001) and winter (r2¼0.67, P ,
0.01). Removing Lower Mud Creek from the analyses
increased the strength of the observed relationships, but
had a stronger affect on EPT richness than BI (Table 4,
Fig. 4).
NMS ordination results revealed large differences in
community composition between stream types. Two-
dimensional NMS solutions were best for both summer
and winter. The summer NMS ordination had a final
stress of 0.13 and explained 78.2% of compositional
similarity, 40.2% along axis 1 and 37.8% along axis 2
(Fig. 5a). The winter NMS had a final stress of 0.078 and
explained 88.2% of compositional similarity among
sites, 58.6% along axis 1 and 29.7% along axis 2 (Fig.
5b). With the exception of Lower Mud Creek, forested
sites clustered closer to one another in winter than in
FIG. 2. Mean values (and SE) of habitat transitions (number of transitions per 100 m reach length), substrate size (mm), meanstream depth (m), and reach canopy cover (% covered) for forested sites (F), forested sites excluding Lower Mud Creek (LMC),urban restored (R), and urban degraded (U) sites (one-way ANOVA, P , 0.05). Differences among stream types are indicated bydifferent letters (Student-Newman-Keuls post hoc multiple comparisons test).
TABLE 3. Mean values (6SE) of macroinvertebrate community metrics with and without Lower Mud Creek (LMC).
Parameter ForestedForested(no LMC)
Urbanrestored
Urbandegraded df F
df(no LMC)
F(no LMC)
x2
(no LMC)
Summer species richness 20.0 6 2.3 22.3 6 0.3 15.3 6 3.9 15.0 6 2.6 2, 9 0.86 2, 8 1.70Summer EPT richness 5.8 6 2.0 7.3 6 1.8 1.8 6 0.6 1.5 6 0.9 2, 9 3.28 2, 8 8.79* 32.1Summer BI 5.8 6 0.8 5.4 6 1.0 7.7 6 0.5 8.0 6 0.4 2, 9 4.35* 2, 8 5.19* 20.2Winter species richness 29.3 6 3.4 32.3 6 1.9 15.5 6 4.7 14.7 6 3.8 2, 8 4.19 2, 7 5.88* 24.5Winter EPT richness 10.3 6 2.4 12.3 6 1.7 1.5 6 0.5 1.3 6 0.9 2, 9 11.46** 2, 8 34.47*** 67.0Winter BI 5.6 6 0.3 5.4 6 0.3 7.0 6 0.4 7.3 6 0.5 2, 8 5.55* 2, 7 6.04* 25.1
Notes: Abbreviations are: EPT, Ephemeroptera, Plecoptera, and Trichoptera; BI, biotic index. Results and effect sizes are fromone-way ANOVAs performed with and without LMC, with metric as a factor.
* P , 0.05; ** P , 0.01; *** P , 0.001.
September 2011 1939EVALUATING RIVER RESTORATION
summer (Fig. 5). In spite of their close proximity (,50 m
of forest between the reaches, Fig. 6), Lower Mud Creek
and Mud Creek Tributary did not cluster together in
either season.
In analyses of long-term data from Rocky Branch, we
found no significant effect of time since restoration on
total species richness, EPT richness, or BI. A three-
dimensional NMS solution was best for explaining
compositional similarity (final stress ¼ 0.09, cumulative
r2 ¼ 0.866) among Rocky Branch macroinvertebrate
communities collected as part of this study, upstream
and restored samples collected for restoration monitor-
ing, and reference data from Sal’s branch and the winter
forested samples from this study. Regardless of year,
restoration monitoring samples from Rocky Branch
clustered more closely to restored samples collected as
part of this study and impacted upstream reference
samples than to forested samples (Fig. 7).
DISCUSSION
We hypothesized that, if restoration is effective at
improving degraded urban stream ecosystems, both the
geomorphology and biota at restored sites would more
closely resemble forested sites than would their urban
counterparts. While it would be overly optimistic to
expect restored stream reaches to become identical to
reference sites, successful restoration ought to lead to
stream habitat and biological communities that are
distinguishable from unrestored urban streams. In this
survey, urban restored streams differed significantly
from their unrestored urban counterparts in only a
single metric: having reduced canopy cover as a direct
result of project implementation (Fig. 2). These results
FIG. 3. Mean values (and SE) of summer and winter species richness (number of species); Ephemeroptera, Plecoptera, andTrichoptera (EPT) richness (number of species); and biotic index for forested sites, forested sites excluding LMC, urban restored,and urban degraded sites (one-way ANOVA, P , 0.05). Differences among stream types is indicated by different letters (Student-Newman-Keuls post hoc multiple comparisons test). Different uppercase letters indicate differences among stream types for theentire data set; different lowercase letters indicate differences among stream types excluding LMC.
INVITED FEATURE1940Ecological Applications
Vol. 21, No. 6
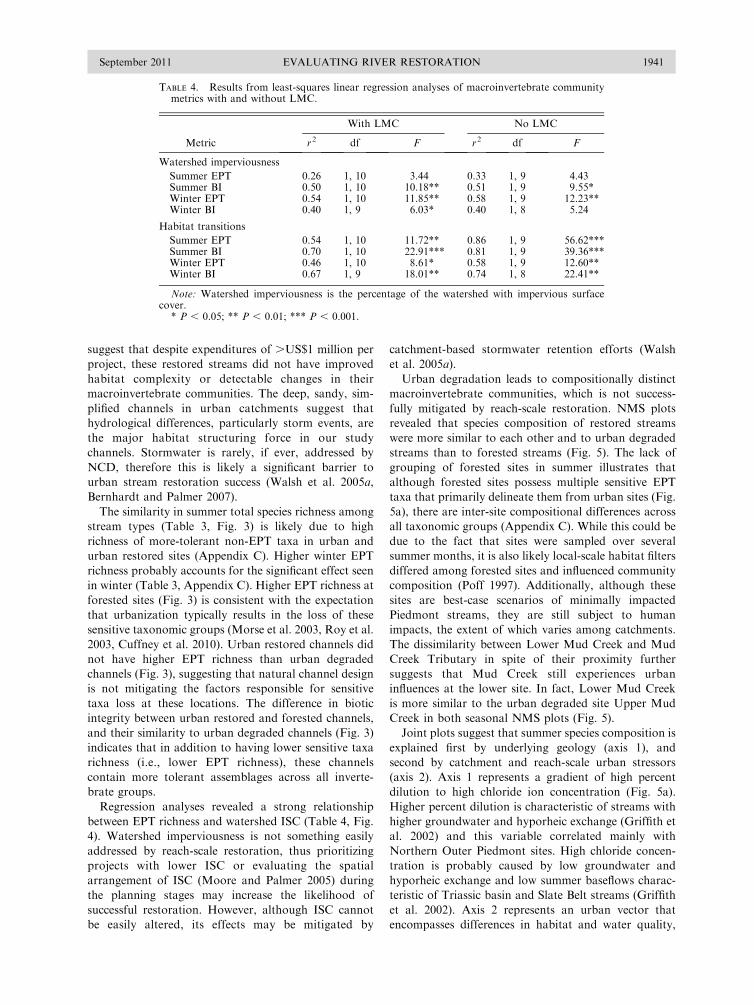
suggest that despite expenditures of .US$1 million per
project, these restored streams did not have improved
habitat complexity or detectable changes in their
macroinvertebrate communities. The deep, sandy, sim-
plified channels in urban catchments suggest that
hydrological differences, particularly storm events, are
the major habitat structuring force in our study
channels. Stormwater is rarely, if ever, addressed by
NCD, therefore this is likely a significant barrier to
urban stream restoration success (Walsh et al. 2005a,
Bernhardt and Palmer 2007).
The similarity in summer total species richness among
stream types (Table 3, Fig. 3) is likely due to high
richness of more-tolerant non-EPT taxa in urban and
urban restored sites (Appendix C). Higher winter EPT
richness probably accounts for the significant effect seen
in winter (Table 3, Appendix C). Higher EPT richness at
forested sites (Fig. 3) is consistent with the expectation
that urbanization typically results in the loss of these
sensitive taxonomic groups (Morse et al. 2003, Roy et al.
2003, Cuffney et al. 2010). Urban restored channels did
not have higher EPT richness than urban degraded
channels (Fig. 3), suggesting that natural channel design
is not mitigating the factors responsible for sensitive
taxa loss at these locations. The difference in biotic
integrity between urban restored and forested channels,
and their similarity to urban degraded channels (Fig. 3)
indicates that in addition to having lower sensitive taxa
richness (i.e., lower EPT richness), these channels
contain more tolerant assemblages across all inverte-
brate groups.
Regression analyses revealed a strong relationship
between EPT richness and watershed ISC (Table 4, Fig.
4). Watershed imperviousness is not something easily
addressed by reach-scale restoration, thus prioritizing
projects with lower ISC or evaluating the spatial
arrangement of ISC (Moore and Palmer 2005) during
the planning stages may increase the likelihood of
successful restoration. However, although ISC cannot
be easily altered, its effects may be mitigated by
catchment-based stormwater retention efforts (Walsh
et al. 2005a).
Urban degradation leads to compositionally distinct
macroinvertebrate communities, which is not success-
fully mitigated by reach-scale restoration. NMS plots
revealed that species composition of restored streams
were more similar to each other and to urban degraded
streams than to forested streams (Fig. 5). The lack of
grouping of forested sites in summer illustrates that
although forested sites possess multiple sensitive EPT
taxa that primarily delineate them from urban sites (Fig.
5a), there are inter-site compositional differences across
all taxonomic groups (Appendix C). While this could be
due to the fact that sites were sampled over several
summer months, it is also likely local-scale habitat filters
differed among forested sites and influenced community
composition (Poff 1997). Additionally, although these
sites are best-case scenarios of minimally impacted
Piedmont streams, they are still subject to human
impacts, the extent of which varies among catchments.
The dissimilarity between Lower Mud Creek and Mud
Creek Tributary in spite of their proximity further
suggests that Mud Creek still experiences urban
influences at the lower site. In fact, Lower Mud Creek
is more similar to the urban degraded site Upper Mud
Creek in both seasonal NMS plots (Fig. 5).
Joint plots suggest that summer species composition is
explained first by underlying geology (axis 1), and
second by catchment and reach-scale urban stressors
(axis 2). Axis 1 represents a gradient of high percent
dilution to high chloride ion concentration (Fig. 5a).
Higher percent dilution is characteristic of streams with
higher groundwater and hyporheic exchange (Griffith et
al. 2002) and this variable correlated mainly with
Northern Outer Piedmont sites. High chloride concen-
tration is probably caused by low groundwater and
hyporheic exchange and low summer baseflows charac-
teristic of Triassic basin and Slate Belt streams (Griffith
et al. 2002). Axis 2 represents an urban vector that
encompasses differences in habitat and water quality,
TABLE 4. Results from least-squares linear regression analyses of macroinvertebrate communitymetrics with and without LMC.
Metric
With LMC No LMC
r2 df F r2 df F
Watershed imperviousness
Summer EPT 0.26 1, 10 3.44 0.33 1, 9 4.43Summer BI 0.50 1, 10 10.18** 0.51 1, 9 9.55*Winter EPT 0.54 1, 10 11.85** 0.58 1, 9 12.23**Winter BI 0.40 1, 9 6.03* 0.40 1, 8 5.24
Habitat transitions
Summer EPT 0.54 1, 10 11.72** 0.86 1, 9 56.62***Summer BI 0.70 1, 10 22.91*** 0.81 1, 9 39.36***Winter EPT 0.46 1, 10 8.61* 0.58 1, 9 12.60**Winter BI 0.67 1, 9 18.01** 0.74 1, 8 22.41**
Note: Watershed imperviousness is the percentage of the watershed with impervious surfacecover.
* P , 0.05; ** P , 0.01; *** P , 0.001.
September 2011 1941EVALUATING RIVER RESTORATION
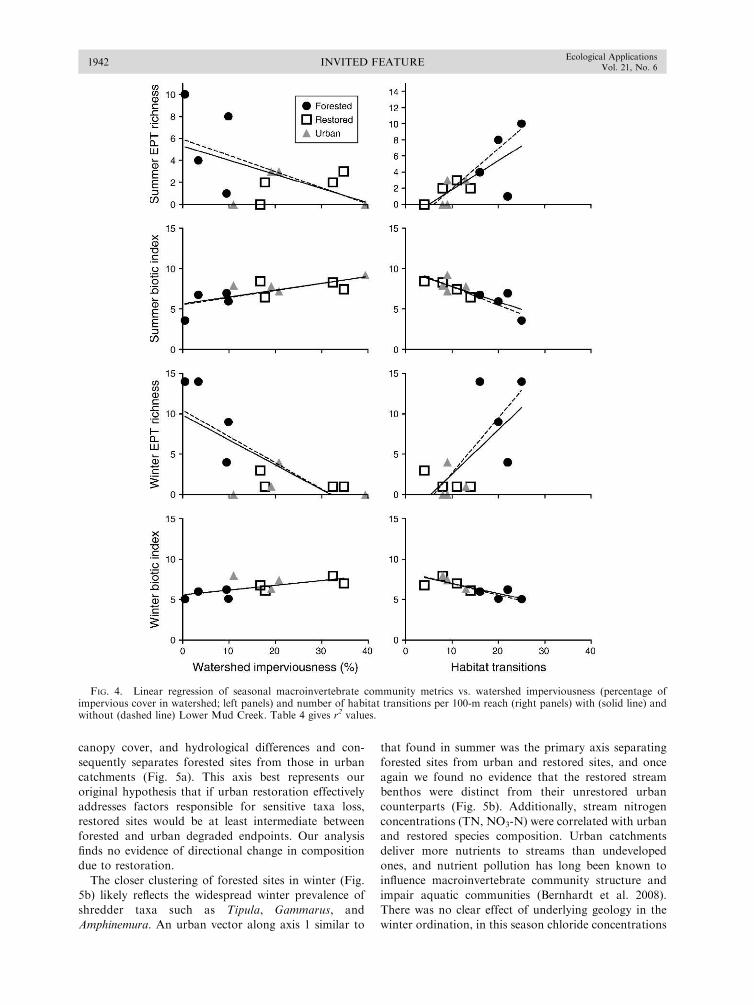
canopy cover, and hydrological differences and con-
sequently separates forested sites from those in urban
catchments (Fig. 5a). This axis best represents our
original hypothesis that if urban restoration effectively
addresses factors responsible for sensitive taxa loss,
restored sites would be at least intermediate between
forested and urban degraded endpoints. Our analysis
finds no evidence of directional change in composition
due to restoration.
The closer clustering of forested sites in winter (Fig.
5b) likely reflects the widespread winter prevalence of
shredder taxa such as Tipula, Gammarus, and
Amphinemura. An urban vector along axis 1 similar to
that found in summer was the primary axis separating
forested sites from urban and restored sites, and once
again we found no evidence that the restored stream
benthos were distinct from their unrestored urban
counterparts (Fig. 5b). Additionally, stream nitrogen
concentrations (TN, NO3-N) were correlated with urban
and restored species composition. Urban catchments
deliver more nutrients to streams than undeveloped
ones, and nutrient pollution has long been known to
influence macroinvertebrate community structure and
impair aquatic communities (Bernhardt et al. 2008).
There was no clear effect of underlying geology in the
winter ordination, in this season chloride concentrations
FIG. 4. Linear regression of seasonal macroinvertebrate community metrics vs. watershed imperviousness (percentage ofimpervious cover in watershed; left panels) and number of habitat transitions per 100-m reach (right panels) with (solid line) andwithout (dashed line) Lower Mud Creek. Table 4 gives r2 values.
INVITED FEATURE1942Ecological Applications
Vol. 21, No. 6

FIG. 5. Two-dimensional joint plots of nonmetric multidimensional scaling (NMS) ordination of (a) summer and (b) wintersquare-root transformed Bray-Curtis similarities with environmental variables. Minimum explanatory r2 for environmentalvariables ¼ 0.3. Final stress ¼ 0.13 for summer and 0.078 for winter. Cumulative r2 ¼ 0.782 and 0.882 for summer and winter,respectively. Site abbreviations are: AB, Walnut Creek Tributary; CEM, Cemetery Creek; FH, Forest Hills; GSE, Goose Creek;LMC, Lower Mud Creek; MCT, Mud Creek Tributary; NGP, Ellerbe Creek; POT, Pot’s Branch; SAN, Sandy Creek; STO, StonyCreek; UMC, Upper Mud Creek. Environmental variable abbreviations (followed by the units in which they were measured) are:Hab trans, habitat transitions; %CV PD, percent coefficient of variation of point depth; Ave canopy, average canopy cover; Cl�,chloride concentration (ppm); NH4-N, ammonium-N concentration (ppm); Ave depth, average water depth (m); DON, dissolvedorganic nitrogen concentration (ppm); %ISC, percentage of watershed with impervious surface cover; %WS Dev, percentage ofwatershed developed; Point depth, stream point depth (m); %Riparian ISC, percent riparian buffer impervious surface cover; %CVCanopy, percent coefficient of variation of canopy cover; GPP, gross primary production (g�m�1�d�1); NO3-N, nitrate-Nconcentration (ppm); TN, total nitrogen (ppm); DD, degree days; Ave temp, average stream temp (8C); d50, median particle size(mm); DOM C:N, dissolved organic matter C:N.
September 2011 1943EVALUATING RIVER RESTORATION
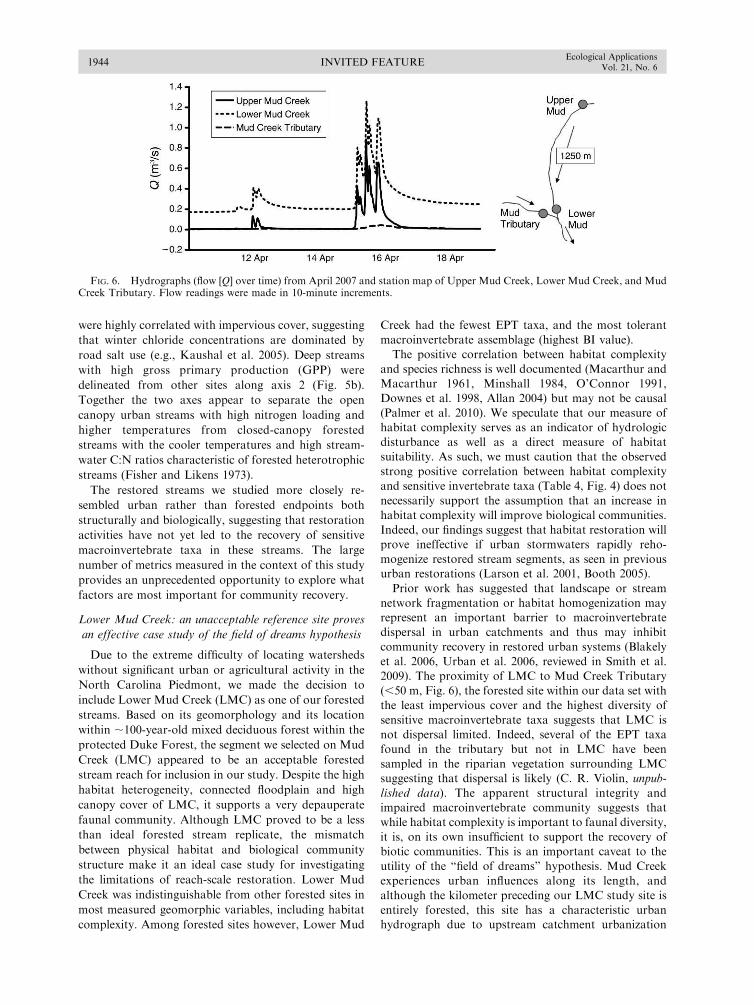
were highly correlated with impervious cover, suggesting
that winter chloride concentrations are dominated by
road salt use (e.g., Kaushal et al. 2005). Deep streams
with high gross primary production (GPP) were
delineated from other sites along axis 2 (Fig. 5b).
Together the two axes appear to separate the open
canopy urban streams with high nitrogen loading and
higher temperatures from closed-canopy forested
streams with the cooler temperatures and high stream-
water C:N ratios characteristic of forested heterotrophic
streams (Fisher and Likens 1973).
The restored streams we studied more closely re-
sembled urban rather than forested endpoints both
structurally and biologically, suggesting that restoration
activities have not yet led to the recovery of sensitive
macroinvertebrate taxa in these streams. The large
number of metrics measured in the context of this study
provides an unprecedented opportunity to explore what
factors are most important for community recovery.
Lower Mud Creek: an unacceptable reference site proves
an effective case study of the field of dreams hypothesis
Due to the extreme difficulty of locating watersheds
without significant urban or agricultural activity in the
North Carolina Piedmont, we made the decision to
include Lower Mud Creek (LMC) as one of our forested
streams. Based on its geomorphology and its location
within ;100-year-old mixed deciduous forest within the
protected Duke Forest, the segment we selected on Mud
Creek (LMC) appeared to be an acceptable forested
stream reach for inclusion in our study. Despite the high
habitat heterogeneity, connected floodplain and high
canopy cover of LMC, it supports a very depauperate
faunal community. Although LMC proved to be a less
than ideal forested stream replicate, the mismatch
between physical habitat and biological community
structure make it an ideal case study for investigating
the limitations of reach-scale restoration. Lower Mud
Creek was indistinguishable from other forested sites in
most measured geomorphic variables, including habitat
complexity. Among forested sites however, Lower Mud
Creek had the fewest EPT taxa, and the most tolerant
macroinvertebrate assemblage (highest BI value).
The positive correlation between habitat complexity
and species richness is well documented (Macarthur and
Macarthur 1961, Minshall 1984, O’Connor 1991,
Downes et al. 1998, Allan 2004) but may not be causal
(Palmer et al. 2010). We speculate that our measure ofhabitat complexity serves as an indicator of hydrologic
disturbance as well as a direct measure of habitat
suitability. As such, we must caution that the observed
strong positive correlation between habitat complexity
and sensitive invertebrate taxa (Table 4, Fig. 4) does not
necessarily support the assumption that an increase in
habitat complexity will improve biological communities.
Indeed, our findings suggest that habitat restoration will
prove ineffective if urban stormwaters rapidly reho-
mogenize restored stream segments, as seen in previousurban restorations (Larson et al. 2001, Booth 2005).
Prior work has suggested that landscape or stream
network fragmentation or habitat homogenization mayrepresent an important barrier to macroinvertebrate
dispersal in urban catchments and thus may inhibit
community recovery in restored urban systems (Blakely
et al. 2006, Urban et al. 2006, reviewed in Smith et al.
2009). The proximity of LMC to Mud Creek Tributary
(,50 m, Fig. 6), the forested site within our data set with
the least impervious cover and the highest diversity of
sensitive macroinvertebrate taxa suggests that LMC is
not dispersal limited. Indeed, several of the EPT taxa
found in the tributary but not in LMC have been
sampled in the riparian vegetation surrounding LMCsuggesting that dispersal is likely (C. R. Violin, unpub-
lished data). The apparent structural integrity and
impaired macroinvertebrate community suggests that
while habitat complexity is important to faunal diversity,
it is, on its own insufficient to support the recovery of
biotic communities. This is an important caveat to the
utility of the ‘‘field of dreams’’ hypothesis. Mud Creek
experiences urban influences along its length, and
although the kilometer preceding our LMC study site is
entirely forested, this site has a characteristic urbanhydrograph due to upstream catchment urbanization
FIG. 6. Hydrographs (flow [Q] over time) from April 2007 and station map of Upper Mud Creek, Lower Mud Creek, and MudCreek Tributary. Flow readings were made in 10-minute increments.
INVITED FEATURE1944Ecological Applications
Vol. 21, No. 6
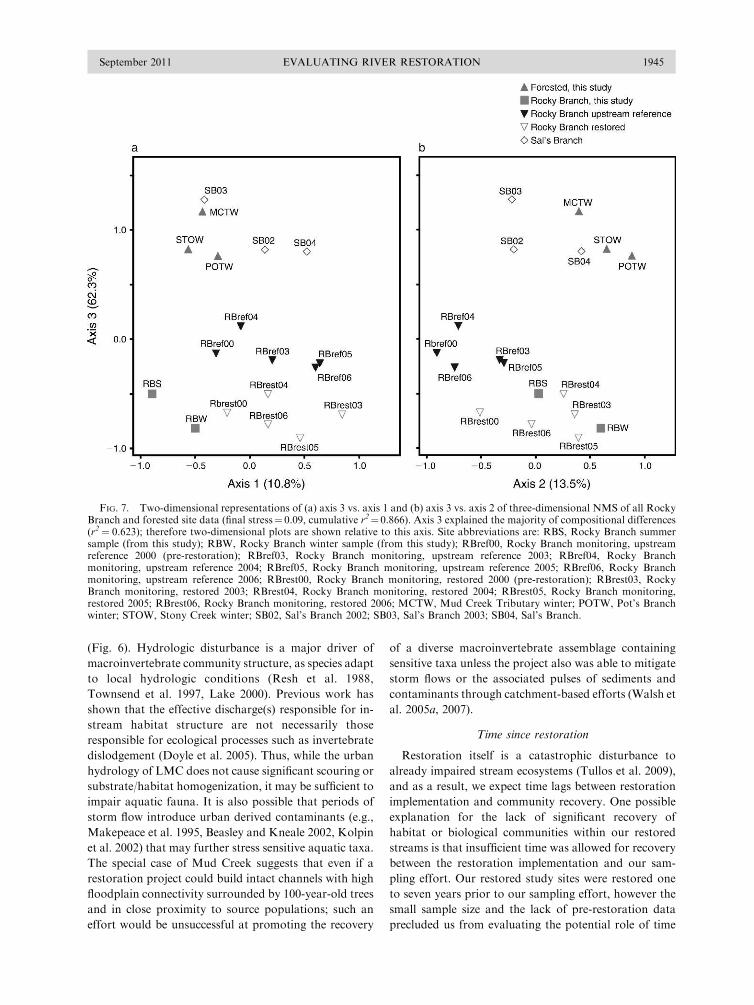
(Fig. 6). Hydrologic disturbance is a major driver of
macroinvertebrate community structure, as species adapt
to local hydrologic conditions (Resh et al. 1988,
Townsend et al. 1997, Lake 2000). Previous work has
shown that the effective discharge(s) responsible for in-
stream habitat structure are not necessarily those
responsible for ecological processes such as invertebrate
dislodgement (Doyle et al. 2005). Thus, while the urban
hydrology of LMC does not cause significant scouring or
substrate/habitat homogenization, it may be sufficient to
impair aquatic fauna. It is also possible that periods of
storm flow introduce urban derived contaminants (e.g.,
Makepeace et al. 1995, Beasley and Kneale 2002, Kolpin
et al. 2002) that may further stress sensitive aquatic taxa.
The special case of Mud Creek suggests that even if a
restoration project could build intact channels with high
floodplain connectivity surrounded by 100-year-old trees
and in close proximity to source populations; such an
effort would be unsuccessful at promoting the recovery
of a diverse macroinvertebrate assemblage containing
sensitive taxa unless the project also was able to mitigate
storm flows or the associated pulses of sediments and
contaminants through catchment-based efforts (Walsh et
al. 2005a, 2007).
Time since restoration
Restoration itself is a catastrophic disturbance to
already impaired stream ecosystems (Tullos et al. 2009),
and as a result, we expect time lags between restoration
implementation and community recovery. One possible
explanation for the lack of significant recovery of
habitat or biological communities within our restored
streams is that insufficient time was allowed for recovery
between the restoration implementation and our sam-
pling effort. Our restored study sites were restored one
to seven years prior to our sampling effort, however the
small sample size and the lack of pre-restoration data
precluded us from evaluating the potential role of time
FIG. 7. Two-dimensional representations of (a) axis 3 vs. axis 1 and (b) axis 3 vs. axis 2 of three-dimensional NMS of all RockyBranch and forested site data (final stress¼ 0.09, cumulative r2¼ 0.866). Axis 3 explained the majority of compositional differences(r2¼ 0.623); therefore two-dimensional plots are shown relative to this axis. Site abbreviations are: RBS, Rocky Branch summersample (from this study); RBW, Rocky Branch winter sample (from this study); RBref00, Rocky Branch monitoring, upstreamreference 2000 (pre-restoration); RBref03, Rocky Branch monitoring, upstream reference 2003; RBref04, Rocky Branchmonitoring, upstream reference 2004; RBref05, Rocky Branch monitoring, upstream reference 2005; RBref06, Rocky Branchmonitoring, upstream reference 2006; RBrest00, Rocky Branch monitoring, restored 2000 (pre-restoration); RBrest03, RockyBranch monitoring, restored 2003; RBrest04, Rocky Branch monitoring, restored 2004; RBrest05, Rocky Branch monitoring,restored 2005; RBrest06, Rocky Branch monitoring, restored 2006; MCTW, Mud Creek Tributary winter; POTW, Pot’s Branchwinter; STOW, Stony Creek winter; SB02, Sal’s Branch 2002; SB03, Sal’s Branch 2003; SB04, Sal’s Branch.
September 2011 1945EVALUATING RIVER RESTORATION
lags in our initial data set. To address this question, we
were able to examine long-term data from one of our
study sites (Rocky Branch, Raleigh, North Carolina).
For this data set we found no significant effect of time
since restoration on total species richness, EPT species
richness, or biotic index for the five-year post-restora-
tion monitoring period. Three-dimensional NMS ordi-
nation of long term monitoring data for the restored
reach of Rocky Branch revealed that macroinvertebrate
communities from the restored reach of Rocky Branch
remained similar in composition to the unrestored
upstream urban reach during the five years of post
restoration monitoring and remained consistently differ-
ent from benthic communities in the closest reference
stream Sal’s Branch (a tributary to Pot’s Branch) (Fig.
7). Thus, long-term monitoring of Rocky Branch further
supports the conclusions of our synoptic sampling
effort, with no evidence of directional change in restored
stream reaches either away from the pre-restoration
composition or toward reference stream conditions. All
available evidence suggests that merely waiting longer
prior to evaluating a restoration project is unlikely to
lead to different conclusions.
CONCLUSIONS
Our results demonstrate the limited utility of reach-
scale restoration to combat the overwhelming effects of
watershed urbanization. Within this study, the only
demonstrable effect of restoration activities was to
remove riparian trees, a practice that may impede
recovery. In our study, restoration failed to improve
habitat over impaired urban channels, suggesting that
watershed level hydrologic processes are degrading
restoration efforts. Expanding urban restoration plan-
ning beyond the reach scale to include watershed-scale
impacts will lead to better restoration design and more
positive restoration outcomes.
ACKNOWLEDGMENTS
The authors thank N. Lesios, D. Golterman, I. Warren, andR. Jackson for help in both the field and the lab. We also thankstaff of the North Carolina Ecosystem Enhancement Programand of the North Carolina Stream Restoration Institute(particularly Mac Haupt and Greg Jennings) for their assistancewith site selection. We also thank staff of the Duke Forest andUmstead State park for providing us with access to referencesites. This paper benefited greatly from comments by S. Reice,L. D’Anna, M. Ardon, J. Morse, and two anonymousreviewers. This research was supported by funds from NSFDEB 0546251, the North Carolina Water Resources ResearchInstitute, the NC Department of Natural Resources, theUniversity of North Carolina Center for the Study of theAmerican South, and the John and Lucile Packard Foundation.
LITERATURE CITED
Allan, J. D. 2004. Landscapes and riverscapes: the influence ofland use on stream ecosystems. Annual Review of Ecology,Evolution, and Systematics 35:257–284.
Angermeier, P. L., and M. R. Winston. 1998. Local vs. regionalinfluences on local diversity in stream fish communities ofVirginia. Ecology 79:911–927.
Baker, D. B., R. P. Richards, T. T. Loftus, and J. W. Kramer.2004. A new flashiness index: characteristics and applicationsto midwestern rivers and streams. Journal of the AmericanWater Resources Association 40:503–522.
Beasley, G., and P. Kneale. 2002. Reviewing the impact ofmetals and PAHs on macroinvertebrates in urban water-courses. Progress in Physical Geography 26:236–270.
Bernhardt, E. S., L. E. Band, C. J. Walsh, and P. E. Berke.2008. Understanding, managing, and minimizing urbanimpacts on surface water nitrogen loading. Annals of theNew York Academy of Sciences 1134:61–96.
Bernhardt, E. S., and M. A. Palmer. 2007. Restoring streams inan urbanizing world. Freshwater Biology 52:738–751.
Bernhardt, E. S., et al. 2005. Ecology—synthesizing US riverrestoration efforts. Science 308:636–637.
Bernhardt, E. S., E. B. Sudduth, M. A. Palmer, J. D. Allan,J. L. Meyer, G. Alexander, J. Follastad-Shah, B. Hassett, R.Jenkinson, R. Lave, J. Rumps, and L. Pagano. 2007.Restoring rivers one reach at a time: results from a surveyof US river restoration practitioners. Restoration Ecology15:482–493.
Blair, R. B. 1996. Land use and avian species diversity along anurban gradient. Ecological Applications 6:506–519.
Blakely, T. J., J. S. Harding, A. R. McIntosh, and M. J.Winterbourn. 2006. Barriers to the recovery of aquatic insectcommunities in urban streams. Freshwater Biology 51:1634–1645.
Booth, D. B. 2005. Challenges and prospects for restoringurban streams: a perspective from the Pacific Northwest ofNorth America. Journal of the North AmericanBenthological Society 24:724–737.
Booth, D. B., and C. R. Jackson. 1997. Urbanization of aquaticsystems: degradation thresholds, stormwater detection, andthe limits of mitigation. Journal of the American WaterResources Association 33:1077–1090.
Brigham, A. R., W. U. Brigham, and A. Gnilka. 1982. Aquaticinsects and oligochaetes of North and South Carolina.Midwest Aquatic Enterprises, Mahomet, Illinois, USA.
Brooks, S. S., M. A. Palmer, B. J. Cardinale, C. M. Swan, andS. Ribblett. 2002. Assessing stream ecosystem rehabilitation:limitations of community structure data. RestorationEcology 10:156–168.
Brown, B. L. 2003. Spatial heterogeneity reduces temporalvariability in stream insect communities. Ecology Letters6:316–325.
Charbonneau, R., and V. H. Resh. 1992. Strawberry Creek onthe University of California, Berkeley campus—a casehistory of urban stream restoration. Aquatic Conserva-tion—Marine and Freshwater Ecosystems 2:293–307.
Clark, P., J. Reed, and F. Chew. 2007. Effects of urbanizationon butterfly species richness, guild structure, and rarity.Urban Ecosystems 10:321–337.
Collier, K. J., B. M. T. A. Aldridge, B. J. Hicks, J. Kelly, A.Macdonald, B. J. Smith, and J. Tonkin. 2009. Ecologicalvalues of Hamilton urban streams (North Island, NewZealand): constraints and opportunities for restoration.New Zealand Journal of Ecology 33:177–189.
Cuffney, T. F., R. A. Brightbill, J. T. May, and I. R. Waite.2010. Responses of benthic macroinvertebrates to environ-mental changes associated with urbanization in nine metro-politan areas. Ecological Applications 20:1384–1401.
Doll, B. 2003. Stabilization of Rocky Branch Creek foreducational demonstration. Final Report to North CarolinaDepartment of Environmental and Natural Resources EPA319 Funding, DWQ Project #EW9015. North CarolinaDepartment of Environmental and Natural Resources,Raleigh, North Carolina, USA.
Downes, B. J., P. S. Lake, E. S. G. Schreiber, and A. Glaister.1998. Habitat structure and regulation of local species
INVITED FEATURE1946Ecological Applications
Vol. 21, No. 6
diversity in a stony, upland stream. Ecological Monographs68:237–257.
Doyle, M. W., E. H. Stanley, D. L. Strayer, R. B. Jacobson,and J. C. Schmidt. 2005. Effective discharge analysis ofecological processes in streams. Water Resources Research41:W11411.
Epler, J. H. 2001. Identification manual for the larvalChironomidae (Diptera) of North and South Carolina: aguide to the taxonomy of the midges of the southeasternUnited States, including Florida. North CarolinaDepartment of Environmental and Natural Resources, St.John’s River Water Management District, Raleigh NorthCarolina, USA.
Federal Interagency Stream Restoration Working Group. 1998.Streamcorridor restoration: principles, processes, andpractices.Federal Interagency StreamRestorationWorkingGroup.GOPItem No. 0120-A; SuDocs No. A 57.6/2:EN 3/PT.653. hhttp://www.nrcs.usda.gov/technical/stream_restoration/i
Fisher, S. G., and G. E. Likens. 1973. Energy flow in BearBrook, New Hampshire: integrative approach to streamecosystem metabolism. Ecological Monographs 43:421–439.
Germaine, S. S., and B. F. Wakeling. 2001. Lizard speciesdistributions and habitat occupation along an urban gradientin Tucson, Arizona, USA. Biological Conservation 97:229–237.
Gorman, O. T., and J. R. Karr. 1978. Habitat structure andstream fish communities. Ecology 59:507–515.
Graham, M. H., and M. S. Edwards. 2001. Statisticalsignificance versus fit: estimating the importance of individ-ual factors in ecological analysis of variance. Oikos 93:505–513.
Griffith, G., J. Omernik, and J. Comstock. 2002. Ecoregions ofNorth Carolina regional descriptions. U.S. EnvironmentalProtection Agency, Corvallis, Oregon, USA.
Grimm, N. B., S. H. Faeth, N. E. Golubiewski, C. L. Redman,J. Wu, X. Bai, and J. M. Briggs. 2008. Global change and theecology of cities. Science 319:756–760.
Grimm, N. B., R. W. Sheibley, C. L. Crenshaw, C. N. Dahm,W. J. Roach, and L. H. Zeglin. 2005. N retention andtransformation in urban streams. Journal of the NorthAmerican Benthological Society 24:626–642.
Groffman, P. M., and M. K. Crawford. 2003. Denitrificationpotential in urban riparian zones. Journal of EnvironmentalQuality 32:1144–1149.
Hassett, B., M. Palmer, E. Bernhardt, S. Smith, J. Carr, and D.Hart. 2005. Restoring watersheds project by project: trends inChesapeake Bay tributary restoration. Frontiers in Ecologyand the Environment 3:259–267.
Homer, C., C. Q. Huang, L. M. Yang, B. Wylie, and M. Coan.2004. Development of a 2001 National Land-Cover Databasefor the United States. Photogrammetric Engineering andRemote Sensing 70:829–840.
Kaushal, S. S., P. M. Groffman, G. E. Likens, K. T. Belt, W. P.Stack, V. R. Kelly, L. E. Band, and G. T. Fisher. 2005.Increased salinization of fresh water in the northeasternUnited States. Proceedings of the National Academy ofSciences USA 102:13517–13520.
KCI Associates. 2003. Stream restoration plan: Third ForkCreek in Forest Hills Park, Durham, NC. North CarolinaWetlands Restoration Program, North Carolina Departmentof Environment and Natural Resources, Raleigh, NorthCarolina, USA.
Kolpin, D. W., E. T. Furlong, M. T. Meyer, E. M. Thurman,S. D. Zaugg, L. B. Barber, and H. T. Buxton. 2002.Pharmaceuticals, hormones, and other organic wastewatercontaminants in U.S. Streams, 1999–2000: a nationalreconnaissance. Environmental Science and Technology36:1202–1211.
Lake, P. S. 2000. Disturbance, patchiness, and diversity instreams. Journal of the North American BenthologicalSociety 19:573–592.
Larson, M. G., D. B. Booth, and S. A. Morely. 2001.Effectiveness of large woody debris in stream rehabilitationprojects in urban basins. Ecological Engineering 18:211–226.
Lenat, D. R. 1993. A biotic index for the southeastern UnitedStates: derivation and list of tolerance values, with criteria forassigning water quality rankings. Journal of the NorthAmerican Benthological Society 12:279–290.
Lenat, D. R., and J. K. Crawford. 1994. Effects of land use onwater quality and aquatic biota of 3 North CarolinaPiedmont streams. Hydrobiologia 294:185–199.
Macarthur, R., and J. W. Macarthur. 1961. On bird speciesdiversity. Ecology 42:594–598.
Makepeace, D. K., D. W. Smith, and S. J. Stanley. 1995. Urbanstormwater quality: summary of contaminant data. CriticalReviews in Environmental Science and Technology 25:91–139.
Malmqvist, B., and S. Rundle. 2002. Threats to the runningwater ecosystems of the world. Environmental Conservation29:134–135.
Maloney, K. O., J. W. Feminella, R. M. Mitchell, S. A. Miller,P. J. Mulholland, and J. N. Houser. 2008. Landuse legaciesand small streams: identifying relationships between histor-ical land use and contemporary stream conditions. Journal ofthe North American Benthological Society 27:280–294.
McCune, B., and M. J. Mefford. 2006. PC-ORD. Multivariateanalysis of ecological data. Version 5. MjM Software,Gleneden Beach, Oregon, USA.
McKinney, M. 2008. Effects of urbanization on speciesrichness: a review of plants and animals. Urban Ecosystems11:161–176.
Merritt, R. W., K. W. Cummins, and M. B. Berg. 2008. Anintroduction to the aquatic insects of North America. Fourthedition. Kendall/Hunt, Dubuque, Iowa, USA.
Meyer, J. L., M. J. Paul, and W. K. Taulbee. 2005. Streamecosystem function in urbanizing landscapes. Journal of theNorth American Benthological Society 24:602–612.
Minshall, G. W. 1984. Aquatic insect–substratum relationships.Pages 358–400 in V. H. Resh and D. M. Rosenberg, editors.The ecology of aquatic insects. Praeger, New York, NewYork, USA.
Moerke, A. H., K. J. Gerard, J. A. Latimore, R. A. Hellenthal,and G. A. Lamberti. 2004. Restoration of an Indiana, USA,stream: bridging the gap between basic and applied loticecology. Journal of the North American BenthologicalSociety 23:647–660.
Moerke, A. H., and G. A. Lamberti. 2004. Restoring streamecosystems: lessons from a midwestern state. RestorationEcology 12:327–334.
Moore, A. A., and M. A. Palmer. 2005. Invertebratebiodiversity in agricultural and urban headwater streams:implications for conservation and management. EcologicalApplications 15:1169–1177.
Morse, C. C., A. D. Huryn, and C. Cronan. 2003. Impervioussurface area as a predictor of the effects of urbanization onstream insect communities in Maine, USA. EnvironmentalMonitoring and Assessment 89:95–127.
National Research Council. 1992. Restoration of aquaticecosystems: science, technology, and the public. NationalAcademy Press, Washington, D.C., USA.
Niezgoda, S. L., and P. A. Johnson. 2005. Improving the urbanstream restoration effort: identifying critical form andprocesses relationships. Environmental Management35:579–592.
North Carolina Department of Transportation. 1999. Streamrestoration plan: Abbott Property, Wake County, NorthCarolina. State Project No. 8.1402601. TIP Project No. R-2541. North Carolina Department of Transportation Project
September 2011 1947EVALUATING RIVER RESTORATION
Development and Environmental Analysis Branch, Raleigh,North Carolina, USA.
North Carolina Division of Water Quality (NC DWQ). 2006.Standard operating procedures for benthic macroinverte-brates. North Carolina Department of Environmental andNatural Resources, Environmental Sciences Section,Biological Assessment Unit, Raleigh, North Carolina, USA.
O’Connor, N. A. 1991. The effects of habitat complexity on themacroinvertebrates colonising wood substrates in a lowlandstream. Oecologia 85:504–512.
Palmer, M. A., R. F. Ambrose, and N. L. Poff. 1997. Ecologicaltheory and community restoration ecology. RestorationEcology 5:291–300.
Palmer, M. A., et al. 2005. Standards for ecologically successfulriver restoration. Journal of Applied Ecology 42:208–217.
Palmer, M. A., H. L. Menninger, and E. Bernhardt. 2010. Riverrestoration, habitat heterogeneity, and biodiversity: a failureof theory or practice? Freshwater Biology 55:205–222.
Paul, M. J., and J. L. Meyer. 2001. Streams in the urbanlandscape. Annual Review of Ecology and Systematics32:333–365.
Pennak, R. W. 1953. Freshwater Invertebrates of the UnitedStates. Ronald Press Company, New York, New York, USA.
Poff, N. L. 1997. Landscape filters and species traits: towardsmechanistic understanding and prediction in stream ecology.Journal of the North American Benthological Society16:391–409.
Resh, V. H., A. V. Brown, A. P. Covich, M. E. Gurtz, H. W. Li,G. W. Minshall, S. R. Reice, A. L. Sheldon, J. B. Wallace,and R. C. Wissmar. 1988. The role of disturbance in streamecology. Journal of the North American BenthologicalSociety 7:433–455.
Richardson, C. J., and J. W. Pahl. 2005. The Duke Foreststormwater improvement and wetlands restoration project.North Carolina Clean Water Management Trust Fund andNorth Carolina Ecosystem Enhancement Program, Raleigh,North Carolina, USA.
Rosgen, D. L. 1994. A classification of natural rivers. Catena22:169–199.
Rosgen, D. L. 1996. A classification of natural rivers: reply tothe comments by J.R. Miller and J.B. Ritter. Catena 27:301–307.
Rosgen, D. L. 2007. Rosgen geomorphic channel design. Pages11:1�11:76 in J. Bernard, J. F. Fripp, and K. R. Robinson,editors. National Engineering Handbook Part 654 (210-VI-NEH). United States Department of Agriculture, NaturalResources Conservation Service, Washington, D.C., USA.
Roy, A. H., A. D. Rosemond, M. J. Paul, D. S. Leigh, and J. B.Wallace. 2003. Stream macroinvertebrate response to catch-ment urbanization (Georgia, U.S.A.). Freshwater Biology48:329–346.
Shields, F. D., R. R. Copeland, P. C. Klingeman, M. W. Doyle,and A. Simon. 2003. Design for stream restoration. Journalof Hydraulic Engineering 129:575–584.
Smith, R. F., L. C. Alexander, and W. O. Lamp. 2009.Dispersal by terrestrial stages of stream insects in urbanwatersheds: a synthesis of current knowledge. Journal of theNorth American Benthological Society 28:1022–1037.
Spanhoff, B., W. Riss, P. Jakel, N. Dakkak, and E. I. Meyer.2006. Effects of an experimental enrichment of instreamhabitat heterogeneity on the stream bed morphology andchironomid community of a straightened section in a sandylowland stream. Environmental Management 37:247–257.
Sponseller, R. A., E. F. Benfield, and H. M. Valett. 2001.Relationships between land use, spatial scale and stream
macroinvertebrate communities. Freshwater Biology46:1409–1424.
Sudduth, E. B., B. A. Hassett, P. Cada, and E. S. Bernhardt.2011. Testing the Field of Dreams Hypothesis: functionalresponses to urbanization and restoration in stream ecosys-tems. Ecological Applications, 21:1972–1988.
Sudduth, E. B., and J. L. Meyer. 2006. Effects of bioengineeredstreambank stabilization on bank habitat and macroinverte-brates in urban streams. Environmental Management38:218–226.
Sudduth, E. B., J. L. Meyer, and E. S. Bernhardt. 2007. Streamrestoration practices in the southeastern United States.Restoration Ecology 15:573–583.
Townsend, C. R., M. R. Scarsbrook, and S. Doledec. 1997.Quantifying disturbance in streams: alternative measures ofdisturbance in relation to macroinvertebrate species traitsand species richness. Journal of the North AmericanBenthological Society 16:531–544.
Tullos, D. D., D. L. Penrose, G. D. Jennings, and W. G. Cope.2009. Analysis of functional traits in reconfigured channels:implications for the bioassessment and disturbance of riverrestoration. Journal of the North American BenthologicalSociety 28:80–92.
United Nations. 2008. World urbanization prospectis: the 2007revision. United Nations, New York, New York, USA.
Urban, M. C., D. K. Skelly, D. Burchsted, W. Price, and S.Lowry. 2006. Stream communities across a rural-urbanlandscape gradient. Diversity and Distributions 12:337–350.
Vermont Water Quality Division. 2009. Stream geomorphicassessment handbook. Vermont Agency of NaturalResources, Department of Environmental Conservation,Waterbury, Vermont, USA.
Vinson, M. R., and C. P. Hawkins. 1998. Biodiversity of streaminsects: variation at local, basin, and regional scales. AnnualReview of Entomology 43:271–293.
Walsh, C. J., T. D. Fletcher, and A. R. Ladson. 2005a. Streamrestoration in urban catchments through redesigning storm-water systems: looking to the catchment to save the stream.Journal of the North American Benthological Society24:690–705.
Walsh, C. J., and J. Kunapo. 2009. The importance of uplandflow paths in determining urban effects on stream ecosys-tems. Journal of the North American Benthological Society28:977–990.
Walsh, C. J., A. H. Roy, J. W. Feminella, P. D. Cottingham,P. M. Groffman, and R. P. Morgan. 2005b. The urbanstream syndrome: current knowledge and the search for acure. Journal of the North American Benthological Society24:706–723.
Walsh, C. J., K. A. Waller, J. Gehling, and R. Mac Nally. 2007.Riverine invertebrate assemblages are degraded more bycatchment urbanisation than by riparian deforestation.Freshwater Biology 52:574–587.
Wang, L. H., and P. Kanehl. 2003. Influences of watershedurbanization and instream habitat on macroinvertebrates incold water streams. Journal of the American WaterResources Association 39:1181–1196.
Weiss, J. M., and S. R. Reice. 2005. The aggregation of impacts:using species-specific effects to infer community-level dis-turbances. Ecological Applications 15:599–617.
Wolman, M. G. 1954. A method of sampling coarse river-bedmaterial. Transactions of the American Geophysical Union35:951–956.
APPENDIX A
Study site UTM coordinates (Ecological Archives A021-087-A1).
INVITED FEATURE1948Ecological Applications
Vol. 21, No. 6

APPENDIX B
Example habitat transition maps and photos for study site block 1 (Ecological Archives A021-087-A2).
APPENDIX C
Study site species lists (Ecological Archives A021-087-A3).
September 2011 1949EVALUATING RIVER RESTORATION
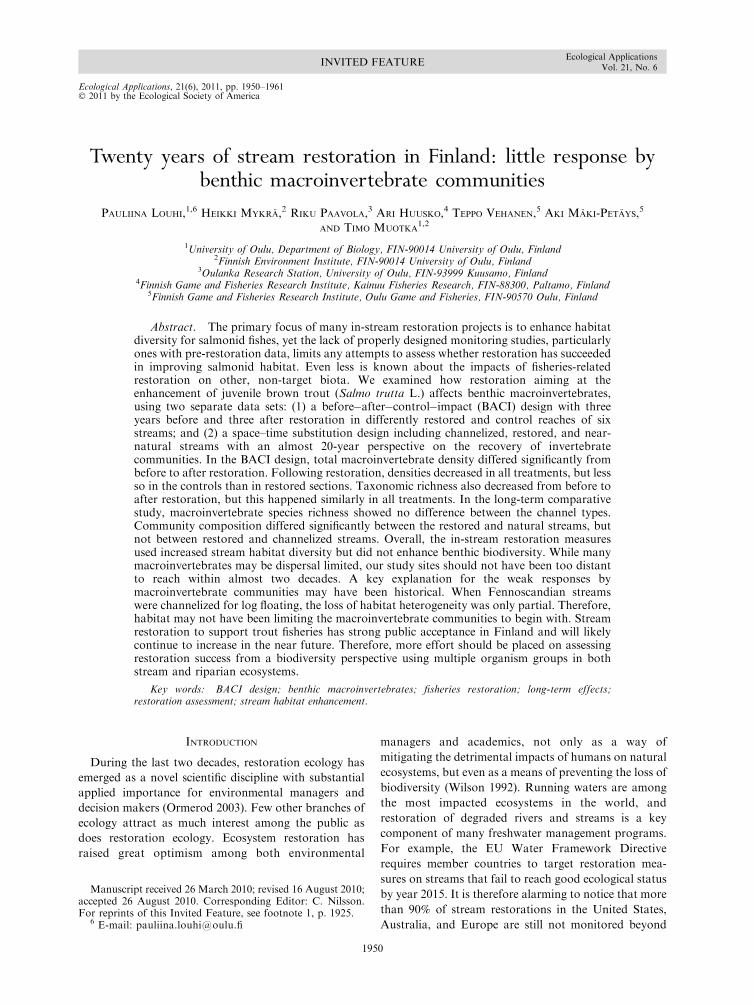
Ecological Applications, 21(6), 2011, pp. 1950–1961� 2011 by the Ecological Society of America
Twenty years of stream restoration in Finland: little response bybenthic macroinvertebrate communities
PAULIINA LOUHI,1,6 HEIKKI MYKRA,2 RIKU PAAVOLA,3 ARI HUUSKO,4 TEPPO VEHANEN,5 AKI MAKI-PETAYS,5
AND TIMO MUOTKA1,2
1University of Oulu, Department of Biology, FIN-90014 University of Oulu, Finland2Finnish Environment Institute, FIN-90014 University of Oulu, Finland
3Oulanka Research Station, University of Oulu, FIN-93999 Kuusamo, Finland4Finnish Game and Fisheries Research Institute, Kainuu Fisheries Research, FIN-88300, Paltamo, Finland
5Finnish Game and Fisheries Research Institute, Oulu Game and Fisheries, FIN-90570 Oulu, Finland
Abstract. The primary focus of many in-stream restoration projects is to enhance habitatdiversity for salmonid fishes, yet the lack of properly designed monitoring studies, particularlyones with pre-restoration data, limits any attempts to assess whether restoration has succeededin improving salmonid habitat. Even less is known about the impacts of fisheries-relatedrestoration on other, non-target biota. We examined how restoration aiming at theenhancement of juvenile brown trout (Salmo trutta L.) affects benthic macroinvertebrates,using two separate data sets: (1) a before�after�control�impact (BACI) design with threeyears before and three after restoration in differently restored and control reaches of sixstreams; and (2) a space–time substitution design including channelized, restored, and near-natural streams with an almost 20-year perspective on the recovery of invertebratecommunities. In the BACI design, total macroinvertebrate density differed significantly frombefore to after restoration. Following restoration, densities decreased in all treatments, but lessso in the controls than in restored sections. Taxonomic richness also decreased from before toafter restoration, but this happened similarly in all treatments. In the long-term comparativestudy, macroinvertebrate species richness showed no difference between the channel types.Community composition differed significantly between the restored and natural streams, butnot between restored and channelized streams. Overall, the in-stream restoration measuresused increased stream habitat diversity but did not enhance benthic biodiversity. While manymacroinvertebrates may be dispersal limited, our study sites should not have been too distantto reach within almost two decades. A key explanation for the weak responses bymacroinvertebrate communities may have been historical. When Fennoscandian streamswere channelized for log floating, the loss of habitat heterogeneity was only partial. Therefore,habitat may not have been limiting the macroinvertebrate communities to begin with. Streamrestoration to support trout fisheries has strong public acceptance in Finland and will likelycontinue to increase in the near future. Therefore, more effort should be placed on assessingrestoration success from a biodiversity perspective using multiple organism groups in bothstream and riparian ecosystems.
Key words: BACI design; benthic macroinvertebrates; fisheries restoration; long-term effects;restoration assessment; stream habitat enhancement.
INTRODUCTION
During the last two decades, restoration ecology has
emerged as a novel scientific discipline with substantial
applied importance for environmental managers and
decision makers (Ormerod 2003). Few other branches of
ecology attract as much interest among the public as
does restoration ecology. Ecosystem restoration has
raised great optimism among both environmental
managers and academics, not only as a way of
mitigating the detrimental impacts of humans on natural
ecosystems, but even as a means of preventing the loss of
biodiversity (Wilson 1992). Running waters are among
the most impacted ecosystems in the world, and
restoration of degraded rivers and streams is a key
component of many freshwater management programs.
For example, the EU Water Framework Directive
requires member countries to target restoration mea-
sures on streams that fail to reach good ecological status
by year 2015. It is therefore alarming to notice that more
than 90% of stream restorations in the United States,
Australia, and Europe are still not monitored beyond
Manuscript received 26 March 2010; revised 16 August 2010;accepted 26 August 2010. Corresponding Editor: C. Nilsson.For reprints of this Invited Feature, see footnote 1, p. 1925.
6 E-mail: [email protected]
1950
INVITED FEATUREEcological Applications
Vol. 21, No. 6
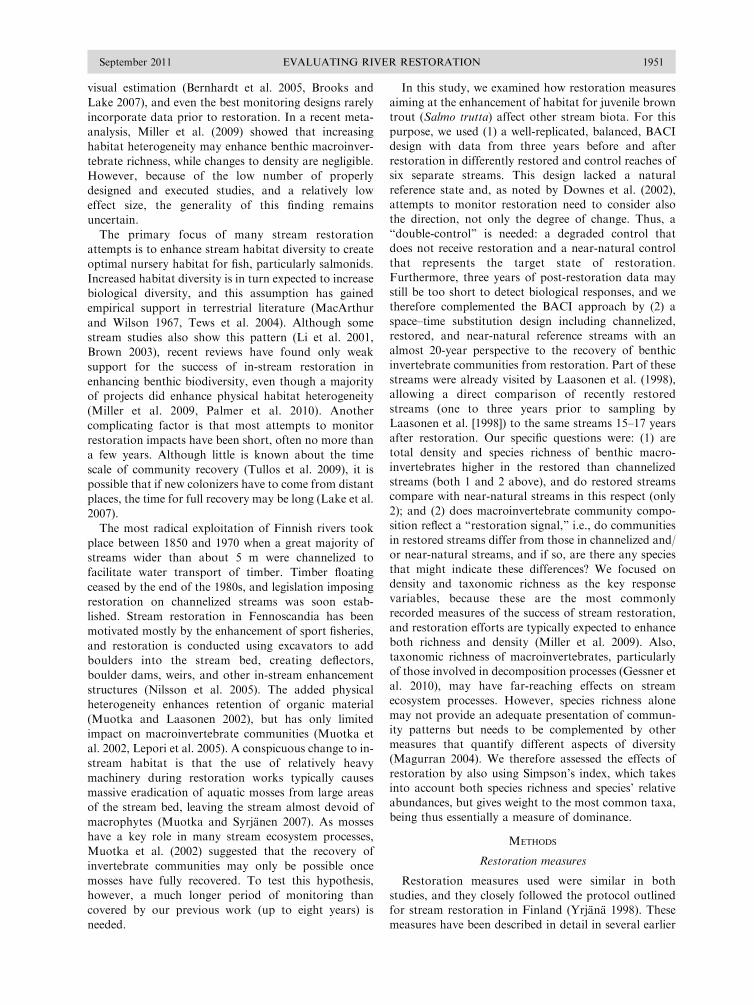
visual estimation (Bernhardt et al. 2005, Brooks and
Lake 2007), and even the best monitoring designs rarely
incorporate data prior to restoration. In a recent meta-
analysis, Miller et al. (2009) showed that increasing
habitat heterogeneity may enhance benthic macroinver-
tebrate richness, while changes to density are negligible.
However, because of the low number of properly
designed and executed studies, and a relatively low
effect size, the generality of this finding remains
uncertain.
The primary focus of many stream restoration
attempts is to enhance stream habitat diversity to create
optimal nursery habitat for fish, particularly salmonids.
Increased habitat diversity is in turn expected to increase
biological diversity, and this assumption has gained
empirical support in terrestrial literature (MacArthur
and Wilson 1967, Tews et al. 2004). Although some
stream studies also show this pattern (Li et al. 2001,
Brown 2003), recent reviews have found only weak
support for the success of in-stream restoration in
enhancing benthic biodiversity, even though a majority
of projects did enhance physical habitat heterogeneity
(Miller et al. 2009, Palmer et al. 2010). Another
complicating factor is that most attempts to monitor
restoration impacts have been short, often no more than
a few years. Although little is known about the time
scale of community recovery (Tullos et al. 2009), it is
possible that if new colonizers have to come from distant
places, the time for full recovery may be long (Lake et al.
2007).
The most radical exploitation of Finnish rivers took
place between 1850 and 1970 when a great majority of
streams wider than about 5 m were channelized to
facilitate water transport of timber. Timber floating
ceased by the end of the 1980s, and legislation imposing
restoration on channelized streams was soon estab-
lished. Stream restoration in Fennoscandia has been
motivated mostly by the enhancement of sport fisheries,
and restoration is conducted using excavators to add
boulders into the stream bed, creating deflectors,
boulder dams, weirs, and other in-stream enhancement
structures (Nilsson et al. 2005). The added physical
heterogeneity enhances retention of organic material
(Muotka and Laasonen 2002), but has only limited
impact on macroinvertebrate communities (Muotka et
al. 2002, Lepori et al. 2005). A conspicuous change to in-
stream habitat is that the use of relatively heavy
machinery during restoration works typically causes
massive eradication of aquatic mosses from large areas
of the stream bed, leaving the stream almost devoid of
macrophytes (Muotka and Syrjanen 2007). As mosses
have a key role in many stream ecosystem processes,
Muotka et al. (2002) suggested that the recovery of
invertebrate communities may only be possible once
mosses have fully recovered. To test this hypothesis,
however, a much longer period of monitoring than
covered by our previous work (up to eight years) is
needed.
In this study, we examined how restoration measures
aiming at the enhancement of habitat for juvenile browntrout (Salmo trutta) affect other stream biota. For this
purpose, we used (1) a well-replicated, balanced, BACIdesign with data from three years before and after
restoration in differently restored and control reaches ofsix separate streams. This design lacked a natural
reference state and, as noted by Downes et al. (2002),attempts to monitor restoration need to consider alsothe direction, not only the degree of change. Thus, a
‘‘double-control’’ is needed: a degraded control thatdoes not receive restoration and a near-natural control
that represents the target state of restoration.Furthermore, three years of post-restoration data may
still be too short to detect biological responses, and wetherefore complemented the BACI approach by (2) a
space–time substitution design including channelized,restored, and near-natural reference streams with an
almost 20-year perspective to the recovery of benthicinvertebrate communities from restoration. Part of these
streams were already visited by Laasonen et al. (1998),allowing a direct comparison of recently restored
streams (one to three years prior to sampling byLaasonen et al. [1998]) to the same streams 15–17 years
after restoration. Our specific questions were: (1) aretotal density and species richness of benthic macro-
invertebrates higher in the restored than channelizedstreams (both 1 and 2 above), and do restored streamscompare with near-natural streams in this respect (only
2); and (2) does macroinvertebrate community compo-sition reflect a ‘‘restoration signal,’’ i.e., do communities
in restored streams differ from those in channelized and/or near-natural streams, and if so, are there any species
that might indicate these differences? We focused ondensity and taxonomic richness as the key response
variables, because these are the most commonlyrecorded measures of the success of stream restoration,
and restoration efforts are typically expected to enhanceboth richness and density (Miller et al. 2009). Also,
taxonomic richness of macroinvertebrates, particularlyof those involved in decomposition processes (Gessner et
al. 2010), may have far-reaching effects on streamecosystem processes. However, species richness alone
may not provide an adequate presentation of commun-ity patterns but needs to be complemented by other
measures that quantify different aspects of diversity(Magurran 2004). We therefore assessed the effects of
restoration by also using Simpson’s index, which takesinto account both species richness and species’ relativeabundances, but gives weight to the most common taxa,
being thus essentially a measure of dominance.
METHODS
Restoration measures
Restoration measures used were similar in both
studies, and they closely followed the protocol outlinedfor stream restoration in Finland (Yrjana 1998). These
measures have been described in detail in several earlier
September 2011 1951EVALUATING RIVER RESTORATION

publications (Laasonen et al. 1998, Muotka et al. 2002,
Muotka and Syrjanen 2007), and we therefore only
provide a short summary. In-stream restoration in
Finland aims at enhancing stream habitat diversity,
and it consists of rearranging the stream bottom using
boulders that were removed from the channel and
placed along stream margins during channelization. This
material is used to construct in-stream enhancement
structures, e.g., boulder ridges and flow deflectors,
placed across the channel. Excavations are also dug to
serve as resting sites for fish. Wood is rarely used in
stream restoration in Finland. These measures are
known to be very effective in enhancing the structural
diversity of in-stream habitat at multiple spatial scales
(Muotka and Syrjanen 2007).
Study areas and sampling designs
A six-year BACI design.—A BACI study was carried
out in six headwater streams in the Oulujoki water-
course, northeastern Finland (648 N, 288 E). These are
second-order streams, with a mean annual flow of 0.29–
0.70 m3/s and mean width of 2–5.5 m. All streams were
channelized for timber floating in the 1950s and 1960s.
Responses of juvenile brown trout to restoration
measures in these streams are reported elsewhere
(Vehanen et al. 2010). In this study, we used the same
set up to monitor changes caused by restoration to
species richness and composition of benthic macro-
invertebrate communities across the six study years. In
each stream, three reaches of ;80 m were selected for
the study. The reaches were separated by at least 300 m
of pool-like (deep, slow-flowing) sections to increase
spatial independence among sites within a stream. In
each reach, we sampled benthic macroinvertebrates
twice a year (June and October) for six years: three
years before (1999–2001) and three after (2001–2003)
restoration. Each reach was divided into eight sub-
reaches of equal length, and one randomly placed
sample was collected in each sub-reach on each sample
date using Surber sampler (0.04 m2, net mesh size 0.3
mm, n¼8 samples per reach). Samples were preserved in
70% ethanol and animals were later sorted and identified
in the laboratory. Owing to the high number of
replicates (n ¼ 1728 samples), only genus-level identi-
fication could be used. Chironomid midges were only
identified to family level and were therefore excluded
from most analyses (except total density). In August
2001, one randomly selected section in each stream was
restored using boulders (.50 cm), another one using
both boulders and large woody debris (diameter¼30–40
cm), while the third reach was left as a control remaining
in a channelized state. In this design, experimental units
within each stream shared largely similar background
conditions of water quality and riparian vegetation.
Restoration structures were added as cross-sectional
weirs at approximately 5-m intervals, the distance being
adjusted by stream slope. A more detailed description of
the study sites and experimental design is given in
Vehanen et al. (2010).
Space–time substitution design.—Restored (n¼15) and
channelized (n ¼ 8) streams included in this survey are
3rd-order tributaries of Rivers Iijoki and Kiiminkijoki in
northeastern Finland. These streams were restored in the
early 1990s and, at the time of sampling, they spanned a
post-restoration recovery period of 15 to 17 years. Rivers
Iijoki and Kiiminkijoki were used extensively for log
floating until the late 1980s, and most tributaries down to
a few meters wide were channelized. Restoration works
were initiated in the early 1990s, and since then, almost
all previously channelized tributaries have been restored
along their full length. As these two river systems do not
contain any unmodified riffles (except in the upmost
headwaters), we included eight near-pristine streams with
intact channels in a neighboring watershed, River
Koutajoki, as regional references for the rehabilitated
and channelized streams. This is the nearest watershed to
Rivers Iijoki and Kiiminkijoki that still remains in a
near-natural state (for a detailed description of River
Koutajoki, see Malmqvist et al. [2009]), so this would be
the most likely source of new colonists if the species
richness in the restored tributaries of Rivers Iijoki and
Kiiminkijoki were to increase. Catchment areas of all the
streams included in this survey, even the ones with
unmodified channels in River Koutajoki, have been
affected by forestry to some degree and no major attempt
to restore catchment hydrology has been made in any of
the basins. Thus, restoration measures were only taken to
enhance in-stream habitat diversity.
Part of the streams (restored, n¼ 8; near-pristine, n¼4) included in this survey were sampled by Laasonen et
al. (1998) in the early 1990s (1990–1992; hereafter
referred to as 1991) when they had been restored one
to three years prior to sampling. One of the main
weaknesses of studies monitoring restoration success is
that they tend to be too short to reliably document
biological responses to restoration. We therefore used
these repeated snapshots to examine whether streams
.15 years after restoration resembled near-natural
reference streams in species richness and community
composition. The sites with repeated sampling are
described in detail in Laasonen et al. (1998) and
Muotka et al. (2002). Briefly, restoration consistently
enhanced streambed diversity, generally increasing mean
water depth, decreasing mean water velocity, and
increasing variability in all stream habitat character-
istics. In all cases, however, the use of bulldozers for
restoration works caused a dramatic loss of aquatic
mosses. Muotka et al. (2002) suggested the loss of
mosses during, and their very slow recovery after,
restoration works to be a key explanation for the lack
(or nearly so) of responses by macroinvertebrate
communities in restored streams. Therefore, to test
whether the recovery of mosses had progressed between
1991 and 2007, we measured the percent cover of mosses
INVITED FEATURE1952Ecological Applications
Vol. 21, No. 6
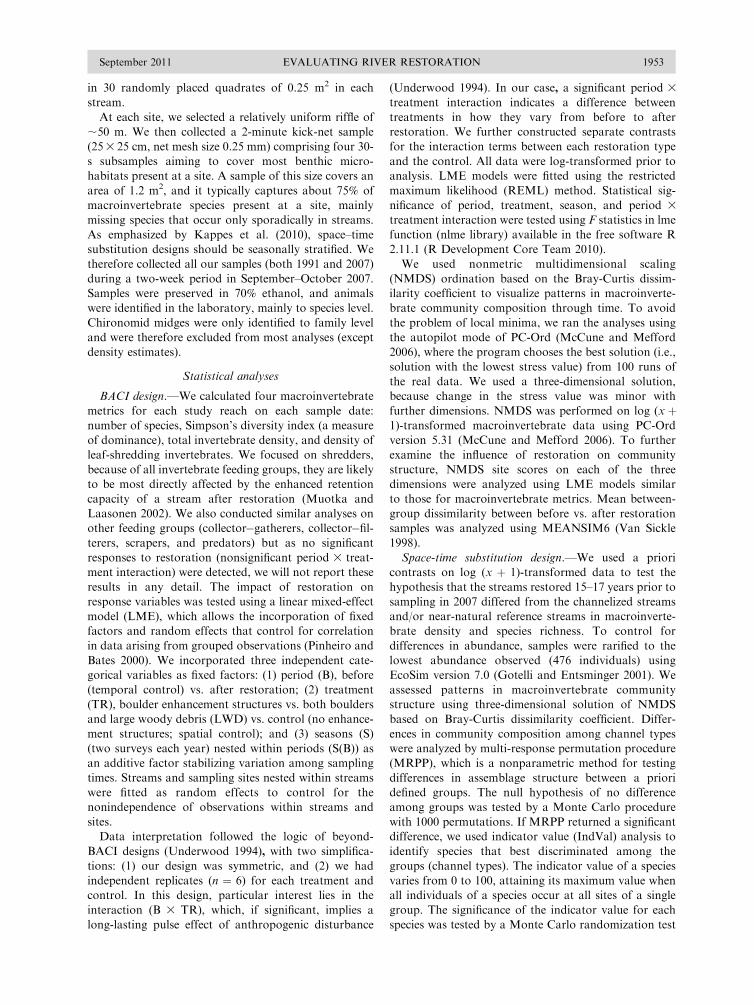
in 30 randomly placed quadrates of 0.25 m2 in each
stream.
At each site, we selected a relatively uniform riffle of
;50 m. We then collected a 2-minute kick-net sample
(253 25 cm, net mesh size 0.25 mm) comprising four 30-
s subsamples aiming to cover most benthic micro-
habitats present at a site. A sample of this size covers an
area of 1.2 m2, and it typically captures about 75% of
macroinvertebrate species present at a site, mainly
missing species that occur only sporadically in streams.
As emphasized by Kappes et al. (2010), space–time
substitution designs should be seasonally stratified. We
therefore collected all our samples (both 1991 and 2007)
during a two-week period in September–October 2007.
Samples were preserved in 70% ethanol, and animals
were identified in the laboratory, mainly to species level.
Chironomid midges were only identified to family level
and were therefore excluded from most analyses (except
density estimates).
Statistical analyses
BACI design.—We calculated four macroinvertebrate
metrics for each study reach on each sample date:
number of species, Simpson’s diversity index (a measure
of dominance), total invertebrate density, and density of
leaf-shredding invertebrates. We focused on shredders,
because of all invertebrate feeding groups, they are likely
to be most directly affected by the enhanced retention
capacity of a stream after restoration (Muotka and
Laasonen 2002). We also conducted similar analyses on
other feeding groups (collector�gatherers, collector�fil-terers, scrapers, and predators) but as no significant
responses to restoration (nonsignificant period 3 treat-
ment interaction) were detected, we will not report these
results in any detail. The impact of restoration on
response variables was tested using a linear mixed-effect
model (LME), which allows the incorporation of fixed
factors and random effects that control for correlation
in data arising from grouped observations (Pinheiro and
Bates 2000). We incorporated three independent cate-
gorical variables as fixed factors: (1) period (B), before
(temporal control) vs. after restoration; (2) treatment
(TR), boulder enhancement structures vs. both boulders
and large woody debris (LWD) vs. control (no enhance-
ment structures; spatial control); and (3) seasons (S)
(two surveys each year) nested within periods (S(B)) as
an additive factor stabilizing variation among sampling
times. Streams and sampling sites nested within streams
were fitted as random effects to control for the
nonindependence of observations within streams and
sites.
Data interpretation followed the logic of beyond-
BACI designs (Underwood 1994), with two simplifica-
tions: (1) our design was symmetric, and (2) we had
independent replicates (n ¼ 6) for each treatment and
control. In this design, particular interest lies in the
interaction (B 3 TR), which, if significant, implies a
long-lasting pulse effect of anthropogenic disturbance
(Underwood 1994). In our case, a significant period 3
treatment interaction indicates a difference between
treatments in how they vary from before to after
restoration. We further constructed separate contrasts
for the interaction terms between each restoration type
and the control. All data were log-transformed prior to
analysis. LME models were fitted using the restricted
maximum likelihood (REML) method. Statistical sig-
nificance of period, treatment, season, and period 3
treatment interaction were tested using F statistics in lme
function (nlme library) available in the free software R
2.11.1 (R Development Core Team 2010).
We used nonmetric multidimensional scaling
(NMDS) ordination based on the Bray-Curtis dissim-
ilarity coefficient to visualize patterns in macroinverte-
brate community composition through time. To avoid
the problem of local minima, we ran the analyses using
the autopilot mode of PC-Ord (McCune and Mefford
2006), where the program chooses the best solution (i.e.,
solution with the lowest stress value) from 100 runs of
the real data. We used a three-dimensional solution,
because change in the stress value was minor with
further dimensions. NMDS was performed on log (x þ1)-transformed macroinvertebrate data using PC-Ord
version 5.31 (McCune and Mefford 2006). To further
examine the influence of restoration on community
structure, NMDS site scores on each of the three
dimensions were analyzed using LME models similar
to those for macroinvertebrate metrics. Mean between-
group dissimilarity between before vs. after restoration
samples was analyzed using MEANSIM6 (Van Sickle
1998).
Space-time substitution design.—We used a priori
contrasts on log (x þ 1)-transformed data to test the
hypothesis that the streams restored 15–17 years prior to
sampling in 2007 differed from the channelized streams
and/or near-natural reference streams in macroinverte-
brate density and species richness. To control for
differences in abundance, samples were rarified to the
lowest abundance observed (476 individuals) using
EcoSim version 7.0 (Gotelli and Entsminger 2001). We
assessed patterns in macroinvertebrate community
structure using three-dimensional solution of NMDS
based on Bray-Curtis dissimilarity coefficient. Differ-
ences in community composition among channel types
were analyzed by multi-response permutation procedure
(MRPP), which is a nonparametric method for testing
differences in assemblage structure between a priori
defined groups. The null hypothesis of no difference
among groups was tested by a Monte Carlo procedure
with 1000 permutations. If MRPP returned a significant
difference, we used indicator value (IndVal) analysis to
identify species that best discriminated among the
groups (channel types). The indicator value of a species
varies from 0 to 100, attaining its maximum value when
all individuals of a species occur at all sites of a single
group. The significance of the indicator value for each
species was tested by a Monte Carlo randomization test
September 2011 1953EVALUATING RIVER RESTORATION
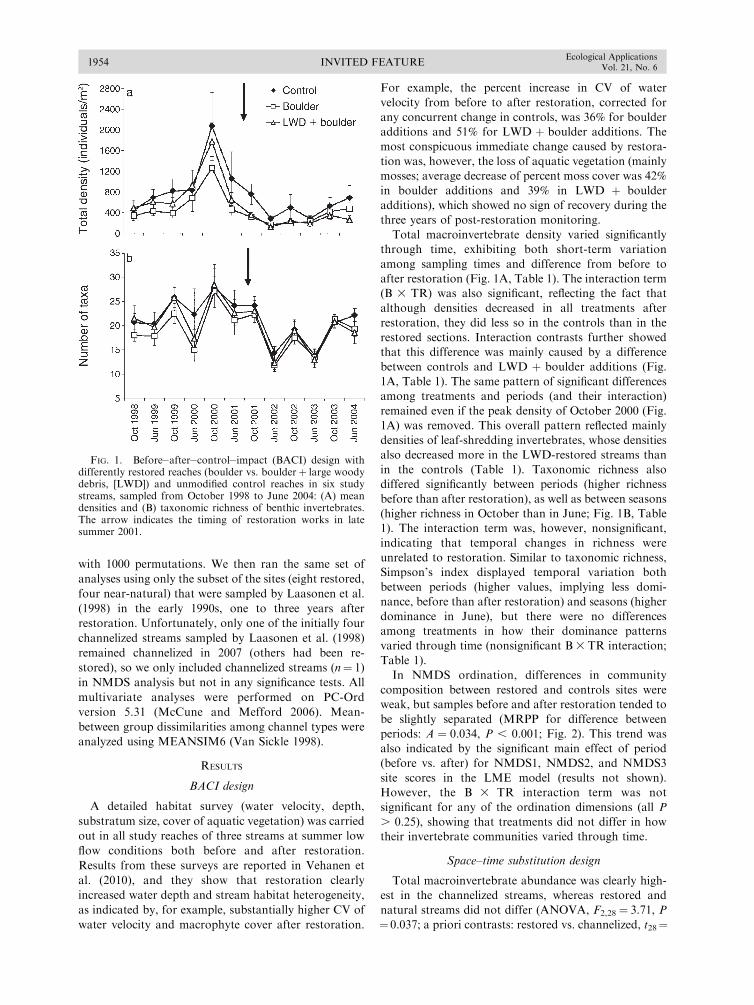
with 1000 permutations. We then ran the same set of
analyses using only the subset of the sites (eight restored,
four near-natural) that were sampled by Laasonen et al.
(1998) in the early 1990s, one to three years after
restoration. Unfortunately, only one of the initially four
channelized streams sampled by Laasonen et al. (1998)
remained channelized in 2007 (others had been re-
stored), so we only included channelized streams (n¼ 1)
in NMDS analysis but not in any significance tests. All
multivariate analyses were performed on PC-Ord
version 5.31 (McCune and Mefford 2006). Mean-
between group dissimilarities among channel types were
analyzed using MEANSIM6 (Van Sickle 1998).
RESULTS
BACI design
A detailed habitat survey (water velocity, depth,
substratum size, cover of aquatic vegetation) was carried
out in all study reaches of three streams at summer low
flow conditions both before and after restoration.
Results from these surveys are reported in Vehanen et
al. (2010), and they show that restoration clearly
increased water depth and stream habitat heterogeneity,
as indicated by, for example, substantially higher CV of
water velocity and macrophyte cover after restoration.
For example, the percent increase in CV of water
velocity from before to after restoration, corrected for
any concurrent change in controls, was 36% for boulder
additions and 51% for LWD þ boulder additions. The
most conspicuous immediate change caused by restora-
tion was, however, the loss of aquatic vegetation (mainly
mosses; average decrease of percent moss cover was 42%
in boulder additions and 39% in LWD þ boulder
additions), which showed no sign of recovery during the
three years of post-restoration monitoring.
Total macroinvertebrate density varied significantly
through time, exhibiting both short-term variation
among sampling times and difference from before to
after restoration (Fig. 1A, Table 1). The interaction term
(B 3 TR) was also significant, reflecting the fact that
although densities decreased in all treatments after
restoration, they did less so in the controls than in the
restored sections. Interaction contrasts further showed
that this difference was mainly caused by a difference
between controls and LWD þ boulder additions (Fig.
1A, Table 1). The same pattern of significant differences
among treatments and periods (and their interaction)
remained even if the peak density of October 2000 (Fig.
1A) was removed. This overall pattern reflected mainly
densities of leaf-shredding invertebrates, whose densities
also decreased more in the LWD-restored streams than
in the controls (Table 1). Taxonomic richness also
differed significantly between periods (higher richness
before than after restoration), as well as between seasons
(higher richness in October than in June; Fig. 1B, Table
1). The interaction term was, however, nonsignificant,
indicating that temporal changes in richness were
unrelated to restoration. Similar to taxonomic richness,
Simpson’s index displayed temporal variation both
between periods (higher values, implying less domi-
nance, before than after restoration) and seasons (higher
dominance in June), but there were no differences
among treatments in how their dominance patterns
varied through time (nonsignificant B 3 TR interaction;
Table 1).
In NMDS ordination, differences in community
composition between restored and controls sites were
weak, but samples before and after restoration tended to
be slightly separated (MRPP for difference between
periods: A ¼ 0.034, P , 0.001; Fig. 2). This trend was
also indicated by the significant main effect of period
(before vs. after) for NMDS1, NMDS2, and NMDS3
site scores in the LME model (results not shown).
However, the B 3 TR interaction term was not
significant for any of the ordination dimensions (all P
. 0.25), showing that treatments did not differ in how
their invertebrate communities varied through time.
Space–time substitution design
Total macroinvertebrate abundance was clearly high-
est in the channelized streams, whereas restored and
natural streams did not differ (ANOVA, F2,28¼ 3.71, P
¼ 0.037; a priori contrasts: restored vs. channelized, t28¼
FIG. 1. Before�after�control�impact (BACI) design withdifferently restored reaches (boulder vs. boulderþ large woodydebris, [LWD]) and unmodified control reaches in six studystreams, sampled from October 1998 to June 2004: (A) meandensities and (B) taxonomic richness of benthic invertebrates.The arrow indicates the timing of restoration works in latesummer 2001.
INVITED FEATURE1954Ecological Applications
Vol. 21, No. 6
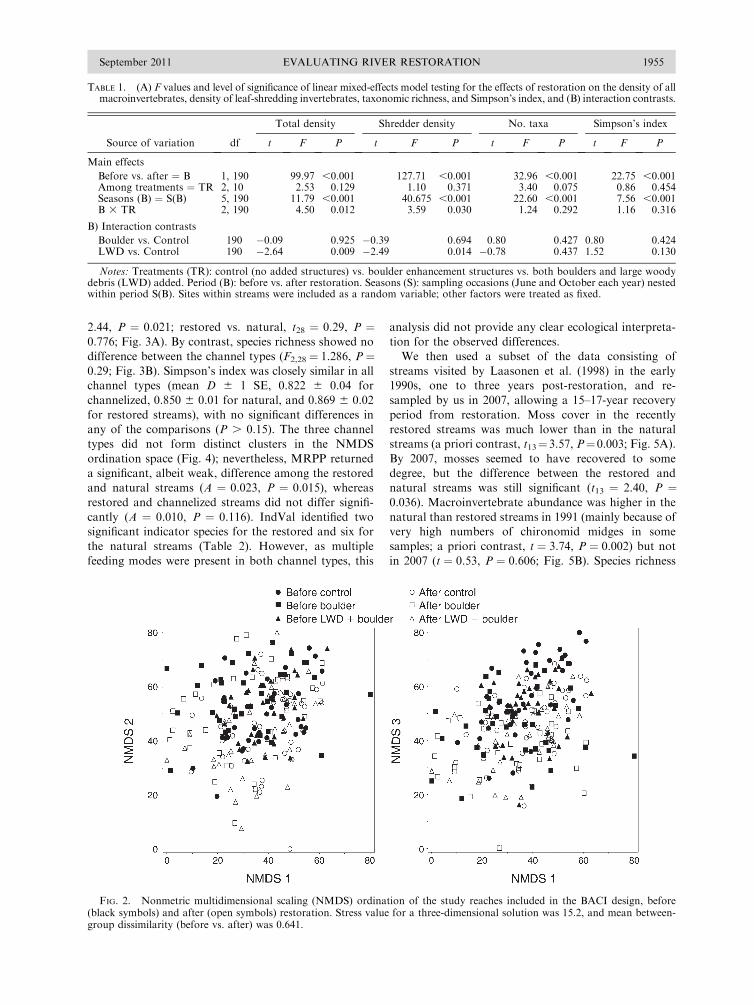
2.44, P ¼ 0.021; restored vs. natural, t28 ¼ 0.29, P ¼0.776; Fig. 3A). By contrast, species richness showed no
difference between the channel types (F2,28¼ 1.286, P¼0.29; Fig. 3B). Simpson’s index was closely similar in allchannel types (mean D 6 1 SE, 0.822 6 0.04 for
channelized, 0.850 6 0.01 for natural, and 0.869 6 0.02
for restored streams), with no significant differences inany of the comparisons (P . 0.15). The three channel
types did not form distinct clusters in the NMDS
ordination space (Fig. 4); nevertheless, MRPP returned
a significant, albeit weak, difference among the restoredand natural streams (A ¼ 0.023, P ¼ 0.015), whereas
restored and channelized streams did not differ signifi-
cantly (A ¼ 0.010, P ¼ 0.116). IndVal identified twosignificant indicator species for the restored and six for
the natural streams (Table 2). However, as multiple
feeding modes were present in both channel types, this
analysis did not provide any clear ecological interpreta-
tion for the observed differences.
We then used a subset of the data consisting of
streams visited by Laasonen et al. (1998) in the early1990s, one to three years post-restoration, and re-
sampled by us in 2007, allowing a 15–17-year recovery
period from restoration. Moss cover in the recently
restored streams was much lower than in the naturalstreams (a priori contrast, t13¼3.57, P¼0.003; Fig. 5A).
By 2007, mosses seemed to have recovered to some
degree, but the difference between the restored andnatural streams was still significant (t13 ¼ 2.40, P ¼0.036). Macroinvertebrate abundance was higher in the
natural than restored streams in 1991 (mainly because ofvery high numbers of chironomid midges in some
samples; a priori contrast, t ¼ 3.74, P ¼ 0.002) but not
in 2007 (t ¼ 0.53, P ¼ 0.606; Fig. 5B). Species richness
TABLE 1. (A) F values and level of significance of linear mixed-effects model testing for the effects of restoration on the density of allmacroinvertebrates, density of leaf-shredding invertebrates, taxonomic richness, and Simpson’s index, and (B) interaction contrasts.
Source of variation df
Total density Shredder density No. taxa Simpson’s index
t F P t F P t F P t F P
Main effects
Before vs. after ¼ B 1, 190 99.97 ,0.001 127.71 ,0.001 32.96 ,0.001 22.75 ,0.001Among treatments ¼ TR 2, 10 2.53 0.129 1.10 0.371 3.40 0.075 0.86 0.454Seasons (B) ¼ S(B) 5, 190 11.79 ,0.001 40.675 ,0.001 22.60 ,0.001 7.56 ,0.001B 3 TR 2, 190 4.50 0.012 3.59 0.030 1.24 0.292 1.16 0.316
B) Interaction contrasts
Boulder vs. Control 190 �0.09 0.925 �0.39 0.694 0.80 0.427 0.80 0.424LWD vs. Control 190 �2.64 0.009 �2.49 0.014 �0.78 0.437 1.52 0.130
Notes: Treatments (TR): control (no added structures) vs. boulder enhancement structures vs. both boulders and large woodydebris (LWD) added. Period (B): before vs. after restoration. Seasons (S): sampling occasions (June and October each year) nestedwithin period S(B). Sites within streams were included as a random variable; other factors were treated as fixed.
FIG. 2. Nonmetric multidimensional scaling (NMDS) ordination of the study reaches included in the BACI design, before(black symbols) and after (open symbols) restoration. Stress value for a three-dimensional solution was 15.2, and mean between-group dissimilarity (before vs. after) was 0.641.
September 2011 1955EVALUATING RIVER RESTORATION

was higher in the restored than natural streams in 1991
(t ¼ 2.73, P ¼ 0.017) but did not differ among the
channel types on the latter sampling time (t¼ 0.44, P¼0.667; Fig. 5C). Comparisons between restored and
channelized streams could not be done because only one
of the initially four streams in this group remained
channelized by 2007. For community composition, the
difference between the restored and natural streams in
1991 bordered at significance (A ¼ 0.031, P ¼ 0.06),
whereas in 2007 communities did not differ among the
channel types (A ¼ 0.014, P ¼ 0.164). Interestingly,
invertebrate communities in the natural streams did not
differ between the two sampling years (A ¼ 0.006, P ¼0.407), whereas in the restored streams, they did (A ¼0.046, P¼0.002; Fig. 6). In three of the restored streams,
where moss cover differed strongly between years (at
least 56% increase in moss cover), a conspicuous change
in macroinvertebrate species composition could be seen,
with the appearance of six species of filter-feeding caddis
larvae (Hydropsychidae) in 2007 that were missing in the
1991 survey. Also the abundance of Rhyacophila caddis
larvae in these three streams increased by 60–92%.
DISCUSSION
We detected little response by macroinvertebrate
communities to in-stream restoration, both in the
short-term BACI approach and in the long-term
comparative study. Therefore, we can safely conclude
that while the in-stream habitat enhancement measures
used clearly increased stream habitat diversity, they had
little impact on benthic biodiversity (see also Laasonen
FIG. 3. (A) Abundance and (B) species richness of benthicmacroinvertebrates in the space–time substitution design,including channelized streams (n ¼ 8), streams restored 15–17years prior to sampling (n ¼ 15), and near-natural referencestreams (n¼ 8). Values are means and SE. Stream types that donot share a letter differ significantly (P , 0.05).
FIG. 4. NMDS ordination of the sites included in the space–time substitution design. Stress value for a three-dimensionalsolution was 15.6, and mean between-group dissimilarities were 0.704 for channelized vs. restored and 0.686 for restored vs. naturalchannels.
INVITED FEATURE1956Ecological Applications
Vol. 21, No. 6
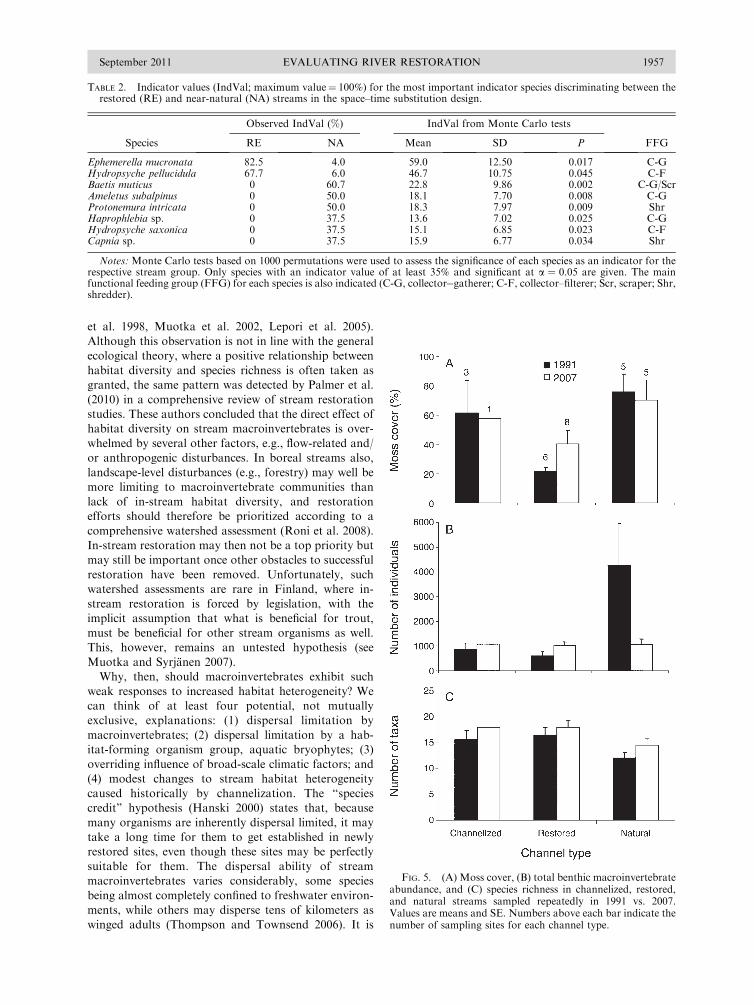
et al. 1998, Muotka et al. 2002, Lepori et al. 2005).
Although this observation is not in line with the generalecological theory, where a positive relationship between
habitat diversity and species richness is often taken asgranted, the same pattern was detected by Palmer et al.
(2010) in a comprehensive review of stream restorationstudies. These authors concluded that the direct effect ofhabitat diversity on stream macroinvertebrates is over-
whelmed by several other factors, e.g., flow-related and/or anthropogenic disturbances. In boreal streams also,
landscape-level disturbances (e.g., forestry) may well bemore limiting to macroinvertebrate communities than
lack of in-stream habitat diversity, and restorationefforts should therefore be prioritized according to a
comprehensive watershed assessment (Roni et al. 2008).In-stream restoration may then not be a top priority butmay still be important once other obstacles to successful
restoration have been removed. Unfortunately, suchwatershed assessments are rare in Finland, where in-
stream restoration is forced by legislation, with theimplicit assumption that what is beneficial for trout,
must be beneficial for other stream organisms as well.This, however, remains an untested hypothesis (see
Muotka and Syrjanen 2007).Why, then, should macroinvertebrates exhibit such
weak responses to increased habitat heterogeneity? Wecan think of at least four potential, not mutuallyexclusive, explanations: (1) dispersal limitation by
macroinvertebrates; (2) dispersal limitation by a hab-itat-forming organism group, aquatic bryophytes; (3)
overriding influence of broad-scale climatic factors; and(4) modest changes to stream habitat heterogeneity
caused historically by channelization. The ‘‘speciescredit’’ hypothesis (Hanski 2000) states that, because
many organisms are inherently dispersal limited, it maytake a long time for them to get established in newlyrestored sites, even though these sites may be perfectly
suitable for them. The dispersal ability of streammacroinvertebrates varies considerably, some species
being almost completely confined to freshwater environ-ments, while others may disperse tens of kilometers as
winged adults (Thompson and Townsend 2006). It is
TABLE 2. Indicator values (IndVal; maximum value¼ 100%) for the most important indicator species discriminating between therestored (RE) and near-natural (NA) streams in the space–time substitution design.
Species
Observed IndVal (%) IndVal from Monte Carlo tests
FFGRE NA Mean SD P
Ephemerella mucronata 82.5 4.0 59.0 12.50 0.017 C-GHydropsyche pellucidula 67.7 6.0 46.7 10.75 0.045 C-FBaetis muticus 0 60.7 22.8 9.86 0.002 C-G/ScrAmeletus subalpinus 0 50.0 18.1 7.70 0.008 C-GProtonemura intricata 0 50.0 18.3 7.97 0.009 ShrHaprophlebia sp. 0 37.5 13.6 7.02 0.025 C-GHydropsyche saxonica 0 37.5 15.1 6.85 0.023 C-FCapnia sp. 0 37.5 15.9 6.77 0.034 Shr
Notes: Monte Carlo tests based on 1000 permutations were used to assess the significance of each species as an indicator for therespective stream group. Only species with an indicator value of at least 35% and significant at a ¼ 0.05 are given. The mainfunctional feeding group (FFG) for each species is also indicated (C-G, collector�gatherer; C-F, collector–filterer; Scr, scraper; Shr,shredder).
FIG. 5. (A) Moss cover, (B) total benthic macroinvertebrateabundance, and (C) species richness in channelized, restored,and natural streams sampled repeatedly in 1991 vs. 2007.Values are means and SE. Numbers above each bar indicate thenumber of sampling sites for each channel type.
September 2011 1957EVALUATING RIVER RESTORATION
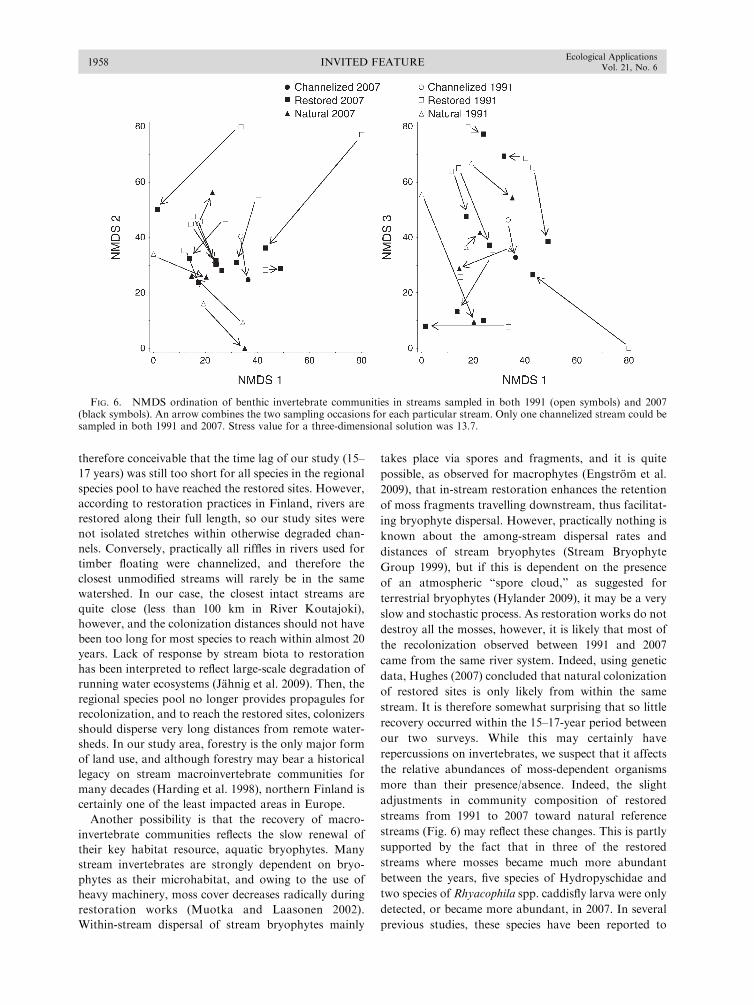
therefore conceivable that the time lag of our study (15–
17 years) was still too short for all species in the regional
species pool to have reached the restored sites. However,
according to restoration practices in Finland, rivers are
restored along their full length, so our study sites were
not isolated stretches within otherwise degraded chan-
nels. Conversely, practically all riffles in rivers used for
timber floating were channelized, and therefore the
closest unmodified streams will rarely be in the same
watershed. In our case, the closest intact streams are
quite close (less than 100 km in River Koutajoki),
however, and the colonization distances should not have
been too long for most species to reach within almost 20
years. Lack of response by stream biota to restoration
has been interpreted to reflect large-scale degradation of
running water ecosystems (Jahnig et al. 2009). Then, the
regional species pool no longer provides propagules for
recolonization, and to reach the restored sites, colonizers
should disperse very long distances from remote water-
sheds. In our study area, forestry is the only major form
of land use, and although forestry may bear a historical
legacy on stream macroinvertebrate communities for
many decades (Harding et al. 1998), northern Finland is
certainly one of the least impacted areas in Europe.
Another possibility is that the recovery of macro-
invertebrate communities reflects the slow renewal of
their key habitat resource, aquatic bryophytes. Many
stream invertebrates are strongly dependent on bryo-
phytes as their microhabitat, and owing to the use of
heavy machinery, moss cover decreases radically during
restoration works (Muotka and Laasonen 2002).
Within-stream dispersal of stream bryophytes mainly
takes place via spores and fragments, and it is quite
possible, as observed for macrophytes (Engstrom et al.
2009), that in-stream restoration enhances the retention
of moss fragments travelling downstream, thus facilitat-
ing bryophyte dispersal. However, practically nothing is
known about the among-stream dispersal rates and
distances of stream bryophytes (Stream Bryophyte
Group 1999), but if this is dependent on the presence
of an atmospheric ‘‘spore cloud,’’ as suggested for
terrestrial bryophytes (Hylander 2009), it may be a very
slow and stochastic process. As restoration works do not
destroy all the mosses, however, it is likely that most of
the recolonization observed between 1991 and 2007
came from the same river system. Indeed, using genetic
data, Hughes (2007) concluded that natural colonization
of restored sites is only likely from within the same
stream. It is therefore somewhat surprising that so little
recovery occurred within the 15–17-year period between
our two surveys. While this may certainly have
repercussions on invertebrates, we suspect that it affects
the relative abundances of moss-dependent organisms
more than their presence/absence. Indeed, the slight
adjustments in community composition of restored
streams from 1991 to 2007 toward natural reference
streams (Fig. 6) may reflect these changes. This is partly
supported by the fact that in three of the restored
streams where mosses became much more abundant
between the years, five species of Hydropyschidae and
two species of Rhyacophila spp. caddisfly larva were only
detected, or became more abundant, in 2007. In several
previous studies, these species have been reported to
FIG. 6. NMDS ordination of benthic invertebrate communities in streams sampled in both 1991 (open symbols) and 2007(black symbols). An arrow combines the two sampling occasions for each particular stream. Only one channelized stream could besampled in both 1991 and 2007. Stress value for a three-dimensional solution was 13.7.
INVITED FEATURE1958Ecological Applications
Vol. 21, No. 6

show strong preference for moss-covered stones
(Malmqvist and Sjostrom 1984, Muotka 1993).
A growing body of literature shows that regional
climatic variability may override localized management
efforts (Bradley and Ormerod 2001, Suding et al. 2004),
and because extreme hydrological events are expected to
be more frequent in the future (Hintzman et al. 2005),
many monitoring studies will be plagued by such
unpredictable broad-scale variability. This was exactly
what happened in our BACI design, because in 2002, a
year after the restoration, discharge was at a record low
in Finnish rivers (Finnish Environment Institute 2002).
This partly confounded the detection of restoration-
induced changes to macroinvertebrate density and
diversity which both decreased after restoration.
However, as a parallel decrease also occurred in
unmodified controls, this response could not have been
caused merely by restoration. Importantly, however, the
response was stronger in restored than in control
reaches, and densities decreased strongly already in
October 2001, soon after restoration and well before the
onset of drought. Therefore, restoration-induced dis-
turbance must also have been involved. Tullos et al.
(2009) suggested that channel reconfiguration acts as a
‘‘disturbance filter’’ that affects macroinvertebrates for
many years after restoration. In our case, recovery from
restoration may indeed have been slowed down by the
subsequent drought. This may also explain the rather
unexpected result of strongly decreased densities of
shredding invertebrates in the LWD-restored streams;
initially, we expected shredder densities to increase after
wood addition because this should enhance the retention
capacity of a stream to riparian litter inputs (Johnson et
al. 2003). However, very low water levels in years
following restoration shifted large areas of stream bed to
slowly flowing pools, and this was particularly pro-
nounced in reaches with added logs (Vehanen et al.
2010). These conditions may have been unsuitable for
many shredders, most of which were relatively sensitive
stonefly species.
When Fennoscandian streams were channelized for
log floating, only major flow obstructions were removed
from the channel, and the loss of habitat heterogeneity
was only partial (Nilsson et al. 2005). Therefore,
heterogeneity may not have been limiting macroinverte-
brate communities in our streams to begin with.
Furthermore, although we lack historical, pre-channeli-
zation data, as well as data from the active timber
floating period (prior to the 1980s), it seems that if
channelization and floating activities did cause any
direct harm to benthic communities, the 20–30-year
period after the cessation of timber floating until our
first survey should have been enough to allow full
community recovery. Therefore, one might ask whether
these streams needed any restoration measures at all. In
fact, although the channelized streams were hydro-
morphologically degraded, their biological communities
did not differ strongly from regional references and,
therefore, under current criteria emphasizing biodiver-
sity, these streams would not be defined as in need ofrestoration. Twenty years ago, however, biodiversity did
not have much weight in environmental decision makingin Finland, and the primary motivation for restoring the
streams used for timber transport was to enhancesalmonid fisheries. In a companion paper, we used thesame BACI set-up to show that stream habitat enhance-
ment had little impact on brown trout populations(Vehanen et al. 2010). Similarly, Stewart et al. (2009)
questioned the use of in-stream enhancement structuresfor fisheries purposes, maintaining that their widespread
use is not based on scientific evidence. It thus seems thatstream restoration using such structures may represent a
case of ‘‘over-application of oversimplified concepts tocomplex systems’’ (Hilderbrand et al. 2005). Never-
theless, stream restoration in its present form has astrong public acceptance in Finland, mainly because it is
considered beneficial for commercially important fish,ecotourism, and the well-being of local people (Olkio
and Eloranta 2007). Thus, as numerous restorationprojects are currently underway in Finland, and many
more are likely to come, it is important that any damageto lotic biota, particularly aquatic mosses, be minimizedby leaving areas of streambed untouched to aid the
recolonization by mosses.Some recent studies have shown that, through
changed hydrology (e.g., increased frequency andduration of flooding) and creation of additional
habitats, in-stream restoration may in fact have quitestrong impacts on riparian plant and insect communities
(Helfield et al. 2007, Jahnig et al. 2009). For example,Jahnig et al. (2009) showed that channel reconstruction
in Central European rivers had no impact on benthicinvertebrates, whereas species richness of floodplain
vegetation and ground beetles increased strongly. Thesepositive responses are perhaps not that surprising, given
the recent evidence that stream and riparian food websare tightly intertwined (Nakano and Murakami 2001,
Marczak and Richardson 2007). As the trophic linksbetween streams and their riparian forests are easily
disturbed by human intervention (Baxter et al. 2004),future research should pay more attention to the effectsof stream restoration on the reciprocal energy fluxes
between these two strongly interconnected ecosystems.Assessment of stream restoration success may have been
too strongly biased toward benthic macroinvertebratesand more emphasis in future projects should be given to
multiple organism groups in both streams and stream-side forests and floodplains.
ACKNOWLEDGMENTS
We thank Rauno Hokki, Olli van der Meer, JormaKorhonen, Ari Kauttu, and Timo Kanniainen, who conductedmost of the field work. Antti Paasivaara is also appreciated forstatistical advice. Financial support was received fromAcademy of Finland, University of Oulu (Thule Institute),Ministry of Agriculture and Forestry, Fortum, PVO Vesivoima,Kemijoki Oy, Maj and Tore Nessling Foundation, and theKone Foundation. Thanks also to Emily Bernhardt, Brendan
September 2011 1959EVALUATING RIVER RESTORATION
McKie, and an anonymous reviewer for their insightfulcomments on a previous version of the manuscript.
LITERATURE CITED
Baxter, C. V., K. D. Fausch, M. Murakami, and P. L.Chapman. 2004. Fish invasion restructures stream and forestfood webs by interrupting reciprocal prey subsidies. Ecology85:2656–2663.
Bernhardt, E. S., et al. 2005. Synthesizing U.S. river restorationefforts. Science 308:636–637.
Bradley, D. C., and S. J. Ormerod. 2001. Communitypersistence among stream invertebrates tracks the NorthAtlantic Oscillation. Journal of Animal Ecology 70:987–996.
Brooks, S. S., and P. S. Lake. 2007. River restoration inVictoria, Australia: change is in the wind, and none too soon.Restoration Ecology 15:584–591.
Brown, B. L. 2003. Spatial heterogeneity reduces temporalvariability in stream insect communities. Ecology Letters6:316–325.
Downes, B. J., L. A. Barmuta, P. G. Fairweather, D. P. Faith,M. J. Keough, P. S. Lake, B. D. Mapstone, and G. P. Quinn.2002. Monitoring ecological impacts. Concepts and practicein flowing waters. Cambridge University Press, Edinburgh,UK.
Engstrom, J., C. Nilsson, and R. Jansson. 2009. Effects ofstream restoration on dispersal of plant propagules. Journalof Applied Ecology 46:397–405.
Finnish Environment Institute. 2002. Annual hydrologicalreport 2002. hhttp://www.environment.fi/default.asp?node¼12756&lan¼eni
Gessner, M. O., C. M. Swan, C. K. Dang, B. G. McKie, R. D.Bardgett, D. H. Wall, and S. Hattenschwiler. 2010. Diversitymeets decomposition. Trends in Ecology and Evolution25:372–380.
Gotelli, N. J., and G. L. Entsminger. 2001. EcoSim: null modelssoftware for ecology. Version 7.0. Acquired Intelligence andKesey-Bear, Jericho, Vermont, USA. hhttp://garyentsminger.com/ecosim/index.htmi
Hanski, I. 2000. Extinction debt and species credit in borealforests: modelling the consequences of different approachesto biodiversity conservation. Annales Zoologici Fennici37:271–280.
Harding, J. S., E. F. Benfield, P. V. Bolstad, G. S. Helfman, andE. B. D. Jones III. 1998. Stream biodiversity: the ghost ofland use past. Proceedings of the National Academy ofSciences USA 95:14843–14847.
Helfield, J. M., S. J. Capon, C. Nilsson, R. Jansson, and D.Palm. 2007. Restoration of rivers used for timber floating:effects on riparian plant diversity. Ecological Applications17:840–851.
Hilderbrand, R. H., A. C. Watts, and A. M. Randle. 2005. Themyths of restoration ecology. Ecology and Society 10(1):19.hhttp://www.ecologyandsociety.org/vol10/iss1/art19/i
Hintzman, L. D., et al. 2005. Evidence and implications ofrecent climate change in Northern Alaska and other Arcticregions. Climatic Change 72:251–298.
Hughes, J. M. 2007. Constraints on recovery: using molecularmethods to study connectivity of aquatic biota in rivers andstreams. Freshwater Biology 52:616–631.
Hylander, K. 2009. No increase in colonization rate in borealbryophytes close to propagule sources. Ecology 90:160–169.
Jahnig, S. C., S. Brunzel, S. Gacek, A. W. Lorenz, and D.Hering. 2009. Effects of re-braiding measures on hydro-morphology, floodplain vegetation, ground beetles andbenthic invertebrates in mountain rivers. Journal ofApplied Ecology 46:406–416.
Johnson, L. B., D. H. Breneman, and C. Richards. 2003.Macroinvertebrate community structure and function asso-ciated with large wood in low gradient streams. RiverResearch and Applications 19:199–218.
Kappes, H., A. Sundermann, and P. Haase. 2010. High spatialvariability biases the space-for-time approach in environ-mental monitoring. Ecological Indicators 10:1202–1205.
Laasonen, P., T. Muotka, and I. Kivijarvi. 1998. Recovery ofmacroinvertebrate communities from stream habitat restora-tion. Aquatic Conservation: Marine and FreshwaterEcosystems 8:101–113.
Lake, P. S., N. Bond, and P. Reich. 2007. Linking ecologicaltheory with stream restoration. Freshwater Biology 52:597–615.
Lepori, F., D. Palm, E. Brannas, and B. Malmqvist, B. 2005.Does restoration of structural heterogeneity in streamsenhance fish and macroinvertebrate diversity? EcologicalApplications 15:2060–2071.
Li, J., A. Herlihy, W. Gerth, P. Kaufmann, S. Gregory, S.Urquhart, and D. P. Larsen. 2001. Variability in streammacroinvertebrates at multiple spatial scales. FreshwaterBiology 46:87–97.
MacArthur, R. H., and E. O. Wilson. 1967. The theory ofisland biogeography. Monographs in Population Biology 1.Princeton University Press, Princeton, New Jersey, USA.
Magurran, A. E. 2004. Measuring biological diversity.Blackwell, Oxford, UK.
Malmqvist, B., T. Muotka, C. Nilsson, and H. Timm. 2009.The Fennoscandian Shield. Pages 297–335 in K. Tockner,C. T. Robinson, and U. Uehlinger, editors. Rivers of Europe.Elsevier, Amsterdam, Netherlands.
Malmqvist, B., and P. Sjostrom. 1984. The microdistribution ofsome lotic insect predators in relation to their prey and toabiotic factors. Freshwater Biology 14:649–656.
Marczak, L. B., and J. S. Richardson. 2007. Spiders andsubsidies: results from the riparian zone of a coastaltemperate rainforest. Journal of Animal Ecology 76:687–694.
McCune, B., and M. J. Mefford. 2006. PC-ORD. Multivariateanalysis of ecological data. Version 5.31. MjM Software,Gleneden Beach, Oregon, USA.
Miller, S. W., P. Budy, and J. C. Schmidt. 2009. Quantifyingmacroinvertebrate responses to instream habitat restoration:applications of meta-analyses to river restoration. Restora-tion Ecology 18:8–19.
Muotka, T. 1993. Microhabitat use by predaceous streaminsects in relation to seasonal changes in prey availability.Annales Zoologici Fennici 30:287–297.
Muotka, T., and P. Laasonen. 2002. Ecosystem recovery inrestored headwater streams: the role of enhanced leafretention. Journal of Applied Ecology 39:145–156.
Muotka, T., R. Paavola, A. Haapala, M. Novikmec, and P.Laasonen. 2002. Long-term recovery of stream habitatstructure and benthic invertebrate communities from in-stream restoration. Biological Conservation 105:243–253.
Muotka, T., and J. Syrjanen. 2007. Changes in habitatstructure, benthic invertebrate density, trout populationsand ecosystem processes in restored forested streams: aboreal perspective. Freshwater Biology 52:724–737.
Nakano, S., and M. Murakami. 2001. Reciprocal subsidies:dynamic interdependence between terrestrial and aquaticfood webs. Proceedings of the National Academy of SciencesUSA 98:1166–1170.
Nilsson, C., F. Lepori, B. Malmqvist, E. Tornlund, N. Hjerdt,J. M. Helfield, D. Palm, J. Ostergren, R. Jansson, E.Brannas, and H. Lundqvist. 2005. Forecasting environmentalresponses to restoration of rivers used as log floatways: aninterdisciplinary challenge. Ecosystems 8:779–800.
Olkio, K., and A. Eloranta. 2007. Evaluation of the socio-economic influences of river restoration in Central Finland.Report. Central Finland Regional Environmental Centre,Jyvaskyla, Finland. [In Finnish, with an English summary.]
Ormerod, S. J. 2003. Restoration in applied ecology: editor’sintroduction. Journal of Applied Ecology 40:44–50.
Palmer, M. A., H. Menninger, and E. Bernhardt. 2010. Riverrestoration, habitat heterogeneity and biodiversity: a failure
INVITED FEATURE1960Ecological Applications
Vol. 21, No. 6
of theory or practice? Freshwater Biology 55 (Supplement1):205–222.
Pinheiro, J. C., and D. M. Bates. 2000. Mixed-effects models inS and S-PLUS. Springer-Verlag, New York, New York,USA.
R Development Core Team, 2010. A language and environmentfor statistical computing. R Foundation for StatisticalComputing, Vienna, Austria. hhttp://www.r-project.orgi
Roni, P., K. Hanson, and T. Beechie. 2008. Global review ofthe physical and biological effectiveness of stream habitatrehabilitation techniques. North American Journal ofFisheries Management 28:856–890.
Stewart, G. B., H. R. Bayliss, D. A. Showler, W. J. Sutherland,and A. S. Pullin. 2009. Effectiveness of engineered in-streamstructure mitigation measures to increase salmonid abun-dance: a systematic review. Ecological Applications 19:931–941.
Stream Bryophyte Group. 1999. Roles of bryophytes in streamecosystems. Journal of the North American BenthologicalSociety 18:151–184.
Suding, K. N., K. L. Gross, and G. R. Houseman. 2004.Alternative states and positive feedbacks in restorationecology. Trends in Ecology and Evolution 19:46–53.
Tews, J., U. Brose, V. Grimm, K. Tielborger, M. C. Wichmann,M. Schwager, and F. Jeltsch. 2004. Animal species diversitydriven by habitat heterogeneity/diversity: the importance ofkeystone structures. Journal of Biogeography 31:79–92.
Thompson, R., and C. Townsend. 2006. A truce with neutraltheory: local deterministic factors, species traits and dispersallimitation together determine patterns of diversity in streaminvertebrates. Journal of Animal Ecology 75:476–484.
Tullos, D., D. Penrose, G. Jennings, and W. Cope. 2009.Analysis of functional traits in reconfigured channels:implications for the bioassessment and disturbance of riverrestoration. Journal of the North American BenthologicalSociety 28:80–92.
Underwood, A. J. 1994. On beyond BACI: sampling designsthat might reliably detect environmental disturbances.Ecological Applications 4:3–15.
Van Sickle, J. 1998. MEANSIM6. hhttp://www.epa.gov/wed/pages/models.htmi
Vehanen, T., A. Huusko, A. Maki-Petays, H. Mykra, P. Louhi,and T. Muotka. 2010. Effects of habitat rehabilitation onhabitat and brown trout in boreal forest streams. FreshwaterBiology 55:2200–2214.
Wilson, E. O. 1992. Diversity of life. Harvard University Press,Cambridge, Massachusetts, USA.
Yrjana, T. 1998. Efforts for in-stream fish habitat restorationwithin River Iijoki, Finland—goals, methods and test results.Pages 239–250 in L. C. de Waal, A. R. G. Large, and P. M.Wade, editors. Rehabilitation of rivers: principles andimplementation. Wiley, Chichester, UK.
September 2011 1961EVALUATING RIVER RESTORATION

Ecological Applications, 21(6), 2011, pp. 1962–1971� 2011 by the Ecological Society of America
River restoration success depends on the species poolof the immediate surroundings
ANDREA SUNDERMANN, STEFAN STOLL,1 AND PETER HAASE
Research Institute Senckenberg, Department of Limnology and Conservation, Clamecystrasse 12, 63571 Gelnhausen, Germany, andBiodiversity and Climate Research Centre (BiK-F), Senckenberganlage 25, 60325 Frankfurt am Main, Germany
Abstract. Previous studies evaluating the success of river restorations have rarely foundany consistent effects on benthic invertebrate assemblages. In this study, we analyzed datafrom 24 river restoration projects in Germany dating back 1 to 12 years and 1231 data setsfrom adjacent river reaches that lie within 0–5, 5–10, and 10–15 km rings centered on therestored sites. We calculated restoration success and recolonization potential of adjacent riverreaches based on stream-type-specific subsets of taxa indicative for good or bad habitatquality. On average, the restorations did not improve the benthic invertebrate communityquality. However, we show that restoration success depends on the presence of sourcepopulations of desired taxa in the surrounding of restored sites. Only where sourcepopulations of additional desired taxa existed within a 0–5 km ring around the restored siteswere benthic invertebrate assemblages improved by the restoration. Beyond the 5-km rings,this recolonization effect was no longer detected. We present here the first field results tosupport the debated argument that a lack of source populations in the areas surroundingrestored sites may play an important role in the failure to establish desired invertebratecommunities by the means of river restorations. In contrast, long-range dispersal ofinvertebrates seems to play a subordinate role in the recolonization of restored sites.However, because the surroundings of the restored sites were far from good ecological quality,the potential for improvement of restored sites was limited.
Key words: aquatic communities; benthic invertebrates; dispersal; habitat heterogeneity; regionalspecies pool; river rehabilitation; source population.
INTRODUCTION
Over the last decades, public awareness of not only
the ecological but also the economic and social values of
rivers has gradually risen, resulting in an increasing
number of river restoration projects (Bernhardt et al.
2005, Palmer et al. 2005, Dudgeon et al. 2006, Jahnig et
al. 2011). Commonly, restoration projects intend to
reconstruct a channel form that is similar to a historic
form or least-disturbed reference site (Palmer 2009). As
degraded river sections often show comparatively
monotonous conditions and a low availability of
potential habitats, river restoration practices often apply
the habitat heterogeneity hypothesis assuming that an
increase in habitat heterogeneity will promote biodiver-
sity (Ricklefs and Schluter 1993). However, the biotic
effects of river restoration on aquatic assemblages are
still poorly understood, and many projects do not yield
the expected results. Palmer et al. (2010) reviewed 78
restoration projects, among which only two showed
statistically significant increases in benthic invertebrate
biodiversity, suggesting an uncoupling between struc-
tural and biological diversity.
The reasons for failure are diverse, but are most often
argued along the following lines. First, even after an
increase in habitat heterogeneity, some stressors persist
and limit the development of the aquatic community
(Lake et al. 2007). Such stressors include water pollution
and inadequate sediment quality (Kowalik and Ormerod
2006). These often come along with persistent land use
changes in the catchment area. Further stressors are
temperature changes (Lehmkuhl 1972), and constraints
in other habitats that species use during periods of their
life cycle (Briers and Gee 2004). Second, long-lasting
impacts lead to a loss of biodiversity, which results in the
disappearance of many sensitive species from large parts
of their former distribution range (Zwick 1992). Species
colonizing a local site are drawn from the regional
species pool (Cornell and Lawton 1992). In many cases,
however, streams and rivers are impacted not only on
the local scale but also on the catchment scale, so that
the regional species pool will decrease and consist
mainly of opportunistic, highly tolerant generalists
(Lake et al. 2007).
Manuscript received 24 March 2010; revised 19 October2010; accepted 20 October 2010. Corresponding Editor: C.Nilsson. For reprints of this Invited Feature, see footnote 1, p.1925.
1 Corresponding author.E-mail: [email protected]
1962
INVITED FEATUREEcological Applications
Vol. 21, No. 6
The recolonization of restored stream sections by
benthic invertebrates therefore also depends on theavailability of a regional species pool and the species
dispersal propensities. Many studies examining themovement of adult insects assume dispersal to be
limited, as the number of specimens rapidly decreaseswith increasing distance to the stream (Petersen et al.2004, Blakely et al. 2006, Hughes 2007, Masters et al.
2007; but see Coutant 1982 and Ims 1995). Some recentgenetic studies, however, indicate that dispersal over
long distances within and across catchments may becommon (Kovats et al. 1996, Kelly et al. 2001, Wilcock
et al. 2003, 2007). Independent of dispersal, Lake et al.(2007) predicted that the existence of a diverse regional
species pool is a prerequisite for a successful recoloniza-tion. The more additional taxa that are available in the
regional species pool, the more likely it is that thenumber of taxa will rise after restoring a site.
By analyzing the outcome of 24 restoration projects(treatment–control approach) and the assemblages in
the vicinity of the restored sites, our study investigatesthe relationship between the community improvement at
restored sites and the regional species pool. Thereby weused a stream type-specific approach, which was not
based on general species assemblage metrics, but onstream type specific sets of benthic invertebrate speciesindicating good or bad habitat quality to estimate the
recolonization potential within three rings of differentdistances from the restored site. We then addressed the
following questions: (1) Is restoration success affectedby the quality of the communities in the surroundings?
and (2) Is there a relationship between distance from aregional pool of desired taxa and the colonization of
desired taxa at a restored site? We hypothesized thatimprovement of the benthic invertebrate assemblages
through restoration will only be observed where sourcepopulations of habitat-specific desired taxa are present
in close vicinity to the restored site. With this study, weaim at revising current and developing new restoration
strategies so that they are more likely to produce thedesired effects in benthic invertebrate communities.
MATERIAL AND METHODS
Restoration projects
We investigated 24 river restoration projects that have
been carried out over the last 12 years with the goal ofimproving the habitat diversity (Table 1). At each
restoration site, two river sections were sampled. Onesection was situated within the restored reach. A second
section was selected further upstream outside of therestored reach and served as a control (space-for-time
substitution; mean distance between sections 1 km). Thestill-degraded control sections were selected to best
represent the conditions of the rehabilitated sectionprior to restoration.
The investigated restoration projects were quitediverse, including re-creation of natural features in
straightened reaches, reconnection of side channels,
and improvement of lateral connectivity. The successful
achievement of these objectives was documented by
Jahnig et al. (2011), who investigated 26 restoration
projects of which 19 were identical to those in our study.
Unfortunately, the achievement of objectives of the
remaining restoration projects were not followed up but
there were no principal differences in the restoration
practices compared to the other sites. A detailed
overview of project goals and measures undertaken to
reach them is given in Table 1. The mean length of
rehabilitated river sections was 1.2 km, and the average
cost was US$670 500 (€528 000) per site. Information
on the location of restoration sites, including their
position within the river network, is provided along with
the land use in the catchment (CORINE land cover
data) in Appendices A and B. Settlement area,
agricultural area (with sub-types arable land and
permanent crops and pastures and heterogeneous
agricultural areas), forested area, and surface water
area were differentiated. The catchment of one site was
dominated by settlement area, the catchment of eight
sites by arable land and permanent crops, five by
pastures and heterogeneous agricultural areas, and 10 by
forested area. Averaged over all sites, agricultural areas
(both sub-types combined, mean percentage 56%)
dominated the landscape, which was also reflected in a
high level of nutrients. In particular, total phosphorus
was critical at 20 out of 24 sites (.0.3 mg/L; data
available online).2,3 Stream order of the restoration sites
were determined on 1:50 000 maps (TOP 50 Hessen and
TOP 50 Nordrhein-Westfalen; Geogrid-Viewer 1.1,
EADS Deutschland GmbH, Munich, Germany).
Sampling design
Benthic invertebrates were sampled in all sections (N
¼ 48 sections), following the official EU Water
Framework Directive (WFD) compliant sampling pro-
tocol applied in Germany (Haase et al. 2004a). Multi-
habitat samples, which reflect the proportion of the
microhabitat types that are present with �5% cover,
were taken from each river section. At each section, 20
sample units were taken, each notionally 25 3 25 cm in
size, resulting in ;1.25 m2 of river bottom being
sampled. All samples were taken from March to July
in 2007 and 2008, according to the protocol for
collecting samples in river monitoring programs to
assess the ecological status of rivers in Germany. At
each site, samples of the restored and control sections
were taken on the same day by the same person.
The sample material was preserved in 70% ethanol
and was transferred to the laboratory where it was
sorted following the method of Haase et al. (2004a, b).
Taxa were identified to the level proposed by Haase et
2 hhttp://www2.hmuelv.hessen.de/umwelt/wasser/wrrl/stadtlandfluss/hessen/ergebnisogdetail//i
3 hhttp://www.elwasims.nrw.de/ims/ELWAS-IMS/viewer.htmi
September 2011 1963EVALUATING RIVER RESTORATION
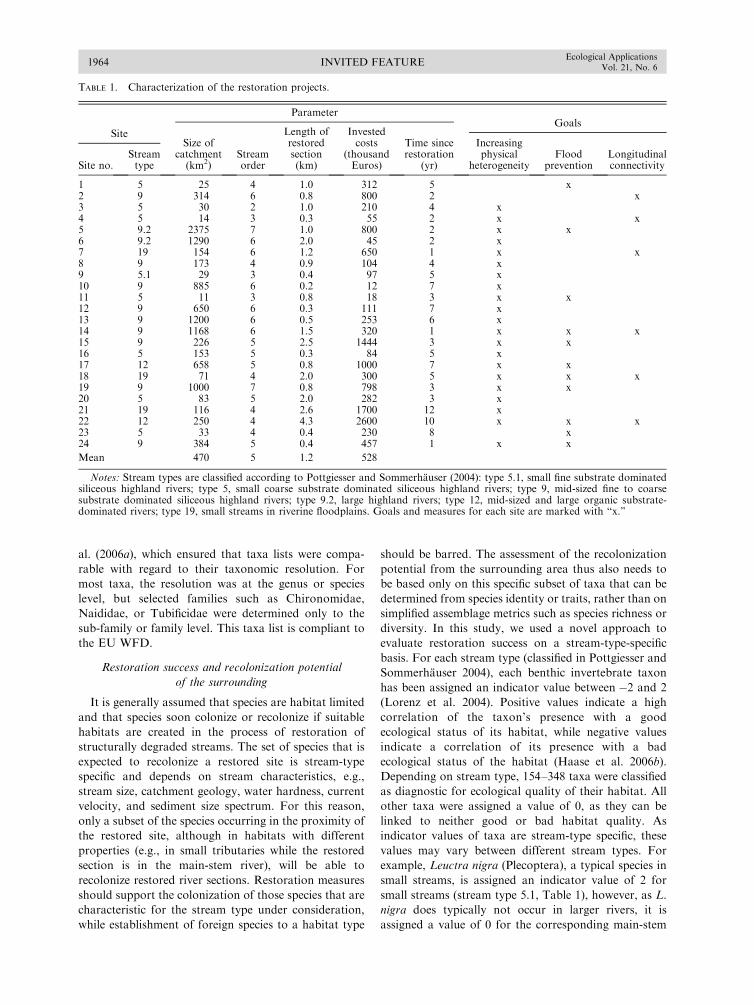
al. (2006a), which ensured that taxa lists were compa-
rable with regard to their taxonomic resolution. For
most taxa, the resolution was at the genus or species
level, but selected families such as Chironomidae,
Naididae, or Tubificidae were determined only to the
sub-family or family level. This taxa list is compliant to
the EU WFD.
Restoration success and recolonization potential
of the surrounding
It is generally assumed that species are habitat limited
and that species soon colonize or recolonize if suitable
habitats are created in the process of restoration of
structurally degraded streams. The set of species that is
expected to recolonize a restored site is stream-type
specific and depends on stream characteristics, e.g.,
stream size, catchment geology, water hardness, current
velocity, and sediment size spectrum. For this reason,
only a subset of the species occurring in the proximity of
the restored site, although in habitats with different
properties (e.g., in small tributaries while the restored
section is in the main-stem river), will be able to
recolonize restored river sections. Restoration measures
should support the colonization of those species that are
characteristic for the stream type under consideration,
while establishment of foreign species to a habitat type
should be barred. The assessment of the recolonization
potential from the surrounding area thus also needs to
be based only on this specific subset of taxa that can be
determined from species identity or traits, rather than on
simplified assemblage metrics such as species richness or
diversity. In this study, we used a novel approach to
evaluate restoration success on a stream-type-specific
basis. For each stream type (classified in Pottgiesser and
Sommerhauser 2004), each benthic invertebrate taxon
has been assigned an indicator value between �2 and 2
(Lorenz et al. 2004). Positive values indicate a high
correlation of the taxon’s presence with a good
ecological status of its habitat, while negative values
indicate a correlation of its presence with a bad
ecological status of the habitat (Haase et al. 2006b).
Depending on stream type, 154–348 taxa were classified
as diagnostic for ecological quality of their habitat. All
other taxa were assigned a value of 0, as they can be
linked to neither good or bad habitat quality. As
indicator values of taxa are stream-type specific, these
values may vary between different stream types. For
example, Leuctra nigra (Plecoptera), a typical species in
small streams, is assigned an indicator value of 2 for
small streams (stream type 5.1, Table 1), however, as L.
nigra does typically not occur in larger rivers, it is
assigned a value of 0 for the corresponding main-stem
TABLE 1. Characterization of the restoration projects.
Site
ParameterGoals
Site no.Streamtype
Size ofcatchment(km2)
Streamorder
Length ofrestoredsection(km)
Investedcosts
(thousandEuros)
Time sincerestoration
(yr)
Increasingphysical
heterogeneityFlood
preventionLongitudinalconnectivity
1 5 25 4 1.0 312 5 x2 9 314 6 0.8 800 2 x3 5 30 2 1.0 210 4 x4 5 14 3 0.3 55 2 x x5 9.2 2375 7 1.0 800 2 x x6 9.2 1290 6 2.0 45 2 x7 19 154 6 1.2 650 1 x x8 9 173 4 0.9 104 4 x9 5.1 29 3 0.4 97 5 x10 9 885 6 0.2 12 7 x11 5 11 3 0.8 18 3 x x12 9 650 6 0.3 111 7 x13 9 1200 6 0.5 253 6 x14 9 1168 6 1.5 320 1 x x x15 9 226 5 2.5 1444 3 x x16 5 153 5 0.3 84 5 x17 12 658 5 0.8 1000 7 x x18 19 71 4 2.0 300 5 x x x19 9 1000 7 0.8 798 3 x x20 5 83 5 2.0 282 3 x21 19 116 4 2.6 1700 12 x22 12 250 4 4.3 2600 10 x x x23 5 33 4 0.4 230 8 x24 9 384 5 0.4 457 1 x x
Mean 470 5 1.2 528
Notes: Stream types are classified according to Pottgiesser and Sommerhauser (2004): type 5.1, small fine substrate dominatedsiliceous highland rivers; type 5, small coarse substrate dominated siliceous highland rivers; type 9, mid-sized fine to coarsesubstrate dominated siliceous highland rivers; type 9.2, large highland rivers; type 12, mid-sized and large organic substrate-dominated rivers; type 19, small streams in riverine floodplains. Goals and measures for each site are marked with ‘‘x.’’
INVITED FEATURE1964Ecological Applications
Vol. 21, No. 6
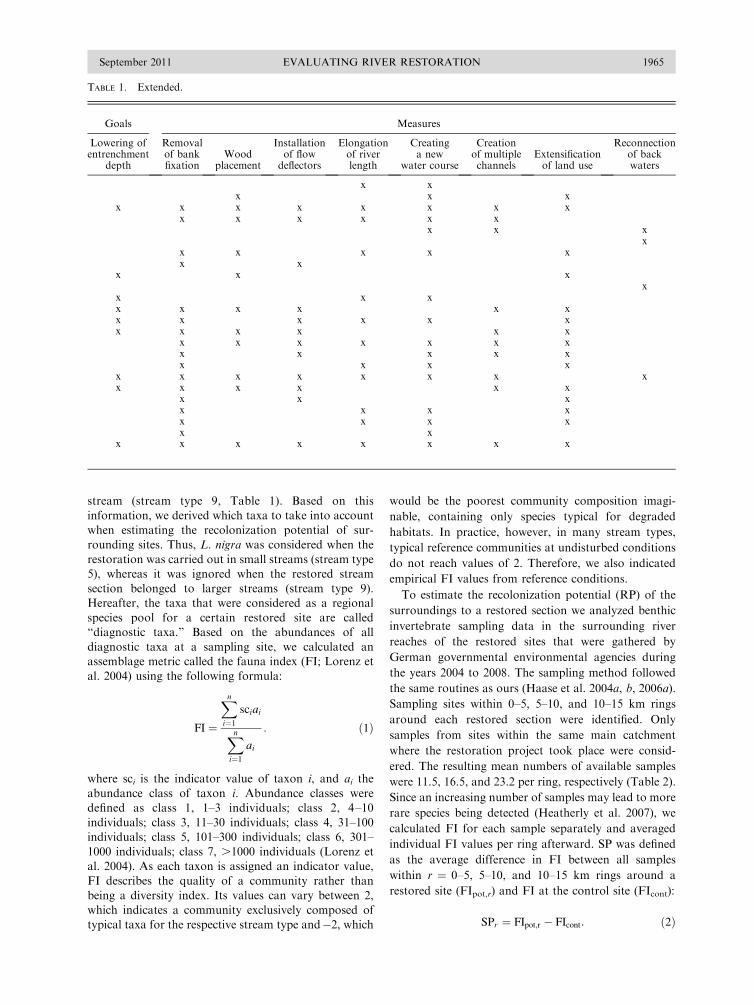
stream (stream type 9, Table 1). Based on this
information, we derived which taxa to take into accountwhen estimating the recolonization potential of sur-
rounding sites. Thus, L. nigra was considered when the
restoration was carried out in small streams (stream type5), whereas it was ignored when the restored stream
section belonged to larger streams (stream type 9).Hereafter, the taxa that were considered as a regional
species pool for a certain restored site are called‘‘diagnostic taxa.’’ Based on the abundances of all
diagnostic taxa at a sampling site, we calculated anassemblage metric called the fauna index (FI; Lorenz et
al. 2004) using the following formula:
FI ¼
Xn
i¼1
sciai
Xn
i¼1
ai
: ð1Þ
where sci is the indicator value of taxon i, and ai the
abundance class of taxon i. Abundance classes weredefined as class 1, 1–3 individuals; class 2, 4–10
individuals; class 3, 11–30 individuals; class 4, 31–100individuals; class 5, 101–300 individuals; class 6, 301–
1000 individuals; class 7, .1000 individuals (Lorenz etal. 2004). As each taxon is assigned an indicator value,
FI describes the quality of a community rather than
being a diversity index. Its values can vary between 2,which indicates a community exclusively composed of
typical taxa for the respective stream type and�2, which
would be the poorest community composition imagi-
nable, containing only species typical for degraded
habitats. In practice, however, in many stream types,
typical reference communities at undisturbed conditions
do not reach values of 2. Therefore, we also indicated
empirical FI values from reference conditions.
To estimate the recolonization potential (RP) of the
surroundings to a restored section we analyzed benthic
invertebrate sampling data in the surrounding river
reaches of the restored sites that were gathered by
German governmental environmental agencies during
the years 2004 to 2008. The sampling method followed
the same routines as ours (Haase et al. 2004a, b, 2006a).
Sampling sites within 0–5, 5–10, and 10–15 km rings
around each restored section were identified. Only
samples from sites within the same main catchment
where the restoration project took place were consid-
ered. The resulting mean numbers of available samples
were 11.5, 16.5, and 23.2 per ring, respectively (Table 2).
Since an increasing number of samples may lead to more
rare species being detected (Heatherly et al. 2007), we
calculated FI for each sample separately and averaged
individual FI values per ring afterward. SP was defined
as the average difference in FI between all samples
within r ¼ 0–5, 5–10, and 10–15 km rings around a
restored site (FIpot,r) and FI at the control site (FIcont):
SPr ¼ FIpot;r � FIcont: ð2Þ
TABLE 1. Extended.
Goals Measures
Lowering ofentrenchment
depth
Removalof bankfixation
Woodplacement
Installationof flow
deflectors
Elongationof riverlength
Creatinga new
water course
Creationof multiplechannels
Extensificationof land use
Reconnectionof backwaters
x xx x x
x x x x x x x xx x x x x x
x x xx
x x x x xx x
x x xx
x x xx x x x x xx x x x x xx x x x x x
x x x x x x xx x x x xx x x x
x x x x x x x xx x x x x x
x x xx x x xx x x xx x
x x x x x x x x
September 2011 1965EVALUATING RIVER RESTORATION
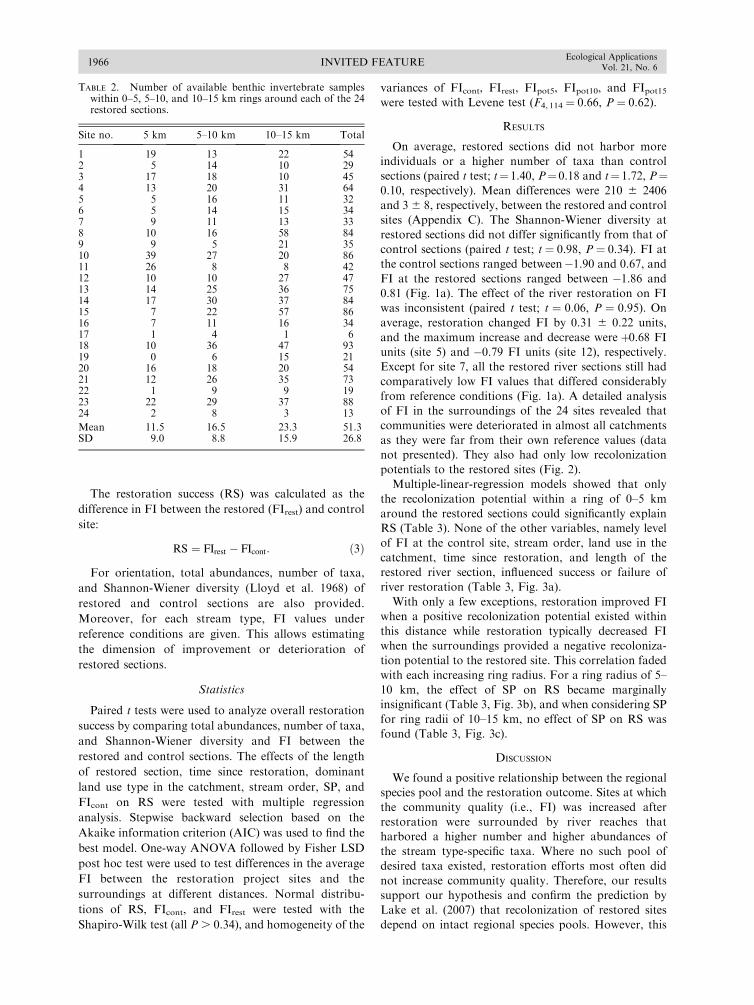
The restoration success (RS) was calculated as the
difference in FI between the restored (FIrest) and control
site:
RS ¼ FIrest � FIcont: ð3Þ
For orientation, total abundances, number of taxa,
and Shannon-Wiener diversity (Lloyd et al. 1968) of
restored and control sections are also provided.
Moreover, for each stream type, FI values under
reference conditions are given. This allows estimating
the dimension of improvement or deterioration of
restored sections.
Statistics
Paired t tests were used to analyze overall restoration
success by comparing total abundances, number of taxa,
and Shannon-Wiener diversity and FI between the
restored and control sections. The effects of the length
of restored section, time since restoration, dominant
land use type in the catchment, stream order, SP, and
FIcont on RS were tested with multiple regression
analysis. Stepwise backward selection based on the
Akaike information criterion (AIC) was used to find the
best model. One-way ANOVA followed by Fisher LSD
post hoc test were used to test differences in the average
FI between the restoration project sites and the
surroundings at different distances. Normal distribu-
tions of RS, FIcont, and FIrest were tested with the
Shapiro-Wilk test (all P . 0.34), and homogeneity of the
variances of FIcont, FIrest, FIpot5, FIpot10, and FIpot15were tested with Levene test (F4, 114 ¼ 0.66, P ¼ 0.62).
RESULTS
On average, restored sections did not harbor more
individuals or a higher number of taxa than control
sections (paired t test; t¼ 1.40, P¼ 0.18 and t¼ 1.72, P¼0.10, respectively). Mean differences were 210 6 2406
and 3 6 8, respectively, between the restored and control
sites (Appendix C). The Shannon-Wiener diversity at
restored sections did not differ significantly from that of
control sections (paired t test; t ¼ 0.98, P ¼ 0.34). FI at
the control sections ranged between�1.90 and 0.67, and
FI at the restored sections ranged between �1.86 and
0.81 (Fig. 1a). The effect of the river restoration on FI
was inconsistent (paired t test; t ¼ 0.06, P ¼ 0.95). On
average, restoration changed FI by 0.31 6 0.22 units,
and the maximum increase and decrease were þ0.68 FI
units (site 5) and �0.79 FI units (site 12), respectively.
Except for site 7, all the restored river sections still had
comparatively low FI values that differed considerably
from reference conditions (Fig. 1a). A detailed analysis
of FI in the surroundings of the 24 sites revealed that
communities were deteriorated in almost all catchments
as they were far from their own reference values (data
not presented). They also had only low recolonization
potentials to the restored sites (Fig. 2).
Multiple-linear-regression models showed that only
the recolonization potential within a ring of 0–5 km
around the restored sections could significantly explain
RS (Table 3). None of the other variables, namely level
of FI at the control site, stream order, land use in the
catchment, time since restoration, and length of the
restored river section, influenced success or failure of
river restoration (Table 3, Fig. 3a).
With only a few exceptions, restoration improved FI
when a positive recolonization potential existed within
this distance while restoration typically decreased FI
when the surroundings provided a negative recoloniza-
tion potential to the restored site. This correlation faded
with each increasing ring radius. For a ring radius of 5–
10 km, the effect of SP on RS became marginally
insignificant (Table 3, Fig. 3b), and when considering SP
for ring radii of 10–15 km, no effect of SP on RS was
found (Table 3, Fig. 3c).
DISCUSSION
We found a positive relationship between the regional
species pool and the restoration outcome. Sites at which
the community quality (i.e., FI) was increased after
restoration were surrounded by river reaches that
harbored a higher number and higher abundances of
the stream type-specific taxa. Where no such pool of
desired taxa existed, restoration efforts most often did
not increase community quality. Therefore, our results
support our hypothesis and confirm the prediction by
Lake et al. (2007) that recolonization of restored sites
depend on intact regional species pools. However, this
TABLE 2. Number of available benthic invertebrate sampleswithin 0–5, 5–10, and 10–15 km rings around each of the 24restored sections.
Site no. 5 km 5–10 km 10–15 km Total
1 19 13 22 542 5 14 10 293 17 18 10 454 13 20 31 645 5 16 11 326 5 14 15 347 9 11 13 338 10 16 58 849 9 5 21 3510 39 27 20 8611 26 8 8 4212 10 10 27 4713 14 25 36 7514 17 30 37 8415 7 22 57 8616 7 11 16 3417 1 4 1 618 10 36 47 9319 0 6 15 2120 16 18 20 5421 12 26 35 7322 1 9 9 1923 22 29 37 8824 2 8 3 13
Mean 11.5 16.5 23.3 51.3SD 9.0 8.8 15.9 26.8
INVITED FEATURE1966Ecological Applications
Vol. 21, No. 6

study also raises the issue that the recolonization
potential of a restored river section cannot be measuredbased on unspecific metrics like taxa richness or diversity
indices—especially because only a subset of the species
occurring in the proximity of the restored site will beable to recolonize formerly degraded sections.
Moreover, many re-colonizing taxa do not necessarily
mean that the quality of the community at restoredsections is improved. Hence, a stream-type-specific
approach is necessary, focusing on the set of diagnostic
taxa for the individual stream type. In our study, theregional species pools of diagnostic taxa were however
in most cases much less diverse than would have beendesirable. This catchment-scale impoverishment of the
species pool is likely the reason that, even in restoration
projects that yielded an increase in FI, the increase wasvery limited.
We cannot preclude that with an average period of 4.5
years since the restoration projects were implemented,
recolonization was still in progress at some sites, and thefinal result was not measurable. Langford et al. (2009)
showed that recolonization of heavily deteriorated sites
may still be in progress 30–50 years after the improve-ment of the habitat conditions. Furthermore, some
species that recolonized the restored section at very low
numbers may have remained undetected by our sam-pling method. In the long-term, especially aquatic
insects with winged adult stages might have the potentialto recolonize restored habitats from neighboring catch-
ments (Briers et al. 2004).
On shorter time scales, however, our study indicates
that dispersal of benthic invertebrate taxa over distances
larger than 5 km is uncommon. Field studies using mark–
recapture experiments or light traps show that flightdispersal typically occurs along water bodies within a
corridor of no more than a few meters to 100 m in width
(Petersen et al. 1999, MacNeale et al. 2005). Directobservations of long distance overland dispersal in
aquatic insects are rare, due to methodological problems
with mark–recapture techniques in small specimens andthe dilution effect in the landscape (but see Coutant
1982), among other reasons. Thus, direct detection of
long-term dispersal will probably underestimate truedispersal. Studies analyzing the genetic relationship of
aquatic populations evade these methodological weak-
nesses. Genetic studies, in particular those based onmicrosatellite markers, can provide insight into recent
dispersal events, however, they may also suffer from
other methodological and conceptual weaknesses (re-viewed in De Meester et al. [2002] and Bohonak and
Jenkins [2003]). Microsatellite studies analyzing the
population structure of benthic invertebrates delivercontrasting results for different species. While Plec-
trocnemia conspersa (Trichoptera), for example, is
suggested to be a strong disperser, facilitating gene flowwithin and between catchments, Polycentropus flavoma-
culatus showed strong genetic differentiation, indicating
much more limited dispersal propensities (Wilcock et al.2007). Even in the taxonomic group of damselflies, who
are generally believed to be comparatively strong flyers,
Coenagrion mercuriale (Odonata) turned out to be a poordisperser (Watts et al. 2005). Thus, our understanding of
feasible dispersal distances and mechanisms driving
dispersal patterns of benthic invertebrates in rivers is
FIG. 1. (a) Fauna index (FI) of the individual restoration projects, at the restored (solid circles) and at the control (open circles)sites. FI values for stream-type-specific reference conditions are also given (3). The site names correspond to the numbers given inTable 1. (b) FI at the restored (FIrest) and control (FIcont) sites, as well as in the surroundings of the restoration projects at siteswithin 0–5, 5–10, and 10–15 km rings (FIpot,5, FIpot,10, and FIpot,15, respectively). Significant differences according to ANOVA/Fisher LSD post hoc test are indicated with different letters above the boxplots. Boxes indicate the 25th and 75th percentiles, barsindicate the 10th and 90th percentiles, dots indicate the 5th and 95th percentiles, and mid lines show the mean.
September 2011 1967EVALUATING RIVER RESTORATION

still restricted. Dispersal of aquatic stages of benthicinvertebrate species is even more limited. For these,
dispersal is generally believed to be more effectivedownstream because of passive drift (Williams and
Williams 1993, Turner and Williams 2000); yet, driftingdistances are typically short (Elliott 2003).
In addition to dispersal capabilities of benthicinvertebrates and the time that is needed for recoloniza-
FIG. 2. FI in the surroundings of the 24 restoration sites within 0–5, 5–10, and 10–15 km rings centered on the restored sites(from left to right, respectively). At site 19, no data were available within the ring of 0–5 km. Site names correspond to the numbersin Table 1.
TABLE 3. Results of the backward selection of variables explaining restoration success in amultiple linear modeling approach, minimizing the Akaike information criterion (AIC).
Model AIC Null dev Res dev Variables df t P
Start 34.28 SPr 1FIcont 1stream order 1land use 3length 1age 1
0–5 km 21.69 3.3 2.7 SP5 1 2.24 0.0365–10 km 23.62 3.4 2.9 SP10 1 1.84 0.07910–15 km 25.04 3.4 3.1 FIcont 1 �1.39 0.18
Note: The initial model is shown (start), as are the best models with minimal AIC after backwardselection for radii of 0–5 km, 5–10 km, and 10–15 km. SPr is the recolonization potential within thering r, FIcont is the fauna index at the control section, stream order is the stream order of therestored site, land use gives the dominant land use type in the catchment in which the restorationwas performed, and age is the number of years since the restoration was carried out. For theoutcome models, null deviance (null dev), residual deviance (res dev), and degrees of freedom (df)are given.
INVITED FEATURE1968Ecological Applications
Vol. 21, No. 6
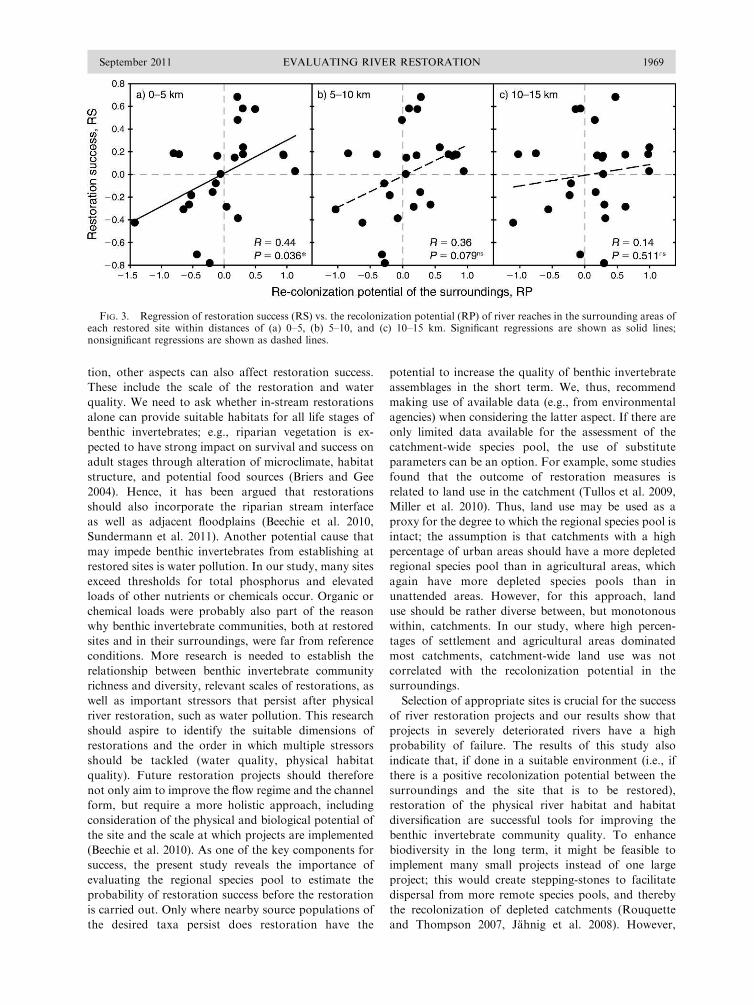
tion, other aspects can also affect restoration success.
These include the scale of the restoration and water
quality. We need to ask whether in-stream restorations
alone can provide suitable habitats for all life stages of
benthic invertebrates; e.g., riparian vegetation is ex-
pected to have strong impact on survival and success on
adult stages through alteration of microclimate, habitat
structure, and potential food sources (Briers and Gee
2004). Hence, it has been argued that restorations
should also incorporate the riparian stream interface
as well as adjacent floodplains (Beechie et al. 2010,
Sundermann et al. 2011). Another potential cause that
may impede benthic invertebrates from establishing at
restored sites is water pollution. In our study, many sites
exceed thresholds for total phosphorus and elevated
loads of other nutrients or chemicals occur. Organic or
chemical loads were probably also part of the reason
why benthic invertebrate communities, both at restored
sites and in their surroundings, were far from reference
conditions. More research is needed to establish the
relationship between benthic invertebrate community
richness and diversity, relevant scales of restorations, as
well as important stressors that persist after physical
river restoration, such as water pollution. This research
should aspire to identify the suitable dimensions of
restorations and the order in which multiple stressors
should be tackled (water quality, physical habitat
quality). Future restoration projects should therefore
not only aim to improve the flow regime and the channel
form, but require a more holistic approach, including
consideration of the physical and biological potential of
the site and the scale at which projects are implemented
(Beechie et al. 2010). As one of the key components for
success, the present study reveals the importance of
evaluating the regional species pool to estimate the
probability of restoration success before the restoration
is carried out. Only where nearby source populations of
the desired taxa persist does restoration have the
potential to increase the quality of benthic invertebrate
assemblages in the short term. We, thus, recommend
making use of available data (e.g., from environmental
agencies) when considering the latter aspect. If there are
only limited data available for the assessment of the
catchment-wide species pool, the use of substitute
parameters can be an option. For example, some studies
found that the outcome of restoration measures is
related to land use in the catchment (Tullos et al. 2009,
Miller et al. 2010). Thus, land use may be used as a
proxy for the degree to which the regional species pool is
intact; the assumption is that catchments with a high
percentage of urban areas should have a more depleted
regional species pool than in agricultural areas, which
again have more depleted species pools than in
unattended areas. However, for this approach, land
use should be rather diverse between, but monotonous
within, catchments. In our study, where high percen-
tages of settlement and agricultural areas dominated
most catchments, catchment-wide land use was not
correlated with the recolonization potential in the
surroundings.
Selection of appropriate sites is crucial for the success
of river restoration projects and our results show that
projects in severely deteriorated rivers have a high
probability of failure. The results of this study also
indicate that, if done in a suitable environment (i.e., if
there is a positive recolonization potential between the
surroundings and the site that is to be restored),
restoration of the physical river habitat and habitat
diversification are successful tools for improving the
benthic invertebrate community quality. To enhance
biodiversity in the long term, it might be feasible to
implement many small projects instead of one large
project; this would create stepping-stones to facilitate
dispersal from more remote species pools, and thereby
the recolonization of depleted catchments (Rouquette
and Thompson 2007, Jahnig et al. 2008). However,
FIG. 3. Regression of restoration success (RS) vs. the recolonization potential (RP) of river reaches in the surrounding areas ofeach restored site within distances of (a) 0–5, (b) 5–10, and (c) 10–15 km. Significant regressions are shown as solid lines;nonsignificant regressions are shown as dashed lines.
September 2011 1969EVALUATING RIVER RESTORATION
dispersal via such stepping-stones may take many years
(Langford et al. 2009), which is often too long with
regard to the short-term assessment periods for restora-
tion success under environmental directives such as the
EU WFD (European Union 2000). Where populations
are depleted at the catchment scale, assisted migrations
from the nearest source population may offer a tool to
support establishment of desired taxa (Layzer and Scott
2006, Smith et al. 2009, Vitt et al. 2009). Even though
highly controversial (Ricciardi and Simberloff 2009,
among others), this tool may be the only measure to
attain the goal of increased biodiversity in large-scale
degraded catchments over relevant time scales for water
management, especially for species with very low
dispersal capabilities. Therefore, we feel that a broader
discussion is needed regarding the time frame for
evaluating restoration success and the risks and benefits
of assisted migrations as a potential tool in river
restorations (McLachlan et al. 2007, Mueller and
Hellmann 2008).
ACKNOWLEDGMENTS
This study was financed by Deutsche Bundesstiftung Umwelt(DBU), the Hesse’s Ministry of Environment, and the researchfunding program LOEWE (Landes-Offensive zur EntwicklungWissenschaftlich-oekonomischer Exzellenz) of Hesse’s Ministryof Higher Education, Research, and the Arts. Data about thesurroundings of the restoration projects were provided by theHessisches Landesamt fur Umwelt und Geologie and theLandesamt fur Natur, Umwelt und Verbraucherschutz NRW.We thank three anonymous referees for comments on an earlierversion of this manuscript. The first and second authorscontributed equally to this work.
LITERATURE CITED
Beechie, T. J., D. A. Sear, J. D. Olden, G. R. Pess, J. M.Buffington, H. Moir, P. Roni, and M. M. Pollock. 2010.Process-based principles for restoring river ecosystems.BioScience 60:209–222.
Bernhardt, E. S., et al. 2005. Synthesizing U.S. river restorationefforts. Science 308:636–637.
Blakely, T. J., J. S. Harding, A. R. McIntosh, and M. J.Winterbourn. 2006. Barriers to the recovery of aquatic insectcommunities in urban streams. Freshwater Biology 51:1634–1645.
Bohonak, A. J., and D. G. Jenkins. 2003. Ecological andevolutionary significance of dispersal by freshwater inverte-brates. Ecology Letters 6:783–796.
Briers, R. A., and J. H. R. Gee. 2004. Riparian forestrymanagement and adult stream insects. Hydrology and EarthSystem Sciences 8:545–549.
Briers, R. A., J. H. R. Gee, H. M. Cariss, and R. Goeghegan.2004. Inter-population dispersal by adult stoneflies detectedby stable isotope enrichment. Freshwater Biology 49:425–431.
Cornell, H. V., and J. H. Lawton. 1992. Species interactions,local and regional processes, and limits to richness ofecological communities: a theoretical perspective. Journalof Animal Ecology 61:1–12.
Coutant, C. C. 1982. Evidence of upstream dispersion of adultcaddisflies (Trichoptera: Hydropsychidae) in the ColumbiaRiver. Aquatic Insects 4:61–66.
De Meester, L., A. Gomez, B. Okamura, and K. Schwenk.2002. The Monopolization Hypothesis and the dispersal–gene flow paradox in aquatic organisms. Acta Oecologica23:121–135.
Dudgeon, D., A. H. Arthington, M. O. Gessner, Z.-I.Kawabata, D. J. Knowler, C. Leveque, R. J. Naiman,A.-H. Prieur-Richard, D. Soto, M. L. J. Stiassny, and C. A.Sullivan. 2006. Freshwater biodiversity: importance, threats,status and conservation challenges. Biological Reviews81:163–182.
Elliott, J. M. 2003. A comparative study of the dispersal of 10species of stream invertebrates. Freshwater Biology 48:1652–1668.
European Union. 2000. Directive 2000/60/EC. Establishing aframework for community action in the field of water policy.European Commission PE-Cons 3639/1/100 Rev 1, Lux-emburg.
Haase, P., S. Lohse, S. Pauls, K. Schindehutte, A. Sundermann,P. Rolauffs, and D. Hering. 2004a. Assessing streams inGermany with benthic invertebrates: development of apractical standardized protocol for macroinvertebrate sam-pling and sorting. Limnologica 34:349–365.
Haase, P., J. Murray-Bligh, S. Lohse, S. Pauls, A. Sundermann,R. Gunn, and R. Clarke. 2006a. Assesing the impact of errorin sorting and identifying macroinvertebrate samples.Hydrobiologia 566:505–521.
Haase, P., S. Pauls, A. Sundermann, and A. Zenker. 2004b.Testing different sorting techniques in macroinvertebratesamples from running waters. Limnologica 34:366–378.
Haase, P., A. Sundermann, and K. Schindehutte. 2006b.Operationelle Taxaliste als Mindestanforderung an dieBestimmung von Makrozoobenthosproben aus Fliebgewassernzur Umsetzung der EU-Wasserrahmenrichtlinie in Deutschland.University of Duisburg-Essen, Essen, Germany. hhttp://www.fliessgewaesserbewertung.de/download/bestimmungi
Heatherly, T., M. R. Whiles, D. J. Gibson, S. L. Collins, A. D.Huryn, J. K. Jackson, and M. A. Palmer. 2007. Stream insectoccupancy–frequency patterns and metapopulation struc-ture. Oecologia 151:313–321.
Hughes, J. M. 2007. Constraints on recovery: using molecularmethods to study connectivity of aquatic biota in rivers andstreams. Freshwater Biology 52:616–631.
Ims, R. A. 1995. Movement patterns related to spatialstructures. Pages 85–109 in L. Hansson, L. Farig, and G.Merriam, editors. Mosaic landscapes and ecological pro-cesses. Chapman and Hall, London, UK.
Jahnig, S. C., A. Lorenz, and D. Hering. 2008.Hydromorphological parameters indicating differences be-tween single- and multiple-channel mountain rivers inGermany, in relation to their modification and recovery.Aquatic Conservation: Marine and Freshwater Ecosystems18:1200–1216.
Jahnig, S. C., A. W. Lorenz, D. Hering, C. Antons, A.Sundermann, E. Jedicke, and P. Haase. 2011. River restora-tion success: a question of perception. EcologicalApplications 21:2007–2015.
Kelly, L. C., D. T. Bilton, and S. D. Rundle. 2001. Populationstructure and dispersal in the Canary Island caddisflyMesophylax asperus (Trichoptera, Limnephilidae). Heredity86:370–377.
Kovats, Z. E., J. J. H. Ciborowski, and L. D. Corkum. 1996.Inland dispersal of adult aquatic insects. Freshwater Biology36:265–276.
Kowalik, R. A., and S. J. Ormerod. 2006. Intensive samplingand transplantation experiments reveal continued effects ofepisodic acidification on sensitive stream invertebrates.Freshwater Biology 51:180–191.
Lake, P. S., N. Bond, and P. Reich. 2007. Linking ecologicaltheory with stream restoration. Freshwater Biology 52:597–615.
Langford, T. E. L., P. J. Shaw, A. J. D. Ferguson, and S. R.Howard. 2009. Long-term recovery of macroinvertebratebiota in grossly polluted streams: re-colonisation as aconstraint to ecological quality. Ecological Indicators9:1064–1077.
INVITED FEATURE1970Ecological Applications
Vol. 21, No. 6
Layzer, J. B., and E. M. Scott. 2006. Restoration andcolonization of freshwater mussels and fish in a southeasternUnited States tailwater. River Research and Applications22:475–491.
Lehmkuhl, D. M. 1972. Change in thermal regime as a cause ofreduction of the benthic fauna downstream of a reservoir.Journal of the Fisheries Research Board Canada 29:1329–1332.
Lloyd, H., J. H. Zar, and J. R. Karr. 1968. On the calculation ofinformation: theoretical measures of diversity. AmericanMidland Naturalist 79:257–272.
Lorenz, A., D. Hering, C. Feld, and P. Rolauffs. 2004. A newmethod for assessing the impact of hydromorphologicaldegradation on the macroinvertebrate fauna of five Germanstream types. Hydrobiologia 516:107–127.
MacNeale, K., B. Peckarsky, and G. Likens. 2005. Stableisotopes identify dispersal patterns of stonefly populationsliving along stream corridors. Freshwater Biology 50:1117–1130.
Masters, Z., I. Peteresen, A. G. Hildrew, and S. J. Ormerod.2007. Insect dispersal does not limit the biological recovery ofstreams from acidification. Aquatic Conservation: Marineand Freshwater Ecosystems 17:375–383.
McLachlan, J. S., J. J. Hellmann, and M. W. Schwartz. 2007. Aframework for debate of assisted migration in an era ofclimate change. Conservation Biology 21:297–302.
Miller, S. W., P. Budy, and J. C. Schmidt. 2010. Quantifyingmacroinvertebrate responses to in-stream habitat restoration:application of meta-analysis to river restoration. RestorationEcology 18:8–19.
Mueller, J. M., and J. J. Hellmann. 2008. An assessment ofinvasion risk from assisted migration. Conservation Biology22:562–567.
Palmer, M. A. 2009. Reforming watershed restoration: sciencein need of application and applications in need of science.Estuaries and Coasts 32:1–17.
Palmer, M. A., et al., editors. 2005. Standards for ecologicallysuccessful river restoration. Journal of Applied Ecology.42:208–217.
Palmer, M. A., H. L. Menninger, and E. Bernhardt. 2010. Riverrestoration, habitat heterogeneity and biodiversity: a failureof theory or practice? Freshwater Biology 55:205–222.
Petersen, I., Z. Masters, A. G. Hildrew, and S. J. Ormerod.2004. Dispersal of adult aquatic insects in catchments ofdiffering land use. Journal of Applied Ecology 41:934–950.
Petersen, I., J. H. Winterbottom, S. Orton, N. Friberg, A. G.Hildrew, D. C. Spiers, and W. S. C. Gurney. 1999.Emergence and lateral dispersal of adult Plecoptera andTrichoptera from Broadstone Stream, UK. FreshwaterBiology 42:401–416.
Pottgiesser, T., and M. Sommerhauser. 2004. Fließge-wassertypologie Deutschlands: die Gewassertypen und ihreSteckbriefe als Beitrag zur Umsetzung der EU-
Wasserrahmenrichtlinie. Pages 1–16 and appendix in C.Steinberg, W. Calmano, R.-D. Wilken, and H. Klapper,editors. Handbuch der Limnologie 19. VIII-2.1. VerlagEcomed, Landsberg/Lech, Germany.
Ricciardi, A., and D. Simberloff. 2009. Assisted colonization isnot a viable conservation strategy. Trends in Ecology andEvolution 24:248–253.
Ricklefs, R. E., and D. Schluter. 1993. Species diversity inecological communities: historical and geographical perspec-tives. University of Chicago Press, Chicago, Illinois, USA.
Rouquette, J. R., and D. J. Thompson. 2007. Patterns ofmovement and dispersal in an endangered damselfly and theconsequences for its management. Journal of AppliedEcology 44:692–701.
Smith, R. F., L. C. Alexander, and W. O. Lamp. 2009.Dispersal by terrestrial stages of stream insects in urbanwatersheds: a synthesis of current knowledge. Journal of theNorth American Benthological Society 28:1022–1037.
Sundermann, A., C. Antons, N. Cron, A. W. Lorenz, D.Hering, and P. Haase. 2011. Hydromorphological restorationof running waters: effects on benthic invertebrate assem-blages. Freshwater Biology. [doi:10.1111/j.1365-2427.2011.02599.x]
Tullos, D., D. L. Penrose, G. D. Jennings, and W. G. Cope.2009. Analysis of functional traits in reconfigured channels:implications for the bioassessment and disturbance of riverrestoration. Journal of the North American BenthologicalSociety 28:80–92.
Turner, D., and D. D. Williams. 2000. Invertebrate movementswithin a small stream: density dependence or compensatingfor drift? International Review of Hydrobiology 85:141–156.
Vitt, P., K. Havens, and O. Hoegh-Guldberg. 2009. Assistedmigration: part of an integrated conservation strategy.Trends in Ecology and Evolution 24:473–474.
Watts, P. C., S. J. Kemp, I. J. Saccheri, and D. J. Thompson.2005. Conservation implications of genetic variation betweenspatially and temporally distinct colonies of the endangereddamselfly Coenagrion mercuriale. Ecological Entomology30:541–547.
Wilcock, H. R., M. W. Bruford, R. A. Nichols, and A. G.Hildrew. 2007. Landscape, habitat characteristics and thegenetic population structure of two caddisflies. FreshwaterBiology 52:1907–1929.
Wilcock, H. R., R. A. Nichols, and A. G. Hildrew. 2003.Genetic population structure and neighborhood populationsize estimates of the caddisfly Plectrocnemia conspersa.Freshwater Biology 48:1813–1824.
Williams, D. D., and N. E. Williams. 1993. The upstream/downstream paradox of lotic invertebrates: quantitativeevidence from a Welsh mountain stream. FreshwaterBiology 30:199–218.
Zwick, P. 1992. Stream habitat fragmentation: a threat tobiodiversity. Biodiversity and Conservation 1:80–97.
APPENDIX A
Location of each restoration project in Germany, including its position within the river network and the land use in thecatchment draining to each restoration site (Ecological Archives A021-088-A1).
APPENDIX B
Land use in the catchments of restored river sections (Ecological Archives A021-088-A2).
APPENDIX C
Abundances, number of taxa, and Shannon-Wiener diversity indices for restored and control sections (Ecological ArchivesA021-088-A3).
September 2011 1971EVALUATING RIVER RESTORATION
Ecological Applications, 21(6), 2011, pp. 1972–1988� 2011 by the Ecological Society of America
Testing the Field of Dreams Hypothesis: functional responsesto urbanization and restoration in stream ecosystems
ELIZABETH B. SUDDUTH,1,3 BROOKE A. HASSETT,1 PETER CADA,2,4 AND EMILY S. BERNHARDT1
1Department of Biology, Duke University, Durham, North Carolina 27708 USA2Nicholas School of the Environment, Duke University, Durham, North Carolina 27708 USA
Abstract. As catchments become increasingly urban, the streams that drain them becomeincreasingly degraded. Urban streams are typically characterized by high-magnitude stormflows, homogeneous habitats, disconnected riparian zones, and elevated nitrogen concen-trations. To reverse the degradation of urban water quality, watershed managers andregulators are increasingly turning to stream restoration approaches. By reshaping the channeland reconnecting the surface waters with their riparian zone, practitioners intend to enhancethe natural nutrient retention capacity of the restored stream ecosystem. Despite theexponential growth in stream restoration projects and expenditures, there has been noevaluation to date of the efficacy of urban stream restoration projects in enhancing nitrogenretention or in altering the underlying ecosystem metabolism that controls instream nitrogenconsumption. In this study, we compared ecosystem metabolism and nitrate uptake kinetics infour stream restoration projects within urban watersheds to ecosystem functions measured infour unrestored urban stream segments and four streams draining minimally impactedforested watersheds in central North Carolina, USA. All 12 sites were surveyed in Junethrough August of 2006 and again in January through March of 2007. We anticipated thaturban streams would have enhanced rates of ecosystem metabolism and nitrate uptake relativeto forested streams due to the increases in nutrient loads and temperature associated withurbanization, and we predicted that restored streams would have further enhanced rates forthese ecosystem functions by virtue of their increased habitat heterogeneity and waterresidence times. Contrary to our predictions we found that stream metabolism did not differbetween stream types in either season and that nitrate uptake kinetics were not differentbetween stream types in the winter. During the summer, restored stream reaches hadsubstantially higher rates of nitrate uptake than unrestored or forested stream reaches;however, we found that variation in stream temperature and canopy cover explained 80% ofthe variation across streams in nitrate uptake. Because the riparian trees are removed duringthe first stage of natural channel design projects, the restored streams in this study hadsignificantly less canopy cover and higher summer temperatures than the urban and forestedstreams with which they were compared.
Key words: benthic organic matter; ecosystem functions; nitrate uptake; stream ecosystem metabolism;stream restoration; transient storage; urbanization.
INTRODUCTION
In 2008, for the first time in human history, more
people live in urban than in rural areas (United Nations
2008). As low-lying lines in the landscape, the streams
draining urban watersheds are strongly affected by the
altered hydrology of urban catchments, particularly the
dramatic increases in stormwater runoff that result from
increasing impervious surface cover (ISC; Booth and
Jackson 1997). Urban watershed hydrology leads to
many physical and biological changes in the streams
(Paul and Meyer 2001), which have together been
termed the ‘‘urban stream syndrome’’ (Meyer et al.
2005, Walsh et al. 2005). The high peak flows character-
istic of urban streams tend to homogenize streambed
sediments, reduce fine- and coarse-scale flow habitat
variation, and incise stream channels leading to dis-
connected riparian zones. At the same time that urban
streams become more ‘‘pipe like,’’ urban infrastructure
(drains, pipes, sewers, roads) routes watershed contam-
inants more directly from the landscape into receiving
streams (reviewed in Bernhardt et al. 2008).
In the United States, a common strategy of stream
management is some form of stream restoration
(Bernhardt et al. 2005). Stream restoration in urban
Manuscript received 30 March 2010; revised 2 September2010; accepted 10 September 2010. Corresponding Editor: C.Nilsson. For reprints of this Invited Feature, see footnote 1, p.1925.
3 E-mail: [email protected] Present address: Tetra Tech, Raleigh, North Carolina
27709 USA.
1972
INVITED FEATUREEcological Applications
Vol. 21, No. 6
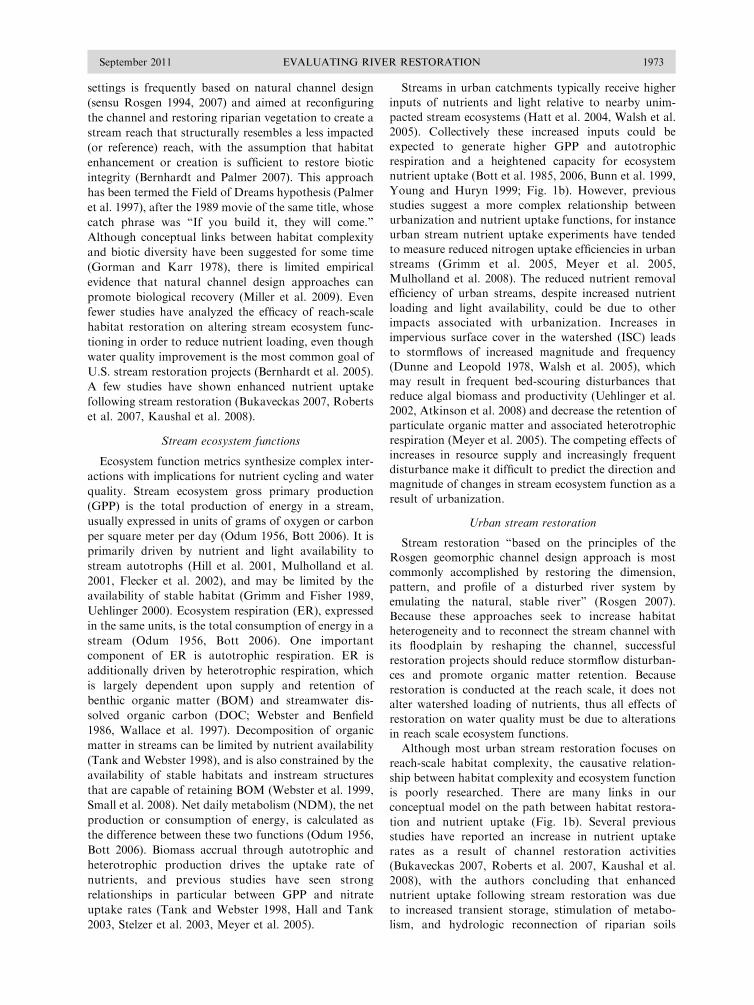
settings is frequently based on natural channel design
(sensu Rosgen 1994, 2007) and aimed at reconfiguring
the channel and restoring riparian vegetation to create a
stream reach that structurally resembles a less impacted
(or reference) reach, with the assumption that habitat
enhancement or creation is sufficient to restore biotic
integrity (Bernhardt and Palmer 2007). This approach
has been termed the Field of Dreams hypothesis (Palmer
et al. 1997), after the 1989 movie of the same title, whose
catch phrase was ‘‘If you build it, they will come.’’
Although conceptual links between habitat complexity
and biotic diversity have been suggested for some time
(Gorman and Karr 1978), there is limited empirical
evidence that natural channel design approaches can
promote biological recovery (Miller et al. 2009). Even
fewer studies have analyzed the efficacy of reach-scale
habitat restoration on altering stream ecosystem func-
tioning in order to reduce nutrient loading, even though
water quality improvement is the most common goal of
U.S. stream restoration projects (Bernhardt et al. 2005).
A few studies have shown enhanced nutrient uptake
following stream restoration (Bukaveckas 2007, Roberts
et al. 2007, Kaushal et al. 2008).
Stream ecosystem functions
Ecosystem function metrics synthesize complex inter-
actions with implications for nutrient cycling and water
quality. Stream ecosystem gross primary production
(GPP) is the total production of energy in a stream,
usually expressed in units of grams of oxygen or carbon
per square meter per day (Odum 1956, Bott 2006). It is
primarily driven by nutrient and light availability to
stream autotrophs (Hill et al. 2001, Mulholland et al.
2001, Flecker et al. 2002), and may be limited by the
availability of stable habitat (Grimm and Fisher 1989,
Uehlinger 2000). Ecosystem respiration (ER), expressed
in the same units, is the total consumption of energy in a
stream (Odum 1956, Bott 2006). One important
component of ER is autotrophic respiration. ER is
additionally driven by heterotrophic respiration, which
is largely dependent upon supply and retention of
benthic organic matter (BOM) and streamwater dis-
solved organic carbon (DOC; Webster and Benfield
1986, Wallace et al. 1997). Decomposition of organic
matter in streams can be limited by nutrient availability
(Tank and Webster 1998), and is also constrained by the
availability of stable habitats and instream structures
that are capable of retaining BOM (Webster et al. 1999,
Small et al. 2008). Net daily metabolism (NDM), the net
production or consumption of energy, is calculated as
the difference between these two functions (Odum 1956,
Bott 2006). Biomass accrual through autotrophic and
heterotrophic production drives the uptake rate of
nutrients, and previous studies have seen strong
relationships in particular between GPP and nitrate
uptake rates (Tank and Webster 1998, Hall and Tank
2003, Stelzer et al. 2003, Meyer et al. 2005).
Streams in urban catchments typically receive higher
inputs of nutrients and light relative to nearby unim-
pacted stream ecosystems (Hatt et al. 2004, Walsh et al.
2005). Collectively these increased inputs could be
expected to generate higher GPP and autotrophic
respiration and a heightened capacity for ecosystem
nutrient uptake (Bott et al. 1985, 2006, Bunn et al. 1999,
Young and Huryn 1999; Fig. 1b). However, previous
studies suggest a more complex relationship between
urbanization and nutrient uptake functions, for instance
urban stream nutrient uptake experiments have tended
to measure reduced nitrogen uptake efficiencies in urban
streams (Grimm et al. 2005, Meyer et al. 2005,
Mulholland et al. 2008). The reduced nutrient removal
efficiency of urban streams, despite increased nutrient
loading and light availability, could be due to other
impacts associated with urbanization. Increases in
impervious surface cover in the watershed (ISC) leads
to stormflows of increased magnitude and frequency
(Dunne and Leopold 1978, Walsh et al. 2005), which
may result in frequent bed-scouring disturbances that
reduce algal biomass and productivity (Uehlinger et al.
2002, Atkinson et al. 2008) and decrease the retention of
particulate organic matter and associated heterotrophic
respiration (Meyer et al. 2005). The competing effects of
increases in resource supply and increasingly frequent
disturbance make it difficult to predict the direction and
magnitude of changes in stream ecosystem function as a
result of urbanization.
Urban stream restoration
Stream restoration ‘‘based on the principles of the
Rosgen geomorphic channel design approach is most
commonly accomplished by restoring the dimension,
pattern, and profile of a disturbed river system by
emulating the natural, stable river’’ (Rosgen 2007).
Because these approaches seek to increase habitat
heterogeneity and to reconnect the stream channel with
its floodplain by reshaping the channel, successful
restoration projects should reduce stormflow disturban-
ces and promote organic matter retention. Because
restoration is conducted at the reach scale, it does not
alter watershed loading of nutrients, thus all effects of
restoration on water quality must be due to alterations
in reach scale ecosystem functions.
Although most urban stream restoration focuses on
reach-scale habitat complexity, the causative relation-
ship between habitat complexity and ecosystem function
is poorly researched. There are many links in our
conceptual model on the path between habitat restora-
tion and nutrient uptake (Fig. 1b). Several previous
studies have reported an increase in nutrient uptake
rates as a result of channel restoration activities
(Bukaveckas 2007, Roberts et al. 2007, Kaushal et al.
2008), with the authors concluding that enhanced
nutrient uptake following stream restoration was due
to increased transient storage, stimulation of metabo-
lism, and hydrologic reconnection of riparian soils
September 2011 1973EVALUATING RIVER RESTORATION
respectively. If the goal of restoration is water quality
improvement, restoration would need to increase
nutrient uptake capacity to levels above those seen in
forested or unrestored urban streams, in order to
maximize nutrient removal and improve water quality.
Study objectives
The overall objective of this study was to examine the
effects of urbanization on stream hydrologic, metabolic,
and nutrient uptake functions in order to (1) describe the
alterations of these critical ecosystem functions by
urbanization and (2) determine the extent to which
urban stream restoration projects are able to mitigate
these impacts.
We examined hydrology, water quality, heat, light,
and the ecosystem functions GPP, ER, NDM, and
nitrate uptake in four forested, four urban, and four
urban restored streams of the North Carolina Piedmont.
We expected that streams in urban catchments would
have reduced canopy cover and higher nutrient loading,
which would lead to higher GPP in urban streams.
Predictions for ER are more difficult. We expected
reduced supply and storage of allochthonous organic
carbon and increased photorespiration and standing
stocks of autochthonous carbon in urban streams. Thus,
while we anticipated that the sources of carbon to
stream microbes would differ between forested and
urban streams, we could not formulate an a priori
prediction for a change in the magnitude of ER. Nitrate
uptake has been found to be strongly correlated with
GPP (Hall and Tank 2003, Hall et al. 2009) and thus we
anticipated that urban streams would have higher
nitrate uptake both as a function of heightened
autotrophic metabolism and as a function of higher
nitrate availability. Because restoration aims to enhance
channel complexity and dampen storm flows, we
expected reduced storm scour in restored urban streams,
meaning they would store greater quantities of alloch-
thonous carbon and have less variable rates of GPP than
their unrestored counterparts. They would thus show
enhanced metabolic activity and nitrate uptake relative
to either forested streams or unrestored urban streams.
METHODS
Study sites
This study was designed with four blocks of sites (each
block containing one forested, one urban unrestored,
and one urban restored stream reach) with similar
watershed size and ecoregion, and similar watershed
percent impervious surface cover (ISC) between the
urban unrestored (hereafter urban) and urban restored
streams to control as much as possible for those
variables (Table 1). We used this blocking strategy to
stage our fieldwork, collecting the same data from all
three streams in a block without any intervening storms.
The study area spans three different ecoregions and
many sites drain two different ecoregions (Table 1). This
has several implications for this study. The soil types in
the different regions are of different ages and origins,
yielding differences in pH and available cations and
anions (Griffith et al. 2002). Both the Carolina Slate Belt
and Triassic Basin are characterized by low baseflow in
FIG. 1. Hypothetical causal model of stream ecosystem function (after Hall et al. 2009). Black arrows indicate that a variablehas a positive effect, while gray dashed arrows indicate a negative effect. (a) Reach-scale controls on gross primary productivity(GPP), ecosystem respiration (ER), and nitrate uptake, indicating the management practice (habitat diversity) and the goal (waterquality improvement by nitrate concentration reduction) of many stream restoration projects. (b) Catchment-scale effects ofurbanization and their proposed reach-scale effects on ecosystem function. Variables are UNO3, nutrient uptake areal rate; DOC,dissolved oxygen content; BOM, benthic organic matter.
INVITED FEATURE1974Ecological Applications
Vol. 21, No. 6

streams due to low yield of water from rocks in the SlateBelt and low permeability of clays in the Triassic Basin
(Griffith et al. 2002). The Northern Outer Piedmont
does not suffer from the same low baseflows, and so
watersheds of comparable sizes but located in differentecoregions may produce streams of different sizes. Low
baseflow and the tendency of streams to dry in summer
have effects on biota; the Triassic Basin in particular isknown for its comparatively low benthic macroinverte-
brate richness (North Carolina Department of
Environment and Natural Resources 2003).
We acquired a 1/3 arc-minute (10 m) digital elevationmodel for Durham, Orange, and Wake counties in
North Carolina from the U.S. Geological Survey
(USGS) Seamless Server and performed analysis using
the ArcHydro extension of ArcGISv9.2 (ESRI,Redlands, California, USA) to calculate flow direction
and flow accumulation, and define streams based on a
1000-pixel threshold and delineate watersheds for allsites. Land use and ISC within those watersheds as well
as within the riparian area of the streams were analyzed
based on 2001 National Land Cover Dataset (NLCD),
and the accompanying ISC data set from the USGSSeamless Server. NLCD was reclassified into four
categories—developed, agriculture, undeveloped, and
water—and then the percentage of each land use typeand ISC for each watershed was calculated. Riparian
area land use was determined using the same techniques
by buffering 30 m around each stream segment in thewatershed.
The North Carolina Ecosystem Enhancement Project
(EEP) provided the locations and basic information on
all of their completed and planned stream restoration
projects. We also accessed the National RiverRestoration Science Synthesis (NRRSS) database for
stream restoration projects within our proposed study
area and consulted with local stream restoration experts
(database available online).5 From these potential sites,
we chose four stream restoration sites. Each had been
restored using natural channel design approaches
(Rosgen 1994, 1996), the dominant stream restoration
approach in North Carolina (Sudduth et al. 2007). The
Abbot restoration project was constructed in 1999 on a
tributary to Walnut Creek that drains a 1.7-km2
suburban (84.5% developed, 17.8% ISC) watershed in
Raleigh, North Carolina. The goal of this project was
‘‘to restore the stream to the stable dimension pattern
and profile for a C4 stream type as classified using
Rosgen’s stream classification methodology (Rosgen
1996). . .This type of restoration will reestablish the
channel on a previous floodplain, or in this case, the
basin of the old pond. Appropriate channel dimensions
(width and depth), pattern (sinuosity, belt width, riffle-
pool spacing), and profile (bed slope) of the new channel
will be determined from reference reaches’’ (North
Carolina Department of Transportation 1999). The
Rocky Branch restoration project was constructed in
2001 on a stream draining a 1.5-km2 watershed heavily
impacted by the campus of North Carolina State
University in Raleigh, North Carolina (99.2% devel-
oped, 34.8% ISC). The Rocky Branch restoration
project goals included ‘‘Restore a stable self-maintaining
morphologic pattern in the stream channel; stabilize
streambanks using vegetation; create and improve
habitat for fish and aquatic invertebrates; improve the
quality of stormwater entering the creek through
restoring and enhancing riparian buffers and establish-
ing stormwater control within the creek’s watershed;
provide safe and enjoyable access to the stream and
passage through the campus by completing the green-
way path adjacent to the creek’’ (Doll 2003).
TABLE 1. Study sites, listed by stream type and ranked in order by percent impervious surface cover (ISC) in the watershed.
Block Type Site nameSitecode
Watershedsize (km2)
Developed(%)
ISC(%)
Undevelopedriparian area inwatershed (%) Ecoregion
3 forested tributary toMud Creek
MC-t 0.9 4.4 0.5 86.6 Carolina Slate Belt/Triassic Basin
1 forested Stony Creek ST 6.9 24.4 3.4 70.9 Carolina Slate Belt4 forested Mud Creek
(lower reach)MC-L 4.1 58.6 9.5 41.2 Carolina Slate Belt/
Triassic Basin2 forested Pott’s Branch PB 4.2 27.4 9.9 71.3 Northern Outer Piedmont4 urban Mud Creek
(upper reach)MC-U 3.5 66.9 11 30.8 Carolina Slate Belt/
Triassic Basin2 urban Cemetery Creek CM 2.2 98 19.1 5 Northern Outer Piedmont1 urban Ellerbe Creek EC 7.6 88.7 20.8 10 Carolina Slate Belt/
Triassic Basin3 urban Goose Creek GC 1.7 100 39.4 0 Triassic Basin4 restored Sandy Creek SA 6.7 76.5 16.8 21.8 Triassic Basin2 restored tributary to
Walnut CreekWC-t 1.7 84.5 17.8 14.7 Northern Outer Piedmont
1 restored Third Fork Creek 3F 4.4 99.5 32.4 0.3 Triassic Basin3 restored Rocky Branch RB 1.5 99.2 34.8 0.4 Northern Outer Piedmont
Note: Blocking is based on watershed size and ecoregion and is used in statistical analysis.
5 hhttp://nrrss.nbii.gov/i
September 2011 1975EVALUATING RIVER RESTORATION

The Sandy Creek restoration project was constructed
in 2004 on a stream draining a 6.7-km2 watershed
dominated by the campus of Duke University in
Durham, North Carolina (76.9% developed, 16.8%
ISC). The stated goals of the Sandy Creek project were
to ‘‘Re-contour and restore more than 600 meters of
degraded stream to hydrologically reconnect the stream
with the adjacent floodplain to improve biogeochemical
transformations and stream water quality’’ (Richardson
and Pahl 2005).
The Third Fork Creek restoration project was
constructed in 2005 on a stream that drains a highly
urbanized 4.4-km2 watershed (99.5% developed, 32.4%
ISC). The planned goals of this restoration were to
‘‘restore stable channel morphology that is capable of
moving the flows and sediment provided by its water-
shed; reduce sediment-related water quality impacts
resulting from lateral bank erosion and bed degradation;
improve aquatic habitat diversity through the reestab-
lishment of riffle–pool bed variability and the use of in-
stream structures; restore vegetative riparian buffers
utilizing native plant species; and, improve natural
aesthetics in an urban park setting’’ (KCI Associates
2003).
Although the ideal comparison would be with pre-
restoration data from the same sites, no measures of
ecosystem function were taken at these sites prior to
restoration. Instead, after selection, each urban restored
stream reach was paired with reaches draining two
similarly sized watersheds, one urban reach without
stream restoration and one non-urban forested reach.
All four urban stream reaches were located in municipal
parks or protected areas of the Duke Forest (a
university-owned, ;7000-ha, research forest) to facili-
tate access and to accurately represent the ‘‘pre-
restoration’’ condition, since most urban stream resto-
ration projects in North Carolina take place on public
land (BenDor et al. 2009). Indeed, two of our urban
stream sites were chosen because the North Carolina
EEP listed them as high-priority sites for future stream
restoration efforts. Goose Creek drains a highly urban
1.7-km2 watershed including parts of downtown
Durham (100% developed, 39.4% ISC). Ellerbe Creek
drains a high-density residential 7.6-km2 watershed
(88.7% developed, 20.8% ISC). Mud Creek (upper
reach) drains a more recently developed (ca. 1980s)
3.5-km2 watershed of housing subdivisions and apart-
ment complexes (67% developed, 11% ISC). Cemetery
Creek drains a 2.2-km2 watershed with an older, high-
density urban neighborhood in Raleigh, North Carolina
(98% developed, 19.1% ISC).
Locating non-urban, forested watersheds of sufficient
size to support perennial streams represents a significant
challenge in the rapidly urbanizing landscape of the
North Carolina Piedmont. We found one watershed in
the area that was fully forested, a tributary to Mud
Creek that drains a 0.9-km2 watershed completely within
the boundaries of the Duke Forest. With the exception
of Mud tributary we chose watersheds that had some
level of watershed impacts in preference to watersheds
that were significantly spatially removed from our urban
and restored streams. Stony Creek drains a 6.9-km2
watershed that is almost completely contained within a
parcel of the Duke Forest near Hillsborough, North
Carolina, but which has a residential area and a non-
operational factory in a small portion of the upper
watershed (3.4% ISC). Potts Branch is located in
Umstead State Park near Raleigh, North Carolina,
and drains a watershed that is primarily protected forest
but is transversed by a major highway and associated
development in the upper watershed (9.9% ISC). Our
study site on Lower Mud Creek was located ;1.2 km
downstream of the urban site on Mud Creek, thus
capturing suburban impacts in its upper reaches (9.5%
ISC). Because of the land use history of the North
Carolina Piedmont, these are not pristine reference sites,
but rather post-agriculture reforested streams with
primarily forested watersheds. There may be legacy
effects of prior agricultural land use on geomorphology,
vegetation, and sediment (Maloney et al. 2008). There
are no unmanaged forest remnants in the area of
sufficient size to have a permanent stream; instead our
‘‘reference’’ streams are representative of the pre-urban
landscape. Further information about the physical
characteristics of all of these sites can be found in
Violin et al. (2011).
Field methods: hydrology
Standard methods were used to analyze stream
channel shape and habitat types (see Violin et al.
2011). Water level and temperature were continuously
monitored beginning in January 2007 using either flow
meters (Teledyne; ISCO, Lincoln, Nebraska, USA) or
pressure transducers (Solinst Canada, Georgetown,
Ontario, Canada) installed within each reach.
Discharge was estimated from level based on surveyed
channel dimensions using HEC-RAS (U.S. Army Corps
of Engineers; software available online).6 Flashiness was
estimated from changes in mean hourly discharge over a
period encompassing all sampling days in a season using
the following formula:
Flashiness ¼
Xn
i¼1
jqi � qi�1j
Xn
i¼1
qi
where qi is mean hourly discharge and qi�1 is mean
hourly discharge from the previous hour (modified from
Baker et al. 2004). We then divided this flashiness index
by watershed area to correct for the effects of watershed
size on storm timing.
6 hhttp://www.hec.usace.army.mil/software/hec-ras/i
INVITED FEATURE1976Ecological Applications
Vol. 21, No. 6
In the summer of 2006, we performed short-term
whole stream conservative tracer additions using rho-
damine dye (FWT Red 50 Liquid; Kingscote Chemicals,
Miamisburg, Ohio, USA) to measure travel times and to
estimate channel transient storage volume (Runkel
1998). A probe equipped with a rhodamine sensor
(YSI Optical Monitoring System; YSI, Yellow Springs,
Ohio, USA) was used to record rhodamine concen-
trations as the tracer was added, allowed to plateau, and
then shut off and rhodamine concentration allowed to
return to baseflow. Hydrodynamic properties (e.g.,
transient storage) of each experimental reach were
estimated using a one-dimensional transport with inflow
and storage model, OTIS-P (Runkel 1998). The storage
zone area (As, in m2), cross-sectional area (A in m2),
dispersion coefficient (D in m2/sec), storage zone
exchange coefficient (a in per second), and storage zone
first-order decay coefficient (ks, in s�1) were parameters
modeled within OTIS-P for all 12 streams. Because
rhodamine has the potential to adsorb to sediment
surfaces (especially in the hyporheic zone) and photo-
degrade (R. Runkel, personal communication), the mass
of dye recovered was determined for each reach. We
used rhodamine rather than a salt tracer in these streams
because we have found highly variable spatiotemporal
patterns of Cl� and Br� in our urban streams that
frustrated our initial attempts to model transient
storage. We also measured average stream width on
the sampling day and calculated specific discharge (Q/w
in m2/sec).
Water sample collection and analysis
Streamwater samples were collected from each stream
reach on the day of ecosystem function sampling and at
least once per month from June 2006 to June 2007.
Samples were filtered in the field through Whatman GF/
F syringe tip filters and returned to the lab on ice. All
samples were stored at 48C and analyzed for NO3�, Br�,
PO43�, SO4
2�, and Cl� with an ion chromatograph
equipped with an AS4A anion column and KOH eluent
generator (Dionex, Sunnyvale, California, USA). Total
nitrogen and dissolved organic carbon were measured on
a total organic carbon analyzer with a total nitrogen
module (Shimadzu, Kyoto, Japan). Ammonium analysis
was performed using the OPA fluorometric technique
(Holmes et al. 1999) using a field fluorometer (10-AU,
Turner Designs, Sunnyvale, California, USA). Dissolved
organic nitrogen (DON) was calculated by subtracting
NO3�-N and NH4
þ-N from TN.
Energy inputs
Canopy cover was estimated in mid-summer using a
spherical densitometer, measuring in four directions at
five randomly chosen points in the thalweg of each
stream; canopy cover was used as a proxy for a more
direct measure of solar energy input such as photo-
synthetically active radiation. Degree-days were calcu-
lated from daily maximum and minimum temperature
data using the double triangle method (Roltsch et al.
1999), both for the individual sampling days for
metabolism and nutrient uptake (to estimate short term
ecosystem effects of temperature) and for continuous
levelogger data records for windows of time around the
sampling (to estimate longer-term effects of temper-
ature). Organic matter was collected in summer for three
blocks of study sites (nine sites total). We quantified
habitat types as riffle, run, or pool and stratified
sampling by type to obtain a representative sample of
the reach (further details in Violin et al. 2011). Transects
were taken at ten points along the stream reach,
randomly chosen and stratified by habitat type. At each
selected transect, surface organic matter sampling
involved collecting by hand all visible coarse organic
matter on the streambed across a 1-m wide transect. At
sites with mostly fine sediments, benthic core samples for
organic matter were taken using five 5-cm diameter
cores evenly distributed across each transect. At sites
where this was not possible because of large particle
sizes, we took two 5-cm diameter cores and one 30-cm
diameter core. In each case, we inserted the corers as far
as possible into the streambed, and recorded the depth
sampled. Samples were returned to the lab where surface
samples were dried in an oven at 608C then weighed. A
subsample of each core was ashed for 3 hours at 5008C
to determine percent ash free dry mass (AFDM).
Benthic core samples were elutriated and preserved in
10% formalin for macroinvertebrate removal; following
picking, samples were dried, weighed, and ashed for
AFDM. Data were then normalized by total streambed
surface area sampled for analysis.
Primary production and ecosystem metabolism
Algal biomass was sampled in summer at the same
transects as organic matter sampling. At four points
spread at even distances across each transect, algae were
sampled by either scraping a 2.5-cm circle off a rock or
removing the top 5-mm of sediment in a 2.5-cm circle.
Samples from each transect were combined and ana-
lyzed for chlorophyll a with a fluorometer (10AU,
Turner Designs, Sunnyvale, California, USA) using
acetone extraction (Arar and Collins 1997). In one
block the reference stream had gone dry due to summer
drought so algae were not sampled (eight sites sampled
total).
Gross primary production, ecosystem respiration, and
net daily metabolism (NDM) were estimated once in
summer and once in winter in each stream using the
single station oxygen method (Odum 1956, Bott 2006).
This method estimates metabolism for a presumed
homogenous downstream reach whose length is deter-
mined by water velocity and reaeration rate. The small
streams in this study were homogenous for an extensive
distance downstream, well encompassing the reach for
which metabolism was estimated. Estimates were made
at baseflow on days without precipitation and at least 2
days following a storm event. Estimates within each
September 2011 1977EVALUATING RIVER RESTORATION
block were made on consecutive days without storms
between them when possible. Although daily production
and metabolism tend to be highly variable even at a
single forested site (Roberts et al. 2007), logistics and
equipment limitation meant that this study used only
single-day estimates, in keeping with methods used in
other multiple-site studies (e.g., Mulholland et al. 2001,
2008).
Dissolved oxygen and temperature were monitored
every 10 minutes using a sonde (model 600XLM; YSI,
Yellow Springs, Ohio, USA). These numbers were
corrected for reaeration using propane releases
(Marzolf et al. 1994, Young and Huryn 1998). At some
sites the propane release failed or produced unrealistic
numbers and at those sites reaeration estimation was
repeated at similar baseflow conditions using sulfur
hexafluoride (SF6; Cole and Caraco 1998). Propane and
SF6 concentrations were measured on a gas chromato-
graph equipped with an ECD (Shimadzu, Kyoto,
Japan). Ecosystem metabolism rates were determined
from the changes in DO concentration every 10 minutes
using the following equation:
DDO ¼ GPP� ERþ E
where DDO is the change in DO concentration (g O2/
m3), GPP is gross primary production (g O2/m3), ER is
ecosystem respiration (g O2/m3) and E is net exchange of
oxygen with the atmosphere (g O2/m3). E is the product
of the reaeration coefficient and the average DO deficit
over the 10-minute sampling interval. GPP is zero at
night, when all metabolism flux is considered to be ER.
During the day, ER was interpolated from metabolism
flux for the hour before dawn and the hour after dusk.
GPP for daytime intervals was the difference between
net metabolism flux and interpolated ER for the
interval. Daily rates of GPP and ER (g�m�2�d�1) were
calculated by summing all interval calculations of GPP
or ER and dividing by the mean water depth observed
on the sampling day.
Nutrient uptake
Nutrient uptake was measured through a series of
short-term nutrient enrichment experiments using stan-
dard approaches (Newbold et al. 1981). Stream reach
length for nutrient release was determined as 60-minute
travel time based on a dye slug to estimate stream
velocity in summer 2006. For consistency, the same
reach length was used in winter 2007. In summer 2006,
we used a modification of methodology used in enrich-
ment experiments to estimate NO3� uptake by using the
regression approach for estimating ambient uptake
lengths (Bernhardt 2002, Thomas et al. 2003, Payn et
al. 2005). In this approach, enrichment experiments use
progressive levels of enrichment. For each enrichment
level, uptake length is calculated as the inverse of the
slope of the regression relating tracer corrected nutrient
concentration to distance downstream of the addition
point. Ambient (non-enrichment) uptake lengths are
estimated as the y-intercept of the curve relating
estimated uptake lengths to the level of nutrient enrich-
ment. To successfully employ the method it is necessary
to calculate at least three uptake lengths. In our 12-stream survey, we encountered difficulties in employing
the regression approach in five of 12 streams where
demand was rapidly saturated and uptake lengths could
only be calculated for one or two of the three levels ofenrichment. Because of this difficulty we used data from
the lowest level enrichment experiments only in all
subsequent analyses (target enrichment ;25 lg/L NO3�-
N). In winter 2007 releases, we performed NO3�
enrichment experiments only at single low-level enrich-
ments (target enrichment ;25 lg/L NO3�-N).
Briefly, to estimate the relative demand for inorganic
N across our 12 streams, we measured uptake length of
nutrients in each stream from which we calculated
nutrient uptake velocities using established equations(Stream Solute Workshop 1990). All injections added
NO3� as NaNO3 and included a co-injected hydrologic
tracer (chloride [NaCl] or bromide [NaBr]) in order to
distinguish uptake from dilution and dispersion (StreamSolute Workshop 1990). Average stream wetted width
was measured at ten sites within each reach. Initial
estimates of discharge for estimating target addition rate
and solution concentration were determined from flow
meter estimates across the channel cross section. Weused the tracer concentrations at plateau to accurately
calculate Q for nutrient uptake calculations. Water
sample collection and analysis was performed as
previously described.
The nutrient uptake areal rate (UNO3) and nutrientuptake velocity (VNO3) were calculated for each nutrient
in each stream using the established method of nutrient
enrichment releases (Newbold et al. 1981, Stream Solute
Workshop 1990). Nutrient uptake lengths were calcu-
lated as the inverse slope of the line describing thedecline in the nutrient concentrations relative to the
tracer over distance downstream (Newbold et al. 1981):
ln Nx ¼ ln N0 � kx
where Nx is the concentration at the sampling site, N0 is
the concentration at the injection site, and kx is the per
meter uptake site. The uptake length (Sw), the averagedistance a molecule of NO3
� or NH4þ travels before it is
removed from the water column, is calculated as k�1.
Uptake rate per square meter is calculated as
U ¼ QN0
Sww
where Q is discharge and w is average stream width.
Uptake velocity (Vf), the mass transfer coefficient
(Stream Solute Workshop 1990), is calculated as
Vf ¼Q
wSw:
This calculation is especially useful in comparative
studies like this one as it allows comparison across
INVITED FEATURE1978Ecological Applications
Vol. 21, No. 6

streams of different sizes and discharges (Hall et al.
2002). This enrichment technique assumes that the gross
uptake rate and the nutrient demand increase at the
same rate for the duration of the enrichment and no
asymptote in uptake capacity is reached in the course of
the release. Uptake velocities are a measure of nutrient
uptake rate relative to nutrient concentration in the
water column normalized for physical differences in
depth and velocity among streams (Stream Solute
Workshop 1990, Davis and Minshall 1999, Hall et al.
2002).
Statistical methods
Data throughout this study were analyzed using a
blocked one-way ANOVA by site type (forested, urban,
restored), with post-hoc Student’s t tests to look for
significant differences among types using JMP version
7.0.2 (SAS Institute, Cary, North Carolina, USA).
Ecosystem functions were also analyzed for correlations
with the structural variables hypothesized to be their
predictors. Multiple regressions were used to examine
the predictability of functional variables based on the
hypothesized causal variables. Forward stepwise multi-
ple regressions (alpha to enter¼ 0.25, alpha to exit¼0.1)
were run based on our conceptual model of ecosystem
functions (Fig. 1b). Predictive variables in models were
evaluated for multicollinearity using a correlation
matrix, and the best model was chosen based on
Akaike information criteria (AIC). Adjusted R2 and
AIC provide a measure of model fit while penalizing the
addition of more model parameters.
RESULTS
Hydrology
Although we saw many differences in channel shape
between forested streams and urban and urban restored
streams (Violin et al. 2011), and in watershed variables
commonly considered to affect flashiness, and despite a
wide range of flashiness across our stream reaches (0.04–
0.3), our flashiness index showed no significant differ-ence among stream types (Table 2). Contrary to
expectations, there were no significant differences
among stream types in transient storage zone volume(Table 2). Flashiness was significantly correlated with
ISC for both summer (R2¼ 0.37, P¼ 0.0287) and winter(R2¼0.34, P¼0.0263). We found no strong correlations
between specific discharge (Q/w) or transient storage
zone volume and any watershed land use characteristics.
Water quality
Monthly water quality sampling revealed generallyhigher nitrogen concentrations in urban streams than
was seen at forested sites (Table 3). Mean monthlynitrate concentrations in the forested streams ranged
from 0.13 to 0.38 mg/L NO3�-N while in the urban
streams it ranged between 0.15 and 1.53 mg/L NO3�-N.
DOC was not significantly different between stream
types, ranging between 2.07 and 7.54 mg/L across all
streams and dates.
Heat and light
At the watershed scale, the proportion of undeveloped
land in the riparian buffer was significantly lower for the
restored and urban streams than for their forestedcounterparts (P ¼ 0.001, Table 1). However, direct
canopy cover over the study reaches did not differ
between urban and forested streams, but was signifi-cantly lower in restored reaches due to clearing for
stream restoration construction (P ¼ 0.01; Table 2).Across all stream types in summer 2007 (5 May–1 June,
matching the timing of 2006 intensive sampling efforts),
total degree-days were significantly higher in restoredand urban streams than in forested streams (P¼ 0.0175;
Table 2). Summer total degree-days were strongly
correlated with ISC in the watershed (R2 ¼ 0.83, P ,
TABLE 2. Physical properties of study sites.
Site Type
Canopycover�(%)
Reachlength(m)
Mediandischarge�
(L/s)Summer totaldegree-days§
Summerflashiness§
Winter totaldegree-days}
Winterflashiness} As/(As þ A) F200
med
MC-t forested 87.94 54 5 11 018 0.04 5127 0.04 0.484 48.37ST forested 87.10 100 6 10 691 0.01 4990 0.01 0.416 41.65MC-L forested 93.66 100 8 11 418 0.01 4740 0.02 0.234 21.52PB forested 81.46 140 12 11 020 0.04 4778 0.10 0.297 28.53MC-U urban 92.23 140 5 11 450 0.26 4583 0.07 0.429 42.91CM urban 71.79 80 13 11 470 0.14 5988 0.15 0.438 43.70EC urban 77.69 50 14 12 167 0.09 5131 0.08 0.168 14.37GC urban 83.67 50 9 12 899 0.17 5942 0.06 0.334 33.21SA restored 48.60 60 3 12 137 0.10 4633 0.10 0.229 22.91WC-t restored 64.74 200 4 12 164 0.06 5003 0.07 0.311 30.983F restored 32.61 80 11 nd# nd 5197 0.30 0.472 47.11RB restored 68.88 50 15 12 604 0.37 6074 0.22 0.222 19.52
� Summer 2006.� January–July 2007.§ Data for 5 May–1 June 2007 (data not available for 2006).} Data for 27 February–19 March 2007.# Data loss due to instrument failure.
September 2011 1979EVALUATING RIVER RESTORATION
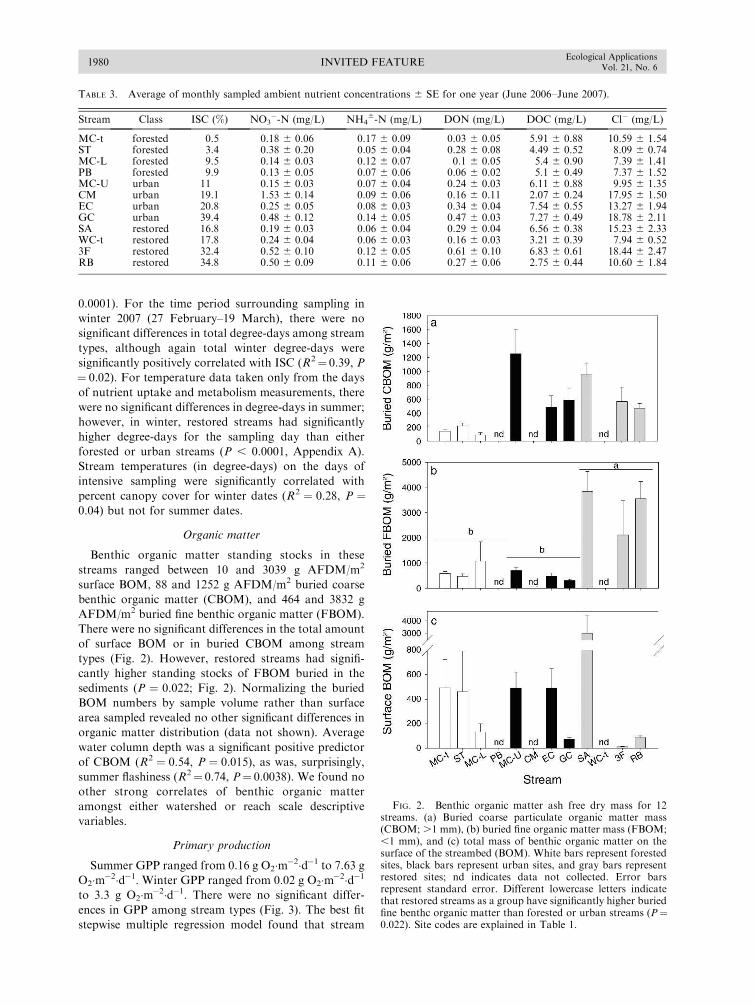
0.0001). For the time period surrounding sampling in
winter 2007 (27 February–19 March), there were no
significant differences in total degree-days among stream
types, although again total winter degree-days were
significantly positively correlated with ISC (R2¼ 0.39, P
¼ 0.02). For temperature data taken only from the days
of nutrient uptake and metabolism measurements, there
were no significant differences in degree-days in summer;
however, in winter, restored streams had significantly
higher degree-days for the sampling day than either
forested or urban streams (P , 0.0001, Appendix A).
Stream temperatures (in degree-days) on the days of
intensive sampling were significantly correlated with
percent canopy cover for winter dates (R2 ¼ 0.28, P ¼0.04) but not for summer dates.
Organic matter
Benthic organic matter standing stocks in these
streams ranged between 10 and 3039 g AFDM/m2
surface BOM, 88 and 1252 g AFDM/m2 buried coarse
benthic organic matter (CBOM), and 464 and 3832 g
AFDM/m2 buried fine benthic organic matter (FBOM).
There were no significant differences in the total amount
of surface BOM or in buried CBOM among stream
types (Fig. 2). However, restored streams had signifi-
cantly higher standing stocks of FBOM buried in the
sediments (P ¼ 0.022; Fig. 2). Normalizing the buried
BOM numbers by sample volume rather than surface
area sampled revealed no other significant differences in
organic matter distribution (data not shown). Average
water column depth was a significant positive predictor
of CBOM (R2 ¼ 0.54, P ¼ 0.015), as was, surprisingly,
summer flashiness (R2¼ 0.74, P¼ 0.0038). We found no
other strong correlates of benthic organic matter
amongst either watershed or reach scale descriptive
variables.
Primary production
Summer GPP ranged from 0.16 g O2�m�2�d�1 to 7.63 g
O2�m�2�d�1. Winter GPP ranged from 0.02 g O2�m�2�d�1to 3.3 g O2�m�2�d�1. There were no significant differ-
ences in GPP among stream types (Fig. 3). The best fit
stepwise multiple regression model found that stream
TABLE 3. Average of monthly sampled ambient nutrient concentrations 6 SE for one year (June 2006–June 2007).
Stream Class ISC (%) NO3�-N (mg/L) NH4
6-N (mg/L) DON (mg/L) DOC (mg/L) Cl� (mg/L)
MC-t forested 0.5 0.18 6 0.06 0.17 6 0.09 0.03 6 0.05 5.91 6 0.88 10.59 6 1.54ST forested 3.4 0.38 6 0.20 0.05 6 0.04 0.28 6 0.08 4.49 6 0.52 8.09 6 0.74MC-L forested 9.5 0.14 6 0.03 0.12 6 0.07 0.1 6 0.05 5.4 6 0.90 7.39 6 1.41PB forested 9.9 0.13 6 0.05 0.07 6 0.06 0.06 6 0.02 5.1 6 0.49 7.37 6 1.52MC-U urban 11 0.15 6 0.03 0.07 6 0.04 0.24 6 0.03 6.11 6 0.88 9.95 6 1.35CM urban 19.1 1.53 6 0.14 0.09 6 0.06 0.16 6 0.11 2.07 6 0.24 17.95 6 1.50EC urban 20.8 0.25 6 0.05 0.08 6 0.03 0.34 6 0.04 7.54 6 0.55 13.27 6 1.94GC urban 39.4 0.48 6 0.12 0.14 6 0.05 0.47 6 0.03 7.27 6 0.49 18.78 6 2.11SA restored 16.8 0.19 6 0.03 0.06 6 0.04 0.29 6 0.04 6.56 6 0.38 15.23 6 2.33WC-t restored 17.8 0.24 6 0.04 0.06 6 0.03 0.16 6 0.03 3.21 6 0.39 7.94 6 0.523F restored 32.4 0.52 6 0.10 0.12 6 0.05 0.61 6 0.10 6.83 6 0.61 18.44 6 2.47RB restored 34.8 0.50 6 0.09 0.11 6 0.06 0.27 6 0.06 2.75 6 0.44 10.60 6 1.84
FIG. 2. Benthic organic matter ash free dry mass for 12streams. (a) Buried coarse particulate organic matter mass(CBOM; .1 mm), (b) buried fine organic matter mass (FBOM;,1 mm), and (c) total mass of benthic organic matter on thesurface of the streambed (BOM). White bars represent forestedsites, black bars represent urban sites, and gray bars representrestored sites; nd indicates data not collected. Error barsrepresent standard error. Different lowercase letters indicatethat restored streams as a group have significantly higher buriedfine benthc organic matter than forested or urban streams (P¼0.022). Site codes are explained in Table 1.
INVITED FEATURE1980Ecological Applications
Vol. 21, No. 6
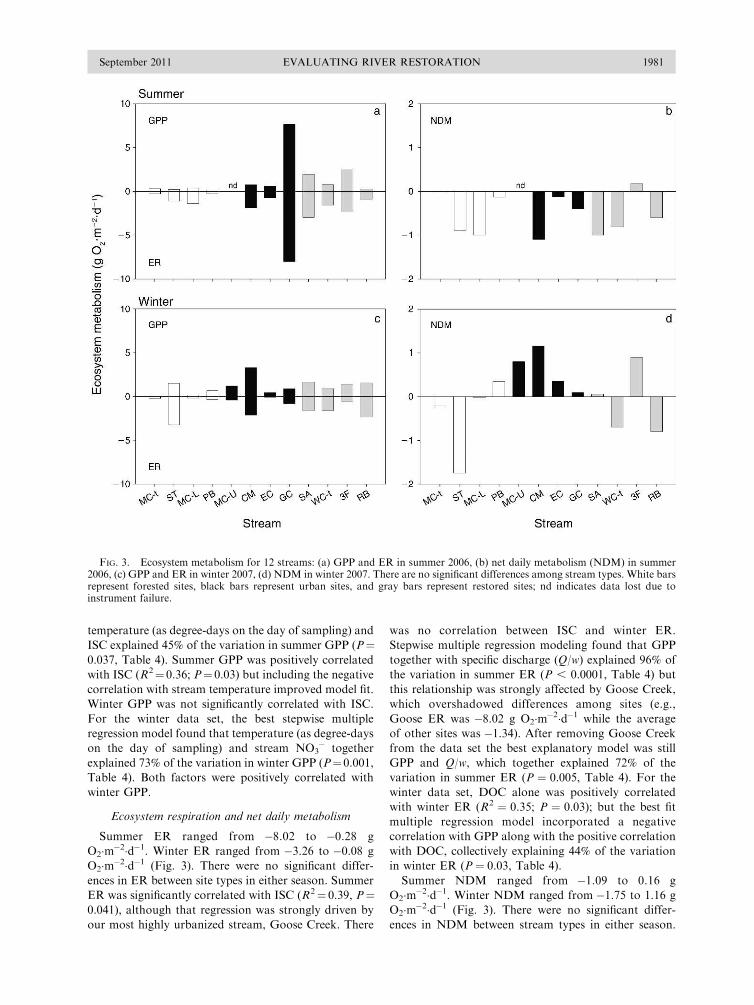
temperature (as degree-days on the day of sampling) and
ISC explained 45% of the variation in summer GPP (P¼0.037, Table 4). Summer GPP was positively correlated
with ISC (R2¼ 0.36; P¼ 0.03) but including the negative
correlation with stream temperature improved model fit.
Winter GPP was not significantly correlated with ISC.
For the winter data set, the best stepwise multiple
regression model found that temperature (as degree-days
on the day of sampling) and stream NO3� together
explained 73% of the variation in winter GPP (P¼0.001,
Table 4). Both factors were positively correlated with
winter GPP.
Ecosystem respiration and net daily metabolism
Summer ER ranged from �8.02 to �0.28 g
O2�m�2�d�1. Winter ER ranged from �3.26 to �0.08 g
O2�m�2�d�1 (Fig. 3). There were no significant differ-
ences in ER between site types in either season. Summer
ER was significantly correlated with ISC (R2¼ 0.39, P¼0.041), although that regression was strongly driven by
our most highly urbanized stream, Goose Creek. There
was no correlation between ISC and winter ER.
Stepwise multiple regression modeling found that GPP
together with specific discharge (Q/w) explained 96% of
the variation in summer ER (P , 0.0001, Table 4) but
this relationship was strongly affected by Goose Creek,
which overshadowed differences among sites (e.g.,
Goose ER was �8.02 g O2�m�2�d�1 while the average
of other sites was �1.34). After removing Goose Creek
from the data set the best explanatory model was still
GPP and Q/w, which together explained 72% of the
variation in summer ER (P ¼ 0.005, Table 4). For the
winter data set, DOC alone was positively correlated
with winter ER (R2 ¼ 0.35; P ¼ 0.03); but the best fit
multiple regression model incorporated a negative
correlation with GPP along with the positive correlation
with DOC, collectively explaining 44% of the variation
in winter ER (P ¼ 0.03, Table 4).
Summer NDM ranged from �1.09 to 0.16 g
O2�m�2�d�1. Winter NDM ranged from �1.75 to 1.16 g
O2�m�2�d�1 (Fig. 3). There were no significant differ-
ences in NDM between stream types in either season.
FIG. 3. Ecosystem metabolism for 12 streams: (a) GPP and ER in summer 2006, (b) net daily metabolism (NDM) in summer2006, (c) GPP and ER in winter 2007, (d) NDM in winter 2007. There are no significant differences among stream types. White barsrepresent forested sites, black bars represent urban sites, and gray bars represent restored sites; nd indicates data lost due toinstrument failure.
September 2011 1981EVALUATING RIVER RESTORATION
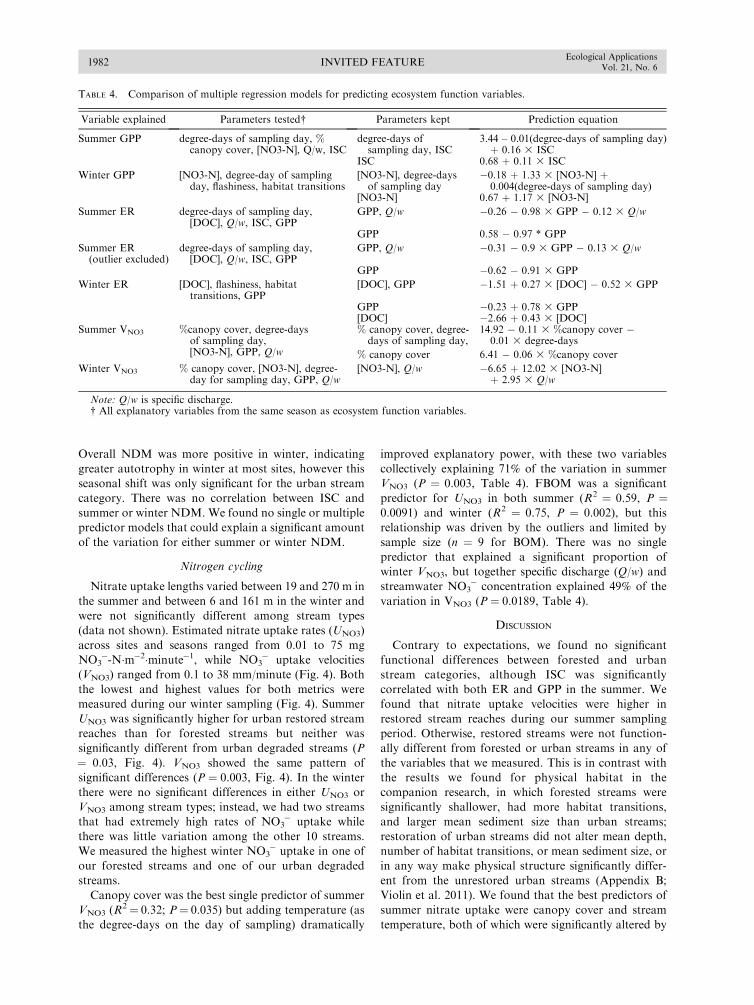
Overall NDM was more positive in winter, indicating
greater autotrophy in winter at most sites, however this
seasonal shift was only significant for the urban stream
category. There was no correlation between ISC and
summer or winter NDM. We found no single or multiple
predictor models that could explain a significant amount
of the variation for either summer or winter NDM.
Nitrogen cycling
Nitrate uptake lengths varied between 19 and 270 m in
the summer and between 6 and 161 m in the winter and
were not significantly different among stream types
(data not shown). Estimated nitrate uptake rates (UNO3)
across sites and seasons ranged from 0.01 to 75 mg
NO3�-N�m�2�minute�1, while NO3
� uptake velocities
(VNO3) ranged from 0.1 to 38 mm/minute (Fig. 4). Both
the lowest and highest values for both metrics were
measured during our winter sampling (Fig. 4). Summer
UNO3 was significantly higher for urban restored stream
reaches than for forested streams but neither was
significantly different from urban degraded streams (P
¼ 0.03, Fig. 4). VNO3 showed the same pattern of
significant differences (P ¼ 0.003, Fig. 4). In the winter
there were no significant differences in either UNO3 or
VNO3 among stream types; instead, we had two streams
that had extremely high rates of NO3� uptake while
there was little variation among the other 10 streams.
We measured the highest winter NO3� uptake in one of
our forested streams and one of our urban degraded
streams.
Canopy cover was the best single predictor of summer
VNO3 (R2¼ 0.32; P¼ 0.035) but adding temperature (as
the degree-days on the day of sampling) dramatically
improved explanatory power, with these two variables
collectively explaining 71% of the variation in summer
VNO3 (P ¼ 0.003, Table 4). FBOM was a significant
predictor for UNO3 in both summer (R2 ¼ 0.59, P ¼0.0091) and winter (R2 ¼ 0.75, P ¼ 0.002), but this
relationship was driven by the outliers and limited by
sample size (n ¼ 9 for BOM). There was no single
predictor that explained a significant proportion of
winter VNO3, but together specific discharge (Q/w) and
streamwater NO3� concentration explained 49% of the
variation in VNO3 (P ¼ 0.0189, Table 4).
DISCUSSION
Contrary to expectations, we found no significant
functional differences between forested and urban
stream categories, although ISC was significantly
correlated with both ER and GPP in the summer. We
found that nitrate uptake velocities were higher in
restored stream reaches during our summer sampling
period. Otherwise, restored streams were not function-
ally different from forested or urban streams in any of
the variables that we measured. This is in contrast with
the results we found for physical habitat in the
companion research, in which forested streams were
significantly shallower, had more habitat transitions,
and larger mean sediment size than urban streams;
restoration of urban streams did not alter mean depth,
number of habitat transitions, or mean sediment size, or
in any way make physical structure significantly differ-
ent from the unrestored urban streams (Appendix B;
Violin et al. 2011). We found that the best predictors of
summer nitrate uptake were canopy cover and stream
temperature, both of which were significantly altered by
TABLE 4. Comparison of multiple regression models for predicting ecosystem function variables.
Variable explained Parameters tested� Parameters kept Prediction equation
Summer GPP degree-days of sampling day, %canopy cover, [NO3-N], Q/w, ISC
degree-days ofsampling day, ISC
3.44 – 0.01(degree-days of sampling day)þ 0.16 3 ISC
ISC 0.68 þ 0.11 3 ISC
Winter GPP [NO3-N], degree-day of samplingday, flashiness, habitat transitions
[NO3-N], degree-daysof sampling day
�0.18 þ 1.33 3 [NO3-N] þ0.004(degree-days of sampling day)
[NO3-N] 0.67 þ 1.17 3 [NO3-N]
Summer ER degree-days of sampling day,[DOC], Q/w, ISC, GPP
GPP, Q/w �0.26 � 0.98 3 GPP � 0.12 3 Q/w
GPP 0.58 � 0.97 * GPP
Summer ER(outlier excluded)
degree-days of sampling day,[DOC], Q/w, ISC, GPP
GPP, Q/w �0.31 � 0.9 3 GPP � 0.13 3 Q/w
GPP �0.62 � 0.91 3 GPP
Winter ER [DOC], flashiness, habitattransitions, GPP
[DOC], GPP �1.51 þ 0.27 3 [DOC] � 0.52 3 GPP
GPP �0.23 þ 0.78 3 GPP[DOC] �2.66 þ 0.43 3 [DOC]
Summer VNO3 %canopy cover, degree-daysof sampling day,[NO3-N], GPP, Q/w
% canopy cover, degree-days of sampling day,
14.92 � 0.11 3 %canopy cover �0.01 3 degree-days
% canopy cover 6.41 � 0.06 3 %canopy cover
Winter VNO3 % canopy cover, [NO3-N], degree-day for sampling day, GPP, Q/w
[NO3-N], Q/w �6.65 þ 12.02 3 [NO3-N]þ 2.95 3 Q/w
Note: Q/w is specific discharge.� All explanatory variables from the same season as ecosystem function variables.
INVITED FEATURE1982Ecological Applications
Vol. 21, No. 6

TABLE 4. Extended.
df F Adjusted R2 P AIC
2, 8 5.1261 0.4521 0.0369 12.7801
1, 9 6.6292 0.3437 0.03 14.0822
2, 9 15.5482 0.7257 0.0012 �16.2253
1, 10 15.9467 0.5761 0.0025 �11.73812, 8 124.4232 0.9611 ,0.0001 �16.5337
1, 9 197.6383 0.9516 ,0.0001 �14.63072, 7 12.8181 0.7242 0.0022 �15.1445
1, 8 18.1648 0.656 0.0028 �14.05132, 9 5.3241 0.4402 0.0298 �3.4174
1, 10 7.4463 0.3695 0.0212 �2.72681, 10 6.979 0.3521 0.0247 �2.40092, 8 13.1451 0.7084 0.003 2.4049
1, 10 6.1182 0.3175 0.0329 8.1776
2, 9 6.3648 0.4938 0.0189 56.2418
FIG. 4. Nitrate uptake measurement for 12 streams: (a) UNO3 for summer 2006, (b) nutrient uptake velocity (VNO3) for summer2006, (c) UNO3 for winter 2007, and (d) VNO3 for winter 2007. White bars represent forested sites, black bars represent urban sites,and gray bars represent restored sites. Letters indicate that summer restored streams as a group have significantly higher arealuptake rates (P ¼ 0.03) and uptake velocities (P ¼ 0.003) than forested streams, while urban streams are indistinguishable fromboth.
September 2011 1983EVALUATING RIVER RESTORATION
restoration activities. Restoration also led to an increase
in streambed FBOM, which has previously been shown
to be a strong correlate of nitrate uptake (Meyer et al.
2005). We hypothesize that the major ecosystem impact
of natural channel design restoration projects in these
systems has been an increase in light and heat, which,
while it may stimulate nutrient uptake, is likely to also
have severe consequences for sensitive biota (Violin et al.
2011). The significant effect of restoration on nutrient
uptake was only seen in summer, not winter, suggesting
that it is primarily an effect of light and heat, and that
the alteration of the physical shape of the channel by
restoration was not the driver of this difference in
biogeochemical cycling.
One of the most interesting findings of this study was
the significant positive relationship between ISC and
streamwater temperatures. Stream temperature (mea-
sured as degree-days) was significantly correlated with
all ecosystem functions in the summer (GPP, ER, and
nitrate uptake). This suggests that the urban heat island
(Kalnay and Cai 2003) has important implications for
the functioning of aquatic ecosystems as well as their
surrounding catchments, an aspect of the heat island
problem that has received little attention to date.
Natural channel design restoration projects typically
remove the local riparian vegetation to ease construc-
tion, which will exacerbate the thermal pollution of
urban watersheds; this could potentially further degrade
stream habitat, or at least constrain biological recovery
of sensitive taxa. Our results suggest that this should be
an area of concern for restoration practitioners. In
reconsidering our conceptual model (Fig. 1b), we need
to add consideration of both the catchment-scale heat
island effects of urbanization and the reach-scale effects
of loss of canopy cover on stream temperature.
As previously seen by Meyer et al. (2005) and
Bernhardt and Palmer (2007), we expected urbanization
to decrease BOM due to reduced inputs and retention,
limiting the fuel available for heterotrophic respiration.
We discovered that in these catchments urbanization did
not decrease BOM when compared with forested
streams, and that restoration may indeed increase buried
FBOM. The significant positive correlation of buried
CBOM standing stocks with both water depth and
hydrologic flashiness suggests that altered urban hydrol-
ogy may be leading to increased burial and storage of
CBOM in the sediments, leading to the very high levels
of CBOM seen at some of the urban sites in this study.
There was, however, no correlation between BOM and
ER among our sites. Instead, increased DOC and ISC in
urban watersheds seemed to be the strongest drivers of
differences in ER. ER was also significantly correlated
with GPP. It seems that in our more urban streams the
energy budget is altered with autochthonous OM and
allochthonous DOC (perhaps from leaking infrastruc-
ture) serving as the primary source of carbon, rather
than allochthonous BOM. As in Hall and Tank (2003),
we found increased nutrient uptake with increased GPP.
However, the relationship was only significant in the
winter and was not related to urbanization factors. We
detected a positive relationship between BOM and
nutrient uptake as seen in other studies (Mulholland et
al. 1985, Webster et al. 2000, Meyer et al. 2005), but this
correlation was skewed by outliers and our ability to
draw conclusions is also limited by lack of statistical
power (n ¼ 9 replicates for BOM in our study).
Based on enhanced carbon and nutrient supply
together with higher heat and light, we expected to see
higher rates of GPP and ER in urban streams and
expected that these factors would collectively lead to
higher nutrient uptake. However, in the extreme
example of Goose Creek in the summer, a very warm
urban stream with high nutrient and organic matter
loading leading to high GPP and ER, we saw no
proportional increase in nitrate uptake. This suggests
that our conceptual model (Fig. 1) failed to consider
some other impacts of urbanization that could be
limiting nutrient uptake in this system. We hypothesize
that urban contaminants or frequent stormwater dis-
turbance may suppress microbial activity in streambed
sediments. The conceptual understanding of the effects
of urbanization on stream ecosystem functioning needs
to be revised to better take into account the many
possible impacts of peak flow conditions and urban
contaminants on stream ecosystems.
Effects and impacts of restoration
Although there are no clear significant differences in
ecosystem function between forested and urban streams,
there were some significant differences between the
restored sites and either forested or urban sites. Some
of these appear to be due to the impacts of restoration,
including loss of canopy cover and further simplification
of substrate and channel structure (Violin et al. 2011). It
is not uncommon to see lingering detrimental effects of a
variety of stream restoration practices (Biggs et al. 1998,
Bednarek 2001, Colangelo and Jones 2005, McKie et al.
2006). The restoration projects in this study are still quite
new (,10 years old); as planted riparian trees grow, the
canopy cover will presumably return at least to levels
seen in the unrestored urban sties. There is no evidence,
however, that the channel will gain in complexity with
time, so we expect simplified channel structure to be a
lasting impact of stream restoration at these sites.
There were surprisingly few significant effects of
urbanization or restoration on hydrologic variables
measured in this study. The lack of differences among
stream types in transient storage seems particularly
surprising, given the significant differences in channel
shape between forested and urban streams (Appendix B;
Violin et al. 2011). This is likely due to the inability of
transient storage estimates with OTIS-P to distinguish
between hyporheic storage and in-channel storage
(Runkel 1998). It is likely that the forested streams have
more hyporheic storage while the deeper, slower urban
streams have more in-channel storage. Restoration likely
INVITED FEATURE1984Ecological Applications
Vol. 21, No. 6

had no effect on this, since the restored streams were
similarly deep and slow, and likely also had predom-
inantly in-channel storage. A stated goal of these
projects, as with most natural channel design projects,
was reconnection of the stream with a floodplain. In
addition to somewhat mitigating the physical effects of
peak stormflows, more contact with the floodplain could
lead to higher uptake rates of nutrients during stormflow.
Because of logistics and safety, as well as the steady-state
assumptions of the nutrient tracer method, we were
unable to measure uptake during stormflow at these sites.
However, since the urban restored streams retain their
flashy urban hydrograph, as restoration did nothing to
address watershed scale hydrologic alteration, any effect
of floodplain reconnection would be relatively brief for
any given storm.
The one clear significant effect of restoration on
ecosystem function that was seen in this study was that
restored sites had significantly higher UNO3 and VNO3 at
baseflow than their forested counterparts in the summer.
Unlike Bukaveckas (2007), we found no effect of
restoration on transient storage (Table 2) or water
depth or velocity (Appendix B; Violin et al. 2011) and
thus we cannot conclude that higher nitrate uptake in
restored streams was due to channel alterations of
restoration. Instead, nitrate uptake rates seem to be
correlated both with higher FBOM at these sites and
with increased temperatures due to loss of canopy cover.
Uptake rates are generally correlated with temperature
(Butturini et al. 2000). Bukaveckas (2007) also saw
significantly higher temperatures in a restored stream
(presumably due to loss of canopy cover) when
compared to both channelized and reference streams,
which may call into question the study’s conclusion that
restoration of channel structure was the sole cause of
increased nutrient uptake in the restored stream.
Kaushal et al. (2008), saw significantly higher denitrifi-
cation rates within streambanks of restored reaches with
low banks vs. restored and unrestored reaches with high
banks, a change they attribute to greater hydrologic
connectivity with the floodplain. Although they saw no
change in groundwater temperature, altered streambank
height could also affect channel shading and thus affect
streamwater and sediment temperatures, which were not
measured in that study. Because high temperatures can
exacerbate dissolved oxygen problems and exclude
organisms with lower thermal tolerance (Jones et al.
2006), we caution that using stream temperature
manipulation to facilitate nitrate retention is not an
effective restoration strategy.
Previous work has shown FBOM to be a strong
predictor of nutrient uptake in both forested
(Mulholland et al. 1985, Webster et al. 2000) and urban
streams (Meyer et al. 2005). It is not clear why the
restored sites in this study had higher FBOM than the
other sites. One possibility is that the loss of canopy
cover is significantly correlated with and likely drives
higher algal biomass observed in the restored streams,
which over time would lead to higher detrital levels of
FBOM. Roberts et al. (2007) saw increased nutrient
uptake following restoration by course woody debris
addition, which also led to increased BOM storage in the
restored channels. Future restoration projects with the
goal of increasing nitrate uptake to improve water
quality could use innovative methods, such as coarse
woody debris addition, to increase FBOM to fuel
nutrient removal. However, as was seen in the Roberts
et al. (2007) study, without management of altered
stormwater peak flows, newly retained BOM can
quickly be buried or scoured and the benefit of this
type of restoration lost.
Field of Dreams hypothesis
The original goal of this study was to test the Field of
Dreams hypothesis, answering the question: Is restora-
tion of stream physical habitat sufficient to restore
ecosystem function? We were unable to answer this
question for several reasons. First, as shown in Violin et
al. (2011), the stream restoration projects examined in
this study had no significant effect on stream depth,
habitat, or particle size when compared to urban
unrestored stream habitat. In addition, in this study,
there were no clear significant differences in ecosystem
function between urban unrestored and forested streams
as groups and thus the question of ‘‘restoring’’
ecosystem function may not be a real one, or at least
not as straightforward as we had expected. We saw a
clear correlation between ISC and GPP across all stream
types, suggesting that urbanization does have quantifi-
able effects of ecosystem functions. However, these
effects are gradual and cumulative, and thus better
suited to a regression approach than the ANOVA
approach of stream types that was the primary focus of
this study. Finally, we saw that restoration did have
effects on nitrate uptake in the summer, but likely due to
loss of stream canopy cover, an unintentional impact of
stream restoration, rather than direct beneficial effects of
habitat restoration. Although, ultimately, our study is
not a true test of the Field of Dreams hypothesis, it
raises questions about the effectiveness of natural
channel design stream restoration as it was performed
at these sites, as well as questions about the assumptions
behind stream restoration in general in terms of the
trade-offs between habitat restoration and enhancing
ecosystem functions like nutrient uptake.
CONCLUSIONS
In a study of 12 streams in the North Carolina
Piedmont, we found surprisingly few significant func-
tional differences between forested, urban, and urban
restored streams. We found that ecosystem functions
(GPP, ER, and nitrate uptake) were primarily controlled
by temperature, which was significantly correlated with
ISC. There was also evidence to suggest that natural
channel design stream restoration is causing a significant
increase in stream temperature through the removal of
September 2011 1985EVALUATING RIVER RESTORATION

riparian vegetation. Although this increase in temper-
ature was strongly correlated with nitrate uptake, which
could be a benefit of restoration, the extreme alteration
of the thermal regime is likely to have severe con-
sequences on the biotic community, which could inhibit
successful biological restoration. In contrast to previous
studies, which documented lower standing stocks of
benthic organic matter in urban streams, we saw no such
reduction. However, autochthonous production and
dissolved organic carbon, rather than allochthonously
derived benthic organic matter, seem to be the primary
drivers of ecosystem respiration, suggesting a funda-
mental shift in the base of the food web in urban
streams. Our study suggests a clear need for a
reconsideration of urban streams that better includes
the effects of heat due to loss of riparian vegetation at
the reach scale and the watershed scale effects of the
urban heat island. It also clearly demonstrates funda-
mental flaws in natural channel design stream restora-
tion projects as practiced at these sites, both because
removal of riparian vegetation exacerbates the urban
heat effect, and because implementation of habitat-
focused stream restoration with a goal of water quality
improvement neglects to use all available knowledge of
the underlying processes of stream ecosystem functions.
ACKNOWLEDGMENTS
The authors thank P. Bukaveckas and an anonymousreviewer for thoughtful comments that greatly improved themanuscript. Invaluable field and lab assistance was provided byJ. Bernhardt, A. Golterman, N. Lessios, H. Neely, and C.Violin. Research was supported by NSF DEB 0546251 (CareerAward) as well as funding from the North Carolina WaterResources Research Institute and the North CarolinaDepartment of Environment and Natural Resources. Theresearch described in this paper has also been funded in partby the U.S. Environmental Protection Agency (EPA) under theScience to Achieve Results (STAR) Graduate FellowshipProgram, Grant #916612. EPA has not officially endorsed thispublication, and the views expressed herein may not reflect theviews of the EPA.
LITERATURE CITED
Arar, E. J., and G. B. Collins. 1997. In vitro determination ofchlorophyll a and pheophytin a in marine and freshwateralgae by fluorescence. Method 445.0�1, Revision 1.2.National Exposure Research Laboratory, Office ofResearch and Development, US Environmental ProtectionAgency, Cincinnati, Ohio, USA.
Atkinson, B. L., M. R. Grace, B. T. Hart, and K. E. N.Vanderkruk. 2008. Sediment instability affects the rate andlocation of primary production and respiration in a sand-bedstream. Journal of the North American Benthological Society27:581–592.
Baker, D. B., R. P. Richards, T. T. Loftus, and J. W. Kramer.2004. A new flashiness index: characteristics and applicationsto Midwestern rivers and streams. Journal of the AmericanWater Resources Association 40:503–522.
Bednarek, A. T. 2001. Undamming rivers: a review of theecological impacts of dam removal. EnvironmentalManagement 27:803–814.
BenDor, T., J. Sholtes, and M. W. Doyle. 2009. Landscapecharacteristics of a stream and wetland mitigation bankingprogram. Ecological Applications 19:2078–2092.
Bernhardt, E. S. 2002. Lessons from kinetic releases ofammonium in streams of the Hubbard Brook ExperimentalForest (HBEF). Verhandlungen der InternationalenVereinigung fur theoretische und angewandte Limnologie28:429–433.
Bernhardt, E. S., L. E. Band, C. J. Walsh, and P. E. Berke.2008. Understanding, managing, and minimizing urbanimpacts on surface water nitrogen loading. Annals of theNew York Academy of Sciences 1134:61–96.
Bernhardt, E. S., and M. A. Palmer. 2007. Restoring streams inan urbanizing world. Freshwater Biology 52:738–751.
Bernhardt, E. S., et al., editors. 2005. Synthesizing US riverrestoration efforts. Science 308:636–637.
Biggs, J., A. Corfield, P. Gron, H. O. Hansen, D. Walker, M.Whitfield, and P. Williams. 1998. Restoration of the riversBrede, Cole and Skerne: a joint Danish and British EU-LIFEdemonstration project. V. Short-term impacts on theconservation value of aquatic macroinvertebrate and macro-phyte assemblages. Aquatic Conservation: Marine andFreshwater Ecosystems 8:241–255.
Booth, D. B., and C. R. Jackson. 1997. Urbanization of aquaticsystems: degradation thresholds, stormwater detection, andthe limits of mitigation. Journal of the American WaterResources Association 33:1077–1090.
Bott, T. L. 2006. Primary productivity and communityrespiration. Pages 663–690 in F. R. Hauer and G. A.Lamberti, editors. Methods in stream ecology. Elsevier, NewYork, New York, USA.
Bott, T. L., J. T. Brock, C. S. Dunn, R. J. Naiman, R. W.Ovink, and R. C. Petersen. 1985. Benthic communitymetabolism in four temperate stream systems: an inter-biomecomparison and evaluation of the river continuum concept.Hydrobiologia 123:3–45.
Bott, T. L., J. D. Newbold, and D. B. Arscott. 2006. Ecosystemmetabolism in piedmont streams: Reach geomorphologymodulates the influence of riparian vegetation. Ecosystems9:398–421.
Bukaveckas, P. A. 2007. Effects of channel restoration on watervelocity, transient storage, and nutrient uptake in achannelized stream. Environmental Science and Technology41:1570–1576.
Bunn, S. E., P. M. Davies, and T. D. Mosisch. 1999. Ecosystemmeasures of river health and their response to riparian andcatchment degradation. Freshwater Biology 41:333–345.
Butturini, A., T. J. Battin, and F. Sabater. 2000. Nitrification instream sediment biofilms: the role of ammonium concen-tration and DOC quality. Water Research 34:629–639.
Colangelo, D. J., and B. L. Jones. 2005. Phase I of theKissimmee River restoration project, Florida, USA: impactsof construction on water quality. Environmental Monitoringand Assessment 102:139–158.
Cole, J. J., and N. F. Caraco. 1998. Atmospheric exchange ofcarbon dioxide in a low-wind oligotrophic lake measured bythe addition of SF6. Limnology and Oceanography 43:647–656.
Davis, J. C., and G. W. Minshall. 1999. Nitrogen andphosphorus uptake in two Idaho (USA) headwater wilder-ness streams. Oecologia 199:247–255.
Doll, B. 2003. Stabilization of Rocky Branch Creek foreducational demonstration: final report to North CarolinaDepartment of Environment and Natural Resources EPA319 Funding, DWQ Project #EW9015. North CarolinaDepartment of Environment and Natural Resources,Raleigh, North Carolina, USA.
Dunne, T., and L. Leopold. 1978. Water in environmentalplanning. W.H. Freeman and Company, New York, NewYork, USA.
Flecker, A. S., B. W. Taylor, E. S. Bernhardt, J. M. Hood,W. K. Cornwell, S. R. Cassat, M. J. Vanni, and N. S.Altman. 2002. Interactions between herbivorous fishes and
INVITED FEATURE1986Ecological Applications
Vol. 21, No. 6
limiting nutrients in a tropical stream system. Ecology83:1831–1844.
Gorman, O. T., and J. R. Karr. 1978. Habitat structure andstream fish communities. Ecology 59:507–515.
Griffith, G., J. Omernik, and J. Comstock. 2002. Ecoregions ofNorth Carolina regional descriptions. U.S. EnvironmentalProtection Agency, Corvallis, Oregon, USA.
Grimm, N. B., and S. G. Fisher. 1989. Stability of periphytonand macroinvertebrates to disturbance by flash floods in adesert stream. Journal of the North American BenthologicalSociety 8:293–307.
Grimm, N. B., R. W. Sheibley, C. L. Crenshaw, C. N. Dahm,W. J. Roach, and L. H. Zeglin. 2005. N retention andtransformation in urban streams. Journal of the NorthAmerican Benthological Society 24:626–642.
Hall, R. O., E. S. Bernhardt, and G. E. Likens. 2002. Relatingnutrient uptake with transient storage in forested mountainstreams. Limnology and Oceanography 47:255–265.
Hall, R. O., and J. L. Tank. 2003. Ecosystem metabolismcontrols nitrogen uptake in streams in Grand Teton NationalPark, Wyoming. Limnology and Oceanography 48:1120–1128.
Hall, R. O., et al. 2009. Nitrate removal in stream ecosystemsmeasured by N-15 addition experiments: total uptake.Limnology and Oceanography 54:653–665.
Hatt, B. E., T. D. Fletcher, C. J. Walsh, and S. L. Taylor. 2004.The influence of urban density and drainage infrastructure onthe concentrations and loads of pollutants in small streams.Environmental Management 34(1):112–124.
Hill, W. R., P. J. Mulholland, and E. R. Marzolf. 2001. Streamecosystem responses to forest leaf emergence in spring.Ecology 82:2306–2319.
Holmes, R. M., A. Aminot, R. Kerouel, B. A. Hooker, and B. J.Peterson. 1999. A simple and precise method for measuringammonium in marine and freshwater ecosystems. CanadianJournal of Fisheries and Aquatic Science 56:1801–1808.
Jones, K. L., G. C. Poole, J. L. Meyer, W. Bumback, and E. A.Kramer. 2006. Quantifying expected ecological response tonatural resource legislation: a case study of riparian buffers,aquatic habitat, and trout populations. Ecology and Society11(2):15.
Kalnay, E., and M. Cai. 2003. Impact of urbanization and land-use change on climate. Nature 423:528–531.
Kaushal, S. S., P. M. Groffman, P. M. Mayer, E. Striz, andA. J. Gold. 2008. Effects of stream restoration on denitrifi-cation in an urbanizing watershed. Ecological Applications18:789–804.
KCI Associates. 2003. Stream restoration plan: Third ForkCreek in Forest Hills Park, Durham North Carolina. NorthCarolina Wetlands Restoration Program, North CarolinaDepartment of Environment and Natural Resources,Raleigh, North Carolina, USA.
Maloney, K. O., J. W. Feminella, R. M. Mitchell, S. A. Miller,P. J. Mulholland, and J. N. Houser. 2008. Landuse legaciesand small streams: identifying relationships between histor-ical land use and contemporary stream conditions. Journal ofthe North American Benthological Society 27(2):280–294.
Marzolf, E. R., P. J. Mulholland, and A. D. Steinman. 1994.Improvements to the diurnal upstream-downstream dis-solved oxygen change technique for determining whole-stream metabolism in small streams. Canadian Journal ofFisheries and Aquatic Sciences 51:1591–1599.
McKie, B. G., Z. Petrin, and B. Malmqvist. 2006. Mitigation ordisturbance? Effects of liming on macroinvertebrate assem-blage structure and leaf-litter decomposition in the humicstreams of northern Sweden. Journal of Applied Ecology43:780–791.
Meyer, J. L., M. J. Paul, and W. K. Taulbee. 2005. Streamecosystem function in urbanizing landscapes. Journal of theNorth American Benthological Society 24:602–612.
Miller, S. W., P. Budy, and J. C. Schmidt. 2009. Quantifyingmacroinvertebrate responses to in-stream habitat restoration:applications of meta-analysis to river restoration.Restoration Ecology 18:8–19.
Mulholland, P. J., et al. 2001. Inter-biome comparison offactors controlling stream metabolism. Freshwater Biology46:1503–1517.
Mulholland, P. J., et al. 2008. Stream denitrification acrossbiomes and its response to anthropogenic nitrate loading.Nature 452:202–205.
Mulholland, P. J., J. D. Newbold, J. W. Elwood, L. A. Ferren,and J. R. Webster. 1985. Phosphorus spiraling in a woodlandstream: seasonal variations. Ecology 66:1012–1023.
Newbold, J. D., J. W. Elwood, R. V. O’Neill, and W. VanWinkle. 1981. Measuring nutrient spiralling in streams.Canadian Journal of Fisheries and Aquatic Sciences38:860–863.
North Carolina Department of Environment and NaturalResources. 2003. North Carolina water quality assessmentand impaired waters list. North Carolina Department ofEnvironment and Natural Resources, Raleigh, NorthCarolina, USA.
North Carolina Department of Transportation. 1999. Streamrestoration plan: Abbott Property, Wake County, NorthCarolina. State Project No. 8.1402601. TIP Project No. R-2541. North Carolina Department of Transportation, ProjectDevelopment and Environmental Analysis Branch, Raleigh,North Carolina, USA.
Odum, H. 1956. Primary production in flowing waters.Limnology and Oceanography 1:102–117.
Palmer, M. A., R. F. Ambrose, and N. L. Poff. 1997. Ecologicaltheory and community restoration ecology. RestorationEcology 5:291–300.
Paul, M. J., and J. L. Meyer. 2001. Streams in the urbanlandscape. Annual Review of Ecology and Systematics32:333–365.
Payn, R. A., J. R. Webster, P. J. Mulholland, H. M. Valett, andW. K. Dodds. 2005. Estimation of stream nutrient uptakefrom nutrient addition experiments. Limnology andOceanography: Methods 3:174–182.
Richardson, C. J., and J. W. Pahl. 2005. The Duke Foreststormwater improvement and wetlands restoration project.Final report to the North Carolina Clean WaterManagement Trust Fund and the North CarolinaEcosystem Enhancement Program. Duke UniversityWetland Center, Nicholas School of the Environment andEarth Sciences, Durham, North Carolina, USA.
Roberts, B. J., P. J. Mulholland, and J. N. Houser. 2007.Effects of upland disturbance and instream restoration onhydrodynamics and ammonium uptake in headwaterstreams. Journal of the North American BenthologicalSociety 26:38–53.
Roltsch, W. J., F. G. Zalom, A. J. Strawn, J. F. Strand, andM. J. Pitcairn. 1999. Evaluation of several degree-dayestimation methods in California climates. InternationalJournal of Biometeorology 42:169–176.
Rosgen, D. L. 1994. A classification of natural rivers. Catena22:169–199.
Rosgen, D. L. 1996. A classification of natural rivers: reply tothe comments by J.R. Miller and J.B. Ritter. Catena 27:301–307.
Rosgen, D. L. 2007. Rosgen geomorphic channel design. Pages11:1�11:76 in J. Bernard, J. F. Fripp, and K. R. Robinson,editors. National Engineering Handbook Part 654 (210-VI-NEH). United States Department of Agriculture, NaturalResources Conservation Service, Washington, D.C., USA.
Runkel, R. L. 1998. One-dimensional transport with inflow andstorage (OTIS): a solute transport model for streams andrivers. United States Geological Survey Water Resources
September 2011 1987EVALUATING RIVER RESTORATION
Investigations Report 4018. United States Geological Survey,Denver, Colorado, USA.
Small, M. J., M. W. Doyle, R. L. Fuller, and R. B. Manners.2008. Hydrologic versus geomorphic limitation on CPOMstorage in stream ecosystems. Freshwater Biology 53:1618–1631.
Stelzer, R. S., J. Heffernan, and G. E. Likens. 2003. Theinfluence of dissolved nutrients and particulate organicmatter quality on microbial respiration and biomass in aforest stream. Freshwater Biology 48:1925–1937.
Stream Solute Workshop. 1990. Concepts and methods forassessing solute dynamics in stream ecosystems. Journal ofthe North American Benthological Society 9:95–119.
Sudduth, E. B., J. L. Meyer, and E. S. Bernhardt. 2007. Streamrestoration practices in the southeastern United States.Restoration Ecology 15:573–583.
Tank, J. L., and J. R. Webster. 1998. Interaction of substrateand nutrient availability on wood biofilm processes instreams. Ecology 79:2168–2179.
Thomas, S. A., H. M. Valett, J. R. Webster, and P. J.Mulholland. 2003. A regression approach to estimatingreactive solute uptake in advective and transient storagezones of stream ecosystems. Advances in Water Resources26:965–976.
Uehlinger, U. 2000. Resistance and resilience of ecosystemmetabolism in a flood-prone river system. FreshwaterBiology 45:319–332.
Uehlinger, U., M. Naegeli, and S. G. Fisher. 2002. Aheterotrophic desert stream? The role of sediment stability.Western North American Naturalist 62:466–473.
United Nations. 2008. World urbanization prospects: the 2007revision. United Nations, New York, New York, USA.
Violin, C. R., P. Cada, E. B. Sudduth, B. A. Hassett, D. L.Penrose, and E. S. Bernhardt. 2011. Effects of urbanization
and urban stream restoration on the physical and biologicalstructure of stream ecosystems. Ecological Applications21:1932–1949.
Wallace, J. B., S. L. Eggert, J. L. Meyer, and J. R. Webster.1997. Multiple trophic levels of a forest stream linked toterrestrial litter inputs. Science 277:102–104.
Walsh, C. J., A. H. Roy, J. W. Feminella, P. D. Cottingham,P. M. Groffman, and R. P. Morgan. 2005. The urban streamsyndrome: current knowledge and the search for a cure.Journal of the North American Benthological Society24:706–723.
Webster, J. R., and E. F. Benfield. 1986. Vascular plantbreakdown in freshwater ecosystems. Annual Review ofEcology and Systematics 17:567–594.
Webster, J. R., E. F. Benfield, T. P. Ehrman, M. A. Schaeffer,J. L. Tank, J. J. Hutchens, and D. J. D’Angelo. 1999. Whathappens to allochthonous material that falls into streams? Asynthesis of new and published information from Coweeta.Freshwater Biology 41:687–705.
Webster, J. R., J. L. Tank, J. B. Wallace, J. L. Meyer, S. L.Eggert, T. P. Ehrman, B. R. Ward, B. L. Bennett, P. F.Wagner, and M. E. McTammany. 2000. Effects of litterexclusion and wood removal on phosphorus and nitrogenretention in a forest stream. Verhandlungen derInternationalen Vereinigung fur theoretische und ange-wandte Limnologie 27:1337–1340.
Young, R. G., and A. D. Huryn. 1998. Comment: improve-ments to the diurnal upstream�downstream dissolved oxygenchange technique for determining whole-stream metabolismin small streams. Canadian Journal of Fisheries and AquaticSciences 55:1784–1785.
Young, R. G., and A. D. Huryn. 1999. Effects of land use onstream metabolism and organic matter turnover. EcologicalApplications 9:1359–1376.
APPENDIX A
Chemical and physical characteristics for summer 2006 and winter 2007 sampling days (Ecological Archives A021-089-A1).
APPENDIX B
Physical data for study sites collected during summer 2006 (Ecological Archives A021-089-A2).
INVITED FEATURE1988Ecological Applications
Vol. 21, No. 6
Ecological Applications, 21(6), 2011, pp. 1989–2006� 2011 by the Ecological Society of America
Assessing stream restoration effectiveness at reducing nitrogenexport to downstream waters
SOLANGE FILOSO1,3
AND MARGARET A. PALMER1,2
1Chesapeake Biological Laboratory, University of Maryland Center for Environmental Science, Solomons, Maryland 20688 USA2Department of Entomology, 4112 Plant Sciences Building, University of Maryland, College Park, Maryland 20472 USA
Abstract. The degradation of headwater streams is common in urbanized coastal areas,and the role these streams play in contributing to downstream pollution is a concern amongnatural resource managers and policy makers. Thus, many urban stream restoration effortsare increasingly focused on reducing the downstream flux of pollutants. In regions that sufferfrom coastal eutrophication, it is unclear whether stream restoration does in fact reducenitrogen (N) flux to downstream waters and, if so, by how much and at what cost. In thispaper, we evaluate whether stream restoration implemented to improve water quality of urbanand suburban streams in the Chesapeake Bay region, USA, is effective at reducing the exportof N in stream flow to downstream waters. We assessed the effectiveness of restored streamspositioned in the upland vs. lowland regions of Coastal Plain watershed during both averageand stormflow conditions. We found that, during periods of low discharge, lowland streamsthat receive minor N inputs from groundwater or bank seepage reduced in-stream N fluxes.Furthermore, lowland streams with the highest N concentrations and lowest discharge werethe most effective. During periods of high flow, only those restoration projects that convertedlowland streams to stream–wetland complexes seemed to be effective at reducing N fluxes,presumably because the design promoted the spillover of stream flow onto adjacentfloodplains and wetlands. The observed N-removal rates were relatively high for streamecosystems, and on the order of 5% of the inputs to the watershed. The dominant forms of Nentering restored reaches varied during low and high flows, indicating that N uptake andretention were controlled by distinctive processes during different hydrological conditions.Therefore, in order for stream restoration to effectively reduce N fluxes exported todownstream waters, restoration design should include features that enhance the processingand retention of different forms of N, and for a wide range of flow conditions. The use ofstrategic designs that match the dominant attributes of a stream such as position in thewatershed, influence of groundwater, dominant flow conditions, and N concentrations iscrucial to assure the success of restoration.
Key words: Chesapeake Bay; headwater streams; Maryland; nitrogen export; nitrogen management;restoration assessment; stream restoration; urban streams.
INTRODUCTION
Human activities have impacted watersheds world-
wide, such that countless rivers and streams are polluted,
have highly altered flows, or are severely degraded
geomorphically. Many countries are now making sub-
stantial investments to improve environmental condi-
tions in these waterways, particularly with respect to the
reduction of nutrients. A variety of strategies are being
employed including the regulation of point-source
pollutant discharge, implementation of land preserva-
tion programs, and improvements to stormwater man-
agement (Daniels and Lappins 2005, Taylor and
Fletcher 2007). Other strategies target point and non-
point sources of pollution by reducing the application of
excess fertilizer to agricultural land, restoring wetlands
or by repairing leaky sewer systems (Verhoeven et al.
2006, Dietz and Clausen 2008). Projects are also being
undertaken to improve water quality in streams by
reconfiguring their channels, reconnecting floodplains or
simply planting riparian vegetation (Spruill 2000, Roni
et al. 2002, Rheinhardt et al. 2009).
These efforts all have in common the goal of
improving water quality but they differ fundamentally
in that some of them are designed to prevent pollutants
from reaching tributaries (e.g., land-based best manage-
ment practices [BMPs]) while others must reduce
pollutants that are already in tributaries (e.g., channel
restoration projects). Enhancing stormwater infrastruc-
ture or reforesting uplands is known to lead to positive
Manuscript received 29 April 2010; revised 7 December 2010;accepted 8 December 2010. Corresponding Editor: C. Nilsson.For reprints of this Invited Feature, see footnote 1, p. 1925.
3 E-mail: [email protected]
1989
September 2011 EVALUATING RIVER RESTORATION

hydrological changes that help cleanse polluted water
before it reaches a stream and also reduce flood-induced
channel disturbances that often degrade water quality
(Walsh et al. 2005). Riparian reforestation has also been
extensively studied, and while projects may not have
immediate effects or work in all settings, over time they
can reduce the movement of nutrients and sediments to
streams and thus lead to improved water quality
(Lowrance et al. 1985, Jordan et al. 1993, Meyer et al.
1998). There are also abundant data to show that, if
properly implemented, agricultural BMPs can result in
substantial reductions in the movement of nutrients and
sediments to adjacent waterways (Staver and Brinsfield
1995, 2000). In contrast, data on the water quality
benefits of restoration projects that involve in-stream
manipulations such as altering channel form or adding
in-stream structure are largely absent despite the
frequency of the practice (Bernhardt et al. 2005).
Stream restoration is a relatively young science and it
has only been in the last several years that studies
quantifying its ecological effectiveness are starting to be
published, with most focusing on benthic invertebrates
or geomorphic channel stability (e.g., Moerke et al.
2004, Smith and Prestegaard 2005, Sudduth and Meyer
2006, Tullos et al. 2009).
Various channel design options to improve water
quality have been suggested (Craig et al. 2008) and there
have been a few short-term or small-scale measurements
using experimental releases of nutrients or core-scale
measurements of denitrification. The experimental
releases are used to quantify nutrient ‘‘uptake rate,’’
which is a measure of the rate at which dissolved
nutrients decline as they move downstream from the
release site. This decline could be due to utilization by
microbes and algae, temporary storage in the sediments,
permanent loss from the stream in the case of nitrogen
(due to denitrification), or a combination of these three.
Bukaveckas (2007) measured uptake rates in three
streams in Kentucky (USA) when flows were low
(April–June) and found small increases in uptake rates
of nitrate and phosphate in restored vs. channelized
stream reaches. Klocker et al. (2009) found no consistent
pattern in various measures of nitrate uptake rates in
two restored stream reaches in Maryland (USA) during
the summer of 2006; however, Kaushal et al. (2008)
found higher denitrification rates in the stream banks of
one of these stream reaches compared to unrestored
reaches. Roberts et al. (2007) added coarse woody debris
to disturbed streams as a restoration ‘‘experiment’’ and
showed that ammonium uptake rates were higher one
month after the wood was added. To date, however,
there have been no comprehensive studies that deter-
mine if in-stream restoration projects can reduce the net
export of N to downstream waters, especially during
periods of both high and low flows, when retention
efficiency can vary dramatically (Shields et al. 2006,
Lewis and Grimm 2007).
We evaluated the effectiveness of restored urban and
suburban Coastal Plain streams at reducing the exportof N to downstream waters over a three-year period and
during high and low flows. For the different hydro-logical conditions, we examined fluxes of N in different
forms, including nitrate (NO3�), ammonium (NH4
þ),and dissolved organic and particulate N (DON and PN,respectively) to explore possible mechanisms that con-
trol N export to downstream waters. We also quantifiedrestoration effectiveness as a function of position of the
restored reach in the watershed. We refer to thesepositions as upland vs. lowland because the former are
positioned higher up in the watershed and the latter arepositioned near the tidal boundary. While they differ
only slightly in terms of channel grade and valley-floorwidth, these differences have important hydrologic and
geomorphic implications. We tested the hypotheses that(1) restored streams are more effective at reducing N
exports than non-restored degraded streams and (2) theN-removal capacity of a restored stream varies between
upland and lowland reaches.The study was conducted in streams in the
Chesapeake Bay region, where excess nutrients exportedfrom the watershed associated with an ever growing
population and intensive agriculture have caused thebay to become increasingly eutrophic over the lastseveral decades (Kemp et al. 2005, Fisher et al. 2006,
Williams et al. 2010). Consequently, this region has oneof the highest number of stream restorations (Hassett et
al. 2005) and diversity of restoration approachesimplemented, including restoration in upland and low-
land reaches of the Coastal Plain region.
MATERIALS AND METHODS
Site descriptions
The study was conducted in eight streams located
within a radius of 40 km in the Coastal Plain of westernMaryland in Anne Arundel County (388510 N, 768320
W), which is one of the most urbanized regions in theUnited States, and where annual precipitation andtemperature average 1130 mm and 13.28C, respectively.
The study streams drained dominantly urban andsuburban catchments that ranged in size from about
0.4 to 1.4 km2 (Table 1), and were serviced either byprivate septic systems, public sewage treatment facilities,
or both. All stream reaches included in the study were inheadwaters (first and second order), however, four
reaches where positioned higher up in the watershed(upland reaches) and four positioned near the tidal zone
(lowland reaches). Headwater streams make up themajority of the channels in the Coastal Plain drainage
network and, despite relatively low gradients comparedto streams in mountainous terrain, they can destabilize
with increased runoff because they lack bedrock controlsand are free to adjust with changes in flow. Degradationof stream reaches positioned higher up in the watershed
(upland reaches) result in gully-like conditions, wherechannels lack adjacent floodplains and are characterized
INVITED FEATURE1990Ecological Applications
Vol. 21, No. 6
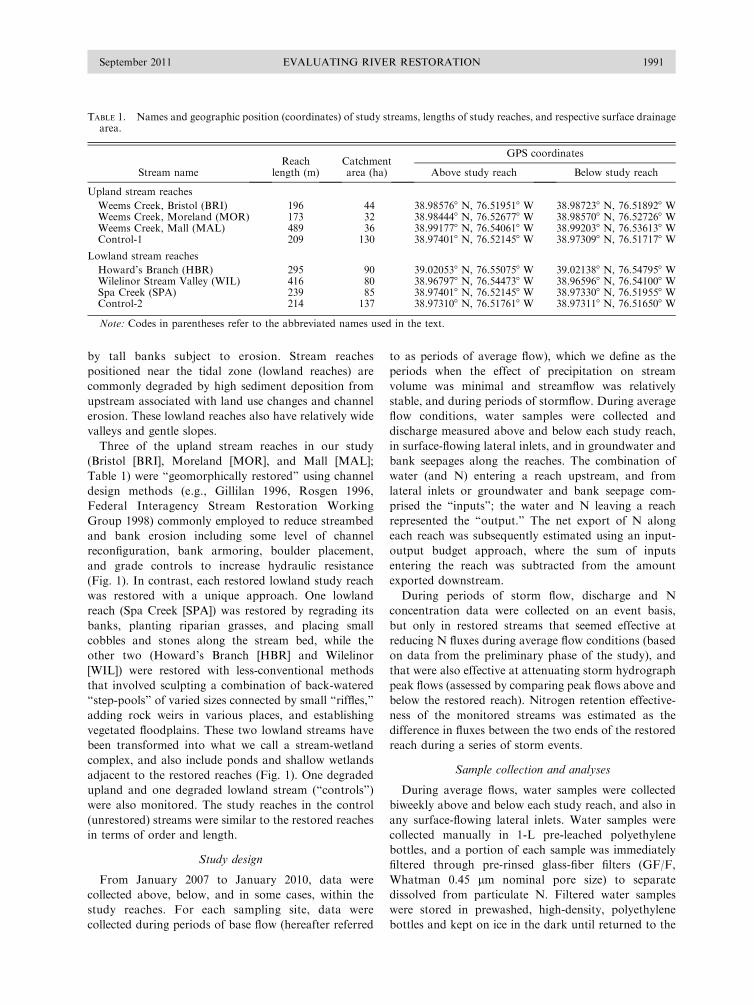
by tall banks subject to erosion. Stream reaches
positioned near the tidal zone (lowland reaches) are
commonly degraded by high sediment deposition from
upstream associated with land use changes and channel
erosion. These lowland reaches also have relatively wide
valleys and gentle slopes.
Three of the upland stream reaches in our study
(Bristol [BRI], Moreland [MOR], and Mall [MAL];
Table 1) were ‘‘geomorphically restored’’ using channel
design methods (e.g., Gillilan 1996, Rosgen 1996,
Federal Interagency Stream Restoration Working
Group 1998) commonly employed to reduce streambed
and bank erosion including some level of channel
reconfiguration, bank armoring, boulder placement,
and grade controls to increase hydraulic resistance
(Fig. 1). In contrast, each restored lowland study reach
was restored with a unique approach. One lowland
reach (Spa Creek [SPA]) was restored by regrading its
banks, planting riparian grasses, and placing small
cobbles and stones along the stream bed, while the
other two (Howard’s Branch [HBR] and Wilelinor
[WIL]) were restored with less-conventional methods
that involved sculpting a combination of back-watered
‘‘step-pools’’ of varied sizes connected by small ‘‘riffles,’’
adding rock weirs in various places, and establishing
vegetated floodplains. These two lowland streams have
been transformed into what we call a stream-wetland
complex, and also include ponds and shallow wetlands
adjacent to the restored reaches (Fig. 1). One degraded
upland and one degraded lowland stream (‘‘controls’’)
were also monitored. The study reaches in the control
(unrestored) streams were similar to the restored reaches
in terms of order and length.
Study design
From January 2007 to January 2010, data were
collected above, below, and in some cases, within the
study reaches. For each sampling site, data were
collected during periods of base flow (hereafter referred
to as periods of average flow), which we define as the
periods when the effect of precipitation on stream
volume was minimal and streamflow was relatively
stable, and during periods of stormflow. During average
flow conditions, water samples were collected and
discharge measured above and below each study reach,
in surface-flowing lateral inlets, and in groundwater and
bank seepages along the reaches. The combination of
water (and N) entering a reach upstream, and from
lateral inlets or groundwater and bank seepage com-
prised the ‘‘inputs’’; the water and N leaving a reach
represented the ‘‘output.’’ The net export of N along
each reach was subsequently estimated using an input-
output budget approach, where the sum of inputs
entering the reach was subtracted from the amount
exported downstream.
During periods of storm flow, discharge and N
concentration data were collected on an event basis,
but only in restored streams that seemed effective at
reducing N fluxes during average flow conditions (based
on data from the preliminary phase of the study), and
that were also effective at attenuating storm hydrograph
peak flows (assessed by comparing peak flows above and
below the restored reach). Nitrogen retention effective-
ness of the monitored streams was estimated as the
difference in fluxes between the two ends of the restored
reach during a series of storm events.
Sample collection and analyses
During average flows, water samples were collected
biweekly above and below each study reach, and also in
any surface-flowing lateral inlets. Water samples were
collected manually in 1-L pre-leached polyethylene
bottles, and a portion of each sample was immediately
filtered through pre-rinsed glass-fiber filters (GF/F,
Whatman 0.45 lm nominal pore size) to separate
dissolved from particulate N. Filtered water samples
were stored in prewashed, high-density, polyethylene
bottles and kept on ice in the dark until returned to the
TABLE 1. Names and geographic position (coordinates) of study streams, lengths of study reaches, and respective surface drainagearea.
Stream nameReach
length (m)Catchmentarea (ha)
GPS coordinates
Above study reach Below study reach
Upland stream reaches
Weems Creek, Bristol (BRI) 196 44 38.985768 N, 76.519518 W 38.987238 N, 76.518928 WWeems Creek, Moreland (MOR) 173 32 38.984448 N, 76.526778 W 38.985708 N, 76.527268 WWeems Creek, Mall (MAL) 489 36 38.991778 N, 76.540618 W 38.992038 N, 76.536138 WControl-1 209 130 38.974018 N, 76.521458 W 38.973098 N, 76.517178 W
Lowland stream reaches
Howard’s Branch (HBR) 295 90 39.020538 N, 76.550758 W 39.021388 N, 76.547958 WWilelinor Stream Valley (WIL) 416 80 38.967978 N, 76.544738 W 38.965968 N, 76.541008 WSpa Creek (SPA) 239 85 38.974018 N, 76.521458 W 38.973308 N, 76.519558 WControl-2 214 137 38.973108 N, 76.517618 W 38.973118 N, 76.516508 W
Note: Codes in parentheses refer to the abbreviated names used in the text.
September 2011 1991EVALUATING RIVER RESTORATION
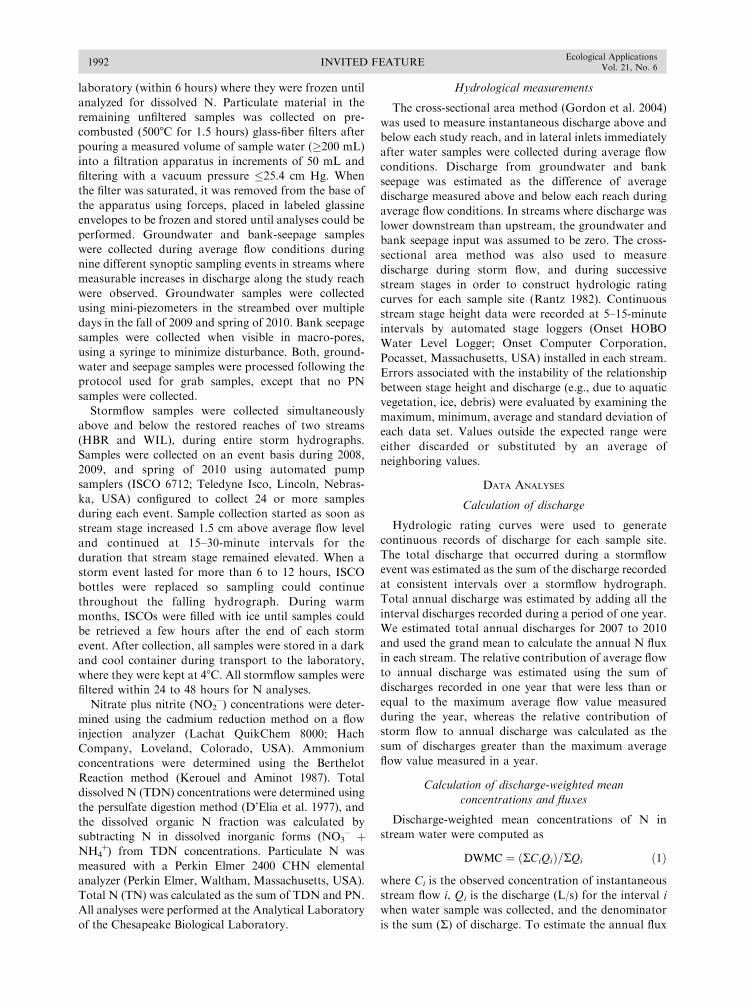
laboratory (within 6 hours) where they were frozen until
analyzed for dissolved N. Particulate material in the
remaining unfiltered samples was collected on pre-
combusted (5008C for 1.5 hours) glass-fiber filters after
pouring a measured volume of sample water (�200 mL)
into a filtration apparatus in increments of 50 mL and
filtering with a vacuum pressure �25.4 cm Hg. When
the filter was saturated, it was removed from the base of
the apparatus using forceps, placed in labeled glassine
envelopes to be frozen and stored until analyses could be
performed. Groundwater and bank-seepage samples
were collected during average flow conditions during
nine different synoptic sampling events in streams where
measurable increases in discharge along the study reach
were observed. Groundwater samples were collected
using mini-piezometers in the streambed over multiple
days in the fall of 2009 and spring of 2010. Bank seepage
samples were collected when visible in macro-pores,
using a syringe to minimize disturbance. Both, ground-
water and seepage samples were processed following the
protocol used for grab samples, except that no PN
samples were collected.
Stormflow samples were collected simultaneously
above and below the restored reaches of two streams
(HBR and WIL), during entire storm hydrographs.
Samples were collected on an event basis during 2008,
2009, and spring of 2010 using automated pump
samplers (ISCO 6712; Teledyne Isco, Lincoln, Nebras-
ka, USA) configured to collect 24 or more samples
during each event. Sample collection started as soon as
stream stage increased 1.5 cm above average flow level
and continued at 15–30-minute intervals for the
duration that stream stage remained elevated. When a
storm event lasted for more than 6 to 12 hours, ISCO
bottles were replaced so sampling could continue
throughout the falling hydrograph. During warm
months, ISCOs were filled with ice until samples could
be retrieved a few hours after the end of each storm
event. After collection, all samples were stored in a dark
and cool container during transport to the laboratory,
where they were kept at 48C. All stormflow samples were
filtered within 24 to 48 hours for N analyses.
Nitrate plus nitrite (NO2�) concentrations were deter-
mined using the cadmium reduction method on a flow
injection analyzer (Lachat QuikChem 8000; Hach
Company, Loveland, Colorado, USA). Ammonium
concentrations were determined using the Berthelot
Reaction method (Kerouel and Aminot 1987). Total
dissolved N (TDN) concentrations were determined using
the persulfate digestion method (D’Elia et al. 1977), and
the dissolved organic N fraction was calculated by
subtracting N in dissolved inorganic forms (NO3� þ
NH4þ) from TDN concentrations. Particulate N was
measured with a Perkin Elmer 2400 CHN elemental
analyzer (Perkin Elmer, Waltham, Massachusetts, USA).
Total N (TN) was calculated as the sum of TDN and PN.
All analyses were performed at the Analytical Laboratory
of the Chesapeake Biological Laboratory.
Hydrological measurements
The cross-sectional area method (Gordon et al. 2004)
was used to measure instantaneous discharge above and
below each study reach, and in lateral inlets immediately
after water samples were collected during average flow
conditions. Discharge from groundwater and bank
seepage was estimated as the difference of average
discharge measured above and below each reach during
average flow conditions. In streams where discharge was
lower downstream than upstream, the groundwater and
bank seepage input was assumed to be zero. The cross-
sectional area method was also used to measure
discharge during storm flow, and during successive
stream stages in order to construct hydrologic rating
curves for each sample site (Rantz 1982). Continuous
stream stage height data were recorded at 5–15-minute
intervals by automated stage loggers (Onset HOBO
Water Level Logger; Onset Computer Corporation,
Pocasset, Massachusetts, USA) installed in each stream.
Errors associated with the instability of the relationship
between stage height and discharge (e.g., due to aquatic
vegetation, ice, debris) were evaluated by examining the
maximum, minimum, average and standard deviation of
each data set. Values outside the expected range were
either discarded or substituted by an average of
neighboring values.
DATA ANALYSES
Calculation of discharge
Hydrologic rating curves were used to generate
continuous records of discharge for each sample site.
The total discharge that occurred during a stormflow
event was estimated as the sum of the discharge recorded
at consistent intervals over a stormflow hydrograph.
Total annual discharge was estimated by adding all the
interval discharges recorded during a period of one year.
We estimated total annual discharges for 2007 to 2010
and used the grand mean to calculate the annual N flux
in each stream. The relative contribution of average flow
to annual discharge was estimated using the sum of
discharges recorded in one year that were less than or
equal to the maximum average flow value measured
during the year, whereas the relative contribution of
storm flow to annual discharge was calculated as the
sum of discharges greater than the maximum average
flow value measured in a year.
Calculation of discharge-weighted mean
concentrations and fluxes
Discharge-weighted mean concentrations of N in
stream water were computed as
DWMC ¼ ðRCiQiÞ=RQi ð1Þ
where Ci is the observed concentration of instantaneous
stream flow i, Qi is the discharge (L/s) for the interval i
when water sample was collected, and the denominator
is the sum (R) of discharge. To estimate the annual flux
INVITED FEATURE1992Ecological Applications
Vol. 21, No. 6

of N exported from each stream during average flow
conditions, we first assumed that the discharge-weighted
mean concentrations (DWMC) of the every-other-week
samples represented concentrations during all periods of
discharge equivalent to or below the maximum value
observed during biweekly sampling. Similarly, we
assumed that the DWMC of samples collected during
storm flow represented concentrations during all high-
flow periods. Total N flux (Fj) for each site was then
calculated separately for high and average flows as
Fj ¼ ðDWMCÞðQjÞ ð2Þ
where DWMC is the discharge-weighted concentration
for each study site, and Qj is the total discharge during
either high or average flows during the year. The sum of
fluxes from high and average flows yielded the annual
fluxes.
Assessment of restoration efficiency
The efficiency of stream restoration at reducing the
net export of N downstream was determined by
comparing N fluxes in and out of the study reaches
during average flow conditions and during storm events.
Net N export during average flow was calculated by
subtracting the sum of N inputs to the reach (i.e., water
from upstream, lateral inlets, bank seepage, and ground-
water) from the flux of N at the outflow. Fluxes from
upstream, at the outflow, and from lateral inlets were
calculated as the product of volume-weighted mean TN
concentrations and average biweekly discharge.
Groundwater and bank seepage fluxes were calculated
as a product of average TDN concentrations of samples
collected during synoptic sampling and the average
discharge increase along each reach. During high-flow
conditions, we evaluated the performance of restoration
by calculating N retention/loss along the restored
reaches. In addition, because stream degradation in
urban catchments is associated with severe-flow-pattern
alterations, our assessment of restoration efficiency
during high-flow conditions also included the evaluation
of storm hydrographs (peak flow characteristics and
magnitude) during different storm events.
Uncertainty assessment
Uncertainties associated with the mass balances were
estimated by determining the propagation of individual
errors generated from the calculation of fluxes included
in the input–output model. The error for each compo-
nent of the mass balance was computed using the
Tukey’s jackknife procedure for mean concentrations
and discharge. To obtain an approximate estimate of the
overall error associated with fluxes, a propagation of the
component errors was performed as described in
FIG. 1. Stream restoration designs used in Anne Arundel County, Maryland, USA. The upper panels show restoration featuressuch as (a) rip-raps and (b) cross vanes used in traditional restoration designs commonly implemented in upland reaches (e.g., BRI,MOR, and MAL). Traditional designs are based on a geomorphic template that refers to a least disturbed reference site (i.e., asemi-pristine stream) to reduce peak flow and control erosion. The lower panels show restoration features such as (c) shallow steppools and (d) riffle weirs, which are part of restoration designs implemented in lowland reaches such as HBR and WIL. Reaches aredescribed in Table 1.
September 2011 1993EVALUATING RIVER RESTORATION
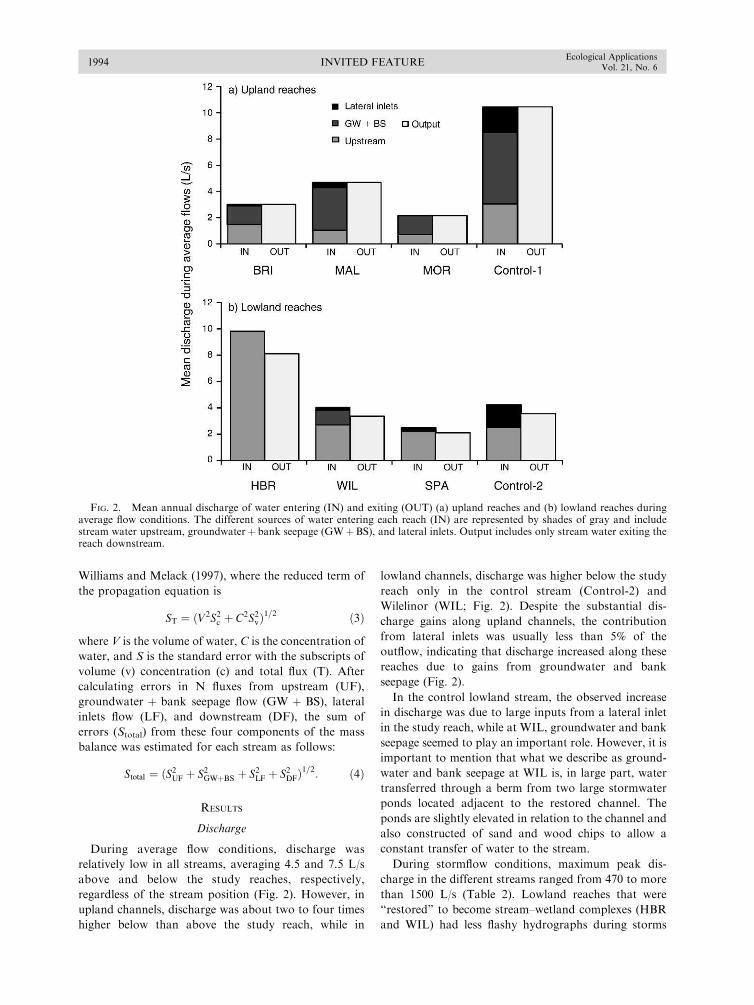
Williams and Melack (1997), where the reduced term of
the propagation equation is
ST ¼ ðV2S2c þ C2S2
vÞ1=2 ð3Þ
where V is the volume of water, C is the concentration of
water, and S is the standard error with the subscripts of
volume (v) concentration (c) and total flux (T). After
calculating errors in N fluxes from upstream (UF),
groundwater þ bank seepage flow (GW þ BS), lateral
inlets flow (LF), and downstream (DF), the sum of
errors (Stotal) from these four components of the mass
balance was estimated for each stream as follows:
Stotal ¼ ðS2UF þ S2
GWþBS þ S2LF þ S2
DFÞ1=2: ð4Þ
RESULTS
Discharge
During average flow conditions, discharge was
relatively low in all streams, averaging 4.5 and 7.5 L/s
above and below the study reaches, respectively,
regardless of the stream position (Fig. 2). However, in
upland channels, discharge was about two to four times
higher below than above the study reach, while in
lowland channels, discharge was higher below the study
reach only in the control stream (Control-2) and
Wilelinor (WIL; Fig. 2). Despite the substantial dis-
charge gains along upland channels, the contribution
from lateral inlets was usually less than 5% of the
outflow, indicating that discharge increased along these
reaches due to gains from groundwater and bank
seepage (Fig. 2).
In the control lowland stream, the observed increase
in discharge was due to large inputs from a lateral inlet
in the study reach, while at WIL, groundwater and bank
seepage seemed to play an important role. However, it is
important to mention that what we describe as ground-
water and bank seepage at WIL is, in large part, water
transferred through a berm from two large stormwater
ponds located adjacent to the restored channel. The
ponds are slightly elevated in relation to the channel and
also constructed of sand and wood chips to allow a
constant transfer of water to the stream.
During stormflow conditions, maximum peak dis-
charge in the different streams ranged from 470 to more
than 1500 L/s (Table 2). Lowland reaches that were
‘‘restored’’ to become stream–wetland complexes (HBR
and WIL) had less flashy hydrographs during storms
FIG. 2. Mean annual discharge of water entering (IN) and exiting (OUT) (a) upland reaches and (b) lowland reaches duringaverage flow conditions. The different sources of water entering each reach (IN) are represented by shades of gray and includestream water upstream, groundwaterþ bank seepage (GWþBS), and lateral inlets. Output includes only stream water exiting thereach downstream.
INVITED FEATURE1994Ecological Applications
Vol. 21, No. 6
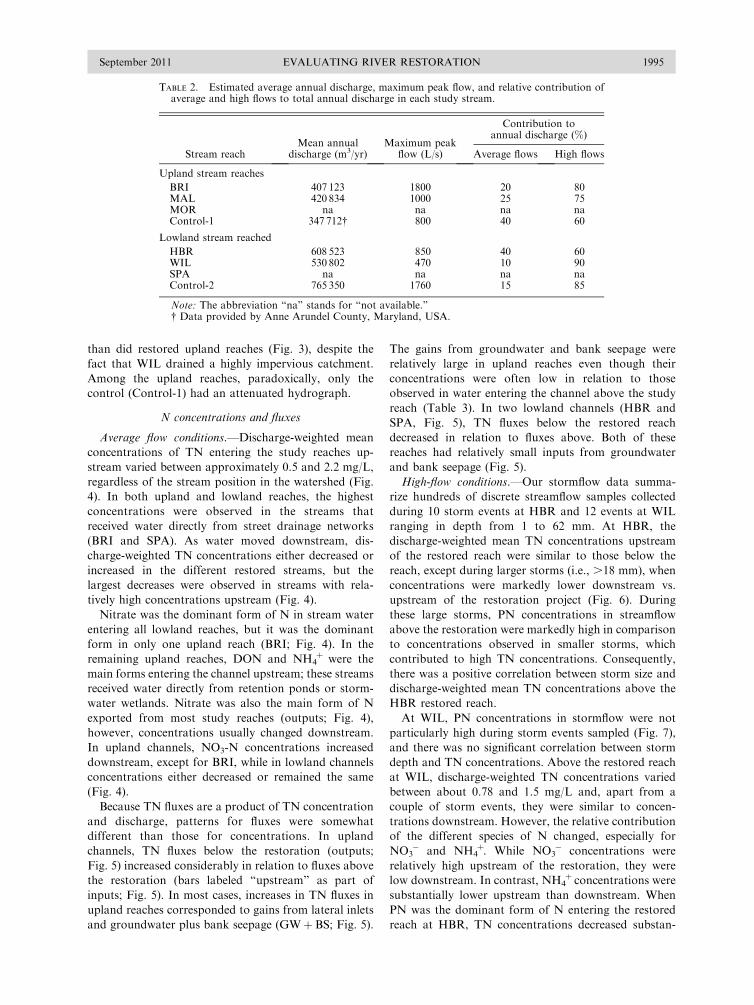
than did restored upland reaches (Fig. 3), despite the
fact that WIL drained a highly impervious catchment.
Among the upland reaches, paradoxically, only the
control (Control-1) had an attenuated hydrograph.
N concentrations and fluxes
Average flow conditions.—Discharge-weighted mean
concentrations of TN entering the study reaches up-
stream varied between approximately 0.5 and 2.2 mg/L,
regardless of the stream position in the watershed (Fig.
4). In both upland and lowland reaches, the highest
concentrations were observed in the streams that
received water directly from street drainage networks
(BRI and SPA). As water moved downstream, dis-
charge-weighted TN concentrations either decreased or
increased in the different restored streams, but the
largest decreases were observed in streams with rela-
tively high concentrations upstream (Fig. 4).
Nitrate was the dominant form of N in stream water
entering all lowland reaches, but it was the dominant
form in only one upland reach (BRI; Fig. 4). In the
remaining upland reaches, DON and NH4þ were the
main forms entering the channel upstream; these streams
received water directly from retention ponds or storm-
water wetlands. Nitrate was also the main form of N
exported from most study reaches (outputs; Fig. 4),
however, concentrations usually changed downstream.
In upland channels, NO3-N concentrations increased
downstream, except for BRI, while in lowland channels
concentrations either decreased or remained the same
(Fig. 4).
Because TN fluxes are a product of TN concentration
and discharge, patterns for fluxes were somewhat
different than those for concentrations. In upland
channels, TN fluxes below the restoration (outputs;
Fig. 5) increased considerably in relation to fluxes above
the restoration (bars labeled ‘‘upstream’’ as part of
inputs; Fig. 5). In most cases, increases in TN fluxes in
upland reaches corresponded to gains from lateral inlets
and groundwater plus bank seepage (GWþ BS; Fig. 5).
The gains from groundwater and bank seepage were
relatively large in upland reaches even though their
concentrations were often low in relation to those
observed in water entering the channel above the study
reach (Table 3). In two lowland channels (HBR and
SPA, Fig. 5), TN fluxes below the restored reach
decreased in relation to fluxes above. Both of these
reaches had relatively small inputs from groundwater
and bank seepage (Fig. 5).
High-flow conditions.—Our stormflow data summa-
rize hundreds of discrete streamflow samples collected
during 10 storm events at HBR and 12 events at WIL
ranging in depth from 1 to 62 mm. At HBR, the
discharge-weighted mean TN concentrations upstream
of the restored reach were similar to those below the
reach, except during larger storms (i.e., .18 mm), when
concentrations were markedly lower downstream vs.
upstream of the restoration project (Fig. 6). During
these large storms, PN concentrations in streamflow
above the restoration were markedly high in comparison
to concentrations observed in smaller storms, which
contributed to high TN concentrations. Consequently,
there was a positive correlation between storm size and
discharge-weighted mean TN concentrations above the
HBR restored reach.
At WIL, PN concentrations in stormflow were not
particularly high during storm events sampled (Fig. 7),
and there was no significant correlation between storm
depth and TN concentrations. Above the restored reach
at WIL, discharge-weighted TN concentrations varied
between about 0.78 and 1.5 mg/L and, apart from a
couple of storm events, they were similar to concen-
trations downstream. However, the relative contribution
of the different species of N changed, especially for
NO3� and NH4
þ. While NO3� concentrations were
relatively high upstream of the restoration, they were
low downstream. In contrast, NH4þ concentrations were
substantially lower upstream than downstream. When
PN was the dominant form of N entering the restored
reach at HBR, TN concentrations decreased substan-
TABLE 2. Estimated average annual discharge, maximum peak flow, and relative contribution ofaverage and high flows to total annual discharge in each study stream.
Stream reachMean annual
discharge (m3/yr)Maximum peak
flow (L/s)
Contribution toannual discharge (%)
Average flows High flows
Upland stream reaches
BRI 407 123 1800 20 80MAL 420 834 1000 25 75MOR na na na naControl-1 347 712� 800 40 60
Lowland stream reached
HBR 608 523 850 40 60WIL 530 802 470 10 90SPA na na na naControl-2 765 350 1760 15 85
Note: The abbreviation ‘‘na’’ stands for ‘‘not available.’’� Data provided by Anne Arundel County, Maryland, USA.
September 2011 1995EVALUATING RIVER RESTORATION
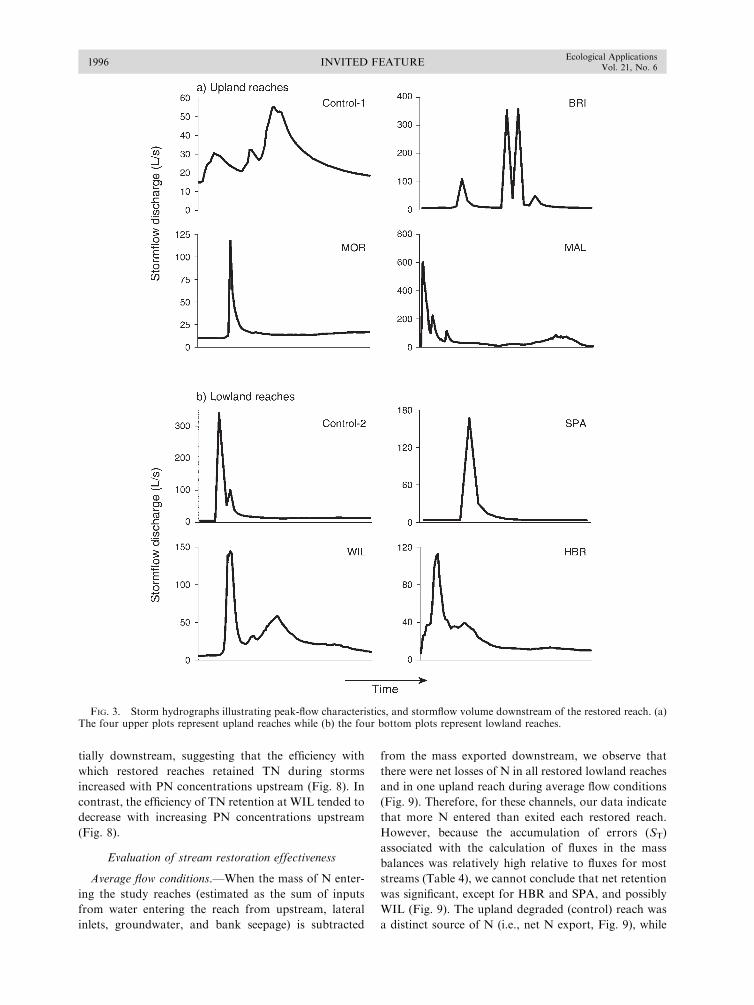
tially downstream, suggesting that the efficiency with
which restored reaches retained TN during storms
increased with PN concentrations upstream (Fig. 8). In
contrast, the efficiency of TN retention at WIL tended to
decrease with increasing PN concentrations upstream
(Fig. 8).
Evaluation of stream restoration effectiveness
Average flow conditions.—When the mass of N enter-
ing the study reaches (estimated as the sum of inputs
from water entering the reach from upstream, lateral
inlets, groundwater, and bank seepage) is subtracted
from the mass exported downstream, we observe that
there were net losses of N in all restored lowland reaches
and in one upland reach during average flow conditions
(Fig. 9). Therefore, for these channels, our data indicate
that more N entered than exited each restored reach.
However, because the accumulation of errors (ST)
associated with the calculation of fluxes in the mass
balances was relatively high relative to fluxes for most
streams (Table 4), we cannot conclude that net retention
was significant, except for HBR and SPA, and possibly
WIL (Fig. 9). The upland degraded (control) reach was
a distinct source of N (i.e., net N export, Fig. 9), while
FIG. 3. Storm hydrographs illustrating peak-flow characteristics, and stormflow volume downstream of the restored reach. (a)The four upper plots represent upland reaches while (b) the four bottom plots represent lowland reaches.
INVITED FEATURE1996Ecological Applications
Vol. 21, No. 6

the lowland degraded (control) reach was much less so
(Fig. 9).
In general, upland streams had a higher accumulation
of errors (ST) relative to fluxes than the lowland reaches
because of additional errors associated with quantifying
fluxes from lateral inlets, and groundwater and bank
seepages (Table 4). Therefore, in streams where these
sources were small relative to the sum of fluxes (e.g.,
SPA and HBR), the propagation of errors was lower.
The relatively stable nature of water quality in the
lowland channels above and below the study reaches
during average flow conditions also lowered the
magnitude of errors. On average, the lowland restored
reaches reduced loads by 0.38 g N�m�1�d�1 (Fig. 9),
which represents about 23% of the N entering the stream
reaches upstream during average flow conditions. This is
a conservative estimate since it includes the modest load
reduction observed at WIL.
High-flow conditions.—Among the 10 events sampled
along the restored reach at HBR during stormflow
conditions, we observed a decrease in TN fluxes in nine
(Table 5), indicating that the restored reach functioned
as a net sink for TN during stormflow conditions. On
average, 1.16 g N was retained/removed per linear meter
of restored stream per storm event, totaling about 0.34
kg N per storm event. Out of the 12 storm events
sampled at WIL, net retention was observed in only
four. On average, the WIL reach was a net source rather
FIG. 4. Discharge-weighted mean TN concentrations (DWMC) in stream flow entering (IN) and exiting (OUT) the studyreaches: (a) concentrations in the upland reaches; (b) concentrations in lowland reaches. The different shades of gray refer todifferent forms of N (particulate N [PN], dissolved organic N [DON], ammonium [NH4], and nitrate [NO3]). For each stream,DWMC was calculated from 39 samples except for SPA, which was calculated from 25.
September 2011 1997EVALUATING RIVER RESTORATION
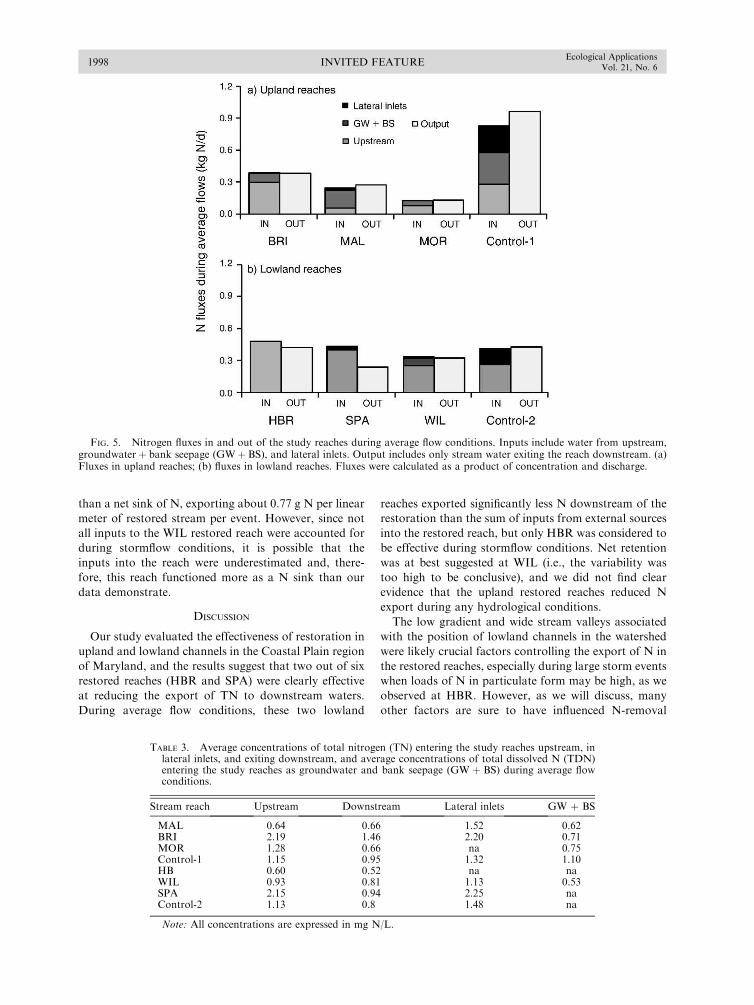
than a net sink of N, exporting about 0.77 g N per linear
meter of restored stream per event. However, since not
all inputs to the WIL restored reach were accounted for
during stormflow conditions, it is possible that the
inputs into the reach were underestimated and, there-
fore, this reach functioned more as a N sink than our
data demonstrate.
DISCUSSION
Our study evaluated the effectiveness of restoration in
upland and lowland channels in the Coastal Plain region
of Maryland, and the results suggest that two out of six
restored reaches (HBR and SPA) were clearly effective
at reducing the export of TN to downstream waters.
During average flow conditions, these two lowland
reaches exported significantly less N downstream of the
restoration than the sum of inputs from external sources
into the restored reach, but only HBR was considered to
be effective during stormflow conditions. Net retention
was at best suggested at WIL (i.e., the variability was
too high to be conclusive), and we did not find clear
evidence that the upland restored reaches reduced N
export during any hydrological conditions.
The low gradient and wide stream valleys associated
with the position of lowland channels in the watershed
were likely crucial factors controlling the export of N in
the restored reaches, especially during large storm events
when loads of N in particulate form may be high, as we
observed at HBR. However, as we will discuss, many
other factors are sure to have influenced N-removal
FIG. 5. Nitrogen fluxes in and out of the study reaches during average flow conditions. Inputs include water from upstream,groundwaterþ bank seepage (GWþ BS), and lateral inlets. Output includes only stream water exiting the reach downstream. (a)Fluxes in upland reaches; (b) fluxes in lowland reaches. Fluxes were calculated as a product of concentration and discharge.
TABLE 3. Average concentrations of total nitrogen (TN) entering the study reaches upstream, inlateral inlets, and exiting downstream, and average concentrations of total dissolved N (TDN)entering the study reaches as groundwater and bank seepage (GW þ BS) during average flowconditions.
Stream reach Upstream Downstream Lateral inlets GW þ BS
MAL 0.64 0.66 1.52 0.62BRI 2.19 1.46 2.20 0.71MOR 1.28 0.66 na 0.75Control-1 1.15 0.95 1.32 1.10HB 0.60 0.52 na naWIL 0.93 0.81 1.13 0.53SPA 2.15 0.94 2.25 naControl-2 1.13 0.8 1.48 na
Note: All concentrations are expressed in mg N/L.
INVITED FEATURE1998Ecological Applications
Vol. 21, No. 6

FIG. 6. Partitioning of N species in stormflow samples collected (a) above and (b) below the restored reach at HBR during 10different storms varying in size. Each column represents the discharge-weighted mean (DWM) concentrations of stream watersamples collected along an entire storm hydrograph; data are sorted on the x-axis according to rainfall depth of the storm event.
FIG. 7. Concentrations and composition of N in stormflow samples collected at WIL during different storm events (a) aboveand (b) below the restored reach. Each column represents the discharge-weighted mean (DWM) concentrations of samples collectedduring a stormflow hydrograph; data are sorted on the x-axis according to rainfall depth of the storm event.
September 2011 1999EVALUATING RIVER RESTORATION

capacities of the study reaches. Clearly, comparisons
among sites and between restored and control streams in
all studies of real-world restoration projects are compli-
cated by inevitable intrinsic preexisting differences
among control and restored streams, or by differences
in restoration design or implementation at each site.
Because we lack pre-restoration data and stormflow
data from some sites, the interpretation of our findings is
further complicated. Despite these caveats, our findings
suggesting that most of the restoration projects did not
seem to result in significant decline in the downstream
export of N along the restored reach have important
implications for N management and for future studies
on the water quality benefits of stream restoration.
A possible explanation for the higher retention rates
observed at HBR and SPA vs. the other reaches during
average flows is that most of the N transported in their
channels originated upstream of the restoration as
opposed to within the restored reach (i.e., from ground-
water and lateral inputs) and, therefore, had more
opportunity for in-channel processing. In contrast, as
upland restored channels received relatively large
amounts of new N from groundwater and bank seepage
inputs along the entire length of the reach, it is likely
that in-stream biotic uptake of N was insufficient to
balance groundwater inputs and internal N cycling
(Brookshire et al. 2009), resulting in a rapid increase in
loads transported downstream. Therefore, unless resto-
ration efforts prevent some of the N in groundwater and
bank seepage from entering the restored streams, the
effectiveness of restoration in upland channels may be
compromised by a limited capacity for in-stream N
processing to compensate for groundwater inputs.
Inputs of N from groundwater and bank seepage at
HBR and SPA were relatively small either because
discharge from these sources was small, which was the
case at Spa Creek (SPA), or because most of the
groundwater and bank seepage that would have entered
the lowland channels directly was retained in seepage
wetlands and shallow ponds built adjacent to the
restored reach. These wetlands and shallow ponds
increased the opportunities for N processing and losses,
and also for water losses through evaporation, evapo-
transpiration, and seepage. In the case of WIL, ground-
water and bank seepage also accumulated in two large
stormwater ponds and subsequently percolated to the
stream through the berms separating the ponds from the
restored channel. The berms were made of sand and
wood chips with Atlantic white cedar (Chamaecyparis
thyoides) planted throughout, and likely promoted N
loss and retention via denitrification and plant uptake.
Higher water residence time associated with the lower
gradient of lowland channels is another important factor
controlling the effectiveness of stream restoration at
reducing fluxes exported downstream because it pro-
vides opportunities for substantial in-channel N removal
FIG. 8. Efficiency of N removal during stormflows forrestored stream reaches as a function of discharge-weightedmean concentrations upstream of the restored reach: (a) HBR;(b) WIL. Both curves are significant (P , 0.05).
FIG. 9. Net export of total N during average flowconditions in study reaches. The mass balance includes inputsfrom surface water upstream of the study reach, groundwaterþbank seepage, and lateral inlets. Output is the mass of Nexported downstream of the study reach. Net export is shownfor (a) upland reaches and (b) lowland reaches. Error barsrepresent the error percentage of flux, based on error analyses.
INVITED FEATURE2000Ecological Applications
Vol. 21, No. 6
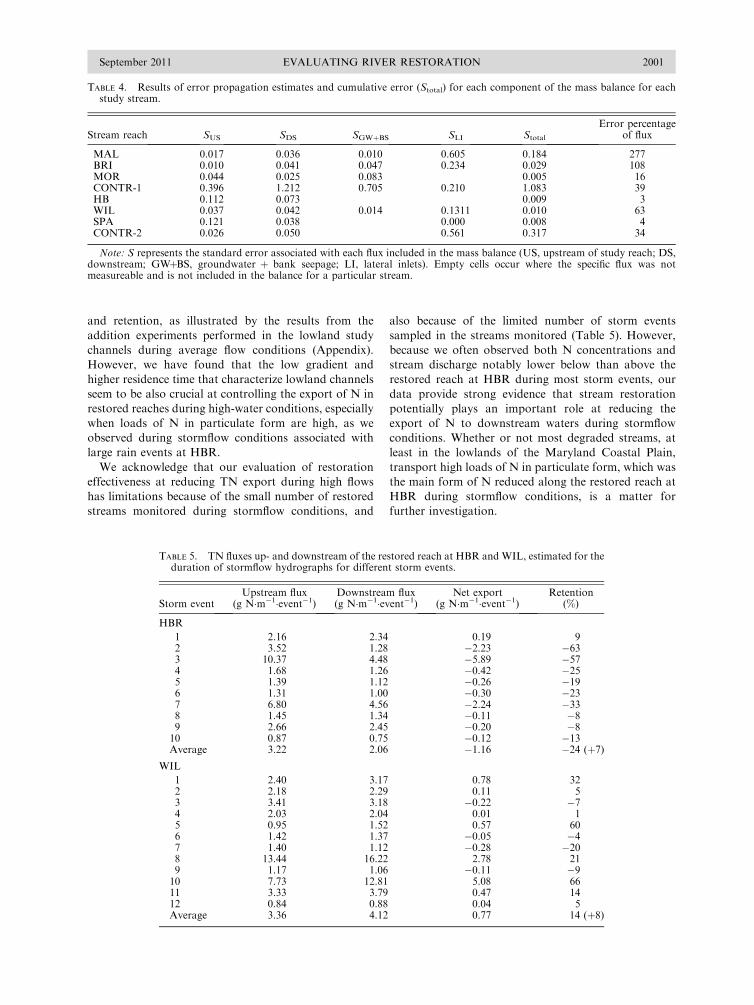
and retention, as illustrated by the results from the
addition experiments performed in the lowland study
channels during average flow conditions (Appendix).
However, we have found that the low gradient and
higher residence time that characterize lowland channels
seem to be also crucial at controlling the export of N in
restored reaches during high-water conditions, especially
when loads of N in particulate form are high, as we
observed during stormflow conditions associated with
large rain events at HBR.
We acknowledge that our evaluation of restoration
effectiveness at reducing TN export during high flows
has limitations because of the small number of restored
streams monitored during stormflow conditions, and
also because of the limited number of storm events
sampled in the streams monitored (Table 5). However,
because we often observed both N concentrations and
stream discharge notably lower below than above the
restored reach at HBR during most storm events, our
data provide strong evidence that stream restoration
potentially plays an important role at reducing the
export of N to downstream waters during stormflow
conditions. Whether or not most degraded streams, at
least in the lowlands of the Maryland Coastal Plain,
transport high loads of N in particulate form, which was
the main form of N reduced along the restored reach at
HBR during stormflow conditions, is a matter for
further investigation.
TABLE 5. TN fluxes up- and downstream of the restored reach at HBR and WIL, estimated for theduration of stormflow hydrographs for different storm events.
Storm eventUpstream flux
(g N�m�1�event�1)Downstream flux(g N�m�1�event�1)
Net export(g N�m�1�event�1)
Retention(%)
HBR
1 2.16 2.34 0.19 92 3.52 1.28 �2.23 �633 10.37 4.48 �5.89 �574 1.68 1.26 �0.42 �255 1.39 1.12 �0.26 �196 1.31 1.00 �0.30 �237 6.80 4.56 �2.24 �338 1.45 1.34 �0.11 �89 2.66 2.45 �0.20 �810 0.87 0.75 �0.12 �13Average 3.22 2.06 �1.16 �24 (þ7)
WIL
1 2.40 3.17 0.78 322 2.18 2.29 0.11 53 3.41 3.18 �0.22 �74 2.03 2.04 0.01 15 0.95 1.52 0.57 606 1.42 1.37 �0.05 �47 1.40 1.12 �0.28 �208 13.44 16.22 2.78 219 1.17 1.06 �0.11 �910 7.73 12.81 5.08 6611 3.33 3.79 0.47 1412 0.84 0.88 0.04 5Average 3.36 4.12 0.77 14 (þ8)
TABLE 4. Results of error propagation estimates and cumulative error (Stotal) for each component of the mass balance for eachstudy stream.
Stream reach SUS SDS SGWþBS SLI Stotal
Error percentageof flux
MAL 0.017 0.036 0.010 0.605 0.184 277BRI 0.010 0.041 0.047 0.234 0.029 108MOR 0.044 0.025 0.083 0.005 16CONTR-1 0.396 1.212 0.705 0.210 1.083 39HB 0.112 0.073 0.009 3WIL 0.037 0.042 0.014 0.1311 0.010 63SPA 0.121 0.038 0.000 0.008 4CONTR-2 0.026 0.050 0.561 0.317 34
Note: S represents the standard error associated with each flux included in the mass balance (US, upstream of study reach; DS,downstream; GWþBS, groundwater þ bank seepage; LI, lateral inlets). Empty cells occur where the specific flux was notmeasureable and is not included in the balance for a particular stream.
September 2011 2001EVALUATING RIVER RESTORATION
Different forms of N must be considered
in restoration efforts
Nitrogen retention is one of the essential ecosystem
services (Grimm et al. 2005) that restoration seeks toreestablish in streams. Moreover, promoting dissimila-
tive uptake of N or denitrification is the most commongoal in restorations that target N reduction because it
leads to the permanent removal of N from the system(Kaushal et al. 2008, Pickett et al. 2008, Klocker et al.
2009). However, while a fundamental condition fordenitrification to occur is availability of NO3
� (Meyer et
al. 2005), organic N is the dominant N pool within riversacross most of the United States and is important even
in basins with high anthropogenic sources of N (Scott etal. 2007).
In streams associated with urbanization, nitrate iscommonly the main N form (Grimm et al. 2005).
However, in our study reaches, much of the N waspresent in other forms. Out of the eight reaches
monitored in this study, NO3� was the dominant form
of N in half of them. Where the contribution of NO3�
was relatively low, NH4þ and DON were the main forms
entering and exiting the restored reach. Thus, given thediverse forms of nitrogen that may exist in streams,
restoration efforts that focus mainly on promoting in-stream denitrification, such as establishing organic
debris dams (Groffman et al. 2005) and inducinghyporheic exchange (Kasahara and Hill 2006), may fail
to reduce N loads if NO3� is a minor component of TN
in stream water.
We speculate that, for our study sites, dissolvedoxygen and DOC may have controlled NO3
� production
in stream reaches where streamflow originated fromstormwater ponds and stormwater wetlands (Thouin et
al. 2009). Stormwater systems have proven to beeffective at removing N in dissolved and particulate
forms (Lee et al. 2009), but they can create an anoxicenvironment that promotes mineralization and limits
nitrification. Water from stormwater ponds and wet-lands also has large quantities of particulate carbon
relative to N in stream water, which can slownitrification (Starry et al. 2005). In streams not linkedto stormwater ponds and wetlands, DON and NH4
þ
could also have originated from septic system dischargeand leaking sewage pipes (Bohlke et al. 2006, Bernhardt
and Palmer 2007).
Restoration is only one of many factors
influencing N-removal capacity in streams
Most N that enters watersheds is removed interrestrial and riparian areas before entering streams
and, while processing N in streams can be substantial,net N removal along a stream reach depends on
hydrologic, geomorphic, and biological conditions inthe watershed (Wollheim et al. 2008). Retention capacity
of watersheds is assumed to be relatively high, but it isalso proportional to inputs (Boyer et al. 2006); as inputs
to the watershed increase, export to aquatic ecosystems
are likely to increase as well. Once excess N enters
stream channels, in-stream N removal, especially of
NO3�, increases with N concentrations in stream water.
However, the relationship between concentrations and
removal is nonlinear, hence, above a certain concen-
tration level, N-removal capacity in streams becomes
saturated (Claessens et al. 2009).
In our study streams, we observed that the reaches
with the highest concentrations of dissolved inorganic N
were those where most streamflow originated directly
from street drainage networks, without any stormflow
management control upstream (e.g., BRI and SPA). In
these reaches, N concentrations decreased substantially
along the restored reach during average flows (Fig. 4),
yet, whether or not restoration was responsible for
promoting N removal in both streams is unclear. We
observed that at BRI, large portions of the restored
reach were covered by iron oxidizing bacteria mats,
which may be an indication that the groundwater
supplied high levels of reduced iron to the stream
channel. Iron oxidizing bacteria can mediate NO3�
reduction coupled to iron oxidation in aquatic ecosys-
tems (Burgin and Hamilton 2007), hence, anoxic
groundwater with high levels of iron in reduced (ferrous)
form rather than stream restoration may have caused
the enhanced removal of NO3� at BRI.
At SPA, the high NO3� concentrations combined with
a low channel gradient were probably the most
important factors yielding the high removal rates
observed (Fig. 9). It is important to note, however, that
our results from the NO3-N addition experiment at SPA
(Appendix) suggest that removal rates would not
continue to increase with increasing N concentrations
since we found a decrease in N uptake when we elevated
NO3-N substantially above background levels (i.e.,
suggesting uptake saturation is likely to occur in these
restored channels if N inputs increase). In addition, at
the peak of the growing season, thick mats of grassy
vegetation grow in this shallow and narrow channel,
which likely remove a substantial amount of N from
stream water. By contrast, in the winter, after this
vegetation has died, N-removal rates decrease (S. Filoso,
unpublished data).
Besides the magnitude of N inputs from the watershed
and ambient N concentrations, discharge is also known
to influence the N-removal capacity of streams.
Generally, N-removal rates are lower during high flows
because there is little time for stream water and
sediments to be in contact (low hydraulic retention).
Therefore, as N export in streams occurs increasingly
during periods of high flows, the ability of streams to
remove N decreases.
As our data show, stormflow contributed the majority
of the discharge in the urban and suburban streams we
studied (Table 2), and stormflow N concentrations in the
streams that we monitored during stormflow conditions
were comparable to or greater than those of average
flow conditions (Figs. 7 and 8). Consequently, we
INVITED FEATURE2002Ecological Applications
Vol. 21, No. 6
deduce that most of the N in the restored streams was
exported during high flows, which means that, restora-
tion efforts that reduce the magnitude of stormflow
discharges are more likely to reduce the total export of
N on an annual basis.
We observed that, along a relatively short restored
reach at HBR (295 m, Table 1), peak flows seemed to be
attenuated enough for TN loads to decrease by an
average of 24% or 1.16 g N/m/storm event, especially
because of retention of relatively high amounts of PN
exported in stream water during high flows in this
stream. On an areal basis, this decrease was on the order
of 193 mg N�m�2�event�1, assuming an average width of
6 m for the entire restoration reach. For the sake of
comparison, we calculated that, during average flow
conditions, the same reach reduced N fluxes by an
average of 11%, or 1.39 mg N�m�2/h�1, while accordingto Mulholland et al. (2009), areal denitrification rates in
urban/suburban streams average about 2 mg N�m�2/h�1.The restored design used at WIL was similar to that of
HBR, however, we did not observe such consistent net
retention in the system during stormflow conditions.
One of the reasons may be that, as we did not account
for N inputs from lateral inlets during large storms, we
presumably underestimated inputs into the system
during stormflow conditions and, consequently, the N
removal or deposition along the restored reach. Another
reason may be that the ponds adjacent to the restored
stream channel at WIL are much larger than the shallow
ponds at HBR, so they accumulate large volumes of
water that overflow into the channel during certain
storms. When pond water overflows into the stream
channel during storms, additional N is loaded into the
restored reach and, consequently, N export is likely to
increase downstream.
Whereas restored lowland streams converted to
stream–wetland complexes such as HBR and WIL
seemed to effectively reduce peak discharges, it is certain
that steeper gradients and narrow adjacent floodplains
associated with upland reaches may restrict the potential
for certain streams to effectively reduce N export to
downstream waters during high-flow conditions.
Therefore, restoration of these types of streams may
need to be accompanied by other measures at the
watershed scale that help reduce excess overflow and
manage N loads to streams.
Putting urban stream restoration
for N management in perspective
While effective management to reduce excess N loads
from anthropogenic sources in urban catchments should
include a variety of measures at the landscape scale
designed to capture, retain and ultimately denitrify this
N (Bernhardt and Palmer 2007), failures at several levels
have lead managers to increasingly turn to streams
restoration as the main attempt to minimize N loads to
downstream or coastal waters (Palmer 2009). If stream
restoration were to be implemented along entire river
networks and at the watershed scale, this managementapproach would be likely be quite effective at reducing
N loads to coastal waters. However, stream reachestargeted for restoration are usually short, have smalldrainage areas (commonly ,1 km2) and, consequently,
contribute relatively little to N export at the watershedscale. Therefore, stream restoration has a limitedcapacity to substantially reduce the delivery of excess
N to coastal waters.In order to provide some perspective about the
magnitude of N flux reduction via stream restoration
in a typical urbanizing catchment in the study region, weconstructed a back-of-the-envelope N budget based onthe catchment characteristics of WIL (Table 6) and the
best-case scenario for in-stream N retention observed inthis study for a restored reach (i.e., net retention forHBR). The main sources of N in the budget and typical
for urban and suburban catchments include atmosphericdeposition, human waste (septic or sewage), lawnfertilizer, and pet waste (Bernhardt et al. 2008).
Assuming that in the Chesapeake Bay watershedatmospheric deposition contributes about 10–14 kgN�ha�1�yr�1, sewage 0.81 kg N�ha�1�yr�1, septic systems
1.55 kg N�person�1�yr�1, and fertilizer to lawns 100 kgN�ha�1�yr�1 (Boyer et al. 2002, Wollheim et al. 2005,Chesapeake Bay Program 2008), we estimated that the
total annual input of N to the catchment wasapproximately 1700 kg. We also assumed that about
72% of the N inputs to the landscape were retained inthe catchment (including terrestrial system, riparianzone); therefore, only about 480 kg of N was loaded into
the restored stream. Of the total N loaded into thestream reach, we estimated that 43%, or about 206 kgN/yr, was exported during average flow conditions, and
57%, or 273 kg N/yr, during high water conditions.Therefore, if we consider that, during average flowconditions the restored stream reduced the N export by
13% or about 27 kg N/yr, and during stormflows theremoval rate was about 20%, or 55 kg N/yr, the restoredreach theoretically removed/retained about 82 kg
N/year. The retention/removal is equivalent to 17% of
TABLE 6. Characteristics of a typical urbanizing headwatercatchment in the study region, which we used to estimate theamount of N input to a catchment and compare with theamount of N flux reduced along a restored study stream.
Characteristic Value
Surface area 90 haRestored stream 400 mAverage flow discharge 4.5 L/sImpervious cover 33 haResidential land 16 haLawn cover 8 haParking lots and roads 6 haResidential lot size 0.375 acres (0.152 ha)Average household 2.5 peopleAverage annual rainfall 1016 mmFertilizer application rate 50 kg N�ha�1�yr�1N retention rate in catchment 65–80%
September 2011 2003EVALUATING RIVER RESTORATION
the annual N export and to less than 5% of the total N
input to the catchment, a catchment-scale figure
consistent with recent estimates by Claessens et al.
(2009) for streams in other catchments. Consequently,
we reiterate the conclusion Claessens et al. (2009) and
others (Bernhardt et al. 2008, Craig et al. 2008) reached:
efforts to substantially reduce watershed N export
should focus on riparian and upland interventions on
the catchment scale as opposed to focusing only on in-
stream channel processes, especially on a reach scale.
CONCLUSIONS
Despite evidence from our study that only some
restoration projects are effective at reducing the export
of N in urban/suburban streams, we have shown that
load-reduction efficiency can be obtained, especially if
restoration reduces the export of N during high water
conditions. However, in order to compensate for the
increasing pace of anthropogenic N inputs and the
concomitant loss in the capacity of N processing in the
drainage area (Bernhardt et al. 2008), streams may need
to be increasingly manipulated or highly engineered to
manage high N loads, at the expense of losing some of
the fundamental functions associated with stream
ecosystems. Thus, innovative projects such as those
implemented at WIL and HBR could be implemented to
reduce N flux in lowland areas if it is acceptable to
convert them to dramatically different ecological sys-
tems (i.e., more like created wetlands than restored
streams). While it remains to be tested, such designs may
have limited effectiveness in the uplands unless increases
in hydraulic retention are sufficient to remove not only
N inputs from upstream but those from groundwater
and lateral inlets. It is more likely that success will come
from preventing excess N from being loaded into the
stream channel in the first place by restoring the riparian
vegetation and implementing watershed scale best
management practices such as improved stormwater
infrastructure. These actions are more likely to promote
N removal/retention under stormflows than channel
projects. While streams are part of a continuum on a
drainage network, restoration is largely implemented in
stream reaches as isolated units, where the proximity
and magnitude of sources to the restored reach are
ignored. Using a combination of approaches that target
the source of the problem (i.e., lowering N inputs to the
watershed and subsequent delivery to streams) will in
the long run be much more likely to provide nutrient
reduction and other restoration benefits than focusing
on restoring streams one reach at a time (Bernhardt and
Palmer 2011).
ACKNOWLEDGMENTS
We thank Sean Smith of the Maryland Department ofNatural Resources for his assistance with finding the study sites,weir installation, and data collection. We also thank EricDuneman, Kristin Politano, Lindsay Cumella, and KateO’Mara for field and laboratory assistance. This manuscriptwas greatly improved by thorough review comments from
Stephen Hamilton, Michael Williams, and an anonymousreviewer. This research was supported by the MarylandDepartment of the Environment and Anne Arundel CountyDepartment of Public Works.
LITERATURE CITED
Bernhardt, E. S., L. E. Band, C. J. Walsh, and P. E. Berke.2008. Understanding, managing, and minimizing urbanimpacts on surface water nitrogen loading. Annals of theNew York Academy of Sciences 1134:61–96.
Bernhardt, E. S., and M. A. Palmer. 2007. Restoring streams inurbanizing landscapes. Freshwater Biology 52:738–751.
Bernhardt, E. S., and M. A. Palmer. 2011. River restoration:the fuzzy logic of repairing reaches to reverse catchment scaledegradation. Ecological Applications 21:1926–1931.
Bernhardt, E. S., et al. 2005. Synthesizing U.S. river restorationefforts. Science 308:636–637.
Bohlke, J. K., R. L. Smith, and D. N. Miller. 2006. Ammoniumtransport and reaction in contaminated groundwater: appli-cation of isotope tracers and isotope fractionation studies.Water Resources Research 42:W05411.
Boyer, E. W., C. L. Goodale, N. A. Jaworski, and R. W.Howarth. 2002. Anthropogenic nitrogen sources and rela-tionships to riverine nitrogen export in the northeasternUSA. Biogeochemistry 57:137–169.
Boyer, E. W., R. W. Howarth, J. N. Galloway, F. J. Dentener,P. A. Green, and C. J. Vorosmarty. 2006. Riverine nitrogenexport from the continents to the coasts. GlobalBiogeochemical Cycles 20:GB1S91.
Brookshire, E. N., H. M. Valett, and S. Gerber. 2009.Maintenance of terrestrial nutrient loss signatures duringin-stream transport. Ecology 90:293–299.
Bukaveckas, P. A. 2007. Effects of channel restoration on watervelocity, transient storage, and nutrient uptake in achannelized stream. Environmental Science and Technology41:1570–76.
Burgin, A. J., and S. K. Hamilton. 2007. Have we over-emphasized the role of denitrification in aquatic ecosystems?A review of nitrate removal pathways. Frontiers in Ecologyand the Environment 5:89–96.
Chesapeake Bay Program. 2008. Sources of nitrogen loadsto the bay. hhttp://www.chesapeakebay.net/nitrogen.aspx?menuitem¼19412i
Claessens, L., C. L. Tague, L. E. Band, P. M. Groffman, andS. T. Kenworthy. 2009. Hydro-ecological linkages in urban-izing watersheds: an empirical assessment of in-stream nitrateloss and evidence of saturation kinetics. Journal ofGeophysical Research 114. [doi:10.1029/2009JG001017]
Craig, L. S., et al. editors. 2008. Stream restoration strategiesfor reducing nitrogen loads. Frontiers in Ecology and theEnvironment. 6:529–538.
Daniels, T., and M. Lappins. 2005. Land preservation: anessential ingredient in smart growth. Journal of PlanningLiterature 3:316–329.
D’Elia, C. F., P. A. Steudler, and N. Corwin. 1977.Determination of total nitrogen in aqueous samples usingpersulfate digestion. Limnology and Oceanography 22:760–764.
Dietz, M. E., and J. C. Clausen. 2008. Stormwater runoff andexport changes with development in a traditional and lowimpact subdivision. Journal of Environmental Management87:560–566.
Federal Interagency Stream Restoration Working Group. 1998.Stream corridor restoration: principles, processes and prac-tices. National Technical Information Service, U.S.Department of Commerce, Springfield, Virginia, USA.
Fisher, T. R., J. D. Hagy, W. R. Boynton, and M. R. Williams.2006. Cultural eutrophication in the Choptank and Patuxentestuaries of the Chesapeake Bay. Limnology and Ocean-ography 51:435–447.
INVITED FEATURE2004Ecological Applications
Vol. 21, No. 6
Gordon, N. D., T. A. McMahon, B. L. Finlayson, C. J. Gippel,and R. J. Nathan. 2004. Stream hydrology: an introductionfor ecologists. Wiley, Chichester, UK.
Grimm, N. B., R. W. Sheibley, C. L. Crenshaw, C. N. Dahm,W. J. Roach, and L. H. Zeglin. 2005. N retention andtransformation in urban streams. Journal of the NorthAmerican Benthological Society 24:626–642.
Groffman, P. M., A. M. Dorsey, and P. M. Mayer. 2005. Nprocessing with geomorphic structures in urban streams.Journal of the North American Benthological Society24:613–625.
Hassett, B., M. A. Palmer, E. S. Bernhardt, S. Smith, J. Carr,and D. Hart. 2005. Restoring watersheds project by project:trends in Chesapeake Bay tributary restoration. Frontiers inEcology and the Environment 3:259–267.
Jordan, T. E., D. L. Correll, and D. E. Weller. 1993. Nutrientinterception by a riparian forest receiving cropland runoff.Journal of Environmental Quality 22:467–473.
Kasahara, T., and A. R. Hill. 2006. Effects of riffle-steprestoration on hyporheic zone chemistry in N-rich lowlandstreams. Canadian Bulletin of Fisheries and Aquatic Sciences63:120–133.
Kaushal, S. S., P. M. Groffman, P. M. Mayer, E. Striz, E. J.Doheny, and A. J. Gold. 2008. Effects of stream restorationon denitrification in an urbanizing watershed. EcologicalApplications 18:789–804.
Kemp, W. M., et al. 2005. Eutrophication of Chesapeake Bay:historical trends and ecological interactions. Marine EcologyProgress Series 303:1–29.
Kerouel, R., and A. Aminot. 1987. An optimized procedure foranalyzing nutrients dissolved in sea-water which minimizescontamination. Marine Environmental Research 22:19–32.
Klocker, C. A., S. S. Kaushal, P. M. Groffman, P. M. Mayer,and R. P. Morgan. 2009. Nitrogen uptake and denitrificationin restored and unrestored streams in urban Maryland, USA.Aquatic Sciences 71:411–424.
Lee, C., T. Fletcher, and G. Sun. 2009. Review: nitrogenremoval in constructed wetland systems. Engineering in LifeSciences 9:11–22.
Lewis, D. B., and N. B. Grimm. 2007. Hierarchical regulationof nitrogen export from urban catchments: interactions ofstorms and landscapes. Ecological Applications 17:2347–2364.
Lowrance, R., R. Leonard, and J. Sheridan. 1985. Managingriparian ecosystems to control nonpoint source pollution.Journal of Soil and Water Conservation 40:87–91.
Meyer, J. L., M. J. Paul, and W. K. Taulbee. 2005. Streamecosystem function in urbanizing landscapes. Journal of theNorth American Benthological Society 24:602–612.
Meyer, J. L., J. B. Wallace, and S. L. Eggert. 1998. Leaf litter asa source of dissolved organic carbon in streams. Ecosystems1:240–249.
Moerke, A. H., K. J. Gerard, J. A. Latimore, R. A. Hellenthal,and G. A. Lamberti. 2004. Restoration of an Indiana, USA,stream: bridging the gap between basic and applied loticecology. Journal of the North American BenthologicalSociety 23:647–660.
Mulholland, P. J., et al. 2009. Nitrate removal in streamecosystems measured by 15N addition experiments: denitri-fication. Limnology and Oceanography 54(3):666–680.
Palmer, M. A. 2009. Invited Odum essay: reforming watershedrestoration: science in need of application and applications inneed of science. Estuaries and Coasts 32:1–17.
Pickett, S. T. A., et al. 2008. Beyond urban legends: anemerging framework of urban ecology, as illustrated by theBaltimore Ecosystem Study. BioScience 58:139–150.
Rantz, S. E. 1982. Measurement and computation of stream-flow. Volume 1: measurement of stage and discharge. U.S.Geological Survey Water Supply Paper 2175. U.S.Geological Survey, Reston, Virginia, USA.
Rheinhardt, R., M. McKenney-Easterling, M. Brinson, J.Masina-Rubbo, R. Brooks, D. Whigham, D. O’Brien, J.Hite, and B. Armstrong. 2009. Canopy composition andforest structure provide restoration targets for low-orderriparian ecosystems. Restoration Ecology 17:51–59.
Roberts, B. J., P. J. Mulholland, and A. N. Houser. 2007.Effects of upland disturbance and instream restoration onhydrodynamics and ammonium uptake in headwaterstreams. Journal of the North American BenthologicalSociety 26:38–53.
Roni, P., T. J. Beechie, R. E. Bilby, F. E. Leonetti, M. M.Pollock, and G. R. Pess. 2002. A review of stream restorationtechniques and a hierarchical strategy for prioritizingrestoration in Pacific Northwest watersheds. NorthAmerican Journal of Fisheries Management 22:1–20.
Rosgen, D. L. 1996. Applied river morphology. WildlandHydrology, Pagosa Springs, Colorado, USA.
Scott, D., J. Harvey, R. Alexander, and G. Schwarz. 2007.Dominance of organic nitrogen from headwater streams tolarge rivers across the conterminous United States. GlobalBiogeochemical Changes 21. [doi:10.1029/2006GB002730]
Shields, F. D., E. J. Langendoen, and M. W. Doyle. 2006.Adapting existing models to examine effects of agriculturalconservation programs on stream habitat quality. Journal ofthe American Water Resources Association 42:25–33.
Smith, S. S., and K. L. Prestegaard. 2005. Hydraulic perform-ance of a morphology-based stream channel design. WaterResources Research 41:W11413.
Spruill, T. B. 2000. Statistical evaluation of effects of riparianbuffers on nitrate and ground water quality. Journal ofEnvironmental Quality 29:1523–1538.
Starry, O. S., H. M. Valett, and M. E. Schreiber. 2005.Nitrification rates in a headwater stream: influences ofseasonal variation in C and N supply. Journal of the NorthAmerican Benthological Society 24:753–768.
Staver, K. W., and R. B. Brinsfield. 1995. Assessing the impactof changes in management practices on nutrient transportfrom Coastal Plain agricultural systems. Final reportsubmitted to the Chesapeake Research Consortium, CRCProject CA NPS#3. Chesapeake Research Consortium,Edgewater, Maryland, USA.
Staver, K. W., and R. B. Brinsfield. 2000. Evaluating changes insubsurface nitrogen discharge from an agricultural watershedinto Chesapeake Bay after implementation of a groundwaterprotection strategy. Final report submitted to the MarylandDepartment of Natural Resources, Section 319 Grant,Project 14-98-340-EPA Q29. University of Maryland,College of Agriculture and Natural Resources, AgriculturalExperiment Station, Wye Research and Education Center,Queenstown, Maryland, USA.
Sudduth, E. L., and J. L. Meyer. 2006. Effects of bioengineeredstreambank stabilization on bank habitat and macroinverte-brates in urban streams. Environmental Management38:218–226.
Taylor, A., and T. Fletcher. 2007. Nonstructural urbanstormwater quality measures: building a knowledge base toimprove their use. Environmental Management 39:663–677.
Thouin, J. A., W. M. Wollheim, C. J. Vorosmarty, J. M.Jacobs, and W. H. McDowell. 2009. The biogeochemicalinfluences of NO3
�, dissolved O2, and dissolved organic C onstream NO3
� uptake. Journal of the North AmericanBenthological Society 28:894–907.
Tullos, D., D. Penrose, G. Jennings, and W. Cope. 2009.Analysis of functional traits in reconfigured channels:implications for the bioassessment and disturbance of riverrestoration. Journal of the North American BenthologicalSociety 28:80–92.
Verhoeven, J. T. A., B. Arheimer, C. Q. Yin, and M. M.Hefting. 2006. Regional and global concerns over wetlands
September 2011 2005EVALUATING RIVER RESTORATION
and water quality. Trends in Ecology and Evolution 21:92–103.
Walsh, C. J., T. D. Fletcher, and A. R. Ladson. 2005. Streamrestoration in urban catchments through redesigning storm-water systems: looking to the catchment to save the stream.Journal of the North American Benthological Society24:690–705.
Williams, M. R., S. Filoso, B. J. Longstaff, and W. C.Dennison. 2010. Long-term trends of water quality andbiotic metrics in Chesapeake Bay: 1986 to 2008. Estuariesand Coasts 33:1279–1299.
Williams, M. R., and J. M. Melack. 1997. Solute export from
forested and partially deforested catchments in the Central
Amazon. Biogeochemistry 38:67–102.
Wollheim, W. M., B. A. Pellerin, C. J. Vorosmarty, and C. H.
Hopkinson. 2005. N retention in urbanizing headwater
catchments. Ecosystems 8:871–884.
Wollheim, W. M., B. J. Peterson, S. M. Thomas, C. H.
Hopkinson, and C. J. Vorosmarty. 2008. Dynamics of N
removal over annual time periods in a suburban river
network. Journal of Geophysical Research 113:G03038.
APPENDIX
A table containing NO3-N uptake rates in restored lowland streams calculated from N addition experiments conducted duringaverage flow conditions (Ecological Archives A021-090-A1).
INVITED FEATURE2006Ecological Applications
Vol. 21, No. 6
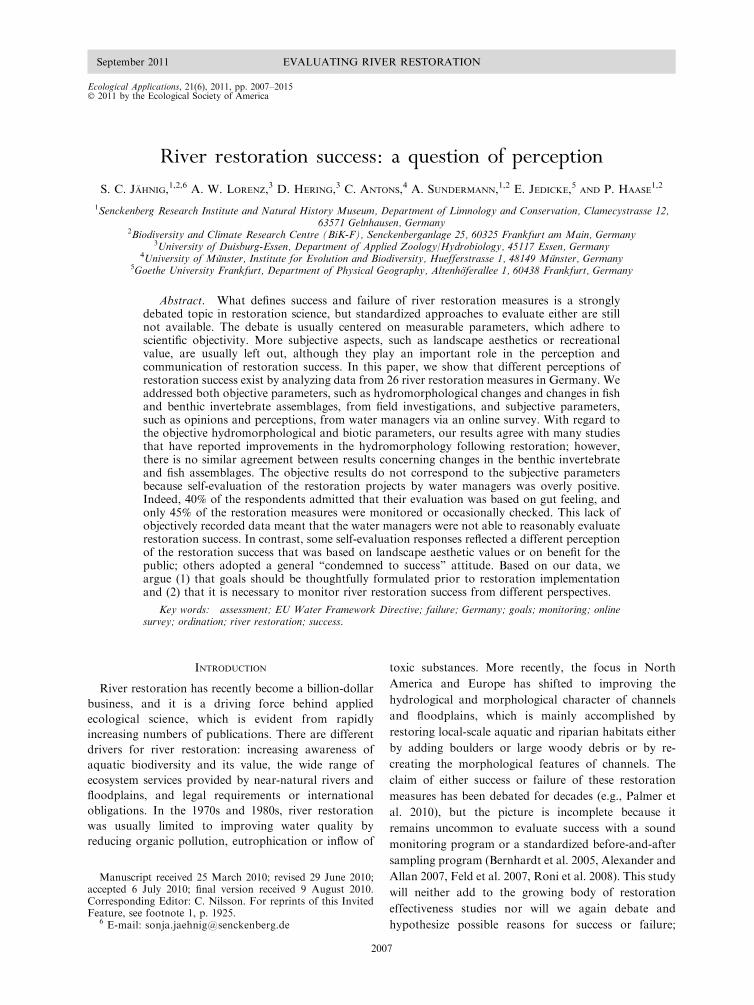
Ecological Applications, 21(6), 2011, pp. 2007–2015� 2011 by the Ecological Society of America
River restoration success: a question of perception
S. C. JAHNIG,1,2,6 A. W. LORENZ,3 D. HERING,3 C. ANTONS,4 A. SUNDERMANN,1,2 E. JEDICKE,5 AND P. HAASE1,2
1Senckenberg Research Institute and Natural History Museum, Department of Limnology and Conservation, Clamecystrasse 12,63571 Gelnhausen, Germany
2Biodiversity and Climate Research Centre (BiK-F), Senckenberganlage 25, 60325 Frankfurt am Main, Germany3University of Duisburg-Essen, Department of Applied Zoology/Hydrobiology, 45117 Essen, Germany
4University of Munster, Institute for Evolution and Biodiversity, Huefferstrasse 1, 48149 Munster, Germany5Goethe University Frankfurt, Department of Physical Geography, Altenhoferallee 1, 60438 Frankfurt, Germany
Abstract. What defines success and failure of river restoration measures is a stronglydebated topic in restoration science, but standardized approaches to evaluate either are stillnot available. The debate is usually centered on measurable parameters, which adhere toscientific objectivity. More subjective aspects, such as landscape aesthetics or recreationalvalue, are usually left out, although they play an important role in the perception andcommunication of restoration success. In this paper, we show that different perceptions ofrestoration success exist by analyzing data from 26 river restoration measures in Germany. Weaddressed both objective parameters, such as hydromorphological changes and changes in fishand benthic invertebrate assemblages, from field investigations, and subjective parameters,such as opinions and perceptions, from water managers via an online survey. With regard tothe objective hydromorphological and biotic parameters, our results agree with many studiesthat have reported improvements in the hydromorphology following restoration; however,there is no similar agreement between results concerning changes in the benthic invertebrateand fish assemblages. The objective results do not correspond to the subjective parametersbecause self-evaluation of the restoration projects by water managers was overly positive.Indeed, 40% of the respondents admitted that their evaluation was based on gut feeling, andonly 45% of the restoration measures were monitored or occasionally checked. This lack ofobjectively recorded data meant that the water managers were not able to reasonably evaluaterestoration success. In contrast, some self-evaluation responses reflected a different perceptionof the restoration success that was based on landscape aesthetic values or on benefit for thepublic; others adopted a general ‘‘condemned to success’’ attitude. Based on our data, weargue (1) that goals should be thoughtfully formulated prior to restoration implementationand (2) that it is necessary to monitor river restoration success from different perspectives.
Key words: assessment; EU Water Framework Directive; failure; Germany; goals; monitoring; onlinesurvey; ordination; river restoration; success.
INTRODUCTION
River restoration has recently become a billion-dollar
business, and it is a driving force behind applied
ecological science, which is evident from rapidly
increasing numbers of publications. There are different
drivers for river restoration: increasing awareness of
aquatic biodiversity and its value, the wide range of
ecosystem services provided by near-natural rivers and
floodplains, and legal requirements or international
obligations. In the 1970s and 1980s, river restoration
was usually limited to improving water quality by
reducing organic pollution, eutrophication or inflow of
toxic substances. More recently, the focus in North
America and Europe has shifted to improving the
hydrological and morphological character of channels
and floodplains, which is mainly accomplished by
restoring local-scale aquatic and riparian habitats either
by adding boulders or large woody debris or by re-
creating the morphological features of channels. The
claim of either success or failure of these restoration
measures has been debated for decades (e.g., Palmer et
al. 2010), but the picture is incomplete because it
remains uncommon to evaluate success with a sound
monitoring program or a standardized before-and-after
sampling program (Bernhardt et al. 2005, Alexander and
Allan 2007, Feld et al. 2007, Roni et al. 2008). This study
will neither add to the growing body of restoration
effectiveness studies nor will we again debate and
hypothesize possible reasons for success or failure;
Manuscript received 25 March 2010; revised 29 June 2010;accepted 6 July 2010; final version received 9 August 2010.Corresponding Editor: C. Nilsson. For reprints of this InvitedFeature, see footnote 1, p. 1925.
6 E-mail: [email protected]
2007
September 2011 EVALUATING RIVER RESTORATION
instead, we will shed light on another dimension: the
perception and communication of success.
‘‘Success’’ of river restoration measures can be defined
with widely different parameters as the basis: abiotic
aspects (e.g., related to hydromorphology, hydrology, or
substrate), biotic aspects (e.g., biodiversity, functional
characteristics, or ecological traits) and socioeconomic
aspects (e.g., recreational value, ecosystem services, or
policy). More generally, river restoration success can be
judged based on objective (i.e., measurable) parameters
and on subjective parameters, which involve preferences,
feelings, or aesthetic values. Both the objective and
subjective parameters may be subject to change, e.g., if
definitions of reference conditions are adapted or if
societal attitudes change.
In a recent study, Woolsey et al. (2007) developed an
extensive indicator set of 49 parameters that covers the
three aspects mentioned above; though, only measura-
ble, quantifiable parameters were included, which is
typically the case. However, there is no doubt that
subjective parameters play an important role in the
perception and communication of restoration success.
Water managers or municipal politicians often commu-
nicate a ‘‘success story’’ of a river restoration project,
while results based on objective parameters might be
more divergent concerning the effects on habitats and on
assemblages (Muotka and Syrjanen 2007, Jahnig et al.
2009b, Weber et al. 2009). It is therefore obvious, but
rarely acknowledged, that restoration success is a matter
of perspective; however, the societal debate regarding
what the ultimate success-indicators in river restoration
should be has been missing thus far.
To advance this debate we analyzed the performance
of different success indicators for 26 relatively large river
restoration measures in Germany; we included both
analysis of hydromorphological and biotic parameters
based on field investigations and the perception of water
managers recorded via an online survey. Our goal was to
(1) compare and relate the objective and subjective
parameters to each other and (2) disentangle the
different perceptions of success as a basis to discuss
the consequences of river restoration practice and
monitoring.
MATERIAL AND METHODS
General approach
We sampled and analyzed data from 26 restoration
projects, which consisted of both non-restored and
restored river sections (‘‘paired sites’’) in German lower
mountain areas and lowlands. The data collected
included the following: (1) the perception of success of
the restoration measures by water managers via an
online questionnaire, (2) hydromorphological changes
between the restored and non-restored sections, and (3)
biological changes in fish and benthic invertebrate
communities between the sections. The selected restora-
tion projects were relatively large, consisted of hydro-
morphological improvements, and had to be well
documented (Appendix A).
Subjective parameters: online questionnaire
Water managers play a key role in restoration projects
in Germany with large influence and decision power,
thus representing very important players in restoration
projects. Getting insights into their perception is there-
fore crucial for the development of future restoration
strategies. An online questionnaire was directed at the
executive water managers of the investigated restoration
projects, which aimed to (1) evaluate the definition of
goals (three questions), (2) evaluate the individual’s
perception of fulfillment of these goals (five questions),
(3) obtain information on barriers to achieving project
success and poll major improvement suggestions (three
questions), and (4) assemble information on the projects,
the institutions, and the role of the respondent within
the projects (four questions). From these questions, we
chose a subset of the most relevant questions for
comparing the perception of success (Table 1).
A total of 139 water managers of the 26 projects were
approached, of which 69 water managers from 22
projects responded. If several answers were available
per project, the median of the answer was calculated,
which resulted in one value for each site.
Objective parameters: hydromorphological
and biological data
Data on hydromorphology and biota prior to
restoration were not available; therefore, we followed a
space-for-time-substitution approach to quantify hydro-
morphological and biological changes. Each restored
section was compared to an upstream non-restored
section, which was similar in terms of geology, adjacent
land use, and catchment size. Non-restored sections
were selected on basis of three parameters: (1) the non-
restored section should by similar to the restored section
prior to restoration, (2) the non-restored section must be
located up-stream of the restored section to avoid an
(positive) influence of by drifting organisms from the
restored section, and (3) in between the two sections
several riffle�pool segments must be present to reduce
the risk of organism interchange. Since this parameter
depends on stream size the inter-site distances varied
between 300 m and 2100 m (one outlier by 7000 m),
mean was 750 m without and 1050 m including the
outlier. Although this design cannot completely exclude
any organism interchange it reflects a compromise
between the desired colonization by dispersing organ-
isms into restored sites and a suitable study design.
Additionally some bias is accounted for in the German
assessment system, which is focusing on reproducing
units (e.g., juvenile fish).
All sections were sampled using the same field
protocol. Habitat composition was surveyed at two
spatial scales, with mesohabitat characteristics of river
and floodplains being recorded on 10 equidistant trans-
INVITED FEATURE2008Ecological Applications
Vol. 21, No. 6
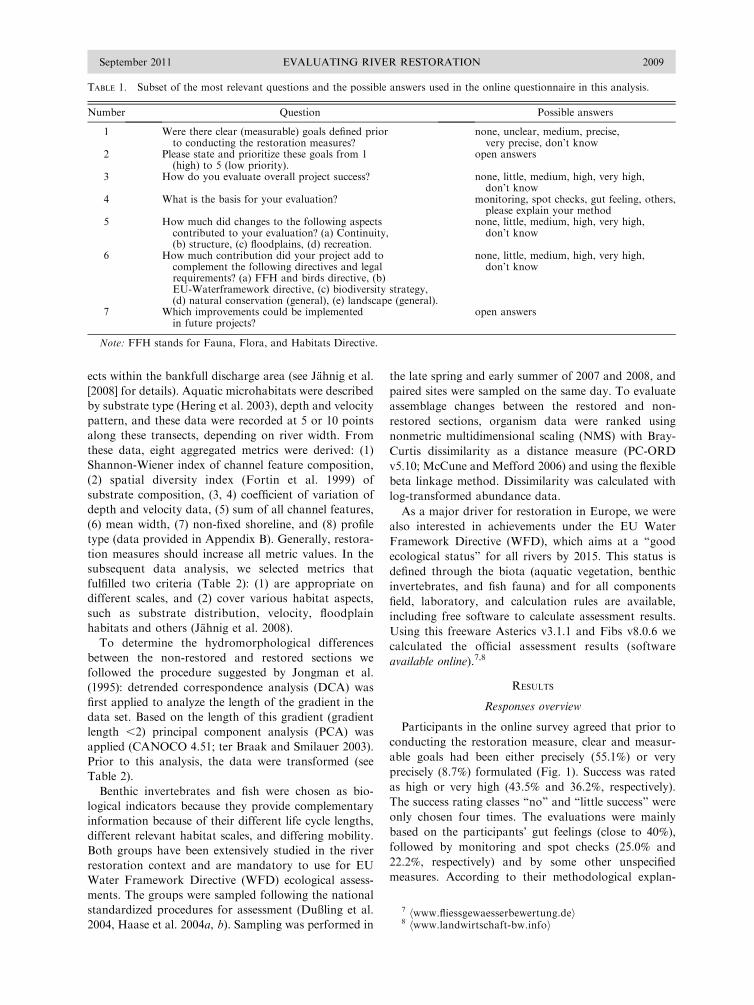
ects within the bankfull discharge area (see Jahnig et al.
[2008] for details). Aquatic microhabitats were described
by substrate type (Hering et al. 2003), depth and velocity
pattern, and these data were recorded at 5 or 10 points
along these transects, depending on river width. From
these data, eight aggregated metrics were derived: (1)
Shannon-Wiener index of channel feature composition,
(2) spatial diversity index (Fortin et al. 1999) of
substrate composition, (3, 4) coefficient of variation of
depth and velocity data, (5) sum of all channel features,
(6) mean width, (7) non-fixed shoreline, and (8) profile
type (data provided in Appendix B). Generally, restora-
tion measures should increase all metric values. In the
subsequent data analysis, we selected metrics that
fulfilled two criteria (Table 2): (1) are appropriate on
different scales, and (2) cover various habitat aspects,
such as substrate distribution, velocity, floodplain
habitats and others (Jahnig et al. 2008).
To determine the hydromorphological differences
between the non-restored and restored sections we
followed the procedure suggested by Jongman et al.
(1995): detrended correspondence analysis (DCA) was
first applied to analyze the length of the gradient in the
data set. Based on the length of this gradient (gradient
length ,2) principal component analysis (PCA) was
applied (CANOCO 4.51; ter Braak and Smilauer 2003).
Prior to this analysis, the data were transformed (see
Table 2).
Benthic invertebrates and fish were chosen as bio-
logical indicators because they provide complementary
information because of their different life cycle lengths,
different relevant habitat scales, and differing mobility.
Both groups have been extensively studied in the river
restoration context and are mandatory to use for EU
Water Framework Directive (WFD) ecological assess-
ments. The groups were sampled following the national
standardized procedures for assessment (Dußling et al.
2004, Haase et al. 2004a, b). Sampling was performed in
the late spring and early summer of 2007 and 2008, and
paired sites were sampled on the same day. To evaluate
assemblage changes between the restored and non-
restored sections, organism data were ranked using
nonmetric multidimensional scaling (NMS) with Bray-
Curtis dissimilarity as a distance measure (PC-ORD
v5.10; McCune and Mefford 2006) and using the flexible
beta linkage method. Dissimilarity was calculated with
log-transformed abundance data.
As a major driver for restoration in Europe, we were
also interested in achievements under the EU Water
Framework Directive (WFD), which aims at a ‘‘good
ecological status’’ for all rivers by 2015. This status is
defined through the biota (aquatic vegetation, benthic
invertebrates, and fish fauna) and for all components
field, laboratory, and calculation rules are available,
including free software to calculate assessment results.
Using this freeware Asterics v3.1.1 and Fibs v8.0.6 we
calculated the official assessment results (software
available online).7,8
RESULTS
Responses overview
Participants in the online survey agreed that prior to
conducting the restoration measure, clear and measur-
able goals had been either precisely (55.1%) or very
precisely (8.7%) formulated (Fig. 1). Success was rated
as high or very high (43.5% and 36.2%, respectively).
The success rating classes ‘‘no’’ and ‘‘little success’’ were
only chosen four times. The evaluations were mainly
based on the participants’ gut feelings (close to 40%),
followed by monitoring and spot checks (25.0% and
22.2%, respectively) and by some other unspecified
measures. According to their methodological explan-
TABLE 1. Subset of the most relevant questions and the possible answers used in the online questionnaire in this analysis.
Number Question Possible answers
1 Were there clear (measurable) goals defined priorto conducting the restoration measures?
none, unclear, medium, precise,very precise, don’t know
2 Please state and prioritize these goals from 1(high) to 5 (low priority).
open answers
3 How do you evaluate overall project success? none, little, medium, high, very high,don’t know
4 What is the basis for your evaluation? monitoring, spot checks, gut feeling, others,please explain your method
5 How much did changes to the following aspectscontributed to your evaluation? (a) Continuity,(b) structure, (c) floodplains, (d) recreation.
none, little, medium, high, very high,don’t know
6 How much contribution did your project add tocomplement the following directives and legalrequirements? (a) FFH and birds directive, (b)EU-Waterframework directive, (c) biodiversity strategy,(d) natural conservation (general), (e) landscape (general).
none, little, medium, high, very high,don’t know
7 Which improvements could be implementedin future projects?
open answers
Note: FFH stands for Fauna, Flora, and Habitats Directive.
7 hwww.fliessgewaesserbewertung.dei8 hwww.landwirtschaft-bw.infoi
September 2011 2009EVALUATING RIVER RESTORATION
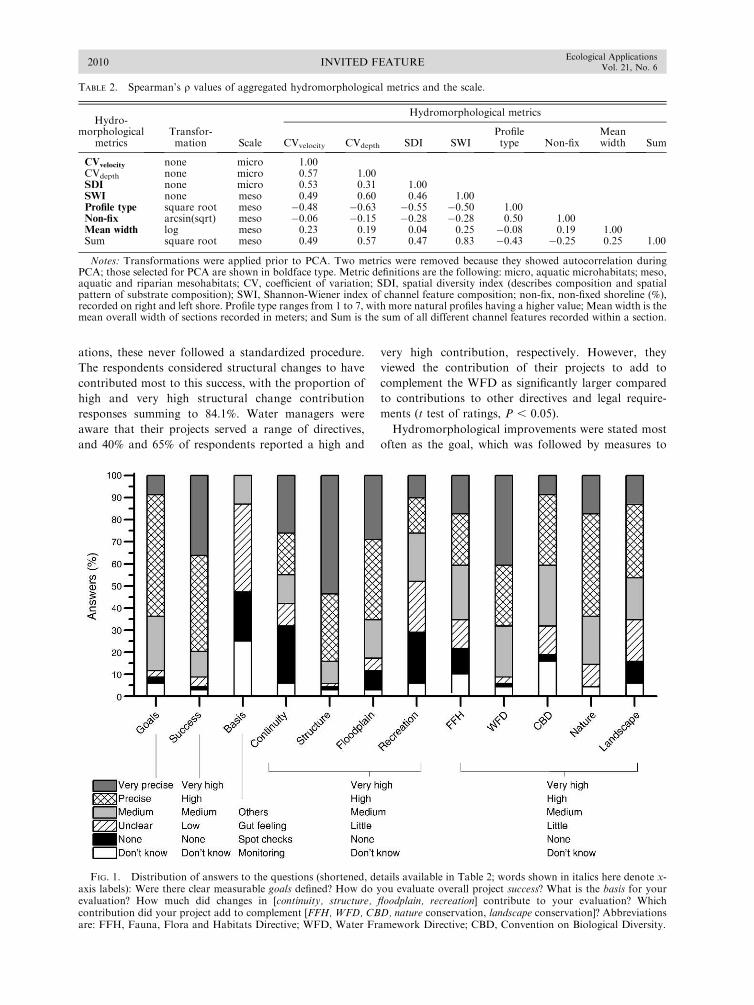
ations, these never followed a standardized procedure.
The respondents considered structural changes to have
contributed most to this success, with the proportion of
high and very high structural change contribution
responses summing to 84.1%. Water managers were
aware that their projects served a range of directives,
and 40% and 65% of respondents reported a high and
very high contribution, respectively. However, they
viewed the contribution of their projects to add to
complement the WFD as significantly larger compared
to contributions to other directives and legal require-
ments (t test of ratings, P , 0.05).
Hydromorphological improvements were stated most
often as the goal, which was followed by measures to
TABLE 2. Spearman’s q values of aggregated hydromorphological metrics and the scale.
Hydro-morphological
metricsTransfor-mation Scale
Hydromorphological metrics
CVvelocity CVdepth SDI SWIProfiletype Non-fix
Meanwidth Sum
CVvelocity none micro 1.00CVdepth none micro 0.57 1.00SDI none micro 0.53 0.31 1.00SWI none meso 0.49 0.60 0.46 1.00Profile type square root meso �0.48 �0.63 �0.55 �0.50 1.00Non-fix arcsin(sqrt) meso �0.06 �0.15 �0.28 �0.28 0.50 1.00Mean width log meso 0.23 0.19 0.04 0.25 �0.08 0.19 1.00Sum square root meso 0.49 0.57 0.47 0.83 �0.43 �0.25 0.25 1.00
Notes: Transformations were applied prior to PCA. Two metrics were removed because they showed autocorrelation duringPCA; those selected for PCA are shown in boldface type. Metric definitions are the following: micro, aquatic microhabitats; meso,aquatic and riparian mesohabitats; CV, coefficient of variation; SDI, spatial diversity index (describes composition and spatialpattern of substrate composition); SWI, Shannon-Wiener index of channel feature composition; non-fix, non-fixed shoreline (%),recorded on right and left shore. Profile type ranges from 1 to 7, with more natural profiles having a higher value; Mean width is themean overall width of sections recorded in meters; and Sum is the sum of all different channel features recorded within a section.
FIG. 1. Distribution of answers to the questions (shortened, details available in Table 2; words shown in italics here denote x-axis labels): Were there clear measurable goals defined? How do you evaluate overall project success? What is the basis for yourevaluation? How much did changes in [continuity, structure, floodplain, recreation] contribute to your evaluation? Whichcontribution did your project add to complement [FFH, WFD, CBD, nature conservation, landscape conservation]? Abbreviationsare: FFH, Fauna, Flora and Habitats Directive; WFD, Water Framework Directive; CBD, Convention on Biological Diversity.
INVITED FEATURE2010Ecological Applications
Vol. 21, No. 6
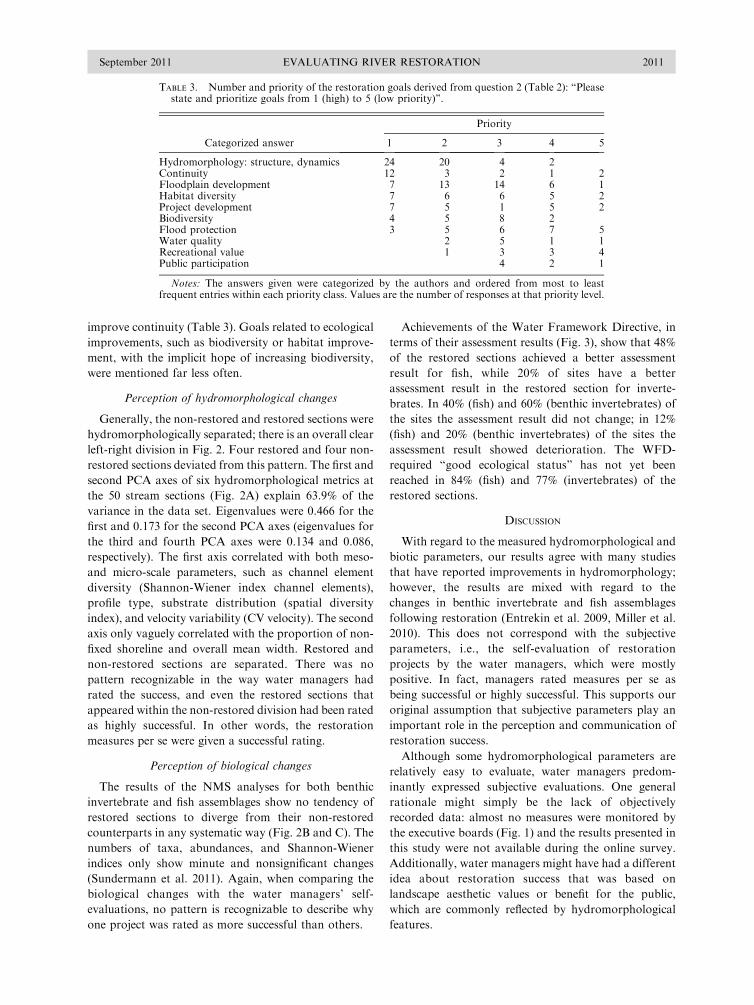
improve continuity (Table 3). Goals related to ecological
improvements, such as biodiversity or habitat improve-
ment, with the implicit hope of increasing biodiversity,
were mentioned far less often.
Perception of hydromorphological changes
Generally, the non-restored and restored sections were
hydromorphologically separated; there is an overall clear
left-right division in Fig. 2. Four restored and four non-
restored sections deviated from this pattern. The first and
second PCA axes of six hydromorphological metrics at
the 50 stream sections (Fig. 2A) explain 63.9% of the
variance in the data set. Eigenvalues were 0.466 for the
first and 0.173 for the second PCA axes (eigenvalues for
the third and fourth PCA axes were 0.134 and 0.086,
respectively). The first axis correlated with both meso-
and micro-scale parameters, such as channel element
diversity (Shannon-Wiener index channel elements),
profile type, substrate distribution (spatial diversity
index), and velocity variability (CV velocity). The second
axis only vaguely correlated with the proportion of non-
fixed shoreline and overall mean width. Restored and
non-restored sections are separated. There was no
pattern recognizable in the way water managers had
rated the success, and even the restored sections that
appeared within the non-restored division had been rated
as highly successful. In other words, the restoration
measures per se were given a successful rating.
Perception of biological changes
The results of the NMS analyses for both benthic
invertebrate and fish assemblages show no tendency of
restored sections to diverge from their non-restored
counterparts in any systematic way (Fig. 2B and C). The
numbers of taxa, abundances, and Shannon-Wiener
indices only show minute and nonsignificant changes
(Sundermann et al. 2011). Again, when comparing the
biological changes with the water managers’ self-
evaluations, no pattern is recognizable to describe why
one project was rated as more successful than others.
Achievements of the Water Framework Directive, in
terms of their assessment results (Fig. 3), show that 48%
of the restored sections achieved a better assessment
result for fish, while 20% of sites have a better
assessment result in the restored section for inverte-
brates. In 40% (fish) and 60% (benthic invertebrates) of
the sites the assessment result did not change; in 12%
(fish) and 20% (benthic invertebrates) of the sites the
assessment result showed deterioration. The WFD-
required ‘‘good ecological status’’ has not yet been
reached in 84% (fish) and 77% (invertebrates) of the
restored sections.
DISCUSSION
With regard to the measured hydromorphological and
biotic parameters, our results agree with many studies
that have reported improvements in hydromorphology;
however, the results are mixed with regard to the
changes in benthic invertebrate and fish assemblages
following restoration (Entrekin et al. 2009, Miller et al.
2010). This does not correspond with the subjective
parameters, i.e., the self-evaluation of restoration
projects by the water managers, which were mostly
positive. In fact, managers rated measures per se as
being successful or highly successful. This supports our
original assumption that subjective parameters play an
important role in the perception and communication of
restoration success.
Although some hydromorphological parameters are
relatively easy to evaluate, water managers predom-
inantly expressed subjective evaluations. One general
rationale might simply be the lack of objectively
recorded data: almost no measures were monitored by
the executive boards (Fig. 1) and the results presented in
this study were not available during the online survey.
Additionally, water managers might have had a different
idea about restoration success that was based on
landscape aesthetic values or benefit for the public,
which are commonly reflected by hydromorphological
features.
TABLE 3. Number and priority of the restoration goals derived from question 2 (Table 2): ‘‘Pleasestate and prioritize goals from 1 (high) to 5 (low priority)’’.
Categorized answer
Priority
1 2 3 4 5
Hydromorphology: structure, dynamics 24 20 4 2Continuity 12 3 2 1 2Floodplain development 7 13 14 6 1Habitat diversity 7 6 6 5 2Project development 7 5 1 5 2Biodiversity 4 5 8 2Flood protection 3 5 6 7 5Water quality 2 5 1 1Recreational value 1 3 3 4Public participation 4 2 1
Notes: The answers given were categorized by the authors and ordered from most to leastfrequent entries within each priority class. Values are the number of responses at that priority level.
September 2011 2011EVALUATING RIVER RESTORATION
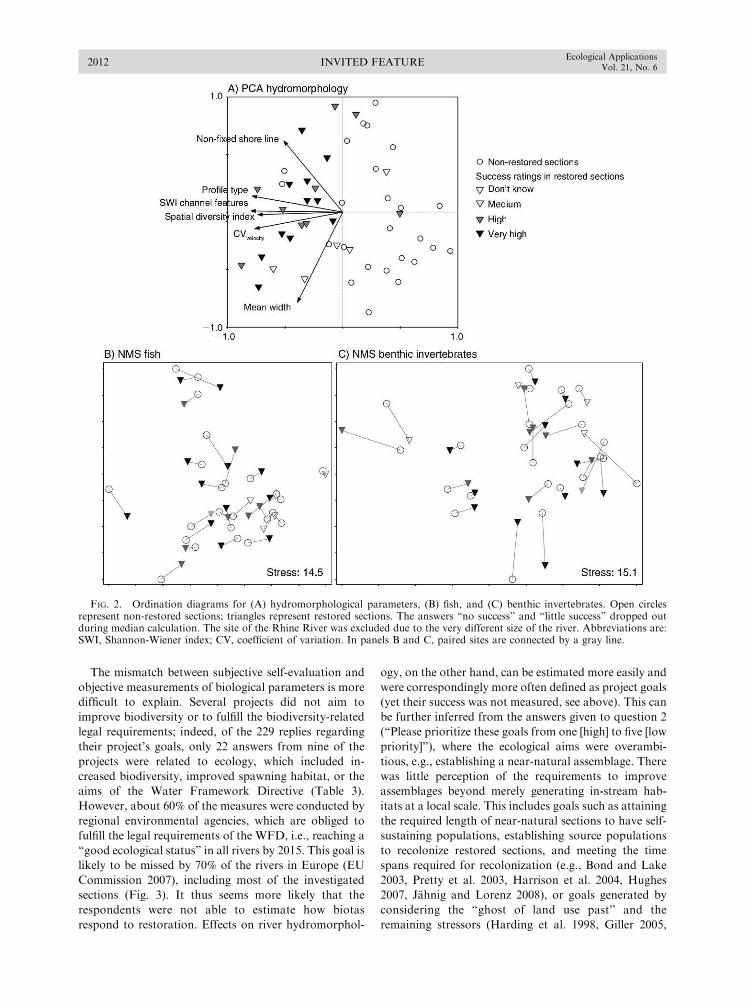
The mismatch between subjective self-evaluation and
objective measurements of biological parameters is more
difficult to explain. Several projects did not aim to
improve biodiversity or to fulfill the biodiversity-related
legal requirements; indeed, of the 229 replies regarding
their project’s goals, only 22 answers from nine of the
projects were related to ecology, which included in-
creased biodiversity, improved spawning habitat, or the
aims of the Water Framework Directive (Table 3).
However, about 60% of the measures were conducted by
regional environmental agencies, which are obliged to
fulfill the legal requirements of the WFD, i.e., reaching a
‘‘good ecological status’’ in all rivers by 2015. This goal is
likely to be missed by 70% of the rivers in Europe (EU
Commission 2007), including most of the investigated
sections (Fig. 3). It thus seems more likely that the
respondents were not able to estimate how biotas
respond to restoration. Effects on river hydromorphol-
ogy, on the other hand, can be estimated more easily and
were correspondingly more often defined as project goals
(yet their success was not measured, see above). This can
be further inferred from the answers given to question 2
(‘‘Please prioritize these goals from one [high] to five [low
priority]’’), where the ecological aims were overambi-
tious, e.g., establishing a near-natural assemblage. There
was little perception of the requirements to improve
assemblages beyond merely generating in-stream hab-
itats at a local scale. This includes goals such as attaining
the required length of near-natural sections to have self-
sustaining populations, establishing source populations
to recolonize restored sections, and meeting the time
spans required for recolonization (e.g., Bond and Lake
2003, Pretty et al. 2003, Harrison et al. 2004, Hughes
2007, Jahnig and Lorenz 2008), or goals generated by
considering the ‘‘ghost of land use past’’ and the
remaining stressors (Harding et al. 1998, Giller 2005,
FIG. 2. Ordination diagrams for (A) hydromorphological parameters, (B) fish, and (C) benthic invertebrates. Open circlesrepresent non-restored sections; triangles represent restored sections. The answers ‘‘no success’’ and ‘‘little success’’ dropped outduring median calculation. The site of the Rhine River was excluded due to the very different size of the river. Abbreviations are:SWI, Shannon-Wiener index; CV, coefficient of variation. In panels B and C, paired sites are connected by a gray line.
INVITED FEATURE2012Ecological Applications
Vol. 21, No. 6

Hilderbrand et al. 2005, Sondergaard and Jeppesen 2007,
Langford et al. 2009). All these parameters have to be
considered when planning restoration measures with the
goal to improve biodiversity. Scientists have the urgent
task of identifying and quantifying the parameters
required for an ecologically successful restoration
(Palmer 2009) because, at the moment, hypotheses
addressing the poor biological response to restoration
are rarely based on empirical data.
In addition to the unintended overestimation of
restoration success, there is a third highly subjective
argument: from a water manager’s perspective, restora-
tion measures are ‘‘condemned to success.’’ If measures
are not immediately successful in reaching legal require-
ments, such as those of the Water Framework Directive,
then river restoration might be seen as a waste of money
and might come to a halt. This argument is supported by
the water managers’ surprising awareness of problems
and their numerous suggestions for improvements of
restoration efforts, despite their generally positive
evaluation of the project’s success (Table 1: question
7). Their suggestions include the following: (1) to
improve political and legal factors, especially related to
integrated river management or land use changes; (2) to
improve the means of project handling, e.g., to achieve
more binding results from preliminary discussions; (3) to
achieve a better estimation of the biological effectiveness
of measures; (4) to increase area availability and pursue
large-scale measures, including reallocation of land use;
(5) to speed up the approval of projects and shift the
approval to lower administrative levels; (6) to strengthen
or impose an obligation for post project monitoring and
communication of results; (7) to supply more financial
means; and (8) to improve participation of stakeholders
during all project phases.
From an objective point of view, the poor definition
and monitoring of river restoration success (Zedler
2007) has prevented a shift to more successful restora-
tion approaches, especially in terms of biological
changes. However, as laid out in the introduction, a
societal debate as to what all stakeholders might
perceive as successful is missing. Definitions of success
could include aspects of legal requirements, socio-
economic reasoning, health issues, landscape aesthetics,
and nature conservation. We thus suggest extended
assessment systems to evaluate restoration success. The
highly sophisticated long developed assessment systems
within the WFD do not account for time lags, ecological
constraints (e.g., related to dispersal capabilities or
hysteresis effects), or subjective parameters. One of the
essential requirements is to formulate clear goals for
each individual assessment measure and to then employ
an adapted set of success indicators (e.g., Woolsey et al.
2007, England et al. 2008). To enhance the probability
of achieving desired biological outcomes, a long-term
vision and a linkage of measures to the context of the
catchment are required. The agreed-upon indicator set
must also consider ecosystem compartments that are not
covered in the standard freshwater assessment or
monitoring approaches. Riparian vegetation and arthro-
FIG. 3. Comprehensive diagram showing the official ecological quality class (EQC) results for invertebrates and fish in therestored sections, the answer of water managers to question 3 from Table 2, ‘‘How do you evaluate overall project success?’’ (x-axis), and the differences in the EQC results between non-restored and restored values (y-axis; values above zero indicateimprovement; values below zero indicate deterioration).
September 2011 2013EVALUATING RIVER RESTORATION
pods, land–water interactions, self purification, denitri-
fication, functional aspects, and ecosystem services have
all been shown to react more quickly and more
positively to restoration measures than aquatic assemb-
lages do (Lepori et al. 2005, Rohde et al. 2005, Kaushal
et al. 2008, Aldridge et al. 2009, Jahnig et al. 2009a,
Klocker et al. 2009, Palmer and Filoso 2009, Tullos et al.
2009). In addition to these objective parameters,
subjective parameters should also be included, such as
the sense of landscape beauty perceived by the public
and the priceless opportunity to teach children about
nature. On the other hand, there could also be a feeling
of nuisance from biting midges or a perception of a
dangerous riverscape (Le Lay et al. 2008). To include
such perspectives would require (expensive) representa-
tive surveys of all stakeholders and is an interesting and
promising future research topic.
By addressing the contradictory perspectives of
success and by disentangling the current different
approaches to assess it, we have shown that perspective
is extremely important when evaluating river restoration
measures. With this study, we hope to contribute to a
societal debate regarding what should be considered to
be river restoration success indicators and to highlight
the necessity of implementing monitoring standards.
ACKNOWLEDGMENTS
This study was financed by Deutsche Bundesstiftung Umwelt(DBU), the Hesse’s Ministry of Environment, and the researchfunding program LOEWE: Landes-Offensive zur EntwicklungWissenschaftlich-oekonomischer Exzellenz of Hesse’s Ministryof Higher Education, Research, and the Arts. Two anonymousreviewers are thanked for their comments and suggestions,which improved the manuscript.
LITERATURE CITED
Aldridge, K. T., J. D. Brookes, and G. G. Ganf. 2009.Rehabilitation of stream ecosystem functions through thereintroduction of coarse particulate organic matter.Restoration Ecology 17:97–106.
Alexander, G. G., and J. D. Allan. 2007. Ecological success instream restoration: case studies from the midwestern UnitedStates. Environmental Management 40:245–255.
Bernhardt, E. S., et al. 2005. Synthesizing U.S. river restorationefforts. Science 308:636–637.
Bond, N. R., and P. S. Lake. 2003. Local habitat restoration instreams: constraints on the effectiveness of restoration forstream biota. Ecological Management and Restoration4:193–198.
Dußling, U., R. Berg, H. Klinger, and C. Wolter. 2004. VIII-7.4Assessing the ecological status of river systems using fishassemblages. Pages 1–84 in C. Steinberg, W. Calmano, H.Klapper, and R. D. Wilken, editors. Handbuch AngewandteLimnologie. Ecomed, Landsberg am Lech, Germany.
England, J., K. S. Skinner, and M. G. Carter. 2008.Monitoring, river restoration and the Water FrameworkDirective. Water and Environment Journal 22:227–234.
Entrekin, S. A., J. L. Tank, E. J. Rosi-Marshall, T. J. Hoellein,and G. A. Lamberti. 2009. Response of secondary produc-tion by macroinvertebrates to large wood addition in threeMichigan streams. Freshwater Biology 54:1741–1758.
EU Commission. 2007. Towards sustainable water manage-ment in the European Union. First stage in the implementa-tion of the Water Framework Directive 2000/60/EC.Commission staff working document. Accompanying docu-
ment to the communication from the commission to theEuropean Parliament and the Council. EU Commission,Brussels, Belgium.
Feld, C. K., D. Hering, S. Jahnig, A. Lorenz, P. Rolauffs, J.Kail, and U. Koenzen. 2007. Okologische Fließgewasserrena-turierung: Erfahrungen zur Durchfuhrung und Erfolgs-kontrolle von Renaturierungsmaßnahmen zur Verbesserungdes okologischen Zustands. Report for the German En-vironment Agency (Umweltbundesamt). German Environ-ment Agency (Umweltbundesamt), Berlin, Germany.
Fortin, M.-J., S. Payette, and K. Marineau. 1999. Spatialvegetation diversity index along a postfire successionalgradient in the northern boreal forest. Ecoscience 6:204–213.
Giller, P. S. 2005. River restoration: seeking ecological stand-ards. Editor’s introduction. Journal of Applied Ecology42:201–207.
Haase, P., S. Lohse, S. Pauls, K. Schindehutte, A. Sundermann,P. Rolauffs, and D. Hering. 2004a. Assessing streams inGermany with benthic invertebrates: development of apractical standardized protocol for macroinvertebrate sam-pling and sorting. Limnologica 34:349–365.
Haase, P., S. Pauls, A. Sundermann, and A. Zenker. 2004b.Testing different sorting techniques in macroinvertebratesamples from running waters. Limnologica 34:366–378.
Harding, J. S., E. F. Benfield, P. V. Bolstad, G. S. Helfman, andE. B. D. Jones. 1998. Stream biodiversity: the ghost of landuse past. Proceedings of the National Academy of SciencesUSA 95:14843–14847.
Harrison, S. S. C., J. L. Pretty, D. Shepherd, A. G. Hildrew, C.Smith, and R. D. Hey. 2004. The effect of instreamrehabilitation structures on macroinvertebrates in lowlandrivers. Journal of Applied Ecology 41:1140–1154.
Hering, D., A. Buffagni, O. Moog, L. Sandin, M.Sommerhauser, I. Stubauer, C. Feld, R. K. Johnson, P.Pinto, N. Skoulikidis, P. F. M. Verdonschot, and S.Zahradkova. 2003. The development of a system to assessthe ecological quality of streams based on macroinverte-brates: design of the sampling programme within the AQEMproject. International Review of Hydrobiology 88:345–361.
Hilderbrand, R. H., A. C. Watts, and A. M. Randle. 2005. Themyths of restoration ecology. Ecology and Society 10:19.hhttp://www.ecologyandsociety.org/vol10/iss1/art19/i
Hughes, J. M. 2007. Constraints on recovery: using molecularmethods to study connectivity of aquatic biota in rivers andstreams. Freshwater Biology 52:616–631.
Jahnig, S. C., S. Brunzel, S. Gacek, A. W. Lorenz, and D.Hering. 2009a. Effects of re-braiding measures on hydro-morphology, floodplain vegetation, ground beetles andbenthic invertebrates in mountain rivers. Journal ofApplied Ecology 46:406–416.
Jahnig, S. C., and A. W. Lorenz. 2008. Substrate-specificmacroinvertebrate diversity patterns following stream resto-ration. Aquatic Sciences: Research Across Boundaries70:292–303.
Jahnig, S. C., A. Lorenz, and D. Hering. 2008.Hydromorphological parameters indicating differences be-tween single- and multiple-channel mountain rivers inGermany, in relation to their modification and recovery.Aquatic Conservation: Marine and Freshwater Ecosystems18:1200–1216.
Jahnig, S. C., A. W. Lorenz, and D. Hering. 2009b. Restorationeffort, habitat mosaics, and macroinvertebrates: does channelform determine community composition? Aquatic Conser-vation: Marine and Freshwater Ecosystems 19:157–169.
Jongman, R. H. G., C. J. F. Ter Braak, and O. F. R. VanTongeren, editors. 1995. Data analysis in community andlandscape ecology. Cambridge University Press, Cambridge,UK.
Kaushal, S. S., P. M. Groffman, P. M. Mayer, E. Stritz, andA. J. Gold. 2008. Effects of stream restoration on denitrifi-
INVITED FEATURE2014Ecological Applications
Vol. 21, No. 6

cation in an urbanizing watershed. Ecological Applications18:789–804.
Klocker, C. A., S. S. Kaushal, P. M. Groffman, P. M. Mayer,and R. P. Morgan. 2009. Nitrogen uptake and denitrificationin restored and unrestored streams in urban Maryland, USA.Aquatic Sciences 71:411–424.
Langford, T. E. L., P. J. Shaw, A. J. D. Ferguson, and S. R.Howard. 2009. Long-term recovery of macroinvertebratebiota in grossly polluted streams: re-colonisation as aconstraint to ecological quality. Ecological Indicators9:1064–1077.
Le Lay, Y.-F., H. Piegay, K. Gregory, A. Chin, S. Doledec, A.Elosegi, M. Mutz, B. Wyzga, and J. Zawiejska. 2008.Variations in cross-cultural perception of riverscapes inrelation to in-channel wood. Transactions of the Instituteof British Geographers 33:268–287.
Lepori, F., D. Palm, and B. Malmqvist. 2005. Effects of streamrestoration on ecosystem functioning: detritus retentivenessand decomposition. Journal of Applied Ecology 42:228–238.
McCune, B., and M. J. Mefford. 2006. PC-ORD. Multivariateanalysis of ecological data. Version 5.10. MjM Software,Gleneden Beach, Oregon, USA.
Miller, S. W., P. Budy, and J. Schmidt. 2010. Quantifyingmacroinvertebrate responses to in-stream habitat restoration:applications of meta-analysis to river restoration. RestorationEcology 18:8–19.
Muotka, T., and J. Syrjanen. 2007. Changes in habitatstructure, benthic invertebrate diversity, trout populationsand ecosystem processes in restored forest streams: a borealperspective. Freshwater Biology 52:724–737.
Palmer, M. 2009. Reforming watershed restoration: science inneed of application and applications in need of science.Estuaries and Coasts 32:1–17.
Palmer, M. A., and S. Filoso. 2009. Restoration of ecosystemservices for environmental markets. Science 325:575–576.
Palmer, M. A., H. L. Menninger, and E. S. Bernhardt. 2010.River restoration, habitat heterogeneity and biodiversity: afailure of theory or practice. Freshwater Biology 55:1–8.
Pretty, J. L., S. S. C. Harrison, D. J. Shepherd, C. Smith, A. G.Hildrew, and R. D. Hey. 2003. River rehabilitation and fishpopulations: assessing the benefit of instream structures.Journal of Applied Ecology 40:251–265.
Rohde, S., M. Schutz, F. Kienast, and P. Englmaier. 2005.River widening: an approach to restoring riparian habitatsand plant species. River Research and Applications 21:1075–1094.
Roni, P., K. Hanson, and T. Beechie. 2008. Global review ofthe physical and biological effectiveness of stream habitatrehabilitation techniques. North American Journal ofFisheries Management 28:856–890.
Sondergaard, M., and E. Jeppesen. 2007. Anthropogenicimpacts on lake and stream ecosystems, and approaches torestoration. Journal of Applied Ecology 44:1089–1094.
Sundermann, A., C. Antons, N. Cron, A. W. Lorenz, D.Hering, and P. Haase. 2011. Hydromorphological restora-tion of running waters: effects on benthic invertebrateassemblages. Freshwater Biology. [doi: 10.1111/j.1365-2427.2011.02599.x]
ter Braak, C. J. F., and P. Smilauer. 2003. Canoco for Windows4.51. Biometrics. Plant Research International, Wageningen,The Netherlands.
Tullos, D. D., D. L. Penrose, G. D. Jennings, and W. G. Cope.2009. Analysis of functional traits in reconfigured channels:implications for the bioassessment and disturbance of riverrestoration. Journal of the North American BenthologicalSociety 28:80–92.
Weber, C., E. Schager, and A. Peter. 2009. Habitat diversityand fish assemblage structure in local river widenings: a casestudy on a Swiss river. River Research and Applications25:687–701.
Woolsey, S., et al. 2007. A strategy to assess river restorationsuccess. Freshwater Biology 52:752–769.
Zedler, J. B. 2007. Success: an unclear, subjective descriptor ofrestoration outcomes. Ecological Restoration 25:162–168.
APPENDIX A
Characterization of the restoration projects (Ecological Archives A021-091-A1).
APPENDIX B
Diversity of mesohabitats and microhabitats at paired sites (Ecological Archives A021-091-A2).
September 2011 2015EVALUATING RIVER RESTORATION


