
Flight Testing of the F/A-lSE/F Automatic Carrier Landing System]
Arthur L. Prickett Naval Air System Command 2 1947 Nickles Rd. Bldg. 1641
Patuxent River, MD 20670- 1500
prickettj [email protected] (301) 342-0774
Christopher J. Parkes Naval Air System Command
2 1947 Nickles Rd. Bldg. 164 1 Patuxent River, MD 20670-1500
[email protected] .mil (301) 342-4645
Abstract-The F/A-lSE/F is the U.S. Navy’s premier strike fighter aircraft, manufactured by the Boeing Company. The F/A-l8E/F aircraft, while maintaining a hgh degree of commonality with the F/A-l8C/D aircraft, has a lengthened fuselage, larger wing and control surfaces, strengthened landing gear, an improved propulsion system including a growth version of the General Electric F404 engine designated the F414-GE-400, and larger high performance inlets. This paper concentrates on the development, test, and evaluation of the F/A-l8E/F Automatic Carrier Landing System (ACLS) up to and including the Third Sea Trials,
U.S. Government work not protected by U.S. copyright.
upon which the aircraft was initially qualified for Mode I, totally automatic, approaches and landings to the aircraft carrier. The paper briefly describes the key components of the F/A-l8E/F’s ACLS, including cockpit displays and controls, antennas, autothrottles and flight control implementation, and interface with the shipboard AN/SPN- 46(V) ACLS. Test procedures and methodology are presented as well as test results and interpretation. Finally, lessons learned are presented and recommendations are made for future aircraft ACLS developmental test and evaluation efforts.
5-2593
TABLE OF CONTENTS
NOMENCLATURE
0 RESULTS AND EVALUATION SUPPORTING DATA CONCLUSION RECOMMENDATIONS LESSONS LEARNED REFERENCES
0 BIOGRAPHIES
0 INTRODUCTION
NOMENCLATURE
ACLS FCC FOST ICLS PALS PQR TST WOD
Automatic Carrier Landing System Flight Control Computer Follow-on Sea Trials Instrument Carrier Landing System Precision Approach and Landing System PALS Quality Rating Third Sea Trials Wind Over Deck
INTRODUCTION
Background
The FlA-18ElF Super Hornet is the U.S. Navy's premier strike fighter aircraft, manufactured by the Boeing Company. The FIA-18EE was designed to provide additional range, payload flexibility, payload recovery, survivability, and growth capabilities over the FIA- 1 SA/BIC/D aircraft. The F/A- 18E/F aircraft, while maintaining a high degree of commonality with the FIA- 18C/D aircraft, has a lengthened fuselage, larger wing and control surfaces, strengthened landing gear, an improved propulsion system including a growth version of the General Electric F404 engine designated the F414-GE-400, and larger high performance inlets. The aircraft also incorporates two additional wing stations and provides added internal volume, power, and cooling provisions for growth avionics.
As part of the Navy's acquisition program phase known as Engineering, Manufacturing, and Development (EMD), the FIA- 18E/F's compatibility with the ANISPN-46 Automatic Carrier Landing System (ACLS) had to be developed and demonstrated. This paper concentrates on the development, test, and evaluation of the F/A-l8E/F ACLS up to and including the Third Sea Trials, upon which the aircraft was initially qualified for Mode I, totally automatic, approaches and landings to the aircraft carrier. The FIA-18EE's predecessor, the F/A-l8C/D, with a history of outastanding ACLS Mode I performance (tailhook longitudinal
c
The paper briefly describes the key components of the FIA- 18E/F's ACLS, including cockpit displays and controls, antennas, autothrottles and flight control implementation, and interface with the shipboard AN/SPN-46(V) ACLS. Test procedures and methodology are presented as well as test results and interpretation. Finally, lessons learned are presented and recommendations are made for future aircraft ACLS developmental test and evaluation efforts.
Description of Test Aircraft and Equipment
F/A-18E/F General Description-The FIA-18E is a single seat carrier based strike fighter aircraft built by the Boeing Company. The FIA-18F is the two-seat model of the Super Hornet and is configured with tandem cockpits. Due to the similarity in flying qualities in the ACLS operating envelope, both versions were treated as a single aircraft, and used interchangeably, for the ACLS development and test effort.
The aircraft is powered by two General Electric F414-GE- 400 afterburning turbofan engines utilizing Full Authority Digital Ehgine Control (FADEC). The aircraft features a variable camber mid-wing with Leading Edge Extensions (LEX) mounted on each side of the fuselage. Twin vertical tails are angled outboard 20 degrees from the vertical. The aircraft is designed with relaxed static stability to increase maneuverability and to reduce approach and landing speed. 'The aircraft is controlled by a digital fly-by-wire flight control system through hydraulically actuated flight control surfaces: ailerons, twin rudders, leading edge flaps, trailing edge flaps, LEX vents, LEX spoilers, and differential stabilators. The leading edge of the wing incorporates a "snag", which increases outboard wing area and increases roll authority in the approach and landing configuration. Basic weight is approximately 31,500 pounds for the FIA- 18E and 32,000 pounds for the FIA-18F. Additional information on the FIA-18EE aircraft may be found in reference [l].
AN/SPN--46(V) Automatic Carrier Landing System (ACLS)--The shipboard based ANISPN-46 ACLS consists of a prec:ision tracking radar, general purpose computer, and data link transmitter, and is designed to automatically control an ACLS equipped airplane to touchdown when operating in it's highest mode (referred to as Mode I). Radar tracking of a beacon system (ANIAPN-202) in the airplane establishes the airplane's position in space. Computer software, containing the necessary control equations, generates airplane vertical rate and bank angle commands to direct the airplane along the desired glide path. Commands are sent to the airplane via the data link. A more detailed description of the ANISPN-46 can be found in reference [2].
touchdown dispersion typically less than 25 ' (lo)), The AC',S provides for three modes of operation which can the to be met Or exceeded by the be selected by the pilot. The first is the Mode I approach
which provides for fully automatic approach from the ACLS FIA-18EE.
5-2594

4
Mode I aDDrOaCh - The pilot couples the aircraft to the ACLS commands, which automatically flies the approach to touchdown. Mode IA amroach - Mode I coupled approach to 200 ft AGL, then pilot takes over to manually fly the approach to touchdown. Mode n aDDroach - The pilot manually flies the cockpit displayed guidance to touchdown.
Figure 1. Typical Mode I Approach
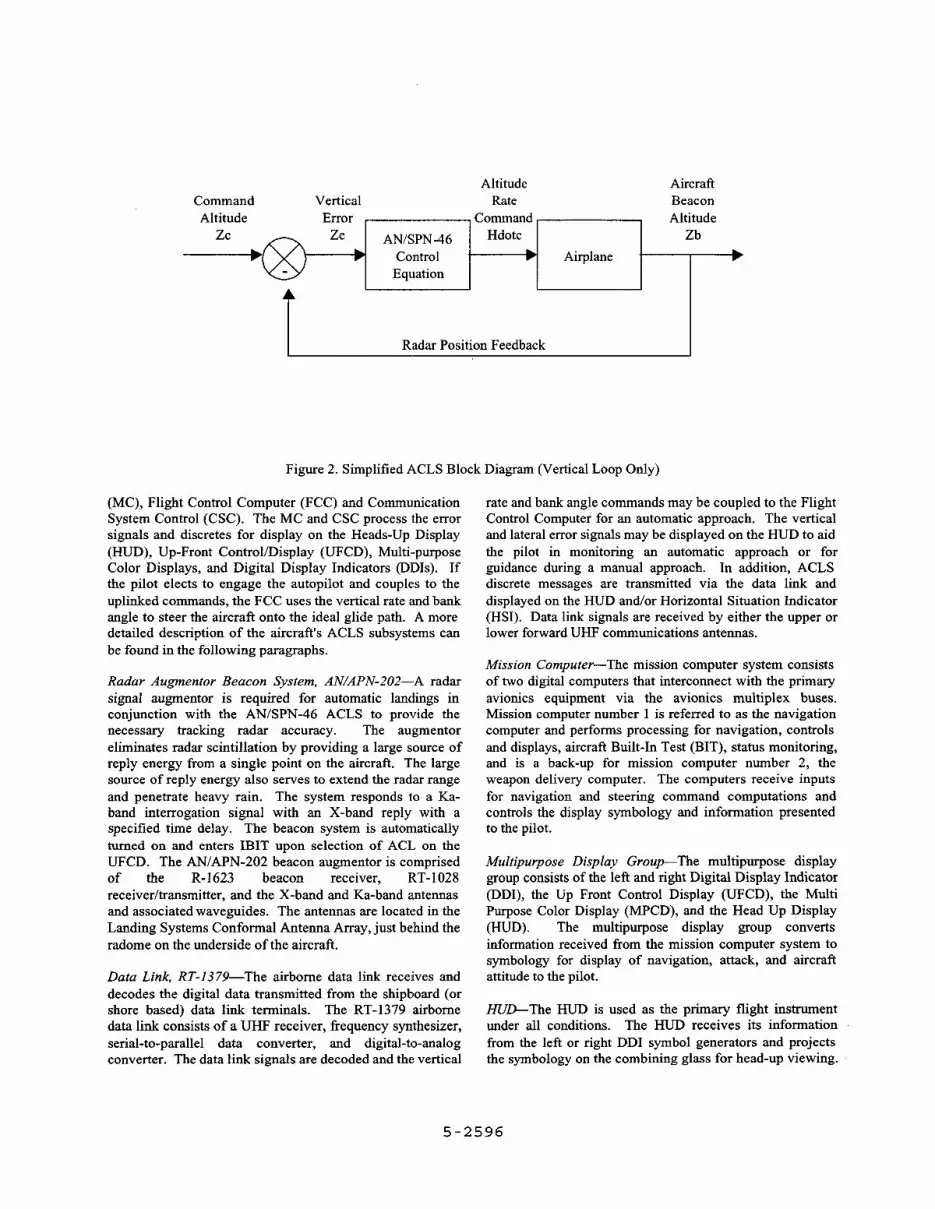
pattern entry point to touchdown on the carrier deck. The approach can be downgraded to a manual approach (called Mode IA) at 112 nmi to touchdown. The second is a Mode I1 approach where the pilot manually controls the aircraft using error signal guidance provided to the cockpit displays by the ACLS from radar acquisition until touchdown. The third is a Mode I11 or Carrier Controlled Approach (CCA) where manual talk down control is provided from the radar acquisition gate to the point at which the pilot can acquire the Fresnel Lens Optical Landing System (FLOLS) or to the weather minimums (200 ft altitude and 112 nmi visibility). The use of an autothrottle is required for Mode MA, but is optional for a Mode I1 or a Mode 111 approach. The Instrument Carrier Landing System (ICLS) is an independent landing system that also provides monitoring of ACLS operations. A diagram of the typical ACLS landing pattern is shown is figure 1. A simplified block diagram of the ACLS vertical axis closed loop is shown in figure 2.
Airborne ACLS Components (FIA-lgE/F)--The airborne ACLS system of the FlA-18EE is made up of several different components which integrate to provide glide path error displays, system status and command discretes, and in its highest mode automatic control of the aircraft to touchdown. The shipboard ACLS radar sends out Ka-band interrogation pulses which are received by the RT-1028 radar beacon which then augments and sends back an X- band return pulse via the R-1623 radar augmentor. This return pulse allows the shipboard subsystem to calculate the aircraft position in space relative to the ship’s ideal glide path. The errors between the aircraft’s position and the ideal glide path are processed by the shipboard computer to calculate appropriate lateral and vertical error signals, ACLS discretes, and vertical rate and bank angle commands which are sent to the aircraft via a UHF data link in a Link-4 format. This information is received by the aircraft’s RT- 1379 data link and distributed to the Mission Computer
5-2595
Airplane Equation
Figure 2. Simplified ACLS Block Diagram (Vertical Loop Only)
b
(MC), Flight Control Computer (FCC) and Commuinication System Control (CSC). The MC and CSC process .the error signals and discretes for display on the Heads-Up Display (HUD), Up-Front Control/Display (UFCD), Multi-purpose Color Displays, and Digital Display Indicators @XIIS). If the pilot elects to engage the autopilot and couples to the uplinked commands, the FCC uses the vertical rate and bank angle to steer the aircraft onto the ideal glide path. A more detailed description of the aircraft's ACLS subsystems can be found in the following paragraphs.
I Radar Position Feedback
Radar Augmentor Beacon System, AN/APN-202---A radar signal augmentor is required for automatic landings in conjunction with the ANISPN-46 ACLS to provide the necessary tracking radar accuracy. The augmentor eliminates radar scintillation by providing a large source of reply energy from a single point on the aircraft. The large source of reply energy also serves to extend the radar range and penetrate heavy rain. The system responds to a Ka- band interrogation signal with an X-band reply with a specified time delay. The beacon system is automatically turned on and enters IBIT upon selection of ACL on the UFCD. The AN/APN-202 beacon augmentor is colmprised of the R- 1623 beacon receiver, KT- 1028 receiver/transmitter, and the X-band and Ka-band amtennas and associated waveguides. The antennas are located in the Landing Systems Conformal Antenna Array, just behind the radome on the underside of the aircraft.
Data Link, RT-1379-The airborne data link receives and decodes the digital data transmitted from the shipboard (or shore based) data link terminals. The RT-1379 airborne data link consists of a UHF receiver, frequency synthesizer, serial-to-parallel data converter, and digital-to-analog converter. The data link signals are decoded and the vertical
rate and bank angle commands may be coupled to the Flight Control Computer for an automatic approach. The vertical and lateral error signals may be displayed on the HUD to aid the pilot in monitoring an automatic approach or for guidance during a manual approach. In addition, ACLS discrete messages are transmitted via the data link and displayed on the HUD and/or Horizontal Situation Indicator (HSI). Data link signals are received by either the upper or lower forward UHF communications antennas.
Mission Computer-The mission computer system consists of two digital computers that interconnect with the primary avionics equipment via the avionics multiplex buses. Mission computer number 1 is referred to as the navigation computer and performs processing for navigation, controls and displays, aircraft Built-In Test (BIT), status monitoring, and is a back-up for mission computer number 2, the weapon delivery computer. The computers receive inputs for navigation and steering command computations and controls the display symbology and information presented to the pilot.
Multipur,oose Display Group-The multipurpose display group coinsists of the left and right Digital Display Indicator (DDI), the Up Front Control Display (UFCD), the Multi Purpose lColor Display (MPCD), and the Head Up Display (HUD). The multipurpose display group converts information received from the mission computer system to symbology for display of navigation, attack, and aircraft attitude to the pilot.
H U G T h e HUD is used as the primary flight instrument under all1 conditions. The HUD receives its information from the left or right DDI symbol generators and projects the symbology on the combining glass for head-up viewing.
5-2596

The ACLS steering tadpole and Instrument Carrier Landing System (ICLS) elevation and azimuth needles are presented on the HUD referenced to the flight path marker, or the waterline symbol, if displayed.
Flight Control Computer-Two Flight Control Computers (FCCs) provide the computations that determine the aircraft flight characteristics. The computers use the pilot and sensor inputs to determine proper outputs to the control actuators for the desired aircraft response. During automatic approaches, data link inputs are used in conjunction with sensor inputs to calculate desired control surface commands. Each FCC has a Programmable Read-only Memory (PROM) installed that contains the flight control programs and gains.
Automatic Throttle Control (ATC)-The Automatic Throttle Control (ATC) maintains on-speed angle of attack of 8.1 deg during an approach by modulating engine thrust in the range of flight idle through military (MIL) power. The computer uses inputs of AOA, longitudinal stick position and trim, calibrated airspeed, normal acceleration, autopilot pitch command, and bank angle to generate the necessary throttle commands. The throttles are backdriven and will disengage upon application of a force of 12 lb.
Scope of Tests
Testing consisted of ground and flight test events. Test aircraft included both the FIA-18E and FIA-18F series. A total of 109 flights for 109 flight hours were flown in the test program Shore based ground and flight tests were conducted between January 1997 and March 2000 at Naval Air Station, Patuxent River, MD. Shipboard testing was conducted during three at-sea periods. Initial shipboard tests were conducted during the Initial Sea Trials (IST) in January 1997 on a not-to-interfere basis with the primary
goal of evaluating the aircraft's basic carrier suitability. As a result, only cursory evaluations of the aircraft's ACLS tracking characteristics and Mode I1 performance were made in the interest of program risk mitigation, and those results are not discussed in this paper. Shipboard ACLS tests were performed as a priority during the Follow-On Sea Trials (FOST) aboard USS HARRY S. TRUMAN (CVN- 75) in March 1999. Although shore based test results to this point demonstrated satisfactory ACLS performance, the team was surprised to discover unsatisfactory ACLS performance at the ship, primarily in the presence of the ship's airwake and close to touchdown. Following extensive analysis and modifications to both the aircraft's FCC ACLS gains and the ANISPN-46 control program, and more shore based test flights, additional shipboard tests were performed during the Third Sea Trials (TST) aboard USS ABRAHAM LINCOLN (CVN-72) in April 2000. Results of this effort proved to be highly satisfactory.
The primary test loadings are shown in table 1.
Method of Tests
Landing systems airborne subsystem functional tests were conducted prior to the start of flight testing to verify the satisfactory integration and operation of landing system components in the aircraft, and to verify the compatibility of these subsystems with simulated ACLS landing system signals provided by appropriate test sets.
Initial flight tests were then performed at altitude to document any data link coupled mode engagement I disengagement transients, and to document the aircraft's open loop longitudinal and lateral response characteristics while operating in data link coupled auto-pilot mode. The measured aircraft responses were compared to responses determined analytically and through simulation. The
f' Storelmissilelcomponent was not critical to test and was often removed for weight savings
5-2597

airplane open loop response data, in conjunction with knowledge of the ACLS control loop, allows prediction of the complete closed loop response and gust response. These predicted responses were then compared with closed loop frequency response flight test data once obtained.
After the open loop response tests at altitude were completed, the airplane began testing in the AN/SPN-46 ACLS closed loop environment. ACLS Mode I1 approaches, which utilize manual aircraft control, were conducted first to allow an initial assessment of the aircraft’s AN/SPN-46 radar beacon tracking characteristics and overall ACLS compatibility, and to permit pilot familiarization with the ACLS controls and displays. ACLS Mode I1 radar skin tracking was conducted to evaluate the aircraft’s AN/SPN-46 radar skin tracking characteristics. These ACLS Mode I1 approaches also allowed each pilot to become familiar with the NAS Patuxent River Landing System Test Facility (LSTF) traffic pattern and ground based landing system sighting prior to ACLS coupled tests.
For ACLS coupled testing, preliminary AN/SPN-46 lateral and longitudinal control equation transfer functioins were established from computer simulations of the total system (shipboard I shore-based and airborne subsystems) dynamics. Initial Mode I approaches were flown to a 100 ft elevated touchdown point to verify that the airplane remained coupled to AN/SPN-46 commands and did not exhibit large magnitude glidepath oscillations. [In the event that large glidepath oscillations were observed, ANISPN-46 control equation gains would have been modiified as required to provide a stable control loop so that closed loop sine wave data could be obtained for use in closed loop optimization.] Closed loop vertical and lateral sine wave test points were then conducted to measure the aiircraft’s closed loop response characteristics. Additionally, the responses measured during the open loop tests were also obtained during the closed loop tests. These closed loop and open loop responses were then compared to those obtained from the analysis, simulation, and open loop tests. Further control program modifications were rnade as required for optimization and additional closed b o p tests flown to demonstrate closed loop performance.
Using the optimized AN/SPN-46 control program developed for the aircraft, standard ACLS Mode I approaches were conducted to evaluate the overall ACLS performance of the aircraft during all approach phases. Initial nominal ACLS Mode I approaches were conducted to a 100 ft AGL elevated touchdown point, with the touchdown point lowered to the runway only after concurrence of the test pilot and engineer. The aircraft’s ACLS performance was then further defined by conducting approaches from a number of off-nominal altitude, cross- track, and off center initial conditions, with a goal of completing a high percentage of attempted Mode I approaches throughout the typical ACLS Mode I (operating envelope. Mode I approaches were also conducted under conditions of wind turbulence, as conditions existed, to
evaluate the airplane / ATC / ANISPN-46 closed loop response to gusts and turbulence.
At the ship, ACLS Mode I1 and Mode IA approaches were again conducted initially to assess the aircraft’s AN/SPN-46 radar beacon tracking characteristics and overall ACLS compatibility prior to Mode I testing. Normal ACLS Mode I approaches were conducted to evaluate the overall ACLS performaince and to determine lateral and longitudinal touchdown dispersions under nominal wind-over-deck (WOD) conditions (23-27 kt, 348-354 deg). The aircraft’s ACLS certification WOD envelope was then expanded by conducting Mode I approaches with off-nominal WOD conditions, with a goal of completing a high percentage of attempted Mode I approaches throughout the typical ACLS Mode I operating envelope. ACLS approach performance was also evaluated in alternate aircraft loadings, based on the resullts of the simulation and shore based tests. Pilots rated all phases of the Mode I approaches using a qualitative rating system known as the Precision Approach and Landing System (PALS) Quality Rating scale (PQRs), figure 3. Definitions of the PALS approach phases are shown in figure 4.
Test aircraft were configured with MIL-STD-1553 Mux Bus instrume:ntation systems to record and/or telemeter parameters of interest. A cockpit video recording system was also used to record cockpit display presentations.
During shipboard testing, hook-to-ramp clearance, engaging speeds, and touchdown points were measured real-time via a MINILIR laser ranging and tracking system. Three high- speed cameras mounted on the carrier island structure provided backup information. The cameras operated at 100 frames per sec.
The MIPJILIR system uses laser and infrared technology, a laser retro reflector on the nose landing gear angle-of attack (AOA) tndexer box, and the AOA indexer light to determine aircraft position data. A portable computer attached to the MINILIli records the events and computes the aircraft attitude (data real-time. The MINILIR system was placed in the catwalk adjacent to Catapult 2 and was remotely operated from an adjacent space in the ship hull.
WOD was measured from the ship’s wind anemometer system on the Belknap Pole during all testing.
ACLS tracking, position errors, commands, and ship motion data were acquired and recorded from the ANISPN-46 ACLS using a PC-based Data Acquisition System (DAS) and also printed real-time on strip charts.
Video tracking cameras were mounted on each AN/SPN-46 antenna pedestal to provide ACLS tracking video. Tracking camera video (VHS) was reviewed between approaches as required and post flight to provide the test team with a qualitative assessment of ACLS tracking performance.
5-2598

POR
DCELLENT CHARACTERISTICS, HIGHLY DESIRABLE INDUCES GRFAT CONFIDENCE IN PILOT .--) - W O . NEGLIGIBLE DEFICIENCIES PILOT HAS CONFIDENCE IN SYSTEM TO SYSTEM PERFORMANCE
FAIR, SOME UNPLEASANT DEFICIENCIES, PILOT HAS CONFIDENCE IN SYSTEM AND PERFORMANCE IS CONSISTEm BUT A "FIX" IS DESIRED IN THIS PHASE OF THE APPROACH
SYSTEM INSPIRES NO CONFIDENCE IN PILOT CONIXOL IS ERRATIC AND UNPREDICTABLE A "FIX" IS MQUIRED IN THlS PHASE OF THE APPROACH OVER AT SOME F'0I"S 9 Y E S - )
AN ACCIDENT WOULD HAVE OCCURRED WITHOW PROMPT PILOT ACTION.
PILOT DECISIONS
Figure 3. PALS Quality Rating (PQR) Scale
LEVELSG -
I I 112'nmi. 114 nmi. RAMP
I TIPOVER
I 6 - 8 nmi.
(1.5 sec from touchdown)
Figure 4. PALS Approach Phase Definitions
Aircraft instrumentation, shipboard ACLS instrumentation, shipboard touchdown points as determined by landing area spotters and h4INILIR data, and shipboard camera data were analyzed post flight to determine touchdown point dispersion, sink rates, ACLS beacon and radar tracking performance, and hook-to-ramp clearances.
Specific test methods are addressed below along with test. results.
RESULTS AND EVALUATION
Shore Based Mode 11/ ICLS Approaches
ACLS Mode I1 approaches were conducted in August 1997 and night Mode I1 and ICLS approaches were conducted in January 1999. Day approaches were conducted from level legs of 900 to 1,500 ft Mean Sea Level (MSL) with and without cross track at roll in. Two approaches were flown using the HUD to display the ACLS tadpole and one approach each was flown using the ACLS symbology on the LDDI, the RDDI, the MPCD, and on the UFCD. Night approaches were conducted from a nominal 1,200 ft level, leg altitude with the pilot concentrating on a different
5-2599

display during each pass. The information provided on each display in both the HUD and Electronic Attitude Display Indicator (EADI) formats was readable and easily recognized, however, the RDDI and MPCD locations made using them as a primary landing aids displays difficult as the pilot's scan had to be widened to maintain track of the ACLS information and the AOA indexer. The MPCD location was also poor in that the control stick was in front of the lower portion of the display preventing the pilot from reading the negative values of the pitch ladder. The HUD and UFCD locations provided excellent locat ions for displaying ACLS data in that the AOA indexer, outside visual references, and ACLS displays were all presented in close proximity. The close proximity of all the relevant precision landing information sources made detecting deviations from angle-of-attack, glide slope, or glide path simple and will allow for increased boarding rates in inclement weather. Within the scope of this tests, the ACLS and ICLS displays were determined to be satisfactoiy for the shipboard recovery mission.
m r
Shore Based Mode I Automatic Approaches
Mode I coupled approaches were conducted to touch and go landings to runway 32 in preparation for FOST. In all, ten nominal Mode I approaches and two cross track approaches were completed to touchdown. ACLS guidance was provided by the Patuxent River AN/SPN-46 using the F-1 SE ACLS control laws version Vl/Ll with the glide slope set to 3.5 deg. Winds were within 20 degrees of runway heading with frequent gusts up to 7 kt. During the cross track approaches, commands were sent to the aircraft as it reached the extended runway centerline with a 25 deg cross track angle approximately 4 nmi from the intended touchdown point. ACLS commands drove the aircraft into an immediate angle of bank back toward centerline anti set up a glide path capture with negligible overshoots. Adding the longitudinal commands at tipover to the lateral corrections did not degrade the aircraft performance. Glide path capture and maintenance tasks to a 3.5 deg glide path and touchdown control of the F/A-lSE aircraft under ACLS Mode I control with the F- 1 SE ACLS control program dated 16 November 1998 instilled high confidence in the test pilots (PQR-2). Within the scope of this test, the Mode I ACLS control of the F/A-l8E/F aircraft was determined to be satisfactory for shore based operations and was recommended for shipboard evaluation.
Rate
All 34 34 100 WODt Completed Attempted (%)
Follow-On Sea Trials (FOST)
FOST testing was conducted in March 1999. ACLS approaches were flown primarily in the FE(CL) loading, however, a few passes were flown in the INT2 loading to assess the flying qualities on approach. Data statistics are presented for the FE(CL) configuration only. AveraLge peak- to-peak deck motion during the final portion of the approaches was 0.2 deg pitch, 0.4 deg roll, arid 0.0 ft touchdown heave. Maximum peak-to-peak declk motion was 0.5 deg pitch, 0.9 deg roll, and 0.1 ft touchdown heave.
I TST
Ship's pitch trim averaged 0.07 deg bow up. Test results are presented in the following paragraphs.
Nominal 19 19 100 Certified 59 59 100
ACLS Hook-Beacon Height Determination-The initial beacon-to-hook height was calculated geometrically from a Computer Aided Design (CAD) drawing of the aircraft. A couple of Mode I approaches to a touch and go or arrestment were performed initially to confirm the programmed ACLS hook-to-beacon height and to determine if any significant changes to the hook-to-beacon height were required to achieve satisfactory touchdown performance. The initial hook-to-beacon value of 12.5 ft was determined to be coirrect during FOST, however, small differences in this number are typical between ships.
Data Sample-Approaches during which the following conditions existed are not included in the presented data because these conditions result in unrepresentative ACLS performance:
Known system problems in the shipboard equipment that were corrected prior to the end of the at-sea test period.
Known system problems in the airborne equipment.
Traffic or foul deck waveoffs.
Operator error.
Completion Rates-Mode I completion rate data for both shipboard test periods are shown in table 2 for the FE(CL) loading and are Satisfactory.
Table 2. Mode I Completion Rate
I 1 I I I
Pilot Quality Ratingestatistics of PALS PQR's of aircraft control for Mode I approaches throughout all approach phases are presented in table 3 and figure 5 for both shipboard test periods. Although the PQR's are at acceptable levels between good (PQR-2) and fair (PQR-3) for both shipboard test periods, performance during FOST had lesser pilot acceptability than during the subsequent TST. Pilots reported excessive angle-of-attack deviations and pitch movement during FOST. This coupled with the poor loingitudinal touchdown performance resulted in the higher P'QRs. PQRs less than 2.5 are desired, with a rating of less than 4 considered acceptable.
5 - 2 6 0 0
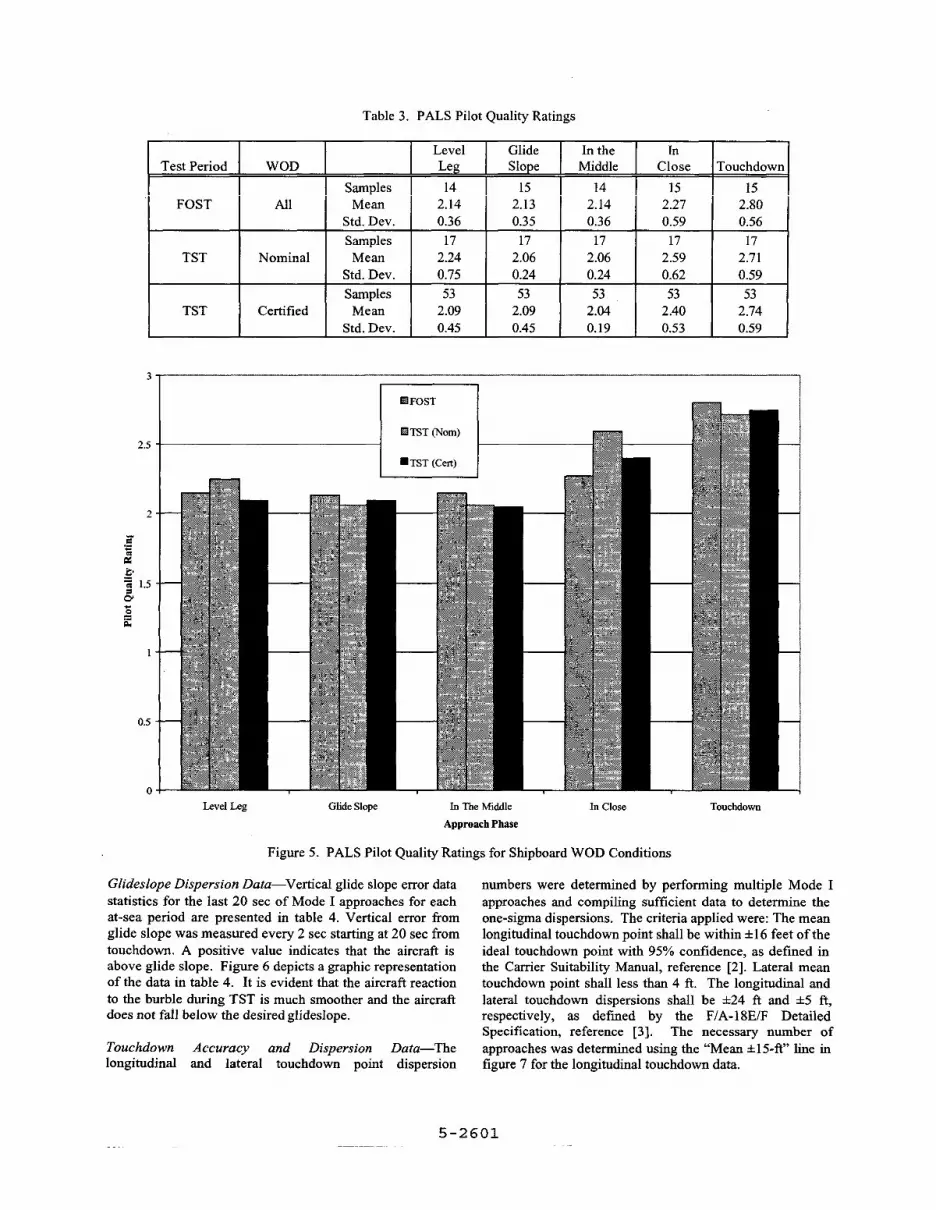
Table 3. PALS Pilot Quality Ratings
53 2.09 0.45
1 Test Period 1 WOD
It Nominal
53 53 53 2.04 2.40 2.74 0.19 0.53 0.59
I TST 1 Certified
Samples Mean
Std. Dev. Samples Mean
Std. Dev. Samples Mean
Std. Dev.
Level Leg 14
2.14 0.36 17
2.24 0.75 53
2.09 0.45
Glide In the In Slope Middle Close Touchdown
2.06 2.06 2.59 2.71 0.24 0.24 0.62 0.59
2.5
2
1
0.5
0 Touchdown Level Leg Glide Slope In The Middle In Close
Approach Phase
Figure 5. PALS Pilot Quality Ratings for Shipboard WOD Conditions
Glideslope Dispersion Data-Vertical glide slope error data statistics for the last 20 sec of Mode I approaches for each at-sea period are presented in table 4. Vertical error from glide slope was measured every 2 sec starting at 20 sec from touchdown. A positive value indicates that the aircraft is above glide slope. Figure 6 depicts a graphic representation of the data in table 4. It is evident that the aircraft reaction to the burble during TST is much smoother and the aircraft does not fall below the desired glideslope.
Touchdown Accuracy and Dispersion Data-The longitudinal and lateral touchdown point dispersion
numbers were determined by performing multiple Mode I approaches and compiling sufficient data to determine the one-sigma dispersions. The criteria applied were: The mean longitudinal touchdown point shall be within *16 feet of the ideal touchdown point with 95% contidence, as defined in the Carrier Suitability Manual, reference [2]. Lateral mean touchdown point shall less than 4 ft. The longitudinal and lateral touchdown dispersions shall be *24 ft and *5 ft, respectively, as defined by the F/A-l8E/F Detailed Specification, reference [3]. The necessary number of approaches was determined using the “Mean ~t15-e ’ line in figure 7 for the longitudinal touchdown data.
5-2601

Table 4. F/A- 18 Vertical Glide Slope Error Data
Test Period
FOST
TST
TST
WOD Samples
All Mean (ft) Std. Dev. (ft)
Samples Nominal Mean (ft)
Std. Dev. (ft) Samples
Certified Mean(ft) Std. Dev. (ft)
Time to Touchdown (sec) ~I
2 1 4 I 6 1 8 1 10 I 12 I 14 I 16
18 18 18 18 18 18 18 0.28 0.43 0.39 0.25 0.13 0.09 0.07 0.86 0.67 0.80 1.01 1.25 0.64 0.52 52 52 52 52 52 50 53
0.44 0.41 0.50 0.50 0.51 0.10 0.03 0.73 0.70 0.82 0.94 1.14 0.60 0.56
18 31
0.91 -0.04
18 0.05 0.87 51
-0.01 0.70
20 31
-0.01 0.77 18
0.02 0.74 51
0.02 0.65
Time to Touchdown (sec)
Figure 6. F/A-18 Mean Vertical Glide Slope Error Plot
Mean :b 10 ft ,
0.6
0.4 ",
0.2 b t
o w a -0.2 * -0.4
-0.6
-0.8
-1
5 15 25 35 45 55 65 75 Standard Deviation - ft
Figure 7. 95% Confidence Level in Mean Touchdown Point
5-2602

The longitudinal touchdown dispersion during FOST was determined to be well out of the specification requirement of 24 ft. This large dispersion was markedly reduced using the improved gains during TST. Tables 7 and 8 show the mean longitudinal and lateral touchdown point and dispersion data for both at-sea test periods.
Test Period
Table 7. Mean Longitudinal Hook Touchdown Point
WOD Samples 33
TST
I FOST I All I Mean(ft)t I 10.7 I Std. Dev. (ft) 38.0
Samples 19 Nominal Mean (ft)t 6.9
TST
I I I Std. Dev. (ft) I 18.1 I Samples 59
Certified Mean (ft)t 6.3 Std. Dev. (ft) 17.0
Test Period
t - In reference to desired touchdown point (a positive value indicates distance beyond the desired point halfway between the no. 2 and 3 arresting wire).
WOD Samples 9
Table 8. Mean Lateral Hook Touchdown Point
TST
Std. Dev. (ft) 1.9 .Samples 15
Nominal Mean (ft)t -3.3
TST
Std. Dev. (ft) 2.4 Samples 48
Std. Dev. (ft) 2.3 Certified Mean (ft)t -3.7
t - In reference to desired touchdown point (a positive value indicates distance right of the desired point).
FOST Summary--As a result of excessive angle-of-attack deviations and pitch movement on approach, and poor longitudinal touchdown dispersion performance with the FCC version 7.4 (V7.4) controls laws and Vl/Ll ACLS control program, the aircraft was recommended for Mode I1 operations only until the entire aircraWACLS control loop could be reanalyzed and retested.
Re-Optimization Effort and Shore Based Flight Tests
Attempts to analytically reproduce the unsatisfactory shipboard ACLS performance in simulation were unsuccessful. The low pitch axis damping evident from the FOST data and subsequent flight tests to investigate the problem could not be reproduced analytically or in Boeing's
Manned Flight Hardware Simulator. During the flight tests, ACLS pitch axis damping checks were made in variety of configurations. Pitch axis damping was unexpectedly low, with sustained oscillations present, for some tests in the Interdiction 2 (INT2) and 5 WET loading configurations. Testing in other Smart Weapons configurations indicated damping between the levels seen for the Fighter Escort (FE) and 5 WET configurations. Analysis of the flight test data did indicate, however, that the control laws, feedback sensors, and control surface actuators were all performing as designed.
To aid in the investigation, the Boeing aerodynamics team analyzed some specific ACLS Interdiction 2 flight test data. The aerodynamic database was interrogated using flight test surface and throttle positions and aircraft motions to generate theoretical aircraft lift and pitching moments for the time slices of interest. These were compared to aircraft lift and pitching moments derived from the flight test mass properties and accelerations. The steady state differences between the theoretical and flight derived results were insignificant, therefore, updates to the aerodynamic database were not justified. However, there were significant low frequency, unsteady residuals, but efforts to correlate the unsteady residuals to the steady state aerodynamic effects were unsuccessful. The source of these force and moment residuals remains unknown. Additional analytical options to assist in the ACLS design effort were considered, but were not pursued since the design for the FCC V8.0 software had been frozen.
To minimize risk, an extensive set of gain variations was developed by Boeing to be evaluated during shore based flights prior to committing FCC V8.0 to a shipboard evaluation. These gains consisted of pre-programmed sets that could be selected in the cockpit for flight test purposes. Additional modifications were also incorporated in the software to allow selected control surfaces to be frozen during follow-on testing if none of the gain sets provided proper performance. This would enable the design engineers to directly develop transfer functions for the aircraft aerodynamics if required for a more rigorous re- design effort.
Shore based testing with FCC V8.0 initially concentrated on evaluating the level of pitch axis damping achievable in the worse-case 5 WET configuration using the various V8.0 gains sets available. Testing consisted of open loop steps and sine waves. The goal was to identify gains sets that provided sufficient damping, yet retained the needed bandwidth to meet the overall system requirements. The best gains sets were then evaluated in the Fighter Escort configuration, since any gain set that performed well in both the 5 WET and Fighter Escort configuration would also perform satisfactorily for the other configurations tested. Once a primary gains set was selected for shipboard testing, the ANISPN-46 ACLS controls gains were optimized to meet the overall closed loop performance criteria given the demonstrated aircraft performance with V8.0. The open
5-2603

loop and closed loop data associated with this analysis is presented in the Supporting Data section of this paper. Since the aircraft was already configured with the variable gain sets, additional modification could be made, if required, during the next shipboard test period if there were any remaining problems with ride quality or touchdown performance.
Third Sea Trials (TST)
TST tests were conducted in April 2000. ACLS approaches were flown primarily in the FE(CL) loading, however, some data were obtained in the INT2 loading to assess the approach characteristics. Data statistics are presented for the
FE(CL) configuration only. Average peak-to-peak deck motion during the final portion of the approaches was 0.4 deg pitch, 0.1 deg roll, and 0.0 ft touchdown heave. Maximum peak-to-peak deck motion was 0.7 deg pitch, 0.7 deg roll, and 0.1 ft touchdown heave. Ship's pitch trim averaged 0.16 deg bow up.
Results of the re-optimization of both the aircraft's FCC gains (now VS.O) and the FIA-lSElF ACLS control program (now veirsion V2/L2) are presented in tables 2 through 8 along with the FOST results. Completion rate remained excellent, PQRs were reduced for most approach phases, glide slope dispersion data were indicative of improved
Figure 8. Representative Mode I Apprciach Time History
5-2604

glidepath control, and most notably, longitudinal touchdown dispersion was more than halved and now well within the specified 24 ft.
ACLS Mode I WOD Expansion-Expansion of the Mode I allowable WOD was desired to allow a greater operating envelope for the Fleet. Once satisfactory touchdown dispersion was confirmed under nominal WOD conditions, Mode I approaches were conducted with the winds outside of the nominal center cell WOD (23-27 kt, 348-354 deg). High port and starboard winds were targeted first, followed by low port and starboard winds. All variations were within the aircraft's basic recovery limitations. PQR's were assigned and reviewed post flight, along with touchdown dispersion data, to determine the final allowable ACLS Mode I certified WOD limits. Certification test results for the certified WOD conditions of 20-34 kt, 345-000 deg are also presented in tables 2 through 8 and are indicative of satisfactory performance over the broader WOD envelope. Changes in touchdown dispersion due to off-nominal WOD were insignificant.
Data recorded for a representative ACLS approach are shown in figure 8. Lateral Error (Ye) data was only available on hard copy strip charts due to recording problems with the ANISPN-46 DAS and are not presented in the figure.
S~PORTING DATA
Landing Systems Aircraft Subsystem Functionality Tests
A dedicated ground test was performed in June 1997 to test landing systems subsystem functionality on one of the test aircraft. These systems' BIT and functionality checks were also verified prior to each flight requiring use of the systems. Subsystem Built-In Tests (BIT) were performed on the ANI"-202, ANIARA-63, and RT-1379NASW avionics units. Additionally, AN/APN-202 tests were performed using the AN/APM-455 test set. Finally, the linearity and sensitivity of cockpit displays as indicated by the ACLS tadpole and the ICLS needles deflections, were measured using the AN/APM-455 test set and the ARM-146 ICLS test set. The linearity and sensitivity tests were performed on the Up Front Control Display (UFCD), left and right Digital Display Indicators (DDIs), the Multi- Purpose Color Display (MPCD), the Standby Attitude Reference Indicator (SARI) and on the Heads-Up Display (HUD). ICLS needle presentations were varied by selecting different preset Differences in Depth of Modulation (DDM) output by the ARN-146 test set. ACLS tadpole presentations were varied by manually reconfiguring the digital output of the ANIAPM-455 test set. Data was taken by measuring the needlehadpole deflection on each display from a centered position through the use of a handheld
metric ruler (accurate to *0.5 mm). No anomalies were noted. The linearity and sensitivity data measured on each display format was satisfactory. All BIT checks were satisfactory.
Data Link Coupled Auto-pilot Mode Engagement / Disengagement Tests
Data link coupled autopilot mode engagements and disengagement tests were performed in June 1997. Tests were conducted in Power Approach (PA), PA112, and Cruise (CR) configurations from 4,000 to 12,600 ft MSL over a range of airspeeds from 1 10 to 180 KCAS in PA and from 210 to 500 KCAS in CR. No anomalies were noted. Tests were completed successfully with occasional autopilot kick-outs that were attributed to excessive range from the transmitting antenna and antenna shading. These tests were not specifically repeated with FCC V8.0, however, performance was deemed satisfactory during normal engagements and disengagement in conjunction with other Mode I testing.
Data Link Open Loop Step Response Tests
Aircraft open loop response to ACLS vertical rate and bank angle step inputs was measured in configuration PA with the ATC engaged from altitudes between 4,000 and 6,000 fi MSL. Open loop step commands were transmitted to the aircraft using the SM-511 data link test set. Data were collected in the FE, 5 WET, and INT2 loadings.
Vertical Rate Response-Overall, the pitch and AOA excursions to open loop vertical rate inputs are larger than that given by the F/A-l8A/B/C/D aircraft, but are not excessive, and at no time did the aircraft exceed the AOA limit of 14 degrees for autopilot disengagement. The coarseness of the INS data (minimum resolution of 0.125 Wsec) prevents precise measurement of aircraft vertical rate response, particularly for measuring overshoots, as the percentages vary by three percent for each least significant bit. However, to the precision available, the data were compared against Specification. The vertical rate response of the aircraft to a small vertical rate command step of +4 ftlsec exceeded the vertical rate overshoot requirements of the Specification in that the vertical rate overshoot in the 5 WET and INT2 loadings exceeded the maximum allowable vertical rate overshoot. The vertical rate overshoots with v8.0 gains are significantly reduced, as shown in figure 9.
Bank Angle Response-Aircraft response to ACLS bank angle commands (not shown) is even in both directions. Aircraft bank angle response to a commanded input is essentially first order and the peak overshoots are generally less than 5%, with the greatest peaks occurring due to turbulence.
5-2605

FE
Figure 9. Vt:rtical Rate (Hdot) Step Response
Data Link Open Loop Frequency Response Tests
Aircraft open loop response to ACLS vertical rate :md bank angle sine wave inputs were measured in configuration PA with the ATC engaged from altitudes between 4,000 and 6,000 ft MSL. Open loop sine wave commands were transmitted from the ground test site to the aircraft over the data link. Data were collected in the FE, 5 WET, and INT2 loadings. Analysis is shown for FE and 5 WET on.ly, since these loadings represent the extremes of the fiequency response results.
F-18D
loading. AN/SPN-46 closed loop and DMC filter gains for FOST were designed around these results. Open loop tests in the DIT2 loading were also conducted prior to FOST. It was discovered that the INT2 response exceeded design guidelines, however, closed loop control was deemed satisfactory for shipboard evaluation. Version 8.0 software development focused on increasing the pitch damping of the aircraft, in ACL mode, by adjusting key autopilot and autothrottle gains. Figure 10 shows the frequency response for V8.0 and V7.4 for the FE and 5 WET loadings.
Vertical Rate Response- Open loop response with V7.4 in the FE loading fell well within the design guidelines and appeared very similar to the F/A-18C/D response in the FE
5-2606

-10
-15
" - 4". -FE-v7.4
-
-FE - v8.0
-5 WET - ~ 8 . 0
A- - - 5 WET - ~ 7 . 4
0.1 1
Frequency (md/sec)
4o t specLimit -
-120 -
-140 -
-160 -
-180 -
~ ~ -0 - - FE-v7.4
_ - * - - 5 WET - ~ 7 . 4 - FE - v8.0
* 5 WET - ~ 8 . 0
-A"" I
0.1 1
Frequency (rdsec)
Figure 10. Vertical Rate to Vertical Rate Command Frequency Response
10
IO
Bank Angle Response- Lateral open loop response with V7.4 in the FE loading also fell well within the design guidelines and appeared very similar to the F/A-l8C/D response. Response for all loadings tested was similar, and is shown is figure 11. Lateral closed loop performance was
satisfactory for shore based test and during FOST. Lateral gains for V8.0 were unchanged from V7.4.
5-2607

." . 0.1
0
-20
-40
-80
1
Frequency (radlsec)
-I,." I
0.1 1
Frequency (radlsee)
10
Figure 1 1. Bank Angle to Bank Angle Command Open Loop Frequency Response
Data Link Closed Loop Frequency Response Tests AN/SPN-46 control gains were held constant during approaches to a 100 ft elevated touchdown point. Figures 12
Closed loop frequency response tests were Co~-~duc&xl With and 13 .present the Bode plots for the data for both FCC the final FCC gain configuration in loading FE. Sine wave v7.4 V8.0 using their respective AN/SPN-46 ACLS in- inputs were superimposed upon the standard 3.5 deg close gain sets, relative to the design guidelines. commanded glidepath for the vertical axis and upon the commanded centerline for the lateral axis while the
5-2608

Vertical Axis Frequency Response- Closed loop vertical response for V7.4 gains fell within the design guidelines, however , it proved unsatisfactory during shipboard testing. The closed loop response for V8.0 exceeded the guidelines but provided satisfactory control in the shipboard
environment. The closed loop response of aircraft beacon altitude (Zb) to altitude command (Zc) is shown in figure 12 for V7.4 gains and in figure 13 for V8.0 gains.
F-l8EF VertF3 g to Z, Closed Loop Response 3.96 kilofeet
I I O " 1 0-1
Frequency (radlsec) I O 0 I O '
Figure 12. Vertical Closed Loop Response (Zb/Zc) for V7.4 Gains
5-2609

F-I 8EF VertF3 $ to ;$ Closed Loop Response 3.96 kilofeet
Frequency (rad/sec)
0
-50
1::: -200
-250
IO‘* lo-’ 1 oo 10’ Frequency (radkec)
Figure 13. Vertical Closed Loop Response (Zb/Zc) for V8.0 Gains
Lateral Axis Frequency Response- Closed loop lateral response fell within the design guidelines and provided satisfactory control during shore based and shipboard
testing. The closed loop response of beacon lateral position (Yb) to lateral command (Yc) is shown in figure 14.
5-2610

F-18EF to Y, Closed Loop Response 3.96 kilofeet
Figure 14. Lateral Closed Loop Response for V7.418.0 Gains
CONCLUSION
The F/A-lSE/F aircraft configured with FCC version 8.0 and using the version V2/L2 ACLS control program demonstrated excellent ACLS Mode I automatic approach and landing performance at the field and aboard ship.
RECOMMENDATIONS
Based in part on the results presented in this paper, the F/A-lSE/F aircraft was recommended for fleet Mode I operational assessment. Further expansion of the WOD is recommended in conjunction with future Precision Approach and Landing System (PALS) shipboard certification efforts, with the objective of clearing the F/A-18E/F for operations with a 4.0 deg glideslope and up to 40 kt or greater WOD.
LESSONS LEARNED
Precise simulation of ACLS performance in the shipboard environment remains a challenge primarily due to the inability to accurately model the ship's unique airwake characteristics. Additionally, in this case the F/A-l8E/F simulation used for the ACLS design process did not indicate a problem with the pitch axis damping in the ACLS mode. Although initial shore based performance with the FCC V7.4 and ACLS version Vl/Ll control gains demonstrated satisfactory results, problems with this configuration were not evident until the shipboard evaluation. Recommend future ACLS development programs develop and validate simulation tools as early in the program as possible to minimize potential costly retests. The addition of an accurate ship's airwake model to the simulation would further enhance the ability of the design team to predict shipboard ACLS performance early in the development program. Recent Computational Fluid Dynamics (CFD) capabilities have put this goal within reach.

Following the initial shipboard ACLS evaluation during FOST, the capability of being able to select from multiple prospective gain sets in FCC V8.0 provided the flexibility required to ensure satisfactory Mode I performance could be achieved at the ship without having to wait for another software build if problems were encountered. Recommend future ACLS development programs incorporate this capability in their test aircraft as a tool for refining ACLS performance at the field and aboard ship without the delay associated with progressive software builds.
It is imperative that all aircraft loadings be investigated as early in the program as possible. The low pitch damping observed during actual flight tests with the INT2 loading prior to FOST should have been indicative of potential problems even though performance in the basic Fighter Escort configuration was satisfactory. The analysis and flight testing of a range of configurations prior to TST greatly minimized performance risk during TST.
Arthur "Joe" Prickett is the lead engineer for Landing Systems Test and Evaluation on the F/A-lSE/F Integrated Test Team at Patuxent River, MD. He eamed his Bachelor of Science in Mechanical Engineering (BSME) from the University of Maryland in 1995. Mr. Prickett graduated from US Naval Test Pilot School
(Fixed Wing Curriculum) as a member of Class 114. He began work at the former Naval Air Test Center, Carrier Suitability Department in June 1990 and has accumulated over 10 years of experience in the test and evaluation of Air Traffic Control and Landing Systems as a project engineer.
REFERENCES
[ 1 ] A1 -F 18EA-NFM-000, Preliminary NATOPS Flight Manual Navy Model F/A- 18EE Aircraft, dtd 1 Nov 1999.
[2] 2 of 30 Sep 1994.
SA FTM-01, Carrier Suitability Testing Manual, Rev.
[3] Detail Specification for Model VA-18EF Aircraft Weapon System, SD-565-3, Revision R-5, Volume 11, of 28 Dec 1993.
BIOGRAPHIES
Chris Parkes is the Head of the Air Traffic Control and Landing Systems Branch of the Test and Evaluation Engineering Department at the Naval Air Systems Command, Patuxent River, MD, where he c:urrently oversees the development, test and evaluation, and certification of all Navy and Marine Corp Air Traffic
Control and Landing Systems. He earned his Bachelor of Science in Mechanical Engineering (BSME) from Virginia Polytechnic Institute and State University in 1983, and earned his Master of Science in System Management (MSSM) from the Florida Institute of Technology in 1991. He began work at the former Naval Air Test Center, Carrier Suitability Department in July 1983 and has accumulated over 17 years of experience in the test and evaluation of Air Traffic Control and Landing Systems as a project engineer, supervisor, and manager.
5-2612


