
ENVIRONMENTAL ASSESSMENT
TRINIDAD RANCHERIA ECONOMICDEVELOPMENT CORPORATION
HOTEL DEVELOPMENT PROJECT
SEPTEMBER 2018
LEAD AGENCY:
Bureau of Indian Affairs2800 Cottage Way
Sacramento, CA 95825(916) 978-6000
ENVIRONMENTAL ASSESSMENT
TRINIDAD RANCHERIA ECONOMICDEVELOPMENT CORPORATION
HOTEL DEVELOPMENT PROJECT
SEPTEMBER 2018
LEAD AGENCY:
Bureau of Indian Affairs2800 Cottage Way
Sacramento, CA 95825(916) 978-6000
PREPARED BY:
Analytical Environmental Services1801 7th Street, Suite 100
Sacramento, CA 95811(916) 447-3479
www.analyticalcorp.com
Analytical Environmental Services i TRDEC Hotel September 2018 Environmental Assessment
TABLE OF CONTENTS TRINIDAD RANCHERIA ECONOMIC DEVELOPMENT CORPORATION ENVIRONMENTAL ASSESSMENT
1.0 INTRODUCTION 1.1 Introduction ............................................................................................................................. 1-1 1.2 Background ............................................................................................................................. 1-2 1.3 Location and Setting ............................................................................................................... 1-2 1.4 Purpose and Need for the Proposed Action ............................................................................ 1-2 1.5 Overview of the Environmental Review Process .................................................................... 1-6 1.6 Environmental Issues Addressed ............................................................................................ 1-6 1.7 Regulatory Requirements and Approvals ............................................................................... 1-6
2.0 PROPOSED ACTION AND ALTERNATIVES
2.1 Selection of Alternatives for Detailed Evaluation .................................................................. 2-1 2.2 Proposed Action and Proposed Project ................................................................................... 2-1 2.3 No-Action Alternative ............................................................................................................. 2-7 2.4 Comparison of the Proposed Action and the Project Alternatives .......................................... 2-7
3.0 DESCRIPTION OF AFFECTED ENVIRONMENT
3.1 Land Resources ....................................................................................................................... 3-1 3.2 Water Resources ..................................................................................................................... 3-6 3.3 Air Quality and Greenhouse Gas ............................................................................................ 3-8 3.4 Biological Resources............................................................................................................. 3-12 3.5 Cultural Resources ................................................................................................................ 3-16 3.6 Socioeconomic Conditions / Environmental Justice ............................................................. 3-17 3.7 Transportation and Circulation ............................................................................................. 3-18 3.8 Land Use ............................................................................................................................... 3-19 3.9 Agriculture ............................................................................................................................ 3-20 3.10 Public Services ...................................................................................................................... 3-20 3.11 Noise ..................................................................................................................................... 3-23 3.12 Hazardous Materials ............................................................................................................. 3-26 3.13 Visual Resources ................................................................................................................... 3-27
4.0 CUMULATIVE AND GROWTH-INDUCING EFFECTS
4.1 Cumulative Effects .................................................................................................................. 4-1 4.2 Indirect and Growht-Inducing Effects .................................................................................... 4-5
5.0 CONSULTATION, COORDINATION AND LIST OF PREPARERS
5.1 Federal Agencies ..................................................................................................................... 5-1 5.2 Local Government .................................................................................................................. 5-1
Analytical Environmental Services ii TRDEC Hotel September 2018 Environmental Assessment
5.3 Preparers of Environmental Assessment ................................................................................. 5-1
FIGURES
Figure 1-1 Regional Location Map ................................................................................................. 1-3 Figure 1-2 Site and Vicinity Map .................................................................................................... 1-4 Figure 1-3 Aerial View Photograph ................................................................................................ 1-5 Figure 2-1 Proposed Site Plan ......................................................................................................... 2-2 Figure 2-2 Architectural Rendering ................................................................................................ 2-4 Figure 3-1 Regional Fault Map ....................................................................................................... 3-2 Figure 3-2 Soil Types ...................................................................................................................... 3-4 Figure 3-3 Habitat Types .............................................................................................................. 3-14
TABLES
Table 3.3-1 Unmitigated Construction Emissions ........................................................................ 3-10 Table 3.3-2 Unmitigated Operational Emissions .......................................................................... 3-11 Table 3.3-3 Proposed Project GHG Emissions ............................................................................. 3-12 Table 3.11-1 Unmitigated Operational Emissions ........................................................................ 3-24
APPENDICES
Appendix A Preliminary Feasibility Report for Trinidad Rancheria Cher-Ae Heights Facility Appendix B Draft Geotechnical Feasibility and Preliminary Design Report Appendix C Best Management Practices Appendix D Regulatory Context Appendix E CalEEMod Files Appendix F Special Status Species Appendix G Trinidad Area Freeway Master Plan Study Report Appendix H Bibliography
Analytical Environmental Services 1-1 TRDEC Hotel September 2018 Environmental Assessment
SECTION 1.0 INTRODUCTION
1.1 INTRODUCTION Programs administered by the U.S. Bureau of Indian Affairs (BIA) allow tribes to improve tribal government infrastructure, community infrastructure, education, job training, and employment opportunities, along with other components of long-term sustainable development that work to improve the quality of life for their members. To help Indian tribes and individuals establish and expand Indian-owned businesses, and to encourage self-sufficiency, Congress passed the Indian Financing Act of 1974 (Act). The Act was established to reduce the disparity between business capital available to Indian and non-Indian businesses. The Act is administered by the BIA, Office of Indian Energy and Economic Development (IEED): Division of Capital Investment (DCI) that oversees the various implementation programs such as the Indian Loan Guaranty, Insurance, and Interest Subsidy Program. BIA approvals under the program, including Indian Loan Guarantees which result in the physical disturbance of the environment (such as new construction), constitute a Federal Action requiring review under the National Environmental Policy Act (NEPA) of 1969. In addition to the DCI, the BIA Division of Real Estate Services assists tribes in improving the quality of life for its members. The Division of Real Estate Services reviews and approves leases on lands held in Trust by the Department of the Interior. Accordingly, this Environmental Assessment (EA) has been prepared for the BIA to support the Trinidad Rancheria Economic Development Corporation (TREDC) requests, on behalf of the Cher-Ae Heights Indian Community of the Trinidad Rancheria (Tribe), for an Indian Loan Guarantee by DCI for capital to build a Hotel adjacent to the Tribe’s Casino on the Reservation and the approval of a lease by the Division of Real Estate Services with Hyatt Place to operate the Hotel. Combined, these two approvals represent the Proposed Action. The construction and operation of the Hotel constitute the Proposed Project. The BIA will use this EA to determine if the Proposed Action and subsequent Proposed Project would result in adverse effects to the environment. This document has been prepared in accordance with the requirements set out in NEPA (42 United States Code [USC] §4321 et seq.), the Council on Environmental Quality (CEQ) Guidelines for Implementing NEPA (40 CFR Parts 1500-1508), and the BIA’s NEPA Guidebook (59 Indian Affairs Manual [IAM] 3-H). Section 2.0 of this EA provides a detailed description of the Project Alternatives. Section 3.0 provides a description of the existing environmental conditions on and in the vicinity of the project site, an analysis of the potential environmental consequences associated with the Project Alternatives, and impact mitigation measures. Section 4.0 describes cumulative and growth-inducing effects, and Section 5.0 presents a list of preparers. Consistent with the requirements of NEPA, the BIA will review and analyze the environmental consequences associated with the Proposed Action and Project Alternatives and either determine that a Finding of No Significant Impact (FONSI) is appropriate, request additional analysis, or request that an Environmental Impact Statement (EIS) be prepared.
1.0 Introduction
Analytical Environmental Services 1-2 TRDEC Hotel September 2018 Environmental Assessment
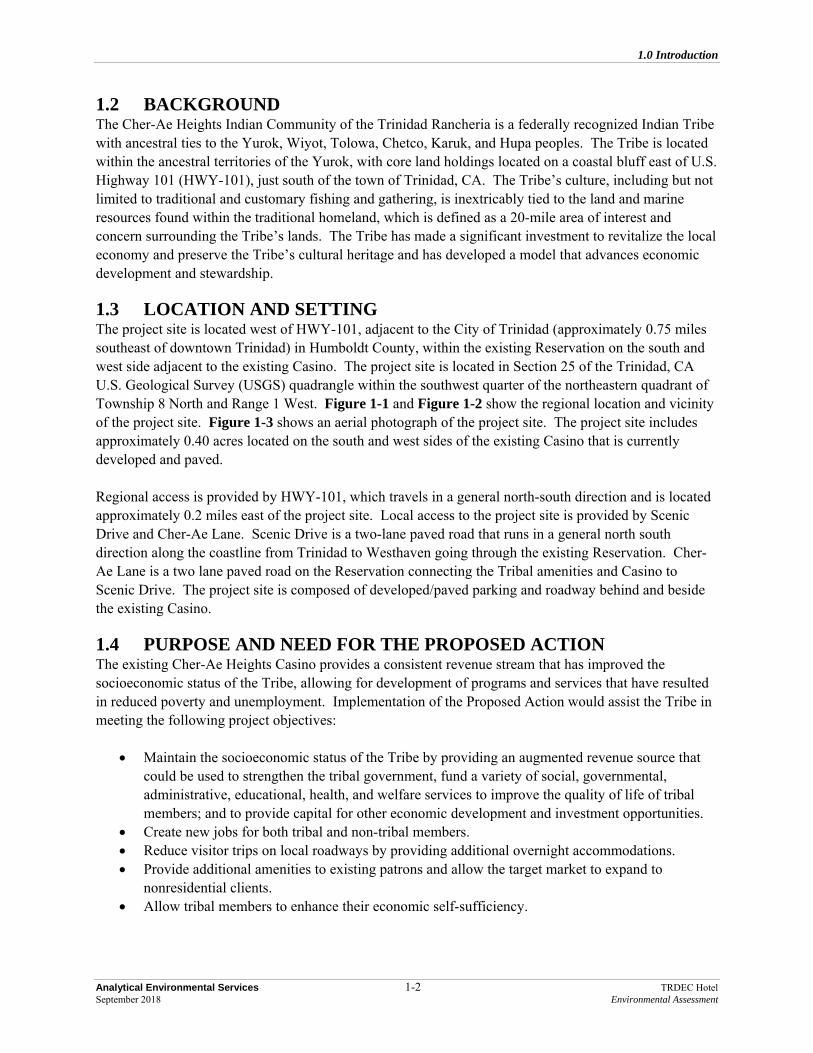
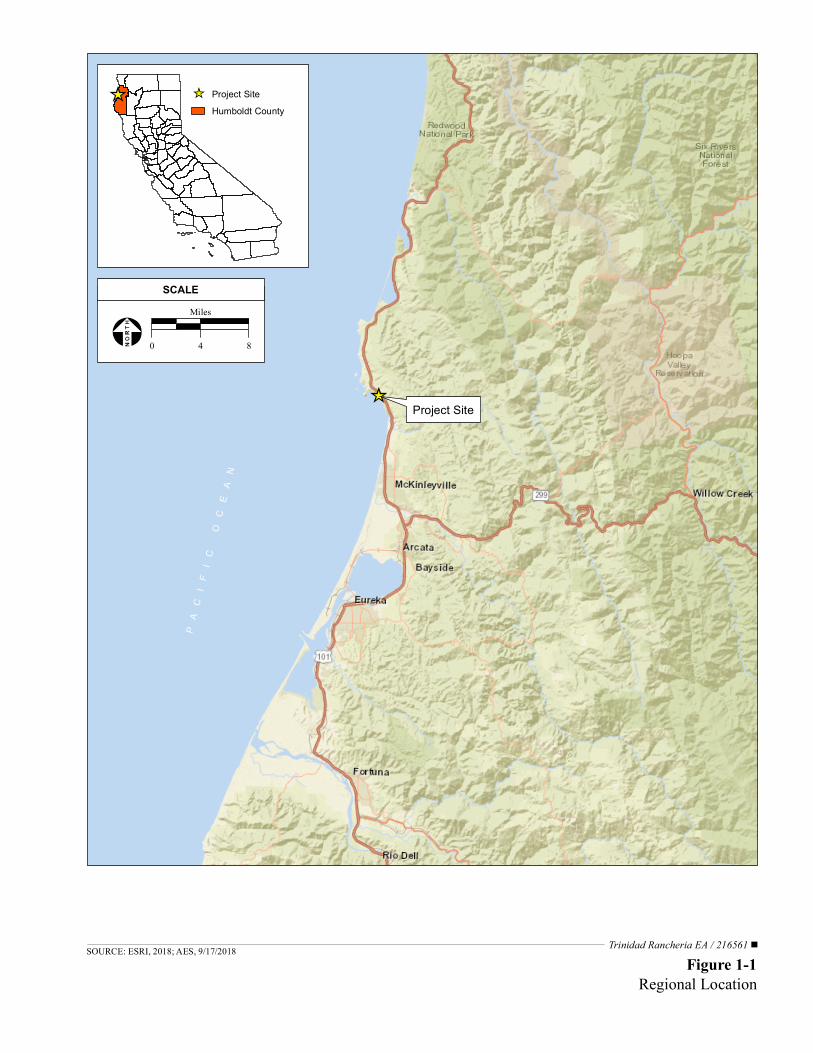
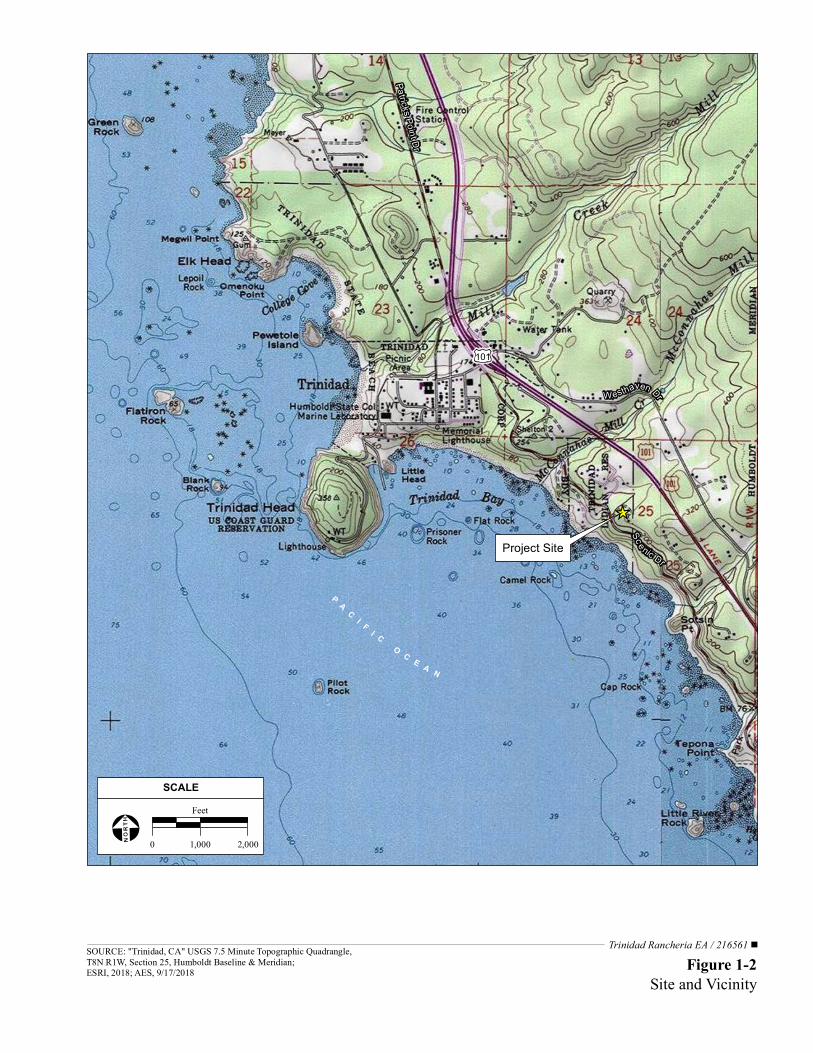
1.2 BACKGROUND The Cher-Ae Heights Indian Community of the Trinidad Rancheria is a federally recognized Indian Tribe with ancestral ties to the Yurok, Wiyot, Tolowa, Chetco, Karuk, and Hupa peoples. The Tribe is located within the ancestral territories of the Yurok, with core land holdings located on a coastal bluff east of U.S. Highway 101 (HWY-101), just south of the town of Trinidad, CA. The Tribe’s culture, including but not limited to traditional and customary fishing and gathering, is inextricably tied to the land and marine resources found within the traditional homeland, which is defined as a 20-mile area of interest and concern surrounding the Tribe’s lands. The Tribe has made a significant investment to revitalize the local economy and preserve the Tribe’s cultural heritage and has developed a model that advances economic development and stewardship. 1.3 LOCATION AND SETTING The project site is located west of HWY-101, adjacent to the City of Trinidad (approximately 0.75 miles southeast of downtown Trinidad) in Humboldt County, within the existing Reservation on the south and west side adjacent to the existing Casino. The project site is located in Section 25 of the Trinidad, CA U.S. Geological Survey (USGS) quadrangle within the southwest quarter of the northeastern quadrant of Township 8 North and Range 1 West. Figure 1-1 and Figure 1-2 show the regional location and vicinity of the project site. Figure 1-3 shows an aerial photograph of the project site. The project site includes approximately 0.40 acres located on the south and west sides of the existing Casino that is currently developed and paved. Regional access is provided by HWY-101, which travels in a general north-south direction and is located approximately 0.2 miles east of the project site. Local access to the project site is provided by Scenic Drive and Cher-Ae Lane. Scenic Drive is a two-lane paved road that runs in a general north south direction along the coastline from Trinidad to Westhaven going through the existing Reservation. Cher-Ae Lane is a two lane paved road on the Reservation connecting the Tribal amenities and Casino to Scenic Drive. The project site is composed of developed/paved parking and roadway behind and beside the existing Casino. 1.4 PURPOSE AND NEED FOR THE PROPOSED ACTION The existing Cher-Ae Heights Casino provides a consistent revenue stream that has improved the socioeconomic status of the Tribe, allowing for development of programs and services that have resulted in reduced poverty and unemployment. Implementation of the Proposed Action would assist the Tribe in meeting the following project objectives:
Maintain the socioeconomic status of the Tribe by providing an augmented revenue source that could be used to strengthen the tribal government, fund a variety of social, governmental, administrative, educational, health, and welfare services to improve the quality of life of tribal members; and to provide capital for other economic development and investment opportunities.
Create new jobs for both tribal and non-tribal members. Reduce visitor trips on local roadways by providing additional overnight accommodations. Provide additional amenities to existing patrons and allow the target market to expand to
nonresidential clients. Allow tribal members to enhance their economic self-sufficiency.
Trinidad Rancheria EA / 216561
PA
CI
FI
CO
CE
AN
Project Site
Figure 1-1Regional Location
SOURCE: ESRI, 2018; AES, 9/17/2018
Project SiteHumboldt County
SCALE
0 4 8
Miles
P AC I F I C
O C E A N
Project Site
101
Sc enic Dr
Patricks Point DrW esthaven Dr
Figure 1-2Site and Vicinity
SOURCE: "Trinidad, CA" USGS 7.5 Minute Topographic Quadrangle,T8N R1W, Section 25, Humboldt Baseline & Meridian; ESRI, 2018; AES, 9/17/2018
0 1,000 2,000
Feet
SCALE
Trinidad Rancheria EA / 216561
Trinidad Rancheria EA / 216561
SCENIC DR
101
BAKER RANCH RD
PRIVATE DR
N WESTHAVEN DR
CHER
-AE LN
LARK LN
PA-PAH LN
TEP-PAH LN
MA-WE MORE VIEW LN
PRIVA
TE D
R
PRIVATE DR
PRIVATE DRPR
IVATE
DR
PRIVATE DR
TER-KER-C O O LN
Figure 1-3Aerial Photograph
SOURCE: DigitalGlobe aerial photograph, 10/12/2017; AES, 9/17/2018
LEGEND
0 225 450
Feet
Project SitePotential Leachfield Location
1.0 Introduction
Analytical Environmental Services 1-6 TRDEC Hotel September 2018 Environmental Assessment
The Proposed Action and subsequent Proposed Project would ensure that the Tribe continues to maintain a long-term, viable, and sustainable revenue base and allow the Tribe to continue to compete with other gaming and tourist attraction venues in the region. 1.5 OVERVIEW OF THE ENVIRONMENTAL REVIEW PROCESS This EA is intended to satisfy the environmental review process of 59 IAM 3-H, 40 CFR § 1501.3 and 40 CFR § 1508.9. The EA has been released for a 30-day comment period. Comments will be considered by the BIA, and either a FONSI will be prepared or additional environmental analysis will be conducted. After the NEPA process is complete, the DCI and Division of Real Estate may issue a determination on the request to approve the Indian Load Guarantee and lease agreement. 1.6 ENVIRONMENTAL ISSUES ADDRESSED In accordance with NEPA and because the Proposed Project is located within a coastal zone, this EA evaluates the following environmental issue areas outlined within the BIA’s NEPA Guidebook:
Land Resources Land Use and Agriculture Water Resources Public Services Air Quality/Greenhouse Gasses Noise Biological Resources Hazardous Materials Cultural Resources Visual Resources Socioeconomic Conditions /
Environmental Justice Transportation and Circulation
Land Resources 1.7 REGULATORY REQUIREMENTS AND APPROVALS The following direct and indirect federal approvals and actions may occur as a result of the Proposed Action:
Consultation with the U.S. Fish and Wildlife Service (USFWS) and the National Marine Fisheries Service (NMFS) under Section 7 of the Federal Endangered Species Act (ESA), if endangered species may be impacted by the Proposed Action.
Consultation with the California Coastal Commissions concerning consistency of the Proposed Action with the Local Coastal Plan in accordance with 15 CFR, Section 930.35(a) of the National Oceanic and Atmospheric Administration, Federal Consistency Regulations.
Consultation with the State Historic Preservation Office under Section 106 of the National Historic Preservation Act (NHPA).
Analytical Environmental Services 2-1 TRDEC Hotel September 2018 Environmental Assessment
SECTION 2.0 PROPOSED ACTION AND ALTERNATIVES
2.1 SELECTION OF ALTERNATIVES FOR DETAILED EVALUATION
As discussed in Section 1.4, the Purpose and Need of the Proposed Action relates to the Tribe’s goals of economic self-sufficiency, self-governance, and self-determination. The only reasonable alternative is for the DCI and the Division of Real Estate Services to deny approval of the Indian Loan Guarantee and lease agreement, respectively. Furthermore, the selected location of the Proposed Project provides for a reduced-level of potential environmental impacts compared to alternative locations as the site is previously developed and supports the existing gaming operation. Other potential alternatives to the Proposed Action, such as a reduction in the size of the area for development or alternative locations, do not meet the definition of “reasonable” under the CEQ’s Regulations for Implementing the NEPA because the purpose and need would not be met. Due to the proposed location of the Hotel, the Tribe has reduced the size to the minimum size that would provide the economic gains that would make the Hotel profitable and thereby viable. Accordingly, a smaller area for the Proposed Project is not evaluated within this Environmental Assessment (EA). Being that all the parcels near the existing Casino are designated for parking, tribal facilities, or housing under Tribal land use planning, the surrounding locations owned by the Tribe are not suitable for a Hotel development. There are no other available comparable and affordable lands that would meet the purpose and need of the Proposed Project (in that the funds needed to purchase surrounding lands would result in lack of funding for Hotel development). Furthermore, the Tribe’s purpose for the development of a 100-room Hotel is to support the existing Casino (Proposed Project). There is no alternative location that would allow the Tribe to have a Hotel near the existing Casino without disrupting future plans essential to the Tribe’s growth and facilities. In addition, developing a Hotel separated from the existing Casino would prevent sharing of operational costs. This increase in operating costs associated with a separated Hotel facility would not be economically feasible for the Tribe. Therefore, alternative locations for the Proposed Project are not evaluated within this EA as none have been evaluated as being a reasonable alternative to the Proposed Project. The Proposed Project would allow the Tribe to better support their existing Casino and patrons visiting the area of Trinidad, thus providing economic benefit to the Tribe and its members. The Proposed Project is detailed below in Section 2.2. 2.2 PROPOSED ACTION AND PROPOSED PROJECT The Proposed Action consists of the guarantee of a loan by DCI to the Tribe’s lender in accordance with 25 Code of Federal Regulations (CFR) Part 162 Residential, Business, and Wind and Solar Resource Leases on Indian Lands and approval of a lease agreement between the Tribe and Hyatt hotels by the Division of Real Estate Services for the operation of the Hotel. 2.2.1 ALTERNATIVE A – PROPOSED PROJECT The Tribe proposes to develop a six-story, 100-room Hotel, and accessory components on approximately 0.4 acres within existing developed/paved areas to the south and east of the existing Casino (Figure 2-1)
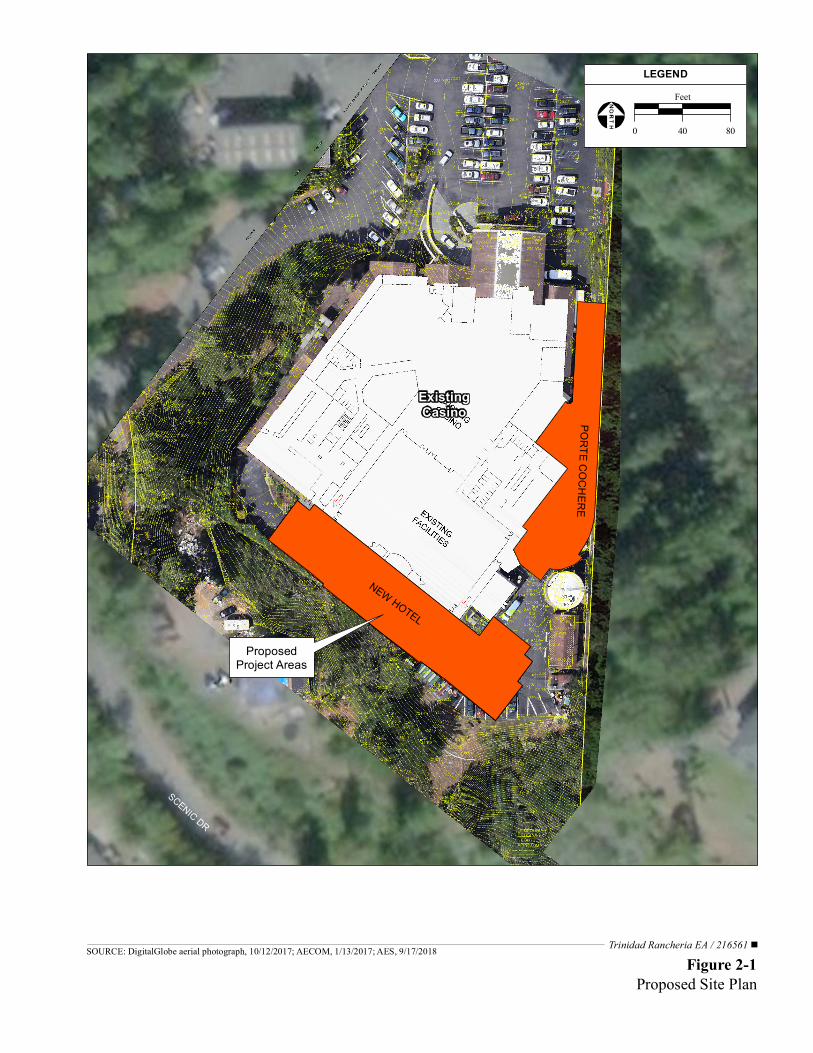
ProposedProject Areas
ExistingCasino
SCENIC DR
Figure 2-1Proposed Site Plan
SOURCE: DigitalGlobe aerial photograph, 10/12/2017; AECOM, 1/13/2017; AES, 9/17/2018
LEGEND
0 40 80
Feet
Trinidad Rancheria EA / 216561
NEW HOTEL
PORTE COCHERE
3.0 Affected Environment, Impacts, and Mitigation
Analytical Environmental Services 2-3 TRDEC Hotel September 2018 Environmental Assessment
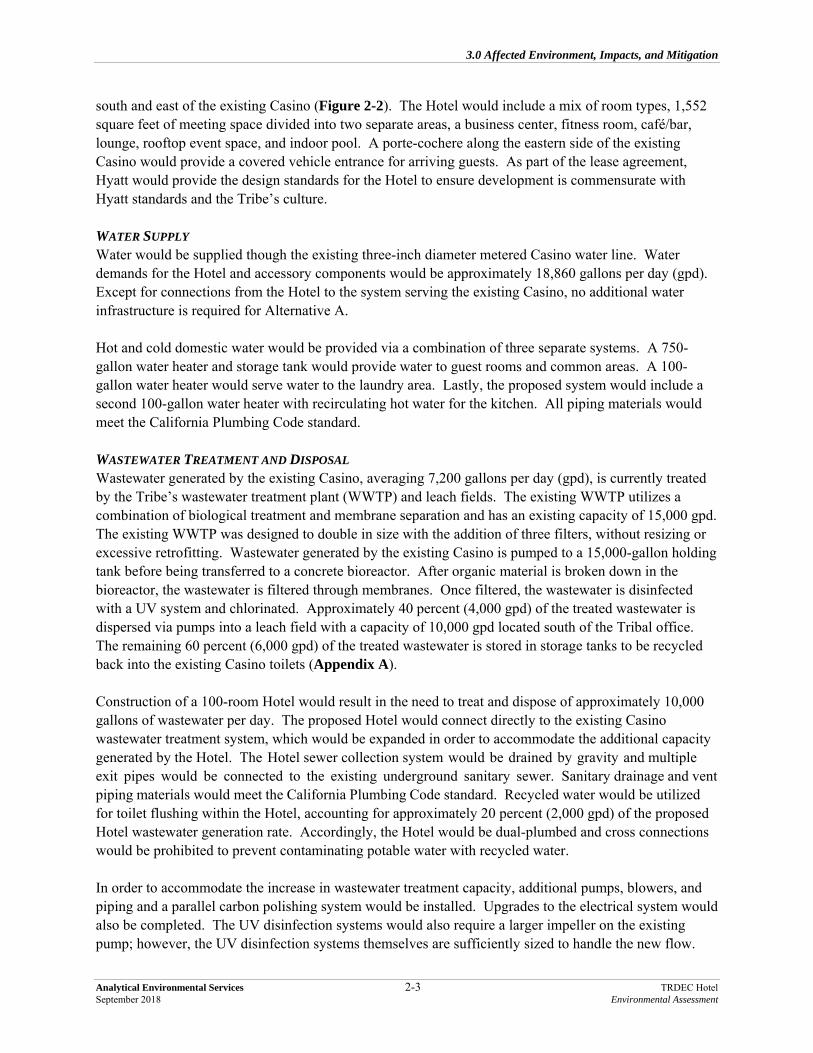
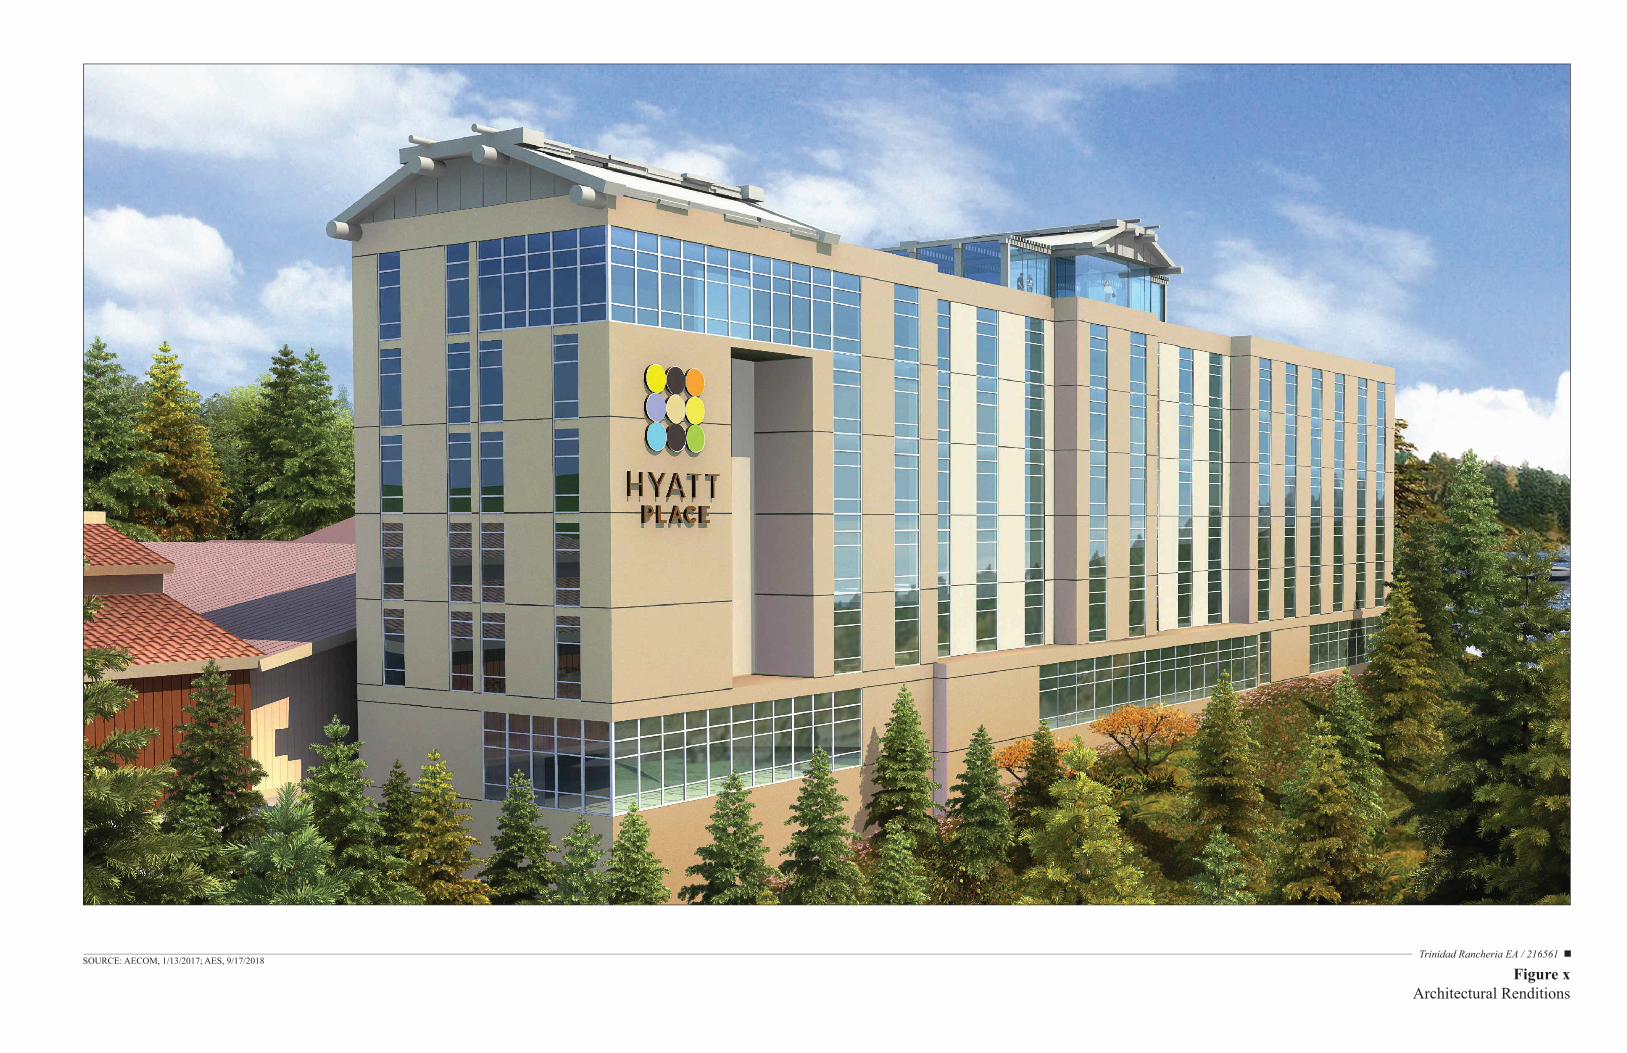
south and east of the existing Casino (Figure 2-2). The Hotel would include a mix of room types, 1,552 square feet of meeting space divided into two separate areas, a business center, fitness room, café/bar, lounge, rooftop event space, and indoor pool. A porte-cochere along the eastern side of the existing Casino would provide a covered vehicle entrance for arriving guests. As part of the lease agreement, Hyatt would provide the design standards for the Hotel to ensure development is commensurate with Hyatt standards and the Tribe’s culture. WATER SUPPLY Water would be supplied though the existing three-inch diameter metered Casino water line. Water demands for the Hotel and accessory components would be approximately 18,860 gallons per day (gpd). Except for connections from the Hotel to the system serving the existing Casino, no additional water infrastructure is required for Alternative A. Hot and cold domestic water would be provided via a combination of three separate systems. A 750-gallon water heater and storage tank would provide water to guest rooms and common areas. A 100-gallon water heater would serve water to the laundry area. Lastly, the proposed system would include a second 100-gallon water heater with recirculating hot water for the kitchen. All piping materials would meet the California Plumbing Code standard. WASTEWATER TREATMENT AND DISPOSAL Wastewater generated by the existing Casino, averaging 7,200 gallons per day (gpd), is currently treated by the Tribe’s wastewater treatment plant (WWTP) and leach fields. The existing WWTP utilizes a combination of biological treatment and membrane separation and has an existing capacity of 15,000 gpd. The existing WWTP was designed to double in size with the addition of three filters, without resizing or excessive retrofitting. Wastewater generated by the existing Casino is pumped to a 15,000-gallon holding tank before being transferred to a concrete bioreactor. After organic material is broken down in the bioreactor, the wastewater is filtered through membranes. Once filtered, the wastewater is disinfected with a UV system and chlorinated. Approximately 40 percent (4,000 gpd) of the treated wastewater is dispersed via pumps into a leach field with a capacity of 10,000 gpd located south of the Tribal office. The remaining 60 percent (6,000 gpd) of the treated wastewater is stored in storage tanks to be recycled back into the existing Casino toilets (Appendix A). Construction of a 100-room Hotel would result in the need to treat and dispose of approximately 10,000 gallons of wastewater per day. The proposed Hotel would connect directly to the existing Casino wastewater treatment system, which would be expanded in order to accommodate the additional capacity generated by the Hotel. The Hotel sewer collection system would be drained by gravity and multiple exit pipes would be connected to the existing underground sanitary sewer. Sanitary drainage and vent piping materials would meet the California Plumbing Code standard. Recycled water would be utilized for toilet flushing within the Hotel, accounting for approximately 20 percent (2,000 gpd) of the proposed Hotel wastewater generation rate. Accordingly, the Hotel would be dual-plumbed and cross connections would be prohibited to prevent contaminating potable water with recycled water. In order to accommodate the increase in wastewater treatment capacity, additional pumps, blowers, and piping and a parallel carbon polishing system would be installed. Upgrades to the electrical system would also be completed. The UV disinfection systems would also require a larger impeller on the existing pump; however, the UV disinfection systems themselves are sufficiently sized to handle the new flow.
Trinidad Rancheria EA / 216561
Figure xArchitectural Renditions
SOURCE: AECOM, 1/13/2017; AES, 9/17/2018
3.0 Affected Environment, Impacts, and Mitigation
Analytical Environmental Services 2-5 TRDEC Hotel September 2018 Environmental Assessment
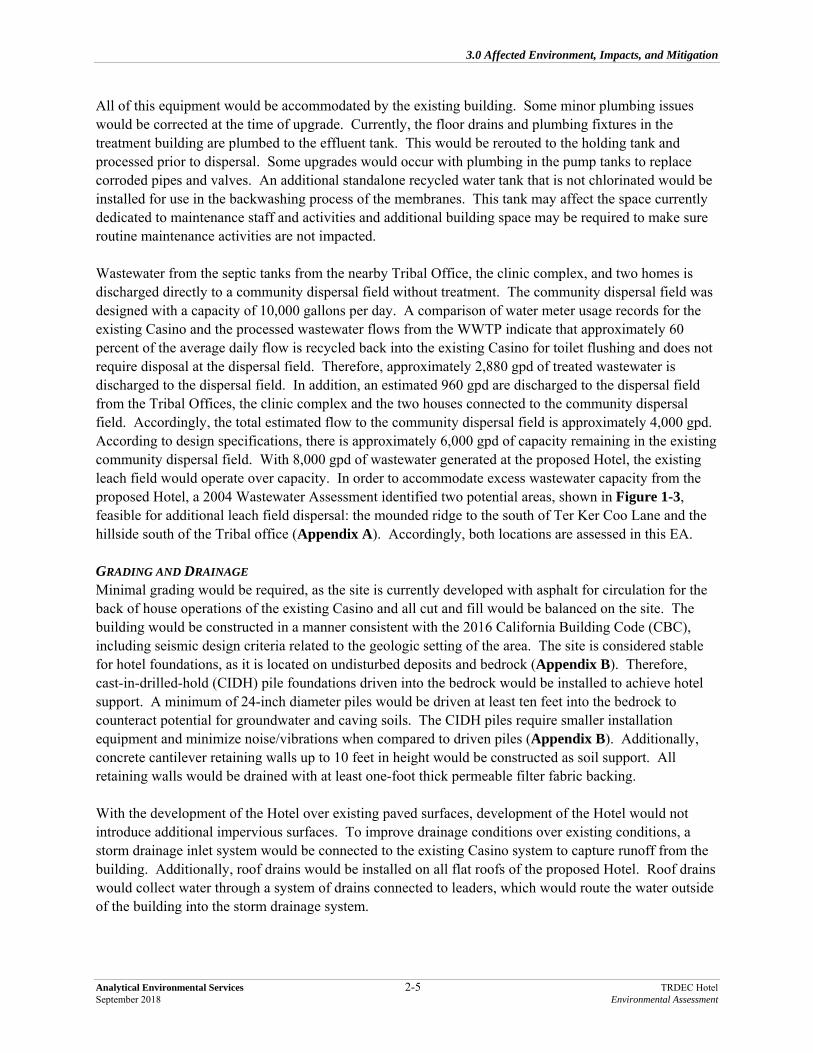
All of this equipment would be accommodated by the existing building. Some minor plumbing issues would be corrected at the time of upgrade. Currently, the floor drains and plumbing fixtures in the treatment building are plumbed to the effluent tank. This would be rerouted to the holding tank and processed prior to dispersal. Some upgrades would occur with plumbing in the pump tanks to replace corroded pipes and valves. An additional standalone recycled water tank that is not chlorinated would be installed for use in the backwashing process of the membranes. This tank may affect the space currently dedicated to maintenance staff and activities and additional building space may be required to make sure routine maintenance activities are not impacted. Wastewater from the septic tanks from the nearby Tribal Office, the clinic complex, and two homes is discharged directly to a community dispersal field without treatment. The community dispersal field was designed with a capacity of 10,000 gallons per day. A comparison of water meter usage records for the existing Casino and the processed wastewater flows from the WWTP indicate that approximately 60 percent of the average daily flow is recycled back into the existing Casino for toilet flushing and does not require disposal at the dispersal field. Therefore, approximately 2,880 gpd of treated wastewater is discharged to the dispersal field. In addition, an estimated 960 gpd are discharged to the dispersal field from the Tribal Offices, the clinic complex and the two houses connected to the community dispersal field. Accordingly, the total estimated flow to the community dispersal field is approximately 4,000 gpd. According to design specifications, there is approximately 6,000 gpd of capacity remaining in the existing community dispersal field. With 8,000 gpd of wastewater generated at the proposed Hotel, the existing leach field would operate over capacity. In order to accommodate excess wastewater capacity from the proposed Hotel, a 2004 Wastewater Assessment identified two potential areas, shown in Figure 1-3, feasible for additional leach field dispersal: the mounded ridge to the south of Ter Ker Coo Lane and the hillside south of the Tribal office (Appendix A). Accordingly, both locations are assessed in this EA. GRADING AND DRAINAGE Minimal grading would be required, as the site is currently developed with asphalt for circulation for the back of house operations of the existing Casino and all cut and fill would be balanced on the site. The building would be constructed in a manner consistent with the 2016 California Building Code (CBC), including seismic design criteria related to the geologic setting of the area. The site is considered stable for hotel foundations, as it is located on undisturbed deposits and bedrock (Appendix B). Therefore, cast-in-drilled-hold (CIDH) pile foundations driven into the bedrock would be installed to achieve hotel support. A minimum of 24-inch diameter piles would be driven at least ten feet into the bedrock to counteract potential for groundwater and caving soils. The CIDH piles require smaller installation equipment and minimize noise/vibrations when compared to driven piles (Appendix B). Additionally, concrete cantilever retaining walls up to 10 feet in height would be constructed as soil support. All retaining walls would be drained with at least one-foot thick permeable filter fabric backing. With the development of the Hotel over existing paved surfaces, development of the Hotel would not introduce additional impervious surfaces. To improve drainage conditions over existing conditions, a storm drainage inlet system would be connected to the existing Casino system to capture runoff from the building. Additionally, roof drains would be installed on all flat roofs of the proposed Hotel. Roof drains would collect water through a system of drains connected to leaders, which would route the water outside of the building into the storm drainage system.
3.0 Affected Environment, Impacts, and Mitigation
Analytical Environmental Services 2-6 TRDEC Hotel September 2018 Environmental Assessment
UTILITIES Natural Gas Natural gas fuel would be provided for gas fired water heaters and kitchen equipment. Natural gas piping materials would meet the California Plumbing Code standards. Electricity The Hotel would obtain a normal power supply via a new utility service. The utility service would be terminated at a metered main electrical service switchboard (MSB). The MSB would be 208Y/120V, three phase, rated 2,500 amps and sized to accommodate all hotel features, including, but not limited to, the building guestroom loads, HVAC equipment, Hotel back of house loads, lighting, general-purpose power receptacles, and kitchen loads. Separate panelboards for lighting, receptacles, and HVAC loads are designed in compliance with California Energy Code, Part 6, Title 24 Section 130.5(a) Electrical Distribution Systems. Hotel electrical distributions would meet the California Energy Code, Part 6 Title 24, as they are enabled to receive and act upon demand response signals. Door and exit lighting would be provided with Integral 90-minute battery back up at guest rooms, public areas, and hotel back of house. LIGHTING Interior All guestroom lighting would be locally switched or, if available, integrated with the Building Management/Guest Card Access Entry System. Interior lighting in all public spaces would be controlled via computerized dimming system and would have equivalency with California Energy Code Title 24 lighting control and power allowance requirements. Additionally, all back of house lighting shall meet California Energy Code Title 24 lighting control and power allowance requirements. Exterior Parking lot lighting would consist of pole-mounted, LED fixtures equipped with motion activated bi-level dimming. Exterior stairwells would be installed with motion sensors activated lights and an emergency battery. All exterior lights would be on a photocell controlled, centralized astronomical digital clock to ensure lights only turn on at night. Additionally, the Hotel would have 90-minute battery for backup lighting to power all emergency door lighting and LED-type illuminated exit signs. Emergency shunt relays would be provided for all areas with switched exit lights. PROJECT CONSTRUCTION The Hotel and accompanying components would be constructed over an eight- to twelve-month period, with an anticipated completion date in the spring to winter of 2020. All staging areas will be located on previously disturbed areas. Construction would involve minimal earthwork, placement of concrete foundations, steel and wood structural framing, masonry, electrical and mechanical work, building finishing, and paving, among other construction trades. Prior to finalization of the grading and development plans for the property, design-level geotechnical specifications addressing the specific grading and development plans would be developed to meet seismic requirements of the IBC. To minimize the risk of fire, all equipment that normally includes a spark arrester would be equipped with an arrester in good working order; structural fire protection would be provided through compliance with California Fire Code and National Fire Alarm Code requirements for commercial structures similar in size to the proposed Hotel; the Tribe would cooperate with the fire district by allowing routine inspections and would ensure that appropriate water supply and pressure is available for emergency fire flows; and typical
3.0 Affected Environment, Impacts, and Mitigation
Analytical Environmental Services 2-7 TRDEC Hotel September 2018 Environmental Assessment
fire flow allowances would be confirmed with the local Fire Marshall prior to construction of any water storage tank. 2.3 ALTERNATIVE B – NO-ACTION ALTERNATIVE Under the No-Action Alternative, DCI and the Division of Real Estate Services would not approve the requested actions. Accordingly, without the guaranteed loan, it is highly unlikely that the Tribe could secure the loan necessary to develop the Hotel. Additionally, without the lease agreement, the costs associated with having to independently design and operate the Hotel would render implementation infeasible for the Tribe. Accordingly, the Hotel and accessory components would not be developed as identified for the benefit of the Tribe under Alternative A. For the purposes of the environmental analysis in this EA, it is assumed that, due to the economic considerations for operating the existing Casino by the Tribe, the property would continue to be utilized in its current state for back of house access to the existing Casino with no additional facilities constructed under this alternative. 2.4 COMPARISON OF THE PROJECT ALTERNATIVES
ALTERNATIVE A
Alternative A would result in significant but mitigable environmental impacts in the following areas:
Land Resources Biological Resources Cultural Resources Traffic Noise Visual Resources
Of the project alternatives evaluated, Alternative A would best meet the Tribe’s objectives by providing the Tribe with a Hotel for the benefit of the Tribe and visiting patrons and community while minimizing or eliminating adverse environmental impacts.
ALTERNATIVE B
While the No-Action Alternative would not result in any of the environmental effects identified for Alternative A, this alternative would not meet the Tribe’s objectives of exercising tribal sovereign self-reliance and enhance the well-being of tribal resources; further, this alternative would not meet the Tribe’s goal to fulfill self-reliance and promote the future of economic stability and development for the Tribe.
Analytical Environmental Services 3-1 TRDEC Hotel September 2018 Environmental Assessment
SECTION 3.0 AFFECTED ENVIRONMENT, IMPACTS, AND MITIGATION FOR THE ALTERNATIVES CONSIDERED
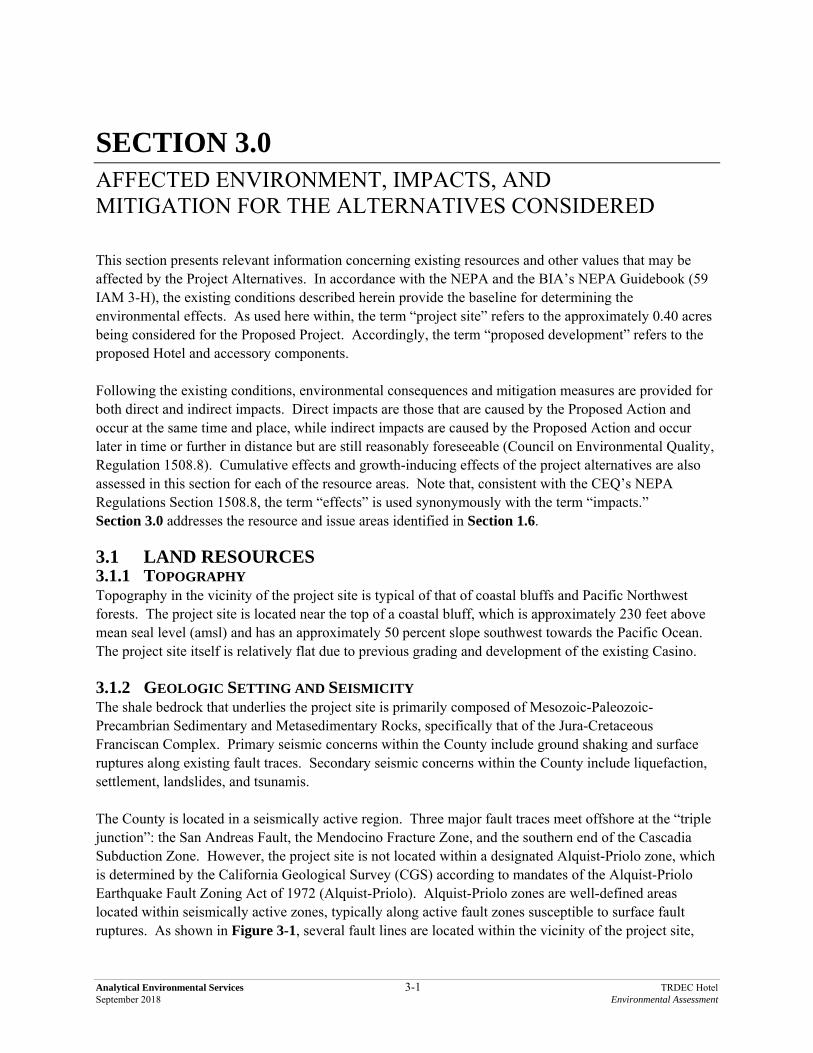
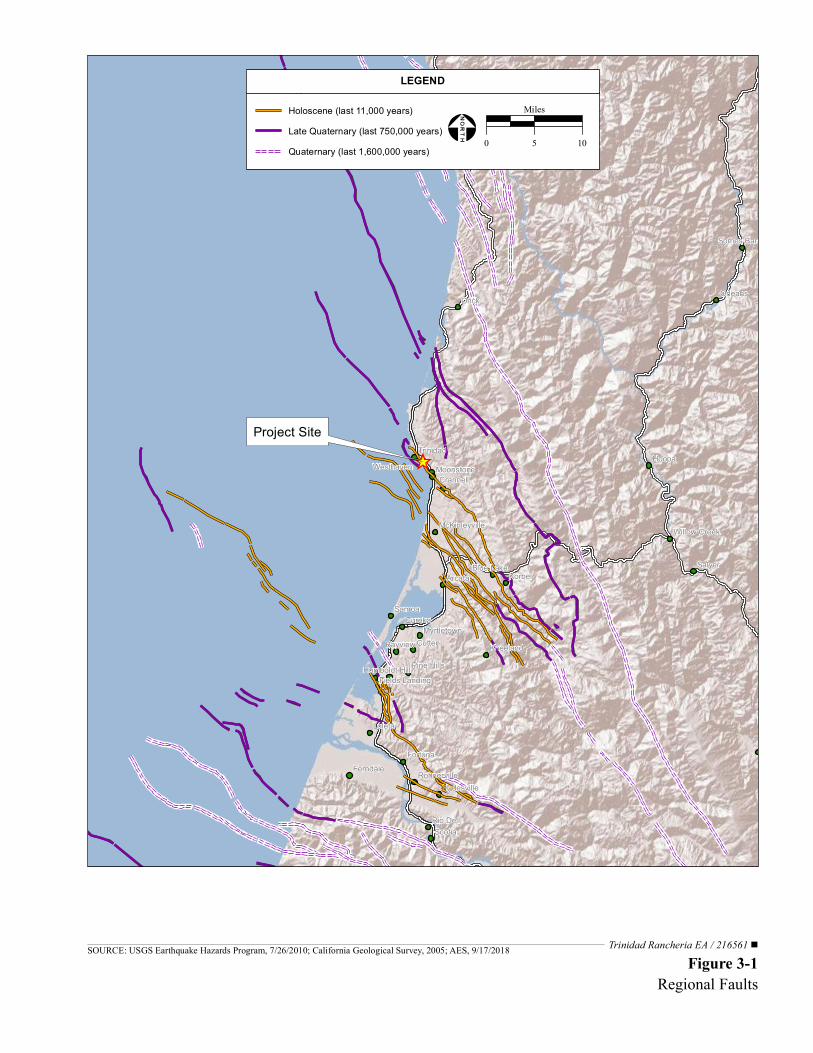
This section presents relevant information concerning existing resources and other values that may be affected by the Project Alternatives. In accordance with the NEPA and the BIA’s NEPA Guidebook (59 IAM 3-H), the existing conditions described herein provide the baseline for determining the environmental effects. As used here within, the term “project site” refers to the approximately 0.40 acres being considered for the Proposed Project. Accordingly, the term “proposed development” refers to the proposed Hotel and accessory components. Following the existing conditions, environmental consequences and mitigation measures are provided for both direct and indirect impacts. Direct impacts are those that are caused by the Proposed Action and occur at the same time and place, while indirect impacts are caused by the Proposed Action and occur later in time or further in distance but are still reasonably foreseeable (Council on Environmental Quality, Regulation 1508.8). Cumulative effects and growth-inducing effects of the project alternatives are also assessed in this section for each of the resource areas. Note that, consistent with the CEQ’s NEPA Regulations Section 1508.8, the term “effects” is used synonymously with the term “impacts.” Section 3.0 addresses the resource and issue areas identified in Section 1.6. 3.1 LAND RESOURCES 3.1.1 TOPOGRAPHY Topography in the vicinity of the project site is typical of that of coastal bluffs and Pacific Northwest forests. The project site is located near the top of a coastal bluff, which is approximately 230 feet above mean seal level (amsl) and has an approximately 50 percent slope southwest towards the Pacific Ocean. The project site itself is relatively flat due to previous grading and development of the existing Casino. 3.1.2 GEOLOGIC SETTING AND SEISMICITY The shale bedrock that underlies the project site is primarily composed of Mesozoic-Paleozoic-Precambrian Sedimentary and Metasedimentary Rocks, specifically that of the Jura-Cretaceous Franciscan Complex. Primary seismic concerns within the County include ground shaking and surface ruptures along existing fault traces. Secondary seismic concerns within the County include liquefaction, settlement, landslides, and tsunamis. The County is located in a seismically active region. Three major fault traces meet offshore at the “triple junction”: the San Andreas Fault, the Mendocino Fracture Zone, and the southern end of the Cascadia Subduction Zone. However, the project site is not located within a designated Alquist-Priolo zone, which is determined by the California Geological Survey (CGS) according to mandates of the Alquist-Priolo Earthquake Fault Zoning Act of 1972 (Alquist-Priolo). Alquist-Priolo zones are well-defined areas located within seismically active zones, typically along active fault zones susceptible to surface fault ruptures. As shown in Figure 3-1, several fault lines are located within the vicinity of the project site,
Trinidad Rancheria EA / 216561
Project SiteHoopa
Samoa
Orick
Requa
Salyer
Cutten
Eureka
KorbelArcata
Scotia
Loleta
Orleans
Bayview
Klamath
Fortuna
Kneeland
Crannell
Trinidad
Rio Dell
Ferndale
Somes Bar
MoonstoneWesthaven
Blue Lake
Myrtletown
Hydesville
Pine Hills
Rohnerville
Willow CreekMcKinleyville
Humboldt HillFields Landing
Figure 3-1Regional Faults
SOURCE: USGS Earthquake Hazards Program, 7/26/2010; California Geological Survey, 2005; AES, 9/17/2018
HISHoloscene (last 11,000 years)Late Quaternary (last 750,000 years)Quaternary (last 1,600,000 years)
LEGEND
0 5 10
Miles
3.0 Affected Environment, Impacts, and Mitigation
Analytical Environmental Services 3-3 TRDEC Hotel September 2018 Environmental Assessment
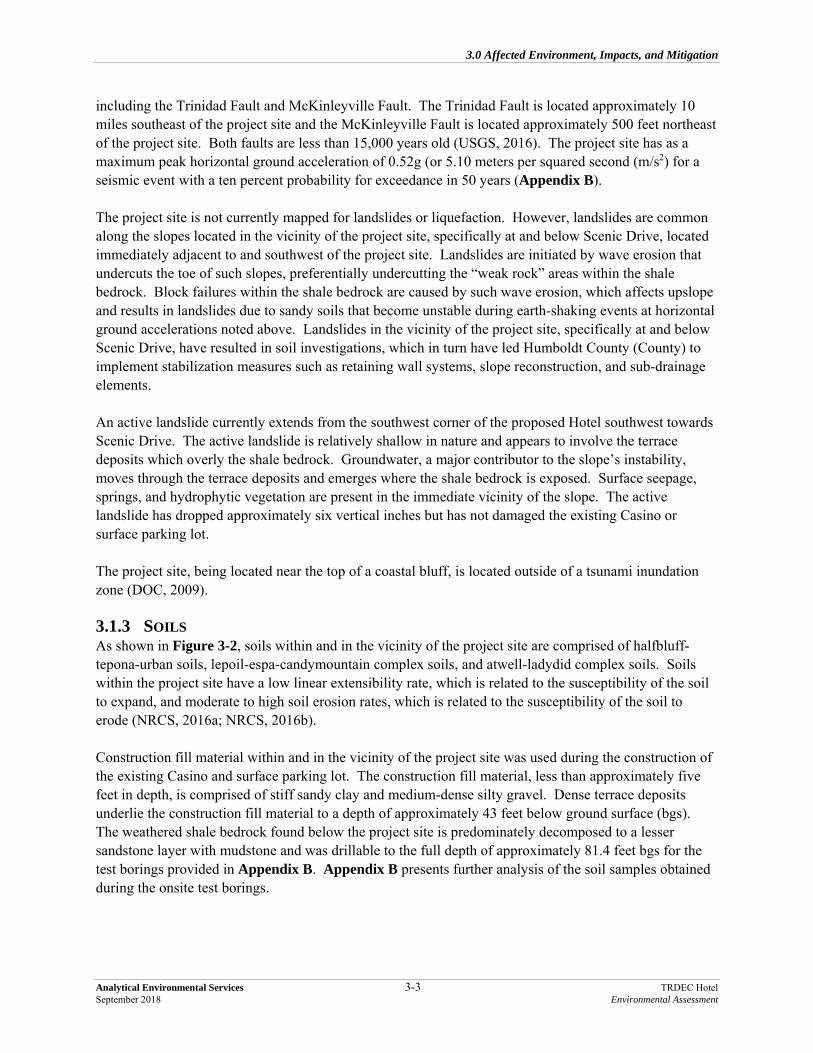
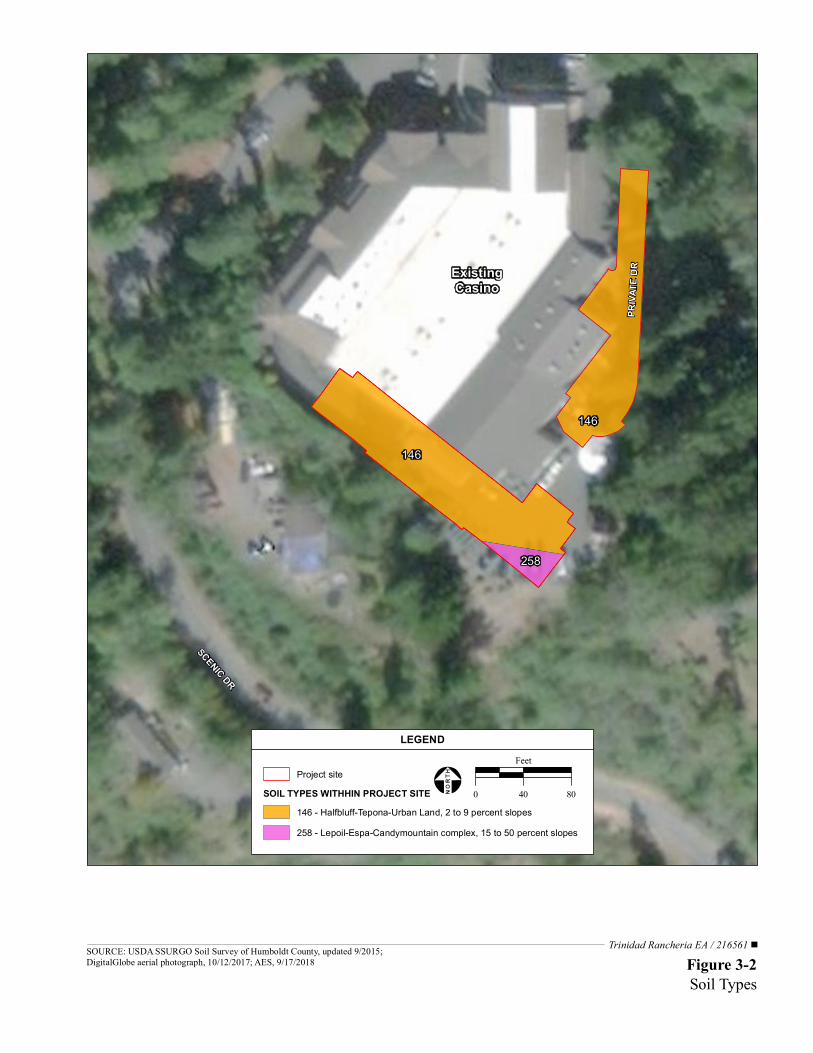
including the Trinidad Fault and McKinleyville Fault. The Trinidad Fault is located approximately 10 miles southeast of the project site and the McKinleyville Fault is located approximately 500 feet northeast of the project site. Both faults are less than 15,000 years old (USGS, 2016). The project site has as a maximum peak horizontal ground acceleration of 0.52g (or 5.10 meters per squared second (m/s2) for a seismic event with a ten percent probability for exceedance in 50 years (Appendix B). The project site is not currently mapped for landslides or liquefaction. However, landslides are common along the slopes located in the vicinity of the project site, specifically at and below Scenic Drive, located immediately adjacent to and southwest of the project site. Landslides are initiated by wave erosion that undercuts the toe of such slopes, preferentially undercutting the “weak rock” areas within the shale bedrock. Block failures within the shale bedrock are caused by such wave erosion, which affects upslope and results in landslides due to sandy soils that become unstable during earth-shaking events at horizontal ground accelerations noted above. Landslides in the vicinity of the project site, specifically at and below Scenic Drive, have resulted in soil investigations, which in turn have led Humboldt County (County) to implement stabilization measures such as retaining wall systems, slope reconstruction, and sub-drainage elements. An active landslide currently extends from the southwest corner of the proposed Hotel southwest towards Scenic Drive. The active landslide is relatively shallow in nature and appears to involve the terrace deposits which overly the shale bedrock. Groundwater, a major contributor to the slope’s instability, moves through the terrace deposits and emerges where the shale bedrock is exposed. Surface seepage, springs, and hydrophytic vegetation are present in the immediate vicinity of the slope. The active landslide has dropped approximately six vertical inches but has not damaged the existing Casino or surface parking lot. The project site, being located near the top of a coastal bluff, is located outside of a tsunami inundation zone (DOC, 2009). 3.1.3 SOILS As shown in Figure 3-2, soils within and in the vicinity of the project site are comprised of halfbluff-tepona-urban soils, lepoil-espa-candymountain complex soils, and atwell-ladydid complex soils. Soils within the project site have a low linear extensibility rate, which is related to the susceptibility of the soil to expand, and moderate to high soil erosion rates, which is related to the susceptibility of the soil to erode (NRCS, 2016a; NRCS, 2016b). Construction fill material within and in the vicinity of the project site was used during the construction of the existing Casino and surface parking lot. The construction fill material, less than approximately five feet in depth, is comprised of stiff sandy clay and medium-dense silty gravel. Dense terrace deposits underlie the construction fill material to a depth of approximately 43 feet below ground surface (bgs). The weathered shale bedrock found below the project site is predominately decomposed to a lesser sandstone layer with mudstone and was drillable to the full depth of approximately 81.4 feet bgs for the test borings provided in Appendix B. Appendix B presents further analysis of the soil samples obtained during the onsite test borings.
ExistingCasino
146
258
146
SCENIC DR
PRIVA
TE D
R
Figure 3-2Soil Types
SOURCE: USDA SSURGO Soil Survey of Humboldt County, updated 9/2015; DigitalGlobe aerial photograph, 10/12/2017; AES, 9/17/2018
LEGEND
Project siteSOIL TYPES WITHHIN PROJECT SITE
146 - Halfbluff-Tepona-Urban Land, 2 to 9 percent slopes258 - Lepoil-Espa-Candymountain complex, 15 to 50 percent slopes
Trinidad Rancheria EA / 216561
0 40 80
Feet
3.0 Affected Environment, Impacts, and Mitigation
Analytical Environmental Services 3-5 TRDEC Hotel September 2018 Environmental Assessment
3.1.4 MINERAL RESOURCES The County has more than 32 permitted and active hard rock quarries (County of Humboldt, 2007a) and more than 90 extraction sites that produce sand, gravel, metals, stone, and clay. The majority of extraction activities within the County involves sand and gravel extractions along the Mad River, Eel River-Van Duzen River complex, Willow Creek, and Trinity River. Trinidad Quarry, located approximately 2.1 miles northeast of the project site, is the closest extraction site to the project site (USGS, 2003). No known mineral resources exist within the project site. 3.1.5 IMPACTS TO LAND RESOURCES Alternative A would result in significant effects to land resources if construction or operation causes significant alterations to the site topography, significant soil erosion, or limits access to mineral resources of regional significance. Alternative A would also result in significant effects to land resources if geological/soil hazards associated with the existing setting would pose limitations to the development of Alternative A or pose a significant health hazard to new habitable structures. TOPOGRAPHY Alternative A would not result in substantial changes to the topography of the project site. Development within the project site, which is relatively flat in nature due to previous grading and development of the existing Casino, would be limited to the existing surface parking lot (Figure 2-1). GEOLOGIC SETTING AND SEISMICITY The County is located in a seismically active region (Figure 3-1). Alquist-Priolo mandates that human occupancy be set back at a minimum of 50 feet from an active fault; the Proposed Project is located outside the 50-foot setback boundary and there is little chance of an active fault on the project site (Appendix B). The active landslide that currently extends from the southwest corner of the proposed Hotel southwest towards Scenic Drive has the potential to affect the foundation of the proposed Hotel. However, the active landslide is relatively shallow in nature and may be readily stabilized utilizing measures such as retaining wall systems, slope reconstruction, and sub-drainage elements (Section 3.1.6). In order to reduce damage from tsunamis, the City’s Draft General Plan designates all areas less than 20 feet above mean sea level (amsl) as Open Space or Special Environment (City of Trinidad, 2012). The project site, being located near the top of a coastal bluff at approximately 230 feet amsl, is located outside of a tsunami inundation zone and is therefore not designated as a Special Environment. SOILS Excavation activities for construction of the proposed Hotel within the project site have the potential to expose soils and increase the susceptibility of such soils to erode. However, construction fill material was used within and in the vicinity of the project site during the construction of the existing Casino and surface parking lot and therefore implementation of Alternative A would not result in significant effects due to soil erosion. Additionally, liquefaction is not anticipated to occur unless sustained high groundwater levels are identified within terrace deposits which overly the shale bedrock (Appendix B).
3.0 Affected Environment, Impacts, and Mitigation
Analytical Environmental Services 3-6 TRDEC Hotel September 2018 Environmental Assessment
MINERAL RESOURCES Excavation activities for construction of the proposed Hotel within the project site are not anticipated to result in a loss of economically-viable aggregate rock or to diminish the extraction of important ores or minerals. No known mineral resources exist within the project site and there are no abandoned mines, shafts, or tailings within or in the vicinity of the project site. Therefore development and use of the land would not affect extraction activities of known mineral resources of importance to the surrounding community. Alternative B Under the No Action Alternative, the project site would remain undeveloped. No mitigation required. 3.1.6 MITIGATION MEASURES
Prior to construction of the Hotel foundation, the contractor shall implement one of the slope stabilization options recommended by the soil engineers in the Draft Geotechnical Feasibility and Preliminary Design Report (Appendix B). Options include soil nail walls, reconstructed embankment, solider pile, and welded wire walls.
3.2 WATER RESOURCES
The following section describes the existing surface water, drainage, flooding, water supply, groundwater, and water quality conditions at the project site. 3.2.1 SURFACE WATER, DRAINAGE, AND FLOODING WATERSHEDS AND HYDROLOGY The project site is located within the Luffenholtz Creek-Frontal Pacific Ocean sub-watershed of the Trinidad Hydrological Unit (HU). Mill Creek, McConnahas Mill Creek, and Luffenholtz Creek are located within the Trinidad HU, flow southwest, and eventually discharge into the Pacific Ocean. Mill Creek is located just north of the City and McConnahas Mill Creek is located immediately adjacent to the northern boundary of the Trinidad Rancheria. Luffenholtz Creek’s headwaters are located northeast of the project site and discharge into the Trinidad Bay of the Pacific Ocean located approximately 1.4 miles south of the project site. CITY WATER SUPPLY Historically, homes within the City had individual wells or have been served from Mill Creek and Luffenholtz Creek. Currently, the City’s water supply system serves approximately 315 connections, including connections to Tribal enterprises. The City has a permitted water use rate of 355,392 gallons per day (gpd), of which the City is using approximately 23 percent (Buckman, 2017). DRAINAGE The project site has slopes which range from approximately zero to five percent. Runoff within the surface parking lot occurs as sheet flow and follows the topography southwest towards on-site detention basins and swales constructed during the development of the existing Casino. The project site and surrounding lands do not directly contribute surface water to the Luffenholtz Creek-Frontal Pacific Ocean sub-watershed; rather, overland flow drains via stormwater outlets into the Pacific Ocean.
3.0 Affected Environment, Impacts, and Mitigation
Analytical Environmental Services 3-7 TRDEC Hotel September 2018 Environmental Assessment
FLOODING The Federal Emergency Management Agency (FEMA) is responsible for assessing the potential for flooding by updating and issuing Flood Insurance Rate Maps (FIRM), which depict various levels of predicted inundation. FEMA has not completed an analysis of flood hazards within the City and therefore a FEMA FIRM is not available (FEMA, 2016). However, FEMA is in agreement with the City that due to the City’s steep slopes, the potential for flooding within the City is nonexistent and therefore flood mapping is unnecessary (City of Trinidad, 2012). 3.2.2 GROUNDWATER The project site is located within the minor Mad-Redwood Big Lagoon Area Basin groundwater basin, which is comprised of the Mad River, Redwood Creek, Eureka Plain, and Trinidad planning watersheds totaling approximately 34,000 acres (County of Humboldt, 2002). These planning watersheds are located within the California Coast Ranges and are mainly comprised of highly unstable, easily erodible rocks which contribute to high levels of sediment in its water features (County of Humboldt, 2002). The average annual runoff that percolates into the combined basin is approximately 1,000,000-acre feet (AF). No groundwater wells supply water within the project site; however, monitoring wells were installed as part of the geotechnical studies investigated in Appendix B. Groundwater was originally measured at approximately 16.5 feet bgs, but has since risen to approximately 12.0 feet bgs. On-site groundwater levels are measured weekly and results indicate that groundwater is seasonally present within the terrace deposits near the shale bedrock. 3.2.3 WATER QUALITY Water is supplied to facilities within the project site by the City, and so water quality is assured by existing City systems. 3.2.4 IMPACTS TO WATER RESOURCES ALTERNATIVE A Alternative A would result in significant effects to water resources if construction or operation would result in off-site flooding, floodplain management, and/or cause an exceedance of applicable water quality criteria, result in a significant decline in groundwater levels, a significant decline in groundwater recharge rates, and/or cause an exceedance of applicable groundwater quality criteria. Surface Water, Drainage, and Flooding Development of the proposed Hotel within the existing surface parking lot would result in no net increase in impervious surfaces. Surface water would continue to follow the topography southwest towards on-site detention basins and swales constructed for the Casino. Roof drains installed on the proposed Hotel would route the water into the storm drainage system. FEMA has determined that the potential for flooding is nonexistent and therefore flood mapping is unnecessary (City of Trinidad, 2012). Water and Groundwater Supplies Water supply is described in Section 2.2.1; the City’s water supply system would serve the proposed Hotel’s water needs through existing connections.
3.0 Affected Environment, Impacts, and Mitigation
Analytical Environmental Services 3-8 TRDEC Hotel September 2018 Environmental Assessment
Wastewater Treatment and Disposal As described in Section 2.2.1, primary treatment of wastewater would be provided by the Tribe’s existing WWTF and expanded leach fields. Water Quality Construction activities may include excavation, which has the potential to result in the erosion of topsoil, potentially increasing sediment discharge into nearby waterbodies and degrading water quality. Construction activities may also include the routine use of potentially hazardous materials such as concrete washings, oil, and grease, which could spill onto the ground and runoff with stormwater. These effects would be reduced to less than significant with the incorporation of Best Management Practices (BMPs) provided in Appendix C. 3.2.5 MITIGATION MEASURES ALTERNATIVE A With the incorporation of the BMPs provided in Appendix C, construction materials would not reach surface waters and effects to water quality as a result of construction activities would be less than significant. No mitigation required. ALTERNATIVE B Under the No Action Alternative, the project site would remain undeveloped. No mitigation required. 3.3 AIR QUALITY AND GREENHOUSE GASSES The Regulatory Context for Air Quality and Greenhouse Gasses is included in Appendix D. 3.3.1 EXISTING AIR QUALITY CONDITIONS The project site is located in the North Coast Air Basin (NCAB), which extends for approximately 250 miles from Sonoma County in the south to the Oregon border in the north and east through Trinity County. The climate of the NCAB is influenced by the Klamath Mountains and the Coast Range provinces. The coastal plains, which are part of the Coast Range province, constitute less than 10 percent of the area of the NCAB but contain the major industrial and population centers. The project site is located on the edge of the coastal plain in the foothills of the Klamath Mountains. 3.3.2 REGIONAL AIR QUALITY NATIONAL AMBIENT AIR QUALITY STANDARDS (NAAQS) DESIGNATIONS The NCAB is in attainment or is unclassified for all criteria air pollutants (CAPs) under the current NAAQS designation (USEPA, 2016). Pollutants of concern are CAPs, or CAP precursors (NOx and ROG), that are present in quantities exceeding the NAAQS in the applicable air basin or region. No CAPs exceed the NAAQS in NCAB (USEPA, 2016), and therefore, pollutants of concern are not present in the NCAB. Major hazardous sources are defined as stationary sources with potential to emit more than 10 tons per year (tpy) of any hazardous air pollutants (HAP) or more than 25 tpy of any combination of HAPs. The current operations at the project site do not meet this threshold.
CLIMATE CHANGE
The impacts of climate change could be both global and regional (IPCC, 2013). Development projects typically result in an increase in GHG emissions due to increases in mobile sources (trips generated), area sources (facility components or operations that directly emit GHGs), and indirect sources related to
3.0 Affected Environment, Impacts, and Mitigation
Analytical Environmental Services 3-9 TRDEC Hotel September 2018 Environmental Assessment
electrical power consumption. To provide a comparative analysis between sources of GHGs, the carbon dioxide equivalent (CO2e) of each GHG is assessed. To calculate total GHG emissions for a source, estimated emissions for each GHG are multiplied by the corresponding CO2e value and the converted values are then summed for a total CO2e emissions rate. 3.3.3 SENSITIVE RECEPTORS Sensitive receptors are facilities that house or attract children, the elderly, and people with illnesses or others who are especially sensitive to the effects of air pollutants. Hospitals, schools, convalescent facilities, and residential areas are examples of sensitive receptors. The project site is surrounded by rural residential areas to the south, east and west, with Tribal buildings and the Casino directly adjacent to the northwest. A single-family rural residence, located on-Reservation approximately 75 feet south of the project site, is the nearest sensitive receptor. The nearest off-Reservation sensitive receptor is a single-family rural residence approximately 165 feet east of the project site. The nearest school, Trinidad Elementary School, is located approximately 0.9 miles north of the project site. 3.3.4 IMPACTS TO AIR QUALITY ALTERNATIVE A Criteria and Hazardous Air Pollutants Adverse effects to ambient air quality would result if either construction or operation of the Proposed Project would result in non-conformance to an applicable State Implementation Plan (SIP) for NAAQS compliance or result in emissions of significant levels that would adversely affect the air quality of a federal Class I area. However, the project site is located within an air basin that is classified as attainment/unclassified for all the CAPs and the least stringent de minimis thresholds from the General Conformity rule have been selected as impact criteria for project evaluation. Project-related air quality impacts fall into two categories: short-term impacts due to construction and long-term impacts due to project operation. Short-term construction activities would result in the generation of particulate matter (≤ 10 microns and ≤ 2.5 microns in diameter PM10 and PM2.5) from grading and demolition activities and ROG, NOx, and CO from diesel-fired construction equipment. Long-term operation of the Proposed Project would result in motor vehicle use. Motor vehicle use would contribute to ozone, the significance of which is determined through the generation of ROG, NOx, and CO pollution. Construction emissions for the Proposed Project were estimated using California Emissions Estimator Model (CalEEMod), which is the latest version of the air quality model approved by the USEPA for use in California. CalEEMod provides default values when site-specific inputs are not available. Construction is assumed to begin in 2019 and continue for eight to 12 months. The following site-specific traffic inputs and assumptions were used for the purposes of air quality modeling:
Construction will occur an average of 22 days per month. Construction will result in a maximum disturbance of 0.40 acres. CalEEMod default construction equipment list was used. The Proposed Project includes construction of a 100-room Hotel.
Default input values for the model included CalEEMod defaults and site-specific data are provided in Appendix E.
3.0 Affected Environment, Impacts, and Mitigation
Analytical Environmental Services 3-10 TRDEC Hotel September 2018 Environmental Assessment
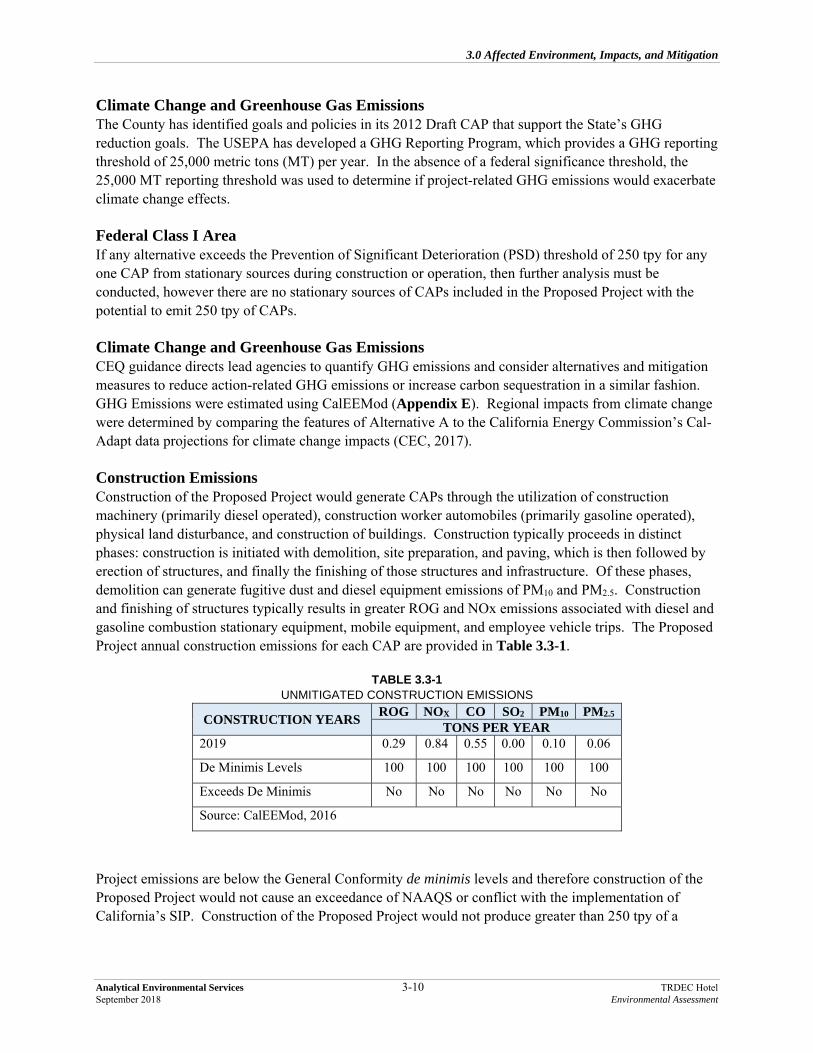
Climate Change and Greenhouse Gas Emissions The County has identified goals and policies in its 2012 Draft CAP that support the State’s GHG reduction goals. The USEPA has developed a GHG Reporting Program, which provides a GHG reporting threshold of 25,000 metric tons (MT) per year. In the absence of a federal significance threshold, the 25,000 MT reporting threshold was used to determine if project-related GHG emissions would exacerbate climate change effects. Federal Class I Area If any alternative exceeds the Prevention of Significant Deterioration (PSD) threshold of 250 tpy for any one CAP from stationary sources during construction or operation, then further analysis must be conducted, however there are no stationary sources of CAPs included in the Proposed Project with the potential to emit 250 tpy of CAPs. Climate Change and Greenhouse Gas Emissions CEQ guidance directs lead agencies to quantify GHG emissions and consider alternatives and mitigation measures to reduce action-related GHG emissions or increase carbon sequestration in a similar fashion. GHG Emissions were estimated using CalEEMod (Appendix E). Regional impacts from climate change were determined by comparing the features of Alternative A to the California Energy Commission’s Cal-Adapt data projections for climate change impacts (CEC, 2017). Construction Emissions Construction of the Proposed Project would generate CAPs through the utilization of construction machinery (primarily diesel operated), construction worker automobiles (primarily gasoline operated), physical land disturbance, and construction of buildings. Construction typically proceeds in distinct phases: construction is initiated with demolition, site preparation, and paving, which is then followed by erection of structures, and finally the finishing of those structures and infrastructure. Of these phases, demolition can generate fugitive dust and diesel equipment emissions of PM10 and PM2.5. Construction and finishing of structures typically results in greater ROG and NOx emissions associated with diesel and gasoline combustion stationary equipment, mobile equipment, and employee vehicle trips. The Proposed Project annual construction emissions for each CAP are provided in Table 3.3-1.
TABLE 3.3-1 UNMITIGATED CONSTRUCTION EMISSIONS
CONSTRUCTION YEARS ROG NOX CO SO2 PM10 PM2.5
TONS PER YEAR 2019 0.29 0.84 0.55 0.00 0.10 0.06
De Minimis Levels 100 100 100 100 100 100
Exceeds De Minimis No No No No No No
Source: CalEEMod, 2016
Project emissions are below the General Conformity de minimis levels and therefore construction of the Proposed Project would not cause an exceedance of NAAQS or conflict with the implementation of California’s SIP. Construction of the Proposed Project would not produce greater than 250 tpy of a

3.0 Affected Environment, Impacts, and Mitigation
Analytical Environmental Services 3-11 TRDEC Hotel September 2018 Environmental Assessment
regulated pollutant and therefore the Proposed Project is not classified as a major source under the Prevention of Significant Deterioration (PSD) program and no pre-construction review is required. Operational Emissions Operational emissions would primarily be comprised of mobile emissions associated with hotel patron’s motor vehicle use, though area and energy source emissions associated with maintenance equipment, space heaters, and water heaters would also contribute to operational emissions. Default assumptions for trip generation rate, trip lengths, average trip speeds, and vehicle fleet for residential land uses in CalEEMod were used to estimate project-related criteria emissions for the build-out year of 2020. Table 3.3-2 summarizes project-related area, energy, and mobile source emissions. Project emissions are below the General Conformity de minimis levels and therefore operation of the Proposed Project would not cause an exceedance of NAAQS or conflict with the implementation of California’s SIP. As with construction, operation of the Proposed Project would not be classified as a major source under the PSD program and no further review is required.
TABLE 3.3-2 UNMITIGATED OPERATIONAL EMISSIONS
SOURCES ROG NOX CO SO2 PM10 PM2.5
TONS PER YEARArea 0.09 0.00 0.00 0.00 0.00 0.00
Energy 0.00 0.02 0.02 0.00 0.00 0.00
Mobile 0.59 3.89 8.78 0.02 1.23 0.36
Total Operational Emissions 0.68 3.91 8.79 0.02 1.23 0.36
De Minimis Level 100 100 100 100 100 100
Exceeds De Minimis No No No No No No
Source: CalEEMod, 2016
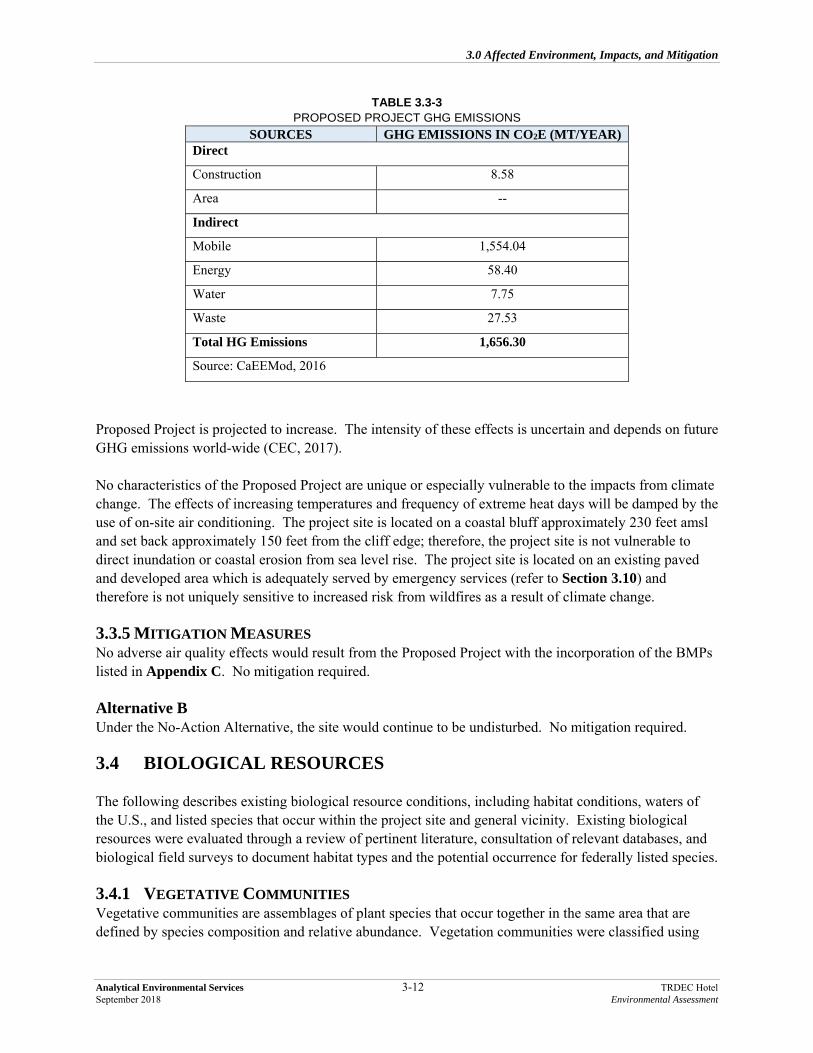
Climate Change and Greenhouse Gas Emissions As shown in Table 3.3-3, construction and operation of the Proposed Project will result in GHG emission of approximately 1,656 metric tons (MT) annually. These emissions equate to less than approximately 0.13 percent of total county-wide emissions in the most recent inventory (County of Humboldt, 2012a). As a result, no significant impacts concerning global climate change would occur as a result of implementation of Alternative A. The 2016 CEQ guidance states that projects subject to NEPA should also analyze the effect of climate change on the project. Average temperature in the City could increase by approximately 2.8° F to 5.1° F by the 2080s, resulting in an increase in projected extreme heat days. Sea level rise is likely to increase by approximately 18 percent in the County and could lead to increased coastal erosion on the cliffs south of the Proposed Project. Additionally, the wildfire risk in the mixed conifer forest adjacent to the
3.0 Affected Environment, Impacts, and Mitigation
Analytical Environmental Services 3-12 TRDEC Hotel September 2018 Environmental Assessment
TABLE 3.3-3 PROPOSED PROJECT GHG EMISSIONS
SOURCES GHG EMISSIONS IN CO2E (MT/YEAR) Direct
Construction 8.58
Area --
Indirect
Mobile 1,554.04
Energy 58.40
Water 7.75
Waste 27.53
Total HG Emissions 1,656.30
Source: CaEEMod, 2016
Proposed Project is projected to increase. The intensity of these effects is uncertain and depends on future GHG emissions world-wide (CEC, 2017). No characteristics of the Proposed Project are unique or especially vulnerable to the impacts from climate change. The effects of increasing temperatures and frequency of extreme heat days will be damped by the use of on-site air conditioning. The project site is located on a coastal bluff approximately 230 feet amsl and set back approximately 150 feet from the cliff edge; therefore, the project site is not vulnerable to direct inundation or coastal erosion from sea level rise. The project site is located on an existing paved and developed area which is adequately served by emergency services (refer to Section 3.10) and therefore is not uniquely sensitive to increased risk from wildfires as a result of climate change. 3.3.5 MITIGATION MEASURES No adverse air quality effects would result from the Proposed Project with the incorporation of the BMPs listed in Appendix C. No mitigation required. Alternative B Under the No-Action Alternative, the site would continue to be undisturbed. No mitigation required. 3.4 BIOLOGICAL RESOURCES The following describes existing biological resource conditions, including habitat conditions, waters of the U.S., and listed species that occur within the project site and general vicinity. Existing biological resources were evaluated through a review of pertinent literature, consultation of relevant databases, and biological field surveys to document habitat types and the potential occurrence for federally listed species. 3.4.1 VEGETATIVE COMMUNITIES Vegetative communities are assemblages of plant species that occur together in the same area that are defined by species composition and relative abundance. Vegetation communities were classified using
3.0 Affected Environment, Impacts, and Mitigation
Analytical Environmental Services 3-13 TRDEC Hotel September 2018 Environmental Assessment
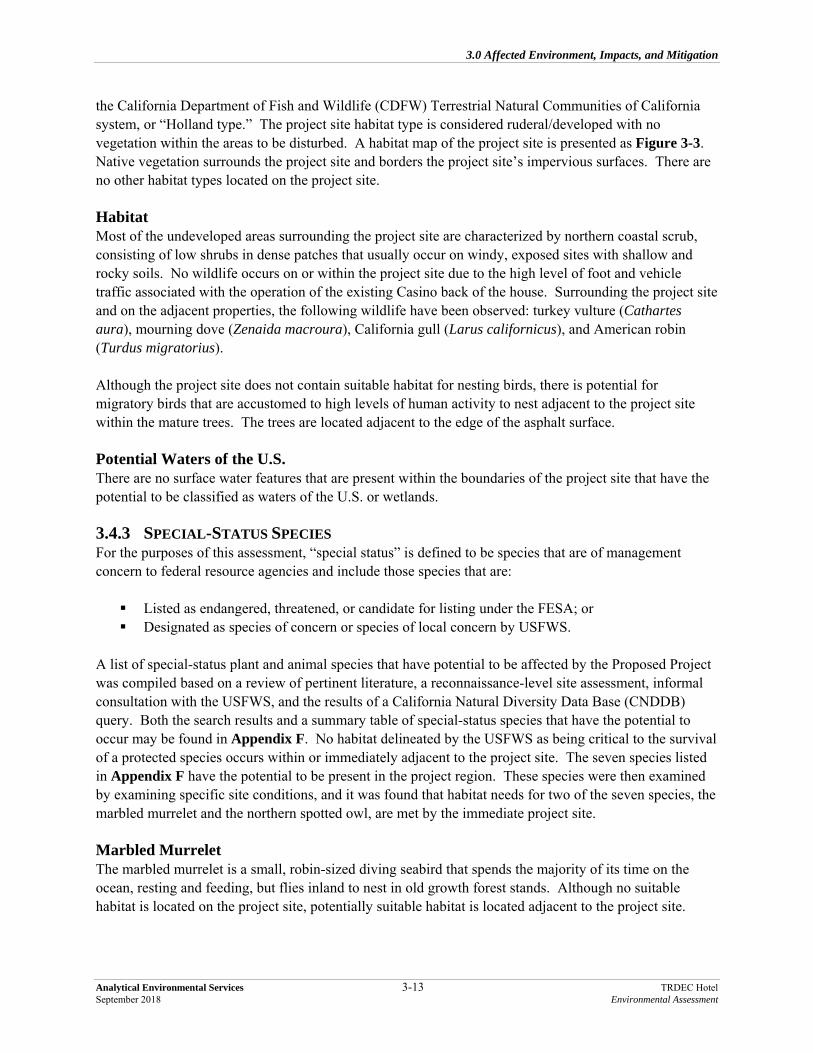
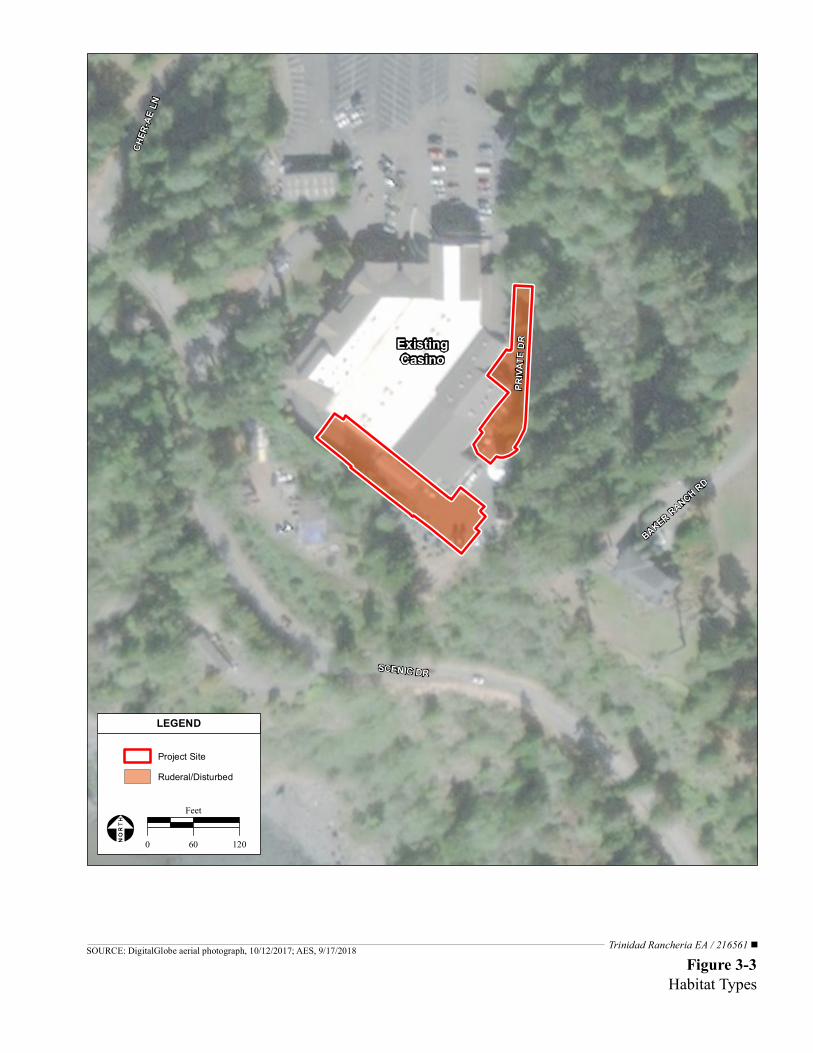
the California Department of Fish and Wildlife (CDFW) Terrestrial Natural Communities of California system, or “Holland type.” The project site habitat type is considered ruderal/developed with no vegetation within the areas to be disturbed. A habitat map of the project site is presented as Figure 3-3. Native vegetation surrounds the project site and borders the project site’s impervious surfaces. There are no other habitat types located on the project site. Habitat Most of the undeveloped areas surrounding the project site are characterized by northern coastal scrub, consisting of low shrubs in dense patches that usually occur on windy, exposed sites with shallow and rocky soils. No wildlife occurs on or within the project site due to the high level of foot and vehicle traffic associated with the operation of the existing Casino back of the house. Surrounding the project site and on the adjacent properties, the following wildlife have been observed: turkey vulture (Cathartes aura), mourning dove (Zenaida macroura), California gull (Larus californicus), and American robin (Turdus migratorius). Although the project site does not contain suitable habitat for nesting birds, there is potential for migratory birds that are accustomed to high levels of human activity to nest adjacent to the project site within the mature trees. The trees are located adjacent to the edge of the asphalt surface. Potential Waters of the U.S. There are no surface water features that are present within the boundaries of the project site that have the potential to be classified as waters of the U.S. or wetlands. 3.4.3 SPECIAL-STATUS SPECIES For the purposes of this assessment, “special status” is defined to be species that are of management concern to federal resource agencies and include those species that are: Listed as endangered, threatened, or candidate for listing under the FESA; or Designated as species of concern or species of local concern by USFWS.
A list of special-status plant and animal species that have potential to be affected by the Proposed Project was compiled based on a review of pertinent literature, a reconnaissance-level site assessment, informal consultation with the USFWS, and the results of a California Natural Diversity Data Base (CNDDB) query. Both the search results and a summary table of special-status species that have the potential to occur may be found in Appendix F. No habitat delineated by the USFWS as being critical to the survival of a protected species occurs within or immediately adjacent to the project site. The seven species listed in Appendix F have the potential to be present in the project region. These species were then examined by examining specific site conditions, and it was found that habitat needs for two of the seven species, the marbled murrelet and the northern spotted owl, are met by the immediate project site. Marbled Murrelet The marbled murrelet is a small, robin-sized diving seabird that spends the majority of its time on the ocean, resting and feeding, but flies inland to nest in old growth forest stands. Although no suitable habitat is located on the project site, potentially suitable habitat is located adjacent to the project site.
Trinidad Rancheria EA / 216561
ExistingCasino
SCENIC DR
PRIVA
TE D
R
CHER
-AE L
N
BAKER RANCH RD
Figure 3-3Habitat Types
SOURCE: DigitalGlobe aerial photograph, 10/12/2017; AES, 9/17/2018
LEGEND
0 60 120
Feet
Project SiteRuderal/Disturbed

3.0 Affected Environment, Impacts, and Mitigation
Analytical Environmental Services 3-15 TRDEC Hotel September 2018 Environmental Assessment
Northern Spotted Owl The northern spotted owl is a medium-sized owl of slight varying shades of chocolate brown with dark eyes and a round face. Northern spotted owls live primarily in old 150 to 200-year old growth forests characterized by dense canopy closure typical of old forests. Although no suitable habitat is located on the project site, potentially suitable habitat is located adjacent to the project site. 3.4.4 IMPACTS TO BIOLOGICAL RESOURCES
ALTERNATIVE A
Significant effects to biological resources would result if Alternative A would:
Interfere substantially with the movement of any native resident or migratory fish or wildlife species or with established native resident or migratory wildlife corridors, or impede the use of native wildlife nursery sites;
Conflict with local policies or ordinances protecting biological resources; Have a substantial significant effect on federally protected wetlands as defined by Section 404 of
the Clean Water Act (CWA) through direct removal, filling, hydrological interruption, or other means;
Have a substantial significant effect on species with special status under the federal Endangered Species Act (FESA);
Have a substantial significant effect on habitat necessary for the future survival of such species, including areas designated as critical habitat by the U.S. Fish and Wildlife Service (USFWS); or
Result in take of migratory bird species as defined by the Migratory Bird Treaty Act (MBTA) (16 USC §703-712).
Special-Status Species Alternative A would not result in a loss of habitat for a protected species, as the project site has been previously disturbed and paved. Although no species have the potential to occur on the project site, the surrounding trees provide potential habitat for marbled murrelet and northern spotted owl. Foraging habitat for marbled murrelet exists within approximately 500 feet of the project site on the shoreline west of the development footprint and potential nesting habitat exists within approximately 25 feet of the project site to the west, south, and east. Potential foraging and nesting habitat for the northern spotted owl exists directly adjacent to the project site. There could be a potential effect if construction activities occur within the nesting period for these species, however effects would be temporary and would not result in take of these species. With the incorporation of the mitigation measures provided below, neither of these species would be adversely affected by the Proposed Project. Waters of the United States No Waters of the U.S. occur on the project site. No discharge of dredged or fill material, or other disturbance to wetlands or other waters of the U.S. would occur as a result of Alternative A. Migratory Birds Although the project site does not contain suitable habitat for nesting birds, there is a potential for migratory birds to nest directly adjacent to the project site within the mature trees. However, the birds would have to be accustomed to areas of intense human activity. Construction activities could result in
3.0 Affected Environment, Impacts, and Mitigation
Analytical Environmental Services 3-16 TRDEC Hotel September 2018 Environmental Assessment
disturbance of nearby nest sites for migratory birds and other birds of prey through temporary increases in ambient noise levels and increased human activity within the Proposed Project area. Such disruptions could result in the abandonment of active nests. This would be a temporary effect and would not result in take of nesting migratory bird species. Alternative B Under the No Action Alternative, the project site would remain undeveloped. No mitigation required. 3.4.5 MITIGATION MEASURES
A qualified biologist shall conduct a preconstruction nesting bird survey within 100 feet of the project site during marbled murrelet, northern spotted owl, bird-of-prey, and migratory bird nesting seasons. If any active nests are located within the vicinity of the project site, a no-disturbance buffer zone shall be established to avoid disturbance or destruction of the nest(s). The distance around the no-disturbance buffer shall be determined by the biologist in coordination with USFWS and will depend on the level of noise or construction activity, the level of ambient noise in the vicinity of the nest, and the line-of-sight between the nest and disturbance. The biologist shall delineate the buffer zone with construction tape or pin flags. The no-disturbance buffer will remain in place until after the nesting season or until the biologist determines that the young birds have fledged. A report shall be prepared and submitted to the Tribe and the USFWS following the fledging of the nestlings to document the results.
3.5 CULTURAL RESOURCES
Archaeological studies of the Trinidad Rancheria, including the Proposed Project footprint, were completed by Benson (1977) and Verwayen and Rohde (2011); neither resulted in the identification of any cultural resources on the Proposed Project site. 3.5.1 AREA OF POTENTIAL EFFECTS The Area of Potential Effects (APE) for the Proposed Project includes the footprint of the proposed Hotel and any support structures, staging areas, etc.; however, all of these improvement and staging areas lie within already-developed locations. There is no vertical APE, as it has been demonstrated that the Proposed Project will be built on bedrock topped with fill (Appendix B). 3.5.2 METHODOLOGY A record search was conducted at the Northwest Information Center (NWIC) of the California Historical Resources Information System by AES staff on January 26, 2017 (NWIC File No. 16-1090). Sources reviewed included: the National Register of Historic Places; the California Register of Historical Resources; California Points of Historical Interest; California Inventory of Historic Resources; California Historical Landmarks; Directory of Properties in the Historic Property Data Files for Trinidad County; and Archaeological Determinations of Eligibility. No resources have been noted within 0.25 -miles of the Proposed Project in spite of the fact that six cultural resource studies have included the APE and 0.25-mile buffer. Historic maps and land patent records were also examined, and it was determined that Alfred D. Dannes purchased approximately 126.9 acres in 1870 that would have included the northern portion of what

3.0 Affected Environment, Impacts, and Mitigation
Analytical Environmental Services 3-17 TRDEC Hotel September 2018 Environmental Assessment
would become the Trinidad Rancheria, however no land patent records could be found that include the project APE (BLM, 2017). Geotechnical studies have shown that the Proposed Project site is located on Pleistocene marine terrace sediments deposited on a wave-cut bench in rock of the Jura-Cretaceous Franciscan Complex (Appendix B). Mollusks found in this formation, like those found near Trinidad Head approximately 2.5 miles to the west of the APE, are among the most common Pleistocene fossils, and frequently belong to species now living (Shimek, 1913). The presence of fossils nearby indicates the potential for fossils to be encountered during construction. Native American Consultation It is presumed that the BIA, as Federal Lead Agency, will conduct any necessary consultation. 3.5.4 IMPACTS TO HISTORIC PROPERTIES / PALEONTOLOGICAL RESOURCES In accordance with Section 106 of the National Historic Preservation Act (NHPA), an adverse effect would result if the Proposed Project causes the physical destruction or alteration to all or part of, removal or change in the character to, or any deterioration or loss of integrity of an existing historic property (i.e. a resource eligible for listing on the National Register of Historic Places. ALTERNATIVE A No historic properties are known exist within the project site and there is no potential for historic properties to occur within the APE as it was previously cleared down to bedrock. Paleontological resources may occur within the APE, as Pleistocene fossil deposits have been identified within similar rock formations nearby. However, with implementation of appropriate mitigation measures, adverse effects to paleontological resources would be reduced to less-than-significant. ALTERNATIVE B Under the No-Action Alternative the site would remain undeveloped. No mitigation required. 3.5.5 MITIGATION MEASURES
Halt work within 50 feet of the find, retain a qualified paleontologist to assess significance. If the find is determined to be significant, determine the appropriate course of action, including recovery, analysis, curation, and reporting according to current professional standards.
3.6 SOCIOECONOMIC CONDITIONS / ENVIRONMENTAL JUSTICE 3.6.1 TRINIDAD, HUMBOLDT COUNTY The City’s population is approximately 0.0026 percent of the population of the County and approximately 0.000009 percent of California’s population. Over the next 20 years, the County is expected to grow from approximately 135,727 to approximately 140,513 individuals (Caltrans, 2015). The Trinidad unemployment rate is 2.5 percent, as compared to the County and State unemployment rate of 5.3 percent (U.S. Census, 2015; EDD, 2016a; EDD, 2016b; EDD, 2015. Statistics for the Tribe were obtained from the BIA’s American Indian Population and Labor Force Estimate Report (2014). Approximately 68 of the 102 enrolled Tribal members, ages 16 through 64, are classified as the labor work force.
3.0 Affected Environment, Impacts, and Mitigation
Analytical Environmental Services 3-18 TRDEC Hotel September 2018 Environmental Assessment
3.6.2 ENVIRONMENTAL JUSTICE FOR MINORITY AND LOW INCOME POPULATIONS The City is located within the census block group 060230102002 with a population of approximately 650 people. The total population that is reported as “low income” is approximately 30 percent (approximately 195 people), which is approximately 5 percent lower than the State estimation of low-income population (USEPA, 2016). Approximately 18.4 percent of Humboldt County is classified as minority, including Hispanic, Asian, Black, Pacific Islander and American Indian, who make up approximately 5.74 percent of the population (including members of the Tribe) (California Department of Finance, 2016). 3.6.3 IMPACTS TO SOCIOECONOMICS/ENVIRONMENTAL JUSTICE Implementation of the Proposed Project would result in significant effects to the socioeconomic and environmental justice settings of the region if it would reduce the ability of the local populace to obtain basic public health and safety services through loss of economic revenues or result in disproportionate and significant effects to an identified minority or low-income community. ALTERNATIVE A The Proposed Project would provide important socioeconomic benefits to the Tribe, including an augmented revenue source, new jobs, and would provide the Tribe with additional amenities within its Reservation. The project site is currently held in trust for the Tribe and therefore there would be no loss in property taxes that could affect public services. In addition, the area currently has a shortage of lodging; therefore, the addition of the proposed Hotel would bring additional tax revenue, assuming patrons would also visit nearby amenities. No mitigation required. No adverse health or environmental impacts to low-income and minority populations would occur as a result of the Proposed Project; instead, the effect on low-income and minority populations would be beneficial. Alternative A would have no adverse effect with regards to environmental justice. No mitigation required. ALTERNATIVE B Under the No-Action Alternative the 0.4 acres would remain undeveloped. No mitigation required 3.6.4 MITIGATION MEASURES No mitigation required. 3.7 TRANSPORTATION AND CIRCULATION 3.7.1 EXISTING TRAFFIC CONDITIONS Hotel access and internal circulation would be provided by the existing Casino’s access and internal roadways. Omni-Means Engineers Planers prepared the 2014 Trinidad Area Freeway Master Plan Study Report (Appendix G), which provides a master plan traffic impact analysis (TIA) that includes build out of a hotel, general office, shopping center, recreational vehicle park, recreational community center, gas station with convenience market, and expansion of the existing Casino. Baseline intersection and roadway operating conditions were evaluated in the TIA by determining the AM and PM peak hour Level of Service (LOS).
3.0 Affected Environment, Impacts, and Mitigation
Analytical Environmental Services 3-19 TRDEC Hotel September 2018 Environmental Assessment
3.7.2 IMPACTS TO TRANSPORTATION AND CIRCULATION ALTERNATIVE A Implementation of the Proposed Project would result in significant effects to the transportation and circulation network if daily traffic generated by the Proposed Project would result in an exceedance of LOS C, in accordance with the significance criteria provided in the County General Plan, or result in a substantial increase in the use of public transportation requiring additional infrastructure or vehicles. The 2010 Highway Capacity Manual provides LOS based on the volume of vehicles traveling on certain types of roadways. Appendix G demonstrates that, with the additional trips generated by the Hotel and ancillary facilities, intersections on the Main Street corridor and the project entrance on Scenic Drive are forecasted to operate at unacceptable LOS. Construction of a new intersection off of HWY 101 would reduce adverse effects on transportation and circulation generated by construction of the Hotel. The BIA understands that the Tribe is currently undergoing consultation with Caltrans to complete this interchange. This new interchange may be located approximately 0.7 miles south of the Main Street interchange. For the purposes of the analysis a tight diamond interchange is assumed at the new interchange, which is referred to as the Cher-Ae Lane interchange. A two lane overcrossing is assumed with all-way stops at the two ramp locations. Easterly extension of Cher-Ae Lane past the interchange to intersect at a “T” intersection with Westhaven Drive is also assumed. Currently, no public transit systems serve the project site. Due to the lack of nearby bus or train stops, public transportation would not be utilized as a source of transportation for the Proposed Project. Therefore, implementation of Alternative A would not result in a significant effect to public transportation and no new facilities or vehicles would be required to meet the needs of Alternative A. ALTERNATIVE B Under the No-Action Alternative, there would be no increase in vehicular traffic from construction or operation on area roadways. No mitigation required. 3.7.3 MITIGATION MEASURES
Construct the Cher-Ae Lane interchange off of HWY 101 to provide direct access to the Rancheria and Westhaven Drive.
3.8 LAND USE
The project site and property is characterized by developed paved areas adjacent to the existing Casino and within the existing Reservation. Surrounding land uses vary from recreational trails to the west to residential on the north and southeast/east. HWY-101 is to the north/northeast. Surrounding land use designations are typical of a rural coastal community. The Reservation is not under the jurisdiction of the City’s, County’s, or State’s land use designations.
3.8.1 IMPACTS TO LAND USE
ALTERNATIVE A
Significant effects to land use would occur if Alternative A would be incompatible with land uses of adjacent properties in such a manner that would impede local and regional planning efforts or result in land use conflicts that would impede neighboring land use. However, Alternative A would be compatible with the mixed land use surrounding the project site, including the adjacent Casino. As the property lacks

3.0 Affected Environment, Impacts, and Mitigation
Analytical Environmental Services 3-20 TRDEC Hotel September 2018 Environmental Assessment
a zoning classification by local jurisdictions but is designated as commercial land use by the Tribe, effects to land use would be less than significant. While the project site is located within a Coastal Zone, the Proposed Project is excluded from the Coastal Zone Management Plan (CZMA) as it would be developed on land held in trust by the federal government. Therefore, the Proposed Project is not required to be developed in accordance with the Local Coastal Plan or the CZMA. Furthermore, the development of the proposed Hotel is consistent with the adjacent land use of the existing Casino.
ALTERNATIVE B
Under the No-Action Alternative, there would be no change in land use. No mitigation required.
3.8.3 LAND USE MITIGATION MEASURES
No changes to land use would occur as a result of the Proposed Project. No mitigation required.
3.9 AGRICULTURE
The project site is not used for agricultural operations and does not provide adequate acreage for crop development or cattle grazing. The project site is not under an active Williamson Act Contract (CDOC, 2017b), and the Proposed Project will not convert any farmland.
3.8.3 IMPACTS TO AGRICULTURE
ALTERNATIVE A
Significant effects to agriculture would occur if the Proposed Project would result in the conversion of agricultural lands designated as prime farmland, farmland of statewide importance, or farmland of local importance or impede local and regional planning efforts to protect agricultural lands, however no agricultural land conversion will result from implementation of Alternative A.
ALTERNATIVE B
Under the No-Action Alternative, the Hotel would not be built. No mitigation required. 3.9.4 MITIGATION MEASURES No agriculture occurs on or within the immediate vicinity of the project site. No mitigation required. 3.10 PUBLIC SERVICES 3.10.1 WATER SUPPLY The City operates the water treatment facility, which serves the City and surrounding unincorporated areas, including the Proposed Project site. This facility is located at 1313 Westhaven Drive North, Trinidad, CA. The City has permits to use approximately 355,392 gpd of water. However, they are currently only using approximately 82,191 gpd (Buckman, 2017). 3.10.2 WASTEWATER SERVICE As described in Section 2.2.1, the Tribe currently utilizes City sewer connections as well as its own WWTF and associated leach fields. The existing Casino is served by the Tribe’s WWTF.
3.0 Affected Environment, Impacts, and Mitigation
Analytical Environmental Services 3-21 TRDEC Hotel September 2018 Environmental Assessment
3.10.3 SOLID WASTE Humboldt Sanitation, a private contractor based in McKinleyville, provides solid waste disposal services to the Rancheria and associated properties. Humboldt Sanitation also operates Humboldt Recycling, which serves the City’s recycling needs. Waste is collected and stored at the Humboldt Sanitation Company transfer station in McKinleyville and then transferred to the Anderson Landfill in Redding, California. The transfer station has a permitted capacity of 100 tons per day (tpd) and there are no enforcement actions against the facility operation. Anderson Landfill has a maximum permitted capacity of 1,850 tpd and with a remaining capacity of over 11 million cubic yards (as of March 2008) with an expected closure date of 2055 (CalRecycle, 2016). Unsuccessful attempts were made to contact both the McKinleyville transfer station and Anderson Landfill to determine daily capacities. However, there is no indication that capacities have been exceeded. 3.10.4 ELECTRICITY, NATURAL GAS, AND TELECOMMUNICATIONS PG&E supplies electricity to existing homes and businesses in the project site. American Telephone and Telegraph (AT&T) provides telephone service and would be responsible for any underground or overhead extensions necessary to serve the project site. Internet and cable TV is available to the project site from Suddenlink Communications and through various satellite television services. There are no known issues with the electricity, natural gas, and telecommunication services that would Hotel construction. 3.10.5 LAW ENFORCEMENT In 2010, the City transferred law enforcement responsibilities to the County Sheriff. The County Sheriff’s Department provides law enforcement services throughout the County and includes Administrative, Operations, and Corrections divisions. The Sheriff’s Office also includes a Special Enforcement Team, boating unit, SWAT, and a drug enforcement unit. The County Sheriff’s Department provides primary law enforcement, while the California Highway Patrol (CHP) provides traffic and supplemental law enforcement services to the project site. The County Correctional Facility is the detention facility for persons arrested in unincorporated areas, including the project site. The expected response times for this portion of the County are estimated at approximately 1 to 15 minutes. The Sheriff’s Office is staffed by 61 sworn deputies, 45 of which are assigned to patrol, and approximately 217 total staff (Cavinta, 2015). There are approximately 38 patrol vehicles, plus specialized vehicles such as 4x4s and other off-road vehicles used in drug enforcement activities. The County Sheriff’s Office has stations in Eureka, Garberville, McKinleyville, and Hoopa. The Main Station is located in Eureka and serves the project site; that station is comprised of two Lieutenants, four Sergeants, six Corporals, and 21 Deputy Sheriffs. Per an agreement between the County Sheriff’s Office and the Tribe, the Tribe provides funding for a deputy to patrol and provide law enforcement services in the vicinity of the Rancheria (Cavinta, 2015). 3.10.6 FIRE PROTECTION AND EMERGENCY MEDICAL The Trinidad Volunteer Fire Department provides fire suppression and emergency medical services to the areas within the City limits with two fire stations located within approximately 9.9 square miles of the Trinidad Planning Area (City of Trinidad, 2012). The closest station is located at 409 Trinity Street in Trinidad, California, which is staffed by 29 volunteers, and therefore is not staffed on a regular basis. The second station is located to south of the project site in Westhaven, at 446 6th Avenue. All staff are trained as first responders or emergency medical technicians and the Trinidad Volunteer Fire Department
3.0 Affected Environment, Impacts, and Mitigation
Analytical Environmental Services 3-22 TRDEC Hotel September 2018 Environmental Assessment
regularly responds to medical emergency calls. Typically, the Trinidad Volunteer Fire Department responds to approximately 50 calls per year (City of Trinidad, 2015). The Trinidad Volunteer Fire Department also has mutual aid agreements with the California Department of Forestry and Fire Protection (CalFire). Although CalFire aids local fire departments in wildfire situations, the project site is not located within a State Responsibility Area, as mapped by CalFire (CalFire, 2013). The project site is located in high fire hazard area within a Local Responsibility Area (CalFire, 2013), where CalFire does not have responsibility to provide wildland fire protection services. Emergency medical services are overseen and authorized by the North Coast Emergency Medical Services Authority (North Coast EMS). North Coast EMS is a Joint Powers Authority created to coordinate the regional EMS system and to reduce the occurrence of death and disability on the north coast (North Coast EMS, 2016). Ambulance and emergency medical services are dispatched through 911 and are provided by several companies on a rotating basis. The nearest hospital emergency room is Mad River Community Hospital located at 3800 Janes Road in Arcata, California. Emergency calls are routed through the Sheriff’s Office and CHP to the respective fire departments. Response times to the project site are approximately 3 to 4.5 minutes, although this depends on available resources. 3.10.7 IMPACTS TO PUBLIC SERVICES ALTERNATIVE A Water Supply Alternative A would obtain water through existing on-site sources as described in Section 2.2.1. The Proposed Project would use approximately seven percent of the City’s available water supply, increasing the City’s total water usage to approximately 30 percent of available capacity. With approximately 70 percent of the City’s water supply still available after project development, there would be no adverse effect on municipal water supplies or operation (Buckman, 2017). Minimal new infrastructure would be required. Wastewater Service As discussed in Section 2.2.1, Alternative A would utilize the Tribes existing WWTP, requiring upgrades and an additional leach field. This upgrade would be solely on Tribal lands and would allow for the system to handle a total of approximately 50,000 gpd, enough capacity to accommodate operation of the new Hotel. Alternative A would have no impact on municipal wastewater systems. Solid Waste Potential solid waste streams from construction would include paper, wood, glass, aluminum, plastics from packing material, waste lumber, insulation, empty non-hazardous chemical containers, concrete, metal, and electrical wiring. Solid waste and recycling from construction and operation of the proposed Hotel would be collected by Humboldt Sanitation and would be transferred to the Anderson Landfill. Utilizing the most conservative daily solid waste generation rate published by CalRecycle (2016b), each hotel room is anticipated to generate approximately 0.002 tons per day (tpd) of solid waste, resulting in a total daily solid waste generation rate of approximately 0.2 tpd. Based on the maximum capacity at the Anderson Landfill, this small addition of solid waste and would not impact solid waste services or facilities.
3.0 Affected Environment, Impacts, and Mitigation
Analytical Environmental Services 3-23 TRDEC Hotel September 2018 Environmental Assessment
Electricity, Natural Gas, and Telecommunications Electrical and telephone infrastructure is already on the project site, and would not require new facilities or upgrades for the Hotel. If available, natural gas will be provided for gas-fired water heaters and kitchen equipment. Law Enforcement In accordance with Public Law (PL) 280, 18 USC §1162, the State of California and other local law enforcement agencies have criminal enforcement authority on tribal lands. The County Sheriff’s Department would continue to provide law enforcement services to the project site. The incremental increase in patrons may result in a proportionate increase in crime, potentially requiring response by off-Reservation law enforcement agencies, however due to the relatively small size of the proposed Hotel, calls for service would not be disproportionate to the current number of calls for service at the Casino. Fire Protection and Emergency Medical Services Construction-related impacts include potential fire threats associated with equipment and vehicles coming into contact with wildland areas. Construction vehicles and equipment such as welders, torches, and grinders may accidentally spark and ignite vegetation or building materials. The increased risk of fire during the construction of the proposed facilities would be similar to that found at other construction sites. Standard construction and operational measures have been incorporated into the project description to prevent fire caused by construction (Appendix C). With these measures, effects would be less than significant. Increased emergency calls to 911 as a result of the Proposed Project would not result in delays to response times or the need for ambulances to be dispatched from more distant locations. Several ambulance companies provide services in the vicinity of the City; therefore it is not expected that increased demand for emergency medical services would create a significant effect. No new off-trust facilities or major renovation to any facilities would be required. Alternative B Under the No Action Alternative, the Hotel would not be developed. No mitigation required. 3.10.8 MITIGATION MEASURES No adverse impacts to public services would occur as a result of the Proposed Project. No mitigation is required for the Proposed Project. 3.11 NOISE 3.11.1 SENSITIVE RECEPTORS The project site is surrounded by rural residential areas to the south and west, with Tribal buildings and the Casino directly adjacent. A single-family rural residence, located on-Reservation approximately 75 feet south of the project site, is the nearest sensitive noise receptor. The nearest off-Reservation sensitive receptor is a single-family rural residence approximately 165 feet east of the project site. The nearest school, Trinidad Elementary School, is located approximately 0.9 miles north of the project site. With the exception of special status species, discussed in Section 3.4, there are no other noise sensitive receptors in the vicinity of the project site.
3.0 Affected Environment, Impacts, and Mitigation
Analytical Environmental Services 3-24 TRDEC Hotel September 2018 Environmental Assessment
3.11.2 EXISTING NOISE SOURCES The noise environment surrounding the project site is influenced primarily by vehicle, highway, and tide-generated noise. Noise levels are increased during parts of the year when local fishery seasons open (e.g. salmon, Dungeness crab, etc.) and during popular tourist months. 3.11.3 IMPACTS TO AMBIENT NOISE A significant effect would occur if project-related noise sources would cause an exceedance of the U.S. Department of Housing and Urban Development’s day-night equivalent (Leq) threshold of 65 decibels A-weighted (dBA) at the nearest sensitive receptor during construction or operation (HUD, 2016). ALTERNATIVE A Construction Noise Site preparation and grading associated with Alternative A would temporarily generate noise above background noise levels. The closest sensitive receptor that would be exposed to noise during project construction is a single family rural residence approximately 75 feet south of the project site. Impacts to the residence are not considered in this analysis because it is on-Reservation and the Tribe would handle the noise issues internally. The nearest off-Reservation sensitive receptor is a residence located approximately 165 feet east of the project site. Construction noise levels at and near the project site would fluctuate depending on the particular type, number, and duration of uses of various pieces of construction equipment. Construction-related material haul trips would raise ambient noise levels along truck routes, depending on the number of haul trips made and types of vehicles used. Table 3.11-1 shows typical noise levels produced by various types of construction equipment.
TABLE 3.11-1
TYPICAL NOISE LEVELS FROM CONSTRUCTION EQUIPMENT
CONSTRUCTION EQUIPMENT NOISE LEVEL (DBA, LEQ AT 50 FEET) Truck 88
Portable Air Compressor 81
Concrete Mixer (Truck) 85
Dozer 85
Paver 89
Generator 76
Backhoe 80
Source: FTA, 2006
Sources of construction noise attenuate (lessen) at a rate of 6 dBA to 9 dBA per doubling of distance from the source, depending upon environmental conditions (i.e. atmospheric conditions and noise barriers, either vegetative or manufactured, etc.) (FTA, 2006). An attenuation factor of 8.0 dBA per doubling of distance is appropriate given the undulating topography and obstructing vegetation in the vicinity of the project site. Based on Table 3.11-1, the maximum projected construction noise level on the project site would be approximately 89 dBA. This is a conservative maximum noise level based on the assumption that louder equipment (pavers) could potentially be used daily. However, not all equipment would be
3.0 Affected Environment, Impacts, and Mitigation
Analytical Environmental Services 3-25 TRDEC Hotel September 2018 Environmental Assessment
used simultaneously and not all equipment would be used on a daily basis. Thus, the actual noise level would be lower than calculated. Using an attenuation factor of 8.0 dBA Leq per doubling of distance, maximum average sound levels at nearby sensitive receptors (approximately 165 feet east of construction activity) would be approximately 77 dBA Leq, which is less than the FHWA threshold of 78 DBA Leq. This level is higher than the County threshold of 50 dBA Leq for commercial land use noise, however construction noise is exempt from County noise requirements (County of Humboldt, 2012b). Operational Noise The level of traffic noise depends on three factors: (1) the volume of the traffic, (2) the speed of the traffic, and (3) the number of trucks in the flow of the traffic. It is not anticipated that traffic speed or the mix of trucks in project-area traffic would change during the operational phase; however, implementation of Alternative A would increase traffic volumes. In accordance with the City’s General Plan Draft Noise and Safety Element, the primary source of noise in the project area is traffic on U.S. Highway 101 (HWY-101). The ambient noise level in the vicinity of the Subject Property is approximately 65 dBA Leq, as stated in the 2013 Caltrans Technical Noise Supplement for typical commercial area noise levels (Caltrans, 2013). The existing traffic volume on HWY-101 is approximately 10,600 vehicles per day (vpd) and Alternative A would add approximately 669 additional vpd to the existing traffic volume, which would result in an ambient noise level increase of approximately 0.27 dBA Leq (Appendix G). The increase in traffic on HWY-101 under Alternative A would increase the ambient noise level in the vicinity of the project to approximately 65.27 dBA, Leq, which is below the federal noise abatement criterion of 67 dBA Leq. Therefore, Alternative A would not result in significant adverse impacts associated with traffic noise levels for sensitive receptors located in the vicinity of HWY-101. Parking lot noise due to vehicles is limited by low vehicle speeds and as a result is not expected to represent a significant source of noise. Human activity in parking lots can also produce noise, including talking, yelling, and opening and closing of car doors and trunk lids. Such activities can occur any time and frequently occur in the evening. It is typical for a passing car in a parking lot to produce a maximum noise level of 60– 65 dBA at a distance of 50 feet, which is comparable to the level of a raised voice. This would not result in significant adverse impacts as maximum parking lot noise levels would be below the federal abatement criterion. ALTERNATIVE B Under the No-Action Alternative, the project site would remain undeveloped. No mitigation required. 3.11.4 MITIGATION MEASURES The following mitigation measures shall be implemented to further reduce impacts from noise during construction:
Construction activities shall only occur between the hours of 7:00 AM to 6:00 PM Monday through Friday and 9:00 AM to 5:00 PM on Saturday. No construction activities shall occur on any Sunday.
Where feasible, stationary construction equipment shall be located on the northern portion of the project site.

3.0 Affected Environment, Impacts, and Mitigation
Analytical Environmental Services 3-26 TRDEC Hotel September 2018 Environmental Assessment
All construction equipment over 50 horsepower shall be equipped with noise-reducing mufflers. 3.12 HAZARDOUS MATERIALS 3.12.1 HAZARDOUS MATERIALS MANAGEMENT Operation of the existing Casino involves a minimal amount of hazardous materials and the Hotel is expected to use similar products. Potentially hazardous materials that may be used and stored at the Hotel include paints, polishes, cleaning products, oils, and detergents. Even when hazardous materials are properly stored and disposed of, there is potential for an accidental spill to occur. 3.12.2 PHASE I ENVIRONMENTAL SITE ASSESSMENT In December 2015, AES conducted a records search of hazardous material incidents for a nearby Phase I Environmental Site Assessment (Phase I ESA) at Trinidad Harbor (AES, 2015). The proposed Hotel is located within the area analyzed during that Phase I ESA, which identified several listings within a 1.0-mile radius of the Proposed Project site.
888 Galindo Street: two 500-gallon storage tanks containing diesel fuel Private Residence: heating fuel tank leak 807 Edwards Street: active storage tank 806 Edwards Street: two incidents with storage tank installation 570 Ewing Street: hazardous materials generator 470 Oceans Avenue: Citizens Mortuary 409 Trinity Street: current NPDES permit 408 Wagner Street: storage fuel tank Trinidad Union School: storage fuel tanks
No listings within the project site were identified. Additionally, a search of the SWRCB Geo Tracker website found three sites approximately 0.5 miles north of the project site (SWRCB, 2017):
Chevron Station #9-1728: Case closed Humboldt State University (Marine Lab): Case closed Pacific Bell: Case Closed
3.12.3 IMPACTS FROM HAZARDOUS MATERIALS ALTERNATIVE A During grading and construction, it is possible that hazardous materials, such as gasoline, diesel fuel, and hydraulic fluid, may be brought on site. Temporary aboveground storage tanks, as well as storage sheds/trailers, would likely be used by contractors for fueling and maintenance purposes. During handling and transfer from one container to another, the potential for an accidental release exists. Depending on the relative hazard of the material, if a spill of significant quantity were to occur, the accidental release could pose as a hazard to construction employees, as well as the environment. No environmental concerns were identified on or in the immediate vicinity of the project site that would likely pose an adverse effect to the environmental integrity of the project site. Development of the Proposed Project would not result in exposing employees or the public to existing hazardous materials conditions.
3.0 Affected Environment, Impacts, and Mitigation
Analytical Environmental Services 3-27 TRDEC Hotel September 2018 Environmental Assessment
Alternative B Under the No-Action Alternative, the Hotel would not be developed. No mitigation required. 3.12.4 MITIGATION MEASURES No adverse effects from hazardous materials would result from the Proposed Project with the incorporation of the BMPs listed in Appendix C. No mitigation required. 3.13 VISUAL RESOURCES 3.13.1 EXISTING ENVIRONMENT The development footprint is located on a paved parking lot adjacent to the existing Casino. Standing at six stories, the height of the proposed Hotel will be significantly taller than the existing Casino (Figure 2-2). Visual characteristics of the project site are typical of coastal rural-residential forested areas in the County. The Proposed Project vicinity is relatively undeveloped and features redwood trees and a variety of coastal vegetation. Views of the as-yet undeveloped site are blocked by trees to the south and west and by the existing Casino to the north and east. The project site is not visible from HWY-101 due to the tall forest lining the highway, but the site is visible from Trinidad Head, a California Historical Landmark. 3.13.2 IMPACTS TO VISUAL RESOURCES ALTERNATIVE A The proposed Hotel would impact the overall coastal aesthetics of the project site. Mitigation measures would require features to soften the visual impact and allow the proposed Hotel to blend into the scenery and adjacent existing Casino so that the Proposed Project would not result in any adverse effects to scenic resources. Residences to the east, west, and south may have views of the Proposed Project, but the Proposed Project would be adjacent to the existing Casino. Incorporation of mitigation measures in Section 3.13.1 would reduce effects to visual resources to less than significant. Lighting from the proposed Hotel would be minimal. The Tribe would use downcast, bi-level dimming motion sensor external lighting, which would not alter the visual aesthetics of the area. Given the relatively small area proposed for development, the additional facilities would fill a small portion of the viewshed when compared to the expansive scenic resources in all directions (Camel Rock, Trinidad Head, Trinidad Bay, beaches, and associated costal bluffs). Incorporation of mitigation measures in Section 3.13.1 would reduce effects to visual resources to less than significant. Alternative B Under the No-Action Alternative, the project site would not be developed. No mitigation required. 3.13.3 MITIGATION
Design elements shall be incorporated into the Proposed Project to minimize visual impacts of buildings and associated structures, including landscaping that compliments buildings and parking areas, with setbacks and vegetation consistent with existing landscaping. Earth-toned paints and coatings shall be used, all exterior glass shall be non-reflective and low-glare, and signs and facades shall be designed with a non-reflective backing to decrease reflectivity.
3.14 BIBLIOGRAPHY Bibliographic references may be found in Appendix H.
Analytical Environmental Services 4-1 TRDEC Hotel September 2018 Environmental Assessment
SECTION 4.0 CUMULATIVE AND GROWTH-INDUCING EFFECTS
Cumulative impacts are defined by CEQ as effects “on the environment which result from the incremental impact of the action when added to other past, present, and reasonably foreseeable future actions” (40 CFR Section 1508.7). No major development projects are proposed and/or are currently being constructed in the region surrounding the Tribe’s lands (OPR, 2017). However, buildout of the City’s Draft General Plan would result in commercial buildout along the west side of HWY-101 (City of Trinidad, 2009). Additionally, buildout of the Tribe’s Comprehensive Economic Development Strategy (Master Plan) would result in development of tribal enterprises and supporting infrastructure on the Tribal lands near the existing Casino and proposed Hotel (Tribe, 2013). The cumulative impact analysis within this EA considered the construction of the projects described above and conservatively assumes an approximately 1.3 percent annual growth rate (Appendix G), along with the full implementation of the Tribe’s Master Plan. Cumulative impacts for each environmental issue area are discussed below. The time frame for the cumulative effects analysis generally extends to 2032; the County of Humboldt’s planning horizon year (County of Humboldt, 2012b). Some actions, which result in individually insignificant impacts, may have significant impacts when cumulative, synergistic, or additive effects are considered. The significance of these effects is particularly evident when impacts pass a threshold, such as causing a jeopardy opinion with regard to endangered species or a nonconformity determination under the CAA. Growth itself is very perceptible and is sometimes regarded by the public as both adverse and an impact. Generally, growth is simply a part of the cumulative environment, rather than an effect or result. However, a shift to unplanned and unregulated growth could be a significant impact. The effects of potential cumulative projects, analyzed in conjunction with the Proposed Project, are presented below.
4.1 CUMULATIVE EFFECTS
4.1.1 LAND RESOURCES The principal effects to land resources associated with any future development in the vicinity of the project site would include localized topographical changes and soil attrition, but as the site has already been graded and paved, this effect is minimal. The Proposed Project and other projects in the area would be required to implement measures consistent with local permitting requirements for construction to address any regional geotechnical, seismic, or mining hazards. Therefore, there are no cumulatively considerable land resources impacts associated with the Proposed Project. No development or changes in land use are proposed under Alternative B, the No-Action Alternative. Accordingly, no land resources would be affected and no cumulatively considerable adverse effects would result from the implementation of Alternative B.
3.0 Affected Environment, Impacts, and Mitigation
Analytical Environmental Services 4-2 TRDEC Hotel September 2018 Environmental Assessment
4.1.2 WATER RESOURCES As discussed in Section 3.2.1, there is adequate supply of surface water from Luffenholtz Creek to serve additional projects in the region; therefore, there is no cumulative impact associated with groundwater availability. Cumulative impacts to water quality could occur if individual projects degrade water quality as a result of stormwater and point-source discharges. However, projects that may be constructed in the vicinity of the Proposed Project are required to comply with the CWA as it relates to stormwater and point-source discharges. Therefore, there are no cumulatively considerable water resource impacts associated with the Proposed Project. No development or changes in land use are proposed under Alternative B, the No-Action Alternative. Accordingly, no water resources would be affected and no cumulatively considerable adverse effects would result from the implementation of Alternative B. 4.1.3 AIR QUALITY
AIR QUALITY
The NCAB is either currently designated as attainment or maintenance for all CAPs, and therefore is currently meeting the attainment standards for all criteria pollutants established by the USEPA. Any future development in the vicinity of the Proposed Project would be subject to state and federal regulations. Furthermore, mobile sources such as passenger cars would become the main source of CAP emissions from foreseeable development as a result of increased trips to the hotel. Although vehicle miles traveled (VMT) may increase, technology advancements resulting in an increase in fuel efficiency will, on average, result in a decrease of mobile source emissions. Therefore, no cumulatively considerable adverse impacts to air quality are anticipated.
CLIMATE CHANGE AND GREENHOUSE GAS EMISSIONS
Worldwide GHG emissions are likely to increase as a result of increased global development. However, annual emissions from the Proposed Project are estimated to be approximately four percent less in 2040 than in 2020 as a result of increased fuel efficiency and therefore would not result in a cumulatively considerable additions to GHG emissions. No development or changes in land use are proposed under Alternative B, the No-Action Alternative. Accordingly, there would be no air quality changes and no greenhouse gasses would be generated. Therefore, no cumulatively considerable adverse effects would result from the implementation of Alternative B. 4.1.4 BIOLOGICAL RESOURCES Potential cumulative effects to biological resources on the project site will be reduced to a less-than-significant level through incorporation of the mitigation measures discussed in Section 3.4.5. Similarly, all other development in the area affecting these resources is limited in scope by land use restrictions within the local coastal plan for the coastal zone and City zoning ordinance. Therefore, there are no cumulatively considerable biological resources impacts associated with the Proposed Project.
3.0 Affected Environment, Impacts, and Mitigation
Analytical Environmental Services 4-3 TRDEC Hotel September 2018 Environmental Assessment
No development or changes in land use are proposed under Alternative B, the No-Action Alternative. Accordingly, no biological resources would be affected and no cumulatively considerable adverse effects would result from the implementation of Alternative B. 4.1.5 CULTURAL RESOURCES Grading and development have eliminated the potential for cultural resources on site, however paleontological resources may be encountered. Protection measures for impacts to paleontological resources have been included in Section 3.5.5. Similarly, all other development in the area affecting these resources must adhere to similar protections for paleontological resources. Therefore, there are no cumulatively considerable cultural resources impacts associated with the Proposed Project. No development or changes in land use are proposed under Alternative B, the No-Action Alternative. Accordingly, no cultural or paleontological resources would be affected and no cumulatively considerable adverse effects would result from the implementation of Alternative B. 4.1.6 SOCIOECONOMIC CONDITIONS / ENVIRONMENTAL JUSTICE Cumulative socioeconomic effects could occur in the project area as the result of developments that affect the lifestyle and economic well-being of residents. The Proposed Project would introduce new economic activity in the County and in the City. This would be a beneficial effect to the region and the Tribe on several different socioeconomic levels. These effects would occur as the region’s economic and demographic characteristics change. However, these cumulative effects would not be significant in comparison with existing economic conditions in the region. Planning documents for the County and the City will continue to designate land uses for businesses, industry, and housing, as well as plan public services for anticipated growth in the region. Specific potential cumulative effects include increases to regional and tribal employment, as well as the local economy. The Proposed Project is not anticipated to result in an adverse environmental justice impacts. As Alternative A would benefit a minority group (the Tribe), the environmental justice impacts would be positive rather than adverse. No development or changes in land use are proposed under Alternative B, the No-Action Alternative. Accordingly, there would be no changes in local socioeconomic conditions and no cumulatively considerable adverse effects would result from the implementation of Alternative B. 4.1.7 TRANSPORTATION AND CIRCULATION A background growth rate of approximately 1.3 percent per year was utilized to obtain the traffic projections for 2040. As shown in Appendix G, with the addition of traffic generated by Alternative A in the cumulative 2040 projection, several intersections within the project site vicinity are projected to operate at an unacceptable LOS F. In order to maintain an LOS of acceptable levels, a new interchange located approximately 0.7 mile south of the Main Street interchange is proposed as part of the Master Plan to provide direct access to the Rancheria and Westhaven Drive. With the proposed Cher-Ae Lane Interchange incorporated into the Master Plan, the study intersections and interchanges would not exceed the target threshold of LOS C with the addition of traffic generated by Alternative A in the cumulative 2040 projection. Therefore, Alternative A in the cumulative 2040 projection would not have a significant adverse impact on the transportation network in the vicinity of the
3.0 Affected Environment, Impacts, and Mitigation
Analytical Environmental Services 4-4 TRDEC Hotel September 2018 Environmental Assessment
project site. The Proposed Project would not noticeably increase ridership on County bus and transit service; therefore, an adverse cumulative effect to public transit would not occur. No development or changes in land use are proposed under Alternative B, the No-Action Alternative. Accordingly, no increased demands would be placed on the transportation system and no cumulatively considerable adverse effects would result from the implementation of Alternative B. 4.1.8 LAND USE The project site is held in federal trust by the BIA, therefore, the project site would not be subject to state or local land use jurisdiction. The Tribe’s Master Plan governs growth and the proposed Hotel is included as a component of the Master Plan. Therefore, there are no cumulatively considerable land use impacts associated with the Proposed Project. No development or changes in land use are proposed under Alternative B, the No-Action Alternative. Accordingly, no cumulatively considerable adverse effects would result from the implementation of Alternative B. 4.1.9 AGRICULTURE The Proposed Project would not remove any agricultural lands or resources, as none exist on the project site or adjacent to the project site. The project site is not under the Williamson Act contracts, nor does the site provide adequate acreage for crop development or cattle grazing or have history of agricultural uses. None of the features of the Tribe’s Master Plan would result in loss of agricultural lands. Therefore, there are no cumulatively considerable agricultural impacts associated with the Proposed Project. No development or changes in land use are proposed under Alternative B, the No-Action Alternative. Accordingly, no agricultural lands would be affected and no cumulatively considerable adverse effects would result from the implementation of Alternative B. 4.1.10 PUBLIC SERVICES The Proposed Project would utilize the existing on-site wastewater systems, thus there would be no cumulatively considerable impacts to this municipal service. All other public services would be accommodated by existing and planned public services. As development of the surrounding area continues, the combined need for public services may create a cumulative impact. However, all future land uses in the region will be subject to approval by local governments or the Tribe under the Master Plan. Should future infrastructure improvements be required, the Tribe and associated agencies would be responsible for mitigating all identified impacts. Therefore, there are no cumulatively considerable public services impacts associated with the Proposed Project. No development or changes in land use are proposed under Alternative B, the No-Action Alternative. Accordingly, no new public services demands would be created and no cumulatively considerable adverse effects would result from the implementation of Alternative B. 4.1.11 NOISE Generally, noise increases as areas are developed. Therefore, the cumulative conditions under Alternative A would increase noise levels through increased traffic and operational activities. Using the growth rate of approximately 1.3 percent per year from the TIA, traffic volumes on HWY-101 would be
3.0 Affected Environment, Impacts, and Mitigation
Analytical Environmental Services 4-5 TRDEC Hotel September 2018 Environmental Assessment
approximately 13,356 vehicles per day. With the addition of project traffic to HWY-101, traffic volumes on HWY-101 would increase to approximately 14,025 vehicles per day. Therefore, in the cumulative 2040 year, the ambient noise level would increase by approximately 0.21 dBA, Leq. With the addition of cumulative traffic volume, the ambient noise level would be approximately 65.48 dBA, Leq, which is less than the federal noise abatement criterion of 67 dBA Leq. Therefore, the Proposed Project would not result in a cumulatively significant adverse impacts associated with traffic noise levels for sensitive receptors located in the vicinity of HWY-101. It is not anticipated that parking lot noise due to vehicles or human activity would change over the buildout year conditions. This would not result in cumulatively significant adverse noise impact, as maximum parking lot noise levels would be below the federal abatement criterion of 67 dBA, Leq. Therefore, there are no cumulatively considerable noise impacts associated with the Proposed Project. No development or changes in land use are proposed under Alternative B, the No-Action Alternative. Accordingly, no new noise sources would be generated and no cumulatively considerable adverse effects would result from the implementation of Alternative B. 4.1.12 HAZARDOUS MATERIALS Any new development in the area would be required to adhere to State and municipal regulations in the delivery, handling, and storage of hazardous materials, thereby reducing the risk of accidental exposure to the public’s health and welfare. Under the Master Plan, the Tribal Council is responsible for ensuring development does not result in the release of hazardous materials and would be required to follow all associated Federal and Tribal requirements for use, storage, and handling. Therefore, there are no cumulatively considerable hazardous materials impacts associated with the Proposed Project. No development or changes in land use are proposed under Alternative B, the No-Action Alternative. Accordingly, no new hazardous materials sources would be generated and no cumulatively considerable adverse effects would result from the implementation of Alternative B. 4.1.13 VISUAL RESOURCES Cumulative development that takes place would be consistent with local land use regulations, including associated design guidelines and the Tribe’s Master Plan. Cumulative effects would include a shift from undeveloped lots to views of developed areas, as well as an increase in the density of urban uses within the City and the Reservation. However, the development of the Proposed Project would be generally consistent with the visual goals of County and City land use regulations and implements the Tribe’s Master Plan. Substantial development is located directly to the north of the project site, and the Proposed Project would be consistent with that development. Therefore, there are no cumulatively considerable visual resources impacts associated with the Proposed Project. No development or changes in land use are proposed under Alternative B, the No-Action Alternative. Accordingly, no new structures would be built and no cumulatively considerable adverse effects would result from the implementation of Alternative B. 4.2 INDIRECT AND GROWTH-INDUCING EFFECTS Under NEPA, indirect and growth-inducing effects of a proposed project must be analyzed [40 CFR 1508.8(b)]. The CEQ Regulations define indirect effects as effects that are caused by the Proposed Action and are later in time or further removed in distance, but still reasonably foreseeable. Growth-
3.0 Affected Environment, Impacts, and Mitigation
Analytical Environmental Services 4-6 TRDEC Hotel September 2018 Environmental Assessment
inducing effects are defined as effects that foster economic or population growth, either directly or indirectly. Direct growth inducement could result, for example, if a project includes the construction of a new residential development. Indirect growth inducement could result if a project establishes substantial new permanent employment opportunities (e.g. new commercial, industrial, or governmental enterprises) or if it removes obstacles to population growth (e.g. expansion of a wastewater treatment plant to increase the service availability). This section focuses on the indirect and growth-inducing effects of Alternative A, the Proposed Project. With no change compared to existing conditions, Alternative B would not result in indirect or growth-inducing effects and is therefore not discussed further. 4.2.1 INDIRECT EFFECTS Analyses of the adequacy of local resources, infrastructure, and services are included in the discussion of environmental consequences for each Project Alternative. No significant, unmitigatible impacts to resources have been identified that would result from the implementation of Alternative A. Any utility upgrades would occur on infrastructure already located on Tribal lands, and would be limited to modifications of the WWTP. The remaining utilities are already located on site and local utility providers have existing capacity to serve the project site. A significant number of new employees would not move to the community from out of the area; as such, no new housing, schools, or other facilities would be constructed as a result of development on the project site. There would be no change in off-site land use and no significant change in population density in the vicinity of the project site. No significant adverse indirect effects relevant to any environmental issue area would occur. 4.4.2 GROWTH-INDUCING EFFECTS Growth inducement may constitute a significant effect if the increased growth is not consistent with or accommodated by the land use and growth management plans and policies for the area affected. Local land use plans provide for development patterns and growth policies allow for orderly development supported by adequate public services and utilities such as water supply, roadway infrastructure, sewer services, and solid waste disposal services. A project that would induce “disorderly” growth (i.e. would conflict with local land use plans) could indirectly cause adverse environmental or public service impacts. The Proposed Project is projected to employ approximately 50 full-time and part-time employees currently living in the City or nearby cities. Although it is anticipated that the majority of the permanent employees would already reside locally, there is room for accommodation if relocation must occur. Therefore, the Proposed Project would not directly induce substantial population growth in the region of the project site. Analyses of the adequacy of local infrastructure and services are included in the discussion of environmental consequences for each proposed Alternative. No significant, unmitigated impacts have been identified that would result from the Proposed Project. Utility infrastructure would not be improved or expanded to increase service availability to any areas surrounding the project site. Wastewater treatment would only serve Tribal development on the proposed trust property and there is adequate domestic water supply available. Therefore, growth-inducing impacts would be less than significant for the Proposed Project.
Analytical Environmental Services 5-1 TRDEC Hotel September 2018 Environmental Assessment
SECTION 5.0 CONSULTATION, COORDINATION, AND LIST OF PREPARERS
5.1 FEDERAL AGENCIES
Bureau of Indian Affairs (Lead Federal Agency) Chad Broussard Harold Hall
United States Department of Agriculture-Natural Resources Conservation Service
5.2 LOCAL GOVERNMENT
City of Trinidad Water District Bryan Buckman
Humboldt County Sheriff’s Department George Cavinta
5.3 PREPARERS OF ENVIRONMENTAL ASSESSMENT
Analytical Environmental Services Project Director: David Zweig, P.E. Project Manager: Trent Wilson Technical Staff Charlane Gross Sam Schoevaars Glenn Mayfield Dana Hirschberg

APPENDICES

APPENDIX APRELIMINARY WASTEWATER FEASIBILITY REPORT
September 29, 2016 Russ Wenham, P.E. Omni Means 330 Hartnell Avenue Suite B Redding, CA 96002 RE: Preliminary Feasibility Report for Trinidad Rancheria Cher-Ae Heights Facility
Dear Russ,
Here is our Preliminary Feasibility Report for the Trinidad Rancheria Cher-Ae Heights Facility, one mile south of Trinidad in Humboldt County California.
This report is based on a site visit with Kenneth Smith, the current plant operator on Monday September 26, 2016 and a review of available documentation. Of particular value to the review was the document prepared by Winzler & Kelly Trinidad Rancheria Phase 2 Community Wastewater Investigation – Wastewater Treatment, Disposal and Reuse Assessment, March 2004 (Assessment.) This document is an excellent tool for the Rancheria to use in their planning efforts going forward and was used as the basis of this current analysis. A copy of the document is attached for reference. The assumptions in the assessment are sound and have been updated as necessary to reflect current data and our professional opinion.
FFacility Description The Cher-Ae Heights area includes a residential area, the Cher-Ae Heights Casino (Casino), a former clinic complex (currently vacant) and the Tribal Office. In 2002, the Rancheria expanded the Cher-Ae Heights Casino, which includes the 200-seat restaurant and event center. A wastewater treatment plant serves the Casino and approximately 60% of the treated wastewater is recycled back into the Casino and used for toilet flushing. The remaining treated wastewater is dispersed back into the environment by means of a dispersal field (leachfield) located just south of the Tribal Office. The homes at Cher-Ae Heights, with two exceptions, are served by individual septic tanks and dispersal fields. The remaining two homes, the Tribal Office and the former clinic complex are served by septic tanks that flow by gravity or are pumped to the same dispersal field that services the Casino's tertiary treatment system. No secondary or tertiary treatment is provided to flows from these auxiliary facilities.
The Rancheria is proposing to add a 100 room hotel to the facility.
Wastewater Flow Analysis In Table ES.1 of the Assessment, a prediction of facility wastewater flows was provided. This table projected potential future wastewater flows from the Casino, the Cher-Ae Heights community flows, and a potential new 200-room hotel and gas station/mini-mart. Given the marginal soil conditions in the area, the Assessment assumed capacity for homes not connected to the wastewater system would
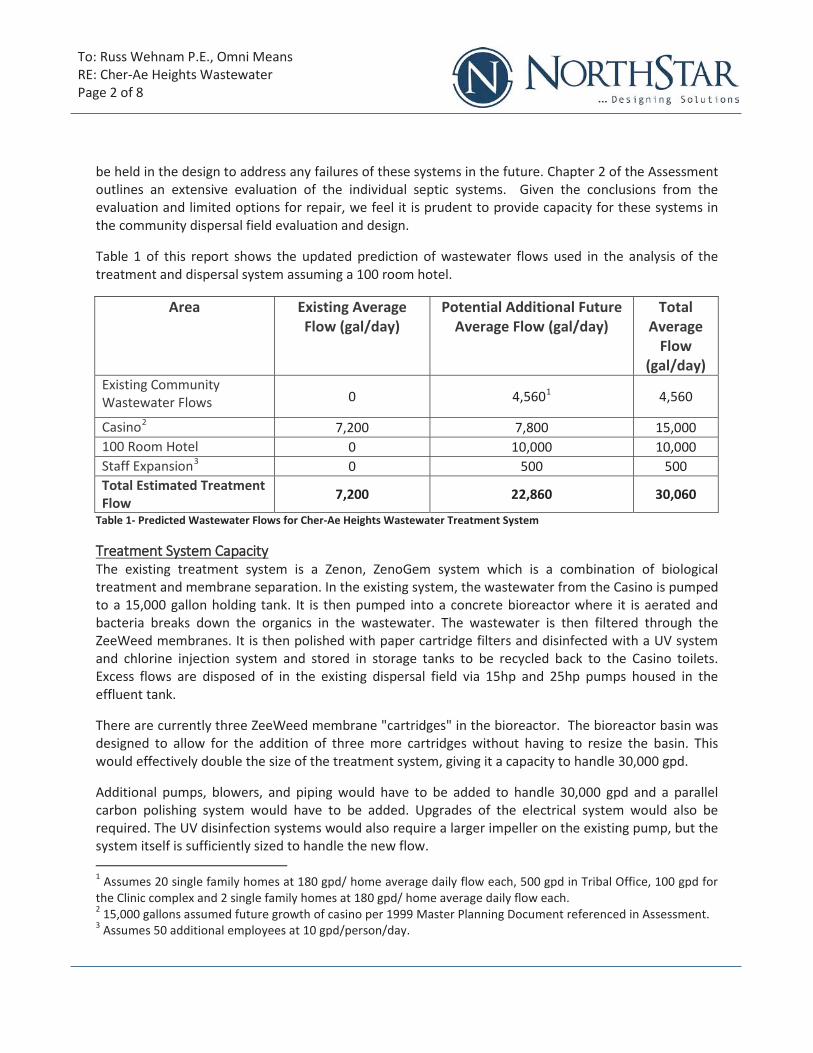
To: Russ Wehnam P.E., Omni Means RE: Cher-Ae Heights Wastewater Page 2 of 8
be held in the design to address any failures of these systems in the future. Chapter 2 of the Assessment outlines an extensive evaluation of the individual septic systems. Given the conclusions from the evaluation and limited options for repair, we feel it is prudent to provide capacity for these systems in the community dispersal field evaluation and design.
Table 1 of this report shows the updated prediction of wastewater flows used in the analysis of the treatment and dispersal system assuming a 100 room hotel.
Area Existing Average Flow (gal/day)
Potential Additional Future Average Flow (gal/day)
Total Average
Flow (gal/day)
Existing Community Wastewater Flows 0 4,5601 4,560
Casino2 7,200 7,800 15,000 100 Room Hotel 0 10,000 10,000 Staff Expansion3 0 500 500 Total Estimated Treatment Flow 7,200 22,860 30,060
Table 1- Predicted Wastewater Flows for Cher-Ae Heights Wastewater Treatment System
Treatment System Capacity The existing treatment system is a Zenon, ZenoGem system which is a combination of biological treatment and membrane separation. In the existing system, the wastewater from the Casino is pumped to a 15,000 gallon holding tank. It is then pumped into a concrete bioreactor where it is aerated and bacteria breaks down the organics in the wastewater. The wastewater is then filtered through the ZeeWeed membranes. It is then polished with paper cartridge filters and disinfected with a UV system and chlorine injection system and stored in storage tanks to be recycled back to the Casino toilets. Excess flows are disposed of in the existing dispersal field via 15hp and 25hp pumps housed in the effluent tank.
There are currently three ZeeWeed membrane "cartridges" in the bioreactor. The bioreactor basin was designed to allow for the addition of three more cartridges without having to resize the basin. This would effectively double the size of the treatment system, giving it a capacity to handle 30,000 gpd.
Additional pumps, blowers, and piping would have to be added to handle 30,000 gpd and a parallel carbon polishing system would have to be added. Upgrades of the electrical system would also be required. The UV disinfection systems would also require a larger impeller on the existing pump, but the system itself is sufficiently sized to handle the new flow.
1 Assumes 20 single family homes at 180 gpd/ home average daily flow each, 500 gpd in Tribal Office, 100 gpd for the Clinic complex and 2 single family homes at 180 gpd/ home average daily flow each. 2 15,000 gallons assumed future growth of casino per 1999 Master Planning Document referenced in Assessment. 3 Assumes 50 additional employees at 10 gpd/person/day.
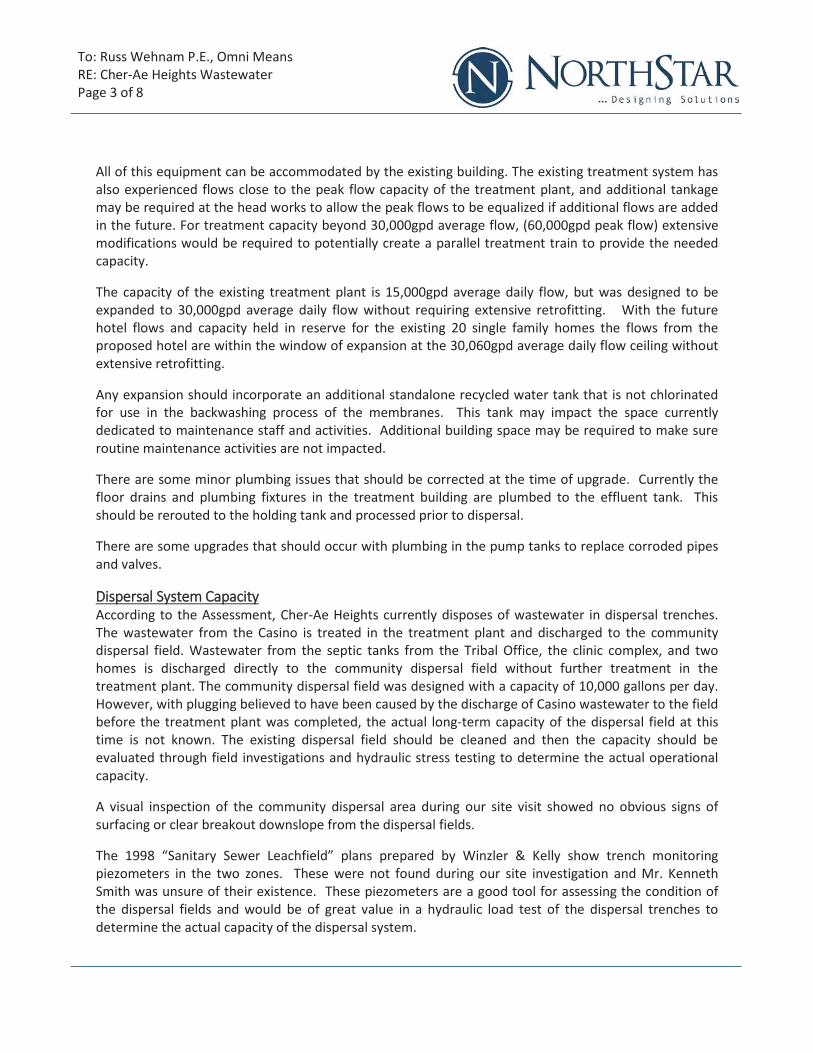
To: Russ Wehnam P.E., Omni Means RE: Cher-Ae Heights Wastewater Page 3 of 8
All of this equipment can be accommodated by the existing building. The existing treatment system has also experienced flows close to the peak flow capacity of the treatment plant, and additional tankage may be required at the head works to allow the peak flows to be equalized if additional flows are added in the future. For treatment capacity beyond 30,000gpd average flow, (60,000gpd peak flow) extensive modifications would be required to potentially create a parallel treatment train to provide the needed capacity.
The capacity of the existing treatment plant is 15,000gpd average daily flow, but was designed to be expanded to 30,000gpd average daily flow without requiring extensive retrofitting. With the future hotel flows and capacity held in reserve for the existing 20 single family homes the flows from the proposed hotel are within the window of expansion at the 30,060gpd average daily flow ceiling without extensive retrofitting.
Any expansion should incorporate an additional standalone recycled water tank that is not chlorinated for use in the backwashing process of the membranes. This tank may impact the space currently dedicated to maintenance staff and activities. Additional building space may be required to make sure routine maintenance activities are not impacted.
There are some minor plumbing issues that should be corrected at the time of upgrade. Currently the floor drains and plumbing fixtures in the treatment building are plumbed to the effluent tank. This should be rerouted to the holding tank and processed prior to dispersal.
There are some upgrades that should occur with plumbing in the pump tanks to replace corroded pipes and valves.
Dispersal System Capacity According to the Assessment, Cher-Ae Heights currently disposes of wastewater in dispersal trenches. The wastewater from the Casino is treated in the treatment plant and discharged to the community dispersal field. Wastewater from the septic tanks from the Tribal Office, the clinic complex, and two homes is discharged directly to the community dispersal field without further treatment in the treatment plant. The community dispersal field was designed with a capacity of 10,000 gallons per day. However, with plugging believed to have been caused by the discharge of Casino wastewater to the field before the treatment plant was completed, the actual long-term capacity of the dispersal field at this time is not known. The existing dispersal field should be cleaned and then the capacity should be evaluated through field investigations and hydraulic stress testing to determine the actual operational capacity.
A visual inspection of the community dispersal area during our site visit showed no obvious signs of surfacing or clear breakout downslope from the dispersal fields.
The 1998 “Sanitary Sewer Leachfield” plans prepared by Winzler & Kelly show trench monitoring piezometers in the two zones. These were not found during our site investigation and Mr. Kenneth Smith was unsure of their existence. These piezometers are a good tool for assessing the condition of the dispersal fields and would be of great value in a hydraulic load test of the dispersal trenches to determine the actual capacity of the dispersal system.
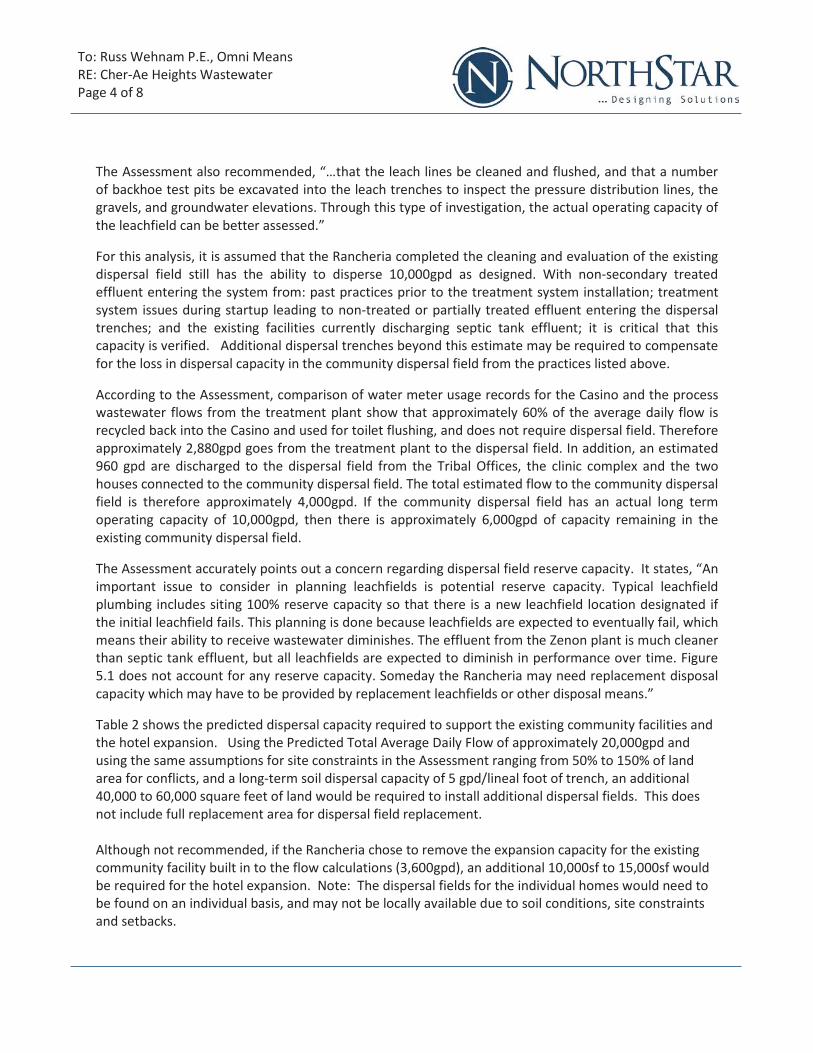
To: Russ Wehnam P.E., Omni Means RE: Cher-Ae Heights Wastewater Page 4 of 8
The Assessment also recommended, “…that the leach lines be cleaned and flushed, and that a number of backhoe test pits be excavated into the leach trenches to inspect the pressure distribution lines, the gravels, and groundwater elevations. Through this type of investigation, the actual operating capacity of the leachfield can be better assessed.”
For this analysis, it is assumed that the Rancheria completed the cleaning and evaluation of the existing dispersal field still has the ability to disperse 10,000gpd as designed. With non-secondary treated effluent entering the system from: past practices prior to the treatment system installation; treatment system issues during startup leading to non-treated or partially treated effluent entering the dispersal trenches; and the existing facilities currently discharging septic tank effluent; it is critical that this capacity is verified. Additional dispersal trenches beyond this estimate may be required to compensate for the loss in dispersal capacity in the community dispersal field from the practices listed above.
According to the Assessment, comparison of water meter usage records for the Casino and the process wastewater flows from the treatment plant show that approximately 60% of the average daily flow is recycled back into the Casino and used for toilet flushing, and does not require dispersal field. Therefore approximately 2,880gpd goes from the treatment plant to the dispersal field. In addition, an estimated 960 gpd are discharged to the dispersal field from the Tribal Offices, the clinic complex and the two houses connected to the community dispersal field. The total estimated flow to the community dispersal field is therefore approximately 4,000gpd. If the community dispersal field has an actual long term operating capacity of 10,000gpd, then there is approximately 6,000gpd of capacity remaining in the existing community dispersal field.
The Assessment accurately points out a concern regarding dispersal field reserve capacity. It states, “An important issue to consider in planning leachfields is potential reserve capacity. Typical leachfield plumbing includes siting 100% reserve capacity so that there is a new leachfield location designated if the initial leachfield fails. This planning is done because leachfields are expected to eventually fail, which means their ability to receive wastewater diminishes. The effluent from the Zenon plant is much cleaner than septic tank effluent, but all leachfields are expected to diminish in performance over time. Figure 5.1 does not account for any reserve capacity. Someday the Rancheria may need replacement disposal capacity which may have to be provided by replacement leachfields or other disposal means.”
Table 2 shows the predicted dispersal capacity required to support the existing community facilities and the hotel expansion. Using the Predicted Total Average Daily Flow of approximately 20,000gpd and using the same assumptions for site constraints in the Assessment ranging from 50% to 150% of land area for conflicts, and a long-term soil dispersal capacity of 5 gpd/lineal foot of trench, an additional 40,000 to 60,000 square feet of land would be required to install additional dispersal fields. This does not include full replacement area for dispersal field replacement. Although not recommended, if the Rancheria chose to remove the expansion capacity for the existing community facility built in to the flow calculations (3,600gpd), an additional 10,000sf to 15,000sf would be required for the hotel expansion. Note: The dispersal fields for the individual homes would need to be found on an individual basis, and may not be locally available due to soil conditions, site constraints and setbacks.
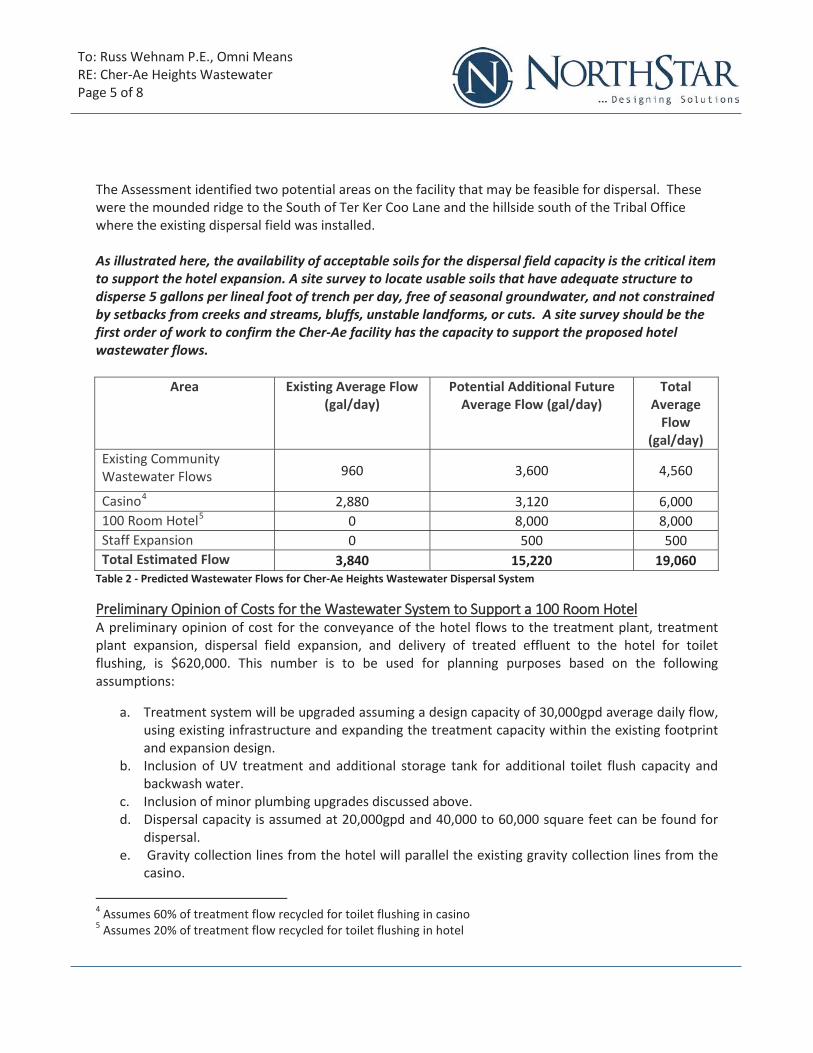
To: Russ Wehnam P.E., Omni Means RE: Cher-Ae Heights Wastewater Page 5 of 8
The Assessment identified two potential areas on the facility that may be feasible for dispersal. These were the mounded ridge to the South of Ter Ker Coo Lane and the hillside south of the Tribal Office where the existing dispersal field was installed. As illustrated here, the availability of acceptable soils for the dispersal field capacity is the critical item to support the hotel expansion. A site survey to locate usable soils that have adequate structure to disperse 5 gallons per lineal foot of trench per day, free of seasonal groundwater, and not constrained by setbacks from creeks and streams, bluffs, unstable landforms, or cuts. A site survey should be the first order of work to confirm the Cher-Ae facility has the capacity to support the proposed hotel wastewater flows.
Area Existing Average Flow (gal/day)
Potential Additional Future Average Flow (gal/day)
Total Average
Flow (gal/day)
Existing Community Wastewater Flows 960 3,600 4,560
Casino4 2,880 3,120 6,000 100 Room Hotel5 0 8,000 8,000 Staff Expansion 0 500 500 Total Estimated Flow 3,840 15,220 19,060
Table 2 - Predicted Wastewater Flows for Cher-Ae Heights Wastewater Dispersal System
Preliminary Opinion of Costs for the Wastewater System to Support a 100 Room Hotel A preliminary opinion of cost for the conveyance of the hotel flows to the treatment plant, treatment plant expansion, dispersal field expansion, and delivery of treated effluent to the hotel for toilet flushing, is $620,000. This number is to be used for planning purposes based on the following assumptions:
a. Treatment system will be upgraded assuming a design capacity of 30,000gpd average daily flow, using existing infrastructure and expanding the treatment capacity within the existing footprint and expansion design.
b. Inclusion of UV treatment and additional storage tank for additional toilet flush capacity and backwash water.
c. Inclusion of minor plumbing upgrades discussed above. d. Dispersal capacity is assumed at 20,000gpd and 40,000 to 60,000 square feet can be found for
dispersal. e. Gravity collection lines from the hotel will parallel the existing gravity collection lines from the
casino.
4 Assumes 60% of treatment flow recycled for toilet flushing in casino 5 Assumes 20% of treatment flow recycled for toilet flushing in hotel
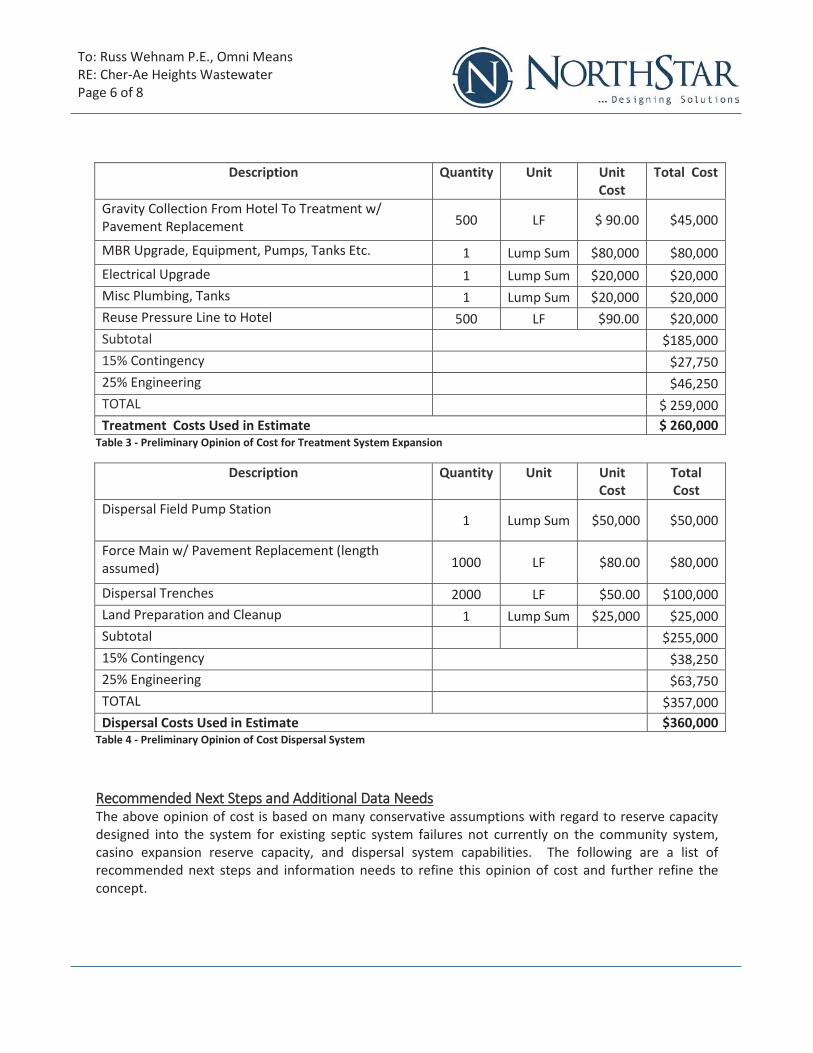
To: Russ Wehnam P.E., Omni Means RE: Cher-Ae Heights Wastewater Page 6 of 8
Description Quantity Unit Unit Cost
Total Cost
Gravity Collection From Hotel To Treatment w/ Pavement Replacement 500 LF $ 90.00 $45,000
MBR Upgrade, Equipment, Pumps, Tanks Etc. 1 Lump Sum $80,000 $80,000 Electrical Upgrade 1 Lump Sum $20,000 $20,000 Misc Plumbing, Tanks 1 Lump Sum $20,000 $20,000 Reuse Pressure Line to Hotel 500 LF $90.00 $20,000 Subtotal $185,000 15% Contingency $27,750 25% Engineering $46,250 TOTAL $ 259,000 Treatment Costs Used in Estimate $ 260,000
Table 3 - Preliminary Opinion of Cost for Treatment System Expansion
Description Quantity Unit Unit Cost
Total Cost
Dispersal Field Pump Station 1 Lump Sum $50,000 $50,000
Force Main w/ Pavement Replacement (length assumed) 1000 LF $80.00 $80,000
Dispersal Trenches 2000 LF $50.00 $100,000 Land Preparation and Cleanup 1 Lump Sum $25,000 $25,000 Subtotal $255,000 15% Contingency $38,250 25% Engineering $63,750 TOTAL $357,000 Dispersal Costs Used in Estimate $360,000
Table 4 - Preliminary Opinion of Cost Dispersal System
Recommended Next Steps and Additional Data Needs The above opinion of cost is based on many conservative assumptions with regard to reserve capacity designed into the system for existing septic system failures not currently on the community system, casino expansion reserve capacity, and dispersal system capabilities. The following are a list of recommended next steps and information needs to refine this opinion of cost and further refine the concept.

To: Russ Wehnam P.E., Omni Means RE: Cher-Ae Heights Wastewater Page 7 of 8
1. Investigate the long-term capacity of the existing community dispersal field to confirm its long-term acceptance rate. Confirmation of this area’s actual capacity will have a significant impact on the additional dispersal area needed to support the hotel project. This may include: a. Long-term hydraulic load test to determine the maximum dispersal system captivity b. Install trench piezometers in selected dispersal trenches to monitor trench performance during
dosing events and through the winter. c. Selected trench excavations with a backhoe to physically inspect the trench conditions. d. Conduct and document routine maintenance on the pressure dosed dispersal fields, particularly
those areas where the septic tank effluent from the auxiliary uses are introduced. 2. Explore additional areas that are suitable for treated wastewater dispersal. This may include:
a. A catalog of potential areas known to long time staff and residents of areas on the Rancheria that have deeper soils not subject to seasonal high groundwater or unstable geological formations.
b. Field verify any areas identified as having potential for wastewater dispersal. This would include geotechnical analysis for any area’s suitability to disperse treated wastewater long-term. This could include but not limited to: i. Percolation testing ii. Ring Infiltration Testing iii. Long-term Infiltration Testing iv. Seasonal Groundwater Monitoring
3. Conduct routine influent and effluent sampling and testing at the treatment system to inform the treatment expansion design process.
4. Consider the pros and cons of “holding” reserve capacity in the treatment and dispersal system design for existing system not currently connected to the community system. It may be beneficial to identify smaller areas elsewhere on the Rancheria that can accommodate individual or smaller clusters of systems.
5. Consider replacement of the existing MBR cassettes along with the installation of the expansion capacity.
6. Consider reviewing options for the complete replacement of the treatment system with an updated skid mounted MBR. This option could take advantage of treatment process technology, may make operations more streamline and alleviate some of the issues associated with retrieving operational data, troubleshooting and alarm responses.
7. An upgrade of the UV system that allows for redundancy should be explored. Currently, the existing UV system is a single unit that does not have redundancy in case of failure of the unit.
8. Explore the use of ozone as part of the disinfection train. Ozone is a very strong oxidant with known disinfection capabilities and has been proven successful in removing color from treated effluent. Ozone would help reduce chlorine consumption in the disinfection process, and may help with public perception of ‘less than perfect” water in toilets and urinals.
9. With toilets in the hotels being flushed with reclaimed water, a review of toilet colors such as off white or biscuit colors reduces the contrast between any residual color in the toilet water. This could also assist with lowering water demand and chlorine consumption.

To: Russ Wehnam P.E., Omni Means RE: Cher-Ae Heights Wastewater Page 8 of 8
I cannot stress enough the need to determine if there is additional dispersal capacity on the site and where this resource is on the Rancheria. The size and location of these areas will have a significant impact on the design and associated cost with the dispersal component of the system.
I hope this information proves informative for our client and aids in the conceptual planning process for what looks to be a spectacular hotel facility. As always, I am available to answer any questions you may have.
Sincerely, NorthStar
Nick Weigel P.E. Senior Engineer Encl: Trinidad Rancheria Phase 2 Community Wastewater Investigation – Wastewater Treatment, Disposal and Reuse Assessment, March 2004, Winzler & Kelly
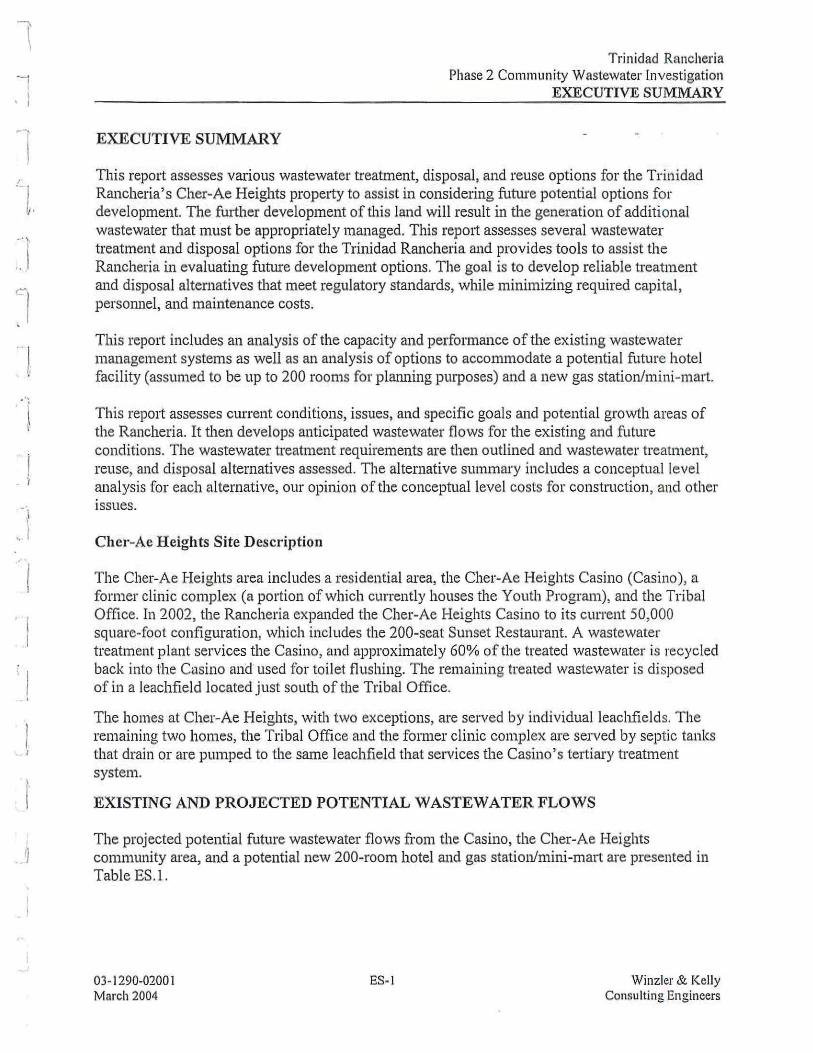
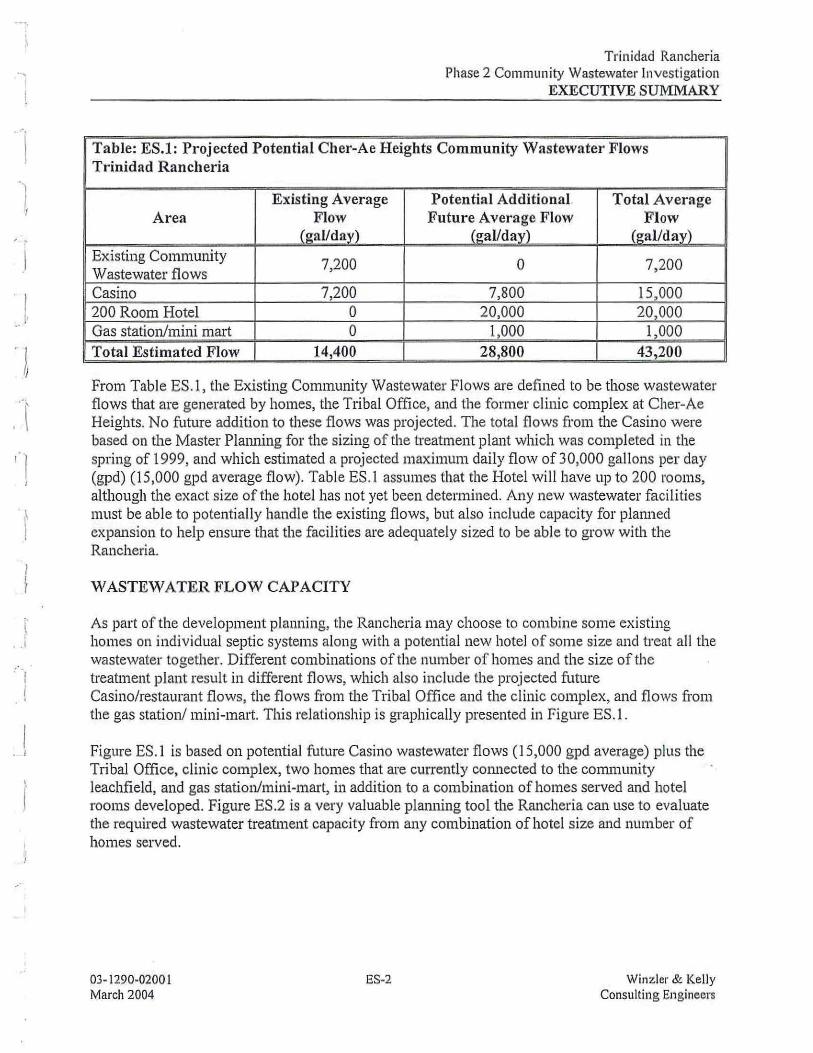
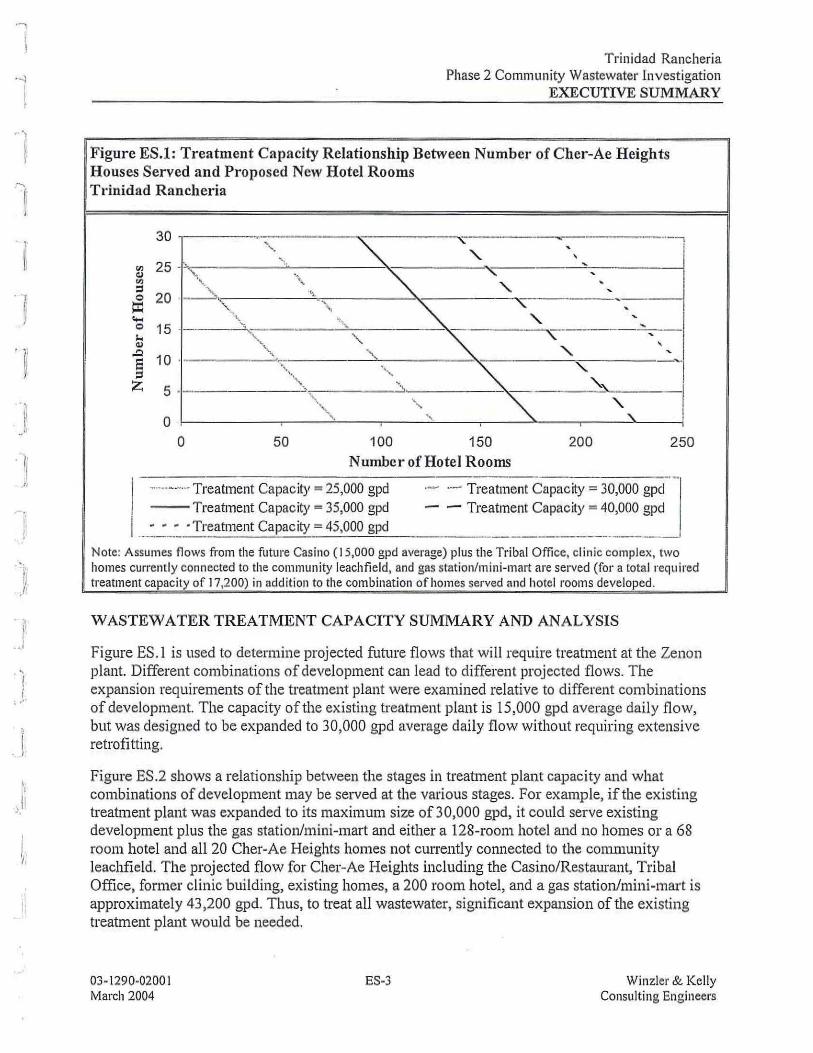
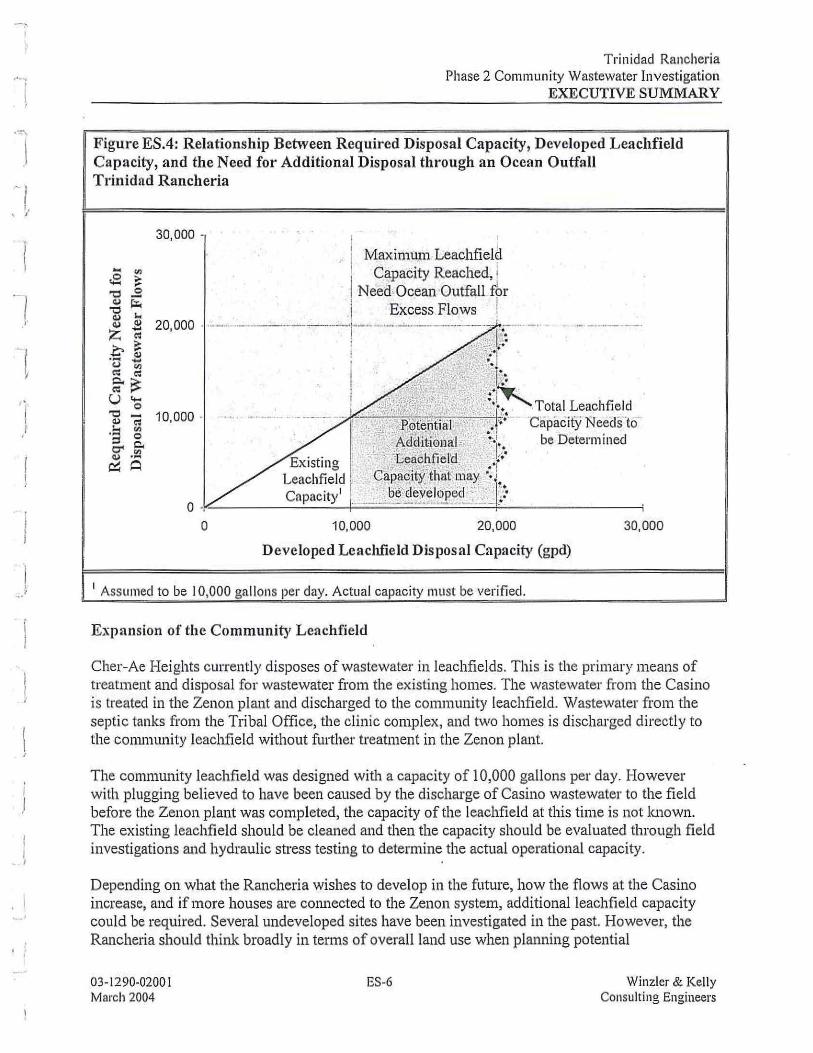
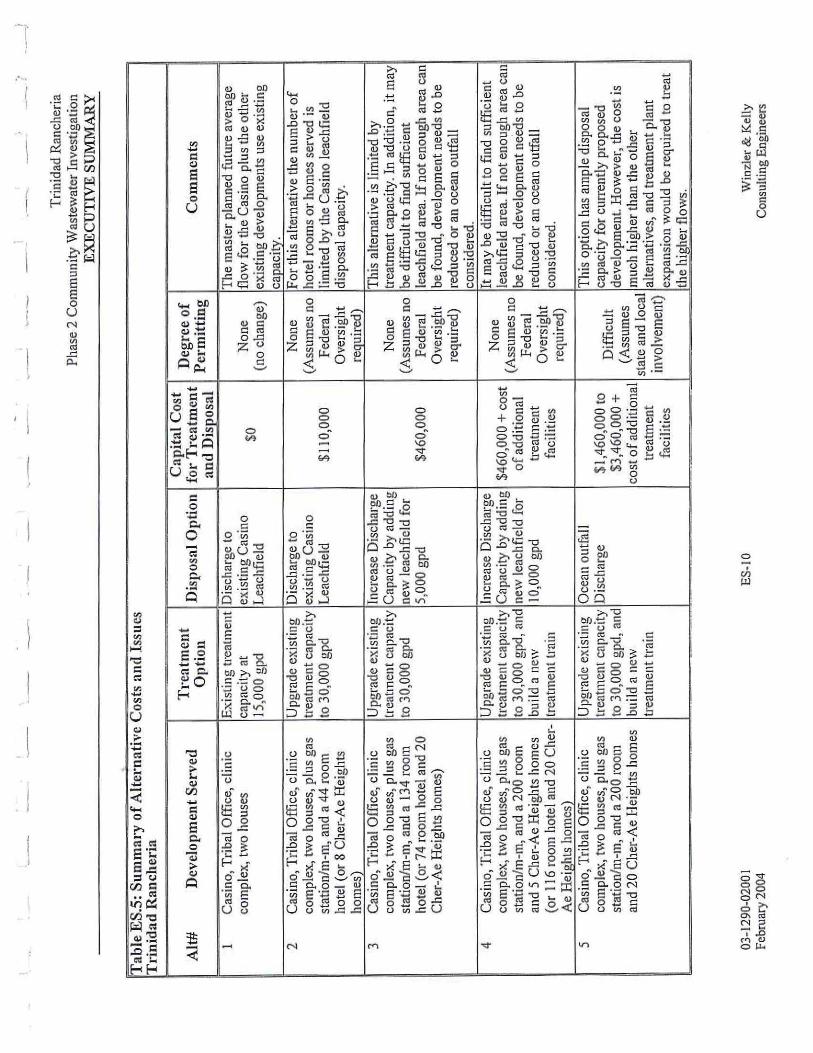
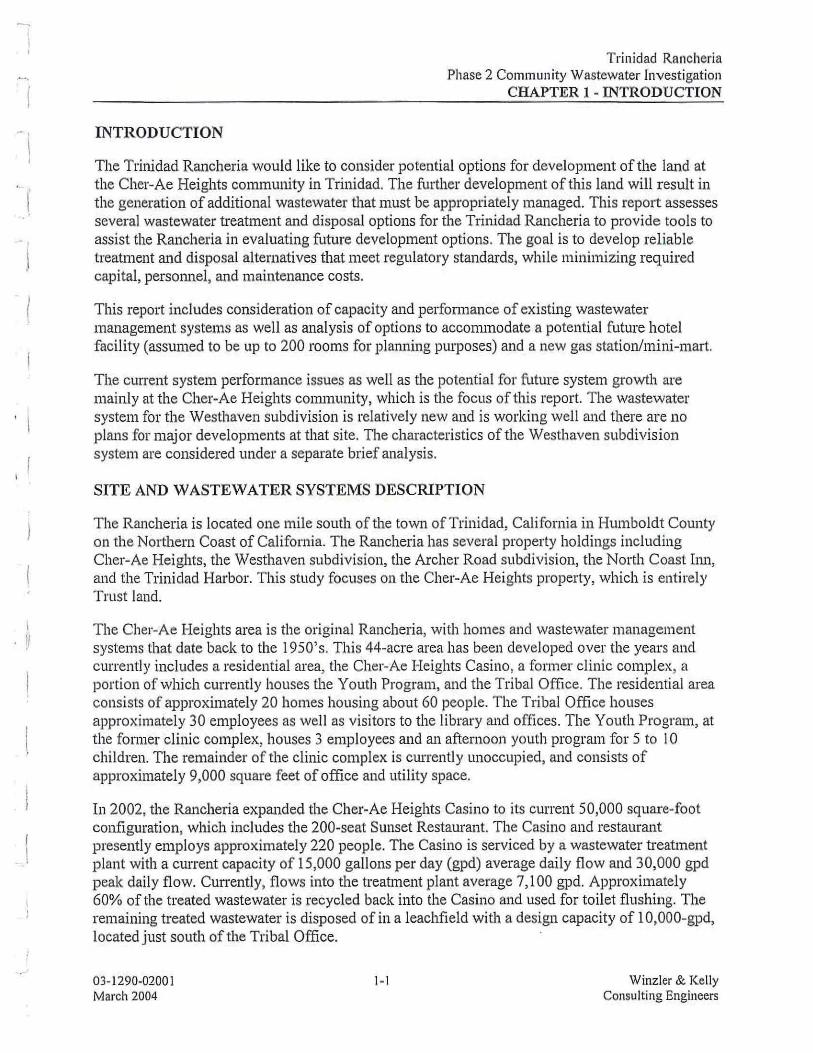
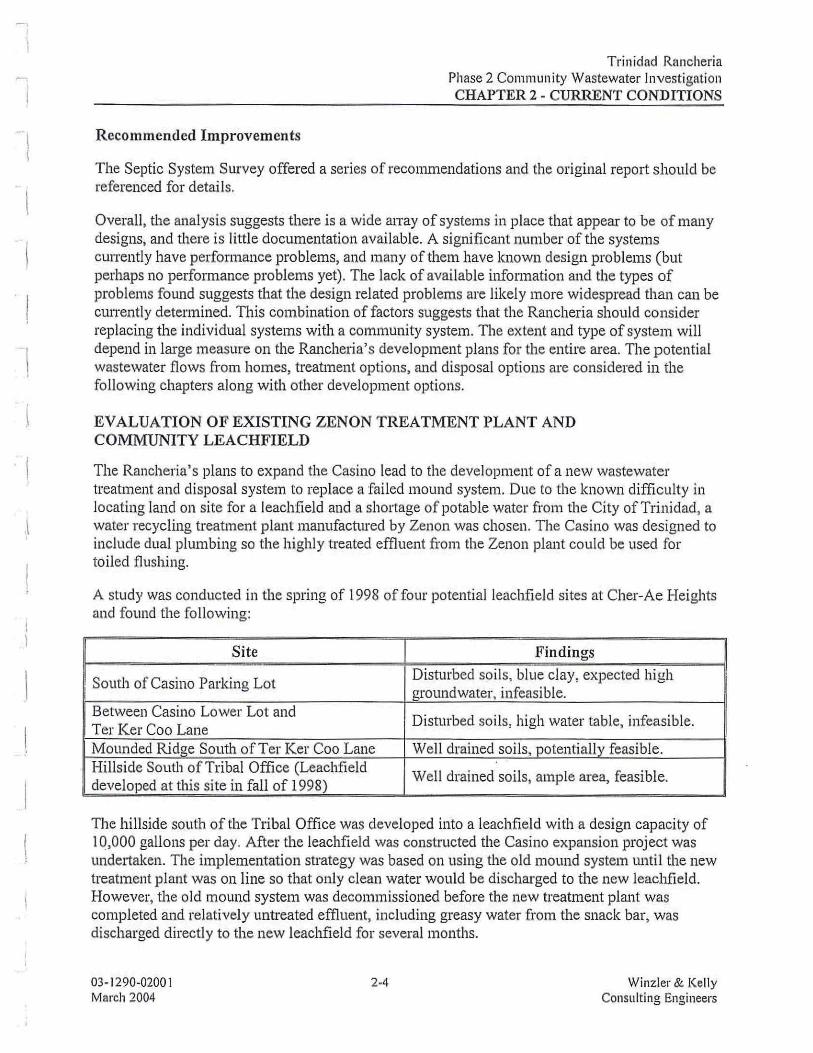
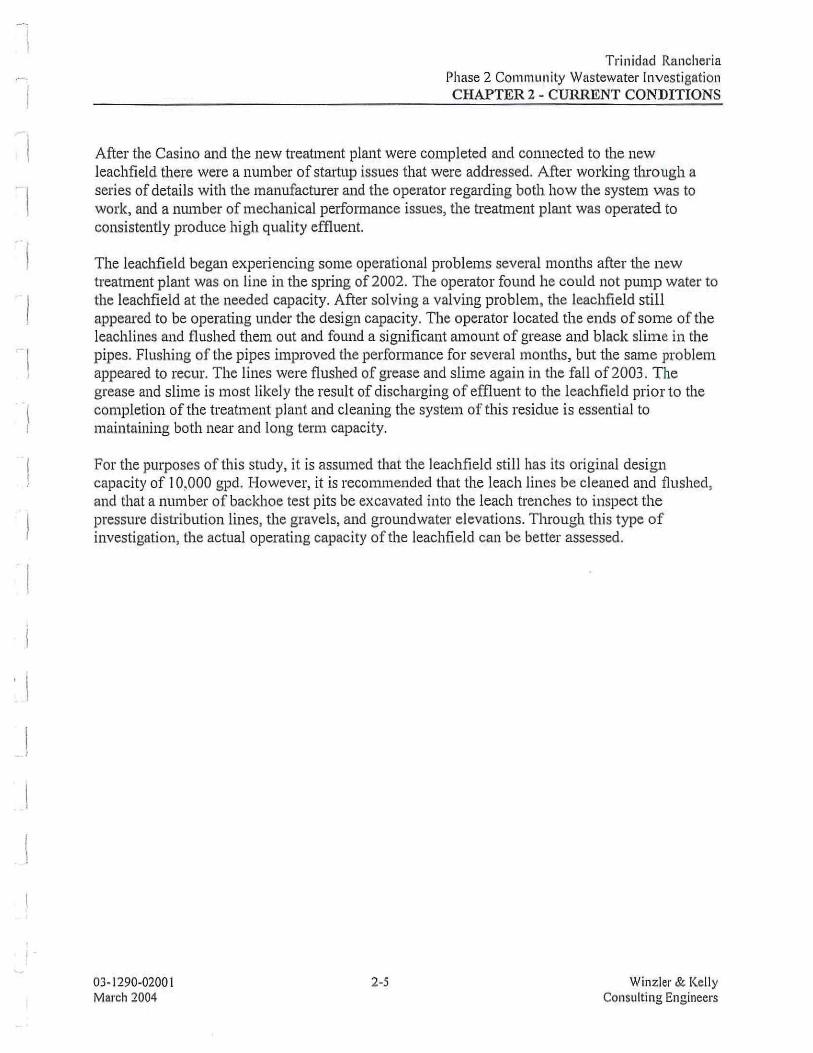
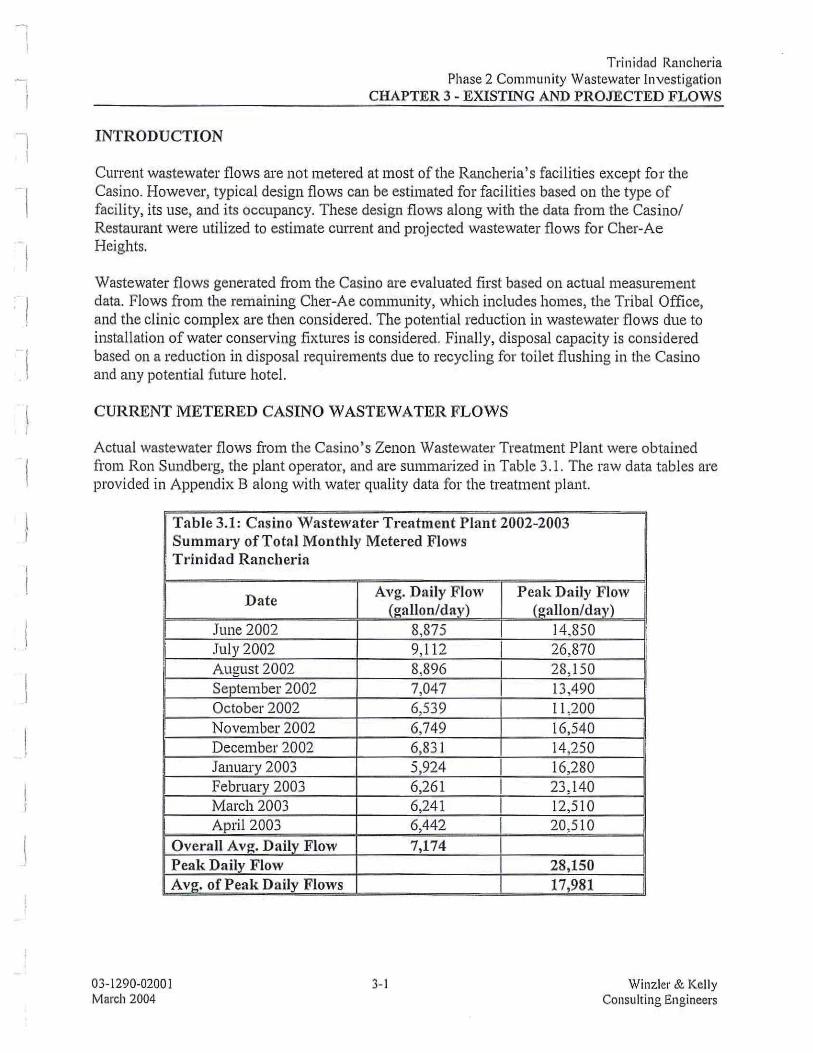
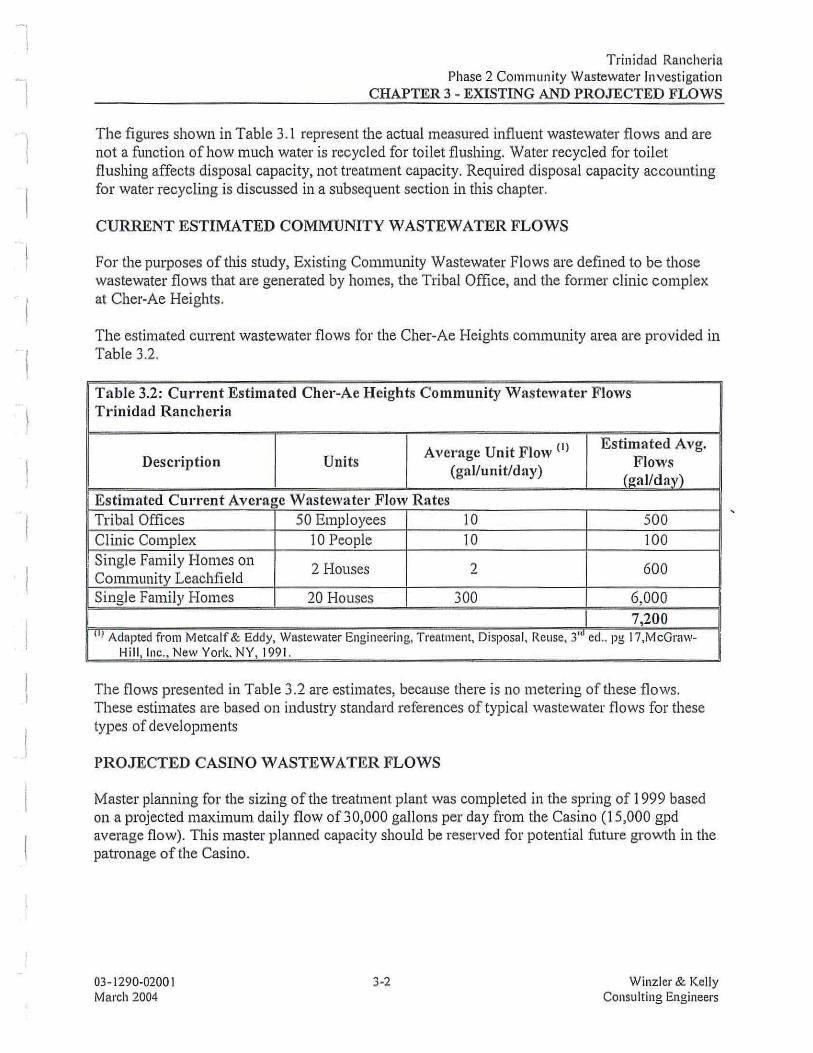
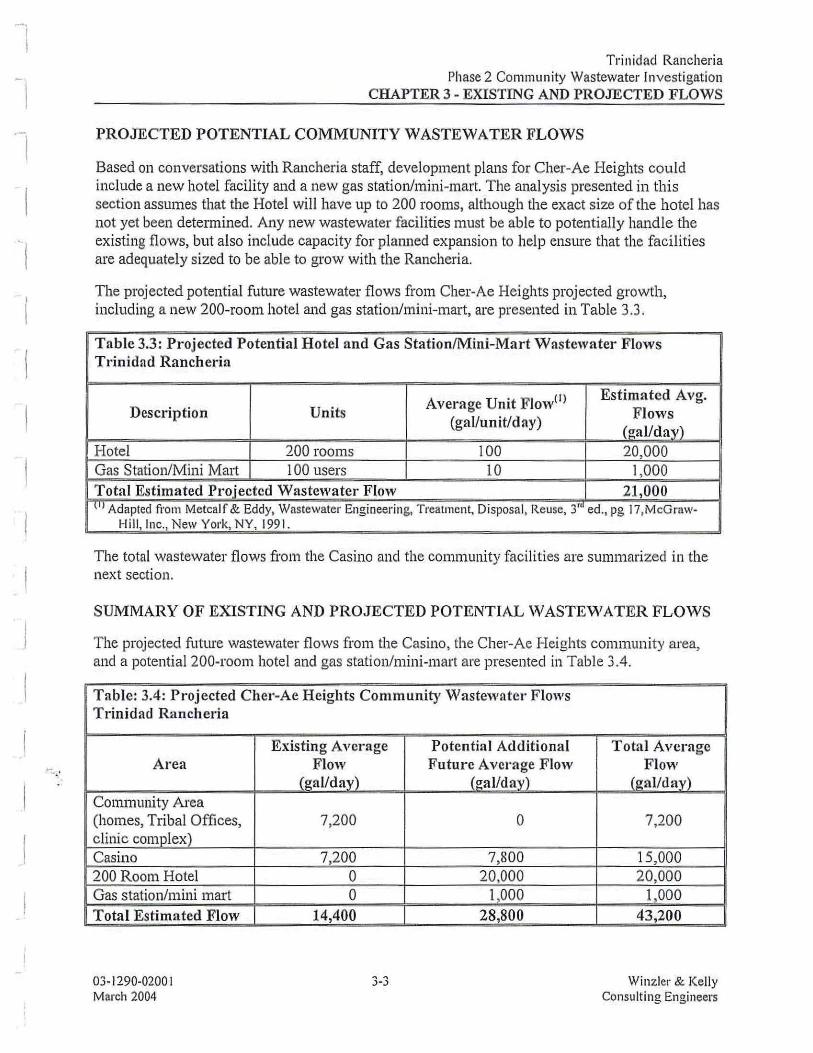
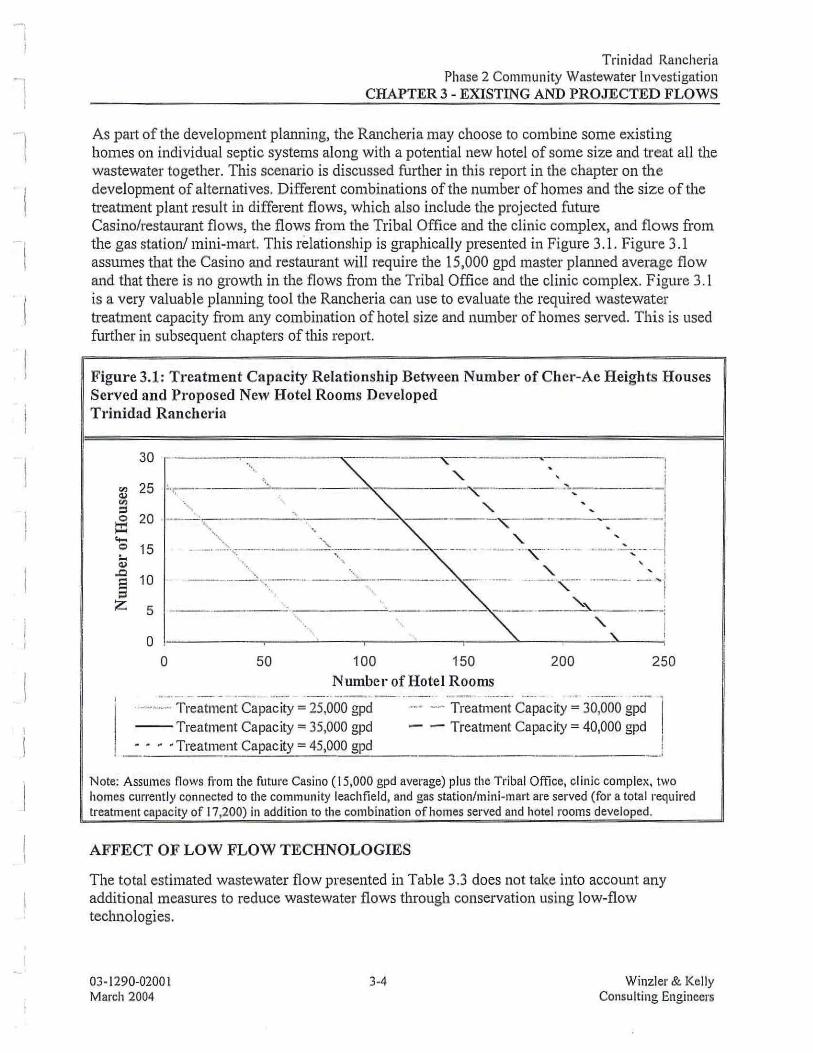
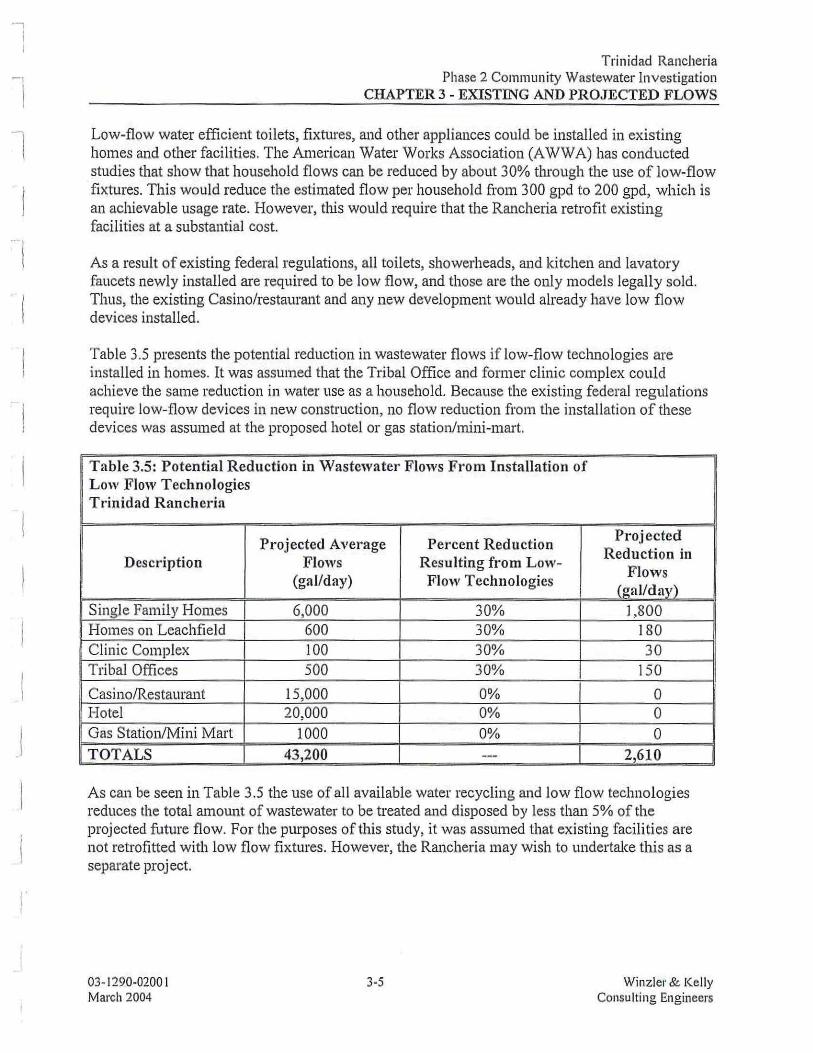
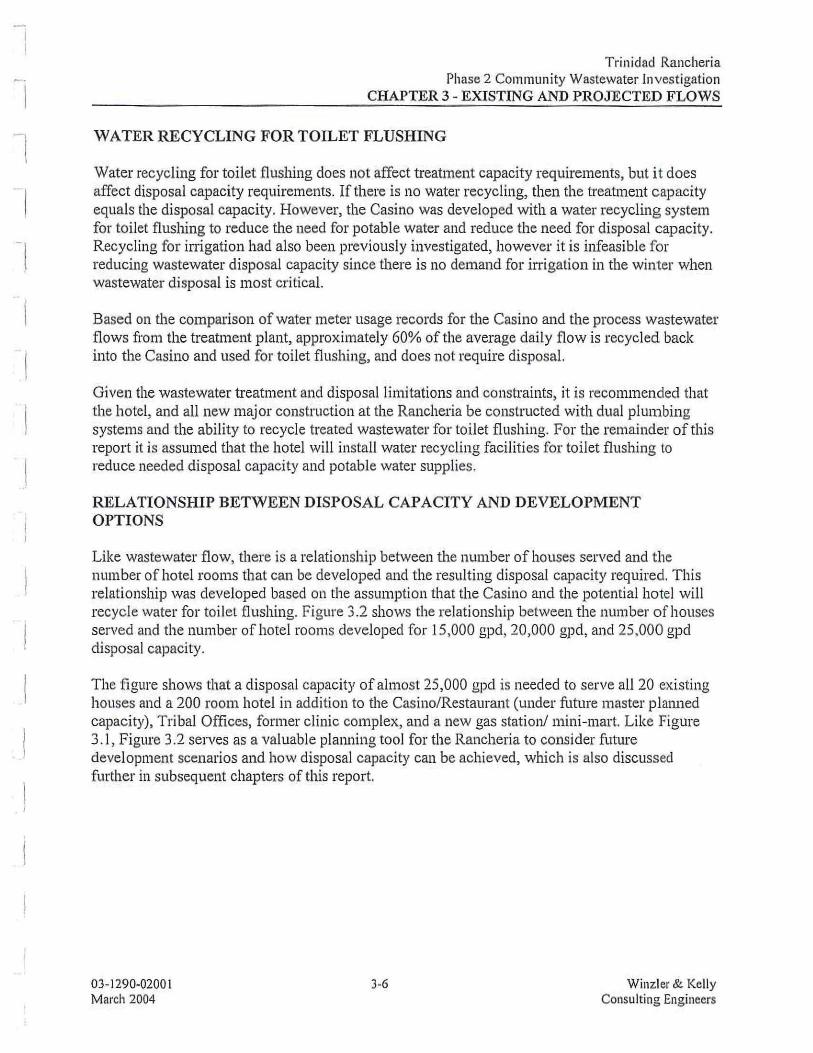
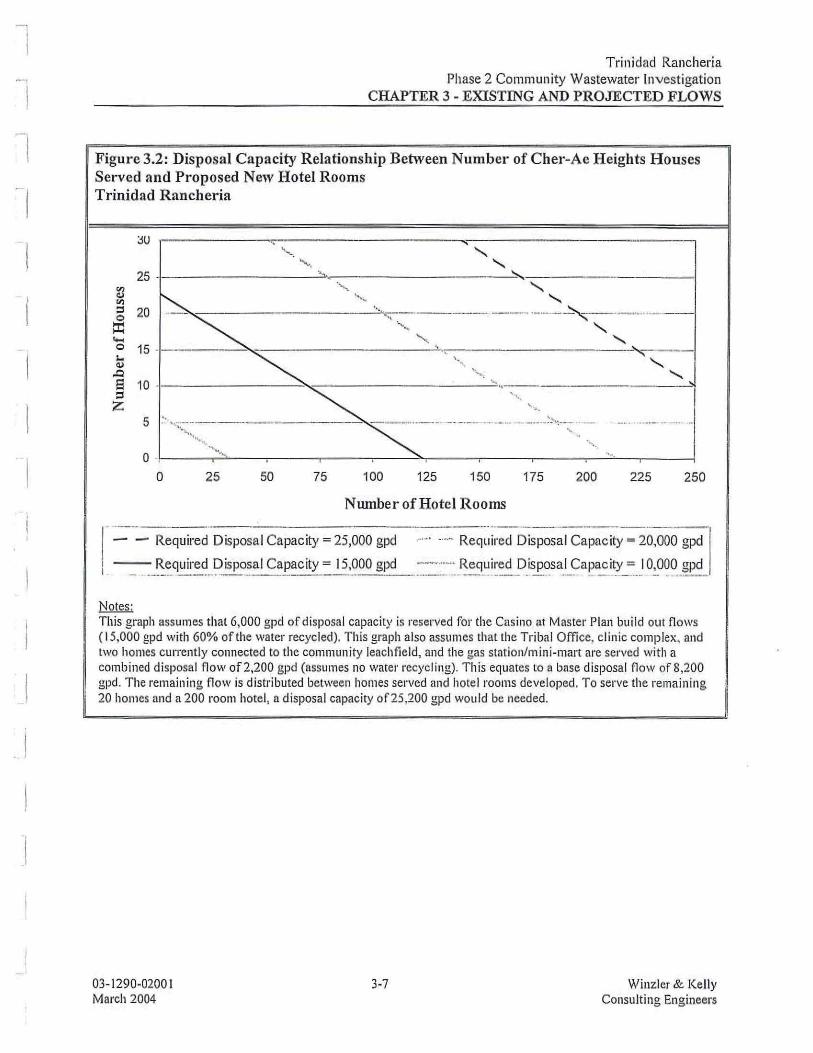

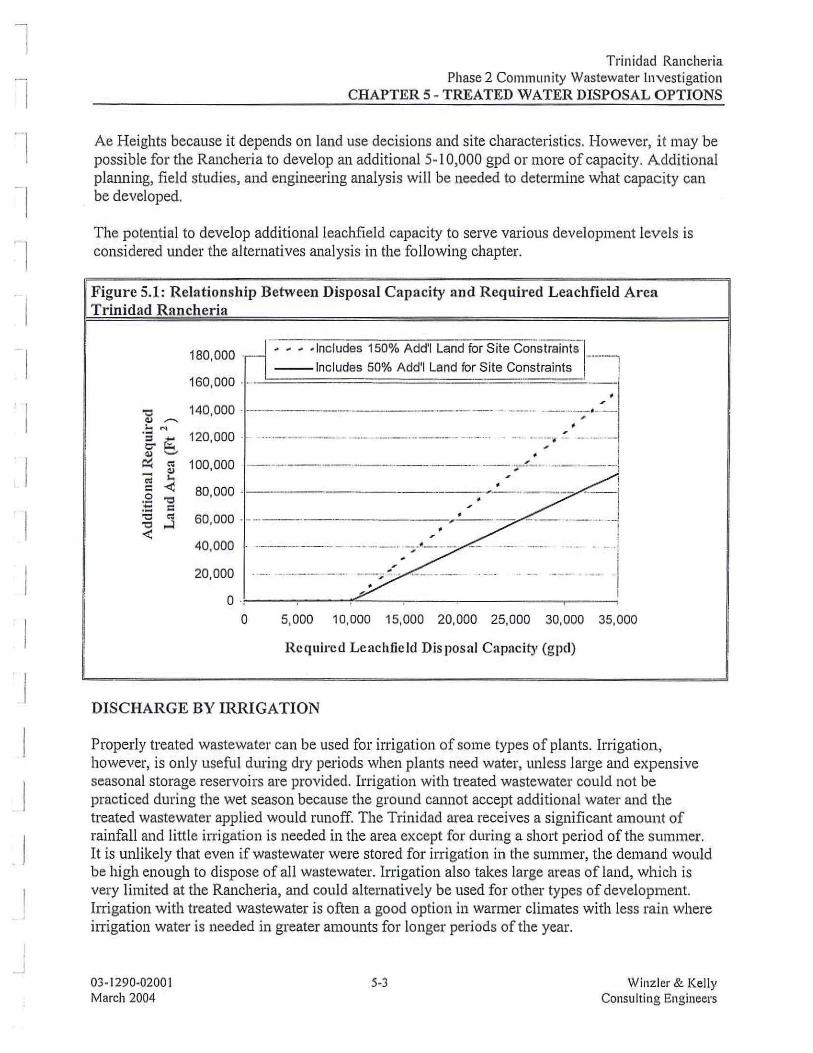
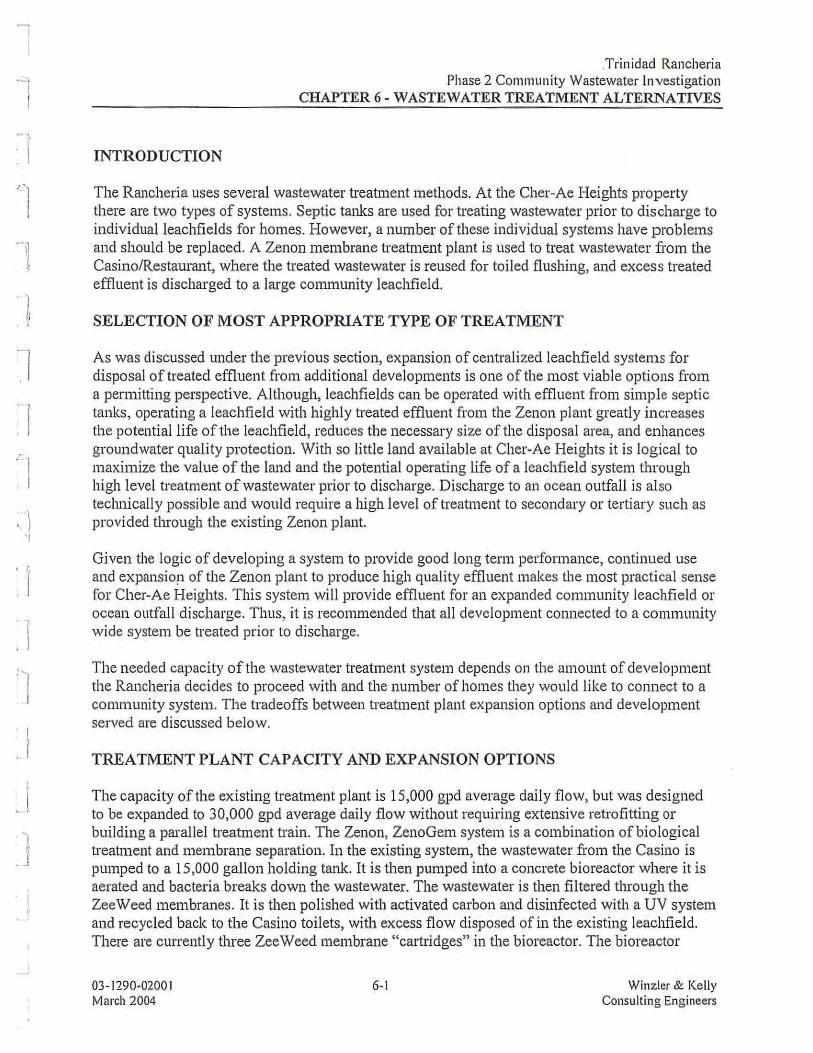
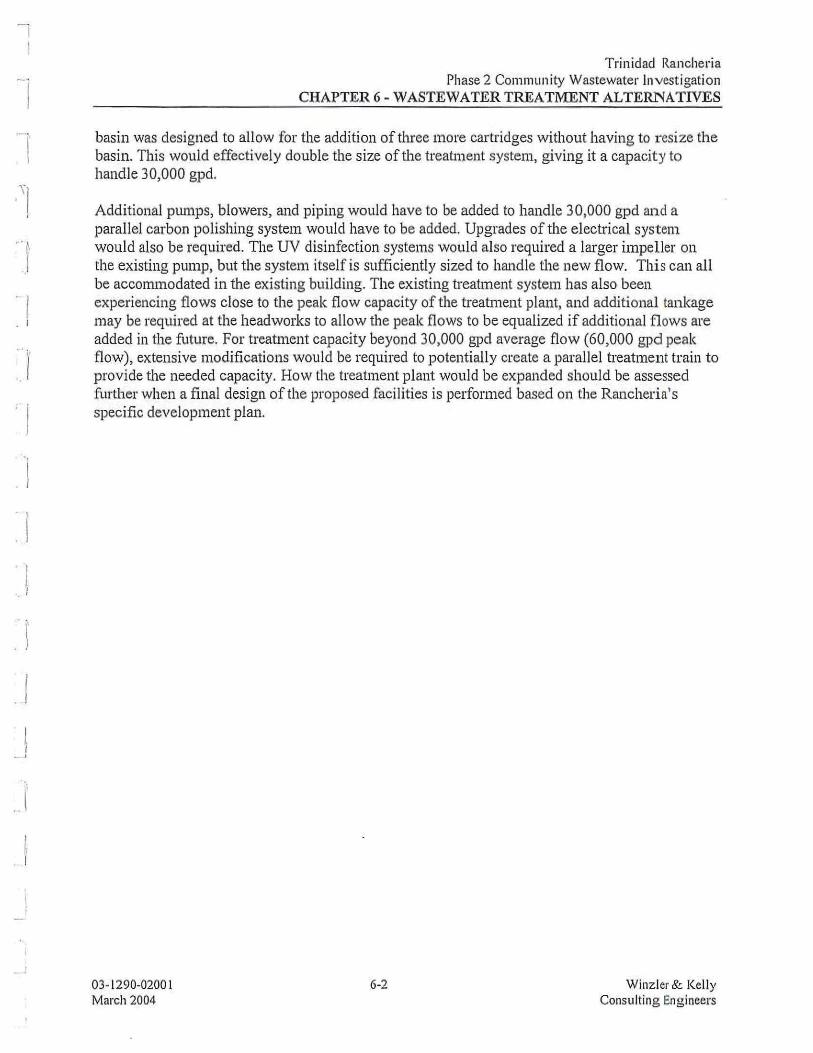
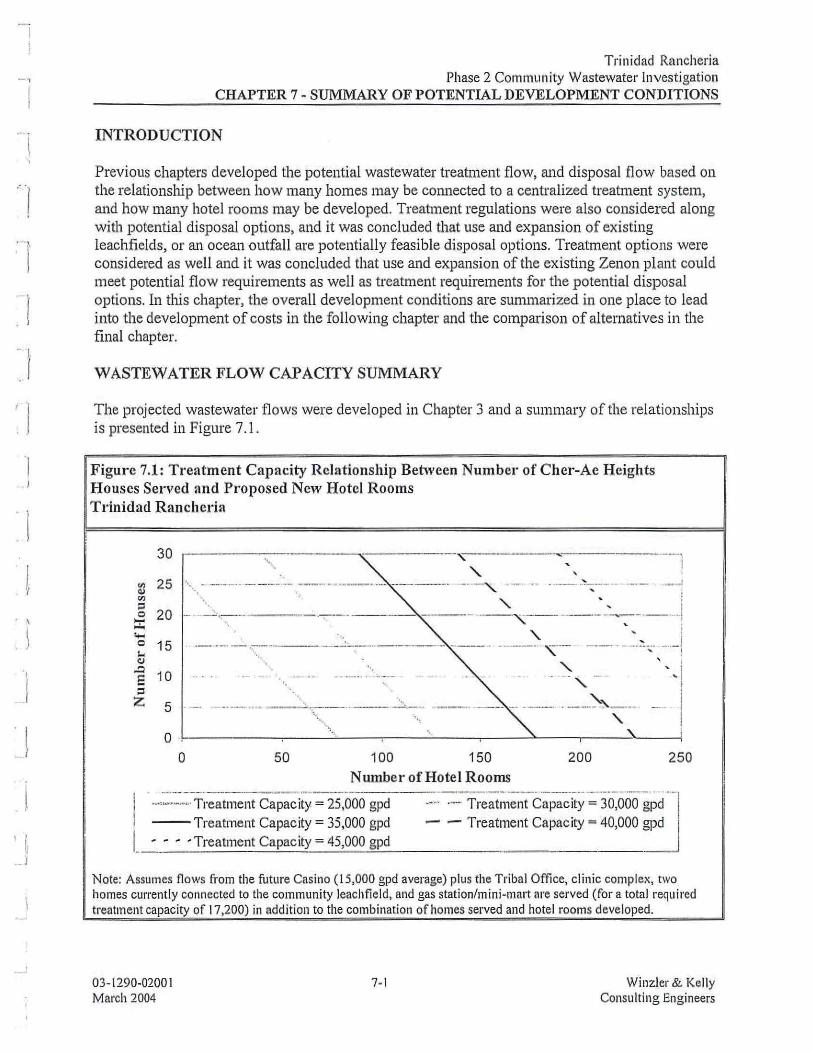
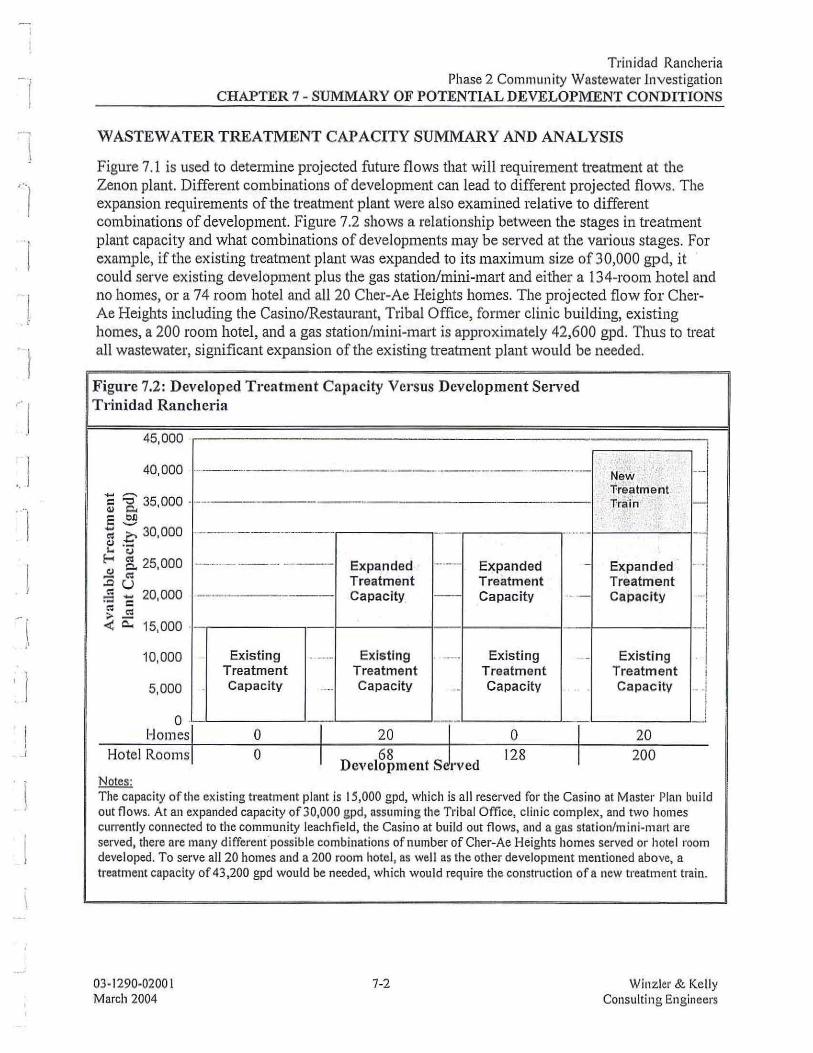
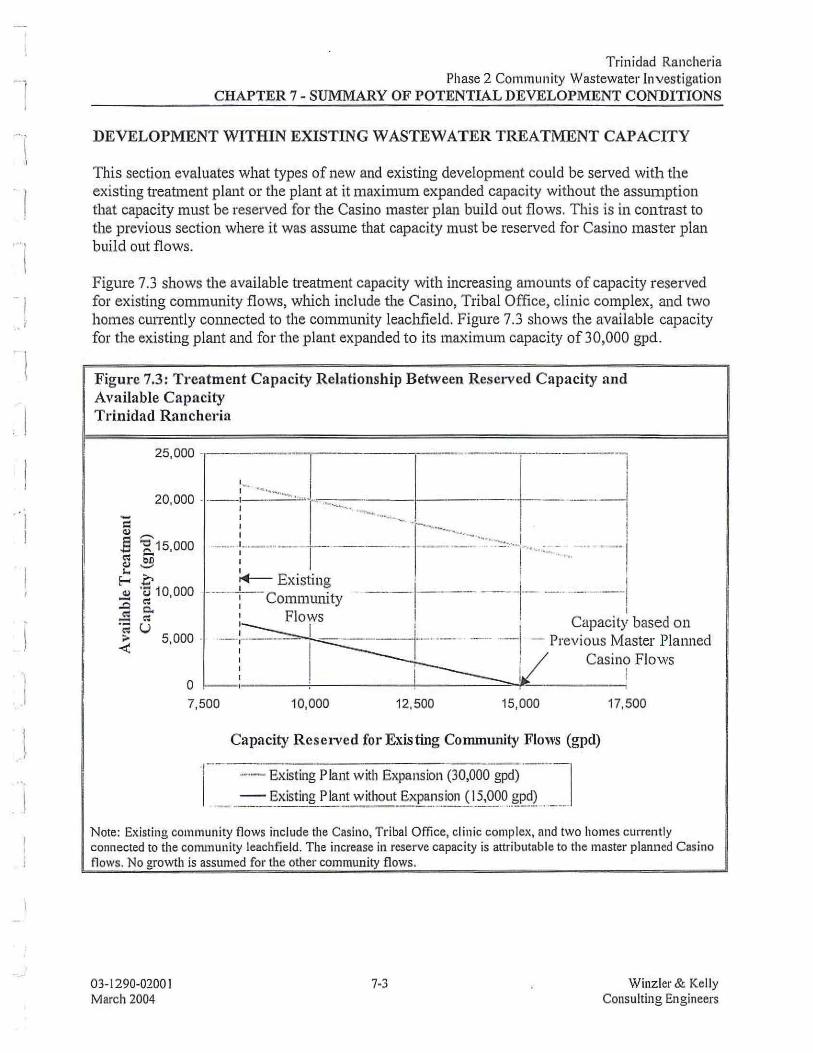
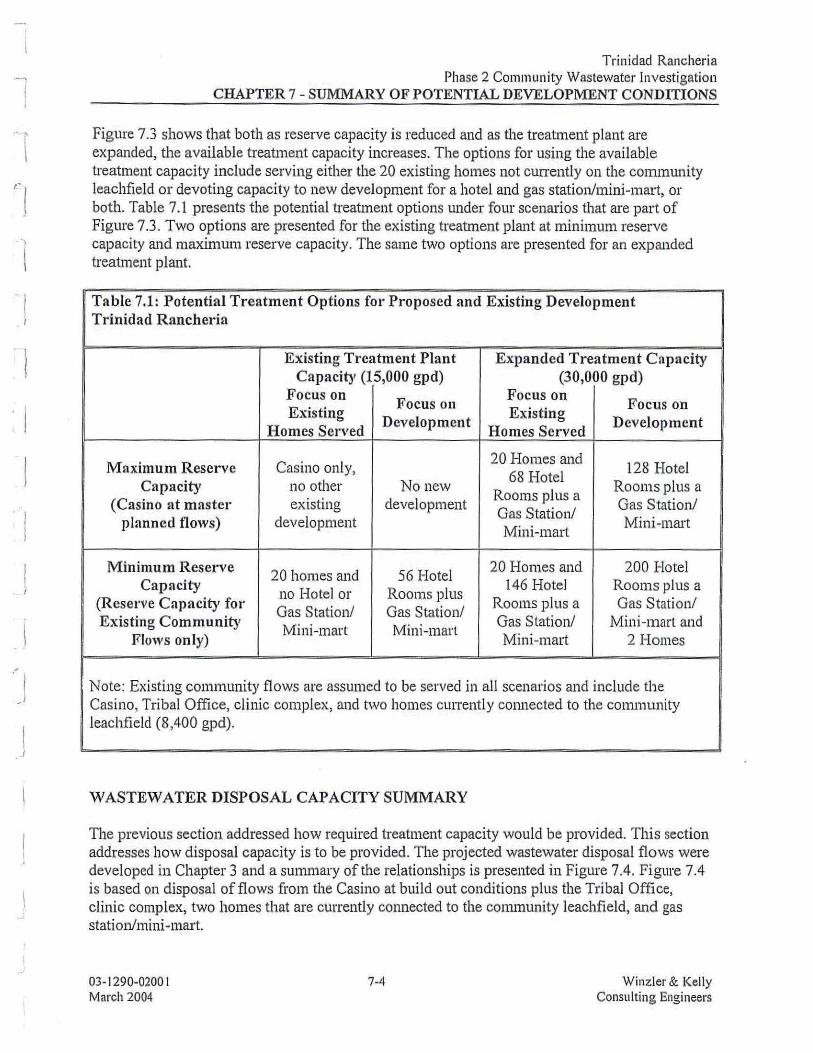
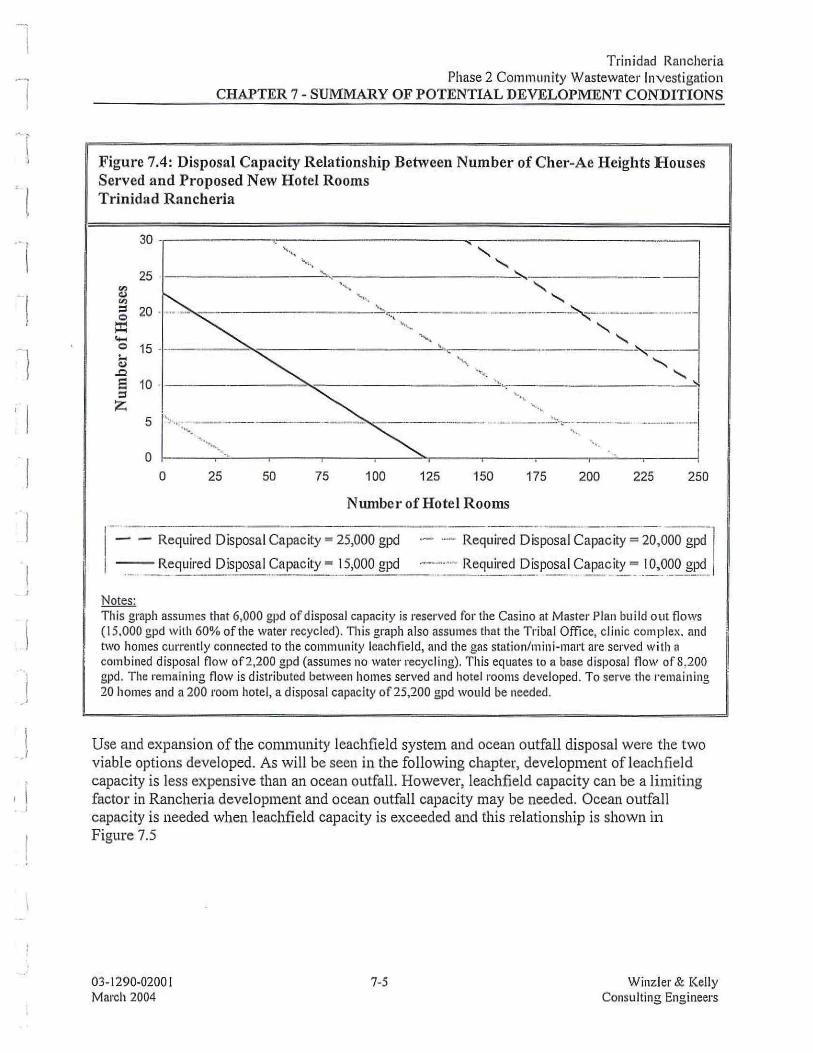
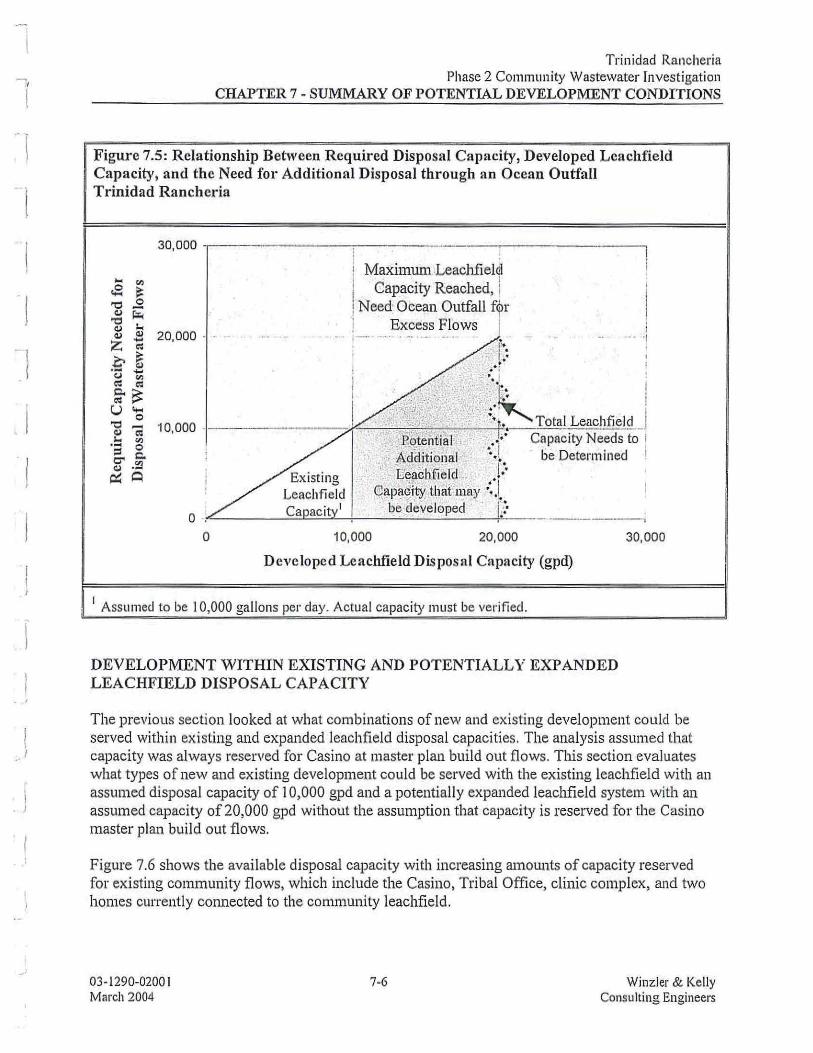
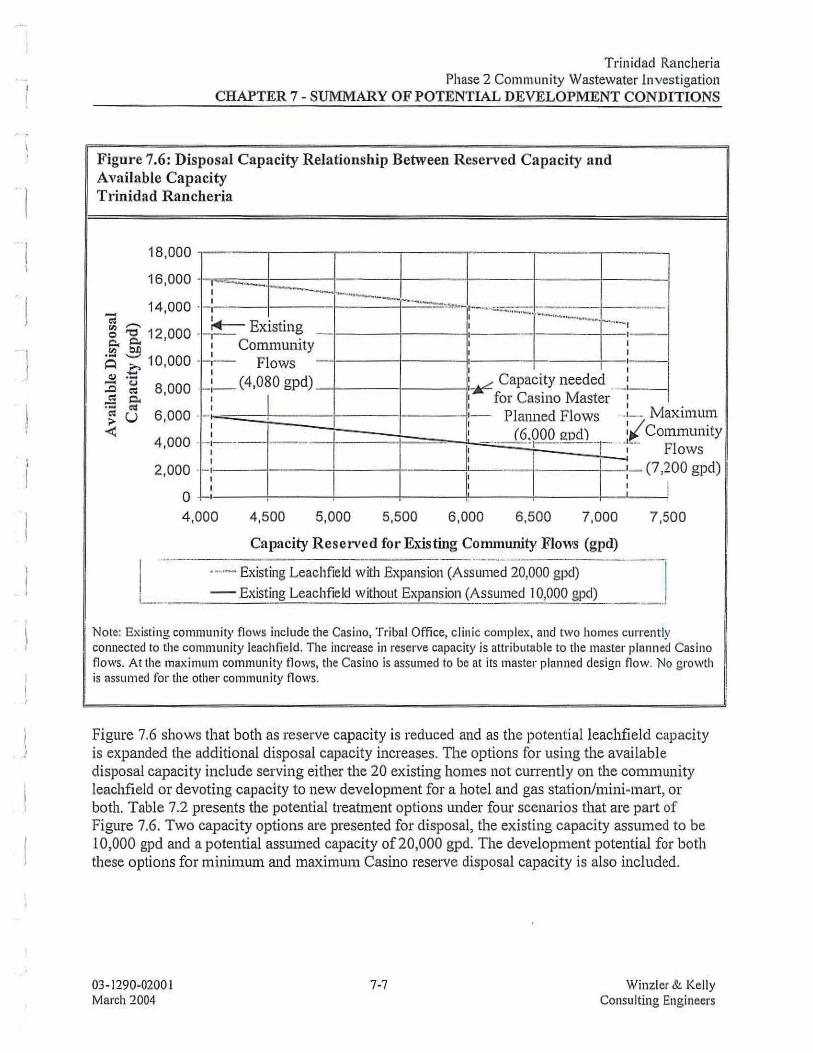
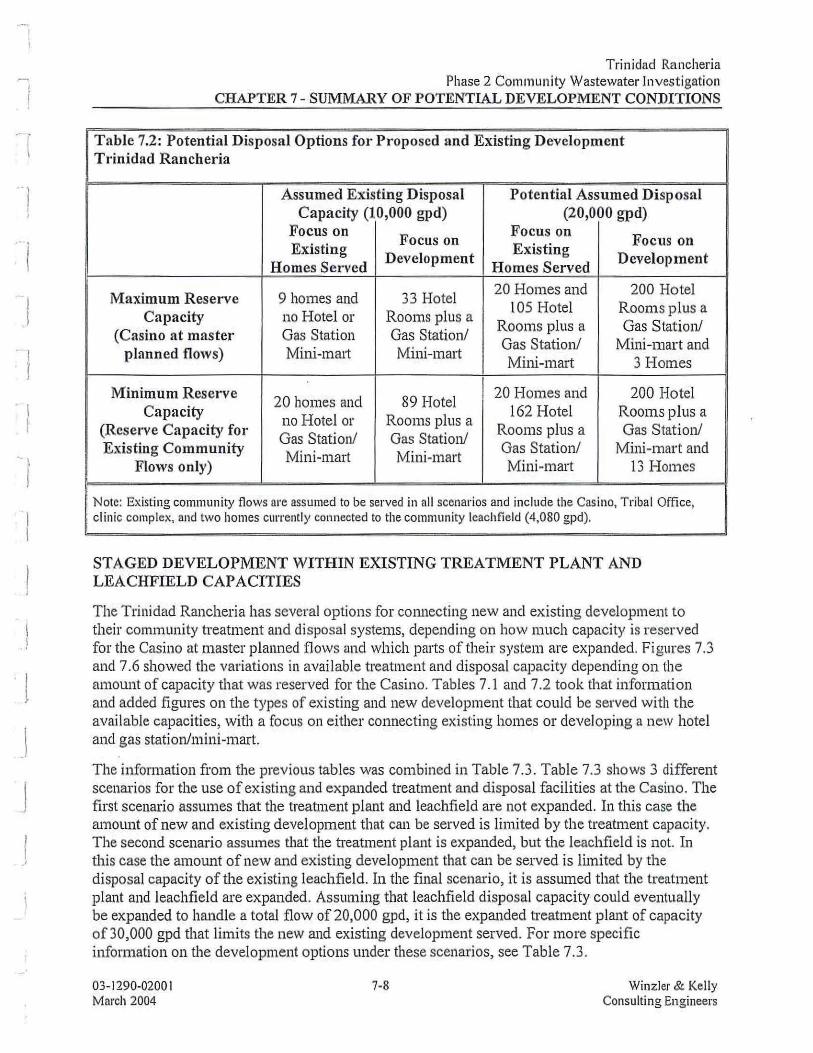
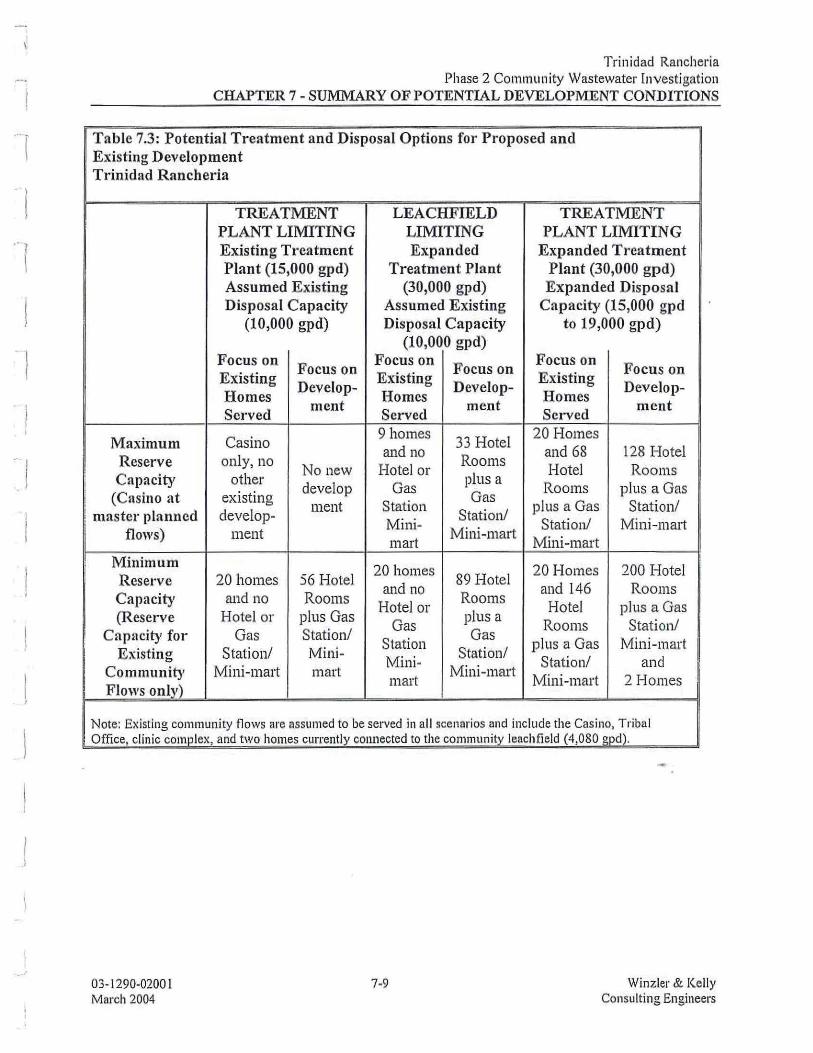
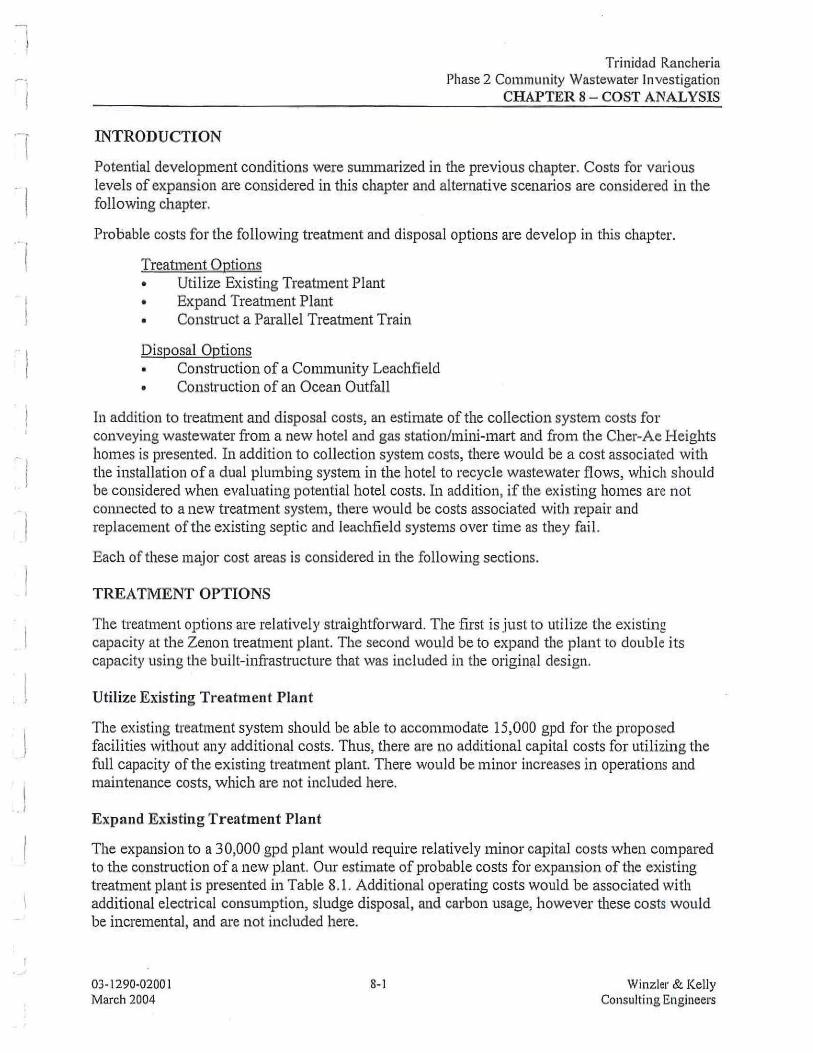
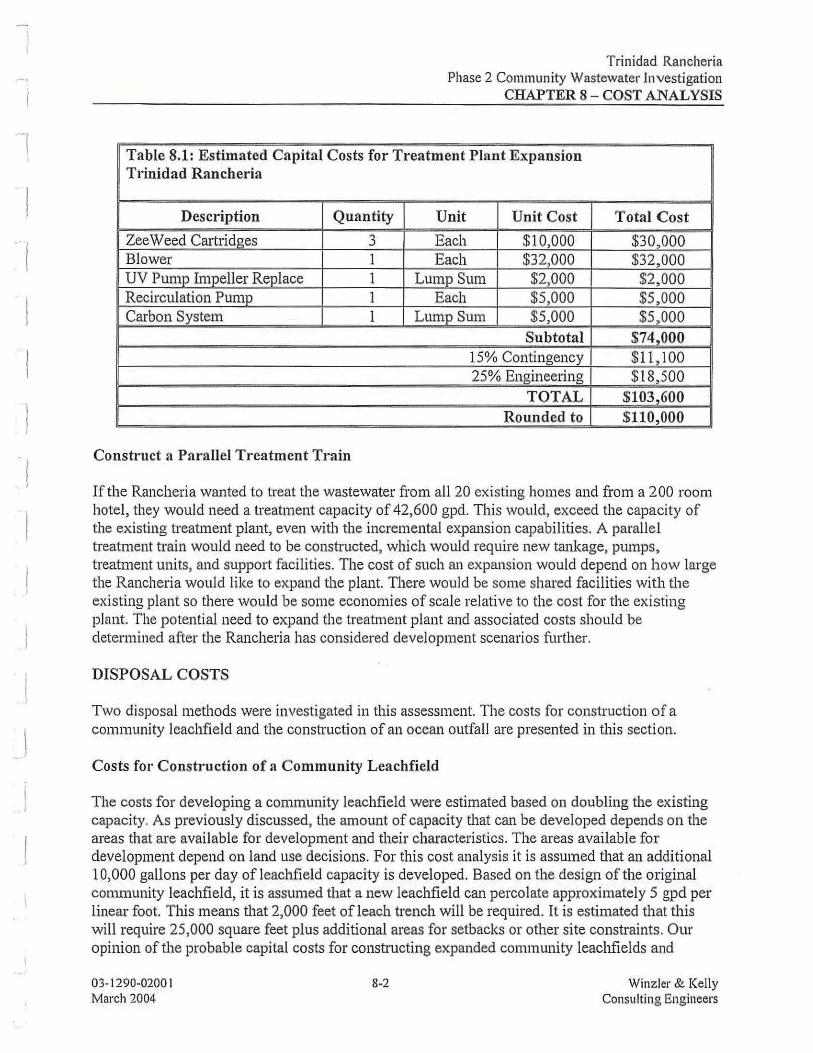
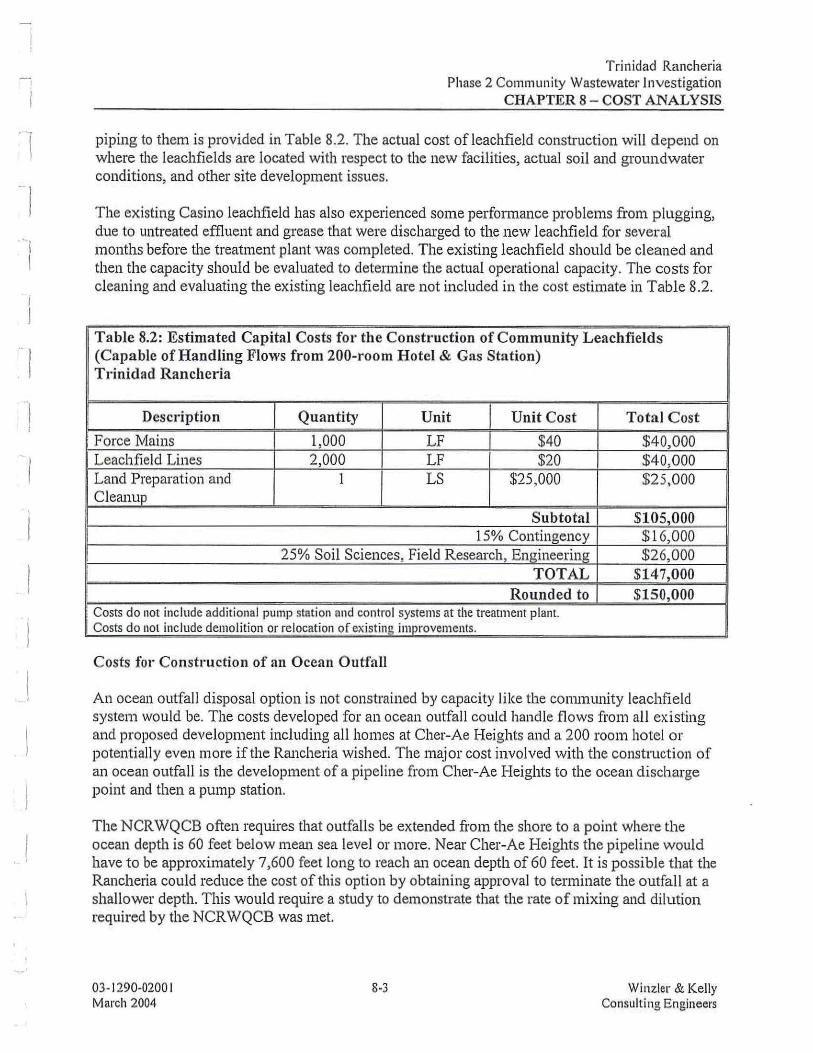
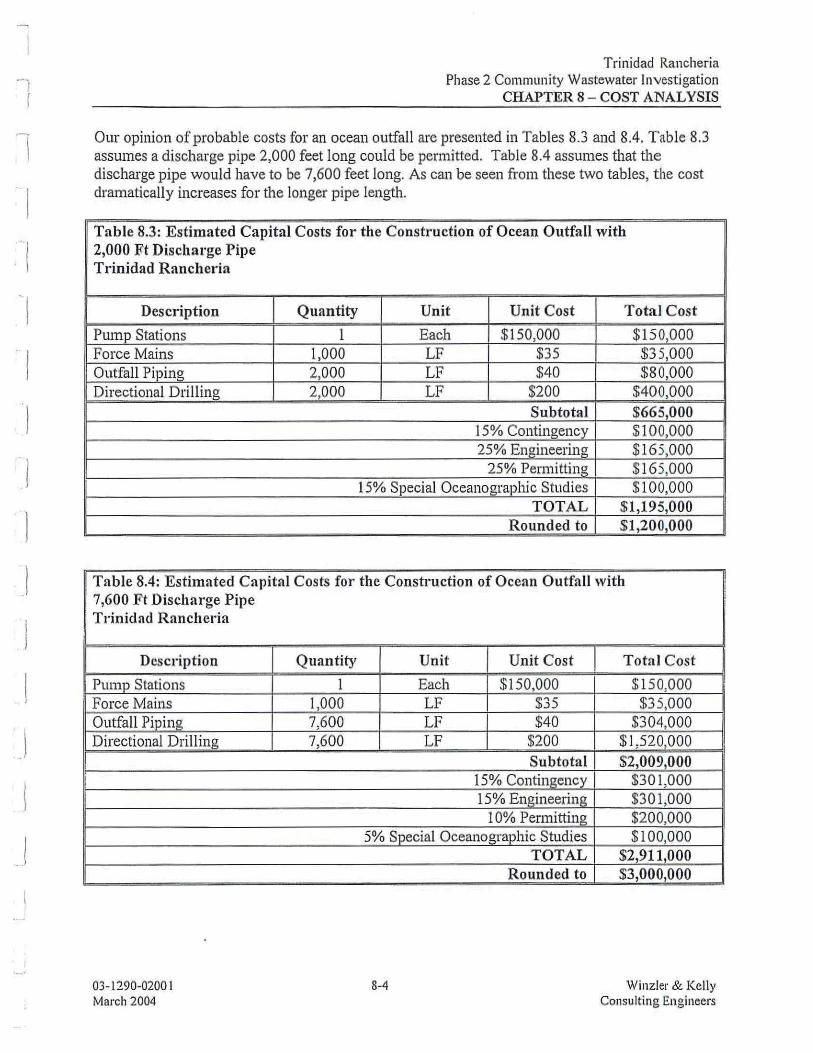
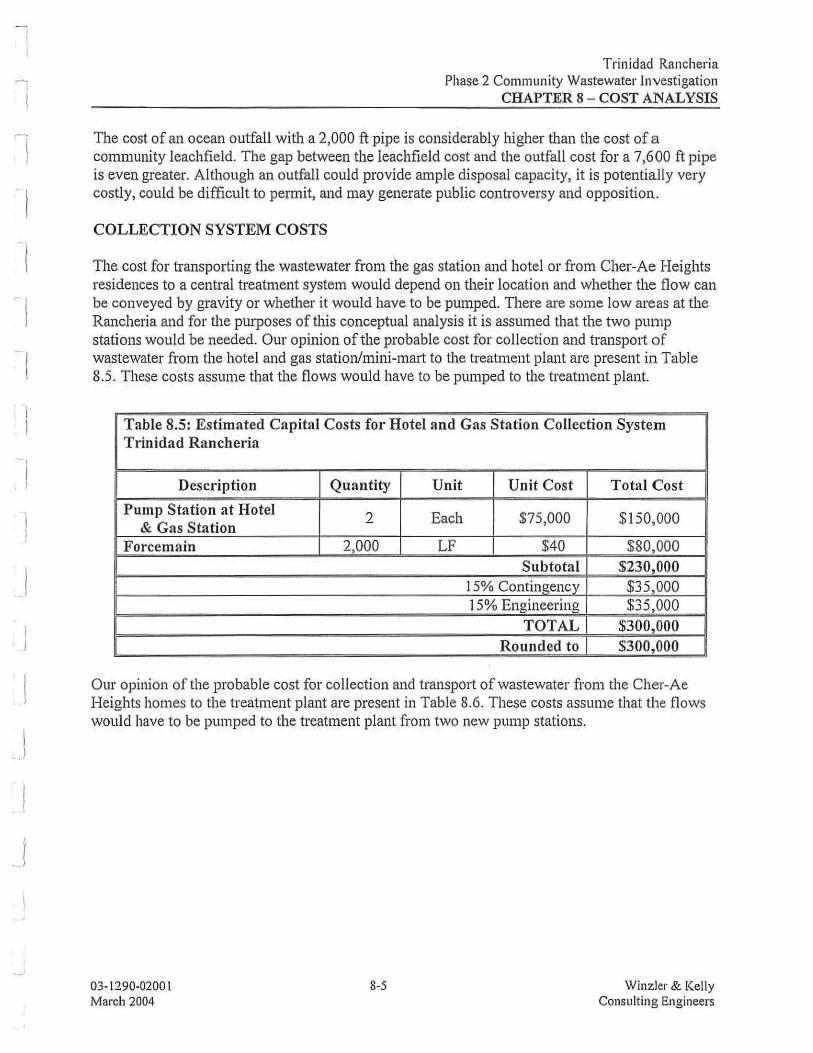
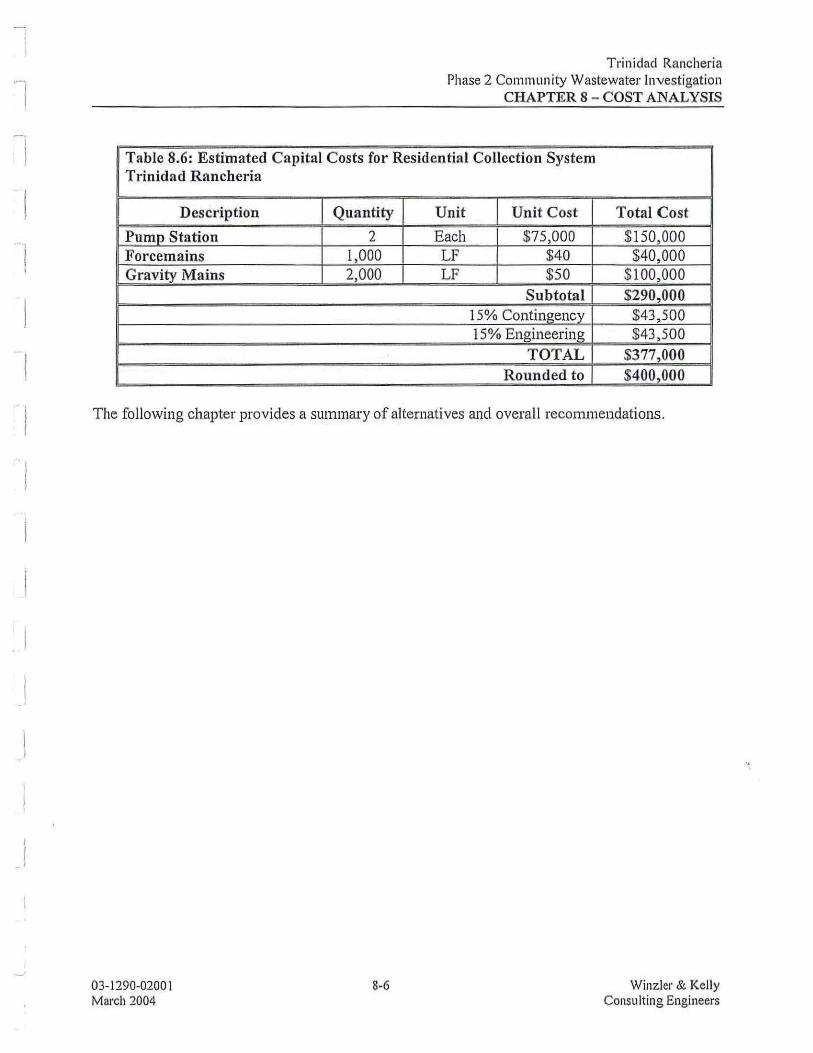
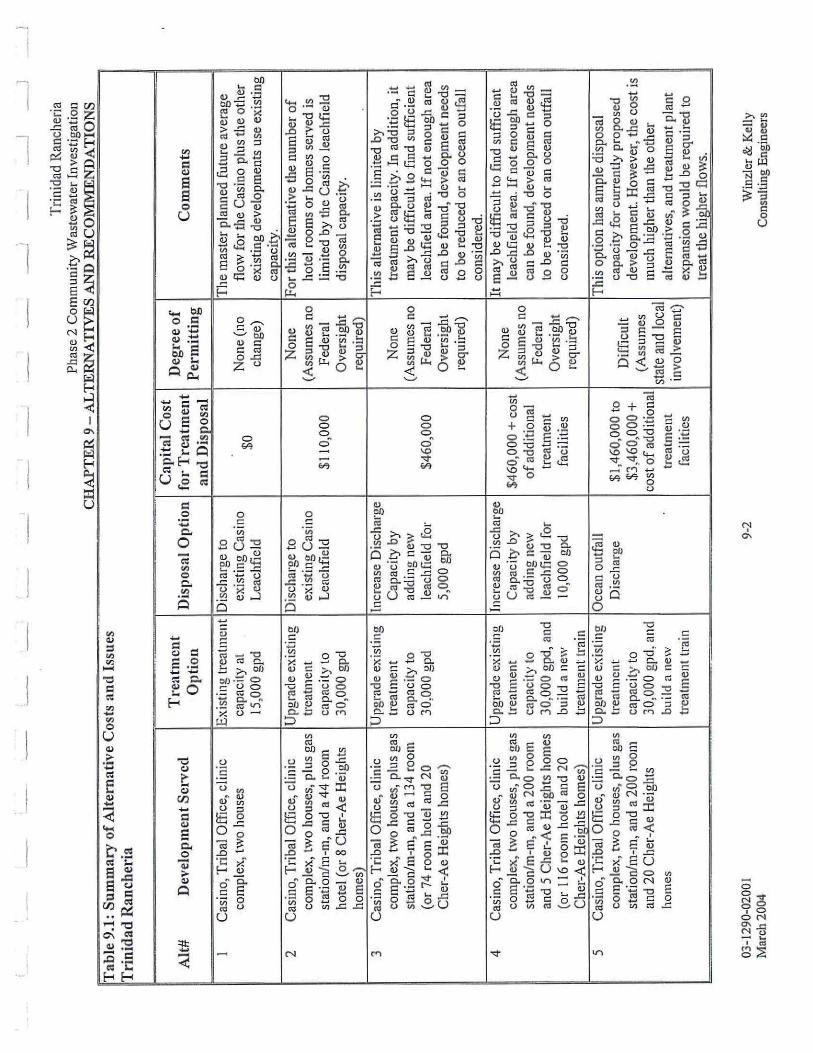

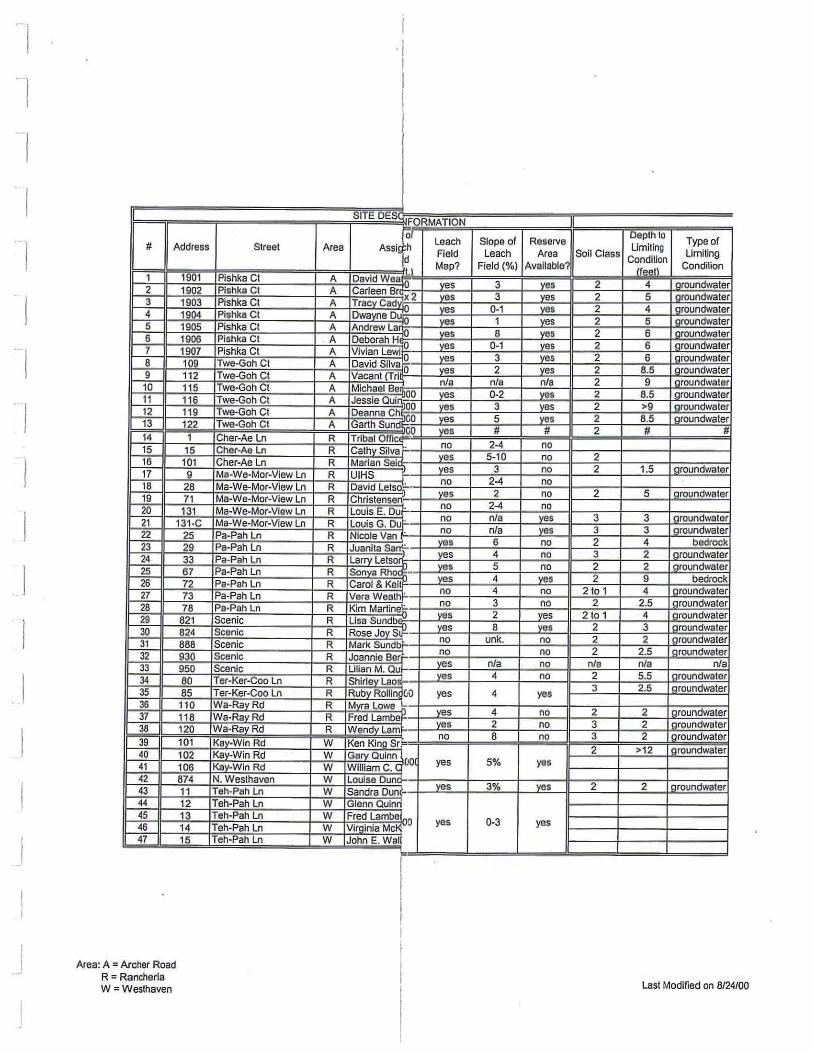
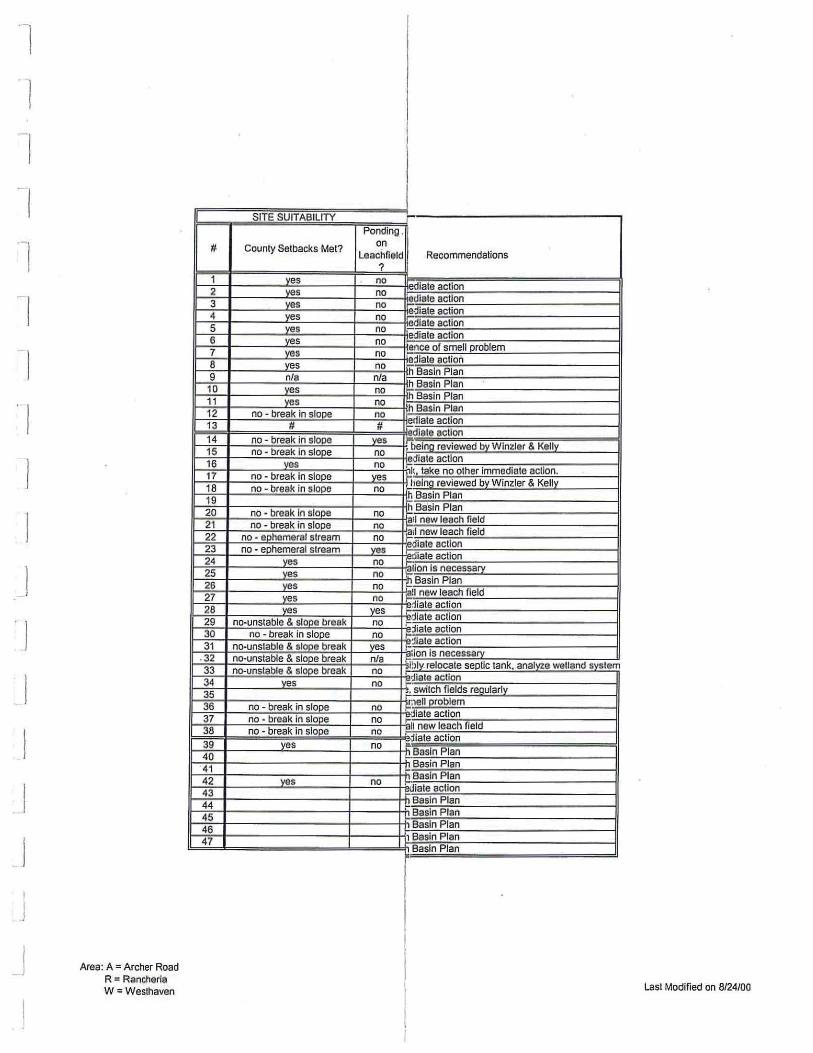

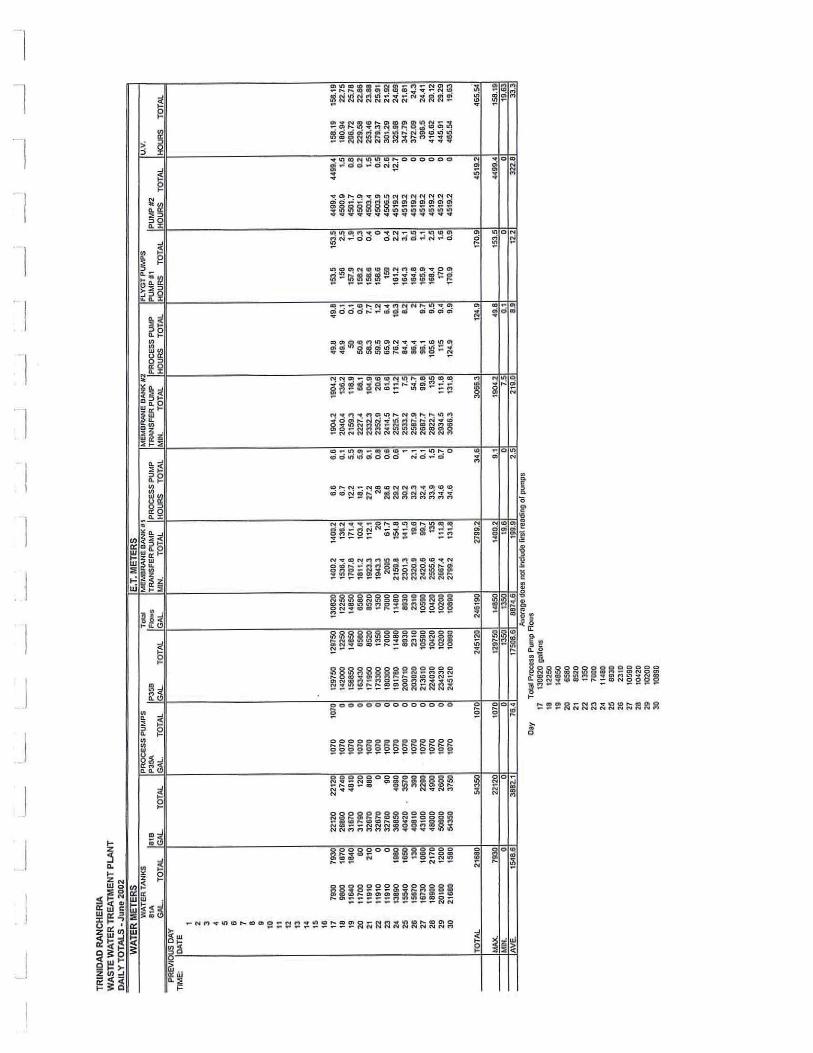
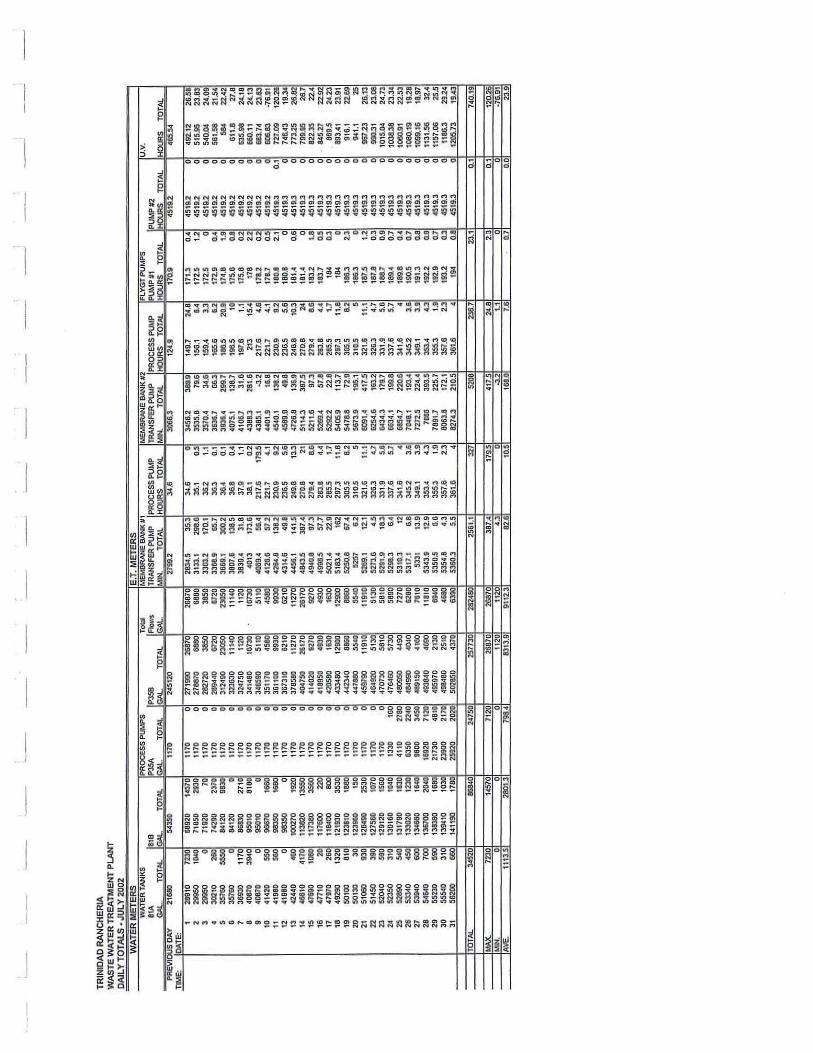
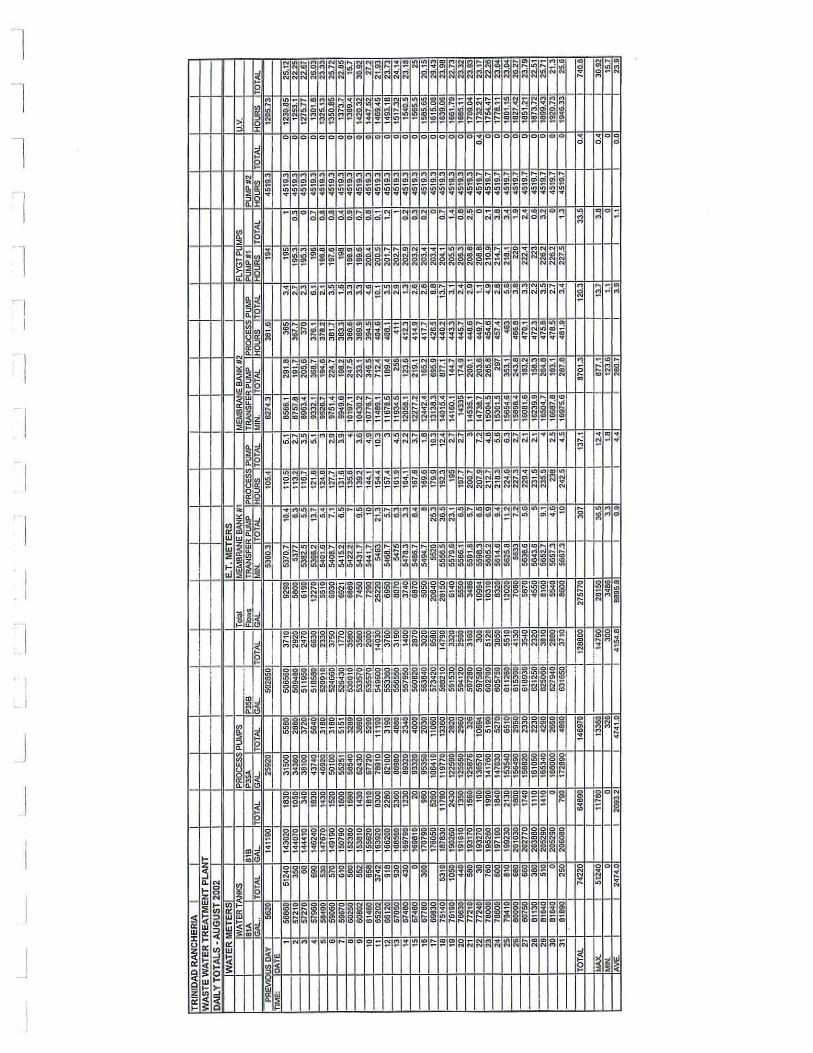
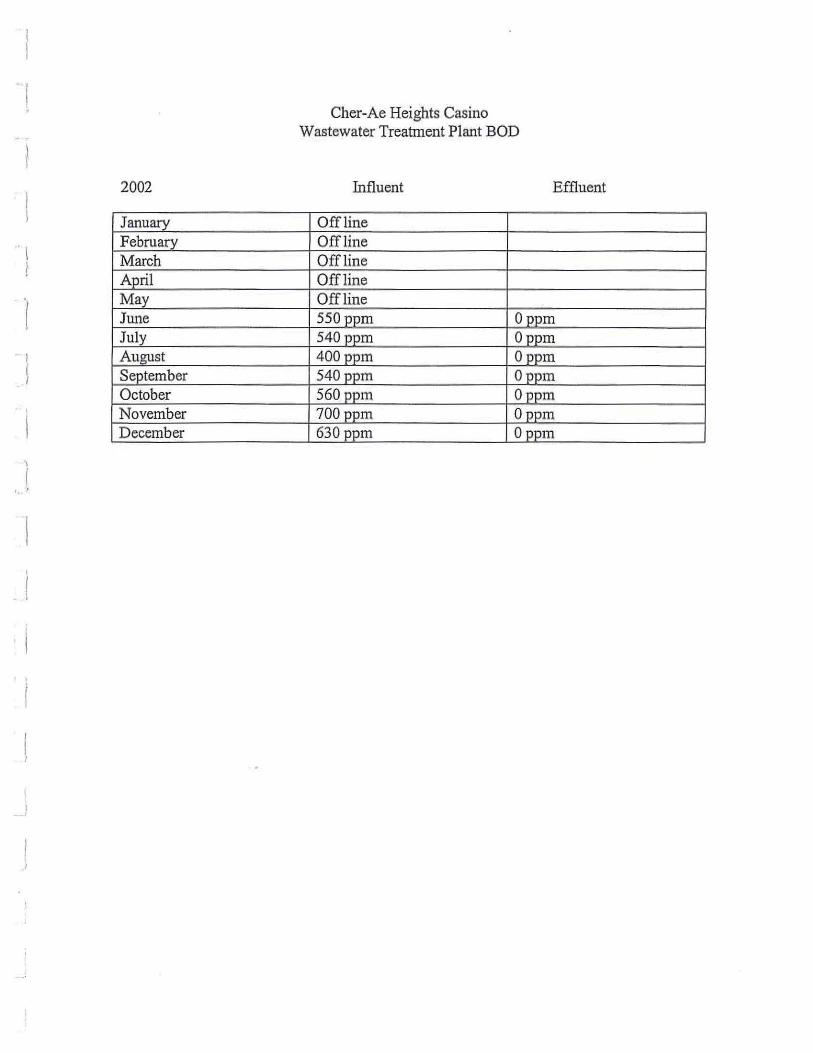

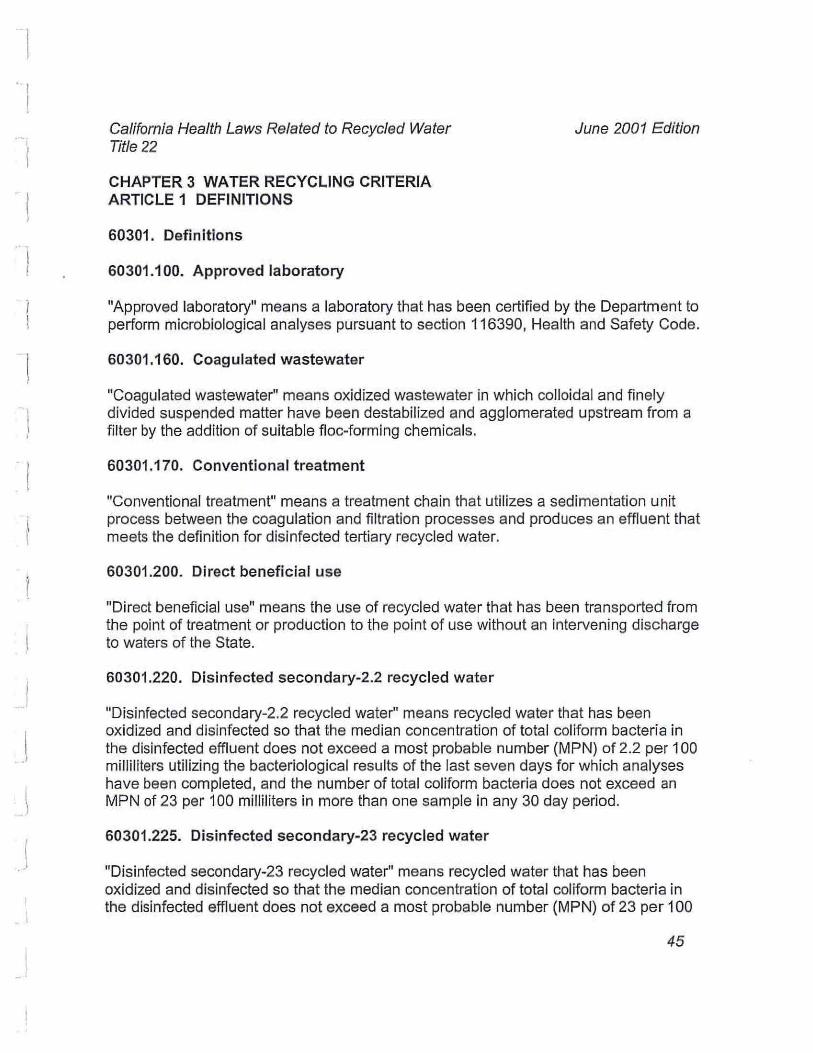
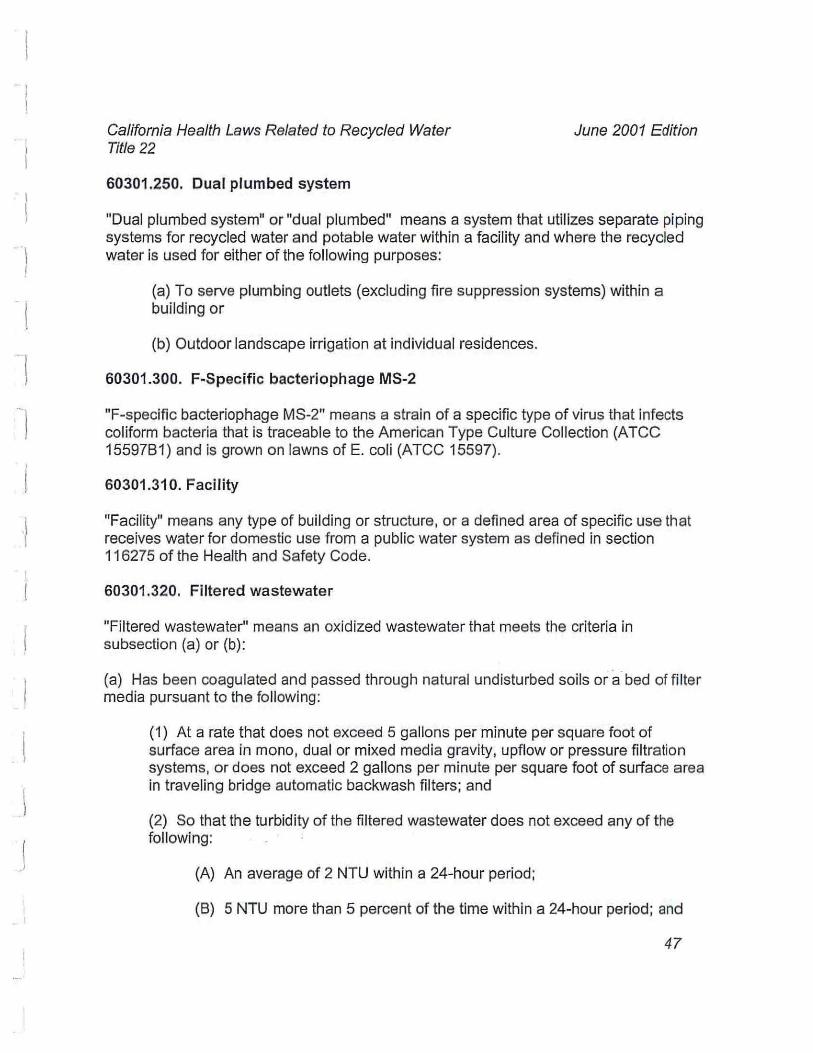
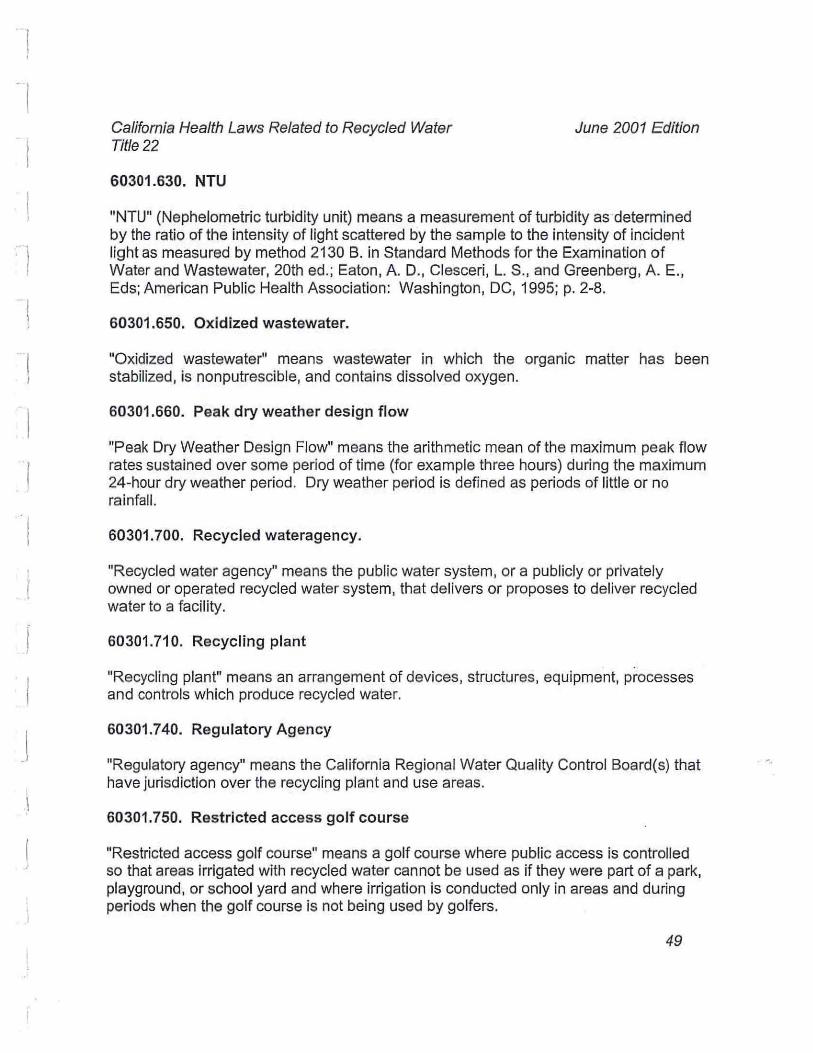
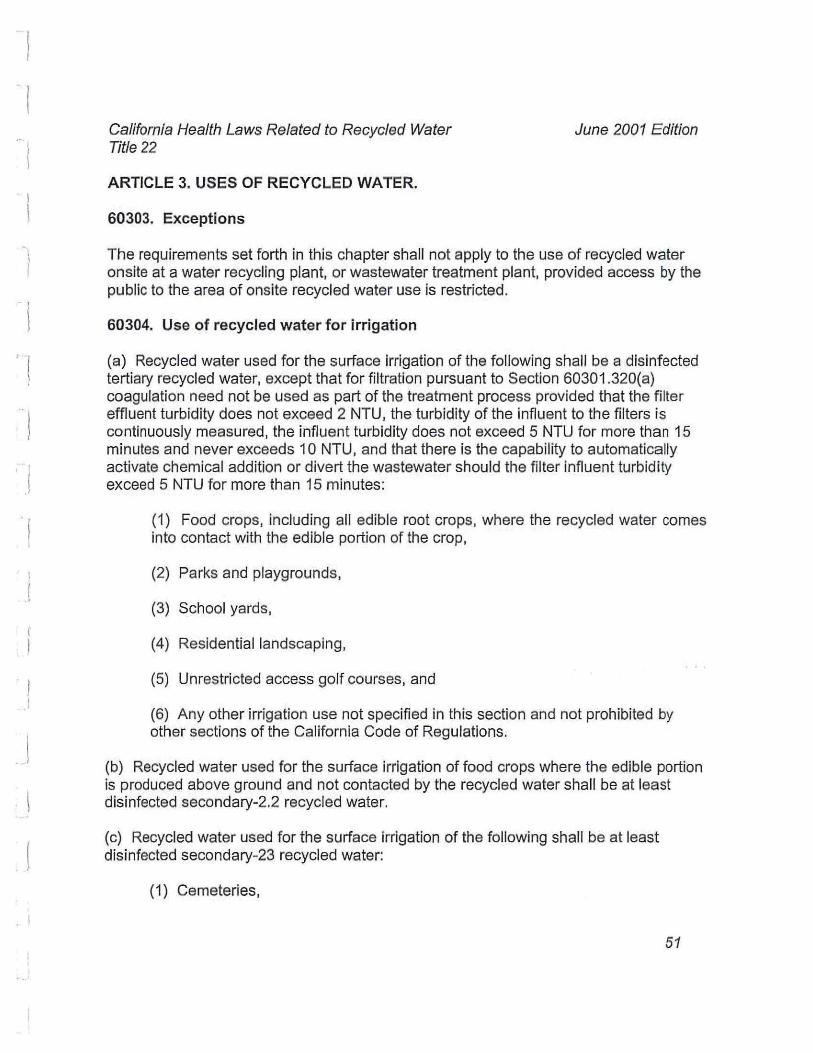
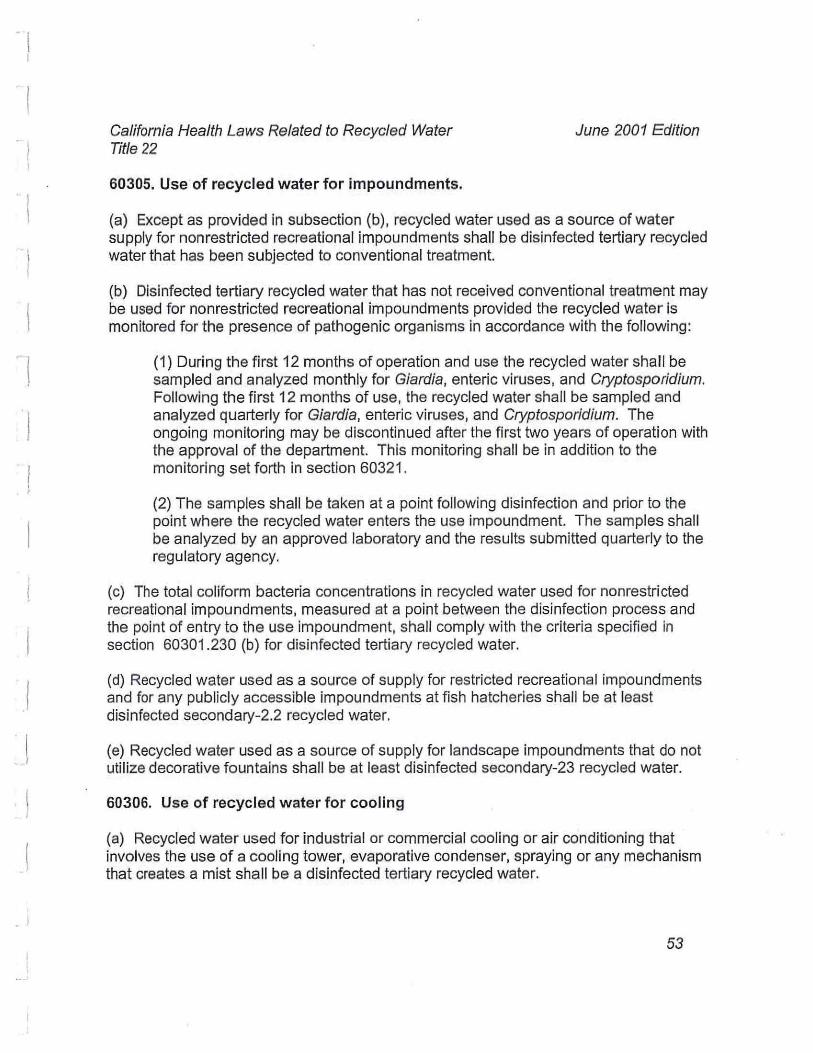
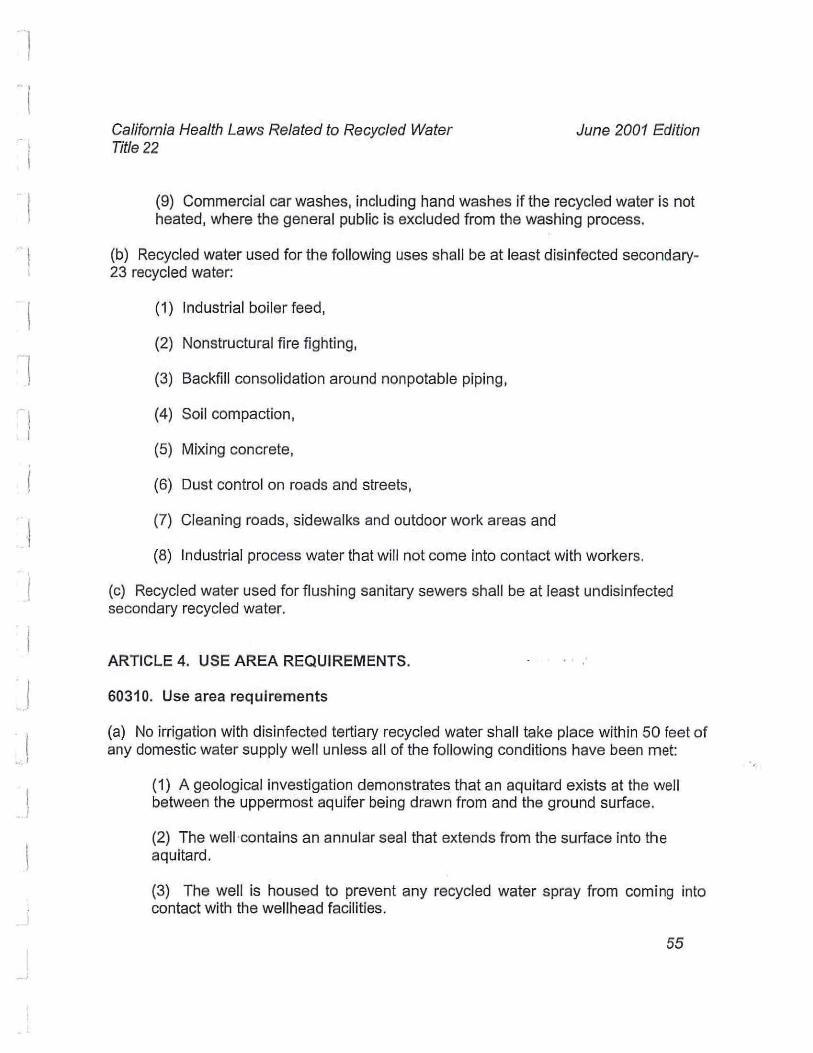
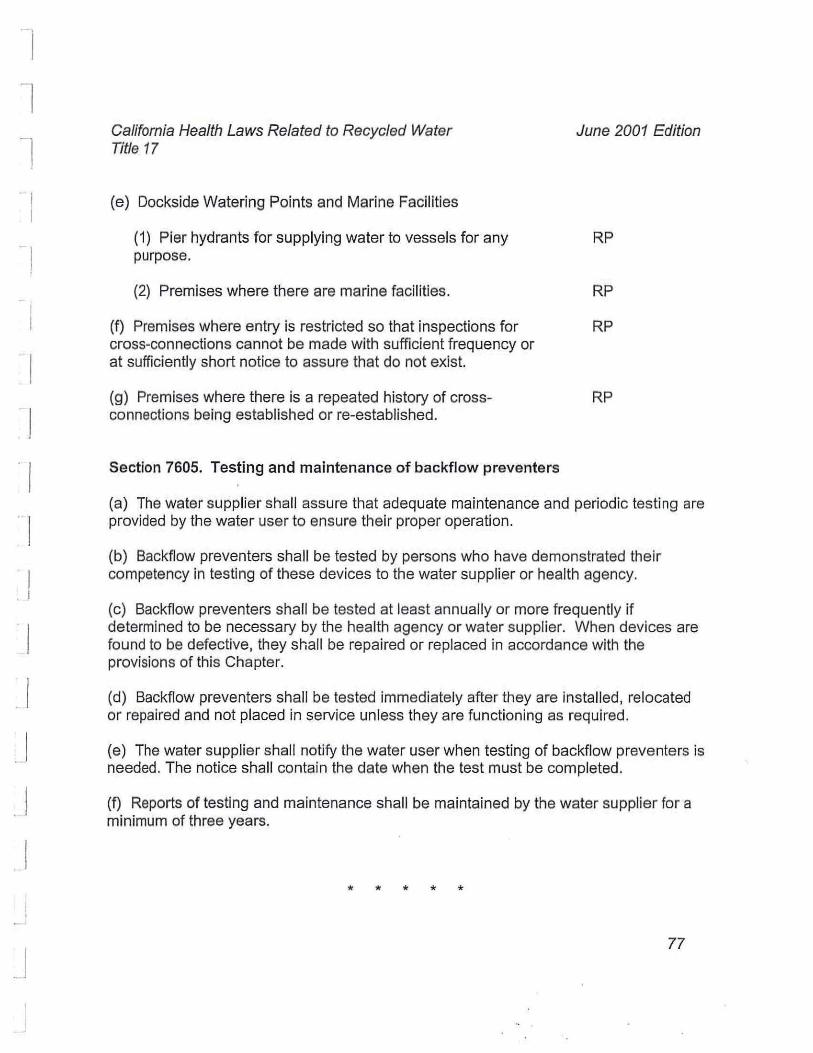

APPENDIX BDRAFT GEOTECHNICAL FEASIBILITY AND PRELIMINARY
DESIGN REPORT
DRAFT GEOTECHNICAL FEASIBILITY AND PRELIMINARY DESIGN REPORT
TRINIDAD RANCHERIA CHER-AE HEIGHTS HOTEL
Trinidad, California
Prepared by:
Crawford & Associates, Inc. 4220 Rocklin Road, Suite 1
Rocklin, CA 95677
November 2016
Prepared for:
Trinidad Rancheria Economic Development Corporation P.O. Box 630
Trinidad, CA 95570
Corporate Office: 1100 Corporate Drive, Suite 230 | Sacramento, CA 95831 | (916) 455-4225 Modesto: 1165 Scenic Drive, Suite B | Modesto, CA 95350 | (209) 312-7668 Pleasanton: 6200 Stoneridge Mall Road, Suite 330 | Pleasanton, CA 94588 | (925) 401-3515 Rocklin: 4220 Rocklin Road, Suite 1 | Rocklin, CA 95677 | (916) 455-4225 Ukiah: 100 North Pine Street | Ukiah, CA 95482| (707) 240-4400 Sacramento | Modesto | Pleasanton | Rocklin | Ukiah
November 8, 2016 CAInc File No. 16-319.1 Mr. David Tyson Trinidad Rancheria Economic Development Corporation P.O. Box 630 Trinidad, CA 95570 Subject: DRAFT GEOTECHNICAL FEASIBILITY AND PRELIMINARY DESIGN REPORT
Trinidad Rancheria Cher-Ae Heights Hotel Trinidad, California
Dear Mr. Tyson, Attached is our DRAFT Geotechnical Feasibility and Preliminary Design Report for the Trinidad Rancheria Cher-Ae Heights Hotel. Crawford & Associates, Inc. (CAInc) completed this report in accordance with our agreement with Trinidad Rancheria Economic Development Corporation (TREDC) dated August 26, 2016. This report provides geotechnical data, geological hazards assessment, and preliminary geotechnical recommendations for the proposed hotel project. We will issue a final report upon receiving comments from you on this draft. Please call if you have questions or require additional information. Sincerely, Crawford & Associates, Inc., Adam J. Killinger, PE, GE Rick Sowers, PE, CEG Project Manager Principal Engineering Geologist Nick Anderson, EIT Project Engineer
Corporate Office: 1100 Corporate Drive, Suite 230 | Sacramento, CA 95831 | (916) 455-4225 Modesto: 1165 Scenic Drive, Suite B | Modesto, CA 95350 | (209) 312-7668 Pleasanton: 6200 Stoneridge Mall Road, Suite 330 | Pleasanton, CA 94588 | (925) 401-3515 Rocklin: 4220 Rocklin Road, Suite 1 | Rocklin, CA 95677 | (916) 455-4225 Ukiah: 100 North Pine Street | Ukiah, CA 95482| (707) 240-4400 Sacramento | Modesto | Pleasanton | Rocklin | Ukiah
TABLE OF CONTENTS
1 INTRODUCTION ..........................................................................................................................1 1.1 PURPOSE .............................................................................................................................1 1.2 SCOPE OF SERVICES .............................................................................................................1
2 SITE & PROJECT DESCRIPTION .....................................................................................................1 3 GEOLOGY ...................................................................................................................................2 4 PREVIOUS EXPLORATION ............................................................................................................2
4.1 CASINO EXPANSION EXPLORATIONS ....................................................................................2 4.2 SCENIC DRIVE SLOPE STABILITY EXPLORATIONS ....................................................................3
5 CURRENT EXPLORATION .............................................................................................................3 6 SURFACE AND SUBSURFACE CONDITIONS....................................................................................3
6.1 SOIL UNITS ..........................................................................................................................3 6.2 BEDROCK ............................................................................................................................4 6.3 GROUNDWATER ..................................................................................................................5
7 LABORATORY TESTING ................................................................................................................6 7.1 CLASSIFICATION AND STRENGTH TESTS ................................................................................7 7.2 CORROSION TESTS ...............................................................................................................8 7.3 EXPANSION INDEX TESTS .....................................................................................................8
8 SEISMIC DESIGN PARAMETERS ....................................................................................................9 9 PRELIMINARY CONCLUSIONS AND RECOMMENDATIONS .............................................................9
9.1 GEOLOGIC HAZARDS .......................................................................................................... 10 9.1.1 FAULT RUPTURE .............................................................................................................. 10 9.1.2 LANDSLIDES ..................................................................................................................... 10 9.1.3 LIQUEFACTION POTENTIAL ............................................................................................. 12 9.1.4 TSUNAMI ......................................................................................................................... 12
9.2 PRELIMINARY RECOMMENDATIONS .................................................................................. 12 9.2.1 HOTEL SUPPORT .............................................................................................................. 12 9.2.2 COMPLEMENTARY FACILITIES SUPPORT ........................................................................ 13 9.2.3 RETAINING WALL SUPPORT & LATERAL PRESSURES ...................................................... 13 9.2.4 PAVEMENT ...................................................................................................................... 14
9.3 GRADING .......................................................................................................................... 14 10 LIMITATIONS ............................................................................................................................ 14
Corporate Office: 1100 Corporate Drive, Suite 230 | Sacramento, CA 95831 | (916) 455-4225 Modesto: 1165 Scenic Drive, Suite B | Modesto, CA 95350 | (209) 312-7668 Pleasanton: 6200 Stoneridge Mall Road, Suite 330 | Pleasanton, CA 94588 | (925) 401-3515 Rocklin: 4220 Rocklin Road, Suite 1 | Rocklin, CA 95677 | (916) 455-4225 Ukiah: 100 North Pine Street | Ukiah, CA 95482| (707) 240-4400 Sacramento | Modesto | Pleasanton | Rocklin | Ukiah
SELECT REFERENCES
Select References
FIGURES
Figure 1: Exploration Location Map Figure 2: Cross Section AA’ Figure 3: Cross Section BB’ Figure 4: Cross Section CC’ Figure 5: Slope Remediation Examples Figure 6: Geology Map Figure 7: Tsunami Inundation Map Figure 8: Fault Activity Map Figure 9: Earthquake Fault Zone Map Detail 1: Piezometer Logs
APPENDIX A
Boring Log Legend Boring Logs
APPENDIX B
Laboratory Test Results
APPENDIX C
LPile Outputs
APPENDIX D
SHN Proposed Expansion Cher-Ae Heights Gaming Building Boring Logs Taber Geotechnical Report – Trinidad Rancheria Expansion Project Test Pits
APPENDIX E
Site Photos
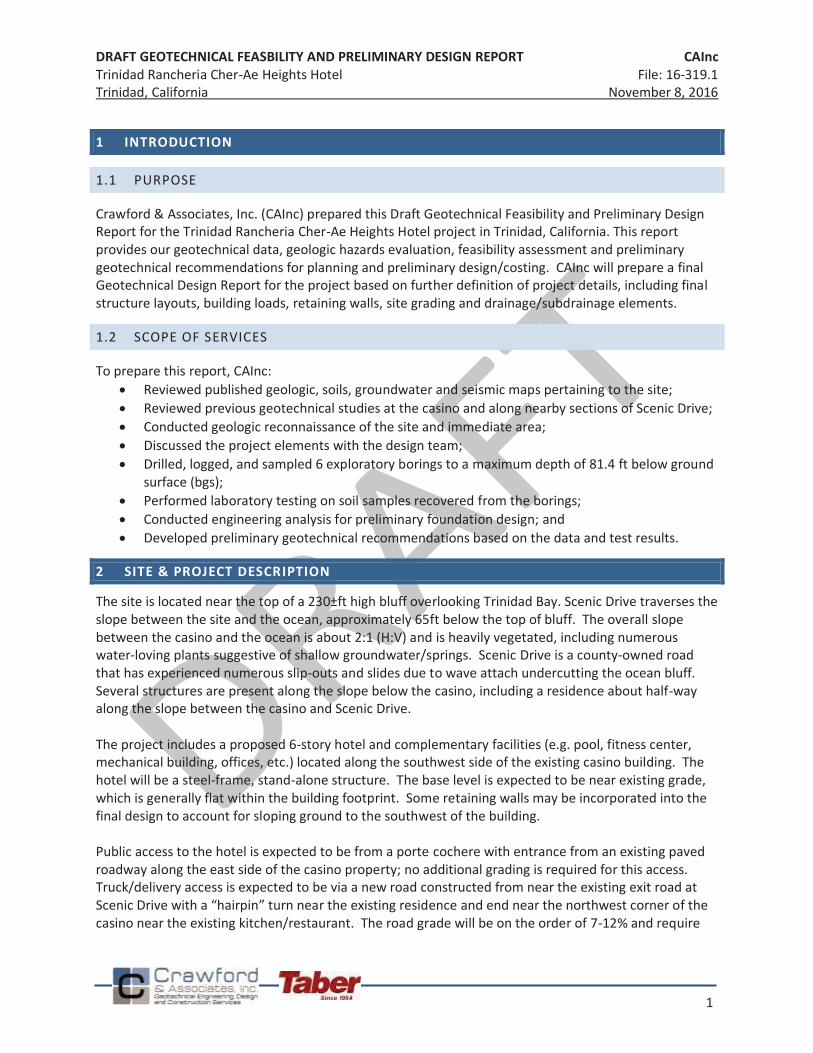
DRAFT GEOTECHNICAL FEASBILITY AND PRELIMINARY DESIGN REPORT CAInc Trinidad Rancheria Cher-Ae Heights Hotel File: 16-319.1 Trinidad, California November 8, 2016
1
1 INTRODUCTION
1.1 PURPOSE
Crawford & Associates, Inc. (CAInc) prepared this Draft Geotechnical Feasibility and Preliminary Design Report for the Trinidad Rancheria Cher-Ae Heights Hotel project in Trinidad, California. This report provides our geotechnical data, geologic hazards evaluation, feasibility assessment and preliminary geotechnical recommendations for planning and preliminary design/costing. CAInc will prepare a final Geotechnical Design Report for the project based on further definition of project details, including final structure layouts, building loads, retaining walls, site grading and drainage/subdrainage elements.
1.2 SCOPE OF SERVICES
To prepare this report, CAInc: Reviewed published geologic, soils, groundwater and seismic maps pertaining to the site; Reviewed previous geotechnical studies at the casino and along nearby sections of Scenic Drive; Conducted geologic reconnaissance of the site and immediate area; Discussed the project elements with the design team; Drilled, logged, and sampled 6 exploratory borings to a maximum depth of 81.4 ft below ground
surface (bgs); Performed laboratory testing on soil samples recovered from the borings; Conducted engineering analysis for preliminary foundation design; and Developed preliminary geotechnical recommendations based on the data and test results.
2 SITE & PROJECT DESCRIPTION
The site is located near the top of a 230±ft high bluff overlooking Trinidad Bay. Scenic Drive traverses the slope between the site and the ocean, approximately 65ft below the top of bluff. The overall slope between the casino and the ocean is about 2:1 (H:V) and is heavily vegetated, including numerous water-loving plants suggestive of shallow groundwater/springs. Scenic Drive is a county-owned road that has experienced numerous slip-outs and slides due to wave attach undercutting the ocean bluff. Several structures are present along the slope below the casino, including a residence about half-way along the slope between the casino and Scenic Drive. The project includes a proposed 6-story hotel and complementary facilities (e.g. pool, fitness center, mechanical building, offices, etc.) located along the southwest side of the existing casino building. The hotel will be a steel-frame, stand-alone structure. The base level is expected to be near existing grade, which is generally flat within the building footprint. Some retaining walls may be incorporated into the final design to account for sloping ground to the southwest of the building. Public access to the hotel is expected to be from a porte cochere with entrance from an existing paved roadway along the east side of the casino property; no additional grading is required for this access. Truck/delivery access is expected to be via a new road constructed from near the existing exit road at Scenic Drive with a “hairpin” turn near the existing residence and end near the northwest corner of the casino near the existing kitchen/restaurant. The road grade will be on the order of 7-12% and require
DRAFT GEOTECHNICAL FEASBILITY AND PRELIMINARY DESIGN REPORT CAInc Trinidad Rancheria Cher-Ae Heights Hotel File: 16-319.1 Trinidad, California November 8, 2016
2
new cut/fills to about 10-15 feet high. New cuts may require retaining walls to about 10 ft high. We understand the existing residence will be acquired by the tribe and removed as part of this project. We show the tentative layout on Figure 1.
3 GEOLOGY
The site is underlain by Pleistocene marine terrace sediments deposited on a wave-cut bench in rock of the Jura-Cretaceous Franciscan Complex. The marine terrace sediments are generally comprised of pebbly sand, silt and clay. The underlying Franciscan Complex is comprised of weathered/sheared shale. We show the site geology on Figure 6. Rock consistent with the Franciscan Complex is exposed near beach-level and locally in the site vicinity near the intersection of Scenic Drive and the casino exit road. This rock is observed to be variably-weathered shale and greywacke sandstone, with layering dipping typically to the northeast. Some rock is very hard while some is soft (mostly within sheared shale layers). The hard rock is generally resistant to erosion, as evidenced by the “sea stacks” left standing in the bay and along the shore. We observed marine terrace deposits exposed along the road cuts of Scenic Drive and along the slopes below the casino. These soils are partly-cemented, pebbly sand and silt. The slopes adjacent west of the site are moderately steep with localized areas of instability. An active slide is located along at the south end of the site and extends from the top of bluff to ocean level 200+ft below. The existing casino is not affected by this feature, although the existing parking area near the mechanical building is at the head of this slide and the outer edge of the pavement has broken and dropped about 6-inches vertically. Scenic Drive crosses this slide and has experienced distress from this movement. This slope contains evidence of shallow groundwater and springs that likely contribute to the slope instability in this area. The active Trinidad Fault is mapped near the ocean and trending about parallel to the shoreline. The proposed hotel project is located approximately 500 feet northeast of this fault. Further discussion of fault rupture hazard and seismic ground motions are presented in Sections 8 and 9 below.
4 PREVIOUS EXPLORATION
4.1 CASINO EXPANSION EXPLORATIONS
The original casino building was expanded in 2000 from 21,000 sf to 50,000 sf, including expansions to the north and south. SHN Consulting Engineers & Geologists (SHN) performed three machine-drilled borings and one hand boring for the northern expansion to a maximum depth of 27ft bgs (report dated October 1998). Taber Consultants (Taber) excavated six test pits for the southern expansion, including a retaining wall and water tank, to a maximum depth of 12ft bgs (reports dated January 1999 and May 1999). These studies show that the existing casino, retaining wall and water tank are founded on strip/ring footings established in the weathered shale bedrock. We include pertinent data from the existing casino expansions in Appendix D.
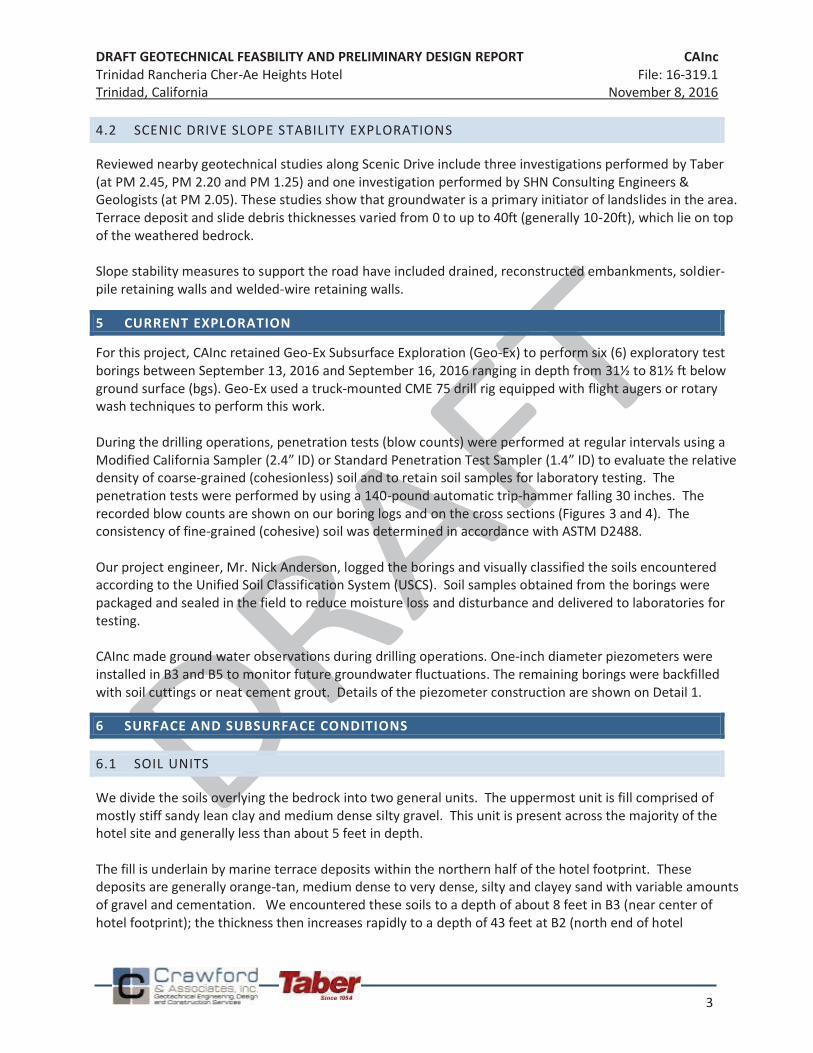
DRAFT GEOTECHNICAL FEASBILITY AND PRELIMINARY DESIGN REPORT CAInc Trinidad Rancheria Cher-Ae Heights Hotel File: 16-319.1 Trinidad, California November 8, 2016
3
4.2 SCENIC DRIVE SLOPE STABILITY EXPLORATIONS
Reviewed nearby geotechnical studies along Scenic Drive include three investigations performed by Taber (at PM 2.45, PM 2.20 and PM 1.25) and one investigation performed by SHN Consulting Engineers & Geologists (at PM 2.05). These studies show that groundwater is a primary initiator of landslides in the area. Terrace deposit and slide debris thicknesses varied from 0 to up to 40ft (generally 10-20ft), which lie on top of the weathered bedrock. Slope stability measures to support the road have included drained, reconstructed embankments, soldier-pile retaining walls and welded-wire retaining walls.
5 CURRENT EXPLORATION
For this project, CAInc retained Geo-Ex Subsurface Exploration (Geo-Ex) to perform six (6) exploratory test borings between September 13, 2016 and September 16, 2016 ranging in depth from 31½ to 81½ ft below ground surface (bgs). Geo-Ex used a truck-mounted CME 75 drill rig equipped with flight augers or rotary wash techniques to perform this work. During the drilling operations, penetration tests (blow counts) were performed at regular intervals using a Modified California Sampler (2.4” ID) or Standard Penetration Test Sampler (1.4” ID) to evaluate the relative density of coarse-grained (cohesionless) soil and to retain soil samples for laboratory testing. The penetration tests were performed by using a 140-pound automatic trip-hammer falling 30 inches. The recorded blow counts are shown on our boring logs and on the cross sections (Figures 3 and 4). The consistency of fine-grained (cohesive) soil was determined in accordance with ASTM D2488. Our project engineer, Mr. Nick Anderson, logged the borings and visually classified the soils encountered according to the Unified Soil Classification System (USCS). Soil samples obtained from the borings were packaged and sealed in the field to reduce moisture loss and disturbance and delivered to laboratories for testing. CAInc made ground water observations during drilling operations. One-inch diameter piezometers were installed in B3 and B5 to monitor future groundwater fluctuations. The remaining borings were backfilled with soil cuttings or neat cement grout. Details of the piezometer construction are shown on Detail 1.
6 SURFACE AND SUBSURFACE CONDITIONS
6.1 SOIL UNITS
We divide the soils overlying the bedrock into two general units. The uppermost unit is fill comprised of mostly stiff sandy lean clay and medium dense silty gravel. This unit is present across the majority of the hotel site and generally less than about 5 feet in depth. The fill is underlain by marine terrace deposits within the northern half of the hotel footprint. These deposits are generally orange-tan, medium dense to very dense, silty and clayey sand with variable amounts of gravel and cementation. We encountered these soils to a depth of about 8 feet in B3 (near center of hotel footprint); the thickness then increases rapidly to a depth of 43 feet at B2 (north end of hotel
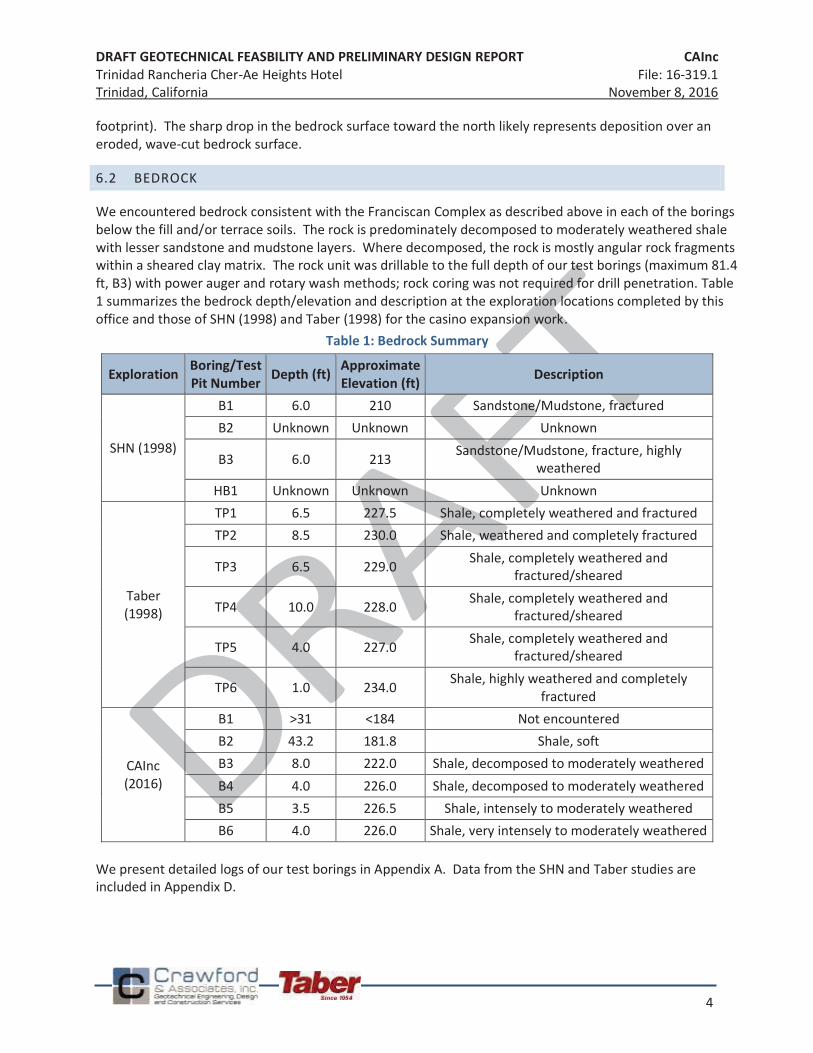
DRAFT GEOTECHNICAL FEASBILITY AND PRELIMINARY DESIGN REPORT CAInc Trinidad Rancheria Cher-Ae Heights Hotel File: 16-319.1 Trinidad, California November 8, 2016
4
footprint). The sharp drop in the bedrock surface toward the north likely represents deposition over an eroded, wave-cut bedrock surface.
6.2 BEDROCK
We encountered bedrock consistent with the Franciscan Complex as described above in each of the borings below the fill and/or terrace soils. The rock is predominately decomposed to moderately weathered shale with lesser sandstone and mudstone layers. Where decomposed, the rock is mostly angular rock fragments within a sheared clay matrix. The rock unit was drillable to the full depth of our test borings (maximum 81.4 ft, B3) with power auger and rotary wash methods; rock coring was not required for drill penetration. Table 1 summarizes the bedrock depth/elevation and description at the exploration locations completed by this office and those of SHN (1998) and Taber (1998) for the casino expansion work.
Table 1: Bedrock Summary
Exploration Boring/Test Pit Number Depth (ft) Approximate
Elevation (ft) Description
SHN (1998)
B1 6.0 210 Sandstone/Mudstone, fractured B2 Unknown Unknown Unknown
B3 6.0 213 Sandstone/Mudstone, fracture, highly weathered
HB1 Unknown Unknown Unknown
Taber (1998)
TP1 6.5 227.5 Shale, completely weathered and fractured TP2 8.5 230.0 Shale, weathered and completely fractured
TP3 6.5 229.0 Shale, completely weathered and fractured/sheared
TP4 10.0 228.0 Shale, completely weathered and fractured/sheared
TP5 4.0 227.0 Shale, completely weathered and fractured/sheared
TP6 1.0 234.0 Shale, highly weathered and completely fractured
CAInc (2016)
B1 >31 <184 Not encountered B2 43.2 181.8 Shale, soft B3 8.0 222.0 Shale, decomposed to moderately weathered B4 4.0 226.0 Shale, decomposed to moderately weathered B5 3.5 226.5 Shale, intensely to moderately weathered B6 4.0 226.0 Shale, very intensely to moderately weathered
We present detailed logs of our test borings in Appendix A. Data from the SHN and Taber studies are included in Appendix D.
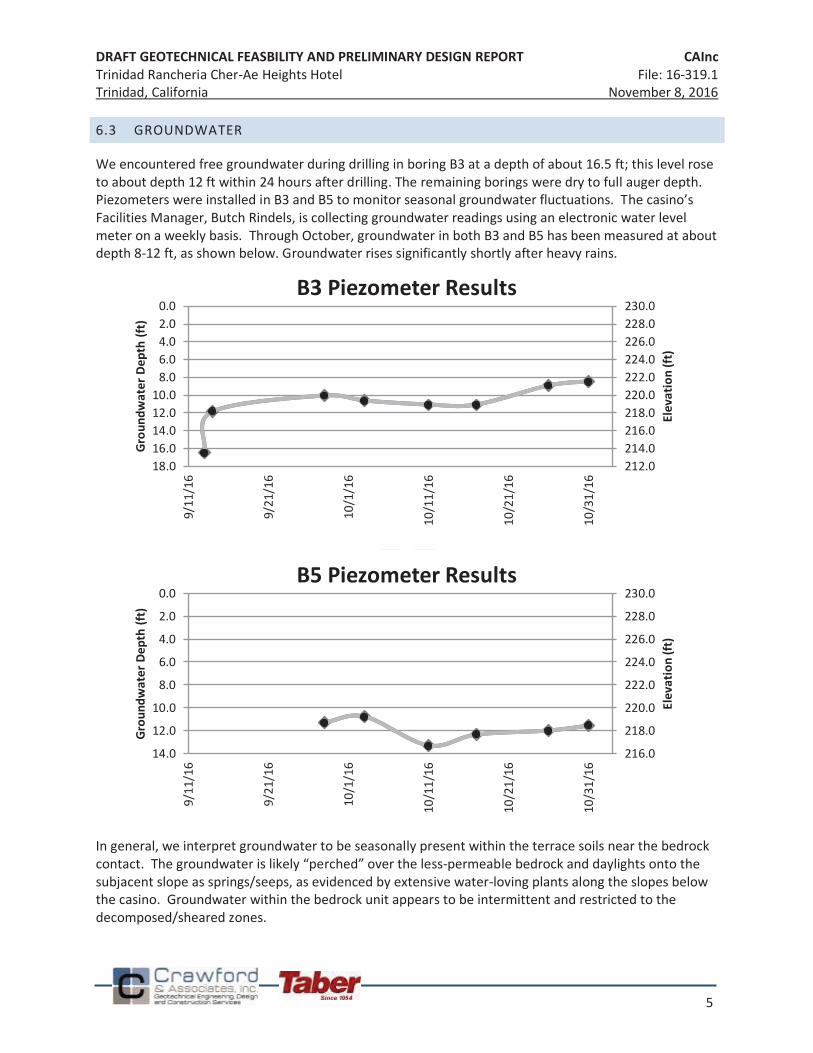
DRAFT GEOTECHNICAL FEASBILITY AND PRELIMINARY DESIGN REPORT CAInc Trinidad Rancheria Cher-Ae Heights Hotel File: 16-319.1 Trinidad, California November 8, 2016
5
6.3 GROUNDWATER
We encountered free groundwater during drilling in boring B3 at a depth of about 16.5 ft; this level rose to about depth 12 ft within 24 hours after drilling. The remaining borings were dry to full auger depth. Piezometers were installed in B3 and B5 to monitor seasonal groundwater fluctuations. The casino’s Facilities Manager, Butch Rindels, is collecting groundwater readings using an electronic water level meter on a weekly basis. Through October, groundwater in both B3 and B5 has been measured at about depth 8-12 ft, as shown below. Groundwater rises significantly shortly after heavy rains.
In general, we interpret groundwater to be seasonally present within the terrace soils near the bedrock contact. The groundwater is likely “perched” over the less-permeable bedrock and daylights onto the subjacent slope as springs/seeps, as evidenced by extensive water-loving plants along the slopes below the casino. Groundwater within the bedrock unit appears to be intermittent and restricted to the decomposed/sheared zones.
212.0214.0216.0218.0220.0222.0224.0226.0228.0230.00.0
2.04.06.08.0
10.012.014.016.018.0
9/11
/16
9/21
/16
10/1
/16
10/1
1/16
10/2
1/16
10/3
1/16
Elev
atio
n (ft
)
Grou
ndw
ater
Dep
th (f
t)
B3 Piezometer Results
216.0
218.0
220.0
222.0
224.0
226.0
228.0
230.00.0
2.0
4.0
6.0
8.0
10.0
12.0
14.0
9/11
/16
9/21
/16
10/1
/16
10/1
1/16
10/2
1/16
10/3
1/16
Elev
atio
n (ft
)
Grou
ndw
ater
Dep
th (f
t)
B5 Piezometer Results
DRAFT GEOTECHNICAL FEASBILITY AND PRELIMINARY DESIGN REPORT CAInc Trinidad Rancheria Cher-Ae Heights Hotel File: 16-319.1 Trinidad, California November 8, 2016
6
7 LABORATORY TESTING
CAInc completed the following laboratory tests on representative soil samples obtained from our exploratory borings:
Moisture Content / Dry Density (ASTM D2216 / D2937) Particle Size Analysis (ASTM D422) No. 200 Sieve Wash (ASTM D1140) Atterberg Limits (ASTM D4318) Expansion Index Test (ASTM D4829) Unconsolidated-Undrained Triaxial Shear Strength Test (ASTM D2850) Unconfined Compressive Strength (ASTM D2166) Direct Shear Strength (ASTM D3080) R-value (CTM 301) Sulfate/Chloride Content (CTM 417/422) pH/Minimum Resistivity (CTM 643)
We present the complete laboratory test results in Appendix B.
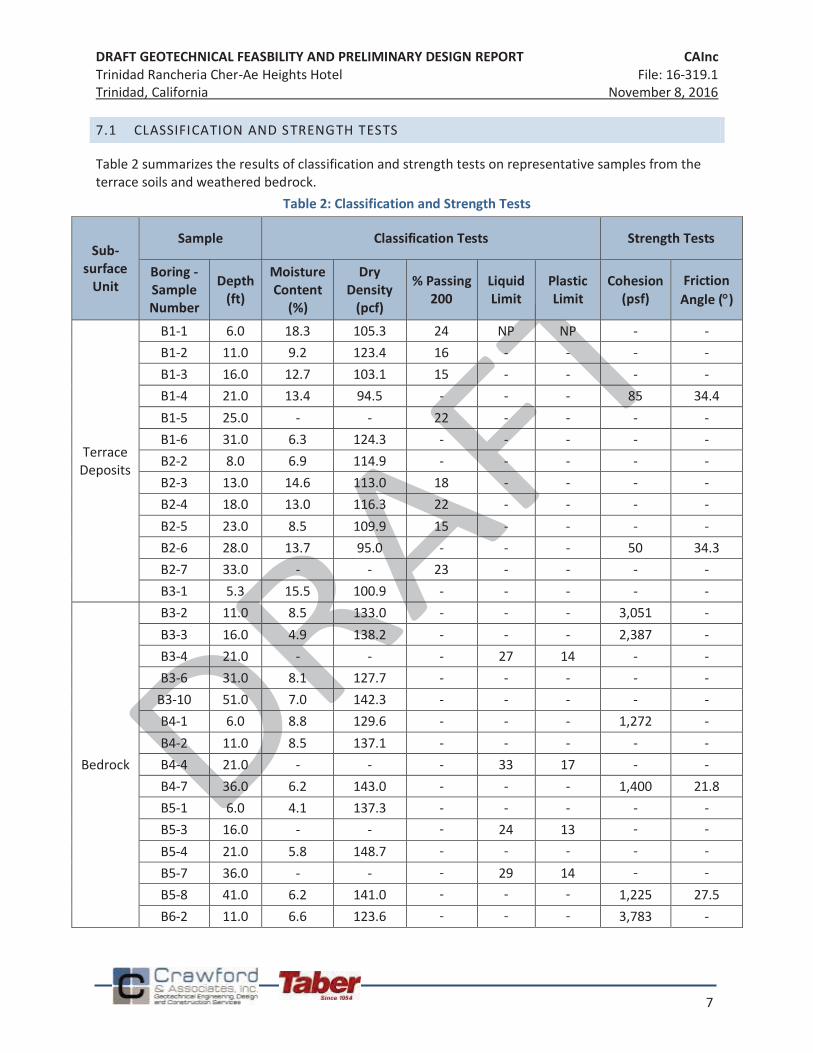
DRAFT GEOTECHNICAL FEASBILITY AND PRELIMINARY DESIGN REPORT CAInc Trinidad Rancheria Cher-Ae Heights Hotel File: 16-319.1 Trinidad, California November 8, 2016
7
7.1 CLASSIFICATION AND STRENGTH TESTS
Table 2 summarizes the results of classification and strength tests on representative samples from the terrace soils and weathered bedrock.
Table 2: Classification and Strength Tests
Sub-surface
Unit
Sample Classification Tests Strength Tests
Boring - Sample Number
Depth (ft)
Moisture Content
(%)
Dry Density
(pcf)
% Passing 200
Liquid Limit
Plastic Limit
Cohesion (psf)
Friction Angle ( )
Terrace Deposits
B1-1 6.0 18.3 105.3 24 NP NP - - B1-2 11.0 9.2 123.4 16 - - - - B1-3 16.0 12.7 103.1 15 - - - - B1-4 21.0 13.4 94.5 - - - 85 34.4 B1-5 25.0 - - 22 - - - - B1-6 31.0 6.3 124.3 - - - - - B2-2 8.0 6.9 114.9 - - - - - B2-3 13.0 14.6 113.0 18 - - - - B2-4 18.0 13.0 116.3 22 - - - - B2-5 23.0 8.5 109.9 15 - - - - B2-6 28.0 13.7 95.0 - - - 50 34.3 B2-7 33.0 - - 23 - - - - B3-1 5.3 15.5 100.9 - - - - -
Bedrock
B3-2 11.0 8.5 133.0 - - - 3,051 - B3-3 16.0 4.9 138.2 - - - 2,387 - B3-4 21.0 - - - 27 14 - - B3-6 31.0 8.1 127.7 - - - - -
B3-10 51.0 7.0 142.3 - - - - - B4-1 6.0 8.8 129.6 - - - 1,272 - B4-2 11.0 8.5 137.1 - - - - - B4-4 21.0 - - - 33 17 - - B4-7 36.0 6.2 143.0 - - - 1,400 21.8 B5-1 6.0 4.1 137.3 - - - - - B5-3 16.0 - - - 24 13 - - B5-4 21.0 5.8 148.7 - - - - - B5-7 36.0 - - - 29 14 - - B5-8 41.0 6.2 141.0 - - - 1,225 27.5 B6-2 11.0 6.6 123.6 - - - 3,783 -
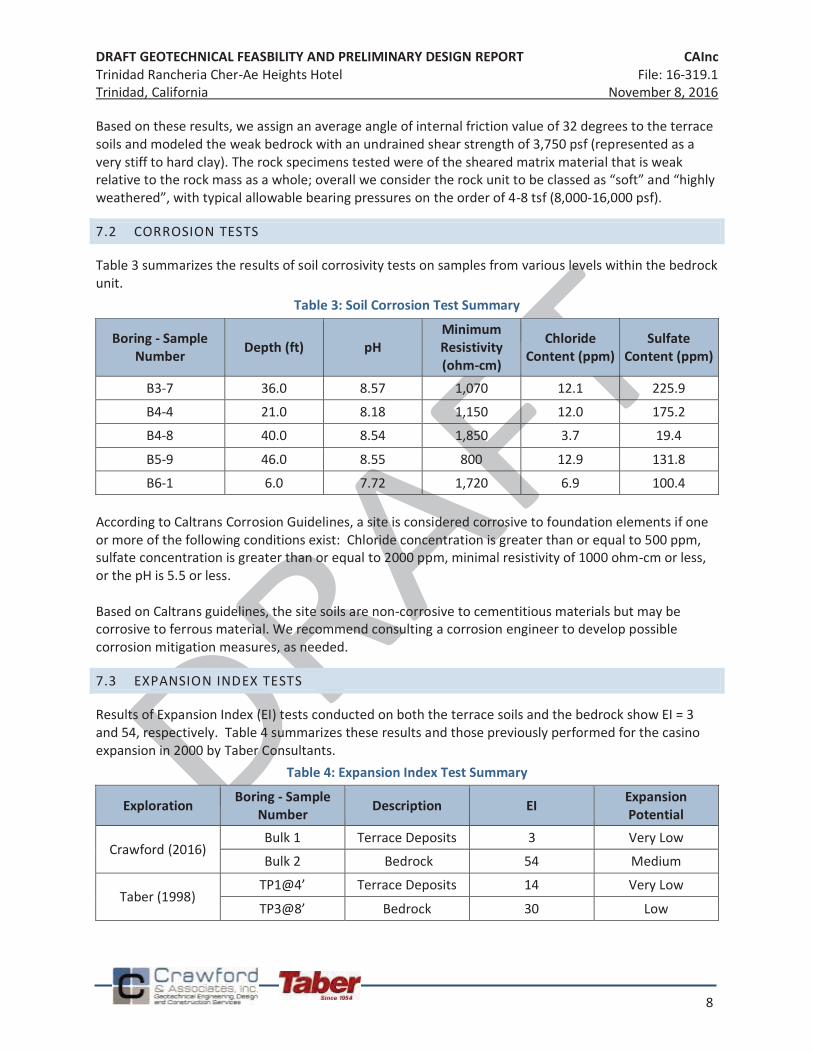
DRAFT GEOTECHNICAL FEASBILITY AND PRELIMINARY DESIGN REPORT CAInc Trinidad Rancheria Cher-Ae Heights Hotel File: 16-319.1 Trinidad, California November 8, 2016
8
Based on these results, we assign an average angle of internal friction value of 32 degrees to the terrace soils and modeled the weak bedrock with an undrained shear strength of 3,750 psf (represented as a very stiff to hard clay). The rock specimens tested were of the sheared matrix material that is weak relative to the rock mass as a whole; overall we consider the rock unit to be classed as “soft” and “highly weathered”, with typical allowable bearing pressures on the order of 4-8 tsf (8,000-16,000 psf).
7.2 CORROSION TESTS
Table 3 summarizes the results of soil corrosivity tests on samples from various levels within the bedrock unit.
Table 3: Soil Corrosion Test Summary
Boring - Sample Number Depth (ft) pH
Minimum Resistivity (ohm-cm)
Chloride Content (ppm)
Sulfate Content (ppm)
B3-7 36.0 8.57 1,070 12.1 225.9 B4-4 21.0 8.18 1,150 12.0 175.2 B4-8 40.0 8.54 1,850 3.7 19.4 B5-9 46.0 8.55 800 12.9 131.8 B6-1 6.0 7.72 1,720 6.9 100.4
According to Caltrans Corrosion Guidelines, a site is considered corrosive to foundation elements if one or more of the following conditions exist: Chloride concentration is greater than or equal to 500 ppm, sulfate concentration is greater than or equal to 2000 ppm, minimal resistivity of 1000 ohm-cm or less, or the pH is 5.5 or less. Based on Caltrans guidelines, the site soils are non-corrosive to cementitious materials but may be corrosive to ferrous material. We recommend consulting a corrosion engineer to develop possible corrosion mitigation measures, as needed.
7.3 EXPANSION INDEX TESTS
Results of Expansion Index (EI) tests conducted on both the terrace soils and the bedrock show EI = 3 and 54, respectively. Table 4 summarizes these results and those previously performed for the casino expansion in 2000 by Taber Consultants.
Table 4: Expansion Index Test Summary
Exploration Boring - Sample Number Description EI Expansion
Potential
Crawford (2016) Bulk 1 Terrace Deposits 3 Very Low Bulk 2 Bedrock 54 Medium
Taber (1998) TP1@4’ Terrace Deposits 14 Very Low TP3@8’ Bedrock 30 Low
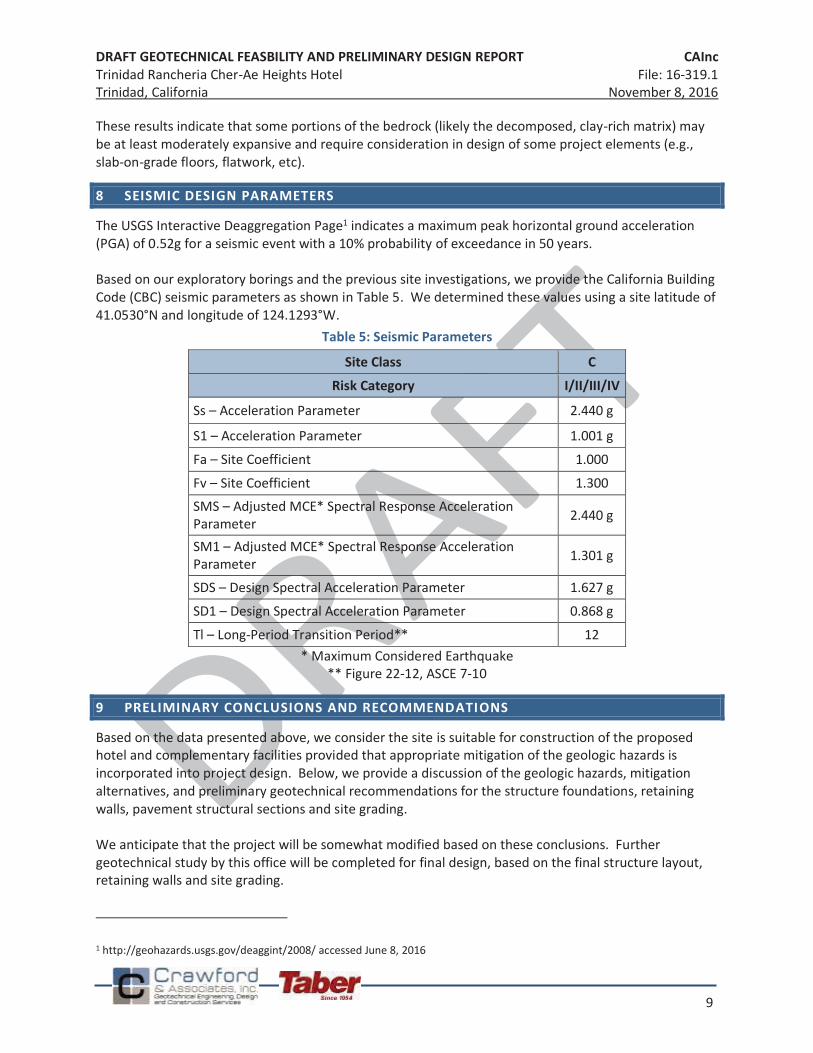
DRAFT GEOTECHNICAL FEASBILITY AND PRELIMINARY DESIGN REPORT CAInc Trinidad Rancheria Cher-Ae Heights Hotel File: 16-319.1 Trinidad, California November 8, 2016
9
These results indicate that some portions of the bedrock (likely the decomposed, clay-rich matrix) may be at least moderately expansive and require consideration in design of some project elements (e.g., slab-on-grade floors, flatwork, etc).
8 SEISMIC DESIGN PARAMETERS
The USGS Interactive Deaggregation Page1 indicates a maximum peak horizontal ground acceleration (PGA) of 0.52g for a seismic event with a 10% probability of exceedance in 50 years. Based on our exploratory borings and the previous site investigations, we provide the California Building Code (CBC) seismic parameters as shown in Table 5. We determined these values using a site latitude of 41.0530°N and longitude of 124.1293°W.
Table 5: Seismic Parameters
Site Class C Risk Category I/II/III/IV
Ss – Acceleration Parameter 2.440 g
S1 – Acceleration Parameter 1.001 g Fa – Site Coefficient 1.000 Fv – Site Coefficient 1.300 SMS – Adjusted MCE* Spectral Response Acceleration Parameter 2.440 g
SM1 – Adjusted MCE* Spectral Response Acceleration Parameter 1.301 g
SDS – Design Spectral Acceleration Parameter 1.627 g SD1 – Design Spectral Acceleration Parameter 0.868 g Tl – Long-Period Transition Period** 12
* Maximum Considered Earthquake ** Figure 22-12, ASCE 7-10
9 PRELIMINARY CONCLUSIONS AND RECOMMENDATIONS
Based on the data presented above, we consider the site is suitable for construction of the proposed hotel and complementary facilities provided that appropriate mitigation of the geologic hazards is incorporated into project design. Below, we provide a discussion of the geologic hazards, mitigation alternatives, and preliminary geotechnical recommendations for the structure foundations, retaining walls, pavement structural sections and site grading. We anticipate that the project will be somewhat modified based on these conclusions. Further geotechnical study by this office will be completed for final design, based on the final structure layout, retaining walls and site grading.
1 http://geohazards.usgs.gov/deaggint/2008/ accessed June 8, 2016
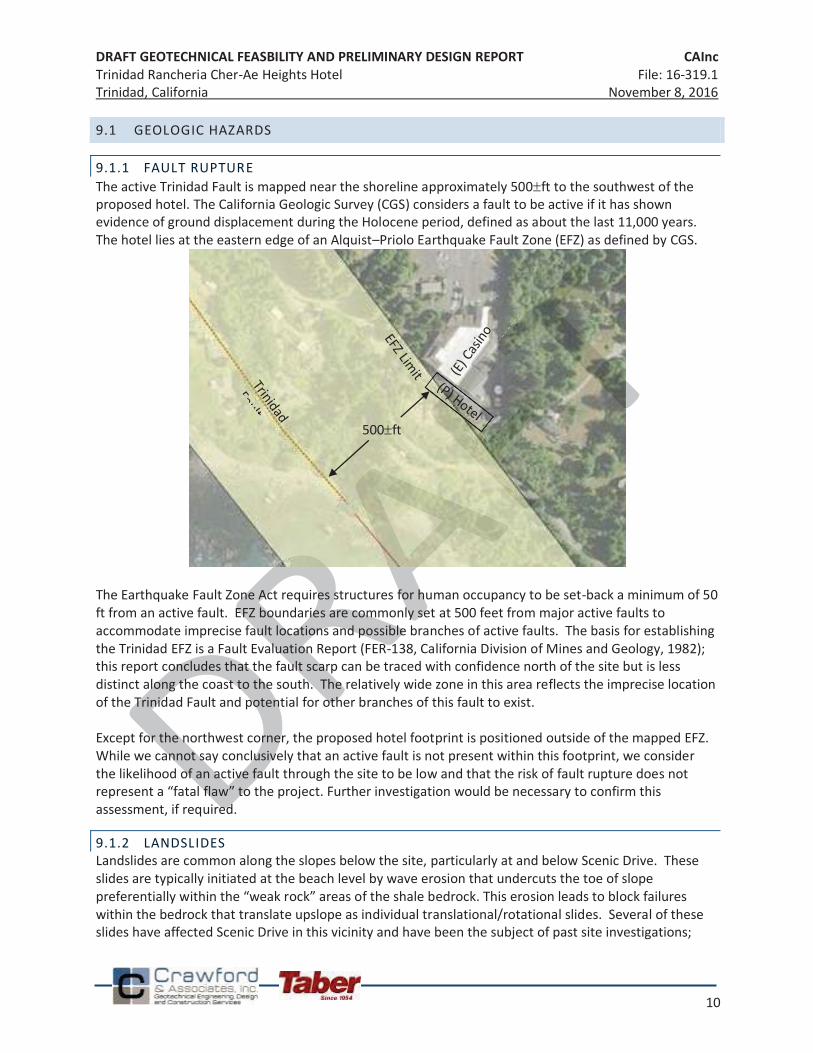
DRAFT GEOTECHNICAL FEASBILITY AND PRELIMINARY DESIGN REPORT CAInc Trinidad Rancheria Cher-Ae Heights Hotel File: 16-319.1 Trinidad, California November 8, 2016
10
9.1 GEOLOGIC HAZARDS
9.1.1 FAULT RUPTURE The active Trinidad Fault is mapped near the shoreline approximately 500 ft to the southwest of the proposed hotel. The California Geologic Survey (CGS) considers a fault to be active if it has shown evidence of ground displacement during the Holocene period, defined as about the last 11,000 years. The hotel lies at the eastern edge of an Alquist–Priolo Earthquake Fault Zone (EFZ) as defined by CGS.
The Earthquake Fault Zone Act requires structures for human occupancy to be set-back a minimum of 50 ft from an active fault. EFZ boundaries are commonly set at 500 feet from major active faults to accommodate imprecise fault locations and possible branches of active faults. The basis for establishing the Trinidad EFZ is a Fault Evaluation Report (FER-138, California Division of Mines and Geology, 1982); this report concludes that the fault scarp can be traced with confidence north of the site but is less distinct along the coast to the south. The relatively wide zone in this area reflects the imprecise location of the Trinidad Fault and potential for other branches of this fault to exist. Except for the northwest corner, the proposed hotel footprint is positioned outside of the mapped EFZ. While we cannot say conclusively that an active fault is not present within this footprint, we consider the likelihood of an active fault through the site to be low and that the risk of fault rupture does not represent a “fatal flaw” to the project. Further investigation would be necessary to confirm this assessment, if required.
9.1.2 LANDSLIDES Landslides are common along the slopes below the site, particularly at and below Scenic Drive. These slides are typically initiated at the beach level by wave erosion that undercuts the toe of slope preferentially within the “weak rock” areas of the shale bedrock. This erosion leads to block failures within the bedrock that translate upslope as individual translational/rotational slides. Several of these slides have affected Scenic Drive in this vicinity and have been the subject of past site investigations;
500 ft
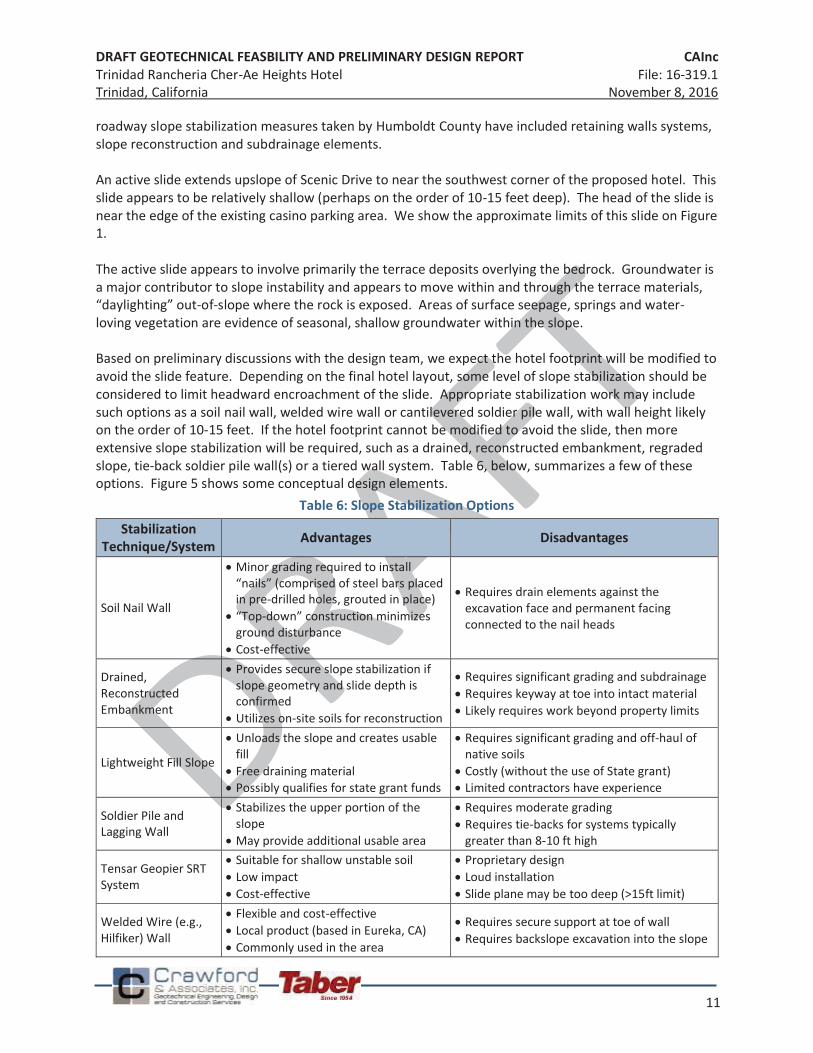
DRAFT GEOTECHNICAL FEASBILITY AND PRELIMINARY DESIGN REPORT CAInc Trinidad Rancheria Cher-Ae Heights Hotel File: 16-319.1 Trinidad, California November 8, 2016
11
roadway slope stabilization measures taken by Humboldt County have included retaining walls systems, slope reconstruction and subdrainage elements. An active slide extends upslope of Scenic Drive to near the southwest corner of the proposed hotel. This slide appears to be relatively shallow (perhaps on the order of 10-15 feet deep). The head of the slide is near the edge of the existing casino parking area. We show the approximate limits of this slide on Figure 1. The active slide appears to involve primarily the terrace deposits overlying the bedrock. Groundwater is a major contributor to slope instability and appears to move within and through the terrace materials, “daylighting” out-of-slope where the rock is exposed. Areas of surface seepage, springs and water-loving vegetation are evidence of seasonal, shallow groundwater within the slope. Based on preliminary discussions with the design team, we expect the hotel footprint will be modified to avoid the slide feature. Depending on the final hotel layout, some level of slope stabilization should be considered to limit headward encroachment of the slide. Appropriate stabilization work may include such options as a soil nail wall, welded wire wall or cantilevered soldier pile wall, with wall height likely on the order of 10-15 feet. If the hotel footprint cannot be modified to avoid the slide, then more extensive slope stabilization will be required, such as a drained, reconstructed embankment, regraded slope, tie-back soldier pile wall(s) or a tiered wall system. Table 6, below, summarizes a few of these options. Figure 5 shows some conceptual design elements.
Table 6: Slope Stabilization Options Stabilization
Technique/System Advantages Disadvantages
Soil Nail Wall
Minor grading required to install “nails” (comprised of steel bars placed in pre-drilled holes, grouted in place) “Top-down” construction minimizes ground disturbance Cost-effective
Requires drain elements against the excavation face and permanent facing connected to the nail heads
Drained, Reconstructed Embankment
Provides secure slope stabilization if slope geometry and slide depth is confirmed Utilizes on-site soils for reconstruction
Requires significant grading and subdrainage Requires keyway at toe into intact material Likely requires work beyond property limits
Lightweight Fill Slope
Unloads the slope and creates usable fill Free draining material Possibly qualifies for state grant funds
Requires significant grading and off-haul of native soils Costly (without the use of State grant) Limited contractors have experience
Soldier Pile and Lagging Wall
Stabilizes the upper portion of the slope May provide additional usable area
Requires moderate grading Requires tie-backs for systems typically greater than 8-10 ft high
Tensar Geopier SRT System
Suitable for shallow unstable soil Low impact Cost-effective
Proprietary design Loud installation Slide plane may be too deep (>15ft limit)
Welded Wire (e.g., Hilfiker) Wall
Flexible and cost-effective Local product (based in Eureka, CA) Commonly used in the area
Requires secure support at toe of wall Requires backslope excavation into the slope
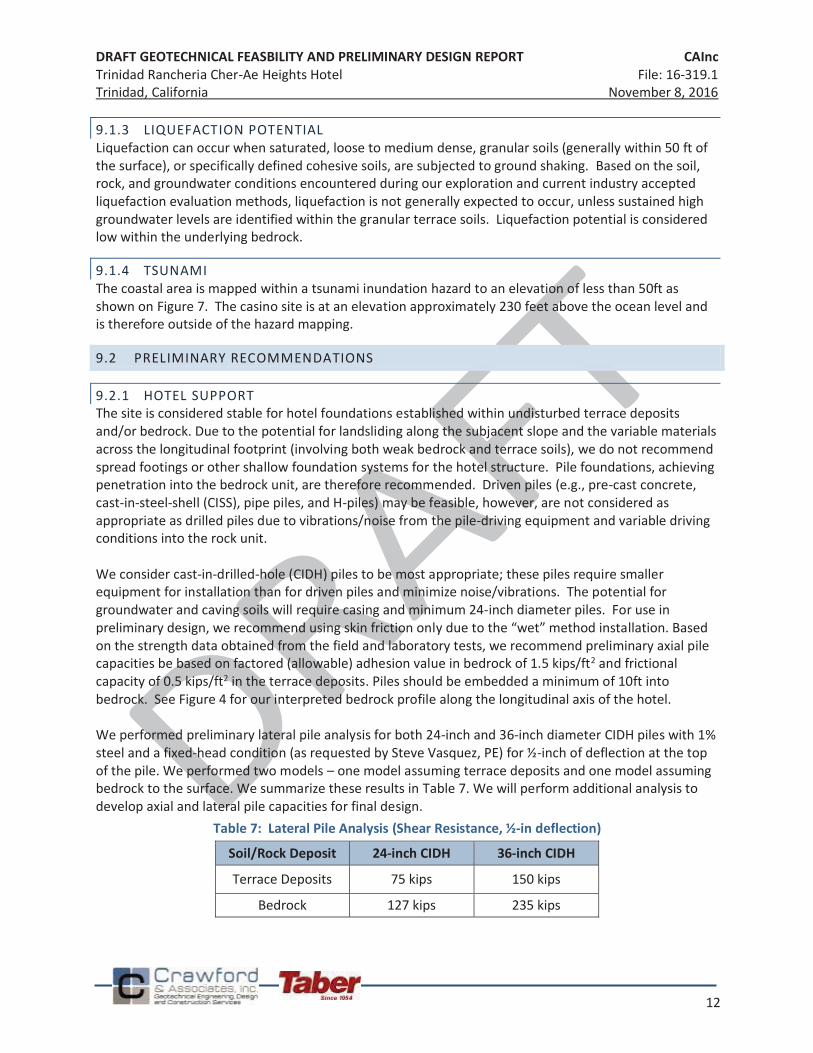
DRAFT GEOTECHNICAL FEASBILITY AND PRELIMINARY DESIGN REPORT CAInc Trinidad Rancheria Cher-Ae Heights Hotel File: 16-319.1 Trinidad, California November 8, 2016
12
9.1.3 LIQUEFACTION POTENTIAL Liquefaction can occur when saturated, loose to medium dense, granular soils (generally within 50 ft of the surface), or specifically defined cohesive soils, are subjected to ground shaking. Based on the soil, rock, and groundwater conditions encountered during our exploration and current industry accepted liquefaction evaluation methods, liquefaction is not generally expected to occur, unless sustained high groundwater levels are identified within the granular terrace soils. Liquefaction potential is considered low within the underlying bedrock.
9.1.4 TSUNAMI The coastal area is mapped within a tsunami inundation hazard to an elevation of less than 50ft as shown on Figure 7. The casino site is at an elevation approximately 230 feet above the ocean level and is therefore outside of the hazard mapping.
9.2 PRELIMINARY RECOMMENDATIONS
9.2.1 HOTEL SUPPORT The site is considered stable for hotel foundations established within undisturbed terrace deposits and/or bedrock. Due to the potential for landsliding along the subjacent slope and the variable materials across the longitudinal footprint (involving both weak bedrock and terrace soils), we do not recommend spread footings or other shallow foundation systems for the hotel structure. Pile foundations, achieving penetration into the bedrock unit, are therefore recommended. Driven piles (e.g., pre-cast concrete, cast-in-steel-shell (CISS), pipe piles, and H-piles) may be feasible, however, are not considered as appropriate as drilled piles due to vibrations/noise from the pile-driving equipment and variable driving conditions into the rock unit. We consider cast-in-drilled-hole (CIDH) piles to be most appropriate; these piles require smaller equipment for installation than for driven piles and minimize noise/vibrations. The potential for groundwater and caving soils will require casing and minimum 24-inch diameter piles. For use in preliminary design, we recommend using skin friction only due to the “wet” method installation. Based on the strength data obtained from the field and laboratory tests, we recommend preliminary axial pile capacities be based on factored (allowable) adhesion value in bedrock of 1.5 kips/ft2 and frictional capacity of 0.5 kips/ft2 in the terrace deposits. Piles should be embedded a minimum of 10ft into bedrock. See Figure 4 for our interpreted bedrock profile along the longitudinal axis of the hotel. We performed preliminary lateral pile analysis for both 24-inch and 36-inch diameter CIDH piles with 1% steel and a fixed-head condition (as requested by Steve Vasquez, PE) for ½-inch of deflection at the top of the pile. We performed two models – one model assuming terrace deposits and one model assuming bedrock to the surface. We summarize these results in Table 7. We will perform additional analysis to develop axial and lateral pile capacities for final design.
Table 7: Lateral Pile Analysis (Shear Resistance, ½-in deflection)
Soil/Rock Deposit 24-inch CIDH 36-inch CIDH
Terrace Deposits 75 kips 150 kips
Bedrock 127 kips 235 kips
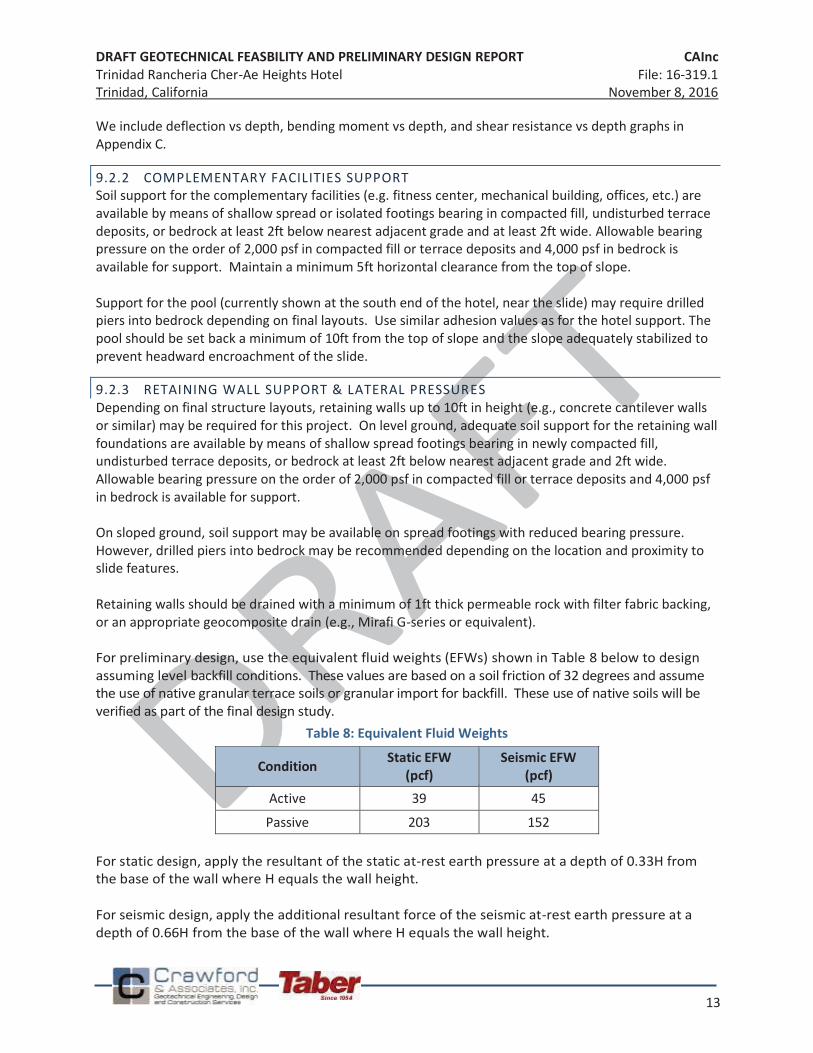
DRAFT GEOTECHNICAL FEASBILITY AND PRELIMINARY DESIGN REPORT CAInc Trinidad Rancheria Cher-Ae Heights Hotel File: 16-319.1 Trinidad, California November 8, 2016
13
We include deflection vs depth, bending moment vs depth, and shear resistance vs depth graphs in Appendix C.
9.2.2 COMPLEMENTARY FACILITIES SUPPORT Soil support for the complementary facilities (e.g. fitness center, mechanical building, offices, etc.) are available by means of shallow spread or isolated footings bearing in compacted fill, undisturbed terrace deposits, or bedrock at least 2ft below nearest adjacent grade and at least 2ft wide. Allowable bearing pressure on the order of 2,000 psf in compacted fill or terrace deposits and 4,000 psf in bedrock is available for support. Maintain a minimum 5ft horizontal clearance from the top of slope. Support for the pool (currently shown at the south end of the hotel, near the slide) may require drilled piers into bedrock depending on final layouts. Use similar adhesion values as for the hotel support. The pool should be set back a minimum of 10ft from the top of slope and the slope adequately stabilized to prevent headward encroachment of the slide.
9.2.3 RETAINING WALL SUPPORT & LATERAL PRESSURES Depending on final structure layouts, retaining walls up to 10ft in height (e.g., concrete cantilever walls or similar) may be required for this project. On level ground, adequate soil support for the retaining wall foundations are available by means of shallow spread footings bearing in newly compacted fill, undisturbed terrace deposits, or bedrock at least 2ft below nearest adjacent grade and 2ft wide. Allowable bearing pressure on the order of 2,000 psf in compacted fill or terrace deposits and 4,000 psf in bedrock is available for support. On sloped ground, soil support may be available on spread footings with reduced bearing pressure. However, drilled piers into bedrock may be recommended depending on the location and proximity to slide features. Retaining walls should be drained with a minimum of 1ft thick permeable rock with filter fabric backing, or an appropriate geocomposite drain (e.g., Mirafi G-series or equivalent). For preliminary design, use the equivalent fluid weights (EFWs) shown in Table 8 below to design assuming level backfill conditions. These values are based on a soil friction of 32 degrees and assume the use of native granular terrace soils or granular import for backfill. These use of native soils will be verified as part of the final design study.
Table 8: Equivalent Fluid Weights
Condition Static EFW (pcf)
Seismic EFW (pcf)
Active 39 45 Passive 203 152
For static design, apply the resultant of the static at-rest earth pressure at a depth of 0.33H from the base of the wall where H equals the wall height. For seismic design, apply the additional resultant force of the seismic at-rest earth pressure at a depth of 0.66H from the base of the wall where H equals the wall height.
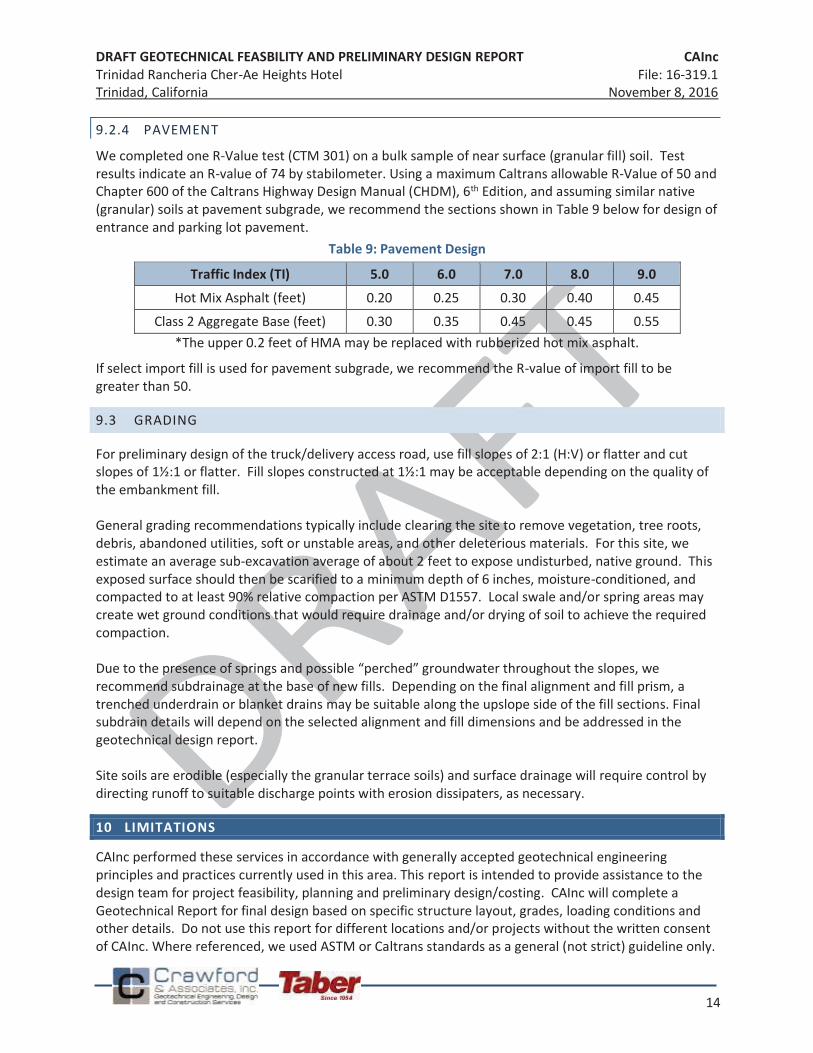
DRAFT GEOTECHNICAL FEASBILITY AND PRELIMINARY DESIGN REPORT CAInc Trinidad Rancheria Cher-Ae Heights Hotel File: 16-319.1 Trinidad, California November 8, 2016
14
9.2.4 PAVEMENT
We completed one R-Value test (CTM 301) on a bulk sample of near surface (granular fill) soil. Test results indicate an R-value of 74 by stabilometer. Using a maximum Caltrans allowable R-Value of 50 and Chapter 600 of the Caltrans Highway Design Manual (CHDM), 6th Edition, and assuming similar native (granular) soils at pavement subgrade, we recommend the sections shown in Table 9 below for design of entrance and parking lot pavement.
Table 9: Pavement Design
Traffic Index (TI) 5.0 6.0 7.0 8.0 9.0 Hot Mix Asphalt (feet) 0.20 0.25 0.30 0.40 0.45
Class 2 Aggregate Base (feet) 0.30 0.35 0.45 0.45 0.55 *The upper 0.2 feet of HMA may be replaced with rubberized hot mix asphalt.
If select import fill is used for pavement subgrade, we recommend the R-value of import fill to be greater than 50.
9.3 GRADING
For preliminary design of the truck/delivery access road, use fill slopes of 2:1 (H:V) or flatter and cut slopes of 1½:1 or flatter. Fill slopes constructed at 1½:1 may be acceptable depending on the quality of the embankment fill. General grading recommendations typically include clearing the site to remove vegetation, tree roots, debris, abandoned utilities, soft or unstable areas, and other deleterious materials. For this site, we estimate an average sub-excavation average of about 2 feet to expose undisturbed, native ground. This exposed surface should then be scarified to a minimum depth of 6 inches, moisture-conditioned, and compacted to at least 90% relative compaction per ASTM D1557. Local swale and/or spring areas may create wet ground conditions that would require drainage and/or drying of soil to achieve the required compaction. Due to the presence of springs and possible “perched” groundwater throughout the slopes, we recommend subdrainage at the base of new fills. Depending on the final alignment and fill prism, a trenched underdrain or blanket drains may be suitable along the upslope side of the fill sections. Final subdrain details will depend on the selected alignment and fill dimensions and be addressed in the geotechnical design report. Site soils are erodible (especially the granular terrace soils) and surface drainage will require control by directing runoff to suitable discharge points with erosion dissipaters, as necessary.
10 LIMITATIONS
CAInc performed these services in accordance with generally accepted geotechnical engineering principles and practices currently used in this area. This report is intended to provide assistance to the design team for project feasibility, planning and preliminary design/costing. CAInc will complete a Geotechnical Report for final design based on specific structure layout, grades, loading conditions and other details. Do not use this report for different locations and/or projects without the written consent of CAInc. Where referenced, we used ASTM or Caltrans standards as a general (not strict) guideline only.

DRAFT GEOTECHNICAL FEASBILITY AND PRELIMINARY DESIGN REPORT CAInc Trinidad Rancheria Cher-Ae Heights Hotel File: 16-319.1 Trinidad, California November 8, 2016
15
CAInc based this report on the current site conditions. We assumed the soil/rock and groundwater conditions are representative of the subsurface conditions on the site. Actual conditions between explorations will vary.
Our scope did not include evaluation of on-site hazardous materials.
Logs of our explorations are presented in Appendix A. The lines designating the interface between soil types are approximate. The transition between soil types may be abrupt or gradual. Our recommendations are based on the final logs, which represent our interpretation of the field logs and general knowledge of the site and geological conditions.
DRAFT GEOTECHNICAL FEASBILITY AND PRELIMINARY DESIGN REPORT CAInc Trinidad Rancheria Cher-Ae Heights Hotel File: 16-319.1 Trinidad, California November 8, 2016
SELECT REFERENCES
Aalto, K.R., Geology of Trinidad, CA, Humboldt State University, 2009. Bradley, D.R., Stephens, T.A., Geotechnical Report: Proposed Expansion, Cher-Ae Heights Gaming Building, SHN Consulting Engineers & Geologists, 1998. Davis, J.F., State of California, Special Studies Zone: Trinidad Quadrangle, California Division of Mines and Geology, 1983. Delattre, M., Rosinski, A., Preliminary Geologic Map of Onshore Portions of the Crescent City and Orick 30’ x 60’ Quadrangles, California, California Geological Survey, 2012. Johnson, R.S., Cargay, E.A., Geotechnical Evaluation and Proposed Remediation of a Slope Failure, Mile Post 2.05 Scenic Drive, South of Trinidad, California, SHN Consulting Engineers & Geologists, 1992. McKnight, J.T., Lindberg, D.N., Figueroa, C., Engineering Geologic Report for Slide Movement on Scenic Drive and Effects on the Joy Sundberg Residence: Geohazard Investigation – Foundation and Slope Stability, Trinity Valley Consulting Engineers, 2013. Smith, T.C., Fault Evaluation Report FER-138. California Division of Mines and Geology, 1982. Sowers, R.D., Addendum No. 1 to “Geotechnical Investigation”, Taber Consultants, 1999. Sowers, R.D., Geotechnical Investigation: Trinidad Rancheria Expansion Project, Taber Consultants, 1999. Sowers, R.D., Subsurface Investigation: Scenic Drive PM 2.20 (south of Bingo Parlor), Taber Consultants, 1999. Taber, H.R., Subsurface Investigation: Trinidad Scenic Drive near Cher-Ae Lane, Taber Consultants, 1986. Taber, H.R., Subsurface Investigation: Trinidad Scenic Drive, Vicinity PM 1.25, Taber Consultants, 1994. Tsunami Inundation Map for Emergency Planning: Trinidad Quadrangle, Crannell Quadrangle, California Geological Survey, 2009.
DRAFT GEOTECHNICAL FEASBILITY AND PRELIMINARY DESIGN REPORT CAInc Trinidad Rancheria Cher-Ae Heights Hotel File: 16-319.1 Trinidad, California November 8, 2016
FIGURES
Exploration Location Map Figure 1 Cross Section AA’ Figure 2 Cross Section BB’ Figure 3 Cross Section CC’ Figure 4
Slope Remediation Examples Figure 5 Geology Map Figure 6
Tsunami Indundation Zone Figure 7 Fault Activity Map Figure 8
Earthquake Fault Zone Map Figure 9 Piezometer Logs Detail 1
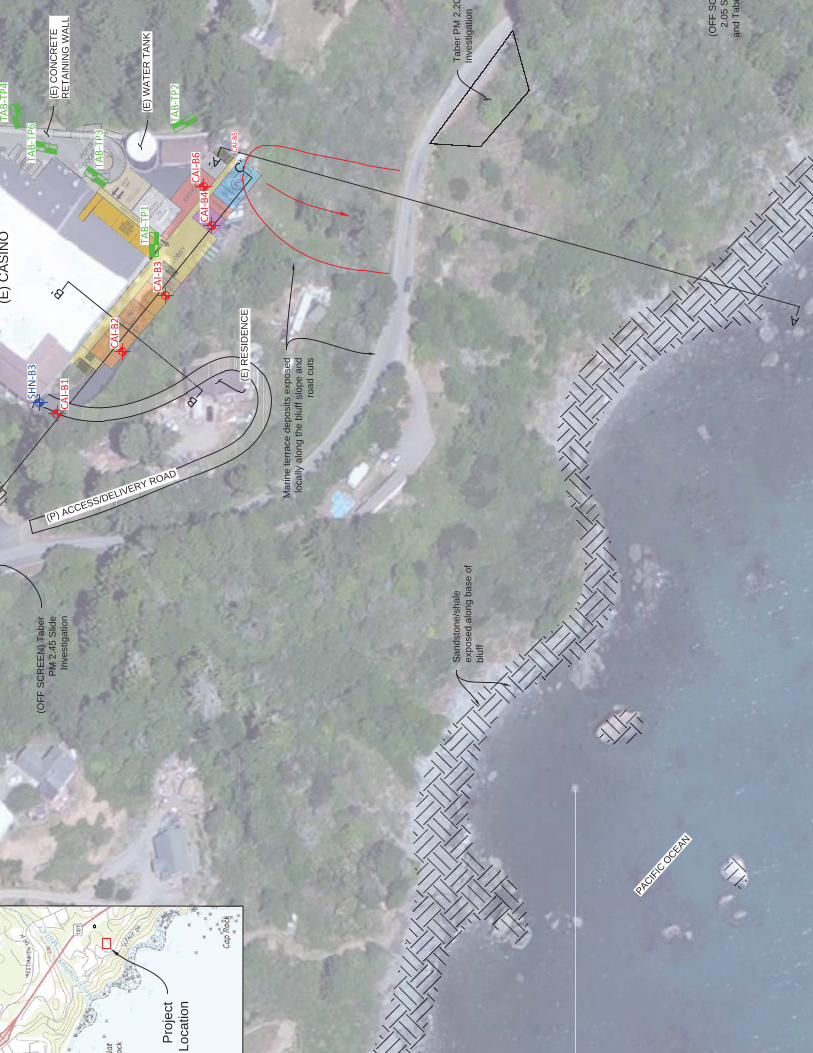
B'
B
A'
A
C'
Pro
ject
Loca
tion
(E)
CA
SIN
O
PACIFIC
OCEAN
(P) ACCESS/DELIVERY ROAD
Mar
ine
terr
ace
depo
sits
exp
osed
loca
lly a
long
the
bluf
f slo
pe a
ndro
ad c
uts
(E)
RE
SID
EN
CE
(E)
WA
TE
R T
AN
K
(E)
CO
NC
RE
TE
RE
TA
ININ
G W
ALL
San
dsto
ne/s
hale
expo
sed
alon
g ba
se o
fbl
uff
Tab
er P
M 2
.20
Inve
stig
atio
n
(OF
F S
CR
EE
N)
Tab
erP
M 2
.45
Slid
eIn
vest
igat
ion
(OF
F S
C2.
05 S
and
Tab
e
TAB-
TP4
TAB-
TP3
TAB-
TP1
TAB-
TP2
CAI-B
2
CAI-B
3
CAI-B
4CA
I-B6 CA
I-B5
CAI-B
1
SHN
-B3
TAB-
TP6
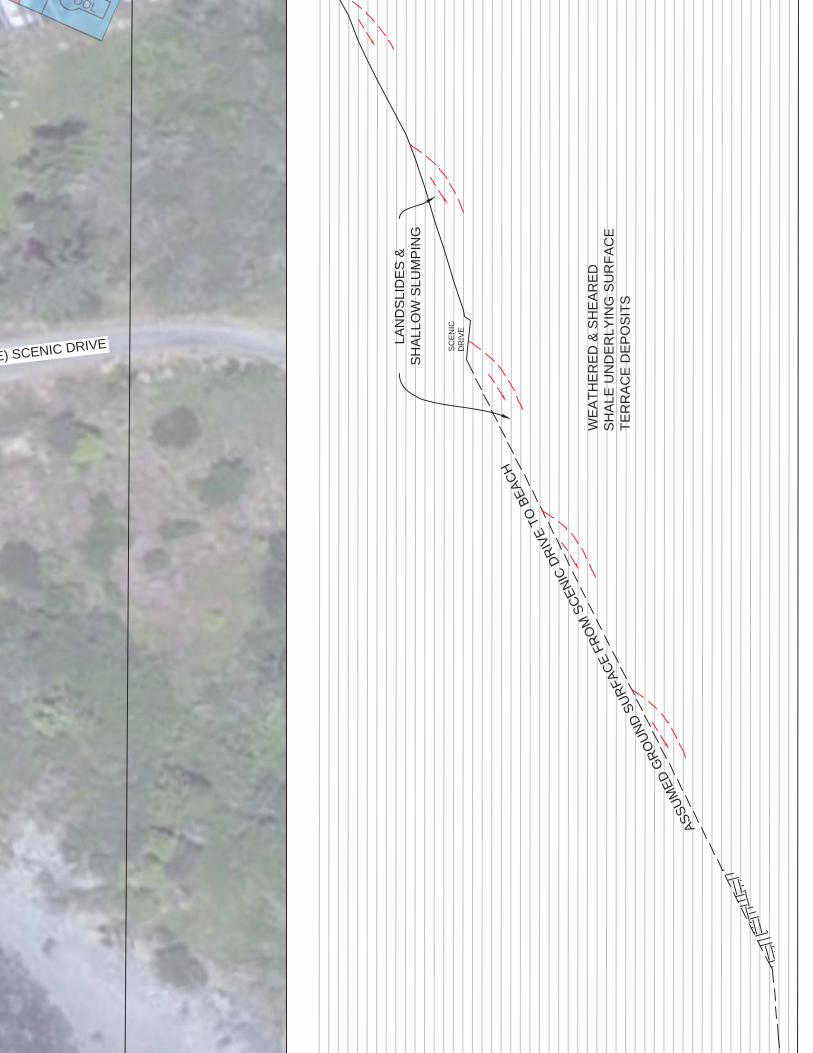
E) SCENIC DRIVE
AS
SU
ME
D G
RO
UN
D S
UR
FAC
E F
RO
M S
CE
NIC
DR
IVE
TO
BE
AC
H
SC
EN
ICD
RIV
E
LAN
DS
LID
ES
&S
HA
LLO
W S
LUM
PIN
G
WE
AT
HE
RE
D &
SH
EA
RE
DS
HA
LE U
ND
ER
LYIN
G S
UR
FA
CE
TE
RR
AC
E D
EP
OS
ITS
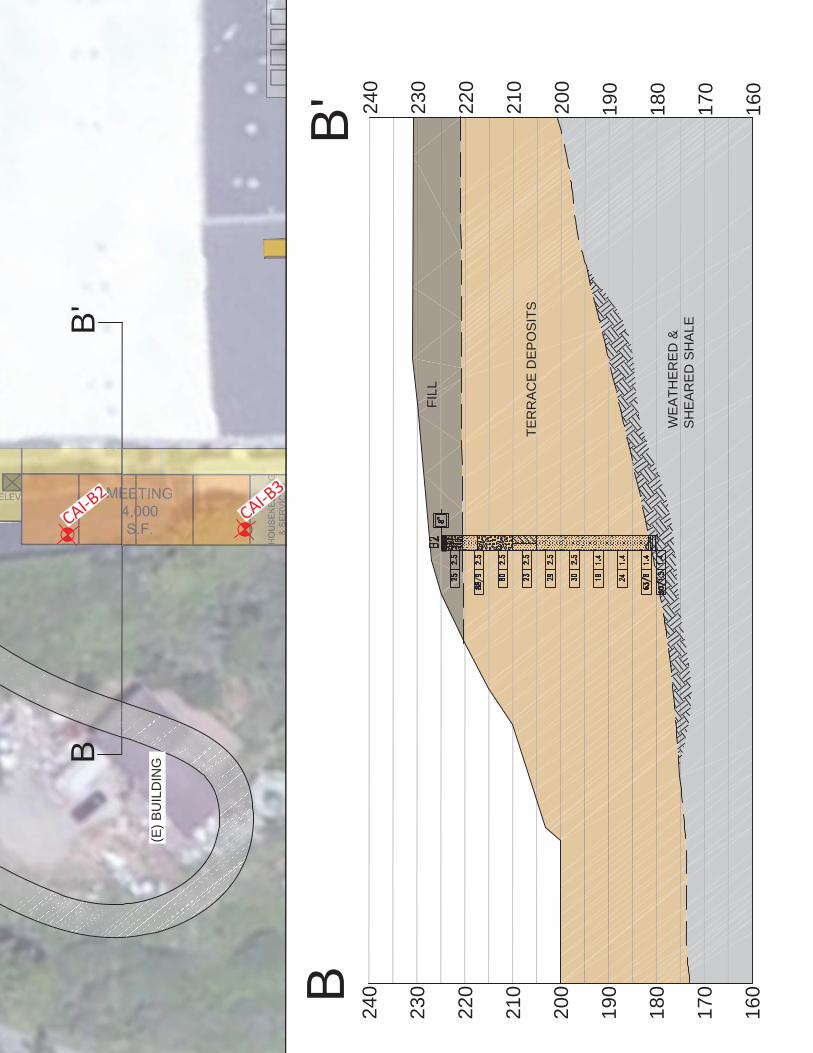
B'
B
CAI-B2
CAI-B3
160
170
180
190
200
210
220
230
240
160
170
180
190
200
210
220
230
240
BB
'
(E)
BU
ILD
ING
WE
AT
HE
RE
D &
SH
EA
RE
D S
HA
LE
TE
RR
AC
E D
EP
OS
ITS
FIL
L
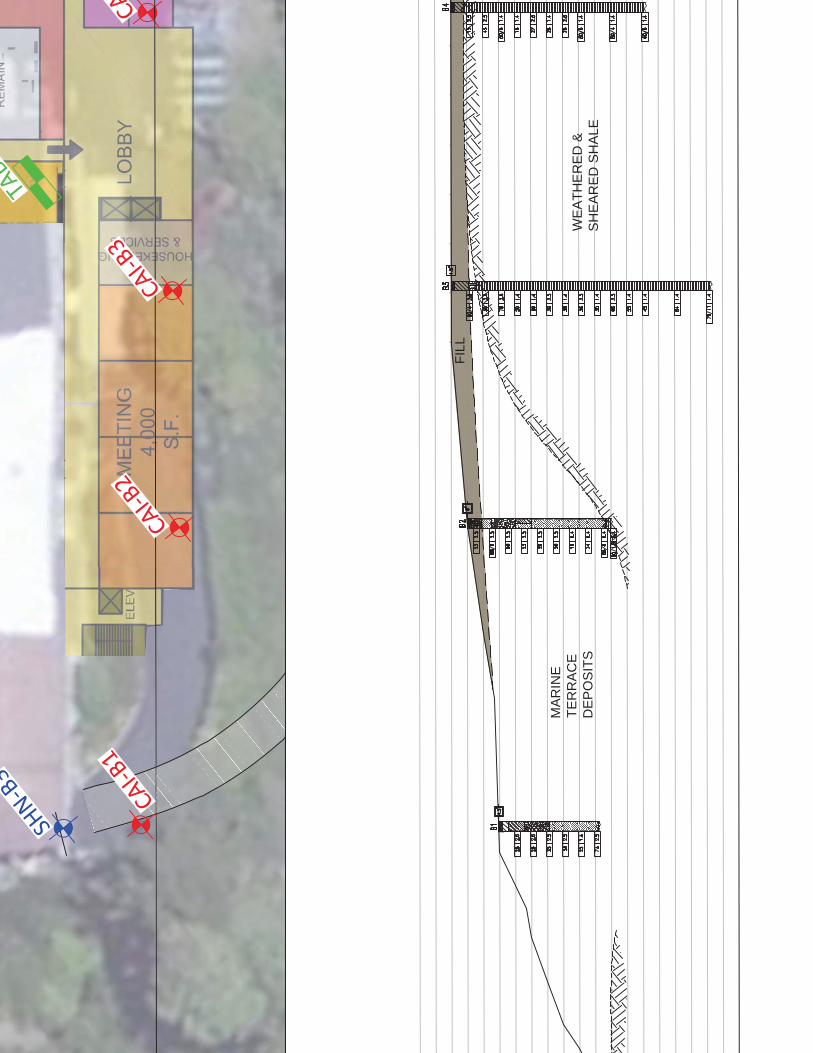
TAB
CAI-B
2CA
I-B3
CACA
I-B1
SHN-B
3
WE
AT
HE
RE
D &
SH
EA
RE
D S
HA
LE
MA
RIN
ET
ER
RA
CE
DE
PO
SIT
S
FIL
L

160
170
180
190
200
210
220
160
170
180
190
200
210
220
230
240
160
170
180
190
200
210
220
230
240
SC
EN
ICD
RIV
E
PO
OL
AN
D/O
RF
AC
ILIT
IES
SC
EN
ICD
RIV
E
ST
EM
WE
LD
ED
WIR
E (
HIL
FIK
ER
) W
AL
L
(US
E F
OR
RE
PLA
CE
(E.G
. TIR
EG
EO
FO
AM
)
TR
IM S
LO
TR
IM S
LOP
PO
OL
AN
D/O
RF
AC
ILIT
IES
SC
EN
ICD
RIV
E
ED
EM
BA
NK
ME
NT
SO
IL N
AIL
WA
LL
TR
IM S
LO
2:1
CO
MP
AC
TE
D F
ILL
DR
AIN
RO
CK
WIT
HF
ILT
ER
FA
BR
IC
SO
MIN
IM
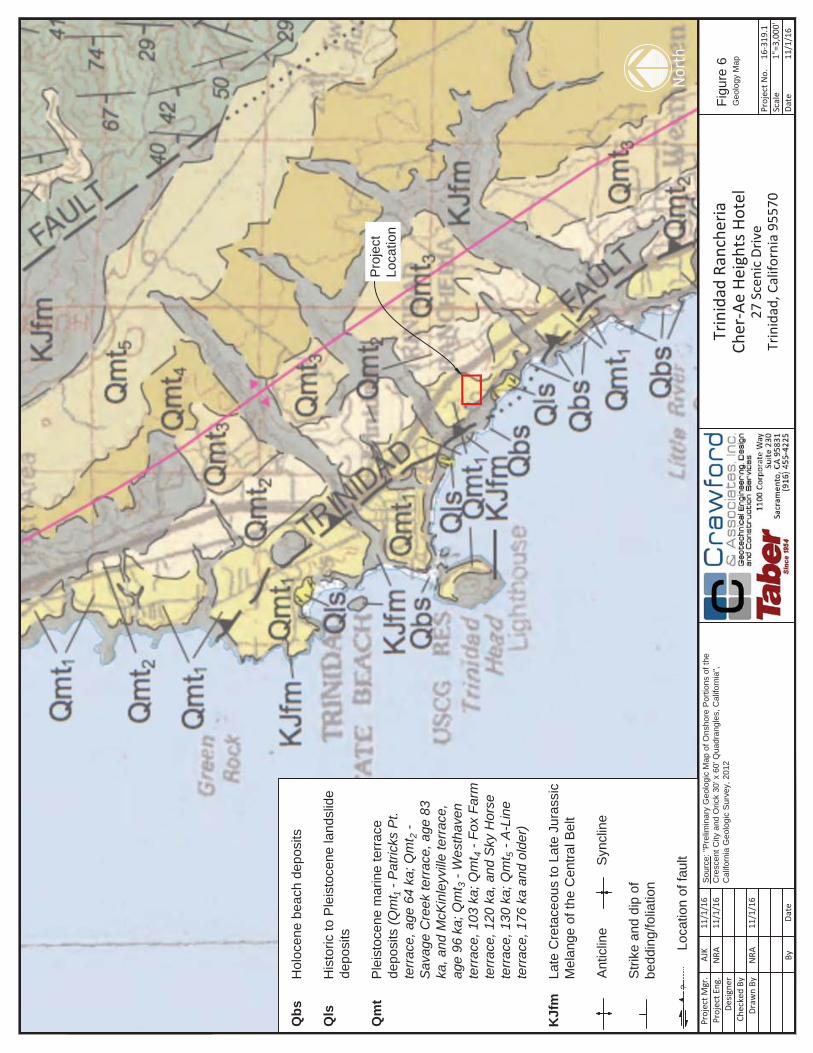
Proj
ect M
gr.
Proj
ect E
ng.
Desig
ner
Chec
ked
ByDr
awn
By
ByDa
te
Proj
ect N
o.Sc
ale
Date
11/1
/16
AJK
11/1
/16
NRA
11/1
/16
NRA
16-3
19.1
11/1
/16
Trin
idad
Ran
cher
iaCh
er-A
e He
ight
s Hot
el27
Sce
nic
Driv
eTr
inid
ad, C
alifo
rnia
955
70
Qb
s H
oloc
ene
beac
h de
posi
ts
Qls
H
isto
ric to
Ple
isto
cene
land
slid
ede
posi
ts
Qm
t P
leis
toce
ne m
arin
e te
rrac
ede
posi
ts (Q
mt 1
- Pat
ricks
Pt.
terr
ace,
age
64
ka; Q
mt 2
-S
avag
e C
reek
terr
ace,
age
83
ka, a
nd M
cKin
leyv
ille
terr
ace,
age
96 k
a; Q
mt 3
- W
esth
aven
terr
ace,
103
ka;
Qm
t 4 -
Fox
Farm
terr
ace,
120
ka,
and
Sky
Hor
sete
rrac
e, 1
30 k
a; Q
mt 5
- A
-Lin
ete
rrac
e, 1
76 k
a an
d ol
der)
KJf
m
Late
Cre
tace
ous
to L
ate
Jura
ssic
Mel
ange
of t
he C
entr
al B
elt
Ant
iclin
e S
yncl
ine
Str
ike
and
dip
ofbe
ddin
g/fo
liatio
n
Loca
tion
of fa
ult
?
Pro
ject
Loca
tion
North
Fig
ure
6G
eolo
gy M
ap
1"=3
,000
'
Sou
rce:
"P
relim
inar
y G
eolo
gic
Map
of O
nsho
re P
ortio
ns o
f the
Cre
scen
t City
and
Oric
k 30
' x 6
0' Q
uadr
angl
es, C
alifo
rnia
",C
alifo
rnia
Geo
logi
c S
urve
y, 2
012
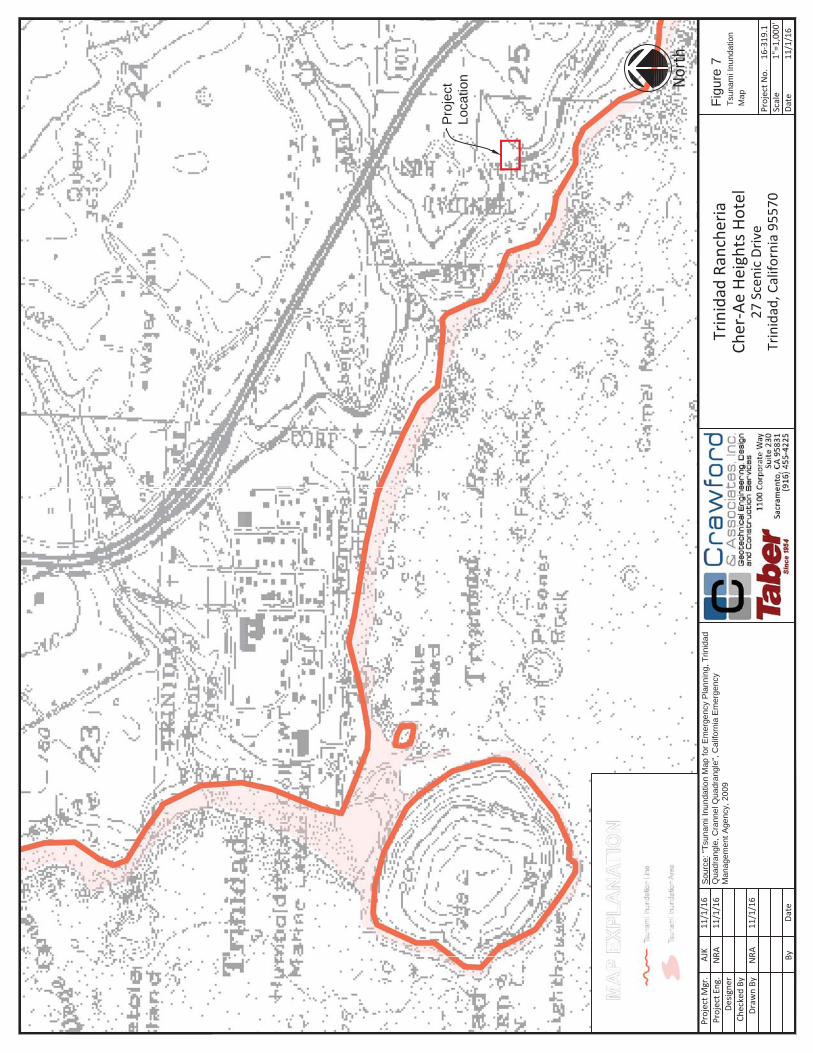
Proj
ect M
gr.
Proj
ect E
ng.
Desig
ner
Chec
ked
ByDr
awn
By
ByDa
te
Proj
ect N
o.Sc
ale
Date
11/1
/16
AJK
11/1
/16
NRA
11/1
/16
NRA
16-3
19.1
11/1
/16
Trin
idad
Ran
cher
iaCh
er-A
e He
ight
s Hot
el27
Sce
nic
Driv
eTr
inid
ad, C
alifo
rnia
955
70
Pro
ject
Loca
tion No
rth
Fig
ure
7T
suna
mi I
nund
atio
nM
ap
1"=1
,000
'
Sou
rce:
"T
suna
mi I
nund
atio
n M
ap fo
r E
mer
genc
y P
lann
ing,
Trin
idad
Qua
dran
gle,
Cra
nnel
Qua
dran
gle"
, Cal
iforn
ia E
mer
genc
yM
anag
emen
t Age
ncy,
200
9
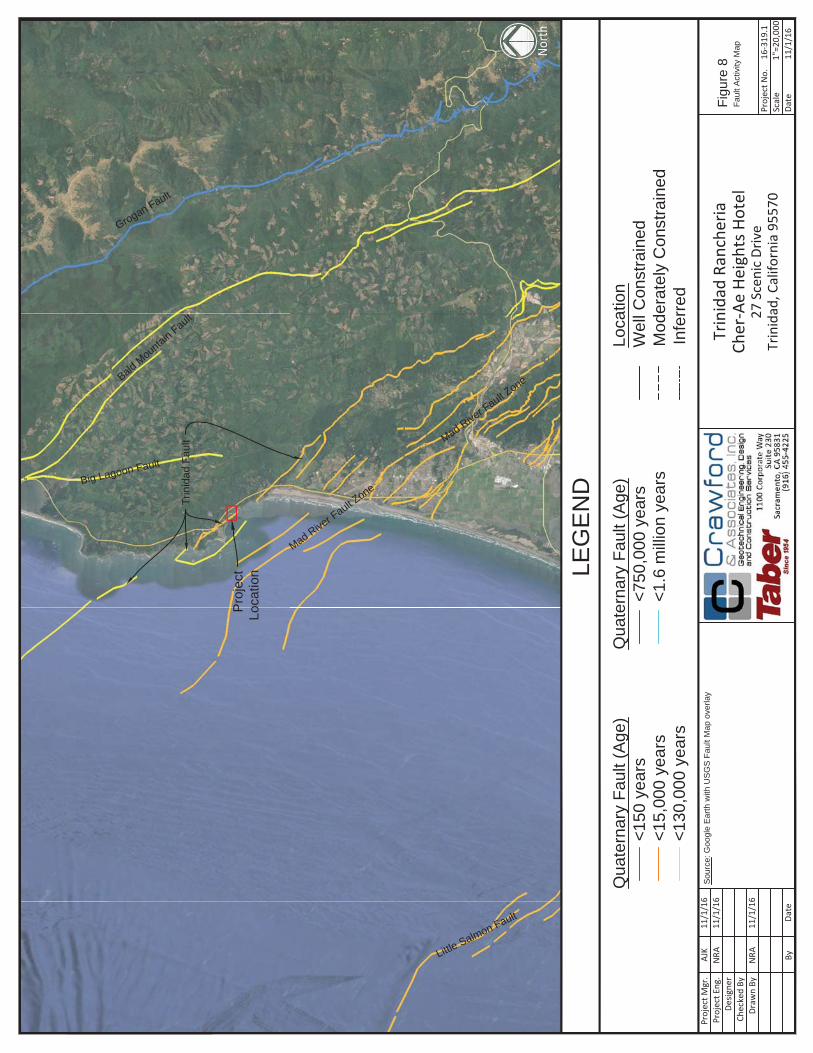
Proj
ect M
gr.
Proj
ect E
ng.
Desig
ner
Chec
ked
ByDr
awn
By
ByDa
te
Proj
ect N
o.Sc
ale
Date
11/1
/16
AJK
11/1
/16
NRA
11/1
/16
NRA
16-3
19.1
11/1
/16
Trin
idad
Ran
cher
iaCh
er-A
e He
ight
s Hot
el27
Sce
nic
Driv
eTr
inid
ad, C
alifo
rnia
955
70
LEG
EN
D
North
Qua
tern
ary
Fau
lt (A
ge)
<15
0 ye
ars
<15
,000
yea
rs<
130,
000
year
s
Qua
tern
ary
Fau
lt (A
ge)
<75
0,00
0 ye
ars
<1.
6 m
illio
n ye
ars
Loca
tion
W
ell C
onst
rain
ed
Mod
erat
ely
Con
stra
ined
In
ferr
ed
Fig
ure
8F
ault
Act
ivity
Map
1"=2
0,00
0'
Pro
ject
Loca
tion
Trin
idad
Fau
lt
Mad Rive
r Fault Z
one
Little Salmon Fault
Bald Mountain F
ault
Grogan Fault
Big Lagoon Fault
Mad Rive
r Fault Z
one
Sou
rce:
Goo
gle
Ear
th w
ith U
SG
S F
ault
Map
ove
rlay
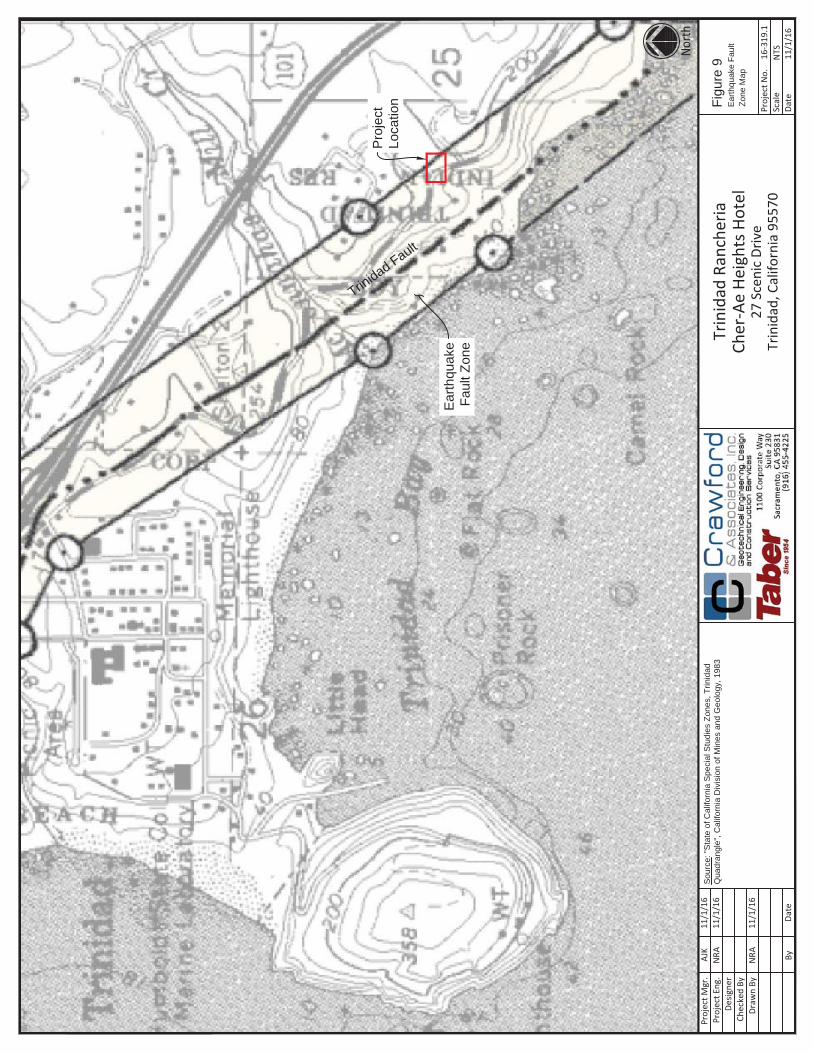
Proj
ect M
gr.
Proj
ect E
ng.
Desig
ner
Chec
ked
ByDr
awn
By
ByDa
te
Proj
ect N
o.Sc
ale
Date
11/1
/16
AJK
11/1
/16
NRA
11/1
/16
NRA
16-3
19.1
11/1
/16
Trin
idad
Ran
cher
iaCh
er-A
e He
ight
s Hot
el27
Sce
nic
Driv
eTr
inid
ad, C
alifo
rnia
955
70
North
Fig
ure
9E
arth
quak
e F
ault
Zon
e M
ap
NTS
Pro
ject
Loca
tion
Ear
thqu
ake
Fau
lt Z
one
Trinidad Fault
Sou
rce:
"S
tate
of C
alifo
rnia
Spe
cial
Stu
dies
Zon
es, T
rinid
adQ
uadr
angl
e", C
alifo
rnia
Div
isio
n of
Min
es a
nd G
eolo
gy, 1
983
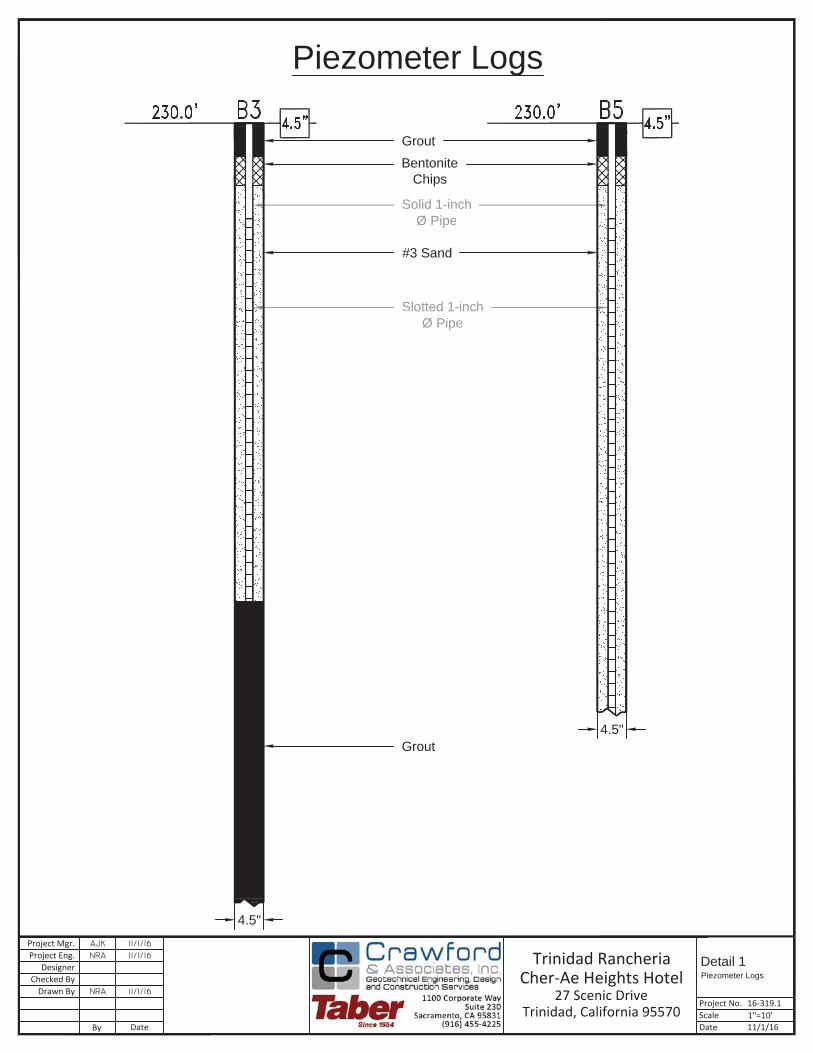
Detail 1Piezometer Logs
1"=10'
Project Mgr.Project Eng.
DesignerChecked By
Drawn By
By Date
Project No.ScaleDate
Trinidad RancheriaCher-Ae Heights Hotel
27 Scenic DriveTrinidad, California 95570
16-319.1
11/1/16
Grout
Grout
BentoniteChips
#3 Sand
Slotted 1-inchØ Pipe
Solid 1-inchØ Pipe
4.5"
4.5"
Piezometer Logs

DRAFT GEOTECHNICAL FEASBILITY AND PRELIMINARY DESIGN REPORT CAInc Trinidad Rancheria Cher-Ae Heights Hotel File: 16-319.1 Trinidad, California November 8, 2016
APPENDIX A
Boring Log Legend Boring Logs
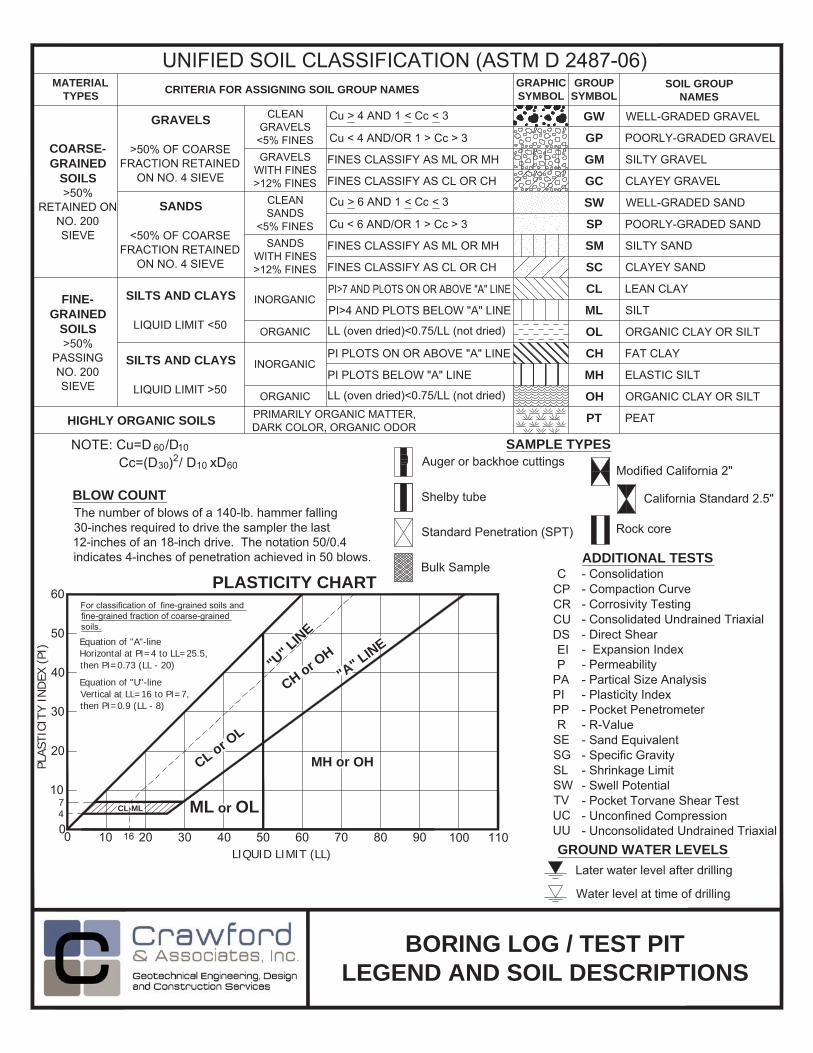
BORING LOG / TEST PITLEGEND AND SOIL DESCRIPTIONS
MATERIALTYPES
GROUPSYMBOL
CRITERIA FOR ASSIGNING SOIL GROUP NAMES SOIL GROUPNAMES
COARSE-GRAINED
SOILS
FINE-GRAINED
SOILS
GRAVELS
SANDS
SILTS AND CLAYS
SILTS AND CLAYS
HIGHLY ORGANIC SOILS
GW
GP
GM
GC
SW
SP
SM
SC
CL
ML
OL
CH
MH
OH
PT
SAMPLE TYPES
ADDITIONAL TESTS
CL-ML
PLASTICITY CHART
ML or OL
MH or OH
"A" L
INE
PLAS
TICI
TY I
ND
EX (
PI)
LIQUID LIMIT (LL)
BLOW COUNT
GROUND WATER LEVELS
"U" L
INE
CL or OL
CH or OH
Equation of "A"-lineHorizontal at PI=4 to LL=25.5,then PI=0.73 (LL - 20)
Equation of "U"-lineVertical at LL=16 to PI=7,then PI=0.9 (LL - 8)
GRAPHICSYMBOL
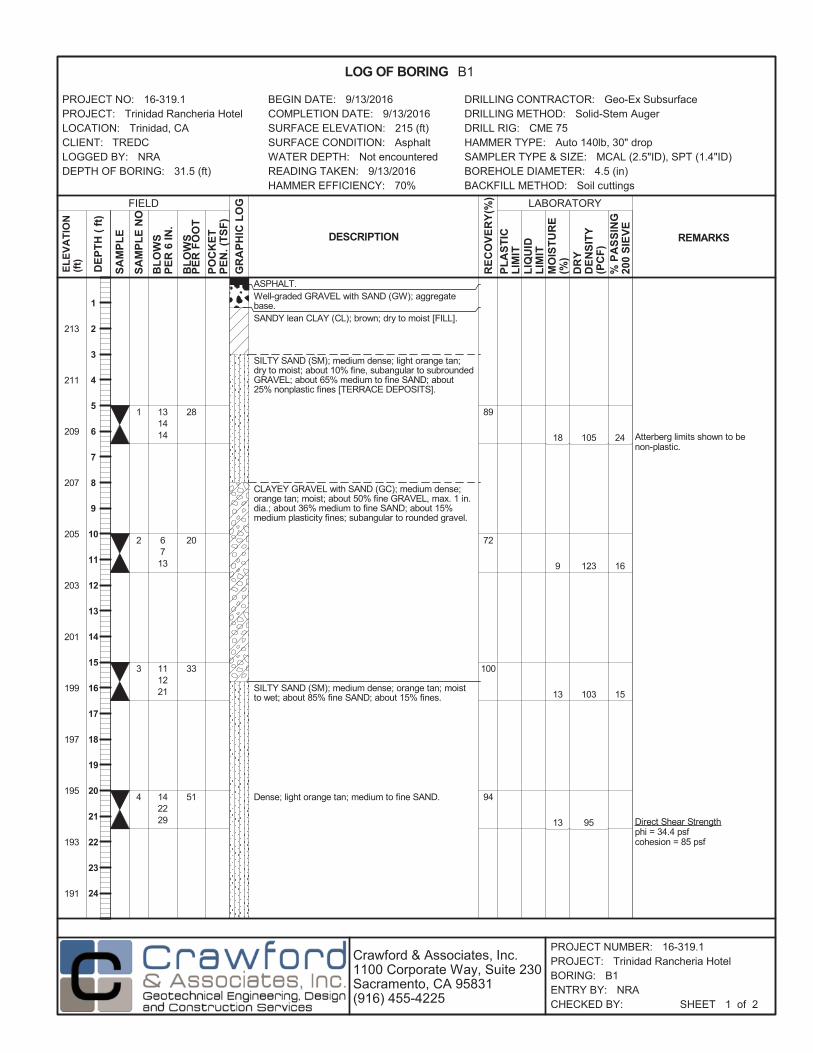
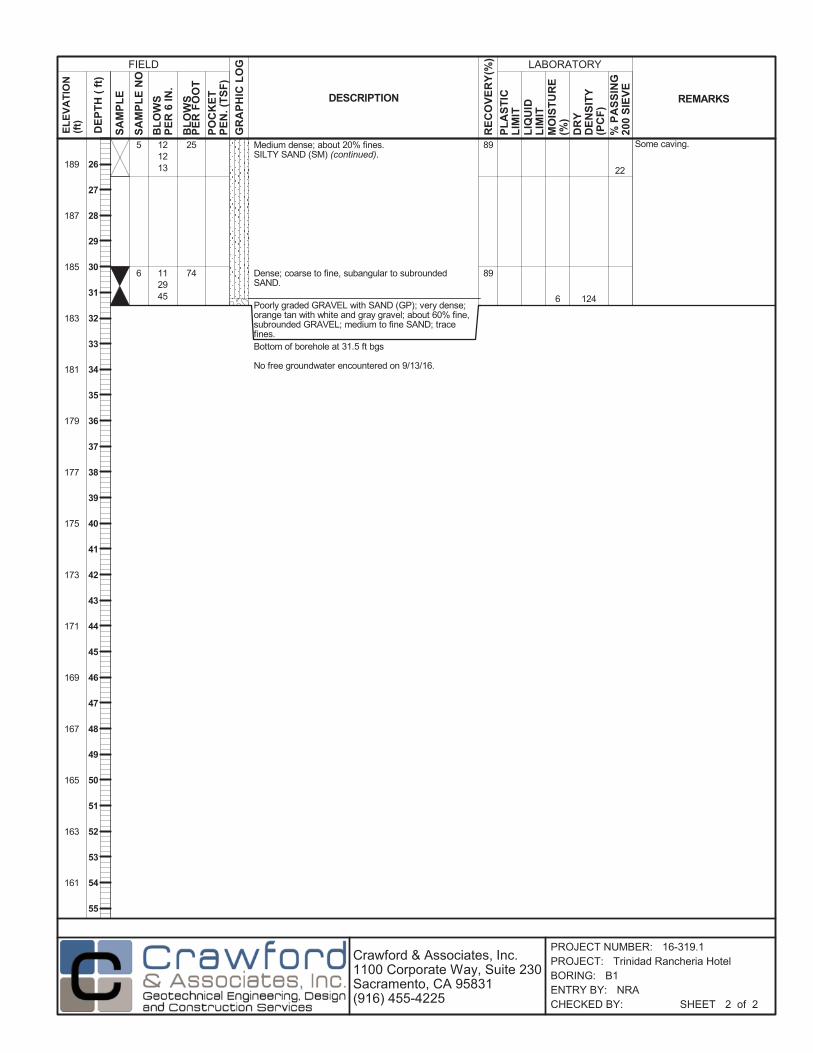
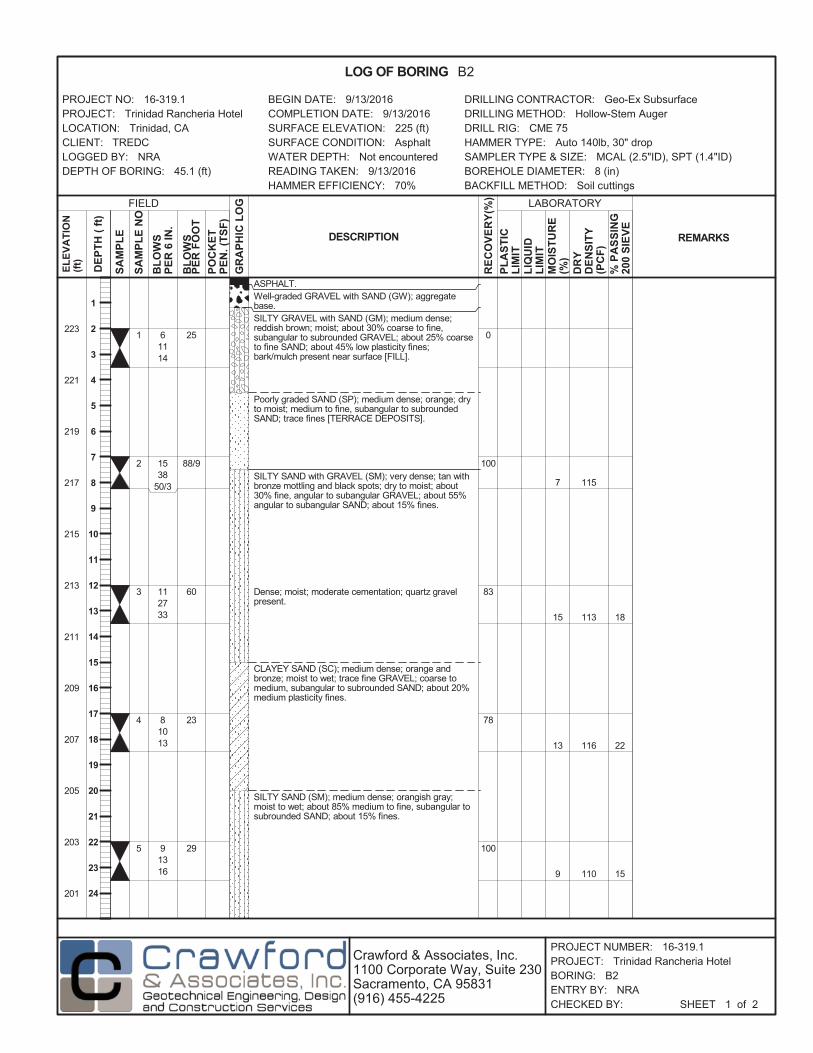
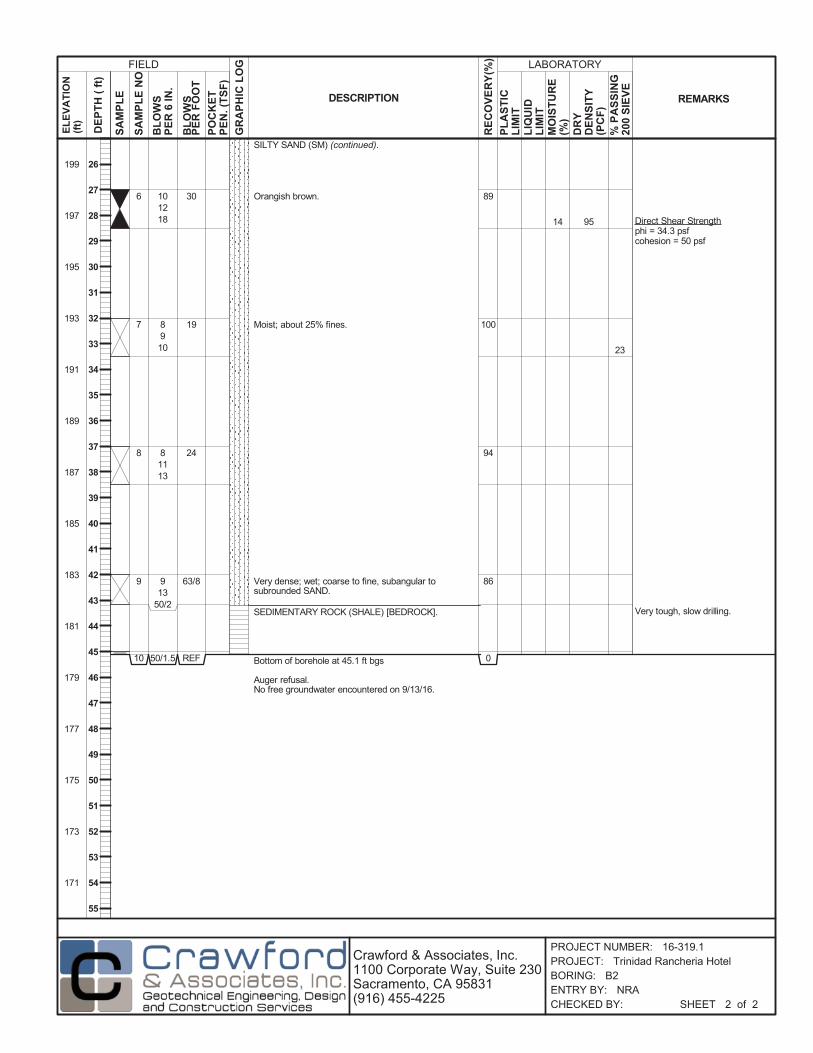
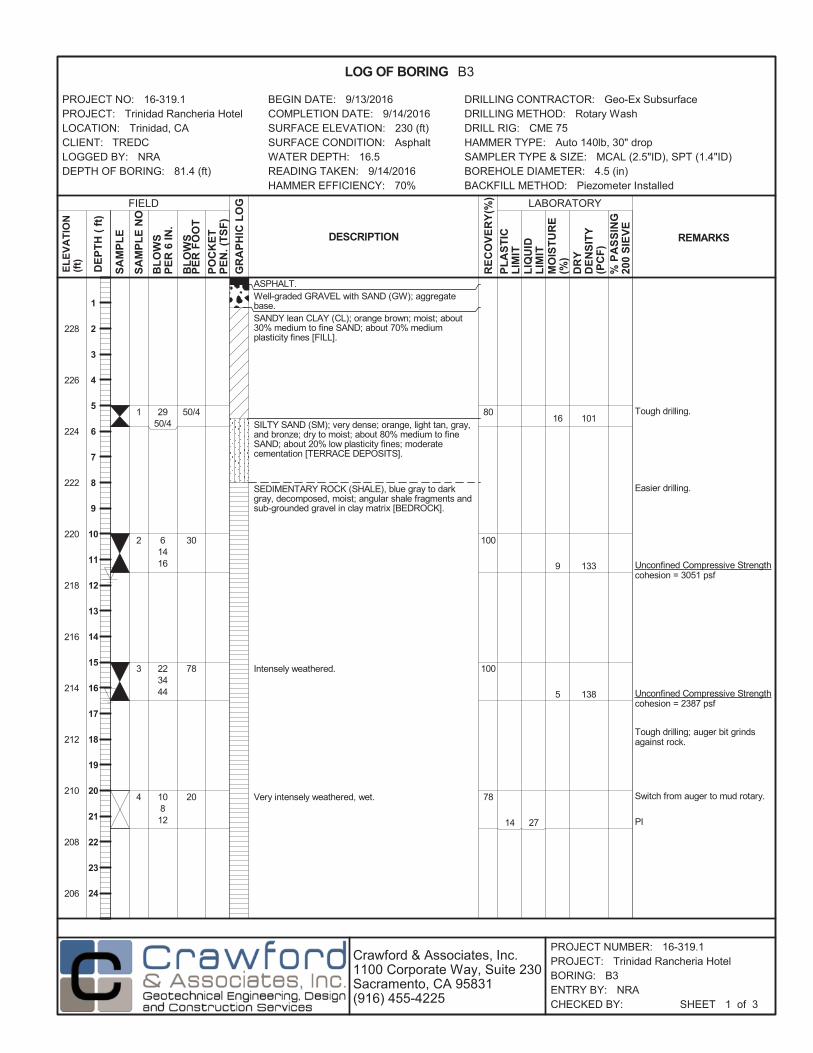
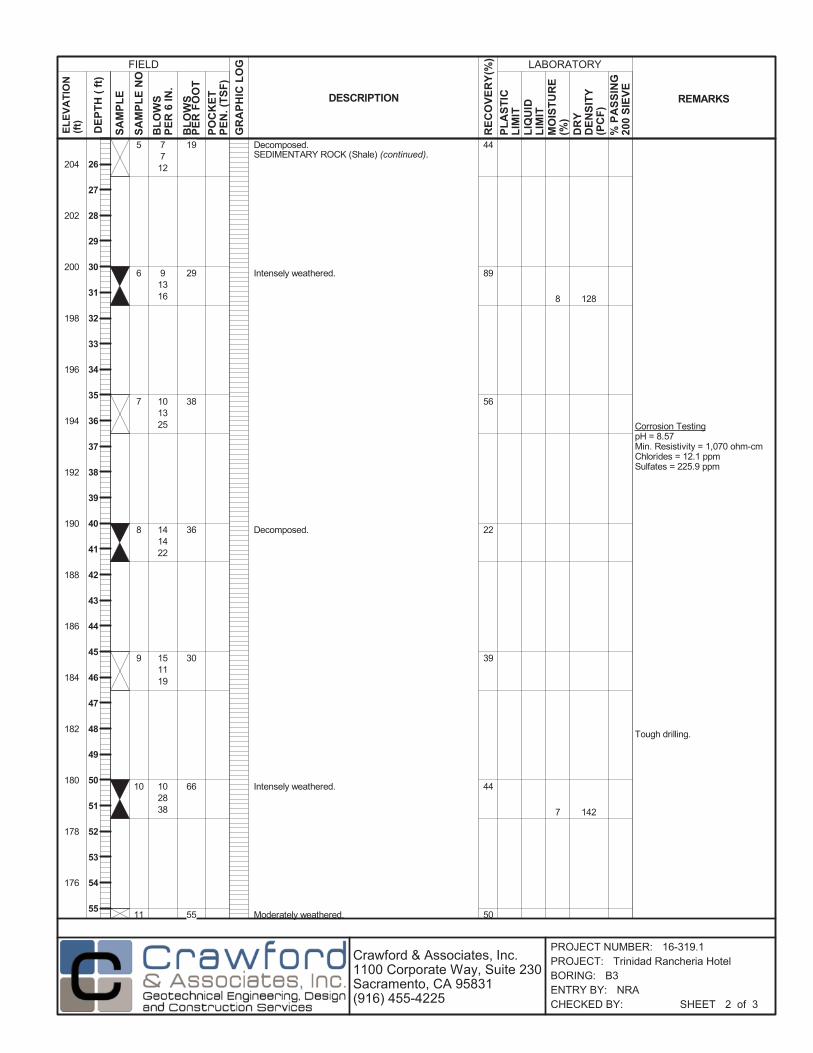
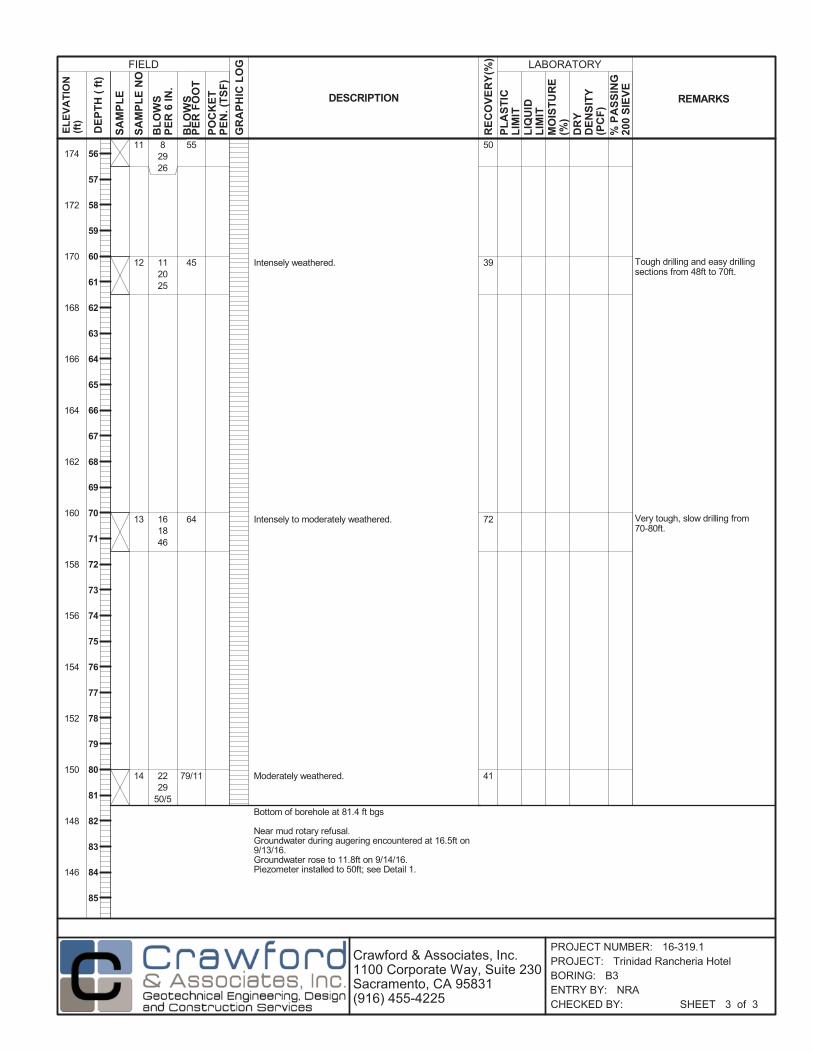
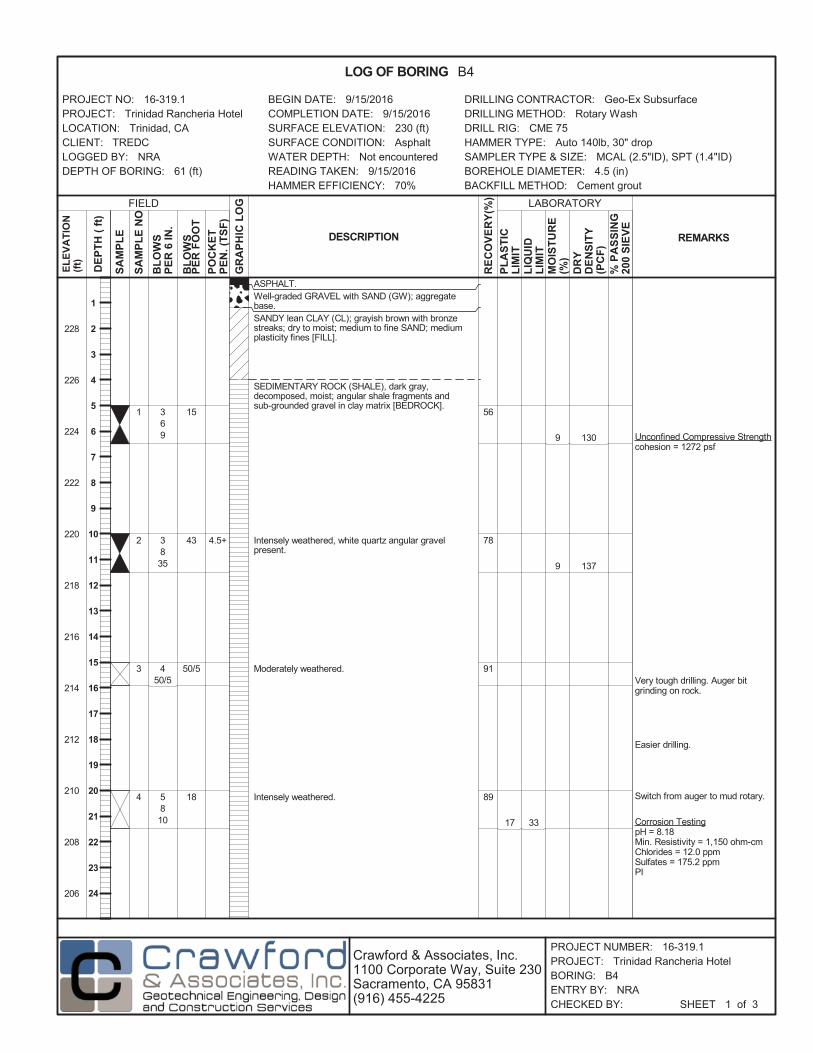
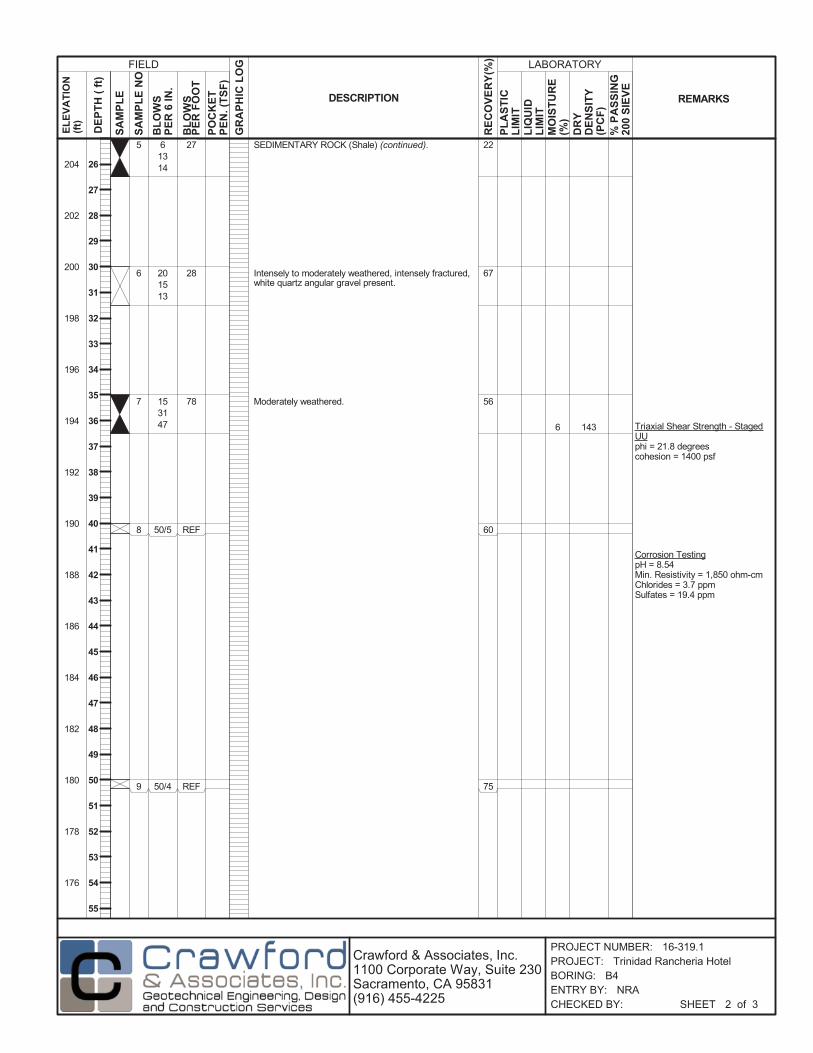
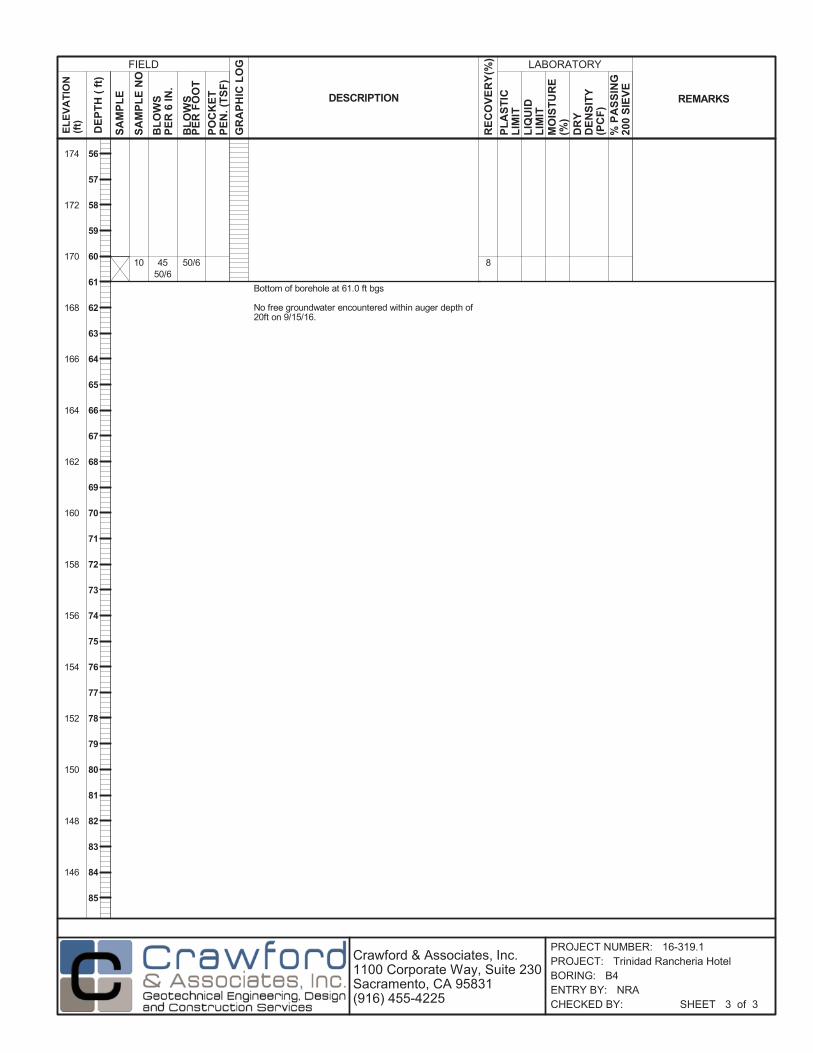
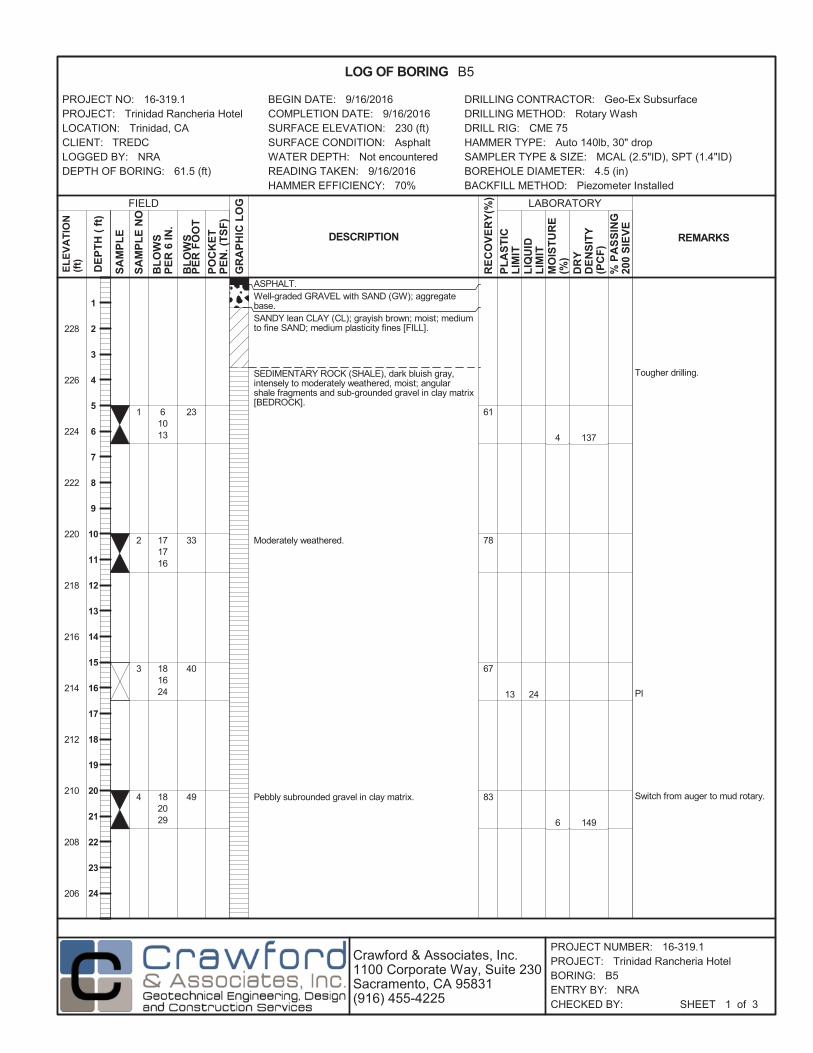
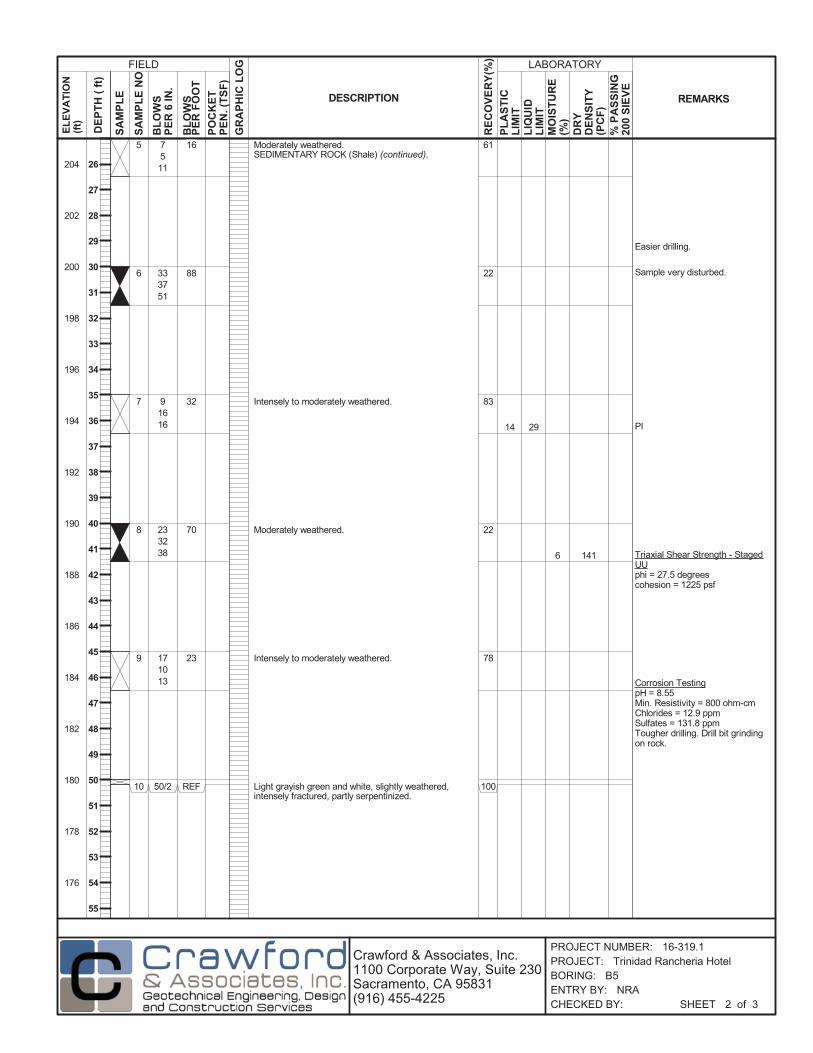

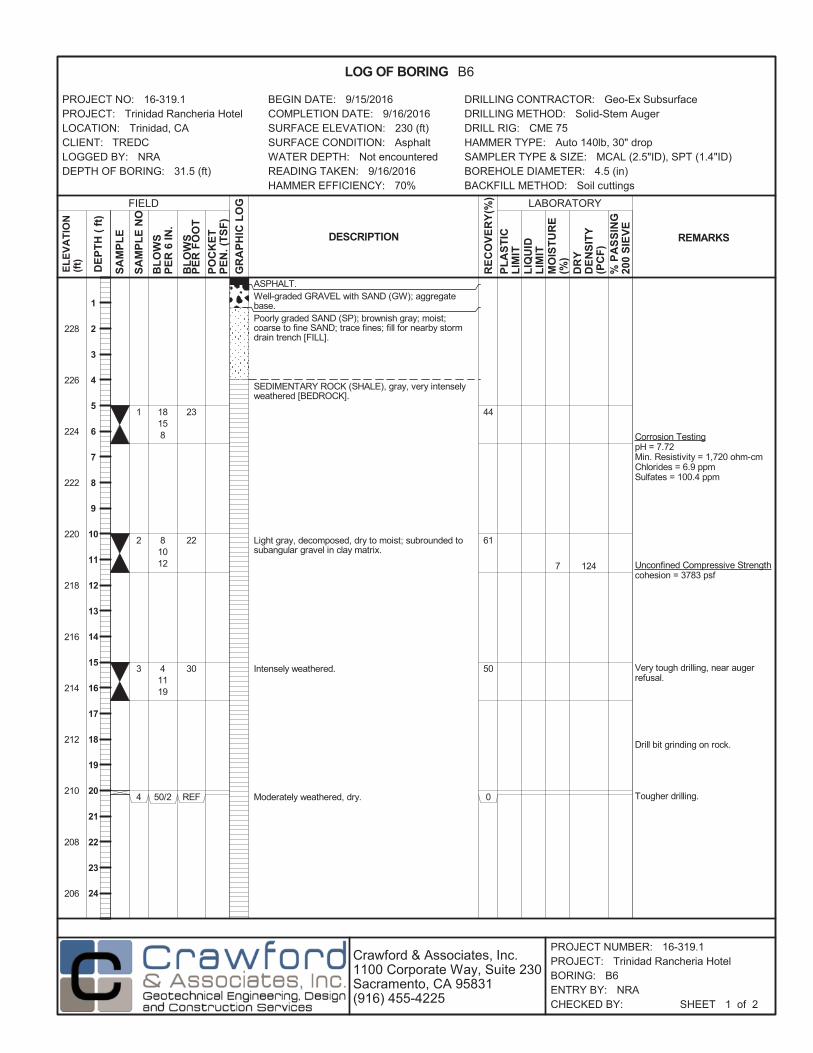


DRAFT GEOTECHNICAL FEASBILITY AND PRELIMINARY DESIGN REPORT CAInc Trinidad Rancheria Cher-Ae Heights Hotel File: 16-319.1 Trinidad, California November 8, 2016
APPENDIX B
Laboratory Test Results

Project Name:CAInc File No:
Date:Technician:
Sample No. B1-1 B1-2 B1-3 B1-6 B2-2
USCS Symbol SM GC SM SP GP
Depth (ft.) 6 11 16 31 8
Sample Length (in.) 5.544 5.600 5.651 5.622 5.218
Diameter (in.) 2.388 2.374 2.374 2.405 2.375
Sample Volume (ft3) 0.01437 0.01434 0.01448 0.01478 0.01338
Total Mass Soil+Tube (g) 1087.8 1151.6 1058.3 1157.9 998.2
Mass of Tube (g) 276.0 275.1 295.8 271.8 253.0
Tare No. P10 P9 P1 P9 G1
Tare (g) 131.7 254.6 131.4 254.5 20.7
Wet Soil + Tare (g) 580.3 741.6 506.6 740.6 59.5
Dry Soil + Tare (g) 510.8 700.7 464.4 711.8 57.0
Dry Soil (g) 379.1 446.1 333.0 457.3 36.4
Water (g) 69.5 40.9 42.2 28.8 2.5
Moisture (%) 18.3 9.2 12.7 6.3 6.9
Dry Density (pcf) 105.3 123.4 103.1 124.3 114.9Notes:
MOISTURE-DENSITY TESTS - D2216
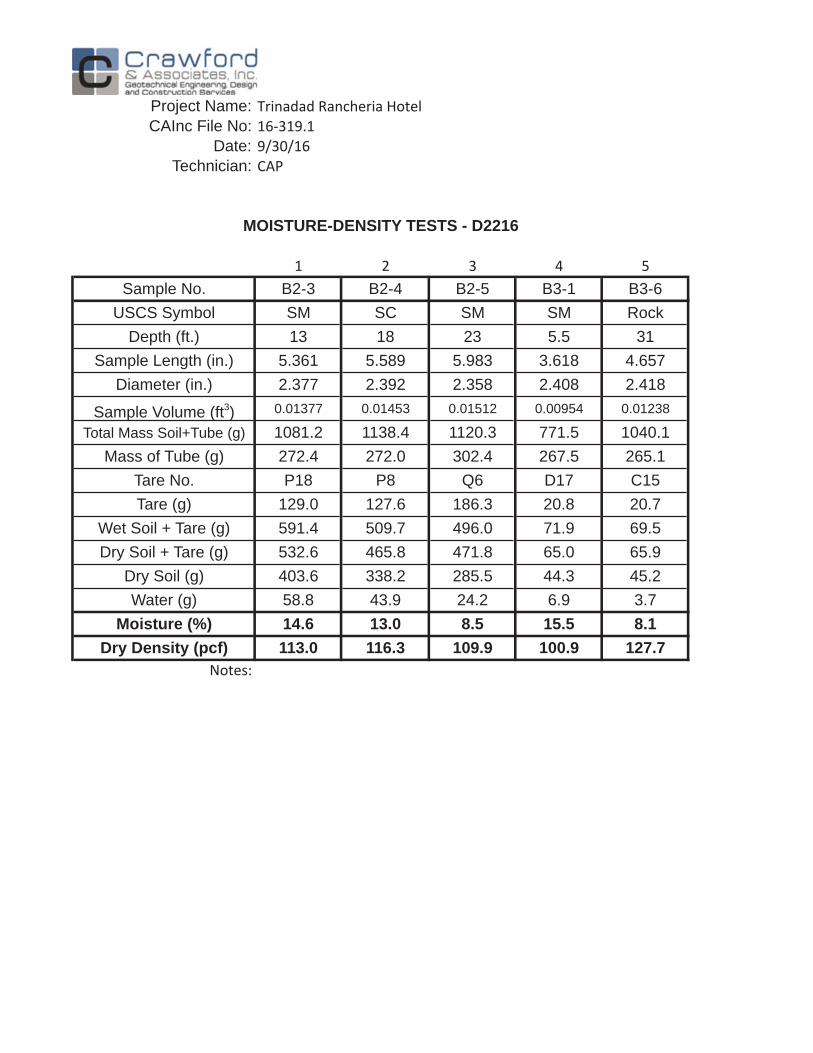
Project Name:CAInc File No:
Date:Technician:
Sample No. B2-3 B2-4 B2-5 B3-1 B3-6
USCS Symbol SM SC SM SM Rock
Depth (ft.) 13 18 23 5.5 31
Sample Length (in.) 5.361 5.589 5.983 3.618 4.657
Diameter (in.) 2.377 2.392 2.358 2.408 2.418
Sample Volume (ft3) 0.01377 0.01453 0.01512 0.00954 0.01238
Total Mass Soil+Tube (g) 1081.2 1138.4 1120.3 771.5 1040.1
Mass of Tube (g) 272.4 272.0 302.4 267.5 265.1
Tare No. P18 P8 Q6 D17 C15
Tare (g) 129.0 127.6 186.3 20.8 20.7
Wet Soil + Tare (g) 591.4 509.7 496.0 71.9 69.5
Dry Soil + Tare (g) 532.6 465.8 471.8 65.0 65.9
Dry Soil (g) 403.6 338.2 285.5 44.3 45.2
Water (g) 58.8 43.9 24.2 6.9 3.7
Moisture (%) 14.6 13.0 8.5 15.5 8.1
Dry Density (pcf) 113.0 116.3 109.9 100.9 127.7
MOISTURE-DENSITY TESTS - D2216
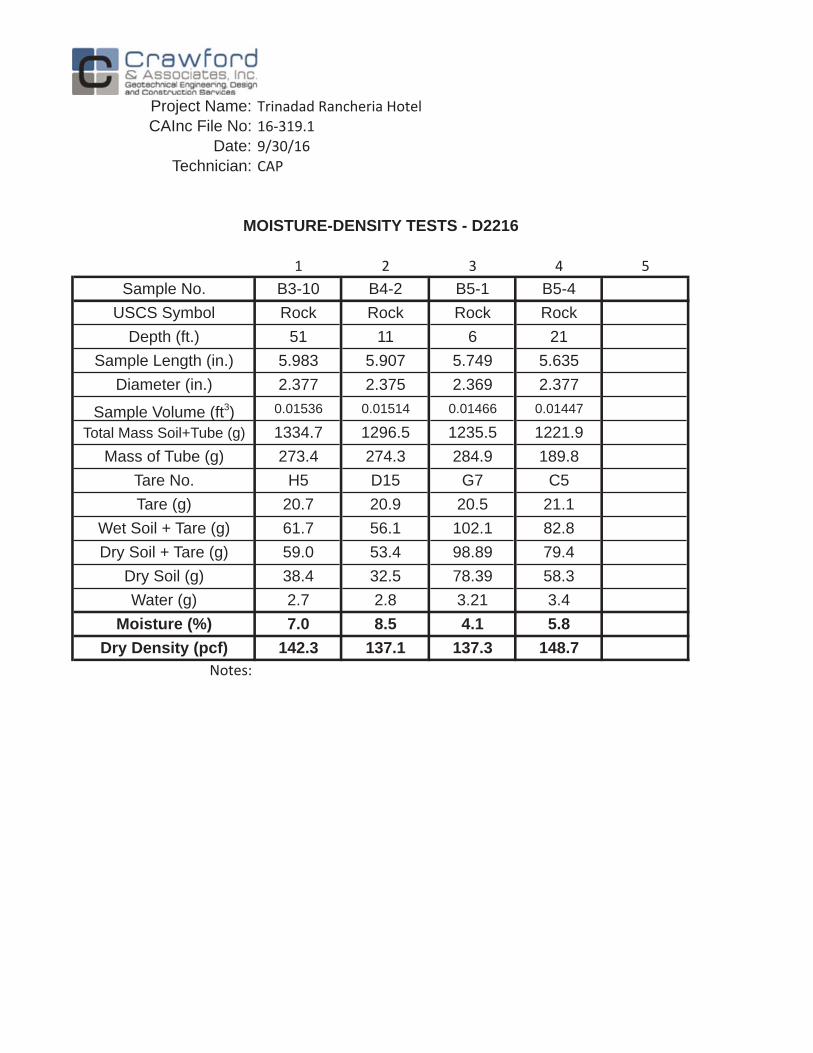
Project Name:CAInc File No:
Date:Technician:
Sample No. B3-10 B4-2 B5-1 B5-4
USCS Symbol Rock Rock Rock Rock
Depth (ft.) 51 11 6 21
Sample Length (in.) 5.983 5.907 5.749 5.635
Diameter (in.) 2.377 2.375 2.369 2.377
Sample Volume (ft3) 0.01536 0.01514 0.01466 0.01447
Total Mass Soil+Tube (g) 1334.7 1296.5 1235.5 1221.9
Mass of Tube (g) 273.4 274.3 284.9 189.8
Tare No. H5 D15 G7 C5
Tare (g) 20.7 20.9 20.5 21.1
Wet Soil + Tare (g) 61.7 56.1 102.1 82.8
Dry Soil + Tare (g) 59.0 53.4 98.89 79.4
Dry Soil (g) 38.4 32.5 78.39 58.3
Water (g) 2.7 2.8 3.21 3.4
Moisture (%) 7.0 8.5 4.1 5.8
Dry Density (pcf) 142.3 137.1 137.3 148.7
MOISTURE-DENSITY TESTS - D2216
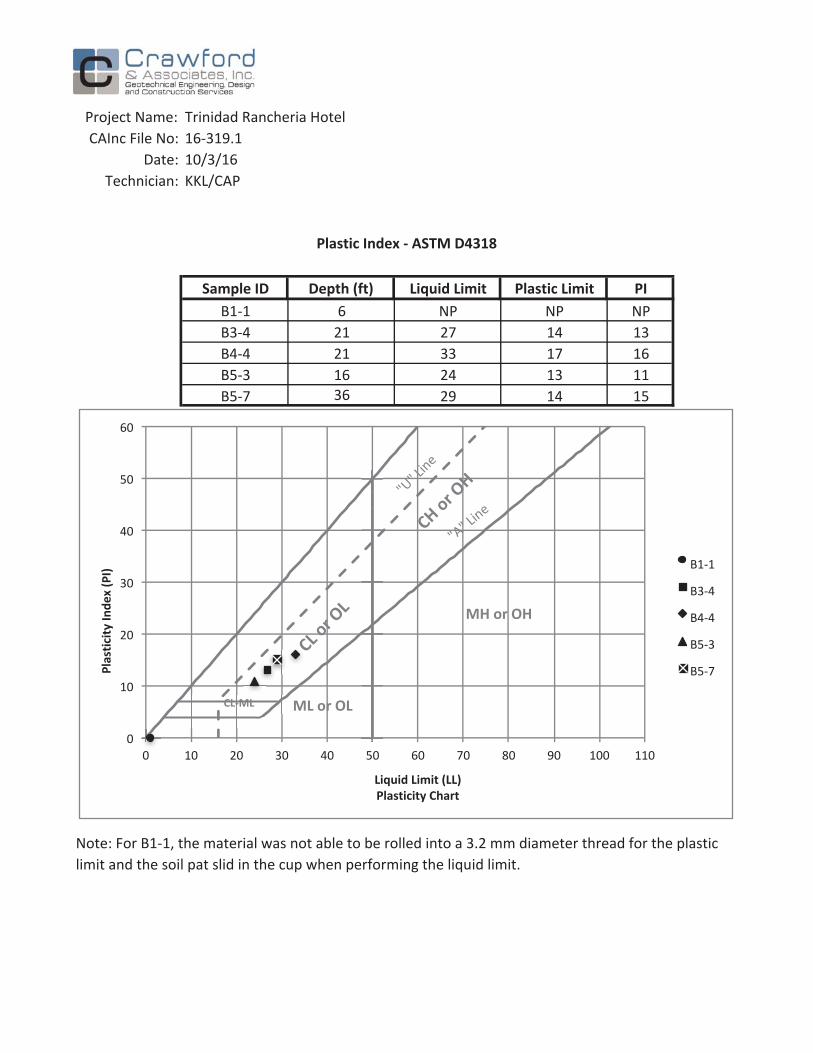
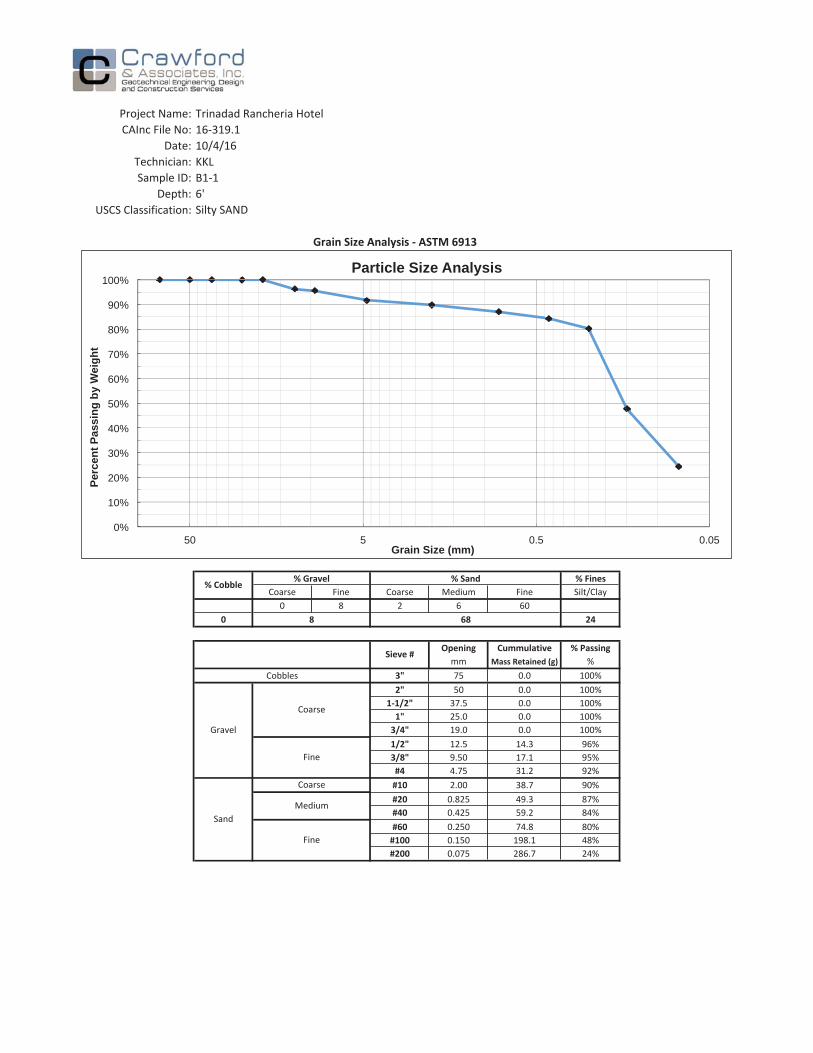
0%
10%
20%
30%
40%
50%
60%
70%
80%
90%
100%
0.05 0.5 5 50
Per
cen
t P
assi
ng
by
Wei
gh
t
Grain Size (mm)
Particle Size Analysis
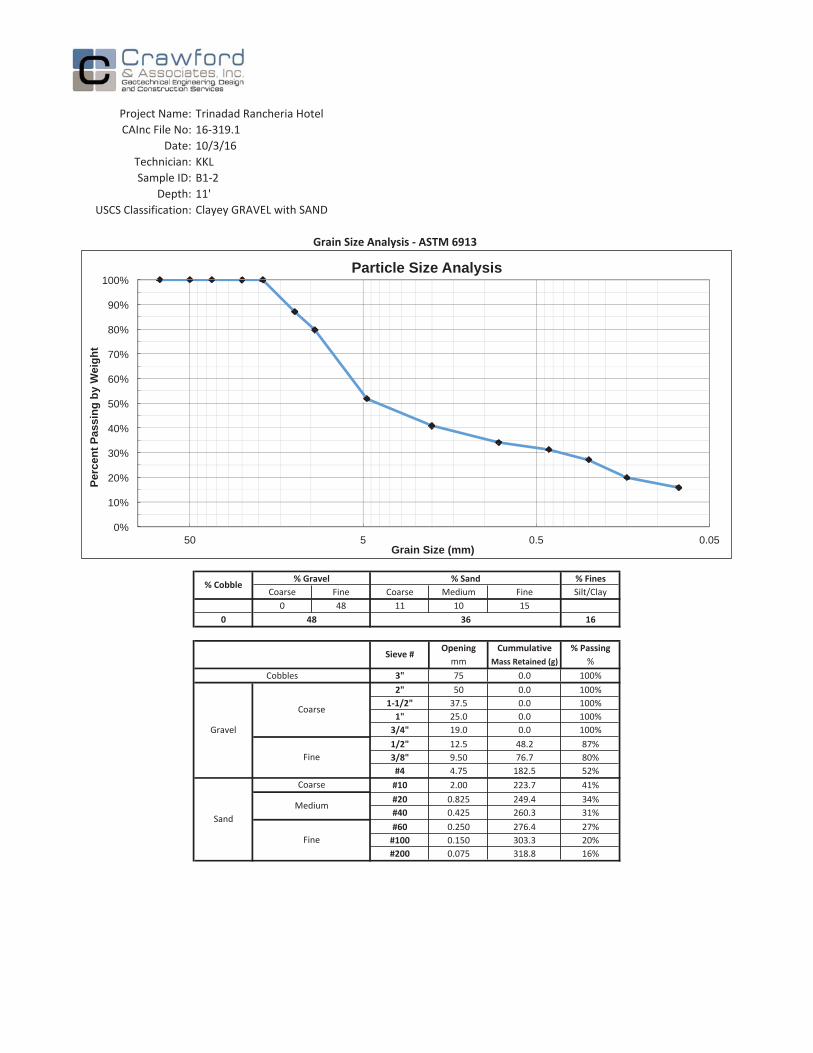
0%
10%
20%
30%
40%
50%
60%
70%
80%
90%
100%
0.05 0.5 5 50
Per
cen
t P
assi
ng
by
Wei
gh
t
Grain Size (mm)
Particle Size Analysis
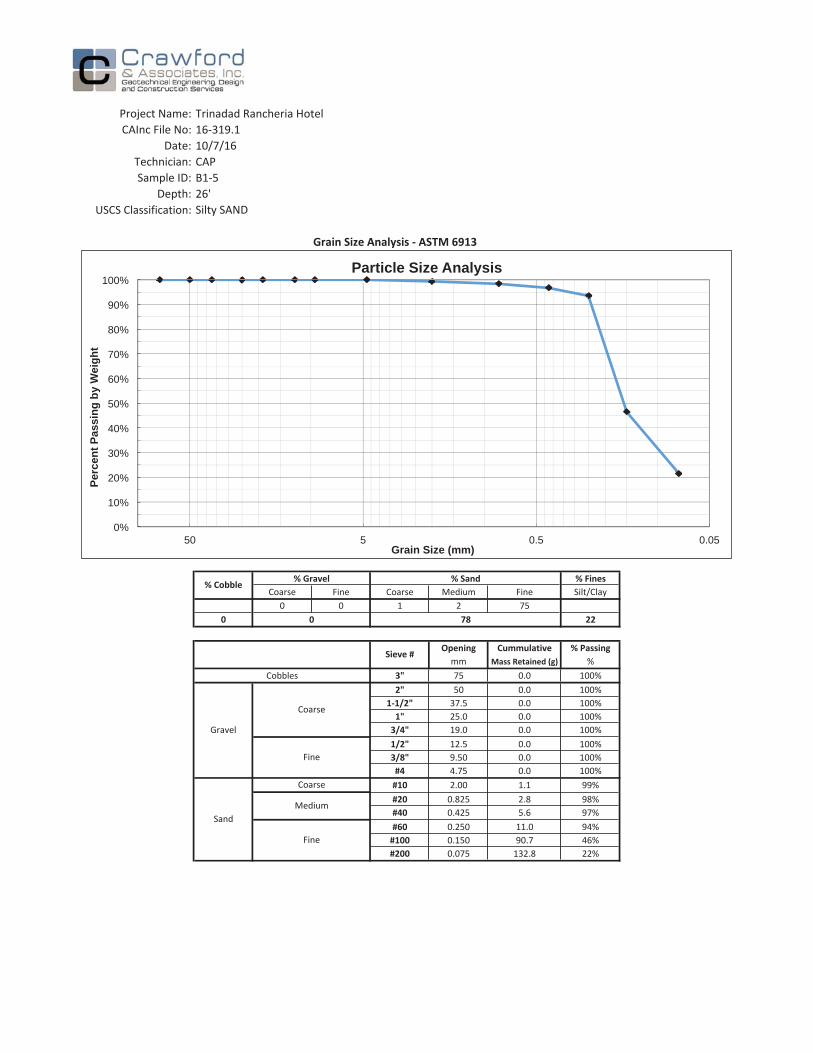
0%
10%
20%
30%
40%
50%
60%
70%
80%
90%
100%
0.05 0.5 5 50
Per
cen
t P
assi
ng
by
Wei
gh
t
Grain Size (mm)
Particle Size Analysis
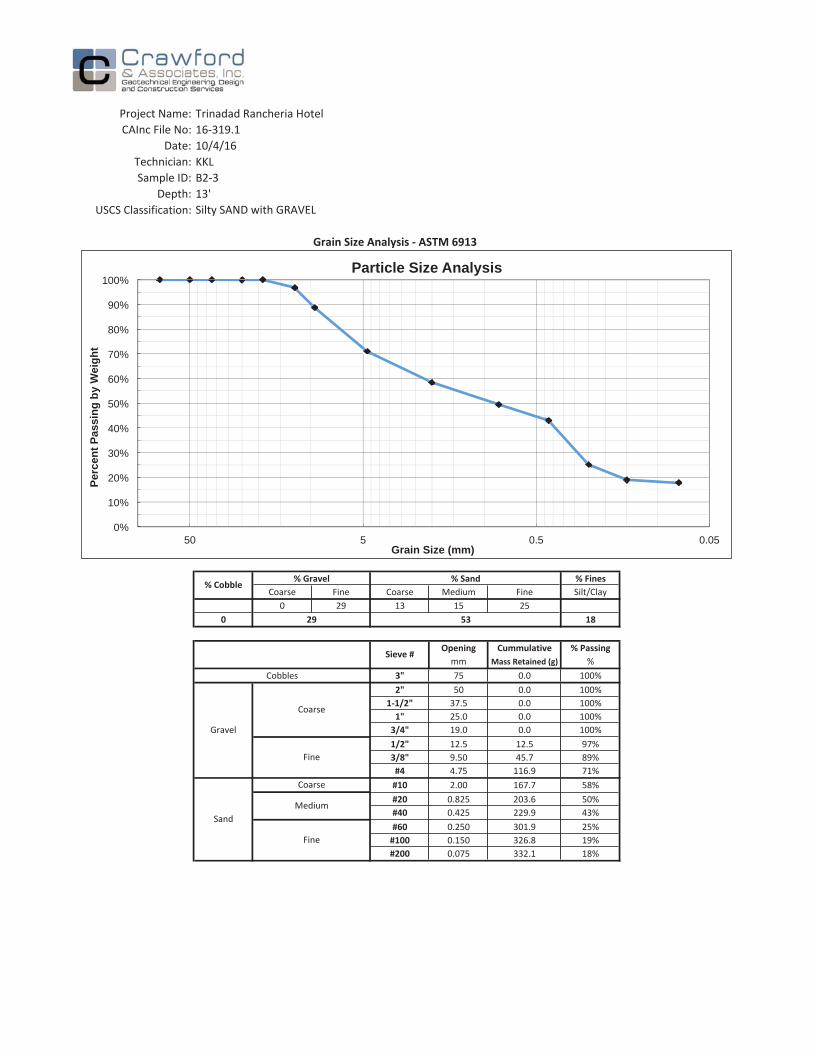
0%
10%
20%
30%
40%
50%
60%
70%
80%
90%
100%
0.05 0.5 5 50
Per
cen
t P
assi
ng
by
Wei
gh
t
Grain Size (mm)
Particle Size Analysis

0%
10%
20%
30%
40%
50%
60%
70%
80%
90%
100%
0.05 0.5 5 50
Per
cen
t P
assi
ng
by
Wei
gh
t
Grain Size (mm)
Particle Size Analysis
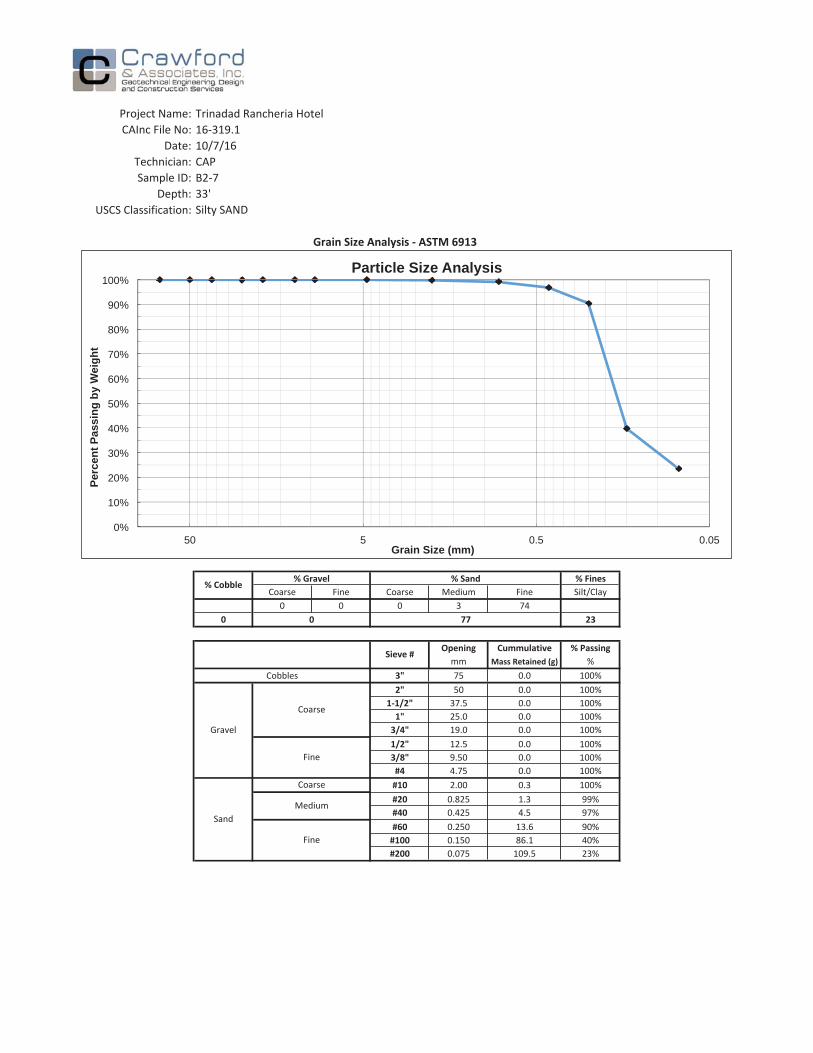
0%
10%
20%
30%
40%
50%
60%
70%
80%
90%
100%
0.05 0.5 5 50
Per
cen
t P
assi
ng
by
Wei
gh
t
Grain Size (mm)
Particle Size Analysis
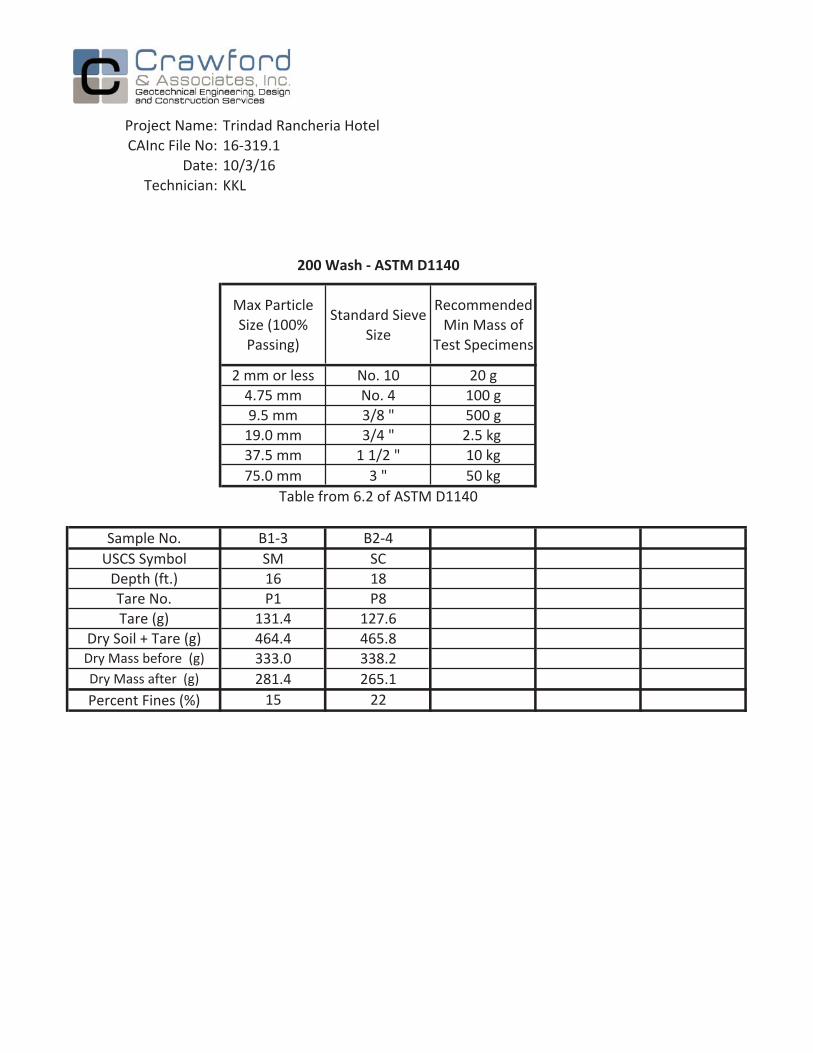
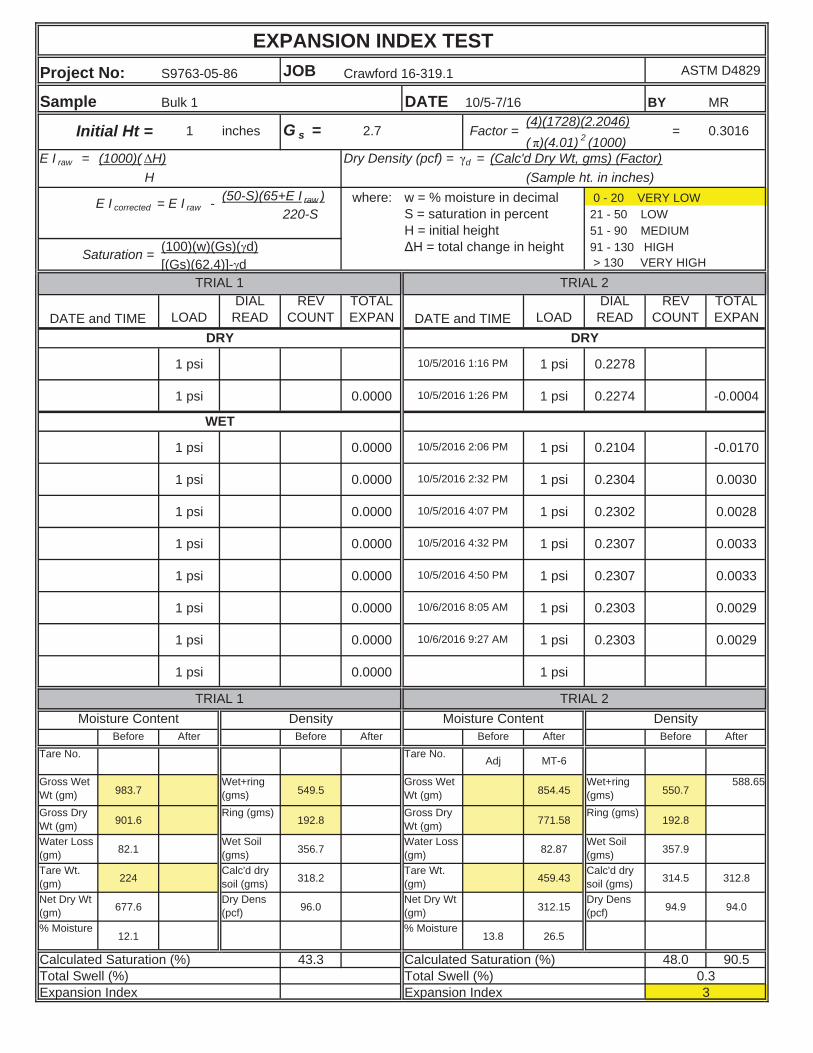
EXPANSION INDEX TEST
Project No: S9763-05-86 JOB Crawford 16-319.1 ASTM D4829
Sample Bulk 1 DATE BY MR
(4)(1728)(2.2046)( )(4.01) 2 (1000)
E I raw = (1000)( H) Dry Density (pcf) = d = (Calc'd Dry Wt, gms) (Factor)H (Sample ht. in inches)
(50-S)(65+E I raw ) where:220-S
(100)(w)(Gs)( d)[(Gs)(62.4)]- d
LOADDIAL READ
REV COUNT
TOTAL EXPAN LOAD
DIAL READ
REV COUNT
TOTAL EXPAN
1 psi 1 psi 0.2278
1 psi 0.0000 1 psi 0.2274 -0.0004
1 psi 0.0000 1 psi 0.2104 -0.0170
1 psi 0.0000 1 psi 0.2304 0.0030
1 psi 0.0000 1 psi 0.2302 0.0028
1 psi 0.0000 1 psi 0.2307 0.0033
1 psi 0.0000 1 psi 0.2307 0.0033
1 psi 0.0000 1 psi 0.2303 0.0029
1 psi 0.0000 1 psi 0.2303 0.0029
1 psi 0.0000 1 psi
Before After Before After Before After Before After
Tare No. Tare No.Adj MT-6
Gross Wet Wt (gm) 983.7
Wet+ring (gms) 549.5
Gross Wet Wt (gm) 854.45
Wet+ring (gms) 550.7
588.65
Gross Dry Wt (gm) 901.6
Ring (gms)192.8
Gross Dry Wt (gm) 771.58
Ring (gms)192.8
Water Loss (gm) 82.1
Wet Soil (gms) 356.7
Water Loss (gm) 82.87
Wet Soil (gms) 357.9
Tare Wt. (gm) 224
Calc'd dry soil (gms) 318.2
Tare Wt. (gm) 459.43
Calc'd dry soil (gms) 314.5 312.8
Net Dry Wt (gm) 677.6
Dry Dens (pcf) 96.0
Net Dry Wt (gm) 312.15
Dry Dens (pcf) 94.9 94.0
% Moisture12.1
% Moisture13.8 26.5
43.3 48.0 90.5
10/5/2016 1:16 PM
10/5/2016 4:07 PM
DRY
DATE and TIME
Expansion Index
Calculated Saturation (%) Calculated Saturation (%)Total Swell (%)
Moisture Content Density Moisture Content
10/5/2016 4:32 PM
TRIAL 2
10/6/2016 8:05 AM
10/6/2016 9:27 AM
21 - 50 LOW
TRIAL 2
91 - 130 HIGH > 130 VERY HIGH
0.3016=
51 - 90 MEDIUM
0 - 20 VERY LOW
G s =Initial Ht =
WET
10/5/2016 4:50 PM
DRY
10/5/2016 1:26 PM
10/5/2016 2:32 PM
DATE and TIME
Factor =
10/5-7/16
2.7
Saturation =
1 inches
H = total change in height
w = % moisture in decimal
H = initial height
E I corrected = E I raw -S = saturation in percent
0.33
TRIAL 1
Density
Expansion Index Total Swell (%)
TRIAL 1
10/5/2016 2:06 PM
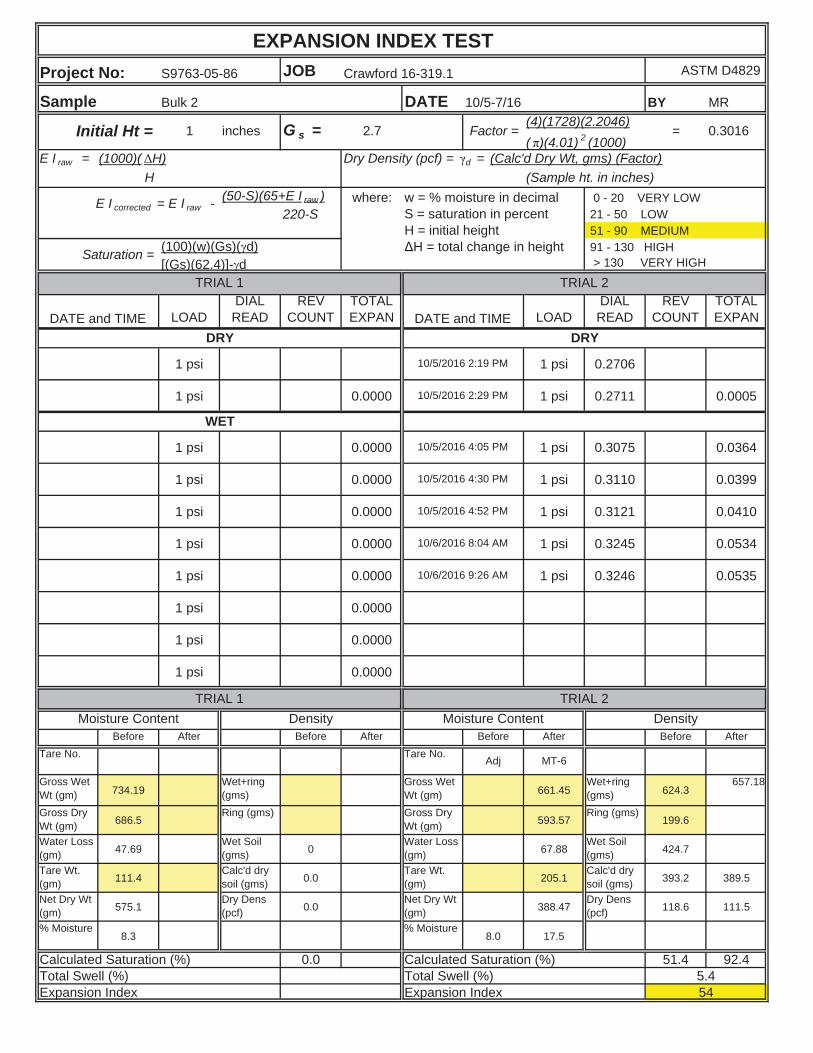
EXPANSION INDEX TEST
Project No: S9763-05-86 JOB Crawford 16-319.1 ASTM D4829
Sample Bulk 2 DATE BY MR
(4)(1728)(2.2046)( )(4.01) 2 (1000)
E I raw = (1000)( H) Dry Density (pcf) = d = (Calc'd Dry Wt, gms) (Factor)H (Sample ht. in inches)
(50-S)(65+E I raw ) where:220-S
(100)(w)(Gs)( d)[(Gs)(62.4)]- d
LOADDIAL READ
REV COUNT
TOTAL EXPAN LOAD
DIAL READ
REV COUNT
TOTAL EXPAN
1 psi 1 psi 0.2706
1 psi 0.0000 1 psi 0.2711 0.0005
1 psi 0.0000 1 psi 0.3075 0.0364
1 psi 0.0000 1 psi 0.3110 0.0399
1 psi 0.0000 1 psi 0.3121 0.0410
1 psi 0.0000 1 psi 0.3245 0.0534
1 psi 0.0000 1 psi 0.3246 0.0535
1 psi 0.0000
1 psi 0.0000
1 psi 0.0000
Before After Before After Before After Before After
Tare No. Tare No.Adj MT-6
Gross Wet Wt (gm) 734.19
Wet+ring (gms)
Gross Wet Wt (gm) 661.45
Wet+ring (gms) 624.3
657.18
Gross Dry Wt (gm) 686.5
Ring (gms) Gross Dry Wt (gm) 593.57
Ring (gms)199.6
Water Loss (gm) 47.69
Wet Soil (gms) 0
Water Loss (gm) 67.88
Wet Soil (gms) 424.7
Tare Wt. (gm) 111.4
Calc'd dry soil (gms) 0.0
Tare Wt. (gm) 205.1
Calc'd dry soil (gms) 393.2 389.5
Net Dry Wt (gm) 575.1
Dry Dens (pcf) 0.0
Net Dry Wt (gm) 388.47
Dry Dens (pcf) 118.6 111.5
% Moisture8.3
% Moisture8.0 17.5
0.0 51.4 92.4
10/5/2016 2:19 PM
10/5/2016 4:52 PM
DRY
DATE and TIME
Expansion Index
Calculated Saturation (%) Calculated Saturation (%)Total Swell (%)
Moisture Content Density Moisture Content
10/6/2016 8:04 AM
TRIAL 2
21 - 50 LOW
TRIAL 2
91 - 130 HIGH > 130 VERY HIGH
0.3016=
51 - 90 MEDIUM
0 - 20 VERY LOW
G s =Initial Ht =
WET
10/6/2016 9:26 AM
DRY
10/5/2016 2:29 PM
10/5/2016 4:30 PM
DATE and TIME
Factor =
10/5-7/16
2.7
Saturation =
1 inches
H = total change in height
w = % moisture in decimal
H = initial height
E I corrected = E I raw -S = saturation in percent
5.454
TRIAL 1
Density
Expansion Index Total Swell (%)
TRIAL 1
10/5/2016 4:05 PM
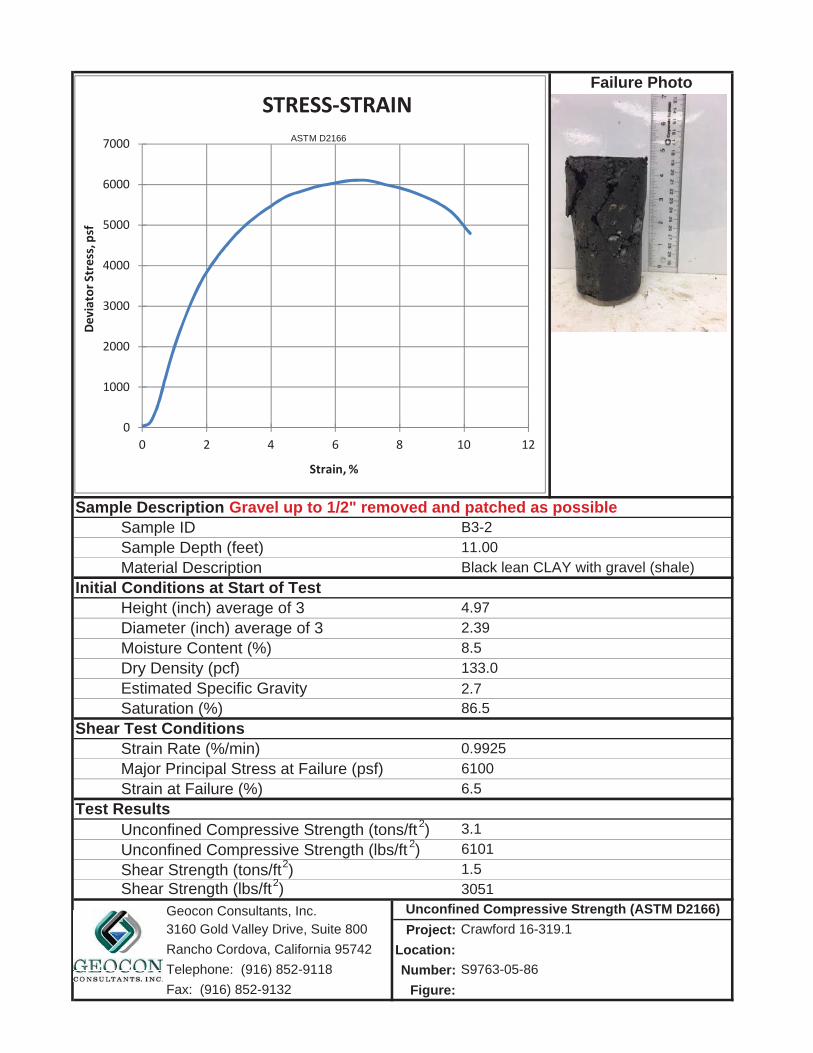
2.7
Project:
Location:
Number:
Figure:
6100
6101
Failure Photo
11.00B3-2
Black lean CLAY with gravel (shale)
4.97
8.5
0.9925
Saturation (%)
Diameter (inch) average of 3
Strain Rate (%/min)
Strain at Failure (%)
Estimated Specific GravityDry Density (pcf)
Major Principal Stress at Failure (psf)
Moisture Content (%)
Sample Depth (feet)
Sample Description Gravel up to 1/2" removed and patched as possible
Initial Conditions at Start of Test
Shear Test Conditions
Sample ID
Material Description
Height (inch) average of 32.39
133.0
86.5
Shear Strength (tons/ft2)
Fax: (916) 852-9132
3160 Gold Valley Drive, Suite 800
Telephone: (916) 852-9118 S9763-05-86
Rancho Cordova, California 95742
1.53051
Geocon Consultants, Inc.Crawford 16-319.1
Shear Strength (lbs/ft2)
6.5
Unconfined Compressive Strength (lbs/ft 2)Unconfined Compressive Strength (tons/ft2) 3.1
Test Results
Unconfined Compressive Strength (ASTM D2166)
0
1000
2000
3000
4000
5000
6000
7000
0 2 4 6 8 10 12
Deviator
Stress,psf
Strain, %
STRESS STRAINASTM D2166
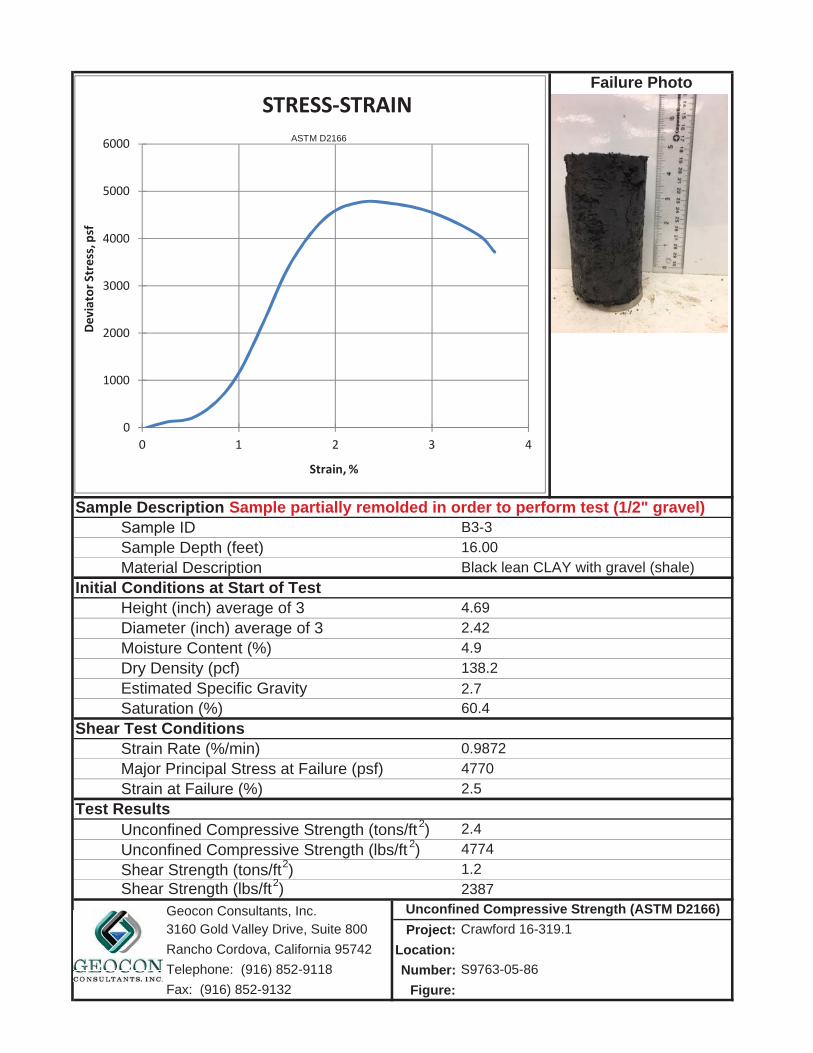
2.7
Project:
Location:
Number:
Figure:
Crawford 16-319.1
Shear Strength (lbs/ft2)
2.5
Unconfined Compressive Strength (lbs/ft 2)Unconfined Compressive Strength (tons/ft2) 2.4
Test Results
Unconfined Compressive Strength (ASTM D2166)
Shear Strength (tons/ft2)
Fax: (916) 852-9132
3160 Gold Valley Drive, Suite 800
Telephone: (916) 852-9118 S9763-05-86
Rancho Cordova, California 95742
1.22387
Geocon Consultants, Inc.
Sample Depth (feet)
Sample Description Sample partially remolded in order to perform test (1/2" gravel)
Initial Conditions at Start of Test
Shear Test Conditions
S ID
Material Description
Height (inch) average of 32.42
138.2
60.4Saturation (%)
Diameter (inch) average of 3
Strain Rate (%/min)
Strain at Failure (%)
Estimated Specific GravityDry Density (pcf)
Major Principal Stress at Failure (psf)
Moisture Content (%)
4770
4774
Failure Photo
16.00B3-3
Black lean CLAY with gravel (shale)
4.69
4.9
0.9872
0
1000
2000
3000
4000
5000
6000
0 1 2 3 4
Deviator
Stress,psf
Strain, %
STRESS STRAINASTM D2166
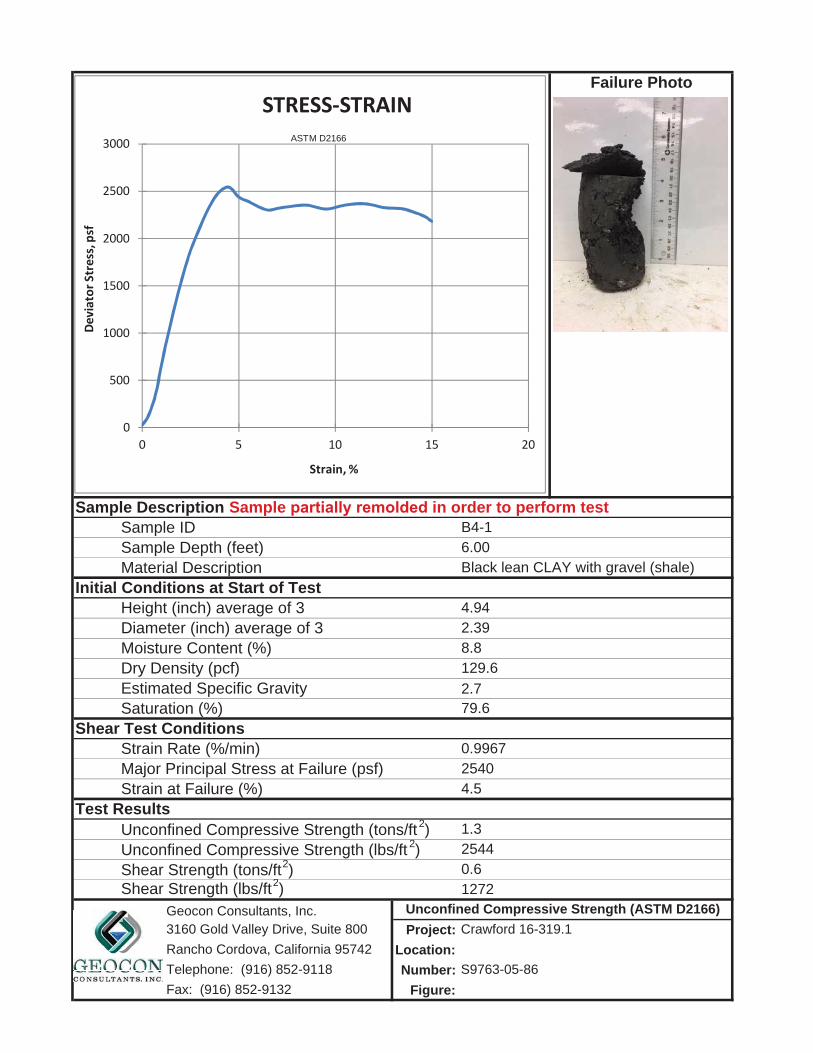
2.7
Project:
Location:
Number:
Figure:
2540
2544
Failure Photo
6.00B4-1
Black lean CLAY with gravel (shale)
4.94
8.8
0.9967
Saturation (%)
Diameter (inch) average of 3
Strain Rate (%/min)
Strain at Failure (%)
Estimated Specific GravityDry Density (pcf)
Major Principal Stress at Failure (psf)
Moisture Content (%)
Sample Depth (feet)
Sample Description Sample in order to perform test
Initial Conditions at Start of Test
Shear Test Conditions
Sample ID
Material Description
Height (inch) average of 32.39
129.6
79.6
Shear Strength (tons/ft2)
Fax: (916) 852-9132
3160 Gold Valley Drive, Suite 800
Telephone: (916) 852-9118 S9763-05-86
Rancho Cordova, California 95742
0.61272
Geocon Consultants, Inc.Crawford 16-319.1
Shear Strength (lbs/ft2)
4.5
Unconfined Compressive Strength (lbs/ft 2)Unconfined Compressive Strength (tons/ft2) 1.3
Test Results
Unconfined Compressive Strength (ASTM D2166)
0
500
1000
1500
2000
2500
3000
0 5 10 15 20
Deviator
Stress,psf
Strain, %
STRESS STRAINASTM D2166
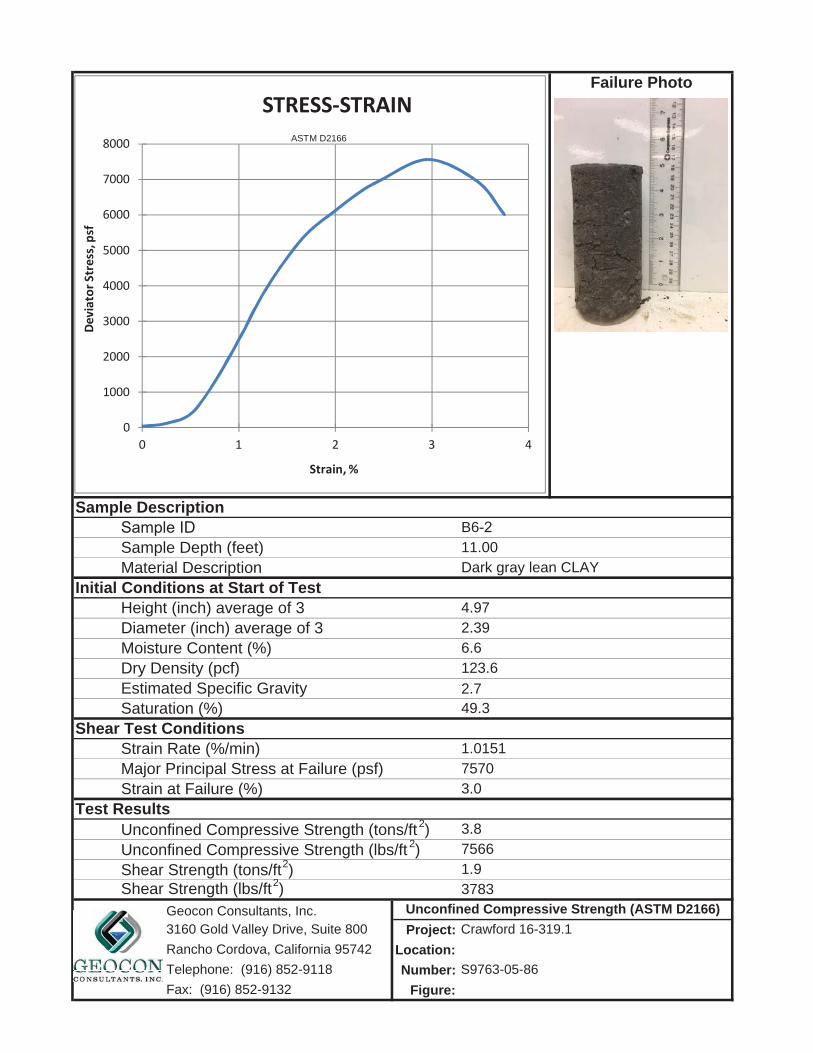
2.7
Project:
Location:
Number:
Figure:
7570
7566
Failure Photo
11.00B6
Dark gray lean CLAY
4.97
6.6
Geocon Consultants, Inc. Unconfined Compressive Strength (ASTM D2166)
Saturation (%)
Diameter (inch) average of 3
Strain Rate (%/min)
Strain at Failure (%)
Estimated Specific GravityDry Density (pcf)
Major Principal Stress at Failure (psf)
Moisture Content (%)
Sample Depth (feet)
Sample Description
Initial Conditions at Start of Test
Shear Test Conditions
Material Description
Height (inch) average of 32.39
123.6
1.93783
3.8Test Results
49.3
1.0151
3.0
Unconfined Compressive Strength (lbs/ft 2)Unconfined Compressive Strength (tons/ft2)
Shear Strength (tons/ft2)
Fax: (916) 852-9132
3160 Gold Valley Drive, Suite 800
Telephone: (916) 852-9118 S9763-05-86
Rancho Cordova, California 95742
Crawford 16-319.1
Shear Strength (lbs/ft2)
0
1000
2000
3000
4000
5000
6000
7000
8000
0 1 2 3 4
Deviator
Stress,psf
Strain, %
STRESS STRAINASTM D2166
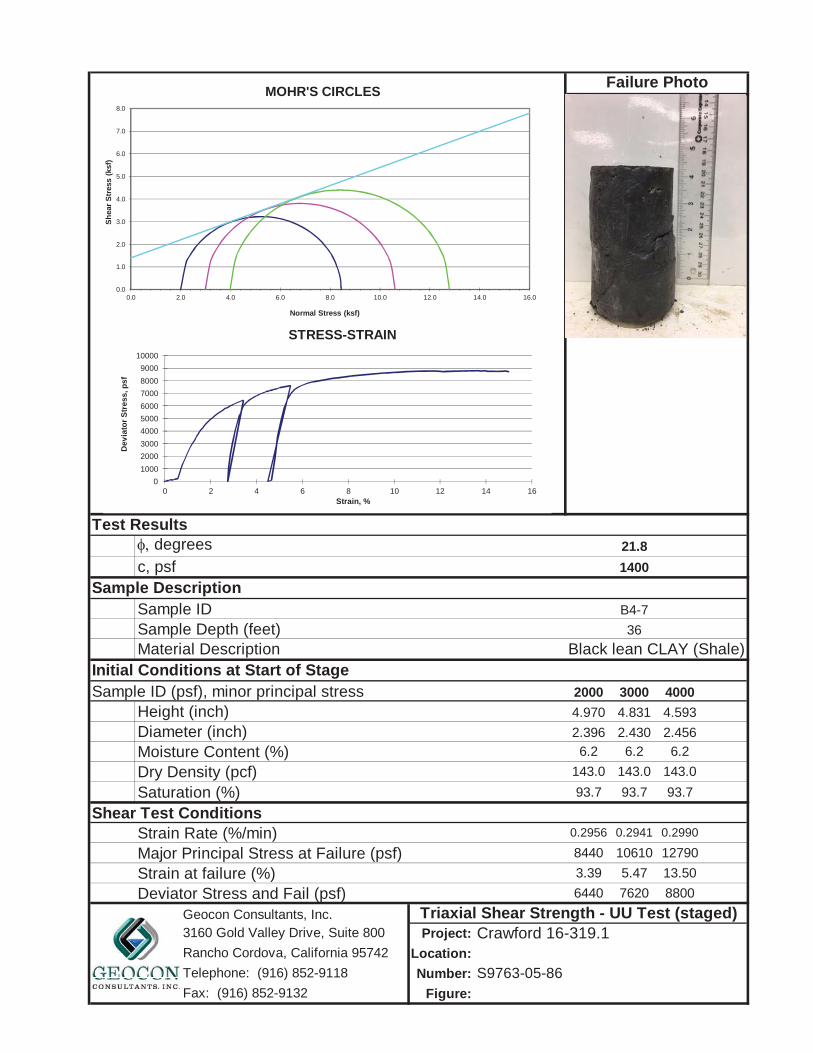
Test Resultsdegrees 21.8
c, psf 1400
Sample DescriptionSample ID B4-7
Sample Depth (feet) 36
Material DescriptionInitial Conditions at Start of StageSample ID (psf), minor principal stress 2000 3000 4000
Height (inch) 4.970 4.831 4.593
Diameter (inch) 2.396 2.430 2.456
Moisture Content (%) 6.2 6.2 6.2
Dry Density (pcf) 143.0 143.0 143.0
Saturation (%) 93.7 93.7 93.7
Shear Test ConditionsStrain Rate (%/min) 0.2956 0.2941 0.2990
Major Principal Stress at Failure (psf) 8440 10610 12790
Strain at failure (%) 3.39 5.47 13.50
Deviator Stress and Fail (psf) 6440 7620 8800
Project:
Location:
Number:
Figure:
Failure Photo
Geocon Consultants, Inc.
Rancho Cordova, California 95742
Triaxial Shear Strength - UU Test (staged)
Black lean CLAY (Shale)
Fax: (916) 852-9132
3160 Gold Valley Drive, Suite 800
Telephone: (916) 852-9118 S9763-05-86
Crawford 16-319.1
0.0
1.0
2.0
3.0
4.0
5.0
6.0
7.0
8.0
0.0 2.0 4.0 6.0 8.0 10.0 12.0 14.0 16.0
Sh
ear
Str
ess
(ksf
)
Normal Stress (ksf)
MOHR'S CIRCLES
0
1000
2000
3000
4000
5000
6000
7000
8000
9000
10000
0 2 4 6 8 10 12 14 16
De
via
tor
Str
es
s, p
sf
Strain, %
STRESS-STRAIN
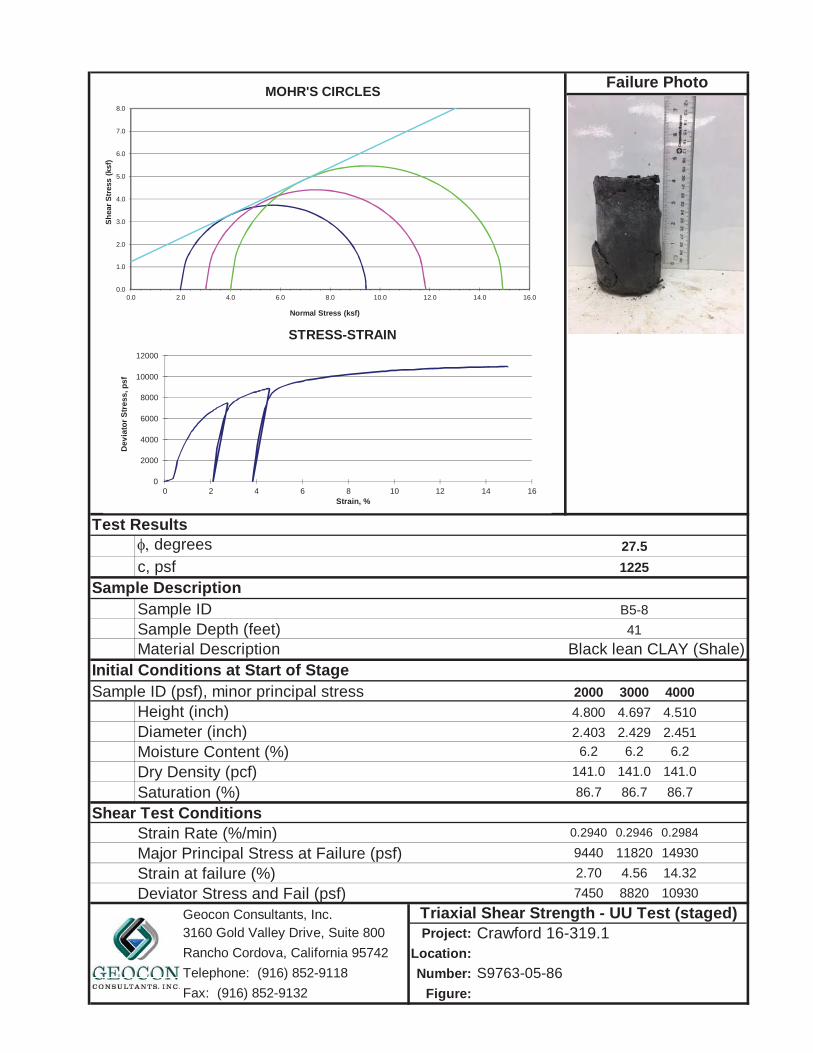
Test Resultsdegrees 27.5
c, psf 1225
Sample DescriptionSample ID B5-8
Sample Depth (feet) 41
Material DescriptionInitial Conditions at Start of StageSample ID (psf), minor principal stress 2000 3000 4000
Height (inch) 4.800 4.697 4.510
Diameter (inch) 2.403 2.429 2.451
Moisture Content (%) 6.2 6.2 6.2
Dry Density (pcf) 141.0 141.0 141.0
Saturation (%) 86.7 86.7 86.7
Shear Test ConditionsStrain Rate (%/min) 0.2940 0.2946 0.2984
Major Principal Stress at Failure (psf) 9440 11820 14930
Strain at failure (%) 2.70 4.56 14.32
Deviator Stress and Fail (psf) 7450 8820 10930
Project:
Location:
Number:
Figure:
Failure Photo
Geocon Consultants, Inc.
Rancho Cordova, California 95742
Triaxial Shear Strength - UU Test (staged)
Black lean CLAY (Shale)
Fax: (916) 852-9132
3160 Gold Valley Drive, Suite 800
Telephone: (916) 852-9118 S9763-05-86
Crawford 16-319.1
0.0
1.0
2.0
3.0
4.0
5.0
6.0
7.0
8.0
0.0 2.0 4.0 6.0 8.0 10.0 12.0 14.0 16.0
Sh
ear
Str
ess
(ksf
)
Normal Stress (ksf)
MOHR'S CIRCLES
0
2000
4000
6000
8000
10000
12000
0 2 4 6 8 10 12 14 16
De
via
tor
Str
es
s, p
sf
Strain, %
STRESS-STRAIN
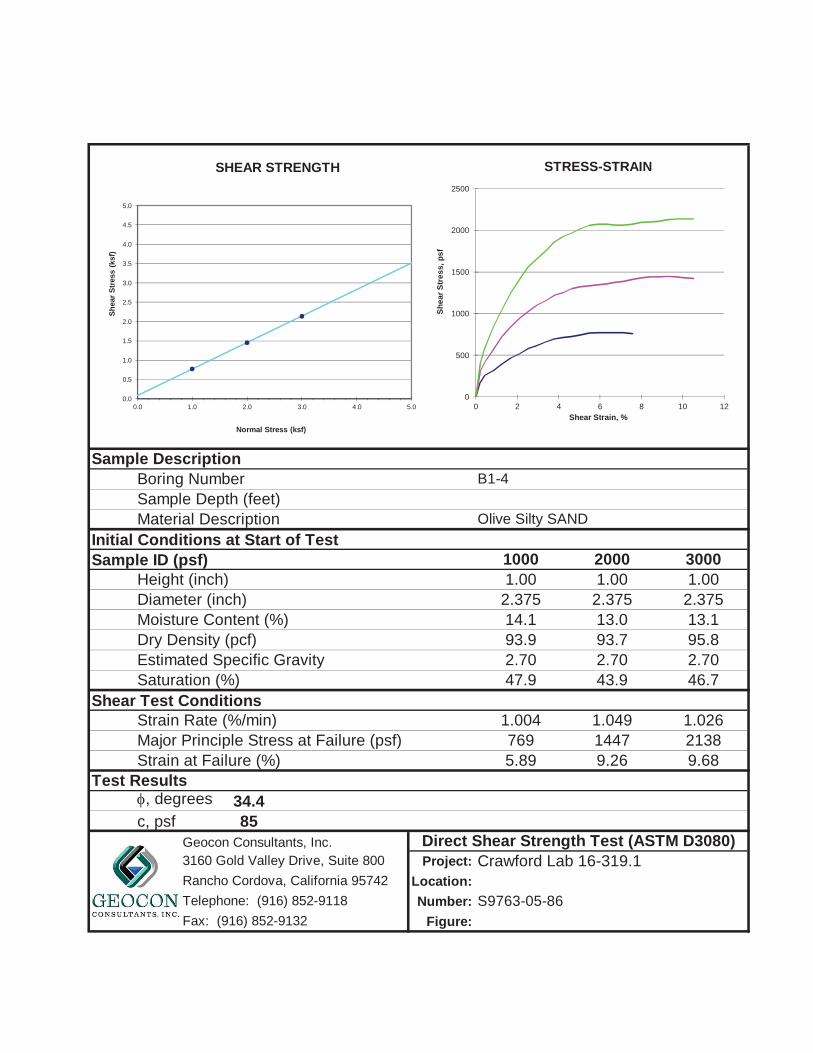
Initial Conditions at Start of TestSample ID (psf)
Shear Test Conditions
, degrees 34.4c, psf 85
Project:
Location:
Number:
Figure:
2.37514.193.9
1.002.3751.00
13.0
1000 2000 3000
93.7
2.375
Sample Description
Test Results
Geocon Consultants, Inc.
Rancho Cordova, California 95742
Diameter (inch)
1.004769
2.7047.9
Direct Shear Strength Test (ASTM D3080)
5.89 9.26Strain at Failure (%)
Estimated Specific Gravity
13.195.8
Moisture Content (%)
1.0491447
Dry Density (pcf)
Crawford Lab 16-319.1
21389.68
2.7043.9
2.7046.7Saturation (%)
Strain Rate (%/min)
Fax: (916) 852-9132
Telephone: (916) 852-9118 S9763-05-86
1.026
3160 Gold Valley Drive, Suite 800
Major Principle Stress at Failure (psf)
Boring Number
Material Description
Height (inch)
Sample Depth (feet)B1-4
Olive Silty SAND
1.00
0.0
0.5
1.0
1.5
2.0
2.5
3.0
3.5
4.0
4.5
5.0
0.0 1.0 2.0 3.0 4.0 5.0
Sh
ear
Str
ess
(ksf
)
Normal Stress (ksf)
SHEAR STRENGTH
0
500
1000
1500
2000
2500
0 2 4 6 8 10 12
Sh
ea
r S
tre
ss
, p
sf
Shear Strain, %
STRESS-STRAIN
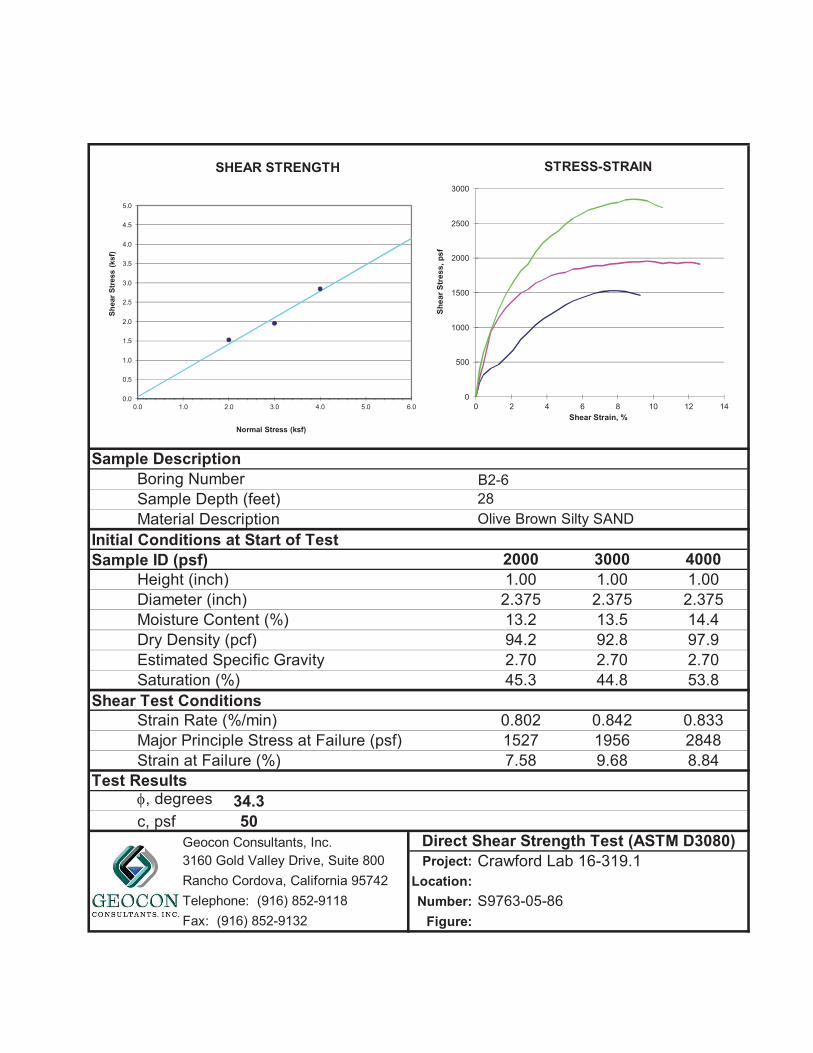
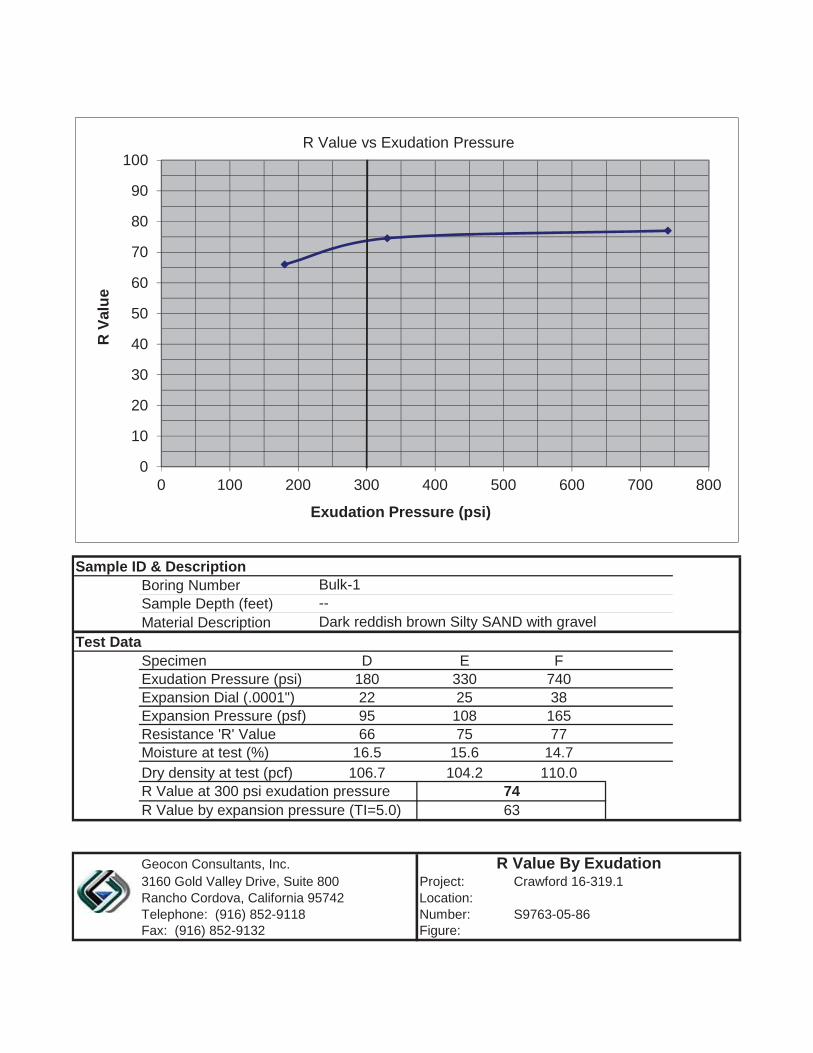
Sample ID & DescriptionBoring NumberSample Depth (feet)Material Description
Test DataSpecimen D E FExudation Pressure (psi) 180 330 740Expansion Dial (.0001") 22 25 38Expansion Pressure (psf) 95 108 165Resistance 'R' Value 66 75 77Moisture at test (%) 16.5 15.6 14.7Dry density at test (pcf) 106.7 104.2 110.0R Value at 300 psi exudation pressureR Value by expansion pressure (TI=5.0)
Geocon Consultants, Inc.3160 Gold Valley Drive, Suite 800 Project:Rancho Cordova, California 95742 Location:Telephone: (916) 852-9118 Number:Fax: (916) 852-9132 Figure:
R Value By ExudationCrawford 16-319.1
S9763-05-86
Bulk-1
7463
--Dark reddish brown Silty SAND with gravel
0
10
20
30
40
50
60
70
80
90
100
0 100 200 300 400 500 600 700 800
R V
alu
e
Exudation Pressure (psi)
R Value vs Exudation Pressure
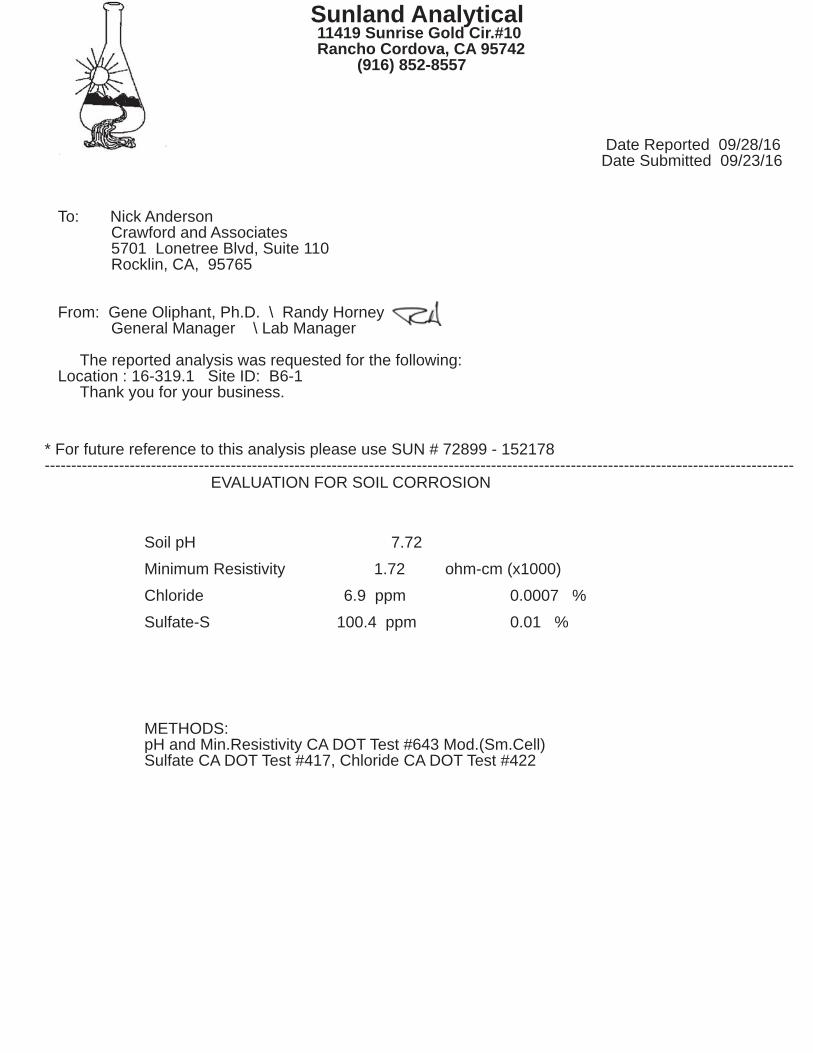
Sunland Analytical 11419 Sunrise Gold Cir.#10 Rancho Cordova, CA 95742 (916) 852-8557
Date Reported 09/28/16 Date Submitted 09/23/16
To: Nick Anderson Crawford and Associates 5701 Lonetree Blvd, Suite 110 Rocklin, CA, 95765
From: Gene Oliphant, Ph.D. \ Randy Horney General Manager \ Lab Manager
The reported analysis was requested for the following:Location : 16-319.1 Site ID: B6-1 Thank you for your business.
* For future reference to this analysis please use SUN # 72899 - 152178 ---------------------------------------------------------------------------------------------------------------------------------------------
EVALUATION FOR SOIL CORROSION
Soil pH 7.72
Minimum Resistivity 1.72 ohm-cm (x1000)
Chloride 6.9 ppm 0.0007 %
Sulfate-S 100.4 ppm 0.01 %
METHODS:pH and Min.Resistivity CA DOT Test #643 Mod.(Sm.Cell)Sulfate CA DOT Test #417, Chloride CA DOT Test #422

Sunland Analytical 11419 Sunrise Gold Cir.#10 Rancho Cordova, CA 95742 (916) 852-8557
Date Reported 09/28/16 Date Submitted 09/23/16
To: Nick Anderson Crawford and Associates 5701 Lonetree Blvd, Suite 110 Rocklin, CA, 95765
From: Gene Oliphant, Ph.D. \ Randy Horney General Manager \ Lab Manager
The reported analysis was requested for the following:Location : 16-319.1 Site ID: B5-9 Thank you for your business.
* For future reference to this analysis please use SUN # 72899 - 152177 ---------------------------------------------------------------------------------------------------------------------------------------------
EVALUATION FOR SOIL CORROSION
Soil pH 8.55
Minimum Resistivity 0.80 ohm-cm (x1000)
Chloride 12.9 ppm 0.0013 %
Sulfate-S 131.8 ppm 0.0132 %
METHODS:pH and Min.Resistivity CA DOT Test #643 Mod.(Sm.Cell)Sulfate CA DOT Test #417, Chloride CA DOT Test #422
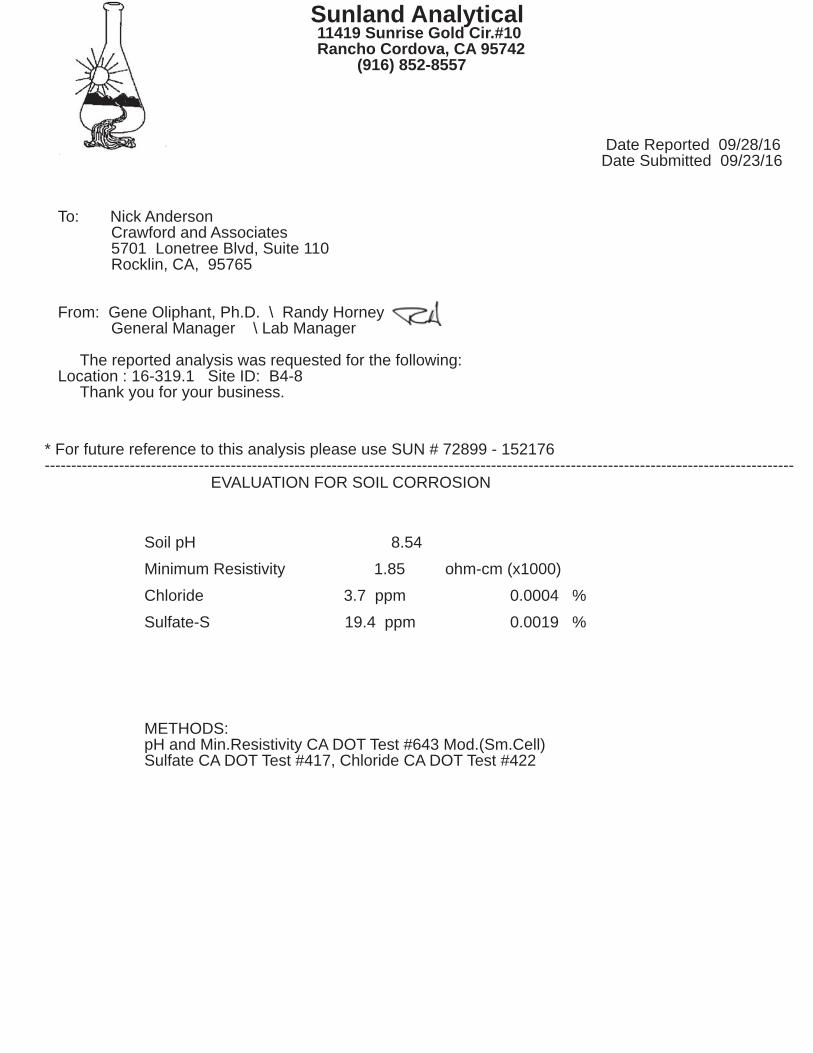
Sunland Analytical 11419 Sunrise Gold Cir.#10 Rancho Cordova, CA 95742 (916) 852-8557
Date Reported 09/28/16 Date Submitted 09/23/16
To: Nick Anderson Crawford and Associates 5701 Lonetree Blvd, Suite 110 Rocklin, CA, 95765
From: Gene Oliphant, Ph.D. \ Randy Horney General Manager \ Lab Manager
The reported analysis was requested for the following:Location : 16-319.1 Site ID: B4-8 Thank you for your business.
* For future reference to this analysis please use SUN # 72899 - 152176 ---------------------------------------------------------------------------------------------------------------------------------------------
EVALUATION FOR SOIL CORROSION
Soil pH 8.54
Minimum Resistivity 1.85 ohm-cm (x1000)
Chloride 3.7 ppm 0.0004 %
Sulfate-S 19.4 ppm 0.0019 %
METHODS:pH and Min.Resistivity CA DOT Test #643 Mod.(Sm.Cell)Sulfate CA DOT Test #417, Chloride CA DOT Test #422

Sunland Analytical 11419 Sunrise Gold Cir.#10 Rancho Cordova, CA 95742 (916) 852-8557
Date Reported 09/28/16 Date Submitted 09/23/16
To: Nick Anderson Crawford and Associates 5701 Lonetree Blvd, Suite 110 Rocklin, CA, 95765
From: Gene Oliphant, Ph.D. \ Randy Horney General Manager \ Lab Manager
The reported analysis was requested for the following:Location : 16-319.1 Site ID: B4-4 Thank you for your business.
* For future reference to this analysis please use SUN # 72899 - 152175 ---------------------------------------------------------------------------------------------------------------------------------------------
EVALUATION FOR SOIL CORROSION
Soil pH 8.18
Minimum Resistivity 1.15 ohm-cm (x1000)
Chloride 12.0 ppm 0.0012 %
Sulfate-S 175.2 ppm 0.0175 %
METHODS:pH and Min.Resistivity CA DOT Test #643 Mod.(Sm.Cell)Sulfate CA DOT Test #417, Chloride CA DOT Test #422
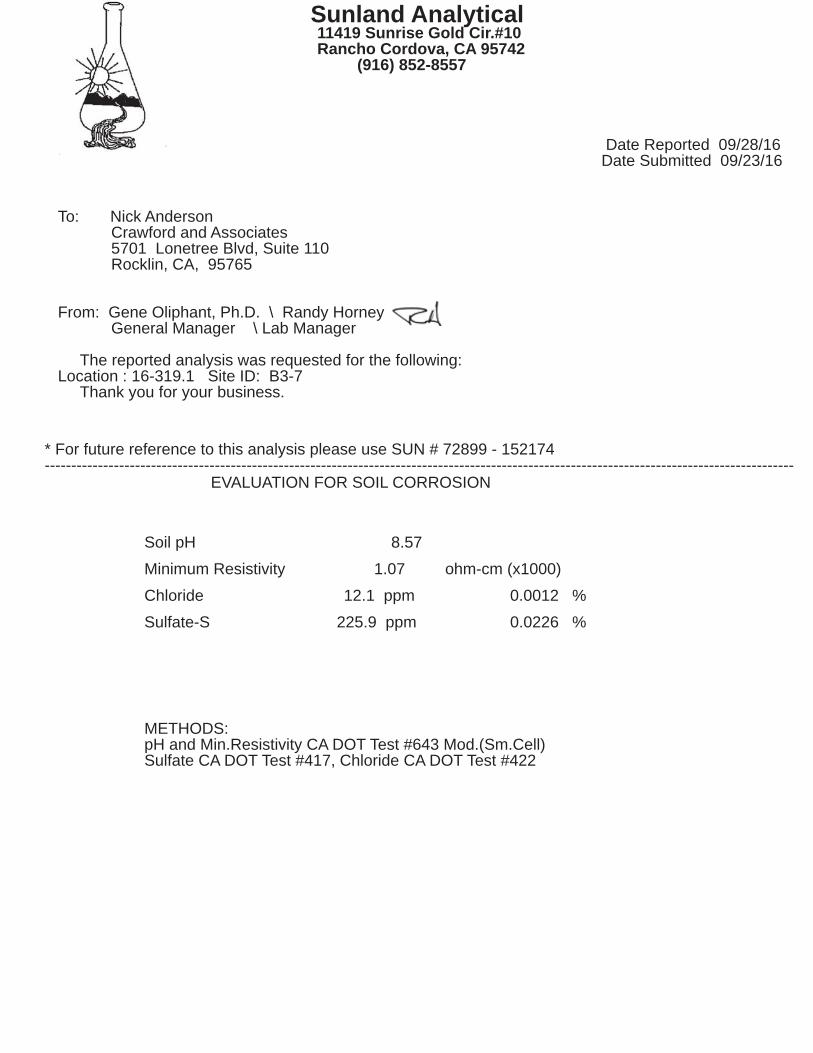
Sunland Analytical 11419 Sunrise Gold Cir.#10 Rancho Cordova, CA 95742 (916) 852-8557
Date Reported 09/28/16 Date Submitted 09/23/16
To: Nick Anderson Crawford and Associates 5701 Lonetree Blvd, Suite 110 Rocklin, CA, 95765
From: Gene Oliphant, Ph.D. \ Randy Horney General Manager \ Lab Manager
The reported analysis was requested for the following:Location : 16-319.1 Site ID: B3-7 Thank you for your business.
* For future reference to this analysis please use SUN # 72899 - 152174 ---------------------------------------------------------------------------------------------------------------------------------------------
EVALUATION FOR SOIL CORROSION
Soil pH 8.57
Minimum Resistivity 1.07 ohm-cm (x1000)
Chloride 12.1 ppm 0.0012 %
Sulfate-S 225.9 ppm 0.0226 %
METHODS:pH and Min.Resistivity CA DOT Test #643 Mod.(Sm.Cell)Sulfate CA DOT Test #417, Chloride CA DOT Test #422

DRAFT GEOTECHNICAL FEASBILITY AND PRELIMINARY DESIGN REPORT CAInc Trinidad Rancheria Cher-Ae Heights Hotel File: 16-319.1 Trinidad, California November 8, 2016
APPENDIX C
LPile Outputs

Shear Force (kips)Preliminary 24-inch CIDH in Terrace Deposits
Dep
th (f
t)
-20 -10 0 10 20 30 40 50 60 70 80
05
1015
2025
3035
4045
5055
60
0.5-inch deflection
Sand
Shear Force (kips)Preliminary 24-inch CIDH in Terrace Deposits
Dep
th (f
t)
-20 -10 0 10 20 30 40 50 60 70 80
05
1015
2025
3035
4045
5055
0
0.5-inch deflection
Sand
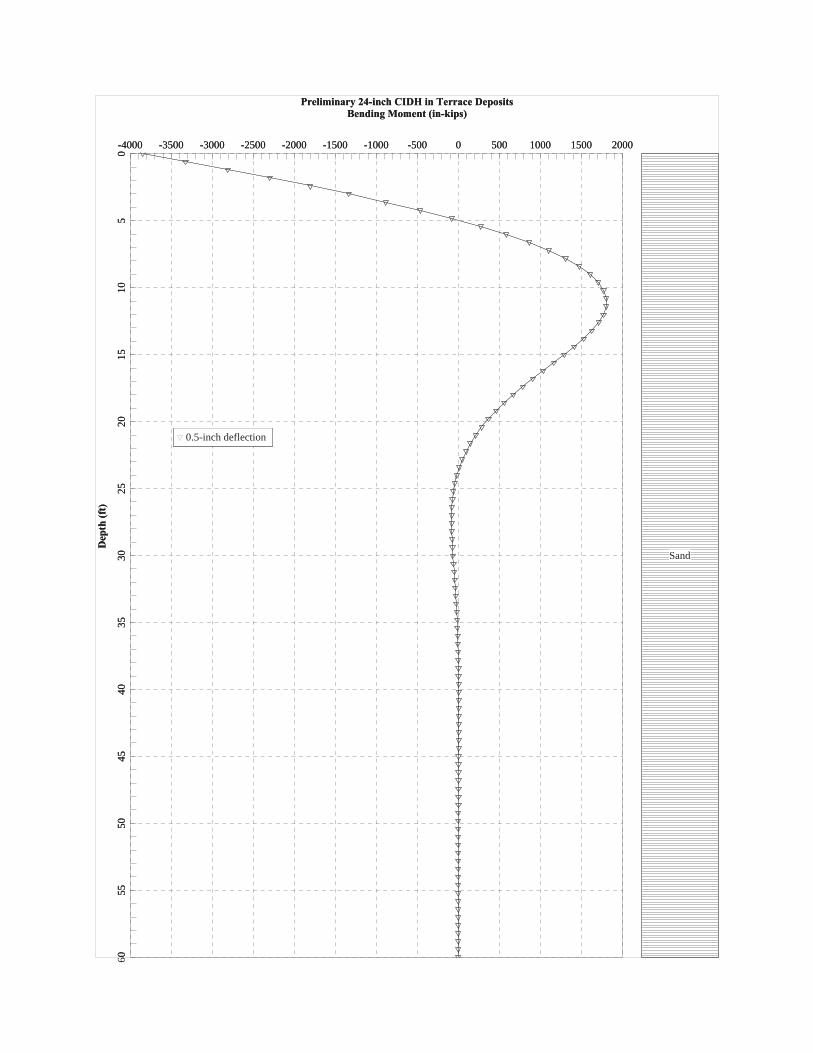
Bending Moment (in-kips)Preliminary 24-inch CIDH in Terrace Deposits
Dep
th (f
t)
-4000 -3500 -3000 -2500 -2000 -1500 -1000 -500 0 500 1000 1500 2000
05
1015
2025
3035
4045
5055
60
0.5-inch deflection
Sand
Bending Moment (in-kips)Preliminary 24-inch CIDH in Terrace Deposits
Dep
th (f
t)
-4000 -3500 -3000 -2500 -2000 -1500 -1000 -500 0 500 1000 1500 2000
05
1015
2025
3035
4045
5055
0
0.5-inch deflection
Sand
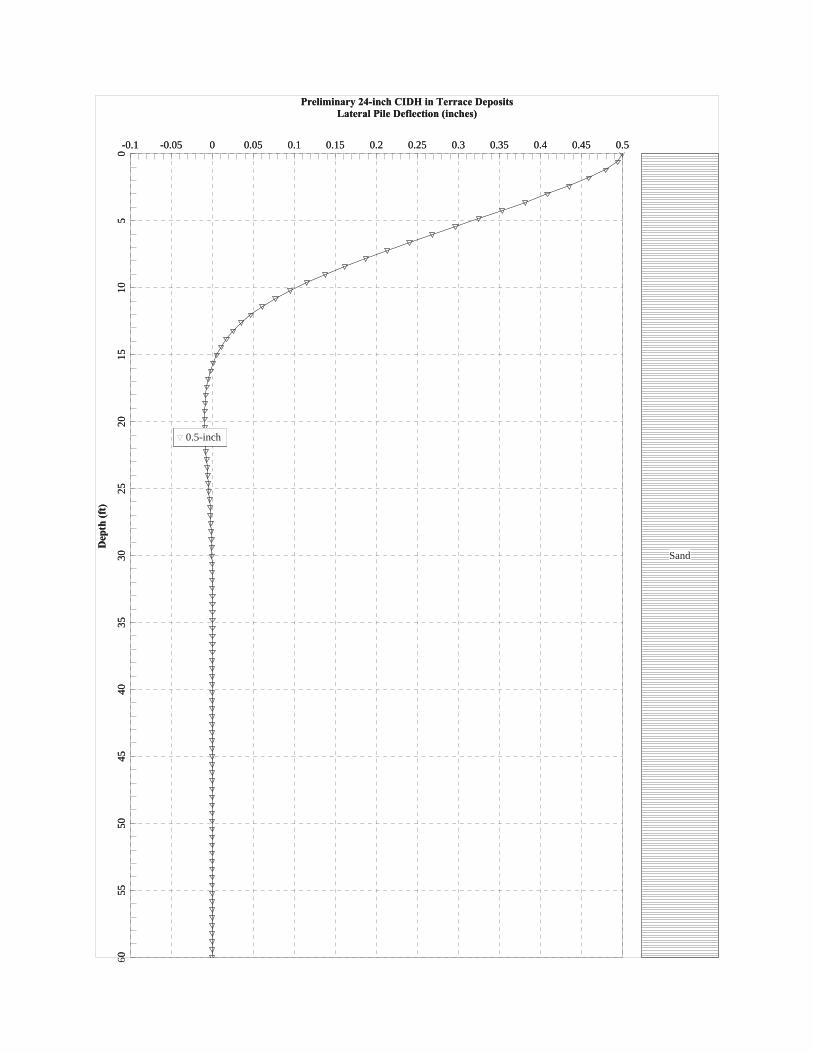
Lateral Pile Deflection (inches)Preliminary 24-inch CIDH in Terrace Deposits
Dep
th (f
t)
-0.1 -0.05 0 0.05 0.1 0.15 0.2 0.25 0.3 0.35 0.4 0.45 0.5
05
1015
2025
3035
4045
5055
60
0.5-inch
Sand
Lateral Pile Deflection (inches)Preliminary 24-inch CIDH in Terrace Deposits
Dep
th (f
t)
-0.1 -0.05 0 0.05 0.1 0.15 0.2 0.25 0.3 0.35 0.4 0.45 0.5
05
1015
2025
3035
4045
5055
0
0.5-inch
Sand
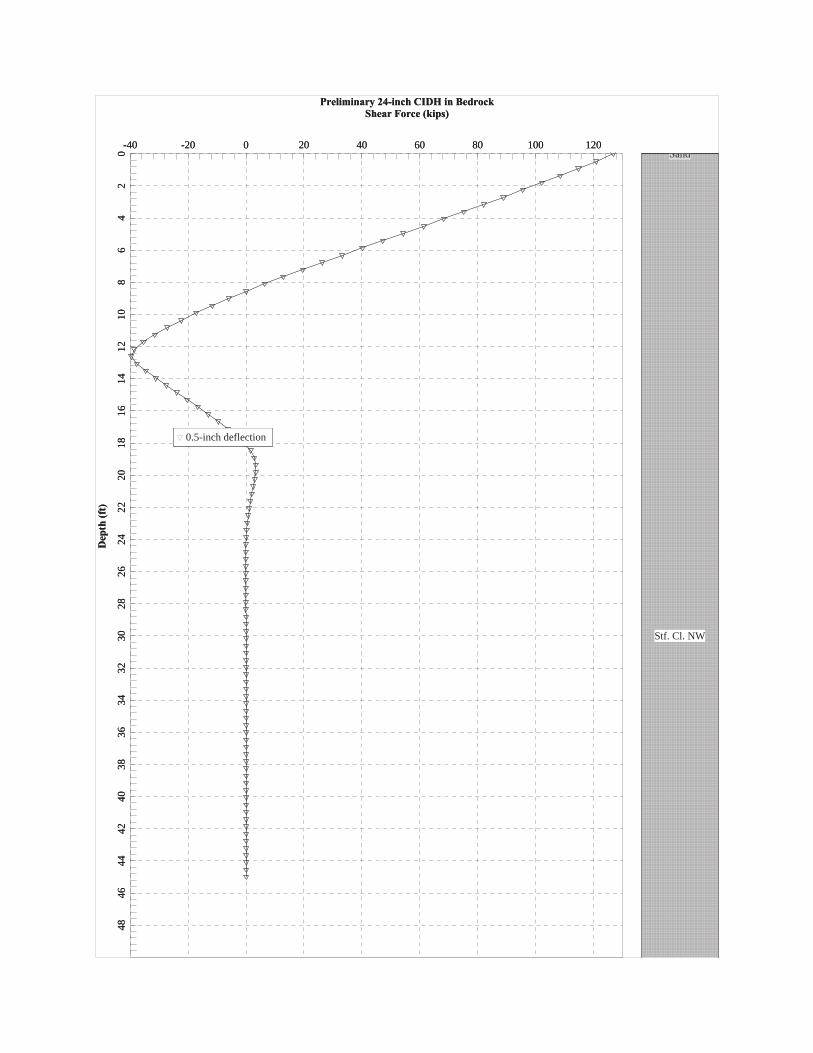
Shear Force (kips)Preliminary 24-inch CIDH in Bedrock
Dep
th (f
t)
-40 -20 0 20 40 60 80 100 120
02
46
810
1214
1618
2022
2426
2830
3234
3638
4042
4446
48
0.5-inch deflection
Sand
Stf. Cl. NW
Shear Force (kips)Preliminary 24-inch CIDH in Bedrock
Dep
th (f
t)
-40 -20 0 20 40 60 80 100 120
02
46
810
1214
1618
2022
2426
2830
3234
3638
4042
4446
48
0.5-inch deflection
Sand
Stf. Cl. NW
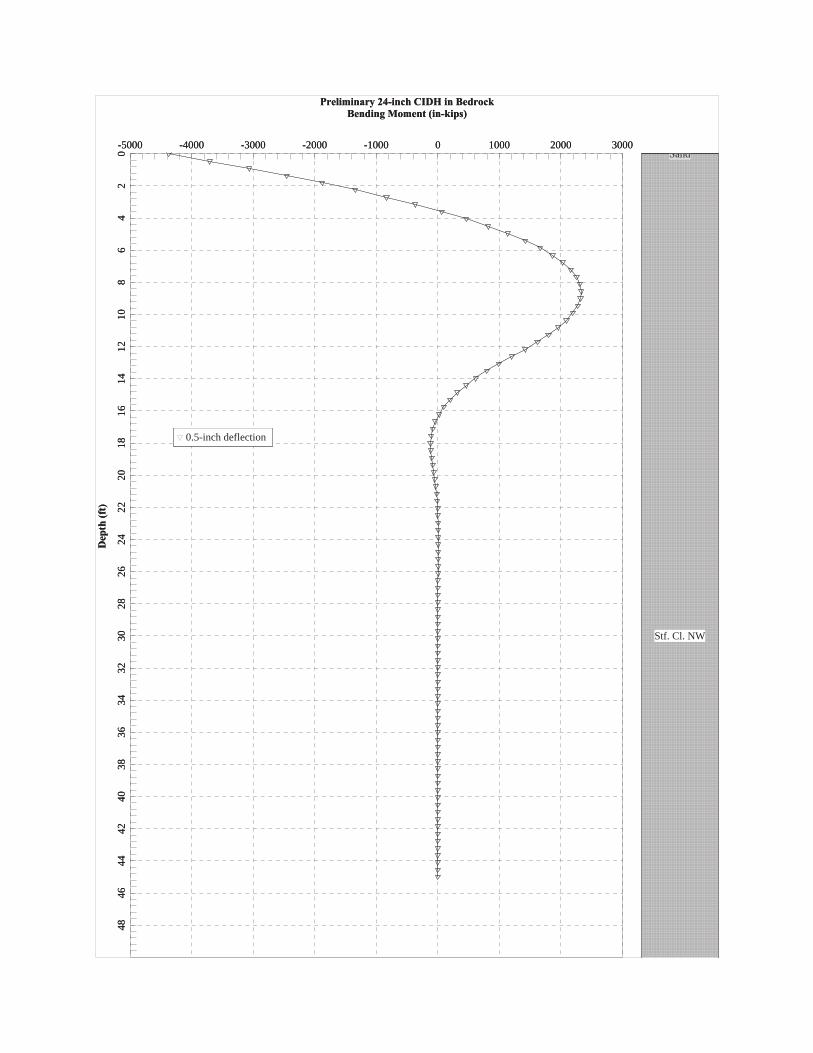
Bending Moment (in-kips)Preliminary 24-inch CIDH in Bedrock
Dep
th (f
t)
-5000 -4000 -3000 -2000 -1000 0 1000 2000 3000
02
46
810
1214
1618
2022
2426
2830
3234
3638
4042
4446
48
0.5-inch deflection
Sand
Stf. Cl. NW
Bending Moment (in-kips)Preliminary 24-inch CIDH in Bedrock
Dep
th (f
t)
-5000 -4000 -3000 -2000 -1000 0 1000 2000 3000
02
46
810
1214
1618
2022
2426
2830
3234
3638
4042
4446
48
0.5-inch deflection
Sand
Stf. Cl. NW
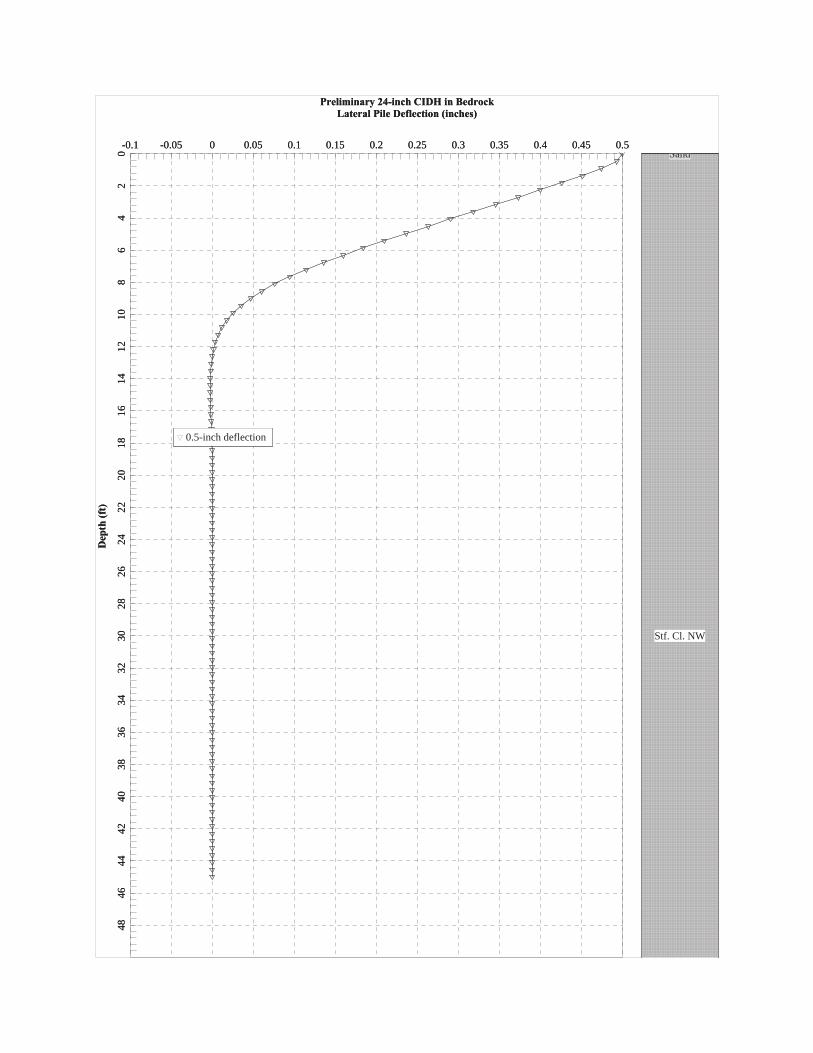
Lateral Pile Deflection (inches)Preliminary 24-inch CIDH in Bedrock
Dep
th (f
t)
-0.1 -0.05 0 0.05 0.1 0.15 0.2 0.25 0.3 0.35 0.4 0.45 0.5
02
46
810
1214
1618
2022
2426
2830
3234
3638
4042
4446
48
0.5-inch deflection
Sand
Stf. Cl. NW
Lateral Pile Deflection (inches)Preliminary 24-inch CIDH in Bedrock
Dep
th (f
t)
-0.1 -0.05 0 0.05 0.1 0.15 0.2 0.25 0.3 0.35 0.4 0.45 0.5
02
46
810
1214
1618
2022
2426
2830
3234
3638
4042
4446
48
0.5-inch deflection
Sand
Stf. Cl. NW
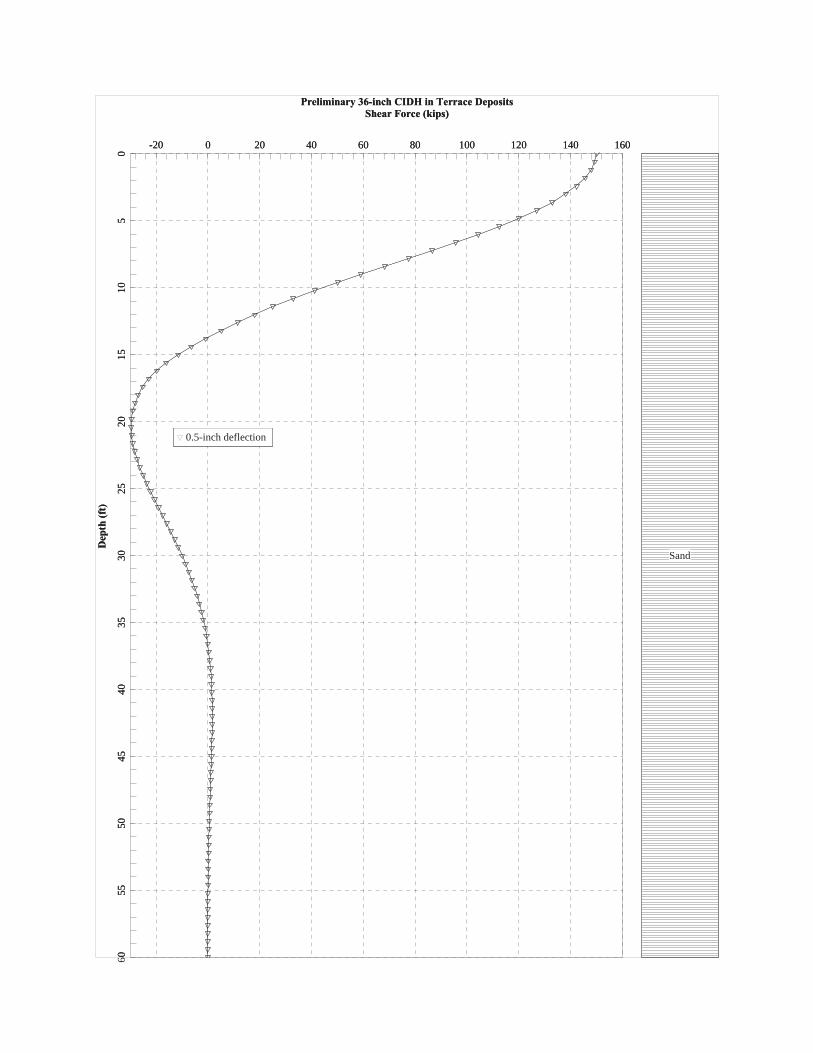
Shear Force (kips)Preliminary 36-inch CIDH in Terrace Deposits
Dep
th (f
t)
-20 0 20 40 60 80 100 120 140 160
05
1015
2025
3035
4045
5055
60
0.5-inch deflection
Sand
Shear Force (kips)Preliminary 36-inch CIDH in Terrace Deposits
Dep
th (f
t)
-20 0 20 40 60 80 100 120 140 160
05
1015
2025
3035
4045
5055
0
0.5-inch deflection
Sand
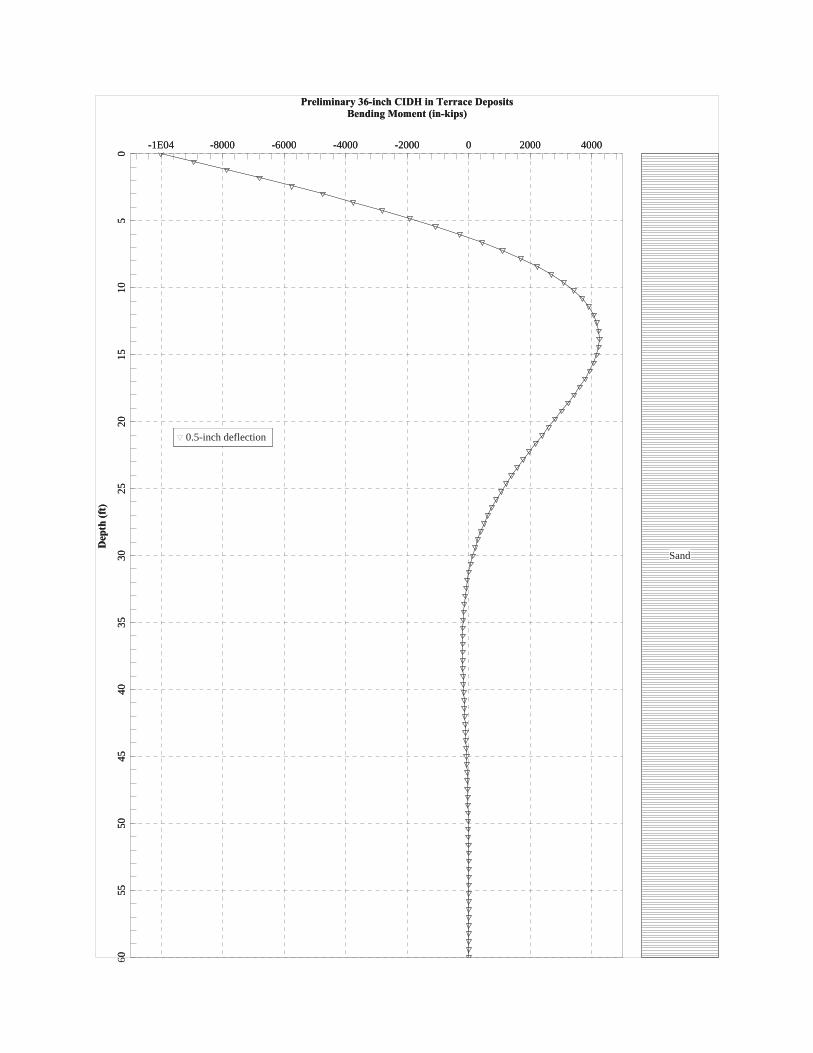
Bending Moment (in-kips)Preliminary 36-inch CIDH in Terrace Deposits
Dep
th (f
t)
-1E04 -8000 -6000 -4000 -2000 0 2000 4000
05
1015
2025
3035
4045
5055
60
0.5-inch deflection
Sand
Bending Moment (in-kips)Preliminary 36-inch CIDH in Terrace Deposits
Dep
th (f
t)
-1E04 -8000 -6000 -4000 -2000 0 2000 4000
05
1015
2025
3035
4045
5055
0
0.5-inch deflection
Sand
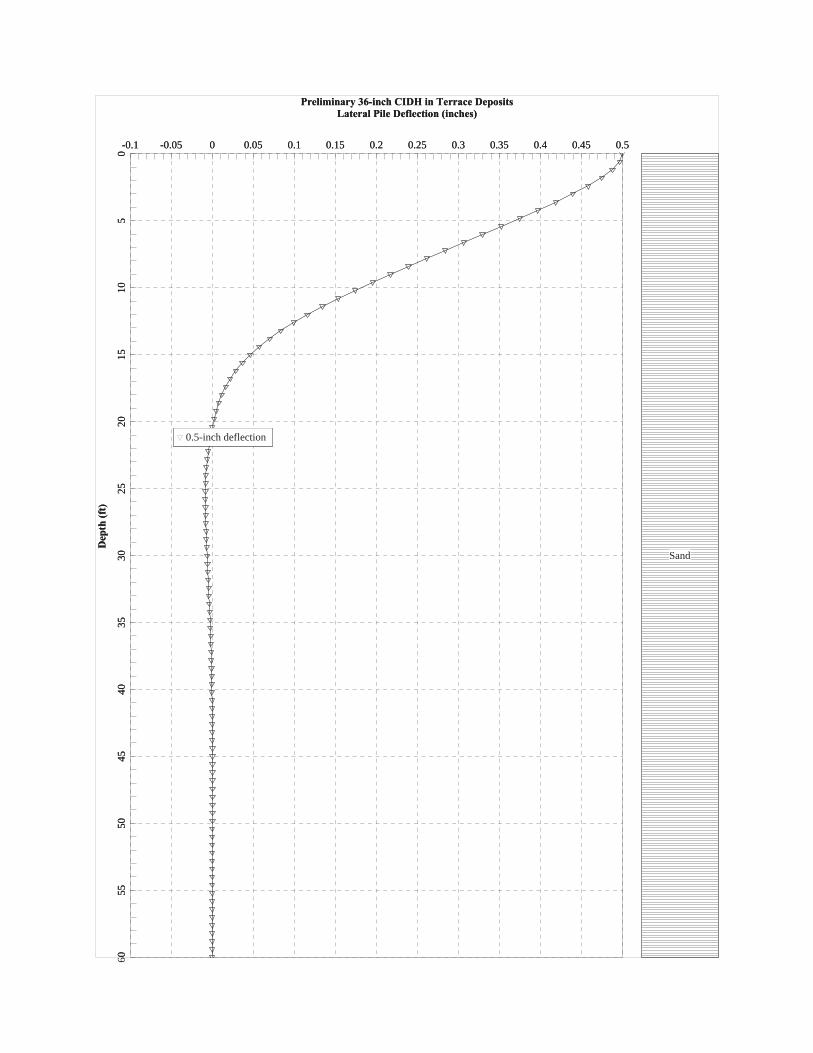
Lateral Pile Deflection (inches)Preliminary 36-inch CIDH in Terrace Deposits
Dep
th (f
t)
-0.1 -0.05 0 0.05 0.1 0.15 0.2 0.25 0.3 0.35 0.4 0.45 0.5
05
1015
2025
3035
4045
5055
60
0.5-inch deflection
Sand
Lateral Pile Deflection (inches)Preliminary 36-inch CIDH in Terrace Deposits
Dep
th (f
t)
-0.1 -0.05 0 0.05 0.1 0.15 0.2 0.25 0.3 0.35 0.4 0.45 0.5
05
1015
2025
3035
4045
5055
0
0.5-inch deflection
Sand

Shear Force (kips)Preliminary 36-inch CIDH in Bedrock
Dep
th (f
t)
-100 -50 0 50 100 150 200 250 300
02
46
810
1214
1618
2022
2426
2830
3234
3638
4042
4446
48
0.5-inch Deflection
Sand
Stf. Cl. NW
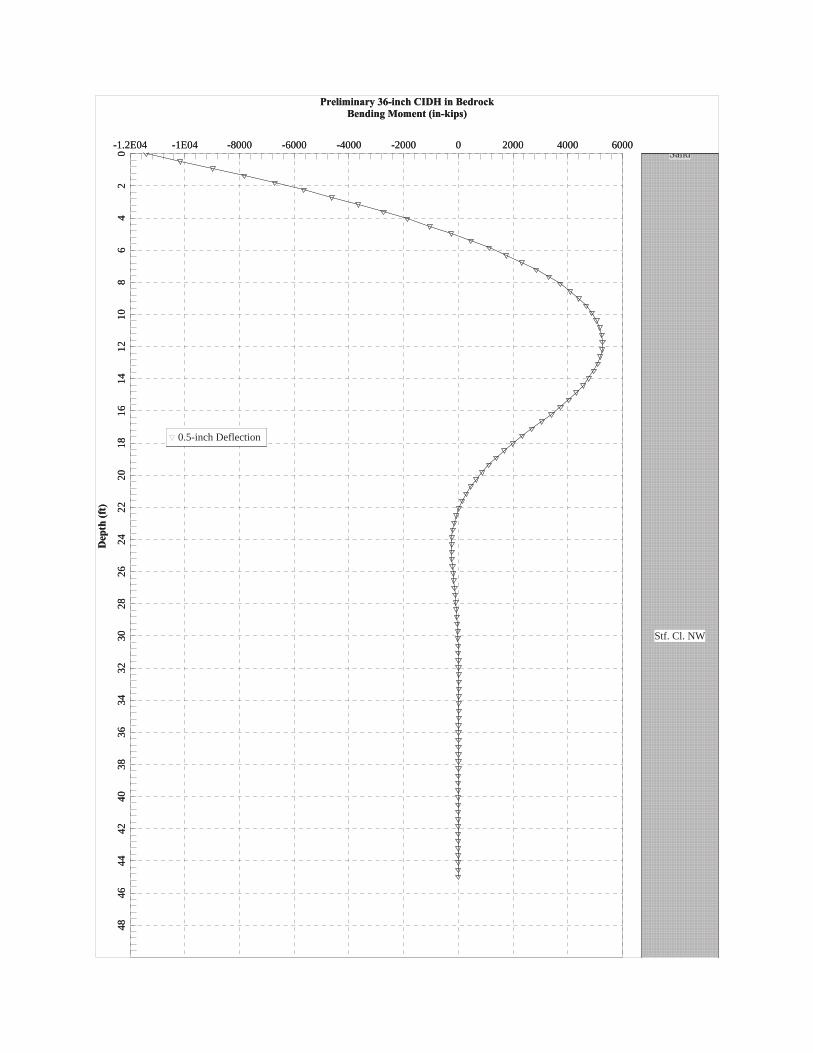
Bending Moment (in-kips)Preliminary 36-inch CIDH in Bedrock
Dep
th (f
t)
-1.2E04 -1E04 -8000 -6000 -4000 -2000 0 2000 4000 6000
02
46
810
1214
1618
2022
2426
2830
3234
3638
4042
4446
48
0.5-inch Deflection
Sand
Stf. Cl. NW
Bending Moment (in-kips)Preliminary 36-inch CIDH in Bedrock
Dep
th (f
t)
-1.2E04 -1E04 -8000 -6000 -4000 -2000 0 2000 4000 6000
02
46
810
1214
1618
2022
2426
2830
3234
3638
4042
4446
48
0.5-inch Deflection
Sand
Stf. Cl. NW

Lateral Pile Deflection (inches)Preliminary 36-inch CIDH in Bedrock
Dep
th (f
t)
-0.1 -0.05 0 0.05 0.1 0.15 0.2 0.25 0.3 0.35 0.4 0.45 0.5
02
46
810
1214
1618
2022
2426
2830
3234
3638
4042
4446
48
0.5-inch Deflection
Sand
Stf. Cl. NW
Lateral Pile Deflection (inches)Preliminary 36-inch CIDH in Bedrock
Dep
th (f
t)
-0.1 -0.05 0 0.05 0.1 0.15 0.2 0.25 0.3 0.35 0.4 0.45 0.5
02
46
810
1214
1618
2022
2426
2830
3234
3638
4042
4446
48
0.5-inch Deflection
Sand
Stf. Cl. NW

DRAFT GEOTECHNICAL FEASBILITY AND PRELIMINARY DESIGN REPORT CAInc Trinidad Rancheria Cher-Ae Heights Hotel File: 16-319.1 Trinidad, California November 8, 2016
APPENDIX D
SHN Geotechnical Report – Proposed Expansion Cher-Ae Heights Gaming Building Boring Logs Taber Geotechnical Report – Trinidad Rancheria Expansion Project Test Pit Logs
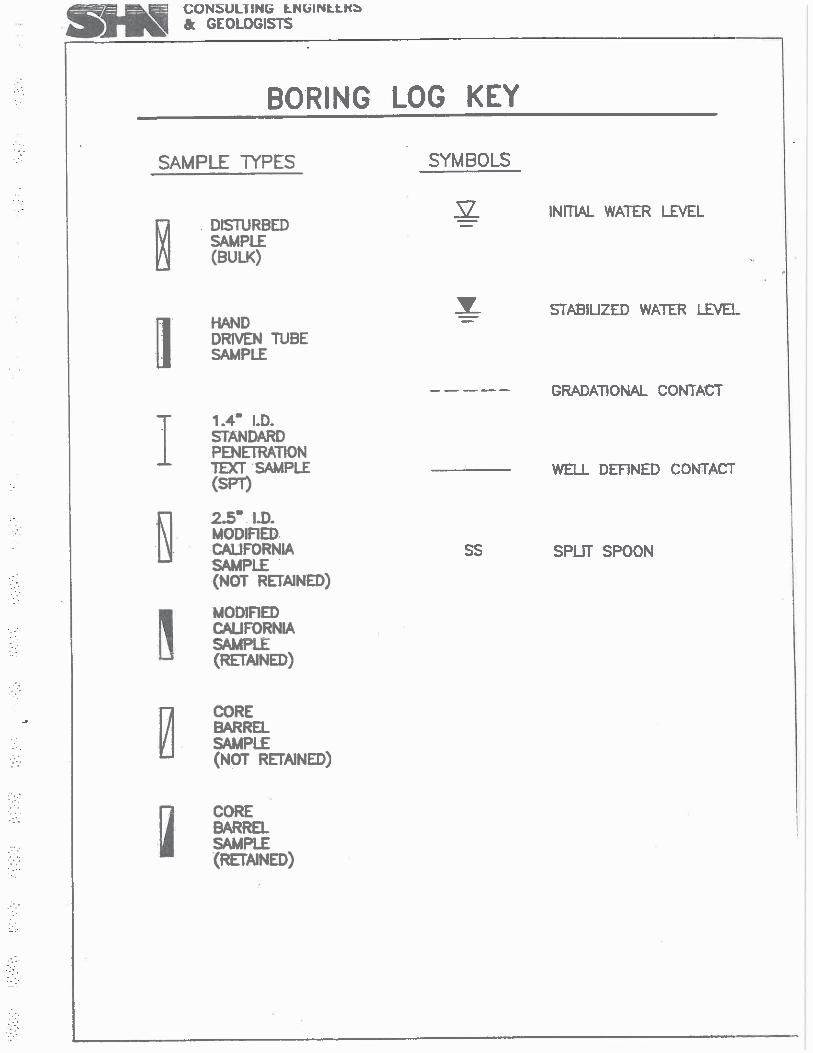
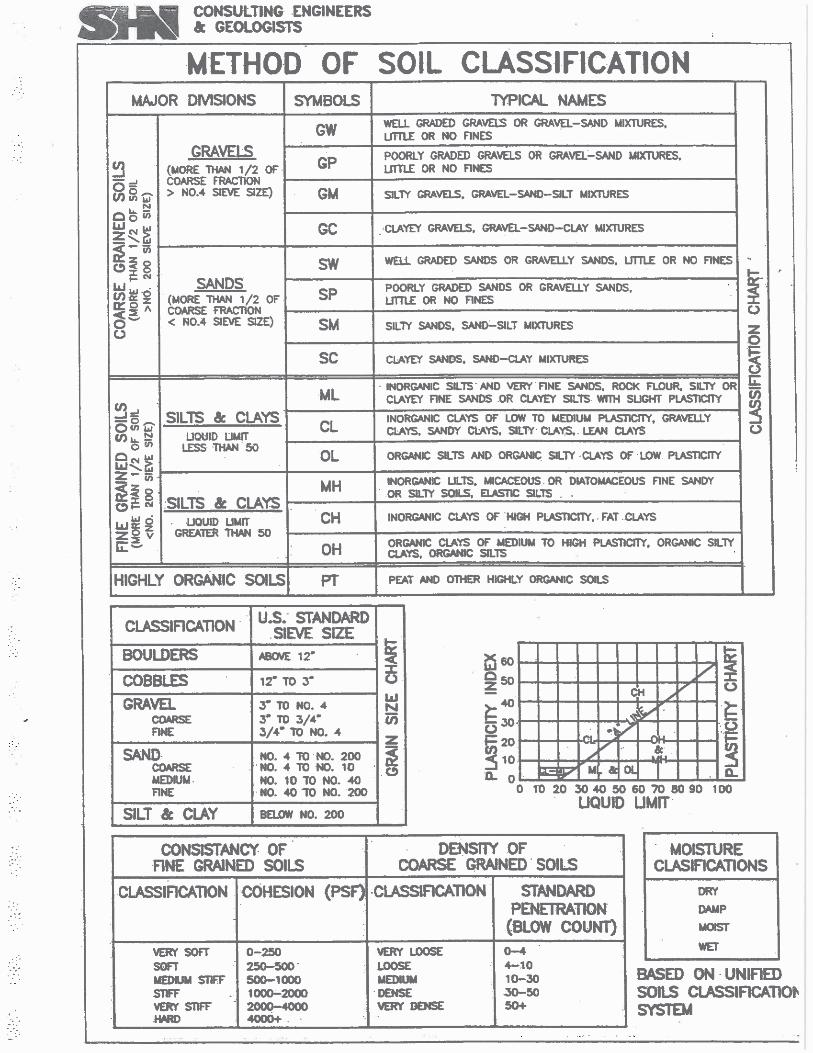
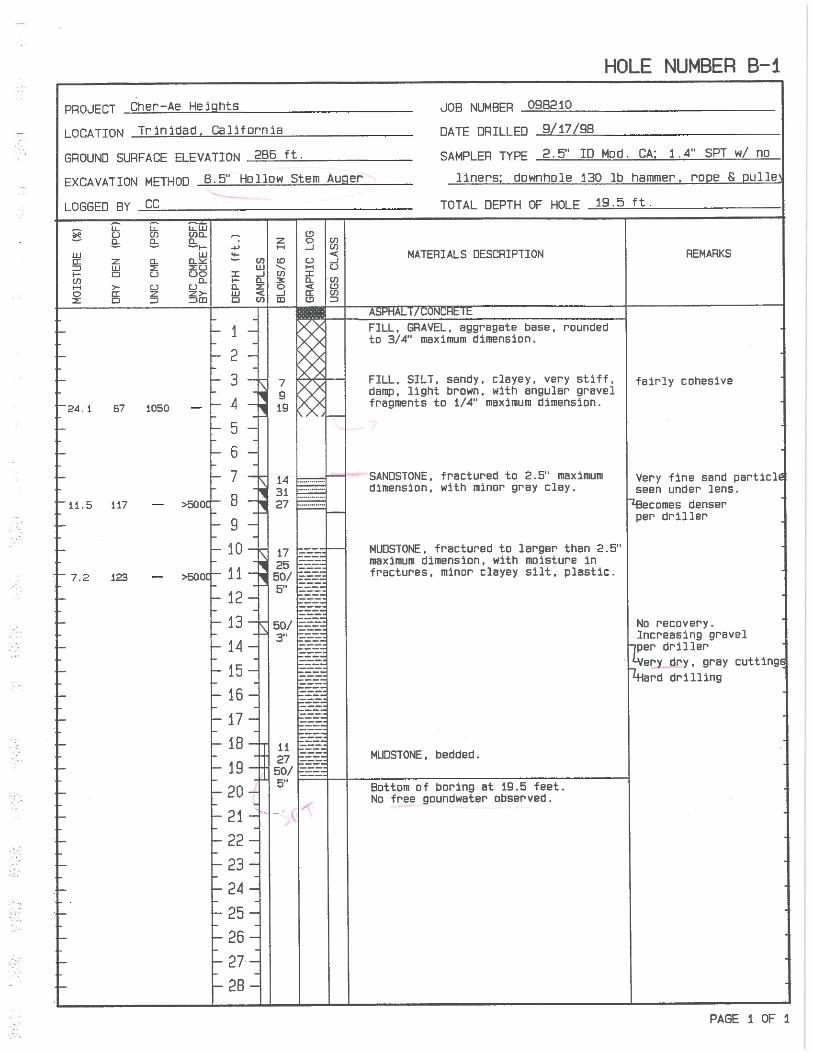
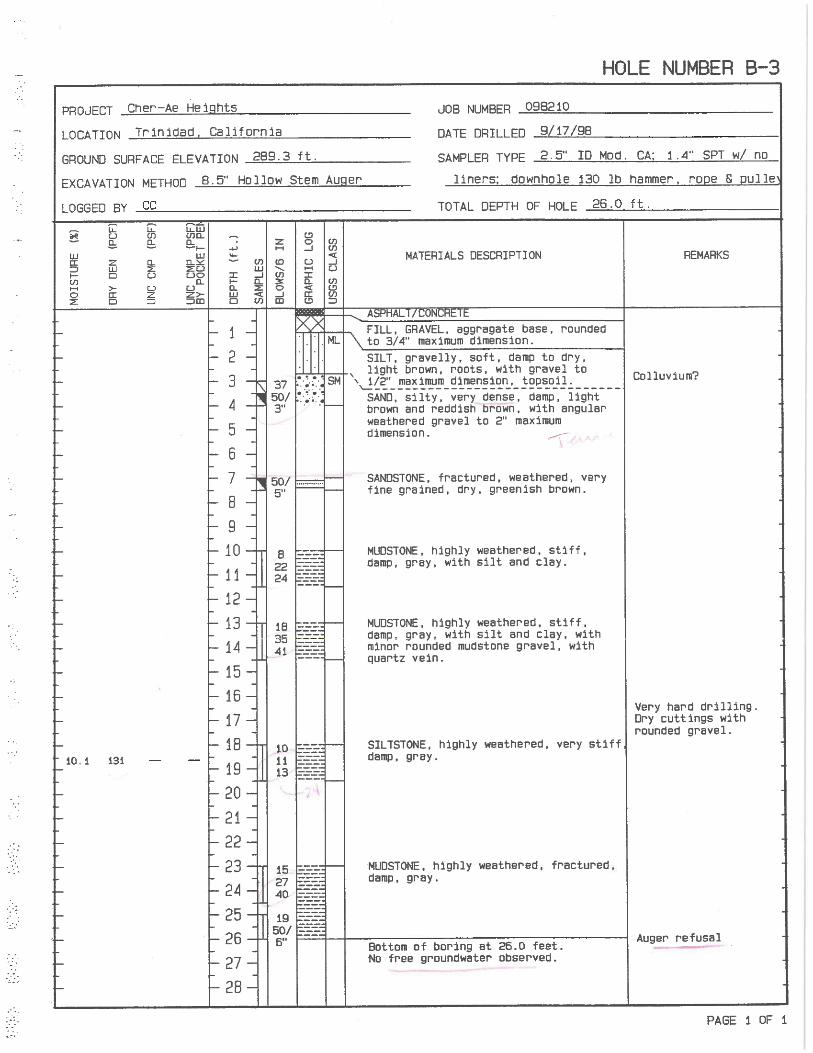
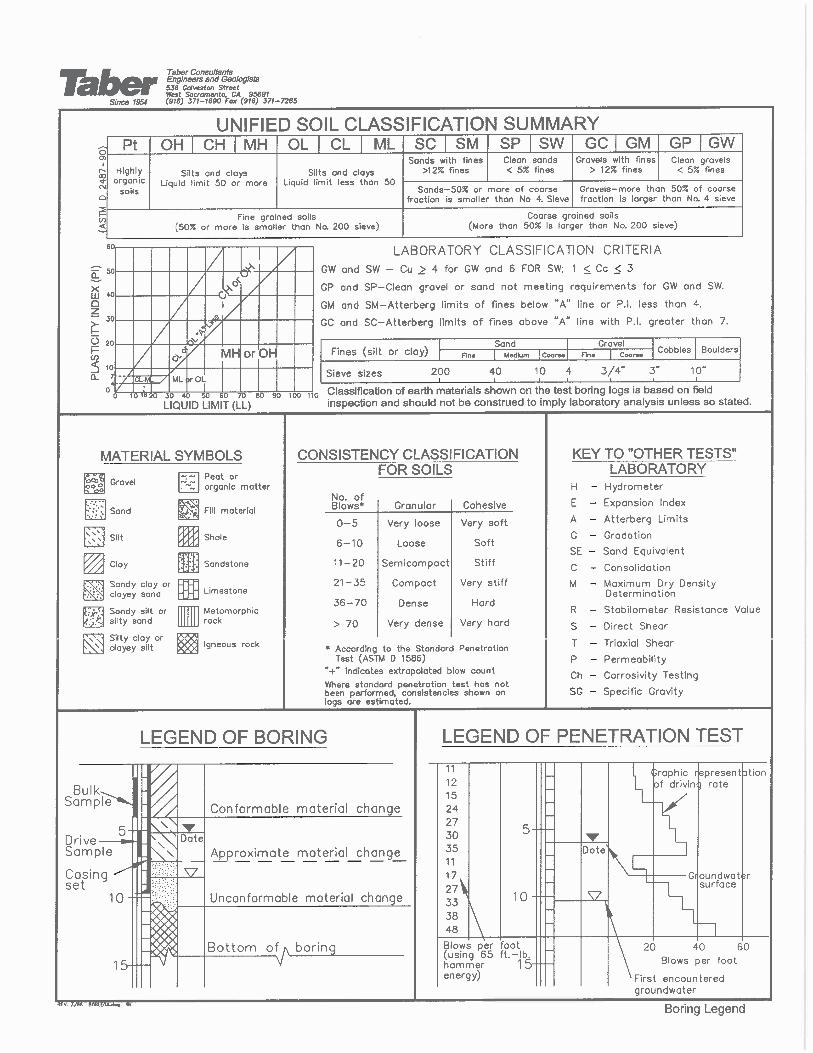
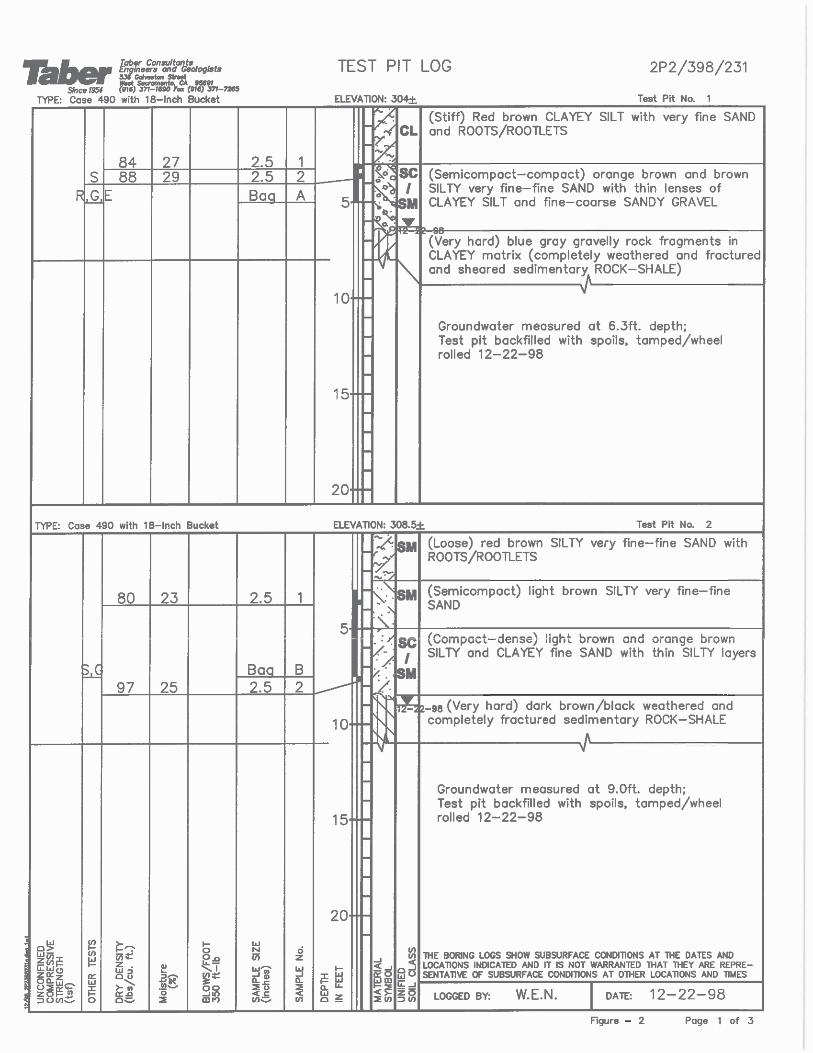
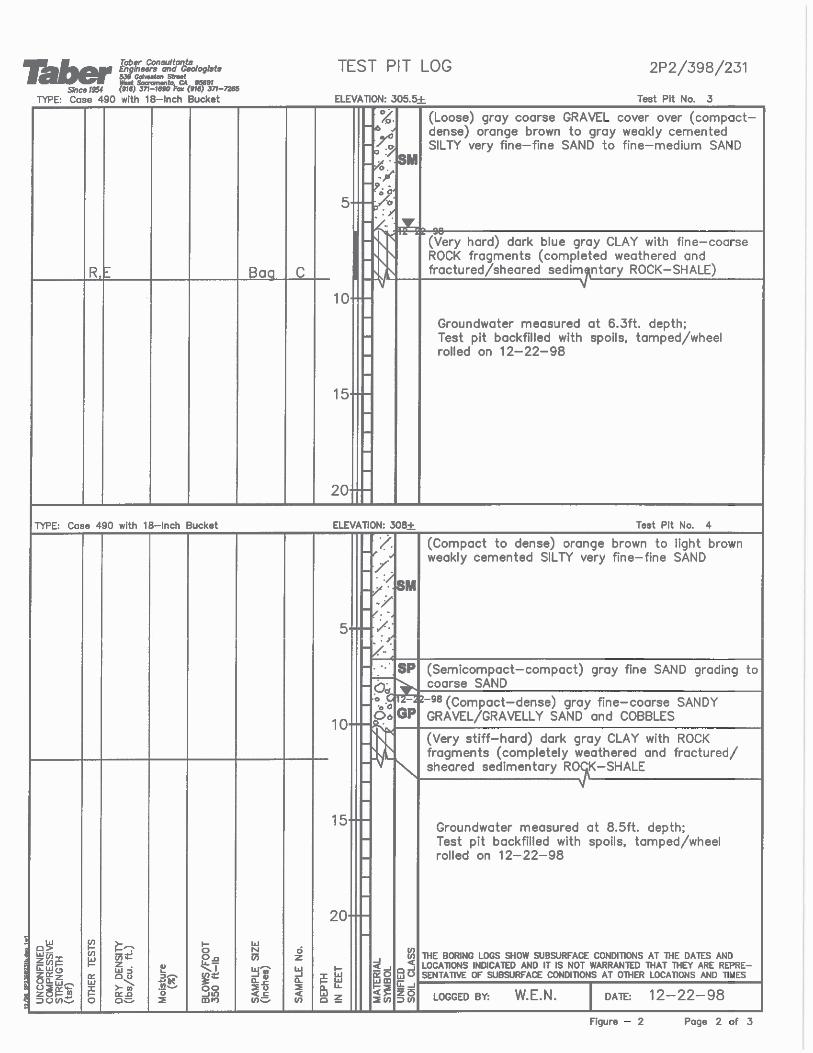
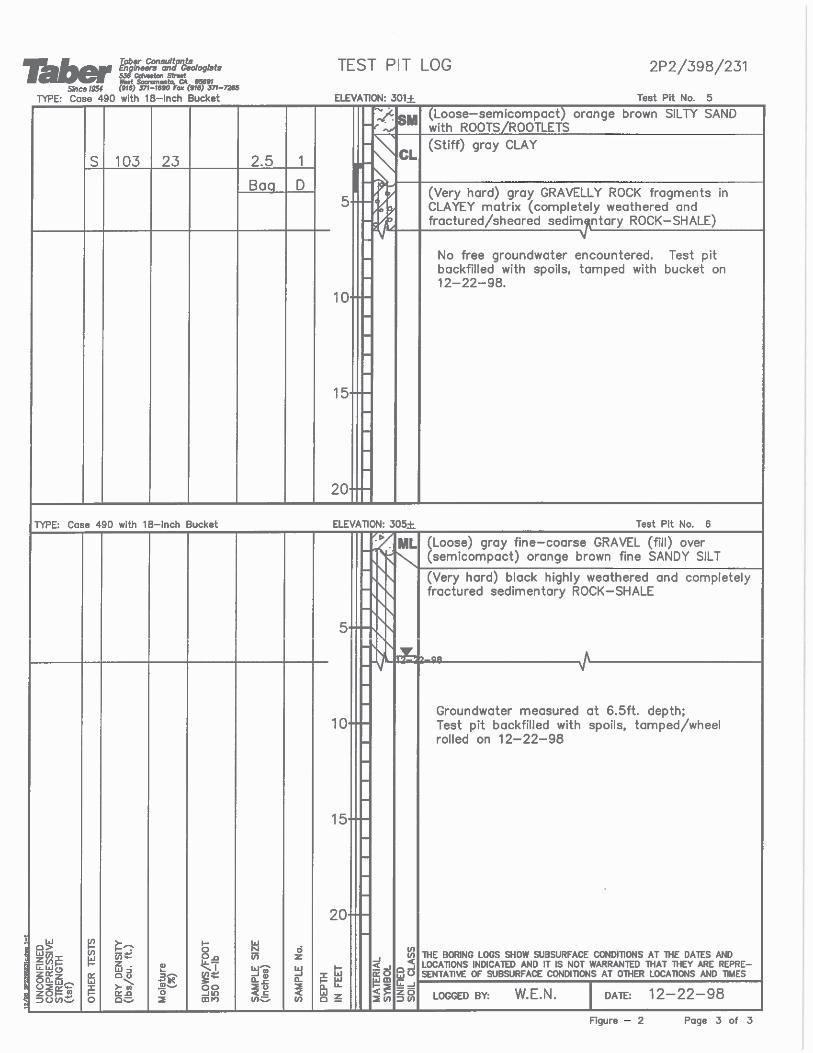

DRAFT GEOTECHNICAL FEASBILITY AND PRELIMINARY DESIGN REPORT CAInc Trinidad Rancheria Cher-Ae Heights Hotel File: 16-319.1 Trinidad, California November 8, 2016
APPENDIX E
Site Photos

DRAFT GEOTECHNICAL FEASBILITY AND PRELIMINARY DESIGN REPORT CAInc Trinidad Rancheria Cher-Ae Heights Hotel File: 16-319.1 Trinidad, California November 8, 2016
Photo 1: Looking east at head of landslide
Photo 2: "Water loving plants" beneath landslide at Scenic Drive
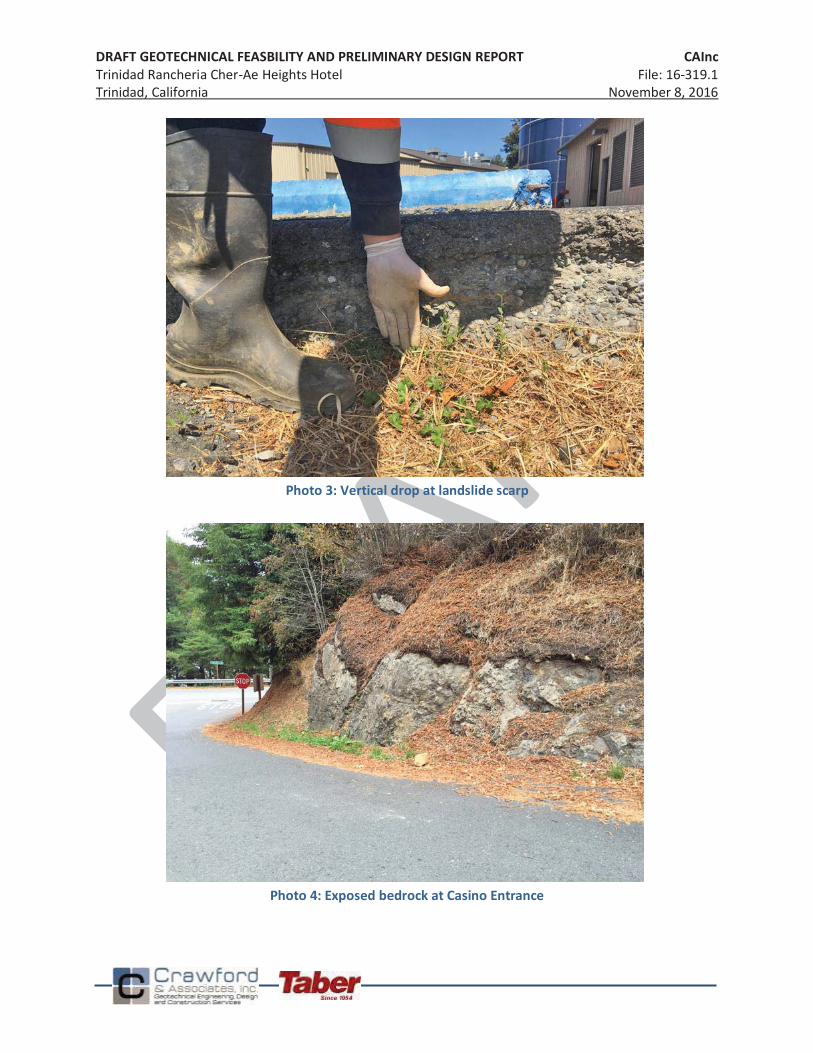
DRAFT GEOTECHNICAL FEASBILITY AND PRELIMINARY DESIGN REPORT CAInc Trinidad Rancheria Cher-Ae Heights Hotel File: 16-319.1 Trinidad, California November 8, 2016
Photo 3: Vertical drop at landslide scarp
Photo 4: Exposed bedrock at Casino Entrance
DRAFT GEOTECHNICAL FEASBILITY AND PRELIMINARY DESIGN REPORT CAInc Trinidad Rancheria Cher-Ae Heights Hotel File: 16-319.1 Trinidad, California November 8, 2016
Photo 5: Sea stacks at beach west of Scenic Drive
Photo 6: Weathered bedrock

APPENDIX CBEST MANAGEMENT PRACTICES
BBEST MANAGEMENT PRACTICES AND CONSERVATION MEASURES
Construction The project site development footprint is under one acre (approximately 0.40 acres) and coverage under the General Construction National Pollutant Discharge Elimination System (NPDES) permit is not required and therefore a Stormwater Pollution Prevention Plan (SWPPP) is not required. However, to further reduce construction impacts from construction, Best Management Practices (BMPs) shall be implemented as necessary. BMPs shall be inspected, maintained, and repaired to assure continued performance of their intended function. BMPs shall be chosen to best suit the site and the activities that occur. ConstructionBMPs may include, but are not limited to, the following:
Stripped areas shall be stabilized through temporary seeding using dryland grasses. Exposed stockpiled soils shall be covered with plastic covering to prevent wind and rain erosion. The construction entrance shall be stabilized by the use of riprap, crushed gravel, or other such materials to prevent the track-out of dirt and mud. Construction roadways shall be stabilized using frequent watering, stabilizing chemical application, or physical covering of gravel or riprap. Filter fences shall be erected at all on-site stormwater exit points and along the edge of graded areas to stabilized non-graded areas and control siltation of on-site stormwater.Prior to land-disturbing activities, the clearing and grading limits shall be marked clearly, both in the field and on the plans. This can be done using construction fences or by creating buffer zones.Concentrated flows create high potential for erosion; therefore, any slopes shall be protected from concentration flow. This can be done by using gradient terraces, interceptor dikes, and swales, and by installing pipe slope drains or level spreaders. Inlets need to be protected to provide an initial filtering of stormwater runoff; however, any sediment buildup shall be removed so the inlet does not become blocked. If construction occurs during wet periods, sub-grade stabilization shall be required. Mulching or netting may be needed for wet-weather construction.Temporary erosion control measures (such as silt fence, gravel filter berms, straw wattles, sediment/grease traps, mulching of disturbed soil, construction stormwater chemical treatment, and construction stormwater filtration) shall be employed for disturbed areas. Exposed and unworked soils shall be stabilized by the application of effective BMPs. These include, but are not limited to, temporary or permanent seeding, mulching, nets and blankets, plastic covering, sodding, and gradient terraces.Temporary erosion control measures (such as silt fences, staked straw bales, and temporary revegetation) shall be employed for disturbed areas and stockpiled soil.Potentially hazardous materials shall be stored away from drainages and containment berms shallbe constructed to prevent spilled materials from reaching water bodies.Vehicles and equipment used during construction shall be provided proper and timely maintenance to reduce potential for mechanical breakdowns leading to a spill of materials into water bodies. Maintenance and fueling shall be conducted in an area that meets the criteria set forth in the spill prevention plan.
WWater Resources The following BMPs would be implemented to reduce water usage at the Hotel:
In order to reduce water consumption and support LEED and sustainability goals of the building, all plumbing would include low-flow and ultra-flow fixtures to reduce water consumption. All fittings are made of brass construction with a high-quality chrome finish, and polished, per thecurrent Hyatt Place plumbing and accessories list. All proposed fixtures would comply with applicable water use reduction requirements of American Society of Heating, Refrigerating, and Air-Conditioning Engineers (ASHRAE) Standard 189.1 Section 6.
Air Quality and Greenhouse Gasses Generation of construction-related emissions is a short-term nuisance impact. The following BMPs, required through contractual obligations, would be implemented to reduce these temporary construction emissions.
The contractor shall designate an on-site Air Quality Construction BMP Manager (AQCBM) whomwould be responsible for directing compliance with the following BMPs for project construction relating to heavy-duty equipment use:
o All diesel-powered equipment shall be properly maintained and shall minimize idling time to 5 minutes when construction equipment is not in use, unless per engine manufacturer’s specifications or for safety reasons more time is required.
o Engines shall be kept in good mechanical condition to minimize exhaust emissions. The AQCBM would be responsible for directing compliance with the following BMPs for fugitive dust control practices during project construction:
o Spray exposed soil with water or other suppressant at least twice a day or as needed. o Minimize dust emissions during transport of fill material or soil by wetting down loads,
ensuring adequate freeboard (space from the top of the material to the top of the truck bed) on trucks, and/or covering loads.
o Promptly clean up spills of transported material on public roads.o Locate construction equipment and truck staging areas away from sensitive receptors as
practical and in consideration of potential effects on other resources.o Cover dirt, gravel, and debris piles as needed to reduce dust and wind-blown debris.
To reduce operational greenhouse gas emissions, the Tribe shall install Energy Star rated appliances such as washing machines, dishwashers, celling fans, and refrigerators. Additionally, the Tribe shall install Energy Star rated low-flow water fixtures such as showerheads and bathroom faucets.
Fire Protection The following BMPs, required through contractual obligations, would be included as part of Alternative A to minimize the risk of fire during construction:
Any construction equipment that normally includes a spark arrester would be equipped with an arrester in good working order. This includes, but is not limited to, vehicles, heavy equipment, and chainsaws.
Structural fire protection would be provided through compliance with Uniform Fire Code requirements for residences and commercial structures similar in size to the proposed clubhouse. The Tribe would cooperate with the fire district by allowing routine inspections. The Tribe would ensure that appropriate water supply and pressure is available for emergency fire flows. Typical fire flow allowances would be confirmed with the local Fire Marshall prior to construction of any water storage tank.Comply with California Fire Code and National Fire Alarm Code requirements for commercial structures similar in size to the proposed Hotel.
HHazardous Materials The following BMPs would be required through contractual obligations and would be included as part of Alternative A to minimize the risk from use of hazardous materials during construction:
Personnel shall follow BMPs for filling and servicing construction equipment and vehicles. To reduce the potential for accidental release, fuel, oil, and hydraulic fluids shall be transferred directly from a service truck to construction equipment and shall not be stored on site.Catch-pans shall be placed under equipment to catch potential spills during servicing.Refueling shall be conducted only with approved pumps, hoses, and nozzles.Vehicle engines shall be shut down during refueling and idling shall be kept to a minimum.No smoking, open flames, or welding shall be allowed in refueling or service areas.Refueling shall be performed away from bodies of water to prevent contamination of water in the event of a leak or spill.Service trucks shall be provided with fire extinguishers and spill containment equipment, such as absorbents.Should a spill contaminate soil, the soil shall be put into containers and disposed of in accordance with local, state, and federal regulations.All containers used to store hazardous materials shall be inspected at least once per week for signsof leaking or failure. All maintenance, refueling, and storage areas shall be inspected monthly.Hazardous materials must be stored in appropriate and approved containers in accordance with applicable regulatory agency protocols. Potentially hazardous materials, including fuels, shall be stored away from drainages and secondary containment shall be provided for all hazardous materials stored during construction and operation.In the event that contaminated soil and/or groundwater are encountered during construction-related earth-moving activities, all work shall be halted until a professional hazardous materials specialist or other qualified individual assesses the extent of contamination. If contamination is determined to be hazardous, representatives of the Tribe shall consult with the BIA and EPA to determine the appropriate course of action, including development of a Sampling and Remediation Plan, if necessary. Any contaminated soils that are determined to be hazardous shall be disposed of in accordance with federal regulations.

APPENDIX DREGULATORY CONTEXT
11 WATER QUALITY
1.1 SURFACE WATER The Clean Water Act (CWA) (33 USC 1251-1376), as amended by the Water Quality Act of 1987, is the major federal legislation governing water quality. The objective of the CWA is “to restore and maintain the chemical, physical, and biological integrity of the Nation’s waters.” The U.S. Environmental Protection Agency (USEPA) is delegated as the authoritative body under the CWA. Important sections of the CWA applicable to the Proposed Action are as follows:
Section 303 and Section 304 provide for water quality standards, criteria, and guidelines. Section 303(d) requires states to identify impaired water bodies and develop total maximum daily loads (TMDLs) for the contaminant(s) of concern. Section 304 publishes water quality criteria for the protection of aquatic life and human health in surface water for approximately 150 pollutants. Section 402 establishes the National Pollutant Discharge Elimination System (NPDES), a permitting system for the discharge of any pollutant (except for dredged or fill material) into waters of the U.S. Each NPDES permit contains limits on pollutant concentrations of wastes discharged to surface waters to prevent degradation of water quality and protect beneficial uses.
1.2 ANTIDEGRADATION POLICY
The federal antidegradation policy (40 CFR Part 131.6) is designed to protect water quality and water resources. The policy directs states to adopt a statewide policy that includes the following primary provisions: (1) existing instream uses and the water quality necessary to protect those uses shall be maintained and protected; (2) where existing water quality is better than necessary to support fishing and swimming conditions, that quality shall be maintained and protected unless the state finds that allowing lower water quality is necessary for important local economic or social development; and (3) where high-quality waters constitute an outstanding national resource, such as waters of national and state parks, wildlife refuges, and waters of exceptional recreational or ecological significance, that water quality shall be maintained and protected. Each state must also develop procedures to implement its antidegradation policy through water quality management processes. Each state’s antidegradation policy must include implementation methods consistent with the provisions outlined in 40 CFR 131.12 (USEPA, 1994).
Complying with the antidegradation provision of the CWA, the North Coast Regional Water Quality Control Board (NCRWQCB) has established general water quality objectives for all inland surface waters under State jurisdiction to protect designated beneficial uses. The Water Quality Control Plan for the North Coast Region (Basin Plan) outlines these surface water quality objectives. Table 1 lists the specific water quality objectives outlined in the Basin Plan by parameter for surface waters under State jurisdiction within the surrounding watersheds. The Basin Plan does not currently list surface water quality objectives for the Trinidad HU.
The State Water Resources Control Board (SWRCB), in compliance with Section 303 of the CWA, has prepared a list of impaired water bodies in California. Impaired water bodies occur where industrial and
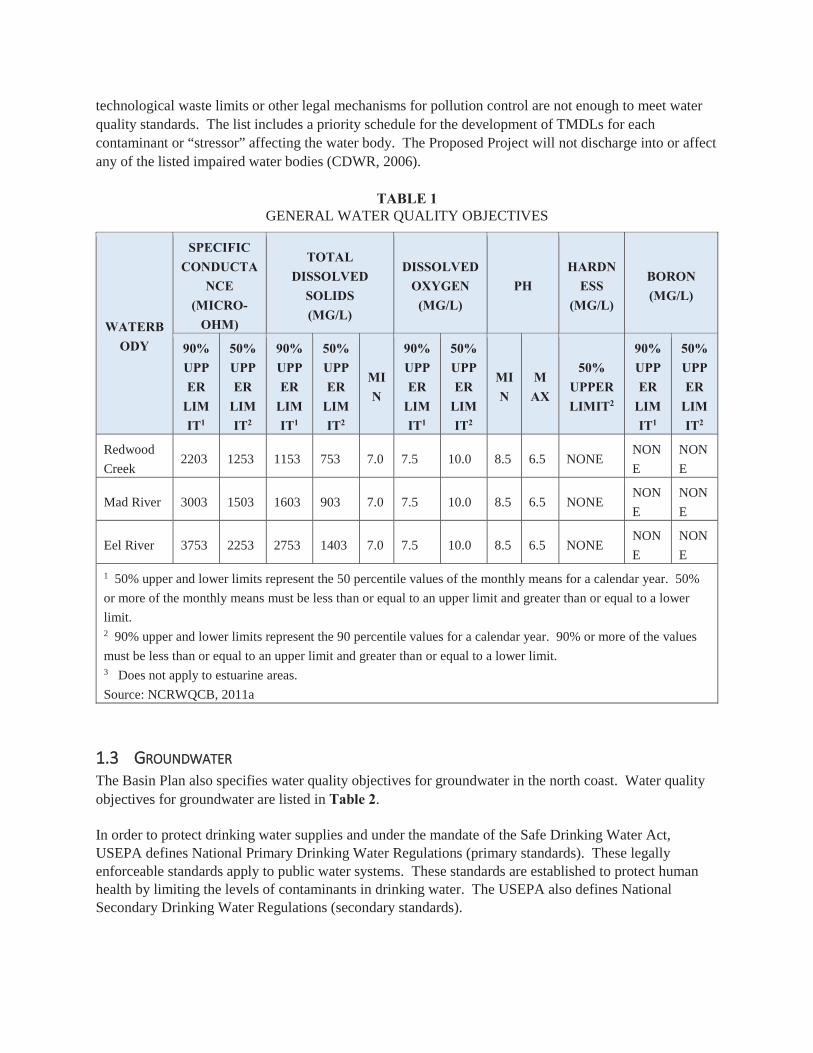
technological waste limits or other legal mechanisms for pollution control are not enough to meet water quality standards. The list includes a priority schedule for the development of TMDLs for each contaminant or “stressor” affecting the water body. The Proposed Project will not discharge into or affect any of the listed impaired water bodies (CDWR, 2006).
TABLE 1GENERAL WATER QUALITY OBJECTIVES
WATERBODY
SPECIFICCONDUCTA
NCE(MICRO-
OHM)
TOTALDISSOLVED
SOLIDS(MG/L)
DISSOLVEDOXYGEN
(MG/L)PH
HARDNESS
(MG/L)
BORON(MG/L)
90%UPPER
LIMIT1
50%UPPER
LIMIT2
90%UPPER
LIMIT1
50%UPPER
LIMIT2
MIN
90%UPPER
LIMIT1
50%UPPER
LIMIT2
MIN
MAX
50%UPPERLIMIT2
90%UPPER
LIMIT1
50%UPPER
LIMIT2
Redwood
Creek2203 1253 1153 753 7.0 7.5 10.0 8.5 6.5 NONE
NON
E
NON
E
Mad River 3003 1503 1603 903 7.0 7.5 10.0 8.5 6.5 NONENON
E
NON
E
Eel River 3753 2253 2753 1403 7.0 7.5 10.0 8.5 6.5 NONENON
E
NON
E
1 50% upper and lower limits represent the 50 percentile values of the monthly means for a calendar year. 50%
or more of the monthly means must be less than or equal to an upper limit and greater than or equal to a lower
limit.2 90% upper and lower limits represent the 90 percentile values for a calendar year. 90% or more of the values
must be less than or equal to an upper limit and greater than or equal to a lower limit.3 Does not apply to estuarine areas.
Source: NCRWQCB, 2011a
11.3 GROUNDWATER The Basin Plan also specifies water quality objectives for groundwater in the north coast. Water quality objectives for groundwater are listed in Table 2.
In order to protect drinking water supplies and under the mandate of the Safe Drinking Water Act, USEPA defines National Primary Drinking Water Regulations (primary standards). These legally enforceable standards apply to public water systems. These standards are established to protect human health by limiting the levels of contaminants in drinking water. The USEPA also defines National Secondary Drinking Water Regulations (secondary standards).
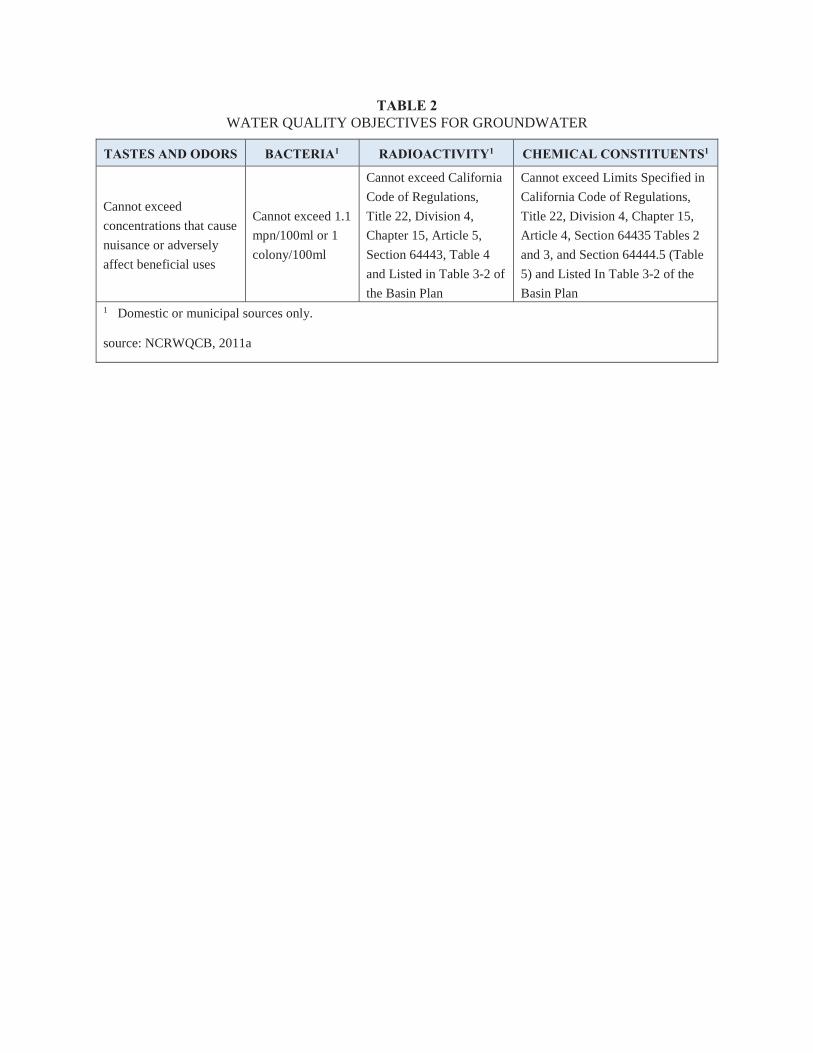
TABLE 2WATER QUALITY OBJECTIVES FOR GROUNDWATER
TASTES AND ODORS BACTERIA1 RADIOACTIVITY1 CHEMICAL CONSTITUENTS1
Cannot exceed
concentrations that cause
nuisance or adversely
affect beneficial uses
Cannot exceed 1.1
mpn/100ml or 1
colony/100ml
Cannot exceed California
Code of Regulations,
Title 22, Division 4,
Chapter 15, Article 5,
Section 64443, Table 4
and Listed in Table 3-2 of
the Basin Plan
Cannot exceed Limits Specified in
California Code of Regulations,
Title 22, Division 4, Chapter 15,
Article 4, Section 64435 Tables 2
and 3, and Section 64444.5 (Table
5) and Listed In Table 3-2 of the
Basin Plan1 Domestic or municipal sources only.
source: NCRWQCB, 2011a
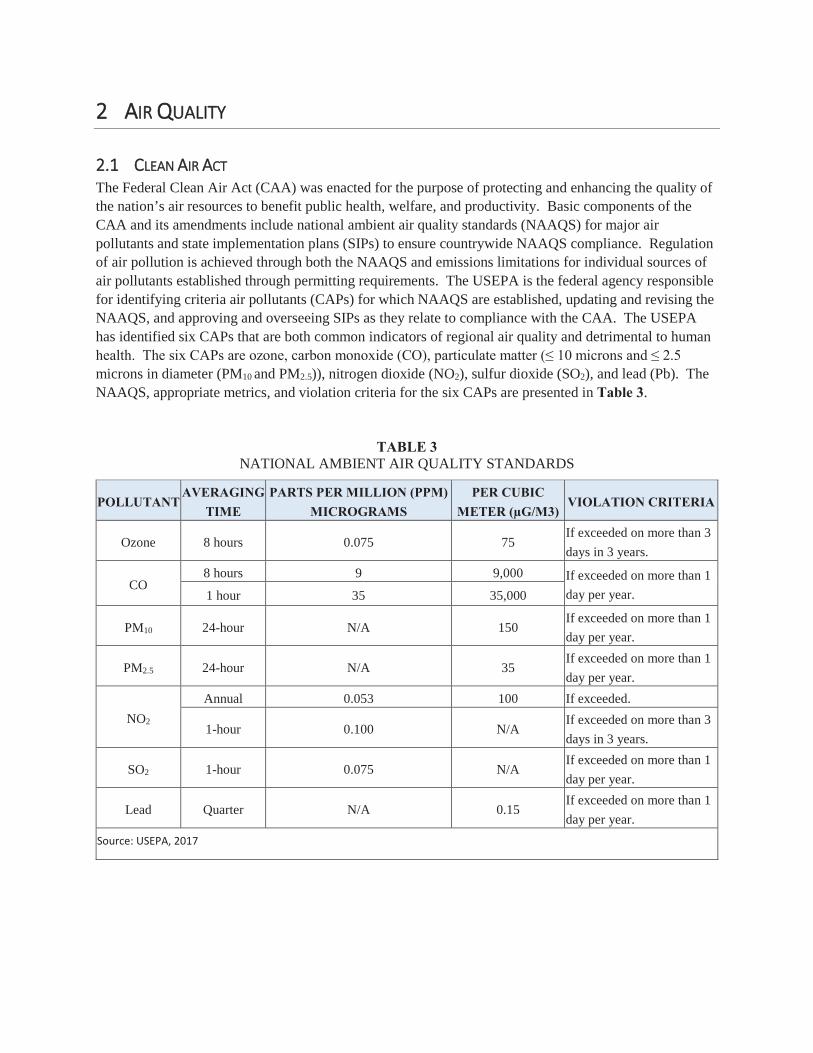
22 AIR QUALITY
2.1 CLEAN AIR ACT The Federal Clean Air Act (CAA) was enacted for the purpose of protecting and enhancing the quality of the nation’s air resources to benefit public health, welfare, and productivity. Basic components of the CAA and its amendments include national ambient air quality standards (NAAQS) for major air pollutants and state implementation plans (SIPs) to ensure countrywide NAAQS compliance. Regulation of air pollution is achieved through both the NAAQS and emissions limitations for individual sources of air pollutants established through permitting requirements. The USEPA is the federal agency responsible for identifying criteria air pollutants (CAPs) for which NAAQS are established, updating and revising the NAAQS, and approving and overseeing SIPs as they relate to compliance with the CAA. The USEPA has identified six CAPs that are both common indicators of regional air quality and detrimental to human
microns in diameter (PM10 and PM2.5)), nitrogen dioxide (NO2), sulfur dioxide (SO2), and lead (Pb). The NAAQS, appropriate metrics, and violation criteria for the six CAPs are presented in Table 3.
TABLE 3NATIONAL AMBIENT AIR QUALITY STANDARDS
POLLUTANTAVERAGING
TIMEPARTS PER MILLION (PPM)
MICROGRAMSPER CUBIC
METER (μG/M3)VIOLATION CRITERIA
Ozone 8 hours 0.075 75If exceeded on more than 3
days in 3 years.
CO8 hours 9 9,000 If exceeded on more than 1
day per year.1 hour 35 35,000
PM10 24-hour N/A 150If exceeded on more than 1
day per year.
PM2.5 24-hour N/A 35If exceeded on more than 1
day per year.
NO2
Annual 0.053 100 If exceeded.
1-hour 0.100 N/AIf exceeded on more than 3
days in 3 years.
SO2 1-hour 0.075 N/AIf exceeded on more than 1
day per year.
Lead Quarter N/A 0.15If exceeded on more than 1
day per year.
Source: USEPA, 2017
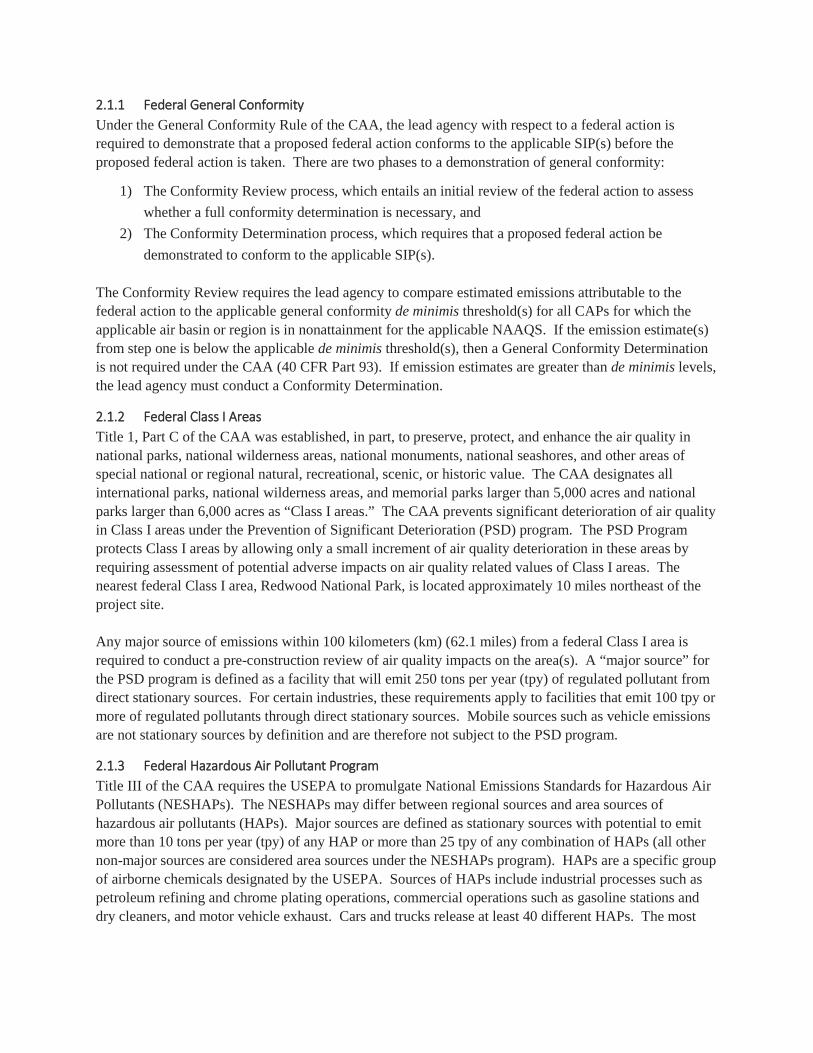
22.1.1 Federal General Conformity Under the General Conformity Rule of the CAA, the lead agency with respect to a federal action is required to demonstrate that a proposed federal action conforms to the applicable SIP(s) before the proposed federal action is taken. There are two phases to a demonstration of general conformity:
1) The Conformity Review process, which entails an initial review of the federal action to assess
whether a full conformity determination is necessary, and
2) The Conformity Determination process, which requires that a proposed federal action be
demonstrated to conform to the applicable SIP(s).
The Conformity Review requires the lead agency to compare estimated emissions attributable to the federal action to the applicable general conformity de minimis threshold(s) for all CAPs for which the applicable air basin or region is in nonattainment for the applicable NAAQS. If the emission estimate(s) from step one is below the applicable de minimis threshold(s), then a General Conformity Determination is not required under the CAA (40 CFR Part 93). If emission estimates are greater than de minimis levels, the lead agency must conduct a Conformity Determination.
2.1.2 Federal Class I Areas Title 1, Part C of the CAA was established, in part, to preserve, protect, and enhance the air quality in national parks, national wilderness areas, national monuments, national seashores, and other areas of special national or regional natural, recreational, scenic, or historic value. The CAA designates all international parks, national wilderness areas, and memorial parks larger than 5,000 acres and national parks larger than 6,000 acres as “Class I areas.” The CAA prevents significant deterioration of air quality in Class I areas under the Prevention of Significant Deterioration (PSD) program. The PSD Program protects Class I areas by allowing only a small increment of air quality deterioration in these areas by requiring assessment of potential adverse impacts on air quality related values of Class I areas. The nearest federal Class I area, Redwood National Park, is located approximately 10 miles northeast of the project site.
Any major source of emissions within 100 kilometers (km) (62.1 miles) from a federal Class I area is required to conduct a pre-construction review of air quality impacts on the area(s). A “major source” for the PSD program is defined as a facility that will emit 250 tons per year (tpy) of regulated pollutant from direct stationary sources. For certain industries, these requirements apply to facilities that emit 100 tpy or more of regulated pollutants through direct stationary sources. Mobile sources such as vehicle emissions are not stationary sources by definition and are therefore not subject to the PSD program.
2.1.3 Federal Hazardous Air Pollutant Program Title III of the CAA requires the USEPA to promulgate National Emissions Standards for Hazardous Air Pollutants (NESHAPs). The NESHAPs may differ between regional sources and area sources of hazardous air pollutants (HAPs). Major sources are defined as stationary sources with potential to emit more than 10 tons per year (tpy) of any HAP or more than 25 tpy of any combination of HAPs (all other non-major sources are considered area sources under the NESHAPs program). HAPs are a specific group of airborne chemicals designated by the USEPA. Sources of HAPs include industrial processes such as petroleum refining and chrome plating operations, commercial operations such as gasoline stations and dry cleaners, and motor vehicle exhaust. Cars and trucks release at least 40 different HAPs. The most
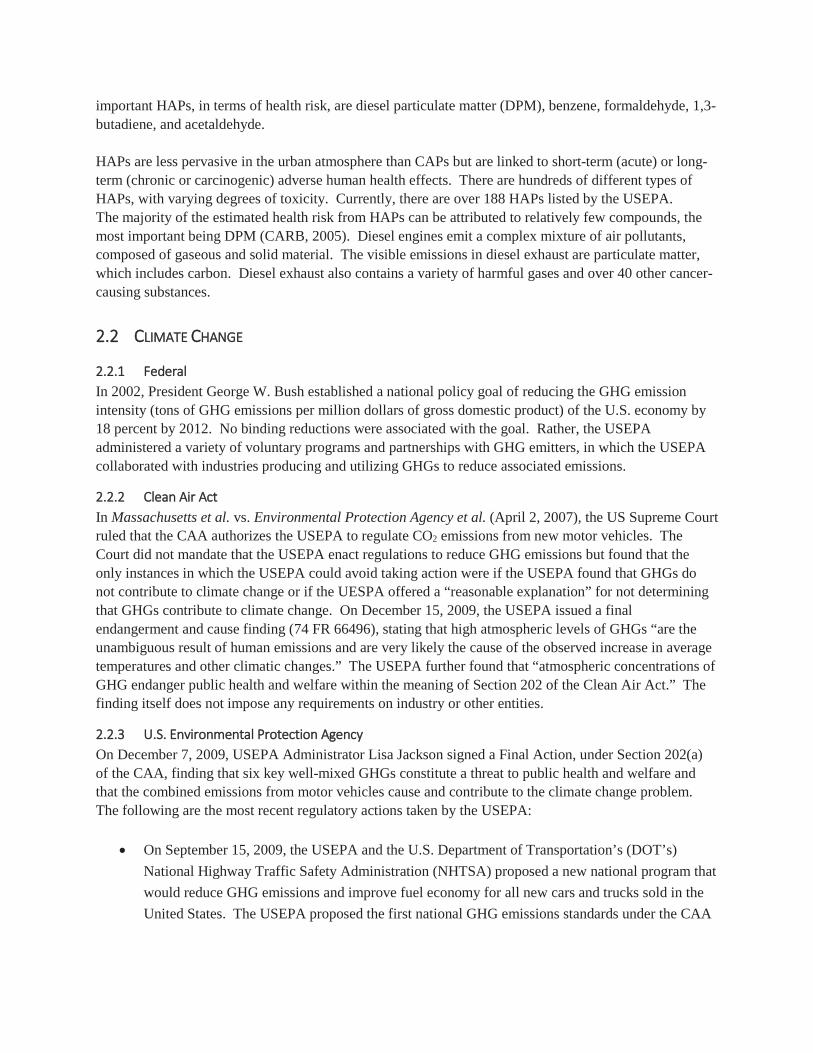
important HAPs, in terms of health risk, are diesel particulate matter (DPM), benzene, formaldehyde, 1,3-butadiene, and acetaldehyde.
HAPs are less pervasive in the urban atmosphere than CAPs but are linked to short-term (acute) or long-term (chronic or carcinogenic) adverse human health effects. There are hundreds of different types of HAPs, with varying degrees of toxicity. Currently, there are over 188 HAPs listed by the USEPA. The majority of the estimated health risk from HAPs can be attributed to relatively few compounds, the most important being DPM (CARB, 2005). Diesel engines emit a complex mixture of air pollutants, composed of gaseous and solid material. The visible emissions in diesel exhaust are particulate matter,which includes carbon. Diesel exhaust also contains a variety of harmful gases and over 40 other cancer-causing substances.
22.2 CLIMATE CHANGE
2.2.1 Federal In 2002, President George W. Bush established a national policy goal of reducing the GHG emission intensity (tons of GHG emissions per million dollars of gross domestic product) of the U.S. economy by 18 percent by 2012. No binding reductions were associated with the goal. Rather, the USEPA administered a variety of voluntary programs and partnerships with GHG emitters, in which the USEPA collaborated with industries producing and utilizing GHGs to reduce associated emissions.
2.2.2 Clean Air Act In Massachusetts et al. vs. Environmental Protection Agency et al. (April 2, 2007), the US Supreme Court ruled that the CAA authorizes the USEPA to regulate CO2 emissions from new motor vehicles. The Court did not mandate that the USEPA enact regulations to reduce GHG emissions but found that the only instances in which the USEPA could avoid taking action were if the USEPA found that GHGs do not contribute to climate change or if the UESPA offered a “reasonable explanation” for not determining that GHGs contribute to climate change. On December 15, 2009, the USEPA issued a final endangerment and cause finding (74 FR 66496), stating that high atmospheric levels of GHGs “are the unambiguous result of human emissions and are very likely the cause of the observed increase in average temperatures and other climatic changes.” The USEPA further found that “atmospheric concentrations of GHG endanger public health and welfare within the meaning of Section 202 of the Clean Air Act.” The finding itself does not impose any requirements on industry or other entities.
2.2.3 U.S. Environmental Protection Agency On December 7, 2009, USEPA Administrator Lisa Jackson signed a Final Action, under Section 202(a) of the CAA, finding that six key well-mixed GHGs constitute a threat to public health and welfare and that the combined emissions from motor vehicles cause and contribute to the climate change problem. The following are the most recent regulatory actions taken by the USEPA:
On September 15, 2009, the USEPA and the U.S. Department of Transportation’s (DOT’s)
National Highway Traffic Safety Administration (NHTSA) proposed a new national program that
would reduce GHG emissions and improve fuel economy for all new cars and trucks sold in the
United States. The USEPA proposed the first national GHG emissions standards under the CAA
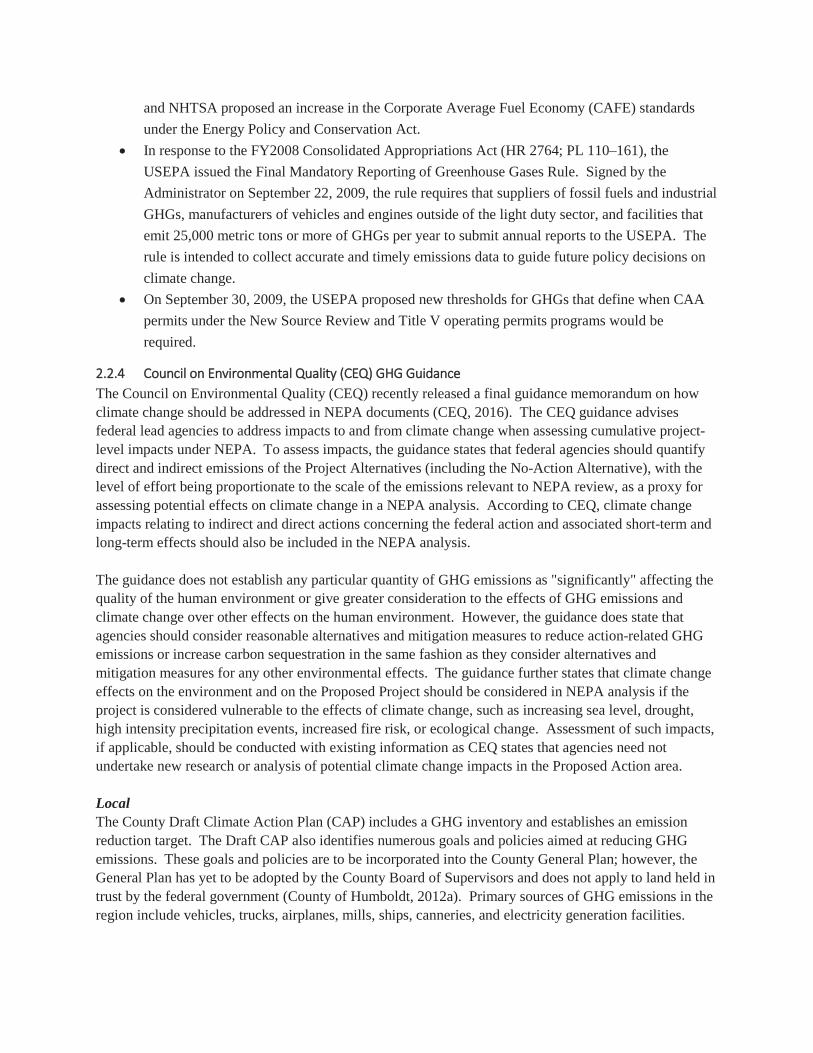
and NHTSA proposed an increase in the Corporate Average Fuel Economy (CAFE) standards
under the Energy Policy and Conservation Act.
In response to the FY2008 Consolidated Appropriations Act (HR 2764; PL 110–161), the
USEPA issued the Final Mandatory Reporting of Greenhouse Gases Rule. Signed by the
Administrator on September 22, 2009, the rule requires that suppliers of fossil fuels and industrial
GHGs, manufacturers of vehicles and engines outside of the light duty sector, and facilities that
emit 25,000 metric tons or more of GHGs per year to submit annual reports to the USEPA. The
rule is intended to collect accurate and timely emissions data to guide future policy decisions on
climate change.
On September 30, 2009, the USEPA proposed new thresholds for GHGs that define when CAA
permits under the New Source Review and Title V operating permits programs would be
required.
22.2.4 Council on Environmental Quality (CEQ) GHG Guidance The Council on Environmental Quality (CEQ) recently released a final guidance memorandum on how climate change should be addressed in NEPA documents (CEQ, 2016). The CEQ guidance advises federal lead agencies to address impacts to and from climate change when assessing cumulative project-level impacts under NEPA. To assess impacts, the guidance states that federal agencies should quantify direct and indirect emissions of the Project Alternatives (including the No-Action Alternative), with the level of effort being proportionate to the scale of the emissions relevant to NEPA review, as a proxy for assessing potential effects on climate change in a NEPA analysis. According to CEQ, climate change impacts relating to indirect and direct actions concerning the federal action and associated short-term and long-term effects should also be included in the NEPA analysis.
The guidance does not establish any particular quantity of GHG emissions as "significantly" affecting the quality of the human environment or give greater consideration to the effects of GHG emissions and climate change over other effects on the human environment. However, the guidance does state that agencies should consider reasonable alternatives and mitigation measures to reduce action-related GHG emissions or increase carbon sequestration in the same fashion as they consider alternatives and mitigation measures for any other environmental effects. The guidance further states that climate change effects on the environment and on the Proposed Project should be considered in NEPA analysis if the project is considered vulnerable to the effects of climate change, such as increasing sea level, drought, high intensity precipitation events, increased fire risk, or ecological change. Assessment of such impacts, if applicable, should be conducted with existing information as CEQ states that agencies need not undertake new research or analysis of potential climate change impacts in the Proposed Action area.
Local The County Draft Climate Action Plan (CAP) includes a GHG inventory and establishes an emission reduction target. The Draft CAP also identifies numerous goals and policies aimed at reducing GHG emissions. These goals and policies are to be incorporated into the County General Plan; however, the General Plan has yet to be adopted by the County Board of Supervisors and does not apply to land held in trust by the federal government (County of Humboldt, 2012a). Primary sources of GHG emissions in the region include vehicles, trucks, airplanes, mills, ships, canneries, and electricity generation facilities.
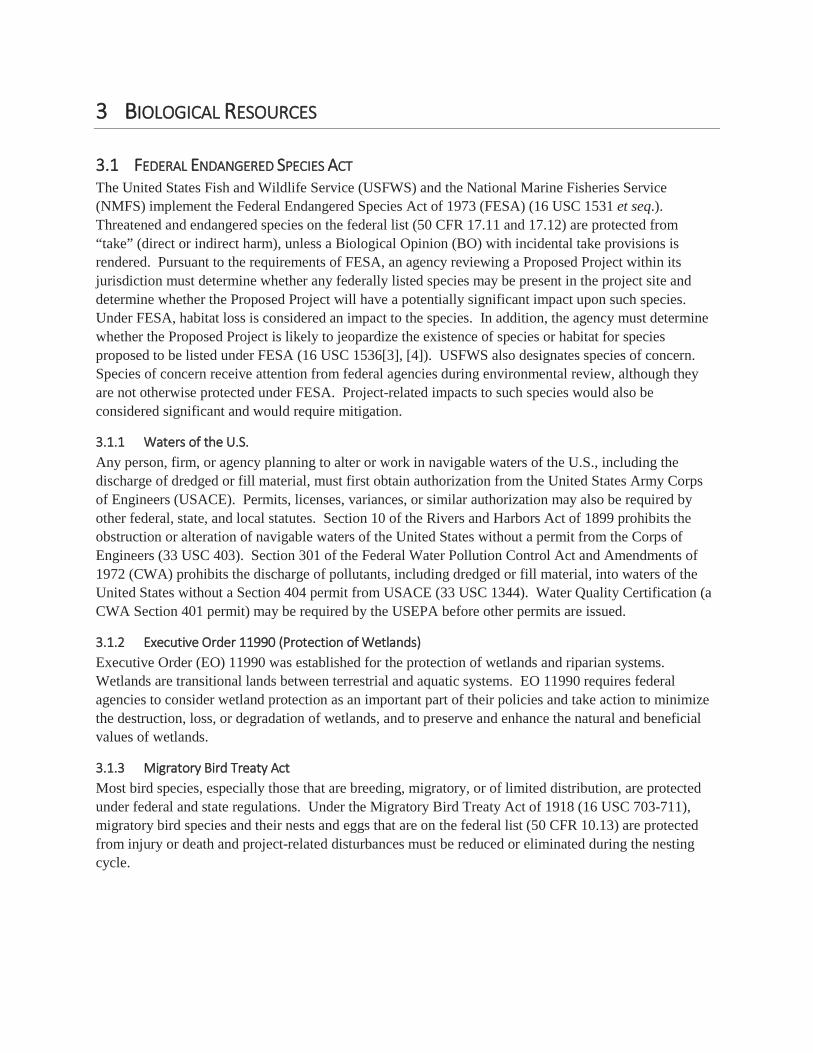
33 BIOLOGICAL RESOURCES
3.1 FEDERAL ENDANGERED SPECIES ACT The United States Fish and Wildlife Service (USFWS) and the National Marine Fisheries Service (NMFS) implement the Federal Endangered Species Act of 1973 (FESA) (16 USC 1531 et seq.). Threatened and endangered species on the federal list (50 CFR 17.11 and 17.12) are protected from “take” (direct or indirect harm), unless a Biological Opinion (BO) with incidental take provisions is rendered. Pursuant to the requirements of FESA, an agency reviewing a Proposed Project within itsjurisdiction must determine whether any federally listed species may be present in the project site and determine whether the Proposed Project will have a potentially significant impact upon such species. Under FESA, habitat loss is considered an impact to the species. In addition, the agency must determine whether the Proposed Project is likely to jeopardize the existence of species or habitat for species proposed to be listed under FESA (16 USC 1536[3], [4]). USFWS also designates species of concern. Species of concern receive attention from federal agencies during environmental review, although they are not otherwise protected under FESA. Project-related impacts to such species would also be considered significant and would require mitigation.
3.1.1 Waters of the U.S. Any person, firm, or agency planning to alter or work in navigable waters of the U.S., including the discharge of dredged or fill material, must first obtain authorization from the United States Army Corps of Engineers (USACE). Permits, licenses, variances, or similar authorization may also be required by other federal, state, and local statutes. Section 10 of the Rivers and Harbors Act of 1899 prohibits the obstruction or alteration of navigable waters of the United States without a permit from the Corps of Engineers (33 USC 403). Section 301 of the Federal Water Pollution Control Act and Amendments of 1972 (CWA) prohibits the discharge of pollutants, including dredged or fill material, into waters of the United States without a Section 404 permit from USACE (33 USC 1344). Water Quality Certification (a CWA Section 401 permit) may be required by the USEPA before other permits are issued.
3.1.2 Executive Order 11990 (Protection of Wetlands) Executive Order (EO) 11990 was established for the protection of wetlands and riparian systems. Wetlands are transitional lands between terrestrial and aquatic systems. EO 11990 requires federal agencies to consider wetland protection as an important part of their policies and take action to minimizethe destruction, loss, or degradation of wetlands, and to preserve and enhance the natural and beneficial values of wetlands.
3.1.3 Migratory Bird Treaty Act Most bird species, especially those that are breeding, migratory, or of limited distribution, are protected under federal and state regulations. Under the Migratory Bird Treaty Act of 1918 (16 USC 703-711), migratory bird species and their nests and eggs that are on the federal list (50 CFR 10.13) are protected from injury or death and project-related disturbances must be reduced or eliminated during the nesting cycle.
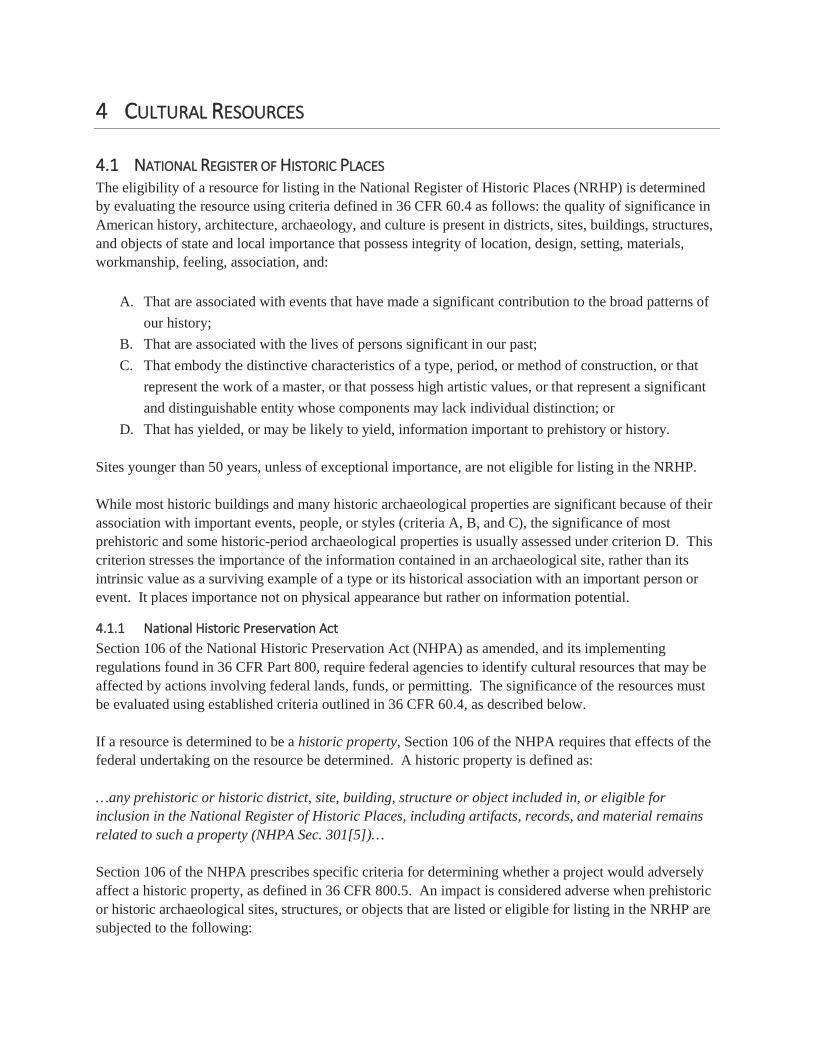
44 CULTURAL RESOURCES
4.1 NATIONAL REGISTER OF HISTORIC PLACES The eligibility of a resource for listing in the National Register of Historic Places (NRHP) is determined by evaluating the resource using criteria defined in 36 CFR 60.4 as follows: the quality of significance in American history, architecture, archaeology, and culture is present in districts, sites, buildings, structures, and objects of state and local importance that possess integrity of location, design, setting, materials, workmanship, feeling, association, and:
A. That are associated with events that have made a significant contribution to the broad patterns of
our history;
B. That are associated with the lives of persons significant in our past;
C. That embody the distinctive characteristics of a type, period, or method of construction, or that
represent the work of a master, or that possess high artistic values, or that represent a significant
and distinguishable entity whose components may lack individual distinction; or
D. That has yielded, or may be likely to yield, information important to prehistory or history.
Sites younger than 50 years, unless of exceptional importance, are not eligible for listing in the NRHP.
While most historic buildings and many historic archaeological properties are significant because of their association with important events, people, or styles (criteria A, B, and C), the significance of most prehistoric and some historic-period archaeological properties is usually assessed under criterion D. This criterion stresses the importance of the information contained in an archaeological site, rather than its intrinsic value as a surviving example of a type or its historical association with an important person or event. It places importance not on physical appearance but rather on information potential.
4.1.1 National Historic Preservation Act Section 106 of the National Historic Preservation Act (NHPA) as amended, and its implementing regulations found in 36 CFR Part 800, require federal agencies to identify cultural resources that may be affected by actions involving federal lands, funds, or permitting. The significance of the resources must be evaluated using established criteria outlined in 36 CFR 60.4, as described below.
If a resource is determined to be a historic property, Section 106 of the NHPA requires that effects of the federal undertaking on the resource be determined. A historic property is defined as:
…any prehistoric or historic district, site, building, structure or object included in, or eligible for inclusion in the National Register of Historic Places, including artifacts, records, and material remains related to such a property (NHPA Sec. 301[5])…
Section 106 of the NHPA prescribes specific criteria for determining whether a project would adversely affect a historic property, as defined in 36 CFR 800.5. An impact is considered adverse when prehistoric or historic archaeological sites, structures, or objects that are listed or eligible for listing in the NRHP are subjected to the following:

Physical destruction of or damage to all or part of the property;
Alteration of a property;
Removal of the property from its historic location;
Change of the character of the property’s use or of physical features within the property’s setting
that contribute to its historic significance;
Introduction of visual, atmospheric, or audible elements that diminish the integrity of the
property’s significant historic features;
Neglect of a property that causes its deterioration; and
Transfer, lease, or sale of the property out of federal control without adequate and legally
enforceable restrictions or conditions to ensure long-term preservation of the property’s historic
significance.
If the historic property will be adversely affected by development, then prudent and feasible measures to avoid or reduce adverse impacts must be taken. The State Historic Preservation Officer (SHPO) must be provided an opportunity to review and comment on these measures prior to project implementation.
44.2 TRADITIONAL CULTURAL PROPERTIES The 1992 amendments to the NHPA allowed for a new designation of a traditional cultural property (TCP). These amendments established "Properties of traditional religious and cultural importance to an Indian tribe or Native Hawaiian organization" might be determined eligible for inclusion in the NRHP (Section 101(d)(6) of the NHPA. Accordingly, a tribal TCP can only be significant and eligible for listing on the NRHP if it meets two criteria: 1) rooted in that community’s history; and 2) are important in maintaining the continuing cultural identity of the community.”
4.3 NATIVE AMERICAN GRAVES PROTECTION AND REPATRIATION ACT The Native American Graves Protection and Repatriation Act (NAGPRA) is a federal law passed in 1990. NAGPRA provides a process for museums and federal agencies to return certain Native American cultural items -- human remains, funerary objects, sacred objects, or objects of cultural patrimony -- to lineal descendants and culturally affiliated Indian tribes and Native Hawaiian organizations. NAGPRA includes provisions for unclaimed and culturally unidentifiable Native American cultural items, intentional and inadvertent discovery of Native American burials and cultural items on federal and tribal lands, and penalties for noncompliance and illegal trafficking.
4.4 PALEONTOLOGICAL RESOURCES PRESERVATION ACT The Paleontological Resources Preservation subtitle of the Omnibus Public Land Management Act, 16 USC 470aaa to aaa-11 requires the U.S. Department of Agriculture and the U.S. Department of the Interior to issue implementation regulations that provide for the preservation, management, and protection of paleontological resources on Federal lands and to insure that these resources are available for current and future generations to enjoy as part of America's national heritage.
Paleontological resources are defined as the traces or remains of prehistoric plants and animals. Such remains often appear as fossilized or petrified skeletal matter, imprints, or endocasts, and reside in
sedimentary rock layers. Fossils are important resources, due to their scientific and educational value. Fossil remains of vertebrates are considered significant. Invertebrate fossils are considered significant if they function as index fossils. Index fossils are those that appear in the fossil record for a relatively short and known period, allowing geologists to interpret the age range of the geological formations in which they are found.
Significance CriteriaSignificance for paleontological resources is reflected in terms of compliance with the Antiquities Act of 1906 (PL 59-209; 16 USC 431 et seq.; 34 Stat. 225), which calls for the protection of historic landmarks, historic and prehistoric structures, and other objects of historic or scientific interest on federal land. Additional provisions appear in the Archaeological and Historic Data Preservation Act of 1974, as amended, for the survey, recovery, and preservation of significant scientific, prehistoric, historic, archaeological, or paleontological data, in such cases wherein this type of data might be otherwise destroyed or irrecoverably lost because of federal projects.
55 SOCIOECONOMIC CONDITIONS/ENVIRONMENTAL JUSTICE
On February 11, 1994, President Clinton issued EO 12898, “Federal Actions to Address Environmental Justice in Minority Populations and Low-Income Populations” and an accompanying Presidential Memorandum to focus federal attention on the environmental and human health conditions in minority communities and low-income communities. EO 12898, as amended, directs federal agencies to develop an Environmental Justice Strategy that identifies and addresses disproportionately high human health or environmental effects of their programs, policies, and activities on minority populations and low-income populations. Compliance with EO 12898 has been incorporated into the NEPA compliance requirements of the BIA for the Proposed Action.

66 LAND USE
6.1 REGULATORY SETTING The Nation’s coastal waters are protected by the federal Coastal Zone Management Act (CZMA) of 1972, which is administered by the National Oceanic and Atmospheric Administration (NOAA) within the Department of Commerce. In California, the CZMA is administered by the California Coastal Commission (CCC), which was established by voter initiative and made permanent by the California Coastal Act of 1976. The CCC carries out its statutory responsibilities largely through the review and approval of local coastal programs (LCPs). The Coastal Zone is defined by the California Coastal Act as "the land and water area of the State of California from the Oregon Border to the border of the Republic of Mexico," as officially mapped on 7.5-minute USGS quadrangle maps and adopted by the CCC. The CZMA states that “excluded from the coastal zone are lands of which is held in trust by the federal government.” Therefore, the project site is not considered part of the Coastal Zone.
Title 15 CFR Part 930 requires federal consistency determinations for projects directly or indirectly affecting any coastal use or resource. Federal consistency determinations stem from the CZMA requirement that federal actions (that are reasonably likely to affect any land or water use or natural resource of the Coastal Zone) be consistent with the enforceable policies of a coastal State's or territory's federally approved Coastal Management Program (“State CMP” or “CMP”). Federal actions include: (1) direct federal actions--activities and development projects performed by a federal agency or a contractor for the benefit of a federal agency; and (2) indirect federal actions--activities not performed by a federal agency, but requiring federal permits or licenses or other forms of federal approval and federal financial assistance to states, territories, and local governments.
The objective is to ensure that federal agencies and applicants for federal approvals and funding adequately consider and comply with State CMPs. Under CZMA Sec. 307(C), each federal agency shall provide a consistency determination to the relevant State agency designated at the earliest practical time but in no case later than 90 days before final approval of the federal activity (unless both the federal agency and the State agency agree to a different schedule).
77 AGRICULTURE
7.1 WILLIAMSON ACT PROVISIONS Under the provisions of the Williamson Act (California Land Conservation Act 1965, Section 51200), landowners contract with the County to maintain agricultural or open space use of their lands in return for reduced property tax assessment. Withdrawal involves a ten-year period of tax adjustment to full market value before protected open space can be converted to urban uses. Consequently, land under a Williamson Act Contract can be in either a non-renewal status or a renewal status. Lands with a non-renewal status indicate the owner has withdrawn from the Williamson Act Contract and is waiting for a period of tax adjustment for the land to reach its full market value for tax purposes.
7.2 FARMLAND PROTECTION POLICY ACT The goal of the Farmland Protection Policy Act (FPPA) is to minimize the extent that federal actions and programs result in the conversion of agricultural lands to non-agricultural uses. Pursuant to the FPPA, theFarmland Conversion Rating Form (Form AD 1006) is used to determine the value of the farmland under consideration and the level of protection such land should receive.
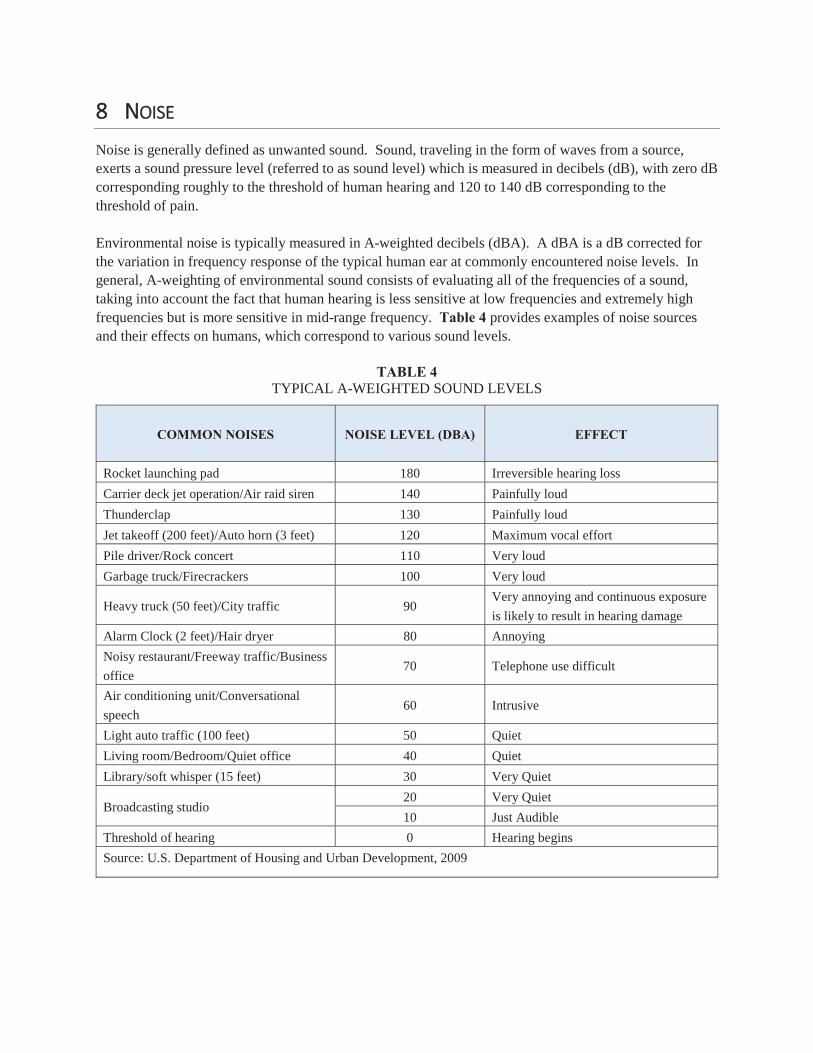
88 NOISE Noise is generally defined as unwanted sound. Sound, traveling in the form of waves from a source, exerts a sound pressure level (referred to as sound level) which is measured in decibels (dB), with zero dB corresponding roughly to the threshold of human hearing and 120 to 140 dB corresponding to the threshold of pain.
Environmental noise is typically measured in A-weighted decibels (dBA). A dBA is a dB corrected for the variation in frequency response of the typical human ear at commonly encountered noise levels. In general, A-weighting of environmental sound consists of evaluating all of the frequencies of a sound, taking into account the fact that human hearing is less sensitive at low frequencies and extremely high frequencies but is more sensitive in mid-range frequency. Table 4 provides examples of noise sourcesand their effects on humans, which correspond to various sound levels.
TABLE 4TYPICAL A-WEIGHTED SOUND LEVELS
COMMON NOISES NOISE LEVEL (DBA) EFFECT
Rocket launching pad 180 Irreversible hearing loss
Carrier deck jet operation/Air raid siren 140 Painfully loud
Thunderclap 130 Painfully loud
Jet takeoff (200 feet)/Auto horn (3 feet) 120 Maximum vocal effort
Pile driver/Rock concert 110 Very loud
Garbage truck/Firecrackers 100 Very loud
Heavy truck (50 feet)/City traffic 90Very annoying and continuous exposure
is likely to result in hearing damage
Alarm Clock (2 feet)/Hair dryer 80 Annoying
Noisy restaurant/Freeway traffic/Business
office70 Telephone use difficult
Air conditioning unit/Conversational
speech60 Intrusive
Light auto traffic (100 feet) 50 Quiet
Living room/Bedroom/Quiet office 40 Quiet
Library/soft whisper (15 feet) 30 Very Quiet
Broadcasting studio20 Very Quiet
10 Just Audible
Threshold of hearing 0 Hearing begins
Source: U.S. Department of Housing and Urban Development, 2009

88.1 NOISE EXPOSURE AND COMMUNITY NOISE An individual’s noise exposure is a measure of noise over a period. A noise level is a measure of noise at a given instant in time. However, community noise varies continuously over a period with respect to the contributing sound sources in the community noise environment. What makes community noise constantly variable throughout a day is the addition of short duration, single event noise sources such asaircraft flyovers, vehicle passbys, sirens, etc. that are readily identifiable to the individual. Thesesuccessive additions of sound to the community noise environment vary the community noise level from instant to instant, requiring the measurement of noise exposure over a period to legitimately characterize a community noise environment and evaluate cumulative noise impacts. This time-varying characteristic of environmental noise is described using statistical noise descriptors. The noise descriptors used in this EA are summarized below:
Leq: the equivalent sound level (Leq) is used to describe noise over a specified period, typically
one hour, in terms of a single numerical value. Leq is the constant sound level which would
contain the same acoustic energy as the varying sound level during the same period (i.e. the
average noise exposure level for the given time period).
Ldn: 24-hour day and night A-weighed noise exposure level (Ldn), which accounts for the greater
sensitivity of most people to nighttime noise by weighting noise levels at night (“penalizing”
nighttime noises). Noise between 10:00 PM and 7:00 AM is weighted (penalized) by adding 10
dB to take into account the greater annoyance of nighttime noises.
CNEL: similar to the Ldn, the Community Noise Equivalent Level (CNEL) adds a 5-dB
“penalty” for the evening hours between 7:00 PM and 10:00 PM, in addition to a 10-dBA penalty
between the hours of 10:00 PM and 7:00 AM.
A wide variation in individual thresholds of annoyance exists and different tolerances to noise tend to develop based on an individual’s past experiences with noise. Thus, an important way of predicting a human reaction to a new noise environment is the way it compares to the existing environment to which one has adapted: the “ambient noise” level. In general, the more a new noise exceeds the previously existing ambient noise level, the less acceptable the new noise will be judged by those hearing it. With regard to increases in A-weighted noise level, the following relationships occur:
Except in carefully controlled laboratory experiments, a change of 1 dBA cannot be perceived;
Outside of the laboratory, a 3-dBA change is considered a just-perceivable difference;
A change in level of at least 5 dBA is required before any noticeable change in human response
would be expected; and
A 10-dBA change is subjectively heard as approximately a doubling in loudness and can cause
adverse response, depending on the existing ambient noise level.
8.2 NOISE STANDARDS Noise standards used in this study include the Federal Highway Administration (FHWA) Noise Abatement Criteria (NAC) for the assessment of noise consequences related to surface traffic and the noise impact criteria established by the County noise policy. These standards are discussed below.
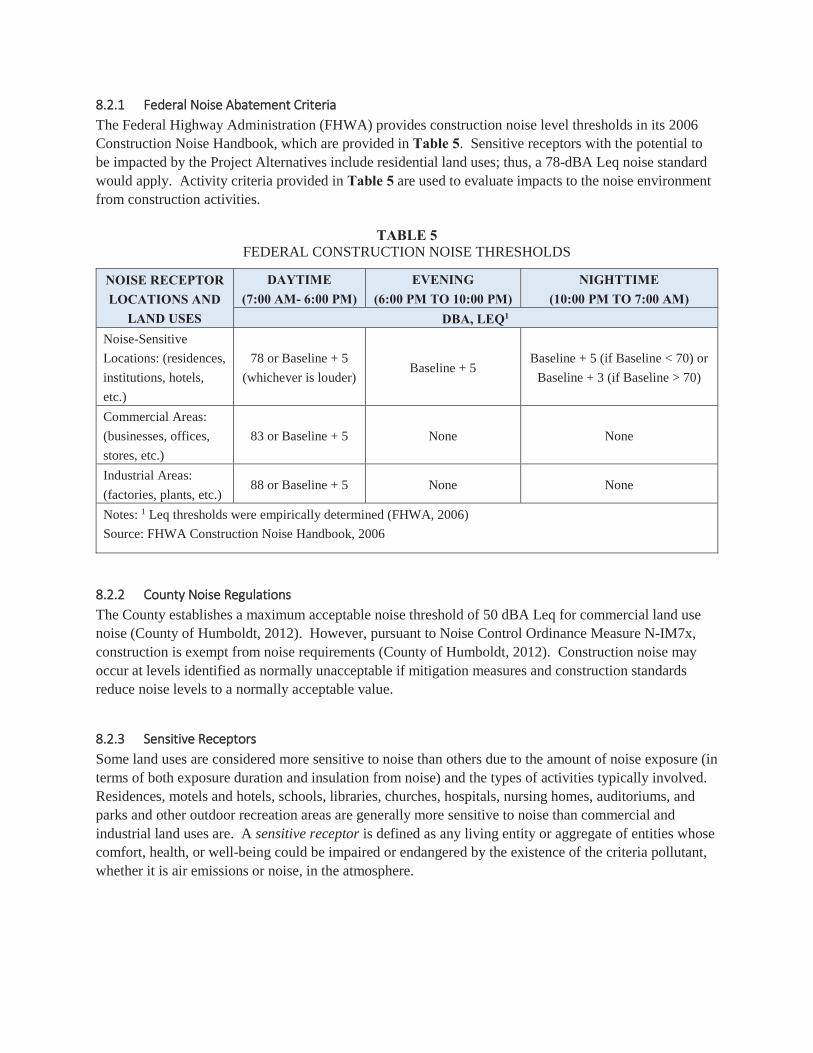
88.2.1 Federal Noise Abatement Criteria The Federal Highway Administration (FHWA) provides construction noise level thresholds in its 2006Construction Noise Handbook, which are provided in Table 5. Sensitive receptors with the potential tobe impacted by the Project Alternatives include residential land uses; thus, a 78-dBA Leq noise standard would apply. Activity criteria provided in Table 5 are used to evaluate impacts to the noise environment from construction activities.
TABLE 5FEDERAL CONSTRUCTION NOISE THRESHOLDS
NOISE RECEPTOR LOCATIONS AND
LAND USES
DAYTIME(7:00 AM- 6:00 PM)
EVENING(6:00 PM TO 10:00 PM)
NIGHTTIME(10:00 PM TO 7:00 AM)
DBA, LEQ1
Noise-Sensitive
Locations: (residences,
institutions, hotels,
etc.)
78 or Baseline + 5
(whichever is louder)Baseline + 5
Baseline + 5 (if Baseline < 70) or
Baseline + 3 (if Baseline > 70)
Commercial Areas:
(businesses, offices,
stores, etc.)
83 or Baseline + 5 None None
Industrial Areas:
(factories, plants, etc.)88 or Baseline + 5 None None
Notes: 1 Leq thresholds were empirically determined (FHWA, 2006)
Source: FHWA Construction Noise Handbook, 2006
8.2.2 County Noise Regulations The County establishes a maximum acceptable noise threshold of 50 dBA Leq for commercial land usenoise (County of Humboldt, 2012). However, pursuant to Noise Control Ordinance Measure N-IM7x, construction is exempt from noise requirements (County of Humboldt, 2012). Construction noise may occur at levels identified as normally unacceptable if mitigation measures and construction standards reduce noise levels to a normally acceptable value.
8.2.3 Sensitive Receptors Some land uses are considered more sensitive to noise than others due to the amount of noise exposure (in terms of both exposure duration and insulation from noise) and the types of activities typically involved. Residences, motels and hotels, schools, libraries, churches, hospitals, nursing homes, auditoriums, and parks and other outdoor recreation areas are generally more sensitive to noise than commercial and industrial land uses are. A sensitive receptor is defined as any living entity or aggregate of entities whose comfort, health, or well-being could be impaired or endangered by the existence of the criteria pollutant, whether it is air emissions or noise, in the atmosphere.

APPENDIX ECALEEMOD FILES

CalE
EMod
Inpu
ts
TRED
C H
otel
Pro
ject
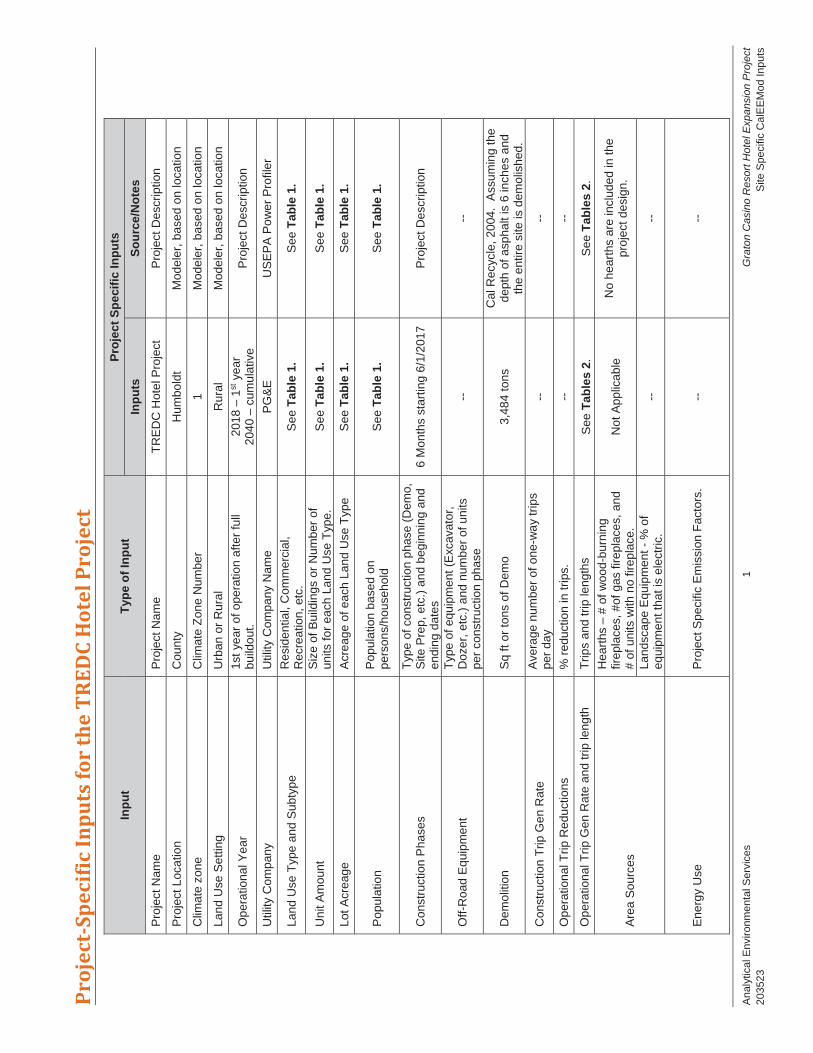
Ana
lytic
al E
nvir
onm
enta
l Ser
vice
s 1
Gra
ton
Cas
ino
Res
ort H
otel
Exp
ansi
on P
roje
ct
2035
23
S
ite S
peci
fic C
alE
EM
od In
puts
Proj
ect-
Spec
ific
Inpu
ts fo
r th
e TR
EDC
Hot
el P
roje
ct
Inp
ut
Typ
e o
f In
pu
t P
roje
ct S
pec
ific
Inp
uts
Inp
uts
S
ou
rce/
No
tes
Pro
ject
Nam
e
Pro
ject
Nam
e
TR
ED
C H
otel
Pro
ject
P
roje
ct D
escr
iptio
n
Pro
ject
Loc
atio
n
Cou
nty
Hum
bold
t M
odel
er, b
ased
on
loca
tion
Clim
ate
zone
C
limat
e Z
one
Num
ber
1 M
odel
er, b
ased
on
loca
tion
Land
Use
Set
ting
U
rban
or
Rur
al
Rur
al
Mod
eler
, bas
ed o
n lo
catio
n
Ope
ratio
nal Y
ear
1s
t ye
ar o
f ope
ratio
n af
ter
full
build
out.
2018
– 1
st y
ear
2040
– c
umul
ativ
e P
roje
ct D
escr
iptio
n
Util
ity C
ompa
ny
Util
ity C
ompa
ny N
ame
P
G&
E
US
EP
A P
ow
er P
rofil
er
Land
Use
Typ
e an
d S
ubty
pe
R
esid
entia
l, C
omm
erci
al,
Rec
reat
ion,
etc
. S
ee T
able
1.
S
ee T
able
1.
Uni
t Am
ount
Siz
e of
Bui
ldin
gs o
r N
umbe
r of
un
its fo
r ea
ch L
and
Use
Typ
e.
See
Tab
le 1
.
See
Tab
le 1
.
Lot
Acr
eag
e
Acr
eag
e of
eac
h La
nd U
se T
ype
See
Tab
le 1
. S
ee T
able
1.
Pop
ulat
ion
P
opul
atio
n ba
sed
on
pers
ons/
hous
ehol
d
See
Tab
le 1
. S
ee T
able
1.
Con
stru
ctio
n P
hase
s
Typ
e of
con
stru
ctio
n ph
ase
(Dem
o,
Site
Pre
p, e
tc.)
and
beg
inni
ng a
nd
endi
ng d
ates
6
Mon
ths
star
ting
6/1/
2017
P
roje
ct D
escr
iptio
n
Off
-Roa
d E
quip
men
t
Typ
e of
equ
ipm
ent
(Exc
avat
or,
Doz
er, e
tc.)
and
num
ber
of u
nits
pe
r co
nstr
uctio
n ph
ase
--
--
Dem
oliti
on
Sq
ft or
tons
of D
emo
3,
484
tons
C
al R
ecyc
le, 2
004.
A
ssum
ing
the
dept
h of
asp
halt
is 6
inch
es a
nd
the
entir
e si
te is
dem
olis
hed.
Con
stru
ctio
n T
rip G
en R
ate
A
vera
ge n
umb
er o
f one
-wa
y tr
ips
per
day
--
--
Ope
ratio
nal T
rip R
educ
tions
%
red
uctio
n in
trip
s.
--
--
Ope
ratio
nal T
rip G
en R
ate
and
trip
leng
th
Trip
s an
d tr
ip le
ngth
s
See
Tab
les
2.
See
Tab
les
2.
Are
a S
ourc
es
Hea
rths
– #
of
woo
d-bu
rnin
g fir
epla
ces,
#of
gas
fire
plac
es,
and
# of
uni
ts w
ith n
o fir
epla
ce.
Not
App
licab
le
No
hear
ths
are
incl
uded
in th
e pr
ojec
t des
ign.
Land
scap
e E
quip
men
t -
% o
f eq
uipm
ent t
hat i
s el
ectr
ic.
--
--
Ene
rgy
Use
P
roje
ct S
peci
fic E
mis
sion
Fac
tors
. --
--
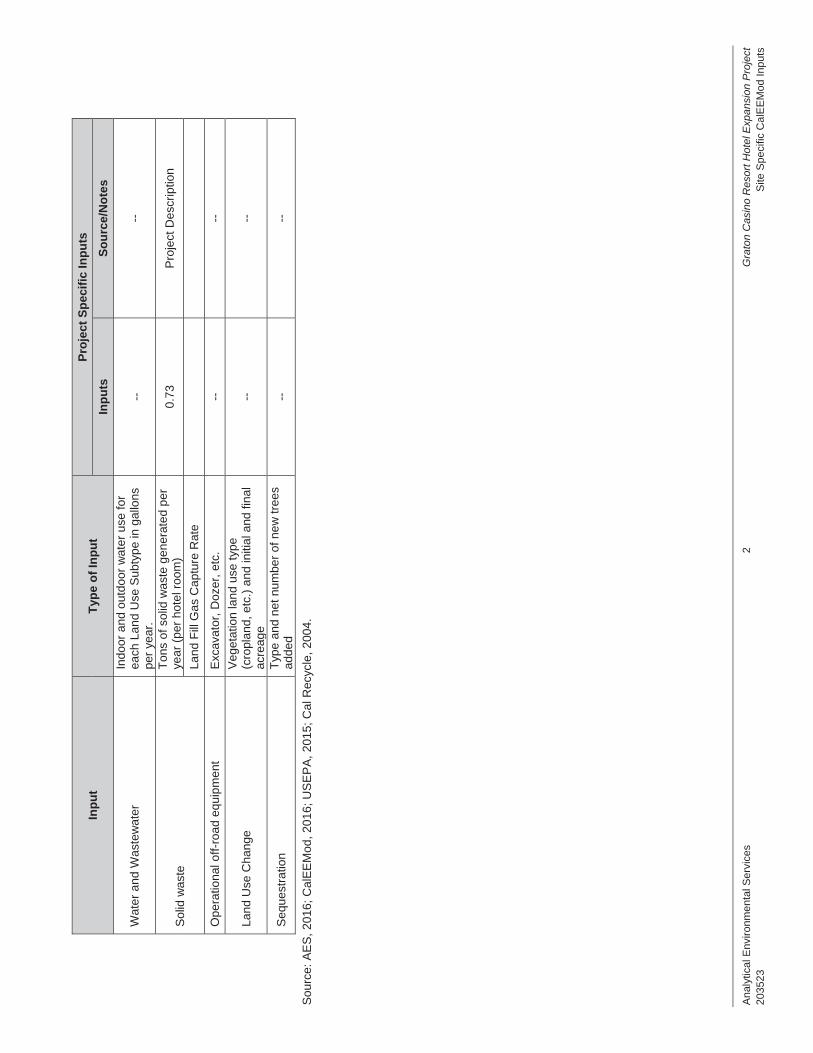
Ana
lytic
al E
nvir
onm
enta
l Ser
vice
s 2
Gra
ton
Cas
ino
Res
ort H
otel
Exp
ansi
on P
roje
ct
2035
23
S
ite S
peci
fic C
alE
EM
od I
nput
s
Inp
ut
Typ
e o
f In
pu
t P
roje
ct S
pec
ific
Inp
uts
Inp
uts
S
ou
rce/
No
tes
Wat
er a
nd W
aste
wat
er
Indo
or a
nd o
utdo
or w
ater
use
for
each
Lan
d U
se S
ubty
pe in
gal
lons
pe
r ye
ar.
--
--
Sol
id w
aste
Ton
s of
sol
id w
aste
gen
erat
ed p
er
year
(pe
r ho
tel r
oom
) 0.
73
Pro
ject
Des
crip
tion
Land
Fill
Gas
Cap
ture
Rat
e
Ope
ratio
nal o
ff-ro
ad e
quip
men
t E
xcav
ator
, Doz
er, e
tc.
--
--
Land
Use
Cha
nge
V
eget
atio
n la
nd u
se t
ype
(cro
plan
d, e
tc.)
and
initi
al a
nd f
inal
ac
reag
e --
--
Seq
uest
ratio
n
Typ
e an
d ne
t nu
mbe
r of
ne
w t
rees
ad
ded
--
--
Sou
rce:
AE
S, 2
016;
Cal
EE
Mod
, 20
16;
US
EP
A,
2015
; Cal
Rec
ycle
, 200
4.
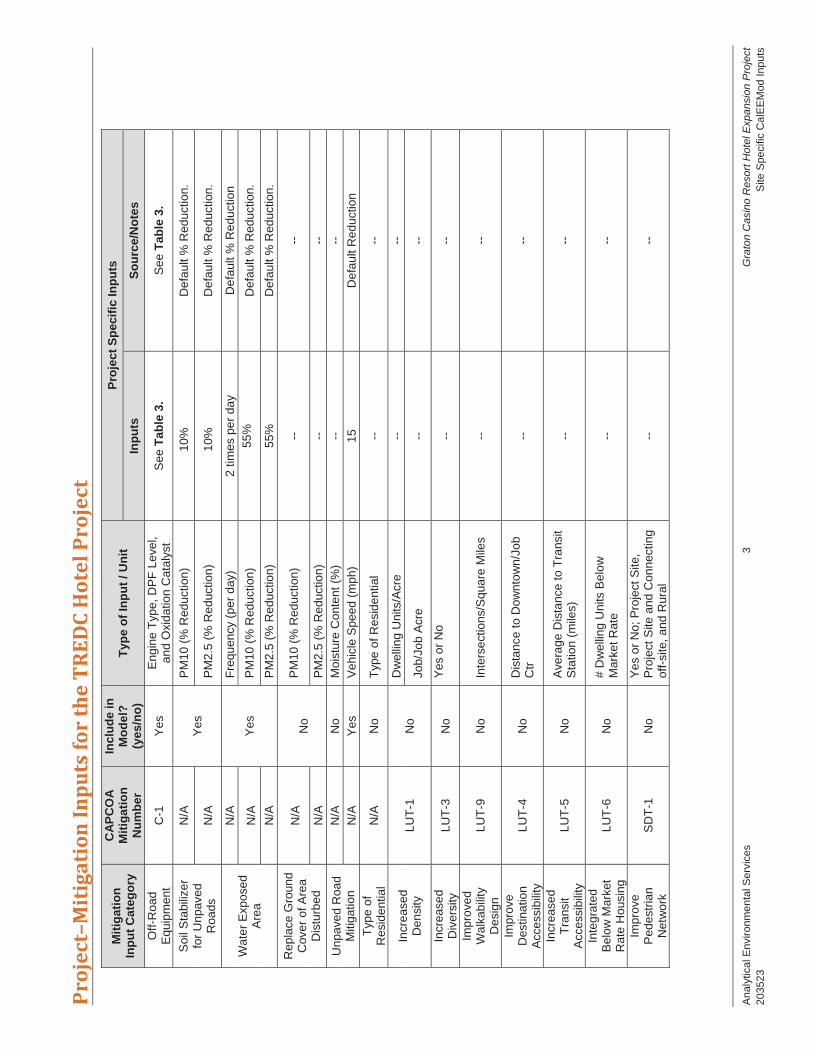
Ana
lytic
al E
nvir
onm
enta
l Ser
vice
s 3
Gra
ton
Cas
ino
Res
ort H
otel
Exp
ansi
on P
roje
ct
2035
23
S
ite S
peci
fic C
alE
EM
od I
nput
s
Proj
ect–
Mit
igat
ion
Inpu
ts fo
r th
e TR
EDC
Hot
el P
roje
ct
Mit
igat
ion
In
pu
t C
ateg
ory
CA
PC
OA
M
itig
atio
n
Nu
mb
er
Incl
ud
e in
M
od
el?
(y
es/n
o)
Typ
e o
f In
pu
t / U
nit
P
roje
ct S
pec
ific
Inp
uts
Inp
uts
S
ou
rce/
No
tes
Off-
Roa
d E
quip
men
t C
-1
Yes
E
ngin
e T
ype,
DP
F L
evel
, an
d O
xida
tion
Cat
alys
t S
ee T
able
3.
See
Tab
le 3
.
Soi
l Sta
biliz
er
for
Unp
aved
R
oads
N/A
Y
es
PM
10 (
% R
educ
tion)
10
%
Def
ault
% R
educ
tion.
N/A
P
M2.
5 (%
Red
uctio
n)
10%
D
efau
lt %
Red
uctio
n.
Wat
er E
xpos
ed
Are
a
N/A
Yes
Fre
quen
cy (
per
day)
2
times
per
day
D
efau
lt %
Red
uctio
n
N/A
P
M10
(%
Red
uctio
n)
55%
D
efau
lt %
Red
uctio
n.
N/A
P
M2.
5 (%
Red
uctio
n)
55%
D
efau
lt %
Red
uctio
n.
Rep
lace
Gro
und
Cov
er o
f Are
a D
istu
rbed
N/A
N
o
PM
10 (
% R
educ
tion)
--
--
N/A
P
M2.
5 (%
Red
uctio
n)
--
--
Unp
aved
Roa
d M
itiga
tion
N
/A
No
M
oist
ure
Con
tent
(%
)
--
--
N/A
Y
es
Veh
icle
Spe
ed (
mph
)
15
Def
ault
Red
uctio
n
Typ
e of
R
esid
entia
l N
/A
No
Typ
e of
Res
iden
tial
--
--
Incr
ease
d D
ensi
ty
LUT
-1
No
D
wel
ling
Uni
ts/A
cre
--
--
Job/
Job
Acr
e
--
--
Incr
ease
d D
iver
sity
LU
T-3
N
o
Yes
or
No
--
--
Impr
oved
W
alka
bilit
y D
esig
n
LUT
-9
No
In
ters
ectio
ns/S
quar
e M
iles
--
--
Impr
ove
Des
tinat
ion
Acc
essi
bilit
y
LUT
-4
No
D
ista
nce
to D
ownt
ow
n/Jo
b C
tr
--
--
Incr
ease
d T
rans
it A
cces
sibi
lity
LU
T-5
N
o
Ave
rage
Dis
tanc
e to
Tra
nsit
Sta
tion
(mile
s)
--
--
Inte
grat
ed
Bel
ow
Mar
ket
Rat
e H
ousi
ng
LUT
-6
No
#
Dw
ellin
g U
nits
Bel
ow
M
arke
t R
ate
--
--
Impr
ove
Ped
estr
ian
Net
wor
k S
DT
-1
No
Yes
or
No;
Pro
ject
Site
, P
roje
ct S
ite a
nd C
onne
ctin
g of
f-si
te, a
nd R
ural
--
--
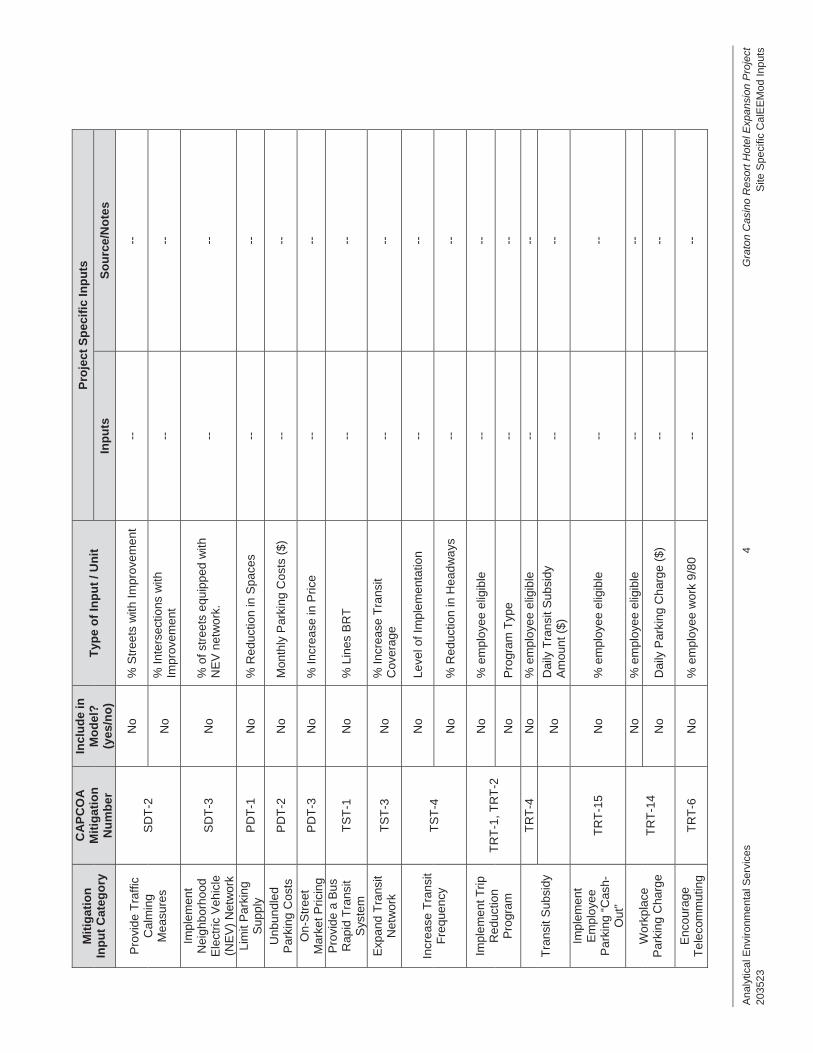
Ana
lytic
al E
nvir
onm
enta
l Ser
vice
s 4
Gra
ton
Cas
ino
Res
ort H
otel
Exp
ansi
on P
roje
ct
2035
23
S
ite S
peci
fic C
alE
EM
od I
nput
s
Mit
igat
ion
In
pu
t C
ateg
ory
CA
PC
OA
M
itig
atio
n
Nu
mb
er
Incl
ud
e in
M
od
el?
(y
es/n
o)
Typ
e o
f In
pu
t / U
nit
P
roje
ct S
pec
ific
Inp
uts
Inp
uts
S
ou
rce/
No
tes
Pro
vide
Tra
ffic
Cal
min
g M
easu
res
SD
T-2
N
o
% S
tree
ts w
ith Im
prov
emen
t --
--
No
%
Inte
rsec
tions
with
Im
prov
emen
t --
--
Impl
emen
t N
eigh
borh
ood
Ele
ctric
Veh
icle
(N
EV
) N
etw
ork
SD
T-3
N
o %
of
stre
ets
equi
pped
with
N
EV
net
wor
k.
--
--
Lim
it P
arki
ng
Sup
ply
PD
T-1
N
o
% R
educ
tion
in S
pace
s --
--
Unb
undl
ed
Par
king
Cos
ts
PD
T-2
N
o M
onth
ly P
arki
ng C
osts
($)
--
--
On-
Str
eet
Mar
ket
Pric
ing
P
DT
-3
No
% In
crea
se in
Pric
e --
--
Pro
vide
a B
us
Rap
id T
rans
it S
yste
m
TS
T-1
N
o
% L
ines
BR
T
--
--
Exp
and
Tra
nsit
Net
wor
k T
ST
-3
No
%
Incr
ease
Tra
nsit
Cov
erag
e
--
--
Incr
ease
Tra
nsit
Fre
que
ncy
T
ST
-4
No
Le
vel o
f Im
plem
enta
tion
--
--
No
%
Red
uctio
n in
Hea
dw
ays
--
--
Impl
emen
t Trip
R
educ
tion
Pro
gram
T
RT
-1, T
RT
-2
No
%
em
ploy
ee e
ligib
le
--
--
No
P
rogr
am T
ype
--
--
Tra
nsit
Sub
sidy
T
RT
-4
No
%
em
ploy
ee e
ligib
le
--
--
N
o
Dai
ly T
rans
it S
ubsi
dy
Am
ount
($)
--
--
Impl
emen
t E
mpl
oye
e P
arki
ng “
Cas
h-O
ut”
TR
T-1
5 N
o
% e
mpl
oyee
elig
ible
--
--
Wor
kpla
ce
Par
king
Cha
rge
T
RT
-14
No
%
em
ploy
ee e
ligib
le
--
--
No
D
aily
Par
king
Cha
rge
($)
--
--
Enc
oura
ge
Tel
ecom
mut
ing
TR
T-6
N
o
% e
mpl
oyee
wor
k 9/
80
--
--
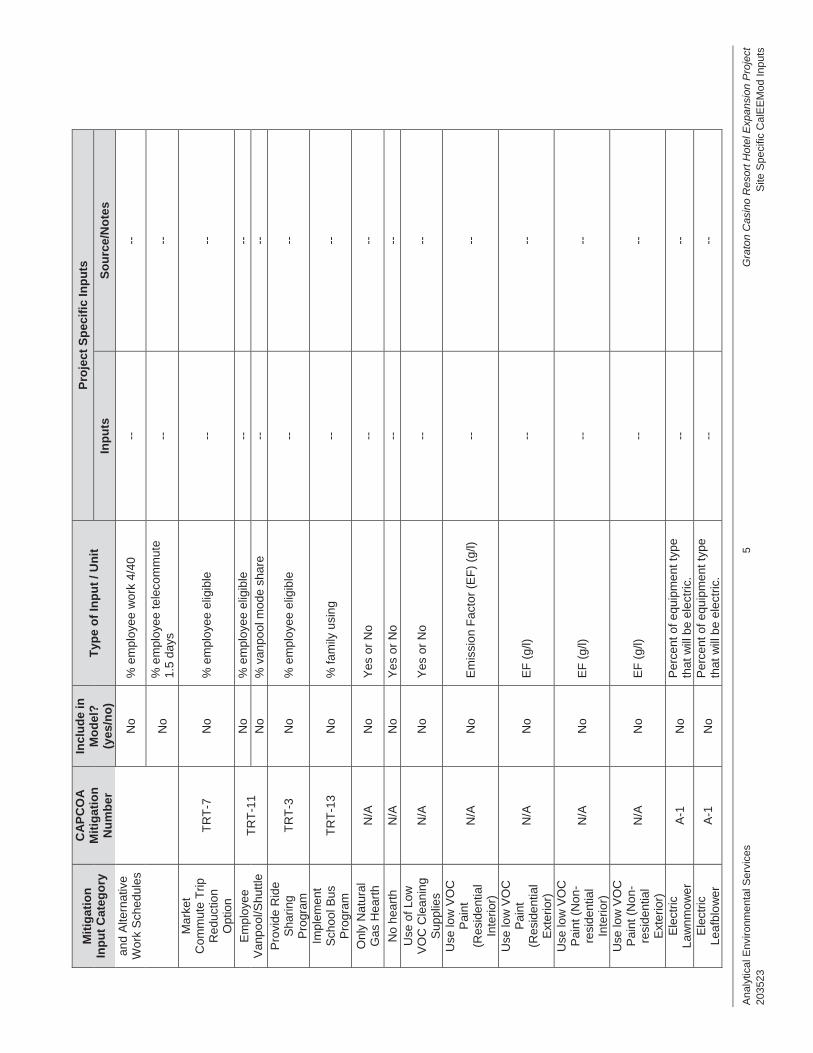
Ana
lytic
al E
nvir
onm
enta
l Ser
vice
s 5
Gra
ton
Cas
ino
Res
ort H
otel
Exp
ansi
on P
roje
ct
2035
23
S
ite S
peci
fic C
alE
EM
od I
nput
s
Mit
igat
ion
In
pu
t C
ateg
ory
CA
PC
OA
M
itig
atio
n
Nu
mb
er
Incl
ud
e in
M
od
el?
(y
es/n
o)
Typ
e o
f In
pu
t / U
nit
P
roje
ct S
pec
ific
Inp
uts
Inp
uts
S
ou
rce/
No
tes
and
Alte
rnat
ive
Wor
k S
ched
ules
N
o
% e
mpl
oyee
wor
k 4/
40
--
--
No
%
em
ploy
ee te
leco
mm
ute
1.5
days
--
--
Mar
ket
Com
mut
e T
rip
Red
uctio
n O
ptio
n
TR
T-7
N
o
% e
mpl
oyee
elig
ible
--
--
Em
plo
yee
Van
pool
/Shu
ttle
T
RT
-11
No
%
em
ploy
ee e
ligib
le
--
--
No
%
van
pool
mod
e sh
are
--
--
P
rovi
de R
ide
Sha
ring
Pro
gram
T
RT
-3
No
%
em
ploy
ee e
ligib
le
--
--
Impl
emen
t S
choo
l Bus
P
rogr
am
TR
T-1
3 N
o
% fa
mily
usi
ng
--
--
Onl
y N
atur
al
Gas
Hea
rth
N
/A
No
Yes
or
No
--
--
No
hear
th
N/A
N
o
Yes
or
No
--
--
Use
of L
ow
V
OC
Cle
anin
g S
uppl
ies
N
/A
No
Yes
or
No
--
--
Use
low
VO
C
Pai
nt
(Res
iden
tial
Inte
rior)
N/A
N
o E
mis
sion
Fac
tor
(EF
) (g
/l)
--
--
Use
low
VO
C
Pai
nt
(Res
iden
tial
Ext
erio
r)
N/A
N
o E
F (
g/l)
--
--
Use
low
VO
C
Pai
nt (
Non
-re
side
ntia
l In
terio
r)
N/A
N
o E
F (
g/l)
--
--
Use
low
VO
C
Pai
nt (
Non
-re
side
ntia
l E
xter
ior)
N/A
N
o E
F (
g/l)
--
--
Ele
ctric
La
wn
mo
we
r
A-1
N
o P
erce
nt o
f equ
ipm
ent t
ype
that
will
be
elec
tric
. --
--
Ele
ctric
Le
afbl
ow
er
A-1
N
o P
erce
nt o
f equ
ipm
ent t
ype
that
will
be
elec
tric
. --
--
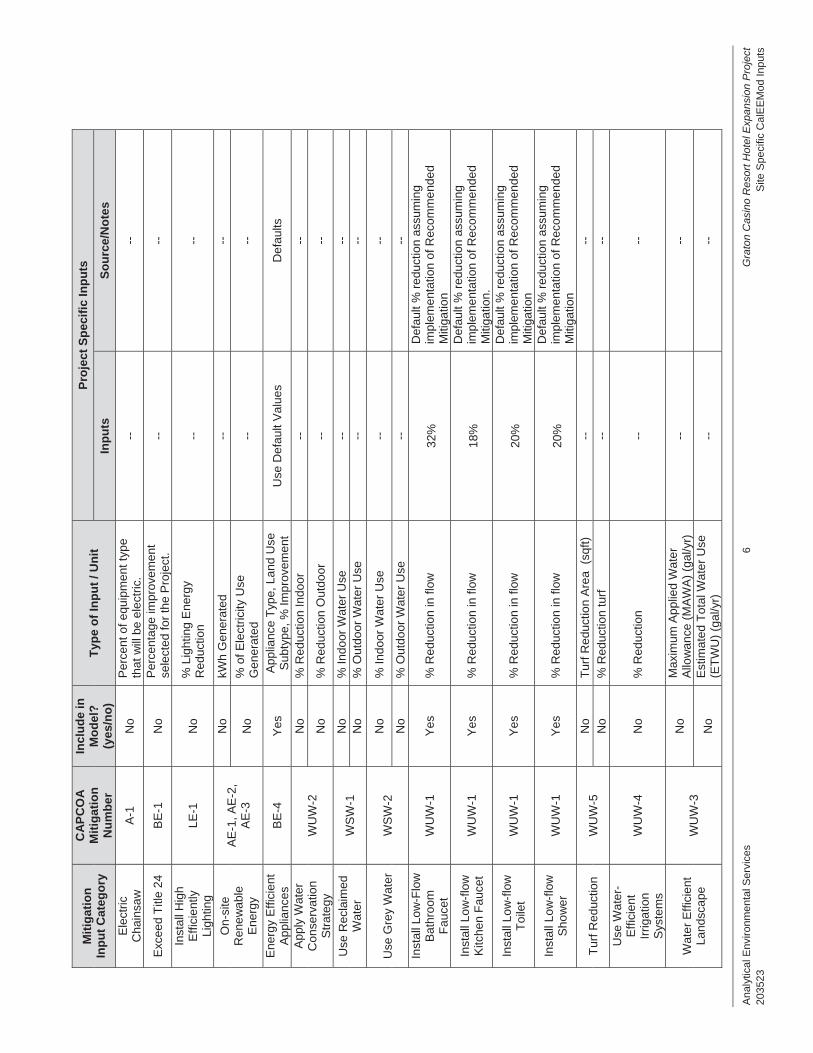
Ana
lytic
al E
nvir
onm
enta
l Ser
vice
s 6
Gra
ton
Cas
ino
Res
ort H
otel
Exp
ansi
on P
roje
ct
2035
23
S
ite S
peci
fic C
alE
EM
od I
nput
s
Mit
igat
ion
In
pu
t C
ateg
ory
CA
PC
OA
M
itig
atio
n
Nu
mb
er
Incl
ud
e in
M
od
el?
(y
es/n
o)
Typ
e o
f In
pu
t / U
nit
P
roje
ct S
pec
ific
Inp
uts
Inp
uts
S
ou
rce/
No
tes
Ele
ctric
C
hain
saw
A
-1
No
Per
cent
of e
quip
men
t typ
e th
at w
ill b
e el
ectr
ic.
--
--
Exc
eed
Titl
e 24
B
E-1
N
o P
erce
ntag
e im
prov
emen
t se
lect
ed fo
r th
e P
roje
ct.
--
--
Inst
all H
igh
Effi
cien
tly
Ligh
ting
LE
-1
No
%
Lig
htin
g E
nerg
y R
educ
tion
--
--
On-
site
R
ene
wa
ble
Ene
rgy
AE
-1, A
E- 2
, A
E-3
No
kW
h G
ener
ated
--
--
No
%
of E
lect
ricity
Use
G
ener
ated
--
--
Ene
rgy
Effi
cien
t A
pplia
nces
B
E-4
Y
es
App
lianc
e T
ype,
Lan
d U
se
Sub
type
, % Im
prov
emen
t U
se D
efau
lt V
alue
s D
efau
lts
App
ly W
ater
C
onse
rvat
ion
Str
ateg
y
WU
W-2
N
o
% R
educ
tion
Indo
or
--
--
No
%
Red
uctio
n O
utdo
or
--
--
Use
Rec
laim
ed
Wat
er
WS
W-1
N
o
% In
door
Wat
er U
se
--
--
No
%
Out
door
Wat
er U
se
--
--
Use
Gre
y W
ater
W
SW
-2
No
%
Indo
or W
ater
Use
--
--
No
%
Out
door
Wat
er U
se
--
--
Inst
all L
ow
-Flo
w
Bat
hroo
m
Fau
cet
WU
W-1
Y
es
% R
educ
tion
in fl
ow
32%
D
efau
lt %
red
uct
ion
assu
min
g
impl
emen
tatio
n of
Rec
omm
ende
d M
itiga
tion
Inst
all L
ow
-flo
w
Kitc
hen
Fau
cet
W
UW
-1
Yes
%
Red
uctio
n in
flow
18
%
Def
ault
% r
educ
tion
assu
min
g
impl
emen
tatio
n of
Rec
omm
ende
d M
itiga
tion.
Inst
all L
ow
-flo
w
Toi
let
WU
W-1
Y
es
% R
educ
tion
in fl
ow
20%
D
efau
lt %
red
uctio
n as
sum
ing
im
plem
enta
tion
of R
ecom
men
ded
Miti
gatio
n
Inst
all L
ow
-flo
w
Sho
wer
W
UW
-1
Yes
%
Red
uctio
n in
flow
20
%
Def
ault
% r
educ
tion
assu
min
g
impl
emen
tatio
n of
Rec
omm
ende
d M
itiga
tion
Tur
f Red
uctio
n
WU
W-5
N
o
Tur
f Red
uctio
n A
rea
(sq
ft)
--
--
No
%
Red
uctio
n tu
rf
--
--
Use
Wat
er-
Effi
cien
t Ir
rigat
ion
Sys
tem
s
WU
W-4
N
o
% R
educ
tion
--
--
Wat
er E
ffici
ent
Land
scap
e
WU
W-3
N
o
Max
imum
App
lied
Wat
er
Allo
wa
nce
(MA
WA
) (g
al/y
r)
--
--
No
E
stim
ated
Tot
al W
ater
Use
(E
TW
U)
(gal
/yr)
--
--
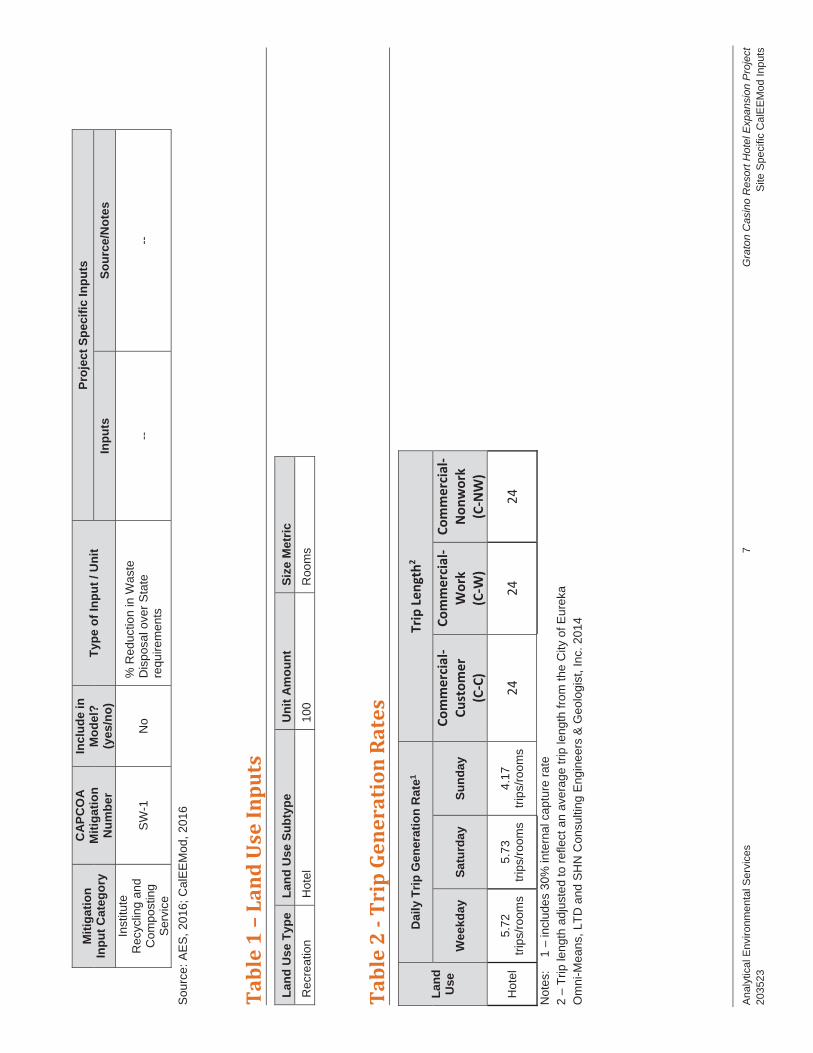
Ana
lytic
al E
nvir
onm
enta
l Ser
vice
s 7
Gra
ton
Cas
ino
Res
ort H
otel
Exp
ansi
on P
roje
ct
2035
23
S
ite S
peci
fic C
alE
EM
od I
nput
s
Mit
igat
ion
In
pu
t C
ateg
ory
CA
PC
OA
M
itig
atio
n
Nu
mb
er
Incl
ud
e in
M
od
el?
(y
es/n
o)
Typ
e o
f In
pu
t / U
nit
P
roje
ct S
pec
ific
Inp
uts
Inp
uts
S
ou
rce/
No
tes
Inst
itute
R
ecyc
ling
and
Com
post
ing
Ser
vice
SW
-1
No
% R
educ
tion
in W
aste
D
ispo
sal o
ver
Sta
te
requ
irem
ents
--
--
Sou
rce:
AE
S,
2016
; C
alE
EM
od,
2016
Ta
ble
1 –
Land
Use
Inpu
ts
Lan
d U
se T
ype
Lan
d U
se S
ub
typ
e
Un
it A
mo
un
t S
ize
Met
ric
Rec
reat
ion
H
otel
10
0
Roo
ms
Tabl
e 2
- Tri
p Ge
nera
tion
Rat
es
Lan
d
Use
Dai
ly T
rip
Gen
erat
ion
Rat
e1
Trip
Len
gth2
Wee
kda
y S
atu
rda
y S
un
day
Com
mer
cial
-Cu
stom
er
(C-C
)
Com
mer
cial
- W
ork
(C
-W)
Com
mer
cial
- N
onw
ork
(C
-NW
)
Hot
el
5.72
tr
ips/
room
s 5.
73
trip
s/ro
oms
4.17
tr
ips/
room
s 24
24
24
Not
es:
1 –
incl
udes
30%
inte
rnal
cap
ture
rat
e
2 –
Trip
leng
th a
djus
ted
to r
efle
ct a
n av
erag
e tr
ip le
ngth
from
the
City
of E
urek
a
Om
ni-M
eans
, LT
D a
nd S
HN
Con
sulti
ng E
ngin
eers
& G
eolo
gist
, Inc
. 201
4
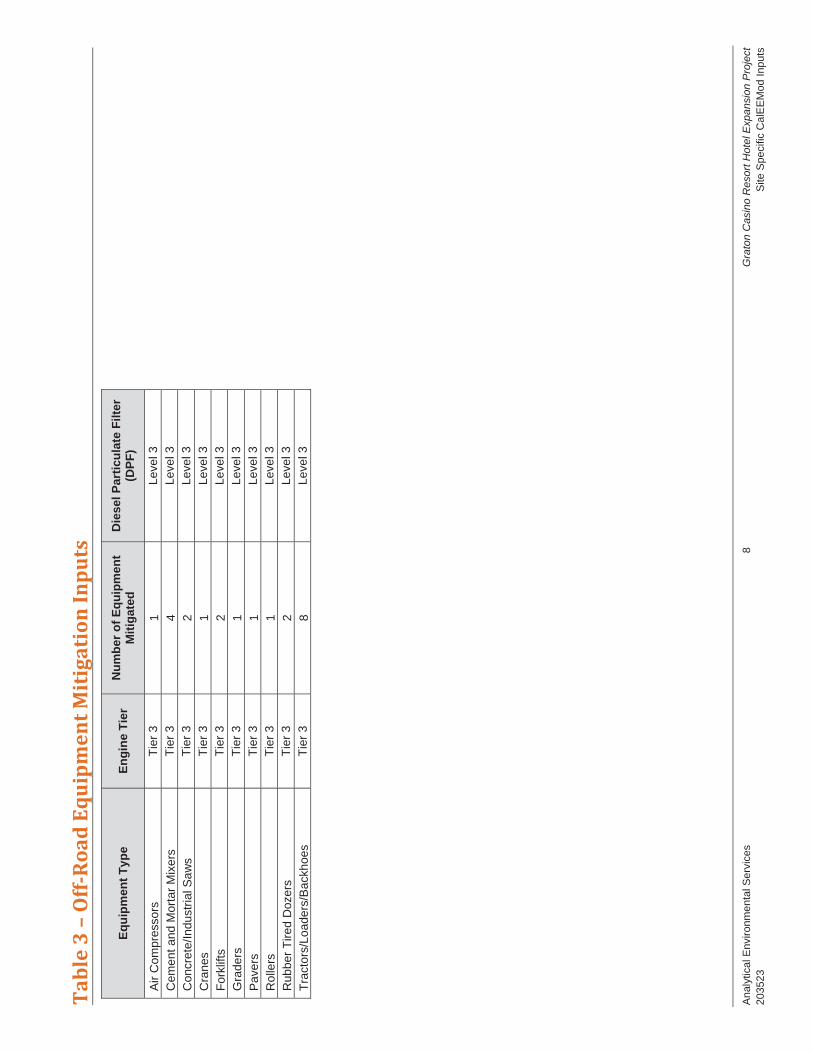
Ana
lytic
al E
nvir
onm
enta
l Ser
vice
s 8
Gra
ton
Cas
ino
Res
ort H
otel
Exp
ansi
on P
roje
ct
2035
23
S
ite S
peci
fic C
alE
EM
od I
nput
s
Tabl
e 3
– O
ff-R
oad
Equi
pmen
t Mit
igat
ion
Inpu
ts
Eq
uip
men
t T
ype
En
gin
e T
ier
N
um
ber
of
Eq
uip
men
t M
itig
ated
D
iese
l Par
ticu
late
Filt
er
(DP
F)
Air
Com
pres
sors
T
ier
3 1
Leve
l 3
Cem
ent a
nd M
orta
r M
ixer
s T
ier
3 4
Leve
l 3
Con
cret
e/In
dust
rial S
aw
s T
ier
3 2
Leve
l 3
Cra
nes
Tie
r 3
1 Le
vel 3
For
klift
s T
ier
3 2
Leve
l 3
Gra
ders
T
ier
3 1
Leve
l 3
Pav
ers
Tie
r 3
1 Le
vel 3
Rol
lers
T
ier
3 1
Leve
l 3
Rub
ber
Tire
d D
ozer
s T
ier
3 2
Leve
l 3
Tra
ctor
s/Lo
ader
s/B
ackh
oes
Tie
r 3
8 Le
vel 3

Pro
ject
Cha
ract
eris
tics
-
Land
Use
- R
efer
to P
roje
ct D
escr
iptio
n
Con
stru
ctio
n P
hase
-
Veh
icle
Trip
s -
Ref
er to
Cal
EE
Mod
inpu
t tab
le
Dem
oliti
on -
Con
stru
ctio
n O
ff-ro
ad E
quip
men
t Miti
gatio
n -
Ref
er to
Cal
EE
Mod
tabl
es
Wat
er M
itiga
tion
-
1.1
Lan
d U
sag
e
Land
Use
sS
ize
Met
ricLo
t Acr
eage
Flo
or S
urfa
ce A
rea
Pop
ulat
ion
Hot
el10
0.00
Roo
m0.
4017
,424
.00
0
1.2
Oth
er P
roje
ct C
har
acte
rist
ics
Urb
aniz
atio
n
Clim
ate
Zo
ne
Rur
al
1
Win
d S
pee
d (
m/s
)P
reci
pit
atio
n F
req
(D
ays)
2.2
103
1.3
Use
r E
nte
red
Co
mm
ents
& N
on
-Def
ault
Dat
a
1.0
Pro
ject
Ch
arac
teri
stic
s
Uti
lity
Co
mp
any
Pac
ific
Gas
& E
lect
ric C
ompa
ny
2018
Op
erat
ion
al Y
ear
CO
2 In
ten
sity
(l
b/M
Wh
r)64
1.35
0.02
9C
H4
Inte
nsi
ty
(lb
/MW
hr)
0.00
6N
2O In
ten
sity
(l
b/M
Wh
r)
Tab
le N
ame
Col
umn
Nam
eD
efau
lt V
alue
New
Val
ue
tblC
onst
Dus
tMiti
gatio
nW
ater
Unp
aved
Roa
dVeh
icle
Spe
ed40
15
TR
ED
C H
ote
l Pro
ject
Hu
mb
old
t C
ou
nty
, An
nu
al
Cal
EE
Mod
Ver
sion
: Cal
EE
Mod
.201
6.3.
1D
ate:
1/4
/201
7 8:
19 A
MP
age
1 of
31
TR
ED
C H
otel
Pro
ject
- H
umbo
ldt C
ount
y, A
nnua
l

tblC
onst
Equ
ipM
itiga
tion
DP
FN
o C
hang
eLe
vel 3
tblC
onst
Equ
ipM
itiga
tion
DP
FN
o C
hang
eLe
vel 3
tblC
onst
Equ
ipM
itiga
tion
DP
FN
o C
hang
eLe
vel 3
tblC
onst
Equ
ipM
itiga
tion
DP
FN
o C
hang
eLe
vel 3
tblC
onst
Equ
ipM
itiga
tion
DP
FN
o C
hang
eLe
vel 3
tblC
onst
Equ
ipM
itiga
tion
DP
FN
o C
hang
eLe
vel 3
tblC
onst
Equ
ipM
itiga
tion
DP
FN
o C
hang
eLe
vel 3
tblC
onst
Equ
ipM
itiga
tion
DP
FN
o C
hang
eLe
vel 3
tblC
onst
Equ
ipM
itiga
tion
DP
FN
o C
hang
eLe
vel 3
tblC
onst
Equ
ipM
itiga
tion
DP
FN
o C
hang
eLe
vel 3
tblC
onst
Equ
ipM
itiga
tion
Num
berO
fEqu
ipm
entM
itiga
ted
0.00
1.00
tblC
onst
Equ
ipM
itiga
tion
Num
berO
fEqu
ipm
entM
itiga
ted
0.00
4.00
tblC
onst
Equ
ipM
itiga
tion
Num
berO
fEqu
ipm
entM
itiga
ted
0.00
2.00
tblC
onst
Equ
ipM
itiga
tion
Num
berO
fEqu
ipm
entM
itiga
ted
0.00
1.00
tblC
onst
Equ
ipM
itiga
tion
Num
berO
fEqu
ipm
entM
itiga
ted
0.00
2.00
tblC
onst
Equ
ipM
itiga
tion
Num
berO
fEqu
ipm
entM
itiga
ted
0.00
1.00
tblC
onst
Equ
ipM
itiga
tion
Num
berO
fEqu
ipm
entM
itiga
ted
0.00
1.00
tblC
onst
Equ
ipM
itiga
tion
Num
berO
fEqu
ipm
entM
itiga
ted
0.00
1.00
tblC
onst
Equ
ipM
itiga
tion
Num
berO
fEqu
ipm
entM
itiga
ted
0.00
2.00
tblC
onst
Equ
ipM
itiga
tion
Num
berO
fEqu
ipm
entM
itiga
ted
0.00
8.00
tblC
onst
Equ
ipM
itiga
tion
Tie
rN
o C
hang
eT
ier
3
tblC
onst
Equ
ipM
itiga
tion
Tie
rN
o C
hang
eT
ier
3
tblC
onst
Equ
ipM
itiga
tion
Tie
rN
o C
hang
eT
ier
3
tblC
onst
Equ
ipM
itiga
tion
Tie
rN
o C
hang
eT
ier
3
tblC
onst
Equ
ipM
itiga
tion
Tie
rN
o C
hang
eT
ier
3
tblC
onst
Equ
ipM
itiga
tion
Tie
rN
o C
hang
eT
ier
3
tblC
onst
Equ
ipM
itiga
tion
Tie
rN
o C
hang
eT
ier
3
Cal
EE
Mod
Ver
sion
: Cal
EE
Mod
.201
6.3.
1D
ate:
1/4
/201
7 8:
19 A
MP
age
2 of
31
TR
ED
C H
otel
Pro
ject
- H
umbo
ldt C
ount
y, A
nnua
l

2.0
Em
issi
on
s S
um
mar
y
tblC
onst
Equ
ipM
itiga
tion
Tie
rN
o C
hang
eT
ier
3
tblC
onst
Equ
ipM
itiga
tion
Tie
rN
o C
hang
eT
ier
3
tblC
onst
Equ
ipM
itiga
tion
Tie
rN
o C
hang
eT
ier
3
tblL
andU
seB
uild
ingS
pace
Squ
areF
eet
145,
200.
0017
,424
.00
tblL
andU
seLa
ndU
seS
quar
eFee
t14
5,20
0.00
17,4
24.0
0
tblL
andU
seLo
tAcr
eage
3.33
0.40
tblP
roje
ctC
hara
cter
istic
sU
rban
izat
ionL
evel
Urb
anR
ural
tblV
ehic
leT
rips
CC
_TL
6.60
24.0
0
tblV
ehic
leT
rips
CN
W_T
L6.
6024
.00
tblV
ehic
leT
rips
CW
_TL
14.7
024
.00
tblV
ehic
leT
rips
ST
_TR
8.19
5.73
tblV
ehic
leT
rips
SU
_TR
5.95
4.17
tblV
ehic
leT
rips
WD
_TR
8.17
5.72
Cal
EE
Mod
Ver
sion
: Cal
EE
Mod
.201
6.3.
1D
ate:
1/4
/201
7 8:
19 A
MP
age
3 of
31
TR
ED
C H
otel
Pro
ject
- H
umbo
ldt C
ount
y, A
nnua
l

2.1
Ove
rall
Co
nst
ruct
ion
RO
GN
Ox
CO
SO
2F
ugiti
veP
M10
Exh
aust
PM
10P
M10
Tot
alF
ugiti
veP
M2.
5E
xhau
stP
M2.
5P
M2.
5T
otal
Bio
- C
O2
NB
io-
CO
2T
otal
CO
2C
H4
N2O
CO
2e
Yea
rto
ns/y
rM
T/y
r
2017
0.28
760.
8370
0.55
239.
2000
e-00
40.
0475
0.05
060.
0982
8.59
00e-
003
0.04
680.
0554
0.00
0085
.312
085
.312
00.
0196
0.00
0085
.801
2
Max
imu
m0.
2876
0.83
700.
5523
9.20
00e-
004
0.04
750.
0506
0.09
828.
5900
e-00
30.
0468
0.05
540.
0000
85.3
120
85.3
120
0.01
960.
0000
85.8
012
Un
mit
igat
ed C
on
stru
ctio
n
RO
GN
Ox
CO
SO
2F
ugiti
veP
M10
Exh
aust
PM
10P
M10
Tot
alF
ugiti
veP
M2.
5E
xhau
stP
M2.
5P
M2.
5T
otal
Bio
- C
O2
NB
io-
CO
2T
otal
CO
2C
H4
N2O
CO
2e
Yea
rto
ns/y
rM
T/y
r
2017
0.22
870.
4604
0.54
669.
2000
e-00
40.
0265
4.52
00e-
003
0.03
105.
2400
e-00
34.
4700
e-00
39.
7100
e-00
30.
0000
85.3
120
85.3
120
0.01
960.
0000
85.8
011
Max
imu
m0.
2287
0.46
040.
5466
9.20
00e-
004
0.02
654.
5200
e-00
30.
0310
5.24
00e-
003
4.47
00e-
003
9.71
00e-
003
0.00
0085
.312
085
.312
00.
0196
0.00
0085
.801
1
Mit
igat
ed C
on
stru
ctio
n
RO
GN
Ox
CO
SO
2F
ug
itiv
eP
M10
Exh
aust
PM
10P
M10
To
tal
Fu
git
ive
PM
2.5
Exh
aust
PM
2.5
PM
2.5
To
tal
Bio
- C
O2
NB
io-C
O2
To
tal C
O2
CH
4N
20C
O2e
Per
cen
tR
edu
ctio
n20
.46
44.9
91.
030.
0044
.33
91.0
768
.46
39.0
090
.45
82.4
70.
000.
000.
000.
000.
000.
00
Cal
EE
Mod
Ver
sion
: Cal
EE
Mod
.201
6.3.
1D
ate:
1/4
/201
7 8:
19 A
MP
age
4 of
31
TR
ED
C H
otel
Pro
ject
- H
umbo
ldt C
ount
y, A
nnua
l

2.2
Ove
rall
Op
erat
ion
al
RO
GN
Ox
CO
SO
2F
ugiti
veP
M10
Exh
aust
PM
10P
M10
Tot
alF
ugiti
veP
M2.
5E
xhau
stP
M2.
5P
M2.
5T
otal
Bio
- C
O2
NB
io-
CO
2T
otal
CO
2C
H4
N2O
CO
2e
Cat
egor
yto
ns/y
rM
T/y
r
Are
a0.
0883
1.00
00e-
005
9.30
00e-
004
0.00
000.
0000
0.00
000.
0000
0.00
000.
0000
1.79
00e-
003
1.79
00e-
003
0.00
000.
0000
1.91
00e-
003
Ene
rgy
1.96
00e-
003
0.01
780.
0150
1.10
00e-
004
1.35
00e-
003
1.35
00e-
003
1.35
00e-
003
1.35
00e-
003
0.00
0058
.131
158
.131
12.
1200
e-00
37.
2000
e-00
458
.398
2
Mob
ile0.
5918
3.89
398.
7755
0.01
701.
1881
0.03
751.
2256
0.32
070.
0356
0.35
630.
0000
1,55
1.63
33
1,55
1.63
33
0.09
620.
0000
1,55
4.03
74
Was
te0.
0000
0.00
000.
0000
0.00
0011
.113
80.
0000
11.1
138
0.65
680.
0000
27.5
339
Wat
er0.
0000
0.00
000.
0000
0.00
000.
8048
4.28
005.
0848
0.08
291.
9900
e-00
37.
7496
To
tal
0.68
213.
9117
8.79
140.
0171
1.18
810.
0389
1.22
690.
3207
0.03
700.
3576
11.9
185
1,61
4.04
62
1,62
5.96
47
0.83
792.
7100
e-00
31,
647.
721
0
Un
mit
igat
ed O
per
atio
nal
Qu
arte
rS
tart
Dat
eE
nd
Dat
eM
axim
um
Un
mit
igat
ed R
OG
+ N
OX
(to
ns/
qu
arte
r)M
axim
um
Mit
igat
ed R
OG
+ N
OX
(to
ns/
qu
arte
r)
16-
1-20
178-
31-2
017
0.53
750.
3010
29-
1-20
179-
30-2
017
0.15
770.
0759
Hig
hes
t0.
5375
0.30
10
Cal
EE
Mod
Ver
sion
: Cal
EE
Mod
.201
6.3.
1D
ate:
1/4
/201
7 8:
19 A
MP
age
5 of
31
TR
ED
C H
otel
Pro
ject
- H
umbo
ldt C
ount
y, A
nnua
l

2.2
Ove
rall
Op
erat
ion
al
RO
GN
Ox
CO
SO
2F
ugiti
veP
M10
Exh
aust
PM
10P
M10
Tot
alF
ugiti
veP
M2.
5E
xhau
stP
M2.
5P
M2.
5T
otal
Bio
- C
O2
NB
io-
CO
2T
otal
CO
2C
H4
N2O
CO
2e
Cat
egor
yto
ns/y
rM
T/y
r
Are
a0.
0883
1.00
00e-
005
9.30
00e-
004
0.00
000.
0000
0.00
000.
0000
0.00
000.
0000
1.79
00e-
003
1.79
00e-
003
0.00
000.
0000
1.91
00e-
003
Ene
rgy
1.96
00e-
003
0.01
780.
0150
1.10
00e-
004
1.35
00e-
003
1.35
00e-
003
1.35
00e-
003
1.35
00e-
003
0.00
0058
.131
158
.131
12.
1200
e-00
37.
2000
e-00
458
.398
2
Mob
ile0.
5918
3.89
398.
7755
0.01
701.
1881
0.03
751.
2256
0.32
070.
0356
0.35
630.
0000
1,55
1.63
33
1,55
1.63
33
0.09
620.
0000
1,55
4.03
74
Was
te0.
0000
0.00
000.
0000
0.00
0011
.113
80.
0000
11.1
138
0.65
680.
0000
27.5
339
Wat
er0.
0000
0.00
000.
0000
0.00
000.
6438
3.48
144.
1252
0.06
631.
5900
e-00
36.
2573
To
tal
0.68
213.
9117
8.79
140.
0171
1.18
810.
0389
1.22
690.
3207
0.03
700.
3576
11.7
576
1,61
3.24
76
1,62
5.00
52
0.82
142.
3100
e-00
31,
646.
228
6
Mit
igat
ed O
per
atio
nal
3.0
Co
nst
ruct
ion
Det
ail
Co
nst
ruct
ion
Ph
ase
RO
GN
Ox
CO
SO
2F
ug
itiv
eP
M10
Exh
aust
PM
10P
M10
To
tal
Fu
git
ive
PM
2.5
Exh
aust
PM
2.5
PM
2.5
To
tal
Bio
- C
O2
NB
io-C
O2
To
tal C
O2
CH
4N
20C
O2e
Per
cen
tR
edu
ctio
n0.
000.
000.
000.
000.
000.
000.
000.
000.
000.
001.
350.
050.
061.
9814
.76
0.09
Cal
EE
Mod
Ver
sion
: Cal
EE
Mod
.201
6.3.
1D
ate:
1/4
/201
7 8:
19 A
MP
age
6 of
31
TR
ED
C H
otel
Pro
ject
- H
umbo
ldt C
ount
y, A
nnua
l
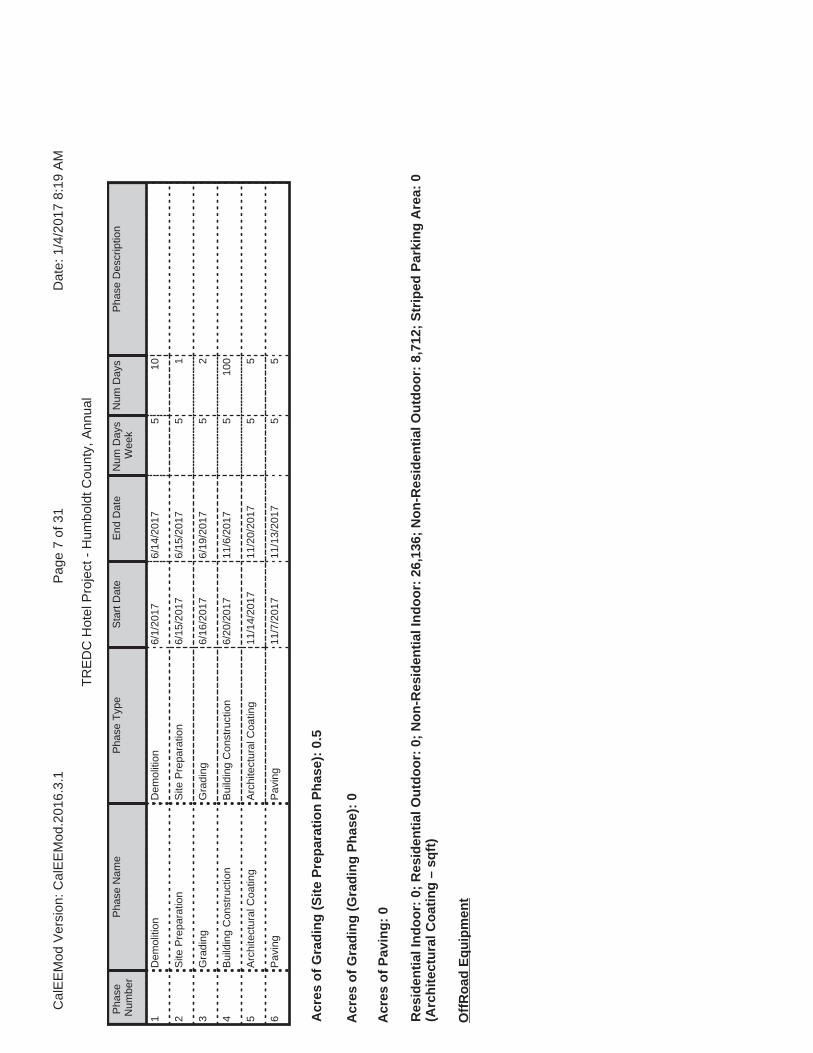
Pha
seN
umbe
rP
hase
Nam
eP
hase
Typ
eS
tart
Dat
eE
nd D
ate
Num
Day
s W
eek
Num
Day
sP
hase
Des
crip
tion
1D
emol
ition
Dem
oliti
on6/
1/20
176/
14/2
017
510
2S
ite P
repa
ratio
nS
ite P
repa
ratio
n6/
15/2
017
6/15
/201
75
1
3G
radi
ngG
radi
ng6/
16/2
017
6/19
/201
75
2
4B
uild
ing
Con
stru
ctio
nB
uild
ing
Con
stru
ctio
n6/
20/2
017
11/6
/201
75
100
5A
rchi
tect
ural
Coa
ting
Arc
hite
ctur
al C
oatin
g11
/14/
2017
11/2
0/20
175
5
6P
avin
gP
avin
g11
/7/2
017
11/1
3/20
175
5
Off
Ro
ad E
qu
ipm
ent
Res
iden
tial
Ind
oo
r: 0
; R
esid
enti
al O
utd
oo
r: 0
; N
on
-Res
iden
tial
Ind
oo
r: 2
6,13
6; N
on
-Res
iden
tial
Ou
tdo
or:
8,7
12;
Str
iped
Par
kin
g A
rea:
0
(Arc
hit
ectu
ral C
oat
ing
– s
qft
)
Acr
es o
f G
rad
ing
(S
ite
Pre
par
atio
n P
has
e):
0.5
Acr
es o
f G
rad
ing
(G
rad
ing
Ph
ase)
: 0
Acr
es o
f P
avin
g:
0
Cal
EE
Mod
Ver
sion
: Cal
EE
Mod
.201
6.3.
1D
ate:
1/4
/201
7 8:
19 A
MP
age
7 of
31
TR
ED
C H
otel
Pro
ject
- H
umbo
ldt C
ount
y, A
nnua
l
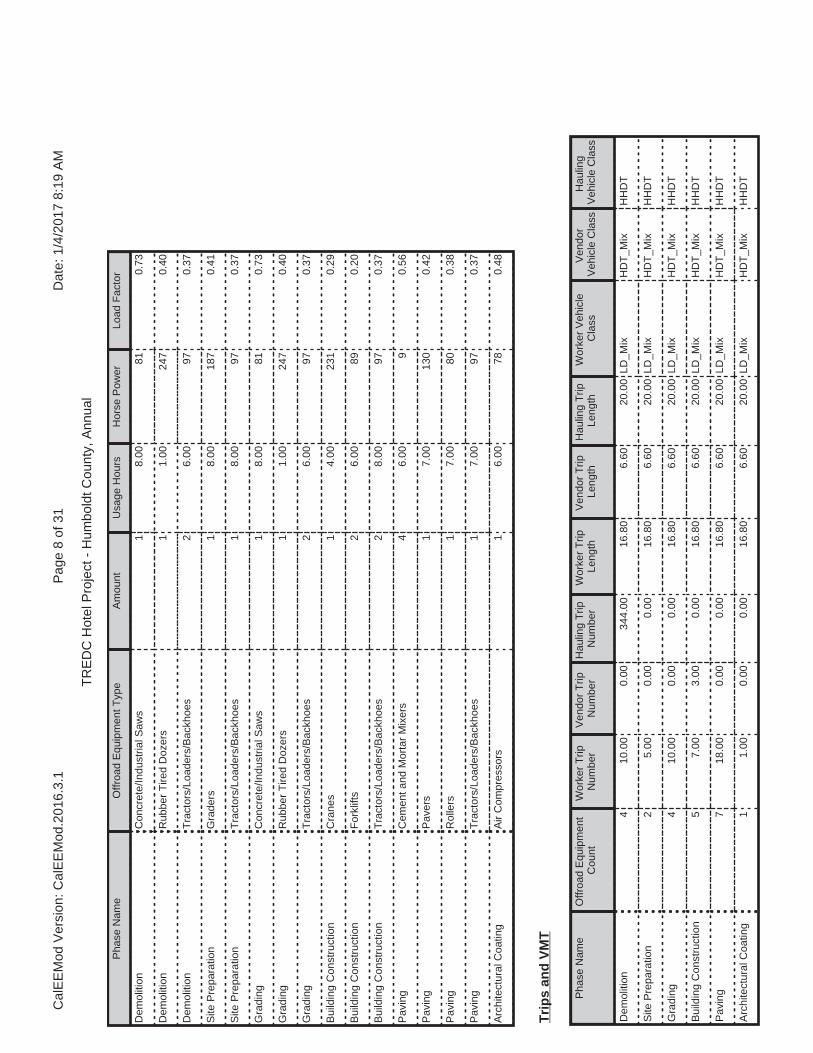
Pha
se N
ame
Offr
oad
Equ
ipm
ent T
ype
Am
ount
Usa
ge H
ours
Hor
se P
ower
Load
Fac
tor
Dem
oliti
onC
oncr
ete/
Indu
stria
l Saw
s1
8.00
810.
73
Dem
oliti
onR
ubbe
r T
ired
Doz
ers
11.
0024
70.
40
Dem
oliti
onT
ract
ors/
Load
ers/
Bac
khoe
s2
6.00
970.
37
Site
Pre
para
tion
Gra
ders
18.
0018
70.
41
Site
Pre
para
tion
Tra
ctor
s/Lo
ader
s/B
ackh
oes
18.
0097
0.37
Gra
ding
Con
cret
e/In
dust
rial S
aws
18.
0081
0.73
Gra
ding
Rub
ber
Tire
d D
ozer
s1
1.00
247
0.40
Gra
ding
Tra
ctor
s/Lo
ader
s/B
ackh
oes
26.
0097
0.37
Bui
ldin
g C
onst
ruct
ion
Cra
nes
14.
0023
10.
29
Bui
ldin
g C
onst
ruct
ion
For
klift
s2
6.00
890.
20
Bui
ldin
g C
onst
ruct
ion
Tra
ctor
s/Lo
ader
s/B
ackh
oes
28.
0097
0.37
Pav
ing
Cem
ent a
nd M
orta
r M
ixer
s4
6.00
90.
56
Pav
ing
Pav
ers
17.
0013
00.
42
Pav
ing
Rol
lers
17.
0080
0.38
Pav
ing
Tra
ctor
s/Lo
ader
s/B
ackh
oes
17.
0097
0.37
Arc
hite
ctur
al C
oatin
gA
ir C
ompr
esso
rs1
6.00
780.
48
Tri
ps
and
VM
T
Pha
se N
ame
Offr
oad
Equ
ipm
ent
Cou
ntW
orke
r T
rip
Num
ber
Ven
dor
Trip
N
umbe
rH
aulin
g T
rip
Num
ber
Wor
ker
Trip
Le
ngth
Ven
dor
Trip
Le
ngth
Hau
ling
Trip
Le
ngth
Wor
ker
Veh
icle
C
lass
Ven
dor
Veh
icle
Cla
ssH
aulin
gV
ehic
le C
lass
Dem
oliti
on4
10.0
00.
0034
4.00
16.8
06.
6020
.00
LD_M
ixH
DT
_Mix
HH
DT
Site
Pre
para
tion
25.
000.
000.
0016
.80
6.60
20.0
0LD
_Mix
HD
T_M
ixH
HD
T
Gra
ding
410
.00
0.00
0.00
16.8
06.
6020
.00
LD_M
ixH
DT
_Mix
HH
DT
Bui
ldin
g C
onst
ruct
ion
57.
003.
000.
0016
.80
6.60
20.0
0LD
_Mix
HD
T_M
ixH
HD
T
Pav
ing
718
.00
0.00
0.00
16.8
06.
6020
.00
LD_M
ixH
DT
_Mix
HH
DT
Arc
hite
ctur
al C
oatin
g1
1.00
0.00
0.00
16.8
06.
6020
.00
LD_M
ixH
DT
_Mix
HH
DT
Cal
EE
Mod
Ver
sion
: Cal
EE
Mod
.201
6.3.
1D
ate:
1/4
/201
7 8:
19 A
MP
age
8 of
31
TR
ED
C H
otel
Pro
ject
- H
umbo
ldt C
ount
y, A
nnua
l
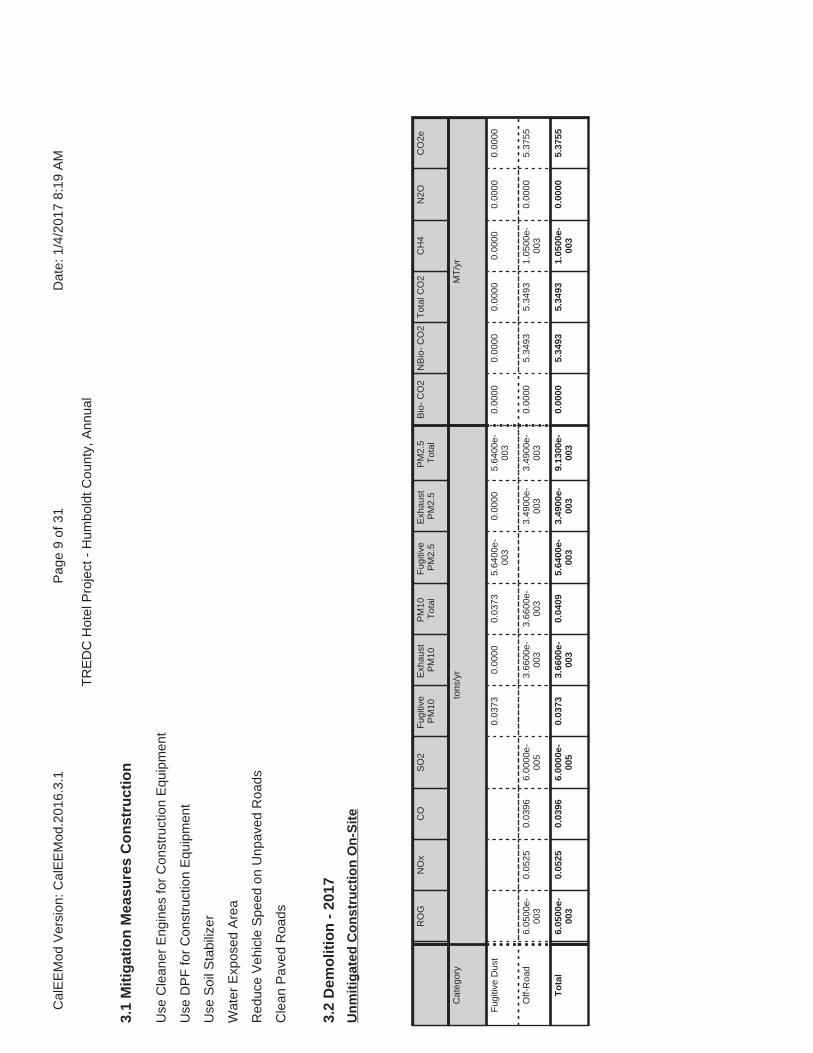
3.2
Dem
olit
ion
- 2
017
RO
GN
Ox
CO
SO
2F
ugiti
veP
M10
Exh
aust
PM
10P
M10
Tot
alF
ugiti
veP
M2.
5E
xhau
stP
M2.
5P
M2.
5T
otal
Bio
- C
O2
NB
io-
CO
2T
otal
CO
2C
H4
N2O
CO
2e
Cat
egor
yto
ns/y
rM
T/y
r
Fug
itive
Dus
t0.
0373
0.00
000.
0373
5.64
00e-
003
0.00
005.
6400
e-00
30.
0000
0.00
000.
0000
0.00
000.
0000
0.00
00
Off-
Roa
d6.
0500
e-00
30.
0525
0.03
966.
0000
e-00
53.
6600
e-00
33.
6600
e-00
33.
4900
e-00
33.
4900
e-00
30.
0000
5.34
935.
3493
1.05
00e-
003
0.00
005.
3755
To
tal
6.05
00e-
003
0.05
250.
0396
6.00
00e-
005
0.03
733.
6600
e-00
30.
0409
5.64
00e-
003
3.49
00e-
003
9.13
00e-
003
0.00
005.
3493
5.34
931.
0500
e-00
30.
0000
5.37
55
Un
mit
igat
ed C
on
stru
ctio
n O
n-S
ite
3.1
Mit
igat
ion
Mea
sure
s C
on
stru
ctio
n
Use
Cle
aner
Eng
ines
for
Con
stru
ctio
n E
quip
men
t
Use
DP
F fo
r C
onst
ruct
ion
Equ
ipm
ent
Use
Soi
l Sta
biliz
er
Wat
er E
xpos
ed A
rea
Red
uce
Veh
icle
Spe
ed o
n U
npav
ed R
oads
Cle
an P
aved
Roa
ds
Cal
EE
Mod
Ver
sion
: Cal
EE
Mod
.201
6.3.
1D
ate:
1/4
/201
7 8:
19 A
MP
age
9 of
31
TR
ED
C H
otel
Pro
ject
- H
umbo
ldt C
ount
y, A
nnua
l

3.2
Dem
olit
ion
- 2
017
RO
GN
Ox
CO
SO
2F
ugiti
veP
M10
Exh
aust
PM
10P
M10
Tot
alF
ugiti
veP
M2.
5E
xhau
stP
M2.
5P
M2.
5T
otal
Bio
- C
O2
NB
io-
CO
2T
otal
CO
2C
H4
N2O
CO
2e
Cat
egor
yto
ns/y
rM
T/y
r
Hau
ling
2.71
00e-
003
0.07
030.
0145
1.40
00e-
004
2.83
00e-
003
7.50
00e-
004
3.57
00e-
003
7.80
00e-
004
7.10
00e-
004
1.49
00e-
003
0.00
0013
.356
713
.356
74.
9000
e-00
40.
0000
13.3
690
Ven
dor
0.00
000.
0000
0.00
000.
0000
0.00
000.
0000
0.00
000.
0000
0.00
000.
0000
0.00
000.
0000
0.00
000.
0000
0.00
000.
0000
Wor
ker
7.00
00e-
004
7.30
00e-
004
5.77
00e-
003
1.00
00e-
005
6.00
00e-
004
1.00
00e-
005
6.10
00e-
004
1.60
00e-
004
1.00
00e-
005
1.70
00e-
004
0.00
000.
5892
0.58
925.
0000
e-00
50.
0000
0.59
05
To
tal
3.41
00e-
003
0.07
100.
0203
1.50
00e-
004
3.43
00e-
003
7.60
00e-
004
4.18
00e-
003
9.40
00e-
004
7.20
00e-
004
1.66
00e-
003
0.00
0013
.945
913
.945
95.
4000
e-00
40.
0000
13.9
595
Un
mit
igat
ed C
on
stru
ctio
n O
ff-S
ite
RO
GN
Ox
CO
SO
2F
ugiti
veP
M10
Exh
aust
PM
10P
M10
Tot
alF
ugiti
veP
M2.
5E
xhau
stP
M2.
5P
M2.
5T
otal
Bio
- C
O2
NB
io-
CO
2T
otal
CO
2C
H4
N2O
CO
2e
Cat
egor
yto
ns/y
rM
T/y
r
Fug
itive
Dus
t0.
0168
0.00
000.
0168
2.54
00e-
003
0.00
002.
5400
e-00
30.
0000
0.00
000.
0000
0.00
000.
0000
0.00
00
Off-
Roa
d1.
3300
e-00
30.
0298
0.03
976.
0000
e-00
53.
0000
e-00
43.
0000
e-00
43.
0000
e-00
43.
0000
e-00
40.
0000
5.34
925.
3492
1.05
00e-
003
0.00
005.
3755
To
tal
1.33
00e-
003
0.02
980.
0397
6.00
00e-
005
0.01
683.
0000
e-00
40.
0171
2.54
00e-
003
3.00
00e-
004
2.84
00e-
003
0.00
005.
3492
5.34
921.
0500
e-00
30.
0000
5.37
55
Mit
igat
ed C
on
stru
ctio
n O
n-S
ite
Cal
EE
Mod
Ver
sion
: Cal
EE
Mod
.201
6.3.
1D
ate:
1/4
/201
7 8:
19 A
MP
age
10 o
f 31
TR
ED
C H
otel
Pro
ject
- H
umbo
ldt C
ount
y, A
nnua
l

3.2
Dem
olit
ion
- 2
017
RO
GN
Ox
CO
SO
2F
ugiti
veP
M10
Exh
aust
PM
10P
M10
Tot
alF
ugiti
veP
M2.
5E
xhau
stP
M2.
5P
M2.
5T
otal
Bio
- C
O2
NB
io-
CO
2T
otal
CO
2C
H4
N2O
CO
2e
Cat
egor
yto
ns/y
rM
T/y
r
Hau
ling
2.71
00e-
003
0.07
030.
0145
1.40
00e-
004
2.83
00e-
003
7.50
00e-
004
3.57
00e-
003
7.80
00e-
004
7.10
00e-
004
1.49
00e-
003
0.00
0013
.356
713
.356
74.
9000
e-00
40.
0000
13.3
690
Ven
dor
0.00
000.
0000
0.00
000.
0000
0.00
000.
0000
0.00
000.
0000
0.00
000.
0000
0.00
000.
0000
0.00
000.
0000
0.00
000.
0000
Wor
ker
7.00
00e-
004
7.30
00e-
004
5.77
00e-
003
1.00
00e-
005
6.00
00e-
004
1.00
00e-
005
6.10
00e-
004
1.60
00e-
004
1.00
00e-
005
1.70
00e-
004
0.00
000.
5892
0.58
925.
0000
e-00
50.
0000
0.59
05
To
tal
3.41
00e-
003
0.07
100.
0203
1.50
00e-
004
3.43
00e-
003
7.60
00e-
004
4.18
00e-
003
9.40
00e-
004
7.20
00e-
004
1.66
00e-
003
0.00
0013
.945
913
.945
95.
4000
e-00
40.
0000
13.9
595
Mit
igat
ed C
on
stru
ctio
n O
ff-S
ite
3.3
Sit
e P
rep
arat
ion
- 2
017
RO
GN
Ox
CO
SO
2F
ugiti
veP
M10
Exh
aust
PM
10P
M10
Tot
alF
ugiti
veP
M2.
5E
xhau
stP
M2.
5P
M2.
5T
otal
Bio
- C
O2
NB
io-
CO
2T
otal
CO
2C
H4
N2O
CO
2e
Cat
egor
yto
ns/y
rM
T/y
r
Fug
itive
Dus
t2.
7000
e-00
40.
0000
2.70
00e-
004
3.00
00e-
005
0.00
003.
0000
e-00
50.
0000
0.00
000.
0000
0.00
000.
0000
0.00
00
Off-
Roa
d4.
3000
e-00
45.
2600
e-00
32.
1800
e-00
30.
0000
2.40
00e-
004
2.40
00e-
004
2.20
00e-
004
2.20
00e-
004
0.00
000.
4534
0.45
341.
4000
e-00
40.
0000
0.45
69
To
tal
4.30
00e-
004
5.26
00e-
003
2.18
00e-
003
0.00
002.
7000
e-00
42.
4000
e-00
45.
1000
e-00
43.
0000
e-00
52.
2000
e-00
42.
5000
e-00
40.
0000
0.45
340.
4534
1.40
00e-
004
0.00
000.
4569
Un
mit
igat
ed C
on
stru
ctio
n O
n-S
ite
Cal
EE
Mod
Ver
sion
: Cal
EE
Mod
.201
6.3.
1D
ate:
1/4
/201
7 8:
19 A
MP
age
11 o
f 31
TR
ED
C H
otel
Pro
ject
- H
umbo
ldt C
ount
y, A
nnua
l
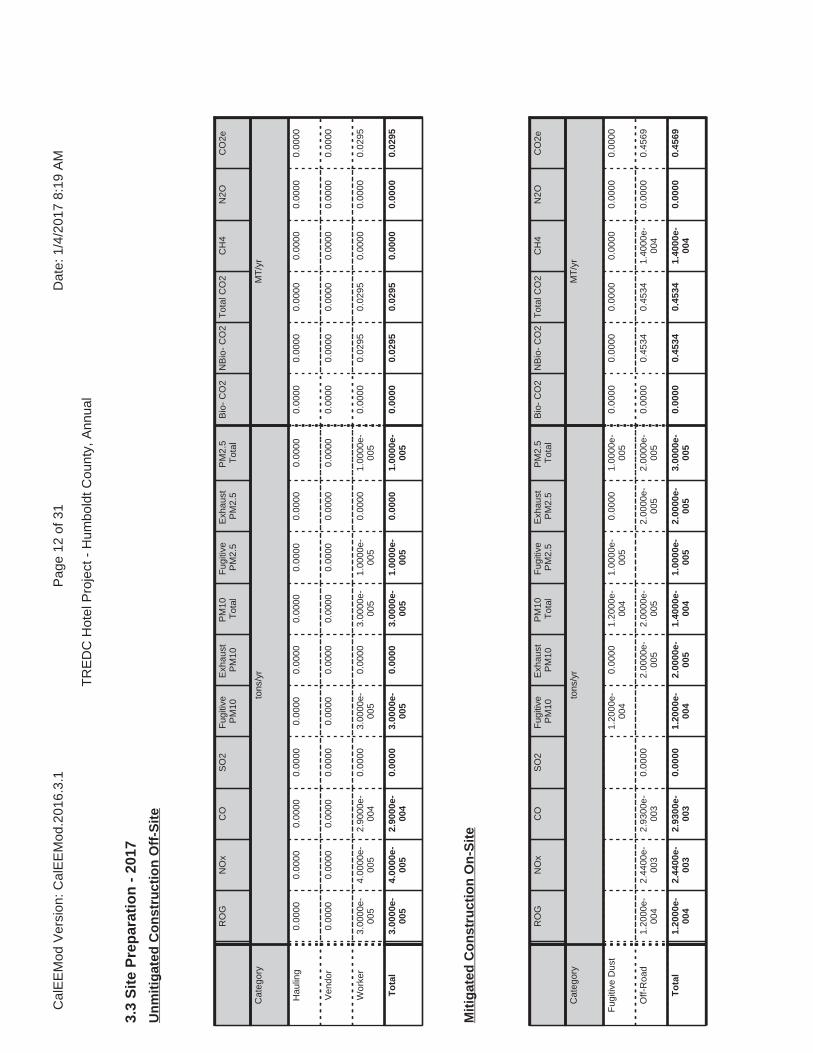
3.3
Sit
e P
rep
arat
ion
- 2
017
RO
GN
Ox
CO
SO
2F
ugiti
veP
M10
Exh
aust
PM
10P
M10
Tot
alF
ugiti
veP
M2.
5E
xhau
stP
M2.
5P
M2.
5T
otal
Bio
- C
O2
NB
io-
CO
2T
otal
CO
2C
H4
N2O
CO
2e
Cat
egor
yto
ns/y
rM
T/y
r
Hau
ling
0.00
000.
0000
0.00
000.
0000
0.00
000.
0000
0.00
000.
0000
0.00
000.
0000
0.00
000.
0000
0.00
000.
0000
0.00
000.
0000
Ven
dor
0.00
000.
0000
0.00
000.
0000
0.00
000.
0000
0.00
000.
0000
0.00
000.
0000
0.00
000.
0000
0.00
000.
0000
0.00
000.
0000
Wor
ker
3.00
00e-
005
4.00
00e-
005
2.90
00e-
004
0.00
003.
0000
e-00
50.
0000
3.00
00e-
005
1.00
00e-
005
0.00
001.
0000
e-00
50.
0000
0.02
950.
0295
0.00
000.
0000
0.02
95
To
tal
3.00
00e-
005
4.00
00e-
005
2.90
00e-
004
0.00
003.
0000
e-00
50.
0000
3.00
00e-
005
1.00
00e-
005
0.00
001.
0000
e-00
50.
0000
0.02
950.
0295
0.00
000.
0000
0.02
95
Un
mit
igat
ed C
on
stru
ctio
n O
ff-S
ite
RO
GN
Ox
CO
SO
2F
ugiti
veP
M10
Exh
aust
PM
10P
M10
Tot
alF
ugiti
veP
M2.
5E
xhau
stP
M2.
5P
M2.
5T
otal
Bio
- C
O2
NB
io-
CO
2T
otal
CO
2C
H4
N2O
CO
2e
Cat
egor
yto
ns/y
rM
T/y
r
Fug
itive
Dus
t1.
2000
e-00
40.
0000
1.20
00e-
004
1.00
00e-
005
0.00
001.
0000
e-00
50.
0000
0.00
000.
0000
0.00
000.
0000
0.00
00
Off-
Roa
d1.
2000
e-00
42.
4400
e-00
32.
9300
e-00
30.
0000
2.00
00e-
005
2.00
00e-
005
2.00
00e-
005
2.00
00e-
005
0.00
000.
4534
0.45
341.
4000
e-00
40.
0000
0.45
69
To
tal
1.20
00e-
004
2.44
00e-
003
2.93
00e-
003
0.00
001.
2000
e-00
42.
0000
e-00
51.
4000
e-00
41.
0000
e-00
52.
0000
e-00
53.
0000
e-00
50.
0000
0.45
340.
4534
1.40
00e-
004
0.00
000.
4569
Mit
igat
ed C
on
stru
ctio
n O
n-S
ite
Cal
EE
Mod
Ver
sion
: Cal
EE
Mod
.201
6.3.
1D
ate:
1/4
/201
7 8:
19 A
MP
age
12 o
f 31
TR
ED
C H
otel
Pro
ject
- H
umbo
ldt C
ount
y, A
nnua
l
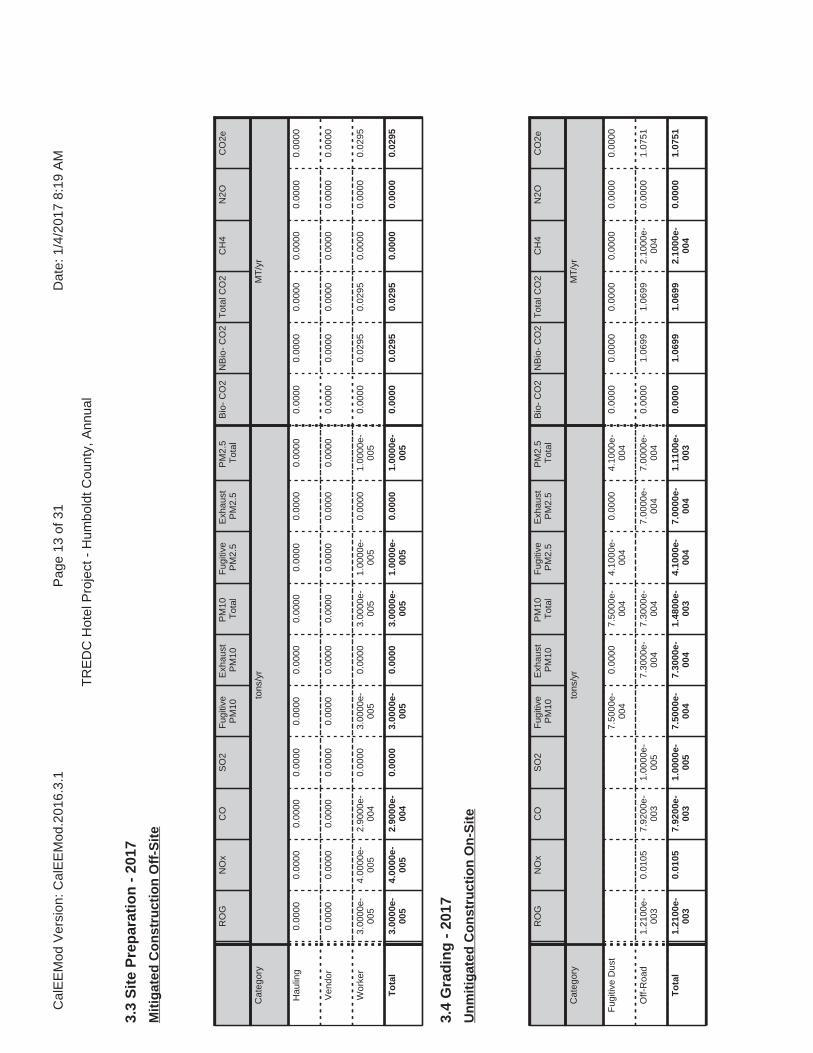
3.3
Sit
e P
rep
arat
ion
- 2
017
RO
GN
Ox
CO
SO
2F
ugiti
veP
M10
Exh
aust
PM
10P
M10
Tot
alF
ugiti
veP
M2.
5E
xhau
stP
M2.
5P
M2.
5T
otal
Bio
- C
O2
NB
io-
CO
2T
otal
CO
2C
H4
N2O
CO
2e
Cat
egor
yto
ns/y
rM
T/y
r
Hau
ling
0.00
000.
0000
0.00
000.
0000
0.00
000.
0000
0.00
000.
0000
0.00
000.
0000
0.00
000.
0000
0.00
000.
0000
0.00
000.
0000
Ven
dor
0.00
000.
0000
0.00
000.
0000
0.00
000.
0000
0.00
000.
0000
0.00
000.
0000
0.00
000.
0000
0.00
000.
0000
0.00
000.
0000
Wor
ker
3.00
00e-
005
4.00
00e-
005
2.90
00e-
004
0.00
003.
0000
e-00
50.
0000
3.00
00e-
005
1.00
00e-
005
0.00
001.
0000
e-00
50.
0000
0.02
950.
0295
0.00
000.
0000
0.02
95
To
tal
3.00
00e-
005
4.00
00e-
005
2.90
00e-
004
0.00
003.
0000
e-00
50.
0000
3.00
00e-
005
1.00
00e-
005
0.00
001.
0000
e-00
50.
0000
0.02
950.
0295
0.00
000.
0000
0.02
95
Mit
igat
ed C
on
stru
ctio
n O
ff-S
ite
3.4
Gra
din
g -
201
7
RO
GN
Ox
CO
SO
2F
ugiti
veP
M10
Exh
aust
PM
10P
M10
Tot
alF
ugiti
veP
M2.
5E
xhau
stP
M2.
5P
M2.
5T
otal
Bio
- C
O2
NB
io-
CO
2T
otal
CO
2C
H4
N2O
CO
2e
Cat
egor
yto
ns/y
rM
T/y
r
Fug
itive
Dus
t7.
5000
e-00
40.
0000
7.50
00e-
004
4.10
00e-
004
0.00
004.
1000
e-00
40.
0000
0.00
000.
0000
0.00
000.
0000
0.00
00
Off-
Roa
d1.
2100
e-00
30.
0105
7.92
00e-
003
1.00
00e-
005
7.30
00e-
004
7.30
00e-
004
7.00
00e-
004
7.00
00e-
004
0.00
001.
0699
1.06
992.
1000
e-00
40.
0000
1.07
51
To
tal
1.21
00e-
003
0.01
057.
9200
e-00
31.
0000
e-00
57.
5000
e-00
47.
3000
e-00
41.
4800
e-00
34.
1000
e-00
47.
0000
e-00
41.
1100
e-00
30.
0000
1.06
991.
0699
2.10
00e-
004
0.00
001.
0751
Un
mit
igat
ed C
on
stru
ctio
n O
n-S
ite
Cal
EE
Mod
Ver
sion
: Cal
EE
Mod
.201
6.3.
1D
ate:
1/4
/201
7 8:
19 A
MP
age
13 o
f 31
TR
ED
C H
otel
Pro
ject
- H
umbo
ldt C
ount
y, A
nnua
l

3.4
Gra
din
g -
201
7
RO
GN
Ox
CO
SO
2F
ugiti
veP
M10
Exh
aust
PM
10P
M10
Tot
alF
ugiti
veP
M2.
5E
xhau
stP
M2.
5P
M2.
5T
otal
Bio
- C
O2
NB
io-
CO
2T
otal
CO
2C
H4
N2O
CO
2e
Cat
egor
yto
ns/y
rM
T/y
r
Hau
ling
0.00
000.
0000
0.00
000.
0000
0.00
000.
0000
0.00
000.
0000
0.00
000.
0000
0.00
000.
0000
0.00
000.
0000
0.00
000.
0000
Ven
dor
0.00
000.
0000
0.00
000.
0000
0.00
000.
0000
0.00
000.
0000
0.00
000.
0000
0.00
000.
0000
0.00
000.
0000
0.00
000.
0000
Wor
ker
1.40
00e-
004
1.50
00e-
004
1.15
00e-
003
0.00
001.
2000
e-00
40.
0000
1.20
00e-
004
3.00
00e-
005
0.00
003.
0000
e-00
50.
0000
0.11
780.
1178
1.00
00e-
005
0.00
000.
1181
To
tal
1.40
00e-
004
1.50
00e-
004
1.15
00e-
003
0.00
001.
2000
e-00
40.
0000
1.20
00e-
004
3.00
00e-
005
0.00
003.
0000
e-00
50.
0000
0.11
780.
1178
1.00
00e-
005
0.00
000.
1181
Un
mit
igat
ed C
on
stru
ctio
n O
ff-S
ite
RO
GN
Ox
CO
SO
2F
ugiti
veP
M10
Exh
aust
PM
10P
M10
Tot
alF
ugiti
veP
M2.
5E
xhau
stP
M2.
5P
M2.
5T
otal
Bio
- C
O2
NB
io-
CO
2T
otal
CO
2C
H4
N2O
CO
2e
Cat
egor
yto
ns/y
rM
T/y
r
Fug
itive
Dus
t3.
4000
e-00
40.
0000
3.40
00e-
004
1.90
00e-
004
0.00
001.
9000
e-00
40.
0000
0.00
000.
0000
0.00
000.
0000
0.00
00
Off-
Roa
d2.
7000
e-00
45.
9600
e-00
37.
9400
e-00
31.
0000
e-00
56.
0000
e-00
56.
0000
e-00
56.
0000
e-00
56.
0000
e-00
50.
0000
1.06
991.
0699
2.10
00e-
004
0.00
001.
0751
To
tal
2.70
00e-
004
5.96
00e-
003
7.94
00e-
003
1.00
00e-
005
3.40
00e-
004
6.00
00e-
005
4.00
00e-
004
1.90
00e-
004
6.00
00e-
005
2.50
00e-
004
0.00
001.
0699
1.06
992.
1000
e-00
40.
0000
1.07
51
Mit
igat
ed C
on
stru
ctio
n O
n-S
ite
Cal
EE
Mod
Ver
sion
: Cal
EE
Mod
.201
6.3.
1D
ate:
1/4
/201
7 8:
19 A
MP
age
14 o
f 31
TR
ED
C H
otel
Pro
ject
- H
umbo
ldt C
ount
y, A
nnua
l

3.4
Gra
din
g -
201
7
RO
GN
Ox
CO
SO
2F
ugiti
veP
M10
Exh
aust
PM
10P
M10
Tot
alF
ugiti
veP
M2.
5E
xhau
stP
M2.
5P
M2.
5T
otal
Bio
- C
O2
NB
io-
CO
2T
otal
CO
2C
H4
N2O
CO
2e
Cat
egor
yto
ns/y
rM
T/y
r
Hau
ling
0.00
000.
0000
0.00
000.
0000
0.00
000.
0000
0.00
000.
0000
0.00
000.
0000
0.00
000.
0000
0.00
000.
0000
0.00
000.
0000
Ven
dor
0.00
000.
0000
0.00
000.
0000
0.00
000.
0000
0.00
000.
0000
0.00
000.
0000
0.00
000.
0000
0.00
000.
0000
0.00
000.
0000
Wor
ker
1.40
00e-
004
1.50
00e-
004
1.15
00e-
003
0.00
001.
2000
e-00
40.
0000
1.20
00e-
004
3.00
00e-
005
0.00
003.
0000
e-00
50.
0000
0.11
780.
1178
1.00
00e-
005
0.00
000.
1181
To
tal
1.40
00e-
004
1.50
00e-
004
1.15
00e-
003
0.00
001.
2000
e-00
40.
0000
1.20
00e-
004
3.00
00e-
005
0.00
003.
0000
e-00
50.
0000
0.11
780.
1178
1.00
00e-
005
0.00
000.
1181
Mit
igat
ed C
on
stru
ctio
n O
ff-S
ite
3.5
Bu
ildin
g C
on
stru
ctio
n -
201
7
RO
GN
Ox
CO
SO
2F
ugiti
veP
M10
Exh
aust
PM
10P
M10
Tot
alF
ugiti
veP
M2.
5E
xhau
stP
M2.
5P
M2.
5T
otal
Bio
- C
O2
NB
io-
CO
2T
otal
CO
2C
H4
N2O
CO
2e
Cat
egor
yto
ns/y
rM
T/y
r
Off-
Roa
d0.
0641
0.63
800.
4035
5.70
00e-
004
0.04
300.
0430
0.03
950.
0395
0.00
0052
.885
152
.885
10.
0162
0.00
0053
.290
2
To
tal
0.06
410.
6380
0.40
355.
7000
e-00
40.
0430
0.04
300.
0395
0.03
950.
0000
52.8
851
52.8
851
0.01
620.
0000
53.2
902
Un
mit
igat
ed C
on
stru
ctio
n O
n-S
ite
Cal
EE
Mod
Ver
sion
: Cal
EE
Mod
.201
6.3.
1D
ate:
1/4
/201
7 8:
19 A
MP
age
15 o
f 31
TR
ED
C H
otel
Pro
ject
- H
umbo
ldt C
ount
y, A
nnua
l
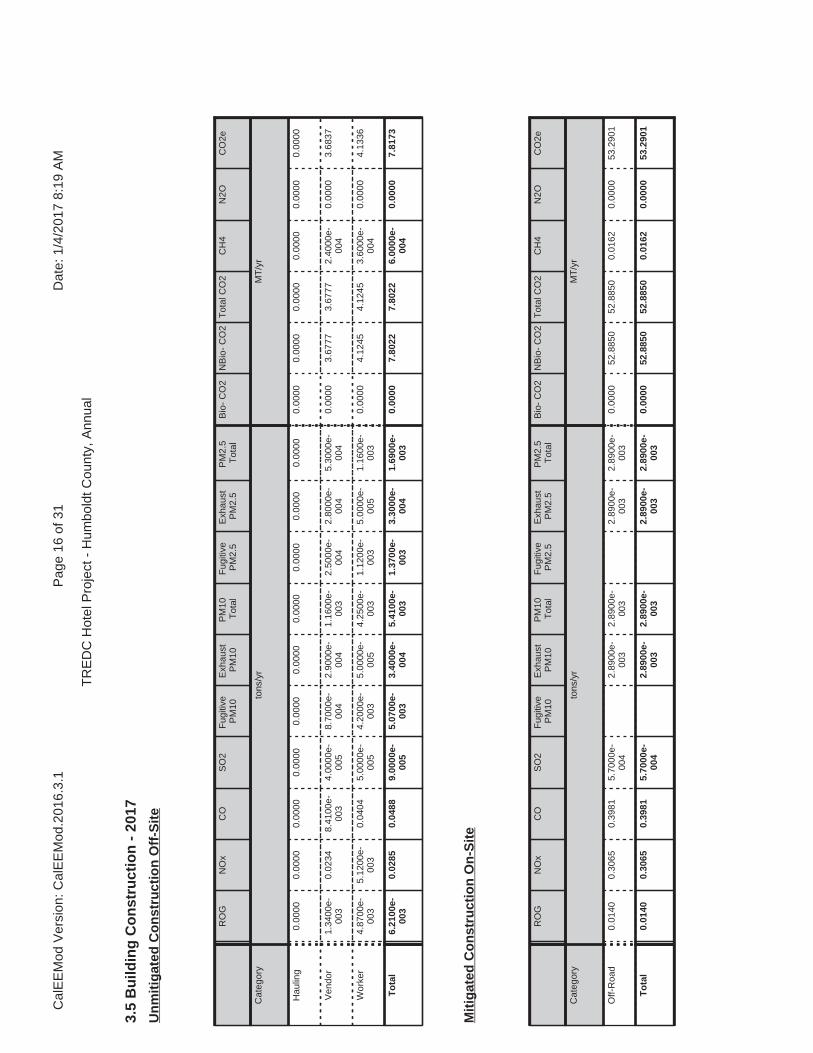
3.5
Bu
ildin
g C
on
stru
ctio
n -
201
7
RO
GN
Ox
CO
SO
2F
ugiti
veP
M10
Exh
aust
PM
10P
M10
Tot
alF
ugiti
veP
M2.
5E
xhau
stP
M2.
5P
M2.
5T
otal
Bio
- C
O2
NB
io-
CO
2T
otal
CO
2C
H4
N2O
CO
2e
Cat
egor
yto
ns/y
rM
T/y
r
Hau
ling
0.00
000.
0000
0.00
000.
0000
0.00
000.
0000
0.00
000.
0000
0.00
000.
0000
0.00
000.
0000
0.00
000.
0000
0.00
000.
0000
Ven
dor
1.34
00e-
003
0.02
348.
4100
e-00
34.
0000
e-00
58.
7000
e-00
42.
9000
e-00
41.
1600
e-00
32.
5000
e-00
42.
8000
e-00
45.
3000
e-00
40.
0000
3.67
773.
6777
2.40
00e-
004
0.00
003.
6837
Wor
ker
4.87
00e-
003
5.12
00e-
003
0.04
045.
0000
e-00
54.
2000
e-00
35.
0000
e-00
54.
2500
e-00
31.
1200
e-00
35.
0000
e-00
51.
1600
e-00
30.
0000
4.12
454.
1245
3.60
00e-
004
0.00
004.
1336
To
tal
6.21
00e-
003
0.02
850.
0488
9.00
00e-
005
5.07
00e-
003
3.40
00e-
004
5.41
00e-
003
1.37
00e-
003
3.30
00e-
004
1.69
00e-
003
0.00
007.
8022
7.80
226.
0000
e-00
40.
0000
7.81
73
Un
mit
igat
ed C
on
stru
ctio
n O
ff-S
ite
RO
GN
Ox
CO
SO
2F
ugiti
veP
M10
Exh
aust
PM
10P
M10
Tot
alF
ugiti
veP
M2.
5E
xhau
stP
M2.
5P
M2.
5T
otal
Bio
- C
O2
NB
io-
CO
2T
otal
CO
2C
H4
N2O
CO
2e
Cat
egor
yto
ns/y
rM
T/y
r
Off-
Roa
d0.
0140
0.30
650.
3981
5.70
00e-
004
2.89
00e-
003
2.89
00e-
003
2.89
00e-
003
2.89
00e-
003
0.00
0052
.885
052
.885
00.
0162
0.00
0053
.290
1
To
tal
0.01
400.
3065
0.39
815.
7000
e-00
42.
8900
e-00
32.
8900
e-00
32.
8900
e-00
32.
8900
e-00
30.
0000
52.8
850
52.8
850
0.01
620.
0000
53.2
901
Mit
igat
ed C
on
stru
ctio
n O
n-S
ite
Cal
EE
Mod
Ver
sion
: Cal
EE
Mod
.201
6.3.
1D
ate:
1/4
/201
7 8:
19 A
MP
age
16 o
f 31
TR
ED
C H
otel
Pro
ject
- H
umbo
ldt C
ount
y, A
nnua
l

3.5
Bu
ildin
g C
on
stru
ctio
n -
201
7
RO
GN
Ox
CO
SO
2F
ugiti
veP
M10
Exh
aust
PM
10P
M10
Tot
alF
ugiti
veP
M2.
5E
xhau
stP
M2.
5P
M2.
5T
otal
Bio
- C
O2
NB
io-
CO
2T
otal
CO
2C
H4
N2O
CO
2e
Cat
egor
yto
ns/y
rM
T/y
r
Hau
ling
0.00
000.
0000
0.00
000.
0000
0.00
000.
0000
0.00
000.
0000
0.00
000.
0000
0.00
000.
0000
0.00
000.
0000
0.00
000.
0000
Ven
dor
1.34
00e-
003
0.02
348.
4100
e-00
34.
0000
e-00
58.
7000
e-00
42.
9000
e-00
41.
1600
e-00
32.
5000
e-00
42.
8000
e-00
45.
3000
e-00
40.
0000
3.67
773.
6777
2.40
00e-
004
0.00
003.
6837
Wor
ker
4.87
00e-
003
5.12
00e-
003
0.04
045.
0000
e-00
54.
2000
e-00
35.
0000
e-00
54.
2500
e-00
31.
1200
e-00
35.
0000
e-00
51.
1600
e-00
30.
0000
4.12
454.
1245
3.60
00e-
004
0.00
004.
1336
To
tal
6.21
00e-
003
0.02
850.
0488
9.00
00e-
005
5.07
00e-
003
3.40
00e-
004
5.41
00e-
003
1.37
00e-
003
3.30
00e-
004
1.69
00e-
003
0.00
007.
8022
7.80
226.
0000
e-00
40.
0000
7.81
73
Mit
igat
ed C
on
stru
ctio
n O
ff-S
ite
3.6
Arc
hit
ectu
ral C
oat
ing
- 2
017
RO
GN
Ox
CO
SO
2F
ugiti
veP
M10
Exh
aust
PM
10P
M10
Tot
alF
ugiti
veP
M2.
5E
xhau
stP
M2.
5P
M2.
5T
otal
Bio
- C
O2
NB
io-
CO
2T
otal
CO
2C
H4
N2O
CO
2e
Cat
egor
yto
ns/y
rM
T/y
r
Arc
hit.
Coa
ting
0.20
190.
0000
0.00
000.
0000
0.00
000.
0000
0.00
000.
0000
0.00
000.
0000
0.00
00
Off-
Roa
d8.
3000
e-00
45.
4600
e-00
34.
6700
e-00
31.
0000
e-00
54.
3000
e-00
44.
3000
e-00
44.
3000
e-00
44.
3000
e-00
40.
0000
0.63
830.
6383
7.00
00e-
005
0.00
000.
6400
To
tal
0.20
275.
4600
e-00
34.
6700
e-00
31.
0000
e-00
54.
3000
e-00
44.
3000
e-00
44.
3000
e-00
44.
3000
e-00
40.
0000
0.63
830.
6383
7.00
00e-
005
0.00
000.
6400
Un
mit
igat
ed C
on
stru
ctio
n O
n-S
ite
Cal
EE
Mod
Ver
sion
: Cal
EE
Mod
.201
6.3.
1D
ate:
1/4
/201
7 8:
19 A
MP
age
17 o
f 31
TR
ED
C H
otel
Pro
ject
- H
umbo
ldt C
ount
y, A
nnua
l
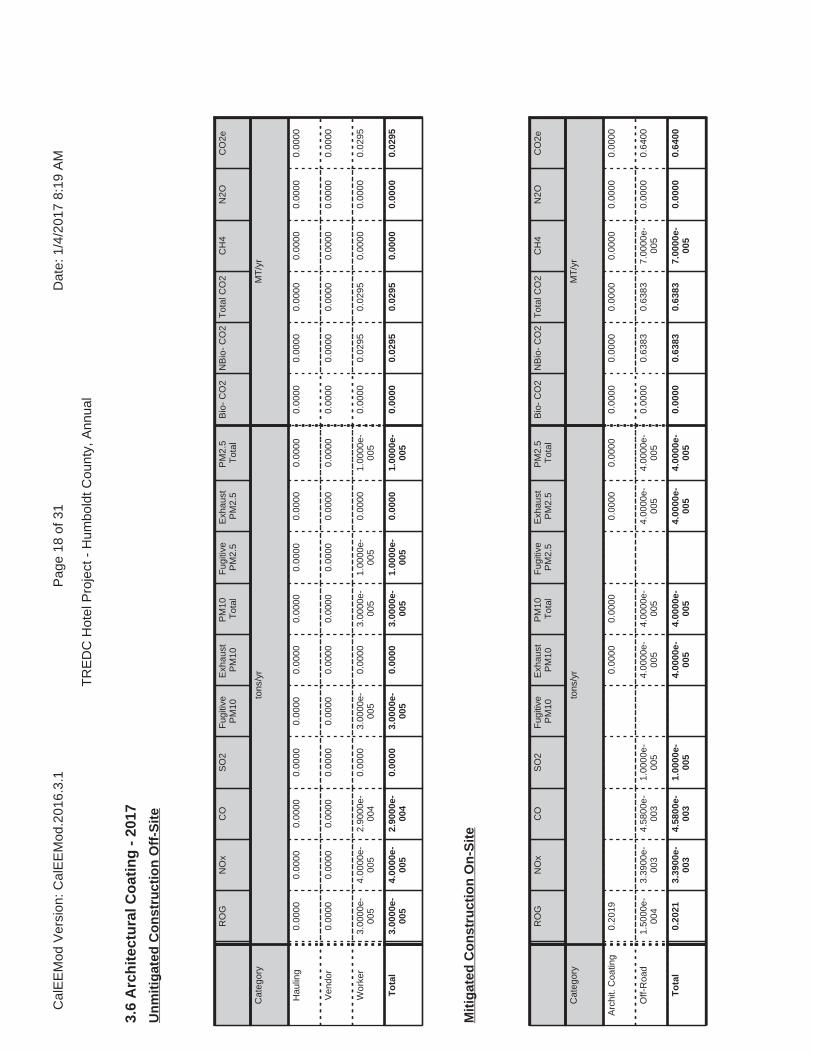
3.6
Arc
hit
ectu
ral C
oat
ing
- 2
017
RO
GN
Ox
CO
SO
2F
ugiti
veP
M10
Exh
aust
PM
10P
M10
Tot
alF
ugiti
veP
M2.
5E
xhau
stP
M2.
5P
M2.
5T
otal
Bio
- C
O2
NB
io-
CO
2T
otal
CO
2C
H4
N2O
CO
2e
Cat
egor
yto
ns/y
rM
T/y
r
Hau
ling
0.00
000.
0000
0.00
000.
0000
0.00
000.
0000
0.00
000.
0000
0.00
000.
0000
0.00
000.
0000
0.00
000.
0000
0.00
000.
0000
Ven
dor
0.00
000.
0000
0.00
000.
0000
0.00
000.
0000
0.00
000.
0000
0.00
000.
0000
0.00
000.
0000
0.00
000.
0000
0.00
000.
0000
Wor
ker
3.00
00e-
005
4.00
00e-
005
2.90
00e-
004
0.00
003.
0000
e-00
50.
0000
3.00
00e-
005
1.00
00e-
005
0.00
001.
0000
e-00
50.
0000
0.02
950.
0295
0.00
000.
0000
0.02
95
To
tal
3.00
00e-
005
4.00
00e-
005
2.90
00e-
004
0.00
003.
0000
e-00
50.
0000
3.00
00e-
005
1.00
00e-
005
0.00
001.
0000
e-00
50.
0000
0.02
950.
0295
0.00
000.
0000
0.02
95
Un
mit
igat
ed C
on
stru
ctio
n O
ff-S
ite
RO
GN
Ox
CO
SO
2F
ugiti
veP
M10
Exh
aust
PM
10P
M10
Tot
alF
ugiti
veP
M2.
5E
xhau
stP
M2.
5P
M2.
5T
otal
Bio
- C
O2
NB
io-
CO
2T
otal
CO
2C
H4
N2O
CO
2e
Cat
egor
yto
ns/y
rM
T/y
r
Arc
hit.
Coa
ting
0.20
190.
0000
0.00
000.
0000
0.00
000.
0000
0.00
000.
0000
0.00
000.
0000
0.00
00
Off-
Roa
d1.
5000
e-00
43.
3900
e-00
34.
5800
e-00
31.
0000
e-00
54.
0000
e-00
54.
0000
e-00
54.
0000
e-00
54.
0000
e-00
50.
0000
0.63
830.
6383
7.00
00e-
005
0.00
000.
6400
To
tal
0.20
213.
3900
e-00
34.
5800
e-00
31.
0000
e-00
54.
0000
e-00
54.
0000
e-00
54.
0000
e-00
54.
0000
e-00
50.
0000
0.63
830.
6383
7.00
00e-
005
0.00
000.
6400
Mit
igat
ed C
on
stru
ctio
n O
n-S
ite
Cal
EE
Mod
Ver
sion
: Cal
EE
Mod
.201
6.3.
1D
ate:
1/4
/201
7 8:
19 A
MP
age
18 o
f 31
TR
ED
C H
otel
Pro
ject
- H
umbo
ldt C
ount
y, A
nnua
l

3.6
Arc
hit
ectu
ral C
oat
ing
- 2
017
RO
GN
Ox
CO
SO
2F
ugiti
veP
M10
Exh
aust
PM
10P
M10
Tot
alF
ugiti
veP
M2.
5E
xhau
stP
M2.
5P
M2.
5T
otal
Bio
- C
O2
NB
io-
CO
2T
otal
CO
2C
H4
N2O
CO
2e
Cat
egor
yto
ns/y
rM
T/y
r
Hau
ling
0.00
000.
0000
0.00
000.
0000
0.00
000.
0000
0.00
000.
0000
0.00
000.
0000
0.00
000.
0000
0.00
000.
0000
0.00
000.
0000
Ven
dor
0.00
000.
0000
0.00
000.
0000
0.00
000.
0000
0.00
000.
0000
0.00
000.
0000
0.00
000.
0000
0.00
000.
0000
0.00
000.
0000
Wor
ker
3.00
00e-
005
4.00
00e-
005
2.90
00e-
004
0.00
003.
0000
e-00
50.
0000
3.00
00e-
005
1.00
00e-
005
0.00
001.
0000
e-00
50.
0000
0.02
950.
0295
0.00
000.
0000
0.02
95
To
tal
3.00
00e-
005
4.00
00e-
005
2.90
00e-
004
0.00
003.
0000
e-00
50.
0000
3.00
00e-
005
1.00
00e-
005
0.00
001.
0000
e-00
50.
0000
0.02
950.
0295
0.00
000.
0000
0.02
95
Mit
igat
ed C
on
stru
ctio
n O
ff-S
ite
3.7
Pav
ing
- 2
017
RO
GN
Ox
CO
SO
2F
ugiti
veP
M10
Exh
aust
PM
10P
M10
Tot
alF
ugiti
veP
M2.
5E
xhau
stP
M2.
5P
M2.
5T
otal
Bio
- C
O2
NB
io-
CO
2T
otal
CO
2C
H4
N2O
CO
2e
Cat
egor
yto
ns/y
rM
T/y
r
Off-
Roa
d2.
6300
e-00
30.
0249
0.01
843.
0000
e-00
51.
5200
e-00
31.
5200
e-00
31.
4100
e-00
31.
4100
e-00
30.
0000
2.46
102.
4610
6.80
00e-
004
0.00
002.
4781
Pav
ing
0.00
000.
0000
0.00
000.
0000
0.00
000.
0000
0.00
000.
0000
0.00
000.
0000
0.00
00
To
tal
2.63
00e-
003
0.02
490.
0184
3.00
00e-
005
1.52
00e-
003
1.52
00e-
003
1.41
00e-
003
1.41
00e-
003
0.00
002.
4610
2.46
106.
8000
e-00
40.
0000
2.47
81
Un
mit
igat
ed C
on
stru
ctio
n O
n-S
ite
Cal
EE
Mod
Ver
sion
: Cal
EE
Mod
.201
6.3.
1D
ate:
1/4
/201
7 8:
19 A
MP
age
19 o
f 31
TR
ED
C H
otel
Pro
ject
- H
umbo
ldt C
ount
y, A
nnua
l

3.7
Pav
ing
- 2
017
RO
GN
Ox
CO
SO
2F
ugiti
veP
M10
Exh
aust
PM
10P
M10
Tot
alF
ugiti
veP
M2.
5E
xhau
stP
M2.
5P
M2.
5T
otal
Bio
- C
O2
NB
io-
CO
2T
otal
CO
2C
H4
N2O
CO
2e
Cat
egor
yto
ns/y
rM
T/y
r
Hau
ling
0.00
000.
0000
0.00
000.
0000
0.00
000.
0000
0.00
000.
0000
0.00
000.
0000
0.00
000.
0000
0.00
000.
0000
0.00
000.
0000
Ven
dor
0.00
000.
0000
0.00
000.
0000
0.00
000.
0000
0.00
000.
0000
0.00
000.
0000
0.00
000.
0000
0.00
000.
0000
0.00
000.
0000
Wor
ker
6.30
00e-
004
6.60
00e-
004
5.20
00e-
003
1.00
00e-
005
5.40
00e-
004
1.00
00e-
005
5.50
00e-
004
1.40
00e-
004
1.00
00e-
005
1.50
00e-
004
0.00
000.
5303
0.53
035.
0000
e-00
50.
0000
0.53
15
To
tal
6.30
00e-
004
6.60
00e-
004
5.20
00e-
003
1.00
00e-
005
5.40
00e-
004
1.00
00e-
005
5.50
00e-
004
1.40
00e-
004
1.00
00e-
005
1.50
00e-
004
0.00
000.
5303
0.53
035.
0000
e-00
50.
0000
0.53
15
Un
mit
igat
ed C
on
stru
ctio
n O
ff-S
ite
RO
GN
Ox
CO
SO
2F
ugiti
veP
M10
Exh
aust
PM
10P
M10
Tot
alF
ugiti
veP
M2.
5E
xhau
stP
M2.
5P
M2.
5T
otal
Bio
- C
O2
NB
io-
CO
2T
otal
CO
2C
H4
N2O
CO
2e
Cat
egor
yto
ns/y
rM
T/y
r
Off-
Roa
d5.
6000
e-00
40.
0119
0.01
733.
0000
e-00
51.
1000
e-00
41.
1000
e-00
41.
1000
e-00
41.
1000
e-00
40.
0000
2.46
102.
4610
6.80
00e-
004
0.00
002.
4781
Pav
ing
0.00
000.
0000
0.00
000.
0000
0.00
000.
0000
0.00
000.
0000
0.00
000.
0000
0.00
00
To
tal
5.60
00e-
004
0.01
190.
0173
3.00
00e-
005
1.10
00e-
004
1.10
00e-
004
1.10
00e-
004
1.10
00e-
004
0.00
002.
4610
2.46
106.
8000
e-00
40.
0000
2.47
81
Mit
igat
ed C
on
stru
ctio
n O
n-S
ite
Cal
EE
Mod
Ver
sion
: Cal
EE
Mod
.201
6.3.
1D
ate:
1/4
/201
7 8:
19 A
MP
age
20 o
f 31
TR
ED
C H
otel
Pro
ject
- H
umbo
ldt C
ount
y, A
nnua
l
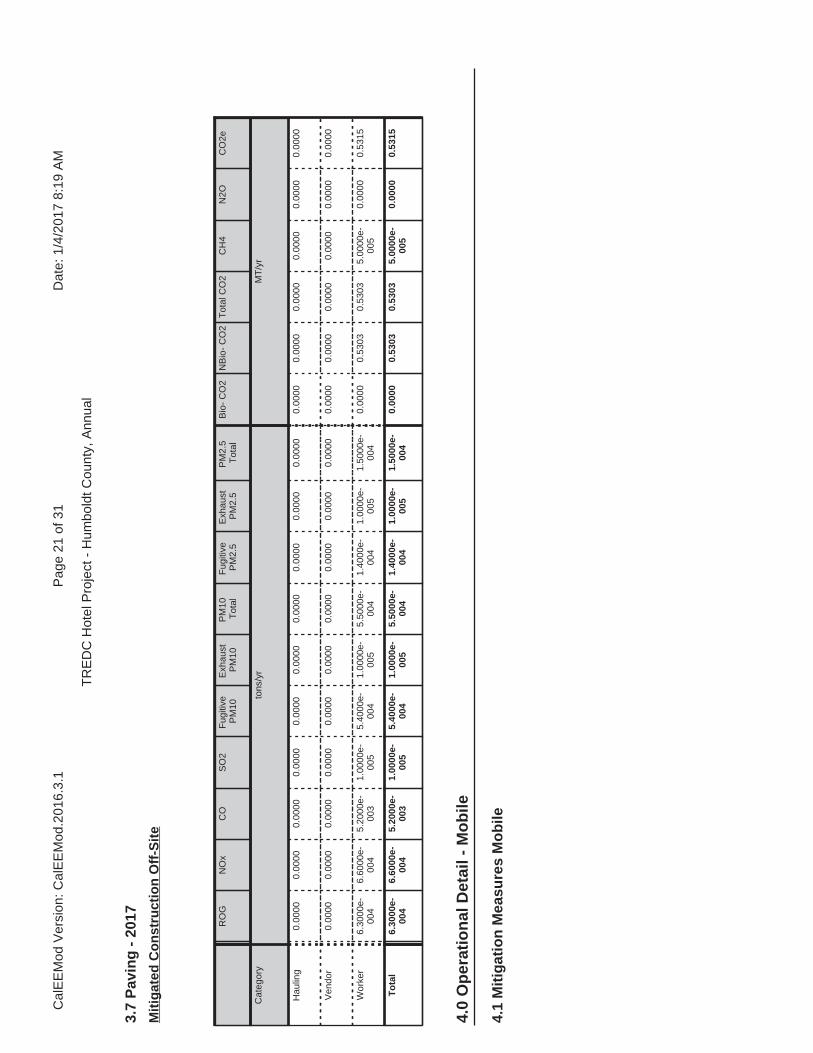
4.0
Op
erat
ion
al D
etai
l - M
ob
ile
4.1
Mit
igat
ion
Mea
sure
s M
ob
ile
3.7
Pav
ing
- 2
017
RO
GN
Ox
CO
SO
2F
ugiti
veP
M10
Exh
aust
PM
10P
M10
Tot
alF
ugiti
veP
M2.
5E
xhau
stP
M2.
5P
M2.
5T
otal
Bio
- C
O2
NB
io-
CO
2T
otal
CO
2C
H4
N2O
CO
2e
Cat
egor
yto
ns/y
rM
T/y
r
Hau
ling
0.00
000.
0000
0.00
000.
0000
0.00
000.
0000
0.00
000.
0000
0.00
000.
0000
0.00
000.
0000
0.00
000.
0000
0.00
000.
0000
Ven
dor
0.00
000.
0000
0.00
000.
0000
0.00
000.
0000
0.00
000.
0000
0.00
000.
0000
0.00
000.
0000
0.00
000.
0000
0.00
000.
0000
Wor
ker
6.30
00e-
004
6.60
00e-
004
5.20
00e-
003
1.00
00e-
005
5.40
00e-
004
1.00
00e-
005
5.50
00e-
004
1.40
00e-
004
1.00
00e-
005
1.50
00e-
004
0.00
000.
5303
0.53
035.
0000
e-00
50.
0000
0.53
15
To
tal
6.30
00e-
004
6.60
00e-
004
5.20
00e-
003
1.00
00e-
005
5.40
00e-
004
1.00
00e-
005
5.50
00e-
004
1.40
00e-
004
1.00
00e-
005
1.50
00e-
004
0.00
000.
5303
0.53
035.
0000
e-00
50.
0000
0.53
15
Mit
igat
ed C
on
stru
ctio
n O
ff-S
ite
Cal
EE
Mod
Ver
sion
: Cal
EE
Mod
.201
6.3.
1D
ate:
1/4
/201
7 8:
19 A
MP
age
21 o
f 31
TR
ED
C H
otel
Pro
ject
- H
umbo
ldt C
ount
y, A
nnua
l

RO
GN
Ox
CO
SO
2F
ugiti
veP
M10
Exh
aust
PM
10P
M10
Tot
alF
ugiti
veP
M2.
5E
xhau
stP
M2.
5P
M2.
5T
otal
Bio
- C
O2
NB
io-
CO
2T
otal
CO
2C
H4
N2O
CO
2e
Cat
egor
yto
ns/y
rM
T/y
r
Miti
gate
d0.
5918
3.89
398.
7755
0.01
701.
1881
0.03
751.
2256
0.32
070.
0356
0.35
630.
0000
1,55
1.63
33
1,55
1.63
33
0.09
620.
0000
1,55
4.03
74
Unm
itiga
ted
0.59
183.
8939
8.77
550.
0170
1.18
810.
0375
1.22
560.
3207
0.03
560.
3563
0.00
001,
551.
633
31,
551.
633
30.
0962
0.00
001,
554.
037
4
4.2
Tri
p S
um
mar
y In
form
atio
n
4.3
Tri
p T
ype
Info
rmat
ion
Ave
rage
Dai
ly T
rip R
ate
Unm
itiga
ted
Miti
gate
d
Land
Use
Wee
kday
Sat
urda
yS
unda
yA
nnua
l VM
TA
nnua
l VM
T
Hot
el57
2.00
573.
0041
7.00
3,24
4,04
13,
244,
041
Tot
al57
2.00
573.
0041
7.00
3,24
4,04
13,
244,
041
Mile
sT
rip %
Trip
Pur
pose
%
Land
Use
H-W
or
C-W
H-S
or
C-C
H-O
or
C-N
WH
-W o
r C
-WH
-S o
r C
-CH
-O o
r C
-NW
Prim
ary
Div
erte
dP
ass-
by
Hot
el24
.00
24.0
024
.00
19.4
061
.60
19.0
058
384
5.0
En
erg
y D
etai
l
4.4
Fle
et M
ix
Land
Use
LD
ALD
T1
LDT
2M
DV
LHD
1LH
D2
MH
DH
HD
OB
US
UB
US
MC
YS
BU
SM
H
Hot
el0.
4487
950.
0606
870.
2061
490.
1458
870.
0579
160.
0092
820.
0146
260.
0426
270.
0029
290.
0019
050.
0064
090.
0015
530.
0012
36
His
toric
al E
nerg
y U
se: N
Cal
EE
Mod
Ver
sion
: Cal
EE
Mod
.201
6.3.
1D
ate:
1/4
/201
7 8:
19 A
MP
age
22 o
f 31
TR
ED
C H
otel
Pro
ject
- H
umbo
ldt C
ount
y, A
nnua
l
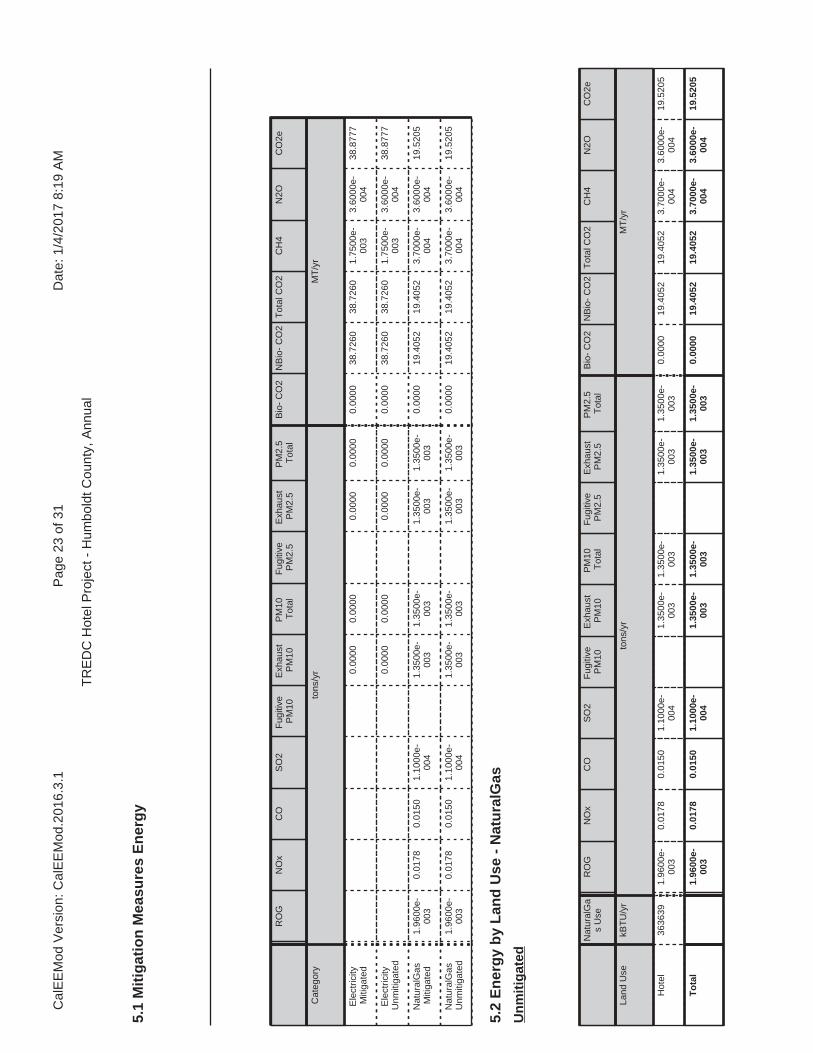
RO
GN
Ox
CO
SO
2F
ugiti
veP
M10
Exh
aust
PM
10P
M10
Tot
alF
ugiti
veP
M2.
5E
xhau
stP
M2.
5P
M2.
5T
otal
Bio
- C
O2
NB
io-
CO
2T
otal
CO
2C
H4
N2O
CO
2e
Cat
egor
yto
ns/y
rM
T/y
r
Ele
ctric
ityM
itiga
ted
0.00
000.
0000
0.00
000.
0000
0.00
0038
.726
038
.726
01.
7500
e-00
33.
6000
e-00
438
.877
7
Ele
ctric
ityU
nmiti
gate
d0.
0000
0.00
000.
0000
0.00
000.
0000
38.7
260
38.7
260
1.75
00e-
003
3.60
00e-
004
38.8
777
Nat
ural
Gas
Miti
gate
d1.
9600
e-00
30.
0178
0.01
501.
1000
e-00
41.
3500
e-00
31.
3500
e-00
31.
3500
e-00
31.
3500
e-00
30.
0000
19.4
052
19.4
052
3.70
00e-
004
3.60
00e-
004
19.5
205
Nat
ural
Gas
Unm
itiga
ted
1.96
00e-
003
0.01
780.
0150
1.10
00e-
004
1.35
00e-
003
1.35
00e-
003
1.35
00e-
003
1.35
00e-
003
0.00
0019
.405
219
.405
23.
7000
e-00
43.
6000
e-00
419
.520
5
5.2
En
erg
y b
y L
and
Use
- N
atu
ralG
as
Nat
ural
Ga
s U
seR
OG
NO
xC
OS
O2
Fug
itive
PM
10E
xhau
stP
M10
PM
10T
otal
Fug
itive
PM
2.5
Exh
aust
PM
2.5
PM
2.5
Tot
alB
io-
CO
2N
Bio
- C
O2
Tot
al C
O2
CH
4N
2OC
O2e
Land
Use
kBT
U/y
rto
ns/y
rM
T/y
r
Hot
el36
3639
1.96
00e-
003
0.01
780.
0150
1.10
00e-
004
1.35
00e-
003
1.35
00e-
003
1.35
00e-
003
1.35
00e-
003
0.00
0019
.405
219
.405
23.
7000
e-00
43.
6000
e-00
419
.520
5
To
tal
1.96
00e-
003
0.01
780.
0150
1.10
00e-
004
1.35
00e-
003
1.35
00e-
003
1.35
00e-
003
1.35
00e-
003
0.00
0019
.405
219
.405
23.
7000
e-00
43.
6000
e-00
419
.520
5
Un
mit
igat
ed
5.1
Mit
igat
ion
Mea
sure
s E
ner
gy
Cal
EE
Mod
Ver
sion
: Cal
EE
Mod
.201
6.3.
1D
ate:
1/4
/201
7 8:
19 A
MP
age
23 o
f 31
TR
ED
C H
otel
Pro
ject
- H
umbo
ldt C
ount
y, A
nnua
l
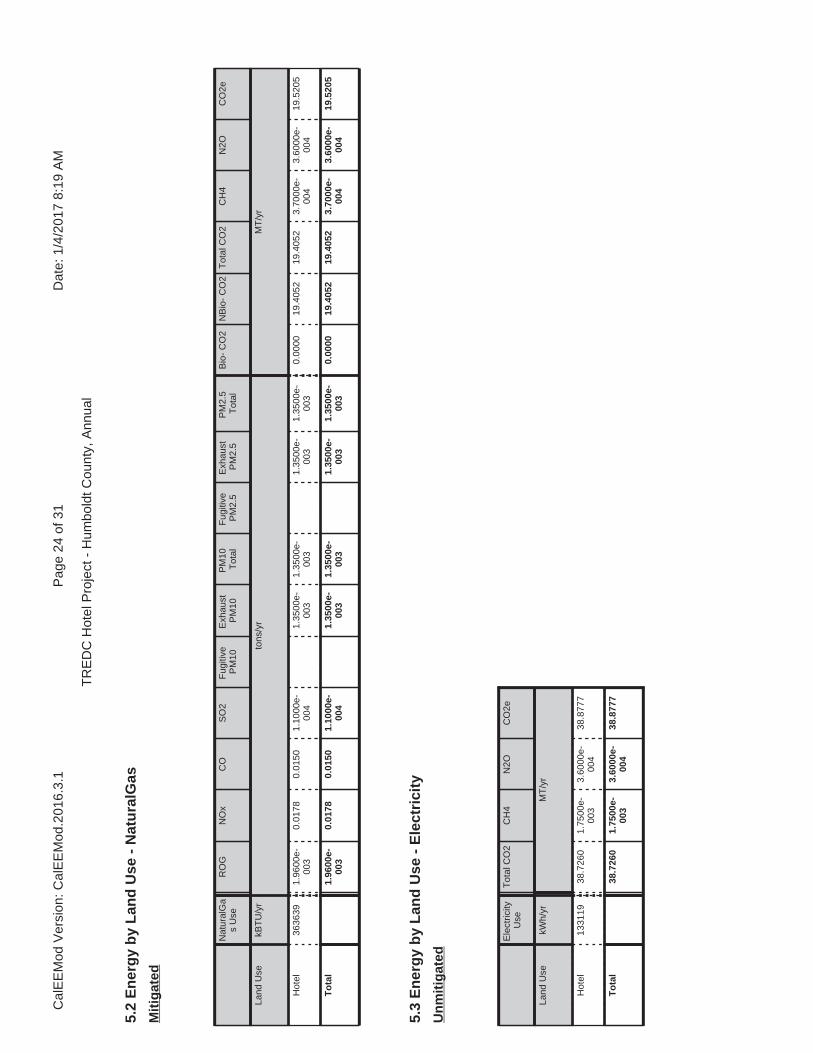
5.2
En
erg
y b
y L
and
Use
- N
atu
ralG
as
Nat
ural
Ga
s U
seR
OG
NO
xC
OS
O2
Fug
itive
PM
10E
xhau
stP
M10
PM
10T
otal
Fug
itive
PM
2.5
Exh
aust
PM
2.5
PM
2.5
Tot
alB
io-
CO
2N
Bio
- C
O2
Tot
al C
O2
CH
4N
2OC
O2e
Land
Use
kBT
U/y
rto
ns/y
rM
T/y
r
Hot
el36
3639
1.96
00e-
003
0.01
780.
0150
1.10
00e-
004
1.35
00e-
003
1.35
00e-
003
1.35
00e-
003
1.35
00e-
003
0.00
0019
.405
219
.405
23.
7000
e-00
43.
6000
e-00
419
.520
5
To
tal
1.96
00e-
003
0.01
780.
0150
1.10
00e-
004
1.35
00e-
003
1.35
00e-
003
1.35
00e-
003
1.35
00e-
003
0.00
0019
.405
219
.405
23.
7000
e-00
43.
6000
e-00
419
.520
5
Mit
igat
ed
5.3
En
erg
y b
y L
and
Use
- E
lect
rici
ty
Ele
ctric
ityU
seT
otal
CO
2C
H4
N2O
CO
2e
Land
Use
kWh/
yrM
T/y
r
Hot
el13
3119
38.7
260
1.75
00e-
003
3.60
00e-
004
38.8
777
To
tal
38.7
260
1.75
00e-
003
3.60
00e-
004
38.8
777
Un
mit
igat
ed
Cal
EE
Mod
Ver
sion
: Cal
EE
Mod
.201
6.3.
1D
ate:
1/4
/201
7 8:
19 A
MP
age
24 o
f 31
TR
ED
C H
otel
Pro
ject
- H
umbo
ldt C
ount
y, A
nnua
l

6.1
Mit
igat
ion
Mea
sure
s A
rea
6.0
Are
a D
etai
l
RO
GN
Ox
CO
SO
2F
ugiti
veP
M10
Exh
aust
PM
10P
M10
Tot
alF
ugiti
veP
M2.
5E
xhau
stP
M2.
5P
M2.
5T
otal
Bio
- C
O2
NB
io-
CO
2T
otal
CO
2C
H4
N2O
CO
2e
Cat
egor
yto
ns/y
rM
T/y
r
Miti
gate
d0.
0883
1.00
00e-
005
9.30
00e-
004
0.00
000.
0000
0.00
000.
0000
0.00
000.
0000
1.79
00e-
003
1.79
00e-
003
0.00
000.
0000
1.91
00e-
003
Unm
itiga
ted
0.08
831.
0000
e-00
59.
3000
e-00
40.
0000
0.00
000.
0000
0.00
000.
0000
0.00
001.
7900
e-00
31.
7900
e-00
30.
0000
0.00
001.
9100
e-00
3
5.3
En
erg
y b
y L
and
Use
- E
lect
rici
ty
Ele
ctric
ityU
seT
otal
CO
2C
H4
N2O
CO
2e
Land
Use
kWh/
yrM
T/y
r
Hot
el13
3119
38.7
260
1.75
00e-
003
3.60
00e-
004
38.8
777
To
tal
38.7
260
1.75
00e-
003
3.60
00e-
004
38.8
777
Mit
igat
ed
Cal
EE
Mod
Ver
sion
: Cal
EE
Mod
.201
6.3.
1D
ate:
1/4
/201
7 8:
19 A
MP
age
25 o
f 31
TR
ED
C H
otel
Pro
ject
- H
umbo
ldt C
ount
y, A
nnua
l
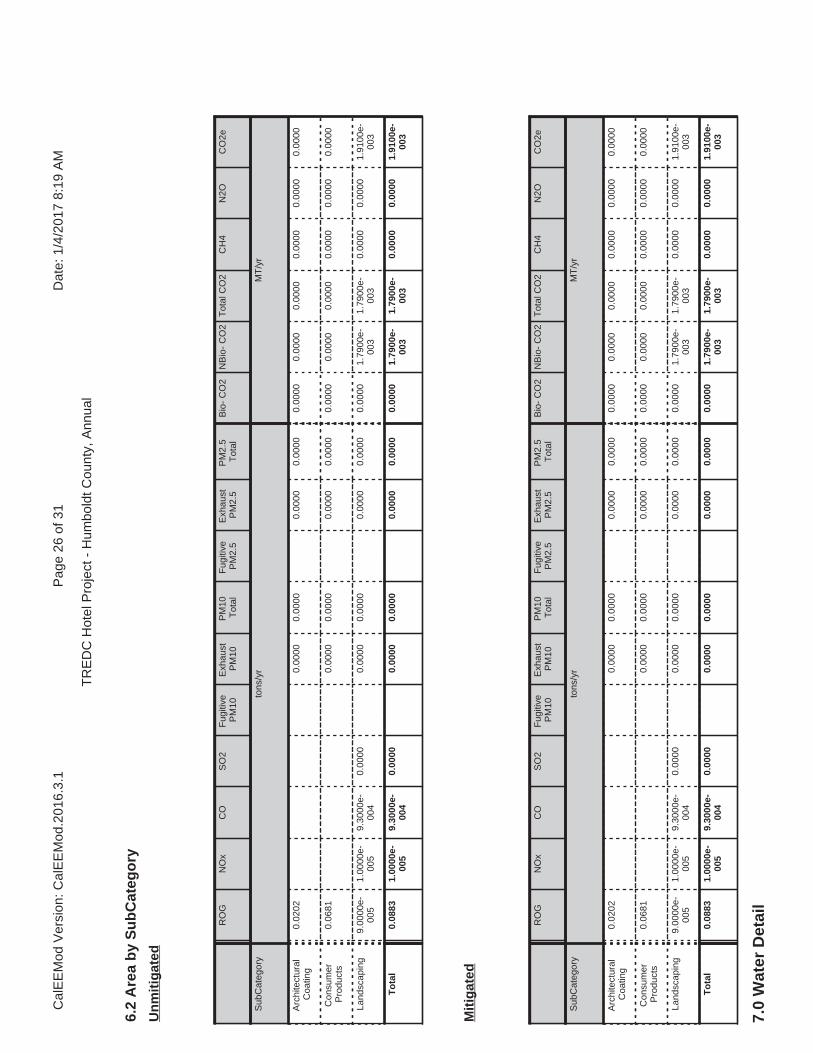
7.0
Wat
er D
etai
l
6.2
Are
a b
y S
ub
Cat
ego
ry
RO
GN
Ox
CO
SO
2F
ugiti
veP
M10
Exh
aust
PM
10P
M10
Tot
alF
ugiti
veP
M2.
5E
xhau
stP
M2.
5P
M2.
5T
otal
Bio
- C
O2
NB
io-
CO
2T
otal
CO
2C
H4
N2O
CO
2e
Sub
Cat
egor
yto
ns/y
rM
T/y
r
Arc
hite
ctur
alC
oatin
g0.
0202
0.00
000.
0000
0.00
000.
0000
0.00
000.
0000
0.00
000.
0000
0.00
000.
0000
Con
sum
erP
rodu
cts
0.06
810.
0000
0.00
000.
0000
0.00
000.
0000
0.00
000.
0000
0.00
000.
0000
0.00
00
Land
scap
ing
9.00
00e-
005
1.00
00e-
005
9.30
00e-
004
0.00
000.
0000
0.00
000.
0000
0.00
000.
0000
1.79
00e-
003
1.79
00e-
003
0.00
000.
0000
1.91
00e-
003
To
tal
0.08
831.
0000
e-00
59.
3000
e-00
40.
0000
0.00
000.
0000
0.00
000.
0000
0.00
001.
7900
e-00
31.
7900
e-00
30.
0000
0.00
001.
9100
e-00
3
Un
mit
igat
ed
RO
GN
Ox
CO
SO
2F
ugiti
veP
M10
Exh
aust
PM
10P
M10
Tot
alF
ugiti
veP
M2.
5E
xhau
stP
M2.
5P
M2.
5T
otal
Bio
- C
O2
NB
io-
CO
2T
otal
CO
2C
H4
N2O
CO
2e
Sub
Cat
egor
yto
ns/y
rM
T/y
r
Arc
hite
ctur
alC
oatin
g0.
0202
0.00
000.
0000
0.00
000.
0000
0.00
000.
0000
0.00
000.
0000
0.00
000.
0000
Con
sum
erP
rodu
cts
0.06
810.
0000
0.00
000.
0000
0.00
000.
0000
0.00
000.
0000
0.00
000.
0000
0.00
00
Land
scap
ing
9.00
00e-
005
1.00
00e-
005
9.30
00e-
004
0.00
000.
0000
0.00
000.
0000
0.00
000.
0000
1.79
00e-
003
1.79
00e-
003
0.00
000.
0000
1.91
00e-
003
To
tal
0.08
831.
0000
e-00
59.
3000
e-00
40.
0000
0.00
000.
0000
0.00
000.
0000
0.00
001.
7900
e-00
31.
7900
e-00
30.
0000
0.00
001.
9100
e-00
3
Mit
igat
ed
Cal
EE
Mod
Ver
sion
: Cal
EE
Mod
.201
6.3.
1D
ate:
1/4
/201
7 8:
19 A
MP
age
26 o
f 31
TR
ED
C H
otel
Pro
ject
- H
umbo
ldt C
ount
y, A
nnua
l
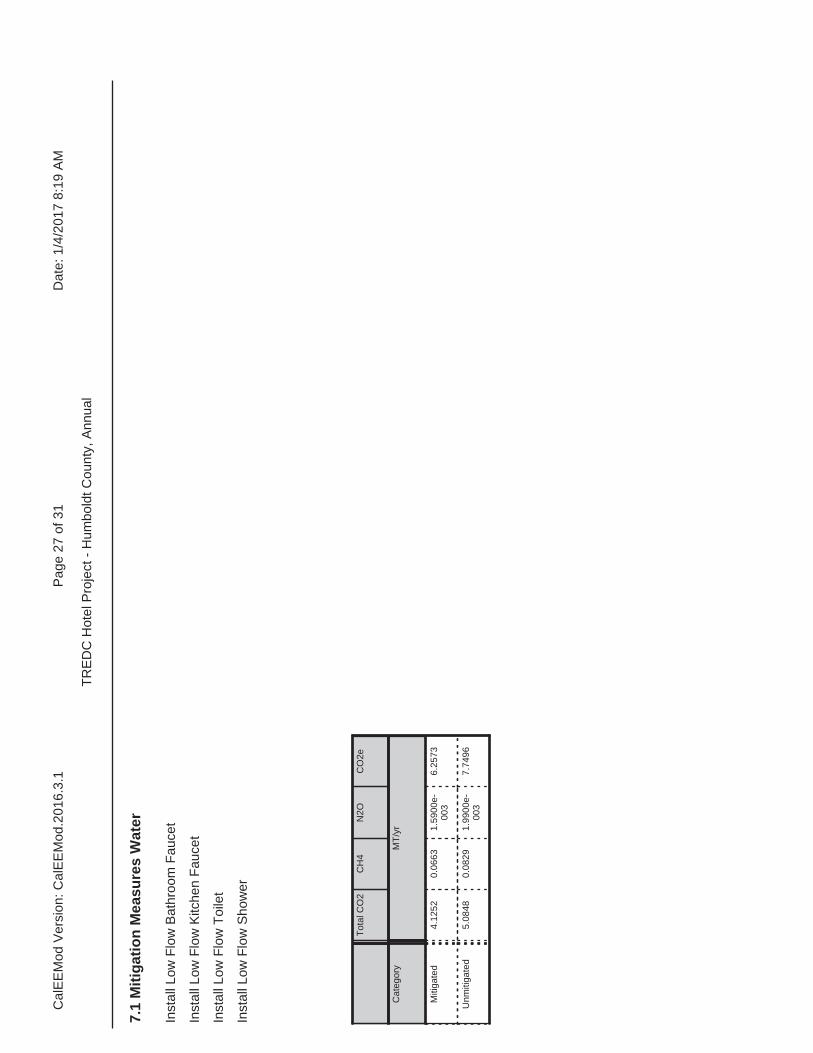
Inst
all L
ow F
low
Bat
hroo
m F
auce
t
Inst
all L
ow F
low
Kitc
hen
Fau
cet
Inst
all L
ow F
low
Toi
let
Inst
all L
ow F
low
Sho
wer
7.1
Mit
igat
ion
Mea
sure
s W
ater
Tot
al C
O2
CH
4N
2OC
O2e
Cat
egor
yM
T/y
r
Miti
gate
d4.
1252
0.06
631.
5900
e-00
36.
2573
Unm
itiga
ted
5.08
480.
0829
1.99
00e-
003
7.74
96
Cal
EE
Mod
Ver
sion
: Cal
EE
Mod
.201
6.3.
1D
ate:
1/4
/201
7 8:
19 A
MP
age
27 o
f 31
TR
ED
C H
otel
Pro
ject
- H
umbo
ldt C
ount
y, A
nnua
l

8.1
Mit
igat
ion
Mea
sure
s W
aste
7.2
Wat
er b
y L
and
Use
Indo
or/O
utdo
or U
seT
otal
CO
2C
H4
N2O
CO
2e
Land
Use
Mga
lM
T/y
r
Hot
el2.
5366
8 /
0.28
1853
5.08
480.
0829
1.99
00e-
003
7.74
96
To
tal
5.08
480.
0829
1.99
00e-
003
7.74
96
Un
mit
igat
ed
Indo
or/O
utdo
or U
seT
otal
CO
2C
H4
N2O
CO
2e
Land
Use
Mga
lM
T/y
r
Hot
el2.
0293
4 /
0.28
1853
4.12
520.
0663
1.59
00e-
003
6.25
73
To
tal
4.12
520.
0663
1.59
00e-
003
6.25
73
Mit
igat
ed
8.0
Was
te D
etai
l
Cal
EE
Mod
Ver
sion
: Cal
EE
Mod
.201
6.3.
1D
ate:
1/4
/201
7 8:
19 A
MP
age
28 o
f 31
TR
ED
C H
otel
Pro
ject
- H
umbo
ldt C
ount
y, A
nnua
l

Tot
al C
O2
CH
4N
2OC
O2e
MT
/yr
Miti
gate
d11
.113
80.
6568
0.00
0027
.533
9
Unm
itiga
ted
11.1
138
0.65
680.
0000
27.5
339
Cat
ego
ry/Y
ear
8.2
Was
te b
y L
and
Use
Was
teD
ispo
sed
Tot
al C
O2
CH
4N
2OC
O2e
Land
Use
tons
MT
/yr
Hot
el54
.75
11.1
138
0.65
680.
0000
27.5
339
To
tal
11.1
138
0.65
680.
0000
27.5
339
Un
mit
igat
ed
Cal
EE
Mod
Ver
sion
: Cal
EE
Mod
.201
6.3.
1D
ate:
1/4
/201
7 8:
19 A
MP
age
29 o
f 31
TR
ED
C H
otel
Pro
ject
- H
umbo
ldt C
ount
y, A
nnua
l

11.0
Veg
etat
ion
8.2
Was
te b
y L
and
Use
Was
teD
ispo
sed
Tot
al C
O2
CH
4N
2OC
O2e
Land
Use
tons
MT
/yr
Hot
el54
.75
11.1
138
0.65
680.
0000
27.5
339
To
tal
11.1
138
0.65
680.
0000
27.5
339
Mit
igat
ed
9.0
Op
erat
ion
al O
ffro
ad
Equ
ipm
ent T
ype
Num
ber
Hou
rs/D
ayD
ays/
Yea
rH
orse
Pow
erLo
ad F
acto
rF
uel T
ype
10.0
Sta
tio
nar
y E
qu
ipm
ent
Fir
e P
um
ps
and
Em
erg
ency
Gen
erat
ors
Equ
ipm
ent T
ype
Num
ber
Hou
rs/D
ayH
ours
/Yea
rH
orse
Pow
erLo
ad F
acto
rF
uel T
ype
Bo
ilers
Equ
ipm
ent T
ype
Num
ber
Hea
t Inp
ut/D
ayH
eat I
nput
/Yea
rB
oile
r R
atin
gF
uel T
ype
Use
r D
efin
ed E
qu
ipm
ent
Equ
ipm
ent T
ype
Num
ber
Cal
EE
Mod
Ver
sion
: Cal
EE
Mod
.201
6.3.
1D
ate:
1/4
/201
7 8:
19 A
MP
age
30 o
f 31
TR
ED
C H
otel
Pro
ject
- H
umbo
ldt C
ount
y, A
nnua
l

Cal
EE
Mod
Ver
sion
: Cal
EE
Mod
.201
6.3.
1D
ate:
1/4
/201
7 8:
19 A
MP
age
31 o
f 31
TR
ED
C H
otel
Pro
ject
- H
umbo
ldt C
ount
y, A
nnua
l

Pro
ject
Cha
ract
eris
tics
-
Land
Use
- R
efer
to P
roje
ct D
escr
iptio
n
Con
stru
ctio
n P
hase
-
Dem
oliti
on -
Veh
icle
Trip
s -
Ref
er to
Cal
EE
Mod
inpu
t tab
le
Con
stru
ctio
n O
ff-ro
ad E
quip
men
t Miti
gatio
n -
Ref
er to
Cal
EE
Mod
tabl
es
Wat
er M
itiga
tion
-
1.1
Lan
d U
sag
e
Land
Use
sS
ize
Met
ricLo
t Acr
eage
Flo
or S
urfa
ce A
rea
Pop
ulat
ion
Hot
el10
0.00
Roo
m0.
4017
,424
.00
0
1.2
Oth
er P
roje
ct C
har
acte
rist
ics
Urb
aniz
atio
n
Clim
ate
Zo
ne
Rur
al
1
Win
d S
pee
d (
m/s
)P
reci
pit
atio
n F
req
(D
ays)
2.2
103
1.3
Use
r E
nte
red
Co
mm
ents
& N
on
-Def
ault
Dat
a
1.0
Pro
ject
Ch
arac
teri
stic
s
Uti
lity
Co
mp
any
Pac
ific
Gas
& E
lect
ric C
ompa
ny
2040
Op
erat
ion
al Y
ear
CO
2 In
ten
sity
(l
b/M
Wh
r)64
1.35
0.02
9C
H4
Inte
nsi
ty
(lb
/MW
hr)
0.00
6N
2O In
ten
sity
(l
b/M
Wh
r)
Tab
le N
ame
Col
umn
Nam
eD
efau
lt V
alue
New
Val
ue
tblC
onst
Dus
tMiti
gatio
nW
ater
Unp
aved
Roa
dVeh
icle
Spe
ed40
15
TR
ED
C H
ote
l Pro
ject
Hu
mb
old
t C
ou
nty
, An
nu
al
Cal
EE
Mod
Ver
sion
: Cal
EE
Mod
.201
6.3.
1D
ate:
1/1
2/20
17 8
:53
AM
Pag
e 1
of 3
1
TR
ED
C H
otel
Pro
ject
- H
umbo
ldt C
ount
y, A
nnua
l

tblC
onst
Equ
ipM
itiga
tion
DP
FN
o C
hang
eLe
vel 3
tblC
onst
Equ
ipM
itiga
tion
DP
FN
o C
hang
eLe
vel 3
tblC
onst
Equ
ipM
itiga
tion
DP
FN
o C
hang
eLe
vel 3
tblC
onst
Equ
ipM
itiga
tion
DP
FN
o C
hang
eLe
vel 3
tblC
onst
Equ
ipM
itiga
tion
DP
FN
o C
hang
eLe
vel 3
tblC
onst
Equ
ipM
itiga
tion
DP
FN
o C
hang
eLe
vel 3
tblC
onst
Equ
ipM
itiga
tion
DP
FN
o C
hang
eLe
vel 3
tblC
onst
Equ
ipM
itiga
tion
DP
FN
o C
hang
eLe
vel 3
tblC
onst
Equ
ipM
itiga
tion
DP
FN
o C
hang
eLe
vel 3
tblC
onst
Equ
ipM
itiga
tion
DP
FN
o C
hang
eLe
vel 3
tblC
onst
Equ
ipM
itiga
tion
Num
berO
fEqu
ipm
entM
itiga
ted
0.00
1.00
tblC
onst
Equ
ipM
itiga
tion
Num
berO
fEqu
ipm
entM
itiga
ted
0.00
4.00
tblC
onst
Equ
ipM
itiga
tion
Num
berO
fEqu
ipm
entM
itiga
ted
0.00
2.00
tblC
onst
Equ
ipM
itiga
tion
Num
berO
fEqu
ipm
entM
itiga
ted
0.00
1.00
tblC
onst
Equ
ipM
itiga
tion
Num
berO
fEqu
ipm
entM
itiga
ted
0.00
2.00
tblC
onst
Equ
ipM
itiga
tion
Num
berO
fEqu
ipm
entM
itiga
ted
0.00
1.00
tblC
onst
Equ
ipM
itiga
tion
Num
berO
fEqu
ipm
entM
itiga
ted
0.00
1.00
tblC
onst
Equ
ipM
itiga
tion
Num
berO
fEqu
ipm
entM
itiga
ted
0.00
1.00
tblC
onst
Equ
ipM
itiga
tion
Num
berO
fEqu
ipm
entM
itiga
ted
0.00
2.00
tblC
onst
Equ
ipM
itiga
tion
Num
berO
fEqu
ipm
entM
itiga
ted
0.00
8.00
tblC
onst
Equ
ipM
itiga
tion
Tie
rN
o C
hang
eT
ier
3
tblC
onst
Equ
ipM
itiga
tion
Tie
rN
o C
hang
eT
ier
3
tblC
onst
Equ
ipM
itiga
tion
Tie
rN
o C
hang
eT
ier
3
tblC
onst
Equ
ipM
itiga
tion
Tie
rN
o C
hang
eT
ier
3
tblC
onst
Equ
ipM
itiga
tion
Tie
rN
o C
hang
eT
ier
3
tblC
onst
Equ
ipM
itiga
tion
Tie
rN
o C
hang
eT
ier
3
tblC
onst
Equ
ipM
itiga
tion
Tie
rN
o C
hang
eT
ier
3
Cal
EE
Mod
Ver
sion
: Cal
EE
Mod
.201
6.3.
1D
ate:
1/1
2/20
17 8
:53
AM
Pag
e 2
of 3
1
TR
ED
C H
otel
Pro
ject
- H
umbo
ldt C
ount
y, A
nnua
l
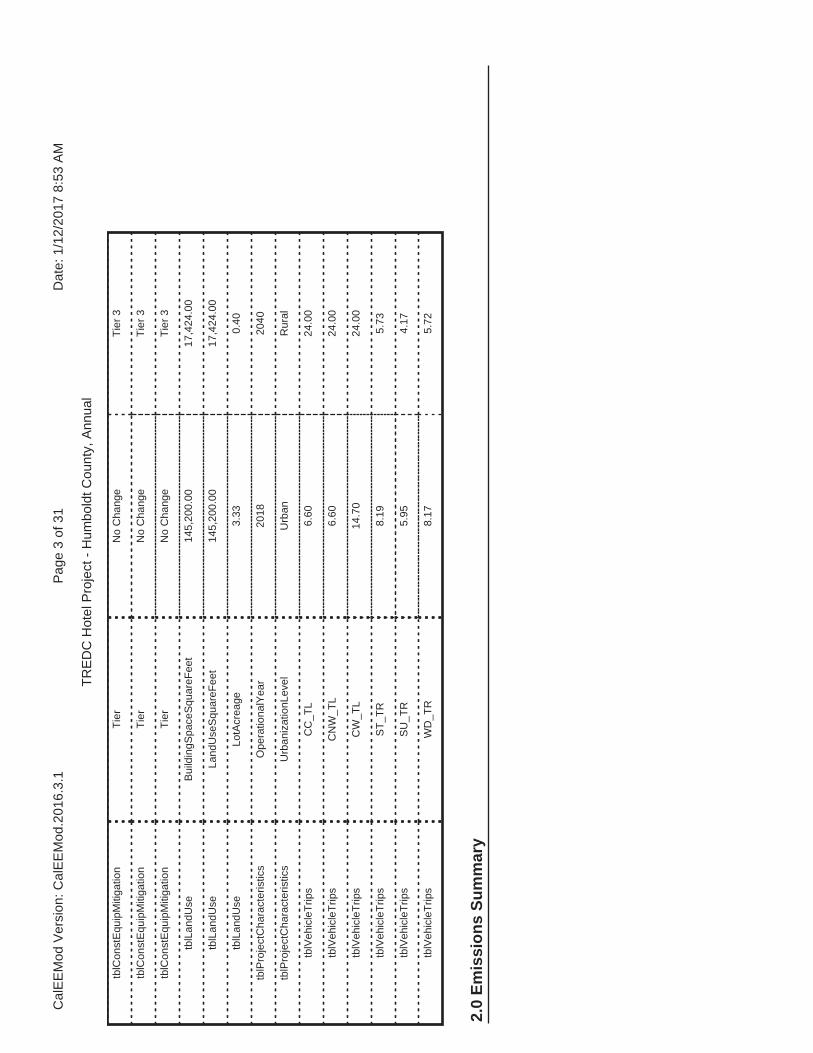
2.0
Em
issi
on
s S
um
mar
y
tblC
onst
Equ
ipM
itiga
tion
Tie
rN
o C
hang
eT
ier
3
tblC
onst
Equ
ipM
itiga
tion
Tie
rN
o C
hang
eT
ier
3
tblC
onst
Equ
ipM
itiga
tion
Tie
rN
o C
hang
eT
ier
3
tblL
andU
seB
uild
ingS
pace
Squ
areF
eet
145,
200.
0017
,424
.00
tblL
andU
seLa
ndU
seS
quar
eFee
t14
5,20
0.00
17,4
24.0
0
tblL
andU
seLo
tAcr
eage
3.33
0.40
tblP
roje
ctC
hara
cter
istic
sO
pera
tiona
lYea
r20
1820
40
tblP
roje
ctC
hara
cter
istic
sU
rban
izat
ionL
evel
Urb
anR
ural
tblV
ehic
leT
rips
CC
_TL
6.60
24.0
0
tblV
ehic
leT
rips
CN
W_T
L6.
6024
.00
tblV
ehic
leT
rips
CW
_TL
14.7
024
.00
tblV
ehic
leT
rips
ST
_TR
8.19
5.73
tblV
ehic
leT
rips
SU
_TR
5.95
4.17
tblV
ehic
leT
rips
WD
_TR
8.17
5.72
Cal
EE
Mod
Ver
sion
: Cal
EE
Mod
.201
6.3.
1D
ate:
1/1
2/20
17 8
:53
AM
Pag
e 3
of 3
1
TR
ED
C H
otel
Pro
ject
- H
umbo
ldt C
ount
y, A
nnua
l
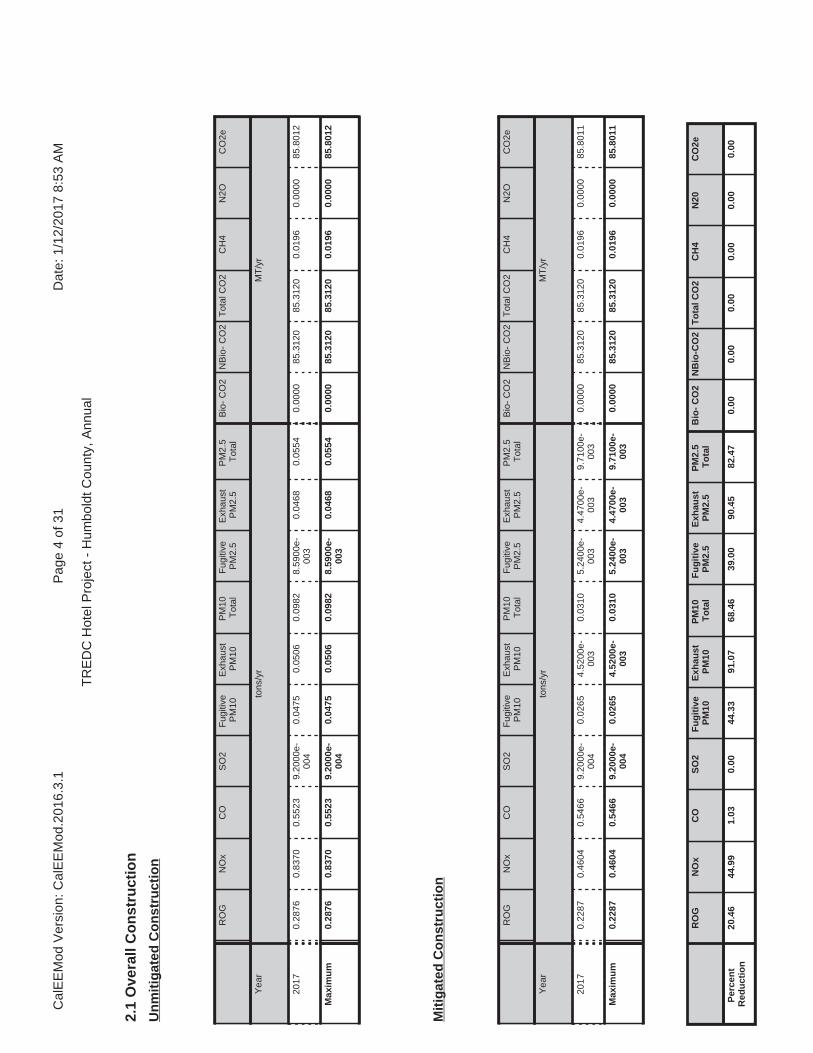
2.1
Ove
rall
Co
nst
ruct
ion
RO
GN
Ox
CO
SO
2F
ugiti
veP
M10
Exh
aust
PM
10P
M10
Tot
alF
ugiti
veP
M2.
5E
xhau
stP
M2.
5P
M2.
5T
otal
Bio
- C
O2
NB
io-
CO
2T
otal
CO
2C
H4
N2O
CO
2e
Yea
rto
ns/y
rM
T/y
r
2017
0.28
760.
8370
0.55
239.
2000
e-00
40.
0475
0.05
060.
0982
8.59
00e-
003
0.04
680.
0554
0.00
0085
.312
085
.312
00.
0196
0.00
0085
.801
2
Max
imu
m0.
2876
0.83
700.
5523
9.20
00e-
004
0.04
750.
0506
0.09
828.
5900
e-00
30.
0468
0.05
540.
0000
85.3
120
85.3
120
0.01
960.
0000
85.8
012
Un
mit
igat
ed C
on
stru
ctio
n
RO
GN
Ox
CO
SO
2F
ugiti
veP
M10
Exh
aust
PM
10P
M10
Tot
alF
ugiti
veP
M2.
5E
xhau
stP
M2.
5P
M2.
5T
otal
Bio
- C
O2
NB
io-
CO
2T
otal
CO
2C
H4
N2O
CO
2e
Yea
rto
ns/y
rM
T/y
r
2017
0.22
870.
4604
0.54
669.
2000
e-00
40.
0265
4.52
00e-
003
0.03
105.
2400
e-00
34.
4700
e-00
39.
7100
e-00
30.
0000
85.3
120
85.3
120
0.01
960.
0000
85.8
011
Max
imu
m0.
2287
0.46
040.
5466
9.20
00e-
004
0.02
654.
5200
e-00
30.
0310
5.24
00e-
003
4.47
00e-
003
9.71
00e-
003
0.00
0085
.312
085
.312
00.
0196
0.00
0085
.801
1
Mit
igat
ed C
on
stru
ctio
n
RO
GN
Ox
CO
SO
2F
ug
itiv
eP
M10
Exh
aust
PM
10P
M10
To
tal
Fu
git
ive
PM
2.5
Exh
aust
PM
2.5
PM
2.5
To
tal
Bio
- C
O2
NB
io-C
O2
To
tal C
O2
CH
4N
20C
O2e
Per
cen
tR
edu
ctio
n20
.46
44.9
91.
030.
0044
.33
91.0
768
.46
39.0
090
.45
82.4
70.
000.
000.
000.
000.
000.
00
Cal
EE
Mod
Ver
sion
: Cal
EE
Mod
.201
6.3.
1D
ate:
1/1
2/20
17 8
:53
AM
Pag
e 4
of 3
1
TR
ED
C H
otel
Pro
ject
- H
umbo
ldt C
ount
y, A
nnua
l
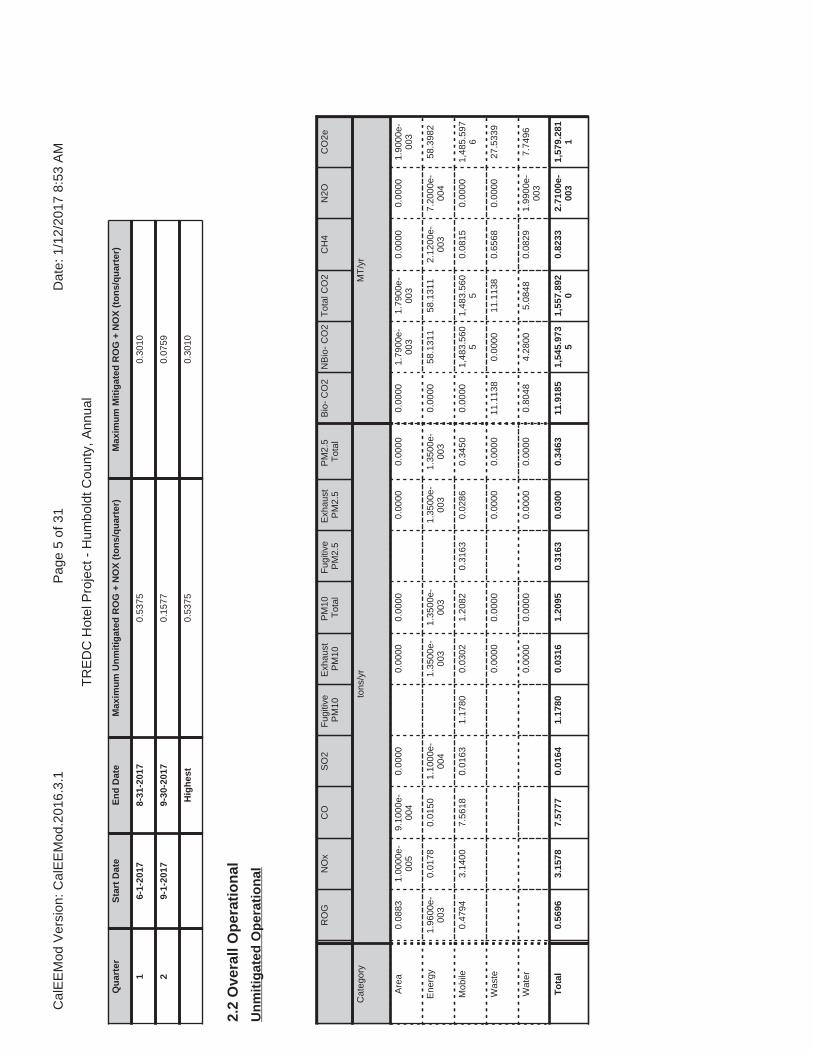
2.2
Ove
rall
Op
erat
ion
al
RO
GN
Ox
CO
SO
2F
ugiti
veP
M10
Exh
aust
PM
10P
M10
Tot
alF
ugiti
veP
M2.
5E
xhau
stP
M2.
5P
M2.
5T
otal
Bio
- C
O2
NB
io-
CO
2T
otal
CO
2C
H4
N2O
CO
2e
Cat
egor
yto
ns/y
rM
T/y
r
Are
a0.
0883
1.00
00e-
005
9.10
00e-
004
0.00
000.
0000
0.00
000.
0000
0.00
000.
0000
1.79
00e-
003
1.79
00e-
003
0.00
000.
0000
1.90
00e-
003
Ene
rgy
1.96
00e-
003
0.01
780.
0150
1.10
00e-
004
1.35
00e-
003
1.35
00e-
003
1.35
00e-
003
1.35
00e-
003
0.00
0058
.131
158
.131
12.
1200
e-00
37.
2000
e-00
458
.398
2
Mob
ile0.
4794
3.14
007.
5618
0.01
631.
1780
0.03
021.
2082
0.31
630.
0286
0.34
500.
0000
1,48
3.56
05
1,48
3.56
05
0.08
150.
0000
1,48
5.59
76
Was
te0.
0000
0.00
000.
0000
0.00
0011
.113
80.
0000
11.1
138
0.65
680.
0000
27.5
339
Wat
er0.
0000
0.00
000.
0000
0.00
000.
8048
4.28
005.
0848
0.08
291.
9900
e-00
37.
7496
To
tal
0.56
963.
1578
7.57
770.
0164
1.17
800.
0316
1.20
950.
3163
0.03
000.
3463
11.9
185
1,54
5.97
35
1,55
7.89
20
0.82
332.
7100
e-00
31,
579.
281
1
Un
mit
igat
ed O
per
atio
nal
Qu
arte
rS
tart
Dat
eE
nd
Dat
eM
axim
um
Un
mit
igat
ed R
OG
+ N
OX
(to
ns/
qu
arte
r)M
axim
um
Mit
igat
ed R
OG
+ N
OX
(to
ns/
qu
arte
r)
16-
1-20
178-
31-2
017
0.53
750.
3010
29-
1-20
179-
30-2
017
0.15
770.
0759
Hig
hes
t0.
5375
0.30
10
Cal
EE
Mod
Ver
sion
: Cal
EE
Mod
.201
6.3.
1D
ate:
1/1
2/20
17 8
:53
AM
Pag
e 5
of 3
1
TR
ED
C H
otel
Pro
ject
- H
umbo
ldt C
ount
y, A
nnua
l
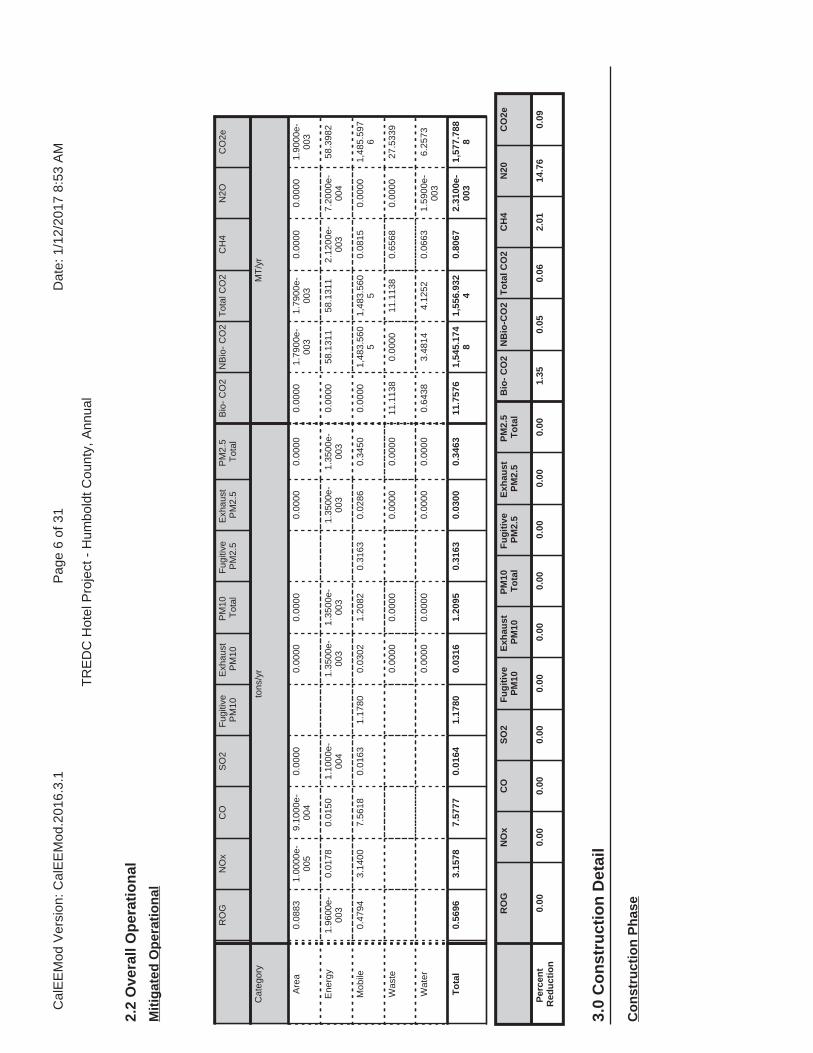
2.2
Ove
rall
Op
erat
ion
al
RO
GN
Ox
CO
SO
2F
ugiti
veP
M10
Exh
aust
PM
10P
M10
Tot
alF
ugiti
veP
M2.
5E
xhau
stP
M2.
5P
M2.
5T
otal
Bio
- C
O2
NB
io-
CO
2T
otal
CO
2C
H4
N2O
CO
2e
Cat
egor
yto
ns/y
rM
T/y
r
Are
a0.
0883
1.00
00e-
005
9.10
00e-
004
0.00
000.
0000
0.00
000.
0000
0.00
000.
0000
1.79
00e-
003
1.79
00e-
003
0.00
000.
0000
1.90
00e-
003
Ene
rgy
1.96
00e-
003
0.01
780.
0150
1.10
00e-
004
1.35
00e-
003
1.35
00e-
003
1.35
00e-
003
1.35
00e-
003
0.00
0058
.131
158
.131
12.
1200
e-00
37.
2000
e-00
458
.398
2
Mob
ile0.
4794
3.14
007.
5618
0.01
631.
1780
0.03
021.
2082
0.31
630.
0286
0.34
500.
0000
1,48
3.56
05
1,48
3.56
05
0.08
150.
0000
1,48
5.59
76
Was
te0.
0000
0.00
000.
0000
0.00
0011
.113
80.
0000
11.1
138
0.65
680.
0000
27.5
339
Wat
er0.
0000
0.00
000.
0000
0.00
000.
6438
3.48
144.
1252
0.06
631.
5900
e-00
36.
2573
To
tal
0.56
963.
1578
7.57
770.
0164
1.17
800.
0316
1.20
950.
3163
0.03
000.
3463
11.7
576
1,54
5.17
48
1,55
6.93
24
0.80
672.
3100
e-00
31,
577.
788
8
Mit
igat
ed O
per
atio
nal
3.0
Co
nst
ruct
ion
Det
ail
Co
nst
ruct
ion
Ph
ase
RO
GN
Ox
CO
SO
2F
ug
itiv
eP
M10
Exh
aust
PM
10P
M10
To
tal
Fu
git
ive
PM
2.5
Exh
aust
PM
2.5
PM
2.5
To
tal
Bio
- C
O2
NB
io-C
O2
To
tal C
O2
CH
4N
20C
O2e
Per
cen
tR
edu
ctio
n0.
000.
000.
000.
000.
000.
000.
000.
000.
000.
001.
350.
050.
062.
0114
.76
0.09
Cal
EE
Mod
Ver
sion
: Cal
EE
Mod
.201
6.3.
1D
ate:
1/1
2/20
17 8
:53
AM
Pag
e 6
of 3
1
TR
ED
C H
otel
Pro
ject
- H
umbo
ldt C
ount
y, A
nnua
l

Pha
seN
umbe
rP
hase
Nam
eP
hase
Typ
eS
tart
Dat
eE
nd D
ate
Num
Day
s W
eek
Num
Day
sP
hase
Des
crip
tion
1D
emol
ition
Dem
oliti
on6/
1/20
176/
14/2
017
510
2S
ite P
repa
ratio
nS
ite P
repa
ratio
n6/
15/2
017
6/15
/201
75
1
3G
radi
ngG
radi
ng6/
16/2
017
6/19
/201
75
2
4B
uild
ing
Con
stru
ctio
nB
uild
ing
Con
stru
ctio
n6/
20/2
017
11/6
/201
75
100
5P
avin
gP
avin
g11
/7/2
017
11/1
3/20
175
5
6A
rchi
tect
ural
Coa
ting
Arc
hite
ctur
al C
oatin
g11
/14/
2017
11/2
0/20
175
5
Off
Ro
ad E
qu
ipm
ent
Res
iden
tial
Ind
oo
r: 0
; R
esid
enti
al O
utd
oo
r: 0
; N
on
-Res
iden
tial
Ind
oo
r: 2
6,13
6; N
on
-Res
iden
tial
Ou
tdo
or:
8,7
12;
Str
iped
Par
kin
g A
rea:
0
(Arc
hit
ectu
ral C
oat
ing
– s
qft
)
Acr
es o
f G
rad
ing
(S
ite
Pre
par
atio
n P
has
e):
0.5
Acr
es o
f G
rad
ing
(G
rad
ing
Ph
ase)
: 0
Acr
es o
f P
avin
g:
0
Cal
EE
Mod
Ver
sion
: Cal
EE
Mod
.201
6.3.
1D
ate:
1/1
2/20
17 8
:53
AM
Pag
e 7
of 3
1
TR
ED
C H
otel
Pro
ject
- H
umbo
ldt C
ount
y, A
nnua
l

Pha
se N
ame
Offr
oad
Equ
ipm
ent T
ype
Am
ount
Usa
ge H
ours
Hor
se P
ower
Load
Fac
tor
Dem
oliti
onC
oncr
ete/
Indu
stria
l Saw
s1
8.00
810.
73
Dem
oliti
onR
ubbe
r T
ired
Doz
ers
11.
0024
70.
40
Dem
oliti
onT
ract
ors/
Load
ers/
Bac
khoe
s2
6.00
970.
37
Site
Pre
para
tion
Gra
ders
18.
0018
70.
41
Site
Pre
para
tion
Tra
ctor
s/Lo
ader
s/B
ackh
oes
18.
0097
0.37
Gra
ding
Con
cret
e/In
dust
rial S
aws
18.
0081
0.73
Gra
ding
Rub
ber
Tire
d D
ozer
s1
1.00
247
0.40
Gra
ding
Tra
ctor
s/Lo
ader
s/B
ackh
oes
26.
0097
0.37
Bui
ldin
g C
onst
ruct
ion
Cra
nes
14.
0023
10.
29
Bui
ldin
g C
onst
ruct
ion
For
klift
s2
6.00
890.
20
Bui
ldin
g C
onst
ruct
ion
Tra
ctor
s/Lo
ader
s/B
ackh
oes
28.
0097
0.37
Arc
hite
ctur
al C
oatin
gA
ir C
ompr
esso
rs1
6.00
780.
48
Pav
ing
Cem
ent a
nd M
orta
r M
ixer
s4
6.00
90.
56
Pav
ing
Pav
ers
17.
0013
00.
42
Pav
ing
Rol
lers
17.
0080
0.38
Pav
ing
Tra
ctor
s/Lo
ader
s/B
ackh
oes
17.
0097
0.37
Tri
ps
and
VM
T
Pha
se N
ame
Offr
oad
Equ
ipm
ent
Cou
ntW
orke
r T
rip
Num
ber
Ven
dor
Trip
N
umbe
rH
aulin
g T
rip
Num
ber
Wor
ker
Trip
Le
ngth
Ven
dor
Trip
Le
ngth
Hau
ling
Trip
Le
ngth
Wor
ker
Veh
icle
C
lass
Ven
dor
Veh
icle
Cla
ssH
aulin
gV
ehic
le C
lass
Dem
oliti
on4
10.0
00.
0034
4.00
16.8
06.
6020
.00
LD_M
ixH
DT
_Mix
HH
DT
Site
Pre
para
tion
25.
000.
000.
0016
.80
6.60
20.0
0LD
_Mix
HD
T_M
ixH
HD
T
Gra
ding
410
.00
0.00
0.00
16.8
06.
6020
.00
LD_M
ixH
DT
_Mix
HH
DT
Bui
ldin
g C
onst
ruct
ion
57.
003.
000.
0016
.80
6.60
20.0
0LD
_Mix
HD
T_M
ixH
HD
T
Arc
hite
ctur
al C
oatin
g1
1.00
0.00
0.00
16.8
06.
6020
.00
LD_M
ixH
DT
_Mix
HH
DT
Pav
ing
718
.00
0.00
0.00
16.8
06.
6020
.00
LD_M
ixH
DT
_Mix
HH
DT
Cal
EE
Mod
Ver
sion
: Cal
EE
Mod
.201
6.3.
1D
ate:
1/1
2/20
17 8
:53
AM
Pag
e 8
of 3
1
TR
ED
C H
otel
Pro
ject
- H
umbo
ldt C
ount
y, A
nnua
l
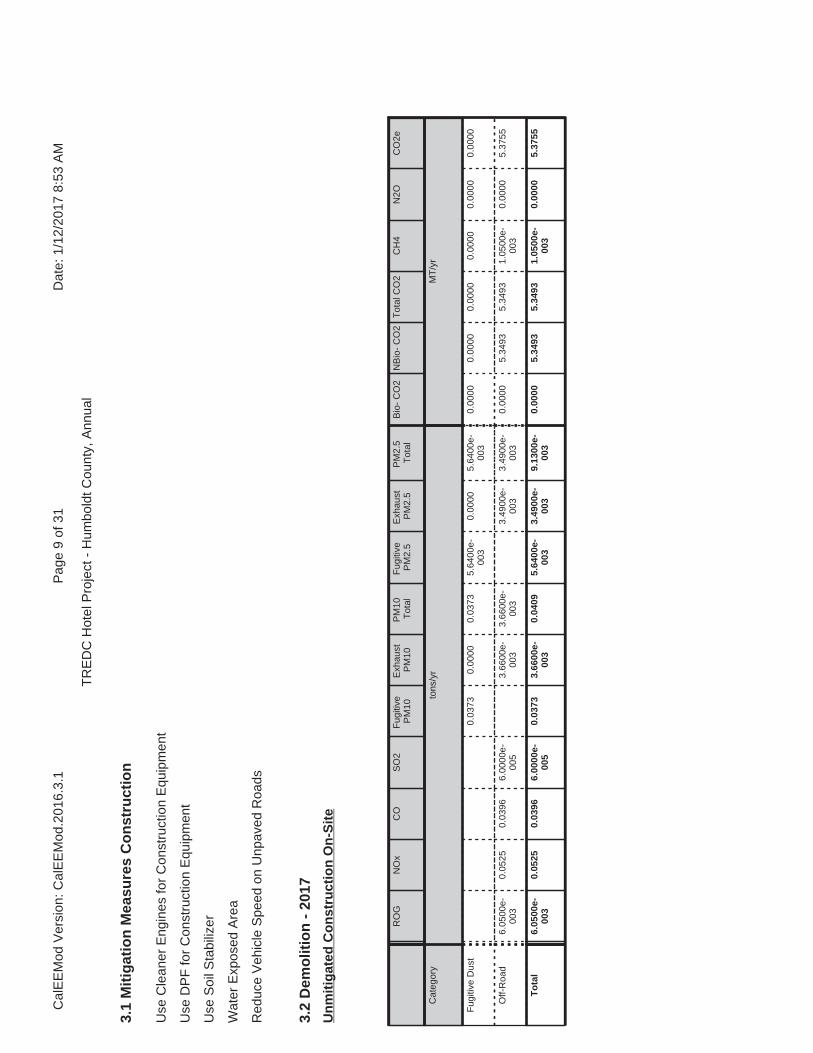
3.2
Dem
olit
ion
- 2
017
RO
GN
Ox
CO
SO
2F
ugiti
veP
M10
Exh
aust
PM
10P
M10
Tot
alF
ugiti
veP
M2.
5E
xhau
stP
M2.
5P
M2.
5T
otal
Bio
- C
O2
NB
io-
CO
2T
otal
CO
2C
H4
N2O
CO
2e
Cat
egor
yto
ns/y
rM
T/y
r
Fug
itive
Dus
t0.
0373
0.00
000.
0373
5.64
00e-
003
0.00
005.
6400
e-00
30.
0000
0.00
000.
0000
0.00
000.
0000
0.00
00
Off-
Roa
d6.
0500
e-00
30.
0525
0.03
966.
0000
e-00
53.
6600
e-00
33.
6600
e-00
33.
4900
e-00
33.
4900
e-00
30.
0000
5.34
935.
3493
1.05
00e-
003
0.00
005.
3755
To
tal
6.05
00e-
003
0.05
250.
0396
6.00
00e-
005
0.03
733.
6600
e-00
30.
0409
5.64
00e-
003
3.49
00e-
003
9.13
00e-
003
0.00
005.
3493
5.34
931.
0500
e-00
30.
0000
5.37
55
Un
mit
igat
ed C
on
stru
ctio
n O
n-S
ite
3.1
Mit
igat
ion
Mea
sure
s C
on
stru
ctio
n
Use
Cle
aner
Eng
ines
for
Con
stru
ctio
n E
quip
men
t
Use
DP
F fo
r C
onst
ruct
ion
Equ
ipm
ent
Use
Soi
l Sta
biliz
er
Wat
er E
xpos
ed A
rea
Red
uce
Veh
icle
Spe
ed o
n U
npav
ed R
oads
Cal
EE
Mod
Ver
sion
: Cal
EE
Mod
.201
6.3.
1D
ate:
1/1
2/20
17 8
:53
AM
Pag
e 9
of 3
1
TR
ED
C H
otel
Pro
ject
- H
umbo
ldt C
ount
y, A
nnua
l
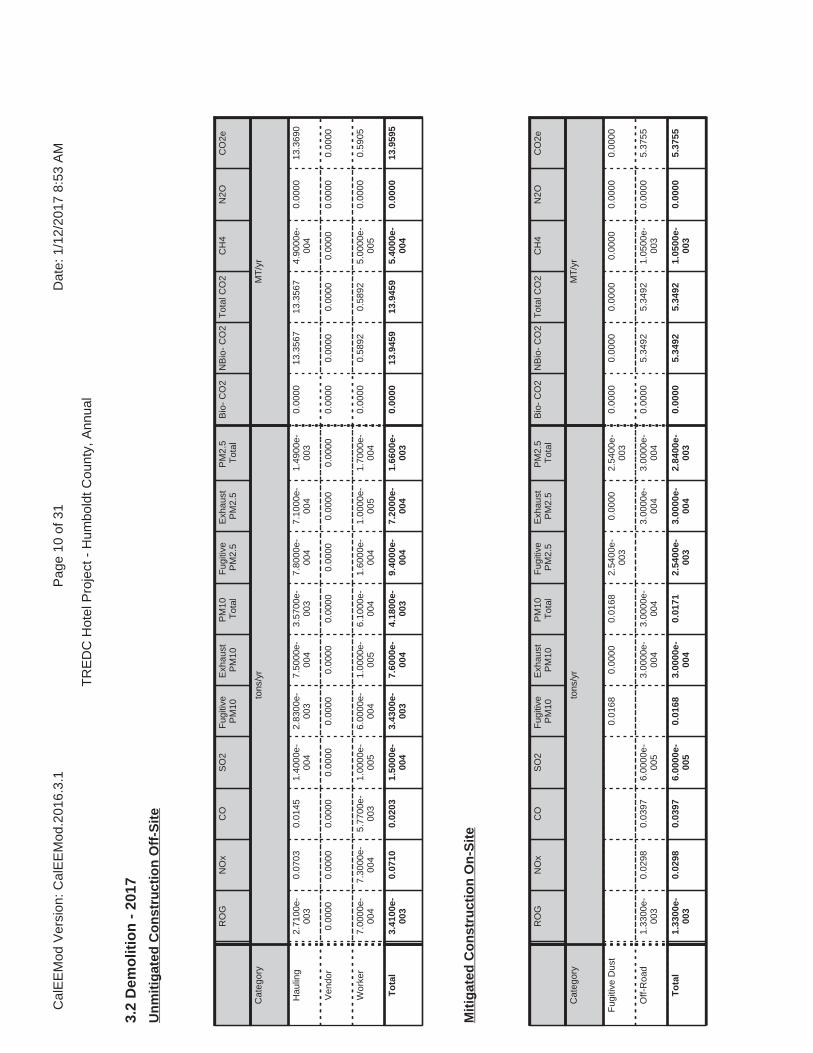
3.2
Dem
olit
ion
- 2
017
RO
GN
Ox
CO
SO
2F
ugiti
veP
M10
Exh
aust
PM
10P
M10
Tot
alF
ugiti
veP
M2.
5E
xhau
stP
M2.
5P
M2.
5T
otal
Bio
- C
O2
NB
io-
CO
2T
otal
CO
2C
H4
N2O
CO
2e
Cat
egor
yto
ns/y
rM
T/y
r
Hau
ling
2.71
00e-
003
0.07
030.
0145
1.40
00e-
004
2.83
00e-
003
7.50
00e-
004
3.57
00e-
003
7.80
00e-
004
7.10
00e-
004
1.49
00e-
003
0.00
0013
.356
713
.356
74.
9000
e-00
40.
0000
13.3
690
Ven
dor
0.00
000.
0000
0.00
000.
0000
0.00
000.
0000
0.00
000.
0000
0.00
000.
0000
0.00
000.
0000
0.00
000.
0000
0.00
000.
0000
Wor
ker
7.00
00e-
004
7.30
00e-
004
5.77
00e-
003
1.00
00e-
005
6.00
00e-
004
1.00
00e-
005
6.10
00e-
004
1.60
00e-
004
1.00
00e-
005
1.70
00e-
004
0.00
000.
5892
0.58
925.
0000
e-00
50.
0000
0.59
05
To
tal
3.41
00e-
003
0.07
100.
0203
1.50
00e-
004
3.43
00e-
003
7.60
00e-
004
4.18
00e-
003
9.40
00e-
004
7.20
00e-
004
1.66
00e-
003
0.00
0013
.945
913
.945
95.
4000
e-00
40.
0000
13.9
595
Un
mit
igat
ed C
on
stru
ctio
n O
ff-S
ite
RO
GN
Ox
CO
SO
2F
ugiti
veP
M10
Exh
aust
PM
10P
M10
Tot
alF
ugiti
veP
M2.
5E
xhau
stP
M2.
5P
M2.
5T
otal
Bio
- C
O2
NB
io-
CO
2T
otal
CO
2C
H4
N2O
CO
2e
Cat
egor
yto
ns/y
rM
T/y
r
Fug
itive
Dus
t0.
0168
0.00
000.
0168
2.54
00e-
003
0.00
002.
5400
e-00
30.
0000
0.00
000.
0000
0.00
000.
0000
0.00
00
Off-
Roa
d1.
3300
e-00
30.
0298
0.03
976.
0000
e-00
53.
0000
e-00
43.
0000
e-00
43.
0000
e-00
43.
0000
e-00
40.
0000
5.34
925.
3492
1.05
00e-
003
0.00
005.
3755
To
tal
1.33
00e-
003
0.02
980.
0397
6.00
00e-
005
0.01
683.
0000
e-00
40.
0171
2.54
00e-
003
3.00
00e-
004
2.84
00e-
003
0.00
005.
3492
5.34
921.
0500
e-00
30.
0000
5.37
55
Mit
igat
ed C
on
stru
ctio
n O
n-S
ite
Cal
EE
Mod
Ver
sion
: Cal
EE
Mod
.201
6.3.
1D
ate:
1/1
2/20
17 8
:53
AM
Pag
e 10
of 3
1
TR
ED
C H
otel
Pro
ject
- H
umbo
ldt C
ount
y, A
nnua
l
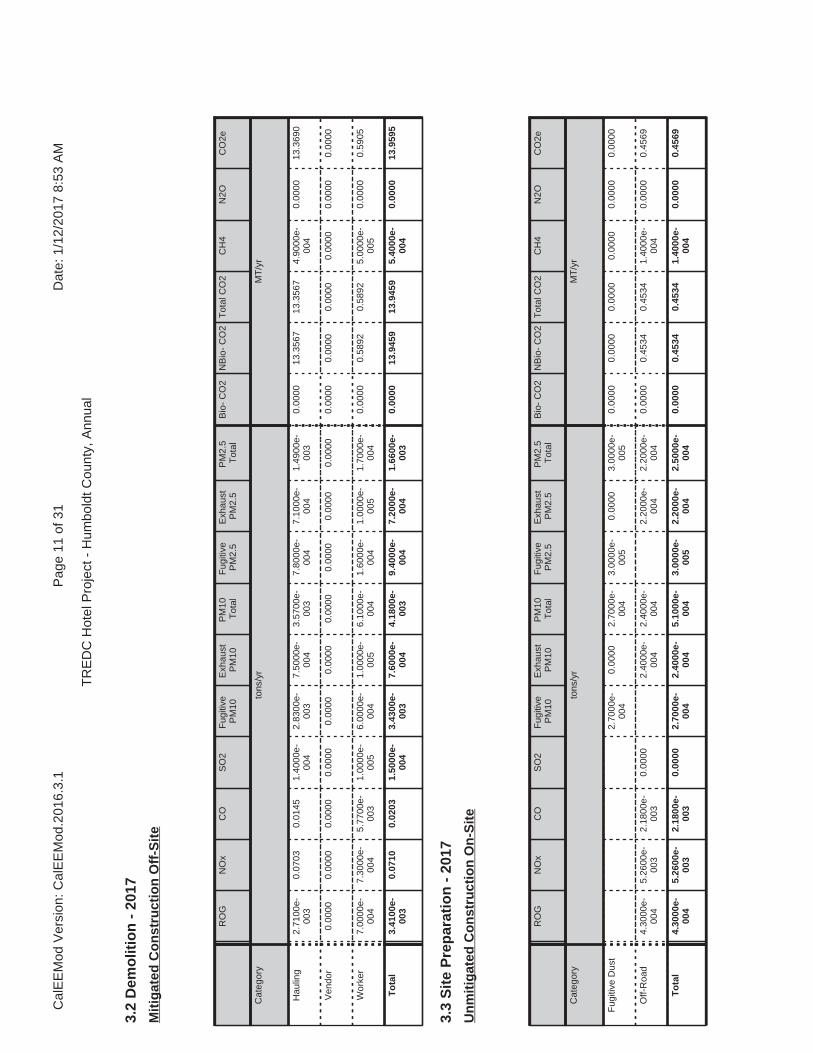
3.2
Dem
olit
ion
- 2
017
RO
GN
Ox
CO
SO
2F
ugiti
veP
M10
Exh
aust
PM
10P
M10
Tot
alF
ugiti
veP
M2.
5E
xhau
stP
M2.
5P
M2.
5T
otal
Bio
- C
O2
NB
io-
CO
2T
otal
CO
2C
H4
N2O
CO
2e
Cat
egor
yto
ns/y
rM
T/y
r
Hau
ling
2.71
00e-
003
0.07
030.
0145
1.40
00e-
004
2.83
00e-
003
7.50
00e-
004
3.57
00e-
003
7.80
00e-
004
7.10
00e-
004
1.49
00e-
003
0.00
0013
.356
713
.356
74.
9000
e-00
40.
0000
13.3
690
Ven
dor
0.00
000.
0000
0.00
000.
0000
0.00
000.
0000
0.00
000.
0000
0.00
000.
0000
0.00
000.
0000
0.00
000.
0000
0.00
000.
0000
Wor
ker
7.00
00e-
004
7.30
00e-
004
5.77
00e-
003
1.00
00e-
005
6.00
00e-
004
1.00
00e-
005
6.10
00e-
004
1.60
00e-
004
1.00
00e-
005
1.70
00e-
004
0.00
000.
5892
0.58
925.
0000
e-00
50.
0000
0.59
05
To
tal
3.41
00e-
003
0.07
100.
0203
1.50
00e-
004
3.43
00e-
003
7.60
00e-
004
4.18
00e-
003
9.40
00e-
004
7.20
00e-
004
1.66
00e-
003
0.00
0013
.945
913
.945
95.
4000
e-00
40.
0000
13.9
595
Mit
igat
ed C
on
stru
ctio
n O
ff-S
ite
3.3
Sit
e P
rep
arat
ion
- 2
017
RO
GN
Ox
CO
SO
2F
ugiti
veP
M10
Exh
aust
PM
10P
M10
Tot
alF
ugiti
veP
M2.
5E
xhau
stP
M2.
5P
M2.
5T
otal
Bio
- C
O2
NB
io-
CO
2T
otal
CO
2C
H4
N2O
CO
2e
Cat
egor
yto
ns/y
rM
T/y
r
Fug
itive
Dus
t2.
7000
e-00
40.
0000
2.70
00e-
004
3.00
00e-
005
0.00
003.
0000
e-00
50.
0000
0.00
000.
0000
0.00
000.
0000
0.00
00
Off-
Roa
d4.
3000
e-00
45.
2600
e-00
32.
1800
e-00
30.
0000
2.40
00e-
004
2.40
00e-
004
2.20
00e-
004
2.20
00e-
004
0.00
000.
4534
0.45
341.
4000
e-00
40.
0000
0.45
69
To
tal
4.30
00e-
004
5.26
00e-
003
2.18
00e-
003
0.00
002.
7000
e-00
42.
4000
e-00
45.
1000
e-00
43.
0000
e-00
52.
2000
e-00
42.
5000
e-00
40.
0000
0.45
340.
4534
1.40
00e-
004
0.00
000.
4569
Un
mit
igat
ed C
on
stru
ctio
n O
n-S
ite
Cal
EE
Mod
Ver
sion
: Cal
EE
Mod
.201
6.3.
1D
ate:
1/1
2/20
17 8
:53
AM
Pag
e 11
of 3
1
TR
ED
C H
otel
Pro
ject
- H
umbo
ldt C
ount
y, A
nnua
l

3.3
Sit
e P
rep
arat
ion
- 2
017
RO
GN
Ox
CO
SO
2F
ugiti
veP
M10
Exh
aust
PM
10P
M10
Tot
alF
ugiti
veP
M2.
5E
xhau
stP
M2.
5P
M2.
5T
otal
Bio
- C
O2
NB
io-
CO
2T
otal
CO
2C
H4
N2O
CO
2e
Cat
egor
yto
ns/y
rM
T/y
r
Hau
ling
0.00
000.
0000
0.00
000.
0000
0.00
000.
0000
0.00
000.
0000
0.00
000.
0000
0.00
000.
0000
0.00
000.
0000
0.00
000.
0000
Ven
dor
0.00
000.
0000
0.00
000.
0000
0.00
000.
0000
0.00
000.
0000
0.00
000.
0000
0.00
000.
0000
0.00
000.
0000
0.00
000.
0000
Wor
ker
3.00
00e-
005
4.00
00e-
005
2.90
00e-
004
0.00
003.
0000
e-00
50.
0000
3.00
00e-
005
1.00
00e-
005
0.00
001.
0000
e-00
50.
0000
0.02
950.
0295
0.00
000.
0000
0.02
95
To
tal
3.00
00e-
005
4.00
00e-
005
2.90
00e-
004
0.00
003.
0000
e-00
50.
0000
3.00
00e-
005
1.00
00e-
005
0.00
001.
0000
e-00
50.
0000
0.02
950.
0295
0.00
000.
0000
0.02
95
Un
mit
igat
ed C
on
stru
ctio
n O
ff-S
ite
RO
GN
Ox
CO
SO
2F
ugiti
veP
M10
Exh
aust
PM
10P
M10
Tot
alF
ugiti
veP
M2.
5E
xhau
stP
M2.
5P
M2.
5T
otal
Bio
- C
O2
NB
io-
CO
2T
otal
CO
2C
H4
N2O
CO
2e
Cat
egor
yto
ns/y
rM
T/y
r
Fug
itive
Dus
t1.
2000
e-00
40.
0000
1.20
00e-
004
1.00
00e-
005
0.00
001.
0000
e-00
50.
0000
0.00
000.
0000
0.00
000.
0000
0.00
00
Off-
Roa
d1.
2000
e-00
42.
4400
e-00
32.
9300
e-00
30.
0000
2.00
00e-
005
2.00
00e-
005
2.00
00e-
005
2.00
00e-
005
0.00
000.
4534
0.45
341.
4000
e-00
40.
0000
0.45
69
To
tal
1.20
00e-
004
2.44
00e-
003
2.93
00e-
003
0.00
001.
2000
e-00
42.
0000
e-00
51.
4000
e-00
41.
0000
e-00
52.
0000
e-00
53.
0000
e-00
50.
0000
0.45
340.
4534
1.40
00e-
004
0.00
000.
4569
Mit
igat
ed C
on
stru
ctio
n O
n-S
ite
Cal
EE
Mod
Ver
sion
: Cal
EE
Mod
.201
6.3.
1D
ate:
1/1
2/20
17 8
:53
AM
Pag
e 12
of 3
1
TR
ED
C H
otel
Pro
ject
- H
umbo
ldt C
ount
y, A
nnua
l
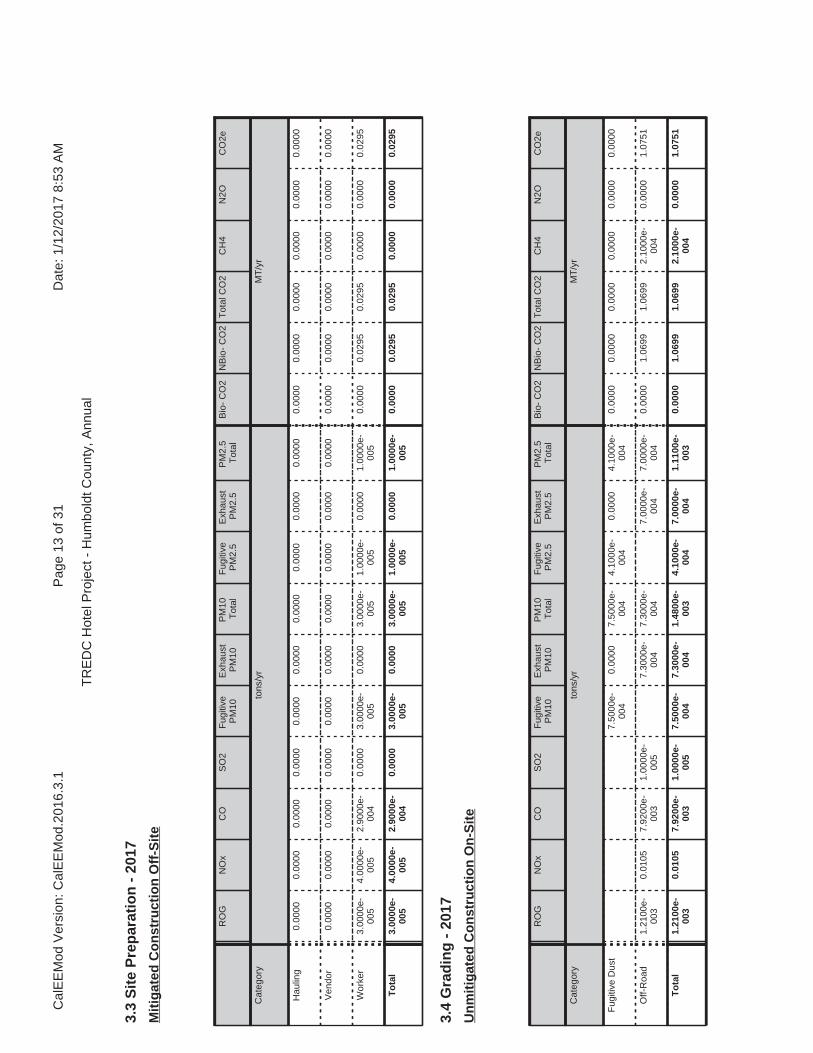
3.3
Sit
e P
rep
arat
ion
- 2
017
RO
GN
Ox
CO
SO
2F
ugiti
veP
M10
Exh
aust
PM
10P
M10
Tot
alF
ugiti
veP
M2.
5E
xhau
stP
M2.
5P
M2.
5T
otal
Bio
- C
O2
NB
io-
CO
2T
otal
CO
2C
H4
N2O
CO
2e
Cat
egor
yto
ns/y
rM
T/y
r
Hau
ling
0.00
000.
0000
0.00
000.
0000
0.00
000.
0000
0.00
000.
0000
0.00
000.
0000
0.00
000.
0000
0.00
000.
0000
0.00
000.
0000
Ven
dor
0.00
000.
0000
0.00
000.
0000
0.00
000.
0000
0.00
000.
0000
0.00
000.
0000
0.00
000.
0000
0.00
000.
0000
0.00
000.
0000
Wor
ker
3.00
00e-
005
4.00
00e-
005
2.90
00e-
004
0.00
003.
0000
e-00
50.
0000
3.00
00e-
005
1.00
00e-
005
0.00
001.
0000
e-00
50.
0000
0.02
950.
0295
0.00
000.
0000
0.02
95
To
tal
3.00
00e-
005
4.00
00e-
005
2.90
00e-
004
0.00
003.
0000
e-00
50.
0000
3.00
00e-
005
1.00
00e-
005
0.00
001.
0000
e-00
50.
0000
0.02
950.
0295
0.00
000.
0000
0.02
95
Mit
igat
ed C
on
stru
ctio
n O
ff-S
ite
3.4
Gra
din
g -
201
7
RO
GN
Ox
CO
SO
2F
ugiti
veP
M10
Exh
aust
PM
10P
M10
Tot
alF
ugiti
veP
M2.
5E
xhau
stP
M2.
5P
M2.
5T
otal
Bio
- C
O2
NB
io-
CO
2T
otal
CO
2C
H4
N2O
CO
2e
Cat
egor
yto
ns/y
rM
T/y
r
Fug
itive
Dus
t7.
5000
e-00
40.
0000
7.50
00e-
004
4.10
00e-
004
0.00
004.
1000
e-00
40.
0000
0.00
000.
0000
0.00
000.
0000
0.00
00
Off-
Roa
d1.
2100
e-00
30.
0105
7.92
00e-
003
1.00
00e-
005
7.30
00e-
004
7.30
00e-
004
7.00
00e-
004
7.00
00e-
004
0.00
001.
0699
1.06
992.
1000
e-00
40.
0000
1.07
51
To
tal
1.21
00e-
003
0.01
057.
9200
e-00
31.
0000
e-00
57.
5000
e-00
47.
3000
e-00
41.
4800
e-00
34.
1000
e-00
47.
0000
e-00
41.
1100
e-00
30.
0000
1.06
991.
0699
2.10
00e-
004
0.00
001.
0751
Un
mit
igat
ed C
on
stru
ctio
n O
n-S
ite
Cal
EE
Mod
Ver
sion
: Cal
EE
Mod
.201
6.3.
1D
ate:
1/1
2/20
17 8
:53
AM
Pag
e 13
of 3
1
TR
ED
C H
otel
Pro
ject
- H
umbo
ldt C
ount
y, A
nnua
l
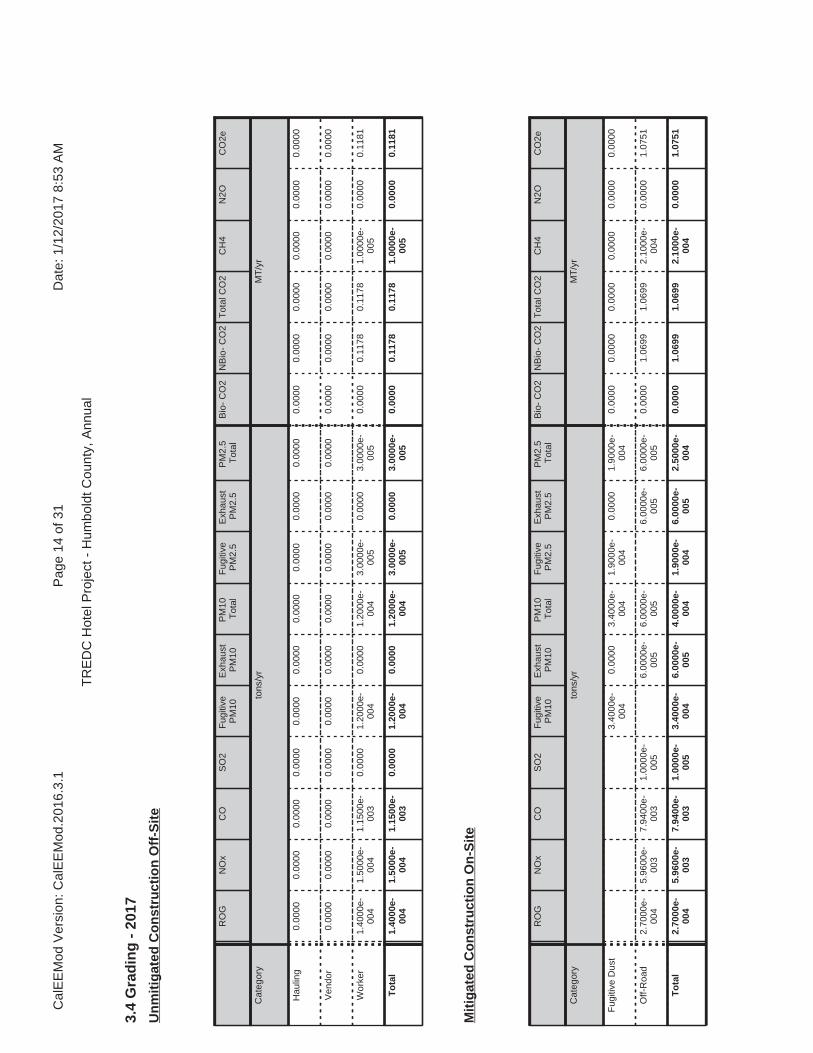
3.4
Gra
din
g -
201
7
RO
GN
Ox
CO
SO
2F
ugiti
veP
M10
Exh
aust
PM
10P
M10
Tot
alF
ugiti
veP
M2.
5E
xhau
stP
M2.
5P
M2.
5T
otal
Bio
- C
O2
NB
io-
CO
2T
otal
CO
2C
H4
N2O
CO
2e
Cat
egor
yto
ns/y
rM
T/y
r
Hau
ling
0.00
000.
0000
0.00
000.
0000
0.00
000.
0000
0.00
000.
0000
0.00
000.
0000
0.00
000.
0000
0.00
000.
0000
0.00
000.
0000
Ven
dor
0.00
000.
0000
0.00
000.
0000
0.00
000.
0000
0.00
000.
0000
0.00
000.
0000
0.00
000.
0000
0.00
000.
0000
0.00
000.
0000
Wor
ker
1.40
00e-
004
1.50
00e-
004
1.15
00e-
003
0.00
001.
2000
e-00
40.
0000
1.20
00e-
004
3.00
00e-
005
0.00
003.
0000
e-00
50.
0000
0.11
780.
1178
1.00
00e-
005
0.00
000.
1181
To
tal
1.40
00e-
004
1.50
00e-
004
1.15
00e-
003
0.00
001.
2000
e-00
40.
0000
1.20
00e-
004
3.00
00e-
005
0.00
003.
0000
e-00
50.
0000
0.11
780.
1178
1.00
00e-
005
0.00
000.
1181
Un
mit
igat
ed C
on
stru
ctio
n O
ff-S
ite
RO
GN
Ox
CO
SO
2F
ugiti
veP
M10
Exh
aust
PM
10P
M10
Tot
alF
ugiti
veP
M2.
5E
xhau
stP
M2.
5P
M2.
5T
otal
Bio
- C
O2
NB
io-
CO
2T
otal
CO
2C
H4
N2O
CO
2e
Cat
egor
yto
ns/y
rM
T/y
r
Fug
itive
Dus
t3.
4000
e-00
40.
0000
3.40
00e-
004
1.90
00e-
004
0.00
001.
9000
e-00
40.
0000
0.00
000.
0000
0.00
000.
0000
0.00
00
Off-
Roa
d2.
7000
e-00
45.
9600
e-00
37.
9400
e-00
31.
0000
e-00
56.
0000
e-00
56.
0000
e-00
56.
0000
e-00
56.
0000
e-00
50.
0000
1.06
991.
0699
2.10
00e-
004
0.00
001.
0751
To
tal
2.70
00e-
004
5.96
00e-
003
7.94
00e-
003
1.00
00e-
005
3.40
00e-
004
6.00
00e-
005
4.00
00e-
004
1.90
00e-
004
6.00
00e-
005
2.50
00e-
004
0.00
001.
0699
1.06
992.
1000
e-00
40.
0000
1.07
51
Mit
igat
ed C
on
stru
ctio
n O
n-S
ite
Cal
EE
Mod
Ver
sion
: Cal
EE
Mod
.201
6.3.
1D
ate:
1/1
2/20
17 8
:53
AM
Pag
e 14
of 3
1
TR
ED
C H
otel
Pro
ject
- H
umbo
ldt C
ount
y, A
nnua
l
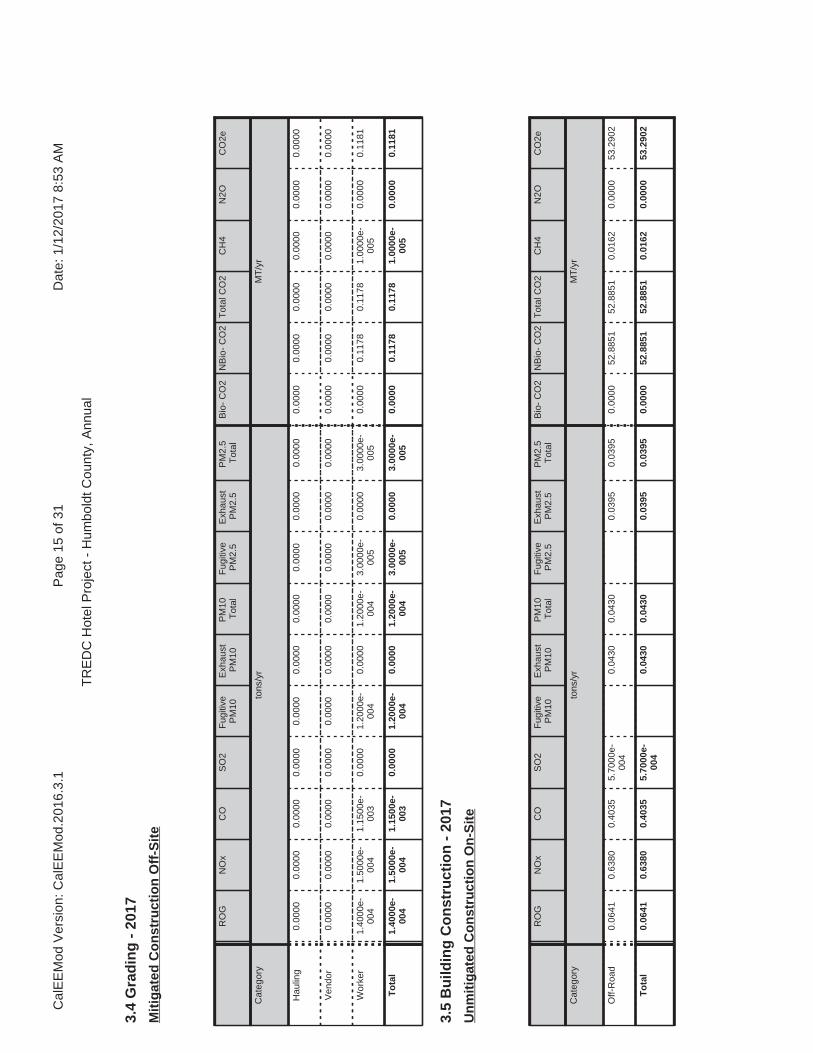
3.4
Gra
din
g -
201
7
RO
GN
Ox
CO
SO
2F
ugiti
veP
M10
Exh
aust
PM
10P
M10
Tot
alF
ugiti
veP
M2.
5E
xhau
stP
M2.
5P
M2.
5T
otal
Bio
- C
O2
NB
io-
CO
2T
otal
CO
2C
H4
N2O
CO
2e
Cat
egor
yto
ns/y
rM
T/y
r
Hau
ling
0.00
000.
0000
0.00
000.
0000
0.00
000.
0000
0.00
000.
0000
0.00
000.
0000
0.00
000.
0000
0.00
000.
0000
0.00
000.
0000
Ven
dor
0.00
000.
0000
0.00
000.
0000
0.00
000.
0000
0.00
000.
0000
0.00
000.
0000
0.00
000.
0000
0.00
000.
0000
0.00
000.
0000
Wor
ker
1.40
00e-
004
1.50
00e-
004
1.15
00e-
003
0.00
001.
2000
e-00
40.
0000
1.20
00e-
004
3.00
00e-
005
0.00
003.
0000
e-00
50.
0000
0.11
780.
1178
1.00
00e-
005
0.00
000.
1181
To
tal
1.40
00e-
004
1.50
00e-
004
1.15
00e-
003
0.00
001.
2000
e-00
40.
0000
1.20
00e-
004
3.00
00e-
005
0.00
003.
0000
e-00
50.
0000
0.11
780.
1178
1.00
00e-
005
0.00
000.
1181
Mit
igat
ed C
on
stru
ctio
n O
ff-S
ite
3.5
Bu
ildin
g C
on
stru
ctio
n -
201
7
RO
GN
Ox
CO
SO
2F
ugiti
veP
M10
Exh
aust
PM
10P
M10
Tot
alF
ugiti
veP
M2.
5E
xhau
stP
M2.
5P
M2.
5T
otal
Bio
- C
O2
NB
io-
CO
2T
otal
CO
2C
H4
N2O
CO
2e
Cat
egor
yto
ns/y
rM
T/y
r
Off-
Roa
d0.
0641
0.63
800.
4035
5.70
00e-
004
0.04
300.
0430
0.03
950.
0395
0.00
0052
.885
152
.885
10.
0162
0.00
0053
.290
2
To
tal
0.06
410.
6380
0.40
355.
7000
e-00
40.
0430
0.04
300.
0395
0.03
950.
0000
52.8
851
52.8
851
0.01
620.
0000
53.2
902
Un
mit
igat
ed C
on
stru
ctio
n O
n-S
ite
Cal
EE
Mod
Ver
sion
: Cal
EE
Mod
.201
6.3.
1D
ate:
1/1
2/20
17 8
:53
AM
Pag
e 15
of 3
1
TR
ED
C H
otel
Pro
ject
- H
umbo
ldt C
ount
y, A
nnua
l

3.5
Bu
ildin
g C
on
stru
ctio
n -
201
7
RO
GN
Ox
CO
SO
2F
ugiti
veP
M10
Exh
aust
PM
10P
M10
Tot
alF
ugiti
veP
M2.
5E
xhau
stP
M2.
5P
M2.
5T
otal
Bio
- C
O2
NB
io-
CO
2T
otal
CO
2C
H4
N2O
CO
2e
Cat
egor
yto
ns/y
rM
T/y
r
Hau
ling
0.00
000.
0000
0.00
000.
0000
0.00
000.
0000
0.00
000.
0000
0.00
000.
0000
0.00
000.
0000
0.00
000.
0000
0.00
000.
0000
Ven
dor
1.34
00e-
003
0.02
348.
4100
e-00
34.
0000
e-00
58.
7000
e-00
42.
9000
e-00
41.
1600
e-00
32.
5000
e-00
42.
8000
e-00
45.
3000
e-00
40.
0000
3.67
773.
6777
2.40
00e-
004
0.00
003.
6837
Wor
ker
4.87
00e-
003
5.12
00e-
003
0.04
045.
0000
e-00
54.
2000
e-00
35.
0000
e-00
54.
2500
e-00
31.
1200
e-00
35.
0000
e-00
51.
1600
e-00
30.
0000
4.12
454.
1245
3.60
00e-
004
0.00
004.
1336
To
tal
6.21
00e-
003
0.02
850.
0488
9.00
00e-
005
5.07
00e-
003
3.40
00e-
004
5.41
00e-
003
1.37
00e-
003
3.30
00e-
004
1.69
00e-
003
0.00
007.
8022
7.80
226.
0000
e-00
40.
0000
7.81
73
Un
mit
igat
ed C
on
stru
ctio
n O
ff-S
ite
RO
GN
Ox
CO
SO
2F
ugiti
veP
M10
Exh
aust
PM
10P
M10
Tot
alF
ugiti
veP
M2.
5E
xhau
stP
M2.
5P
M2.
5T
otal
Bio
- C
O2
NB
io-
CO
2T
otal
CO
2C
H4
N2O
CO
2e
Cat
egor
yto
ns/y
rM
T/y
r
Off-
Roa
d0.
0140
0.30
650.
3981
5.70
00e-
004
2.89
00e-
003
2.89
00e-
003
2.89
00e-
003
2.89
00e-
003
0.00
0052
.885
052
.885
00.
0162
0.00
0053
.290
1
To
tal
0.01
400.
3065
0.39
815.
7000
e-00
42.
8900
e-00
32.
8900
e-00
32.
8900
e-00
32.
8900
e-00
30.
0000
52.8
850
52.8
850
0.01
620.
0000
53.2
901
Mit
igat
ed C
on
stru
ctio
n O
n-S
ite
Cal
EE
Mod
Ver
sion
: Cal
EE
Mod
.201
6.3.
1D
ate:
1/1
2/20
17 8
:53
AM
Pag
e 16
of 3
1
TR
ED
C H
otel
Pro
ject
- H
umbo
ldt C
ount
y, A
nnua
l
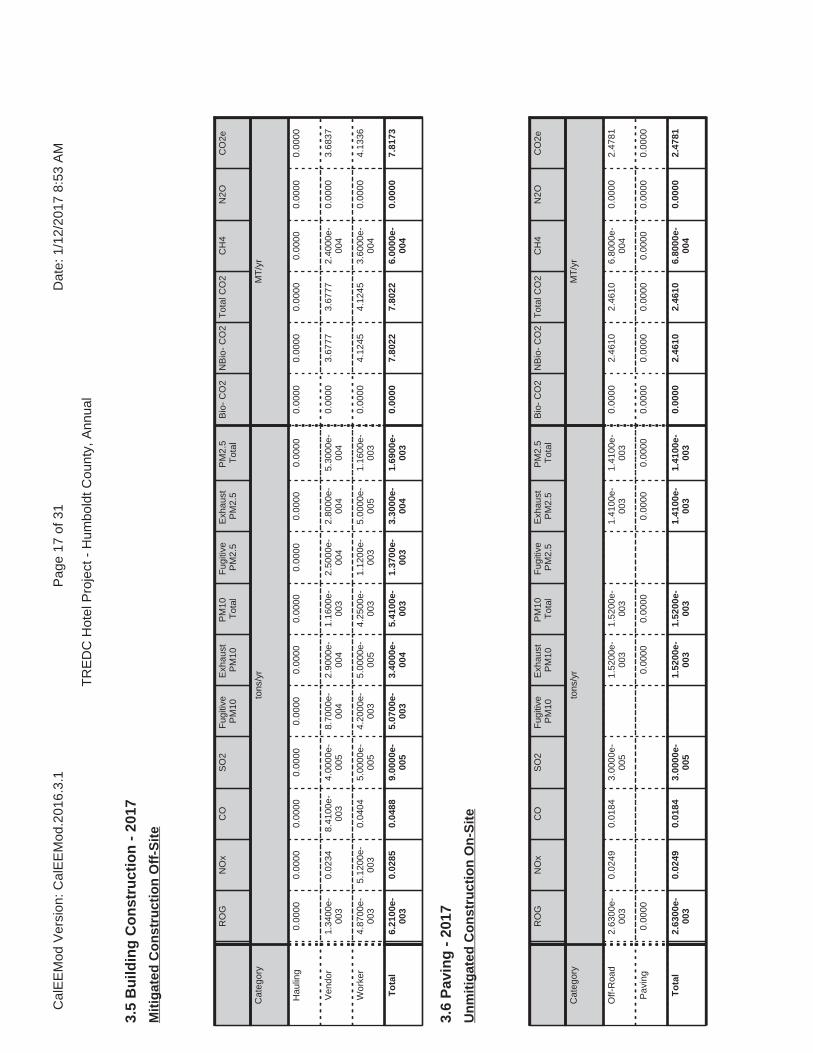
3.5
Bu
ildin
g C
on
stru
ctio
n -
201
7
RO
GN
Ox
CO
SO
2F
ugiti
veP
M10
Exh
aust
PM
10P
M10
Tot
alF
ugiti
veP
M2.
5E
xhau
stP
M2.
5P
M2.
5T
otal
Bio
- C
O2
NB
io-
CO
2T
otal
CO
2C
H4
N2O
CO
2e
Cat
egor
yto
ns/y
rM
T/y
r
Hau
ling
0.00
000.
0000
0.00
000.
0000
0.00
000.
0000
0.00
000.
0000
0.00
000.
0000
0.00
000.
0000
0.00
000.
0000
0.00
000.
0000
Ven
dor
1.34
00e-
003
0.02
348.
4100
e-00
34.
0000
e-00
58.
7000
e-00
42.
9000
e-00
41.
1600
e-00
32.
5000
e-00
42.
8000
e-00
45.
3000
e-00
40.
0000
3.67
773.
6777
2.40
00e-
004
0.00
003.
6837
Wor
ker
4.87
00e-
003
5.12
00e-
003
0.04
045.
0000
e-00
54.
2000
e-00
35.
0000
e-00
54.
2500
e-00
31.
1200
e-00
35.
0000
e-00
51.
1600
e-00
30.
0000
4.12
454.
1245
3.60
00e-
004
0.00
004.
1336
To
tal
6.21
00e-
003
0.02
850.
0488
9.00
00e-
005
5.07
00e-
003
3.40
00e-
004
5.41
00e-
003
1.37
00e-
003
3.30
00e-
004
1.69
00e-
003
0.00
007.
8022
7.80
226.
0000
e-00
40.
0000
7.81
73
Mit
igat
ed C
on
stru
ctio
n O
ff-S
ite
3.6
Pav
ing
- 2
017
RO
GN
Ox
CO
SO
2F
ugiti
veP
M10
Exh
aust
PM
10P
M10
Tot
alF
ugiti
veP
M2.
5E
xhau
stP
M2.
5P
M2.
5T
otal
Bio
- C
O2
NB
io-
CO
2T
otal
CO
2C
H4
N2O
CO
2e
Cat
egor
yto
ns/y
rM
T/y
r
Off-
Roa
d2.
6300
e-00
30.
0249
0.01
843.
0000
e-00
51.
5200
e-00
31.
5200
e-00
31.
4100
e-00
31.
4100
e-00
30.
0000
2.46
102.
4610
6.80
00e-
004
0.00
002.
4781
Pav
ing
0.00
000.
0000
0.00
000.
0000
0.00
000.
0000
0.00
000.
0000
0.00
000.
0000
0.00
00
To
tal
2.63
00e-
003
0.02
490.
0184
3.00
00e-
005
1.52
00e-
003
1.52
00e-
003
1.41
00e-
003
1.41
00e-
003
0.00
002.
4610
2.46
106.
8000
e-00
40.
0000
2.47
81
Un
mit
igat
ed C
on
stru
ctio
n O
n-S
ite
Cal
EE
Mod
Ver
sion
: Cal
EE
Mod
.201
6.3.
1D
ate:
1/1
2/20
17 8
:53
AM
Pag
e 17
of 3
1
TR
ED
C H
otel
Pro
ject
- H
umbo
ldt C
ount
y, A
nnua
l

3.6
Pav
ing
- 2
017
RO
GN
Ox
CO
SO
2F
ugiti
veP
M10
Exh
aust
PM
10P
M10
Tot
alF
ugiti
veP
M2.
5E
xhau
stP
M2.
5P
M2.
5T
otal
Bio
- C
O2
NB
io-
CO
2T
otal
CO
2C
H4
N2O
CO
2e
Cat
egor
yto
ns/y
rM
T/y
r
Hau
ling
0.00
000.
0000
0.00
000.
0000
0.00
000.
0000
0.00
000.
0000
0.00
000.
0000
0.00
000.
0000
0.00
000.
0000
0.00
000.
0000
Ven
dor
0.00
000.
0000
0.00
000.
0000
0.00
000.
0000
0.00
000.
0000
0.00
000.
0000
0.00
000.
0000
0.00
000.
0000
0.00
000.
0000
Wor
ker
6.30
00e-
004
6.60
00e-
004
5.20
00e-
003
1.00
00e-
005
5.40
00e-
004
1.00
00e-
005
5.50
00e-
004
1.40
00e-
004
1.00
00e-
005
1.50
00e-
004
0.00
000.
5303
0.53
035.
0000
e-00
50.
0000
0.53
15
To
tal
6.30
00e-
004
6.60
00e-
004
5.20
00e-
003
1.00
00e-
005
5.40
00e-
004
1.00
00e-
005
5.50
00e-
004
1.40
00e-
004
1.00
00e-
005
1.50
00e-
004
0.00
000.
5303
0.53
035.
0000
e-00
50.
0000
0.53
15
Un
mit
igat
ed C
on
stru
ctio
n O
ff-S
ite
RO
GN
Ox
CO
SO
2F
ugiti
veP
M10
Exh
aust
PM
10P
M10
Tot
alF
ugiti
veP
M2.
5E
xhau
stP
M2.
5P
M2.
5T
otal
Bio
- C
O2
NB
io-
CO
2T
otal
CO
2C
H4
N2O
CO
2e
Cat
egor
yto
ns/y
rM
T/y
r
Off-
Roa
d5.
6000
e-00
40.
0119
0.01
733.
0000
e-00
51.
1000
e-00
41.
1000
e-00
41.
1000
e-00
41.
1000
e-00
40.
0000
2.46
102.
4610
6.80
00e-
004
0.00
002.
4781
Pav
ing
0.00
000.
0000
0.00
000.
0000
0.00
000.
0000
0.00
000.
0000
0.00
000.
0000
0.00
00
To
tal
5.60
00e-
004
0.01
190.
0173
3.00
00e-
005
1.10
00e-
004
1.10
00e-
004
1.10
00e-
004
1.10
00e-
004
0.00
002.
4610
2.46
106.
8000
e-00
40.
0000
2.47
81
Mit
igat
ed C
on
stru
ctio
n O
n-S
ite
Cal
EE
Mod
Ver
sion
: Cal
EE
Mod
.201
6.3.
1D
ate:
1/1
2/20
17 8
:53
AM
Pag
e 18
of 3
1
TR
ED
C H
otel
Pro
ject
- H
umbo
ldt C
ount
y, A
nnua
l
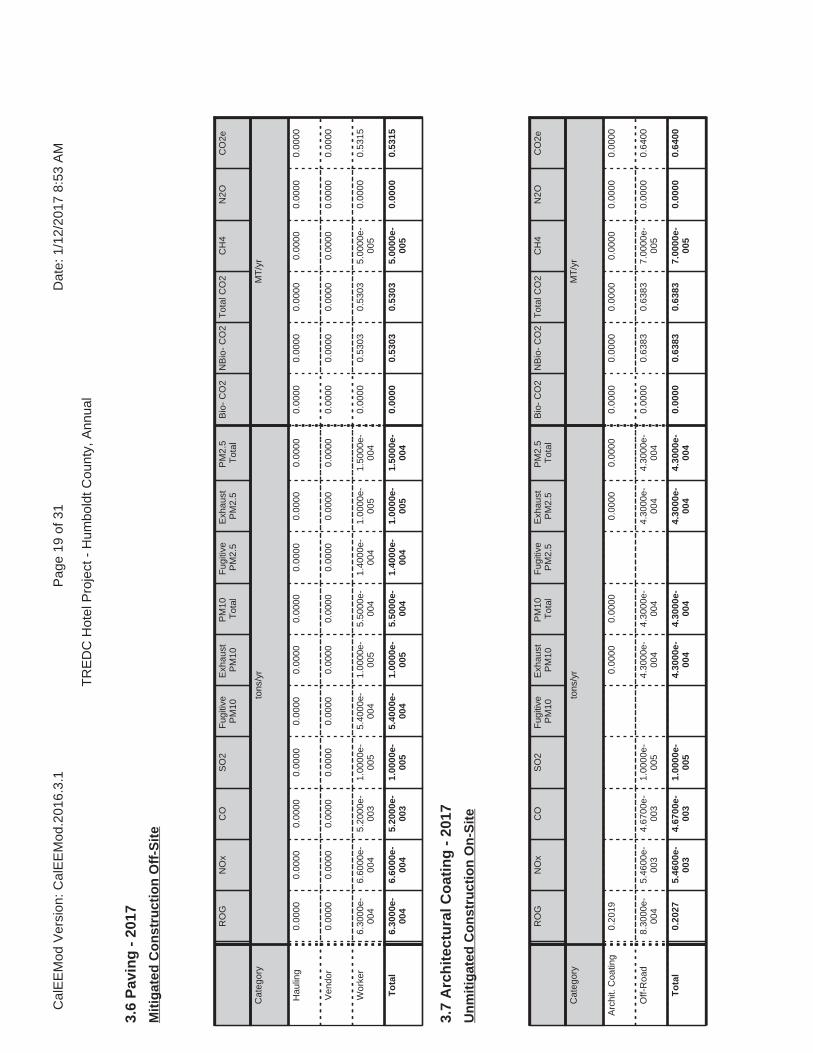
3.6
Pav
ing
- 2
017
RO
GN
Ox
CO
SO
2F
ugiti
veP
M10
Exh
aust
PM
10P
M10
Tot
alF
ugiti
veP
M2.
5E
xhau
stP
M2.
5P
M2.
5T
otal
Bio
- C
O2
NB
io-
CO
2T
otal
CO
2C
H4
N2O
CO
2e
Cat
egor
yto
ns/y
rM
T/y
r
Hau
ling
0.00
000.
0000
0.00
000.
0000
0.00
000.
0000
0.00
000.
0000
0.00
000.
0000
0.00
000.
0000
0.00
000.
0000
0.00
000.
0000
Ven
dor
0.00
000.
0000
0.00
000.
0000
0.00
000.
0000
0.00
000.
0000
0.00
000.
0000
0.00
000.
0000
0.00
000.
0000
0.00
000.
0000
Wor
ker
6.30
00e-
004
6.60
00e-
004
5.20
00e-
003
1.00
00e-
005
5.40
00e-
004
1.00
00e-
005
5.50
00e-
004
1.40
00e-
004
1.00
00e-
005
1.50
00e-
004
0.00
000.
5303
0.53
035.
0000
e-00
50.
0000
0.53
15
To
tal
6.30
00e-
004
6.60
00e-
004
5.20
00e-
003
1.00
00e-
005
5.40
00e-
004
1.00
00e-
005
5.50
00e-
004
1.40
00e-
004
1.00
00e-
005
1.50
00e-
004
0.00
000.
5303
0.53
035.
0000
e-00
50.
0000
0.53
15
Mit
igat
ed C
on
stru
ctio
n O
ff-S
ite
3.7
Arc
hit
ectu
ral C
oat
ing
- 2
017
RO
GN
Ox
CO
SO
2F
ugiti
veP
M10
Exh
aust
PM
10P
M10
Tot
alF
ugiti
veP
M2.
5E
xhau
stP
M2.
5P
M2.
5T
otal
Bio
- C
O2
NB
io-
CO
2T
otal
CO
2C
H4
N2O
CO
2e
Cat
egor
yto
ns/y
rM
T/y
r
Arc
hit.
Coa
ting
0.20
190.
0000
0.00
000.
0000
0.00
000.
0000
0.00
000.
0000
0.00
000.
0000
0.00
00
Off-
Roa
d8.
3000
e-00
45.
4600
e-00
34.
6700
e-00
31.
0000
e-00
54.
3000
e-00
44.
3000
e-00
44.
3000
e-00
44.
3000
e-00
40.
0000
0.63
830.
6383
7.00
00e-
005
0.00
000.
6400
To
tal
0.20
275.
4600
e-00
34.
6700
e-00
31.
0000
e-00
54.
3000
e-00
44.
3000
e-00
44.
3000
e-00
44.
3000
e-00
40.
0000
0.63
830.
6383
7.00
00e-
005
0.00
000.
6400
Un
mit
igat
ed C
on
stru
ctio
n O
n-S
ite
Cal
EE
Mod
Ver
sion
: Cal
EE
Mod
.201
6.3.
1D
ate:
1/1
2/20
17 8
:53
AM
Pag
e 19
of 3
1
TR
ED
C H
otel
Pro
ject
- H
umbo
ldt C
ount
y, A
nnua
l

3.7
Arc
hit
ectu
ral C
oat
ing
- 2
017
RO
GN
Ox
CO
SO
2F
ugiti
veP
M10
Exh
aust
PM
10P
M10
Tot
alF
ugiti
veP
M2.
5E
xhau
stP
M2.
5P
M2.
5T
otal
Bio
- C
O2
NB
io-
CO
2T
otal
CO
2C
H4
N2O
CO
2e
Cat
egor
yto
ns/y
rM
T/y
r
Hau
ling
0.00
000.
0000
0.00
000.
0000
0.00
000.
0000
0.00
000.
0000
0.00
000.
0000
0.00
000.
0000
0.00
000.
0000
0.00
000.
0000
Ven
dor
0.00
000.
0000
0.00
000.
0000
0.00
000.
0000
0.00
000.
0000
0.00
000.
0000
0.00
000.
0000
0.00
000.
0000
0.00
000.
0000
Wor
ker
3.00
00e-
005
4.00
00e-
005
2.90
00e-
004
0.00
003.
0000
e-00
50.
0000
3.00
00e-
005
1.00
00e-
005
0.00
001.
0000
e-00
50.
0000
0.02
950.
0295
0.00
000.
0000
0.02
95
To
tal
3.00
00e-
005
4.00
00e-
005
2.90
00e-
004
0.00
003.
0000
e-00
50.
0000
3.00
00e-
005
1.00
00e-
005
0.00
001.
0000
e-00
50.
0000
0.02
950.
0295
0.00
000.
0000
0.02
95
Un
mit
igat
ed C
on
stru
ctio
n O
ff-S
ite
RO
GN
Ox
CO
SO
2F
ugiti
veP
M10
Exh
aust
PM
10P
M10
Tot
alF
ugiti
veP
M2.
5E
xhau
stP
M2.
5P
M2.
5T
otal
Bio
- C
O2
NB
io-
CO
2T
otal
CO
2C
H4
N2O
CO
2e
Cat
egor
yto
ns/y
rM
T/y
r
Arc
hit.
Coa
ting
0.20
190.
0000
0.00
000.
0000
0.00
000.
0000
0.00
000.
0000
0.00
000.
0000
0.00
00
Off-
Roa
d1.
5000
e-00
43.
3900
e-00
34.
5800
e-00
31.
0000
e-00
54.
0000
e-00
54.
0000
e-00
54.
0000
e-00
54.
0000
e-00
50.
0000
0.63
830.
6383
7.00
00e-
005
0.00
000.
6400
To
tal
0.20
213.
3900
e-00
34.
5800
e-00
31.
0000
e-00
54.
0000
e-00
54.
0000
e-00
54.
0000
e-00
54.
0000
e-00
50.
0000
0.63
830.
6383
7.00
00e-
005
0.00
000.
6400
Mit
igat
ed C
on
stru
ctio
n O
n-S
ite
Cal
EE
Mod
Ver
sion
: Cal
EE
Mod
.201
6.3.
1D
ate:
1/1
2/20
17 8
:53
AM
Pag
e 20
of 3
1
TR
ED
C H
otel
Pro
ject
- H
umbo
ldt C
ount
y, A
nnua
l
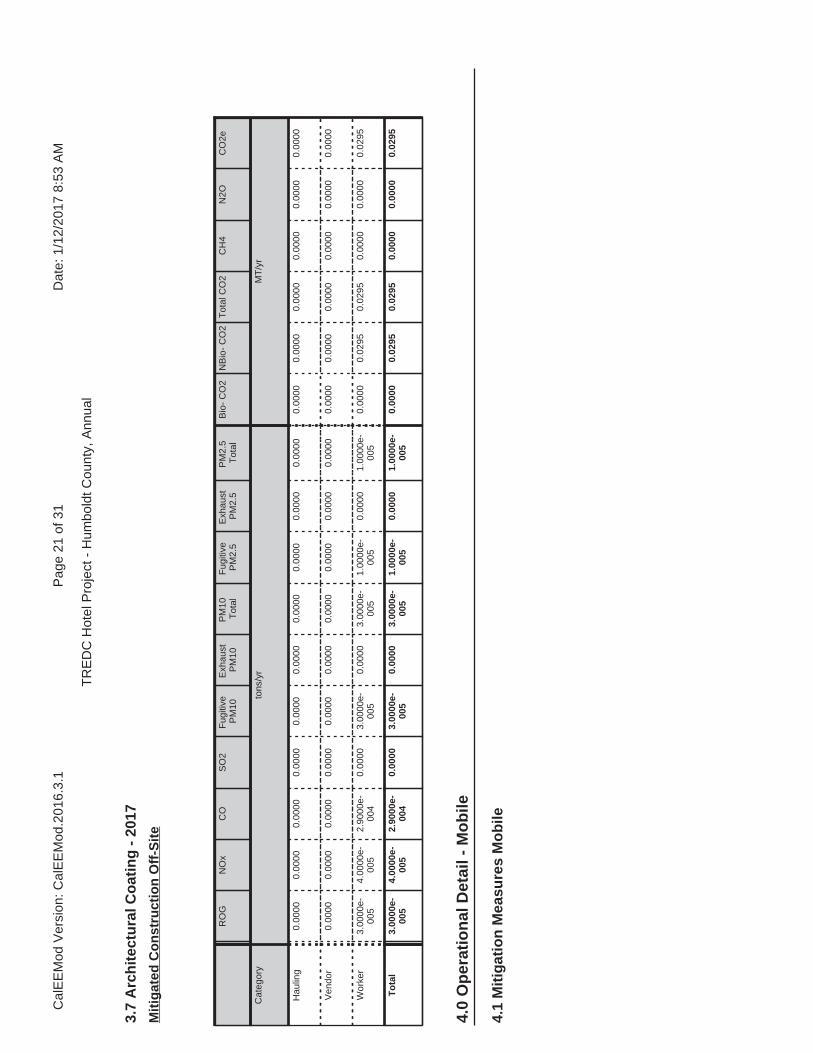
4.0
Op
erat
ion
al D
etai
l - M
ob
ile
4.1
Mit
igat
ion
Mea
sure
s M
ob
ile
3.7
Arc
hit
ectu
ral C
oat
ing
- 2
017
RO
GN
Ox
CO
SO
2F
ugiti
veP
M10
Exh
aust
PM
10P
M10
Tot
alF
ugiti
veP
M2.
5E
xhau
stP
M2.
5P
M2.
5T
otal
Bio
- C
O2
NB
io-
CO
2T
otal
CO
2C
H4
N2O
CO
2e
Cat
egor
yto
ns/y
rM
T/y
r
Hau
ling
0.00
000.
0000
0.00
000.
0000
0.00
000.
0000
0.00
000.
0000
0.00
000.
0000
0.00
000.
0000
0.00
000.
0000
0.00
000.
0000
Ven
dor
0.00
000.
0000
0.00
000.
0000
0.00
000.
0000
0.00
000.
0000
0.00
000.
0000
0.00
000.
0000
0.00
000.
0000
0.00
000.
0000
Wor
ker
3.00
00e-
005
4.00
00e-
005
2.90
00e-
004
0.00
003.
0000
e-00
50.
0000
3.00
00e-
005
1.00
00e-
005
0.00
001.
0000
e-00
50.
0000
0.02
950.
0295
0.00
000.
0000
0.02
95
To
tal
3.00
00e-
005
4.00
00e-
005
2.90
00e-
004
0.00
003.
0000
e-00
50.
0000
3.00
00e-
005
1.00
00e-
005
0.00
001.
0000
e-00
50.
0000
0.02
950.
0295
0.00
000.
0000
0.02
95
Mit
igat
ed C
on
stru
ctio
n O
ff-S
ite
Cal
EE
Mod
Ver
sion
: Cal
EE
Mod
.201
6.3.
1D
ate:
1/1
2/20
17 8
:53
AM
Pag
e 21
of 3
1
TR
ED
C H
otel
Pro
ject
- H
umbo
ldt C
ount
y, A
nnua
l
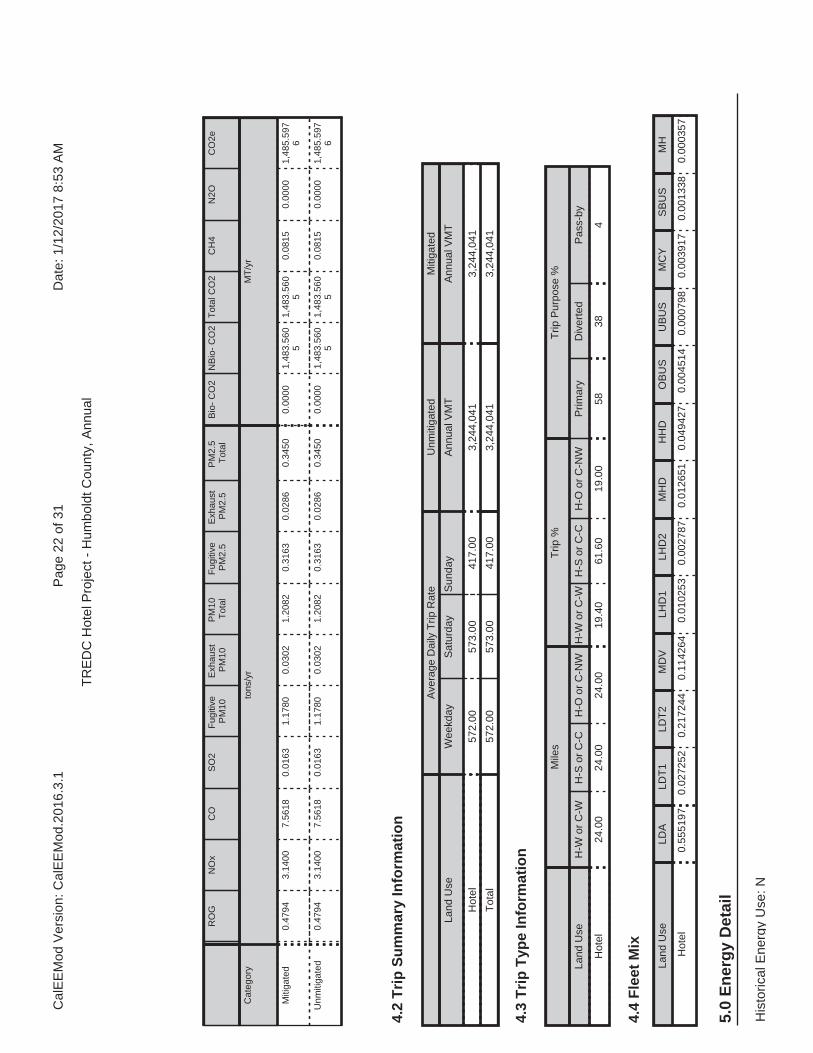
RO
GN
Ox
CO
SO
2F
ugiti
veP
M10
Exh
aust
PM
10P
M10
Tot
alF
ugiti
veP
M2.
5E
xhau
stP
M2.
5P
M2.
5T
otal
Bio
- C
O2
NB
io-
CO
2T
otal
CO
2C
H4
N2O
CO
2e
Cat
egor
yto
ns/y
rM
T/y
r
Miti
gate
d0.
4794
3.14
007.
5618
0.01
631.
1780
0.03
021.
2082
0.31
630.
0286
0.34
500.
0000
1,48
3.56
05
1,48
3.56
05
0.08
150.
0000
1,48
5.59
76
Unm
itiga
ted
0.47
943.
1400
7.56
180.
0163
1.17
800.
0302
1.20
820.
3163
0.02
860.
3450
0.00
001,
483.
560
51,
483.
560
50.
0815
0.00
001,
485.
597
6
4.2
Tri
p S
um
mar
y In
form
atio
n
4.3
Tri
p T
ype
Info
rmat
ion
Ave
rage
Dai
ly T
rip R
ate
Unm
itiga
ted
Miti
gate
d
Land
Use
Wee
kday
Sat
urda
yS
unda
yA
nnua
l VM
TA
nnua
l VM
T
Hot
el57
2.00
573.
0041
7.00
3,24
4,04
13,
244,
041
Tot
al57
2.00
573.
0041
7.00
3,24
4,04
13,
244,
041
Mile
sT
rip %
Trip
Pur
pose
%
Land
Use
H-W
or
C-W
H-S
or
C-C
H-O
or
C-N
WH
-W o
r C
-WH
-S o
r C
-CH
-O o
r C
-NW
Prim
ary
Div
erte
dP
ass-
by
Hot
el24
.00
24.0
024
.00
19.4
061
.60
19.0
058
384
5.0
En
erg
y D
etai
l
4.4
Fle
et M
ix
Land
Use
LD
ALD
T1
LDT
2M
DV
LHD
1LH
D2
MH
DH
HD
OB
US
UB
US
MC
YS
BU
SM
H
Hot
el0.
5551
970.
0272
520.
2172
440.
1142
640.
0102
530.
0027
870.
0126
510.
0494
270.
0045
140.
0007
980.
0039
170.
0013
380.
0003
57
His
toric
al E
nerg
y U
se: N
Cal
EE
Mod
Ver
sion
: Cal
EE
Mod
.201
6.3.
1D
ate:
1/1
2/20
17 8
:53
AM
Pag
e 22
of 3
1
TR
ED
C H
otel
Pro
ject
- H
umbo
ldt C
ount
y, A
nnua
l

RO
GN
Ox
CO
SO
2F
ugiti
veP
M10
Exh
aust
PM
10P
M10
Tot
alF
ugiti
veP
M2.
5E
xhau
stP
M2.
5P
M2.
5T
otal
Bio
- C
O2
NB
io-
CO
2T
otal
CO
2C
H4
N2O
CO
2e
Cat
egor
yto
ns/y
rM
T/y
r
Ele
ctric
ityM
itiga
ted
0.00
000.
0000
0.00
000.
0000
0.00
0038
.726
038
.726
01.
7500
e-00
33.
6000
e-00
438
.877
7
Ele
ctric
ityU
nmiti
gate
d0.
0000
0.00
000.
0000
0.00
000.
0000
38.7
260
38.7
260
1.75
00e-
003
3.60
00e-
004
38.8
777
Nat
ural
Gas
Miti
gate
d1.
9600
e-00
30.
0178
0.01
501.
1000
e-00
41.
3500
e-00
31.
3500
e-00
31.
3500
e-00
31.
3500
e-00
30.
0000
19.4
052
19.4
052
3.70
00e-
004
3.60
00e-
004
19.5
205
Nat
ural
Gas
Unm
itiga
ted
1.96
00e-
003
0.01
780.
0150
1.10
00e-
004
1.35
00e-
003
1.35
00e-
003
1.35
00e-
003
1.35
00e-
003
0.00
0019
.405
219
.405
23.
7000
e-00
43.
6000
e-00
419
.520
5
5.2
En
erg
y b
y L
and
Use
- N
atu
ralG
as
Nat
ural
Ga
s U
seR
OG
NO
xC
OS
O2
Fug
itive
PM
10E
xhau
stP
M10
PM
10T
otal
Fug
itive
PM
2.5
Exh
aust
PM
2.5
PM
2.5
Tot
alB
io-
CO
2N
Bio
- C
O2
Tot
al C
O2
CH
4N
2OC
O2e
Land
Use
kBT
U/y
rto
ns/y
rM
T/y
r
Hot
el36
3639
1.96
00e-
003
0.01
780.
0150
1.10
00e-
004
1.35
00e-
003
1.35
00e-
003
1.35
00e-
003
1.35
00e-
003
0.00
0019
.405
219
.405
23.
7000
e-00
43.
6000
e-00
419
.520
5
To
tal
1.96
00e-
003
0.01
780.
0150
1.10
00e-
004
1.35
00e-
003
1.35
00e-
003
1.35
00e-
003
1.35
00e-
003
0.00
0019
.405
219
.405
23.
7000
e-00
43.
6000
e-00
419
.520
5
Un
mit
igat
ed
5.1
Mit
igat
ion
Mea
sure
s E
ner
gy
Cal
EE
Mod
Ver
sion
: Cal
EE
Mod
.201
6.3.
1D
ate:
1/1
2/20
17 8
:53
AM
Pag
e 23
of 3
1
TR
ED
C H
otel
Pro
ject
- H
umbo
ldt C
ount
y, A
nnua
l

5.2
En
erg
y b
y L
and
Use
- N
atu
ralG
as
Nat
ural
Ga
s U
seR
OG
NO
xC
OS
O2
Fug
itive
PM
10E
xhau
stP
M10
PM
10T
otal
Fug
itive
PM
2.5
Exh
aust
PM
2.5
PM
2.5
Tot
alB
io-
CO
2N
Bio
- C
O2
Tot
al C
O2
CH
4N
2OC
O2e
Land
Use
kBT
U/y
rto
ns/y
rM
T/y
r
Hot
el36
3639
1.96
00e-
003
0.01
780.
0150
1.10
00e-
004
1.35
00e-
003
1.35
00e-
003
1.35
00e-
003
1.35
00e-
003
0.00
0019
.405
219
.405
23.
7000
e-00
43.
6000
e-00
419
.520
5
To
tal
1.96
00e-
003
0.01
780.
0150
1.10
00e-
004
1.35
00e-
003
1.35
00e-
003
1.35
00e-
003
1.35
00e-
003
0.00
0019
.405
219
.405
23.
7000
e-00
43.
6000
e-00
419
.520
5
Mit
igat
ed
5.3
En
erg
y b
y L
and
Use
- E
lect
rici
ty
Ele
ctric
ityU
seT
otal
CO
2C
H4
N2O
CO
2e
Land
Use
kWh/
yrM
T/y
r
Hot
el13
3119
38.7
260
1.75
00e-
003
3.60
00e-
004
38.8
777
To
tal
38.7
260
1.75
00e-
003
3.60
00e-
004
38.8
777
Un
mit
igat
ed
Cal
EE
Mod
Ver
sion
: Cal
EE
Mod
.201
6.3.
1D
ate:
1/1
2/20
17 8
:53
AM
Pag
e 24
of 3
1
TR
ED
C H
otel
Pro
ject
- H
umbo
ldt C
ount
y, A
nnua
l
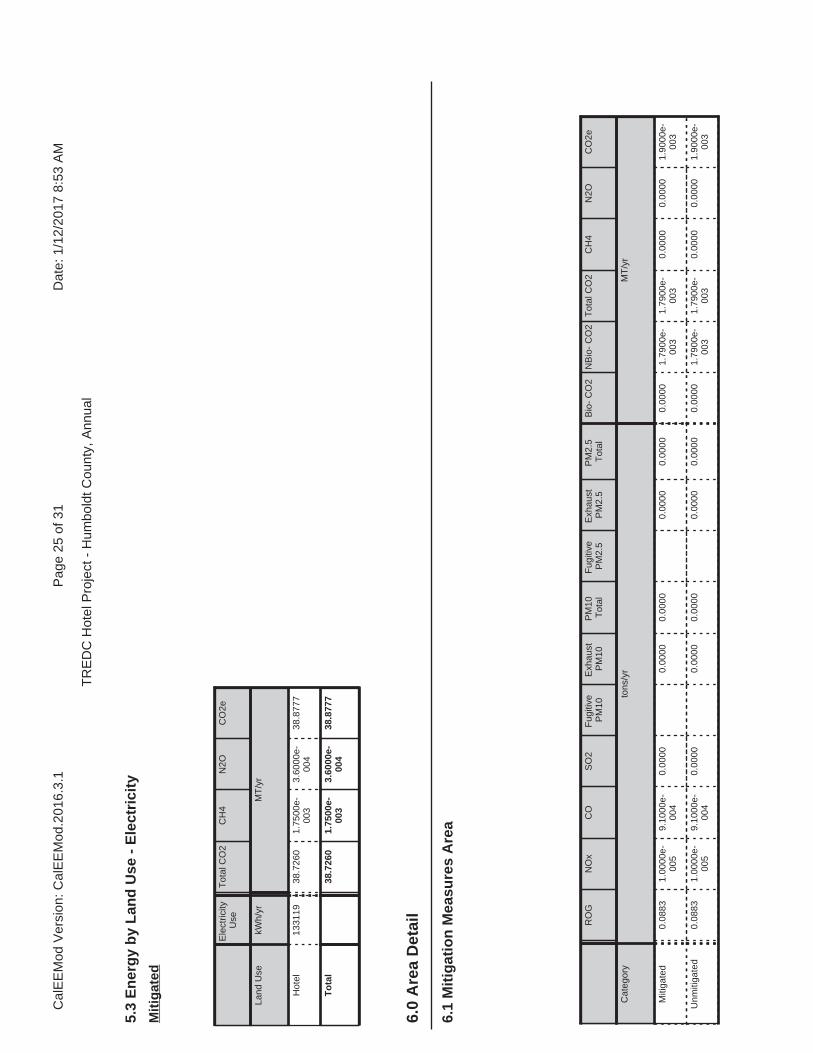
6.1
Mit
igat
ion
Mea
sure
s A
rea
6.0
Are
a D
etai
l
RO
GN
Ox
CO
SO
2F
ugiti
veP
M10
Exh
aust
PM
10P
M10
Tot
alF
ugiti
veP
M2.
5E
xhau
stP
M2.
5P
M2.
5T
otal
Bio
- C
O2
NB
io-
CO
2T
otal
CO
2C
H4
N2O
CO
2e
Cat
egor
yto
ns/y
rM
T/y
r
Miti
gate
d0.
0883
1.00
00e-
005
9.10
00e-
004
0.00
000.
0000
0.00
000.
0000
0.00
000.
0000
1.79
00e-
003
1.79
00e-
003
0.00
000.
0000
1.90
00e-
003
Unm
itiga
ted
0.08
831.
0000
e-00
59.
1000
e-00
40.
0000
0.00
000.
0000
0.00
000.
0000
0.00
001.
7900
e-00
31.
7900
e-00
30.
0000
0.00
001.
9000
e-00
3
5.3
En
erg
y b
y L
and
Use
- E
lect
rici
ty
Ele
ctric
ityU
seT
otal
CO
2C
H4
N2O
CO
2e
Land
Use
kWh/
yrM
T/y
r
Hot
el13
3119
38.7
260
1.75
00e-
003
3.60
00e-
004
38.8
777
To
tal
38.7
260
1.75
00e-
003
3.60
00e-
004
38.8
777
Mit
igat
ed
Cal
EE
Mod
Ver
sion
: Cal
EE
Mod
.201
6.3.
1D
ate:
1/1
2/20
17 8
:53
AM
Pag
e 25
of 3
1
TR
ED
C H
otel
Pro
ject
- H
umbo
ldt C
ount
y, A
nnua
l

7.0
Wat
er D
etai
l
6.2
Are
a b
y S
ub
Cat
ego
ry
RO
GN
Ox
CO
SO
2F
ugiti
veP
M10
Exh
aust
PM
10P
M10
Tot
alF
ugiti
veP
M2.
5E
xhau
stP
M2.
5P
M2.
5T
otal
Bio
- C
O2
NB
io-
CO
2T
otal
CO
2C
H4
N2O
CO
2e
Sub
Cat
egor
yto
ns/y
rM
T/y
r
Arc
hite
ctur
alC
oatin
g0.
0202
0.00
000.
0000
0.00
000.
0000
0.00
000.
0000
0.00
000.
0000
0.00
000.
0000
Con
sum
erP
rodu
cts
0.06
810.
0000
0.00
000.
0000
0.00
000.
0000
0.00
000.
0000
0.00
000.
0000
0.00
00
Land
scap
ing
8.00
00e-
005
1.00
00e-
005
9.10
00e-
004
0.00
000.
0000
0.00
000.
0000
0.00
000.
0000
1.79
00e-
003
1.79
00e-
003
0.00
000.
0000
1.90
00e-
003
To
tal
0.08
831.
0000
e-00
59.
1000
e-00
40.
0000
0.00
000.
0000
0.00
000.
0000
0.00
001.
7900
e-00
31.
7900
e-00
30.
0000
0.00
001.
9000
e-00
3
Un
mit
igat
ed
RO
GN
Ox
CO
SO
2F
ugiti
veP
M10
Exh
aust
PM
10P
M10
Tot
alF
ugiti
veP
M2.
5E
xhau
stP
M2.
5P
M2.
5T
otal
Bio
- C
O2
NB
io-
CO
2T
otal
CO
2C
H4
N2O
CO
2e
Sub
Cat
egor
yto
ns/y
rM
T/y
r
Arc
hite
ctur
alC
oatin
g0.
0202
0.00
000.
0000
0.00
000.
0000
0.00
000.
0000
0.00
000.
0000
0.00
000.
0000
Con
sum
erP
rodu
cts
0.06
810.
0000
0.00
000.
0000
0.00
000.
0000
0.00
000.
0000
0.00
000.
0000
0.00
00
Land
scap
ing
8.00
00e-
005
1.00
00e-
005
9.10
00e-
004
0.00
000.
0000
0.00
000.
0000
0.00
000.
0000
1.79
00e-
003
1.79
00e-
003
0.00
000.
0000
1.90
00e-
003
To
tal
0.08
831.
0000
e-00
59.
1000
e-00
40.
0000
0.00
000.
0000
0.00
000.
0000
0.00
001.
7900
e-00
31.
7900
e-00
30.
0000
0.00
001.
9000
e-00
3
Mit
igat
ed
Cal
EE
Mod
Ver
sion
: Cal
EE
Mod
.201
6.3.
1D
ate:
1/1
2/20
17 8
:53
AM
Pag
e 26
of 3
1
TR
ED
C H
otel
Pro
ject
- H
umbo
ldt C
ount
y, A
nnua
l

Inst
all L
ow F
low
Bat
hroo
m F
auce
t
Inst
all L
ow F
low
Kitc
hen
Fau
cet
Inst
all L
ow F
low
Toi
let
Inst
all L
ow F
low
Sho
wer
7.1
Mit
igat
ion
Mea
sure
s W
ater
Tot
al C
O2
CH
4N
2OC
O2e
Cat
egor
yM
T/y
r
Miti
gate
d4.
1252
0.06
631.
5900
e-00
36.
2573
Unm
itiga
ted
5.08
480.
0829
1.99
00e-
003
7.74
96
Cal
EE
Mod
Ver
sion
: Cal
EE
Mod
.201
6.3.
1D
ate:
1/1
2/20
17 8
:53
AM
Pag
e 27
of 3
1
TR
ED
C H
otel
Pro
ject
- H
umbo
ldt C
ount
y, A
nnua
l
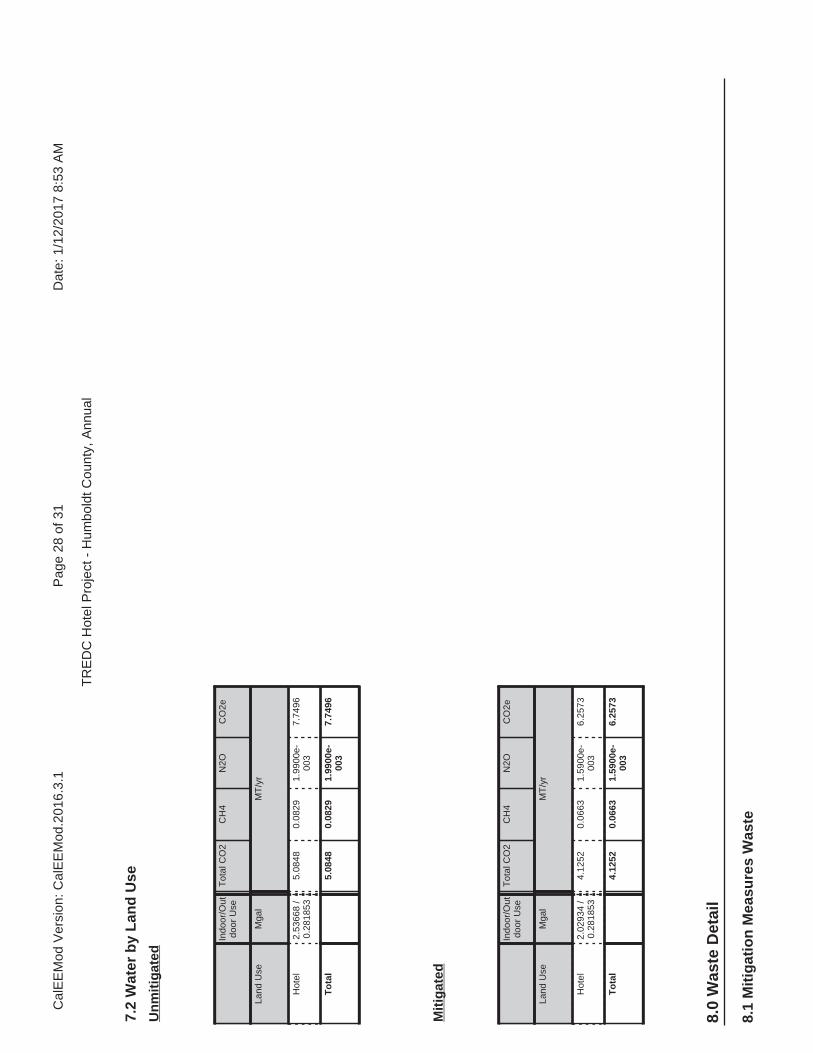
8.1
Mit
igat
ion
Mea
sure
s W
aste
7.2
Wat
er b
y L
and
Use
Indo
or/O
utdo
or U
seT
otal
CO
2C
H4
N2O
CO
2e
Land
Use
Mga
lM
T/y
r
Hot
el2.
5366
8 /
0.28
1853
5.08
480.
0829
1.99
00e-
003
7.74
96
To
tal
5.08
480.
0829
1.99
00e-
003
7.74
96
Un
mit
igat
ed
Indo
or/O
utdo
or U
seT
otal
CO
2C
H4
N2O
CO
2e
Land
Use
Mga
lM
T/y
r
Hot
el2.
0293
4 /
0.28
1853
4.12
520.
0663
1.59
00e-
003
6.25
73
To
tal
4.12
520.
0663
1.59
00e-
003
6.25
73
Mit
igat
ed
8.0
Was
te D
etai
l
Cal
EE
Mod
Ver
sion
: Cal
EE
Mod
.201
6.3.
1D
ate:
1/1
2/20
17 8
:53
AM
Pag
e 28
of 3
1
TR
ED
C H
otel
Pro
ject
- H
umbo
ldt C
ount
y, A
nnua
l
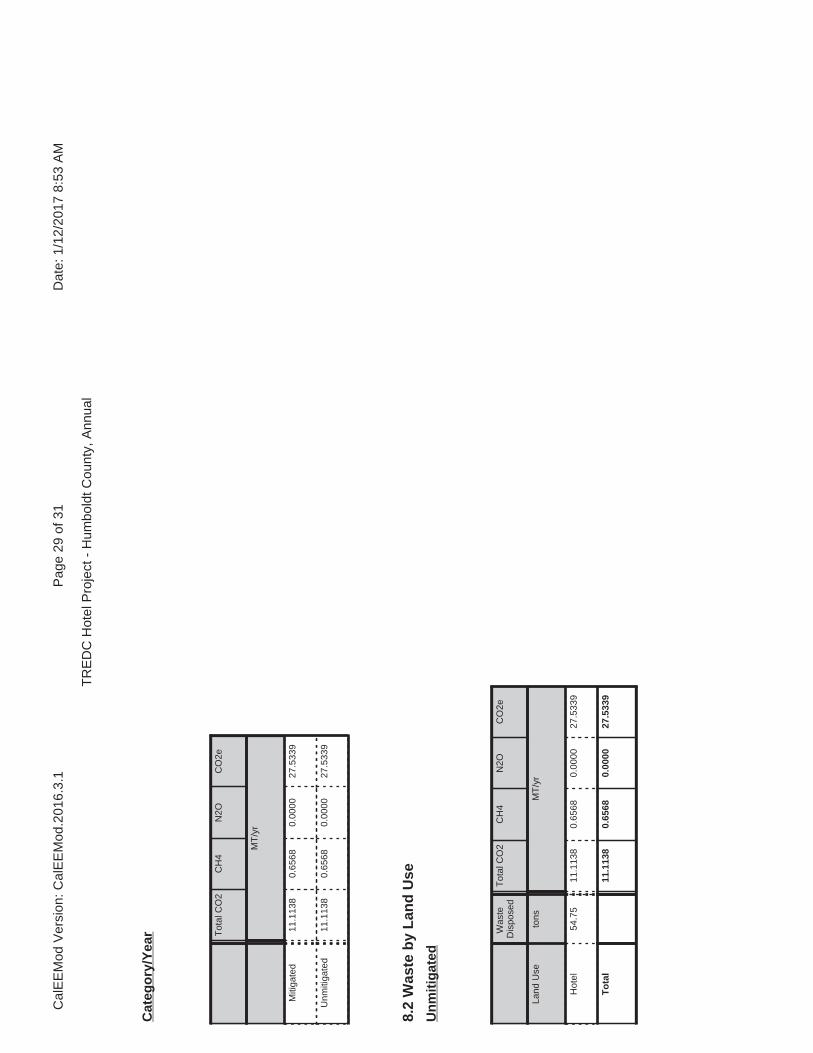
Tot
al C
O2
CH
4N
2OC
O2e
MT
/yr
Miti
gate
d11
.113
80.
6568
0.00
0027
.533
9
Unm
itiga
ted
11.1
138
0.65
680.
0000
27.5
339
Cat
ego
ry/Y
ear
8.2
Was
te b
y L
and
Use
Was
teD
ispo
sed
Tot
al C
O2
CH
4N
2OC
O2e
Land
Use
tons
MT
/yr
Hot
el54
.75
11.1
138
0.65
680.
0000
27.5
339
To
tal
11.1
138
0.65
680.
0000
27.5
339
Un
mit
igat
ed
Cal
EE
Mod
Ver
sion
: Cal
EE
Mod
.201
6.3.
1D
ate:
1/1
2/20
17 8
:53
AM
Pag
e 29
of 3
1
TR
ED
C H
otel
Pro
ject
- H
umbo
ldt C
ount
y, A
nnua
l
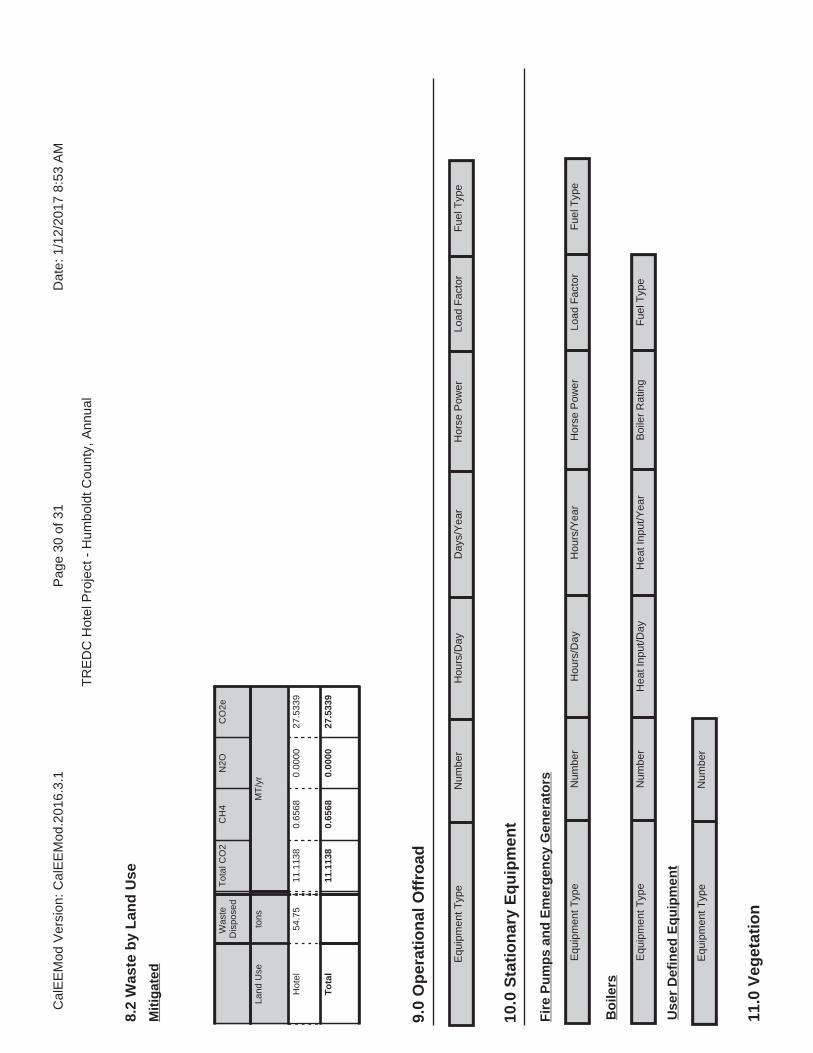
11.0
Veg
etat
ion
8.2
Was
te b
y L
and
Use
Was
teD
ispo
sed
Tot
al C
O2
CH
4N
2OC
O2e
Land
Use
tons
MT
/yr
Hot
el54
.75
11.1
138
0.65
680.
0000
27.5
339
To
tal
11.1
138
0.65
680.
0000
27.5
339
Mit
igat
ed
9.0
Op
erat
ion
al O
ffro
ad
Equ
ipm
ent T
ype
Num
ber
Hou
rs/D
ayD
ays/
Yea
rH
orse
Pow
erLo
ad F
acto
rF
uel T
ype
10.0
Sta
tio
nar
y E
qu
ipm
ent
Fir
e P
um
ps
and
Em
erg
ency
Gen
erat
ors
Equ
ipm
ent T
ype
Num
ber
Hou
rs/D
ayH
ours
/Yea
rH
orse
Pow
erLo
ad F
acto
rF
uel T
ype
Bo
ilers
Equ
ipm
ent T
ype
Num
ber
Hea
t Inp
ut/D
ayH
eat I
nput
/Yea
rB
oile
r R
atin
gF
uel T
ype
Use
r D
efin
ed E
qu
ipm
ent
Equ
ipm
ent T
ype
Num
ber
Cal
EE
Mod
Ver
sion
: Cal
EE
Mod
.201
6.3.
1D
ate:
1/1
2/20
17 8
:53
AM
Pag
e 30
of 3
1
TR
ED
C H
otel
Pro
ject
- H
umbo
ldt C
ount
y, A
nnua
l

Cal
EE
Mod
Ver
sion
: Cal
EE
Mod
.201
6.3.
1D
ate:
1/1
2/20
17 8
:53
AM
Pag
e 31
of 3
1
TR
ED
C H
otel
Pro
ject
- H
umbo
ldt C
ount
y, A
nnua
l

Pro
ject
Cha
ract
eris
tics
-
Land
Use
- R
efer
to P
roje
ct D
escr
iptio
n
Con
stru
ctio
n P
hase
-
Veh
icle
Trip
s -
Ref
er to
Cal
EE
Mod
inpu
t tab
le
Dem
oliti
on -
Con
stru
ctio
n O
ff-ro
ad E
quip
men
t Miti
gatio
n -
Ref
er to
Cal
EE
Mod
tabl
es
Wat
er M
itiga
tion
-
1.1
Lan
d U
sag
e
Land
Use
sS
ize
Met
ricLo
t Acr
eage
Flo
or S
urfa
ce A
rea
Pop
ulat
ion
Hot
el10
0.00
Roo
m0.
4017
,424
.00
0
1.2
Oth
er P
roje
ct C
har
acte
rist
ics
Urb
aniz
atio
n
Clim
ate
Zo
ne
Rur
al
1
Win
d S
pee
d (
m/s
)P
reci
pit
atio
n F
req
(D
ays)
2.2
103
1.3
Use
r E
nte
red
Co
mm
ents
& N
on
-Def
ault
Dat
a
1.0
Pro
ject
Ch
arac
teri
stic
s
Uti
lity
Co
mp
any
Pac
ific
Gas
& E
lect
ric C
ompa
ny
2018
Op
erat
ion
al Y
ear
CO
2 In
ten
sity
(l
b/M
Wh
r)64
1.35
0.02
9C
H4
Inte
nsi
ty
(lb
/MW
hr)
0.00
6N
2O In
ten
sity
(l
b/M
Wh
r)
Tab
le N
ame
Col
umn
Nam
eD
efau
lt V
alue
New
Val
ue
tblC
onst
Dus
tMiti
gatio
nW
ater
Unp
aved
Roa
dVeh
icle
Spe
ed40
15
TR
ED
C H
ote
l Pro
ject
Hu
mb
old
t C
ou
nty
, Su
mm
er
Cal
EE
Mod
Ver
sion
: Cal
EE
Mod
.201
6.3.
1D
ate:
1/4
/201
7 8:
29 A
MP
age
1 of
25
TR
ED
C H
otel
Pro
ject
- H
umbo
ldt C
ount
y, S
umm
er

tblC
onst
Equ
ipM
itiga
tion
DP
FN
o C
hang
eLe
vel 3
tblC
onst
Equ
ipM
itiga
tion
DP
FN
o C
hang
eLe
vel 3
tblC
onst
Equ
ipM
itiga
tion
DP
FN
o C
hang
eLe
vel 3
tblC
onst
Equ
ipM
itiga
tion
DP
FN
o C
hang
eLe
vel 3
tblC
onst
Equ
ipM
itiga
tion
DP
FN
o C
hang
eLe
vel 3
tblC
onst
Equ
ipM
itiga
tion
DP
FN
o C
hang
eLe
vel 3
tblC
onst
Equ
ipM
itiga
tion
DP
FN
o C
hang
eLe
vel 3
tblC
onst
Equ
ipM
itiga
tion
DP
FN
o C
hang
eLe
vel 3
tblC
onst
Equ
ipM
itiga
tion
DP
FN
o C
hang
eLe
vel 3
tblC
onst
Equ
ipM
itiga
tion
DP
FN
o C
hang
eLe
vel 3
tblC
onst
Equ
ipM
itiga
tion
Num
berO
fEqu
ipm
entM
itiga
ted
0.00
1.00
tblC
onst
Equ
ipM
itiga
tion
Num
berO
fEqu
ipm
entM
itiga
ted
0.00
4.00
tblC
onst
Equ
ipM
itiga
tion
Num
berO
fEqu
ipm
entM
itiga
ted
0.00
2.00
tblC
onst
Equ
ipM
itiga
tion
Num
berO
fEqu
ipm
entM
itiga
ted
0.00
1.00
tblC
onst
Equ
ipM
itiga
tion
Num
berO
fEqu
ipm
entM
itiga
ted
0.00
2.00
tblC
onst
Equ
ipM
itiga
tion
Num
berO
fEqu
ipm
entM
itiga
ted
0.00
1.00
tblC
onst
Equ
ipM
itiga
tion
Num
berO
fEqu
ipm
entM
itiga
ted
0.00
1.00
tblC
onst
Equ
ipM
itiga
tion
Num
berO
fEqu
ipm
entM
itiga
ted
0.00
1.00
tblC
onst
Equ
ipM
itiga
tion
Num
berO
fEqu
ipm
entM
itiga
ted
0.00
2.00
tblC
onst
Equ
ipM
itiga
tion
Num
berO
fEqu
ipm
entM
itiga
ted
0.00
8.00
tblC
onst
Equ
ipM
itiga
tion
Tie
rN
o C
hang
eT
ier
3
tblC
onst
Equ
ipM
itiga
tion
Tie
rN
o C
hang
eT
ier
3
tblC
onst
Equ
ipM
itiga
tion
Tie
rN
o C
hang
eT
ier
3
tblC
onst
Equ
ipM
itiga
tion
Tie
rN
o C
hang
eT
ier
3
tblC
onst
Equ
ipM
itiga
tion
Tie
rN
o C
hang
eT
ier
3
tblC
onst
Equ
ipM
itiga
tion
Tie
rN
o C
hang
eT
ier
3
tblC
onst
Equ
ipM
itiga
tion
Tie
rN
o C
hang
eT
ier
3
Cal
EE
Mod
Ver
sion
: Cal
EE
Mod
.201
6.3.
1D
ate:
1/4
/201
7 8:
29 A
MP
age
2 of
25
TR
ED
C H
otel
Pro
ject
- H
umbo
ldt C
ount
y, S
umm
er

2.0
Em
issi
on
s S
um
mar
y
tblC
onst
Equ
ipM
itiga
tion
Tie
rN
o C
hang
eT
ier
3
tblC
onst
Equ
ipM
itiga
tion
Tie
rN
o C
hang
eT
ier
3
tblC
onst
Equ
ipM
itiga
tion
Tie
rN
o C
hang
eT
ier
3
tblL
andU
seB
uild
ingS
pace
Squ
areF
eet
145,
200.
0017
,424
.00
tblL
andU
seLa
ndU
seS
quar
eFee
t14
5,20
0.00
17,4
24.0
0
tblL
andU
seLo
tAcr
eage
3.33
0.40
tblP
roje
ctC
hara
cter
istic
sU
rban
izat
ionL
evel
Urb
anR
ural
tblV
ehic
leT
rips
CC
_TL
6.60
24.0
0
tblV
ehic
leT
rips
CN
W_T
L6.
6024
.00
tblV
ehic
leT
rips
CW
_TL
14.7
024
.00
tblV
ehic
leT
rips
ST
_TR
8.19
5.73
tblV
ehic
leT
rips
SU
_TR
5.95
4.17
tblV
ehic
leT
rips
WD
_TR
8.17
5.72
Cal
EE
Mod
Ver
sion
: Cal
EE
Mod
.201
6.3.
1D
ate:
1/4
/201
7 8:
29 A
MP
age
3 of
25
TR
ED
C H
otel
Pro
ject
- H
umbo
ldt C
ount
y, S
umm
er

2.1
Ove
rall
Co
nst
ruct
ion
(M
axim
um
Dai
ly E
mis
sio
n)
RO
GN
Ox
CO
SO
2F
ugiti
veP
M10
Exh
aust
PM
10P
M10
Tot
alF
ugiti
veP
M2.
5E
xhau
stP
M2.
5P
M2.
5T
otal
Bio
- C
O2
NB
io-
CO
2T
otal
CO
2C
H4
N2O
CO
2e
Yea
rlb
/day
lb/d
ay
2017
81.1
053
24.6
354
11.8
194
0.04
168.
1808
0.88
159.
0623
1.32
620.
8410
2.16
710.
0000
4,27
3.62
05
4,27
3.62
05
0.37
020.
0000
4,28
2.29
77
Max
imu
m81
.105
324
.635
411
.819
40.
0416
8.18
080.
8815
9.06
231.
3262
0.84
102.
1671
0.00
004,
273.
620
54,
273.
620
50.
3702
0.00
004,
282.
297
7
Un
mit
igat
ed C
on
stru
ctio
n
RO
GN
Ox
CO
SO
2F
ugiti
veP
M10
Exh
aust
PM
10P
M10
Tot
alF
ugiti
veP
M2.
5E
xhau
stP
M2.
5P
M2.
5T
otal
Bio
- C
O2
NB
io-
CO
2T
otal
CO
2C
H4
N2O
CO
2e
Yea
rlb
/day
lb/d
ay
2017
80.8
324
20.1
020
11.8
392
0.04
164.
0803
0.21
004.
2903
0.70
530.
2035
0.90
880.
0000
4,27
3.62
05
4,27
3.62
05
0.37
020.
0000
4,28
2.29
77
Max
imu
m80
.832
420
.102
011
.839
20.
0416
4.08
030.
2100
4.29
030.
7053
0.20
350.
9088
0.00
004,
273.
620
54,
273.
620
50.
3702
0.00
004,
282.
297
7
Mit
igat
ed C
on
stru
ctio
n
RO
GN
Ox
CO
SO
2F
ug
itiv
eP
M10
Exh
aust
PM
10P
M10
To
tal
Fu
git
ive
PM
2.5
Exh
aust
PM
2.5
PM
2.5
To
tal
Bio
- C
O2
NB
io-C
O2
To
tal C
O2
CH
4N
20C
O2e
Per
cen
tR
edu
ctio
n0.
3418
.40
-0.1
70.
0050
.12
76.1
852
.66
46.8
275
.81
58.0
60.
000.
000.
000.
000.
000.
00
Cal
EE
Mod
Ver
sion
: Cal
EE
Mod
.201
6.3.
1D
ate:
1/4
/201
7 8:
29 A
MP
age
4 of
25
TR
ED
C H
otel
Pro
ject
- H
umbo
ldt C
ount
y, S
umm
er

2.2
Ove
rall
Op
erat
ion
al
RO
GN
Ox
CO
SO
2F
ugiti
veP
M10
Exh
aust
PM
10P
M10
Tot
alF
ugiti
veP
M2.
5E
xhau
stP
M2.
5P
M2.
5T
otal
Bio
- C
O2
NB
io-
CO
2T
otal
CO
2C
H4
N2O
CO
2e
Cat
egor
ylb
/day
lb/d
ay
Are
a0.
4845
1.00
00e-
004
0.01
040.
0000
4.00
00e-
005
4.00
00e-
005
4.00
00e-
005
4.00
00e-
005
0.02
190.
0219
6.00
00e-
005
0.02
34
Ene
rgy
0.01
070.
0977
0.08
215.
9000
e-00
47.
4200
e-00
37.
4200
e-00
37.
4200
e-00
37.
4200
e-00
311
7.20
8311
7.20
832.
2500
e-00
32.
1500
e-00
311
7.90
49
Mob
ile3.
3509
21.7
434
48.6
571
0.09
757.
2338
0.21
447.
4481
1.94
200.
2034
2.14
549,
813.
877
29,
813.
877
20.
6002
9,82
8.88
10
To
tal
3.84
6221
.841
148
.749
50.
0981
7.23
380.
2218
7.45
561.
9420
0.21
092.
1528
9,93
1.10
74
9,93
1.10
74
0.60
252.
1500
e-00
39,
946.
809
2
Un
mit
igat
ed O
per
atio
nal
RO
GN
Ox
CO
SO
2F
ugiti
veP
M10
Exh
aust
PM
10P
M10
Tot
alF
ugiti
veP
M2.
5E
xhau
stP
M2.
5P
M2.
5T
otal
Bio
- C
O2
NB
io-
CO
2T
otal
CO
2C
H4
N2O
CO
2e
Cat
egor
ylb
/day
lb/d
ay
Are
a0.
4845
1.00
00e-
004
0.01
040.
0000
4.00
00e-
005
4.00
00e-
005
4.00
00e-
005
4.00
00e-
005
0.02
190.
0219
6.00
00e-
005
0.02
34
Ene
rgy
0.01
070.
0977
0.08
215.
9000
e-00
47.
4200
e-00
37.
4200
e-00
37.
4200
e-00
37.
4200
e-00
311
7.20
8311
7.20
832.
2500
e-00
32.
1500
e-00
311
7.90
49
Mob
ile3.
3509
21.7
434
48.6
571
0.09
757.
2338
0.21
447.
4481
1.94
200.
2034
2.14
549,
813.
877
29,
813.
877
20.
6002
9,82
8.88
10
To
tal
3.84
6221
.841
148
.749
50.
0981
7.23
380.
2218
7.45
561.
9420
0.21
092.
1528
9,93
1.10
74
9,93
1.10
74
0.60
252.
1500
e-00
39,
946.
809
2
Mit
igat
ed O
per
atio
nal
Cal
EE
Mod
Ver
sion
: Cal
EE
Mod
.201
6.3.
1D
ate:
1/4
/201
7 8:
29 A
MP
age
5 of
25
TR
ED
C H
otel
Pro
ject
- H
umbo
ldt C
ount
y, S
umm
er
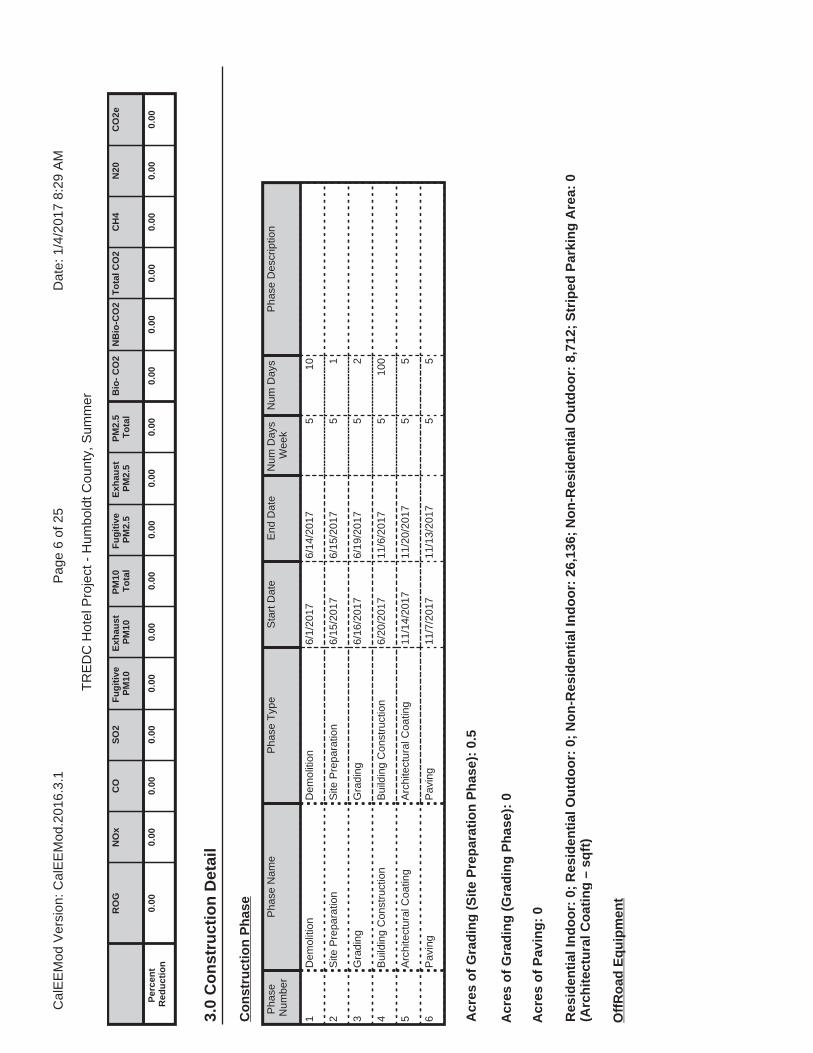
3.0
Co
nst
ruct
ion
Det
ail
Co
nst
ruct
ion
Ph
ase
Pha
seN
umbe
rP
hase
Nam
eP
hase
Typ
eS
tart
Dat
eE
nd D
ate
Num
Day
s W
eek
Num
Day
sP
hase
Des
crip
tion
1D
emol
ition
Dem
oliti
on6/
1/20
176/
14/2
017
510
2S
ite P
repa
ratio
nS
ite P
repa
ratio
n6/
15/2
017
6/15
/201
75
1
3G
radi
ngG
radi
ng6/
16/2
017
6/19
/201
75
2
4B
uild
ing
Con
stru
ctio
nB
uild
ing
Con
stru
ctio
n6/
20/2
017
11/6
/201
75
100
5A
rchi
tect
ural
Coa
ting
Arc
hite
ctur
al C
oatin
g11
/14/
2017
11/2
0/20
175
5
6P
avin
gP
avin
g11
/7/2
017
11/1
3/20
175
5
Off
Ro
ad E
qu
ipm
ent
RO
GN
Ox
CO
SO
2F
ug
itiv
eP
M10
Exh
aust
PM
10P
M10
To
tal
Fu
git
ive
PM
2.5
Exh
aust
PM
2.5
PM
2.5
To
tal
Bio
- C
O2
NB
io-C
O2
To
tal C
O2
CH
4N
20C
O2e
Per
cen
tR
edu
ctio
n0.
000.
000.
000.
000.
000.
000.
000.
000.
000.
000.
000.
000.
000.
000.
000.
00
Res
iden
tial
Ind
oo
r: 0
; R
esid
enti
al O
utd
oo
r: 0
; N
on
-Res
iden
tial
Ind
oo
r: 2
6,13
6; N
on
-Res
iden
tial
Ou
tdo
or:
8,7
12;
Str
iped
Par
kin
g A
rea:
0
(Arc
hit
ectu
ral C
oat
ing
– s
qft
)
Acr
es o
f G
rad
ing
(S
ite
Pre
par
atio
n P
has
e):
0.5
Acr
es o
f G
rad
ing
(G
rad
ing
Ph
ase)
: 0
Acr
es o
f P
avin
g:
0
Cal
EE
Mod
Ver
sion
: Cal
EE
Mod
.201
6.3.
1D
ate:
1/4
/201
7 8:
29 A
MP
age
6 of
25
TR
ED
C H
otel
Pro
ject
- H
umbo
ldt C
ount
y, S
umm
er

Pha
se N
ame
Offr
oad
Equ
ipm
ent T
ype
Am
ount
Usa
ge H
ours
Hor
se P
ower
Load
Fac
tor
Dem
oliti
onC
oncr
ete/
Indu
stria
l Saw
s1
8.00
810.
73
Dem
oliti
onR
ubbe
r T
ired
Doz
ers
11.
0024
70.
40
Dem
oliti
onT
ract
ors/
Load
ers/
Bac
khoe
s2
6.00
970.
37
Site
Pre
para
tion
Gra
ders
18.
0018
70.
41
Site
Pre
para
tion
Tra
ctor
s/Lo
ader
s/B
ackh
oes
18.
0097
0.37
Gra
ding
Con
cret
e/In
dust
rial S
aws
18.
0081
0.73
Gra
ding
Rub
ber
Tire
d D
ozer
s1
1.00
247
0.40
Gra
ding
Tra
ctor
s/Lo
ader
s/B
ackh
oes
26.
0097
0.37
Bui
ldin
g C
onst
ruct
ion
Cra
nes
14.
0023
10.
29
Bui
ldin
g C
onst
ruct
ion
For
klift
s2
6.00
890.
20
Bui
ldin
g C
onst
ruct
ion
Tra
ctor
s/Lo
ader
s/B
ackh
oes
28.
0097
0.37
Pav
ing
Cem
ent a
nd M
orta
r M
ixer
s4
6.00
90.
56
Pav
ing
Pav
ers
17.
0013
00.
42
Pav
ing
Rol
lers
17.
0080
0.38
Pav
ing
Tra
ctor
s/Lo
ader
s/B
ackh
oes
17.
0097
0.37
Arc
hite
ctur
al C
oatin
gA
ir C
ompr
esso
rs1
6.00
780.
48
Tri
ps
and
VM
T
Pha
se N
ame
Offr
oad
Equ
ipm
ent
Cou
ntW
orke
r T
rip
Num
ber
Ven
dor
Trip
N
umbe
rH
aulin
g T
rip
Num
ber
Wor
ker
Trip
Le
ngth
Ven
dor
Trip
Le
ngth
Hau
ling
Trip
Le
ngth
Wor
ker
Veh
icle
C
lass
Ven
dor
Veh
icle
Cla
ssH
aulin
gV
ehic
le C
lass
Dem
oliti
on4
10.0
00.
0034
4.00
16.8
06.
6020
.00
LD_M
ixH
DT
_Mix
HH
DT
Site
Pre
para
tion
25.
000.
000.
0016
.80
6.60
20.0
0LD
_Mix
HD
T_M
ixH
HD
T
Gra
ding
410
.00
0.00
0.00
16.8
06.
6020
.00
LD_M
ixH
DT
_Mix
HH
DT
Bui
ldin
g C
onst
ruct
ion
57.
003.
000.
0016
.80
6.60
20.0
0LD
_Mix
HD
T_M
ixH
HD
T
Pav
ing
718
.00
0.00
0.00
16.8
06.
6020
.00
LD_M
ixH
DT
_Mix
HH
DT
Arc
hite
ctur
al C
oatin
g1
1.00
0.00
0.00
16.8
06.
6020
.00
LD_M
ixH
DT
_Mix
HH
DT
Cal
EE
Mod
Ver
sion
: Cal
EE
Mod
.201
6.3.
1D
ate:
1/4
/201
7 8:
29 A
MP
age
7 of
25
TR
ED
C H
otel
Pro
ject
- H
umbo
ldt C
ount
y, S
umm
er

3.2
Dem
olit
ion
- 2
017
RO
GN
Ox
CO
SO
2F
ugiti
veP
M10
Exh
aust
PM
10P
M10
Tot
alF
ugiti
veP
M2.
5E
xhau
stP
M2.
5P
M2.
5T
otal
Bio
- C
O2
NB
io-
CO
2T
otal
CO
2C
H4
N2O
CO
2e
Cat
egor
ylb
/day
lb/d
ay
Fug
itive
Dus
t7.
4554
0.00
007.
4554
1.12
880.
0000
1.12
880.
0000
0.00
00
Off-
Roa
d1.
2100
10.4
978
7.91
820.
0120
0.73
180.
7318
0.69
780.
6978
1,17
9.30
75
1,17
9.30
75
0.23
191,
185.
104
7
To
tal
1.21
0010
.497
87.
9182
0.01
207.
4554
0.73
188.
1872
1.12
880.
6978
1.82
661,
179.
307
51,
179.
307
50.
2319
1,18
5.10
47
Un
mit
igat
ed C
on
stru
ctio
n O
n-S
ite
3.1
Mit
igat
ion
Mea
sure
s C
on
stru
ctio
n
Use
Cle
aner
Eng
ines
for
Con
stru
ctio
n E
quip
men
t
Use
DP
F fo
r C
onst
ruct
ion
Equ
ipm
ent
Use
Soi
l Sta
biliz
er
Wat
er E
xpos
ed A
rea
Red
uce
Veh
icle
Spe
ed o
n U
npav
ed R
oads
Cle
an P
aved
Roa
ds
Cal
EE
Mod
Ver
sion
: Cal
EE
Mod
.201
6.3.
1D
ate:
1/4
/201
7 8:
29 A
MP
age
8 of
25
TR
ED
C H
otel
Pro
ject
- H
umbo
ldt C
ount
y, S
umm
er

3.2
Dem
olit
ion
- 2
017
RO
GN
Ox
CO
SO
2F
ugiti
veP
M10
Exh
aust
PM
10P
M10
Tot
alF
ugiti
veP
M2.
5E
xhau
stP
M2.
5P
M2.
5T
otal
Bio
- C
O2
NB
io-
CO
2T
otal
CO
2C
H4
N2O
CO
2e
Cat
egor
ylb
/day
lb/d
ay
Hau
ling
0.53
5014
.002
22.
7854
0.02
830.
5977
0.14
830.
7460
0.16
350.
1419
0.30
542,
964.
485
32,
964.
485
30.
1039
2,96
7.08
35
Ven
dor
0.00
000.
0000
0.00
000.
0000
0.00
000.
0000
0.00
000.
0000
0.00
000.
0000
0.00
000.
0000
0.00
000.
0000
Wor
ker
0.12
730.
1354
1.11
581.
3100
e-00
30.
1277
1.40
00e-
003
0.12
910.
0339
1.30
00e-
003
0.03
5212
9.82
7712
9.82
770.
0113
130.
1095
To
tal
0.66
2314
.137
63.
9011
0.02
960.
7254
0.14
970.
8751
0.19
740.
1432
0.34
063,
094.
313
03,
094.
313
00.
1152
3,09
7.19
29
Un
mit
igat
ed C
on
stru
ctio
n O
ff-S
ite
RO
GN
Ox
CO
SO
2F
ugiti
veP
M10
Exh
aust
PM
10P
M10
Tot
alF
ugiti
veP
M2.
5E
xhau
stP
M2.
5P
M2.
5T
otal
Bio
- C
O2
NB
io-
CO
2T
otal
CO
2C
H4
N2O
CO
2e
Cat
egor
ylb
/day
lb/d
ay
Fug
itive
Dus
t3.
3549
0.00
003.
3549
0.50
800.
0000
0.50
800.
0000
0.00
00
Off-
Roa
d0.
2652
5.96
447.
9381
0.01
200.
0603
0.06
030.
0603
0.06
030.
0000
1,17
9.30
75
1,17
9.30
75
0.23
191,
185.
104
7
To
tal
0.26
525.
9644
7.93
810.
0120
3.35
490.
0603
3.41
520.
5080
0.06
030.
5682
0.00
001,
179.
307
51,
179.
307
50.
2319
1,18
5.10
47
Mit
igat
ed C
on
stru
ctio
n O
n-S
ite
Cal
EE
Mod
Ver
sion
: Cal
EE
Mod
.201
6.3.
1D
ate:
1/4
/201
7 8:
29 A
MP
age
9 of
25
TR
ED
C H
otel
Pro
ject
- H
umbo
ldt C
ount
y, S
umm
er

3.2
Dem
olit
ion
- 2
017
RO
GN
Ox
CO
SO
2F
ugiti
veP
M10
Exh
aust
PM
10P
M10
Tot
alF
ugiti
veP
M2.
5E
xhau
stP
M2.
5P
M2.
5T
otal
Bio
- C
O2
NB
io-
CO
2T
otal
CO
2C
H4
N2O
CO
2e
Cat
egor
ylb
/day
lb/d
ay
Hau
ling
0.53
5014
.002
22.
7854
0.02
830.
5977
0.14
830.
7460
0.16
350.
1419
0.30
542,
964.
485
32,
964.
485
30.
1039
2,96
7.08
35
Ven
dor
0.00
000.
0000
0.00
000.
0000
0.00
000.
0000
0.00
000.
0000
0.00
000.
0000
0.00
000.
0000
0.00
000.
0000
Wor
ker
0.12
730.
1354
1.11
581.
3100
e-00
30.
1277
1.40
00e-
003
0.12
910.
0339
1.30
00e-
003
0.03
5212
9.82
7712
9.82
770.
0113
130.
1095
To
tal
0.66
2314
.137
63.
9011
0.02
960.
7254
0.14
970.
8751
0.19
740.
1432
0.34
063,
094.
313
03,
094.
313
00.
1152
3,09
7.19
29
Mit
igat
ed C
on
stru
ctio
n O
ff-S
ite
3.3
Sit
e P
rep
arat
ion
- 2
017
RO
GN
Ox
CO
SO
2F
ugiti
veP
M10
Exh
aust
PM
10P
M10
Tot
alF
ugiti
veP
M2.
5E
xhau
stP
M2.
5P
M2.
5T
otal
Bio
- C
O2
NB
io-
CO
2T
otal
CO
2C
H4
N2O
CO
2e
Cat
egor
ylb
/day
lb/d
ay
Fug
itive
Dus
t0.
5303
0.00
000.
5303
0.05
730.
0000
0.05
730.
0000
0.00
00
Off-
Roa
d0.
8524
10.5
148
4.35
339.
7700
e-00
30.
4726
0.47
260.
4347
0.43
4799
9.52
0199
9.52
010.
3063
1,00
7.17
64
To
tal
0.85
2410
.514
84.
3533
9.77
00e-
003
0.53
030.
4726
1.00
280.
0573
0.43
470.
4920
999.
5201
999.
5201
0.30
631,
007.
176
4
Un
mit
igat
ed C
on
stru
ctio
n O
n-S
ite
Cal
EE
Mod
Ver
sion
: Cal
EE
Mod
.201
6.3.
1D
ate:
1/4
/201
7 8:
29 A
MP
age
10 o
f 25
TR
ED
C H
otel
Pro
ject
- H
umbo
ldt C
ount
y, S
umm
er

3.3
Sit
e P
rep
arat
ion
- 2
017
RO
GN
Ox
CO
SO
2F
ugiti
veP
M10
Exh
aust
PM
10P
M10
Tot
alF
ugiti
veP
M2.
5E
xhau
stP
M2.
5P
M2.
5T
otal
Bio
- C
O2
NB
io-
CO
2T
otal
CO
2C
H4
N2O
CO
2e
Cat
egor
ylb
/day
lb/d
ay
Hau
ling
0.00
000.
0000
0.00
000.
0000
0.00
000.
0000
0.00
000.
0000
0.00
000.
0000
0.00
000.
0000
0.00
000.
0000
Ven
dor
0.00
000.
0000
0.00
000.
0000
0.00
000.
0000
0.00
000.
0000
0.00
000.
0000
0.00
000.
0000
0.00
000.
0000
Wor
ker
0.06
370.
0677
0.55
796.
6000
e-00
40.
0639
7.00
00e-
004
0.06
460.
0169
6.50
00e-
004
0.01
7664
.913
964
.913
95.
6400
e-00
365
.054
7
To
tal
0.06
370.
0677
0.55
796.
6000
e-00
40.
0639
7.00
00e-
004
0.06
460.
0169
6.50
00e-
004
0.01
7664
.913
964
.913
95.
6400
e-00
365
.054
7
Un
mit
igat
ed C
on
stru
ctio
n O
ff-S
ite
RO
GN
Ox
CO
SO
2F
ugiti
veP
M10
Exh
aust
PM
10P
M10
Tot
alF
ugiti
veP
M2.
5E
xhau
stP
M2.
5P
M2.
5T
otal
Bio
- C
O2
NB
io-
CO
2T
otal
CO
2C
H4
N2O
CO
2e
Cat
egor
ylb
/day
lb/d
ay
Fug
itive
Dus
t0.
2386
0.00
000.
2386
0.02
580.
0000
0.02
580.
0000
0.00
00
Off-
Roa
d0.
2382
4.87
165.
8579
9.77
00e-
003
0.03
610.
0361
0.03
610.
0361
0.00
0099
9.52
0199
9.52
010.
3063
1,00
7.17
64
To
tal
0.23
824.
8716
5.85
799.
7700
e-00
30.
2386
0.03
610.
2747
0.02
580.
0361
0.06
180.
0000
999.
5201
999.
5201
0.30
631,
007.
176
4
Mit
igat
ed C
on
stru
ctio
n O
n-S
ite
Cal
EE
Mod
Ver
sion
: Cal
EE
Mod
.201
6.3.
1D
ate:
1/4
/201
7 8:
29 A
MP
age
11 o
f 25
TR
ED
C H
otel
Pro
ject
- H
umbo
ldt C
ount
y, S
umm
er

3.3
Sit
e P
rep
arat
ion
- 2
017
RO
GN
Ox
CO
SO
2F
ugiti
veP
M10
Exh
aust
PM
10P
M10
Tot
alF
ugiti
veP
M2.
5E
xhau
stP
M2.
5P
M2.
5T
otal
Bio
- C
O2
NB
io-
CO
2T
otal
CO
2C
H4
N2O
CO
2e
Cat
egor
ylb
/day
lb/d
ay
Hau
ling
0.00
000.
0000
0.00
000.
0000
0.00
000.
0000
0.00
000.
0000
0.00
000.
0000
0.00
000.
0000
0.00
000.
0000
Ven
dor
0.00
000.
0000
0.00
000.
0000
0.00
000.
0000
0.00
000.
0000
0.00
000.
0000
0.00
000.
0000
0.00
000.
0000
Wor
ker
0.06
370.
0677
0.55
796.
6000
e-00
40.
0639
7.00
00e-
004
0.06
460.
0169
6.50
00e-
004
0.01
7664
.913
964
.913
95.
6400
e-00
365
.054
7
To
tal
0.06
370.
0677
0.55
796.
6000
e-00
40.
0639
7.00
00e-
004
0.06
460.
0169
6.50
00e-
004
0.01
7664
.913
964
.913
95.
6400
e-00
365
.054
7
Mit
igat
ed C
on
stru
ctio
n O
ff-S
ite
3.4
Gra
din
g -
201
7
RO
GN
Ox
CO
SO
2F
ugiti
veP
M10
Exh
aust
PM
10P
M10
Tot
alF
ugiti
veP
M2.
5E
xhau
stP
M2.
5P
M2.
5T
otal
Bio
- C
O2
NB
io-
CO
2T
otal
CO
2C
H4
N2O
CO
2e
Cat
egor
ylb
/day
lb/d
ay
Fug
itive
Dus
t0.
7528
0.00
000.
7528
0.41
380.
0000
0.41
380.
0000
0.00
00
Off-
Roa
d1.
2100
10.4
978
7.91
820.
0120
0.73
180.
7318
0.69
780.
6978
1,17
9.30
75
1,17
9.30
75
0.23
191,
185.
104
7
To
tal
1.21
0010
.497
87.
9182
0.01
200.
7528
0.73
181.
4845
0.41
380.
6978
1.11
151,
179.
307
51,
179.
307
50.
2319
1,18
5.10
47
Un
mit
igat
ed C
on
stru
ctio
n O
n-S
ite
Cal
EE
Mod
Ver
sion
: Cal
EE
Mod
.201
6.3.
1D
ate:
1/4
/201
7 8:
29 A
MP
age
12 o
f 25
TR
ED
C H
otel
Pro
ject
- H
umbo
ldt C
ount
y, S
umm
er

3.4
Gra
din
g -
201
7
RO
GN
Ox
CO
SO
2F
ugiti
veP
M10
Exh
aust
PM
10P
M10
Tot
alF
ugiti
veP
M2.
5E
xhau
stP
M2.
5P
M2.
5T
otal
Bio
- C
O2
NB
io-
CO
2T
otal
CO
2C
H4
N2O
CO
2e
Cat
egor
ylb
/day
lb/d
ay
Hau
ling
0.00
000.
0000
0.00
000.
0000
0.00
000.
0000
0.00
000.
0000
0.00
000.
0000
0.00
000.
0000
0.00
000.
0000
Ven
dor
0.00
000.
0000
0.00
000.
0000
0.00
000.
0000
0.00
000.
0000
0.00
000.
0000
0.00
000.
0000
0.00
000.
0000
Wor
ker
0.12
730.
1354
1.11
581.
3100
e-00
30.
1277
1.40
00e-
003
0.12
910.
0339
1.30
00e-
003
0.03
5212
9.82
7712
9.82
770.
0113
130.
1095
To
tal
0.12
730.
1354
1.11
581.
3100
e-00
30.
1277
1.40
00e-
003
0.12
910.
0339
1.30
00e-
003
0.03
5212
9.82
7712
9.82
770.
0113
130.
1095
Un
mit
igat
ed C
on
stru
ctio
n O
ff-S
ite
RO
GN
Ox
CO
SO
2F
ugiti
veP
M10
Exh
aust
PM
10P
M10
Tot
alF
ugiti
veP
M2.
5E
xhau
stP
M2.
5P
M2.
5T
otal
Bio
- C
O2
NB
io-
CO
2T
otal
CO
2C
H4
N2O
CO
2e
Cat
egor
ylb
/day
lb/d
ay
Fug
itive
Dus
t0.
3387
0.00
000.
3387
0.18
620.
0000
0.18
620.
0000
0.00
00
Off-
Roa
d0.
2652
5.96
447.
9381
0.01
200.
0603
0.06
030.
0603
0.06
030.
0000
1,17
9.30
75
1,17
9.30
75
0.23
191,
185.
104
7
To
tal
0.26
525.
9644
7.93
810.
0120
0.33
870.
0603
0.39
900.
1862
0.06
030.
2465
0.00
001,
179.
307
51,
179.
307
50.
2319
1,18
5.10
47
Mit
igat
ed C
on
stru
ctio
n O
n-S
ite
Cal
EE
Mod
Ver
sion
: Cal
EE
Mod
.201
6.3.
1D
ate:
1/4
/201
7 8:
29 A
MP
age
13 o
f 25
TR
ED
C H
otel
Pro
ject
- H
umbo
ldt C
ount
y, S
umm
er

3.4
Gra
din
g -
201
7
RO
GN
Ox
CO
SO
2F
ugiti
veP
M10
Exh
aust
PM
10P
M10
Tot
alF
ugiti
veP
M2.
5E
xhau
stP
M2.
5P
M2.
5T
otal
Bio
- C
O2
NB
io-
CO
2T
otal
CO
2C
H4
N2O
CO
2e
Cat
egor
ylb
/day
lb/d
ay
Hau
ling
0.00
000.
0000
0.00
000.
0000
0.00
000.
0000
0.00
000.
0000
0.00
000.
0000
0.00
000.
0000
0.00
000.
0000
Ven
dor
0.00
000.
0000
0.00
000.
0000
0.00
000.
0000
0.00
000.
0000
0.00
000.
0000
0.00
000.
0000
0.00
000.
0000
Wor
ker
0.12
730.
1354
1.11
581.
3100
e-00
30.
1277
1.40
00e-
003
0.12
910.
0339
1.30
00e-
003
0.03
5212
9.82
7712
9.82
770.
0113
130.
1095
To
tal
0.12
730.
1354
1.11
581.
3100
e-00
30.
1277
1.40
00e-
003
0.12
910.
0339
1.30
00e-
003
0.03
5212
9.82
7712
9.82
770.
0113
130.
1095
Mit
igat
ed C
on
stru
ctio
n O
ff-S
ite
3.5
Bu
ildin
g C
on
stru
ctio
n -
201
7
RO
GN
Ox
CO
SO
2F
ugiti
veP
M10
Exh
aust
PM
10P
M10
Tot
alF
ugiti
veP
M2.
5E
xhau
stP
M2.
5P
M2.
5T
otal
Bio
- C
O2
NB
io-
CO
2T
otal
CO
2C
H4
N2O
CO
2e
Cat
egor
ylb
/day
lb/d
ay
Off-
Roa
d1.
2812
12.7
589
8.07
000.
0114
0.85
910.
8591
0.79
040.
7904
1,16
5.91
64
1,16
5.91
64
0.35
721,
174.
847
3
To
tal
1.28
1212
.758
98.
0700
0.01
140.
8591
0.85
910.
7904
0.79
041,
165.
916
41,
165.
916
40.
3572
1,17
4.84
73
Un
mit
igat
ed C
on
stru
ctio
n O
n-S
ite
Cal
EE
Mod
Ver
sion
: Cal
EE
Mod
.201
6.3.
1D
ate:
1/4
/201
7 8:
29 A
MP
age
14 o
f 25
TR
ED
C H
otel
Pro
ject
- H
umbo
ldt C
ount
y, S
umm
er
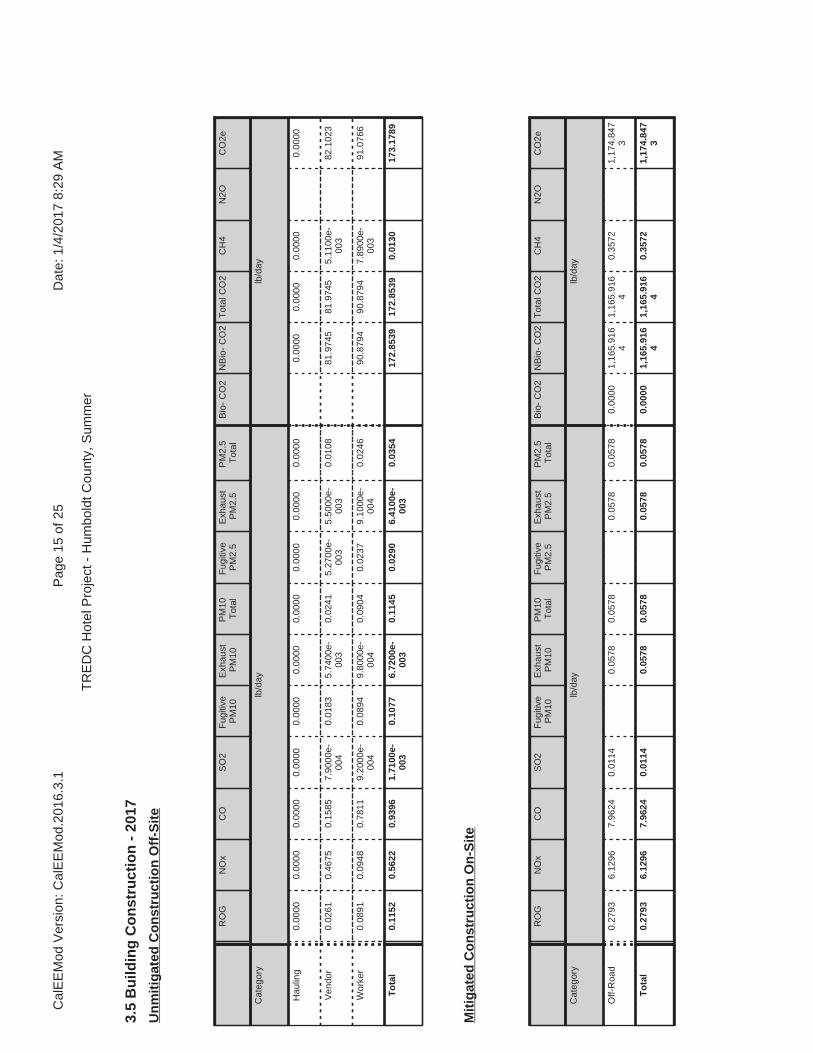
3.5
Bu
ildin
g C
on
stru
ctio
n -
201
7
RO
GN
Ox
CO
SO
2F
ugiti
veP
M10
Exh
aust
PM
10P
M10
Tot
alF
ugiti
veP
M2.
5E
xhau
stP
M2.
5P
M2.
5T
otal
Bio
- C
O2
NB
io-
CO
2T
otal
CO
2C
H4
N2O
CO
2e
Cat
egor
ylb
/day
lb/d
ay
Hau
ling
0.00
000.
0000
0.00
000.
0000
0.00
000.
0000
0.00
000.
0000
0.00
000.
0000
0.00
000.
0000
0.00
000.
0000
Ven
dor
0.02
610.
4675
0.15
857.
9000
e-00
40.
0183
5.74
00e-
003
0.02
415.
2700
e-00
35.
5000
e-00
30.
0108
81.9
745
81.9
745
5.11
00e-
003
82.1
023
Wor
ker
0.08
910.
0948
0.78
119.
2000
e-00
40.
0894
9.80
00e-
004
0.09
040.
0237
9.10
00e-
004
0.02
4690
.879
490
.879
47.
8900
e-00
391
.076
6
To
tal
0.11
520.
5622
0.93
961.
7100
e-00
30.
1077
6.72
00e-
003
0.11
450.
0290
6.41
00e-
003
0.03
5417
2.85
3917
2.85
390.
0130
173.
1789
Un
mit
igat
ed C
on
stru
ctio
n O
ff-S
ite
RO
GN
Ox
CO
SO
2F
ugiti
veP
M10
Exh
aust
PM
10P
M10
Tot
alF
ugiti
veP
M2.
5E
xhau
stP
M2.
5P
M2.
5T
otal
Bio
- C
O2
NB
io-
CO
2T
otal
CO
2C
H4
N2O
CO
2e
Cat
egor
ylb
/day
lb/d
ay
Off-
Roa
d0.
2793
6.12
967.
9624
0.01
140.
0578
0.05
780.
0578
0.05
780.
0000
1,16
5.91
64
1,16
5.91
64
0.35
721,
174.
847
3
To
tal
0.27
936.
1296
7.96
240.
0114
0.05
780.
0578
0.05
780.
0578
0.00
001,
165.
916
41,
165.
916
40.
3572
1,17
4.84
73
Mit
igat
ed C
on
stru
ctio
n O
n-S
ite
Cal
EE
Mod
Ver
sion
: Cal
EE
Mod
.201
6.3.
1D
ate:
1/4
/201
7 8:
29 A
MP
age
15 o
f 25
TR
ED
C H
otel
Pro
ject
- H
umbo
ldt C
ount
y, S
umm
er

3.5
Bu
ildin
g C
on
stru
ctio
n -
201
7
RO
GN
Ox
CO
SO
2F
ugiti
veP
M10
Exh
aust
PM
10P
M10
Tot
alF
ugiti
veP
M2.
5E
xhau
stP
M2.
5P
M2.
5T
otal
Bio
- C
O2
NB
io-
CO
2T
otal
CO
2C
H4
N2O
CO
2e
Cat
egor
ylb
/day
lb/d
ay
Hau
ling
0.00
000.
0000
0.00
000.
0000
0.00
000.
0000
0.00
000.
0000
0.00
000.
0000
0.00
000.
0000
0.00
000.
0000
Ven
dor
0.02
610.
4675
0.15
857.
9000
e-00
40.
0183
5.74
00e-
003
0.02
415.
2700
e-00
35.
5000
e-00
30.
0108
81.9
745
81.9
745
5.11
00e-
003
82.1
023
Wor
ker
0.08
910.
0948
0.78
119.
2000
e-00
40.
0894
9.80
00e-
004
0.09
040.
0237
9.10
00e-
004
0.02
4690
.879
490
.879
47.
8900
e-00
391
.076
6
To
tal
0.11
520.
5622
0.93
961.
7100
e-00
30.
1077
6.72
00e-
003
0.11
450.
0290
6.41
00e-
003
0.03
5417
2.85
3917
2.85
390.
0130
173.
1789
Mit
igat
ed C
on
stru
ctio
n O
ff-S
ite
3.6
Arc
hit
ectu
ral C
oat
ing
- 2
017
RO
GN
Ox
CO
SO
2F
ugiti
veP
M10
Exh
aust
PM
10P
M10
Tot
alF
ugiti
veP
M2.
5E
xhau
stP
M2.
5P
M2.
5T
otal
Bio
- C
O2
NB
io-
CO
2T
otal
CO
2C
H4
N2O
CO
2e
Cat
egor
ylb
/day
lb/d
ay
Arc
hit.
Coa
ting
80.7
602
0.00
000.
0000
0.00
000.
0000
0.00
000.
0000
Off-
Roa
d0.
3323
2.18
501.
8681
2.97
00e-
003
0.17
330.
1733
0.17
330.
1733
281.
4481
281.
4481
0.02
9728
2.19
09
To
tal
81.0
926
2.18
501.
8681
2.97
00e-
003
0.17
330.
1733
0.17
330.
1733
281.
4481
281.
4481
0.02
9728
2.19
09
Un
mit
igat
ed C
on
stru
ctio
n O
n-S
ite
Cal
EE
Mod
Ver
sion
: Cal
EE
Mod
.201
6.3.
1D
ate:
1/4
/201
7 8:
29 A
MP
age
16 o
f 25
TR
ED
C H
otel
Pro
ject
- H
umbo
ldt C
ount
y, S
umm
er

3.6
Arc
hit
ectu
ral C
oat
ing
- 2
017
RO
GN
Ox
CO
SO
2F
ugiti
veP
M10
Exh
aust
PM
10P
M10
Tot
alF
ugiti
veP
M2.
5E
xhau
stP
M2.
5P
M2.
5T
otal
Bio
- C
O2
NB
io-
CO
2T
otal
CO
2C
H4
N2O
CO
2e
Cat
egor
ylb
/day
lb/d
ay
Hau
ling
0.00
000.
0000
0.00
000.
0000
0.00
000.
0000
0.00
000.
0000
0.00
000.
0000
0.00
000.
0000
0.00
000.
0000
Ven
dor
0.00
000.
0000
0.00
000.
0000
0.00
000.
0000
0.00
000.
0000
0.00
000.
0000
0.00
000.
0000
0.00
000.
0000
Wor
ker
0.01
270.
0135
0.11
161.
3000
e-00
40.
0128
1.40
00e-
004
0.01
293.
3900
e-00
31.
3000
e-00
43.
5200
e-00
312
.982
812
.982
81.
1300
e-00
313
.011
0
To
tal
0.01
270.
0135
0.11
161.
3000
e-00
40.
0128
1.40
00e-
004
0.01
293.
3900
e-00
31.
3000
e-00
43.
5200
e-00
312
.982
812
.982
81.
1300
e-00
313
.011
0
Un
mit
igat
ed C
on
stru
ctio
n O
ff-S
ite
RO
GN
Ox
CO
SO
2F
ugiti
veP
M10
Exh
aust
PM
10P
M10
Tot
alF
ugiti
veP
M2.
5E
xhau
stP
M2.
5P
M2.
5T
otal
Bio
- C
O2
NB
io-
CO
2T
otal
CO
2C
H4
N2O
CO
2e
Cat
egor
ylb
/day
lb/d
ay
Arc
hit.
Coa
ting
80.7
602
0.00
000.
0000
0.00
000.
0000
0.00
000.
0000
Off-
Roa
d0.
0594
1.35
701.
8324
2.97
00e-
003
0.01
430.
0143
0.01
430.
0143
0.00
0028
1.44
8128
1.44
810.
0297
282.
1909
To
tal
80.8
197
1.35
701.
8324
2.97
00e-
003
0.01
430.
0143
0.01
430.
0143
0.00
0028
1.44
8128
1.44
810.
0297
282.
1909
Mit
igat
ed C
on
stru
ctio
n O
n-S
ite
Cal
EE
Mod
Ver
sion
: Cal
EE
Mod
.201
6.3.
1D
ate:
1/4
/201
7 8:
29 A
MP
age
17 o
f 25
TR
ED
C H
otel
Pro
ject
- H
umbo
ldt C
ount
y, S
umm
er

3.6
Arc
hit
ectu
ral C
oat
ing
- 2
017
RO
GN
Ox
CO
SO
2F
ugiti
veP
M10
Exh
aust
PM
10P
M10
Tot
alF
ugiti
veP
M2.
5E
xhau
stP
M2.
5P
M2.
5T
otal
Bio
- C
O2
NB
io-
CO
2T
otal
CO
2C
H4
N2O
CO
2e
Cat
egor
ylb
/day
lb/d
ay
Hau
ling
0.00
000.
0000
0.00
000.
0000
0.00
000.
0000
0.00
000.
0000
0.00
000.
0000
0.00
000.
0000
0.00
000.
0000
Ven
dor
0.00
000.
0000
0.00
000.
0000
0.00
000.
0000
0.00
000.
0000
0.00
000.
0000
0.00
000.
0000
0.00
000.
0000
Wor
ker
0.01
270.
0135
0.11
161.
3000
e-00
40.
0128
1.40
00e-
004
0.01
293.
3900
e-00
31.
3000
e-00
43.
5200
e-00
312
.982
812
.982
81.
1300
e-00
313
.011
0
To
tal
0.01
270.
0135
0.11
161.
3000
e-00
40.
0128
1.40
00e-
004
0.01
293.
3900
e-00
31.
3000
e-00
43.
5200
e-00
312
.982
812
.982
81.
1300
e-00
313
.011
0
Mit
igat
ed C
on
stru
ctio
n O
ff-S
ite
3.7
Pav
ing
- 2
017
RO
GN
Ox
CO
SO
2F
ugiti
veP
M10
Exh
aust
PM
10P
M10
Tot
alF
ugiti
veP
M2.
5E
xhau
stP
M2.
5P
M2.
5T
otal
Bio
- C
O2
NB
io-
CO
2T
otal
CO
2C
H4
N2O
CO
2e
Cat
egor
ylb
/day
lb/d
ay
Off-
Roa
d1.
0532
9.97
547.
3425
0.01
130.
6087
0.60
870.
5636
0.56
361,
085.
107
11,
085.
107
10.
3018
1,09
2.65
15
Pav
ing
0.00
000.
0000
0.00
000.
0000
0.00
000.
0000
0.00
00
To
tal
1.05
329.
9754
7.34
250.
0113
0.60
870.
6087
0.56
360.
5636
1,08
5.10
71
1,08
5.10
71
0.30
181,
092.
651
5
Un
mit
igat
ed C
on
stru
ctio
n O
n-S
ite
Cal
EE
Mod
Ver
sion
: Cal
EE
Mod
.201
6.3.
1D
ate:
1/4
/201
7 8:
29 A
MP
age
18 o
f 25
TR
ED
C H
otel
Pro
ject
- H
umbo
ldt C
ount
y, S
umm
er

3.7
Pav
ing
- 2
017
RO
GN
Ox
CO
SO
2F
ugiti
veP
M10
Exh
aust
PM
10P
M10
Tot
alF
ugiti
veP
M2.
5E
xhau
stP
M2.
5P
M2.
5T
otal
Bio
- C
O2
NB
io-
CO
2T
otal
CO
2C
H4
N2O
CO
2e
Cat
egor
ylb
/day
lb/d
ay
Hau
ling
0.00
000.
0000
0.00
000.
0000
0.00
000.
0000
0.00
000.
0000
0.00
000.
0000
0.00
000.
0000
0.00
000.
0000
Ven
dor
0.00
000.
0000
0.00
000.
0000
0.00
000.
0000
0.00
000.
0000
0.00
000.
0000
0.00
000.
0000
0.00
000.
0000
Wor
ker
0.22
910.
2437
2.00
842.
3700
e-00
30.
2299
2.53
00e-
003
0.23
240.
0610
2.34
00e-
003
0.06
3323
3.68
9923
3.68
990.
0203
234.
1970
To
tal
0.22
910.
2437
2.00
842.
3700
e-00
30.
2299
2.53
00e-
003
0.23
240.
0610
2.34
00e-
003
0.06
3323
3.68
9923
3.68
990.
0203
234.
1970
Un
mit
igat
ed C
on
stru
ctio
n O
ff-S
ite
RO
GN
Ox
CO
SO
2F
ugiti
veP
M10
Exh
aust
PM
10P
M10
Tot
alF
ugiti
veP
M2.
5E
xhau
stP
M2.
5P
M2.
5T
otal
Bio
- C
O2
NB
io-
CO
2T
otal
CO
2C
H4
N2O
CO
2e
Cat
egor
ylb
/day
lb/d
ay
Off-
Roa
d0.
2239
4.75
796.
9028
0.01
130.
0436
0.04
360.
0436
0.04
360.
0000
1,08
5.10
71
1,08
5.10
71
0.30
181,
092.
651
5
Pav
ing
0.00
000.
0000
0.00
000.
0000
0.00
000.
0000
0.00
00
To
tal
0.22
394.
7579
6.90
280.
0113
0.04
360.
0436
0.04
360.
0436
0.00
001,
085.
107
11,
085.
107
10.
3018
1,09
2.65
15
Mit
igat
ed C
on
stru
ctio
n O
n-S
ite
Cal
EE
Mod
Ver
sion
: Cal
EE
Mod
.201
6.3.
1D
ate:
1/4
/201
7 8:
29 A
MP
age
19 o
f 25
TR
ED
C H
otel
Pro
ject
- H
umbo
ldt C
ount
y, S
umm
er

4.0
Op
erat
ion
al D
etai
l - M
ob
ile
4.1
Mit
igat
ion
Mea
sure
s M
ob
ile
3.7
Pav
ing
- 2
017
RO
GN
Ox
CO
SO
2F
ugiti
veP
M10
Exh
aust
PM
10P
M10
Tot
alF
ugiti
veP
M2.
5E
xhau
stP
M2.
5P
M2.
5T
otal
Bio
- C
O2
NB
io-
CO
2T
otal
CO
2C
H4
N2O
CO
2e
Cat
egor
ylb
/day
lb/d
ay
Hau
ling
0.00
000.
0000
0.00
000.
0000
0.00
000.
0000
0.00
000.
0000
0.00
000.
0000
0.00
000.
0000
0.00
000.
0000
Ven
dor
0.00
000.
0000
0.00
000.
0000
0.00
000.
0000
0.00
000.
0000
0.00
000.
0000
0.00
000.
0000
0.00
000.
0000
Wor
ker
0.22
910.
2437
2.00
842.
3700
e-00
30.
2299
2.53
00e-
003
0.23
240.
0610
2.34
00e-
003
0.06
3323
3.68
9923
3.68
990.
0203
234.
1970
To
tal
0.22
910.
2437
2.00
842.
3700
e-00
30.
2299
2.53
00e-
003
0.23
240.
0610
2.34
00e-
003
0.06
3323
3.68
9923
3.68
990.
0203
234.
1970
Mit
igat
ed C
on
stru
ctio
n O
ff-S
ite
Cal
EE
Mod
Ver
sion
: Cal
EE
Mod
.201
6.3.
1D
ate:
1/4
/201
7 8:
29 A
MP
age
20 o
f 25
TR
ED
C H
otel
Pro
ject
- H
umbo
ldt C
ount
y, S
umm
er

RO
GN
Ox
CO
SO
2F
ugiti
veP
M10
Exh
aust
PM
10P
M10
Tot
alF
ugiti
veP
M2.
5E
xhau
stP
M2.
5P
M2.
5T
otal
Bio
- C
O2
NB
io-
CO
2T
otal
CO
2C
H4
N2O
CO
2e
Cat
egor
ylb
/day
lb/d
ay
Miti
gate
d3.
3509
21.7
434
48.6
571
0.09
757.
2338
0.21
447.
4481
1.94
200.
2034
2.14
549,
813.
877
29,
813.
877
20.
6002
9,82
8.88
10
Unm
itiga
ted
3.35
0921
.743
448
.657
10.
0975
7.23
380.
2144
7.44
811.
9420
0.20
342.
1454
9,81
3.87
72
9,81
3.87
72
0.60
029,
828.
881
0
4.2
Tri
p S
um
mar
y In
form
atio
n
4.3
Tri
p T
ype
Info
rmat
ion
Ave
rage
Dai
ly T
rip R
ate
Unm
itiga
ted
Miti
gate
d
Land
Use
Wee
kday
Sat
urda
yS
unda
yA
nnua
l VM
TA
nnua
l VM
T
Hot
el57
2.00
573.
0041
7.00
3,24
4,04
13,
244,
041
Tot
al57
2.00
573.
0041
7.00
3,24
4,04
13,
244,
041
Mile
sT
rip %
Trip
Pur
pose
%
Land
Use
H-W
or
C-W
H-S
or
C-C
H-O
or
C-N
WH
-W o
r C
-WH
-S o
r C
-CH
-O o
r C
-NW
Prim
ary
Div
erte
dP
ass-
by
Hot
el24
.00
24.0
024
.00
19.4
061
.60
19.0
058
384
5.0
En
erg
y D
etai
l
4.4
Fle
et M
ix
Land
Use
LD
ALD
T1
LDT
2M
DV
LHD
1LH
D2
MH
DH
HD
OB
US
UB
US
MC
YS
BU
SM
H
Hot
el0.
4487
950.
0606
870.
2061
490.
1458
870.
0579
160.
0092
820.
0146
260.
0426
270.
0029
290.
0019
050.
0064
090.
0015
530.
0012
36
His
toric
al E
nerg
y U
se: N
Cal
EE
Mod
Ver
sion
: Cal
EE
Mod
.201
6.3.
1D
ate:
1/4
/201
7 8:
29 A
MP
age
21 o
f 25
TR
ED
C H
otel
Pro
ject
- H
umbo
ldt C
ount
y, S
umm
er

RO
GN
Ox
CO
SO
2F
ugiti
veP
M10
Exh
aust
PM
10P
M10
Tot
alF
ugiti
veP
M2.
5E
xhau
stP
M2.
5P
M2.
5T
otal
Bio
- C
O2
NB
io-
CO
2T
otal
CO
2C
H4
N2O
CO
2e
Cat
egor
ylb
/day
lb/d
ay
Nat
ural
Gas
Miti
gate
d0.
0107
0.09
770.
0821
5.90
00e-
004
7.42
00e-
003
7.42
00e-
003
7.42
00e-
003
7.42
00e-
003
117.
2083
117.
2083
2.25
00e-
003
2.15
00e-
003
117.
9049
Nat
ural
Gas
Unm
itiga
ted
0.01
070.
0977
0.08
215.
9000
e-00
47.
4200
e-00
37.
4200
e-00
37.
4200
e-00
37.
4200
e-00
311
7.20
8311
7.20
832.
2500
e-00
32.
1500
e-00
311
7.90
49
5.2
En
erg
y b
y L
and
Use
- N
atu
ralG
as
Nat
ural
Ga
s U
seR
OG
NO
xC
OS
O2
Fug
itive
PM
10E
xhau
stP
M10
PM
10T
otal
Fug
itive
PM
2.5
Exh
aust
PM
2.5
PM
2.5
Tot
alB
io-
CO
2N
Bio
- C
O2
Tot
al C
O2
CH
4N
2OC
O2e
Land
Use
kBT
U/y
rlb
/day
lb/d
ay
Hot
el99
6.27
10.
0107
0.09
770.
0821
5.90
00e-
004
7.42
00e-
003
7.42
00e-
003
7.42
00e-
003
7.42
00e-
003
117.
2083
117.
2083
2.25
00e-
003
2.15
00e-
003
117.
9049
To
tal
0.01
070.
0977
0.08
215.
9000
e-00
47.
4200
e-00
37.
4200
e-00
37.
4200
e-00
37.
4200
e-00
311
7.20
8311
7.20
832.
2500
e-00
32.
1500
e-00
311
7.90
49
Un
mit
igat
ed
5.1
Mit
igat
ion
Mea
sure
s E
ner
gy
Cal
EE
Mod
Ver
sion
: Cal
EE
Mod
.201
6.3.
1D
ate:
1/4
/201
7 8:
29 A
MP
age
22 o
f 25
TR
ED
C H
otel
Pro
ject
- H
umbo
ldt C
ount
y, S
umm
er

6.1
Mit
igat
ion
Mea
sure
s A
rea
6.0
Are
a D
etai
l
RO
GN
Ox
CO
SO
2F
ugiti
veP
M10
Exh
aust
PM
10P
M10
Tot
alF
ugiti
veP
M2.
5E
xhau
stP
M2.
5P
M2.
5T
otal
Bio
- C
O2
NB
io-
CO
2T
otal
CO
2C
H4
N2O
CO
2e
Cat
egor
ylb
/day
lb/d
ay
Miti
gate
d0.
4845
1.00
00e-
004
0.01
040.
0000
4.00
00e-
005
4.00
00e-
005
4.00
00e-
005
4.00
00e-
005
0.02
190.
0219
6.00
00e-
005
0.02
34
Unm
itiga
ted
0.48
451.
0000
e-00
40.
0104
0.00
004.
0000
e-00
54.
0000
e-00
54.
0000
e-00
54.
0000
e-00
50.
0219
0.02
196.
0000
e-00
50.
0234
5.2
En
erg
y b
y L
and
Use
- N
atu
ralG
as
Nat
ural
Ga
s U
seR
OG
NO
xC
OS
O2
Fug
itive
PM
10E
xhau
stP
M10
PM
10T
otal
Fug
itive
PM
2.5
Exh
aust
PM
2.5
PM
2.5
Tot
alB
io-
CO
2N
Bio
- C
O2
Tot
al C
O2
CH
4N
2OC
O2e
Land
Use
kBT
U/y
rlb
/day
lb/d
ay
Hot
el0.
9962
710.
0107
0.09
770.
0821
5.90
00e-
004
7.42
00e-
003
7.42
00e-
003
7.42
00e-
003
7.42
00e-
003
117.
2083
117.
2083
2.25
00e-
003
2.15
00e-
003
117.
9049
To
tal
0.01
070.
0977
0.08
215.
9000
e-00
47.
4200
e-00
37.
4200
e-00
37.
4200
e-00
37.
4200
e-00
311
7.20
8311
7.20
832.
2500
e-00
32.
1500
e-00
311
7.90
49
Mit
igat
ed
Cal
EE
Mod
Ver
sion
: Cal
EE
Mod
.201
6.3.
1D
ate:
1/4
/201
7 8:
29 A
MP
age
23 o
f 25
TR
ED
C H
otel
Pro
ject
- H
umbo
ldt C
ount
y, S
umm
er

7.0
Wat
er D
etai
l
6.2
Are
a b
y S
ub
Cat
ego
ry
RO
GN
Ox
CO
SO
2F
ugiti
veP
M10
Exh
aust
PM
10P
M10
Tot
alF
ugiti
veP
M2.
5E
xhau
stP
M2.
5P
M2.
5T
otal
Bio
- C
O2
NB
io-
CO
2T
otal
CO
2C
H4
N2O
CO
2e
Sub
Cat
egor
ylb
/day
lb/d
ay
Arc
hite
ctur
alC
oatin
g0.
1106
0.00
000.
0000
0.00
000.
0000
0.00
000.
0000
Con
sum
erP
rodu
cts
0.37
290.
0000
0.00
000.
0000
0.00
000.
0000
0.00
00
Land
scap
ing
9.90
00e-
004
1.00
00e-
004
0.01
040.
0000
4.00
00e-
005
4.00
00e-
005
4.00
00e-
005
4.00
00e-
005
0.02
190.
0219
6.00
00e-
005
0.02
34
To
tal
0.48
451.
0000
e-00
40.
0104
0.00
004.
0000
e-00
54.
0000
e-00
54.
0000
e-00
54.
0000
e-00
50.
0219
0.02
196.
0000
e-00
50.
0234
Un
mit
igat
ed
RO
GN
Ox
CO
SO
2F
ugiti
veP
M10
Exh
aust
PM
10P
M10
Tot
alF
ugiti
veP
M2.
5E
xhau
stP
M2.
5P
M2.
5T
otal
Bio
- C
O2
NB
io-
CO
2T
otal
CO
2C
H4
N2O
CO
2e
Sub
Cat
egor
ylb
/day
lb/d
ay
Arc
hite
ctur
alC
oatin
g0.
1106
0.00
000.
0000
0.00
000.
0000
0.00
000.
0000
Con
sum
erP
rodu
cts
0.37
290.
0000
0.00
000.
0000
0.00
000.
0000
0.00
00
Land
scap
ing
9.90
00e-
004
1.00
00e-
004
0.01
040.
0000
4.00
00e-
005
4.00
00e-
005
4.00
00e-
005
4.00
00e-
005
0.02
190.
0219
6.00
00e-
005
0.02
34
To
tal
0.48
451.
0000
e-00
40.
0104
0.00
004.
0000
e-00
54.
0000
e-00
54.
0000
e-00
54.
0000
e-00
50.
0219
0.02
196.
0000
e-00
50.
0234
Mit
igat
ed
Cal
EE
Mod
Ver
sion
: Cal
EE
Mod
.201
6.3.
1D
ate:
1/4
/201
7 8:
29 A
MP
age
24 o
f 25
TR
ED
C H
otel
Pro
ject
- H
umbo
ldt C
ount
y, S
umm
er

8.1
Mit
igat
ion
Mea
sure
s W
aste
Inst
all L
ow F
low
Bat
hroo
m F
auce
t
Inst
all L
ow F
low
Kitc
hen
Fau
cet
Inst
all L
ow F
low
Toi
let
Inst
all L
ow F
low
Sho
wer
7.1
Mit
igat
ion
Mea
sure
s W
ater
8.0
Was
te D
etai
l
11.0
Veg
etat
ion
9.0
Op
erat
ion
al O
ffro
ad
Equ
ipm
ent T
ype
Num
ber
Hou
rs/D
ayD
ays/
Yea
rH
orse
Pow
erLo
ad F
acto
rF
uel T
ype
10.0
Sta
tio
nar
y E
qu
ipm
ent
Fir
e P
um
ps
and
Em
erg
ency
Gen
erat
ors
Equ
ipm
ent T
ype
Num
ber
Hou
rs/D
ayH
ours
/Yea
rH
orse
Pow
erLo
ad F
acto
rF
uel T
ype
Bo
ilers
Equ
ipm
ent T
ype
Num
ber
Hea
t Inp
ut/D
ayH
eat I
nput
/Yea
rB
oile
r R
atin
gF
uel T
ype
Use
r D
efin
ed E
qu
ipm
ent
Equ
ipm
ent T
ype
Num
ber
Cal
EE
Mod
Ver
sion
: Cal
EE
Mod
.201
6.3.
1D
ate:
1/4
/201
7 8:
29 A
MP
age
25 o
f 25
TR
ED
C H
otel
Pro
ject
- H
umbo
ldt C
ount
y, S
umm
er

Pro
ject
Cha
ract
eris
tics
-
Land
Use
- R
efer
to P
roje
ct D
escr
iptio
n
Con
stru
ctio
n P
hase
-
Dem
oliti
on -
Veh
icle
Trip
s -
Ref
er to
Cal
EE
Mod
inpu
t tab
le
Con
stru
ctio
n O
ff-ro
ad E
quip
men
t Miti
gatio
n -
Ref
er to
Cal
EE
Mod
tabl
es
Wat
er M
itiga
tion
-
1.1
Lan
d U
sag
e
Land
Use
sS
ize
Met
ricLo
t Acr
eage
Flo
or S
urfa
ce A
rea
Pop
ulat
ion
Hot
el10
0.00
Roo
m0.
4017
,424
.00
0
1.2
Oth
er P
roje
ct C
har
acte
rist
ics
Urb
aniz
atio
n
Clim
ate
Zo
ne
Rur
al
1
Win
d S
pee
d (
m/s
)P
reci
pit
atio
n F
req
(D
ays)
2.2
103
1.3
Use
r E
nte
red
Co
mm
ents
& N
on
-Def
ault
Dat
a
1.0
Pro
ject
Ch
arac
teri
stic
s
Uti
lity
Co
mp
any
Pac
ific
Gas
& E
lect
ric C
ompa
ny
2040
Op
erat
ion
al Y
ear
CO
2 In
ten
sity
(l
b/M
Wh
r)64
1.35
0.02
9C
H4
Inte
nsi
ty
(lb
/MW
hr)
0.00
6N
2O In
ten
sity
(l
b/M
Wh
r)
Tab
le N
ame
Col
umn
Nam
eD
efau
lt V
alue
New
Val
ue
tblC
onst
Dus
tMiti
gatio
nW
ater
Unp
aved
Roa
dVeh
icle
Spe
ed40
15
TR
ED
C H
ote
l Pro
ject
Hu
mb
old
t C
ou
nty
, Su
mm
er
Cal
EE
Mod
Ver
sion
: Cal
EE
Mod
.201
6.3.
1D
ate:
1/1
2/20
17 8
:54
AM
Pag
e 1
of 2
5
TR
ED
C H
otel
Pro
ject
- H
umbo
ldt C
ount
y, S
umm
er

tblC
onst
Equ
ipM
itiga
tion
DP
FN
o C
hang
eLe
vel 3
tblC
onst
Equ
ipM
itiga
tion
DP
FN
o C
hang
eLe
vel 3
tblC
onst
Equ
ipM
itiga
tion
DP
FN
o C
hang
eLe
vel 3
tblC
onst
Equ
ipM
itiga
tion
DP
FN
o C
hang
eLe
vel 3
tblC
onst
Equ
ipM
itiga
tion
DP
FN
o C
hang
eLe
vel 3
tblC
onst
Equ
ipM
itiga
tion
DP
FN
o C
hang
eLe
vel 3
tblC
onst
Equ
ipM
itiga
tion
DP
FN
o C
hang
eLe
vel 3
tblC
onst
Equ
ipM
itiga
tion
DP
FN
o C
hang
eLe
vel 3
tblC
onst
Equ
ipM
itiga
tion
DP
FN
o C
hang
eLe
vel 3
tblC
onst
Equ
ipM
itiga
tion
DP
FN
o C
hang
eLe
vel 3
tblC
onst
Equ
ipM
itiga
tion
Num
berO
fEqu
ipm
entM
itiga
ted
0.00
1.00
tblC
onst
Equ
ipM
itiga
tion
Num
berO
fEqu
ipm
entM
itiga
ted
0.00
4.00
tblC
onst
Equ
ipM
itiga
tion
Num
berO
fEqu
ipm
entM
itiga
ted
0.00
2.00
tblC
onst
Equ
ipM
itiga
tion
Num
berO
fEqu
ipm
entM
itiga
ted
0.00
1.00
tblC
onst
Equ
ipM
itiga
tion
Num
berO
fEqu
ipm
entM
itiga
ted
0.00
2.00
tblC
onst
Equ
ipM
itiga
tion
Num
berO
fEqu
ipm
entM
itiga
ted
0.00
1.00
tblC
onst
Equ
ipM
itiga
tion
Num
berO
fEqu
ipm
entM
itiga
ted
0.00
1.00
tblC
onst
Equ
ipM
itiga
tion
Num
berO
fEqu
ipm
entM
itiga
ted
0.00
1.00
tblC
onst
Equ
ipM
itiga
tion
Num
berO
fEqu
ipm
entM
itiga
ted
0.00
2.00
tblC
onst
Equ
ipM
itiga
tion
Num
berO
fEqu
ipm
entM
itiga
ted
0.00
8.00
tblC
onst
Equ
ipM
itiga
tion
Tie
rN
o C
hang
eT
ier
3
tblC
onst
Equ
ipM
itiga
tion
Tie
rN
o C
hang
eT
ier
3
tblC
onst
Equ
ipM
itiga
tion
Tie
rN
o C
hang
eT
ier
3
tblC
onst
Equ
ipM
itiga
tion
Tie
rN
o C
hang
eT
ier
3
tblC
onst
Equ
ipM
itiga
tion
Tie
rN
o C
hang
eT
ier
3
tblC
onst
Equ
ipM
itiga
tion
Tie
rN
o C
hang
eT
ier
3
tblC
onst
Equ
ipM
itiga
tion
Tie
rN
o C
hang
eT
ier
3
Cal
EE
Mod
Ver
sion
: Cal
EE
Mod
.201
6.3.
1D
ate:
1/1
2/20
17 8
:54
AM
Pag
e 2
of 2
5
TR
ED
C H
otel
Pro
ject
- H
umbo
ldt C
ount
y, S
umm
er
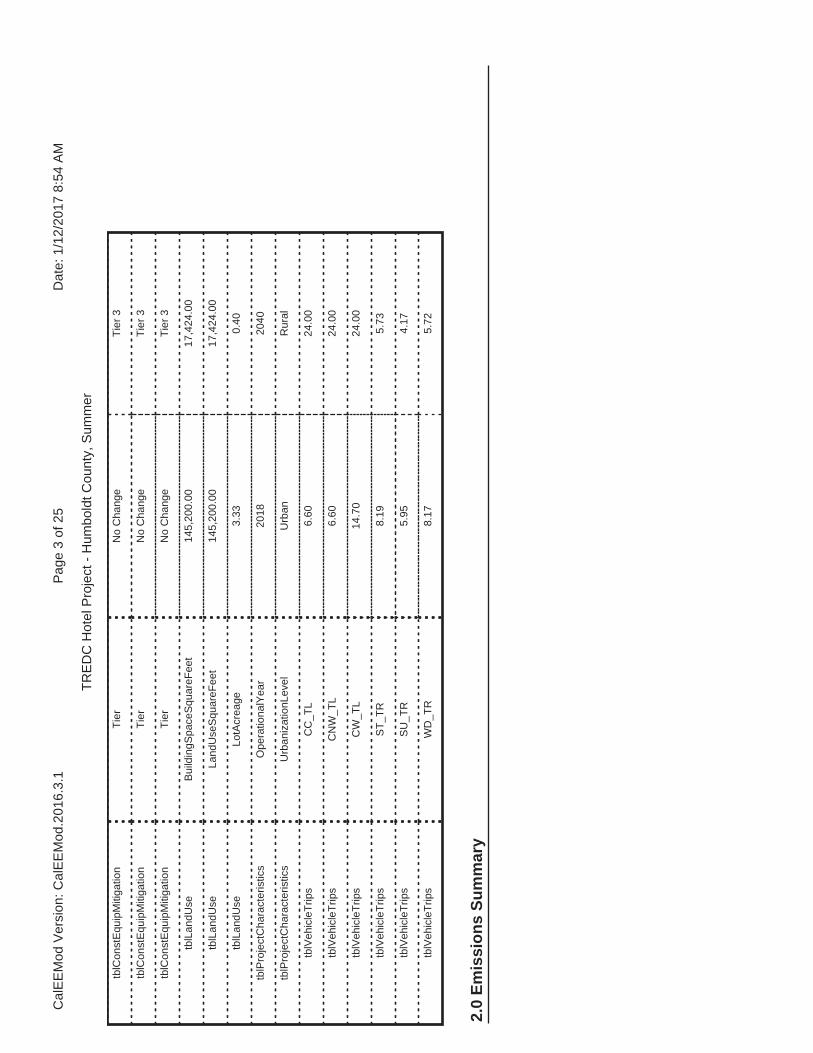
2.0
Em
issi
on
s S
um
mar
y
tblC
onst
Equ
ipM
itiga
tion
Tie
rN
o C
hang
eT
ier
3
tblC
onst
Equ
ipM
itiga
tion
Tie
rN
o C
hang
eT
ier
3
tblC
onst
Equ
ipM
itiga
tion
Tie
rN
o C
hang
eT
ier
3
tblL
andU
seB
uild
ingS
pace
Squ
areF
eet
145,
200.
0017
,424
.00
tblL
andU
seLa
ndU
seS
quar
eFee
t14
5,20
0.00
17,4
24.0
0
tblL
andU
seLo
tAcr
eage
3.33
0.40
tblP
roje
ctC
hara
cter
istic
sO
pera
tiona
lYea
r20
1820
40
tblP
roje
ctC
hara
cter
istic
sU
rban
izat
ionL
evel
Urb
anR
ural
tblV
ehic
leT
rips
CC
_TL
6.60
24.0
0
tblV
ehic
leT
rips
CN
W_T
L6.
6024
.00
tblV
ehic
leT
rips
CW
_TL
14.7
024
.00
tblV
ehic
leT
rips
ST
_TR
8.19
5.73
tblV
ehic
leT
rips
SU
_TR
5.95
4.17
tblV
ehic
leT
rips
WD
_TR
8.17
5.72
Cal
EE
Mod
Ver
sion
: Cal
EE
Mod
.201
6.3.
1D
ate:
1/1
2/20
17 8
:54
AM
Pag
e 3
of 2
5
TR
ED
C H
otel
Pro
ject
- H
umbo
ldt C
ount
y, S
umm
er

2.1
Ove
rall
Co
nst
ruct
ion
(M
axim
um
Dai
ly E
mis
sio
n)
RO
GN
Ox
CO
SO
2F
ugiti
veP
M10
Exh
aust
PM
10P
M10
Tot
alF
ugiti
veP
M2.
5E
xhau
stP
M2.
5P
M2.
5T
otal
Bio
- C
O2
NB
io-
CO
2T
otal
CO
2C
H4
N2O
CO
2e
Yea
rlb
/day
lb/d
ay
2017
81.1
053
24.6
354
11.8
194
0.04
168.
1808
0.88
159.
0623
1.32
620.
8410
2.16
710.
0000
4,27
3.62
05
4,27
3.62
05
0.37
020.
0000
4,28
2.29
77
Max
imu
m81
.105
324
.635
411
.819
40.
0416
8.18
080.
8815
9.06
231.
3262
0.84
102.
1671
0.00
004,
273.
620
54,
273.
620
50.
3702
0.00
004,
282.
297
7
Un
mit
igat
ed C
on
stru
ctio
n
RO
GN
Ox
CO
SO
2F
ugiti
veP
M10
Exh
aust
PM
10P
M10
Tot
alF
ugiti
veP
M2.
5E
xhau
stP
M2.
5P
M2.
5T
otal
Bio
- C
O2
NB
io-
CO
2T
otal
CO
2C
H4
N2O
CO
2e
Yea
rlb
/day
lb/d
ay
2017
80.8
324
20.1
020
11.8
392
0.04
164.
0803
0.21
004.
2903
0.70
530.
2035
0.90
880.
0000
4,27
3.62
05
4,27
3.62
05
0.37
020.
0000
4,28
2.29
77
Max
imu
m80
.832
420
.102
011
.839
20.
0416
4.08
030.
2100
4.29
030.
7053
0.20
350.
9088
0.00
004,
273.
620
54,
273.
620
50.
3702
0.00
004,
282.
297
7
Mit
igat
ed C
on
stru
ctio
n
RO
GN
Ox
CO
SO
2F
ug
itiv
eP
M10
Exh
aust
PM
10P
M10
To
tal
Fu
git
ive
PM
2.5
Exh
aust
PM
2.5
PM
2.5
To
tal
Bio
- C
O2
NB
io-C
O2
To
tal C
O2
CH
4N
20C
O2e
Per
cen
tR
edu
ctio
n0.
3418
.40
-0.1
70.
0050
.12
76.1
852
.66
46.8
275
.81
58.0
60.
000.
000.
000.
000.
000.
00
Cal
EE
Mod
Ver
sion
: Cal
EE
Mod
.201
6.3.
1D
ate:
1/1
2/20
17 8
:54
AM
Pag
e 4
of 2
5
TR
ED
C H
otel
Pro
ject
- H
umbo
ldt C
ount
y, S
umm
er
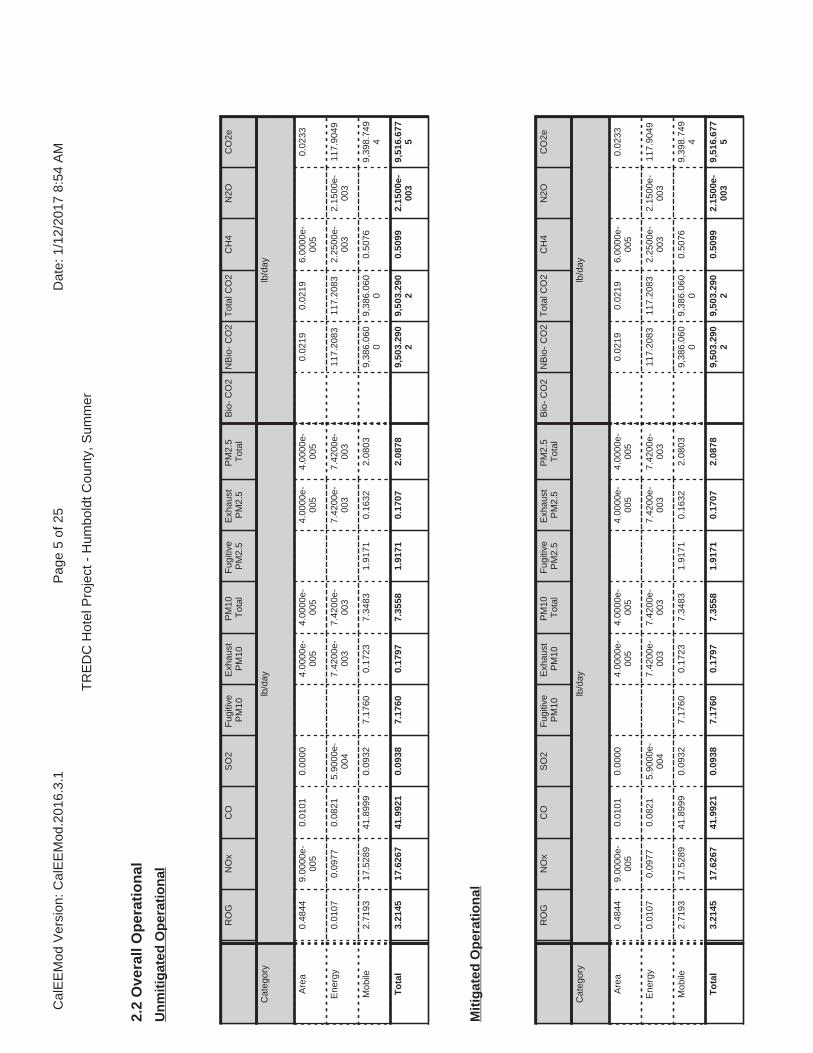
2.2
Ove
rall
Op
erat
ion
al
RO
GN
Ox
CO
SO
2F
ugiti
veP
M10
Exh
aust
PM
10P
M10
Tot
alF
ugiti
veP
M2.
5E
xhau
stP
M2.
5P
M2.
5T
otal
Bio
- C
O2
NB
io-
CO
2T
otal
CO
2C
H4
N2O
CO
2e
Cat
egor
ylb
/day
lb/d
ay
Are
a0.
4844
9.00
00e-
005
0.01
010.
0000
4.00
00e-
005
4.00
00e-
005
4.00
00e-
005
4.00
00e-
005
0.02
190.
0219
6.00
00e-
005
0.02
33
Ene
rgy
0.01
070.
0977
0.08
215.
9000
e-00
47.
4200
e-00
37.
4200
e-00
37.
4200
e-00
37.
4200
e-00
311
7.20
8311
7.20
832.
2500
e-00
32.
1500
e-00
311
7.90
49
Mob
ile2.
7193
17.5
289
41.8
999
0.09
327.
1760
0.17
237.
3483
1.91
710.
1632
2.08
039,
386.
060
09,
386.
060
00.
5076
9,39
8.74
94
To
tal
3.21
4517
.626
741
.992
10.
0938
7.17
600.
1797
7.35
581.
9171
0.17
072.
0878
9,50
3.29
02
9,50
3.29
02
0.50
992.
1500
e-00
39,
516.
677
5
Un
mit
igat
ed O
per
atio
nal
RO
GN
Ox
CO
SO
2F
ugiti
veP
M10
Exh
aust
PM
10P
M10
Tot
alF
ugiti
veP
M2.
5E
xhau
stP
M2.
5P
M2.
5T
otal
Bio
- C
O2
NB
io-
CO
2T
otal
CO
2C
H4
N2O
CO
2e
Cat
egor
ylb
/day
lb/d
ay
Are
a0.
4844
9.00
00e-
005
0.01
010.
0000
4.00
00e-
005
4.00
00e-
005
4.00
00e-
005
4.00
00e-
005
0.02
190.
0219
6.00
00e-
005
0.02
33
Ene
rgy
0.01
070.
0977
0.08
215.
9000
e-00
47.
4200
e-00
37.
4200
e-00
37.
4200
e-00
37.
4200
e-00
311
7.20
8311
7.20
832.
2500
e-00
32.
1500
e-00
311
7.90
49
Mob
ile2.
7193
17.5
289
41.8
999
0.09
327.
1760
0.17
237.
3483
1.91
710.
1632
2.08
039,
386.
060
09,
386.
060
00.
5076
9,39
8.74
94
To
tal
3.21
4517
.626
741
.992
10.
0938
7.17
600.
1797
7.35
581.
9171
0.17
072.
0878
9,50
3.29
02
9,50
3.29
02
0.50
992.
1500
e-00
39,
516.
677
5
Mit
igat
ed O
per
atio
nal
Cal
EE
Mod
Ver
sion
: Cal
EE
Mod
.201
6.3.
1D
ate:
1/1
2/20
17 8
:54
AM
Pag
e 5
of 2
5
TR
ED
C H
otel
Pro
ject
- H
umbo
ldt C
ount
y, S
umm
er
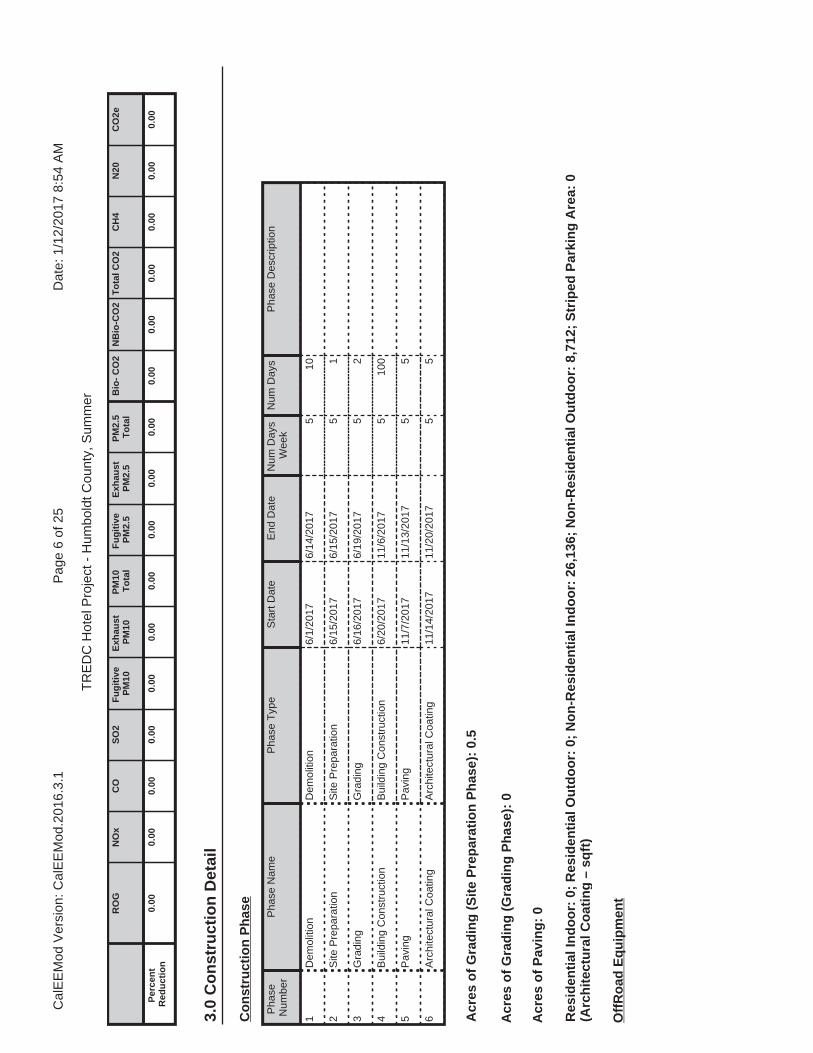
3.0
Co
nst
ruct
ion
Det
ail
Co
nst
ruct
ion
Ph
ase
Pha
seN
umbe
rP
hase
Nam
eP
hase
Typ
eS
tart
Dat
eE
nd D
ate
Num
Day
s W
eek
Num
Day
sP
hase
Des
crip
tion
1D
emol
ition
Dem
oliti
on6/
1/20
176/
14/2
017
510
2S
ite P
repa
ratio
nS
ite P
repa
ratio
n6/
15/2
017
6/15
/201
75
1
3G
radi
ngG
radi
ng6/
16/2
017
6/19
/201
75
2
4B
uild
ing
Con
stru
ctio
nB
uild
ing
Con
stru
ctio
n6/
20/2
017
11/6
/201
75
100
5P
avin
gP
avin
g11
/7/2
017
11/1
3/20
175
5
6A
rchi
tect
ural
Coa
ting
Arc
hite
ctur
al C
oatin
g11
/14/
2017
11/2
0/20
175
5
Off
Ro
ad E
qu
ipm
ent
RO
GN
Ox
CO
SO
2F
ug
itiv
eP
M10
Exh
aust
PM
10P
M10
To
tal
Fu
git
ive
PM
2.5
Exh
aust
PM
2.5
PM
2.5
To
tal
Bio
- C
O2
NB
io-C
O2
To
tal C
O2
CH
4N
20C
O2e
Per
cen
tR
edu
ctio
n0.
000.
000.
000.
000.
000.
000.
000.
000.
000.
000.
000.
000.
000.
000.
000.
00
Res
iden
tial
Ind
oo
r: 0
; R
esid
enti
al O
utd
oo
r: 0
; N
on
-Res
iden
tial
Ind
oo
r: 2
6,13
6; N
on
-Res
iden
tial
Ou
tdo
or:
8,7
12;
Str
iped
Par
kin
g A
rea:
0
(Arc
hit
ectu
ral C
oat
ing
– s
qft
)
Acr
es o
f G
rad
ing
(S
ite
Pre
par
atio
n P
has
e):
0.5
Acr
es o
f G
rad
ing
(G
rad
ing
Ph
ase)
: 0
Acr
es o
f P
avin
g:
0
Cal
EE
Mod
Ver
sion
: Cal
EE
Mod
.201
6.3.
1D
ate:
1/1
2/20
17 8
:54
AM
Pag
e 6
of 2
5
TR
ED
C H
otel
Pro
ject
- H
umbo
ldt C
ount
y, S
umm
er

Pha
se N
ame
Offr
oad
Equ
ipm
ent T
ype
Am
ount
Usa
ge H
ours
Hor
se P
ower
Load
Fac
tor
Dem
oliti
onC
oncr
ete/
Indu
stria
l Saw
s1
8.00
810.
73
Dem
oliti
onR
ubbe
r T
ired
Doz
ers
11.
0024
70.
40
Dem
oliti
onT
ract
ors/
Load
ers/
Bac
khoe
s2
6.00
970.
37
Site
Pre
para
tion
Gra
ders
18.
0018
70.
41
Site
Pre
para
tion
Tra
ctor
s/Lo
ader
s/B
ackh
oes
18.
0097
0.37
Gra
ding
Con
cret
e/In
dust
rial S
aws
18.
0081
0.73
Gra
ding
Rub
ber
Tire
d D
ozer
s1
1.00
247
0.40
Gra
ding
Tra
ctor
s/Lo
ader
s/B
ackh
oes
26.
0097
0.37
Bui
ldin
g C
onst
ruct
ion
Cra
nes
14.
0023
10.
29
Bui
ldin
g C
onst
ruct
ion
For
klift
s2
6.00
890.
20
Bui
ldin
g C
onst
ruct
ion
Tra
ctor
s/Lo
ader
s/B
ackh
oes
28.
0097
0.37
Arc
hite
ctur
al C
oatin
gA
ir C
ompr
esso
rs1
6.00
780.
48
Pav
ing
Cem
ent a
nd M
orta
r M
ixer
s4
6.00
90.
56
Pav
ing
Pav
ers
17.
0013
00.
42
Pav
ing
Rol
lers
17.
0080
0.38
Pav
ing
Tra
ctor
s/Lo
ader
s/B
ackh
oes
17.
0097
0.37
Tri
ps
and
VM
T
Pha
se N
ame
Offr
oad
Equ
ipm
ent
Cou
ntW
orke
r T
rip
Num
ber
Ven
dor
Trip
N
umbe
rH
aulin
g T
rip
Num
ber
Wor
ker
Trip
Le
ngth
Ven
dor
Trip
Le
ngth
Hau
ling
Trip
Le
ngth
Wor
ker
Veh
icle
C
lass
Ven
dor
Veh
icle
Cla
ssH
aulin
gV
ehic
le C
lass
Dem
oliti
on4
10.0
00.
0034
4.00
16.8
06.
6020
.00
LD_M
ixH
DT
_Mix
HH
DT
Site
Pre
para
tion
25.
000.
000.
0016
.80
6.60
20.0
0LD
_Mix
HD
T_M
ixH
HD
T
Gra
ding
410
.00
0.00
0.00
16.8
06.
6020
.00
LD_M
ixH
DT
_Mix
HH
DT
Bui
ldin
g C
onst
ruct
ion
57.
003.
000.
0016
.80
6.60
20.0
0LD
_Mix
HD
T_M
ixH
HD
T
Arc
hite
ctur
al C
oatin
g1
1.00
0.00
0.00
16.8
06.
6020
.00
LD_M
ixH
DT
_Mix
HH
DT
Pav
ing
718
.00
0.00
0.00
16.8
06.
6020
.00
LD_M
ixH
DT
_Mix
HH
DT
Cal
EE
Mod
Ver
sion
: Cal
EE
Mod
.201
6.3.
1D
ate:
1/1
2/20
17 8
:54
AM
Pag
e 7
of 2
5
TR
ED
C H
otel
Pro
ject
- H
umbo
ldt C
ount
y, S
umm
er
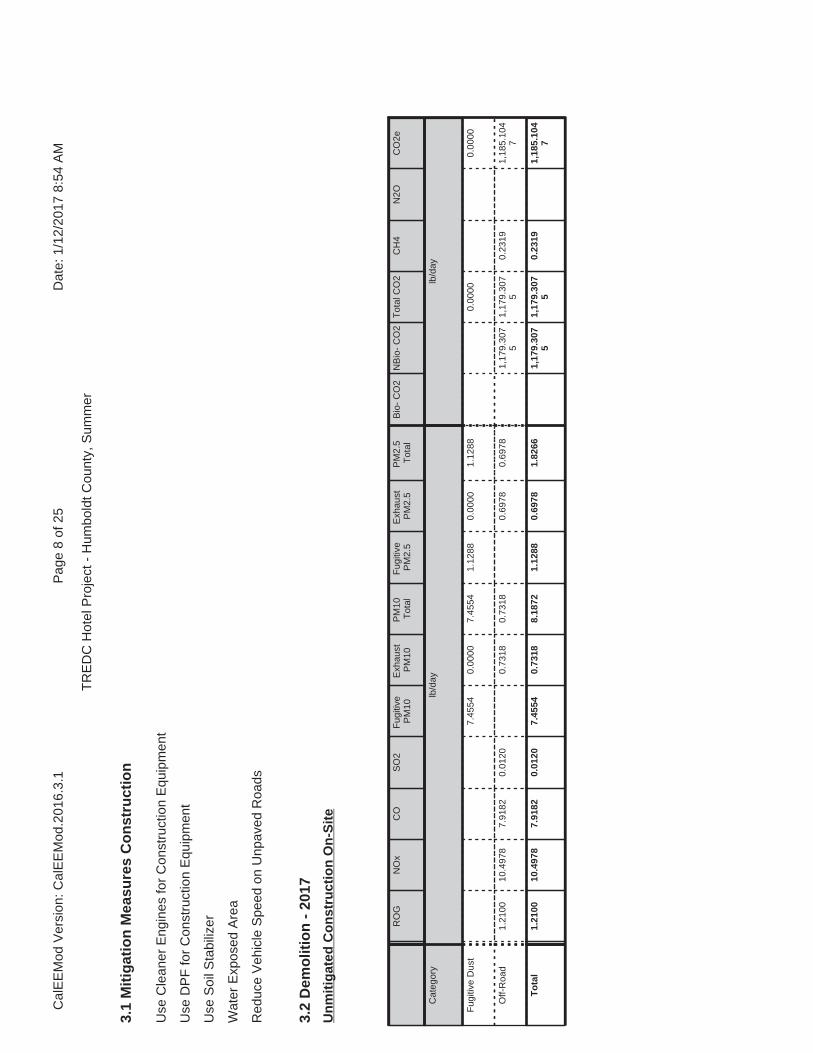
3.2
Dem
olit
ion
- 2
017
RO
GN
Ox
CO
SO
2F
ugiti
veP
M10
Exh
aust
PM
10P
M10
Tot
alF
ugiti
veP
M2.
5E
xhau
stP
M2.
5P
M2.
5T
otal
Bio
- C
O2
NB
io-
CO
2T
otal
CO
2C
H4
N2O
CO
2e
Cat
egor
ylb
/day
lb/d
ay
Fug
itive
Dus
t7.
4554
0.00
007.
4554
1.12
880.
0000
1.12
880.
0000
0.00
00
Off-
Roa
d1.
2100
10.4
978
7.91
820.
0120
0.73
180.
7318
0.69
780.
6978
1,17
9.30
75
1,17
9.30
75
0.23
191,
185.
104
7
To
tal
1.21
0010
.497
87.
9182
0.01
207.
4554
0.73
188.
1872
1.12
880.
6978
1.82
661,
179.
307
51,
179.
307
50.
2319
1,18
5.10
47
Un
mit
igat
ed C
on
stru
ctio
n O
n-S
ite
3.1
Mit
igat
ion
Mea
sure
s C
on
stru
ctio
n
Use
Cle
aner
Eng
ines
for
Con
stru
ctio
n E
quip
men
t
Use
DP
F fo
r C
onst
ruct
ion
Equ
ipm
ent
Use
Soi
l Sta
biliz
er
Wat
er E
xpos
ed A
rea
Red
uce
Veh
icle
Spe
ed o
n U
npav
ed R
oads
Cal
EE
Mod
Ver
sion
: Cal
EE
Mod
.201
6.3.
1D
ate:
1/1
2/20
17 8
:54
AM
Pag
e 8
of 2
5
TR
ED
C H
otel
Pro
ject
- H
umbo
ldt C
ount
y, S
umm
er

3.2
Dem
olit
ion
- 2
017
RO
GN
Ox
CO
SO
2F
ugiti
veP
M10
Exh
aust
PM
10P
M10
Tot
alF
ugiti
veP
M2.
5E
xhau
stP
M2.
5P
M2.
5T
otal
Bio
- C
O2
NB
io-
CO
2T
otal
CO
2C
H4
N2O
CO
2e
Cat
egor
ylb
/day
lb/d
ay
Hau
ling
0.53
5014
.002
22.
7854
0.02
830.
5977
0.14
830.
7460
0.16
350.
1419
0.30
542,
964.
485
32,
964.
485
30.
1039
2,96
7.08
35
Ven
dor
0.00
000.
0000
0.00
000.
0000
0.00
000.
0000
0.00
000.
0000
0.00
000.
0000
0.00
000.
0000
0.00
000.
0000
Wor
ker
0.12
730.
1354
1.11
581.
3100
e-00
30.
1277
1.40
00e-
003
0.12
910.
0339
1.30
00e-
003
0.03
5212
9.82
7712
9.82
770.
0113
130.
1095
To
tal
0.66
2314
.137
63.
9011
0.02
960.
7254
0.14
970.
8751
0.19
740.
1432
0.34
063,
094.
313
03,
094.
313
00.
1152
3,09
7.19
29
Un
mit
igat
ed C
on
stru
ctio
n O
ff-S
ite
RO
GN
Ox
CO
SO
2F
ugiti
veP
M10
Exh
aust
PM
10P
M10
Tot
alF
ugiti
veP
M2.
5E
xhau
stP
M2.
5P
M2.
5T
otal
Bio
- C
O2
NB
io-
CO
2T
otal
CO
2C
H4
N2O
CO
2e
Cat
egor
ylb
/day
lb/d
ay
Fug
itive
Dus
t3.
3549
0.00
003.
3549
0.50
800.
0000
0.50
800.
0000
0.00
00
Off-
Roa
d0.
2652
5.96
447.
9381
0.01
200.
0603
0.06
030.
0603
0.06
030.
0000
1,17
9.30
75
1,17
9.30
75
0.23
191,
185.
104
7
To
tal
0.26
525.
9644
7.93
810.
0120
3.35
490.
0603
3.41
520.
5080
0.06
030.
5682
0.00
001,
179.
307
51,
179.
307
50.
2319
1,18
5.10
47
Mit
igat
ed C
on
stru
ctio
n O
n-S
ite
Cal
EE
Mod
Ver
sion
: Cal
EE
Mod
.201
6.3.
1D
ate:
1/1
2/20
17 8
:54
AM
Pag
e 9
of 2
5
TR
ED
C H
otel
Pro
ject
- H
umbo
ldt C
ount
y, S
umm
er

3.2
Dem
olit
ion
- 2
017
RO
GN
Ox
CO
SO
2F
ugiti
veP
M10
Exh
aust
PM
10P
M10
Tot
alF
ugiti
veP
M2.
5E
xhau
stP
M2.
5P
M2.
5T
otal
Bio
- C
O2
NB
io-
CO
2T
otal
CO
2C
H4
N2O
CO
2e
Cat
egor
ylb
/day
lb/d
ay
Hau
ling
0.53
5014
.002
22.
7854
0.02
830.
5977
0.14
830.
7460
0.16
350.
1419
0.30
542,
964.
485
32,
964.
485
30.
1039
2,96
7.08
35
Ven
dor
0.00
000.
0000
0.00
000.
0000
0.00
000.
0000
0.00
000.
0000
0.00
000.
0000
0.00
000.
0000
0.00
000.
0000
Wor
ker
0.12
730.
1354
1.11
581.
3100
e-00
30.
1277
1.40
00e-
003
0.12
910.
0339
1.30
00e-
003
0.03
5212
9.82
7712
9.82
770.
0113
130.
1095
To
tal
0.66
2314
.137
63.
9011
0.02
960.
7254
0.14
970.
8751
0.19
740.
1432
0.34
063,
094.
313
03,
094.
313
00.
1152
3,09
7.19
29
Mit
igat
ed C
on
stru
ctio
n O
ff-S
ite
3.3
Sit
e P
rep
arat
ion
- 2
017
RO
GN
Ox
CO
SO
2F
ugiti
veP
M10
Exh
aust
PM
10P
M10
Tot
alF
ugiti
veP
M2.
5E
xhau
stP
M2.
5P
M2.
5T
otal
Bio
- C
O2
NB
io-
CO
2T
otal
CO
2C
H4
N2O
CO
2e
Cat
egor
ylb
/day
lb/d
ay
Fug
itive
Dus
t0.
5303
0.00
000.
5303
0.05
730.
0000
0.05
730.
0000
0.00
00
Off-
Roa
d0.
8524
10.5
148
4.35
339.
7700
e-00
30.
4726
0.47
260.
4347
0.43
4799
9.52
0199
9.52
010.
3063
1,00
7.17
64
To
tal
0.85
2410
.514
84.
3533
9.77
00e-
003
0.53
030.
4726
1.00
280.
0573
0.43
470.
4920
999.
5201
999.
5201
0.30
631,
007.
176
4
Un
mit
igat
ed C
on
stru
ctio
n O
n-S
ite
Cal
EE
Mod
Ver
sion
: Cal
EE
Mod
.201
6.3.
1D
ate:
1/1
2/20
17 8
:54
AM
Pag
e 10
of 2
5
TR
ED
C H
otel
Pro
ject
- H
umbo
ldt C
ount
y, S
umm
er
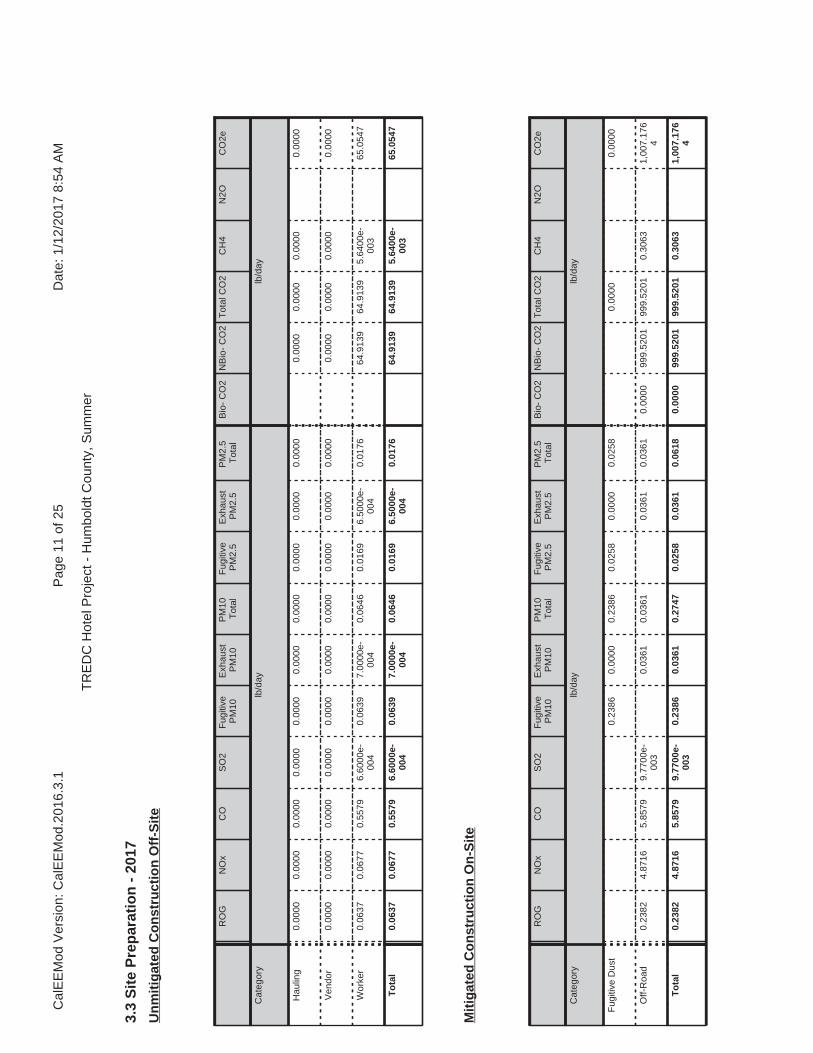
3.3
Sit
e P
rep
arat
ion
- 2
017
RO
GN
Ox
CO
SO
2F
ugiti
veP
M10
Exh
aust
PM
10P
M10
Tot
alF
ugiti
veP
M2.
5E
xhau
stP
M2.
5P
M2.
5T
otal
Bio
- C
O2
NB
io-
CO
2T
otal
CO
2C
H4
N2O
CO
2e
Cat
egor
ylb
/day
lb/d
ay
Hau
ling
0.00
000.
0000
0.00
000.
0000
0.00
000.
0000
0.00
000.
0000
0.00
000.
0000
0.00
000.
0000
0.00
000.
0000
Ven
dor
0.00
000.
0000
0.00
000.
0000
0.00
000.
0000
0.00
000.
0000
0.00
000.
0000
0.00
000.
0000
0.00
000.
0000
Wor
ker
0.06
370.
0677
0.55
796.
6000
e-00
40.
0639
7.00
00e-
004
0.06
460.
0169
6.50
00e-
004
0.01
7664
.913
964
.913
95.
6400
e-00
365
.054
7
To
tal
0.06
370.
0677
0.55
796.
6000
e-00
40.
0639
7.00
00e-
004
0.06
460.
0169
6.50
00e-
004
0.01
7664
.913
964
.913
95.
6400
e-00
365
.054
7
Un
mit
igat
ed C
on
stru
ctio
n O
ff-S
ite
RO
GN
Ox
CO
SO
2F
ugiti
veP
M10
Exh
aust
PM
10P
M10
Tot
alF
ugiti
veP
M2.
5E
xhau
stP
M2.
5P
M2.
5T
otal
Bio
- C
O2
NB
io-
CO
2T
otal
CO
2C
H4
N2O
CO
2e
Cat
egor
ylb
/day
lb/d
ay
Fug
itive
Dus
t0.
2386
0.00
000.
2386
0.02
580.
0000
0.02
580.
0000
0.00
00
Off-
Roa
d0.
2382
4.87
165.
8579
9.77
00e-
003
0.03
610.
0361
0.03
610.
0361
0.00
0099
9.52
0199
9.52
010.
3063
1,00
7.17
64
To
tal
0.23
824.
8716
5.85
799.
7700
e-00
30.
2386
0.03
610.
2747
0.02
580.
0361
0.06
180.
0000
999.
5201
999.
5201
0.30
631,
007.
176
4
Mit
igat
ed C
on
stru
ctio
n O
n-S
ite
Cal
EE
Mod
Ver
sion
: Cal
EE
Mod
.201
6.3.
1D
ate:
1/1
2/20
17 8
:54
AM
Pag
e 11
of 2
5
TR
ED
C H
otel
Pro
ject
- H
umbo
ldt C
ount
y, S
umm
er

3.3
Sit
e P
rep
arat
ion
- 2
017
RO
GN
Ox
CO
SO
2F
ugiti
veP
M10
Exh
aust
PM
10P
M10
Tot
alF
ugiti
veP
M2.
5E
xhau
stP
M2.
5P
M2.
5T
otal
Bio
- C
O2
NB
io-
CO
2T
otal
CO
2C
H4
N2O
CO
2e
Cat
egor
ylb
/day
lb/d
ay
Hau
ling
0.00
000.
0000
0.00
000.
0000
0.00
000.
0000
0.00
000.
0000
0.00
000.
0000
0.00
000.
0000
0.00
000.
0000
Ven
dor
0.00
000.
0000
0.00
000.
0000
0.00
000.
0000
0.00
000.
0000
0.00
000.
0000
0.00
000.
0000
0.00
000.
0000
Wor
ker
0.06
370.
0677
0.55
796.
6000
e-00
40.
0639
7.00
00e-
004
0.06
460.
0169
6.50
00e-
004
0.01
7664
.913
964
.913
95.
6400
e-00
365
.054
7
To
tal
0.06
370.
0677
0.55
796.
6000
e-00
40.
0639
7.00
00e-
004
0.06
460.
0169
6.50
00e-
004
0.01
7664
.913
964
.913
95.
6400
e-00
365
.054
7
Mit
igat
ed C
on
stru
ctio
n O
ff-S
ite
3.4
Gra
din
g -
201
7
RO
GN
Ox
CO
SO
2F
ugiti
veP
M10
Exh
aust
PM
10P
M10
Tot
alF
ugiti
veP
M2.
5E
xhau
stP
M2.
5P
M2.
5T
otal
Bio
- C
O2
NB
io-
CO
2T
otal
CO
2C
H4
N2O
CO
2e
Cat
egor
ylb
/day
lb/d
ay
Fug
itive
Dus
t0.
7528
0.00
000.
7528
0.41
380.
0000
0.41
380.
0000
0.00
00
Off-
Roa
d1.
2100
10.4
978
7.91
820.
0120
0.73
180.
7318
0.69
780.
6978
1,17
9.30
75
1,17
9.30
75
0.23
191,
185.
104
7
To
tal
1.21
0010
.497
87.
9182
0.01
200.
7528
0.73
181.
4845
0.41
380.
6978
1.11
151,
179.
307
51,
179.
307
50.
2319
1,18
5.10
47
Un
mit
igat
ed C
on
stru
ctio
n O
n-S
ite
Cal
EE
Mod
Ver
sion
: Cal
EE
Mod
.201
6.3.
1D
ate:
1/1
2/20
17 8
:54
AM
Pag
e 12
of 2
5
TR
ED
C H
otel
Pro
ject
- H
umbo
ldt C
ount
y, S
umm
er

3.4
Gra
din
g -
201
7
RO
GN
Ox
CO
SO
2F
ugiti
veP
M10
Exh
aust
PM
10P
M10
Tot
alF
ugiti
veP
M2.
5E
xhau
stP
M2.
5P
M2.
5T
otal
Bio
- C
O2
NB
io-
CO
2T
otal
CO
2C
H4
N2O
CO
2e
Cat
egor
ylb
/day
lb/d
ay
Hau
ling
0.00
000.
0000
0.00
000.
0000
0.00
000.
0000
0.00
000.
0000
0.00
000.
0000
0.00
000.
0000
0.00
000.
0000
Ven
dor
0.00
000.
0000
0.00
000.
0000
0.00
000.
0000
0.00
000.
0000
0.00
000.
0000
0.00
000.
0000
0.00
000.
0000
Wor
ker
0.12
730.
1354
1.11
581.
3100
e-00
30.
1277
1.40
00e-
003
0.12
910.
0339
1.30
00e-
003
0.03
5212
9.82
7712
9.82
770.
0113
130.
1095
To
tal
0.12
730.
1354
1.11
581.
3100
e-00
30.
1277
1.40
00e-
003
0.12
910.
0339
1.30
00e-
003
0.03
5212
9.82
7712
9.82
770.
0113
130.
1095
Un
mit
igat
ed C
on
stru
ctio
n O
ff-S
ite
RO
GN
Ox
CO
SO
2F
ugiti
veP
M10
Exh
aust
PM
10P
M10
Tot
alF
ugiti
veP
M2.
5E
xhau
stP
M2.
5P
M2.
5T
otal
Bio
- C
O2
NB
io-
CO
2T
otal
CO
2C
H4
N2O
CO
2e
Cat
egor
ylb
/day
lb/d
ay
Fug
itive
Dus
t0.
3387
0.00
000.
3387
0.18
620.
0000
0.18
620.
0000
0.00
00
Off-
Roa
d0.
2652
5.96
447.
9381
0.01
200.
0603
0.06
030.
0603
0.06
030.
0000
1,17
9.30
75
1,17
9.30
75
0.23
191,
185.
104
7
To
tal
0.26
525.
9644
7.93
810.
0120
0.33
870.
0603
0.39
900.
1862
0.06
030.
2465
0.00
001,
179.
307
51,
179.
307
50.
2319
1,18
5.10
47
Mit
igat
ed C
on
stru
ctio
n O
n-S
ite
Cal
EE
Mod
Ver
sion
: Cal
EE
Mod
.201
6.3.
1D
ate:
1/1
2/20
17 8
:54
AM
Pag
e 13
of 2
5
TR
ED
C H
otel
Pro
ject
- H
umbo
ldt C
ount
y, S
umm
er
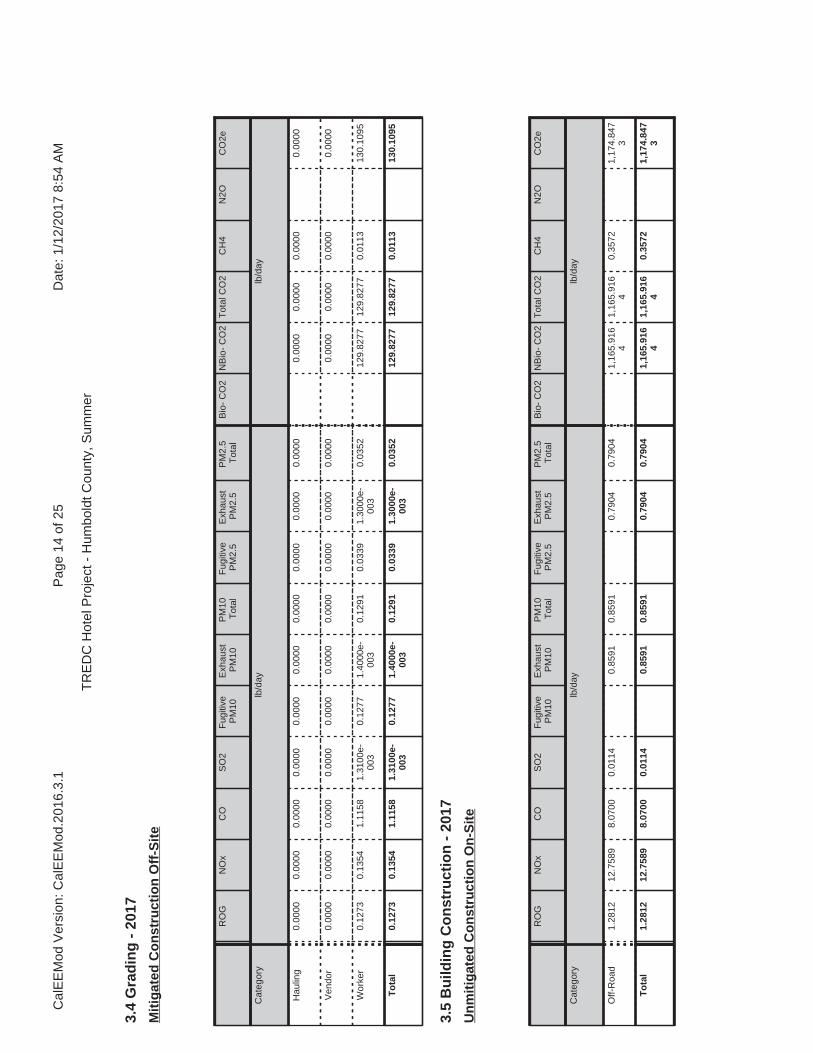
3.4
Gra
din
g -
201
7
RO
GN
Ox
CO
SO
2F
ugiti
veP
M10
Exh
aust
PM
10P
M10
Tot
alF
ugiti
veP
M2.
5E
xhau
stP
M2.
5P
M2.
5T
otal
Bio
- C
O2
NB
io-
CO
2T
otal
CO
2C
H4
N2O
CO
2e
Cat
egor
ylb
/day
lb/d
ay
Hau
ling
0.00
000.
0000
0.00
000.
0000
0.00
000.
0000
0.00
000.
0000
0.00
000.
0000
0.00
000.
0000
0.00
000.
0000
Ven
dor
0.00
000.
0000
0.00
000.
0000
0.00
000.
0000
0.00
000.
0000
0.00
000.
0000
0.00
000.
0000
0.00
000.
0000
Wor
ker
0.12
730.
1354
1.11
581.
3100
e-00
30.
1277
1.40
00e-
003
0.12
910.
0339
1.30
00e-
003
0.03
5212
9.82
7712
9.82
770.
0113
130.
1095
To
tal
0.12
730.
1354
1.11
581.
3100
e-00
30.
1277
1.40
00e-
003
0.12
910.
0339
1.30
00e-
003
0.03
5212
9.82
7712
9.82
770.
0113
130.
1095
Mit
igat
ed C
on
stru
ctio
n O
ff-S
ite
3.5
Bu
ildin
g C
on
stru
ctio
n -
201
7
RO
GN
Ox
CO
SO
2F
ugiti
veP
M10
Exh
aust
PM
10P
M10
Tot
alF
ugiti
veP
M2.
5E
xhau
stP
M2.
5P
M2.
5T
otal
Bio
- C
O2
NB
io-
CO
2T
otal
CO
2C
H4
N2O
CO
2e
Cat
egor
ylb
/day
lb/d
ay
Off-
Roa
d1.
2812
12.7
589
8.07
000.
0114
0.85
910.
8591
0.79
040.
7904
1,16
5.91
64
1,16
5.91
64
0.35
721,
174.
847
3
To
tal
1.28
1212
.758
98.
0700
0.01
140.
8591
0.85
910.
7904
0.79
041,
165.
916
41,
165.
916
40.
3572
1,17
4.84
73
Un
mit
igat
ed C
on
stru
ctio
n O
n-S
ite
Cal
EE
Mod
Ver
sion
: Cal
EE
Mod
.201
6.3.
1D
ate:
1/1
2/20
17 8
:54
AM
Pag
e 14
of 2
5
TR
ED
C H
otel
Pro
ject
- H
umbo
ldt C
ount
y, S
umm
er

3.5
Bu
ildin
g C
on
stru
ctio
n -
201
7
RO
GN
Ox
CO
SO
2F
ugiti
veP
M10
Exh
aust
PM
10P
M10
Tot
alF
ugiti
veP
M2.
5E
xhau
stP
M2.
5P
M2.
5T
otal
Bio
- C
O2
NB
io-
CO
2T
otal
CO
2C
H4
N2O
CO
2e
Cat
egor
ylb
/day
lb/d
ay
Hau
ling
0.00
000.
0000
0.00
000.
0000
0.00
000.
0000
0.00
000.
0000
0.00
000.
0000
0.00
000.
0000
0.00
000.
0000
Ven
dor
0.02
610.
4675
0.15
857.
9000
e-00
40.
0183
5.74
00e-
003
0.02
415.
2700
e-00
35.
5000
e-00
30.
0108
81.9
745
81.9
745
5.11
00e-
003
82.1
023
Wor
ker
0.08
910.
0948
0.78
119.
2000
e-00
40.
0894
9.80
00e-
004
0.09
040.
0237
9.10
00e-
004
0.02
4690
.879
490
.879
47.
8900
e-00
391
.076
6
To
tal
0.11
520.
5622
0.93
961.
7100
e-00
30.
1077
6.72
00e-
003
0.11
450.
0290
6.41
00e-
003
0.03
5417
2.85
3917
2.85
390.
0130
173.
1789
Un
mit
igat
ed C
on
stru
ctio
n O
ff-S
ite
RO
GN
Ox
CO
SO
2F
ugiti
veP
M10
Exh
aust
PM
10P
M10
Tot
alF
ugiti
veP
M2.
5E
xhau
stP
M2.
5P
M2.
5T
otal
Bio
- C
O2
NB
io-
CO
2T
otal
CO
2C
H4
N2O
CO
2e
Cat
egor
ylb
/day
lb/d
ay
Off-
Roa
d0.
2793
6.12
967.
9624
0.01
140.
0578
0.05
780.
0578
0.05
780.
0000
1,16
5.91
64
1,16
5.91
64
0.35
721,
174.
847
3
To
tal
0.27
936.
1296
7.96
240.
0114
0.05
780.
0578
0.05
780.
0578
0.00
001,
165.
916
41,
165.
916
40.
3572
1,17
4.84
73
Mit
igat
ed C
on
stru
ctio
n O
n-S
ite
Cal
EE
Mod
Ver
sion
: Cal
EE
Mod
.201
6.3.
1D
ate:
1/1
2/20
17 8
:54
AM
Pag
e 15
of 2
5
TR
ED
C H
otel
Pro
ject
- H
umbo
ldt C
ount
y, S
umm
er

3.5
Bu
ildin
g C
on
stru
ctio
n -
201
7
RO
GN
Ox
CO
SO
2F
ugiti
veP
M10
Exh
aust
PM
10P
M10
Tot
alF
ugiti
veP
M2.
5E
xhau
stP
M2.
5P
M2.
5T
otal
Bio
- C
O2
NB
io-
CO
2T
otal
CO
2C
H4
N2O
CO
2e
Cat
egor
ylb
/day
lb/d
ay
Hau
ling
0.00
000.
0000
0.00
000.
0000
0.00
000.
0000
0.00
000.
0000
0.00
000.
0000
0.00
000.
0000
0.00
000.
0000
Ven
dor
0.02
610.
4675
0.15
857.
9000
e-00
40.
0183
5.74
00e-
003
0.02
415.
2700
e-00
35.
5000
e-00
30.
0108
81.9
745
81.9
745
5.11
00e-
003
82.1
023
Wor
ker
0.08
910.
0948
0.78
119.
2000
e-00
40.
0894
9.80
00e-
004
0.09
040.
0237
9.10
00e-
004
0.02
4690
.879
490
.879
47.
8900
e-00
391
.076
6
To
tal
0.11
520.
5622
0.93
961.
7100
e-00
30.
1077
6.72
00e-
003
0.11
450.
0290
6.41
00e-
003
0.03
5417
2.85
3917
2.85
390.
0130
173.
1789
Mit
igat
ed C
on
stru
ctio
n O
ff-S
ite
3.6
Pav
ing
- 2
017
RO
GN
Ox
CO
SO
2F
ugiti
veP
M10
Exh
aust
PM
10P
M10
Tot
alF
ugiti
veP
M2.
5E
xhau
stP
M2.
5P
M2.
5T
otal
Bio
- C
O2
NB
io-
CO
2T
otal
CO
2C
H4
N2O
CO
2e
Cat
egor
ylb
/day
lb/d
ay
Off-
Roa
d1.
0532
9.97
547.
3425
0.01
130.
6087
0.60
870.
5636
0.56
361,
085.
107
11,
085.
107
10.
3018
1,09
2.65
15
Pav
ing
0.00
000.
0000
0.00
000.
0000
0.00
000.
0000
0.00
00
To
tal
1.05
329.
9754
7.34
250.
0113
0.60
870.
6087
0.56
360.
5636
1,08
5.10
71
1,08
5.10
71
0.30
181,
092.
651
5
Un
mit
igat
ed C
on
stru
ctio
n O
n-S
ite
Cal
EE
Mod
Ver
sion
: Cal
EE
Mod
.201
6.3.
1D
ate:
1/1
2/20
17 8
:54
AM
Pag
e 16
of 2
5
TR
ED
C H
otel
Pro
ject
- H
umbo
ldt C
ount
y, S
umm
er
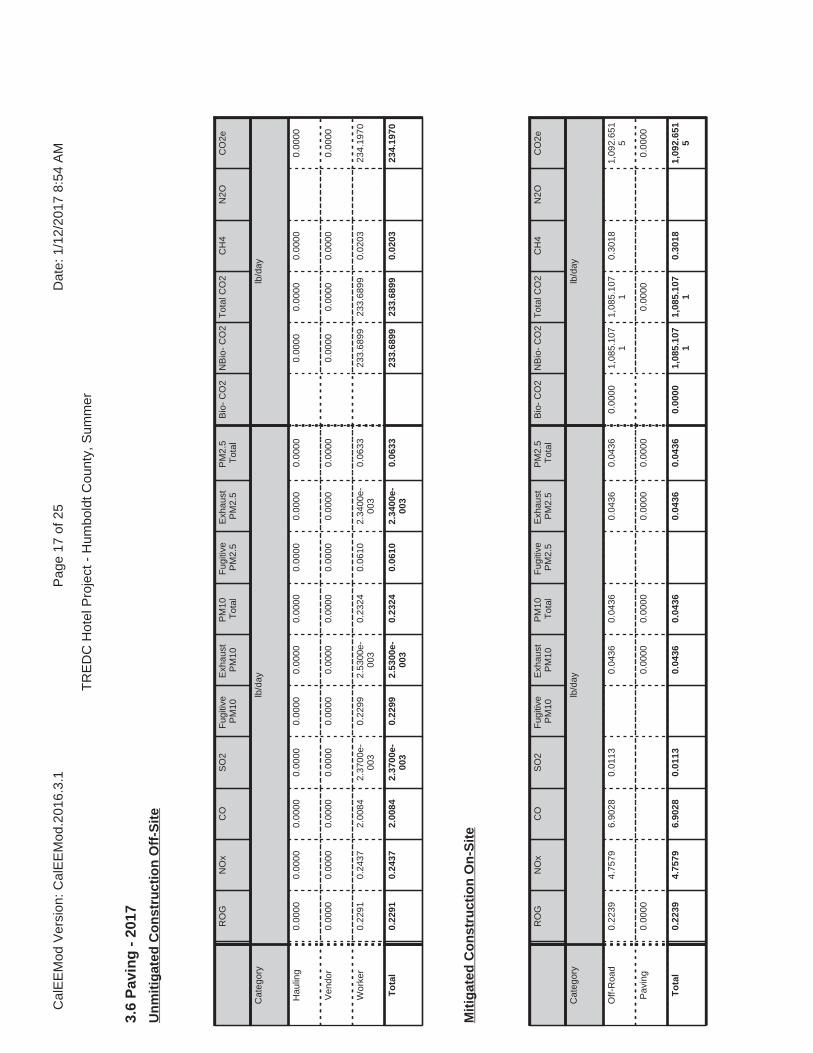
3.6
Pav
ing
- 2
017
RO
GN
Ox
CO
SO
2F
ugiti
veP
M10
Exh
aust
PM
10P
M10
Tot
alF
ugiti
veP
M2.
5E
xhau
stP
M2.
5P
M2.
5T
otal
Bio
- C
O2
NB
io-
CO
2T
otal
CO
2C
H4
N2O
CO
2e
Cat
egor
ylb
/day
lb/d
ay
Hau
ling
0.00
000.
0000
0.00
000.
0000
0.00
000.
0000
0.00
000.
0000
0.00
000.
0000
0.00
000.
0000
0.00
000.
0000
Ven
dor
0.00
000.
0000
0.00
000.
0000
0.00
000.
0000
0.00
000.
0000
0.00
000.
0000
0.00
000.
0000
0.00
000.
0000
Wor
ker
0.22
910.
2437
2.00
842.
3700
e-00
30.
2299
2.53
00e-
003
0.23
240.
0610
2.34
00e-
003
0.06
3323
3.68
9923
3.68
990.
0203
234.
1970
To
tal
0.22
910.
2437
2.00
842.
3700
e-00
30.
2299
2.53
00e-
003
0.23
240.
0610
2.34
00e-
003
0.06
3323
3.68
9923
3.68
990.
0203
234.
1970
Un
mit
igat
ed C
on
stru
ctio
n O
ff-S
ite
RO
GN
Ox
CO
SO
2F
ugiti
veP
M10
Exh
aust
PM
10P
M10
Tot
alF
ugiti
veP
M2.
5E
xhau
stP
M2.
5P
M2.
5T
otal
Bio
- C
O2
NB
io-
CO
2T
otal
CO
2C
H4
N2O
CO
2e
Cat
egor
ylb
/day
lb/d
ay
Off-
Roa
d0.
2239
4.75
796.
9028
0.01
130.
0436
0.04
360.
0436
0.04
360.
0000
1,08
5.10
71
1,08
5.10
71
0.30
181,
092.
651
5
Pav
ing
0.00
000.
0000
0.00
000.
0000
0.00
000.
0000
0.00
00
To
tal
0.22
394.
7579
6.90
280.
0113
0.04
360.
0436
0.04
360.
0436
0.00
001,
085.
107
11,
085.
107
10.
3018
1,09
2.65
15
Mit
igat
ed C
on
stru
ctio
n O
n-S
ite
Cal
EE
Mod
Ver
sion
: Cal
EE
Mod
.201
6.3.
1D
ate:
1/1
2/20
17 8
:54
AM
Pag
e 17
of 2
5
TR
ED
C H
otel
Pro
ject
- H
umbo
ldt C
ount
y, S
umm
er

3.6
Pav
ing
- 2
017
RO
GN
Ox
CO
SO
2F
ugiti
veP
M10
Exh
aust
PM
10P
M10
Tot
alF
ugiti
veP
M2.
5E
xhau
stP
M2.
5P
M2.
5T
otal
Bio
- C
O2
NB
io-
CO
2T
otal
CO
2C
H4
N2O
CO
2e
Cat
egor
ylb
/day
lb/d
ay
Hau
ling
0.00
000.
0000
0.00
000.
0000
0.00
000.
0000
0.00
000.
0000
0.00
000.
0000
0.00
000.
0000
0.00
000.
0000
Ven
dor
0.00
000.
0000
0.00
000.
0000
0.00
000.
0000
0.00
000.
0000
0.00
000.
0000
0.00
000.
0000
0.00
000.
0000
Wor
ker
0.22
910.
2437
2.00
842.
3700
e-00
30.
2299
2.53
00e-
003
0.23
240.
0610
2.34
00e-
003
0.06
3323
3.68
9923
3.68
990.
0203
234.
1970
To
tal
0.22
910.
2437
2.00
842.
3700
e-00
30.
2299
2.53
00e-
003
0.23
240.
0610
2.34
00e-
003
0.06
3323
3.68
9923
3.68
990.
0203
234.
1970
Mit
igat
ed C
on
stru
ctio
n O
ff-S
ite
3.7
Arc
hit
ectu
ral C
oat
ing
- 2
017
RO
GN
Ox
CO
SO
2F
ugiti
veP
M10
Exh
aust
PM
10P
M10
Tot
alF
ugiti
veP
M2.
5E
xhau
stP
M2.
5P
M2.
5T
otal
Bio
- C
O2
NB
io-
CO
2T
otal
CO
2C
H4
N2O
CO
2e
Cat
egor
ylb
/day
lb/d
ay
Arc
hit.
Coa
ting
80.7
602
0.00
000.
0000
0.00
000.
0000
0.00
000.
0000
Off-
Roa
d0.
3323
2.18
501.
8681
2.97
00e-
003
0.17
330.
1733
0.17
330.
1733
281.
4481
281.
4481
0.02
9728
2.19
09
To
tal
81.0
926
2.18
501.
8681
2.97
00e-
003
0.17
330.
1733
0.17
330.
1733
281.
4481
281.
4481
0.02
9728
2.19
09
Un
mit
igat
ed C
on
stru
ctio
n O
n-S
ite
Cal
EE
Mod
Ver
sion
: Cal
EE
Mod
.201
6.3.
1D
ate:
1/1
2/20
17 8
:54
AM
Pag
e 18
of 2
5
TR
ED
C H
otel
Pro
ject
- H
umbo
ldt C
ount
y, S
umm
er

3.7
Arc
hit
ectu
ral C
oat
ing
- 2
017
RO
GN
Ox
CO
SO
2F
ugiti
veP
M10
Exh
aust
PM
10P
M10
Tot
alF
ugiti
veP
M2.
5E
xhau
stP
M2.
5P
M2.
5T
otal
Bio
- C
O2
NB
io-
CO
2T
otal
CO
2C
H4
N2O
CO
2e
Cat
egor
ylb
/day
lb/d
ay
Hau
ling
0.00
000.
0000
0.00
000.
0000
0.00
000.
0000
0.00
000.
0000
0.00
000.
0000
0.00
000.
0000
0.00
000.
0000
Ven
dor
0.00
000.
0000
0.00
000.
0000
0.00
000.
0000
0.00
000.
0000
0.00
000.
0000
0.00
000.
0000
0.00
000.
0000
Wor
ker
0.01
270.
0135
0.11
161.
3000
e-00
40.
0128
1.40
00e-
004
0.01
293.
3900
e-00
31.
3000
e-00
43.
5200
e-00
312
.982
812
.982
81.
1300
e-00
313
.011
0
To
tal
0.01
270.
0135
0.11
161.
3000
e-00
40.
0128
1.40
00e-
004
0.01
293.
3900
e-00
31.
3000
e-00
43.
5200
e-00
312
.982
812
.982
81.
1300
e-00
313
.011
0
Un
mit
igat
ed C
on
stru
ctio
n O
ff-S
ite
RO
GN
Ox
CO
SO
2F
ugiti
veP
M10
Exh
aust
PM
10P
M10
Tot
alF
ugiti
veP
M2.
5E
xhau
stP
M2.
5P
M2.
5T
otal
Bio
- C
O2
NB
io-
CO
2T
otal
CO
2C
H4
N2O
CO
2e
Cat
egor
ylb
/day
lb/d
ay
Arc
hit.
Coa
ting
80.7
602
0.00
000.
0000
0.00
000.
0000
0.00
000.
0000
Off-
Roa
d0.
0594
1.35
701.
8324
2.97
00e-
003
0.01
430.
0143
0.01
430.
0143
0.00
0028
1.44
8128
1.44
810.
0297
282.
1909
To
tal
80.8
197
1.35
701.
8324
2.97
00e-
003
0.01
430.
0143
0.01
430.
0143
0.00
0028
1.44
8128
1.44
810.
0297
282.
1909
Mit
igat
ed C
on
stru
ctio
n O
n-S
ite
Cal
EE
Mod
Ver
sion
: Cal
EE
Mod
.201
6.3.
1D
ate:
1/1
2/20
17 8
:54
AM
Pag
e 19
of 2
5
TR
ED
C H
otel
Pro
ject
- H
umbo
ldt C
ount
y, S
umm
er
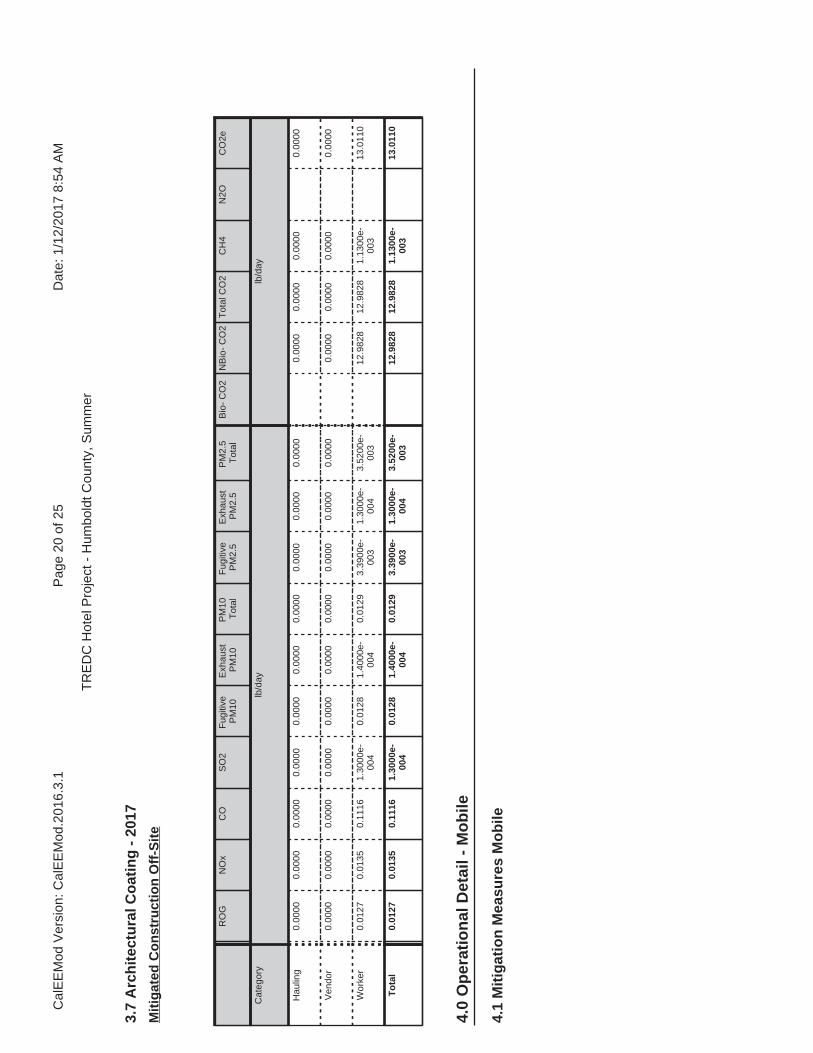
4.0
Op
erat
ion
al D
etai
l - M
ob
ile
4.1
Mit
igat
ion
Mea
sure
s M
ob
ile
3.7
Arc
hit
ectu
ral C
oat
ing
- 2
017
RO
GN
Ox
CO
SO
2F
ugiti
veP
M10
Exh
aust
PM
10P
M10
Tot
alF
ugiti
veP
M2.
5E
xhau
stP
M2.
5P
M2.
5T
otal
Bio
- C
O2
NB
io-
CO
2T
otal
CO
2C
H4
N2O
CO
2e
Cat
egor
ylb
/day
lb/d
ay
Hau
ling
0.00
000.
0000
0.00
000.
0000
0.00
000.
0000
0.00
000.
0000
0.00
000.
0000
0.00
000.
0000
0.00
000.
0000
Ven
dor
0.00
000.
0000
0.00
000.
0000
0.00
000.
0000
0.00
000.
0000
0.00
000.
0000
0.00
000.
0000
0.00
000.
0000
Wor
ker
0.01
270.
0135
0.11
161.
3000
e-00
40.
0128
1.40
00e-
004
0.01
293.
3900
e-00
31.
3000
e-00
43.
5200
e-00
312
.982
812
.982
81.
1300
e-00
313
.011
0
To
tal
0.01
270.
0135
0.11
161.
3000
e-00
40.
0128
1.40
00e-
004
0.01
293.
3900
e-00
31.
3000
e-00
43.
5200
e-00
312
.982
812
.982
81.
1300
e-00
313
.011
0
Mit
igat
ed C
on
stru
ctio
n O
ff-S
ite
Cal
EE
Mod
Ver
sion
: Cal
EE
Mod
.201
6.3.
1D
ate:
1/1
2/20
17 8
:54
AM
Pag
e 20
of 2
5
TR
ED
C H
otel
Pro
ject
- H
umbo
ldt C
ount
y, S
umm
er

RO
GN
Ox
CO
SO
2F
ugiti
veP
M10
Exh
aust
PM
10P
M10
Tot
alF
ugiti
veP
M2.
5E
xhau
stP
M2.
5P
M2.
5T
otal
Bio
- C
O2
NB
io-
CO
2T
otal
CO
2C
H4
N2O
CO
2e
Cat
egor
ylb
/day
lb/d
ay
Miti
gate
d2.
7193
17.5
289
41.8
999
0.09
327.
1760
0.17
237.
3483
1.91
710.
1632
2.08
039,
386.
060
09,
386.
060
00.
5076
9,39
8.74
94
Unm
itiga
ted
2.71
9317
.528
941
.899
90.
0932
7.17
600.
1723
7.34
831.
9171
0.16
322.
0803
9,38
6.06
00
9,38
6.06
00
0.50
769,
398.
749
4
4.2
Tri
p S
um
mar
y In
form
atio
n
4.3
Tri
p T
ype
Info
rmat
ion
Ave
rage
Dai
ly T
rip R
ate
Unm
itiga
ted
Miti
gate
d
Land
Use
Wee
kday
Sat
urda
yS
unda
yA
nnua
l VM
TA
nnua
l VM
T
Hot
el57
2.00
573.
0041
7.00
3,24
4,04
13,
244,
041
Tot
al57
2.00
573.
0041
7.00
3,24
4,04
13,
244,
041
Mile
sT
rip %
Trip
Pur
pose
%
Land
Use
H-W
or
C-W
H-S
or
C-C
H-O
or
C-N
WH
-W o
r C
-WH
-S o
r C
-CH
-O o
r C
-NW
Prim
ary
Div
erte
dP
ass-
by
Hot
el24
.00
24.0
024
.00
19.4
061
.60
19.0
058
384
5.0
En
erg
y D
etai
l
4.4
Fle
et M
ix
Land
Use
LD
ALD
T1
LDT
2M
DV
LHD
1LH
D2
MH
DH
HD
OB
US
UB
US
MC
YS
BU
SM
H
Hot
el0.
5551
970.
0272
520.
2172
440.
1142
640.
0102
530.
0027
870.
0126
510.
0494
270.
0045
140.
0007
980.
0039
170.
0013
380.
0003
57
His
toric
al E
nerg
y U
se: N
Cal
EE
Mod
Ver
sion
: Cal
EE
Mod
.201
6.3.
1D
ate:
1/1
2/20
17 8
:54
AM
Pag
e 21
of 2
5
TR
ED
C H
otel
Pro
ject
- H
umbo
ldt C
ount
y, S
umm
er
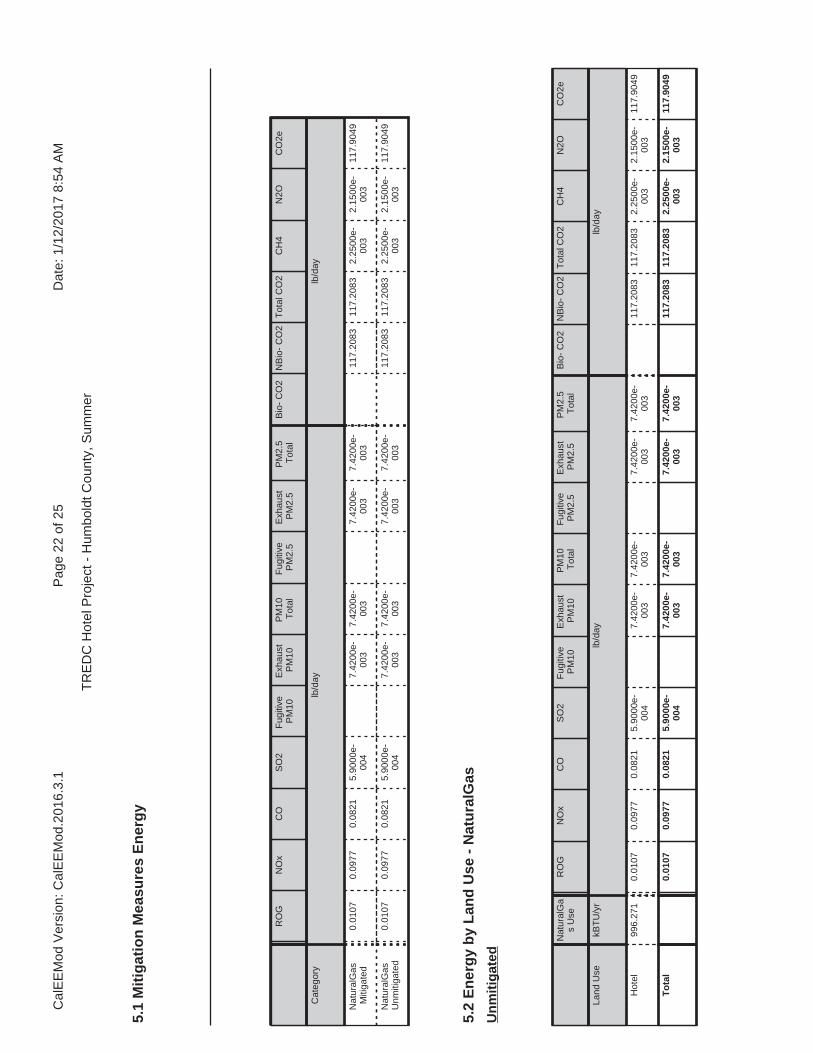
RO
GN
Ox
CO
SO
2F
ugiti
veP
M10
Exh
aust
PM
10P
M10
Tot
alF
ugiti
veP
M2.
5E
xhau
stP
M2.
5P
M2.
5T
otal
Bio
- C
O2
NB
io-
CO
2T
otal
CO
2C
H4
N2O
CO
2e
Cat
egor
ylb
/day
lb/d
ay
Nat
ural
Gas
Miti
gate
d0.
0107
0.09
770.
0821
5.90
00e-
004
7.42
00e-
003
7.42
00e-
003
7.42
00e-
003
7.42
00e-
003
117.
2083
117.
2083
2.25
00e-
003
2.15
00e-
003
117.
9049
Nat
ural
Gas
Unm
itiga
ted
0.01
070.
0977
0.08
215.
9000
e-00
47.
4200
e-00
37.
4200
e-00
37.
4200
e-00
37.
4200
e-00
311
7.20
8311
7.20
832.
2500
e-00
32.
1500
e-00
311
7.90
49
5.2
En
erg
y b
y L
and
Use
- N
atu
ralG
as
Nat
ural
Ga
s U
seR
OG
NO
xC
OS
O2
Fug
itive
PM
10E
xhau
stP
M10
PM
10T
otal
Fug
itive
PM
2.5
Exh
aust
PM
2.5
PM
2.5
Tot
alB
io-
CO
2N
Bio
- C
O2
Tot
al C
O2
CH
4N
2OC
O2e
Land
Use
kBT
U/y
rlb
/day
lb/d
ay
Hot
el99
6.27
10.
0107
0.09
770.
0821
5.90
00e-
004
7.42
00e-
003
7.42
00e-
003
7.42
00e-
003
7.42
00e-
003
117.
2083
117.
2083
2.25
00e-
003
2.15
00e-
003
117.
9049
To
tal
0.01
070.
0977
0.08
215.
9000
e-00
47.
4200
e-00
37.
4200
e-00
37.
4200
e-00
37.
4200
e-00
311
7.20
8311
7.20
832.
2500
e-00
32.
1500
e-00
311
7.90
49
Un
mit
igat
ed
5.1
Mit
igat
ion
Mea
sure
s E
ner
gy
Cal
EE
Mod
Ver
sion
: Cal
EE
Mod
.201
6.3.
1D
ate:
1/1
2/20
17 8
:54
AM
Pag
e 22
of 2
5
TR
ED
C H
otel
Pro
ject
- H
umbo
ldt C
ount
y, S
umm
er

6.1
Mit
igat
ion
Mea
sure
s A
rea
6.0
Are
a D
etai
l
RO
GN
Ox
CO
SO
2F
ugiti
veP
M10
Exh
aust
PM
10P
M10
Tot
alF
ugiti
veP
M2.
5E
xhau
stP
M2.
5P
M2.
5T
otal
Bio
- C
O2
NB
io-
CO
2T
otal
CO
2C
H4
N2O
CO
2e
Cat
egor
ylb
/day
lb/d
ay
Miti
gate
d0.
4844
9.00
00e-
005
0.01
010.
0000
4.00
00e-
005
4.00
00e-
005
4.00
00e-
005
4.00
00e-
005
0.02
190.
0219
6.00
00e-
005
0.02
33
Unm
itiga
ted
0.48
449.
0000
e-00
50.
0101
0.00
004.
0000
e-00
54.
0000
e-00
54.
0000
e-00
54.
0000
e-00
50.
0219
0.02
196.
0000
e-00
50.
0233
5.2
En
erg
y b
y L
and
Use
- N
atu
ralG
as
Nat
ural
Ga
s U
seR
OG
NO
xC
OS
O2
Fug
itive
PM
10E
xhau
stP
M10
PM
10T
otal
Fug
itive
PM
2.5
Exh
aust
PM
2.5
PM
2.5
Tot
alB
io-
CO
2N
Bio
- C
O2
Tot
al C
O2
CH
4N
2OC
O2e
Land
Use
kBT
U/y
rlb
/day
lb/d
ay
Hot
el0.
9962
710.
0107
0.09
770.
0821
5.90
00e-
004
7.42
00e-
003
7.42
00e-
003
7.42
00e-
003
7.42
00e-
003
117.
2083
117.
2083
2.25
00e-
003
2.15
00e-
003
117.
9049
To
tal
0.01
070.
0977
0.08
215.
9000
e-00
47.
4200
e-00
37.
4200
e-00
37.
4200
e-00
37.
4200
e-00
311
7.20
8311
7.20
832.
2500
e-00
32.
1500
e-00
311
7.90
49
Mit
igat
ed
Cal
EE
Mod
Ver
sion
: Cal
EE
Mod
.201
6.3.
1D
ate:
1/1
2/20
17 8
:54
AM
Pag
e 23
of 2
5
TR
ED
C H
otel
Pro
ject
- H
umbo
ldt C
ount
y, S
umm
er

7.0
Wat
er D
etai
l
6.2
Are
a b
y S
ub
Cat
ego
ry
RO
GN
Ox
CO
SO
2F
ugiti
veP
M10
Exh
aust
PM
10P
M10
Tot
alF
ugiti
veP
M2.
5E
xhau
stP
M2.
5P
M2.
5T
otal
Bio
- C
O2
NB
io-
CO
2T
otal
CO
2C
H4
N2O
CO
2e
Sub
Cat
egor
ylb
/day
lb/d
ay
Arc
hite
ctur
alC
oatin
g0.
1106
0.00
000.
0000
0.00
000.
0000
0.00
000.
0000
Con
sum
erP
rodu
cts
0.37
290.
0000
0.00
000.
0000
0.00
000.
0000
0.00
00
Land
scap
ing
9.30
00e-
004
9.00
00e-
005
0.01
010.
0000
4.00
00e-
005
4.00
00e-
005
4.00
00e-
005
4.00
00e-
005
0.02
190.
0219
6.00
00e-
005
0.02
33
To
tal
0.48
449.
0000
e-00
50.
0101
0.00
004.
0000
e-00
54.
0000
e-00
54.
0000
e-00
54.
0000
e-00
50.
0219
0.02
196.
0000
e-00
50.
0233
Un
mit
igat
ed
RO
GN
Ox
CO
SO
2F
ugiti
veP
M10
Exh
aust
PM
10P
M10
Tot
alF
ugiti
veP
M2.
5E
xhau
stP
M2.
5P
M2.
5T
otal
Bio
- C
O2
NB
io-
CO
2T
otal
CO
2C
H4
N2O
CO
2e
Sub
Cat
egor
ylb
/day
lb/d
ay
Arc
hite
ctur
alC
oatin
g0.
1106
0.00
000.
0000
0.00
000.
0000
0.00
000.
0000
Con
sum
erP
rodu
cts
0.37
290.
0000
0.00
000.
0000
0.00
000.
0000
0.00
00
Land
scap
ing
9.30
00e-
004
9.00
00e-
005
0.01
010.
0000
4.00
00e-
005
4.00
00e-
005
4.00
00e-
005
4.00
00e-
005
0.02
190.
0219
6.00
00e-
005
0.02
33
To
tal
0.48
449.
0000
e-00
50.
0101
0.00
004.
0000
e-00
54.
0000
e-00
54.
0000
e-00
54.
0000
e-00
50.
0219
0.02
196.
0000
e-00
50.
0233
Mit
igat
ed
Cal
EE
Mod
Ver
sion
: Cal
EE
Mod
.201
6.3.
1D
ate:
1/1
2/20
17 8
:54
AM
Pag
e 24
of 2
5
TR
ED
C H
otel
Pro
ject
- H
umbo
ldt C
ount
y, S
umm
er

8.1
Mit
igat
ion
Mea
sure
s W
aste
Inst
all L
ow F
low
Bat
hroo
m F
auce
t
Inst
all L
ow F
low
Kitc
hen
Fau
cet
Inst
all L
ow F
low
Toi
let
Inst
all L
ow F
low
Sho
wer
7.1
Mit
igat
ion
Mea
sure
s W
ater
8.0
Was
te D
etai
l
11.0
Veg
etat
ion
9.0
Op
erat
ion
al O
ffro
ad
Equ
ipm
ent T
ype
Num
ber
Hou
rs/D
ayD
ays/
Yea
rH
orse
Pow
erLo
ad F
acto
rF
uel T
ype
10.0
Sta
tio
nar
y E
qu
ipm
ent
Fir
e P
um
ps
and
Em
erg
ency
Gen
erat
ors
Equ
ipm
ent T
ype
Num
ber
Hou
rs/D
ayH
ours
/Yea
rH
orse
Pow
erLo
ad F
acto
rF
uel T
ype
Bo
ilers
Equ
ipm
ent T
ype
Num
ber
Hea
t Inp
ut/D
ayH
eat I
nput
/Yea
rB
oile
r R
atin
gF
uel T
ype
Use
r D
efin
ed E
qu
ipm
ent
Equ
ipm
ent T
ype
Num
ber
Cal
EE
Mod
Ver
sion
: Cal
EE
Mod
.201
6.3.
1D
ate:
1/1
2/20
17 8
:54
AM
Pag
e 25
of 2
5
TR
ED
C H
otel
Pro
ject
- H
umbo
ldt C
ount
y, S
umm
er
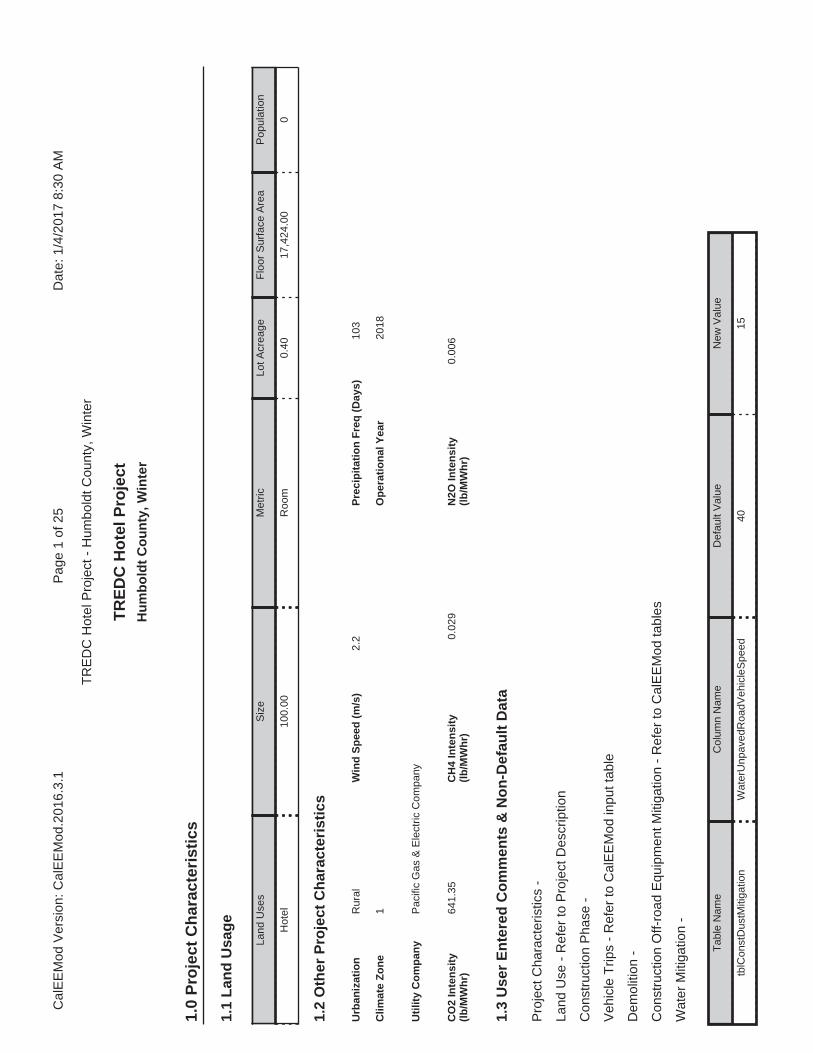
Pro
ject
Cha
ract
eris
tics
-
Land
Use
- R
efer
to P
roje
ct D
escr
iptio
n
Con
stru
ctio
n P
hase
-
Veh
icle
Trip
s -
Ref
er to
Cal
EE
Mod
inpu
t tab
le
Dem
oliti
on -
Con
stru
ctio
n O
ff-ro
ad E
quip
men
t Miti
gatio
n -
Ref
er to
Cal
EE
Mod
tabl
es
Wat
er M
itiga
tion
-
1.1
Lan
d U
sag
e
Land
Use
sS
ize
Met
ricLo
t Acr
eage
Flo
or S
urfa
ce A
rea
Pop
ulat
ion
Hot
el10
0.00
Roo
m0.
4017
,424
.00
0
1.2
Oth
er P
roje
ct C
har
acte
rist
ics
Urb
aniz
atio
n
Clim
ate
Zo
ne
Rur
al
1
Win
d S
pee
d (
m/s
)P
reci
pit
atio
n F
req
(D
ays)
2.2
103
1.3
Use
r E
nte
red
Co
mm
ents
& N
on
-Def
ault
Dat
a
1.0
Pro
ject
Ch
arac
teri
stic
s
Uti
lity
Co
mp
any
Pac
ific
Gas
& E
lect
ric C
ompa
ny
2018
Op
erat
ion
al Y
ear
CO
2 In
ten
sity
(l
b/M
Wh
r)64
1.35
0.02
9C
H4
Inte
nsi
ty
(lb
/MW
hr)
0.00
6N
2O In
ten
sity
(l
b/M
Wh
r)
Tab
le N
ame
Col
umn
Nam
eD
efau
lt V
alue
New
Val
ue
tblC
onst
Dus
tMiti
gatio
nW
ater
Unp
aved
Roa
dVeh
icle
Spe
ed40
15
TR
ED
C H
ote
l Pro
ject
Hu
mb
old
t C
ou
nty
, Win
ter
Cal
EE
Mod
Ver
sion
: Cal
EE
Mod
.201
6.3.
1D
ate:
1/4
/201
7 8:
30 A
MP
age
1 of
25
TR
ED
C H
otel
Pro
ject
- H
umbo
ldt C
ount
y, W
inte
r

tblC
onst
Equ
ipM
itiga
tion
DP
FN
o C
hang
eLe
vel 3
tblC
onst
Equ
ipM
itiga
tion
DP
FN
o C
hang
eLe
vel 3
tblC
onst
Equ
ipM
itiga
tion
DP
FN
o C
hang
eLe
vel 3
tblC
onst
Equ
ipM
itiga
tion
DP
FN
o C
hang
eLe
vel 3
tblC
onst
Equ
ipM
itiga
tion
DP
FN
o C
hang
eLe
vel 3
tblC
onst
Equ
ipM
itiga
tion
DP
FN
o C
hang
eLe
vel 3
tblC
onst
Equ
ipM
itiga
tion
DP
FN
o C
hang
eLe
vel 3
tblC
onst
Equ
ipM
itiga
tion
DP
FN
o C
hang
eLe
vel 3
tblC
onst
Equ
ipM
itiga
tion
DP
FN
o C
hang
eLe
vel 3
tblC
onst
Equ
ipM
itiga
tion
DP
FN
o C
hang
eLe
vel 3
tblC
onst
Equ
ipM
itiga
tion
Num
berO
fEqu
ipm
entM
itiga
ted
0.00
1.00
tblC
onst
Equ
ipM
itiga
tion
Num
berO
fEqu
ipm
entM
itiga
ted
0.00
4.00
tblC
onst
Equ
ipM
itiga
tion
Num
berO
fEqu
ipm
entM
itiga
ted
0.00
2.00
tblC
onst
Equ
ipM
itiga
tion
Num
berO
fEqu
ipm
entM
itiga
ted
0.00
1.00
tblC
onst
Equ
ipM
itiga
tion
Num
berO
fEqu
ipm
entM
itiga
ted
0.00
2.00
tblC
onst
Equ
ipM
itiga
tion
Num
berO
fEqu
ipm
entM
itiga
ted
0.00
1.00
tblC
onst
Equ
ipM
itiga
tion
Num
berO
fEqu
ipm
entM
itiga
ted
0.00
1.00
tblC
onst
Equ
ipM
itiga
tion
Num
berO
fEqu
ipm
entM
itiga
ted
0.00
1.00
tblC
onst
Equ
ipM
itiga
tion
Num
berO
fEqu
ipm
entM
itiga
ted
0.00
2.00
tblC
onst
Equ
ipM
itiga
tion
Num
berO
fEqu
ipm
entM
itiga
ted
0.00
8.00
tblC
onst
Equ
ipM
itiga
tion
Tie
rN
o C
hang
eT
ier
3
tblC
onst
Equ
ipM
itiga
tion
Tie
rN
o C
hang
eT
ier
3
tblC
onst
Equ
ipM
itiga
tion
Tie
rN
o C
hang
eT
ier
3
tblC
onst
Equ
ipM
itiga
tion
Tie
rN
o C
hang
eT
ier
3
tblC
onst
Equ
ipM
itiga
tion
Tie
rN
o C
hang
eT
ier
3
tblC
onst
Equ
ipM
itiga
tion
Tie
rN
o C
hang
eT
ier
3
tblC
onst
Equ
ipM
itiga
tion
Tie
rN
o C
hang
eT
ier
3
Cal
EE
Mod
Ver
sion
: Cal
EE
Mod
.201
6.3.
1D
ate:
1/4
/201
7 8:
30 A
MP
age
2 of
25
TR
ED
C H
otel
Pro
ject
- H
umbo
ldt C
ount
y, W
inte
r
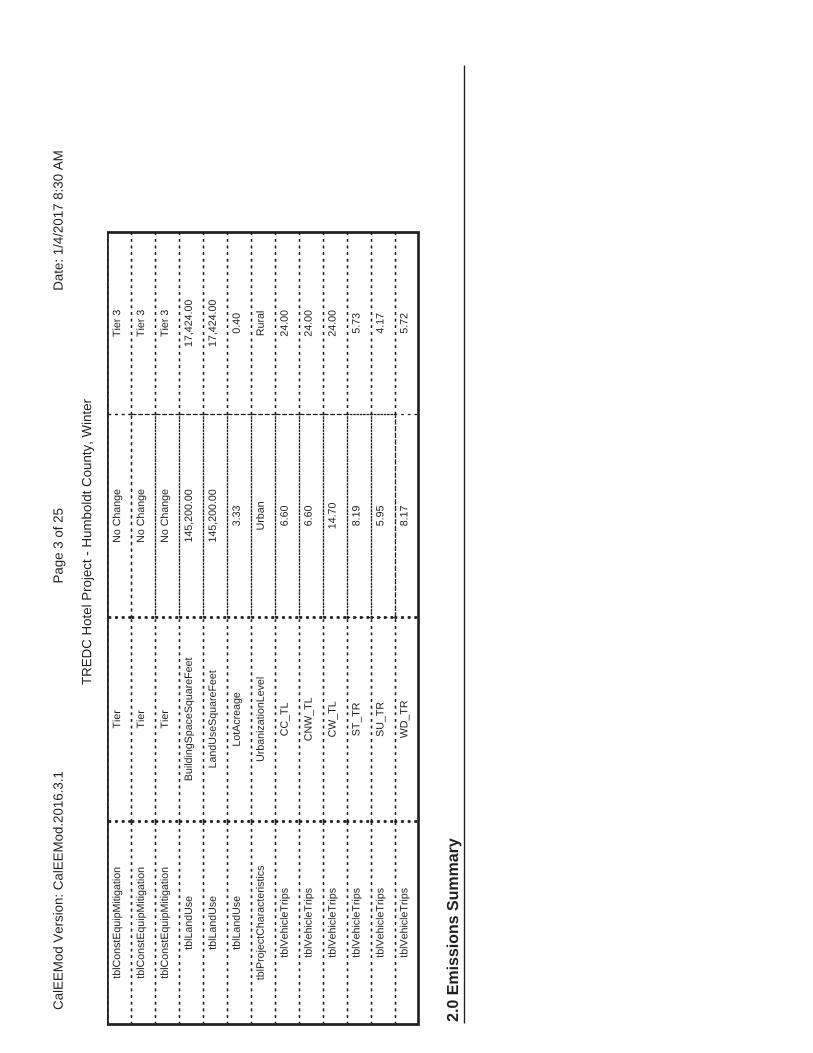
2.0
Em
issi
on
s S
um
mar
y
tblC
onst
Equ
ipM
itiga
tion
Tie
rN
o C
hang
eT
ier
3
tblC
onst
Equ
ipM
itiga
tion
Tie
rN
o C
hang
eT
ier
3
tblC
onst
Equ
ipM
itiga
tion
Tie
rN
o C
hang
eT
ier
3
tblL
andU
seB
uild
ingS
pace
Squ
areF
eet
145,
200.
0017
,424
.00
tblL
andU
seLa
ndU
seS
quar
eFee
t14
5,20
0.00
17,4
24.0
0
tblL
andU
seLo
tAcr
eage
3.33
0.40
tblP
roje
ctC
hara
cter
istic
sU
rban
izat
ionL
evel
Urb
anR
ural
tblV
ehic
leT
rips
CC
_TL
6.60
24.0
0
tblV
ehic
leT
rips
CN
W_T
L6.
6024
.00
tblV
ehic
leT
rips
CW
_TL
14.7
024
.00
tblV
ehic
leT
rips
ST
_TR
8.19
5.73
tblV
ehic
leT
rips
SU
_TR
5.95
4.17
tblV
ehic
leT
rips
WD
_TR
8.17
5.72
Cal
EE
Mod
Ver
sion
: Cal
EE
Mod
.201
6.3.
1D
ate:
1/4
/201
7 8:
30 A
MP
age
3 of
25
TR
ED
C H
otel
Pro
ject
- H
umbo
ldt C
ount
y, W
inte
r
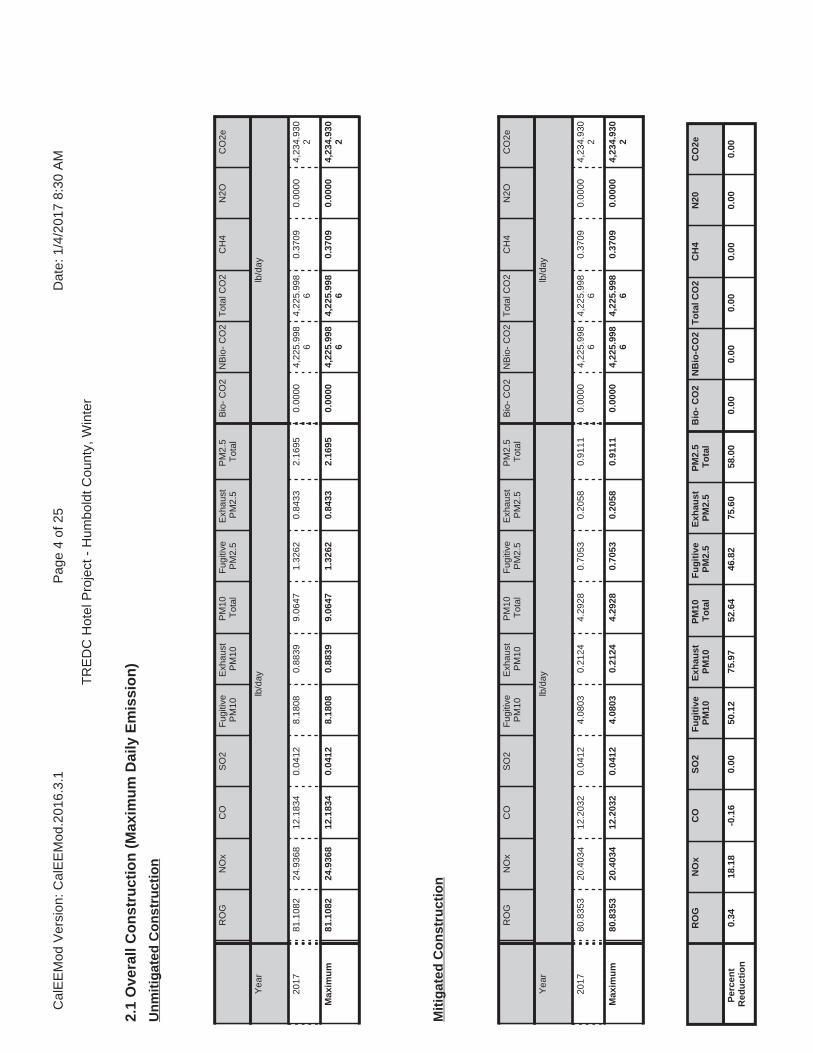
2.1
Ove
rall
Co
nst
ruct
ion
(M
axim
um
Dai
ly E
mis
sio
n)
RO
GN
Ox
CO
SO
2F
ugiti
veP
M10
Exh
aust
PM
10P
M10
Tot
alF
ugiti
veP
M2.
5E
xhau
stP
M2.
5P
M2.
5T
otal
Bio
- C
O2
NB
io-
CO
2T
otal
CO
2C
H4
N2O
CO
2e
Yea
rlb
/day
lb/d
ay
2017
81.1
082
24.9
368
12.1
834
0.04
128.
1808
0.88
399.
0647
1.32
620.
8433
2.16
950.
0000
4,22
5.99
86
4,22
5.99
86
0.37
090.
0000
4,23
4.93
02
Max
imu
m81
.108
224
.936
812
.183
40.
0412
8.18
080.
8839
9.06
471.
3262
0.84
332.
1695
0.00
004,
225.
998
64,
225.
998
60.
3709
0.00
004,
234.
930
2
Un
mit
igat
ed C
on
stru
ctio
n
RO
GN
Ox
CO
SO
2F
ugiti
veP
M10
Exh
aust
PM
10P
M10
Tot
alF
ugiti
veP
M2.
5E
xhau
stP
M2.
5P
M2.
5T
otal
Bio
- C
O2
NB
io-
CO
2T
otal
CO
2C
H4
N2O
CO
2e
Yea
rlb
/day
lb/d
ay
2017
80.8
353
20.4
034
12.2
032
0.04
124.
0803
0.21
244.
2928
0.70
530.
2058
0.91
110.
0000
4,22
5.99
86
4,22
5.99
86
0.37
090.
0000
4,23
4.93
02
Max
imu
m80
.835
320
.403
412
.203
20.
0412
4.08
030.
2124
4.29
280.
7053
0.20
580.
9111
0.00
004,
225.
998
64,
225.
998
60.
3709
0.00
004,
234.
930
2
Mit
igat
ed C
on
stru
ctio
n
RO
GN
Ox
CO
SO
2F
ug
itiv
eP
M10
Exh
aust
PM
10P
M10
To
tal
Fu
git
ive
PM
2.5
Exh
aust
PM
2.5
PM
2.5
To
tal
Bio
- C
O2
NB
io-C
O2
To
tal C
O2
CH
4N
20C
O2e
Per
cen
tR
edu
ctio
n0.
3418
.18
-0.1
60.
0050
.12
75.9
752
.64
46.8
275
.60
58.0
00.
000.
000.
000.
000.
000.
00
Cal
EE
Mod
Ver
sion
: Cal
EE
Mod
.201
6.3.
1D
ate:
1/4
/201
7 8:
30 A
MP
age
4 of
25
TR
ED
C H
otel
Pro
ject
- H
umbo
ldt C
ount
y, W
inte
r
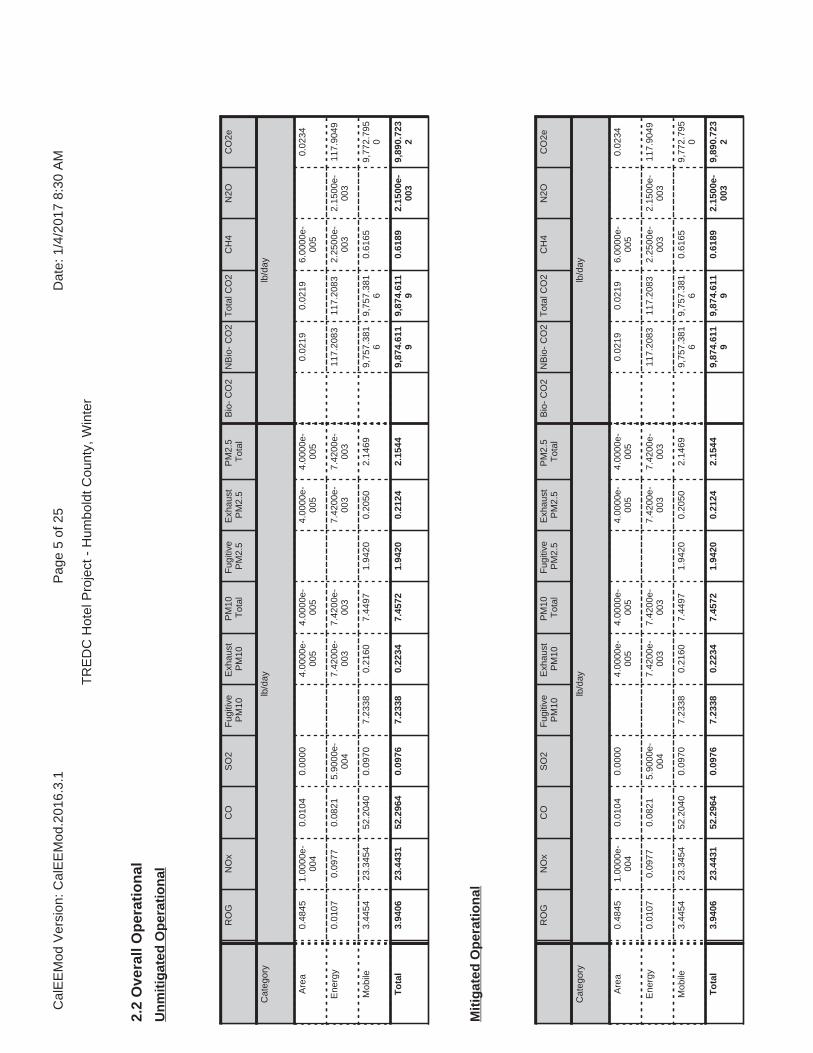
2.2
Ove
rall
Op
erat
ion
al
RO
GN
Ox
CO
SO
2F
ugiti
veP
M10
Exh
aust
PM
10P
M10
Tot
alF
ugiti
veP
M2.
5E
xhau
stP
M2.
5P
M2.
5T
otal
Bio
- C
O2
NB
io-
CO
2T
otal
CO
2C
H4
N2O
CO
2e
Cat
egor
ylb
/day
lb/d
ay
Are
a0.
4845
1.00
00e-
004
0.01
040.
0000
4.00
00e-
005
4.00
00e-
005
4.00
00e-
005
4.00
00e-
005
0.02
190.
0219
6.00
00e-
005
0.02
34
Ene
rgy
0.01
070.
0977
0.08
215.
9000
e-00
47.
4200
e-00
37.
4200
e-00
37.
4200
e-00
37.
4200
e-00
311
7.20
8311
7.20
832.
2500
e-00
32.
1500
e-00
311
7.90
49
Mob
ile3.
4454
23.3
454
52.2
040
0.09
707.
2338
0.21
607.
4497
1.94
200.
2050
2.14
699,
757.
381
69,
757.
381
60.
6165
9,77
2.79
50
To
tal
3.94
0623
.443
152
.296
40.
0976
7.23
380.
2234
7.45
721.
9420
0.21
242.
1544
9,87
4.61
19
9,87
4.61
19
0.61
892.
1500
e-00
39,
890.
723
2
Un
mit
igat
ed O
per
atio
nal
RO
GN
Ox
CO
SO
2F
ugiti
veP
M10
Exh
aust
PM
10P
M10
Tot
alF
ugiti
veP
M2.
5E
xhau
stP
M2.
5P
M2.
5T
otal
Bio
- C
O2
NB
io-
CO
2T
otal
CO
2C
H4
N2O
CO
2e
Cat
egor
ylb
/day
lb/d
ay
Are
a0.
4845
1.00
00e-
004
0.01
040.
0000
4.00
00e-
005
4.00
00e-
005
4.00
00e-
005
4.00
00e-
005
0.02
190.
0219
6.00
00e-
005
0.02
34
Ene
rgy
0.01
070.
0977
0.08
215.
9000
e-00
47.
4200
e-00
37.
4200
e-00
37.
4200
e-00
37.
4200
e-00
311
7.20
8311
7.20
832.
2500
e-00
32.
1500
e-00
311
7.90
49
Mob
ile3.
4454
23.3
454
52.2
040
0.09
707.
2338
0.21
607.
4497
1.94
200.
2050
2.14
699,
757.
381
69,
757.
381
60.
6165
9,77
2.79
50
To
tal
3.94
0623
.443
152
.296
40.
0976
7.23
380.
2234
7.45
721.
9420
0.21
242.
1544
9,87
4.61
19
9,87
4.61
19
0.61
892.
1500
e-00
39,
890.
723
2
Mit
igat
ed O
per
atio
nal
Cal
EE
Mod
Ver
sion
: Cal
EE
Mod
.201
6.3.
1D
ate:
1/4
/201
7 8:
30 A
MP
age
5 of
25
TR
ED
C H
otel
Pro
ject
- H
umbo
ldt C
ount
y, W
inte
r

3.0
Co
nst
ruct
ion
Det
ail
Co
nst
ruct
ion
Ph
ase
Pha
seN
umbe
rP
hase
Nam
eP
hase
Typ
eS
tart
Dat
eE
nd D
ate
Num
Day
s W
eek
Num
Day
sP
hase
Des
crip
tion
1D
emol
ition
Dem
oliti
on6/
1/20
176/
14/2
017
510
2S
ite P
repa
ratio
nS
ite P
repa
ratio
n6/
15/2
017
6/15
/201
75
1
3G
radi
ngG
radi
ng6/
16/2
017
6/19
/201
75
2
4B
uild
ing
Con
stru
ctio
nB
uild
ing
Con
stru
ctio
n6/
20/2
017
11/6
/201
75
100
5A
rchi
tect
ural
Coa
ting
Arc
hite
ctur
al C
oatin
g11
/14/
2017
11/2
0/20
175
5
6P
avin
gP
avin
g11
/7/2
017
11/1
3/20
175
5
Off
Ro
ad E
qu
ipm
ent
RO
GN
Ox
CO
SO
2F
ug
itiv
eP
M10
Exh
aust
PM
10P
M10
To
tal
Fu
git
ive
PM
2.5
Exh
aust
PM
2.5
PM
2.5
To
tal
Bio
- C
O2
NB
io-C
O2
To
tal C
O2
CH
4N
20C
O2e
Per
cen
tR
edu
ctio
n0.
000.
000.
000.
000.
000.
000.
000.
000.
000.
000.
000.
000.
000.
000.
000.
00
Res
iden
tial
Ind
oo
r: 0
; R
esid
enti
al O
utd
oo
r: 0
; N
on
-Res
iden
tial
Ind
oo
r: 2
6,13
6; N
on
-Res
iden
tial
Ou
tdo
or:
8,7
12;
Str
iped
Par
kin
g A
rea:
0
(Arc
hit
ectu
ral C
oat
ing
– s
qft
)
Acr
es o
f G
rad
ing
(S
ite
Pre
par
atio
n P
has
e):
0.5
Acr
es o
f G
rad
ing
(G
rad
ing
Ph
ase)
: 0
Acr
es o
f P
avin
g:
0
Cal
EE
Mod
Ver
sion
: Cal
EE
Mod
.201
6.3.
1D
ate:
1/4
/201
7 8:
30 A
MP
age
6 of
25
TR
ED
C H
otel
Pro
ject
- H
umbo
ldt C
ount
y, W
inte
r

Pha
se N
ame
Offr
oad
Equ
ipm
ent T
ype
Am
ount
Usa
ge H
ours
Hor
se P
ower
Load
Fac
tor
Dem
oliti
onC
oncr
ete/
Indu
stria
l Saw
s1
8.00
810.
73
Dem
oliti
onR
ubbe
r T
ired
Doz
ers
11.
0024
70.
40
Dem
oliti
onT
ract
ors/
Load
ers/
Bac
khoe
s2
6.00
970.
37
Site
Pre
para
tion
Gra
ders
18.
0018
70.
41
Site
Pre
para
tion
Tra
ctor
s/Lo
ader
s/B
ackh
oes
18.
0097
0.37
Gra
ding
Con
cret
e/In
dust
rial S
aws
18.
0081
0.73
Gra
ding
Rub
ber
Tire
d D
ozer
s1
1.00
247
0.40
Gra
ding
Tra
ctor
s/Lo
ader
s/B
ackh
oes
26.
0097
0.37
Bui
ldin
g C
onst
ruct
ion
Cra
nes
14.
0023
10.
29
Bui
ldin
g C
onst
ruct
ion
For
klift
s2
6.00
890.
20
Bui
ldin
g C
onst
ruct
ion
Tra
ctor
s/Lo
ader
s/B
ackh
oes
28.
0097
0.37
Pav
ing
Cem
ent a
nd M
orta
r M
ixer
s4
6.00
90.
56
Pav
ing
Pav
ers
17.
0013
00.
42
Pav
ing
Rol
lers
17.
0080
0.38
Pav
ing
Tra
ctor
s/Lo
ader
s/B
ackh
oes
17.
0097
0.37
Arc
hite
ctur
al C
oatin
gA
ir C
ompr
esso
rs1
6.00
780.
48
Tri
ps
and
VM
T
Pha
se N
ame
Offr
oad
Equ
ipm
ent
Cou
ntW
orke
r T
rip
Num
ber
Ven
dor
Trip
N
umbe
rH
aulin
g T
rip
Num
ber
Wor
ker
Trip
Le
ngth
Ven
dor
Trip
Le
ngth
Hau
ling
Trip
Le
ngth
Wor
ker
Veh
icle
C
lass
Ven
dor
Veh
icle
Cla
ssH
aulin
gV
ehic
le C
lass
Dem
oliti
on4
10.0
00.
0034
4.00
16.8
06.
6020
.00
LD_M
ixH
DT
_Mix
HH
DT
Site
Pre
para
tion
25.
000.
000.
0016
.80
6.60
20.0
0LD
_Mix
HD
T_M
ixH
HD
T
Gra
ding
410
.00
0.00
0.00
16.8
06.
6020
.00
LD_M
ixH
DT
_Mix
HH
DT
Bui
ldin
g C
onst
ruct
ion
57.
003.
000.
0016
.80
6.60
20.0
0LD
_Mix
HD
T_M
ixH
HD
T
Pav
ing
718
.00
0.00
0.00
16.8
06.
6020
.00
LD_M
ixH
DT
_Mix
HH
DT
Arc
hite
ctur
al C
oatin
g1
1.00
0.00
0.00
16.8
06.
6020
.00
LD_M
ixH
DT
_Mix
HH
DT
Cal
EE
Mod
Ver
sion
: Cal
EE
Mod
.201
6.3.
1D
ate:
1/4
/201
7 8:
30 A
MP
age
7 of
25
TR
ED
C H
otel
Pro
ject
- H
umbo
ldt C
ount
y, W
inte
r

3.2
Dem
olit
ion
- 2
017
RO
GN
Ox
CO
SO
2F
ugiti
veP
M10
Exh
aust
PM
10P
M10
Tot
alF
ugiti
veP
M2.
5E
xhau
stP
M2.
5P
M2.
5T
otal
Bio
- C
O2
NB
io-
CO
2T
otal
CO
2C
H4
N2O
CO
2e
Cat
egor
ylb
/day
lb/d
ay
Fug
itive
Dus
t7.
4554
0.00
007.
4554
1.12
880.
0000
1.12
880.
0000
0.00
00
Off-
Roa
d1.
2100
10.4
978
7.91
820.
0120
0.73
180.
7318
0.69
780.
6978
1,17
9.30
75
1,17
9.30
75
0.23
191,
185.
104
7
To
tal
1.21
0010
.497
87.
9182
0.01
207.
4554
0.73
188.
1872
1.12
880.
6978
1.82
661,
179.
307
51,
179.
307
50.
2319
1,18
5.10
47
Un
mit
igat
ed C
on
stru
ctio
n O
n-S
ite
3.1
Mit
igat
ion
Mea
sure
s C
on
stru
ctio
n
Use
Cle
aner
Eng
ines
for
Con
stru
ctio
n E
quip
men
t
Use
DP
F fo
r C
onst
ruct
ion
Equ
ipm
ent
Use
Soi
l Sta
biliz
er
Wat
er E
xpos
ed A
rea
Red
uce
Veh
icle
Spe
ed o
n U
npav
ed R
oads
Cle
an P
aved
Roa
ds
Cal
EE
Mod
Ver
sion
: Cal
EE
Mod
.201
6.3.
1D
ate:
1/4
/201
7 8:
30 A
MP
age
8 of
25
TR
ED
C H
otel
Pro
ject
- H
umbo
ldt C
ount
y, W
inte
r

3.2
Dem
olit
ion
- 2
017
RO
GN
Ox
CO
SO
2F
ugiti
veP
M10
Exh
aust
PM
10P
M10
Tot
alF
ugiti
veP
M2.
5E
xhau
stP
M2.
5P
M2.
5T
otal
Bio
- C
O2
NB
io-
CO
2T
otal
CO
2C
H4
N2O
CO
2e
Cat
egor
ylb
/day
lb/d
ay
Hau
ling
0.55
1114
.275
93.
0651
0.02
790.
5977
0.15
080.
7484
0.16
350.
1442
0.30
772,
917.
265
62,
917.
265
60.
1138
2,92
0.11
08
Ven
dor
0.00
000.
0000
0.00
000.
0000
0.00
000.
0000
0.00
000.
0000
0.00
000.
0000
0.00
000.
0000
0.00
000.
0000
Wor
ker
0.15
610.
1632
1.20
001.
3100
e-00
30.
1277
1.40
00e-
003
0.12
910.
0339
1.30
00e-
003
0.03
5212
9.42
5512
9.42
550.
0116
129.
7147
To
tal
0.70
7214
.439
04.
2652
0.02
920.
7254
0.15
220.
8776
0.19
740.
1455
0.34
293,
046.
691
13,
046.
691
10.
1254
3,04
9.82
55
Un
mit
igat
ed C
on
stru
ctio
n O
ff-S
ite
RO
GN
Ox
CO
SO
2F
ugiti
veP
M10
Exh
aust
PM
10P
M10
Tot
alF
ugiti
veP
M2.
5E
xhau
stP
M2.
5P
M2.
5T
otal
Bio
- C
O2
NB
io-
CO
2T
otal
CO
2C
H4
N2O
CO
2e
Cat
egor
ylb
/day
lb/d
ay
Fug
itive
Dus
t3.
3549
0.00
003.
3549
0.50
800.
0000
0.50
800.
0000
0.00
00
Off-
Roa
d0.
2652
5.96
447.
9381
0.01
200.
0603
0.06
030.
0603
0.06
030.
0000
1,17
9.30
75
1,17
9.30
75
0.23
191,
185.
104
7
To
tal
0.26
525.
9644
7.93
810.
0120
3.35
490.
0603
3.41
520.
5080
0.06
030.
5682
0.00
001,
179.
307
51,
179.
307
50.
2319
1,18
5.10
47
Mit
igat
ed C
on
stru
ctio
n O
n-S
ite
Cal
EE
Mod
Ver
sion
: Cal
EE
Mod
.201
6.3.
1D
ate:
1/4
/201
7 8:
30 A
MP
age
9 of
25
TR
ED
C H
otel
Pro
ject
- H
umbo
ldt C
ount
y, W
inte
r

3.2
Dem
olit
ion
- 2
017
RO
GN
Ox
CO
SO
2F
ugiti
veP
M10
Exh
aust
PM
10P
M10
Tot
alF
ugiti
veP
M2.
5E
xhau
stP
M2.
5P
M2.
5T
otal
Bio
- C
O2
NB
io-
CO
2T
otal
CO
2C
H4
N2O
CO
2e
Cat
egor
ylb
/day
lb/d
ay
Hau
ling
0.55
1114
.275
93.
0651
0.02
790.
5977
0.15
080.
7484
0.16
350.
1442
0.30
772,
917.
265
62,
917.
265
60.
1138
2,92
0.11
08
Ven
dor
0.00
000.
0000
0.00
000.
0000
0.00
000.
0000
0.00
000.
0000
0.00
000.
0000
0.00
000.
0000
0.00
000.
0000
Wor
ker
0.15
610.
1632
1.20
001.
3100
e-00
30.
1277
1.40
00e-
003
0.12
910.
0339
1.30
00e-
003
0.03
5212
9.42
5512
9.42
550.
0116
129.
7147
To
tal
0.70
7214
.439
04.
2652
0.02
920.
7254
0.15
220.
8776
0.19
740.
1455
0.34
293,
046.
691
13,
046.
691
10.
1254
3,04
9.82
55
Mit
igat
ed C
on
stru
ctio
n O
ff-S
ite
3.3
Sit
e P
rep
arat
ion
- 2
017
RO
GN
Ox
CO
SO
2F
ugiti
veP
M10
Exh
aust
PM
10P
M10
Tot
alF
ugiti
veP
M2.
5E
xhau
stP
M2.
5P
M2.
5T
otal
Bio
- C
O2
NB
io-
CO
2T
otal
CO
2C
H4
N2O
CO
2e
Cat
egor
ylb
/day
lb/d
ay
Fug
itive
Dus
t0.
5303
0.00
000.
5303
0.05
730.
0000
0.05
730.
0000
0.00
00
Off-
Roa
d0.
8524
10.5
148
4.35
339.
7700
e-00
30.
4726
0.47
260.
4347
0.43
4799
9.52
0199
9.52
010.
3063
1,00
7.17
64
To
tal
0.85
2410
.514
84.
3533
9.77
00e-
003
0.53
030.
4726
1.00
280.
0573
0.43
470.
4920
999.
5201
999.
5201
0.30
631,
007.
176
4
Un
mit
igat
ed C
on
stru
ctio
n O
n-S
ite
Cal
EE
Mod
Ver
sion
: Cal
EE
Mod
.201
6.3.
1D
ate:
1/4
/201
7 8:
30 A
MP
age
10 o
f 25
TR
ED
C H
otel
Pro
ject
- H
umbo
ldt C
ount
y, W
inte
r

3.3
Sit
e P
rep
arat
ion
- 2
017
RO
GN
Ox
CO
SO
2F
ugiti
veP
M10
Exh
aust
PM
10P
M10
Tot
alF
ugiti
veP
M2.
5E
xhau
stP
M2.
5P
M2.
5T
otal
Bio
- C
O2
NB
io-
CO
2T
otal
CO
2C
H4
N2O
CO
2e
Cat
egor
ylb
/day
lb/d
ay
Hau
ling
0.00
000.
0000
0.00
000.
0000
0.00
000.
0000
0.00
000.
0000
0.00
000.
0000
0.00
000.
0000
0.00
000.
0000
Ven
dor
0.00
000.
0000
0.00
000.
0000
0.00
000.
0000
0.00
000.
0000
0.00
000.
0000
0.00
000.
0000
0.00
000.
0000
Wor
ker
0.07
800.
0816
0.60
006.
6000
e-00
40.
0639
7.00
00e-
004
0.06
460.
0169
6.50
00e-
004
0.01
7664
.712
764
.712
75.
7800
e-00
364
.857
4
To
tal
0.07
800.
0816
0.60
006.
6000
e-00
40.
0639
7.00
00e-
004
0.06
460.
0169
6.50
00e-
004
0.01
7664
.712
764
.712
75.
7800
e-00
364
.857
4
Un
mit
igat
ed C
on
stru
ctio
n O
ff-S
ite
RO
GN
Ox
CO
SO
2F
ugiti
veP
M10
Exh
aust
PM
10P
M10
Tot
alF
ugiti
veP
M2.
5E
xhau
stP
M2.
5P
M2.
5T
otal
Bio
- C
O2
NB
io-
CO
2T
otal
CO
2C
H4
N2O
CO
2e
Cat
egor
ylb
/day
lb/d
ay
Fug
itive
Dus
t0.
2386
0.00
000.
2386
0.02
580.
0000
0.02
580.
0000
0.00
00
Off-
Roa
d0.
2382
4.87
165.
8579
9.77
00e-
003
0.03
610.
0361
0.03
610.
0361
0.00
0099
9.52
0199
9.52
010.
3063
1,00
7.17
64
To
tal
0.23
824.
8716
5.85
799.
7700
e-00
30.
2386
0.03
610.
2747
0.02
580.
0361
0.06
180.
0000
999.
5201
999.
5201
0.30
631,
007.
176
4
Mit
igat
ed C
on
stru
ctio
n O
n-S
ite
Cal
EE
Mod
Ver
sion
: Cal
EE
Mod
.201
6.3.
1D
ate:
1/4
/201
7 8:
30 A
MP
age
11 o
f 25
TR
ED
C H
otel
Pro
ject
- H
umbo
ldt C
ount
y, W
inte
r

3.3
Sit
e P
rep
arat
ion
- 2
017
RO
GN
Ox
CO
SO
2F
ugiti
veP
M10
Exh
aust
PM
10P
M10
Tot
alF
ugiti
veP
M2.
5E
xhau
stP
M2.
5P
M2.
5T
otal
Bio
- C
O2
NB
io-
CO
2T
otal
CO
2C
H4
N2O
CO
2e
Cat
egor
ylb
/day
lb/d
ay
Hau
ling
0.00
000.
0000
0.00
000.
0000
0.00
000.
0000
0.00
000.
0000
0.00
000.
0000
0.00
000.
0000
0.00
000.
0000
Ven
dor
0.00
000.
0000
0.00
000.
0000
0.00
000.
0000
0.00
000.
0000
0.00
000.
0000
0.00
000.
0000
0.00
000.
0000
Wor
ker
0.07
800.
0816
0.60
006.
6000
e-00
40.
0639
7.00
00e-
004
0.06
460.
0169
6.50
00e-
004
0.01
7664
.712
764
.712
75.
7800
e-00
364
.857
4
To
tal
0.07
800.
0816
0.60
006.
6000
e-00
40.
0639
7.00
00e-
004
0.06
460.
0169
6.50
00e-
004
0.01
7664
.712
764
.712
75.
7800
e-00
364
.857
4
Mit
igat
ed C
on
stru
ctio
n O
ff-S
ite
3.4
Gra
din
g -
201
7
RO
GN
Ox
CO
SO
2F
ugiti
veP
M10
Exh
aust
PM
10P
M10
Tot
alF
ugiti
veP
M2.
5E
xhau
stP
M2.
5P
M2.
5T
otal
Bio
- C
O2
NB
io-
CO
2T
otal
CO
2C
H4
N2O
CO
2e
Cat
egor
ylb
/day
lb/d
ay
Fug
itive
Dus
t0.
7528
0.00
000.
7528
0.41
380.
0000
0.41
380.
0000
0.00
00
Off-
Roa
d1.
2100
10.4
978
7.91
820.
0120
0.73
180.
7318
0.69
780.
6978
1,17
9.30
75
1,17
9.30
75
0.23
191,
185.
104
7
To
tal
1.21
0010
.497
87.
9182
0.01
200.
7528
0.73
181.
4845
0.41
380.
6978
1.11
151,
179.
307
51,
179.
307
50.
2319
1,18
5.10
47
Un
mit
igat
ed C
on
stru
ctio
n O
n-S
ite
Cal
EE
Mod
Ver
sion
: Cal
EE
Mod
.201
6.3.
1D
ate:
1/4
/201
7 8:
30 A
MP
age
12 o
f 25
TR
ED
C H
otel
Pro
ject
- H
umbo
ldt C
ount
y, W
inte
r

3.4
Gra
din
g -
201
7
RO
GN
Ox
CO
SO
2F
ugiti
veP
M10
Exh
aust
PM
10P
M10
Tot
alF
ugiti
veP
M2.
5E
xhau
stP
M2.
5P
M2.
5T
otal
Bio
- C
O2
NB
io-
CO
2T
otal
CO
2C
H4
N2O
CO
2e
Cat
egor
ylb
/day
lb/d
ay
Hau
ling
0.00
000.
0000
0.00
000.
0000
0.00
000.
0000
0.00
000.
0000
0.00
000.
0000
0.00
000.
0000
0.00
000.
0000
Ven
dor
0.00
000.
0000
0.00
000.
0000
0.00
000.
0000
0.00
000.
0000
0.00
000.
0000
0.00
000.
0000
0.00
000.
0000
Wor
ker
0.15
610.
1632
1.20
001.
3100
e-00
30.
1277
1.40
00e-
003
0.12
910.
0339
1.30
00e-
003
0.03
5212
9.42
5512
9.42
550.
0116
129.
7147
To
tal
0.15
610.
1632
1.20
001.
3100
e-00
30.
1277
1.40
00e-
003
0.12
910.
0339
1.30
00e-
003
0.03
5212
9.42
5512
9.42
550.
0116
129.
7147
Un
mit
igat
ed C
on
stru
ctio
n O
ff-S
ite
RO
GN
Ox
CO
SO
2F
ugiti
veP
M10
Exh
aust
PM
10P
M10
Tot
alF
ugiti
veP
M2.
5E
xhau
stP
M2.
5P
M2.
5T
otal
Bio
- C
O2
NB
io-
CO
2T
otal
CO
2C
H4
N2O
CO
2e
Cat
egor
ylb
/day
lb/d
ay
Fug
itive
Dus
t0.
3387
0.00
000.
3387
0.18
620.
0000
0.18
620.
0000
0.00
00
Off-
Roa
d0.
2652
5.96
447.
9381
0.01
200.
0603
0.06
030.
0603
0.06
030.
0000
1,17
9.30
75
1,17
9.30
75
0.23
191,
185.
104
7
To
tal
0.26
525.
9644
7.93
810.
0120
0.33
870.
0603
0.39
900.
1862
0.06
030.
2465
0.00
001,
179.
307
51,
179.
307
50.
2319
1,18
5.10
47
Mit
igat
ed C
on
stru
ctio
n O
n-S
ite
Cal
EE
Mod
Ver
sion
: Cal
EE
Mod
.201
6.3.
1D
ate:
1/4
/201
7 8:
30 A
MP
age
13 o
f 25
TR
ED
C H
otel
Pro
ject
- H
umbo
ldt C
ount
y, W
inte
r

3.4
Gra
din
g -
201
7
RO
GN
Ox
CO
SO
2F
ugiti
veP
M10
Exh
aust
PM
10P
M10
Tot
alF
ugiti
veP
M2.
5E
xhau
stP
M2.
5P
M2.
5T
otal
Bio
- C
O2
NB
io-
CO
2T
otal
CO
2C
H4
N2O
CO
2e
Cat
egor
ylb
/day
lb/d
ay
Hau
ling
0.00
000.
0000
0.00
000.
0000
0.00
000.
0000
0.00
000.
0000
0.00
000.
0000
0.00
000.
0000
0.00
000.
0000
Ven
dor
0.00
000.
0000
0.00
000.
0000
0.00
000.
0000
0.00
000.
0000
0.00
000.
0000
0.00
000.
0000
0.00
000.
0000
Wor
ker
0.15
610.
1632
1.20
001.
3100
e-00
30.
1277
1.40
00e-
003
0.12
910.
0339
1.30
00e-
003
0.03
5212
9.42
5512
9.42
550.
0116
129.
7147
To
tal
0.15
610.
1632
1.20
001.
3100
e-00
30.
1277
1.40
00e-
003
0.12
910.
0339
1.30
00e-
003
0.03
5212
9.42
5512
9.42
550.
0116
129.
7147
Mit
igat
ed C
on
stru
ctio
n O
ff-S
ite
3.5
Bu
ildin
g C
on
stru
ctio
n -
201
7
RO
GN
Ox
CO
SO
2F
ugiti
veP
M10
Exh
aust
PM
10P
M10
Tot
alF
ugiti
veP
M2.
5E
xhau
stP
M2.
5P
M2.
5T
otal
Bio
- C
O2
NB
io-
CO
2T
otal
CO
2C
H4
N2O
CO
2e
Cat
egor
ylb
/day
lb/d
ay
Off-
Roa
d1.
2812
12.7
589
8.07
000.
0114
0.85
910.
8591
0.79
040.
7904
1,16
5.91
64
1,16
5.91
64
0.35
721,
174.
847
3
To
tal
1.28
1212
.758
98.
0700
0.01
140.
8591
0.85
910.
7904
0.79
041,
165.
916
41,
165.
916
40.
3572
1,17
4.84
73
Un
mit
igat
ed C
on
stru
ctio
n O
n-S
ite
Cal
EE
Mod
Ver
sion
: Cal
EE
Mod
.201
6.3.
1D
ate:
1/4
/201
7 8:
30 A
MP
age
14 o
f 25
TR
ED
C H
otel
Pro
ject
- H
umbo
ldt C
ount
y, W
inte
r

3.5
Bu
ildin
g C
on
stru
ctio
n -
201
7
RO
GN
Ox
CO
SO
2F
ugiti
veP
M10
Exh
aust
PM
10P
M10
Tot
alF
ugiti
veP
M2.
5E
xhau
stP
M2.
5P
M2.
5T
otal
Bio
- C
O2
NB
io-
CO
2T
otal
CO
2C
H4
N2O
CO
2e
Cat
egor
ylb
/day
lb/d
ay
Hau
ling
0.00
000.
0000
0.00
000.
0000
0.00
000.
0000
0.00
000.
0000
0.00
000.
0000
0.00
000.
0000
0.00
000.
0000
Ven
dor
0.02
770.
4726
0.18
057.
7000
e-00
40.
0183
5.87
00e-
003
0.02
425.
2700
e-00
35.
6100
e-00
30.
0109
79.8
455
79.8
455
5.60
00e-
003
79.9
856
Wor
ker
0.10
930.
1142
0.84
009.
2000
e-00
40.
0894
9.80
00e-
004
0.09
040.
0237
9.10
00e-
004
0.02
4690
.597
890
.597
88.
1000
e-00
390
.800
3
To
tal
0.13
690.
5868
1.02
051.
6900
e-00
30.
1077
6.85
00e-
003
0.11
460.
0290
6.52
00e-
003
0.03
5517
0.44
3417
0.44
340.
0137
170.
7859
Un
mit
igat
ed C
on
stru
ctio
n O
ff-S
ite
RO
GN
Ox
CO
SO
2F
ugiti
veP
M10
Exh
aust
PM
10P
M10
Tot
alF
ugiti
veP
M2.
5E
xhau
stP
M2.
5P
M2.
5T
otal
Bio
- C
O2
NB
io-
CO
2T
otal
CO
2C
H4
N2O
CO
2e
Cat
egor
ylb
/day
lb/d
ay
Off-
Roa
d0.
2793
6.12
967.
9624
0.01
140.
0578
0.05
780.
0578
0.05
780.
0000
1,16
5.91
64
1,16
5.91
64
0.35
721,
174.
847
3
To
tal
0.27
936.
1296
7.96
240.
0114
0.05
780.
0578
0.05
780.
0578
0.00
001,
165.
916
41,
165.
916
40.
3572
1,17
4.84
73
Mit
igat
ed C
on
stru
ctio
n O
n-S
ite
Cal
EE
Mod
Ver
sion
: Cal
EE
Mod
.201
6.3.
1D
ate:
1/4
/201
7 8:
30 A
MP
age
15 o
f 25
TR
ED
C H
otel
Pro
ject
- H
umbo
ldt C
ount
y, W
inte
r
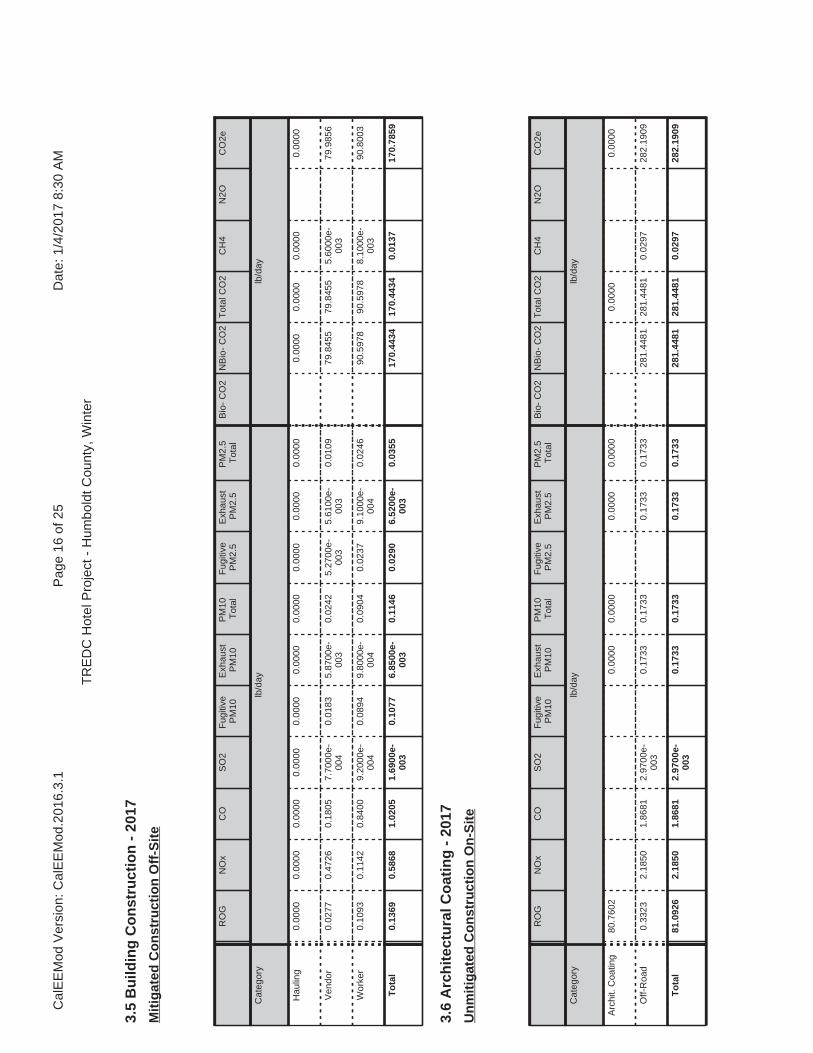
3.5
Bu
ildin
g C
on
stru
ctio
n -
201
7
RO
GN
Ox
CO
SO
2F
ugiti
veP
M10
Exh
aust
PM
10P
M10
Tot
alF
ugiti
veP
M2.
5E
xhau
stP
M2.
5P
M2.
5T
otal
Bio
- C
O2
NB
io-
CO
2T
otal
CO
2C
H4
N2O
CO
2e
Cat
egor
ylb
/day
lb/d
ay
Hau
ling
0.00
000.
0000
0.00
000.
0000
0.00
000.
0000
0.00
000.
0000
0.00
000.
0000
0.00
000.
0000
0.00
000.
0000
Ven
dor
0.02
770.
4726
0.18
057.
7000
e-00
40.
0183
5.87
00e-
003
0.02
425.
2700
e-00
35.
6100
e-00
30.
0109
79.8
455
79.8
455
5.60
00e-
003
79.9
856
Wor
ker
0.10
930.
1142
0.84
009.
2000
e-00
40.
0894
9.80
00e-
004
0.09
040.
0237
9.10
00e-
004
0.02
4690
.597
890
.597
88.
1000
e-00
390
.800
3
To
tal
0.13
690.
5868
1.02
051.
6900
e-00
30.
1077
6.85
00e-
003
0.11
460.
0290
6.52
00e-
003
0.03
5517
0.44
3417
0.44
340.
0137
170.
7859
Mit
igat
ed C
on
stru
ctio
n O
ff-S
ite
3.6
Arc
hit
ectu
ral C
oat
ing
- 2
017
RO
GN
Ox
CO
SO
2F
ugiti
veP
M10
Exh
aust
PM
10P
M10
Tot
alF
ugiti
veP
M2.
5E
xhau
stP
M2.
5P
M2.
5T
otal
Bio
- C
O2
NB
io-
CO
2T
otal
CO
2C
H4
N2O
CO
2e
Cat
egor
ylb
/day
lb/d
ay
Arc
hit.
Coa
ting
80.7
602
0.00
000.
0000
0.00
000.
0000
0.00
000.
0000
Off-
Roa
d0.
3323
2.18
501.
8681
2.97
00e-
003
0.17
330.
1733
0.17
330.
1733
281.
4481
281.
4481
0.02
9728
2.19
09
To
tal
81.0
926
2.18
501.
8681
2.97
00e-
003
0.17
330.
1733
0.17
330.
1733
281.
4481
281.
4481
0.02
9728
2.19
09
Un
mit
igat
ed C
on
stru
ctio
n O
n-S
ite
Cal
EE
Mod
Ver
sion
: Cal
EE
Mod
.201
6.3.
1D
ate:
1/4
/201
7 8:
30 A
MP
age
16 o
f 25
TR
ED
C H
otel
Pro
ject
- H
umbo
ldt C
ount
y, W
inte
r

3.6
Arc
hit
ectu
ral C
oat
ing
- 2
017
RO
GN
Ox
CO
SO
2F
ugiti
veP
M10
Exh
aust
PM
10P
M10
Tot
alF
ugiti
veP
M2.
5E
xhau
stP
M2.
5P
M2.
5T
otal
Bio
- C
O2
NB
io-
CO
2T
otal
CO
2C
H4
N2O
CO
2e
Cat
egor
ylb
/day
lb/d
ay
Hau
ling
0.00
000.
0000
0.00
000.
0000
0.00
000.
0000
0.00
000.
0000
0.00
000.
0000
0.00
000.
0000
0.00
000.
0000
Ven
dor
0.00
000.
0000
0.00
000.
0000
0.00
000.
0000
0.00
000.
0000
0.00
000.
0000
0.00
000.
0000
0.00
000.
0000
Wor
ker
0.01
560.
0163
0.12
001.
3000
e-00
40.
0128
1.40
00e-
004
0.01
293.
3900
e-00
31.
3000
e-00
43.
5200
e-00
312
.942
612
.942
61.
1600
e-00
312
.971
5
To
tal
0.01
560.
0163
0.12
001.
3000
e-00
40.
0128
1.40
00e-
004
0.01
293.
3900
e-00
31.
3000
e-00
43.
5200
e-00
312
.942
612
.942
61.
1600
e-00
312
.971
5
Un
mit
igat
ed C
on
stru
ctio
n O
ff-S
ite
RO
GN
Ox
CO
SO
2F
ugiti
veP
M10
Exh
aust
PM
10P
M10
Tot
alF
ugiti
veP
M2.
5E
xhau
stP
M2.
5P
M2.
5T
otal
Bio
- C
O2
NB
io-
CO
2T
otal
CO
2C
H4
N2O
CO
2e
Cat
egor
ylb
/day
lb/d
ay
Arc
hit.
Coa
ting
80.7
602
0.00
000.
0000
0.00
000.
0000
0.00
000.
0000
Off-
Roa
d0.
0594
1.35
701.
8324
2.97
00e-
003
0.01
430.
0143
0.01
430.
0143
0.00
0028
1.44
8128
1.44
810.
0297
282.
1909
To
tal
80.8
197
1.35
701.
8324
2.97
00e-
003
0.01
430.
0143
0.01
430.
0143
0.00
0028
1.44
8128
1.44
810.
0297
282.
1909
Mit
igat
ed C
on
stru
ctio
n O
n-S
ite
Cal
EE
Mod
Ver
sion
: Cal
EE
Mod
.201
6.3.
1D
ate:
1/4
/201
7 8:
30 A
MP
age
17 o
f 25
TR
ED
C H
otel
Pro
ject
- H
umbo
ldt C
ount
y, W
inte
r

3.6
Arc
hit
ectu
ral C
oat
ing
- 2
017
RO
GN
Ox
CO
SO
2F
ugiti
veP
M10
Exh
aust
PM
10P
M10
Tot
alF
ugiti
veP
M2.
5E
xhau
stP
M2.
5P
M2.
5T
otal
Bio
- C
O2
NB
io-
CO
2T
otal
CO
2C
H4
N2O
CO
2e
Cat
egor
ylb
/day
lb/d
ay
Hau
ling
0.00
000.
0000
0.00
000.
0000
0.00
000.
0000
0.00
000.
0000
0.00
000.
0000
0.00
000.
0000
0.00
000.
0000
Ven
dor
0.00
000.
0000
0.00
000.
0000
0.00
000.
0000
0.00
000.
0000
0.00
000.
0000
0.00
000.
0000
0.00
000.
0000
Wor
ker
0.01
560.
0163
0.12
001.
3000
e-00
40.
0128
1.40
00e-
004
0.01
293.
3900
e-00
31.
3000
e-00
43.
5200
e-00
312
.942
612
.942
61.
1600
e-00
312
.971
5
To
tal
0.01
560.
0163
0.12
001.
3000
e-00
40.
0128
1.40
00e-
004
0.01
293.
3900
e-00
31.
3000
e-00
43.
5200
e-00
312
.942
612
.942
61.
1600
e-00
312
.971
5
Mit
igat
ed C
on
stru
ctio
n O
ff-S
ite
3.7
Pav
ing
- 2
017
RO
GN
Ox
CO
SO
2F
ugiti
veP
M10
Exh
aust
PM
10P
M10
Tot
alF
ugiti
veP
M2.
5E
xhau
stP
M2.
5P
M2.
5T
otal
Bio
- C
O2
NB
io-
CO
2T
otal
CO
2C
H4
N2O
CO
2e
Cat
egor
ylb
/day
lb/d
ay
Off-
Roa
d1.
0532
9.97
547.
3425
0.01
130.
6087
0.60
870.
5636
0.56
361,
085.
107
11,
085.
107
10.
3018
1,09
2.65
15
Pav
ing
0.00
000.
0000
0.00
000.
0000
0.00
000.
0000
0.00
00
To
tal
1.05
329.
9754
7.34
250.
0113
0.60
870.
6087
0.56
360.
5636
1,08
5.10
71
1,08
5.10
71
0.30
181,
092.
651
5
Un
mit
igat
ed C
on
stru
ctio
n O
n-S
ite
Cal
EE
Mod
Ver
sion
: Cal
EE
Mod
.201
6.3.
1D
ate:
1/4
/201
7 8:
30 A
MP
age
18 o
f 25
TR
ED
C H
otel
Pro
ject
- H
umbo
ldt C
ount
y, W
inte
r

3.7
Pav
ing
- 2
017
RO
GN
Ox
CO
SO
2F
ugiti
veP
M10
Exh
aust
PM
10P
M10
Tot
alF
ugiti
veP
M2.
5E
xhau
stP
M2.
5P
M2.
5T
otal
Bio
- C
O2
NB
io-
CO
2T
otal
CO
2C
H4
N2O
CO
2e
Cat
egor
ylb
/day
lb/d
ay
Hau
ling
0.00
000.
0000
0.00
000.
0000
0.00
000.
0000
0.00
000.
0000
0.00
000.
0000
0.00
000.
0000
0.00
000.
0000
Ven
dor
0.00
000.
0000
0.00
000.
0000
0.00
000.
0000
0.00
000.
0000
0.00
000.
0000
0.00
000.
0000
0.00
000.
0000
Wor
ker
0.28
090.
2937
2.16
002.
3600
e-00
30.
2299
2.53
00e-
003
0.23
240.
0610
2.34
00e-
003
0.06
3323
2.96
5923
2.96
590.
0208
233.
4865
To
tal
0.28
090.
2937
2.16
002.
3600
e-00
30.
2299
2.53
00e-
003
0.23
240.
0610
2.34
00e-
003
0.06
3323
2.96
5923
2.96
590.
0208
233.
4865
Un
mit
igat
ed C
on
stru
ctio
n O
ff-S
ite
RO
GN
Ox
CO
SO
2F
ugiti
veP
M10
Exh
aust
PM
10P
M10
Tot
alF
ugiti
veP
M2.
5E
xhau
stP
M2.
5P
M2.
5T
otal
Bio
- C
O2
NB
io-
CO
2T
otal
CO
2C
H4
N2O
CO
2e
Cat
egor
ylb
/day
lb/d
ay
Off-
Roa
d0.
2239
4.75
796.
9028
0.01
130.
0436
0.04
360.
0436
0.04
360.
0000
1,08
5.10
71
1,08
5.10
71
0.30
181,
092.
651
5
Pav
ing
0.00
000.
0000
0.00
000.
0000
0.00
000.
0000
0.00
00
To
tal
0.22
394.
7579
6.90
280.
0113
0.04
360.
0436
0.04
360.
0436
0.00
001,
085.
107
11,
085.
107
10.
3018
1,09
2.65
15
Mit
igat
ed C
on
stru
ctio
n O
n-S
ite
Cal
EE
Mod
Ver
sion
: Cal
EE
Mod
.201
6.3.
1D
ate:
1/4
/201
7 8:
30 A
MP
age
19 o
f 25
TR
ED
C H
otel
Pro
ject
- H
umbo
ldt C
ount
y, W
inte
r
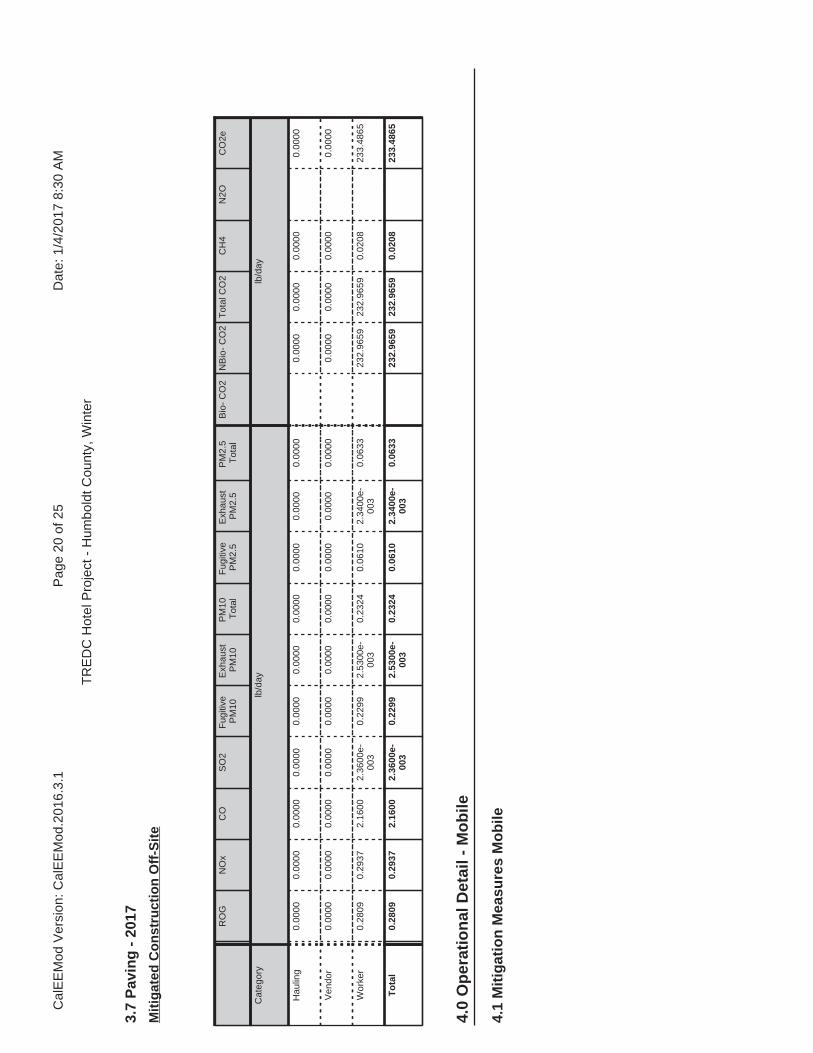
4.0
Op
erat
ion
al D
etai
l - M
ob
ile
4.1
Mit
igat
ion
Mea
sure
s M
ob
ile
3.7
Pav
ing
- 2
017
RO
GN
Ox
CO
SO
2F
ugiti
veP
M10
Exh
aust
PM
10P
M10
Tot
alF
ugiti
veP
M2.
5E
xhau
stP
M2.
5P
M2.
5T
otal
Bio
- C
O2
NB
io-
CO
2T
otal
CO
2C
H4
N2O
CO
2e
Cat
egor
ylb
/day
lb/d
ay
Hau
ling
0.00
000.
0000
0.00
000.
0000
0.00
000.
0000
0.00
000.
0000
0.00
000.
0000
0.00
000.
0000
0.00
000.
0000
Ven
dor
0.00
000.
0000
0.00
000.
0000
0.00
000.
0000
0.00
000.
0000
0.00
000.
0000
0.00
000.
0000
0.00
000.
0000
Wor
ker
0.28
090.
2937
2.16
002.
3600
e-00
30.
2299
2.53
00e-
003
0.23
240.
0610
2.34
00e-
003
0.06
3323
2.96
5923
2.96
590.
0208
233.
4865
To
tal
0.28
090.
2937
2.16
002.
3600
e-00
30.
2299
2.53
00e-
003
0.23
240.
0610
2.34
00e-
003
0.06
3323
2.96
5923
2.96
590.
0208
233.
4865
Mit
igat
ed C
on
stru
ctio
n O
ff-S
ite
Cal
EE
Mod
Ver
sion
: Cal
EE
Mod
.201
6.3.
1D
ate:
1/4
/201
7 8:
30 A
MP
age
20 o
f 25
TR
ED
C H
otel
Pro
ject
- H
umbo
ldt C
ount
y, W
inte
r
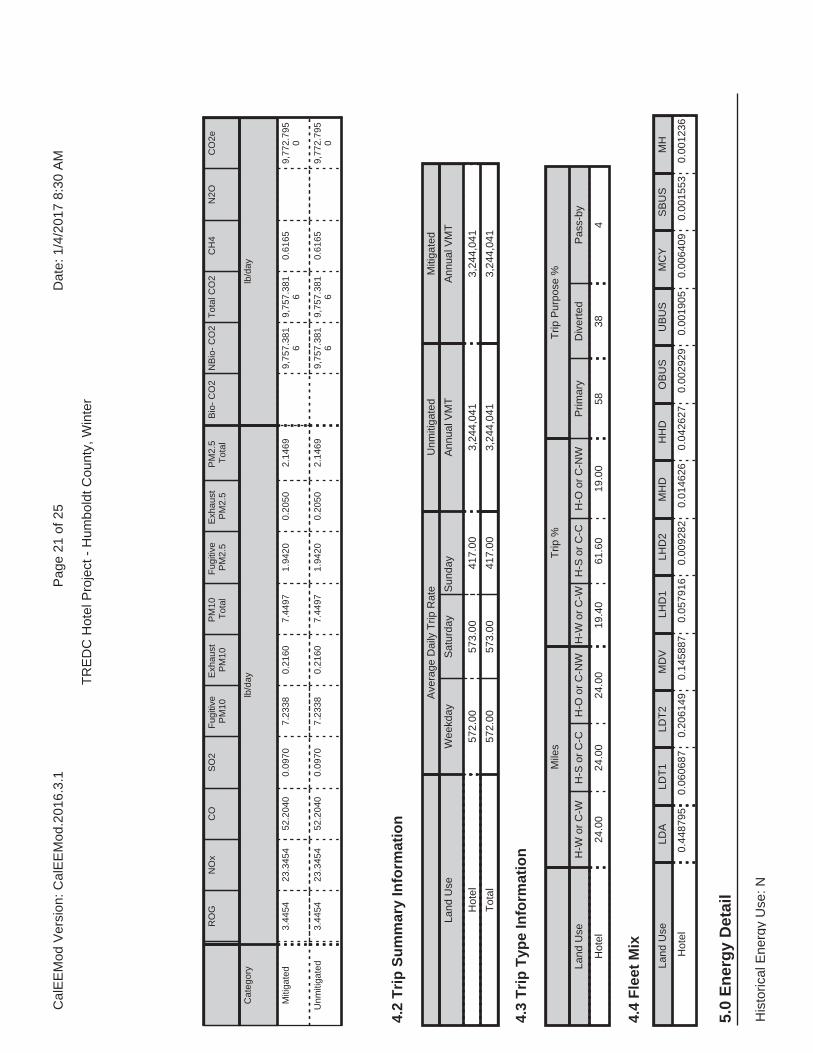
RO
GN
Ox
CO
SO
2F
ugiti
veP
M10
Exh
aust
PM
10P
M10
Tot
alF
ugiti
veP
M2.
5E
xhau
stP
M2.
5P
M2.
5T
otal
Bio
- C
O2
NB
io-
CO
2T
otal
CO
2C
H4
N2O
CO
2e
Cat
egor
ylb
/day
lb/d
ay
Miti
gate
d3.
4454
23.3
454
52.2
040
0.09
707.
2338
0.21
607.
4497
1.94
200.
2050
2.14
699,
757.
381
69,
757.
381
60.
6165
9,77
2.79
50
Unm
itiga
ted
3.44
5423
.345
452
.204
00.
0970
7.23
380.
2160
7.44
971.
9420
0.20
502.
1469
9,75
7.38
16
9,75
7.38
16
0.61
659,
772.
795
0
4.2
Tri
p S
um
mar
y In
form
atio
n
4.3
Tri
p T
ype
Info
rmat
ion
Ave
rage
Dai
ly T
rip R
ate
Unm
itiga
ted
Miti
gate
d
Land
Use
Wee
kday
Sat
urda
yS
unda
yA
nnua
l VM
TA
nnua
l VM
T
Hot
el57
2.00
573.
0041
7.00
3,24
4,04
13,
244,
041
Tot
al57
2.00
573.
0041
7.00
3,24
4,04
13,
244,
041
Mile
sT
rip %
Trip
Pur
pose
%
Land
Use
H-W
or
C-W
H-S
or
C-C
H-O
or
C-N
WH
-W o
r C
-WH
-S o
r C
-CH
-O o
r C
-NW
Prim
ary
Div
erte
dP
ass-
by
Hot
el24
.00
24.0
024
.00
19.4
061
.60
19.0
058
384
5.0
En
erg
y D
etai
l
4.4
Fle
et M
ix
Land
Use
LD
ALD
T1
LDT
2M
DV
LHD
1LH
D2
MH
DH
HD
OB
US
UB
US
MC
YS
BU
SM
H
Hot
el0.
4487
950.
0606
870.
2061
490.
1458
870.
0579
160.
0092
820.
0146
260.
0426
270.
0029
290.
0019
050.
0064
090.
0015
530.
0012
36
His
toric
al E
nerg
y U
se: N
Cal
EE
Mod
Ver
sion
: Cal
EE
Mod
.201
6.3.
1D
ate:
1/4
/201
7 8:
30 A
MP
age
21 o
f 25
TR
ED
C H
otel
Pro
ject
- H
umbo
ldt C
ount
y, W
inte
r

RO
GN
Ox
CO
SO
2F
ugiti
veP
M10
Exh
aust
PM
10P
M10
Tot
alF
ugiti
veP
M2.
5E
xhau
stP
M2.
5P
M2.
5T
otal
Bio
- C
O2
NB
io-
CO
2T
otal
CO
2C
H4
N2O
CO
2e
Cat
egor
ylb
/day
lb/d
ay
Nat
ural
Gas
Miti
gate
d0.
0107
0.09
770.
0821
5.90
00e-
004
7.42
00e-
003
7.42
00e-
003
7.42
00e-
003
7.42
00e-
003
117.
2083
117.
2083
2.25
00e-
003
2.15
00e-
003
117.
9049
Nat
ural
Gas
Unm
itiga
ted
0.01
070.
0977
0.08
215.
9000
e-00
47.
4200
e-00
37.
4200
e-00
37.
4200
e-00
37.
4200
e-00
311
7.20
8311
7.20
832.
2500
e-00
32.
1500
e-00
311
7.90
49
5.2
En
erg
y b
y L
and
Use
- N
atu
ralG
as
Nat
ural
Ga
s U
seR
OG
NO
xC
OS
O2
Fug
itive
PM
10E
xhau
stP
M10
PM
10T
otal
Fug
itive
PM
2.5
Exh
aust
PM
2.5
PM
2.5
Tot
alB
io-
CO
2N
Bio
- C
O2
Tot
al C
O2
CH
4N
2OC
O2e
Land
Use
kBT
U/y
rlb
/day
lb/d
ay
Hot
el99
6.27
10.
0107
0.09
770.
0821
5.90
00e-
004
7.42
00e-
003
7.42
00e-
003
7.42
00e-
003
7.42
00e-
003
117.
2083
117.
2083
2.25
00e-
003
2.15
00e-
003
117.
9049
To
tal
0.01
070.
0977
0.08
215.
9000
e-00
47.
4200
e-00
37.
4200
e-00
37.
4200
e-00
37.
4200
e-00
311
7.20
8311
7.20
832.
2500
e-00
32.
1500
e-00
311
7.90
49
Un
mit
igat
ed
5.1
Mit
igat
ion
Mea
sure
s E
ner
gy
Cal
EE
Mod
Ver
sion
: Cal
EE
Mod
.201
6.3.
1D
ate:
1/4
/201
7 8:
30 A
MP
age
22 o
f 25
TR
ED
C H
otel
Pro
ject
- H
umbo
ldt C
ount
y, W
inte
r
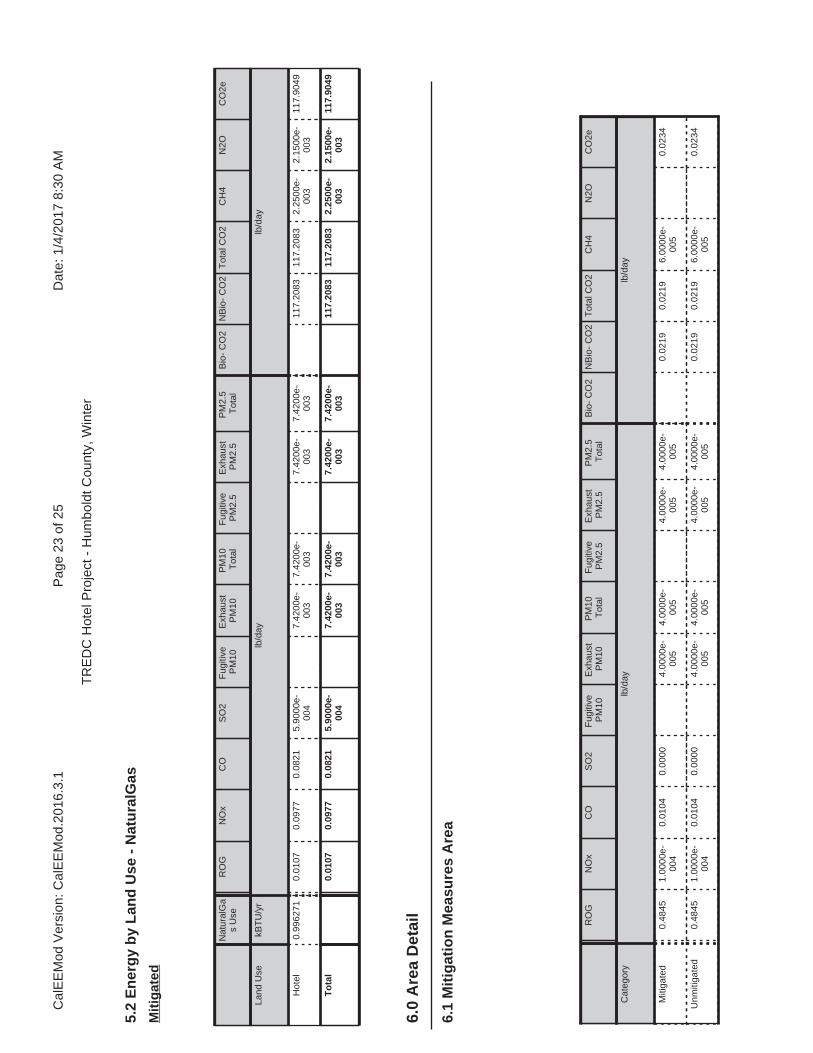
6.1
Mit
igat
ion
Mea
sure
s A
rea
6.0
Are
a D
etai
l
RO
GN
Ox
CO
SO
2F
ugiti
veP
M10
Exh
aust
PM
10P
M10
Tot
alF
ugiti
veP
M2.
5E
xhau
stP
M2.
5P
M2.
5T
otal
Bio
- C
O2
NB
io-
CO
2T
otal
CO
2C
H4
N2O
CO
2e
Cat
egor
ylb
/day
lb/d
ay
Miti
gate
d0.
4845
1.00
00e-
004
0.01
040.
0000
4.00
00e-
005
4.00
00e-
005
4.00
00e-
005
4.00
00e-
005
0.02
190.
0219
6.00
00e-
005
0.02
34
Unm
itiga
ted
0.48
451.
0000
e-00
40.
0104
0.00
004.
0000
e-00
54.
0000
e-00
54.
0000
e-00
54.
0000
e-00
50.
0219
0.02
196.
0000
e-00
50.
0234
5.2
En
erg
y b
y L
and
Use
- N
atu
ralG
as
Nat
ural
Ga
s U
seR
OG
NO
xC
OS
O2
Fug
itive
PM
10E
xhau
stP
M10
PM
10T
otal
Fug
itive
PM
2.5
Exh
aust
PM
2.5
PM
2.5
Tot
alB
io-
CO
2N
Bio
- C
O2
Tot
al C
O2
CH
4N
2OC
O2e
Land
Use
kBT
U/y
rlb
/day
lb/d
ay
Hot
el0.
9962
710.
0107
0.09
770.
0821
5.90
00e-
004
7.42
00e-
003
7.42
00e-
003
7.42
00e-
003
7.42
00e-
003
117.
2083
117.
2083
2.25
00e-
003
2.15
00e-
003
117.
9049
To
tal
0.01
070.
0977
0.08
215.
9000
e-00
47.
4200
e-00
37.
4200
e-00
37.
4200
e-00
37.
4200
e-00
311
7.20
8311
7.20
832.
2500
e-00
32.
1500
e-00
311
7.90
49
Mit
igat
ed
Cal
EE
Mod
Ver
sion
: Cal
EE
Mod
.201
6.3.
1D
ate:
1/4
/201
7 8:
30 A
MP
age
23 o
f 25
TR
ED
C H
otel
Pro
ject
- H
umbo
ldt C
ount
y, W
inte
r

7.0
Wat
er D
etai
l
6.2
Are
a b
y S
ub
Cat
ego
ry
RO
GN
Ox
CO
SO
2F
ugiti
veP
M10
Exh
aust
PM
10P
M10
Tot
alF
ugiti
veP
M2.
5E
xhau
stP
M2.
5P
M2.
5T
otal
Bio
- C
O2
NB
io-
CO
2T
otal
CO
2C
H4
N2O
CO
2e
Sub
Cat
egor
ylb
/day
lb/d
ay
Arc
hite
ctur
alC
oatin
g0.
1106
0.00
000.
0000
0.00
000.
0000
0.00
000.
0000
Con
sum
erP
rodu
cts
0.37
290.
0000
0.00
000.
0000
0.00
000.
0000
0.00
00
Land
scap
ing
9.90
00e-
004
1.00
00e-
004
0.01
040.
0000
4.00
00e-
005
4.00
00e-
005
4.00
00e-
005
4.00
00e-
005
0.02
190.
0219
6.00
00e-
005
0.02
34
To
tal
0.48
451.
0000
e-00
40.
0104
0.00
004.
0000
e-00
54.
0000
e-00
54.
0000
e-00
54.
0000
e-00
50.
0219
0.02
196.
0000
e-00
50.
0234
Un
mit
igat
ed
RO
GN
Ox
CO
SO
2F
ugiti
veP
M10
Exh
aust
PM
10P
M10
Tot
alF
ugiti
veP
M2.
5E
xhau
stP
M2.
5P
M2.
5T
otal
Bio
- C
O2
NB
io-
CO
2T
otal
CO
2C
H4
N2O
CO
2e
Sub
Cat
egor
ylb
/day
lb/d
ay
Arc
hite
ctur
alC
oatin
g0.
1106
0.00
000.
0000
0.00
000.
0000
0.00
000.
0000
Con
sum
erP
rodu
cts
0.37
290.
0000
0.00
000.
0000
0.00
000.
0000
0.00
00
Land
scap
ing
9.90
00e-
004
1.00
00e-
004
0.01
040.
0000
4.00
00e-
005
4.00
00e-
005
4.00
00e-
005
4.00
00e-
005
0.02
190.
0219
6.00
00e-
005
0.02
34
To
tal
0.48
451.
0000
e-00
40.
0104
0.00
004.
0000
e-00
54.
0000
e-00
54.
0000
e-00
54.
0000
e-00
50.
0219
0.02
196.
0000
e-00
50.
0234
Mit
igat
ed
Cal
EE
Mod
Ver
sion
: Cal
EE
Mod
.201
6.3.
1D
ate:
1/4
/201
7 8:
30 A
MP
age
24 o
f 25
TR
ED
C H
otel
Pro
ject
- H
umbo
ldt C
ount
y, W
inte
r
8.1
Mit
igat
ion
Mea
sure
s W
aste
Inst
all L
ow F
low
Bat
hroo
m F
auce
t
Inst
all L
ow F
low
Kitc
hen
Fau
cet
Inst
all L
ow F
low
Toi
let
Inst
all L
ow F
low
Sho
wer
7.1
Mit
igat
ion
Mea
sure
s W
ater
8.0
Was
te D
etai
l
11.0
Veg
etat
ion
9.0
Op
erat
ion
al O
ffro
ad
Equ
ipm
ent T
ype
Num
ber
Hou
rs/D
ayD
ays/
Yea
rH
orse
Pow
erLo
ad F
acto
rF
uel T
ype
10.0
Sta
tio
nar
y E
qu
ipm
ent
Fir
e P
um
ps
and
Em
erg
ency
Gen
erat
ors
Equ
ipm
ent T
ype
Num
ber
Hou
rs/D
ayH
ours
/Yea
rH
orse
Pow
erLo
ad F
acto
rF
uel T
ype
Bo
ilers
Equ
ipm
ent T
ype
Num
ber
Hea
t Inp
ut/D
ayH
eat I
nput
/Yea
rB
oile
r R
atin
gF
uel T
ype
Use
r D
efin
ed E
qu
ipm
ent
Equ
ipm
ent T
ype
Num
ber
Cal
EE
Mod
Ver
sion
: Cal
EE
Mod
.201
6.3.
1D
ate:
1/4
/201
7 8:
30 A
MP
age
25 o
f 25
TR
ED
C H
otel
Pro
ject
- H
umbo
ldt C
ount
y, W
inte
r
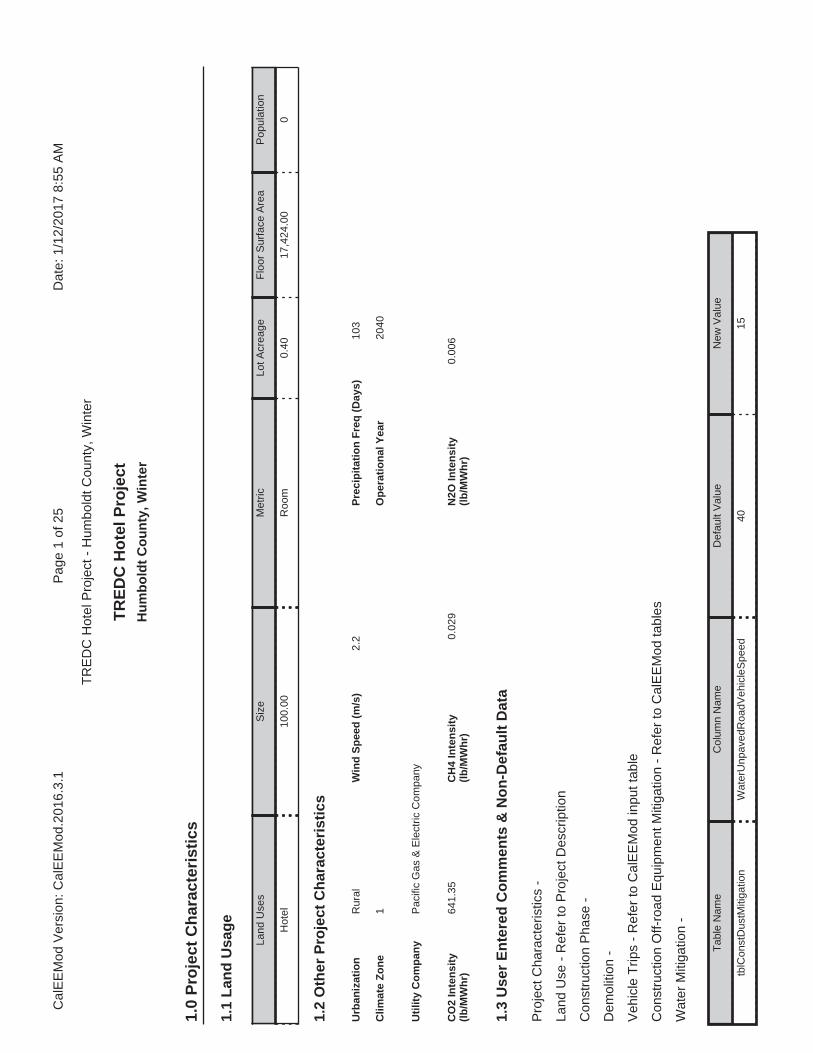
Pro
ject
Cha
ract
eris
tics
-
Land
Use
- R
efer
to P
roje
ct D
escr
iptio
n
Con
stru
ctio
n P
hase
-
Dem
oliti
on -
Veh
icle
Trip
s -
Ref
er to
Cal
EE
Mod
inpu
t tab
le
Con
stru
ctio
n O
ff-ro
ad E
quip
men
t Miti
gatio
n -
Ref
er to
Cal
EE
Mod
tabl
es
Wat
er M
itiga
tion
-
1.1
Lan
d U
sag
e
Land
Use
sS
ize
Met
ricLo
t Acr
eage
Flo
or S
urfa
ce A
rea
Pop
ulat
ion
Hot
el10
0.00
Roo
m0.
4017
,424
.00
0
1.2
Oth
er P
roje
ct C
har
acte
rist
ics
Urb
aniz
atio
n
Clim
ate
Zo
ne
Rur
al
1
Win
d S
pee
d (
m/s
)P
reci
pit
atio
n F
req
(D
ays)
2.2
103
1.3
Use
r E
nte
red
Co
mm
ents
& N
on
-Def
ault
Dat
a
1.0
Pro
ject
Ch
arac
teri
stic
s
Uti
lity
Co
mp
any
Pac
ific
Gas
& E
lect
ric C
ompa
ny
2040
Op
erat
ion
al Y
ear
CO
2 In
ten
sity
(l
b/M
Wh
r)64
1.35
0.02
9C
H4
Inte
nsi
ty
(lb
/MW
hr)
0.00
6N
2O In
ten
sity
(l
b/M
Wh
r)
Tab
le N
ame
Col
umn
Nam
eD
efau
lt V
alue
New
Val
ue
tblC
onst
Dus
tMiti
gatio
nW
ater
Unp
aved
Roa
dVeh
icle
Spe
ed40
15
TR
ED
C H
ote
l Pro
ject
Hu
mb
old
t C
ou
nty
, Win
ter
Cal
EE
Mod
Ver
sion
: Cal
EE
Mod
.201
6.3.
1D
ate:
1/1
2/20
17 8
:55
AM
Pag
e 1
of 2
5
TR
ED
C H
otel
Pro
ject
- H
umbo
ldt C
ount
y, W
inte
r
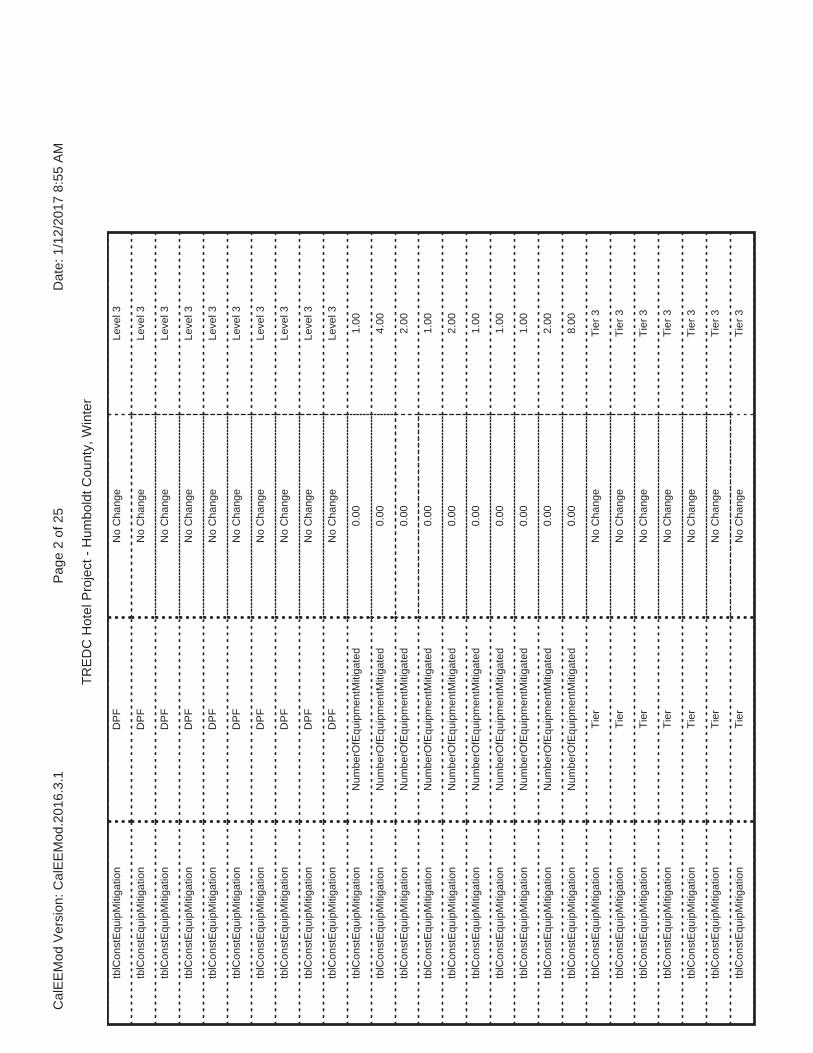
tblC
onst
Equ
ipM
itiga
tion
DP
FN
o C
hang
eLe
vel 3
tblC
onst
Equ
ipM
itiga
tion
DP
FN
o C
hang
eLe
vel 3
tblC
onst
Equ
ipM
itiga
tion
DP
FN
o C
hang
eLe
vel 3
tblC
onst
Equ
ipM
itiga
tion
DP
FN
o C
hang
eLe
vel 3
tblC
onst
Equ
ipM
itiga
tion
DP
FN
o C
hang
eLe
vel 3
tblC
onst
Equ
ipM
itiga
tion
DP
FN
o C
hang
eLe
vel 3
tblC
onst
Equ
ipM
itiga
tion
DP
FN
o C
hang
eLe
vel 3
tblC
onst
Equ
ipM
itiga
tion
DP
FN
o C
hang
eLe
vel 3
tblC
onst
Equ
ipM
itiga
tion
DP
FN
o C
hang
eLe
vel 3
tblC
onst
Equ
ipM
itiga
tion
DP
FN
o C
hang
eLe
vel 3
tblC
onst
Equ
ipM
itiga
tion
Num
berO
fEqu
ipm
entM
itiga
ted
0.00
1.00
tblC
onst
Equ
ipM
itiga
tion
Num
berO
fEqu
ipm
entM
itiga
ted
0.00
4.00
tblC
onst
Equ
ipM
itiga
tion
Num
berO
fEqu
ipm
entM
itiga
ted
0.00
2.00
tblC
onst
Equ
ipM
itiga
tion
Num
berO
fEqu
ipm
entM
itiga
ted
0.00
1.00
tblC
onst
Equ
ipM
itiga
tion
Num
berO
fEqu
ipm
entM
itiga
ted
0.00
2.00
tblC
onst
Equ
ipM
itiga
tion
Num
berO
fEqu
ipm
entM
itiga
ted
0.00
1.00
tblC
onst
Equ
ipM
itiga
tion
Num
berO
fEqu
ipm
entM
itiga
ted
0.00
1.00
tblC
onst
Equ
ipM
itiga
tion
Num
berO
fEqu
ipm
entM
itiga
ted
0.00
1.00
tblC
onst
Equ
ipM
itiga
tion
Num
berO
fEqu
ipm
entM
itiga
ted
0.00
2.00
tblC
onst
Equ
ipM
itiga
tion
Num
berO
fEqu
ipm
entM
itiga
ted
0.00
8.00
tblC
onst
Equ
ipM
itiga
tion
Tie
rN
o C
hang
eT
ier
3
tblC
onst
Equ
ipM
itiga
tion
Tie
rN
o C
hang
eT
ier
3
tblC
onst
Equ
ipM
itiga
tion
Tie
rN
o C
hang
eT
ier
3
tblC
onst
Equ
ipM
itiga
tion
Tie
rN
o C
hang
eT
ier
3
tblC
onst
Equ
ipM
itiga
tion
Tie
rN
o C
hang
eT
ier
3
tblC
onst
Equ
ipM
itiga
tion
Tie
rN
o C
hang
eT
ier
3
tblC
onst
Equ
ipM
itiga
tion
Tie
rN
o C
hang
eT
ier
3
Cal
EE
Mod
Ver
sion
: Cal
EE
Mod
.201
6.3.
1D
ate:
1/1
2/20
17 8
:55
AM
Pag
e 2
of 2
5
TR
ED
C H
otel
Pro
ject
- H
umbo
ldt C
ount
y, W
inte
r

2.0
Em
issi
on
s S
um
mar
y
tblC
onst
Equ
ipM
itiga
tion
Tie
rN
o C
hang
eT
ier
3
tblC
onst
Equ
ipM
itiga
tion
Tie
rN
o C
hang
eT
ier
3
tblC
onst
Equ
ipM
itiga
tion
Tie
rN
o C
hang
eT
ier
3
tblL
andU
seB
uild
ingS
pace
Squ
areF
eet
145,
200.
0017
,424
.00
tblL
andU
seLa
ndU
seS
quar
eFee
t14
5,20
0.00
17,4
24.0
0
tblL
andU
seLo
tAcr
eage
3.33
0.40
tblP
roje
ctC
hara
cter
istic
sO
pera
tiona
lYea
r20
1820
40
tblP
roje
ctC
hara
cter
istic
sU
rban
izat
ionL
evel
Urb
anR
ural
tblV
ehic
leT
rips
CC
_TL
6.60
24.0
0
tblV
ehic
leT
rips
CN
W_T
L6.
6024
.00
tblV
ehic
leT
rips
CW
_TL
14.7
024
.00
tblV
ehic
leT
rips
ST
_TR
8.19
5.73
tblV
ehic
leT
rips
SU
_TR
5.95
4.17
tblV
ehic
leT
rips
WD
_TR
8.17
5.72
Cal
EE
Mod
Ver
sion
: Cal
EE
Mod
.201
6.3.
1D
ate:
1/1
2/20
17 8
:55
AM
Pag
e 3
of 2
5
TR
ED
C H
otel
Pro
ject
- H
umbo
ldt C
ount
y, W
inte
r

2.1
Ove
rall
Co
nst
ruct
ion
(M
axim
um
Dai
ly E
mis
sio
n)
RO
GN
Ox
CO
SO
2F
ugiti
veP
M10
Exh
aust
PM
10P
M10
Tot
alF
ugiti
veP
M2.
5E
xhau
stP
M2.
5P
M2.
5T
otal
Bio
- C
O2
NB
io-
CO
2T
otal
CO
2C
H4
N2O
CO
2e
Yea
rlb
/day
lb/d
ay
2017
81.1
082
24.9
368
12.1
834
0.04
128.
1808
0.88
399.
0647
1.32
620.
8433
2.16
950.
0000
4,22
5.99
86
4,22
5.99
86
0.37
090.
0000
4,23
4.93
02
Max
imu
m81
.108
224
.936
812
.183
40.
0412
8.18
080.
8839
9.06
471.
3262
0.84
332.
1695
0.00
004,
225.
998
64,
225.
998
60.
3709
0.00
004,
234.
930
2
Un
mit
igat
ed C
on
stru
ctio
n
RO
GN
Ox
CO
SO
2F
ugiti
veP
M10
Exh
aust
PM
10P
M10
Tot
alF
ugiti
veP
M2.
5E
xhau
stP
M2.
5P
M2.
5T
otal
Bio
- C
O2
NB
io-
CO
2T
otal
CO
2C
H4
N2O
CO
2e
Yea
rlb
/day
lb/d
ay
2017
80.8
353
20.4
034
12.2
032
0.04
124.
0803
0.21
244.
2928
0.70
530.
2058
0.91
110.
0000
4,22
5.99
86
4,22
5.99
86
0.37
090.
0000
4,23
4.93
02
Max
imu
m80
.835
320
.403
412
.203
20.
0412
4.08
030.
2124
4.29
280.
7053
0.20
580.
9111
0.00
004,
225.
998
64,
225.
998
60.
3709
0.00
004,
234.
930
2
Mit
igat
ed C
on
stru
ctio
n
RO
GN
Ox
CO
SO
2F
ug
itiv
eP
M10
Exh
aust
PM
10P
M10
To
tal
Fu
git
ive
PM
2.5
Exh
aust
PM
2.5
PM
2.5
To
tal
Bio
- C
O2
NB
io-C
O2
To
tal C
O2
CH
4N
20C
O2e
Per
cen
tR
edu
ctio
n0.
3418
.18
-0.1
60.
0050
.12
75.9
752
.64
46.8
275
.60
58.0
00.
000.
000.
000.
000.
000.
00
Cal
EE
Mod
Ver
sion
: Cal
EE
Mod
.201
6.3.
1D
ate:
1/1
2/20
17 8
:55
AM
Pag
e 4
of 2
5
TR
ED
C H
otel
Pro
ject
- H
umbo
ldt C
ount
y, W
inte
r

2.2
Ove
rall
Op
erat
ion
al
RO
GN
Ox
CO
SO
2F
ugiti
veP
M10
Exh
aust
PM
10P
M10
Tot
alF
ugiti
veP
M2.
5E
xhau
stP
M2.
5P
M2.
5T
otal
Bio
- C
O2
NB
io-
CO
2T
otal
CO
2C
H4
N2O
CO
2e
Cat
egor
ylb
/day
lb/d
ay
Are
a0.
4844
9.00
00e-
005
0.01
010.
0000
4.00
00e-
005
4.00
00e-
005
4.00
00e-
005
4.00
00e-
005
0.02
190.
0219
6.00
00e-
005
0.02
33
Ene
rgy
0.01
070.
0977
0.08
215.
9000
e-00
47.
4200
e-00
37.
4200
e-00
37.
4200
e-00
37.
4200
e-00
311
7.20
8311
7.20
832.
2500
e-00
32.
1500
e-00
311
7.90
49
Mob
ile2.
7847
18.8
207
45.0
027
0.09
277.
1760
0.17
417.
3501
1.91
710.
1650
2.08
219,
323.
407
79,
323.
407
70.
5235
9,33
6.49
63
To
tal
3.27
9818
.918
445
.094
90.
0933
7.17
600.
1816
7.35
761.
9171
0.17
252.
0896
9,44
0.63
79
9,44
0.63
79
0.52
592.
1500
e-00
39,
454.
424
4
Un
mit
igat
ed O
per
atio
nal
RO
GN
Ox
CO
SO
2F
ugiti
veP
M10
Exh
aust
PM
10P
M10
Tot
alF
ugiti
veP
M2.
5E
xhau
stP
M2.
5P
M2.
5T
otal
Bio
- C
O2
NB
io-
CO
2T
otal
CO
2C
H4
N2O
CO
2e
Cat
egor
ylb
/day
lb/d
ay
Are
a0.
4844
9.00
00e-
005
0.01
010.
0000
4.00
00e-
005
4.00
00e-
005
4.00
00e-
005
4.00
00e-
005
0.02
190.
0219
6.00
00e-
005
0.02
33
Ene
rgy
0.01
070.
0977
0.08
215.
9000
e-00
47.
4200
e-00
37.
4200
e-00
37.
4200
e-00
37.
4200
e-00
311
7.20
8311
7.20
832.
2500
e-00
32.
1500
e-00
311
7.90
49
Mob
ile2.
7847
18.8
207
45.0
027
0.09
277.
1760
0.17
417.
3501
1.91
710.
1650
2.08
219,
323.
407
79,
323.
407
70.
5235
9,33
6.49
63
To
tal
3.27
9818
.918
445
.094
90.
0933
7.17
600.
1816
7.35
761.
9171
0.17
252.
0896
9,44
0.63
79
9,44
0.63
79
0.52
592.
1500
e-00
39,
454.
424
4
Mit
igat
ed O
per
atio
nal
Cal
EE
Mod
Ver
sion
: Cal
EE
Mod
.201
6.3.
1D
ate:
1/1
2/20
17 8
:55
AM
Pag
e 5
of 2
5
TR
ED
C H
otel
Pro
ject
- H
umbo
ldt C
ount
y, W
inte
r

3.0
Co
nst
ruct
ion
Det
ail
Co
nst
ruct
ion
Ph
ase
Pha
seN
umbe
rP
hase
Nam
eP
hase
Typ
eS
tart
Dat
eE
nd D
ate
Num
Day
s W
eek
Num
Day
sP
hase
Des
crip
tion
1D
emol
ition
Dem
oliti
on6/
1/20
176/
14/2
017
510
2S
ite P
repa
ratio
nS
ite P
repa
ratio
n6/
15/2
017
6/15
/201
75
1
3G
radi
ngG
radi
ng6/
16/2
017
6/19
/201
75
2
4B
uild
ing
Con
stru
ctio
nB
uild
ing
Con
stru
ctio
n6/
20/2
017
11/6
/201
75
100
5P
avin
gP
avin
g11
/7/2
017
11/1
3/20
175
5
6A
rchi
tect
ural
Coa
ting
Arc
hite
ctur
al C
oatin
g11
/14/
2017
11/2
0/20
175
5
Off
Ro
ad E
qu
ipm
ent
RO
GN
Ox
CO
SO
2F
ug
itiv
eP
M10
Exh
aust
PM
10P
M10
To
tal
Fu
git
ive
PM
2.5
Exh
aust
PM
2.5
PM
2.5
To
tal
Bio
- C
O2
NB
io-C
O2
To
tal C
O2
CH
4N
20C
O2e
Per
cen
tR
edu
ctio
n0.
000.
000.
000.
000.
000.
000.
000.
000.
000.
000.
000.
000.
000.
000.
000.
00
Res
iden
tial
Ind
oo
r: 0
; R
esid
enti
al O
utd
oo
r: 0
; N
on
-Res
iden
tial
Ind
oo
r: 2
6,13
6; N
on
-Res
iden
tial
Ou
tdo
or:
8,7
12;
Str
iped
Par
kin
g A
rea:
0
(Arc
hit
ectu
ral C
oat
ing
– s
qft
)
Acr
es o
f G
rad
ing
(S
ite
Pre
par
atio
n P
has
e):
0.5
Acr
es o
f G
rad
ing
(G
rad
ing
Ph
ase)
: 0
Acr
es o
f P
avin
g:
0
Cal
EE
Mod
Ver
sion
: Cal
EE
Mod
.201
6.3.
1D
ate:
1/1
2/20
17 8
:55
AM
Pag
e 6
of 2
5
TR
ED
C H
otel
Pro
ject
- H
umbo
ldt C
ount
y, W
inte
r

Pha
se N
ame
Offr
oad
Equ
ipm
ent T
ype
Am
ount
Usa
ge H
ours
Hor
se P
ower
Load
Fac
tor
Dem
oliti
onC
oncr
ete/
Indu
stria
l Saw
s1
8.00
810.
73
Dem
oliti
onR
ubbe
r T
ired
Doz
ers
11.
0024
70.
40
Dem
oliti
onT
ract
ors/
Load
ers/
Bac
khoe
s2
6.00
970.
37
Site
Pre
para
tion
Gra
ders
18.
0018
70.
41
Site
Pre
para
tion
Tra
ctor
s/Lo
ader
s/B
ackh
oes
18.
0097
0.37
Gra
ding
Con
cret
e/In
dust
rial S
aws
18.
0081
0.73
Gra
ding
Rub
ber
Tire
d D
ozer
s1
1.00
247
0.40
Gra
ding
Tra
ctor
s/Lo
ader
s/B
ackh
oes
26.
0097
0.37
Bui
ldin
g C
onst
ruct
ion
Cra
nes
14.
0023
10.
29
Bui
ldin
g C
onst
ruct
ion
For
klift
s2
6.00
890.
20
Bui
ldin
g C
onst
ruct
ion
Tra
ctor
s/Lo
ader
s/B
ackh
oes
28.
0097
0.37
Arc
hite
ctur
al C
oatin
gA
ir C
ompr
esso
rs1
6.00
780.
48
Pav
ing
Cem
ent a
nd M
orta
r M
ixer
s4
6.00
90.
56
Pav
ing
Pav
ers
17.
0013
00.
42
Pav
ing
Rol
lers
17.
0080
0.38
Pav
ing
Tra
ctor
s/Lo
ader
s/B
ackh
oes
17.
0097
0.37
Tri
ps
and
VM
T
Pha
se N
ame
Offr
oad
Equ
ipm
ent
Cou
ntW
orke
r T
rip
Num
ber
Ven
dor
Trip
N
umbe
rH
aulin
g T
rip
Num
ber
Wor
ker
Trip
Le
ngth
Ven
dor
Trip
Le
ngth
Hau
ling
Trip
Le
ngth
Wor
ker
Veh
icle
C
lass
Ven
dor
Veh
icle
Cla
ssH
aulin
gV
ehic
le C
lass
Dem
oliti
on4
10.0
00.
0034
4.00
16.8
06.
6020
.00
LD_M
ixH
DT
_Mix
HH
DT
Site
Pre
para
tion
25.
000.
000.
0016
.80
6.60
20.0
0LD
_Mix
HD
T_M
ixH
HD
T
Gra
ding
410
.00
0.00
0.00
16.8
06.
6020
.00
LD_M
ixH
DT
_Mix
HH
DT
Bui
ldin
g C
onst
ruct
ion
57.
003.
000.
0016
.80
6.60
20.0
0LD
_Mix
HD
T_M
ixH
HD
T
Arc
hite
ctur
al C
oatin
g1
1.00
0.00
0.00
16.8
06.
6020
.00
LD_M
ixH
DT
_Mix
HH
DT
Pav
ing
718
.00
0.00
0.00
16.8
06.
6020
.00
LD_M
ixH
DT
_Mix
HH
DT
Cal
EE
Mod
Ver
sion
: Cal
EE
Mod
.201
6.3.
1D
ate:
1/1
2/20
17 8
:55
AM
Pag
e 7
of 2
5
TR
ED
C H
otel
Pro
ject
- H
umbo
ldt C
ount
y, W
inte
r

3.2
Dem
olit
ion
- 2
017
RO
GN
Ox
CO
SO
2F
ugiti
veP
M10
Exh
aust
PM
10P
M10
Tot
alF
ugiti
veP
M2.
5E
xhau
stP
M2.
5P
M2.
5T
otal
Bio
- C
O2
NB
io-
CO
2T
otal
CO
2C
H4
N2O
CO
2e
Cat
egor
ylb
/day
lb/d
ay
Fug
itive
Dus
t7.
4554
0.00
007.
4554
1.12
880.
0000
1.12
880.
0000
0.00
00
Off-
Roa
d1.
2100
10.4
978
7.91
820.
0120
0.73
180.
7318
0.69
780.
6978
1,17
9.30
75
1,17
9.30
75
0.23
191,
185.
104
7
To
tal
1.21
0010
.497
87.
9182
0.01
207.
4554
0.73
188.
1872
1.12
880.
6978
1.82
661,
179.
307
51,
179.
307
50.
2319
1,18
5.10
47
Un
mit
igat
ed C
on
stru
ctio
n O
n-S
ite
3.1
Mit
igat
ion
Mea
sure
s C
on
stru
ctio
n
Use
Cle
aner
Eng
ines
for
Con
stru
ctio
n E
quip
men
t
Use
DP
F fo
r C
onst
ruct
ion
Equ
ipm
ent
Use
Soi
l Sta
biliz
er
Wat
er E
xpos
ed A
rea
Red
uce
Veh
icle
Spe
ed o
n U
npav
ed R
oads
Cal
EE
Mod
Ver
sion
: Cal
EE
Mod
.201
6.3.
1D
ate:
1/1
2/20
17 8
:55
AM
Pag
e 8
of 2
5
TR
ED
C H
otel
Pro
ject
- H
umbo
ldt C
ount
y, W
inte
r

3.2
Dem
olit
ion
- 2
017
RO
GN
Ox
CO
SO
2F
ugiti
veP
M10
Exh
aust
PM
10P
M10
Tot
alF
ugiti
veP
M2.
5E
xhau
stP
M2.
5P
M2.
5T
otal
Bio
- C
O2
NB
io-
CO
2T
otal
CO
2C
H4
N2O
CO
2e
Cat
egor
ylb
/day
lb/d
ay
Hau
ling
0.55
1114
.275
93.
0651
0.02
790.
5977
0.15
080.
7484
0.16
350.
1442
0.30
772,
917.
265
62,
917.
265
60.
1138
2,92
0.11
08
Ven
dor
0.00
000.
0000
0.00
000.
0000
0.00
000.
0000
0.00
000.
0000
0.00
000.
0000
0.00
000.
0000
0.00
000.
0000
Wor
ker
0.15
610.
1632
1.20
001.
3100
e-00
30.
1277
1.40
00e-
003
0.12
910.
0339
1.30
00e-
003
0.03
5212
9.42
5512
9.42
550.
0116
129.
7147
To
tal
0.70
7214
.439
04.
2652
0.02
920.
7254
0.15
220.
8776
0.19
740.
1455
0.34
293,
046.
691
13,
046.
691
10.
1254
3,04
9.82
55
Un
mit
igat
ed C
on
stru
ctio
n O
ff-S
ite
RO
GN
Ox
CO
SO
2F
ugiti
veP
M10
Exh
aust
PM
10P
M10
Tot
alF
ugiti
veP
M2.
5E
xhau
stP
M2.
5P
M2.
5T
otal
Bio
- C
O2
NB
io-
CO
2T
otal
CO
2C
H4
N2O
CO
2e
Cat
egor
ylb
/day
lb/d
ay
Fug
itive
Dus
t3.
3549
0.00
003.
3549
0.50
800.
0000
0.50
800.
0000
0.00
00
Off-
Roa
d0.
2652
5.96
447.
9381
0.01
200.
0603
0.06
030.
0603
0.06
030.
0000
1,17
9.30
75
1,17
9.30
75
0.23
191,
185.
104
7
To
tal
0.26
525.
9644
7.93
810.
0120
3.35
490.
0603
3.41
520.
5080
0.06
030.
5682
0.00
001,
179.
307
51,
179.
307
50.
2319
1,18
5.10
47
Mit
igat
ed C
on
stru
ctio
n O
n-S
ite
Cal
EE
Mod
Ver
sion
: Cal
EE
Mod
.201
6.3.
1D
ate:
1/1
2/20
17 8
:55
AM
Pag
e 9
of 2
5
TR
ED
C H
otel
Pro
ject
- H
umbo
ldt C
ount
y, W
inte
r

3.2
Dem
olit
ion
- 2
017
RO
GN
Ox
CO
SO
2F
ugiti
veP
M10
Exh
aust
PM
10P
M10
Tot
alF
ugiti
veP
M2.
5E
xhau
stP
M2.
5P
M2.
5T
otal
Bio
- C
O2
NB
io-
CO
2T
otal
CO
2C
H4
N2O
CO
2e
Cat
egor
ylb
/day
lb/d
ay
Hau
ling
0.55
1114
.275
93.
0651
0.02
790.
5977
0.15
080.
7484
0.16
350.
1442
0.30
772,
917.
265
62,
917.
265
60.
1138
2,92
0.11
08
Ven
dor
0.00
000.
0000
0.00
000.
0000
0.00
000.
0000
0.00
000.
0000
0.00
000.
0000
0.00
000.
0000
0.00
000.
0000
Wor
ker
0.15
610.
1632
1.20
001.
3100
e-00
30.
1277
1.40
00e-
003
0.12
910.
0339
1.30
00e-
003
0.03
5212
9.42
5512
9.42
550.
0116
129.
7147
To
tal
0.70
7214
.439
04.
2652
0.02
920.
7254
0.15
220.
8776
0.19
740.
1455
0.34
293,
046.
691
13,
046.
691
10.
1254
3,04
9.82
55
Mit
igat
ed C
on
stru
ctio
n O
ff-S
ite
3.3
Sit
e P
rep
arat
ion
- 2
017
RO
GN
Ox
CO
SO
2F
ugiti
veP
M10
Exh
aust
PM
10P
M10
Tot
alF
ugiti
veP
M2.
5E
xhau
stP
M2.
5P
M2.
5T
otal
Bio
- C
O2
NB
io-
CO
2T
otal
CO
2C
H4
N2O
CO
2e
Cat
egor
ylb
/day
lb/d
ay
Fug
itive
Dus
t0.
5303
0.00
000.
5303
0.05
730.
0000
0.05
730.
0000
0.00
00
Off-
Roa
d0.
8524
10.5
148
4.35
339.
7700
e-00
30.
4726
0.47
260.
4347
0.43
4799
9.52
0199
9.52
010.
3063
1,00
7.17
64
To
tal
0.85
2410
.514
84.
3533
9.77
00e-
003
0.53
030.
4726
1.00
280.
0573
0.43
470.
4920
999.
5201
999.
5201
0.30
631,
007.
176
4
Un
mit
igat
ed C
on
stru
ctio
n O
n-S
ite
Cal
EE
Mod
Ver
sion
: Cal
EE
Mod
.201
6.3.
1D
ate:
1/1
2/20
17 8
:55
AM
Pag
e 10
of 2
5
TR
ED
C H
otel
Pro
ject
- H
umbo
ldt C
ount
y, W
inte
r

3.3
Sit
e P
rep
arat
ion
- 2
017
RO
GN
Ox
CO
SO
2F
ugiti
veP
M10
Exh
aust
PM
10P
M10
Tot
alF
ugiti
veP
M2.
5E
xhau
stP
M2.
5P
M2.
5T
otal
Bio
- C
O2
NB
io-
CO
2T
otal
CO
2C
H4
N2O
CO
2e
Cat
egor
ylb
/day
lb/d
ay
Hau
ling
0.00
000.
0000
0.00
000.
0000
0.00
000.
0000
0.00
000.
0000
0.00
000.
0000
0.00
000.
0000
0.00
000.
0000
Ven
dor
0.00
000.
0000
0.00
000.
0000
0.00
000.
0000
0.00
000.
0000
0.00
000.
0000
0.00
000.
0000
0.00
000.
0000
Wor
ker
0.07
800.
0816
0.60
006.
6000
e-00
40.
0639
7.00
00e-
004
0.06
460.
0169
6.50
00e-
004
0.01
7664
.712
764
.712
75.
7800
e-00
364
.857
4
To
tal
0.07
800.
0816
0.60
006.
6000
e-00
40.
0639
7.00
00e-
004
0.06
460.
0169
6.50
00e-
004
0.01
7664
.712
764
.712
75.
7800
e-00
364
.857
4
Un
mit
igat
ed C
on
stru
ctio
n O
ff-S
ite
RO
GN
Ox
CO
SO
2F
ugiti
veP
M10
Exh
aust
PM
10P
M10
Tot
alF
ugiti
veP
M2.
5E
xhau
stP
M2.
5P
M2.
5T
otal
Bio
- C
O2
NB
io-
CO
2T
otal
CO
2C
H4
N2O
CO
2e
Cat
egor
ylb
/day
lb/d
ay
Fug
itive
Dus
t0.
2386
0.00
000.
2386
0.02
580.
0000
0.02
580.
0000
0.00
00
Off-
Roa
d0.
2382
4.87
165.
8579
9.77
00e-
003
0.03
610.
0361
0.03
610.
0361
0.00
0099
9.52
0199
9.52
010.
3063
1,00
7.17
64
To
tal
0.23
824.
8716
5.85
799.
7700
e-00
30.
2386
0.03
610.
2747
0.02
580.
0361
0.06
180.
0000
999.
5201
999.
5201
0.30
631,
007.
176
4
Mit
igat
ed C
on
stru
ctio
n O
n-S
ite
Cal
EE
Mod
Ver
sion
: Cal
EE
Mod
.201
6.3.
1D
ate:
1/1
2/20
17 8
:55
AM
Pag
e 11
of 2
5
TR
ED
C H
otel
Pro
ject
- H
umbo
ldt C
ount
y, W
inte
r
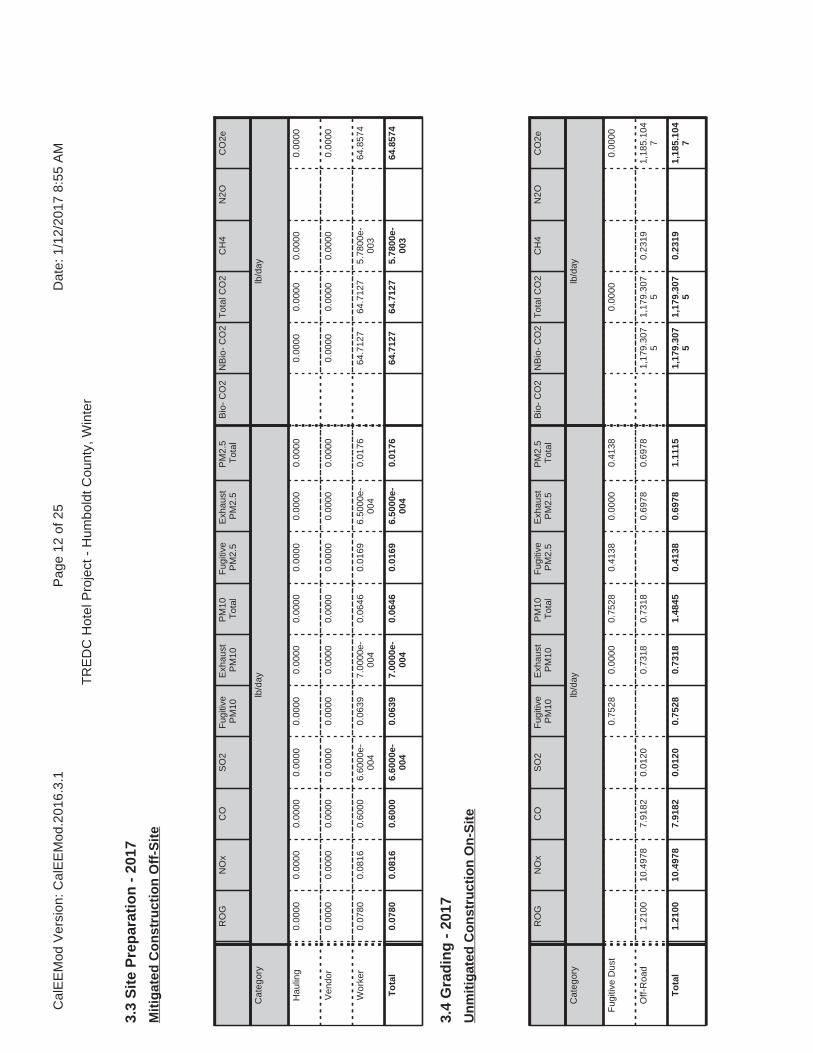
3.3
Sit
e P
rep
arat
ion
- 2
017
RO
GN
Ox
CO
SO
2F
ugiti
veP
M10
Exh
aust
PM
10P
M10
Tot
alF
ugiti
veP
M2.
5E
xhau
stP
M2.
5P
M2.
5T
otal
Bio
- C
O2
NB
io-
CO
2T
otal
CO
2C
H4
N2O
CO
2e
Cat
egor
ylb
/day
lb/d
ay
Hau
ling
0.00
000.
0000
0.00
000.
0000
0.00
000.
0000
0.00
000.
0000
0.00
000.
0000
0.00
000.
0000
0.00
000.
0000
Ven
dor
0.00
000.
0000
0.00
000.
0000
0.00
000.
0000
0.00
000.
0000
0.00
000.
0000
0.00
000.
0000
0.00
000.
0000
Wor
ker
0.07
800.
0816
0.60
006.
6000
e-00
40.
0639
7.00
00e-
004
0.06
460.
0169
6.50
00e-
004
0.01
7664
.712
764
.712
75.
7800
e-00
364
.857
4
To
tal
0.07
800.
0816
0.60
006.
6000
e-00
40.
0639
7.00
00e-
004
0.06
460.
0169
6.50
00e-
004
0.01
7664
.712
764
.712
75.
7800
e-00
364
.857
4
Mit
igat
ed C
on
stru
ctio
n O
ff-S
ite
3.4
Gra
din
g -
201
7
RO
GN
Ox
CO
SO
2F
ugiti
veP
M10
Exh
aust
PM
10P
M10
Tot
alF
ugiti
veP
M2.
5E
xhau
stP
M2.
5P
M2.
5T
otal
Bio
- C
O2
NB
io-
CO
2T
otal
CO
2C
H4
N2O
CO
2e
Cat
egor
ylb
/day
lb/d
ay
Fug
itive
Dus
t0.
7528
0.00
000.
7528
0.41
380.
0000
0.41
380.
0000
0.00
00
Off-
Roa
d1.
2100
10.4
978
7.91
820.
0120
0.73
180.
7318
0.69
780.
6978
1,17
9.30
75
1,17
9.30
75
0.23
191,
185.
104
7
To
tal
1.21
0010
.497
87.
9182
0.01
200.
7528
0.73
181.
4845
0.41
380.
6978
1.11
151,
179.
307
51,
179.
307
50.
2319
1,18
5.10
47
Un
mit
igat
ed C
on
stru
ctio
n O
n-S
ite
Cal
EE
Mod
Ver
sion
: Cal
EE
Mod
.201
6.3.
1D
ate:
1/1
2/20
17 8
:55
AM
Pag
e 12
of 2
5
TR
ED
C H
otel
Pro
ject
- H
umbo
ldt C
ount
y, W
inte
r

3.4
Gra
din
g -
201
7
RO
GN
Ox
CO
SO
2F
ugiti
veP
M10
Exh
aust
PM
10P
M10
Tot
alF
ugiti
veP
M2.
5E
xhau
stP
M2.
5P
M2.
5T
otal
Bio
- C
O2
NB
io-
CO
2T
otal
CO
2C
H4
N2O
CO
2e
Cat
egor
ylb
/day
lb/d
ay
Hau
ling
0.00
000.
0000
0.00
000.
0000
0.00
000.
0000
0.00
000.
0000
0.00
000.
0000
0.00
000.
0000
0.00
000.
0000
Ven
dor
0.00
000.
0000
0.00
000.
0000
0.00
000.
0000
0.00
000.
0000
0.00
000.
0000
0.00
000.
0000
0.00
000.
0000
Wor
ker
0.15
610.
1632
1.20
001.
3100
e-00
30.
1277
1.40
00e-
003
0.12
910.
0339
1.30
00e-
003
0.03
5212
9.42
5512
9.42
550.
0116
129.
7147
To
tal
0.15
610.
1632
1.20
001.
3100
e-00
30.
1277
1.40
00e-
003
0.12
910.
0339
1.30
00e-
003
0.03
5212
9.42
5512
9.42
550.
0116
129.
7147
Un
mit
igat
ed C
on
stru
ctio
n O
ff-S
ite
RO
GN
Ox
CO
SO
2F
ugiti
veP
M10
Exh
aust
PM
10P
M10
Tot
alF
ugiti
veP
M2.
5E
xhau
stP
M2.
5P
M2.
5T
otal
Bio
- C
O2
NB
io-
CO
2T
otal
CO
2C
H4
N2O
CO
2e
Cat
egor
ylb
/day
lb/d
ay
Fug
itive
Dus
t0.
3387
0.00
000.
3387
0.18
620.
0000
0.18
620.
0000
0.00
00
Off-
Roa
d0.
2652
5.96
447.
9381
0.01
200.
0603
0.06
030.
0603
0.06
030.
0000
1,17
9.30
75
1,17
9.30
75
0.23
191,
185.
104
7
To
tal
0.26
525.
9644
7.93
810.
0120
0.33
870.
0603
0.39
900.
1862
0.06
030.
2465
0.00
001,
179.
307
51,
179.
307
50.
2319
1,18
5.10
47
Mit
igat
ed C
on
stru
ctio
n O
n-S
ite
Cal
EE
Mod
Ver
sion
: Cal
EE
Mod
.201
6.3.
1D
ate:
1/1
2/20
17 8
:55
AM
Pag
e 13
of 2
5
TR
ED
C H
otel
Pro
ject
- H
umbo
ldt C
ount
y, W
inte
r

3.4
Gra
din
g -
201
7
RO
GN
Ox
CO
SO
2F
ugiti
veP
M10
Exh
aust
PM
10P
M10
Tot
alF
ugiti
veP
M2.
5E
xhau
stP
M2.
5P
M2.
5T
otal
Bio
- C
O2
NB
io-
CO
2T
otal
CO
2C
H4
N2O
CO
2e
Cat
egor
ylb
/day
lb/d
ay
Hau
ling
0.00
000.
0000
0.00
000.
0000
0.00
000.
0000
0.00
000.
0000
0.00
000.
0000
0.00
000.
0000
0.00
000.
0000
Ven
dor
0.00
000.
0000
0.00
000.
0000
0.00
000.
0000
0.00
000.
0000
0.00
000.
0000
0.00
000.
0000
0.00
000.
0000
Wor
ker
0.15
610.
1632
1.20
001.
3100
e-00
30.
1277
1.40
00e-
003
0.12
910.
0339
1.30
00e-
003
0.03
5212
9.42
5512
9.42
550.
0116
129.
7147
To
tal
0.15
610.
1632
1.20
001.
3100
e-00
30.
1277
1.40
00e-
003
0.12
910.
0339
1.30
00e-
003
0.03
5212
9.42
5512
9.42
550.
0116
129.
7147
Mit
igat
ed C
on
stru
ctio
n O
ff-S
ite
3.5
Bu
ildin
g C
on
stru
ctio
n -
201
7
RO
GN
Ox
CO
SO
2F
ugiti
veP
M10
Exh
aust
PM
10P
M10
Tot
alF
ugiti
veP
M2.
5E
xhau
stP
M2.
5P
M2.
5T
otal
Bio
- C
O2
NB
io-
CO
2T
otal
CO
2C
H4
N2O
CO
2e
Cat
egor
ylb
/day
lb/d
ay
Off-
Roa
d1.
2812
12.7
589
8.07
000.
0114
0.85
910.
8591
0.79
040.
7904
1,16
5.91
64
1,16
5.91
64
0.35
721,
174.
847
3
To
tal
1.28
1212
.758
98.
0700
0.01
140.
8591
0.85
910.
7904
0.79
041,
165.
916
41,
165.
916
40.
3572
1,17
4.84
73
Un
mit
igat
ed C
on
stru
ctio
n O
n-S
ite
Cal
EE
Mod
Ver
sion
: Cal
EE
Mod
.201
6.3.
1D
ate:
1/1
2/20
17 8
:55
AM
Pag
e 14
of 2
5
TR
ED
C H
otel
Pro
ject
- H
umbo
ldt C
ount
y, W
inte
r
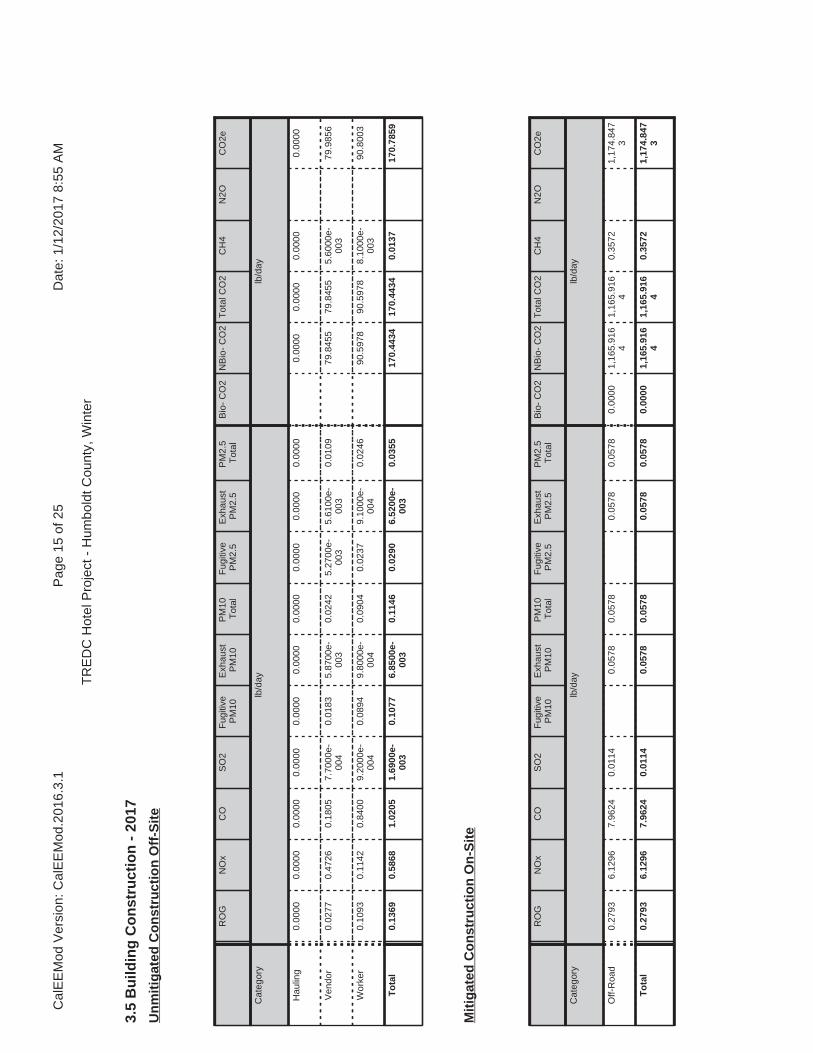
3.5
Bu
ildin
g C
on
stru
ctio
n -
201
7
RO
GN
Ox
CO
SO
2F
ugiti
veP
M10
Exh
aust
PM
10P
M10
Tot
alF
ugiti
veP
M2.
5E
xhau
stP
M2.
5P
M2.
5T
otal
Bio
- C
O2
NB
io-
CO
2T
otal
CO
2C
H4
N2O
CO
2e
Cat
egor
ylb
/day
lb/d
ay
Hau
ling
0.00
000.
0000
0.00
000.
0000
0.00
000.
0000
0.00
000.
0000
0.00
000.
0000
0.00
000.
0000
0.00
000.
0000
Ven
dor
0.02
770.
4726
0.18
057.
7000
e-00
40.
0183
5.87
00e-
003
0.02
425.
2700
e-00
35.
6100
e-00
30.
0109
79.8
455
79.8
455
5.60
00e-
003
79.9
856
Wor
ker
0.10
930.
1142
0.84
009.
2000
e-00
40.
0894
9.80
00e-
004
0.09
040.
0237
9.10
00e-
004
0.02
4690
.597
890
.597
88.
1000
e-00
390
.800
3
To
tal
0.13
690.
5868
1.02
051.
6900
e-00
30.
1077
6.85
00e-
003
0.11
460.
0290
6.52
00e-
003
0.03
5517
0.44
3417
0.44
340.
0137
170.
7859
Un
mit
igat
ed C
on
stru
ctio
n O
ff-S
ite
RO
GN
Ox
CO
SO
2F
ugiti
veP
M10
Exh
aust
PM
10P
M10
Tot
alF
ugiti
veP
M2.
5E
xhau
stP
M2.
5P
M2.
5T
otal
Bio
- C
O2
NB
io-
CO
2T
otal
CO
2C
H4
N2O
CO
2e
Cat
egor
ylb
/day
lb/d
ay
Off-
Roa
d0.
2793
6.12
967.
9624
0.01
140.
0578
0.05
780.
0578
0.05
780.
0000
1,16
5.91
64
1,16
5.91
64
0.35
721,
174.
847
3
To
tal
0.27
936.
1296
7.96
240.
0114
0.05
780.
0578
0.05
780.
0578
0.00
001,
165.
916
41,
165.
916
40.
3572
1,17
4.84
73
Mit
igat
ed C
on
stru
ctio
n O
n-S
ite
Cal
EE
Mod
Ver
sion
: Cal
EE
Mod
.201
6.3.
1D
ate:
1/1
2/20
17 8
:55
AM
Pag
e 15
of 2
5
TR
ED
C H
otel
Pro
ject
- H
umbo
ldt C
ount
y, W
inte
r

3.5
Bu
ildin
g C
on
stru
ctio
n -
201
7
RO
GN
Ox
CO
SO
2F
ugiti
veP
M10
Exh
aust
PM
10P
M10
Tot
alF
ugiti
veP
M2.
5E
xhau
stP
M2.
5P
M2.
5T
otal
Bio
- C
O2
NB
io-
CO
2T
otal
CO
2C
H4
N2O
CO
2e
Cat
egor
ylb
/day
lb/d
ay
Hau
ling
0.00
000.
0000
0.00
000.
0000
0.00
000.
0000
0.00
000.
0000
0.00
000.
0000
0.00
000.
0000
0.00
000.
0000
Ven
dor
0.02
770.
4726
0.18
057.
7000
e-00
40.
0183
5.87
00e-
003
0.02
425.
2700
e-00
35.
6100
e-00
30.
0109
79.8
455
79.8
455
5.60
00e-
003
79.9
856
Wor
ker
0.10
930.
1142
0.84
009.
2000
e-00
40.
0894
9.80
00e-
004
0.09
040.
0237
9.10
00e-
004
0.02
4690
.597
890
.597
88.
1000
e-00
390
.800
3
To
tal
0.13
690.
5868
1.02
051.
6900
e-00
30.
1077
6.85
00e-
003
0.11
460.
0290
6.52
00e-
003
0.03
5517
0.44
3417
0.44
340.
0137
170.
7859
Mit
igat
ed C
on
stru
ctio
n O
ff-S
ite
3.6
Pav
ing
- 2
017
RO
GN
Ox
CO
SO
2F
ugiti
veP
M10
Exh
aust
PM
10P
M10
Tot
alF
ugiti
veP
M2.
5E
xhau
stP
M2.
5P
M2.
5T
otal
Bio
- C
O2
NB
io-
CO
2T
otal
CO
2C
H4
N2O
CO
2e
Cat
egor
ylb
/day
lb/d
ay
Off-
Roa
d1.
0532
9.97
547.
3425
0.01
130.
6087
0.60
870.
5636
0.56
361,
085.
107
11,
085.
107
10.
3018
1,09
2.65
15
Pav
ing
0.00
000.
0000
0.00
000.
0000
0.00
000.
0000
0.00
00
To
tal
1.05
329.
9754
7.34
250.
0113
0.60
870.
6087
0.56
360.
5636
1,08
5.10
71
1,08
5.10
71
0.30
181,
092.
651
5
Un
mit
igat
ed C
on
stru
ctio
n O
n-S
ite
Cal
EE
Mod
Ver
sion
: Cal
EE
Mod
.201
6.3.
1D
ate:
1/1
2/20
17 8
:55
AM
Pag
e 16
of 2
5
TR
ED
C H
otel
Pro
ject
- H
umbo
ldt C
ount
y, W
inte
r

3.6
Pav
ing
- 2
017
RO
GN
Ox
CO
SO
2F
ugiti
veP
M10
Exh
aust
PM
10P
M10
Tot
alF
ugiti
veP
M2.
5E
xhau
stP
M2.
5P
M2.
5T
otal
Bio
- C
O2
NB
io-
CO
2T
otal
CO
2C
H4
N2O
CO
2e
Cat
egor
ylb
/day
lb/d
ay
Hau
ling
0.00
000.
0000
0.00
000.
0000
0.00
000.
0000
0.00
000.
0000
0.00
000.
0000
0.00
000.
0000
0.00
000.
0000
Ven
dor
0.00
000.
0000
0.00
000.
0000
0.00
000.
0000
0.00
000.
0000
0.00
000.
0000
0.00
000.
0000
0.00
000.
0000
Wor
ker
0.28
090.
2937
2.16
002.
3600
e-00
30.
2299
2.53
00e-
003
0.23
240.
0610
2.34
00e-
003
0.06
3323
2.96
5923
2.96
590.
0208
233.
4865
To
tal
0.28
090.
2937
2.16
002.
3600
e-00
30.
2299
2.53
00e-
003
0.23
240.
0610
2.34
00e-
003
0.06
3323
2.96
5923
2.96
590.
0208
233.
4865
Un
mit
igat
ed C
on
stru
ctio
n O
ff-S
ite
RO
GN
Ox
CO
SO
2F
ugiti
veP
M10
Exh
aust
PM
10P
M10
Tot
alF
ugiti
veP
M2.
5E
xhau
stP
M2.
5P
M2.
5T
otal
Bio
- C
O2
NB
io-
CO
2T
otal
CO
2C
H4
N2O
CO
2e
Cat
egor
ylb
/day
lb/d
ay
Off-
Roa
d0.
2239
4.75
796.
9028
0.01
130.
0436
0.04
360.
0436
0.04
360.
0000
1,08
5.10
71
1,08
5.10
71
0.30
181,
092.
651
5
Pav
ing
0.00
000.
0000
0.00
000.
0000
0.00
000.
0000
0.00
00
To
tal
0.22
394.
7579
6.90
280.
0113
0.04
360.
0436
0.04
360.
0436
0.00
001,
085.
107
11,
085.
107
10.
3018
1,09
2.65
15
Mit
igat
ed C
on
stru
ctio
n O
n-S
ite
Cal
EE
Mod
Ver
sion
: Cal
EE
Mod
.201
6.3.
1D
ate:
1/1
2/20
17 8
:55
AM
Pag
e 17
of 2
5
TR
ED
C H
otel
Pro
ject
- H
umbo
ldt C
ount
y, W
inte
r
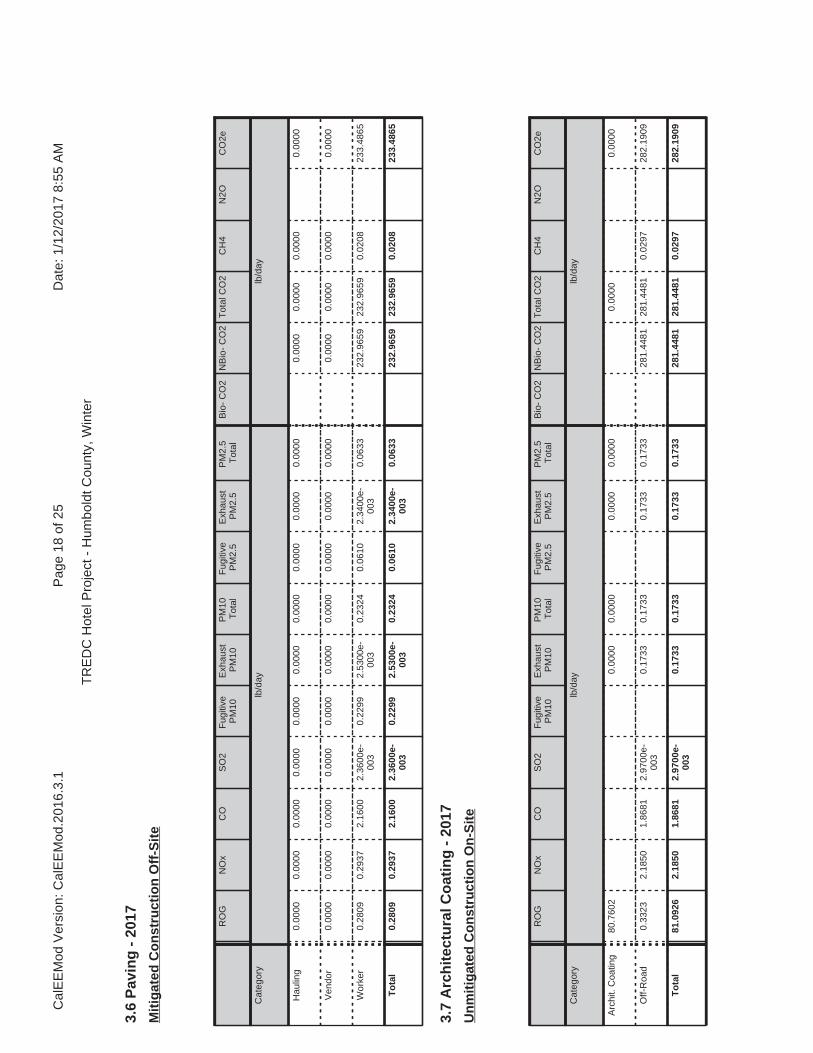
3.6
Pav
ing
- 2
017
RO
GN
Ox
CO
SO
2F
ugiti
veP
M10
Exh
aust
PM
10P
M10
Tot
alF
ugiti
veP
M2.
5E
xhau
stP
M2.
5P
M2.
5T
otal
Bio
- C
O2
NB
io-
CO
2T
otal
CO
2C
H4
N2O
CO
2e
Cat
egor
ylb
/day
lb/d
ay
Hau
ling
0.00
000.
0000
0.00
000.
0000
0.00
000.
0000
0.00
000.
0000
0.00
000.
0000
0.00
000.
0000
0.00
000.
0000
Ven
dor
0.00
000.
0000
0.00
000.
0000
0.00
000.
0000
0.00
000.
0000
0.00
000.
0000
0.00
000.
0000
0.00
000.
0000
Wor
ker
0.28
090.
2937
2.16
002.
3600
e-00
30.
2299
2.53
00e-
003
0.23
240.
0610
2.34
00e-
003
0.06
3323
2.96
5923
2.96
590.
0208
233.
4865
To
tal
0.28
090.
2937
2.16
002.
3600
e-00
30.
2299
2.53
00e-
003
0.23
240.
0610
2.34
00e-
003
0.06
3323
2.96
5923
2.96
590.
0208
233.
4865
Mit
igat
ed C
on
stru
ctio
n O
ff-S
ite
3.7
Arc
hit
ectu
ral C
oat
ing
- 2
017
RO
GN
Ox
CO
SO
2F
ugiti
veP
M10
Exh
aust
PM
10P
M10
Tot
alF
ugiti
veP
M2.
5E
xhau
stP
M2.
5P
M2.
5T
otal
Bio
- C
O2
NB
io-
CO
2T
otal
CO
2C
H4
N2O
CO
2e
Cat
egor
ylb
/day
lb/d
ay
Arc
hit.
Coa
ting
80.7
602
0.00
000.
0000
0.00
000.
0000
0.00
000.
0000
Off-
Roa
d0.
3323
2.18
501.
8681
2.97
00e-
003
0.17
330.
1733
0.17
330.
1733
281.
4481
281.
4481
0.02
9728
2.19
09
To
tal
81.0
926
2.18
501.
8681
2.97
00e-
003
0.17
330.
1733
0.17
330.
1733
281.
4481
281.
4481
0.02
9728
2.19
09
Un
mit
igat
ed C
on
stru
ctio
n O
n-S
ite
Cal
EE
Mod
Ver
sion
: Cal
EE
Mod
.201
6.3.
1D
ate:
1/1
2/20
17 8
:55
AM
Pag
e 18
of 2
5
TR
ED
C H
otel
Pro
ject
- H
umbo
ldt C
ount
y, W
inte
r

3.7
Arc
hit
ectu
ral C
oat
ing
- 2
017
RO
GN
Ox
CO
SO
2F
ugiti
veP
M10
Exh
aust
PM
10P
M10
Tot
alF
ugiti
veP
M2.
5E
xhau
stP
M2.
5P
M2.
5T
otal
Bio
- C
O2
NB
io-
CO
2T
otal
CO
2C
H4
N2O
CO
2e
Cat
egor
ylb
/day
lb/d
ay
Hau
ling
0.00
000.
0000
0.00
000.
0000
0.00
000.
0000
0.00
000.
0000
0.00
000.
0000
0.00
000.
0000
0.00
000.
0000
Ven
dor
0.00
000.
0000
0.00
000.
0000
0.00
000.
0000
0.00
000.
0000
0.00
000.
0000
0.00
000.
0000
0.00
000.
0000
Wor
ker
0.01
560.
0163
0.12
001.
3000
e-00
40.
0128
1.40
00e-
004
0.01
293.
3900
e-00
31.
3000
e-00
43.
5200
e-00
312
.942
612
.942
61.
1600
e-00
312
.971
5
To
tal
0.01
560.
0163
0.12
001.
3000
e-00
40.
0128
1.40
00e-
004
0.01
293.
3900
e-00
31.
3000
e-00
43.
5200
e-00
312
.942
612
.942
61.
1600
e-00
312
.971
5
Un
mit
igat
ed C
on
stru
ctio
n O
ff-S
ite
RO
GN
Ox
CO
SO
2F
ugiti
veP
M10
Exh
aust
PM
10P
M10
Tot
alF
ugiti
veP
M2.
5E
xhau
stP
M2.
5P
M2.
5T
otal
Bio
- C
O2
NB
io-
CO
2T
otal
CO
2C
H4
N2O
CO
2e
Cat
egor
ylb
/day
lb/d
ay
Arc
hit.
Coa
ting
80.7
602
0.00
000.
0000
0.00
000.
0000
0.00
000.
0000
Off-
Roa
d0.
0594
1.35
701.
8324
2.97
00e-
003
0.01
430.
0143
0.01
430.
0143
0.00
0028
1.44
8128
1.44
810.
0297
282.
1909
To
tal
80.8
197
1.35
701.
8324
2.97
00e-
003
0.01
430.
0143
0.01
430.
0143
0.00
0028
1.44
8128
1.44
810.
0297
282.
1909
Mit
igat
ed C
on
stru
ctio
n O
n-S
ite
Cal
EE
Mod
Ver
sion
: Cal
EE
Mod
.201
6.3.
1D
ate:
1/1
2/20
17 8
:55
AM
Pag
e 19
of 2
5
TR
ED
C H
otel
Pro
ject
- H
umbo
ldt C
ount
y, W
inte
r

4.0
Op
erat
ion
al D
etai
l - M
ob
ile
4.1
Mit
igat
ion
Mea
sure
s M
ob
ile
3.7
Arc
hit
ectu
ral C
oat
ing
- 2
017
RO
GN
Ox
CO
SO
2F
ugiti
veP
M10
Exh
aust
PM
10P
M10
Tot
alF
ugiti
veP
M2.
5E
xhau
stP
M2.
5P
M2.
5T
otal
Bio
- C
O2
NB
io-
CO
2T
otal
CO
2C
H4
N2O
CO
2e
Cat
egor
ylb
/day
lb/d
ay
Hau
ling
0.00
000.
0000
0.00
000.
0000
0.00
000.
0000
0.00
000.
0000
0.00
000.
0000
0.00
000.
0000
0.00
000.
0000
Ven
dor
0.00
000.
0000
0.00
000.
0000
0.00
000.
0000
0.00
000.
0000
0.00
000.
0000
0.00
000.
0000
0.00
000.
0000
Wor
ker
0.01
560.
0163
0.12
001.
3000
e-00
40.
0128
1.40
00e-
004
0.01
293.
3900
e-00
31.
3000
e-00
43.
5200
e-00
312
.942
612
.942
61.
1600
e-00
312
.971
5
To
tal
0.01
560.
0163
0.12
001.
3000
e-00
40.
0128
1.40
00e-
004
0.01
293.
3900
e-00
31.
3000
e-00
43.
5200
e-00
312
.942
612
.942
61.
1600
e-00
312
.971
5
Mit
igat
ed C
on
stru
ctio
n O
ff-S
ite
Cal
EE
Mod
Ver
sion
: Cal
EE
Mod
.201
6.3.
1D
ate:
1/1
2/20
17 8
:55
AM
Pag
e 20
of 2
5
TR
ED
C H
otel
Pro
ject
- H
umbo
ldt C
ount
y, W
inte
r
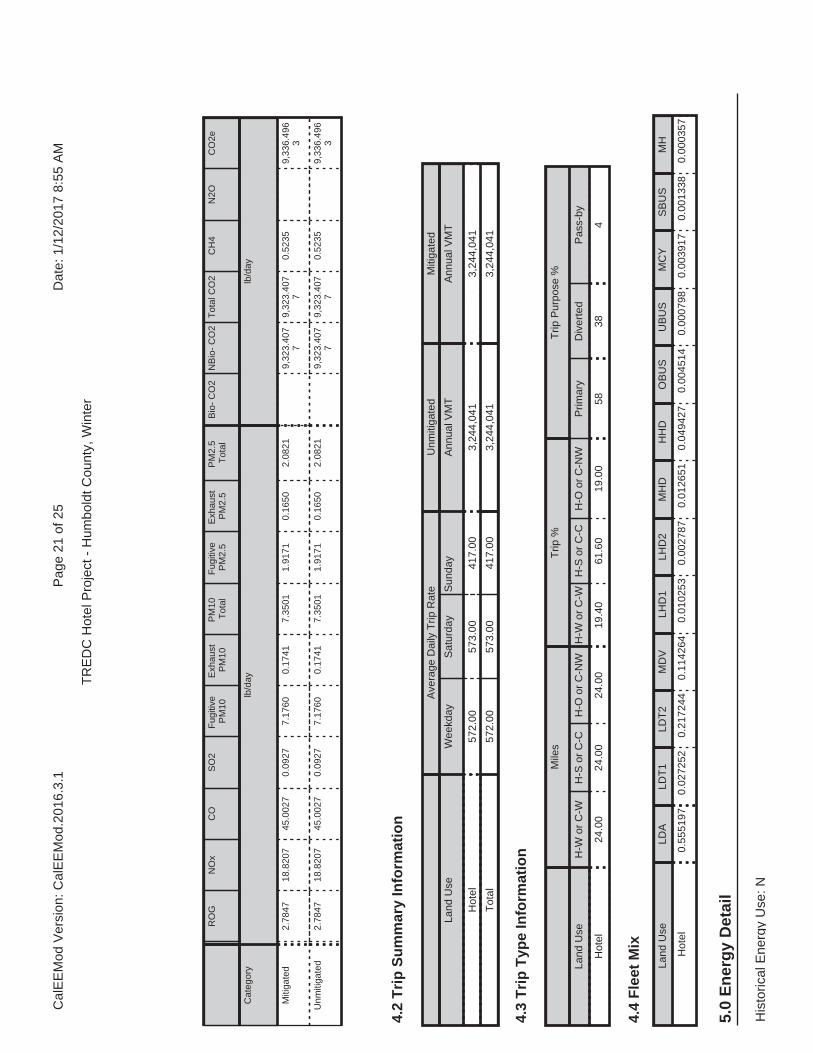
RO
GN
Ox
CO
SO
2F
ugiti
veP
M10
Exh
aust
PM
10P
M10
Tot
alF
ugiti
veP
M2.
5E
xhau
stP
M2.
5P
M2.
5T
otal
Bio
- C
O2
NB
io-
CO
2T
otal
CO
2C
H4
N2O
CO
2e
Cat
egor
ylb
/day
lb/d
ay
Miti
gate
d2.
7847
18.8
207
45.0
027
0.09
277.
1760
0.17
417.
3501
1.91
710.
1650
2.08
219,
323.
407
79,
323.
407
70.
5235
9,33
6.49
63
Unm
itiga
ted
2.78
4718
.820
745
.002
70.
0927
7.17
600.
1741
7.35
011.
9171
0.16
502.
0821
9,32
3.40
77
9,32
3.40
77
0.52
359,
336.
496
3
4.2
Tri
p S
um
mar
y In
form
atio
n
4.3
Tri
p T
ype
Info
rmat
ion
Ave
rage
Dai
ly T
rip R
ate
Unm
itiga
ted
Miti
gate
d
Land
Use
Wee
kday
Sat
urda
yS
unda
yA
nnua
l VM
TA
nnua
l VM
T
Hot
el57
2.00
573.
0041
7.00
3,24
4,04
13,
244,
041
Tot
al57
2.00
573.
0041
7.00
3,24
4,04
13,
244,
041
Mile
sT
rip %
Trip
Pur
pose
%
Land
Use
H-W
or
C-W
H-S
or
C-C
H-O
or
C-N
WH
-W o
r C
-WH
-S o
r C
-CH
-O o
r C
-NW
Prim
ary
Div
erte
dP
ass-
by
Hot
el24
.00
24.0
024
.00
19.4
061
.60
19.0
058
384
5.0
En
erg
y D
etai
l
4.4
Fle
et M
ix
Land
Use
LD
ALD
T1
LDT
2M
DV
LHD
1LH
D2
MH
DH
HD
OB
US
UB
US
MC
YS
BU
SM
H
Hot
el0.
5551
970.
0272
520.
2172
440.
1142
640.
0102
530.
0027
870.
0126
510.
0494
270.
0045
140.
0007
980.
0039
170.
0013
380.
0003
57
His
toric
al E
nerg
y U
se: N
Cal
EE
Mod
Ver
sion
: Cal
EE
Mod
.201
6.3.
1D
ate:
1/1
2/20
17 8
:55
AM
Pag
e 21
of 2
5
TR
ED
C H
otel
Pro
ject
- H
umbo
ldt C
ount
y, W
inte
r

RO
GN
Ox
CO
SO
2F
ugiti
veP
M10
Exh
aust
PM
10P
M10
Tot
alF
ugiti
veP
M2.
5E
xhau
stP
M2.
5P
M2.
5T
otal
Bio
- C
O2
NB
io-
CO
2T
otal
CO
2C
H4
N2O
CO
2e
Cat
egor
ylb
/day
lb/d
ay
Nat
ural
Gas
Miti
gate
d0.
0107
0.09
770.
0821
5.90
00e-
004
7.42
00e-
003
7.42
00e-
003
7.42
00e-
003
7.42
00e-
003
117.
2083
117.
2083
2.25
00e-
003
2.15
00e-
003
117.
9049
Nat
ural
Gas
Unm
itiga
ted
0.01
070.
0977
0.08
215.
9000
e-00
47.
4200
e-00
37.
4200
e-00
37.
4200
e-00
37.
4200
e-00
311
7.20
8311
7.20
832.
2500
e-00
32.
1500
e-00
311
7.90
49
5.2
En
erg
y b
y L
and
Use
- N
atu
ralG
as
Nat
ural
Ga
s U
seR
OG
NO
xC
OS
O2
Fug
itive
PM
10E
xhau
stP
M10
PM
10T
otal
Fug
itive
PM
2.5
Exh
aust
PM
2.5
PM
2.5
Tot
alB
io-
CO
2N
Bio
- C
O2
Tot
al C
O2
CH
4N
2OC
O2e
Land
Use
kBT
U/y
rlb
/day
lb/d
ay
Hot
el99
6.27
10.
0107
0.09
770.
0821
5.90
00e-
004
7.42
00e-
003
7.42
00e-
003
7.42
00e-
003
7.42
00e-
003
117.
2083
117.
2083
2.25
00e-
003
2.15
00e-
003
117.
9049
To
tal
0.01
070.
0977
0.08
215.
9000
e-00
47.
4200
e-00
37.
4200
e-00
37.
4200
e-00
37.
4200
e-00
311
7.20
8311
7.20
832.
2500
e-00
32.
1500
e-00
311
7.90
49
Un
mit
igat
ed
5.1
Mit
igat
ion
Mea
sure
s E
ner
gy
Cal
EE
Mod
Ver
sion
: Cal
EE
Mod
.201
6.3.
1D
ate:
1/1
2/20
17 8
:55
AM
Pag
e 22
of 2
5
TR
ED
C H
otel
Pro
ject
- H
umbo
ldt C
ount
y, W
inte
r

6.1
Mit
igat
ion
Mea
sure
s A
rea
6.0
Are
a D
etai
l
RO
GN
Ox
CO
SO
2F
ugiti
veP
M10
Exh
aust
PM
10P
M10
Tot
alF
ugiti
veP
M2.
5E
xhau
stP
M2.
5P
M2.
5T
otal
Bio
- C
O2
NB
io-
CO
2T
otal
CO
2C
H4
N2O
CO
2e
Cat
egor
ylb
/day
lb/d
ay
Miti
gate
d0.
4844
9.00
00e-
005
0.01
010.
0000
4.00
00e-
005
4.00
00e-
005
4.00
00e-
005
4.00
00e-
005
0.02
190.
0219
6.00
00e-
005
0.02
33
Unm
itiga
ted
0.48
449.
0000
e-00
50.
0101
0.00
004.
0000
e-00
54.
0000
e-00
54.
0000
e-00
54.
0000
e-00
50.
0219
0.02
196.
0000
e-00
50.
0233
5.2
En
erg
y b
y L
and
Use
- N
atu
ralG
as
Nat
ural
Ga
s U
seR
OG
NO
xC
OS
O2
Fug
itive
PM
10E
xhau
stP
M10
PM
10T
otal
Fug
itive
PM
2.5
Exh
aust
PM
2.5
PM
2.5
Tot
alB
io-
CO
2N
Bio
- C
O2
Tot
al C
O2
CH
4N
2OC
O2e
Land
Use
kBT
U/y
rlb
/day
lb/d
ay
Hot
el0.
9962
710.
0107
0.09
770.
0821
5.90
00e-
004
7.42
00e-
003
7.42
00e-
003
7.42
00e-
003
7.42
00e-
003
117.
2083
117.
2083
2.25
00e-
003
2.15
00e-
003
117.
9049
To
tal
0.01
070.
0977
0.08
215.
9000
e-00
47.
4200
e-00
37.
4200
e-00
37.
4200
e-00
37.
4200
e-00
311
7.20
8311
7.20
832.
2500
e-00
32.
1500
e-00
311
7.90
49
Mit
igat
ed
Cal
EE
Mod
Ver
sion
: Cal
EE
Mod
.201
6.3.
1D
ate:
1/1
2/20
17 8
:55
AM
Pag
e 23
of 2
5
TR
ED
C H
otel
Pro
ject
- H
umbo
ldt C
ount
y, W
inte
r
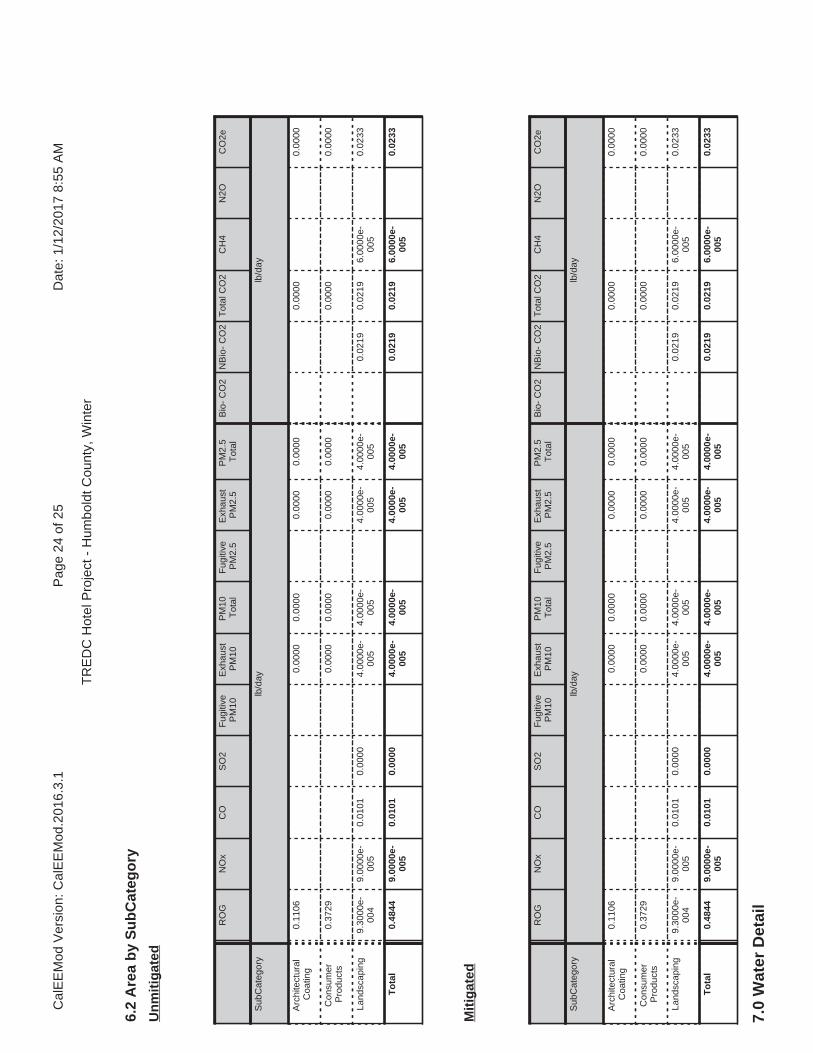
7.0
Wat
er D
etai
l
6.2
Are
a b
y S
ub
Cat
ego
ry
RO
GN
Ox
CO
SO
2F
ugiti
veP
M10
Exh
aust
PM
10P
M10
Tot
alF
ugiti
veP
M2.
5E
xhau
stP
M2.
5P
M2.
5T
otal
Bio
- C
O2
NB
io-
CO
2T
otal
CO
2C
H4
N2O
CO
2e
Sub
Cat
egor
ylb
/day
lb/d
ay
Arc
hite
ctur
alC
oatin
g0.
1106
0.00
000.
0000
0.00
000.
0000
0.00
000.
0000
Con
sum
erP
rodu
cts
0.37
290.
0000
0.00
000.
0000
0.00
000.
0000
0.00
00
Land
scap
ing
9.30
00e-
004
9.00
00e-
005
0.01
010.
0000
4.00
00e-
005
4.00
00e-
005
4.00
00e-
005
4.00
00e-
005
0.02
190.
0219
6.00
00e-
005
0.02
33
To
tal
0.48
449.
0000
e-00
50.
0101
0.00
004.
0000
e-00
54.
0000
e-00
54.
0000
e-00
54.
0000
e-00
50.
0219
0.02
196.
0000
e-00
50.
0233
Un
mit
igat
ed
RO
GN
Ox
CO
SO
2F
ugiti
veP
M10
Exh
aust
PM
10P
M10
Tot
alF
ugiti
veP
M2.
5E
xhau
stP
M2.
5P
M2.
5T
otal
Bio
- C
O2
NB
io-
CO
2T
otal
CO
2C
H4
N2O
CO
2e
Sub
Cat
egor
ylb
/day
lb/d
ay
Arc
hite
ctur
alC
oatin
g0.
1106
0.00
000.
0000
0.00
000.
0000
0.00
000.
0000
Con
sum
erP
rodu
cts
0.37
290.
0000
0.00
000.
0000
0.00
000.
0000
0.00
00
Land
scap
ing
9.30
00e-
004
9.00
00e-
005
0.01
010.
0000
4.00
00e-
005
4.00
00e-
005
4.00
00e-
005
4.00
00e-
005
0.02
190.
0219
6.00
00e-
005
0.02
33
To
tal
0.48
449.
0000
e-00
50.
0101
0.00
004.
0000
e-00
54.
0000
e-00
54.
0000
e-00
54.
0000
e-00
50.
0219
0.02
196.
0000
e-00
50.
0233
Mit
igat
ed
Cal
EE
Mod
Ver
sion
: Cal
EE
Mod
.201
6.3.
1D
ate:
1/1
2/20
17 8
:55
AM
Pag
e 24
of 2
5
TR
ED
C H
otel
Pro
ject
- H
umbo
ldt C
ount
y, W
inte
r

8.1
Mit
igat
ion
Mea
sure
s W
aste
Inst
all L
ow F
low
Bat
hroo
m F
auce
t
Inst
all L
ow F
low
Kitc
hen
Fau
cet
Inst
all L
ow F
low
Toi
let
Inst
all L
ow F
low
Sho
wer
7.1
Mit
igat
ion
Mea
sure
s W
ater
8.0
Was
te D
etai
l
11.0
Veg
etat
ion
9.0
Op
erat
ion
al O
ffro
ad
Equ
ipm
ent T
ype
Num
ber
Hou
rs/D
ayD
ays/
Yea
rH
orse
Pow
erLo
ad F
acto
rF
uel T
ype
10.0
Sta
tio
nar
y E
qu
ipm
ent
Fir
e P
um
ps
and
Em
erg
ency
Gen
erat
ors
Equ
ipm
ent T
ype
Num
ber
Hou
rs/D
ayH
ours
/Yea
rH
orse
Pow
erLo
ad F
acto
rF
uel T
ype
Bo
ilers
Equ
ipm
ent T
ype
Num
ber
Hea
t Inp
ut/D
ayH
eat I
nput
/Yea
rB
oile
r R
atin
gF
uel T
ype
Use
r D
efin
ed E
qu
ipm
ent
Equ
ipm
ent T
ype
Num
ber
Cal
EE
Mod
Ver
sion
: Cal
EE
Mod
.201
6.3.
1D
ate:
1/1
2/20
17 8
:55
AM
Pag
e 25
of 2
5
TR
ED
C H
otel
Pro
ject
- H
umbo
ldt C
ount
y, W
inte
r

APPENDIX FSPECIAL STATUS SPECIES
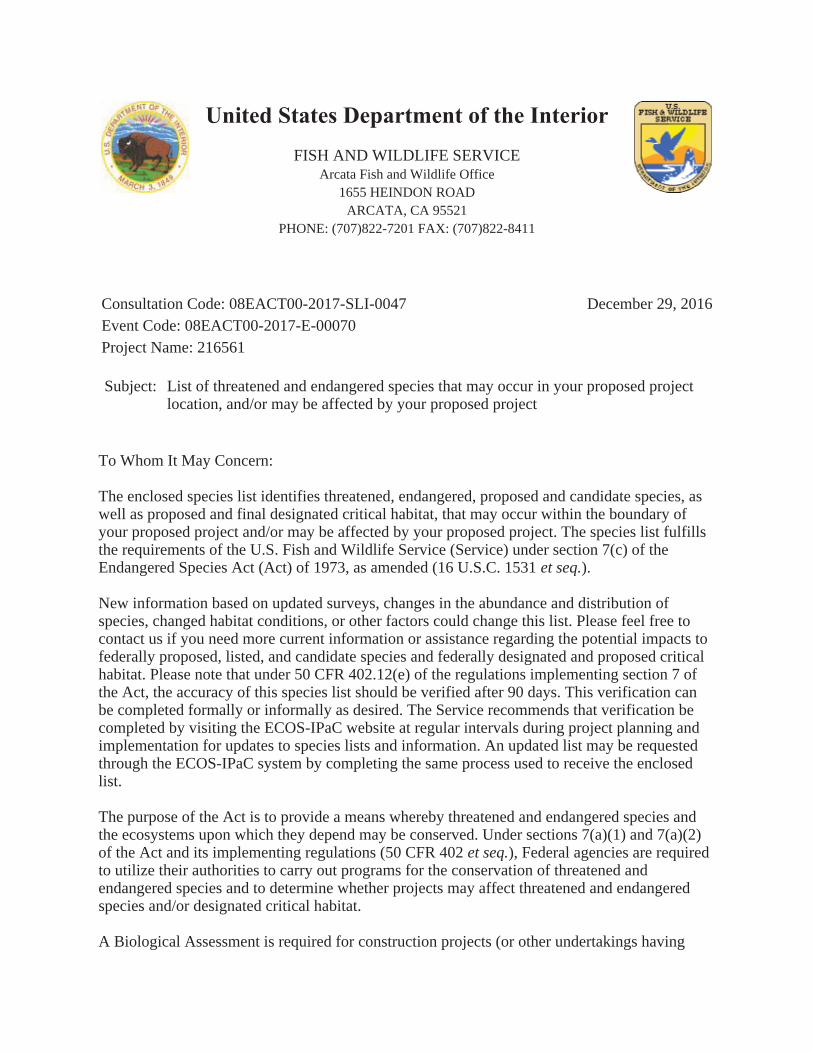
United States Department of the InteriorFISH AND WILDLIFE SERVICE
Arcata Fish and Wildlife Office1655 HEINDON ROAD
ARCATA, CA 95521PHONE: (707)822-7201 FAX: (707)822-8411
Consultation Code: 08EACT00-2017-SLI-0047 December 29, 2016Event Code: 08EACT00-2017-E-00070Project Name: 216561
Subject: List of threatened and endangered species that may occur in your proposed projectlocation, and/or may be affected by your proposed project
To Whom It May Concern:
The enclosed species list identifies threatened, endangered, proposed and candidate species, aswell as proposed and final designated critical habitat, that may occur within the boundary ofyour proposed project and/or may be affected by your proposed project. The species list fulfillsthe requirements of the U.S. Fish and Wildlife Service (Service) under section 7(c) of theEndangered Species Act (Act) of 1973, as amended (16 U.S.C. 1531 ).et seq.
New information based on updated surveys, changes in the abundance and distribution ofspecies, changed habitat conditions, or other factors could change this list. Please feel free tocontact us if you need more current information or assistance regarding the potential impacts tofederally proposed, listed, and candidate species and federally designated and proposed criticalhabitat. Please note that under 50 CFR 402.12(e) of the regulations implementing section 7 ofthe Act, the accuracy of this species list should be verified after 90 days. This verification canbe completed formally or informally as desired. The Service recommends that verification becompleted by visiting the ECOS-IPaC website at regular intervals during project planning andimplementation for updates to species lists and information. An updated list may be requestedthrough the ECOS-IPaC system by completing the same process used to receive the enclosedlist.
The purpose of the Act is to provide a means whereby threatened and endangered species andthe ecosystems upon which they depend may be conserved. Under sections 7(a)(1) and 7(a)(2)of the Act and its implementing regulations (50 CFR 402 ), Federal agencies are requiredet seq.to utilize their authorities to carry out programs for the conservation of threatened andendangered species and to determine whether projects may affect threatened and endangeredspecies and/or designated critical habitat.
A Biological Assessment is required for construction projects (or other undertakings having

similar physical impacts) that are major Federal actions significantly affecting the quality of thehuman environment as defined in the National Environmental Policy Act (42 U.S.C. 4332(2)(c)). For projects other than major construction activities, the Service suggests that a biologicalevaluation similar to a Biological Assessment be prepared to determine whether the project mayaffect listed or proposed species and/or designated or proposed critical habitat. Recommendedcontents of a Biological Assessment are described at 50 CFR 402.12.
If a Federal agency determines, based on the Biological Assessment or biological evaluation,that listed species and/or designated critical habitat may be affected by the proposed project, theagency is required to consult with the Service pursuant to 50 CFR 402. In addition, the Servicerecommends that candidate species, proposed species and proposed critical habitat be addressedwithin the consultation. More information on the regulations and procedures for section 7consultation, including the role of permit or license applicants, can be found in the "EndangeredSpecies Consultation Handbook" at:
http://www.fws.gov/endangered/esa-library/pdf/TOC-GLOS.PDF
Please be aware that bald and golden eagles are protected under the Bald and Golden EagleProtection Act (16 U.S.C. 668 ), and projects affecting these species may requireet seq.development of an eagle conservation plan(http://www.fws.gov/windenergy/eagle_guidance.html). Additionally, wind energy projectsshould follow the wind energy guidelines (http://www.fws.gov/windenergy/) for minimizingimpacts to migratory birds and bats.
Guidance for minimizing impacts to migratory birds for projects including communicationstowers (e.g., cellular, digital television, radio, and emergency broadcast) can be found at:http://www.fws.gov/migratorybirds/CurrentBirdIssues/Hazards/towers/towers.htm;http://www.towerkill.com; andhttp://www.fws.gov/migratorybirds/CurrentBirdIssues/Hazards/towers/comtow.html.
We appreciate your concern for threatened and endangered species. The Service encouragesFederal agencies to include conservation of threatened and endangered species into their projectplanning to further the purposes of the Act. Please include the Consultation Tracking Number inthe header of this letter with any request for consultation or correspondence about your projectthat you submit to our office.
Attachment
2
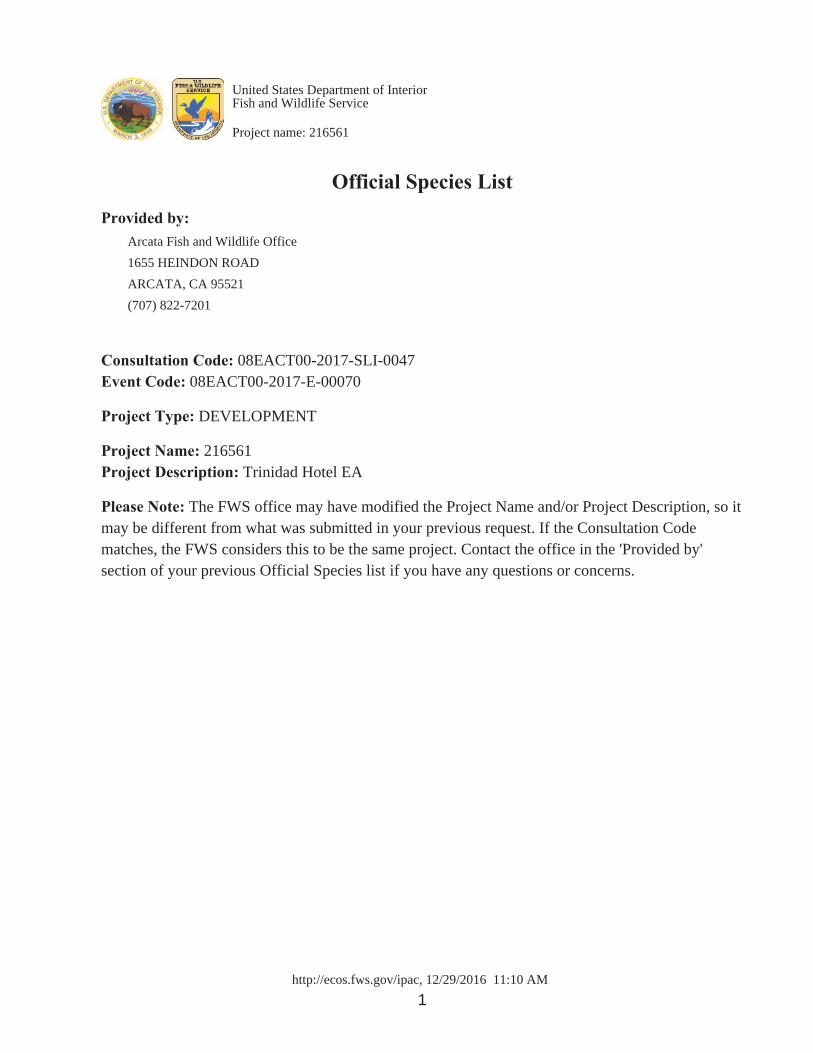
http://ecos.fws.gov/ipac, 12/29/2016 11:10 AM
1
Official Species ListProvided by:
Arcata Fish and Wildlife Office
1655 HEINDON ROAD
ARCATA, CA 95521
(707) 822-7201
Consultation Code: 08EACT00-2017-SLI-0047Event Code: 08EACT00-2017-E-00070
Project Type: DEVELOPMENT
Project Name: 216561Project Description: Trinidad Hotel EA
Please Note: The FWS office may have modified the Project Name and/or Project Description, so itmay be different from what was submitted in your previous request. If the Consultation Codematches, the FWS considers this to be the same project. Contact the office in the 'Provided by'section of your previous Official Species list if you have any questions or concerns.
United States Department of InteriorFish and Wildlife Service
Project name: 216561
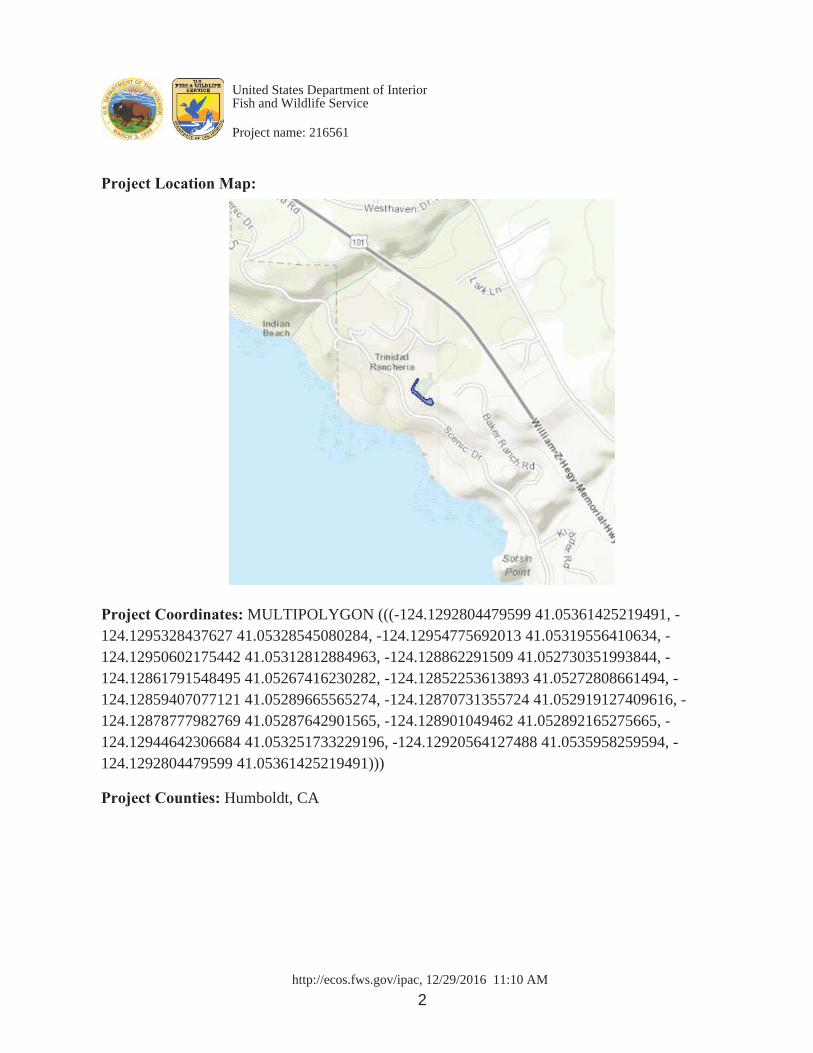
http://ecos.fws.gov/ipac, 12/29/2016 11:10 AM
2
Project Location Map:
Project Coordinates: MULTIPOLYGON (((-124.1292804479599 41.05361425219491, -124.1295328437627 41.05328545080284, -124.12954775692013 41.05319556410634, -124.12950602175442 41.05312812884963, -124.128862291509 41.052730351993844, -124.12861791548495 41.05267416230282, -124.12852253613893 41.05272808661494, -124.12859407077121 41.05289665565274, -124.12870731355724 41.052919127409616, -124.12878777982769 41.05287642901565, -124.128901049462 41.052892165275665, -124.12944642306684 41.053251733229196, -124.12920564127488 41.0535958259594, -124.1292804479599 41.05361425219491)))
Project Counties: Humboldt, CA
United States Department of InteriorFish and Wildlife Service
Project name: 216561

http://ecos.fws.gov/ipac, 12/29/2016 11:10 AM
3
Endangered Species Act Species List
There are a total of 6 threatened or endangered species on your species list. Species on this list should be considered in
an effects analysis for your project and could include species that exist in another geographic area. For example, certain
fish may appear on the species list because a project could affect downstream species. Critical habitats listed under the
Has Critical Habitat column may or may not lie within your project area. See the Critical habitats within yourproject area section further below for critical habitat that lies within your project. Please contact the designated FWS
office if you have questions.
Birds Status Has Critical Habitat Condition(s)
Marbled murrelet (Brachyramphus
marmoratus)
Population: U.S.A. (CA, OR, WA)
Threatened Final designated
Northern Spotted owl (Strix
occidentalis caurina)
Population: Wherever found
Threatened Final designated
Short-Tailed albatross (Phoebastria
(=diomedea) albatrus)
Population: Wherever found
Endangered
western snowy plover (Charadrius
nivosus ssp. nivosus)
Population: Pacific Coast population DPS-
U.S.A. (CA, OR, WA), Mexico (within 50 miles
of Pacific coast)
Threatened Final designated
Yellow-Billed Cuckoo (Coccyzus
americanus)
Population: Western U.S. DPS
Threatened Proposed
Fishes
Tidewater goby (Eucyclogobius Endangered Final designated
United States Department of InteriorFish and Wildlife Service
Project name: 216561

http://ecos.fws.gov/ipac, 12/29/2016 11:10 AM
4
newberryi)
Population: Wherever found
United States Department of InteriorFish and Wildlife Service
Project name: 216561
http://ecos.fws.gov/ipac, 12/29/2016 11:10 AM
5
Critical habitats that lie within your project areaThere are no critical habitats within your project area.
United States Department of InteriorFish and Wildlife Service
Project name: 216561
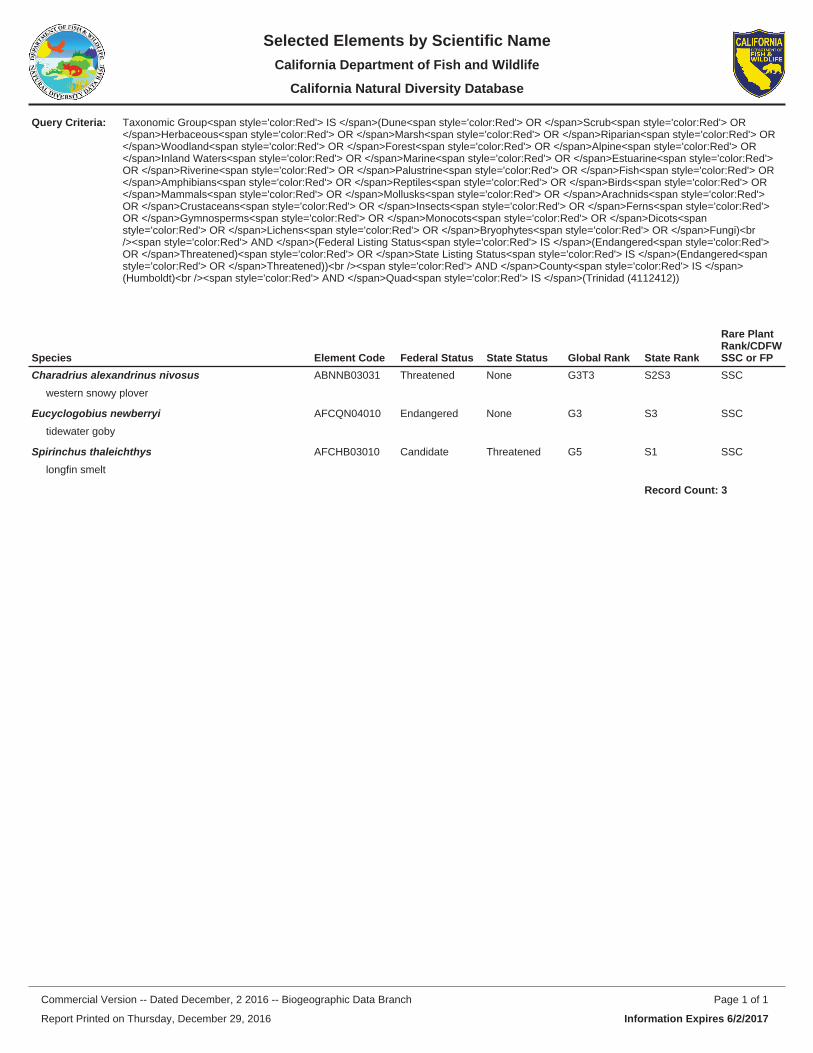
Species Element Code Federal Status State Status Global Rank State Rank
Rare Plant Rank/CDFWSSC or FP
Charadrius alexandrinus nivosuswestern snowy plover
ABNNB03031 Threatened None G3T3 S2S3 SSC
Eucyclogobius newberryitidewater goby
AFCQN04010 Endangered None G3 S3 SSC
Spirinchus thaleichthyslongfin smelt
AFCHB03010 Candidate Threatened G5 S1 SSC
Record Count: 3
Taxonomic Group<span style='color:Red'> IS </span>(Dune<span style='color:Red'> OR </span>Scrub<span style='color:Red'> OR </span>Herbaceous<span style='color:Red'> OR </span>Marsh<span style='color:Red'> OR </span>Riparian<span style='color:Red'> OR </span>Woodland<span style='color:Red'> OR </span>Forest<span style='color:Red'> OR </span>Alpine<span style='color:Red'> OR </span>Inland Waters<span style='color:Red'> OR </span>Marine<span style='color:Red'> OR </span>Estuarine<span style='color:Red'> OR </span>Riverine<span style='color:Red'> OR </span>Palustrine<span style='color:Red'> OR </span>Fish<span style='color:Red'> OR </span>Amphibians<span style='color:Red'> OR </span>Reptiles<span style='color:Red'> OR </span>Birds<span style='color:Red'> OR </span>Mammals<span style='color:Red'> OR </span>Mollusks<span style='color:Red'> OR </span>Arachnids<span style='color:Red'> OR </span>Crustaceans<span style='color:Red'> OR </span>Insects<span style='color:Red'> OR </span>Ferns<span style='color:Red'> OR </span>Gymnosperms<span style='color:Red'> OR </span>Monocots<span style='color:Red'> OR </span>Dicots<span style='color:Red'> OR </span>Lichens<span style='color:Red'> OR </span>Bryophytes<span style='color:Red'> OR </span>Fungi)<br /><span style='color:Red'> AND </span>(Federal Listing Status<span style='color:Red'> IS </span>(Endangered<span style='color:Red'> OR </span>Threatened)<span style='color:Red'> OR </span>State Listing Status<span style='color:Red'> IS </span>(Endangered<span style='color:Red'> OR </span>Threatened))<br /><span style='color:Red'> AND </span>County<span style='color:Red'> IS </span>(Humboldt)<br /><span style='color:Red'> AND </span>Quad<span style='color:Red'> IS </span>(Trinidad (4112412))
Query Criteria:
Report Printed on Thursday, December 29, 2016
Page 1 of 1Commercial Version -- Dated December, 2 2016 -- Biogeographic Data Branch
Information Expires 6/2/2017
Selected Elements by Scientific Name
California Department of Fish and WildlifeCalifornia Natural Diversity Database
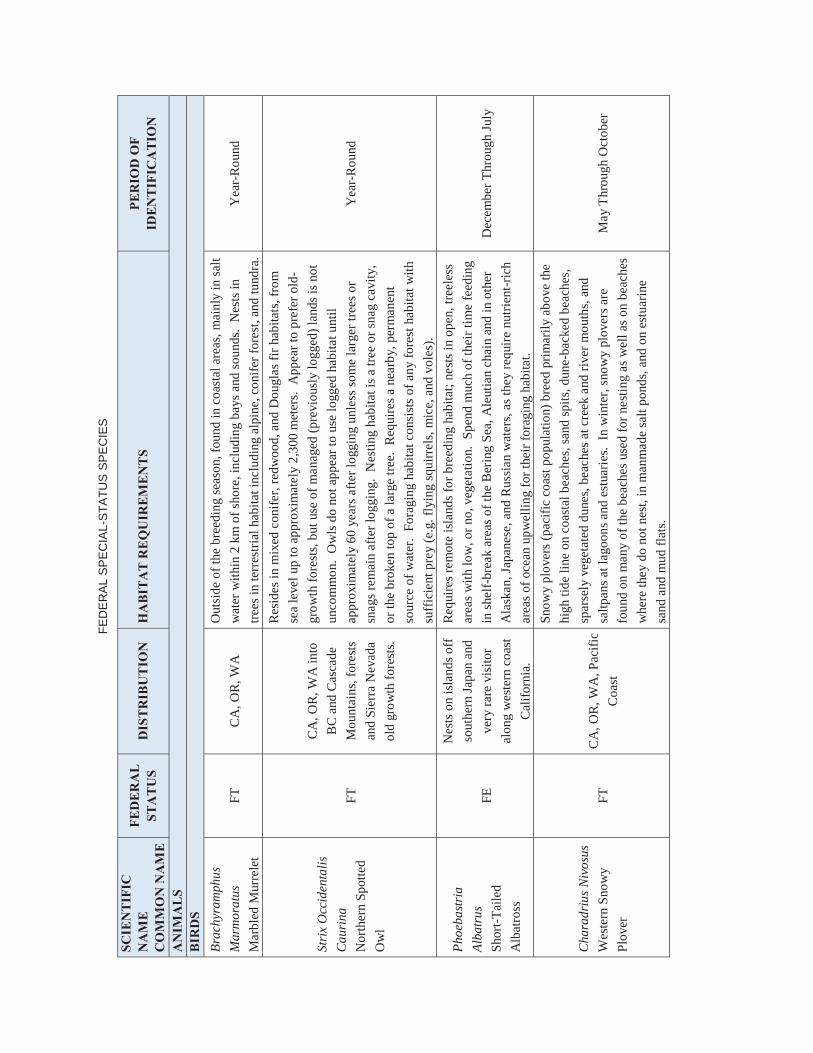
FE
DE
RA
L S
PE
CIA
L-S
TA
TU
S S
PE
CIE
S
SCIE
NT
IFIC
N
AM
EC
OM
MO
N N
AM
E
FED
ERA
LST
ATU
SD
ISTR
IBU
TIO
NH
AB
ITA
T R
EQ
UIR
EMEN
TSPE
RIO
D O
F ID
ENTI
FIC
ATI
ON
AN
IMA
LSB
IRD
SB
rach
yram
phus
Mar
mor
atus
Mar
bled
Mur
rele
t
FT
CA
, OR
, WA
Out
side
of
the
bree
ding
sea
son,
fou
nd in
coa
stal
are
as, m
ainl
y in
sal
t
wat
er w
ithi
n 2
km o
f sh
ore,
incl
udin
g ba
ys a
nd s
ound
s. N
ests
in
tree
s in
terr
estr
ial h
abit
at in
clud
ing
alpi
ne, c
onif
er f
ores
t, an
d tu
ndra
.
Yea
r-R
ound
Stri
x O
ccid
enta
lis
Cau
rina
Nor
ther
n S
pott
ed
Ow
l
FT
CA
, OR
, WA
into
BC
and
Cas
cade
Mou
ntai
ns, f
ores
ts
and
Sie
rra
Nev
ada
old
grow
th f
ores
ts.
Res
ides
in m
ixed
con
ifer
, red
woo
d, a
nd D
ougl
as f
ir h
abit
ats,
fro
m
sea
leve
l up
to a
ppro
xim
atel
y 2,
300
met
ers.
App
ear
to p
refe
r ol
d-
grow
th f
ores
ts, b
utus
e of
man
aged
(pr
evio
usly
logg
ed)
land
s is
not
unco
mm
on.
Ow
ls d
o no
t app
ear
to u
se lo
gged
hab
itat
unt
il
appr
oxim
atel
y 60
yea
rs a
fter
logg
ing
unle
ss s
ome
larg
er tr
ees
or
snag
s re
mai
n af
ter
logg
ing.
Nes
ting
hab
itat
is a
tree
or
snag
cav
ity,
or th
e br
oken
top
of a
larg
e tr
ee.
Req
uire
s a
near
by, p
erm
anen
t
sour
ce o
f w
ater
. F
orag
ing
habi
tat c
onsi
sts
of a
ny f
ores
t hab
itat
wit
h
suff
icie
nt p
rey
(e.g
. fly
ing
squi
rrel
s, m
ice,
and
vol
es).
Yea
r-R
ound
Pho
ebas
tria
Alb
atru
s
Sho
rt-T
aile
d
Alb
atro
ss
FE
Nes
ts o
n is
land
sof
f
sout
hern
Jap
an a
nd
very
rar
e vi
sito
r
alon
g w
este
rn c
oast
Cal
ifor
nia.
Req
uire
s re
mot
e is
land
s fo
r br
eedi
ng h
abit
at; n
ests
in o
pen,
tree
less
area
s w
ith
low
, or
no, v
eget
atio
n. S
pend
muc
h of
thei
r ti
me
feed
ing
in s
helf
-bre
ak a
reas
of
the
Ber
ing
Sea
, Ale
utia
n ch
ain
and
in o
ther
Ala
skan
, Jap
anes
e, a
nd R
ussi
an w
ater
s, a
s th
ey r
equi
re n
utri
ent-
rich
area
s of
oce
an u
pwel
ling
for
thei
r fo
ragi
ng h
abit
at.
Dec
embe
r T
hrou
gh J
uly
Cha
radr
ius
Niv
osus
Wes
tern
Sno
wy
Plo
ver
FT
CA
, OR
, WA
, Pac
ific
Coa
st
Sno
wy
plov
ers
(pac
ific
coa
st p
opul
atio
n) b
reed
pri
mar
ily
abov
e th
e
high
tide
line
on
coas
tal b
each
es, s
and
spit
s, d
une-
back
ed b
each
es,
spar
sely
veg
etat
ed d
unes
, bea
ches
at c
reek
and
riv
er m
outh
s, a
nd
salt
pans
at l
agoo
ns a
nd e
stua
ries
. In
win
ter,
sno
wy
plov
ers
are
foun
d on
man
y of
the
beac
hes
used
for
nes
ting
as
wel
l as
on b
each
es
whe
re th
ey d
o no
t nes
t, in
man
mad
e sa
lt p
onds
, and
on
estu
arin
e
sand
and
mud
fla
ts.
May
Thr
ough
Oct
ober
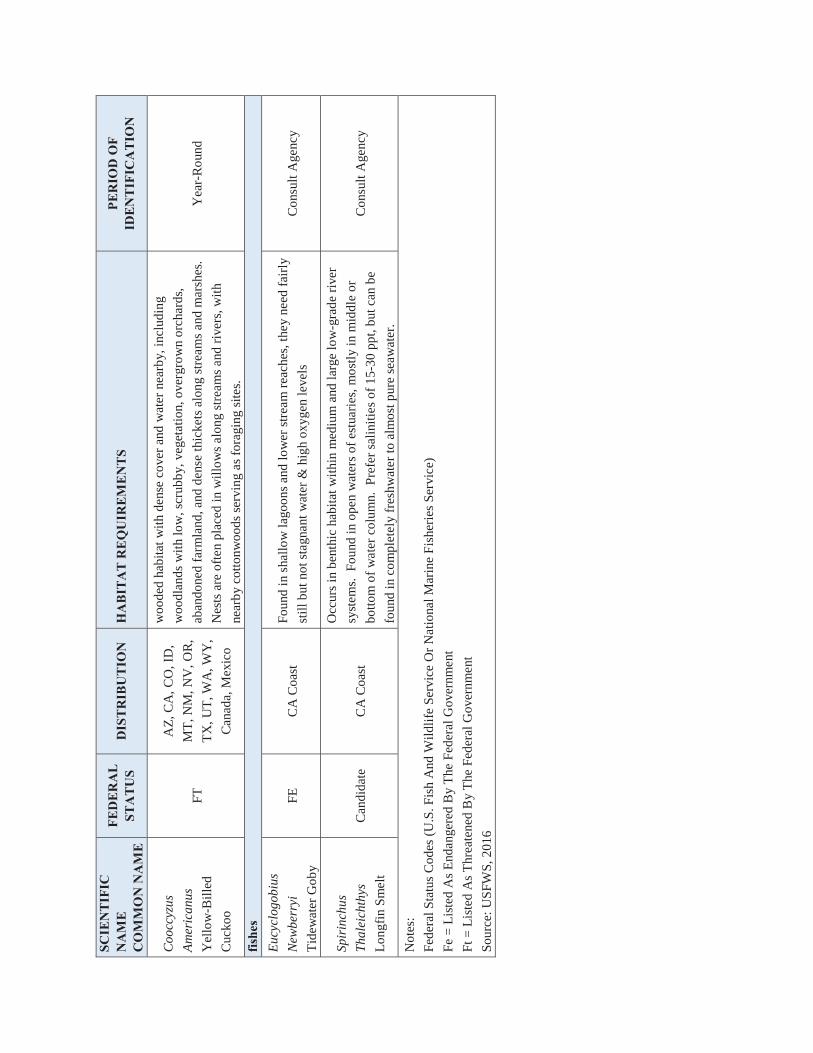
SCIE
NT
IFIC
N
AM
EC
OM
MO
N N
AM
E
FED
ERA
LST
ATU
SD
ISTR
IBU
TIO
NH
AB
ITA
T R
EQ
UIR
EMEN
TSPE
RIO
D O
F ID
ENTI
FIC
ATI
ON
Coo
ccyz
us
Am
eric
anus
Yel
low
-Bil
led
Cuc
koo
FT
AZ
, CA
, CO
, ID
,
MT
, NM
, NV
, OR
,
TX
, UT
, WA
, WY
,
Can
ada,
Mex
ico
woo
ded
habi
tat w
ith
dens
e co
ver
and
wat
er n
earb
y, in
clud
ing
woo
dlan
ds w
ith
low
, scr
ubby
, veg
etat
ion,
ove
rgro
wn
orch
ards
,
aban
done
d fa
rmla
nd, a
nd d
ense
thic
kets
alo
ng s
trea
ms
and
mar
shes
.
Nes
ts a
re o
ften
pla
ced
in w
illo
ws
alon
g st
ream
s an
d ri
vers
, wit
h
near
by c
otto
nwoo
ds s
ervi
ng a
s fo
ragi
ng s
ites
.
Yea
r-R
ound
fishe
sE
ucyc
logo
bius
New
berr
yi
Tid
ewat
er G
oby
FE
CA
Coa
stFo
und
in s
hall
ow la
goon
s an
d lo
wer
str
eam
rea
ches
, the
y ne
ed f
airl
y
stil
lbut
not
sta
gnan
t wat
er &
hig
h ox
ygen
leve
lsC
onsu
lt A
genc
y
Spir
inch
us
Tha
leic
hthy
s
Lon
gfin
Sm
elt
Can
dida
teC
A C
oast
Occ
urs
in b
enth
ic h
abit
at w
ithi
n m
ediu
m a
nd la
rge
low
-gra
de r
iver
syst
ems.
Fou
nd in
ope
n w
ater
s of
est
uari
es, m
ostl
y in
mid
dle
or
bott
om o
f w
ater
col
umn.
Pre
fer
sali
niti
es o
f 15
-30
ppt,
but c
an b
e
foun
d in
com
plet
ely
fres
hwat
er to
alm
ost p
ure
seaw
ater
.
Con
sult
Age
ncy
Not
es:
Fed
eral
Sta
tus
Cod
es (
U.S
. Fis
h A
nd W
ildl
ife
Ser
vice
Or
Nat
iona
l Mar
ine
Fis
heri
es S
ervi
ce)
Fe
= L
iste
d A
s E
ndan
gere
dB
y T
he F
eder
al G
over
nmen
t
Ft =
Lis
ted
As
Thr
eate
ned
By
The
Fed
eral
Gov
ernm
ent
Sou
rce:
US
FW
S, 2
016

APPENDIX GTRINIDAD AREA FREEWAY MASTER PLAN STUDY

Trinidad Area Freeway Master Plan Study Report
Prepared for:
The Trinidad Rancheria
Prepared by:
TRINIDAD AREA FREEWAY MASTER PLAN STUDY
PREPARED FOR: THE TRINIDAD RANCHERIA
1 CHER-AE LANE TRINIDAD, CA 95570
PREPARED JOINTLY BY:
OMNI-MEANS, LTD. ENGINEERS & PLANNERS
943 RESERVE DRIVE SACRAMENTO CA 95678
(916) 782-8688
AND
SHN CONSULTING ENGINEERS & GEOLOGISTS, INC 812 W. WABASH
EUREKA, CA 95501-2138
FEBRUARY 2014
45-6108-01 R1721RPT003.DOCX
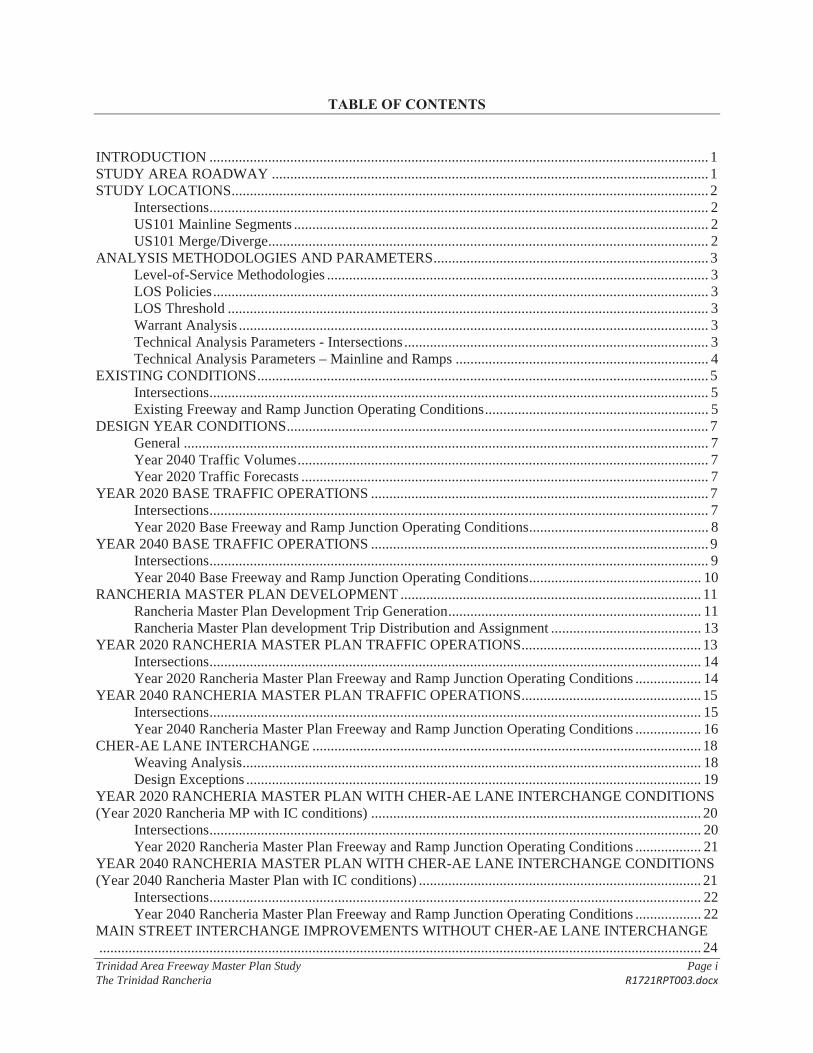
Trinidad Area Freeway Master Plan Study Page i The Trinidad Rancheria R1721RPT003.docx
TABLE OF CONTENTS
INTRODUCTION ........................................................................................................................................ 1STUDY AREA ROADWAY ....................................................................................................................... 1STUDY LOCATIONS .................................................................................................................................. 2
Intersections ........................................................................................................................................ 2US101 Mainline Segments ................................................................................................................. 2US101 Merge/Diverge ........................................................................................................................ 2
ANALYSIS METHODOLOGIES AND PARAMETERS ........................................................................... 3Level-of-Service Methodologies ........................................................................................................ 3LOS Policies ....................................................................................................................................... 3LOS Threshold ................................................................................................................................... 3Warrant Analysis ................................................................................................................................ 3Technical Analysis Parameters - Intersections ................................................................................... 3Technical Analysis Parameters – Mainline and Ramps ..................................................................... 4
EXISTING CONDITIONS ........................................................................................................................... 5Intersections ........................................................................................................................................ 5Existing Freeway and Ramp Junction Operating Conditions ............................................................. 5
DESIGN YEAR CONDITIONS ................................................................................................................... 7General ............................................................................................................................................... 7Year 2040 Traffic Volumes ................................................................................................................ 7Year 2020 Traffic Forecasts ............................................................................................................... 7
YEAR 2020 BASE TRAFFIC OPERATIONS ............................................................................................ 7Intersections ........................................................................................................................................ 7Year 2020 Base Freeway and Ramp Junction Operating Conditions ................................................. 8
YEAR 2040 BASE TRAFFIC OPERATIONS ............................................................................................ 9Intersections ........................................................................................................................................ 9Year 2040 Base Freeway and Ramp Junction Operating Conditions ............................................... 10
RANCHERIA MASTER PLAN DEVELOPMENT .................................................................................. 11Rancheria Master Plan Development Trip Generation ..................................................................... 11Rancheria Master Plan development Trip Distribution and Assignment ......................................... 13
YEAR 2020 RANCHERIA MASTER PLAN TRAFFIC OPERATIONS ................................................. 13Intersections ...................................................................................................................................... 14Year 2020 Rancheria Master Plan Freeway and Ramp Junction Operating Conditions .................. 14
YEAR 2040 RANCHERIA MASTER PLAN TRAFFIC OPERATIONS ................................................. 15Intersections ...................................................................................................................................... 15Year 2040 Rancheria Master Plan Freeway and Ramp Junction Operating Conditions .................. 16
CHER-AE LANE INTERCHANGE .......................................................................................................... 18Weaving Analysis ............................................................................................................................. 18Design Exceptions ............................................................................................................................ 19
YEAR 2020 RANCHERIA MASTER PLAN WITH CHER-AE LANE INTERCHANGE CONDITIONS (Year 2020 Rancheria MP with IC conditions) .......................................................................................... 20
Intersections ...................................................................................................................................... 20Year 2020 Rancheria Master Plan Freeway and Ramp Junction Operating Conditions .................. 21
YEAR 2040 RANCHERIA MASTER PLAN WITH CHER-AE LANE INTERCHANGE CONDITIONS (Year 2040 Rancheria Master Plan with IC conditions) ............................................................................. 21
Intersections ...................................................................................................................................... 22Year 2040 Rancheria Master Plan Freeway and Ramp Junction Operating Conditions .................. 22
MAIN STREET INTERCHANGE IMPROVEMENTS WITHOUT CHER-AE LANE INTERCHANGE .................................................................................................................................................................... 24
Trinidad Area Freeway Master Plan Study Page ii The Trinidad Rancheria R1721RPT003.docx
Main Street/Scenic Drive ....................................................................................................... 24Main Street/US 101 SB Ramps .............................................................................................. 25Main Street/US 101 NB Ramps ............................................................................................. 25Westhaven Drive/Frontage Road ........................................................................................... 25Scenic Drive/Cher-Ae Lane ................................................................................................... 25
CHER-AE LANE INTERCHANGE IMPROVEMENTS .......................................................................... 25Cher-Ae Lane/US 101 NB Ramps ......................................................................................... 26Cher-Ae Lane/US 101 SB Ramps .......................................................................................... 26
RECOMMENDATION .............................................................................................................................. 26
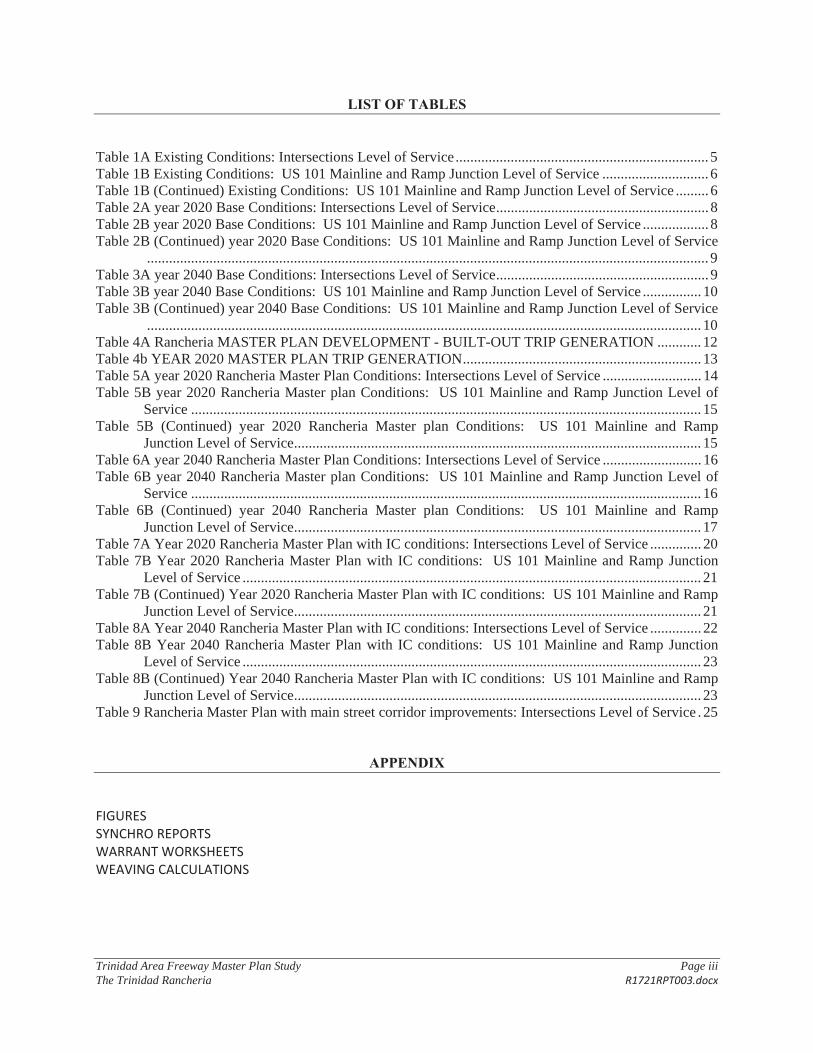
Trinidad Area Freeway Master Plan Study Page iii The Trinidad Rancheria R1721RPT003.docx
LIST OF TABLES
Table 1A Existing Conditions: Intersections Level of Service ..................................................................... 5Table 1B Existing Conditions: US 101 Mainline and Ramp Junction Level of Service ............................. 6Table 1B (Continued) Existing Conditions: US 101 Mainline and Ramp Junction Level of Service ......... 6Table 2A year 2020 Base Conditions: Intersections Level of Service .......................................................... 8Table 2B year 2020 Base Conditions: US 101 Mainline and Ramp Junction Level of Service .................. 8Table 2B (Continued) year 2020 Base Conditions: US 101 Mainline and Ramp Junction Level of Service
......................................................................................................................................................... 9Table 3A year 2040 Base Conditions: Intersections Level of Service .......................................................... 9Table 3B year 2040 Base Conditions: US 101 Mainline and Ramp Junction Level of Service ................ 10Table 3B (Continued) year 2040 Base Conditions: US 101 Mainline and Ramp Junction Level of Service
....................................................................................................................................................... 10Table 4A Rancheria MASTER PLAN DEVELOPMENT - BUILT-OUT TRIP GENERATION ............ 12Table 4b YEAR 2020 MASTER PLAN TRIP GENERATION ................................................................. 13Table 5A year 2020 Rancheria Master Plan Conditions: Intersections Level of Service ........................... 14Table 5B year 2020 Rancheria Master plan Conditions: US 101 Mainline and Ramp Junction Level of
Service ........................................................................................................................................... 15Table 5B (Continued) year 2020 Rancheria Master plan Conditions: US 101 Mainline and Ramp
Junction Level of Service ............................................................................................................... 15Table 6A year 2040 Rancheria Master Plan Conditions: Intersections Level of Service ........................... 16Table 6B year 2040 Rancheria Master plan Conditions: US 101 Mainline and Ramp Junction Level of
Service ........................................................................................................................................... 16Table 6B (Continued) year 2040 Rancheria Master plan Conditions: US 101 Mainline and Ramp
Junction Level of Service ............................................................................................................... 17Table 7A Year 2020 Rancheria Master Plan with IC conditions: Intersections Level of Service .............. 20Table 7B Year 2020 Rancheria Master Plan with IC conditions: US 101 Mainline and Ramp Junction
Level of Service ............................................................................................................................. 21Table 7B (Continued) Year 2020 Rancheria Master Plan with IC conditions: US 101 Mainline and Ramp
Junction Level of Service ............................................................................................................... 21Table 8A Year 2040 Rancheria Master Plan with IC conditions: Intersections Level of Service .............. 22Table 8B Year 2040 Rancheria Master Plan with IC conditions: US 101 Mainline and Ramp Junction
Level of Service ............................................................................................................................. 23Table 8B (Continued) Year 2040 Rancheria Master Plan with IC conditions: US 101 Mainline and Ramp
Junction Level of Service ............................................................................................................... 23Table 9 Rancheria Master Plan with main street corridor improvements: Intersections Level of Service . 25
APPENDIX
FIGURESSYNCHRO REPORTSWARRANT WORKSHEETSWEAVING CALCULATIONS
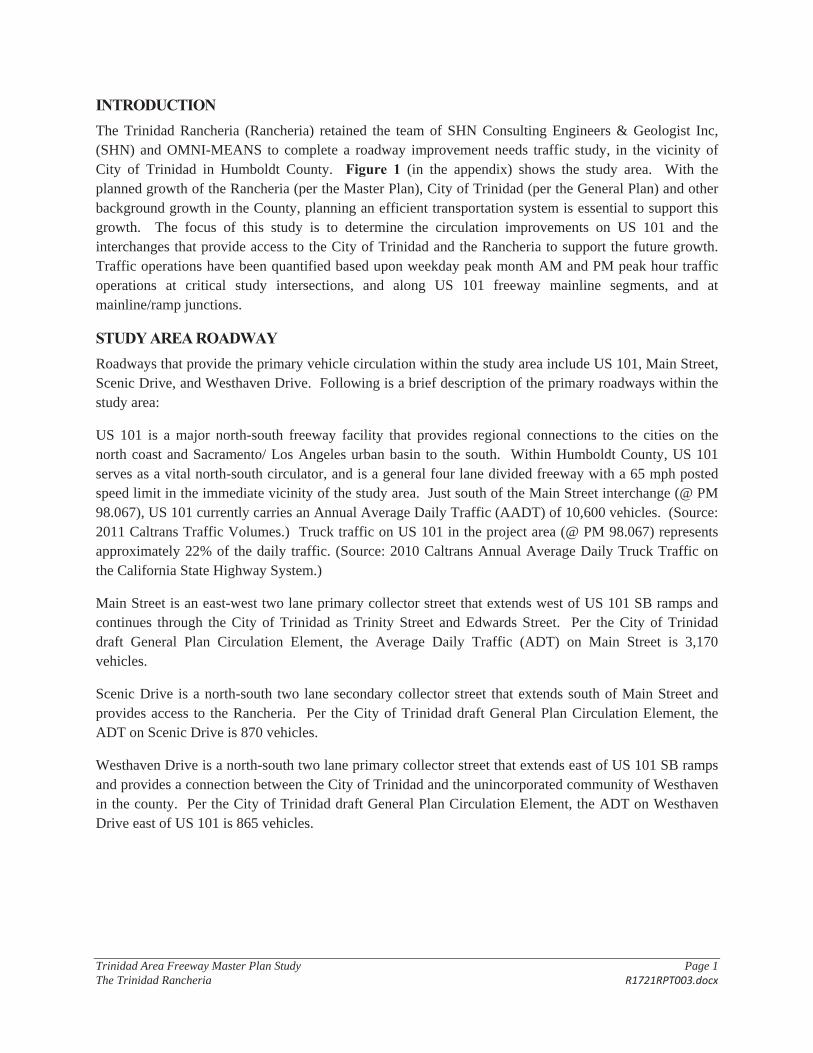
Trinidad Area Freeway Master Plan Study Page 1 The Trinidad Rancheria R1721RPT003.docx
INTRODUCTION The Trinidad Rancheria (Rancheria) retained the team of SHN Consulting Engineers & Geologist Inc, (SHN) and OMNI-MEANS to complete a roadway improvement needs traffic study, in the vicinity of City of Trinidad in Humboldt County. Figure 1 (in the appendix) shows the study area. With the planned growth of the Rancheria (per the Master Plan), City of Trinidad (per the General Plan) and other background growth in the County, planning an efficient transportation system is essential to support this growth. The focus of this study is to determine the circulation improvements on US 101 and the interchanges that provide access to the City of Trinidad and the Rancheria to support the future growth. Traffic operations have been quantified based upon weekday peak month AM and PM peak hour traffic operations at critical study intersections, and along US 101 freeway mainline segments, and at mainline/ramp junctions.
STUDY AREA ROADWAY Roadways that provide the primary vehicle circulation within the study area include US 101, Main Street, Scenic Drive, and Westhaven Drive. Following is a brief description of the primary roadways within the study area:
US 101 is a major north-south freeway facility that provides regional connections to the cities on the north coast and Sacramento/ Los Angeles urban basin to the south. Within Humboldt County, US 101 serves as a vital north-south circulator, and is a general four lane divided freeway with a 65 mph posted speed limit in the immediate vicinity of the study area. Just south of the Main Street interchange (@ PM 98.067), US 101 currently carries an Annual Average Daily Traffic (AADT) of 10,600 vehicles. (Source: 2011 Caltrans Traffic Volumes.) Truck traffic on US 101 in the project area (@ PM 98.067) represents approximately 22% of the daily traffic. (Source: 2010 Caltrans Annual Average Daily Truck Traffic on the California State Highway System.)
Main Street is an east-west two lane primary collector street that extends west of US 101 SB ramps and continues through the City of Trinidad as Trinity Street and Edwards Street. Per the City of Trinidad draft General Plan Circulation Element, the Average Daily Traffic (ADT) on Main Street is 3,170 vehicles.
Scenic Drive is a north-south two lane secondary collector street that extends south of Main Street and provides access to the Rancheria. Per the City of Trinidad draft General Plan Circulation Element, the ADT on Scenic Drive is 870 vehicles.
Westhaven Drive is a north-south two lane primary collector street that extends east of US 101 SB ramps and provides a connection between the City of Trinidad and the unincorporated community of Westhaven in the county. Per the City of Trinidad draft General Plan Circulation Element, the ADT on Westhaven Drive east of US 101 is 865 vehicles.
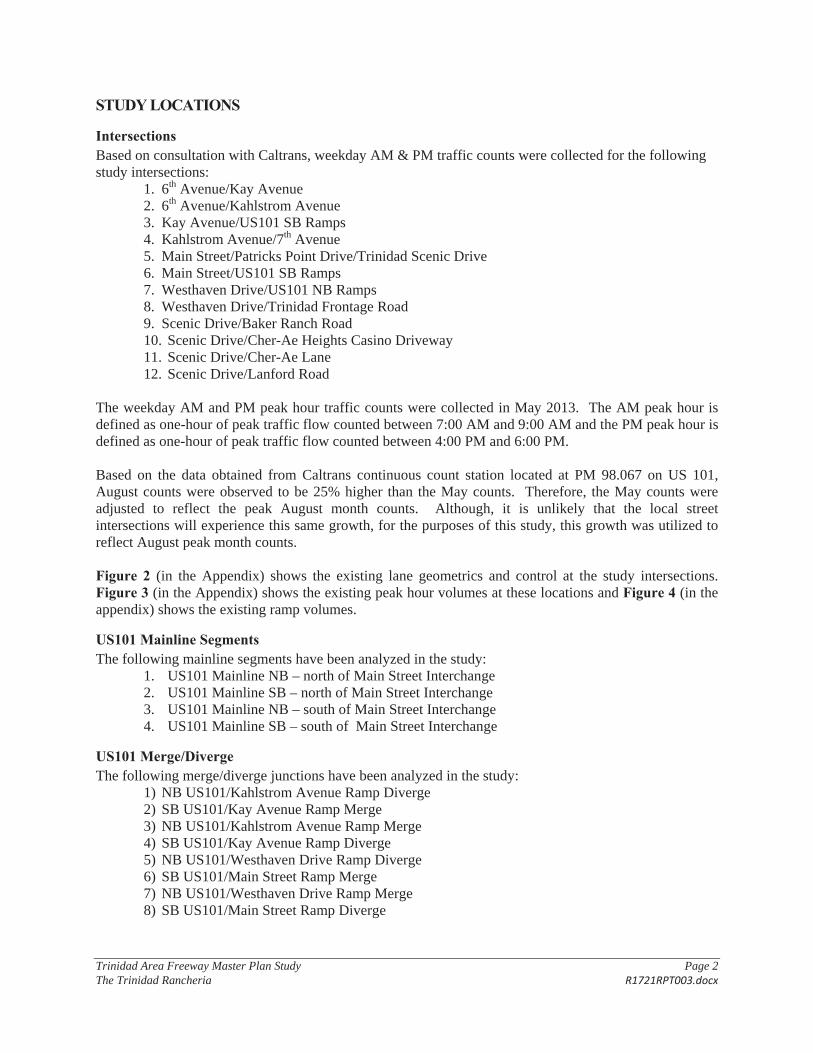
Trinidad Area Freeway Master Plan Study Page 2 The Trinidad Rancheria R1721RPT003.docx
STUDY LOCATIONS
Intersections Based on consultation with Caltrans, weekday AM & PM traffic counts were collected for the following study intersections:
1. 6th Avenue/Kay Avenue 2. 6th Avenue/Kahlstrom Avenue 3. Kay Avenue/US101 SB Ramps 4. Kahlstrom Avenue/7th Avenue 5. Main Street/Patricks Point Drive/Trinidad Scenic Drive 6. Main Street/US101 SB Ramps 7. Westhaven Drive/US101 NB Ramps 8. Westhaven Drive/Trinidad Frontage Road 9. Scenic Drive/Baker Ranch Road 10. Scenic Drive/Cher-Ae Heights Casino Driveway 11. Scenic Drive/Cher-Ae Lane 12. Scenic Drive/Lanford Road
The weekday AM and PM peak hour traffic counts were collected in May 2013. The AM peak hour is defined as one-hour of peak traffic flow counted between 7:00 AM and 9:00 AM and the PM peak hour is defined as one-hour of peak traffic flow counted between 4:00 PM and 6:00 PM.
Based on the data obtained from Caltrans continuous count station located at PM 98.067 on US 101, August counts were observed to be 25% higher than the May counts. Therefore, the May counts were adjusted to reflect the peak August month counts. Although, it is unlikely that the local street intersections will experience this same growth, for the purposes of this study, this growth was utilized to reflect August peak month counts.
Figure 2 (in the Appendix) shows the existing lane geometrics and control at the study intersections. Figure 3 (in the Appendix) shows the existing peak hour volumes at these locations and Figure 4 (in the appendix) shows the existing ramp volumes.
US101 Mainline Segments The following mainline segments have been analyzed in the study:
1. US101 Mainline NB – north of Main Street Interchange 2. US101 Mainline SB – north of Main Street Interchange 3. US101 Mainline NB – south of Main Street Interchange 4. US101 Mainline SB – south of Main Street Interchange
US101 Merge/Diverge The following merge/diverge junctions have been analyzed in the study:
1) NB US101/Kahlstrom Avenue Ramp Diverge 2) SB US101/Kay Avenue Ramp Merge 3) NB US101/Kahlstrom Avenue Ramp Merge 4) SB US101/Kay Avenue Ramp Diverge 5) NB US101/Westhaven Drive Ramp Diverge 6) SB US101/Main Street Ramp Merge 7) NB US101/Westhaven Drive Ramp Merge 8) SB US101/Main Street Ramp Diverge
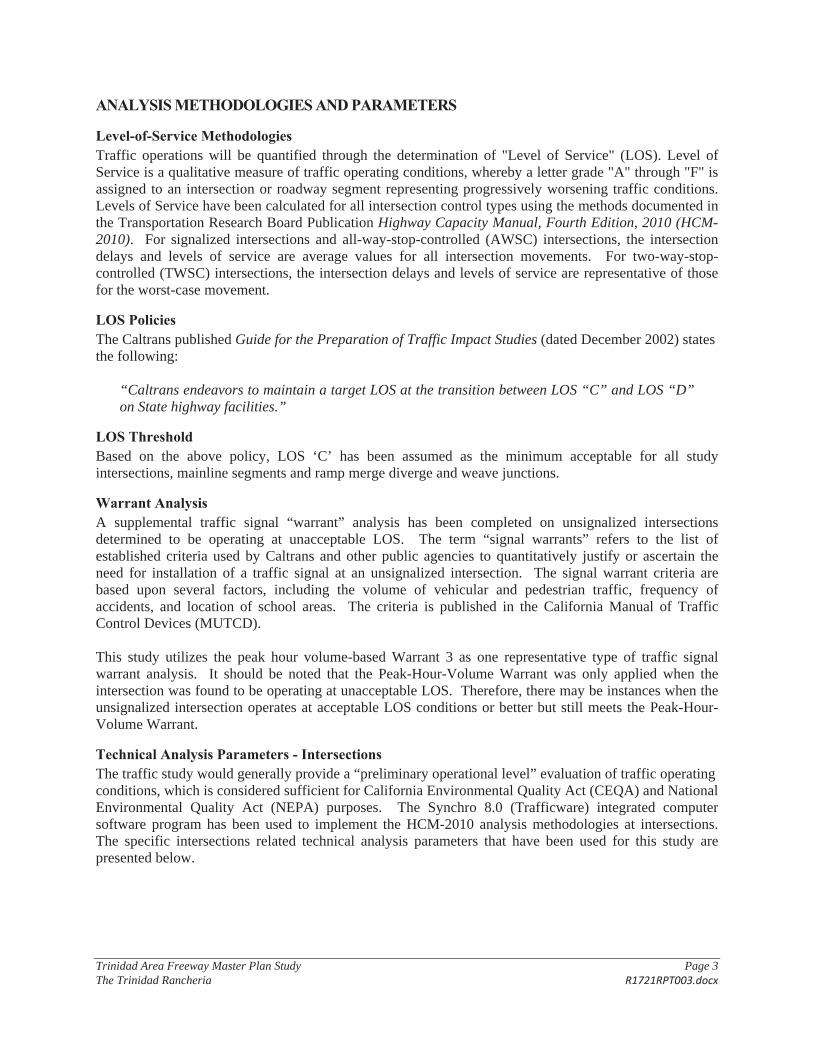
Trinidad Area Freeway Master Plan Study Page 3 The Trinidad Rancheria R1721RPT003.docx
ANALYSIS METHODOLOGIES AND PARAMETERS
Level-of-Service Methodologies Traffic operations will be quantified through the determination of "Level of Service" (LOS). Level of Service is a qualitative measure of traffic operating conditions, whereby a letter grade "A" through "F" is assigned to an intersection or roadway segment representing progressively worsening traffic conditions. Levels of Service have been calculated for all intersection control types using the methods documented in the Transportation Research Board Publication Highway Capacity Manual, Fourth Edition, 2010 (HCM-2010). For signalized intersections and all-way-stop-controlled (AWSC) intersections, the intersection delays and levels of service are average values for all intersection movements. For two-way-stop-controlled (TWSC) intersections, the intersection delays and levels of service are representative of those for the worst-case movement.
LOS Policies The Caltrans published Guide for the Preparation of Traffic Impact Studies (dated December 2002) states the following:
“Caltrans endeavors to maintain a target LOS at the transition between LOS “C” and LOS “D” on State highway facilities.”
LOS Threshold Based on the above policy, LOS ‘C’ has been assumed as the minimum acceptable for all study intersections, mainline segments and ramp merge diverge and weave junctions.
Warrant Analysis A supplemental traffic signal “warrant” analysis has been completed on unsignalized intersections determined to be operating at unacceptable LOS. The term “signal warrants” refers to the list of established criteria used by Caltrans and other public agencies to quantitatively justify or ascertain the need for installation of a traffic signal at an unsignalized intersection. The signal warrant criteria are based upon several factors, including the volume of vehicular and pedestrian traffic, frequency of accidents, and location of school areas. The criteria is published in the California Manual of Traffic Control Devices (MUTCD).
This study utilizes the peak hour volume-based Warrant 3 as one representative type of traffic signal warrant analysis. It should be noted that the Peak-Hour-Volume Warrant was only applied when the intersection was found to be operating at unacceptable LOS. Therefore, there may be instances when the unsignalized intersection operates at acceptable LOS conditions or better but still meets the Peak-Hour-Volume Warrant.
Technical Analysis Parameters - Intersections The traffic study would generally provide a “preliminary operational level” evaluation of traffic operating conditions, which is considered sufficient for California Environmental Quality Act (CEQA) and National Environmental Quality Act (NEPA) purposes. The Synchro 8.0 (Trafficware) integrated computer software program has been used to implement the HCM-2010 analysis methodologies at intersections. The specific intersections related technical analysis parameters that have been used for this study are presented below.
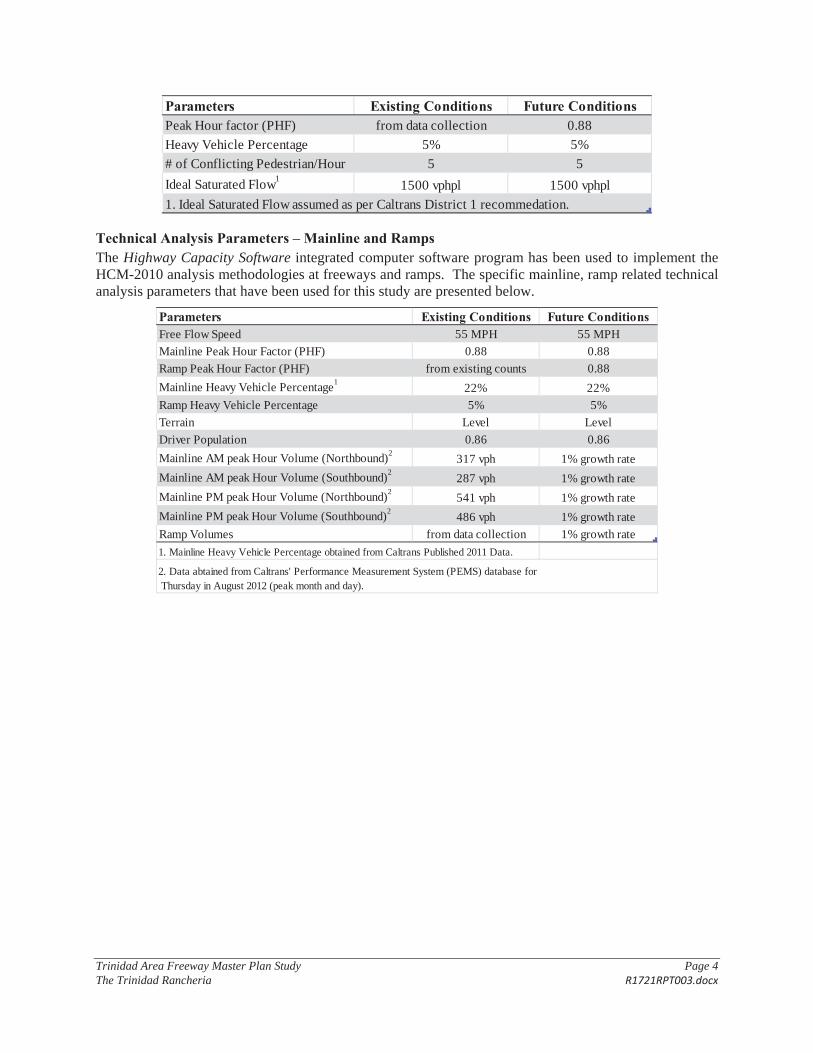
Trinidad Area Freeway Master Plan Study Page 4 The Trinidad Rancheria R1721RPT003.docx
Parameters Existing Conditions Future ConditionsPeak Hour factor (PHF) from data collection 0.88
Heavy Vehicle Percentage 5% 5%
# of Conflicting Pedestrian/Hour 5 5
Ideal Saturated Flow11500 vphpl 1500 vphpl
1. Ideal Saturated Flow assumed as per Caltrans District 1 recommedation.
Technical Analysis Parameters – Mainline and Ramps The Highway Capacity Software integrated computer software program has been used to implement the HCM-2010 analysis methodologies at freeways and ramps. The specific mainline, ramp related technical analysis parameters that have been used for this study are presented below.
Parameters Existing Conditions Future ConditionsFree Flow Speed 55 MPH 55 MPH
Mainline Peak Hour Factor (PHF) 0.88 0.88
Ramp Peak Hour Factor (PHF) from existing counts 0.88
Mainline Heavy Vehicle Percentage122% 22%
Ramp Heavy Vehicle Percentage 5% 5%
Terrain Level Level
Driver Population 0.86 0.86
Mainline AM peak Hour Volume (Northbound)2317 vph 1% growth rate
Mainline AM peak Hour Volume (Southbound)2287 vph 1% growth rate
Mainline PM peak Hour Volume (Northbound)2541 vph 1% growth rate
Mainline PM peak Hour Volume (Southbound)2486 vph 1% growth rate
Ramp Volumes from data collection 1% growth rate
1. Mainline Heavy Vehicle Percentage obtained from Caltrans Published 2011 Data.
2. Data abtained from Caltrans' Performance Measurement System (PEMS) database for Thursday in August 2012 (peak month and day).
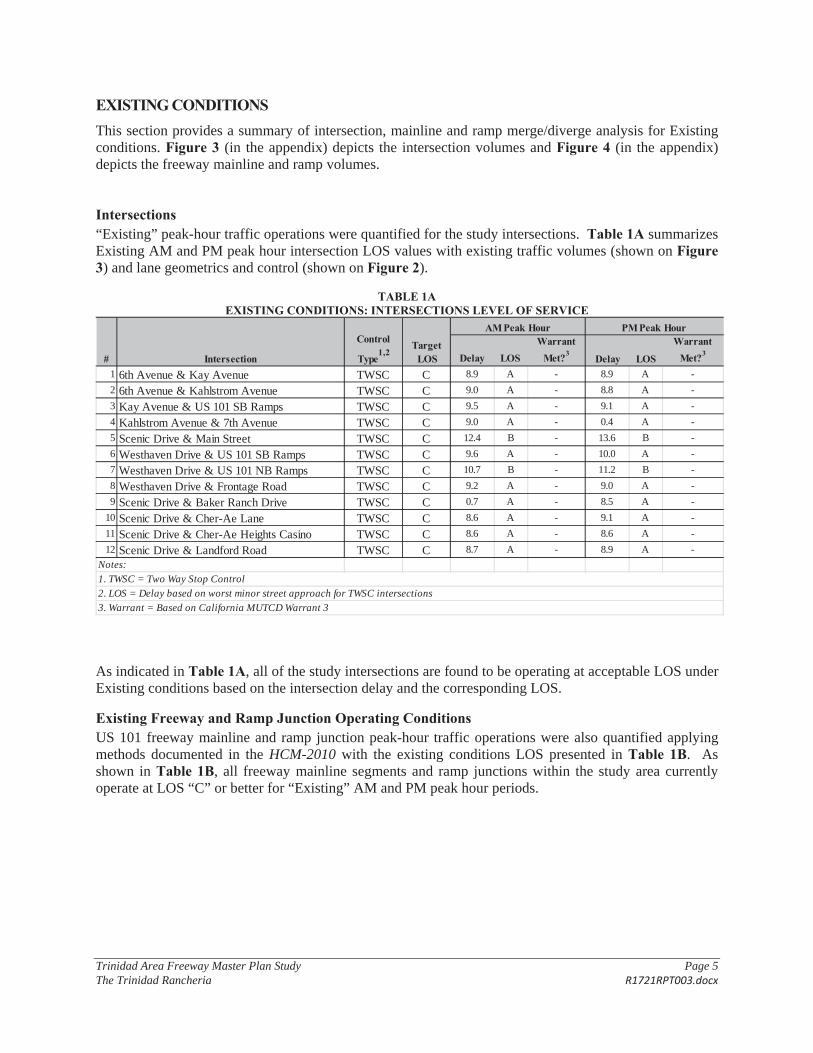
Trinidad Area Freeway Master Plan Study Page 5 The Trinidad Rancheria R1721RPT003.docx
EXISTING CONDITIONS This section provides a summary of intersection, mainline and ramp merge/diverge analysis for Existing conditions. Figure 3 (in the appendix) depicts the intersection volumes and Figure 4 (in the appendix) depicts the freeway mainline and ramp volumes.
Intersections “Existing” peak-hour traffic operations were quantified for the study intersections. Table 1A summarizes Existing AM and PM peak hour intersection LOS values with existing traffic volumes (shown on Figure3) and lane geometrics and control (shown on Figure 2).
TABLE 1A EXISTING CONDITIONS: INTERSECTIONS LEVEL OF SERVICE
Delay LOSWarrant
Met?3 Delay LOS
Warrant Met?3
1 6th Avenue & Kay Avenue TWSC C 8.9 A - 8.9 A -
2 6th Avenue & Kahlstrom Avenue TWSC C 9.0 A - 8.8 A -
3 Kay Avenue & US 101 SB Ramps TWSC C 9.5 A - 9.1 A -
4 Kahlstrom Avenue & 7th Avenue TWSC C 9.0 A - 0.4 A -
5 Scenic Drive & Main Street TWSC C 12.4 B - 13.6 B -
6 Westhaven Drive & US 101 SB Ramps TWSC C 9.6 A - 10.0 A -
7 Westhaven Drive & US 101 NB Ramps TWSC C 10.7 B - 11.2 B -
8 Westhaven Drive & Frontage Road TWSC C 9.2 A - 9.0 A -
9 Scenic Drive & Baker Ranch Drive TWSC C 0.7 A - 8.5 A -
10 Scenic Drive & Cher-Ae Lane TWSC C 8.6 A - 9.1 A -
11 Scenic Drive & Cher-Ae Heights Casino TWSC C 8.6 A - 8.6 A -
12 Scenic Drive & Landford Road TWSC C 8.7 A - 8.9 A -
Notes:
1. TWSC = Two Way Stop Control
2. LOS = Delay based on worst minor street approach for TWSC intersections
3. Warrant = Based on California MUTCD Warrant 3
# Intersection
Control
Type1,2
Target LOS
AM Peak Hour PM Peak Hour
As indicated in Table 1A, all of the study intersections are found to be operating at acceptable LOS under Existing conditions based on the intersection delay and the corresponding LOS.
Existing Freeway and Ramp Junction Operating Conditions US 101 freeway mainline and ramp junction peak-hour traffic operations were also quantified applying methods documented in the HCM-2010 with the existing conditions LOS presented in Table 1B. As shown in Table 1B, all freeway mainline segments and ramp junctions within the study area currently operate at LOS “C” or better for “Existing” AM and PM peak hour periods.
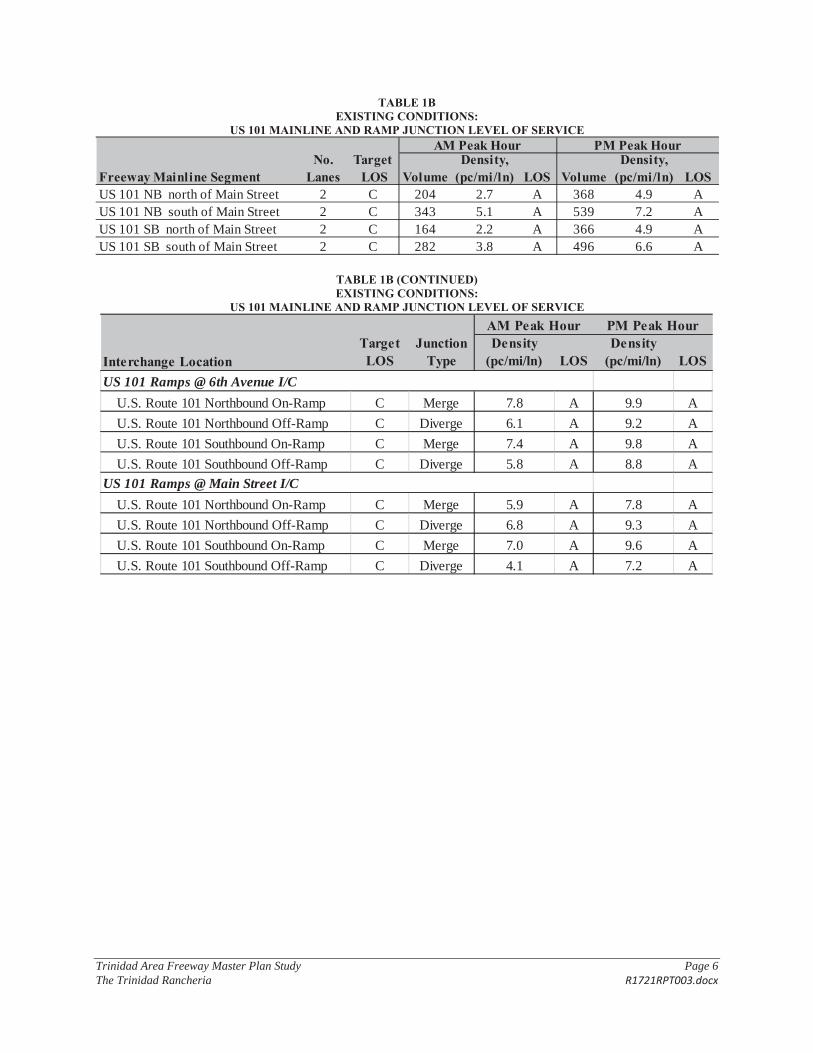
Trinidad Area Freeway Master Plan Study Page 6 The Trinidad Rancheria R1721RPT003.docx
TABLE 1B EXISTING CONDITIONS:
US 101 MAINLINE AND RAMP JUNCTION LEVEL OF SERVICE
VolumeDensity,
(pc/mi/ln) LOS VolumeDensity,
(pc/mi/ln) LOSUS 101 NB north of Main Street 2 C 204 2.7 A 368 4.9 AUS 101 NB south of Main Street 2 C 343 5.1 A 539 7.2 AUS 101 SB north of Main Street 2 C 164 2.2 A 366 4.9 AUS 101 SB south of Main Street 2 C 282 3.8 A 496 6.6 A
Freeway Mainline SegmentNo.
LanesTarget
LOS
AM Peak Hour PM Peak Hour
TABLE 1B (CONTINUED) EXISTING CONDITIONS:
US 101 MAINLINE AND RAMP JUNCTION LEVEL OF SERVICE
Target LOS
Junction Type
Density (pc/mi/ln) LOS
Density (pc/mi/ln) LOS
U.S. Route 101 Northbound On-Ramp C Merge 7.8 A 9.9 A
U.S. Route 101 Northbound Off-Ramp C Diverge 6.1 A 9.2 A
U.S. Route 101 Southbound On-Ramp C Merge 7.4 A 9.8 A
U.S. Route 101 Southbound Off-Ramp C Diverge 5.8 A 8.8 A
U.S. Route 101 Northbound On-Ramp C Merge 5.9 A 7.8 A
U.S. Route 101 Northbound Off-Ramp C Diverge 6.8 A 9.3 A
U.S. Route 101 Southbound On-Ramp C Merge 7.0 A 9.6 A
U.S. Route 101 Southbound Off-Ramp C Diverge 4.1 A 7.2 A
Interchange Location
AM Peak Hour PM Peak Hour
US 101 Ramps @ 6th Avenue I/C
US 101 Ramps @ Main Street I/C
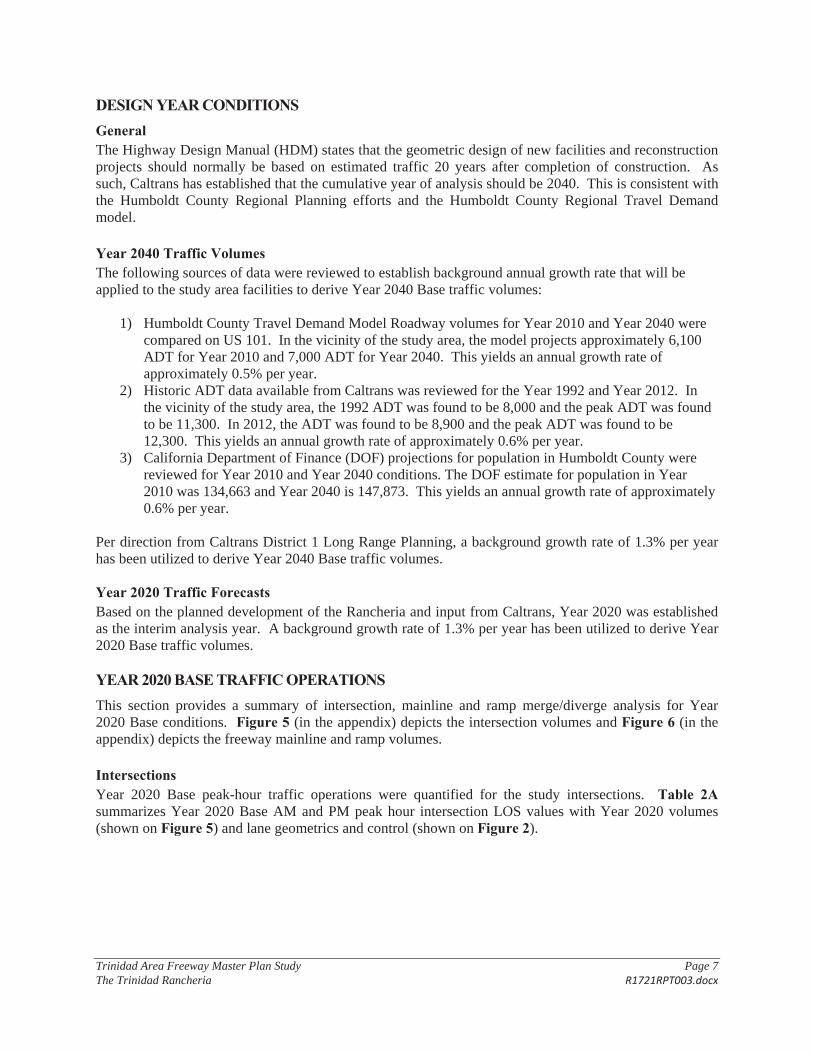
Trinidad Area Freeway Master Plan Study Page 7 The Trinidad Rancheria R1721RPT003.docx
DESIGN YEAR CONDITIONS General The Highway Design Manual (HDM) states that the geometric design of new facilities and reconstruction projects should normally be based on estimated traffic 20 years after completion of construction. As such, Caltrans has established that the cumulative year of analysis should be 2040. This is consistent with the Humboldt County Regional Planning efforts and the Humboldt County Regional Travel Demand model.
Year 2040 Traffic Volumes The following sources of data were reviewed to establish background annual growth rate that will be applied to the study area facilities to derive Year 2040 Base traffic volumes:
1) Humboldt County Travel Demand Model Roadway volumes for Year 2010 and Year 2040 were compared on US 101. In the vicinity of the study area, the model projects approximately 6,100 ADT for Year 2010 and 7,000 ADT for Year 2040. This yields an annual growth rate of approximately 0.5% per year.
2) Historic ADT data available from Caltrans was reviewed for the Year 1992 and Year 2012. In the vicinity of the study area, the 1992 ADT was found to be 8,000 and the peak ADT was found to be 11,300. In 2012, the ADT was found to be 8,900 and the peak ADT was found to be 12,300. This yields an annual growth rate of approximately 0.6% per year.
3) California Department of Finance (DOF) projections for population in Humboldt County were reviewed for Year 2010 and Year 2040 conditions. The DOF estimate for population in Year 2010 was 134,663 and Year 2040 is 147,873. This yields an annual growth rate of approximately 0.6% per year.
Per direction from Caltrans District 1 Long Range Planning, a background growth rate of 1.3% per year has been utilized to derive Year 2040 Base traffic volumes.
Year 2020 Traffic Forecasts Based on the planned development of the Rancheria and input from Caltrans, Year 2020 was established as the interim analysis year. A background growth rate of 1.3% per year has been utilized to derive Year 2020 Base traffic volumes.
YEAR 2020 BASE TRAFFIC OPERATIONS This section provides a summary of intersection, mainline and ramp merge/diverge analysis for Year 2020 Base conditions. Figure 5 (in the appendix) depicts the intersection volumes and Figure 6 (in the appendix) depicts the freeway mainline and ramp volumes.
Intersections Year 2020 Base peak-hour traffic operations were quantified for the study intersections. Table 2Asummarizes Year 2020 Base AM and PM peak hour intersection LOS values with Year 2020 volumes (shown on Figure 5) and lane geometrics and control (shown on Figure 2).
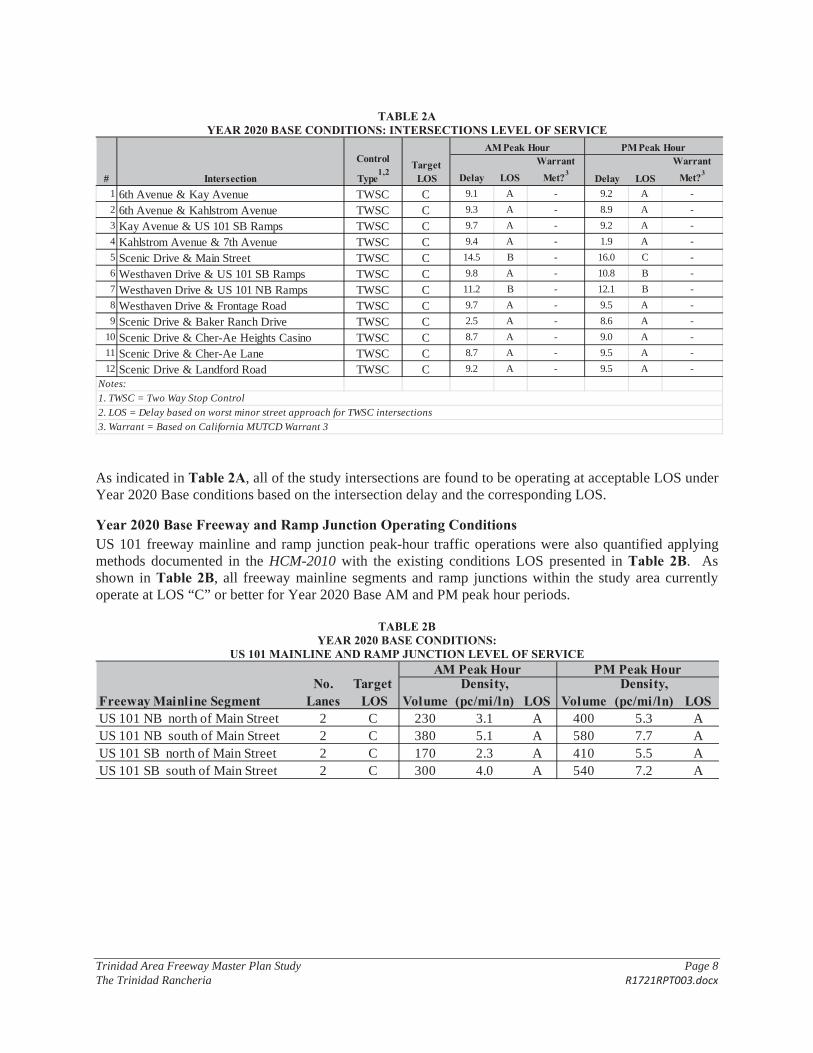
Trinidad Area Freeway Master Plan Study Page 8 The Trinidad Rancheria R1721RPT003.docx
TABLE 2A YEAR 2020 BASE CONDITIONS: INTERSECTIONS LEVEL OF SERVICE
Delay LOSWarrant
Met?3 Delay LOS
Warrant Met?3
1 6th Avenue & Kay Avenue TWSC C 9.1 A - 9.2 A -
2 6th Avenue & Kahlstrom Avenue TWSC C 9.3 A - 8.9 A -
3 Kay Avenue & US 101 SB Ramps TWSC C 9.7 A - 9.2 A -
4 Kahlstrom Avenue & 7th Avenue TWSC C 9.4 A - 1.9 A -
5 Scenic Drive & Main Street TWSC C 14.5 B - 16.0 C -
6 Westhaven Drive & US 101 SB Ramps TWSC C 9.8 A - 10.8 B -
7 Westhaven Drive & US 101 NB Ramps TWSC C 11.2 B - 12.1 B -
8 Westhaven Drive & Frontage Road TWSC C 9.7 A - 9.5 A -
9 Scenic Drive & Baker Ranch Drive TWSC C 2.5 A - 8.6 A -
10 Scenic Drive & Cher-Ae Heights Casino TWSC C 8.7 A - 9.0 A -
11 Scenic Drive & Cher-Ae Lane TWSC C 8.7 A - 9.5 A -
12 Scenic Drive & Landford Road TWSC C 9.2 A - 9.5 A -
Notes:1. TWSC = Two Way Stop Control
2. LOS = Delay based on worst minor street approach for TWSC intersections
3. Warrant = Based on California MUTCD Warrant 3
# Intersection
Control
Type1,2
Target LOS
AM Peak Hour PM Peak Hour
As indicated in Table 2A, all of the study intersections are found to be operating at acceptable LOS under Year 2020 Base conditions based on the intersection delay and the corresponding LOS.
Year 2020 Base Freeway and Ramp Junction Operating Conditions US 101 freeway mainline and ramp junction peak-hour traffic operations were also quantified applying methods documented in the HCM-2010 with the existing conditions LOS presented in Table 2B. As shown in Table 2B, all freeway mainline segments and ramp junctions within the study area currently operate at LOS “C” or better for Year 2020 Base AM and PM peak hour periods.
TABLE 2B YEAR 2020 BASE CONDITIONS:
US 101 MAINLINE AND RAMP JUNCTION LEVEL OF SERVICE
VolumeDensity,
(pc/mi/ln) LOS VolumeDensity,
(pc/mi/ln) LOSUS 101 NB north of Main Street 2 C 230 3.1 A 400 5.3 AUS 101 NB south of Main Street 2 C 380 5.1 A 580 7.7 AUS 101 SB north of Main Street 2 C 170 2.3 A 410 5.5 AUS 101 SB south of Main Street 2 C 300 4.0 A 540 7.2 A
Freeway Mainline SegmentNo.
LanesTarget
LOS
AM Peak Hour PM Peak Hour
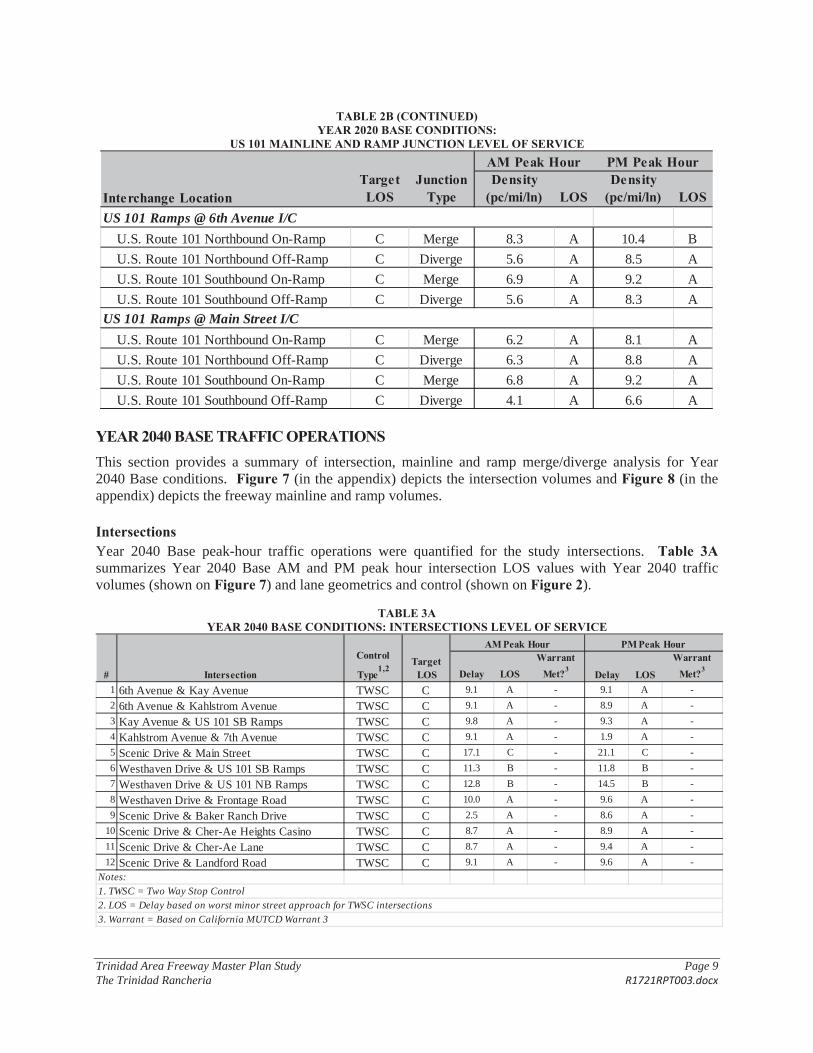
Trinidad Area Freeway Master Plan Study Page 9 The Trinidad Rancheria R1721RPT003.docx
TABLE 2B (CONTINUED) YEAR 2020 BASE CONDITIONS:
US 101 MAINLINE AND RAMP JUNCTION LEVEL OF SERVICE
Target LOS
Junction Type
Density (pc/mi/ln) LOS
Density (pc/mi/ln) LOS
U.S. Route 101 Northbound On-Ramp C Merge 8.3 A 10.4 B
U.S. Route 101 Northbound Off-Ramp C Diverge 5.6 A 8.5 A
U.S. Route 101 Southbound On-Ramp C Merge 6.9 A 9.2 A
U.S. Route 101 Southbound Off-Ramp C Diverge 5.6 A 8.3 A
U.S. Route 101 Northbound On-Ramp C Merge 6.2 A 8.1 A
U.S. Route 101 Northbound Off-Ramp C Diverge 6.3 A 8.8 A
U.S. Route 101 Southbound On-Ramp C Merge 6.8 A 9.2 A
U.S. Route 101 Southbound Off-Ramp C Diverge 4.1 A 6.6 A
Interchange Location
AM Peak Hour PM Peak Hour
US 101 Ramps @ 6th Avenue I/C
US 101 Ramps @ Main Street I/C
YEAR 2040 BASE TRAFFIC OPERATIONS This section provides a summary of intersection, mainline and ramp merge/diverge analysis for Year 2040 Base conditions. Figure 7 (in the appendix) depicts the intersection volumes and Figure 8 (in the appendix) depicts the freeway mainline and ramp volumes.
Intersections Year 2040 Base peak-hour traffic operations were quantified for the study intersections. Table 3Asummarizes Year 2040 Base AM and PM peak hour intersection LOS values with Year 2040 traffic volumes (shown on Figure 7) and lane geometrics and control (shown on Figure 2).
TABLE 3A YEAR 2040 BASE CONDITIONS: INTERSECTIONS LEVEL OF SERVICE
Delay LOSWarrant
Met?3Delay LOS
Warrant Met?3
1 6th Avenue & Kay Avenue TWSC C 9.1 A - 9.1 A -
2 6th Avenue & Kahlstrom Avenue TWSC C 9.1 A - 8.9 A -
3 Kay Avenue & US 101 SB Ramps TWSC C 9.8 A - 9.3 A -
4 Kahlstrom Avenue & 7th Avenue TWSC C 9.1 A - 1.9 A -
5 Scenic Drive & Main Street TWSC C 17.1 C - 21.1 C -
6 Westhaven Drive & US 101 SB Ramps TWSC C 11.3 B - 11.8 B -
7 Westhaven Drive & US 101 NB Ramps TWSC C 12.8 B - 14.5 B -
8 Westhaven Drive & Frontage Road TWSC C 10.0 A - 9.6 A -
9 Scenic Drive & Baker Ranch Drive TWSC C 2.5 A - 8.6 A -
10 Scenic Drive & Cher-Ae Heights Casino TWSC C 8.7 A - 8.9 A -
11 Scenic Drive & Cher-Ae Lane TWSC C 8.7 A - 9.4 A -
12 Scenic Drive & Landford Road TWSC C 9.1 A - 9.6 A -
Notes:
1. TWSC = Two Way Stop Control2. LOS = Delay based on worst minor street approach for TWSC intersections
3. Warrant = Based on California MUTCD Warrant 3
# Intersection
Control
Type1,2
Target LOS
AM Peak Hour PM Peak Hour
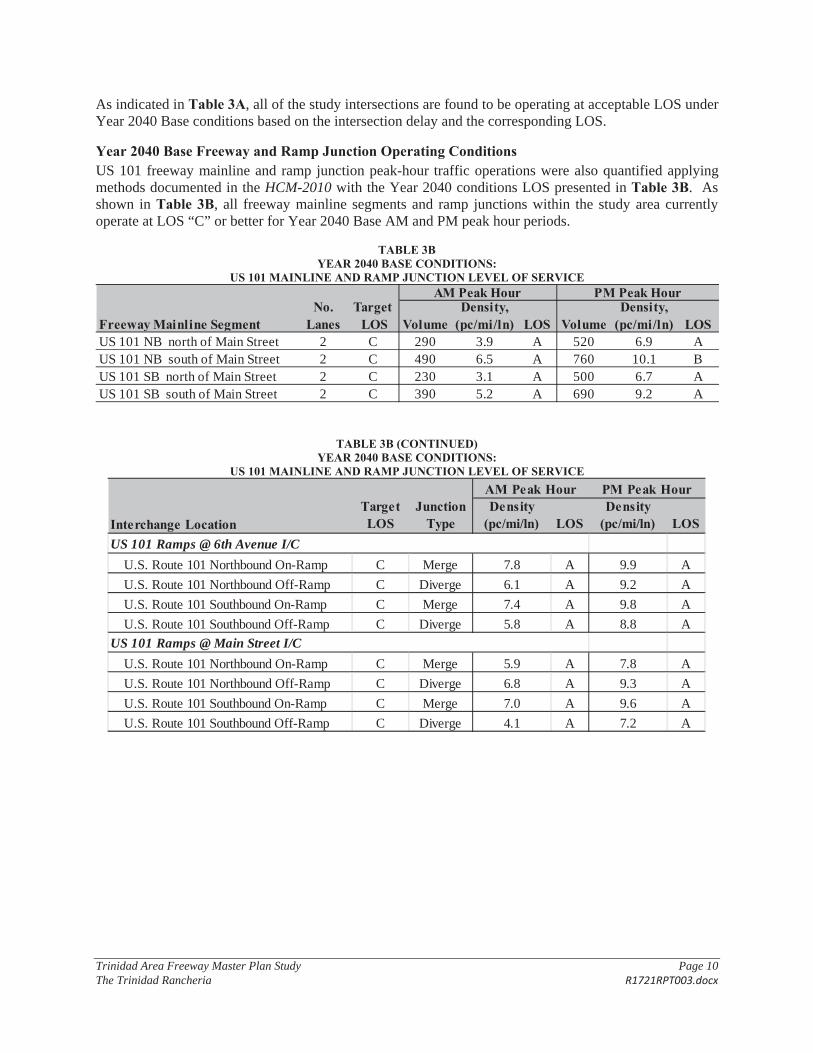
Trinidad Area Freeway Master Plan Study Page 10 The Trinidad Rancheria R1721RPT003.docx
As indicated in Table 3A, all of the study intersections are found to be operating at acceptable LOS under Year 2040 Base conditions based on the intersection delay and the corresponding LOS.
Year 2040 Base Freeway and Ramp Junction Operating Conditions US 101 freeway mainline and ramp junction peak-hour traffic operations were also quantified applying methods documented in the HCM-2010 with the Year 2040 conditions LOS presented in Table 3B. As shown in Table 3B, all freeway mainline segments and ramp junctions within the study area currently operate at LOS “C” or better for Year 2040 Base AM and PM peak hour periods.
TABLE 3B YEAR 2040 BASE CONDITIONS:
US 101 MAINLINE AND RAMP JUNCTION LEVEL OF SERVICE
VolumeDensity,
(pc/mi/ln) LOS VolumeDensity,
(pc/mi/ln) LOSUS 101 NB north of Main Street 2 C 290 3.9 A 520 6.9 AUS 101 NB south of Main Street 2 C 490 6.5 A 760 10.1 BUS 101 SB north of Main Street 2 C 230 3.1 A 500 6.7 AUS 101 SB south of Main Street 2 C 390 5.2 A 690 9.2 A
Freeway Mainline SegmentNo.
LanesTarget
LOS
AM Peak Hour PM Peak Hour
TABLE 3B (CONTINUED) YEAR 2040 BASE CONDITIONS:
US 101 MAINLINE AND RAMP JUNCTION LEVEL OF SERVICE
Target LOS
Junction Type
Density (pc/mi/ln) LOS
Density (pc/mi/ln) LOS
U.S. Route 101 Northbound On-Ramp C Merge 7.8 A 9.9 A
U.S. Route 101 Northbound Off-Ramp C Diverge 6.1 A 9.2 A
U.S. Route 101 Southbound On-Ramp C Merge 7.4 A 9.8 A
U.S. Route 101 Southbound Off-Ramp C Diverge 5.8 A 8.8 A
U.S. Route 101 Northbound On-Ramp C Merge 5.9 A 7.8 A
U.S. Route 101 Northbound Off-Ramp C Diverge 6.8 A 9.3 A
U.S. Route 101 Southbound On-Ramp C Merge 7.0 A 9.6 A
U.S. Route 101 Southbound Off-Ramp C Diverge 4.1 A 7.2 A
Interchange Location
AM Peak Hour PM Peak Hour
US 101 Ramps @ 6th Avenue I/C
US 101 Ramps @ Main Street I/C
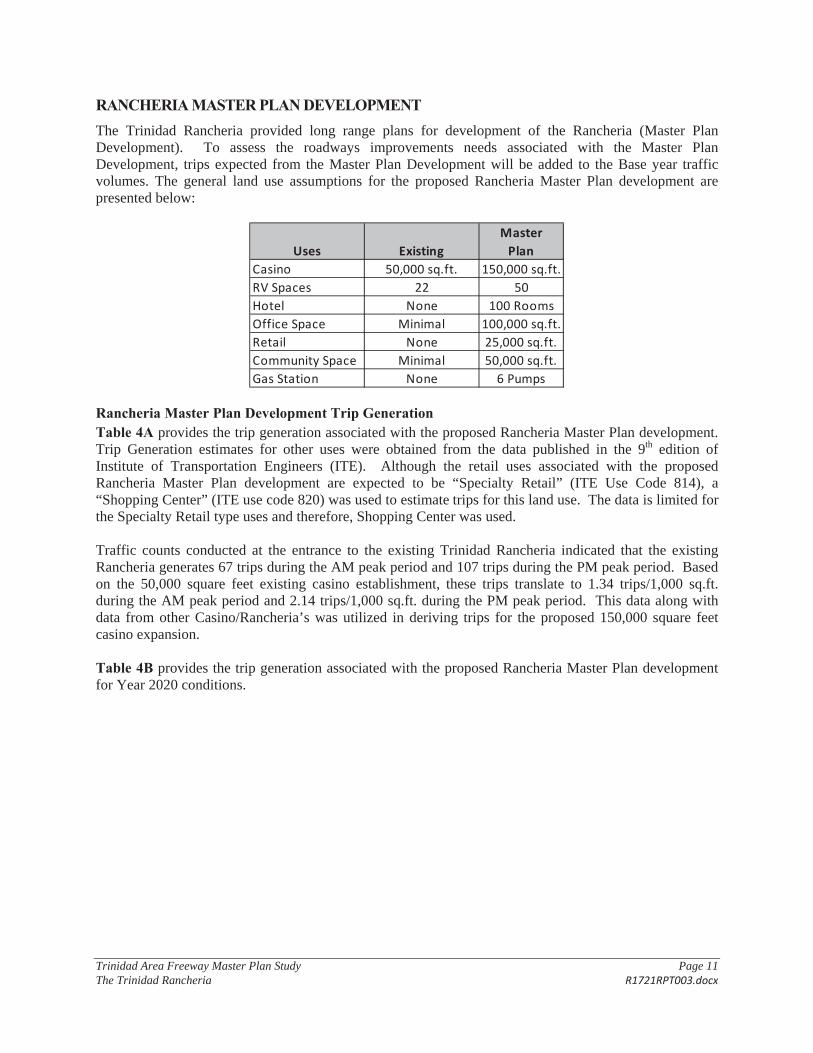
Trinidad Area Freeway Master Plan Study Page 11 The Trinidad Rancheria R1721RPT003.docx
RANCHERIA MASTER PLAN DEVELOPMENT The Trinidad Rancheria provided long range plans for development of the Rancheria (Master Plan Development). To assess the roadways improvements needs associated with the Master Plan Development, trips expected from the Master Plan Development will be added to the Base year traffic volumes. The general land use assumptions for the proposed Rancheria Master Plan development are presented below:
Uses ExistingMasterPlan
Casino 50,000 sq.ft. 150,000 sq.ft.RV Spaces 22 50Hotel None 100 RoomsOffice Space Minimal 100,000 sq.ft.Retail None 25,000 sq.ft.Community Space Minimal 50,000 sq.ft.Gas Station None 6 Pumps
Rancheria Master Plan Development Trip Generation Table 4A provides the trip generation associated with the proposed Rancheria Master Plan development. Trip Generation estimates for other uses were obtained from the data published in the 9th edition of Institute of Transportation Engineers (ITE). Although the retail uses associated with the proposed Rancheria Master Plan development are expected to be “Specialty Retail” (ITE Use Code 814), a “Shopping Center” (ITE use code 820) was used to estimate trips for this land use. The data is limited for the Specialty Retail type uses and therefore, Shopping Center was used.
Traffic counts conducted at the entrance to the existing Trinidad Rancheria indicated that the existing Rancheria generates 67 trips during the AM peak period and 107 trips during the PM peak period. Based on the 50,000 square feet existing casino establishment, these trips translate to 1.34 trips/1,000 sq.ft. during the AM peak period and 2.14 trips/1,000 sq.ft. during the PM peak period. This data along with data from other Casino/Rancheria’s was utilized in deriving trips for the proposed 150,000 square feet casino expansion.
Table 4B provides the trip generation associated with the proposed Rancheria Master Plan development for Year 2020 conditions.
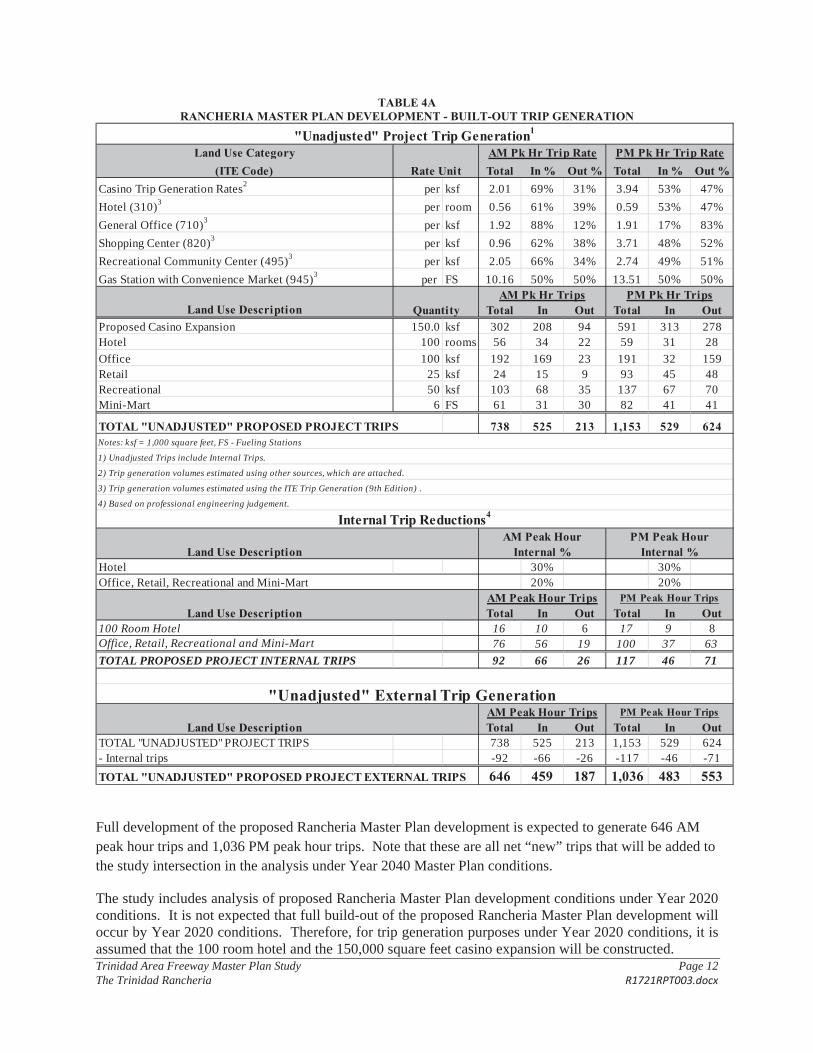
Trinidad Area Freeway Master Plan Study Page 12 The Trinidad Rancheria R1721RPT003.docx
TABLE 4A RANCHERIA MASTER PLAN DEVELOPMENT - BUILT-OUT TRIP GENERATION
Land Use Category AM Pk Hr Trip Rate PM Pk Hr Trip Rate(ITE Code) Total In % Out % Total In % Out %
Casino Trip Generation Rates2 per ksf 2.01 69% 31% 3.94 53% 47%
Hotel (310)3 per room 0.56 61% 39% 0.59 53% 47%
General Office (710)3 per ksf 1.92 88% 12% 1.91 17% 83%
Shopping Center (820)3 per ksf 0.96 62% 38% 3.71 48% 52%
Recreational Community Center (495)3 per ksf 2.05 66% 34% 2.74 49% 51%
Gas Station with Convenience Market (945)3 per FS 10.16 50% 50% 13.51 50% 50%AM Pk Hr Trips PM Pk Hr Trips
Land Use Description Total In Out Total In OutProposed Casino Expansion 150.0 ksf 302 208 94 591 313 278Hotel 100 rooms 56 34 22 59 31 28
Office 100 ksf 192 169 23 191 32 159Retail 25 ksf 24 15 9 93 45 48Recreational 50 ksf 103 68 35 137 67 70Mini-Mart 6 FS 61 31 30 82 41 41
TOTAL "UNADJUSTED" PROPOSED PROJECT TRIPS 738 525 213 1,153 529 624
AM Peak Hour PM Peak HourLand Use Description Internal % Internal %
Hotel 30% 30%20% 20%
AM Peak Hour Trips PM Peak Hour TripsLand Use Description Total In Out Total In Out
100 Room Hotel 16 10 6 17 9 8Office, Retail, Recreational and Mini-Mart 76 56 19 100 37 63
TOTAL PROPOSED PROJECT INTERNAL TRIPS 92 66 26 117 46 71
AM Peak Hour Trips PM Peak Hour TripsLand Use Description Total In Out Total In Out
TOTAL "UNADJUSTED" PROJECT TRIPS 738 525 213 1,153 529 624- Internal trips -92 -66 -26 -117 -46 -71
TOTAL "UNADJUSTED" PROPOSED PROJECT EXTERNAL TRIPS 646 459 187 1,036 483 553
4) Based on professional engineering judgement.
Office, Retail, Recreational and Mini-Mart
"Unadjusted" External Trip Generation
Internal Trip Reductions4
Quantity
Notes: ksf = 1,000 square feet, FS - Fueling Stations
1) Unadjusted Trips include Internal Trips.
2) Trip generation volumes estimated using other sources, which are attached.
3) Trip generation volumes estimated using the ITE Trip Generation (9th Edition) .
"Unadjusted" Project Trip Generation1
Rate Unit
Full development of the proposed Rancheria Master Plan development is expected to generate 646 AM peak hour trips and 1,036 PM peak hour trips. Note that these are all net “new” trips that will be added to the study intersection in the analysis under Year 2040 Master Plan conditions.
The study includes analysis of proposed Rancheria Master Plan development conditions under Year 2020 conditions. It is not expected that full build-out of the proposed Rancheria Master Plan development will occur by Year 2020 conditions. Therefore, for trip generation purposes under Year 2020 conditions, it is assumed that the 100 room hotel and the 150,000 square feet casino expansion will be constructed.
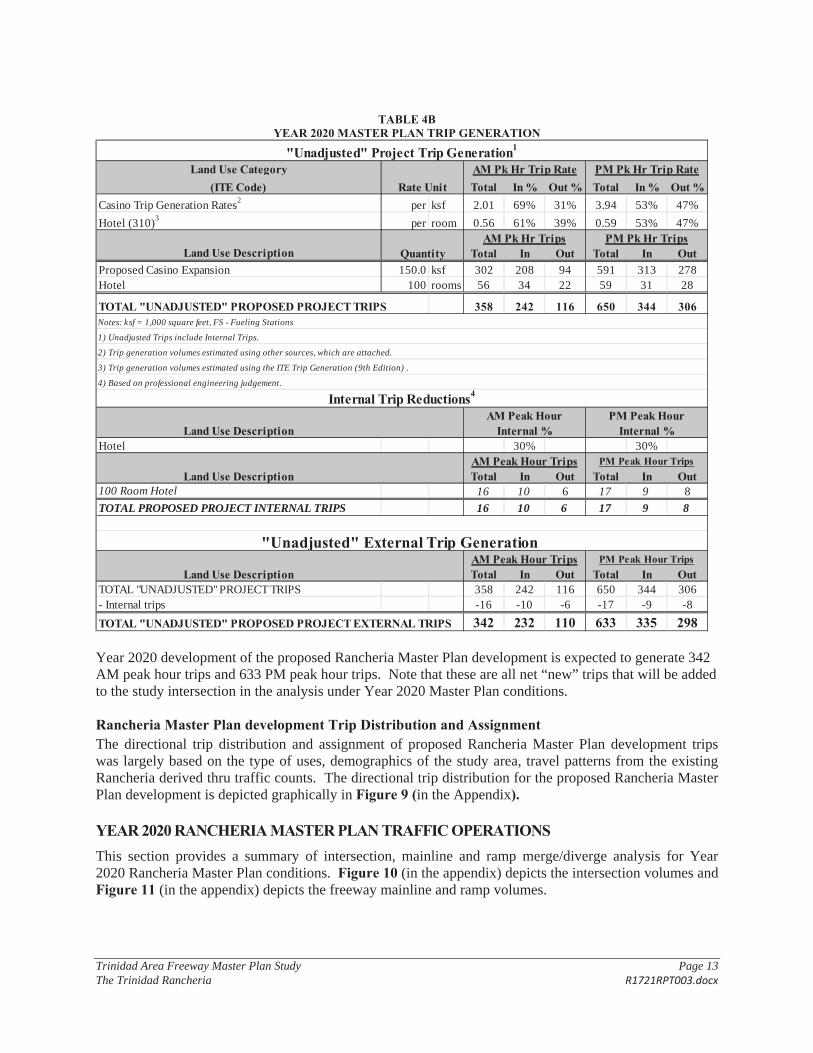
Trinidad Area Freeway Master Plan Study Page 13 The Trinidad Rancheria R1721RPT003.docx
TABLE 4B YEAR 2020 MASTER PLAN TRIP GENERATION
Land Use Category AM Pk Hr Trip Rate PM Pk Hr Trip Rate(ITE Code) Total In % Out % Total In % Out %
Casino Trip Generation Rates2 per ksf 2.01 69% 31% 3.94 53% 47%
Hotel (310)3 per room 0.56 61% 39% 0.59 53% 47%AM Pk Hr Trips PM Pk Hr Trips
Land Use Description Total In Out Total In OutProposed Casino Expansion 150.0 ksf 302 208 94 591 313 278Hotel 100 rooms 56 34 22 59 31 28
TOTAL "UNADJUSTED" PROPOSED PROJECT TRIPS 358 242 116 650 344 306
AM Peak Hour PM Peak HourLand Use Description Internal % Internal %
Hotel 30% 30%AM Peak Hour Trips PM Peak Hour Trips
Land Use Description Total In Out Total In Out100 Room Hotel 16 10 6 17 9 8
TOTAL PROPOSED PROJECT INTERNAL TRIPS 16 10 6 17 9 8
AM Peak Hour Trips PM Peak Hour TripsLand Use Description Total In Out Total In Out
TOTAL "UNADJUSTED" PROJECT TRIPS 358 242 116 650 344 306- Internal trips -16 -10 -6 -17 -9 -8
TOTAL "UNADJUSTED" PROPOSED PROJECT EXTERNAL TRIPS 342 232 110 633 335 298
Internal Trip Reductions4
"Unadjusted" External Trip Generation
4) Based on professional engineering judgement.
"Unadjusted" Project Trip Generation1
Rate Unit
Quantity
Notes: ksf = 1,000 square feet, FS - Fueling Stations
1) Unadjusted Trips include Internal Trips.
2) Trip generation volumes estimated using other sources, which are attached.
3) Trip generation volumes estimated using the ITE Trip Generation (9th Edition) .
Year 2020 development of the proposed Rancheria Master Plan development is expected to generate 342 AM peak hour trips and 633 PM peak hour trips. Note that these are all net “new” trips that will be added to the study intersection in the analysis under Year 2020 Master Plan conditions.
Rancheria Master Plan development Trip Distribution and Assignment The directional trip distribution and assignment of proposed Rancheria Master Plan development trips was largely based on the type of uses, demographics of the study area, travel patterns from the existing Rancheria derived thru traffic counts. The directional trip distribution for the proposed Rancheria Master Plan development is depicted graphically in Figure 9 (in the Appendix).
YEAR 2020 RANCHERIA MASTER PLAN TRAFFIC OPERATIONS This section provides a summary of intersection, mainline and ramp merge/diverge analysis for Year 2020 Rancheria Master Plan conditions. Figure 10 (in the appendix) depicts the intersection volumes and Figure 11 (in the appendix) depicts the freeway mainline and ramp volumes.
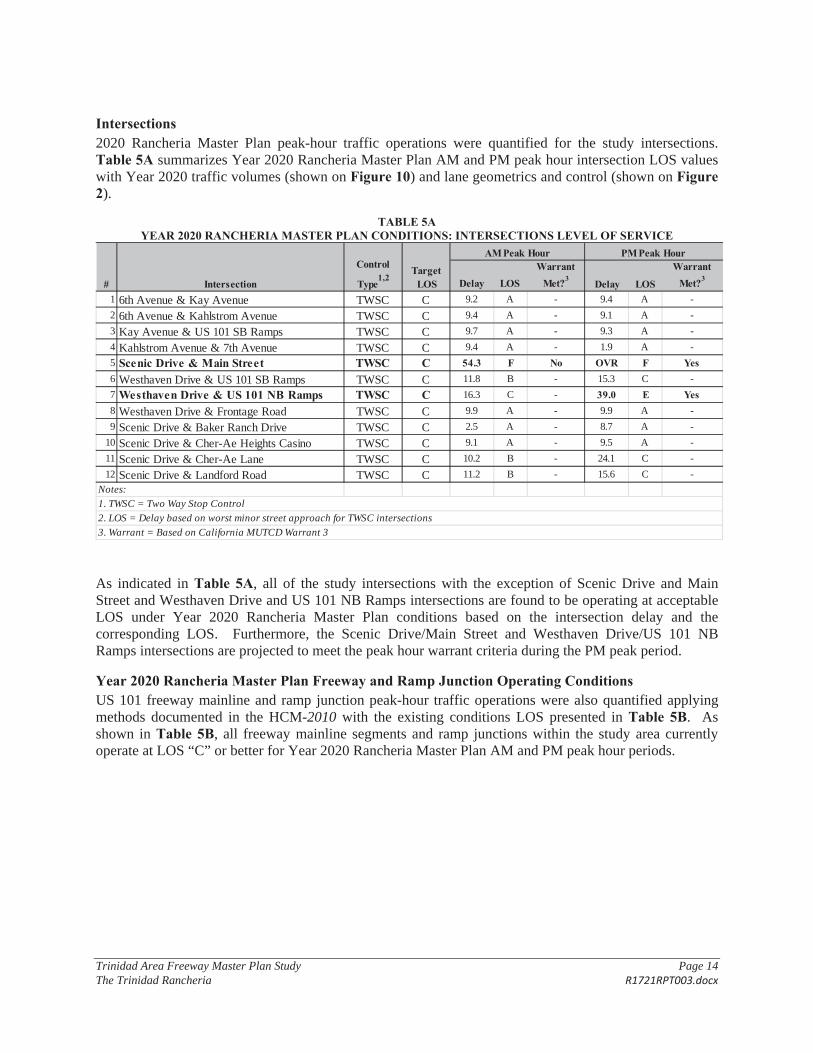
Trinidad Area Freeway Master Plan Study Page 14 The Trinidad Rancheria R1721RPT003.docx
Intersections 2020 Rancheria Master Plan peak-hour traffic operations were quantified for the study intersections. Table 5A summarizes Year 2020 Rancheria Master Plan AM and PM peak hour intersection LOS values with Year 2020 traffic volumes (shown on Figure 10) and lane geometrics and control (shown on Figure 2).
TABLE 5A YEAR 2020 RANCHERIA MASTER PLAN CONDITIONS: INTERSECTIONS LEVEL OF SERVICE
Delay LOSWarrant
Met?3 Delay LOS
Warrant Met?3
1 6th Avenue & Kay Avenue TWSC C 9.2 A - 9.4 A -
2 6th Avenue & Kahlstrom Avenue TWSC C 9.4 A - 9.1 A -
3 Kay Avenue & US 101 SB Ramps TWSC C 9.7 A - 9.3 A -
4 Kahlstrom Avenue & 7th Avenue TWSC C 9.4 A - 1.9 A -
5 Scenic Drive & Main Street TWSC C 54.3 F No OVR F Yes6 Westhaven Drive & US 101 SB Ramps TWSC C 11.8 B - 15.3 C -
7 Westhaven Drive & US 101 NB Ramps TWSC C 16.3 C - 39.0 E Yes8 Westhaven Drive & Frontage Road TWSC C 9.9 A - 9.9 A -
9 Scenic Drive & Baker Ranch Drive TWSC C 2.5 A - 8.7 A -
10 Scenic Drive & Cher-Ae Heights Casino TWSC C 9.1 A - 9.5 A -
11 Scenic Drive & Cher-Ae Lane TWSC C 10.2 B - 24.1 C -
12 Scenic Drive & Landford Road TWSC C 11.2 B - 15.6 C -
Notes:1. TWSC = Two Way Stop Control
2. LOS = Delay based on worst minor street approach for TWSC intersections
3. Warrant = Based on California MUTCD Warrant 3
# Intersection
Control
Type1,2
Target LOS
AM Peak Hour PM Peak Hour
As indicated in Table 5A, all of the study intersections with the exception of Scenic Drive and Main Street and Westhaven Drive and US 101 NB Ramps intersections are found to be operating at acceptable LOS under Year 2020 Rancheria Master Plan conditions based on the intersection delay and the corresponding LOS. Furthermore, the Scenic Drive/Main Street and Westhaven Drive/US 101 NB Ramps intersections are projected to meet the peak hour warrant criteria during the PM peak period.
Year 2020 Rancheria Master Plan Freeway and Ramp Junction Operating Conditions US 101 freeway mainline and ramp junction peak-hour traffic operations were also quantified applying methods documented in the HCM-2010 with the existing conditions LOS presented in Table 5B. As shown in Table 5B, all freeway mainline segments and ramp junctions within the study area currently operate at LOS “C” or better for Year 2020 Rancheria Master Plan AM and PM peak hour periods.
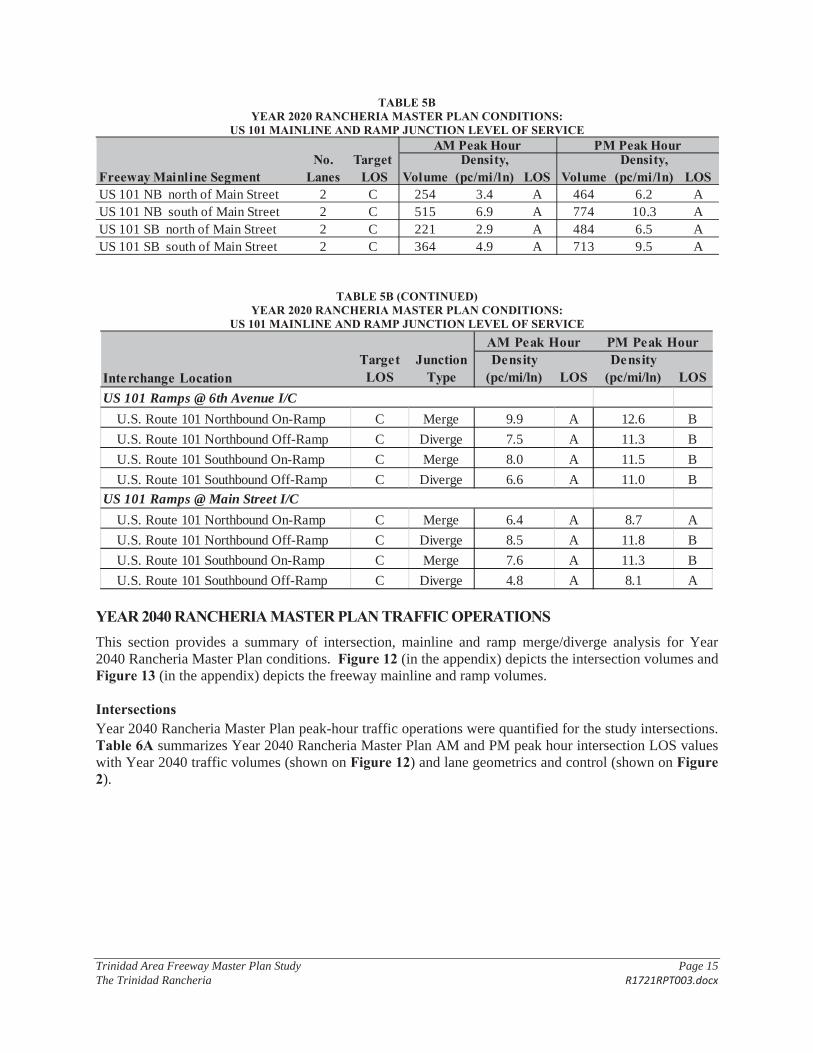
Trinidad Area Freeway Master Plan Study Page 15 The Trinidad Rancheria R1721RPT003.docx
TABLE 5B YEAR 2020 RANCHERIA MASTER PLAN CONDITIONS:
US 101 MAINLINE AND RAMP JUNCTION LEVEL OF SERVICE
VolumeDensity,
(pc/mi/ln) LOS VolumeDensity,
(pc/mi/ln) LOSUS 101 NB north of Main Street 2 C 254 3.4 A 464 6.2 AUS 101 NB south of Main Street 2 C 515 6.9 A 774 10.3 AUS 101 SB north of Main Street 2 C 221 2.9 A 484 6.5 AUS 101 SB south of Main Street 2 C 364 4.9 A 713 9.5 A
Freeway Mainline SegmentNo.
LanesTarget
LOS
AM Peak Hour PM Peak Hour
TABLE 5B (CONTINUED) YEAR 2020 RANCHERIA MASTER PLAN CONDITIONS:
US 101 MAINLINE AND RAMP JUNCTION LEVEL OF SERVICE
Target LOS
Junction Type
Density (pc/mi/ln) LOS
Density (pc/mi/ln) LOS
U.S. Route 101 Northbound On-Ramp C Merge 9.9 A 12.6 B
U.S. Route 101 Northbound Off-Ramp C Diverge 7.5 A 11.3 B
U.S. Route 101 Southbound On-Ramp C Merge 8.0 A 11.5 B
U.S. Route 101 Southbound Off-Ramp C Diverge 6.6 A 11.0 B
U.S. Route 101 Northbound On-Ramp C Merge 6.4 A 8.7 A
U.S. Route 101 Northbound Off-Ramp C Diverge 8.5 A 11.8 B
U.S. Route 101 Southbound On-Ramp C Merge 7.6 A 11.3 B
U.S. Route 101 Southbound Off-Ramp C Diverge 4.8 A 8.1 A
Interchange Location
AM Peak Hour PM Peak Hour
US 101 Ramps @ 6th Avenue I/C
US 101 Ramps @ Main Street I/C
YEAR 2040 RANCHERIA MASTER PLAN TRAFFIC OPERATIONS This section provides a summary of intersection, mainline and ramp merge/diverge analysis for Year 2040 Rancheria Master Plan conditions. Figure 12 (in the appendix) depicts the intersection volumes and Figure 13 (in the appendix) depicts the freeway mainline and ramp volumes.
Intersections Year 2040 Rancheria Master Plan peak-hour traffic operations were quantified for the study intersections. Table 6A summarizes Year 2040 Rancheria Master Plan AM and PM peak hour intersection LOS values with Year 2040 traffic volumes (shown on Figure 12) and lane geometrics and control (shown on Figure 2).
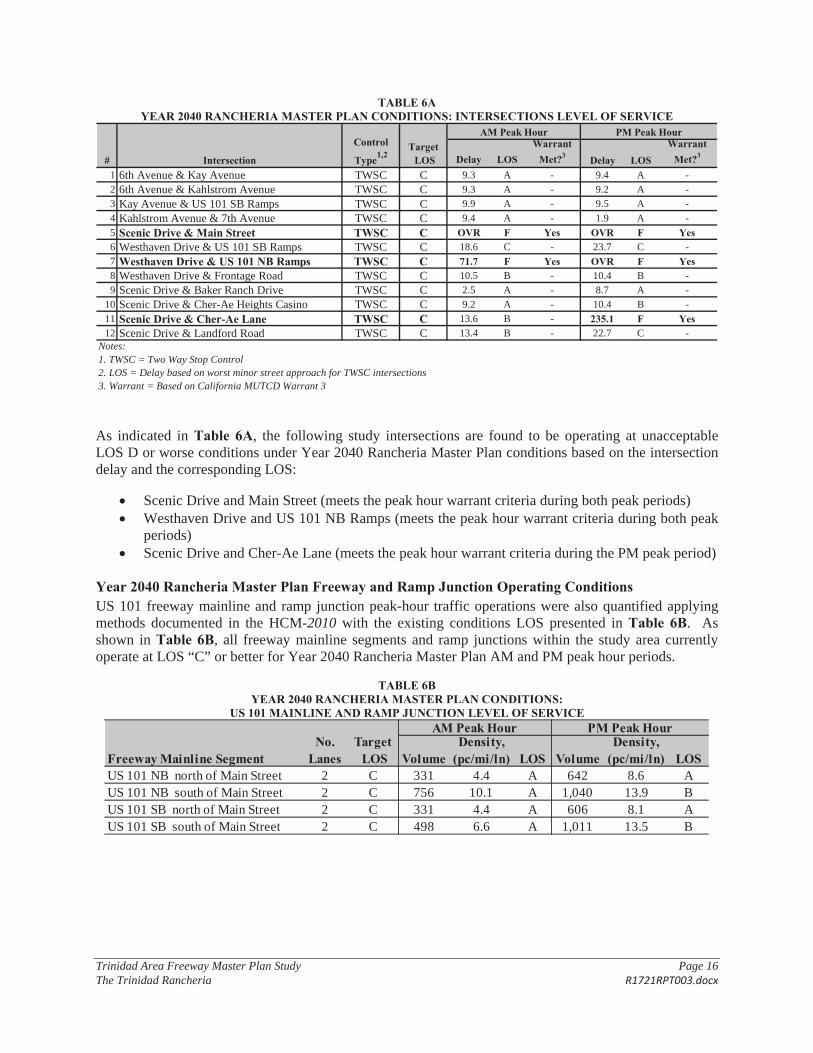
Trinidad Area Freeway Master Plan Study Page 16 The Trinidad Rancheria R1721RPT003.docx
TABLE 6A YEAR 2040 RANCHERIA MASTER PLAN CONDITIONS: INTERSECTIONS LEVEL OF SERVICE
Delay LOSWarrant
Met?3 Delay LOSWarrant
Met?3
1 6th Avenue & Kay Avenue TWSC C 9.3 A - 9.4 A -
2 6th Avenue & Kahlstrom Avenue TWSC C 9.3 A - 9.2 A -
3 Kay Avenue & US 101 SB Ramps TWSC C 9.9 A - 9.5 A -
4 Kahlstrom Avenue & 7th Avenue TWSC C 9.4 A - 1.9 A -
5 Scenic Drive & Main Street TWSC C OVR F Yes OVR F Yes6 Westhaven Drive & US 101 SB Ramps TWSC C 18.6 C - 23.7 C -
7 Westhaven Drive & US 101 NB Ramps TWSC C 71.7 F Yes OVR F Yes8 Westhaven Drive & Frontage Road TWSC C 10.5 B - 10.4 B -
9 Scenic Drive & Baker Ranch Drive TWSC C 2.5 A - 8.7 A -
10 Scenic Drive & Cher-Ae Heights Casino TWSC C 9.2 A - 10.4 B -
11 Scenic Drive & Cher-Ae Lane TWSC C 13.6 B - 235.1 F Yes12 Scenic Drive & Landford Road TWSC C 13.4 B - 22.7 C -
Notes:1. TWSC = Two Way Stop Control2. LOS = Delay based on worst minor street approach for TWSC intersections3. Warrant = Based on California MUTCD Warrant 3
# Intersection
Control
Type1,2Target LOS
AM Peak Hour PM Peak Hour
As indicated in Table 6A, the following study intersections are found to be operating at unacceptable LOS D or worse conditions under Year 2040 Rancheria Master Plan conditions based on the intersection delay and the corresponding LOS:
Scenic Drive and Main Street (meets the peak hour warrant criteria during both peak periods) Westhaven Drive and US 101 NB Ramps (meets the peak hour warrant criteria during both peak periods)Scenic Drive and Cher-Ae Lane (meets the peak hour warrant criteria during the PM peak period)
Year 2040 Rancheria Master Plan Freeway and Ramp Junction Operating Conditions US 101 freeway mainline and ramp junction peak-hour traffic operations were also quantified applying methods documented in the HCM-2010 with the existing conditions LOS presented in Table 6B. As shown in Table 6B, all freeway mainline segments and ramp junctions within the study area currently operate at LOS “C” or better for Year 2040 Rancheria Master Plan AM and PM peak hour periods.
TABLE 6B YEAR 2040 RANCHERIA MASTER PLAN CONDITIONS:
US 101 MAINLINE AND RAMP JUNCTION LEVEL OF SERVICE
VolumeDensity,
(pc/mi/ln) LOS VolumeDensity,
(pc/mi/ln) LOSUS 101 NB north of Main Street 2 C 331 4.4 A 642 8.6 AUS 101 NB south of Main Street 2 C 756 10.1 A 1,040 13.9 BUS 101 SB north of Main Street 2 C 331 4.4 A 606 8.1 AUS 101 SB south of Main Street 2 C 498 6.6 A 1,011 13.5 B
Freeway Mainline SegmentNo.
LanesTarget
LOS
AM Peak Hour PM Peak Hour
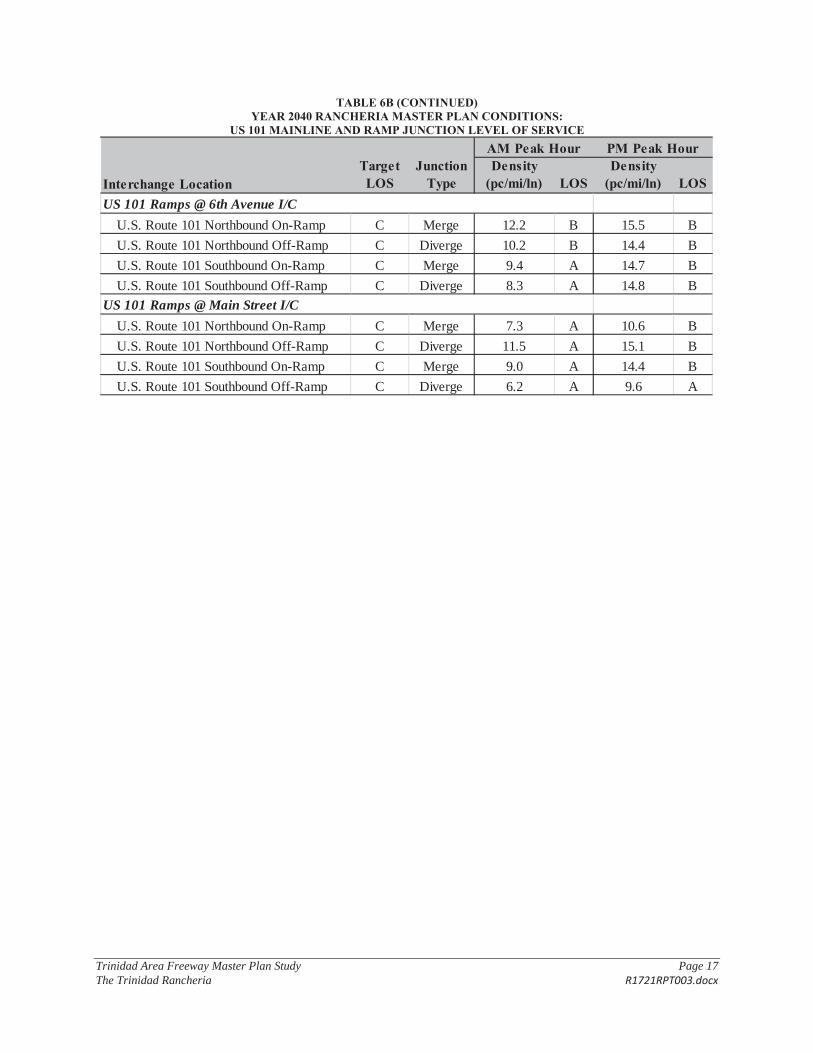
Trinidad Area Freeway Master Plan Study Page 17 The Trinidad Rancheria R1721RPT003.docx
TABLE 6B (CONTINUED) YEAR 2040 RANCHERIA MASTER PLAN CONDITIONS:
US 101 MAINLINE AND RAMP JUNCTION LEVEL OF SERVICE
Target LOS
Junction Type
Density (pc/mi/ln) LOS
Density (pc/mi/ln) LOS
U.S. Route 101 Northbound On-Ramp C Merge 12.2 B 15.5 B
U.S. Route 101 Northbound Off-Ramp C Diverge 10.2 B 14.4 B
U.S. Route 101 Southbound On-Ramp C Merge 9.4 A 14.7 B
U.S. Route 101 Southbound Off-Ramp C Diverge 8.3 A 14.8 B
U.S. Route 101 Northbound On-Ramp C Merge 7.3 A 10.6 B
U.S. Route 101 Northbound Off-Ramp C Diverge 11.5 A 15.1 B
U.S. Route 101 Southbound On-Ramp C Merge 9.0 A 14.4 B
U.S. Route 101 Southbound Off-Ramp C Diverge 6.2 A 9.6 A
Interchange Location
AM Peak Hour PM Peak Hour
US 101 Ramps @ 6th Avenue I/C
US 101 Ramps @ Main Street I/C
Trinidad Area Freeway Master Plan Study Page 18 The Trinidad Rancheria R1721RPT003.docx
CHER-AE LANE INTERCHANGE As noted in the previous analysis, with the addition of trips associated with the Rancheria Master Plan, the intersections on Main Street interchange are forecasted to operate at unacceptable LOS E or worse conditions under both Year 2020 and Year 2040 conditions. Without the Rancheria Master Plan trips, all of the study locations are projected to operate at acceptable LOS. Therefore, within this study, traffic operations analysis is evaluated with an interchange that provides direct access to the Rancheria and Westhaven Drive. This new interchange will be located approximately 0.7 miles south of the Main Street interchange.
For the purposes of the analysis a tight diamond interchange is assumed at the new interchange, which is referred to as the Cher-Ae Lane interchange. A two lane overcrossing is assumed with all-way stops at the two ramp locations. Easterly extension of Cher-Ae Lane past the interchange to intersect at a “T” intersection with Westhaven Drive is also assumed.
It should be noted that the spacing between the existing Main Street interchange and the proposed Cher-Ae Lane interchange does not meet the spacing requirements and a design exception would be necessary. However, the objective of this study is to analyze transportation operations associated with the new interchange and the design details and exceptions will be prepared in a Project Study Report, which will be prepared at a later time.
Weaving Analysis Caltrans District 1 Traffic Operations performed a weaving analysis for the proposed Cher-Ae Lane Interchange on U.S. 101, approximately 0.7 miles south of the Trinidad interchange. The Leisch Method, referred to in Index 504.7 of the Caltrans Highway Design Manual (HDM), 6th Edition, was used in this analysis. Figure 504.7A from the HDM, which demonstrates this method, is provided in the appendix. The results of this analysis provided by Caltrans District 1 Traffic Operations are summarized below.
The overall conclusion from this analysis is that there is adequate distance on U.S. 101 between the proposed interchange ramps and the existing Trinidad interchange ramps to accommodate the interaction of entering and exiting traffic (current and projected) on U.S. 101 in both the north and south directions while maintaining acceptable Level of Service (LOS) on the freeway. Auxiliary lanes will not be needed on U.S. 101 if a new interchange is constructed near PM 100.2.
Using the post mile locations for the ramp connections of the Trinidad interchange and proposed Cher-Ae Lane interchange, the on and off ramps would be separated by approximately 2,600 feet (0.49 miles) and 2,500 feet (0.47 miles) for the northbound and southbound portions of the freeway, respectively. According to Index 504.5, Paragraph 2, of the HDM, "auxiliary lanes should be provided in all cases when the weaving distance is less than 2000 feet." Under these criteria, auxiliary lanes would not be required for northbound (NB) and southbound (SB) U.S. 101 between the Trinidad interchange and the proposed interchange.
The weaving analysis prepared by Caltrans District 1 Traffic Operations was based on the Year 2020 and 2040 volume information presented in the appendix. The data used was in the units of vehicles per hour (vph) and was taken from the afternoon PM peak hour. Year 2020 plus interchange northbound weaving volumes was calculated at 233 vph (80 vph NB onramp + 153 vph NB off ramp). Southbound weaving was calculated at 244 vph PM peak (151 vph SB onramp + 93 vph SB off ramp). Year 2040 plus interchange northbound weaving volumes was calculated at 292 vph (139 NB onramp + 153 vph NB off ramp). Southbound weaving was calculated at 339 vph (212 vph SB onramp + 127 vph SB off ramp).
Trinidad Area Freeway Master Plan Study Page 19 The Trinidad Rancheria R1721RPT003.docx
HDM Section 504.7, Paragraph 3, gives a rough approximation for length of a weaving section, "one foot of length per weaving vehicle per hour (vph)." The largest weaving volume, 339 vph for Year 2040 in the southbound direction, would only require a 339 foot weaving section, which is much less than the 2500 and 2600 feet distances that exist between on and off ramps in the NB and SB directions, respectively. The distances between the ramps are more than adequate to accommodate the interaction of through traffic, traffic entering the freeway, and traffic exiting the freeway between the proposed and existing interchanges; therefore, auxiliary lanes would not be necessary.
The Leisch Method was used to determine Level of Service (LOS). The results from the method nomograph (HDM Figure 504.7A, provided in the appendix) show that the Year 2040 southbound weaving volume of 339 vph, or 401 passenger cars per hour (pcph), would result in LOS A. Being that the Year 2040 northbound weaving volume and the Year 2020 volumes are all less than 339 vph (401 pcph), LOS A would exist in both directions for the weaving section lengths between the interchanges for Year 2020 and 2040 conditions.
Design Exceptions To promote uniform practice on a statewide basis, the Caltrans HDM identifies standards that shall be considered during project planning. When design features or elements deviate from HDM mandatory standards, approval from the appropriate Caltrans Design Coordinator shall be obtained. The authority to approve exceptions to advisory standards rests with the District Director (District 1).
Design exception approval must be obtained prior to Caltrans approval of a Project Study Report (PSR). When project development is initiated with approval of a Project Study Report – Project Development Support (PSR-PDS) document, approval of applicable design exceptions can be deferred to the Project Report (PR) phase.
Table 82.1A of the HDM lists mandatory standards subject to the above approval requirements. A screening-level review of the standards resulted in development of the below list of potential exceptions to mandatory standards for this project:
HDM Index Standard Comment 101.1 Selection of Design Speed Local roads at interchanges may not meet standards. 201.1 Sight Distance Standards Local roads at interchanges may not meet standards. 202.2 Superelevation Local roads and ramp termini may not meet standards. 203.1 Horizontal Alignment Local roads may not meet standards. 204.1 Local Facility Grades Local road grades may not meet standards. 309.1 Clear Recovery Zone Existing topographic features may not meet standards. 501.3 Interchange Spacing A new interchange will require an exception. 504.3 Distance Between Ramp & Not met at existing interchanges. May not be met Frontage Roads at new interchange.
Table 82.1B of the HDM lists advisory standards subject to the above approval requirements. A screening-level review of the standards resulted in development of the below list of potential exceptions to advisory standards for this project:
HDM Index Standard Comment 101.1 Selection of Design Speed Local roads at interchanges may not meet standards. 105.4 Two ADA Ramp Design One access ramp is often appropriate at signalized
freeway ramps. 203.1 Horizontal Alignment Local roads may not meet standards. 204.1 Local Facility Grades Local road grades may not meet standards.
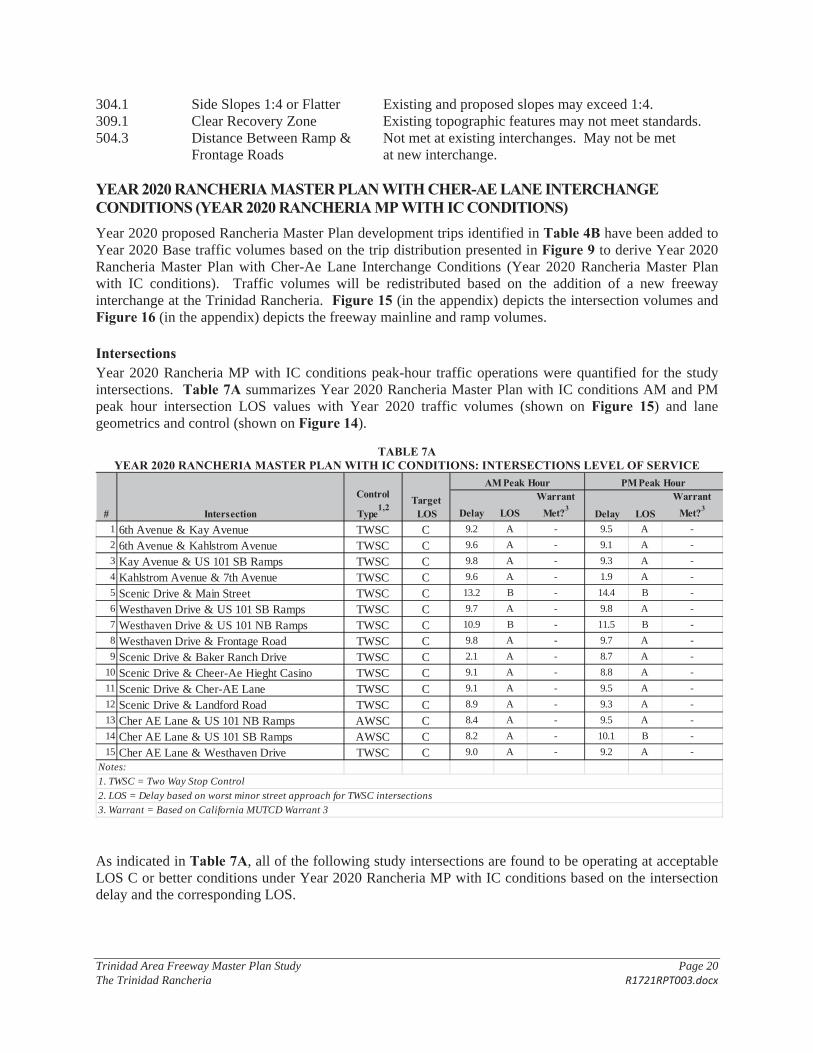
Trinidad Area Freeway Master Plan Study Page 20 The Trinidad Rancheria R1721RPT003.docx
304.1 Side Slopes 1:4 or Flatter Existing and proposed slopes may exceed 1:4. 309.1 Clear Recovery Zone Existing topographic features may not meet standards. 504.3 Distance Between Ramp & Not met at existing interchanges. May not be met Frontage Roads at new interchange.
YEAR 2020 RANCHERIA MASTER PLAN WITH CHER-AE LANE INTERCHANGE CONDITIONS (YEAR 2020 RANCHERIA MP WITH IC CONDITIONS) Year 2020 proposed Rancheria Master Plan development trips identified in Table 4B have been added to Year 2020 Base traffic volumes based on the trip distribution presented in Figure 9 to derive Year 2020 Rancheria Master Plan with Cher-Ae Lane Interchange Conditions (Year 2020 Rancheria Master Plan with IC conditions). Traffic volumes will be redistributed based on the addition of a new freeway interchange at the Trinidad Rancheria. Figure 15 (in the appendix) depicts the intersection volumes and Figure 16 (in the appendix) depicts the freeway mainline and ramp volumes.
Intersections Year 2020 Rancheria MP with IC conditions peak-hour traffic operations were quantified for the study intersections. Table 7A summarizes Year 2020 Rancheria Master Plan with IC conditions AM and PM peak hour intersection LOS values with Year 2020 traffic volumes (shown on Figure 15) and lane geometrics and control (shown on Figure 14).
TABLE 7A YEAR 2020 RANCHERIA MASTER PLAN WITH IC CONDITIONS: INTERSECTIONS LEVEL OF SERVICE
Delay LOSWarrant
Met?3 Delay LOS
Warrant Met?3
1 6th Avenue & Kay Avenue TWSC C 9.2 A - 9.5 A -
2 6th Avenue & Kahlstrom Avenue TWSC C 9.6 A - 9.1 A -
3 Kay Avenue & US 101 SB Ramps TWSC C 9.8 A - 9.3 A -
4 Kahlstrom Avenue & 7th Avenue TWSC C 9.6 A - 1.9 A -
5 Scenic Drive & Main Street TWSC C 13.2 B - 14.4 B -
6 Westhaven Drive & US 101 SB Ramps TWSC C 9.7 A - 9.8 A -
7 Westhaven Drive & US 101 NB Ramps TWSC C 10.9 B - 11.5 B -
8 Westhaven Drive & Frontage Road TWSC C 9.8 A - 9.7 A -
9 Scenic Drive & Baker Ranch Drive TWSC C 2.1 A - 8.7 A -
10 Scenic Drive & Cheer-Ae Hieght Casino TWSC C 9.1 A - 8.8 A -
11 Scenic Drive & Cher-AE Lane TWSC C 9.1 A - 9.5 A -
12 Scenic Drive & Landford Road TWSC C 8.9 A - 9.3 A -
13 Cher AE Lane & US 101 NB Ramps AWSC C 8.4 A - 9.5 A -
14 Cher AE Lane & US 101 SB Ramps AWSC C 8.2 A - 10.1 B -
15 Cher AE Lane & Westhaven Drive TWSC C 9.0 A - 9.2 A -
Notes:1. TWSC = Two Way Stop Control
2. LOS = Delay based on worst minor street approach for TWSC intersections3. Warrant = Based on California MUTCD Warrant 3
# Intersection
Control
Type1,2
Target LOS
AM Peak Hour PM Peak Hour
As indicated in Table 7A, all of the following study intersections are found to be operating at acceptable LOS C or better conditions under Year 2020 Rancheria MP with IC conditions based on the intersection delay and the corresponding LOS.
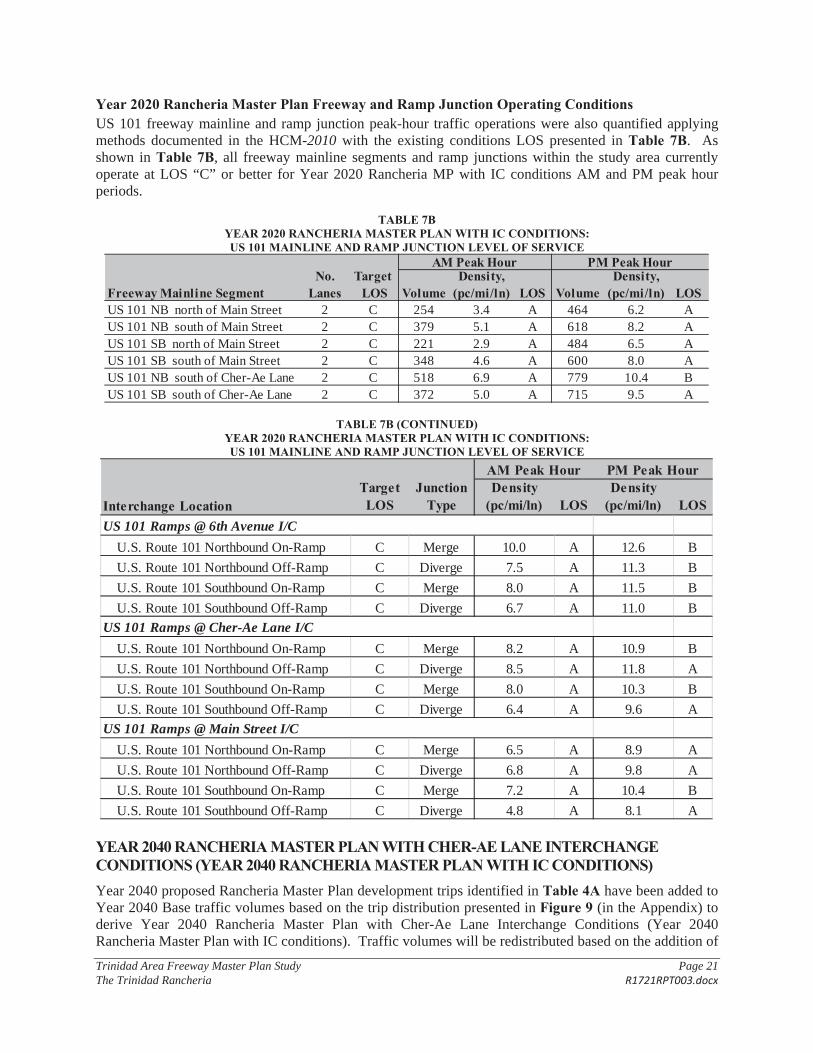
Trinidad Area Freeway Master Plan Study Page 21 The Trinidad Rancheria R1721RPT003.docx
Year 2020 Rancheria Master Plan Freeway and Ramp Junction Operating Conditions US 101 freeway mainline and ramp junction peak-hour traffic operations were also quantified applying methods documented in the HCM-2010 with the existing conditions LOS presented in Table 7B. As shown in Table 7B, all freeway mainline segments and ramp junctions within the study area currently operate at LOS “C” or better for Year 2020 Rancheria MP with IC conditions AM and PM peak hour periods.
TABLE 7B YEAR 2020 RANCHERIA MASTER PLAN WITH IC CONDITIONS:US 101 MAINLINE AND RAMP JUNCTION LEVEL OF SERVICE
VolumeDensity,
(pc/mi/ln) LOS VolumeDensity,
(pc/mi/ln) LOSUS 101 NB north of Main Street 2 C 254 3.4 A 464 6.2 AUS 101 NB south of Main Street 2 C 379 5.1 A 618 8.2 AUS 101 SB north of Main Street 2 C 221 2.9 A 484 6.5 AUS 101 SB south of Main Street 2 C 348 4.6 A 600 8.0 AUS 101 NB south of Cher-Ae Lane 2 C 518 6.9 A 779 10.4 BUS 101 SB south of Cher-Ae Lane 2 C 372 5.0 A 715 9.5 A
Freeway Mainline SegmentNo.
LanesTarget
LOS
AM Peak Hour PM Peak Hour
TABLE 7B (CONTINUED) YEAR 2020 RANCHERIA MASTER PLAN WITH IC CONDITIONS:US 101 MAINLINE AND RAMP JUNCTION LEVEL OF SERVICE
Target LOS
Junction Type
Density (pc/mi/ln) LOS
Density (pc/mi/ln) LOS
U.S. Route 101 Northbound On-Ramp C Merge 10.0 A 12.6 B
U.S. Route 101 Northbound Off-Ramp C Diverge 7.5 A 11.3 B
U.S. Route 101 Southbound On-Ramp C Merge 8.0 A 11.5 B
U.S. Route 101 Southbound Off-Ramp C Diverge 6.7 A 11.0 B
U.S. Route 101 Northbound On-Ramp C Merge 8.2 A 10.9 B
U.S. Route 101 Northbound Off-Ramp C Diverge 8.5 A 11.8 A
U.S. Route 101 Southbound On-Ramp C Merge 8.0 A 10.3 B
U.S. Route 101 Southbound Off-Ramp C Diverge 6.4 A 9.6 A
U.S. Route 101 Northbound On-Ramp C Merge 6.5 A 8.9 A
U.S. Route 101 Northbound Off-Ramp C Diverge 6.8 A 9.8 A
U.S. Route 101 Southbound On-Ramp C Merge 7.2 A 10.4 B
U.S. Route 101 Southbound Off-Ramp C Diverge 4.8 A 8.1 A
Interchange Location
AM Peak Hour PM Peak Hour
US 101 Ramps @ 6th Avenue I/C
US 101 Ramps @ Main Street I/C
US 101 Ramps @ Cher-Ae Lane I/C
YEAR 2040 RANCHERIA MASTER PLAN WITH CHER-AE LANE INTERCHANGE CONDITIONS (YEAR 2040 RANCHERIA MASTER PLAN WITH IC CONDITIONS) Year 2040 proposed Rancheria Master Plan development trips identified in Table 4A have been added to Year 2040 Base traffic volumes based on the trip distribution presented in Figure 9 (in the Appendix) to derive Year 2040 Rancheria Master Plan with Cher-Ae Lane Interchange Conditions (Year 2040 Rancheria Master Plan with IC conditions). Traffic volumes will be redistributed based on the addition of
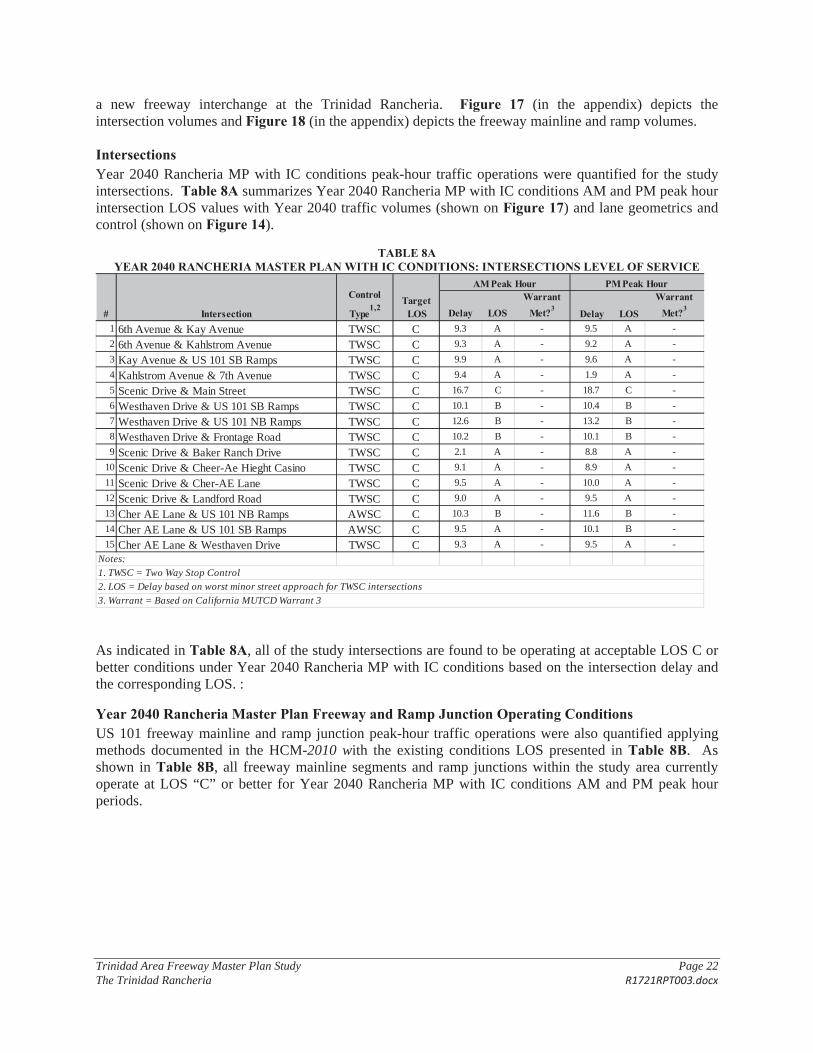
Trinidad Area Freeway Master Plan Study Page 22 The Trinidad Rancheria R1721RPT003.docx
a new freeway interchange at the Trinidad Rancheria. Figure 17 (in the appendix) depicts the intersection volumes and Figure 18 (in the appendix) depicts the freeway mainline and ramp volumes.
Intersections Year 2040 Rancheria MP with IC conditions peak-hour traffic operations were quantified for the study intersections. Table 8A summarizes Year 2040 Rancheria MP with IC conditions AM and PM peak hour intersection LOS values with Year 2040 traffic volumes (shown on Figure 17) and lane geometrics and control (shown on Figure 14).
TABLE 8A YEAR 2040 RANCHERIA MASTER PLAN WITH IC CONDITIONS: INTERSECTIONS LEVEL OF SERVICE
Delay LOSWarrant
Met?3Delay LOS
Warrant Met?3
1 6th Avenue & Kay Avenue TWSC C 9.3 A - 9.5 A -
2 6th Avenue & Kahlstrom Avenue TWSC C 9.3 A - 9.2 A -
3 Kay Avenue & US 101 SB Ramps TWSC C 9.9 A - 9.6 A -
4 Kahlstrom Avenue & 7th Avenue TWSC C 9.4 A - 1.9 A -
5 Scenic Drive & Main Street TWSC C 16.7 C - 18.7 C -
6 Westhaven Drive & US 101 SB Ramps TWSC C 10.1 B - 10.4 B -
7 Westhaven Drive & US 101 NB Ramps TWSC C 12.6 B - 13.2 B -
8 Westhaven Drive & Frontage Road TWSC C 10.2 B - 10.1 B -
9 Scenic Drive & Baker Ranch Drive TWSC C 2.1 A - 8.8 A -
10 Scenic Drive & Cheer-Ae Hieght Casino TWSC C 9.1 A - 8.9 A -
11 Scenic Drive & Cher-AE Lane TWSC C 9.5 A - 10.0 A -
12 Scenic Drive & Landford Road TWSC C 9.0 A - 9.5 A -
13 Cher AE Lane & US 101 NB Ramps AWSC C 10.3 B - 11.6 B -
14 Cher AE Lane & US 101 SB Ramps AWSC C 9.5 A - 10.1 B -
15 Cher AE Lane & Westhaven Drive TWSC C 9.3 A - 9.5 A -
Notes:
1. TWSC = Two Way Stop Control2. LOS = Delay based on worst minor street approach for TWSC intersections
3. Warrant = Based on California MUTCD Warrant 3
# Intersection
Control
Type1,2
Target LOS
AM Peak Hour PM Peak Hour
As indicated in Table 8A, all of the study intersections are found to be operating at acceptable LOS C or better conditions under Year 2040 Rancheria MP with IC conditions based on the intersection delay and the corresponding LOS. :
Year 2040 Rancheria Master Plan Freeway and Ramp Junction Operating Conditions US 101 freeway mainline and ramp junction peak-hour traffic operations were also quantified applying methods documented in the HCM-2010 with the existing conditions LOS presented in Table 8B. As shown in Table 8B, all freeway mainline segments and ramp junctions within the study area currently operate at LOS “C” or better for Year 2040 Rancheria MP with IC conditions AM and PM peak hour periods.
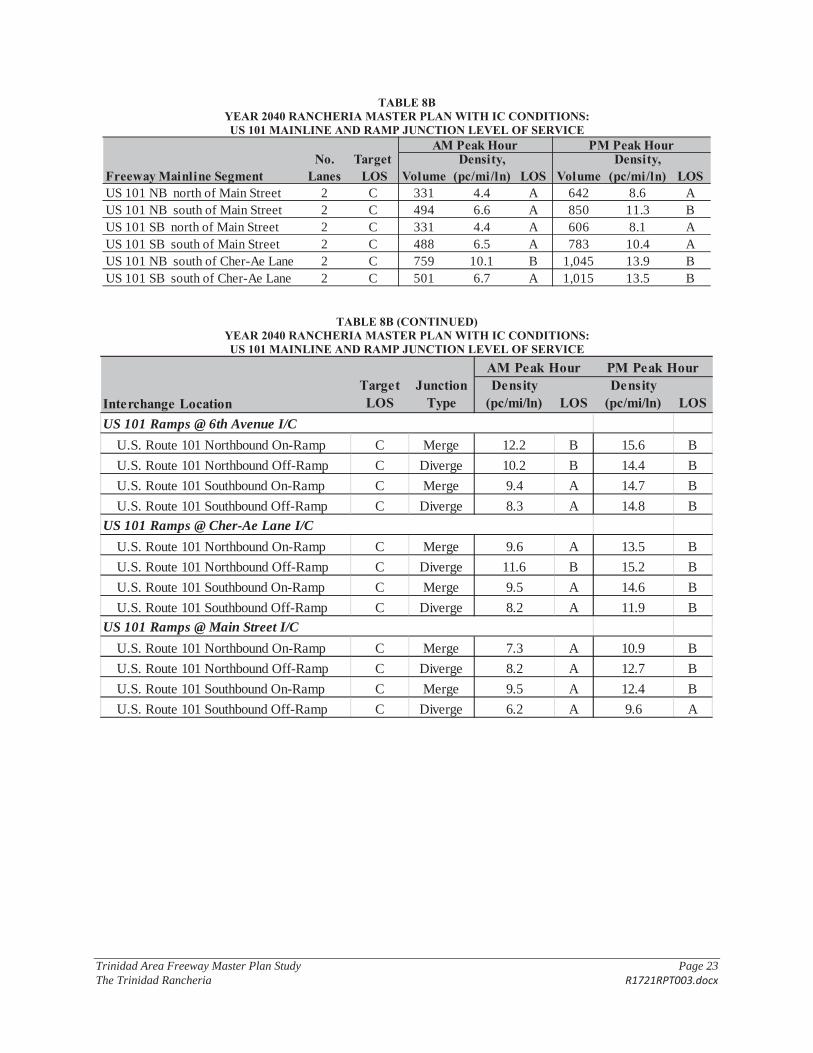
Trinidad Area Freeway Master Plan Study Page 23 The Trinidad Rancheria R1721RPT003.docx
TABLE 8B YEAR 2040 RANCHERIA MASTER PLAN WITH IC CONDITIONS:US 101 MAINLINE AND RAMP JUNCTION LEVEL OF SERVICE
VolumeDensity,
(pc/mi/ln) LOS VolumeDensity,
(pc/mi/ln) LOSUS 101 NB north of Main Street 2 C 331 4.4 A 642 8.6 AUS 101 NB south of Main Street 2 C 494 6.6 A 850 11.3 BUS 101 SB north of Main Street 2 C 331 4.4 A 606 8.1 AUS 101 SB south of Main Street 2 C 488 6.5 A 783 10.4 AUS 101 NB south of Cher-Ae Lane 2 C 759 10.1 B 1,045 13.9 BUS 101 SB south of Cher-Ae Lane 2 C 501 6.7 A 1,015 13.5 B
Freeway Mainline SegmentNo.
LanesTarget
LOS
AM Peak Hour PM Peak Hour
TABLE 8B (CONTINUED) YEAR 2040 RANCHERIA MASTER PLAN WITH IC CONDITIONS:US 101 MAINLINE AND RAMP JUNCTION LEVEL OF SERVICE
Target LOS
Junction Type
Density (pc/mi/ln) LOS
Density (pc/mi/ln) LOS
U.S. Route 101 Northbound On-Ramp C Merge 12.2 B 15.6 B
U.S. Route 101 Northbound Off-Ramp C Diverge 10.2 B 14.4 B
U.S. Route 101 Southbound On-Ramp C Merge 9.4 A 14.7 B
U.S. Route 101 Southbound Off-Ramp C Diverge 8.3 A 14.8 B
U.S. Route 101 Northbound On-Ramp C Merge 9.6 A 13.5 B
U.S. Route 101 Northbound Off-Ramp C Diverge 11.6 B 15.2 B
U.S. Route 101 Southbound On-Ramp C Merge 9.5 A 14.6 B
U.S. Route 101 Southbound Off-Ramp C Diverge 8.2 A 11.9 B
U.S. Route 101 Northbound On-Ramp C Merge 7.3 A 10.9 B
U.S. Route 101 Northbound Off-Ramp C Diverge 8.2 A 12.7 B
U.S. Route 101 Southbound On-Ramp C Merge 9.5 A 12.4 B
U.S. Route 101 Southbound Off-Ramp C Diverge 6.2 A 9.6 A
Interchange Location
AM Peak Hour PM Peak Hour
US 101 Ramps @ 6th Avenue I/C
US 101 Ramps @ Main Street I/C
US 101 Ramps @ Cher-Ae Lane I/C
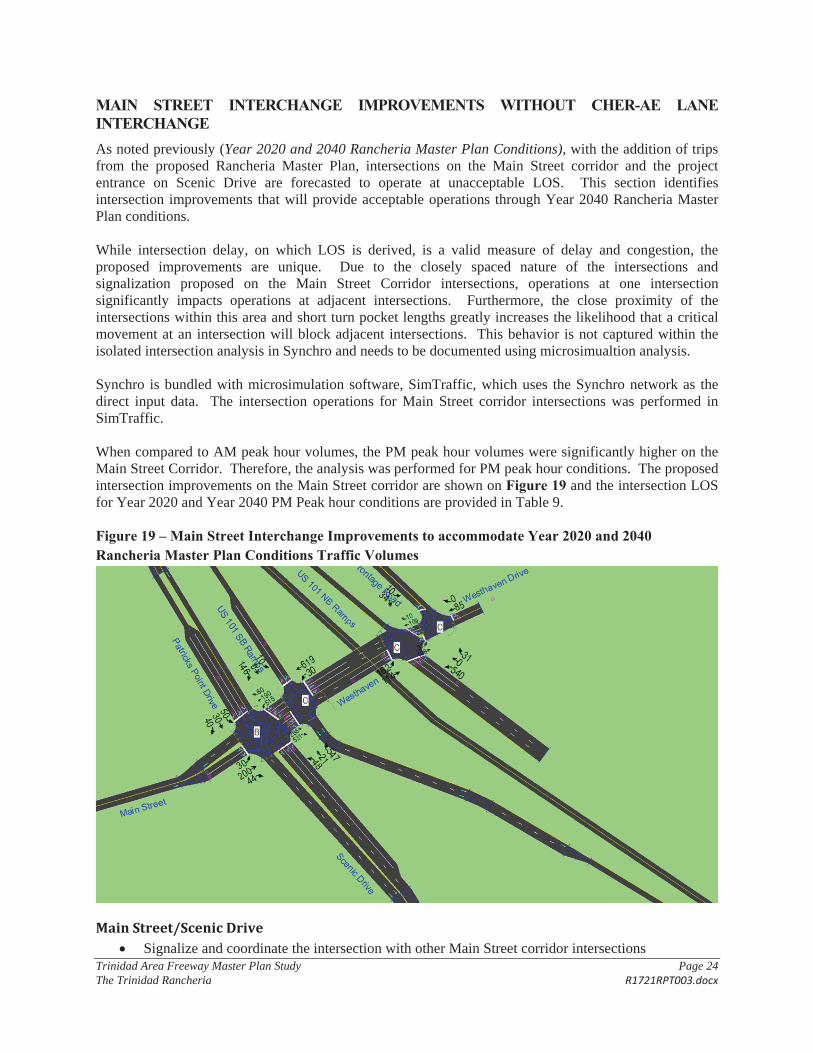
Trinidad Area Freeway Master Plan Study Page 24 The Trinidad Rancheria R1721RPT003.docx
MAIN STREET INTERCHANGE IMPROVEMENTS WITHOUT CHER-AE LANE INTERCHANGEAs noted previously (Year 2020 and 2040 Rancheria Master Plan Conditions), with the addition of trips from the proposed Rancheria Master Plan, intersections on the Main Street corridor and the project entrance on Scenic Drive are forecasted to operate at unacceptable LOS. This section identifies intersection improvements that will provide acceptable operations through Year 2040 Rancheria Master Plan conditions.
While intersection delay, on which LOS is derived, is a valid measure of delay and congestion, the proposed improvements are unique. Due to the closely spaced nature of the intersections and signalization proposed on the Main Street Corridor intersections, operations at one intersection significantly impacts operations at adjacent intersections. Furthermore, the close proximity of the intersections within this area and short turn pocket lengths greatly increases the likelihood that a critical movement at an intersection will block adjacent intersections. This behavior is not captured within the isolated intersection analysis in Synchro and needs to be documented using microsimualtion analysis.
Synchro is bundled with microsimulation software, SimTraffic, which uses the Synchro network as the direct input data. The intersection operations for Main Street corridor intersections was performed in SimTraffic.
When compared to AM peak hour volumes, the PM peak hour volumes were significantly higher on the Main Street Corridor. Therefore, the analysis was performed for PM peak hour conditions. The proposed intersection improvements on the Main Street corridor are shown on Figure 19 and the intersection LOS for Year 2020 and Year 2040 PM Peak hour conditions are provided in Table 9.
Figure 19 – Main Street Interchange Improvements to accommodate Year 2020 and 2040 Rancheria Master Plan Conditions Traffic Volumes
Main Street/Scenic DriveSignalize and coordinate the intersection with other Main Street corridor intersections
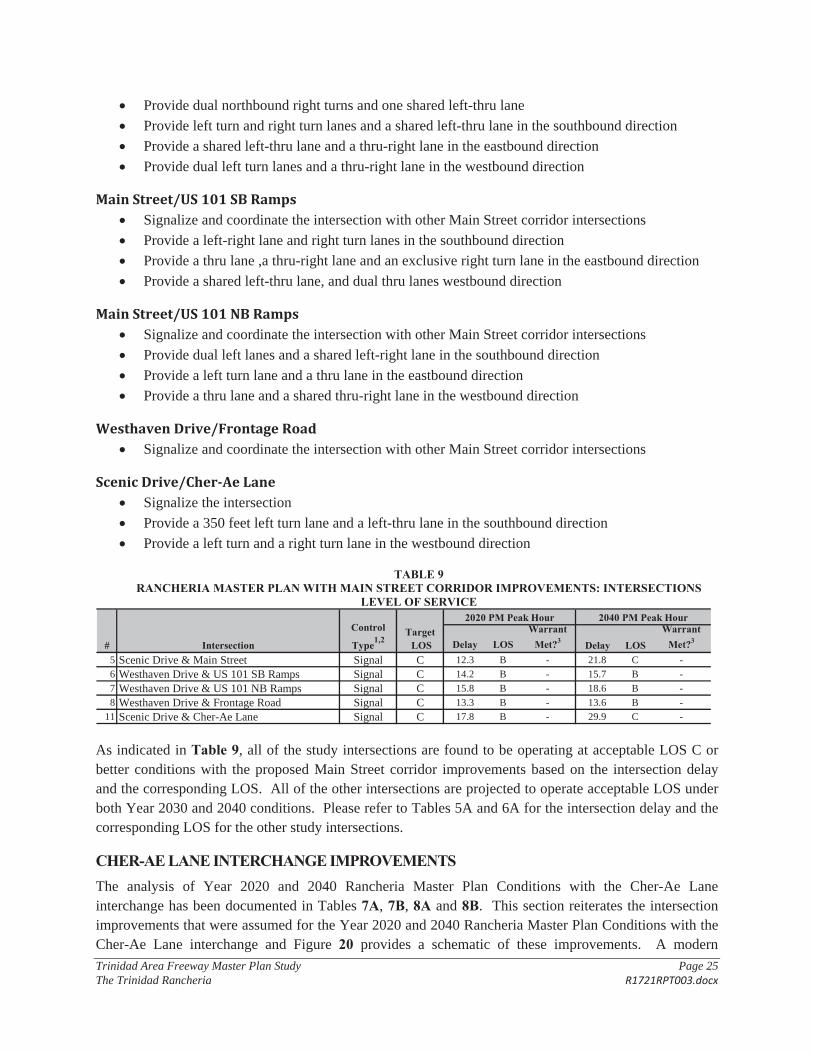
Trinidad Area Freeway Master Plan Study Page 25 The Trinidad Rancheria R1721RPT003.docx
Provide dual northbound right turns and one shared left-thru lane
Provide left turn and right turn lanes and a shared left-thru lane in the southbound direction
Provide a shared left-thru lane and a thru-right lane in the eastbound direction
Provide dual left turn lanes and a thru-right lane in the westbound direction
Main Street/US 101 SB RampsSignalize and coordinate the intersection with other Main Street corridor intersections
Provide a left-right lane and right turn lanes in the southbound direction
Provide a thru lane ,a thru-right lane and an exclusive right turn lane in the eastbound direction
Provide a shared left-thru lane, and dual thru lanes westbound direction
Main Street/US 101 NB RampsSignalize and coordinate the intersection with other Main Street corridor intersections
Provide dual left lanes and a shared left-right lane in the southbound direction
Provide a left turn lane and a thru lane in the eastbound direction
Provide a thru lane and a shared thru-right lane in the westbound direction
Westhaven Drive/Frontage RoadSignalize and coordinate the intersection with other Main Street corridor intersections
Scenic Drive/Cher Ae LaneSignalize the intersection
Provide a 350 feet left turn lane and a left-thru lane in the southbound direction
Provide a left turn and a right turn lane in the westbound direction
TABLE 9 RANCHERIA MASTER PLAN WITH MAIN STREET CORRIDOR IMPROVEMENTS: INTERSECTIONS
LEVEL OF SERVICE
Delay LOSWarrant
Met?3 Delay LOSWarrant
Met?3
5 Scenic Drive & Main Street Signal C 12.3 B - 21.8 C -
6 Westhaven Drive & US 101 SB Ramps Signal C 14.2 B - 15.7 B -
7 Westhaven Drive & US 101 NB Ramps Signal C 15.8 B - 18.6 B -
8 Westhaven Drive & Frontage Road Signal C 13.3 B - 13.6 B -11 Scenic Drive & Cher-Ae Lane Signal C 17.8 B - 29.9 C -
# Intersection
Control
Type1,2Target LOS
2020 PM Peak Hour 2040 PM Peak Hour
As indicated in Table 9, all of the study intersections are found to be operating at acceptable LOS C or better conditions with the proposed Main Street corridor improvements based on the intersection delay and the corresponding LOS. All of the other intersections are projected to operate acceptable LOS under both Year 2030 and 2040 conditions. Please refer to Tables 5A and 6A for the intersection delay and the corresponding LOS for the other study intersections.
CHER-AE LANE INTERCHANGE IMPROVEMENTS The analysis of Year 2020 and 2040 Rancheria Master Plan Conditions with the Cher-Ae Lane interchange has been documented in Tables 7A, 7B, 8A and 8B. This section reiterates the intersection improvements that were assumed for the Year 2020 and 2040 Rancheria Master Plan Conditions with the Cher-Ae Lane interchange and Figure 20 provides a schematic of these improvements. A modern
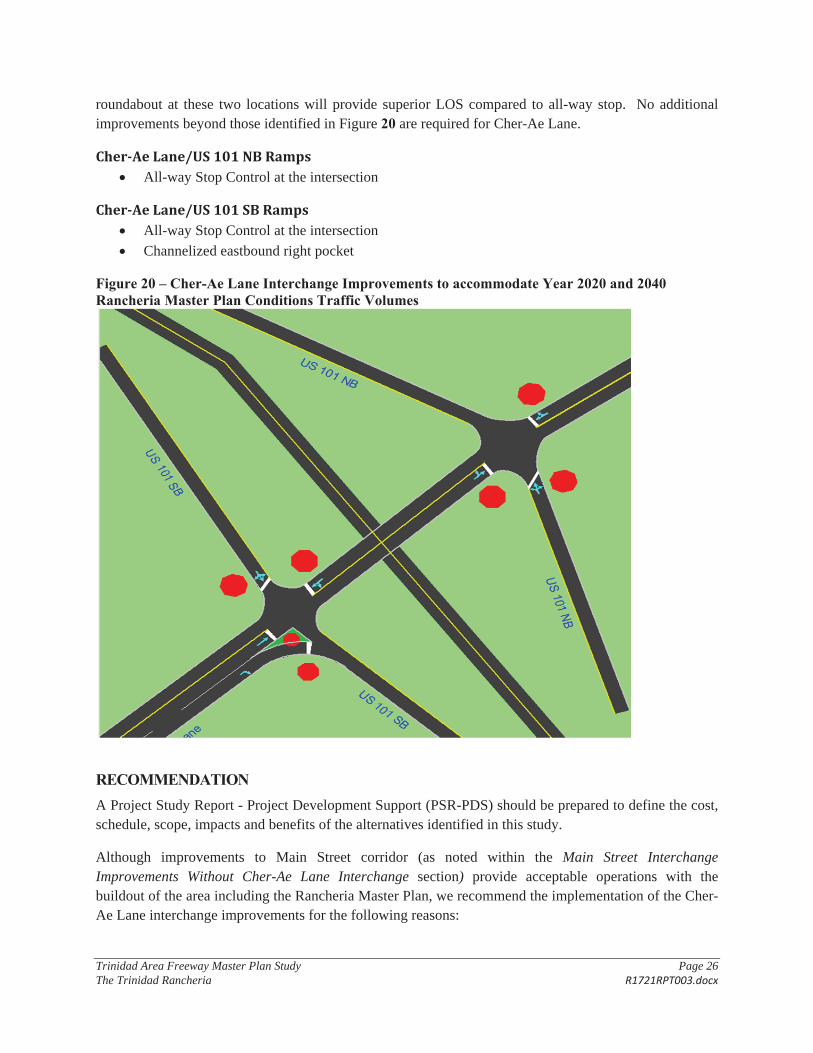
Trinidad Area Freeway Master Plan Study Page 26 The Trinidad Rancheria R1721RPT003.docx
roundabout at these two locations will provide superior LOS compared to all-way stop. No additional improvements beyond those identified in Figure 20 are required for Cher-Ae Lane.
Cher Ae Lane/US 101 NB RampsAll-way Stop Control at the intersection
Cher Ae Lane/US 101 SB RampsAll-way Stop Control at the intersection
Channelized eastbound right pocket
Figure 20 – Cher-Ae Lane Interchange Improvements to accommodate Year 2020 and 2040 Rancheria Master Plan Conditions Traffic Volumes
RECOMMENDATIONA Project Study Report - Project Development Support (PSR-PDS) should be prepared to define the cost, schedule, scope, impacts and benefits of the alternatives identified in this study.
Although improvements to Main Street corridor (as noted within the Main Street Interchange Improvements Without Cher-Ae Lane Interchange section) provide acceptable operations with the buildout of the area including the Rancheria Master Plan, we recommend the implementation of the Cher-Ae Lane interchange improvements for the following reasons:

Trinidad Area Freeway Master Plan Study Page 27 The Trinidad Rancheria R1721RPT003.docx
(1) Improving the Main Street Interchange will require significant right of way acquisition and change the character of the gateway to the coastal community of Trinidad
(2) Geometry (Close spacing) of intersections on Main Street is undesirable (3) Cher-Ae Lane interchange improvements provide superior operations when compared to the
Main Street Interchange Improvements (4) A new Cher-Ae Lane interchange will reduce travel times by providing a more efficient
connection between the Trinidad Rancheria and the US101 corridor

APPENDIXFIGURES
SYNCHRO REPORTS
WARRANT WORKSHEETS
WEAVING ANALYSIS

APPENDIX HBIBLIOGRAPHY
Analytical Environmental Services 5-1 TRDEC HotelAugust 2018 Environmental Assessment
Analytical Environmental Services (AES), 2015. Phase I Environmental Site Assessment – Trinidad Rancheria Stormwater Improvement and Interpretive Visitor Center Project. December 2015. Available by request from the Bureau of Indian Affairs, Pacific Region, Division of Environmental and Cultural Resources Management, and Safety. (916) 978-6165.
Benson, James R., 1977. An Archaeological Survey of the Trinidad Rancheria in Humboldt County, California. Report available at the Northwest Information Center.
Bureau of Indian Affairs (BIA), 2014. 2013 American Indian Population and Labor Force Report. Available online at: https://www.bia.gov/cs/groups/public/documents/text/idc1-024782.pdf.Accessed February 2016.
Bureau of Land Management (BLM), 2017. Land Patents. Available online at: https://glorecords.blm.gov/search/default.aspx#searchTabIndex=0&searchByTypeIndex=0.Accessed January 2017.
Buckman, Bryan; 2017. Personal communication with AES staff and Bryan Buckman, Director of Trinidad Water Department. January 10, 2017.
California Air Pollution Control Officers Association (CAPCOA), 2016. Appendix A Calculation Details for CalEEMod. Available online at: http://www.aqmd.gov/docs/default-source/caleemod/upgrades/2016.3/02_appendix-a2016-3-1.pdf?sfvrsn=2. Accessed January 18, 2017.
California Department of Conservation (DOC), 2009. Tsunami Inundation Map for Emergency Planning. State of California – County of Humboldt. Trinidad Quadrangle / Crannell Quadrangle. June 1, 2009. Available online at: http://www.conservation.ca.gov/cgs/geologic_hazards/Tsunami/Inundation_Maps/humboldt/Documents/Tsunami_Inundation_TrinidadCrannell_Quads_Humboldt.pdf. Accessed February 9, 2017.
California Department of Finance, 2013. California and Counties by Age and Race/Ethnicity - Total Only: 2000–2010. March 19, 2013. Available online at: http://www.dof.ca.gov/research/demographic/data/race-ethnic/2000-2010/index.php. Accessed January 10, 2016.
California Department of Finance, 2016. Population Estimates for Cities, Counties, and the State, 2010 Census Counts. Available online at: http://www.dof.ca.gov/research/demographic/reports/projections/P-1/. Accessed January 10, 2017.
California Department of Forestry and Fire Protection (CalFire), 2012. Fire Hazard Severity Zones in SRA – Humboldt County. Available online at: http://www.fire.ca.gov/fire_prevention/fhsz_maps_humboldt. Accessed January 3, 2017.
CalFire, 2013. California Master Cooperative Wildland Fire Management and Stafford Act Response Agreement. Available online at: https://gacc.nifc.gov/oscc/cwcg/docs/2013cfma/FinalCFMA2013-2018.pdf. Accessed January 17, 2017.
California Department of Water Resources (CDWR), 2006. CWA Section 303(d) List of Water Quality Limited Segment Requiring TMDLS. Available online at: http://www.waterboards.ca.gov/water_issues/programs/tmdl/docs/303dlists2006/epa/r1_06_303d_reqtmdls.pdf. Accessed January 27, 2017.
California Department of Transportation (Caltrans), 2013. Technical Noise Supplement to the Traffic Noise Analysis Protocol. Available online at: http://www.dot.ca.gov/hq/env/noise/pub/TeNS_Sept_2013B.pdf. Accessed December 30, 2016.
Caltrans and California Economic Forecast, 2015. California County-Level Economic Forecast 2015-2040. Available online at: http://www.dot.ca.gov/hq/tpp/offices/eab/docs/Full%20Report%202015.pdf. Accessed January 3, 2017.
California Department of Resources Recycling and Recovery (CalRecycle), 2016a. Facility/Site Summary Details: Anderson Landfill, Inc. (45-AA-0020). Available online at: http://www.calrecycle.ca.gov/SWFacilities/Directory/45-AA-0020/Detail/. Accessed January 2016.
CalRecycle, 2016b. Estimated Solid Waste Generation Rates. Available online at: https://www2.calrecycle.ca.gov/WasteCharacterization/General/Rates. Accessed December 30, 2016.
California Emissions Estimator Model (CalEEMod), 2016. Computer modeling program, Version 3.1. Available online at: http://www.caleemod.com/. Accessed January 4, 2017.
California Energy Commission (CEC), 2017. Cal-Adapt. Available online at: http://cal-adapt.org/.Accessed January 18, 2017.
Cavinta, George, Lieutenant, 2015. Commander of Patrol Operation of Humboldt County Sheriff’s Department. Personal communication between Commander of Patrol Operation Lieutenant Cavinta and AES (Justin Demianew). December 8, 2015.
Cher-Ae Heights Indian Community of the Trinidad Rancheria (Tribe), 2013. Comprehensive Economic Development Strategy 2014-2020.
City of Trinidad, 2009. Draft Noise and Safety Element. Available online at: http://www.trinidad.ca.gov/phocadownload/PlanningCommission/GeneralPlanUpdate/land%20use%20w%20figures.pdf. Accessed February 16, 2017.

City of Trinidad, 2012. Draft Land Use Element. Available online at: http://www.trinidad.ca.gov/phocadownload/PlanningCommission/GeneralPlanUpdate/noisesafety%2010-12%20pc%20approved.pdf. Accessed January 3, 2017.
City of Trinidad, 2015. Trinidad Volunteer Fire Department. Available online at: http://www.trinidad.ca.gov/departments-a-services/volunteer-fire-department.html. Accessed January 20, 2017.
Council on Environmental Quality (CEQ), 2016. Final Guidance for Federal Departments and Agencies on Consideration of Greenhouse Gas Emissions and the Effects of Climate Change in National Environmental Policy Act Reviews. Available online at: https://www.whitehouse.gov/sites/whitehouse.gov/files/documents/nepa_final_ghg_guidance.pdf.Accessed January 18, 2017.
County of Humboldt, 2002. Humboldt County General Plan Update, Natural Resources and Hazards. Available online at: http://www.humboldtgov.org/DocumentCenter/Home/View/1366. Accessed January 13, 2017.
County of Humboldt, 2007a. Mineral Resources. Available online at:
County of Humboldt, 2012a. Climate Action Plan. Available online at: http://www.humboldtgov.org/DocumentCenter/View/1347. Accessed January 3, 2017.
County of Humboldt, 2012b. Approved Draft Noise Element. Available online at: https://humboldtgov.org/DocumentCenter/View/1895. Accessed January 3, 2017.
Crawford & Associates, 2016. Draft Geotechnical Feasibility and Preliminary Design Report, Trinidad Rancheria Cher-Ae Heights Hotel, Trinidad, California. Prepared for Trinidad Rancheria Economic Development Corporation.
Employment Development Department (EDD), 2015. Labor Force and Unemployment Rate for Cities and Census Designated Places. Available online at: http://www.labormarketinfo.edd.ca.gov/data/labor-force-and-unemployment-for-cities-and-census-areas.html. Accessed January 3, 2017.
EDD, 2016a. California’s Unemployment rate falls to 5.3 percent in November. Available online at: http://www.edd.ca.gov/About_EDD/pdf/urate201612.pdf. Accessed January 4, 2017.
EDD, 2016b. Humboldt County Industry Employment and Labor Force. Available online at: http://www.labormarketinfo.edd.ca.gov/file/lfmonth/humbopds.pdf. Accessed January 4, 2017.
Federal Emergency Management Agency (FEMA), 2016. Flood Insurance Rate Maps for Trinidad, California. Available online at: https://msc.fema.gov/portal/search?AddressQuery=1%20Bay%20Street%2C%20Trinidad%2C%20CA#searchresultsanchor. Accessed January 10, 2016.

Federal Highway Administration (FHWA), 2006. Construction Noise Handbook Final Report. August 2006. Available online at: http://www.fhwa.dot.gov/environment/noise/construction_noise/handbook /. Accessed December 30, 2016.
Federal Transportation Administration (FTA), 2006. Transit Noise and Vibration Impact Assessment. Available online at: https://www.transit.dot.gov/sites/fta.dot.gov/files/docs/FTA_Noise_and_Vibration_Manual.pdf.Accessed Jan 5, 2017.
Governor’s Office of Planning and Research (OPR), 2017. Query the CEQAnet Database. Available online at: http://www.ceqanet.ca.gov/QueryForm.asp. Accessed January 20, 2017.
Intergovernmental Panel on Climate Change (IPCC), 2013. IPCC Fifth Assessment Report, 2013. Available online at: http://www.ipcc.ch/report/ar5/wg1/. Accessed January 24, 2017.
Intergovernmental Panel on Climate Change (IPCC), 2014... IPCC Fifth Assessment Report (AR5), 2014.Available online at: http://www.ipcc.ch/report/ar5/. Accessed January 12, 2018.
National Resource Conservation Service (NRCS) 2016a. Halfbluff Series Soil Descriptions. Available online at: https://soilseries.sc.egov.usda.gov/OSD_Docs/H/HALFBLUFF.html. AccessedJanuary 10, 2017.
National Resource Conservation Service (NRCS) 2016b. Lepoil Series Soil Descriptions. Available online at: https://soilseries.sc.egov.usda.gov/OSD_Docs/L/LEPOIL.html. Accessed January 10, 2017.
North Coast Emergency Management System (EMS), 2016. About EMS. Available online at: http://www.northcoastems.com/ems-system/about-north-coast-ems/. Accessed January 20, 2017.
North Coast Regional Water Quality Control Board (NCRWQCB), 2011a. Water Quality Objectives for the North Coast Region. May 2011. Available online: http://www.waterboards.ca.gov/northcoast/water_issues/programs/basin_plan/083105-bp/04_water_quality_objectives.pdf. Accessed January 20, 2017.
Northstar, 2016. Preliminary Feasibility Report for Trinidad Rancheria Cher-Ae Heights Facility. Report prepared for Omni Means.
Shimek, Bohumil, 1913. The Significance of Pleistocene Mollusks. Science Vol. 37, No. 953 (Apr. 4, 1913), pp. 501-509.
State Water Resources Control Board (SWRCB), 2017. GeoTracker. Available online at: http://geotracker.waterboards.ca.gov/map/?CMD=runreport&myaddress=27+Scenic+Dr%2C+Trinidad%2C+CA+95570. Accessed January 30, 2017.

U.S. Census Bureau, 2015. Trinidad City, California. Available online at: https://factfinder.census.gov/faces/nav/jsf/pages/community_facts.xhtml. Accessed January 3, 2017.
U.S. Census Bureau, 2016. Quickfacts. Available online at: https://www.census.gov/quickfacts/table/PST045216/06,06023,00. Accessed January 3, 2017.
U.S. Department of Housing and Urban Development (HUD), 2009. HUD Noise Guidebook. Availableat: https://www.hudexchange.info/resource/313/hud-noise-guidebook/. Accessed January 5, 2017.
HUD, 2016. Noise Abatement and Control. HUD Exchange. Available online at: https://www.hudexchange.info/programs/environmental-review/noise-abatement-and-control/.Accessed January 13, 2017.
U.S. Environmental Protection Agency (USEPA), 2016. EJSCREEN, Environmental Justice Screening and Mapping Tool. Low income demographics for census block 060230102002. Available online at: http://www.epa.gov/ejscreen. Accessed February 19, 2016.
USEPA, 2016. Nonattainment Areas for Criteria Pollutants (Green Book). Available online at: https://www.epa.gov/green-book. Accessed January 18, 2017.
USEPA, 2017. NAAQS Table. Available online at: https://www.epa.gov/criteria-air-pollutants/naaqs-table. Accessed on January 11, 2018.
U.S. Fish and Wildlife Service. 2016. Species Information, Threatened and Endangered Plants and Animals. Available online at: http://endangered.fws.gov/wildlife.html. Accessed January 2017.
U.S. Geological Survey (USGS), 2003. Active Mines and Mineral Plants in the US. Available online at: https://mrdata.usgs.gov/mineral-resources/active-mines.html. Accessed January 10, 2016.
USGS, 2016. Interactive Fault Map. Available online at: http://earthquake.usgs.gov/hazards/qfaults/map/#qfaults. Accessed January 10, 2017.
Verwayen, Donald, and Jerry Rohde, 2011. A Cultural Resource Study of Trinidad Rancheria Fee and Trust Lands, Humboldt County, California. Report available at the Northwest Information Center.


