END-TO-END FORENSIC IDENTIFICATION PROCESS PROJECT Phase 2 – Final Report
2016
2 | END-TO-END FORENSIC IDENTIFICATION PROCESS PROJECT
CONTENTS Foreword .............................................................................. 4
Executive Summary .............................................................. 5
Results Overview ................................................................................. 5
Crime Scene Attendance ................................................................. 6
Evidence Submission ....................................................................... 6
Analysis of Evidence ........................................................................ 6
Identification ................................................................................... 7
Investigation .................................................................................... 7
Comparison of the results between E2E1 and E2E2 ....................... 7
Recommendation .......................................................................... 14
Introduction ........................................................................ 15
Findings ............................................................................................. 15
Data Overview Nationally .............................................................. 16
Results by Stage ............................................................................. 19
Overall Forensic Performance ....................................................... 28
Discussion .......................................................................................... 31
Recommendation .............................................................................. 32
Acknowledgements ........................................................................... 32
Appendix 1: Glossary ..................................................... 33
Appendix 2: Performance measures at each stage......... 36
Lead Time (Duration) ..................................................................... 36
Success Rate (Proportion) ............................................................. 36
Stages ............................................................................................. 36
Stage 1: Crime Scene Attendance ................................................. 37
Stage 2: Evidence Submission ....................................................... 37
END-TO-END FORENSIC IDENTIFICATION PROCESS PROJECT | 3
Stage 3: Analysis of Evidence ........................................................ 37
Stage 4: Identification .................................................................... 38
Stage 5: Investigation .................................................................... 38
Stage 1 – Stage 5: End-to-End Performance ................................. 39
Appendix 3: Data collection, quality & descriptive
statistics ..................................................... 40
Data collection ............................................................................... 40
Data quality.................................................................................... 40
Descriptive statistics ...................................................................... 40
Appendix 4: Horizontal box plots for lead times ............ 42
References .......................................................................... 50
4 | END-TO-END FORENSIC IDENTIFICATION PROCESS PROJECT
FOREWORD There are few studies like the End-to-End project, which aims to assess the effectiveness of forensic science as
a function of the quality of the scientific analysis and the timeliness with which that analysis is provided. The
End-to-End project is fundamentally different from more discrete studies that measure individual components
or stages, in that it provides a whole-of-process assessment, mirroring the complex process of criminal
investigations. The End-to-End project has provided a framework for assessing the impact of change on
service delivery, be it organisational change or technical change. This report details the results of the second
time the End-to-End project has been run. The repeat of the project enables jurisdictions to compare previous
performance to current, as well as examine cross-jurisdictional performance, providing a real opportunity to
learn from the best performers.
By applying consistent performance criteria across both projects, examination of the wealth of data that has
resulted can reveal how different organisational approaches, technology impacts and the extent to which
forensic science is integrated into investigations can impact service delivery. Not only does a study like End-to-
End help improve effectiveness by identifying efficient processes or repetitive effort, it also identifies future
risks and opportunities. The more fingerprint and DNA databases continue to grow, the more effective a tool
they become in assisting law enforcement's ability to solve cases, further validating the use of forensic
evidence to build databasing capabilities.
The End-to-End projects, while limited in scope to fingerprint and DNA evidence from non-aggravated
burglaries, provide a series of snapshots of forensic performance, highlight the responsiveness of the
participating agencies in adopting the recommendations for improved use of resources, and givesome
direction to future endeavours to ultimately improve the efficiency and effectiveness of forensic science.
Dr Linzi Wilson-Wilde OAM Director National Institute of Forensic Science Australia New Zealand
END-TO-END FORENSIC IDENTIFICATION PROCESS PROJECT | 5
EXECUTIVE SUMMARY This report presents the findings from a repeat of the original End-to-End (E2E1) project run in 2011. This
repeat project has been termed End-to-End Phase 2 (E2E2). E2E2 was conducted in 2015 in the same eight
Australian jurisdictions, with the same data collection period (May – Sept) as E2E1, and under the same
conditions.
One of the main challenges in re-running the End-to-End project was identifying jurisdictional changes
occurring since 2011, whether legal, technological or organisational, and to what extent recommendations
from the original End-to-End project had been implemented. A core benefit of repeating the project was
enabling agencies to compare their own data from the previous phase and establish whether such changes
have had any significant impact on efficiency or effectiveness. To this end, individual jurisdictional results
from E2E2 were made available to each relevant jurisdiction and responses were sought from each of the
Australian forensic agencies to identify what changes have occurred since E2E1 and to provide possible
explanations for any variations between the two projects.
This report makes available the findings from the analysis of the 2015 data, provides a comparison with 2011
data, and offers future recommendations.
RESULTS OVERVIEW
Based on data collected from 17 sites across Australia for more than 7,500 burglaries reported over a five
month period, this study has established that:
There is wide variation between state jurisdictions across each stage of the forensic process, both in terms of success (except for analysis success) and lead times (including the analysis stage).
76% of burglaries reported to police were attended by CSI with a median response time of 3.5 hours and a median time spent at the scene of 44 minutes.
In 2011 regional areas had higher attendance rates and longer scene examination times than metropolitan areas. However, in 2015, metro had higher attendance rates and the scene examination times were essentially equivalent.
Again there was more fingerprint evidence collected compared with DNA (32% versus 14%). And again there was a (this time slightly) higher arrest rate based on DNA identification than fingerprint identifications (42% versus 41%).
Identification rates were the same for both fingerprints and DNA (32%), up from 23% in 2011, reflecting the improved collection of value evidence and generally more mature databases.
At each stage in the End-to-End process, national median lead times were shorter for fingerprint evidence than DNA evidence and the 2015 data showed a median overall End-to-End process time of 16 (previously 19) days for arrests based on fingerprint identifications compared with 49 days (same) for arrests based on DNA identifications only. Overall when fingerprint and DNA evidence is considered together, forensic evidence achieves a median End-to-End process time of 28 (previously 29) days.
In 2011, the last stage dominated the overall time in almost all jurisdictions. The majority of jurisdictions have since reduced their overall lead times significantly and the 2015 data shows the National average is down by almost 50%.
The overall arrest rate after forensic identification is 4.7 per 100 crimes reported, nearly double that of 2.4 per 100 from 2011 data.
6 | END-TO-END FORENSIC IDENTIFICATION PROCESS PROJECT
On a stage by stage basis, again from the 2015 data, there was no consistent evidence to suggest that strong
performance at one stage of the process correlated with strong performance for another stage or that there
was a link between stages. There remained significant variation in performance across the jurisdictions,
indicating a potential scope for further improvement across the many stages of the forensic process. Again,
understanding that each police agency operates under different legislation and internal practices, it is
anticipated that each jurisdiction may need to tailor their strategy in order to further improve performance in
processing burglary cases.
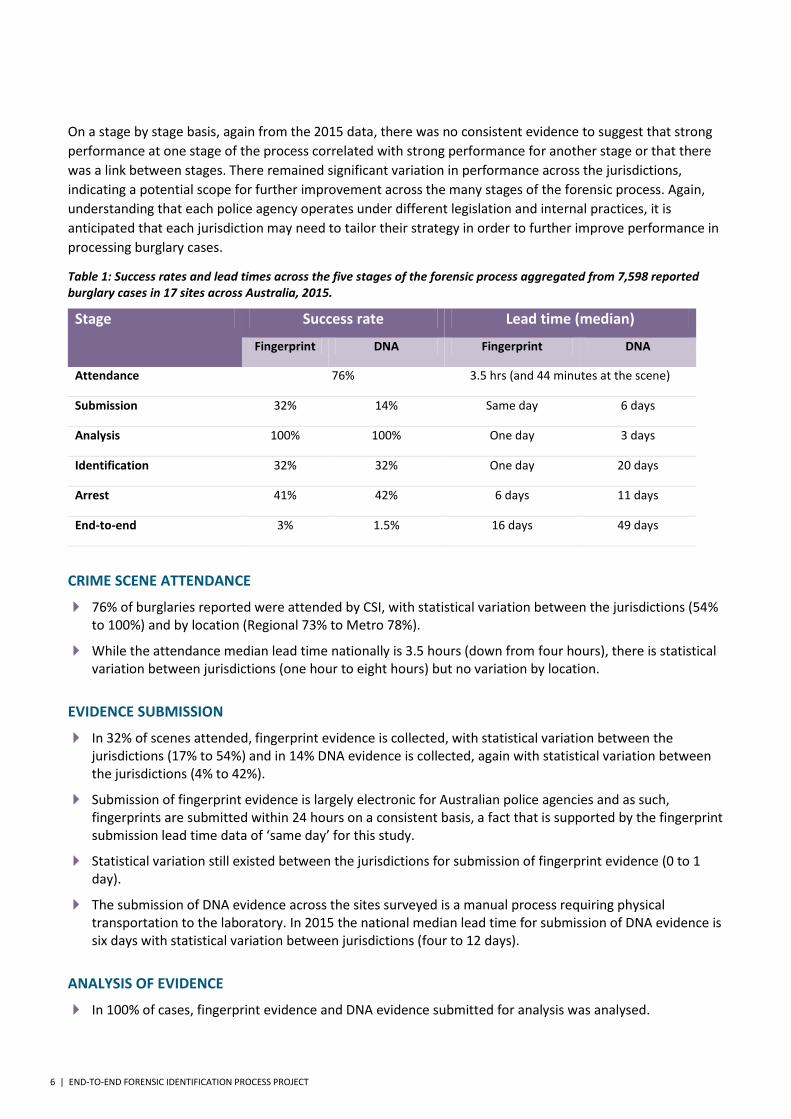
Table 1: Success rates and lead times across the five stages of the forensic process aggregated from 7,598 reported burglary cases in 17 sites across Australia, 2015.
Stage Success rate Lead time (median)
Fingerprint DNA Fingerprint DNA
Attendance 76% 3.5 hrs (and 44 minutes at the scene)
Submission 32% 14% Same day 6 days
Analysis 100% 100% One day 3 days
Identification 32% 32% One day 20 days
Arrest 41% 42% 6 days 11 days
End-to-end 3% 1.5% 16 days 49 days
CRIME SCENE ATTENDANCE
76% of burglaries reported were attended by CSI, with statistical variation between the jurisdictions (54% to 100%) and by location (Regional 73% to Metro 78%).
While the attendance median lead time nationally is 3.5 hours (down from four hours), there is statistical variation between jurisdictions (one hour to eight hours) but no variation by location.
EVIDENCE SUBMISSION
In 32% of scenes attended, fingerprint evidence is collected, with statistical variation between the jurisdictions (17% to 54%) and in 14% DNA evidence is collected, again with statistical variation between the jurisdictions (4% to 42%).
Submission of fingerprint evidence is largely electronic for Australian police agencies and as such, fingerprints are submitted within 24 hours on a consistent basis, a fact that is supported by the fingerprint submission lead time data of ‘same day’ for this study.
Statistical variation still existed between the jurisdictions for submission of fingerprint evidence (0 to 1 day).
The submission of DNA evidence across the sites surveyed is a manual process requiring physical transportation to the laboratory. In 2015 the national median lead time for submission of DNA evidence is six days with statistical variation between jurisdictions (four to 12 days).
ANALYSIS OF EVIDENCE
In 100% of cases, fingerprint evidence and DNA evidence submitted for analysis was analysed.
END-TO-END FORENSIC IDENTIFICATION PROCESS PROJECT | 7
Overall, the percentage of cases with a profile suitable for upload to the National Automated Fingerprint Identification System (NAFIS) database is nearly double that of the percentage of cases with a profile suitable for upload to the National Criminal Investigation DNA Database (NCIDD). 91% of fingerprint evidence analysed resulted in a print suitable for upload to NAFIS (up from 87% in 2011), compared to 47% of DNA evidence being found suitable for upload to NCIDD, up from 42% in 2011.
IDENTIFICATION
The overall identification rate for fingerprints and DNA was 32% for each. There was variation observed between the jurisdictions (fingerprints 17% to 83% and DNA 17% to 69%).
There are higher identification rates in DNA by location at regional sites (37%) as opposed to metropolitan sites (31%), but not much difference for fingerprints by location (31% versus 32%).
There are longer median lead times for DNA identification than for fingerprints. The increase in the number of DNA markers examined and new methods of interpreting DNA mixtures (i.e. introduction of STRmix) was anticipated to increase the time it takes to analyse and interpret DNA profiles (however, it appears to have had a greater effect in some jurisdictions).
INVESTIGATION
For cases in which the identification of an offender was made from fingerprint evidence, 41% resulted in the arrest of the offender. Comparatively, for cases in which the identification was made from DNA evidence, 42% resulted in an arrest. In 2011 these percentages were 37% and 50% respectively.
In 2015 there are still longer lead times for DNA based arrests than for fingerprint based arrests.
The national lead time for investigation (i.e. the time from identification to arrest) has reduced significantly in 2015, where as in 2011 it was longer than the lead time for all other stages put together.
The overall arrest rate after forensic identification is 4.7 per 100 crimes reported (rounded to total 4.5 in Table 1 above), with a range across the jurisdictions of 2 to 10 arrests per 100 crimes reported.
COMPARISON OF THE RESULTS BETWEEN E2E1 AND E2E2
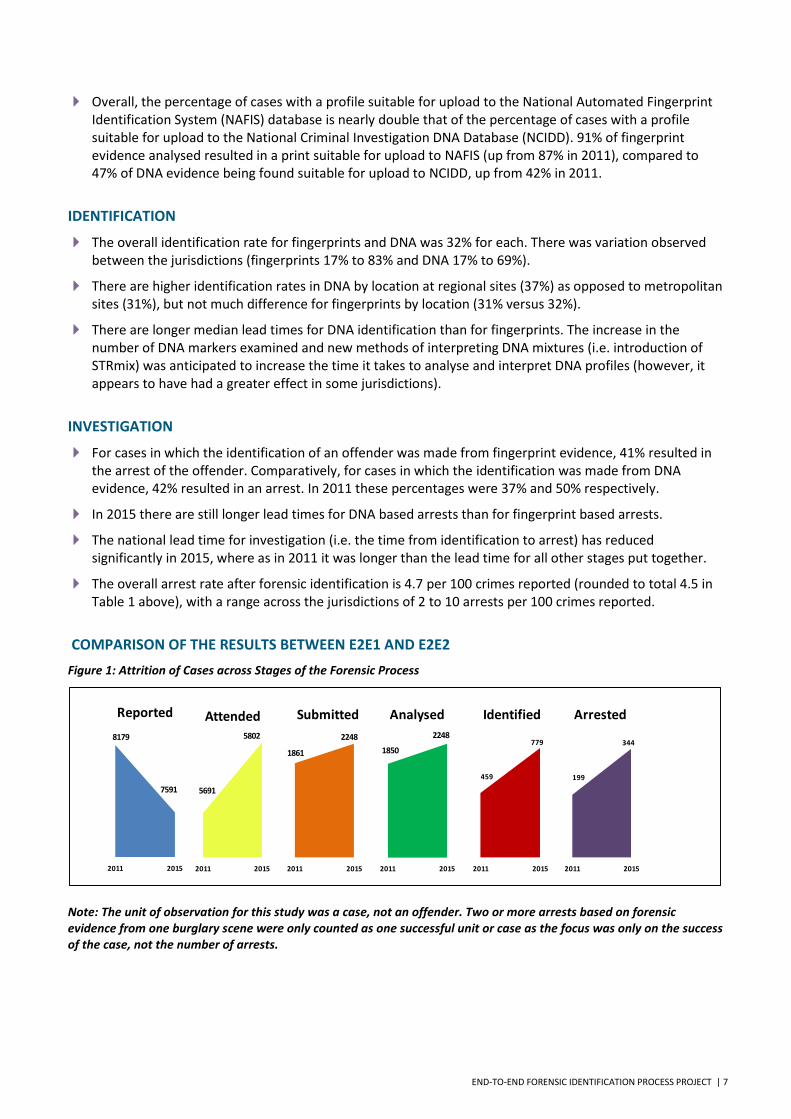
Figure 1: Attrition of Cases across Stages of the Forensic Process
Note: The unit of observation for this study was a case, not an offender. Two or more arrests based on forensic evidence from one burglary scene were only counted as one successful unit or case as the focus was only on the success of the case, not the number of arrests.
2011 2015
Reported
8179
7591
2011 2015
Attended
5691
5802
2011 2015
Submitted
2011 2015
Analysed
459
779
2011 2015
Identified
199
344
2011 2015
Arrested
1850
2248
1861
2248
8 | END-TO-END FORENSIC IDENTIFICATION PROCESS PROJECT
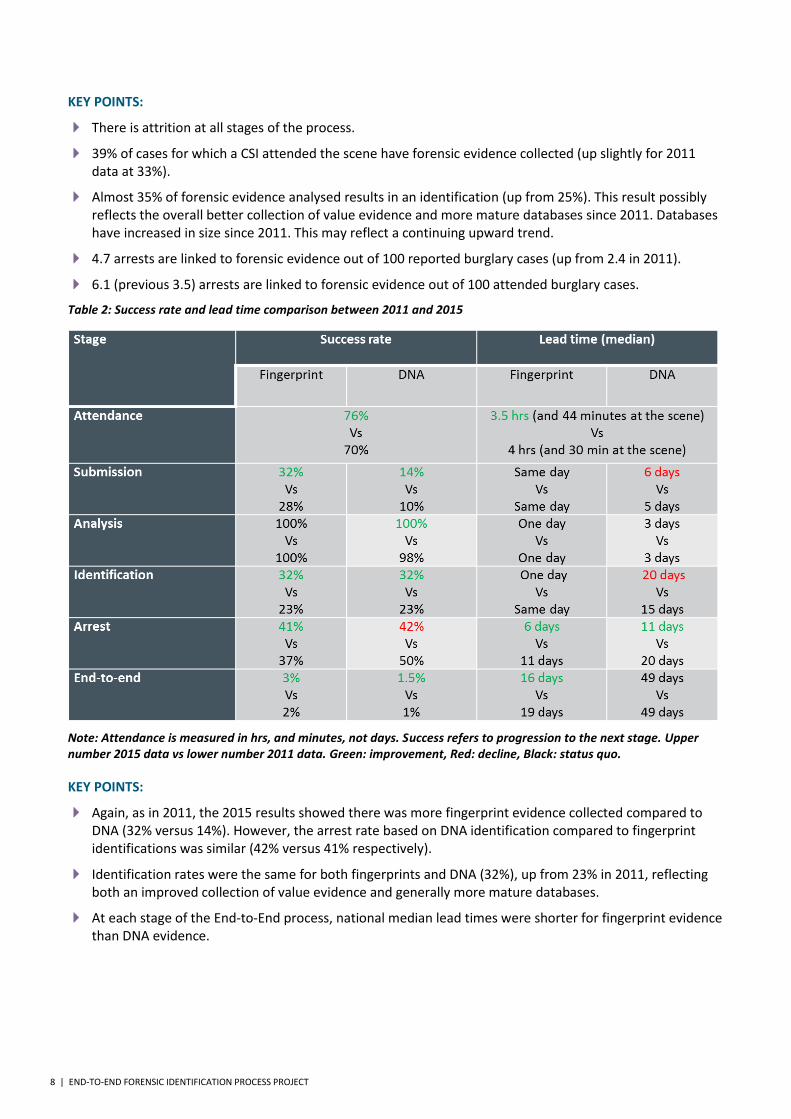
KEY POINTS:
There is attrition at all stages of the process.
39% of cases for which a CSI attended the scene have forensic evidence collected (up slightly for 2011 data at 33%).
Almost 35% of forensic evidence analysed results in an identification (up from 25%). This result possibly reflects the overall better collection of value evidence and more mature databases since 2011. Databases have increased in size since 2011. This may reflect a continuing upward trend.
4.7 arrests are linked to forensic evidence out of 100 reported burglary cases (up from 2.4 in 2011).
6.1 (previous 3.5) arrests are linked to forensic evidence out of 100 attended burglary cases.
Table 2: Success rate and lead time comparison between 2011 and 2015
Note: Attendance is measured in hrs, and minutes, not days. Success refers to progression to the next stage. Upper number 2015 data vs lower number 2011 data. Green: improvement, Red: decline, Black: status quo.
KEY POINTS:
Again, as in 2011, the 2015 results showed there was more fingerprint evidence collected compared to DNA (32% versus 14%). However, the arrest rate based on DNA identification compared to fingerprint identifications was similar (42% versus 41% respectively).
Identification rates were the same for both fingerprints and DNA (32%), up from 23% in 2011, reflecting both an improved collection of value evidence and generally more mature databases.
At each stage of the End-to-End process, national median lead times were shorter for fingerprint evidence than DNA evidence.
END-TO-END FORENSIC IDENTIFICATION PROCESS PROJECT | 9
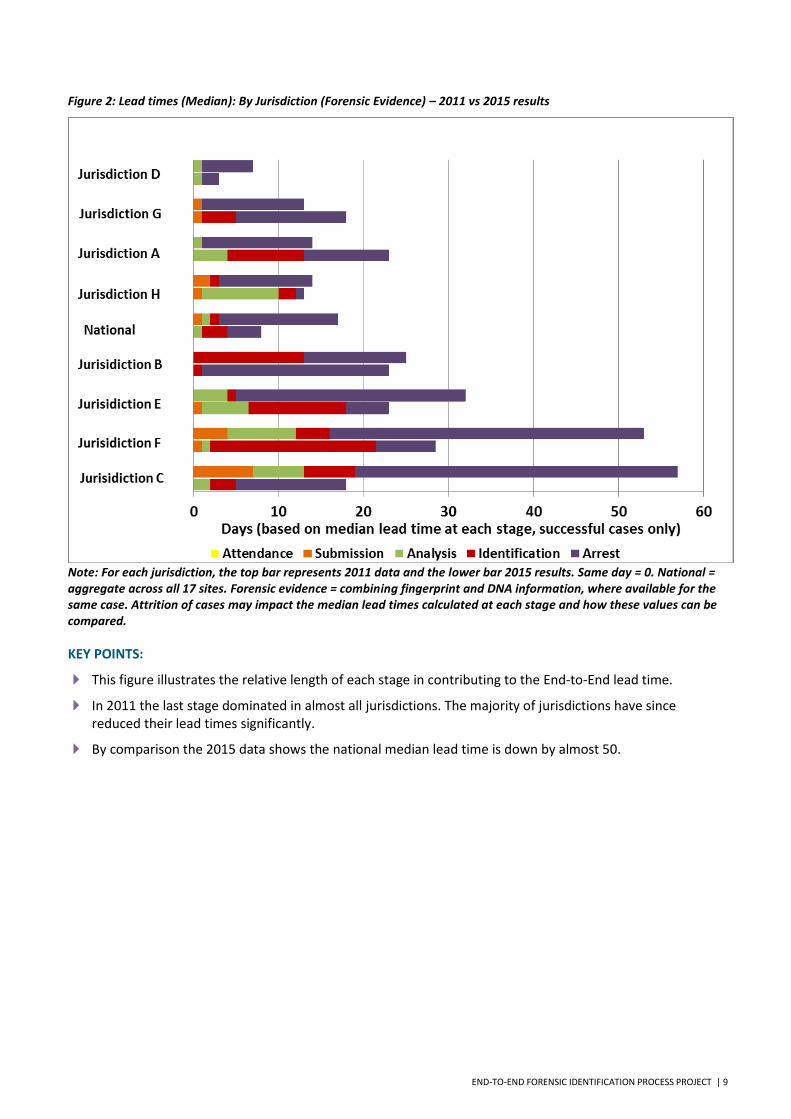
Figure 2: Lead times (Median): By Jurisdiction (Forensic Evidence) – 2011 vs 2015 results
Note: For each jurisdiction, the top bar represents 2011 data and the lower bar 2015 results. Same day = 0. National = aggregate across all 17 sites. Forensic evidence = combining fingerprint and DNA information, where available for the same case. Attrition of cases may impact the median lead times calculated at each stage and how these values can be compared.
KEY POINTS:
This figure illustrates the relative length of each stage in contributing to the End-to-End lead time.
In 2011 the last stage dominated in almost all jurisdictions. The majority of jurisdictions have since reduced their lead times significantly.
By comparison the 2015 data shows the national median lead time is down by almost 50.
10 | END-TO-END FORENSIC IDENTIFICATION PROCESS PROJECT
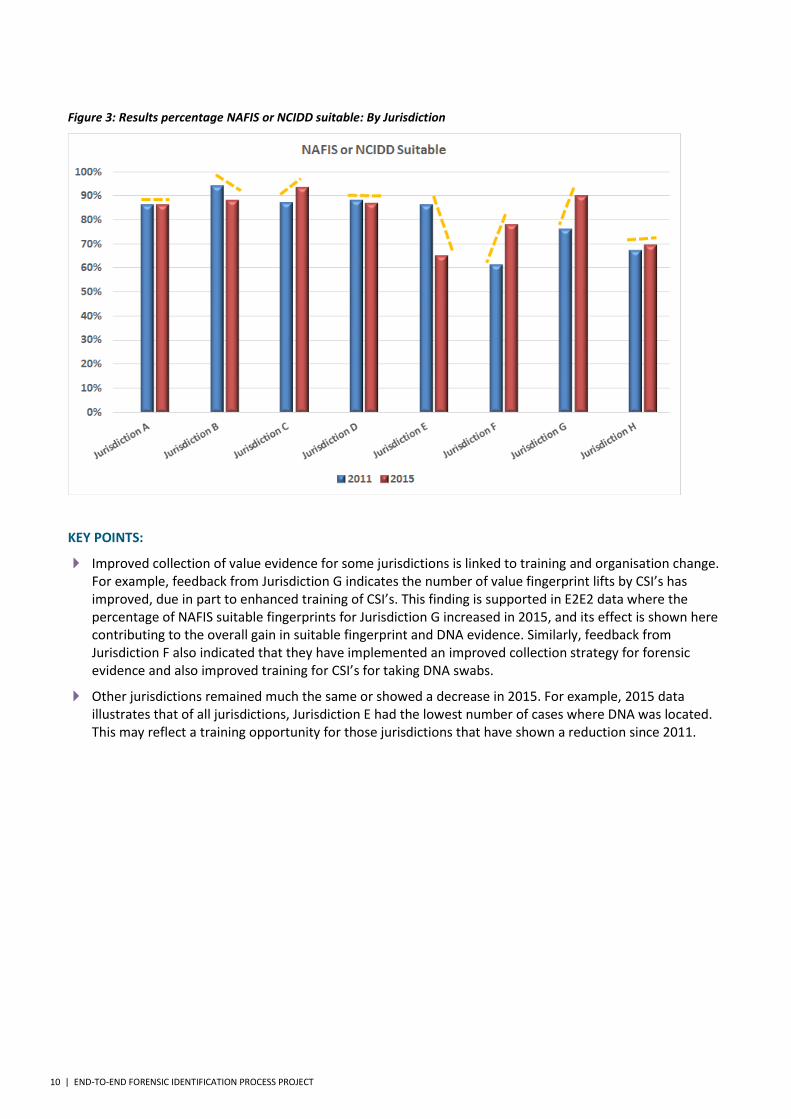
Figure 3: Results percentage NAFIS or NCIDD suitable: By Jurisdiction
KEY POINTS:
Improved collection of value evidence for some jurisdictions is linked to training and organisation change. For example, feedback from Jurisdiction G indicates the number of value fingerprint lifts by CSI’s has improved, due in part to enhanced training of CSI’s. This finding is supported in E2E2 data where the percentage of NAFIS suitable fingerprints for Jurisdiction G increased in 2015, and its effect is shown here contributing to the overall gain in suitable fingerprint and DNA evidence. Similarly, feedback from Jurisdiction F also indicated that they have implemented an improved collection strategy for forensic evidence and also improved training for CSI’s for taking DNA swabs.
Other jurisdictions remained much the same or showed a decrease in 2015. For example, 2015 data illustrates that of all jurisdictions, Jurisdiction E had the lowest number of cases where DNA was located. This may reflect a training opportunity for those jurisdictions that have shown a reduction since 2011.
END-TO-END FORENSIC IDENTIFICATION PROCESS PROJECT | 11
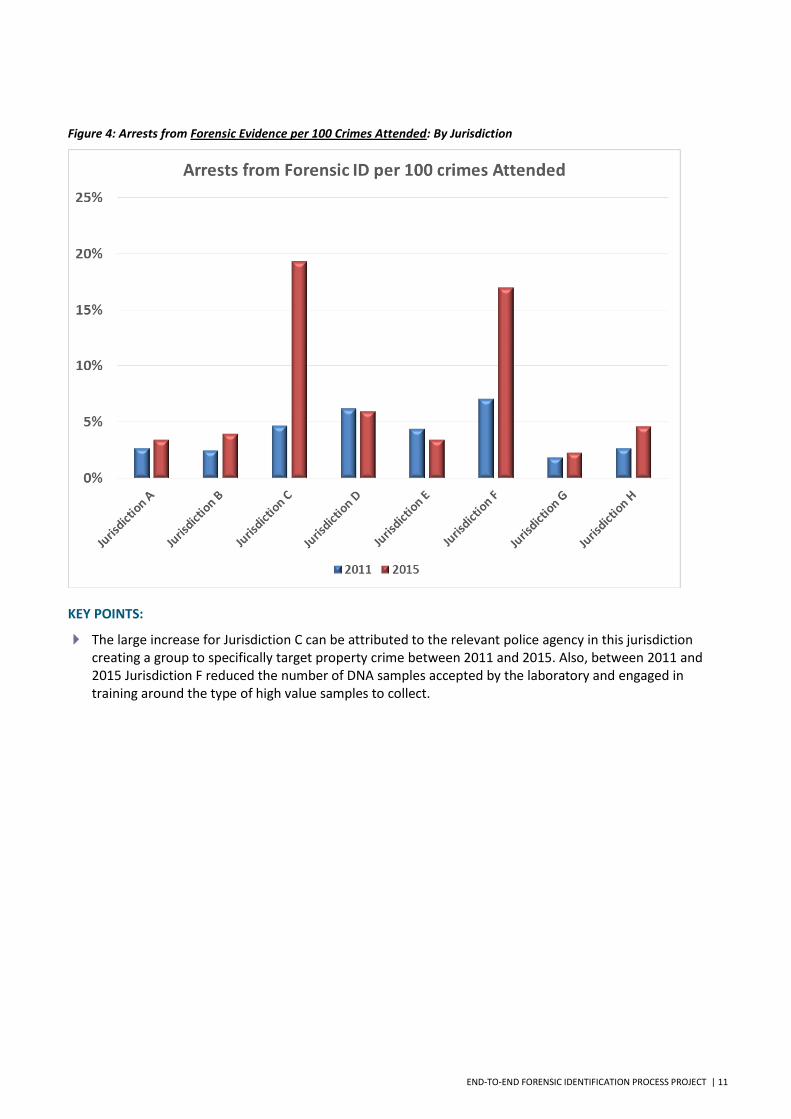
Figure 4: Arrests from Forensic Evidence per 100 Crimes Attended: By Jurisdiction
KEY POINTS:
The large increase for Jurisdiction C can be attributed to the relevant police agency in this jurisdiction creating a group to specifically target property crime between 2011 and 2015. Also, between 2011 and 2015 Jurisdiction F reduced the number of DNA samples accepted by the laboratory and engaged in training around the type of high value samples to collect.
12 | END-TO-END FORENSIC IDENTIFICATION PROCESS PROJECT
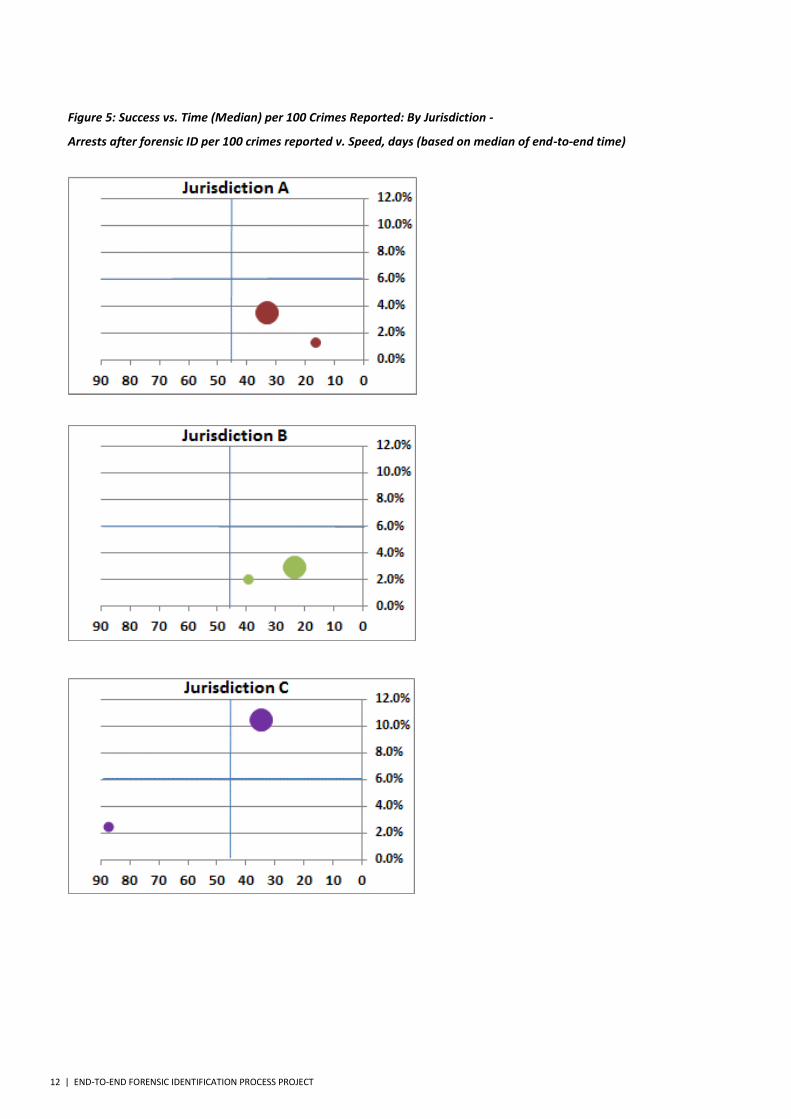
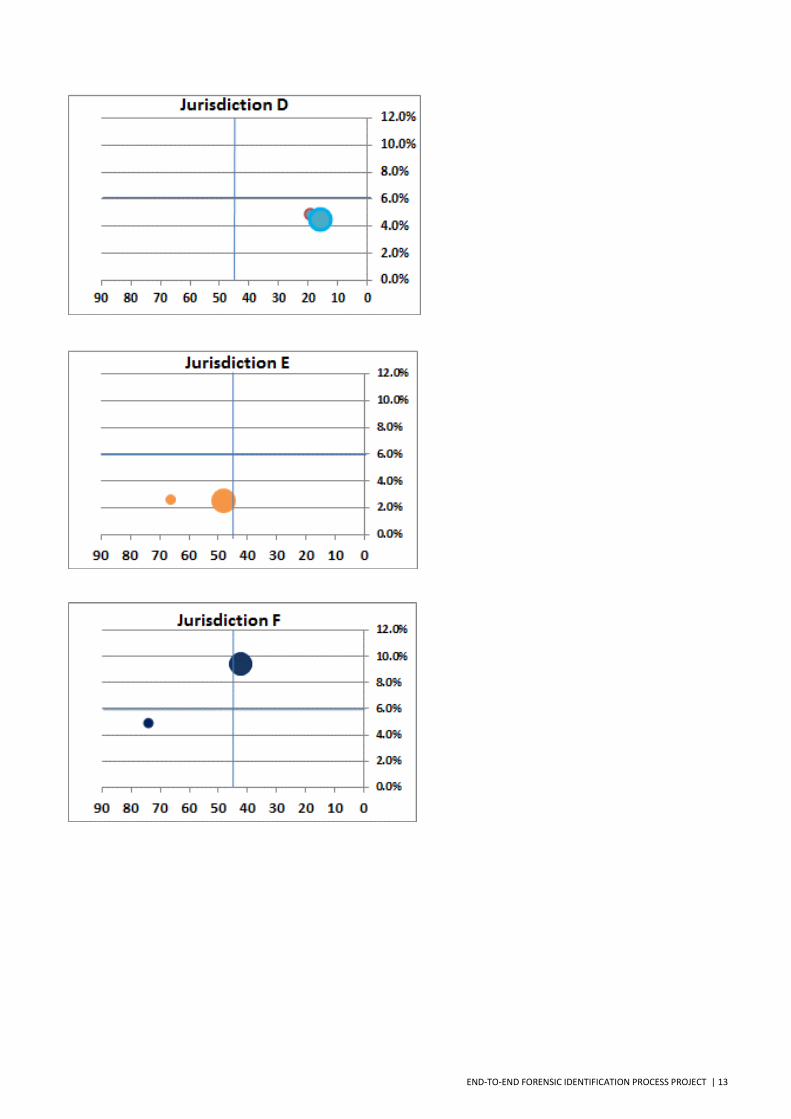
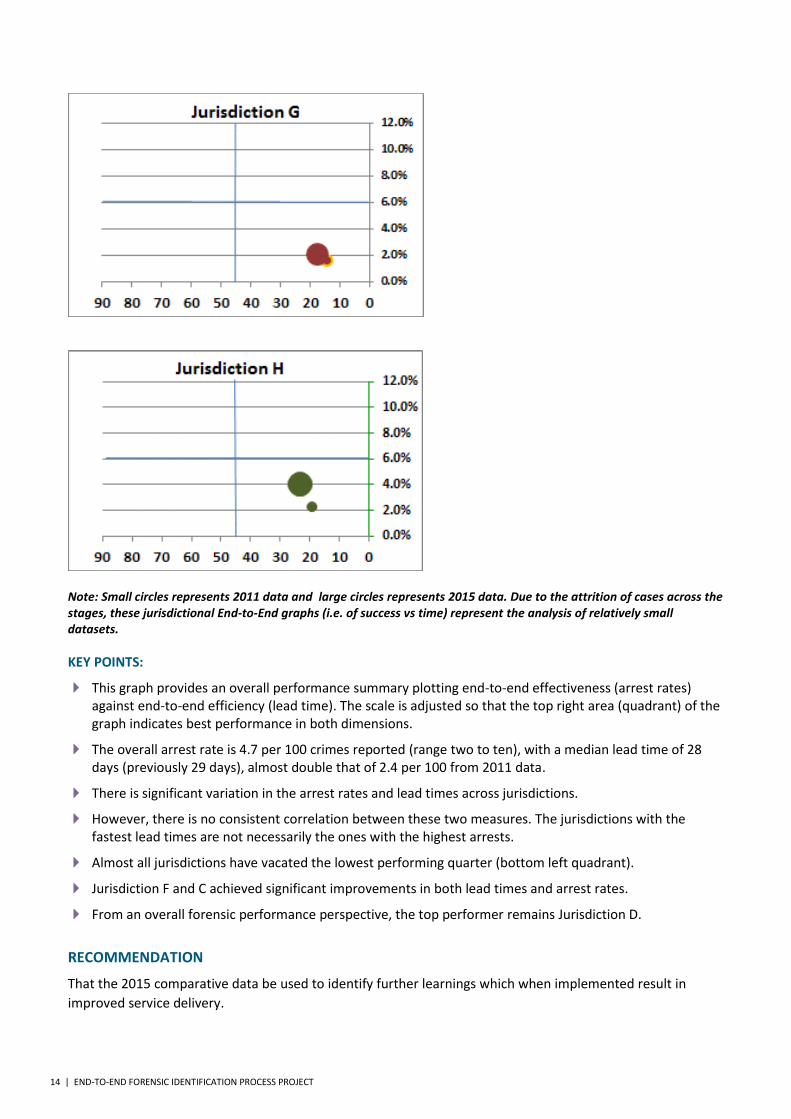
Figure 5: Success vs. Time (Median) per 100 Crimes Reported: By Jurisdiction -
Arrests after forensic ID per 100 crimes reported v. Speed, days (based on median of end-to-end time)
END-TO-END FORENSIC IDENTIFICATION PROCESS PROJECT | 13
14 | END-TO-END FORENSIC IDENTIFICATION PROCESS PROJECT
Note: Small circles represents 2011 data and large circles represents 2015 data. Due to the attrition of cases across the stages, these jurisdictional End-to-End graphs (i.e. of success vs time) represent the analysis of relatively small datasets.
KEY POINTS:
This graph provides an overall performance summary plotting end-to-end effectiveness (arrest rates) against end-to-end efficiency (lead time). The scale is adjusted so that the top right area (quadrant) of the graph indicates best performance in both dimensions.
The overall arrest rate is 4.7 per 100 crimes reported (range two to ten), with a median lead time of 28 days (previously 29 days), almost double that of 2.4 per 100 from 2011 data.
There is significant variation in the arrest rates and lead times across jurisdictions.
However, there is no consistent correlation between these two measures. The jurisdictions with the fastest lead times are not necessarily the ones with the highest arrests.
Almost all jurisdictions have vacated the lowest performing quarter (bottom left quadrant).
Jurisdiction F and C achieved significant improvements in both lead times and arrest rates.
From an overall forensic performance perspective, the top performer remains Jurisdiction D.
RECOMMENDATION
That the 2015 comparative data be used to identify further learnings which when implemented result in
improved service delivery.
END-TO-END FORENSIC IDENTIFICATION PROCESS PROJECT | 15
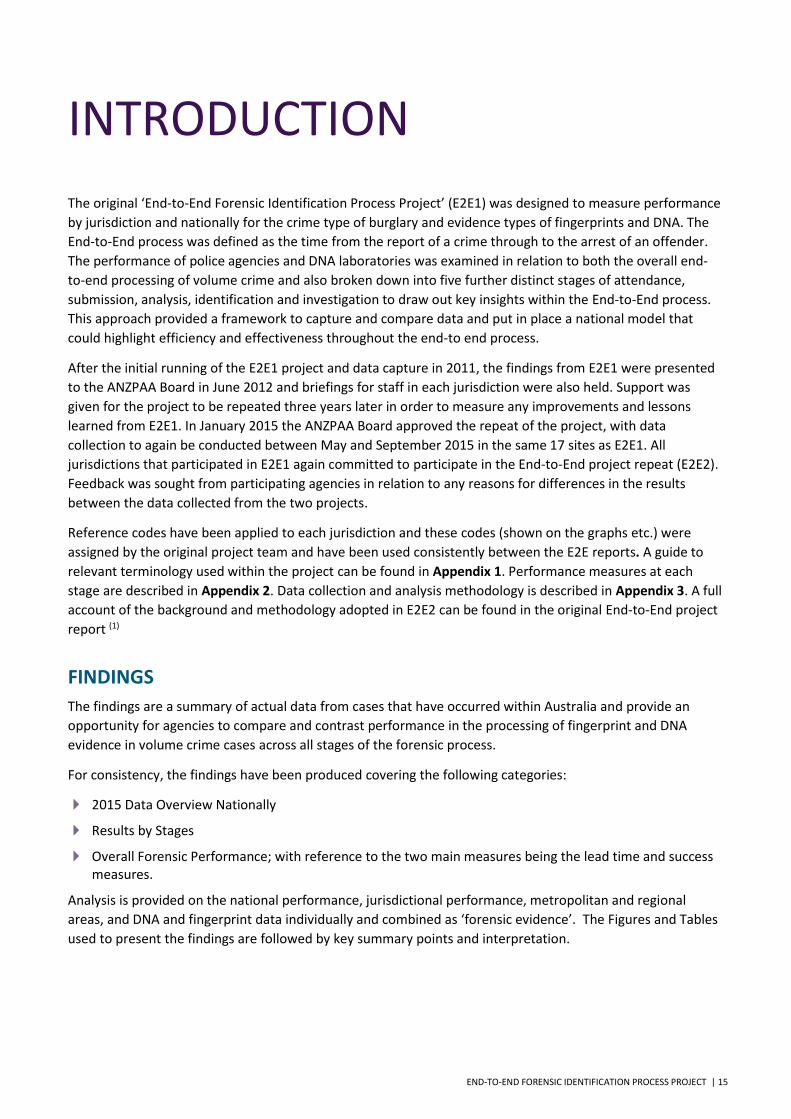
INTRODUCTION
The original ‘End-to-End Forensic Identification Process Project’ (E2E1) was designed to measure performance
by jurisdiction and nationally for the crime type of burglary and evidence types of fingerprints and DNA. The
End-to-End process was defined as the time from the report of a crime through to the arrest of an offender.
The performance of police agencies and DNA laboratories was examined in relation to both the overall end-
to-end processing of volume crime and also broken down into five further distinct stages of attendance,
submission, analysis, identification and investigation to draw out key insights within the End-to-End process.
This approach provided a framework to capture and compare data and put in place a national model that
could highlight efficiency and effectiveness throughout the end-to end process.
After the initial running of the E2E1 project and data capture in 2011, the findings from E2E1 were presented
to the ANZPAA Board in June 2012 and briefings for staff in each jurisdiction were also held. Support was
given for the project to be repeated three years later in order to measure any improvements and lessons
learned from E2E1. In January 2015 the ANZPAA Board approved the repeat of the project, with data
collection to again be conducted between May and September 2015 in the same 17 sites as E2E1. All
jurisdictions that participated in E2E1 again committed to participate in the End-to-End project repeat (E2E2).
Feedback was sought from participating agencies in relation to any reasons for differences in the results
between the data collected from the two projects.
Reference codes have been applied to each jurisdiction and these codes (shown on the graphs etc.) were
assigned by the original project team and have been used consistently between the E2E reports. A guide to
relevant terminology used within the project can be found in Appendix 1. Performance measures at each
stage are described in Appendix 2. Data collection and analysis methodology is described in Appendix 3. A full
account of the background and methodology adopted in E2E2 can be found in the original End-to-End project
report (1)
FINDINGS
The findings are a summary of actual data from cases that have occurred within Australia and provide an
opportunity for agencies to compare and contrast performance in the processing of fingerprint and DNA
evidence in volume crime cases across all stages of the forensic process.
For consistency, the findings have been produced covering the following categories:
2015 Data Overview Nationally
Results by Stages
Overall Forensic Performance; with reference to the two main measures being the lead time and success measures.
Analysis is provided on the national performance, jurisdictional performance, metropolitan and regional
areas, and DNA and fingerprint data individually and combined as ‘forensic evidence’. The Figures and Tables
used to present the findings are followed by key summary points and interpretation.
16 | END-TO-END FORENSIC IDENTIFICATION PROCESS PROJECT
DATA OVERVIEW NATIONALLY
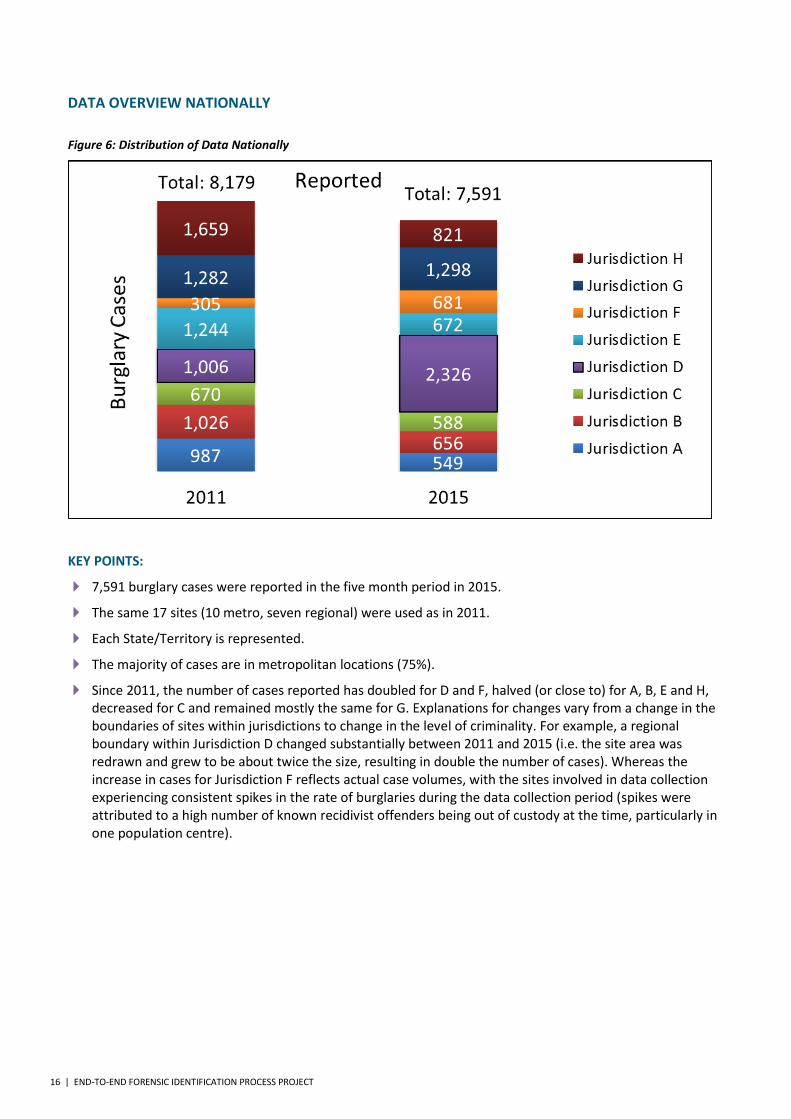
Figure 6: Distribution of Data Nationally
KEY POINTS:
7,591 burglary cases were reported in the five month period in 2015.
The same 17 sites (10 metro, seven regional) were used as in 2011.
Each State/Territory is represented.
The majority of cases are in metropolitan locations (75%).
Since 2011, the number of cases reported has doubled for D and F, halved (or close to) for A, B, E and H, decreased for C and remained mostly the same for G. Explanations for changes vary from a change in the boundaries of sites within jurisdictions to change in the level of criminality. For example, a regional boundary within Jurisdiction D changed substantially between 2011 and 2015 (i.e. the site area was redrawn and grew to be about twice the size, resulting in double the number of cases). Whereas the increase in cases for Jurisdiction F reflects actual case volumes, with the sites involved in data collection experiencing consistent spikes in the rate of burglaries during the data collection period (spikes were attributed to a high number of known recidivist offenders being out of custody at the time, particularly in one population centre).
END-TO-END FORENSIC IDENTIFICATION PROCESS PROJECT | 17
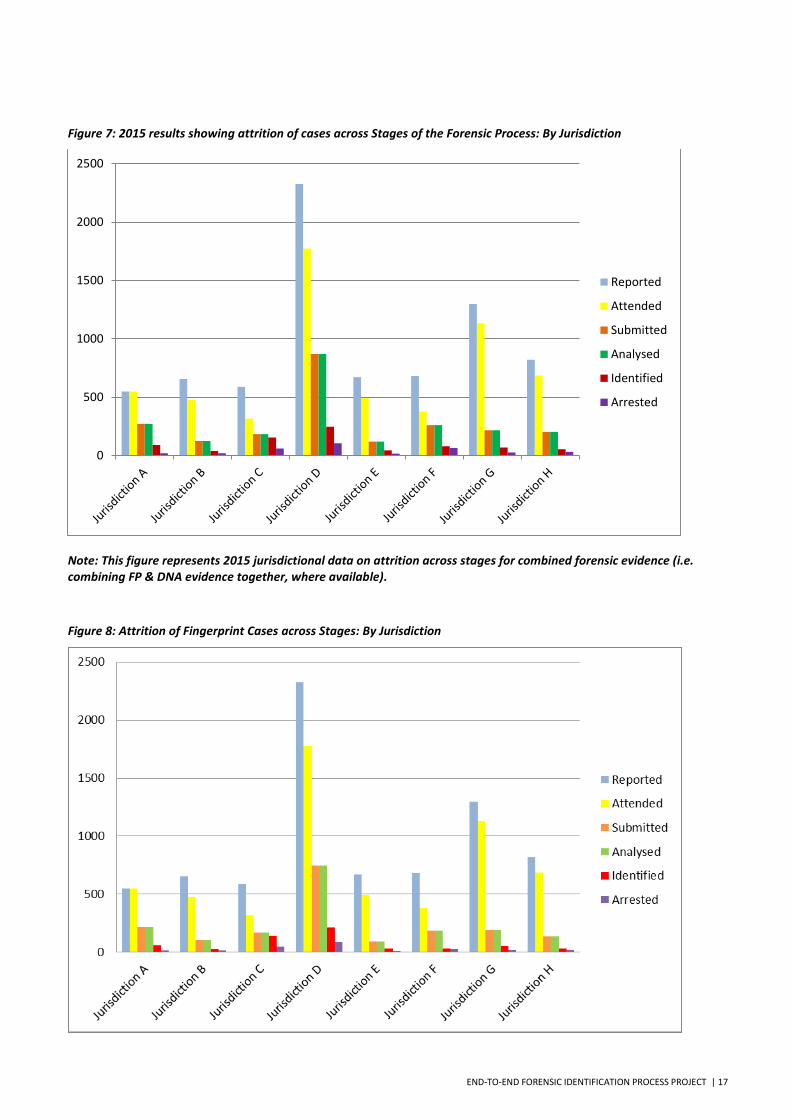
Figure 7: 2015 results showing attrition of cases across Stages of the Forensic Process: By Jurisdiction
Note: This figure represents 2015 jurisdictional data on attrition across stages for combined forensic evidence (i.e. combining FP & DNA evidence together, where available).
Figure 8: Attrition of Fingerprint Cases across Stages: By Jurisdiction
0
500
1000
1500
2000
2500
Reported
Attended
Submitted
Analysed
Identified
Arrested
18 | END-TO-END FORENSIC IDENTIFICATION PROCESS PROJECT
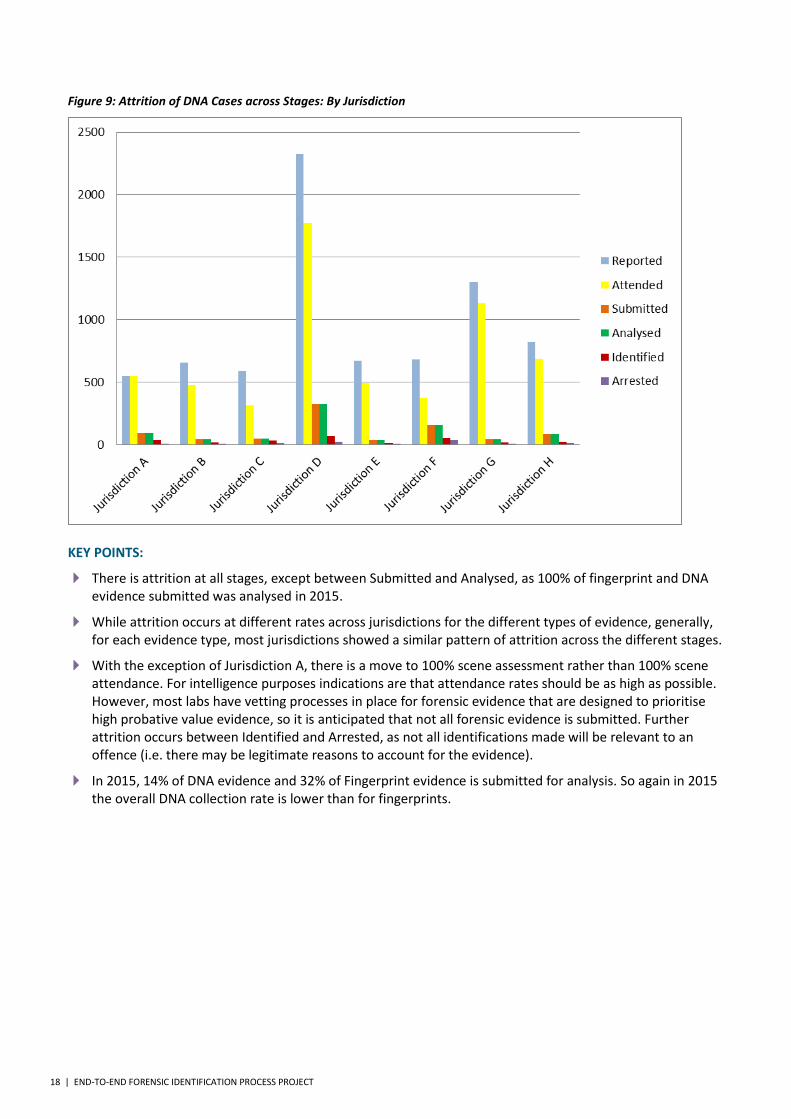
Figure 9: Attrition of DNA Cases across Stages: By Jurisdiction
KEY POINTS:
There is attrition at all stages, except between Submitted and Analysed, as 100% of fingerprint and DNA evidence submitted was analysed in 2015.
While attrition occurs at different rates across jurisdictions for the different types of evidence, generally, for each evidence type, most jurisdictions showed a similar pattern of attrition across the different stages.
With the exception of Jurisdiction A, there is a move to 100% scene assessment rather than 100% scene attendance. For intelligence purposes indications are that attendance rates should be as high as possible. However, most labs have vetting processes in place for forensic evidence that are designed to prioritise high probative value evidence, so it is anticipated that not all forensic evidence is submitted. Further attrition occurs between Identified and Arrested, as not all identifications made will be relevant to an offence (i.e. there may be legitimate reasons to account for the evidence).
In 2015, 14% of DNA evidence and 32% of Fingerprint evidence is submitted for analysis. So again in 2015 the overall DNA collection rate is lower than for fingerprints.
END-TO-END FORENSIC IDENTIFICATION PROCESS PROJECT | 19
RESULTS BY STAGE
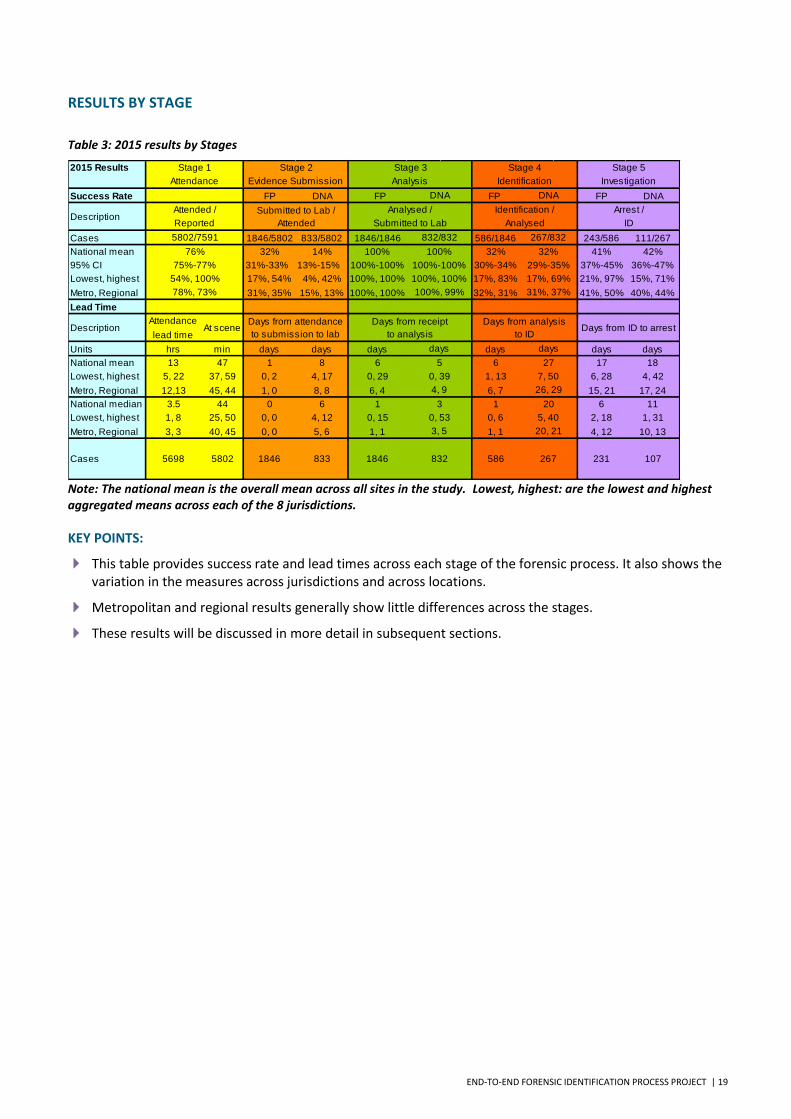
Table 3: 2015 results by Stages
Note: The national mean is the overall mean across all sites in the study. Lowest, highest: are the lowest and highest aggregated means across each of the 8 jurisdictions.
KEY POINTS:
This table provides success rate and lead times across each stage of the forensic process. It also shows the variation in the measures across jurisdictions and across locations.
Metropolitan and regional results generally show little differences across the stages.
These results will be discussed in more detail in subsequent sections.
2015 Results
Success Rate FP DNA FP FP FP DNA
Cases 1846/5802 833/5802 1846/1846 586/1846 243/586 111/267
National mean 32% 14% 100% 32% 41% 42%
95% CI 31%-33% 13%-15% 100%-100% 30%-34% 37%-45% 36%-47%
Lowest, highest 17%, 54% 4%, 42% 100%, 100% 17%, 83% 21%, 97% 15%, 71%
Metro, Regional 31%, 35% 15%, 13% 100%, 100% 32%, 31% 41%, 50% 40%, 44%
Lead Time
Attendance
lead time
Units hrs min days days days days days days
National mean 13 47 1 8 6 6 17 18
Lowest, highest 5, 22 37, 59 0, 2 4, 17 0, 29 1, 13 6, 28 4, 42
Metro, Regional 12,13 45, 44 1, 0 8, 8 6, 4 6, 7 15, 21 17, 24
National median 3.5 44 0 6 1 1 6 11
Lowest, highest 1, 8 25, 50 0, 0 4, 12 0, 15 0, 6 2, 18 1, 31
Metro, Regional 3, 3 40, 45 0, 0 5, 6 1, 1 1, 1 4, 12 10, 13
Cases 5802 1846 833 1846 832 586 267 231 1075698
3 20
0, 53 5, 40
Days from ID to arrest
days days
5 27
0, 39 7, 50
4, 9 26, 29
3, 5 20, 21
Description At sceneDays from attendance
to submission to lab
Days from receipt
to analysis
Days from analysis
to ID
54%, 100% 100%, 100% 17%, 69%
78%, 73% 100%, 99% 31%, 37%
5802/7591 832/832 267/832
76% 100% 32%
75%-77% 100%-100% 29%-35%
DescriptionAttended / Submitted to Lab /
Attended
Analysed / Identification / Arrest /
Reported Submitted to Lab Analysed ID
DNADNA
Stage 1 Stage 2 Stage 3 Stage 4 Stage 5
Attendance Evidence Submission Analysis Identification Investigation
20 | END-TO-END FORENSIC IDENTIFICATION PROCESS PROJECT
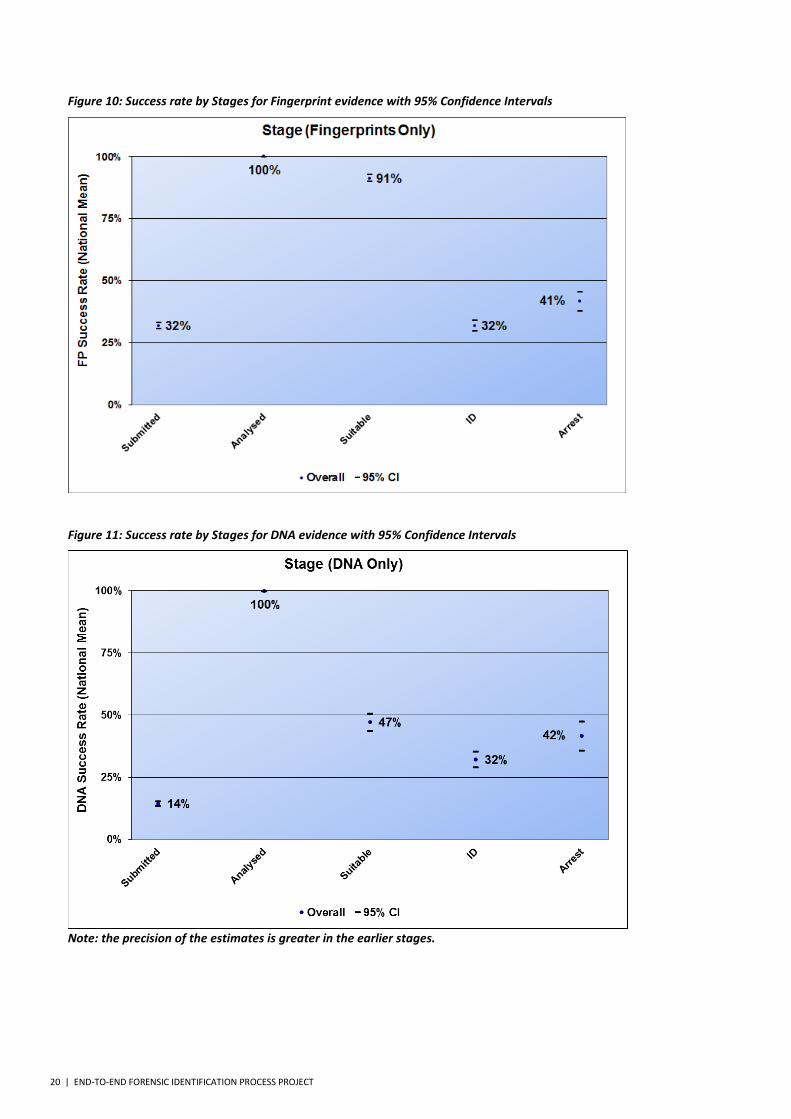
Figure 10: Success rate by Stages for Fingerprint evidence with 95% Confidence Intervals
Figure 11: Success rate by Stages for DNA evidence with 95% Confidence Intervals
Note: the precision of the estimates is greater in the earlier stages.
END-TO-END FORENSIC IDENTIFICATION PROCESS PROJECT | 21
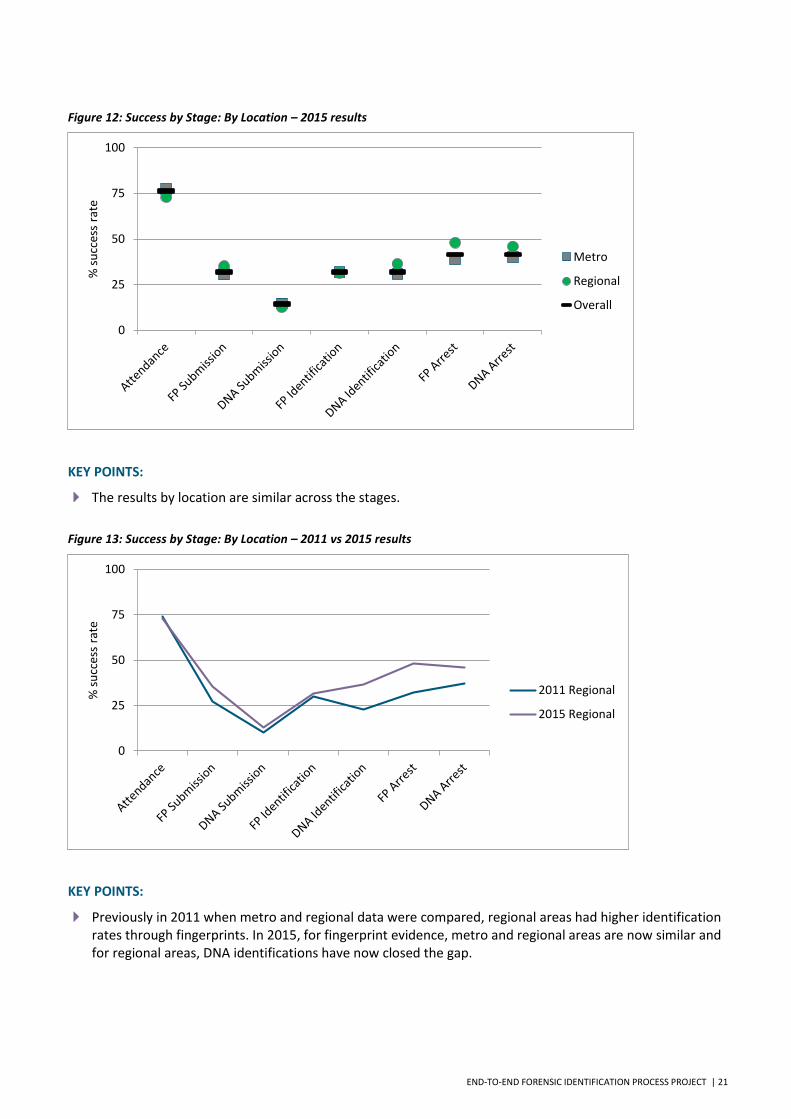
Figure 12: Success by Stage: By Location – 2015 results
KEY POINTS:
The results by location are similar across the stages.
Figure 13: Success by Stage: By Location – 2011 vs 2015 results
KEY POINTS:
Previously in 2011 when metro and regional data were compared, regional areas had higher identification rates through fingerprints. In 2015, for fingerprint evidence, metro and regional areas are now similar and for regional areas, DNA identifications have now closed the gap.
0
25
50
75
100
% s
ucc
ess
rate
Metro
Regional
Overall
0
25
50
75
100
% s
ucc
ess
rate
2011 Regional
2015 Regional
22 | END-TO-END FORENSIC IDENTIFICATION PROCESS PROJECT
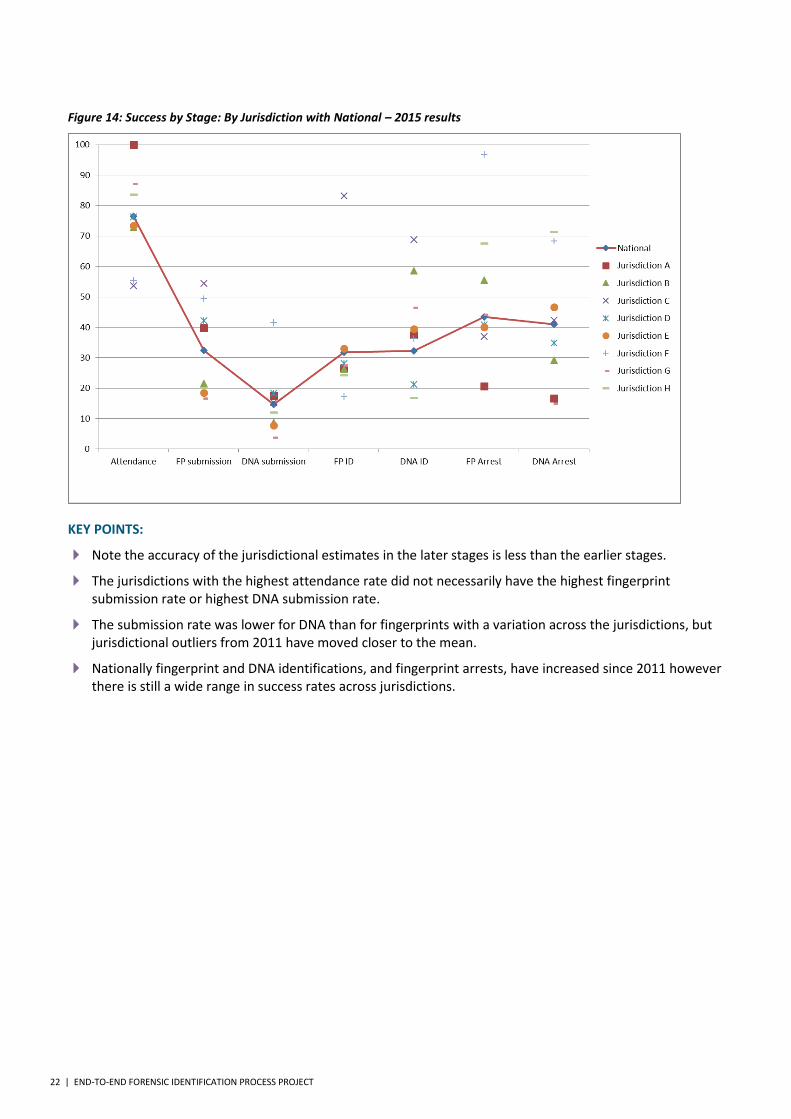
Figure 14: Success by Stage: By Jurisdiction with National – 2015 results
KEY POINTS:
Note the accuracy of the jurisdictional estimates in the later stages is less than the earlier stages.
The jurisdictions with the highest attendance rate did not necessarily have the highest fingerprint submission rate or highest DNA submission rate.
The submission rate was lower for DNA than for fingerprints with a variation across the jurisdictions, but jurisdictional outliers from 2011 have moved closer to the mean.
Nationally fingerprint and DNA identifications, and fingerprint arrests, have increased since 2011 however there is still a wide range in success rates across jurisdictions.
END-TO-END FORENSIC IDENTIFICATION PROCESS PROJECT | 23
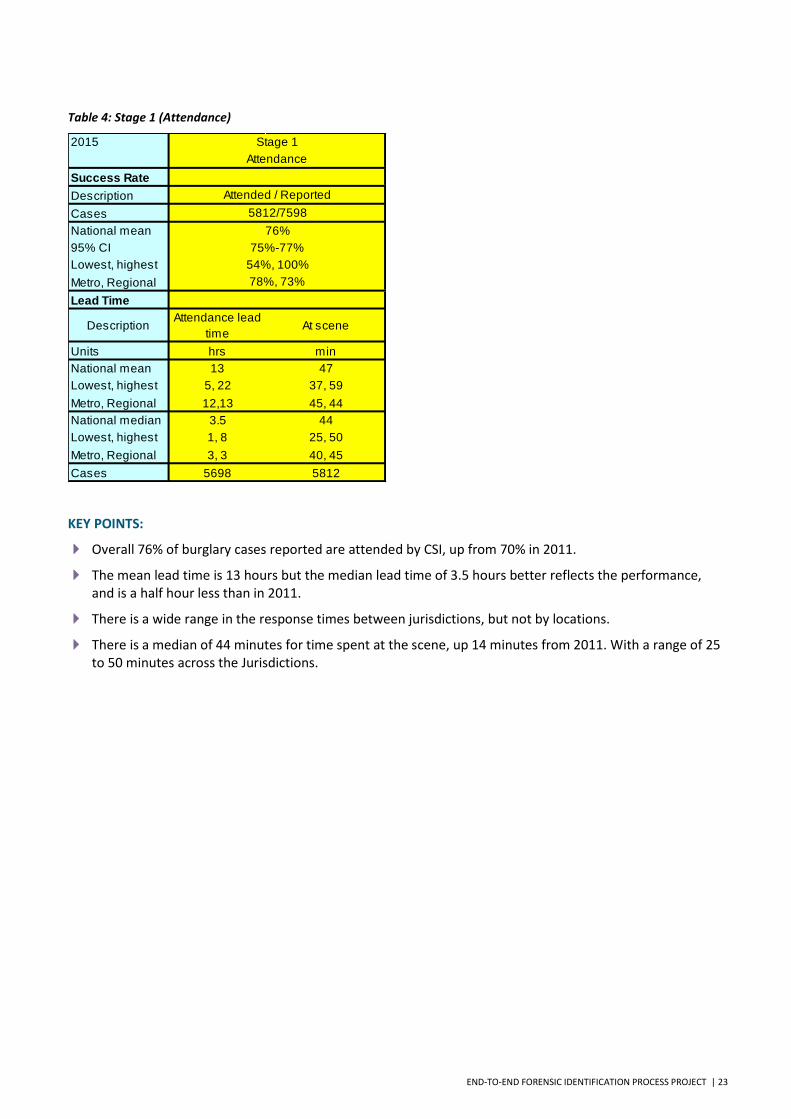
Table 4: Stage 1 (Attendance)
KEY POINTS:
Overall 76% of burglary cases reported are attended by CSI, up from 70% in 2011.
The mean lead time is 13 hours but the median lead time of 3.5 hours better reflects the performance, and is a half hour less than in 2011.
There is a wide range in the response times between jurisdictions, but not by locations.
There is a median of 44 minutes for time spent at the scene, up 14 minutes from 2011. With a range of 25 to 50 minutes across the Jurisdictions.
2015
Success Rate
Description
Cases
National mean
95% CI
Lowest, highest
Metro, Regional
Lead Time
DescriptionAttendance lead
timeAt scene
Units hrs min
National mean 13 47
Lowest, highest 5, 22 37, 59
Metro, Regional 12,13 45, 44
National median 3.5 44
Lowest, highest 1, 8 25, 50
Metro, Regional 3, 3 40, 45
Cases 5698 5812
75%-77%
54%, 100%
78%, 73%
Stage 1
Attendance
Attended / Reported
5812/7598
76%
24 | END-TO-END FORENSIC IDENTIFICATION PROCESS PROJECT
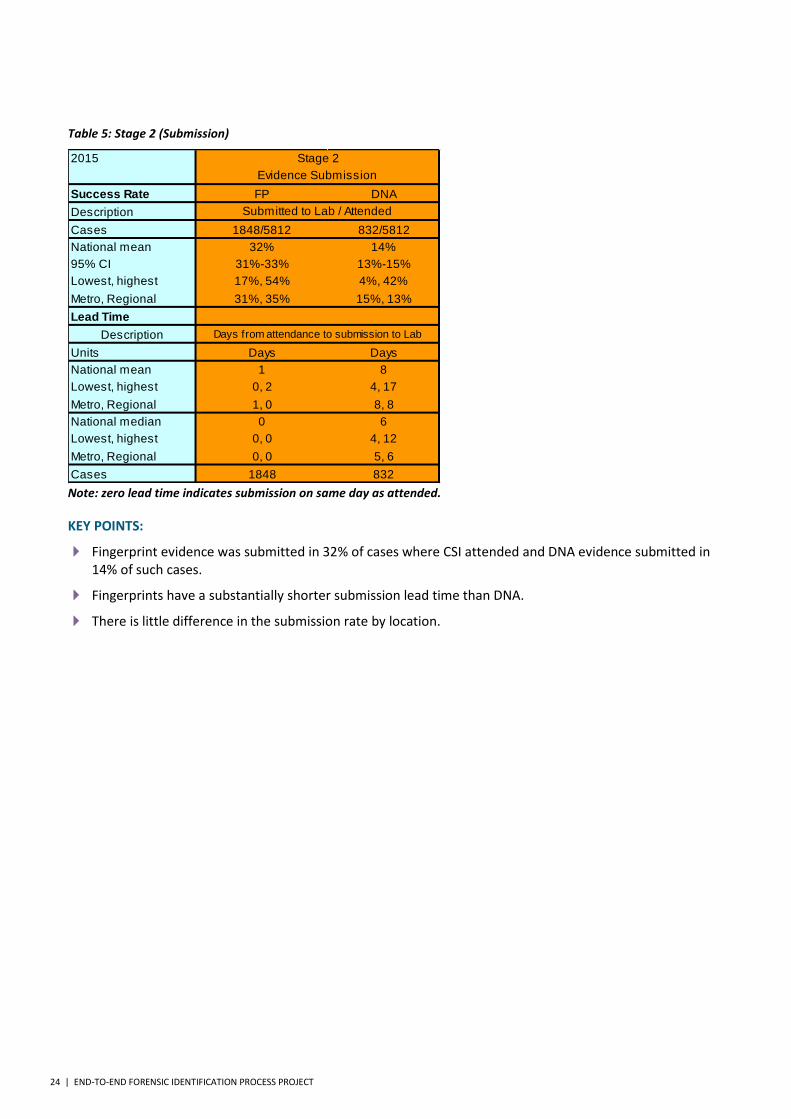
Table 5: Stage 2 (Submission)
Note: zero lead time indicates submission on same day as attended.
KEY POINTS:
Fingerprint evidence was submitted in 32% of cases where CSI attended and DNA evidence submitted in 14% of such cases.
Fingerprints have a substantially shorter submission lead time than DNA.
There is little difference in the submission rate by location.
2015
Success Rate FP DNA
Description
Cases 1848/5812 832/5812
National mean 32% 14%
95% CI 31%-33% 13%-15%
Lowest, highest 17%, 54% 4%, 42%
Metro, Regional 31%, 35% 15%, 13%
Lead Time
Description
Units Days Days
National mean 1 8
Lowest, highest 0, 2 4, 17
Metro, Regional 1, 0 8, 8
National median 0 6
Lowest, highest 0, 0 4, 12
Metro, Regional 0, 0 5, 6
Cases 1848 832
Stage 2
Evidence Submission
Submitted to Lab / Attended
Days from attendance to submission to Lab
END-TO-END FORENSIC IDENTIFICATION PROCESS PROJECT | 25
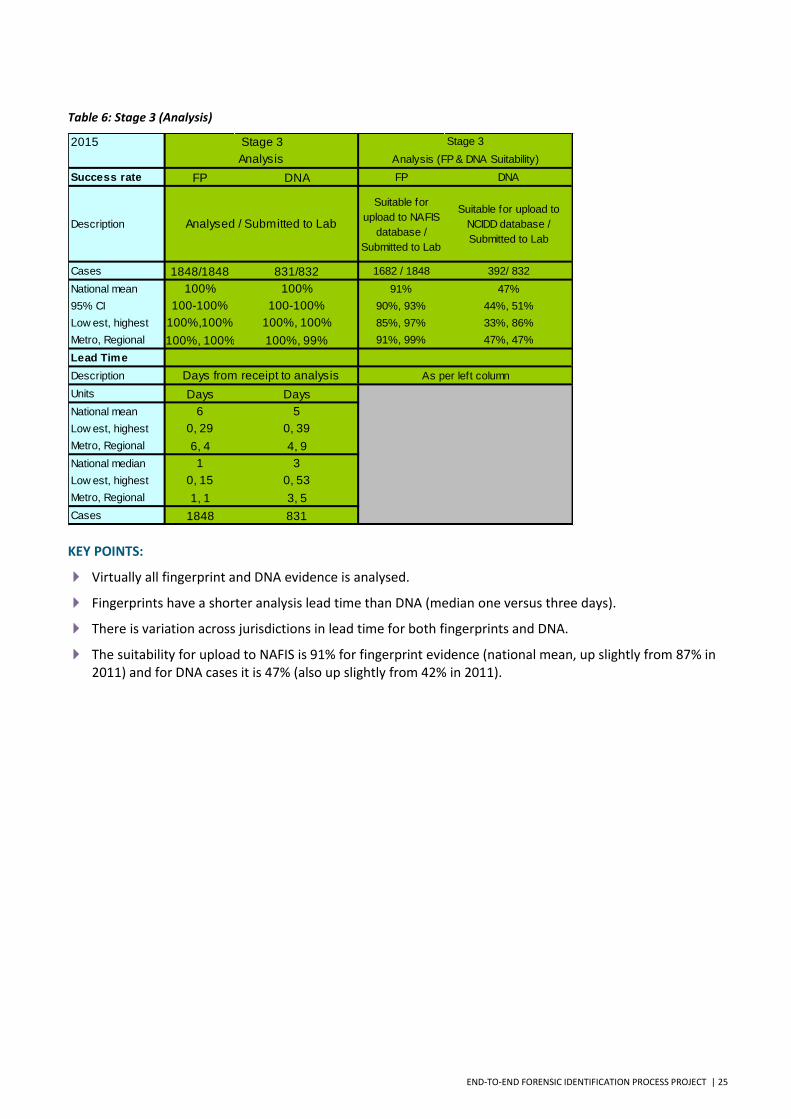
Table 6: Stage 3 (Analysis)
KEY POINTS:
Virtually all fingerprint and DNA evidence is analysed.
Fingerprints have a shorter analysis lead time than DNA (median one versus three days).
There is variation across jurisdictions in lead time for both fingerprints and DNA.
The suitability for upload to NAFIS is 91% for fingerprint evidence (national mean, up slightly from 87% in 2011) and for DNA cases it is 47% (also up slightly from 42% in 2011).
2015
Success rate FP DNA FP DNA
Description
Suitable for
upload to NAFIS
database /
Submitted to Lab
Suitable for upload to
NCIDD database /
Submitted to Lab
Cases 1848/1848 831/832 1682 / 1848 392/ 832
National mean 100% 100% 91% 47%
95% CI 100-100% 100-100% 90%, 93% 44%, 51%
Low est, highest 100%,100% 100%, 100% 85%, 97% 33%, 86%
Metro, Regional 100%, 100% 100%, 99% 91%, 99% 47%, 47%
Lead Time
Description
Units Days Days
National mean 6 5
Low est, highest 0, 29 0, 39
Metro, Regional 6, 4 4, 9
National median 1 3
Low est, highest 0, 15 0, 53
Metro, Regional 1, 1 3, 5
Cases 1848 831
Days from receipt to analysis As per left column
Stage 3 Stage 3
Analysis Analysis (FP & DNA Suitability)
Analysed / Submitted to Lab
26 | END-TO-END FORENSIC IDENTIFICATION PROCESS PROJECT
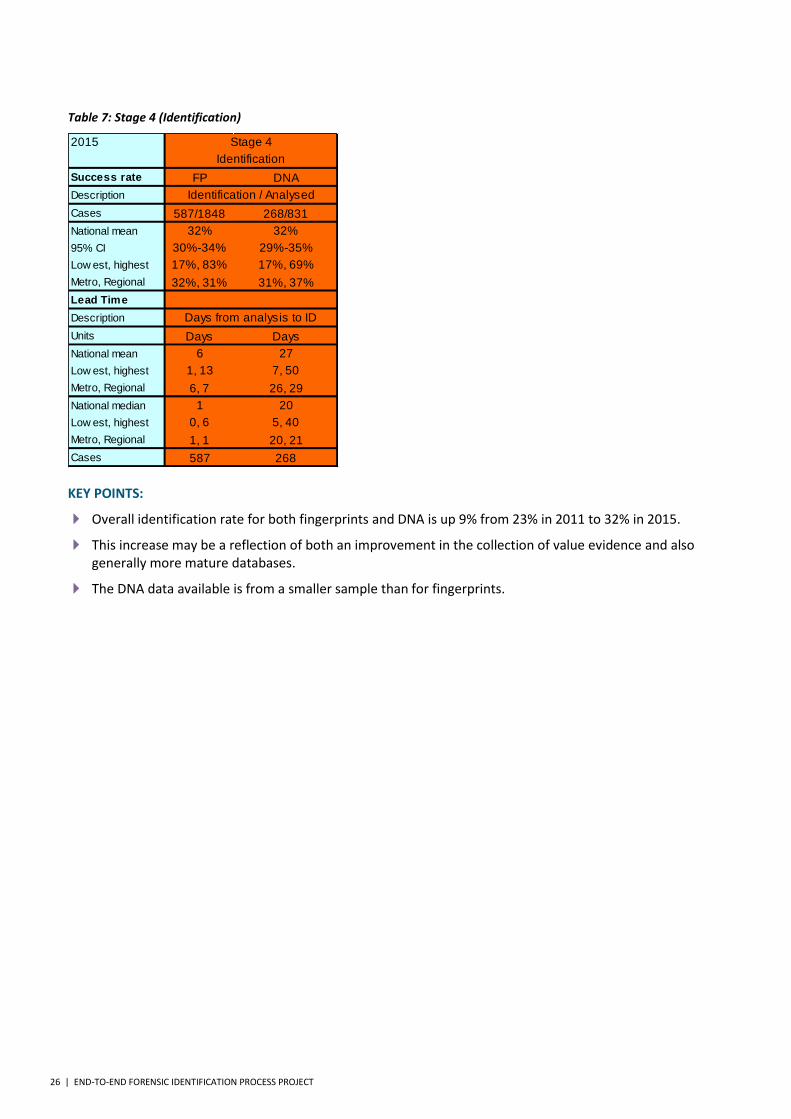
Table 7: Stage 4 (Identification)
KEY POINTS:
Overall identification rate for both fingerprints and DNA is up 9% from 23% in 2011 to 32% in 2015.
This increase may be a reflection of both an improvement in the collection of value evidence and also generally more mature databases.
The DNA data available is from a smaller sample than for fingerprints.
2015
Success rate FP DNA
Description
Cases 587/1848 268/831
National mean 32% 32%
95% CI 30%-34% 29%-35%
Low est, highest 17%, 83% 17%, 69%
Metro, Regional 32%, 31% 31%, 37%
Lead Time
Description
Units Days Days
National mean 6 27
Low est, highest 1, 13 7, 50
Metro, Regional 6, 7 26, 29
National median 1 20
Low est, highest 0, 6 5, 40
Metro, Regional 1, 1 20, 21
Cases 587 268
Stage 4
Identification
Identification / Analysed
Days from analysis to ID
END-TO-END FORENSIC IDENTIFICATION PROCESS PROJECT | 27
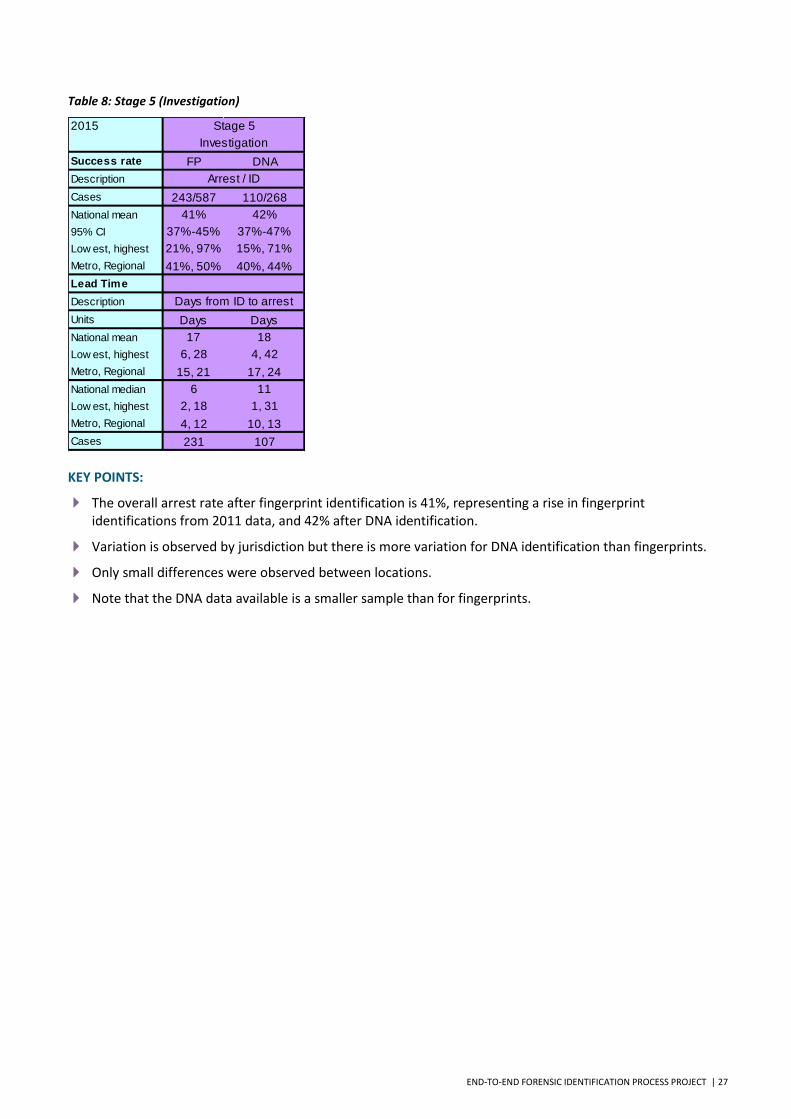
Table 8: Stage 5 (Investigation)
KEY POINTS:
The overall arrest rate after fingerprint identification is 41%, representing a rise in fingerprint identifications from 2011 data, and 42% after DNA identification.
Variation is observed by jurisdiction but there is more variation for DNA identification than fingerprints.
Only small differences were observed between locations.
Note that the DNA data available is a smaller sample than for fingerprints.
2015
Success rate FP DNA
Description
Cases 243/587 110/268
National mean 41% 42%
95% CI 37%-45% 37%-47%
Low est, highest 21%, 97% 15%, 71%
Metro, Regional 41%, 50% 40%, 44%
Lead Time
Description
Units Days Days
National mean 17 18
Low est, highest 6, 28 4, 42
Metro, Regional 15, 21 17, 24
National median 6 11
Low est, highest 2, 18 1, 31
Metro, Regional 4, 12 10, 13
Cases 231 107
Stage 5
Investigation
Arrest / ID
Days from ID to arrest
28 | END-TO-END FORENSIC IDENTIFICATION PROCESS PROJECT
OVERALL FORENSIC PERFORMANCE
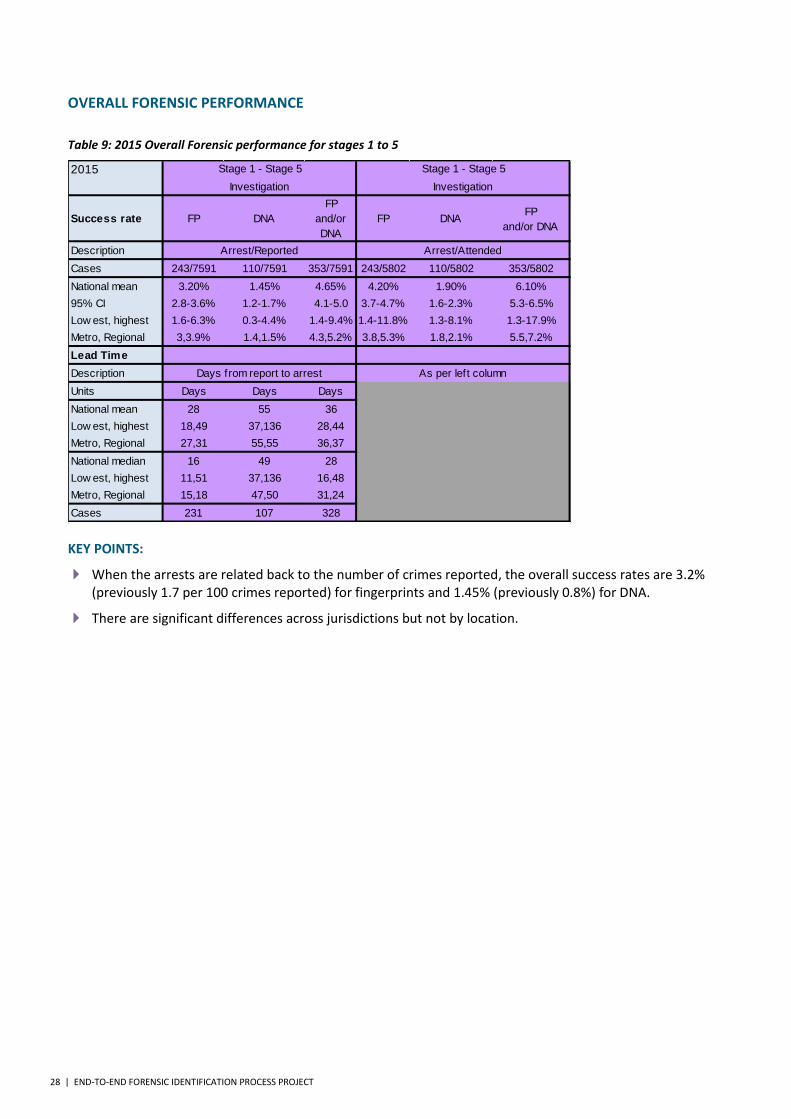
Table 9: 2015 Overall Forensic performance for stages 1 to 5
KEY POINTS:
When the arrests are related back to the number of crimes reported, the overall success rates are 3.2% (previously 1.7 per 100 crimes reported) for fingerprints and 1.45% (previously 0.8%) for DNA.
There are significant differences across jurisdictions but not by location.
2015
Success rate FP DNA
FP
and/or
DNA
FP DNAFP
and/or DNA
Description
Cases 243/7591 110/7591 353/7591 243/5802 110/5802 353/5802
National mean 3.20% 1.45% 4.65% 4.20% 1.90% 6.10%
95% CI 2.8-3.6% 1.2-1.7% 4.1-5.0 3.7-4.7% 1.6-2.3% 5.3-6.5%
Low est, highest 1.6-6.3% 0.3-4.4% 1.4-9.4% 1.4-11.8% 1.3-8.1% 1.3-17.9%
Metro, Regional 3,3.9% 1.4,1.5% 4.3,5.2% 3.8,5.3% 1.8,2.1% 5.5,7.2%
Lead Time
Description
Units Days Days Days
National mean 28 55 36
Low est, highest 18,49 37,136 28,44
Metro, Regional 27,31 55,55 36,37
National median 16 49 28
Low est, highest 11,51 37,136 16,48
Metro, Regional 15,18 47,50 31,24
Cases 231 107 328
Days from report to arrest As per left column
Stage 1 - Stage 5 Stage 1 - Stage 5
Investigation Investigation
Arrest/Reported Arrest/Attended
END-TO-END FORENSIC IDENTIFICATION PROCESS PROJECT | 29
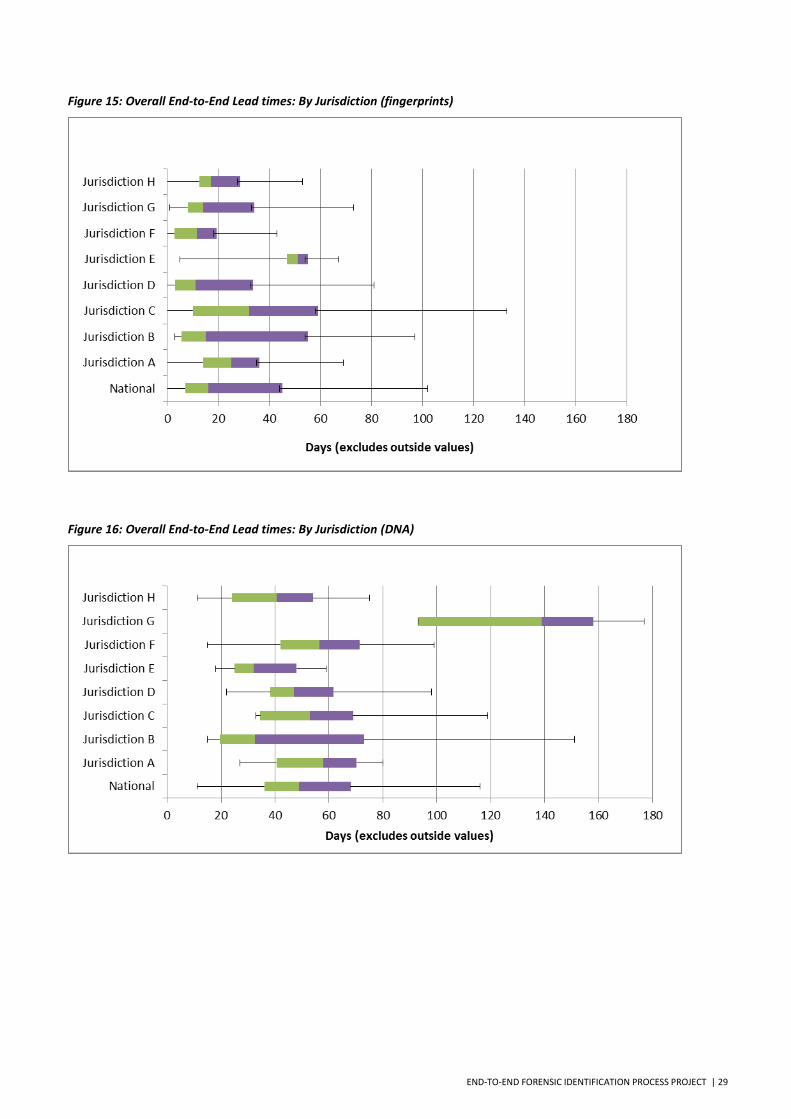
Figure 15: Overall End-to-End Lead times: By Jurisdiction (fingerprints)
Figure 16: Overall End-to-End Lead times: By Jurisdiction (DNA)
30 | END-TO-END FORENSIC IDENTIFICATION PROCESS PROJECT
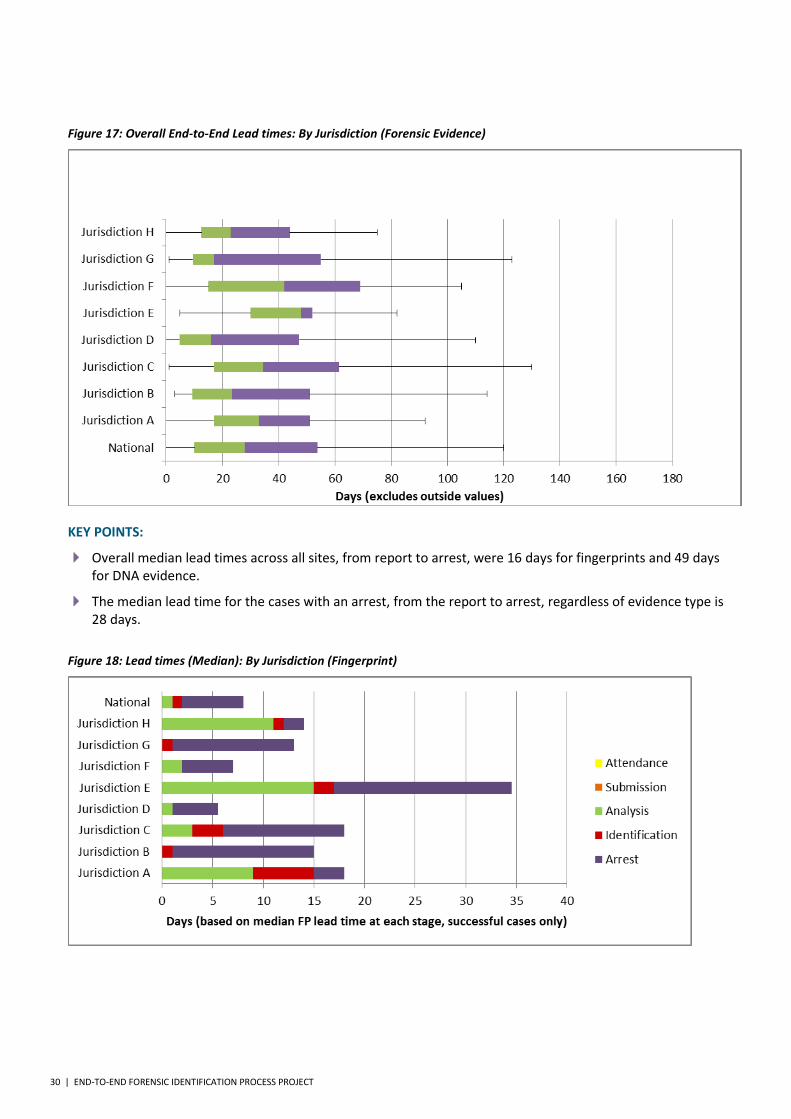
Figure 17: Overall End-to-End Lead times: By Jurisdiction (Forensic Evidence)
KEY POINTS:
Overall median lead times across all sites, from report to arrest, were 16 days for fingerprints and 49 days for DNA evidence.
The median lead time for the cases with an arrest, from the report to arrest, regardless of evidence type is 28 days.
Figure 18: Lead times (Median): By Jurisdiction (Fingerprint)
END-TO-END FORENSIC IDENTIFICATION PROCESS PROJECT | 31
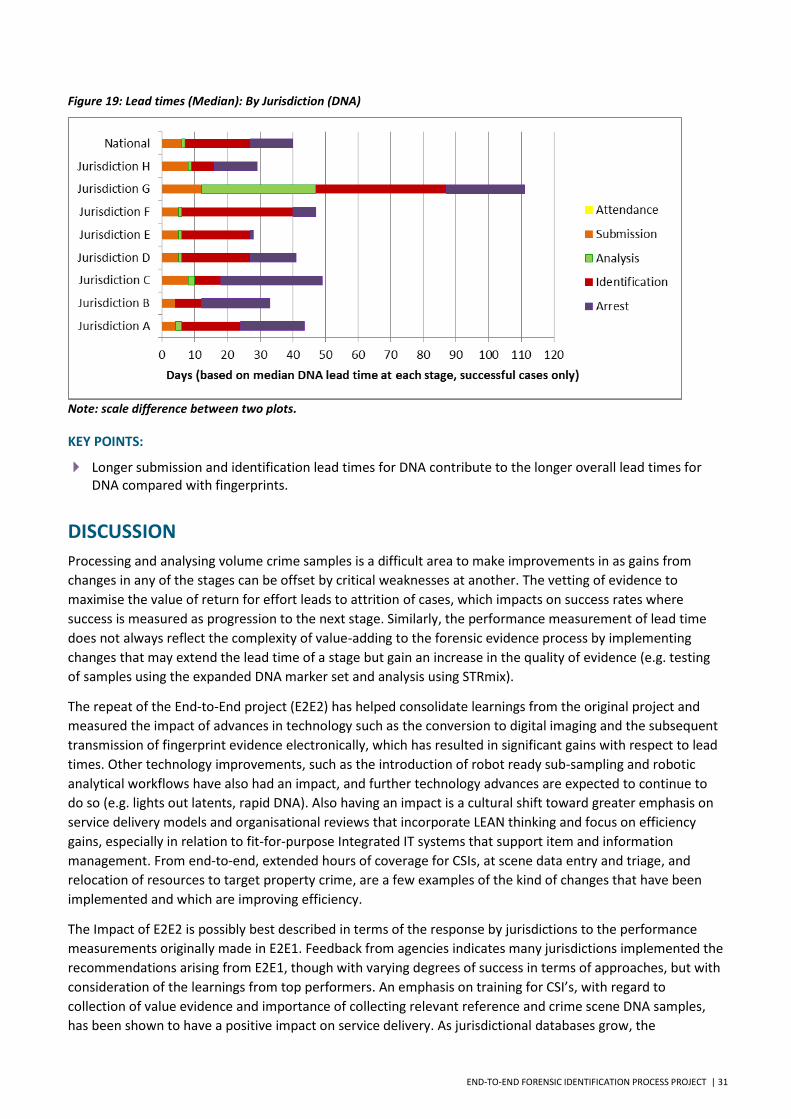
Figure 19: Lead times (Median): By Jurisdiction (DNA)
Note: scale difference between two plots.
KEY POINTS:
Longer submission and identification lead times for DNA contribute to the longer overall lead times for DNA compared with fingerprints.
DISCUSSION
Processing and analysing volume crime samples is a difficult area to make improvements in as gains from
changes in any of the stages can be offset by critical weaknesses at another. The vetting of evidence to
maximise the value of return for effort leads to attrition of cases, which impacts on success rates where
success is measured as progression to the next stage. Similarly, the performance measurement of lead time
does not always reflect the complexity of value-adding to the forensic evidence process by implementing
changes that may extend the lead time of a stage but gain an increase in the quality of evidence (e.g. testing
of samples using the expanded DNA marker set and analysis using STRmix).
The repeat of the End-to-End project (E2E2) has helped consolidate learnings from the original project and
measured the impact of advances in technology such as the conversion to digital imaging and the subsequent
transmission of fingerprint evidence electronically, which has resulted in significant gains with respect to lead
times. Other technology improvements, such as the introduction of robot ready sub-sampling and robotic
analytical workflows have also had an impact, and further technology advances are expected to continue to
do so (e.g. lights out latents, rapid DNA). Also having an impact is a cultural shift toward greater emphasis on
service delivery models and organisational reviews that incorporate LEAN thinking and focus on efficiency
gains, especially in relation to fit-for-purpose Integrated IT systems that support item and information
management. From end-to-end, extended hours of coverage for CSIs, at scene data entry and triage, and
relocation of resources to target property crime, are a few examples of the kind of changes that have been
implemented and which are improving efficiency.
The Impact of E2E2 is possibly best described in terms of the response by jurisdictions to the performance
measurements originally made in E2E1. Feedback from agencies indicates many jurisdictions implemented the
recommendations arising from E2E1, though with varying degrees of success in terms of approaches, but with
consideration of the learnings from top performers. An emphasis on training for CSI’s, with regard to
collection of value evidence and importance of collecting relevant reference and crime scene DNA samples,
has been shown to have a positive impact on service delivery. As jurisdictional databases grow, the
32 | END-TO-END FORENSIC IDENTIFICATION PROCESS PROJECT
identification rate for DNA profiles and fingerprints obtained at crime scenes is on the increase. Also
encouragingly, since 2011, police organisations have been able to apply strategies to develop means to
improve communication and outcomes at the investigation stage, allowing the benefits gained at earlier
stages of the process to be realised at the arrest stage and in the overall lead times.
The End-to-End project has helped develop and refine a national model for end-to-end forensic processing of
volume crime samples, providing a useful tool to enable agencies to capture and compare data, which in turn
provides valuable information on efficiency and effectiveness of the forensic processes which support
investigations.
RECOMMENDATION
Based on the findings from the repeat of the End-to-End project, the following recommendations are made:
The data be used to identify further learnings that when implemented result in improved service delivery.
ANZPAA NIFS to provide workshops based upon request from individual jurisdictions.
ACKNOWLEDGEMENTS
ANZPAA NIFS would like to acknowledge the following personnel for their contribution to the project:
Dr Linzi Wilson-Wilde, Director, ANZPAA NIFS
Eva Bruenisholz, End-to-End Phase 2 - Project Officer, ANZPAA NIFS
Nicholas Vandenberg, End-to-End Phase 2 - Project Officer, ANZPAA NIFS
Cheryl Brown, End-to-End Project Phase 1 - Project Officer, South Australia Police
END-TO-END FORENSIC IDENTIFICATION PROCESS PROJECT | 33
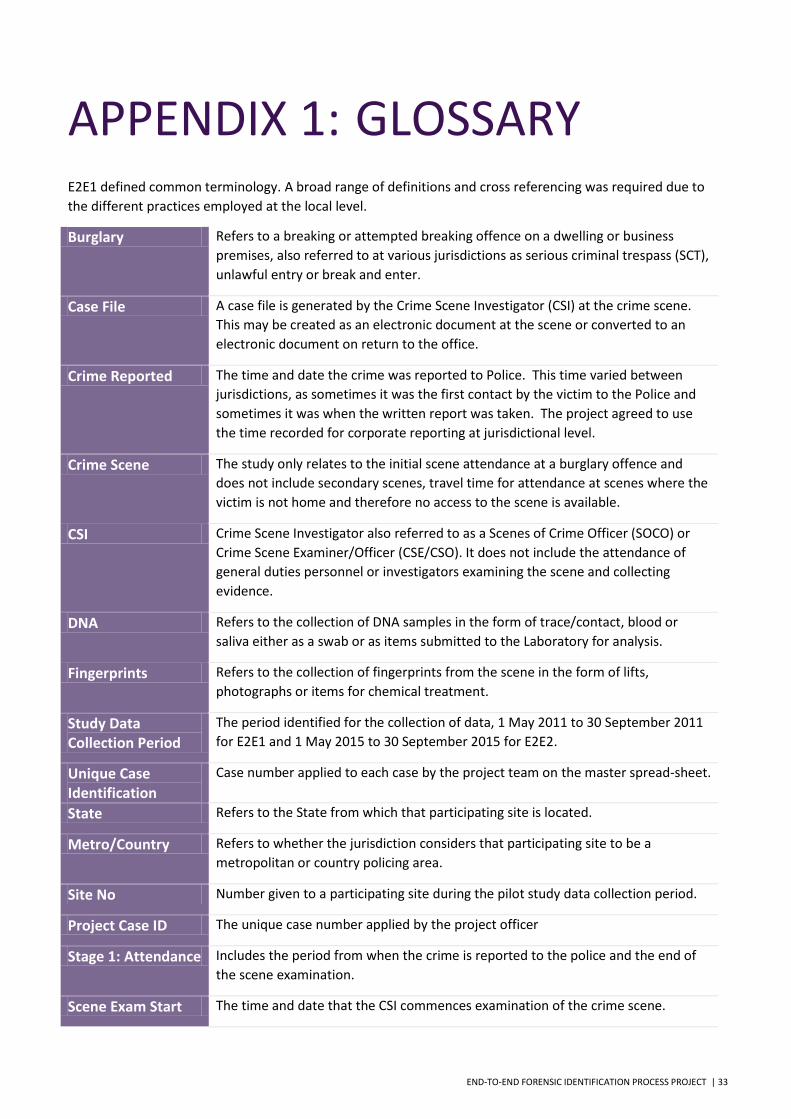
APPENDIX 1: GLOSSARY E2E1 defined common terminology. A broad range of definitions and cross referencing was required due to
the different practices employed at the local level.
Burglary Refers to a breaking or attempted breaking offence on a dwelling or business
premises, also referred to at various jurisdictions as serious criminal trespass (SCT),
unlawful entry or break and enter.
Case File A case file is generated by the Crime Scene Investigator (CSI) at the crime scene.
This may be created as an electronic document at the scene or converted to an
electronic document on return to the office.
Crime Reported The time and date the crime was reported to Police. This time varied between
jurisdictions, as sometimes it was the first contact by the victim to the Police and
sometimes it was when the written report was taken. The project agreed to use
the time recorded for corporate reporting at jurisdictional level.
Crime Scene The study only relates to the initial scene attendance at a burglary offence and
does not include secondary scenes, travel time for attendance at scenes where the
victim is not home and therefore no access to the scene is available.
CSI Crime Scene Investigator also referred to as a Scenes of Crime Officer (SOCO) or
Crime Scene Examiner/Officer (CSE/CSO). It does not include the attendance of
general duties personnel or investigators examining the scene and collecting
evidence.
DNA Refers to the collection of DNA samples in the form of trace/contact, blood or
saliva either as a swab or as items submitted to the Laboratory for analysis.
Fingerprints Refers to the collection of fingerprints from the scene in the form of lifts,
photographs or items for chemical treatment.
Study Data Collection Period
The period identified for the collection of data, 1 May 2011 to 30 September 2011
for E2E1 and 1 May 2015 to 30 September 2015 for E2E2.
Unique Case Identification
Case number applied to each case by the project team on the master spread-sheet.
State Refers to the State from which that participating site is located.
Metro/Country Refers to whether the jurisdiction considers that participating site to be a
metropolitan or country policing area.
Site No Number given to a participating site during the pilot study data collection period.
Project Case ID The unique case number applied by the project officer
Stage 1: Attendance Includes the period from when the crime is reported to the police and the end of
the scene examination.
Scene Exam Start The time and date that the CSI commences examination of the crime scene.
34 | END-TO-END FORENSIC IDENTIFICATION PROCESS PROJECT
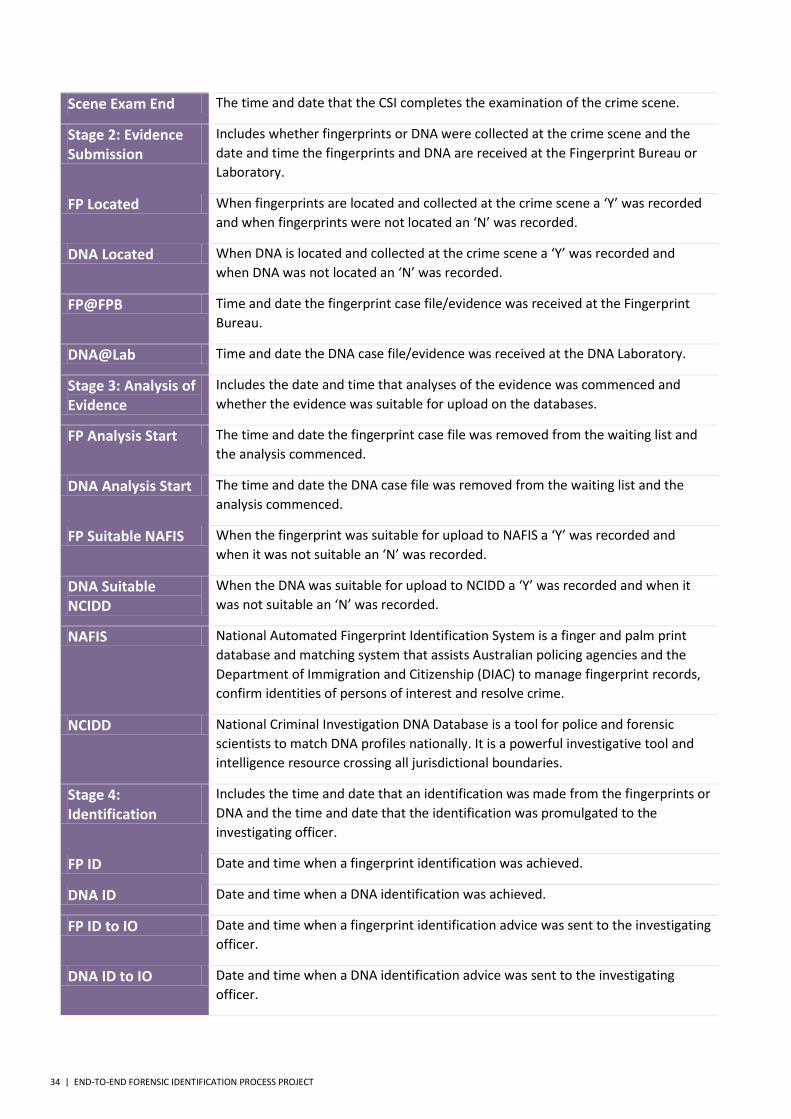
Scene Exam End The time and date that the CSI completes the examination of the crime scene.
Stage 2: Evidence Submission
Includes whether fingerprints or DNA were collected at the crime scene and the
date and time the fingerprints and DNA are received at the Fingerprint Bureau or
Laboratory.
FP Located When fingerprints are located and collected at the crime scene a ‘Y’ was recorded
and when fingerprints were not located an ‘N’ was recorded.
DNA Located When DNA is located and collected at the crime scene a ‘Y’ was recorded and
when DNA was not located an ‘N’ was recorded.
FP@FPB Time and date the fingerprint case file/evidence was received at the Fingerprint
Bureau.
DNA@Lab Time and date the DNA case file/evidence was received at the DNA Laboratory.
Stage 3: Analysis of Evidence
Includes the date and time that analyses of the evidence was commenced and
whether the evidence was suitable for upload on the databases.
FP Analysis Start The time and date the fingerprint case file was removed from the waiting list and
the analysis commenced.
DNA Analysis Start The time and date the DNA case file was removed from the waiting list and the
analysis commenced.
FP Suitable NAFIS When the fingerprint was suitable for upload to NAFIS a ‘Y’ was recorded and
when it was not suitable an ‘N’ was recorded.
DNA Suitable NCIDD
When the DNA was suitable for upload to NCIDD a ‘Y’ was recorded and when it
was not suitable an ‘N’ was recorded.
NAFIS National Automated Fingerprint Identification System is a finger and palm print
database and matching system that assists Australian policing agencies and the
Department of Immigration and Citizenship (DIAC) to manage fingerprint records,
confirm identities of persons of interest and resolve crime.
NCIDD National Criminal Investigation DNA Database is a tool for police and forensic
scientists to match DNA profiles nationally. It is a powerful investigative tool and
intelligence resource crossing all jurisdictional boundaries.
Stage 4: Identification
Includes the time and date that an identification was made from the fingerprints or
DNA and the time and date that the identification was promulgated to the
investigating officer.
FP ID Date and time when a fingerprint identification was achieved.
DNA ID Date and time when a DNA identification was achieved.
FP ID to IO Date and time when a fingerprint identification advice was sent to the investigating
officer.
DNA ID to IO Date and time when a DNA identification advice was sent to the investigating
officer.
END-TO-END FORENSIC IDENTIFICATION PROCESS PROJECT | 35
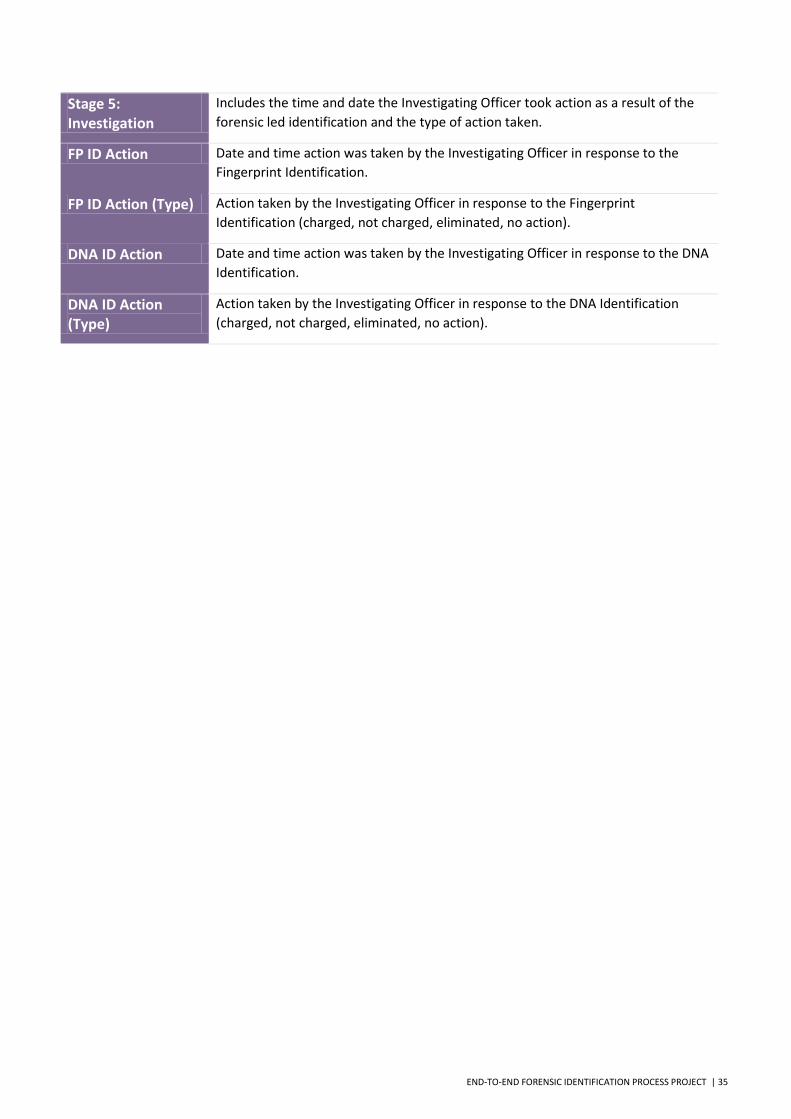
Stage 5: Investigation
Includes the time and date the Investigating Officer took action as a result of the
forensic led identification and the type of action taken.
FP ID Action Date and time action was taken by the Investigating Officer in response to the
Fingerprint Identification.
FP ID Action (Type) Action taken by the Investigating Officer in response to the Fingerprint
Identification (charged, not charged, eliminated, no action).
DNA ID Action Date and time action was taken by the Investigating Officer in response to the DNA
Identification.
DNA ID Action (Type)
Action taken by the Investigating Officer in response to the DNA Identification
(charged, not charged, eliminated, no action).
36 | END-TO-END FORENSIC IDENTIFICATION PROCESS PROJECT
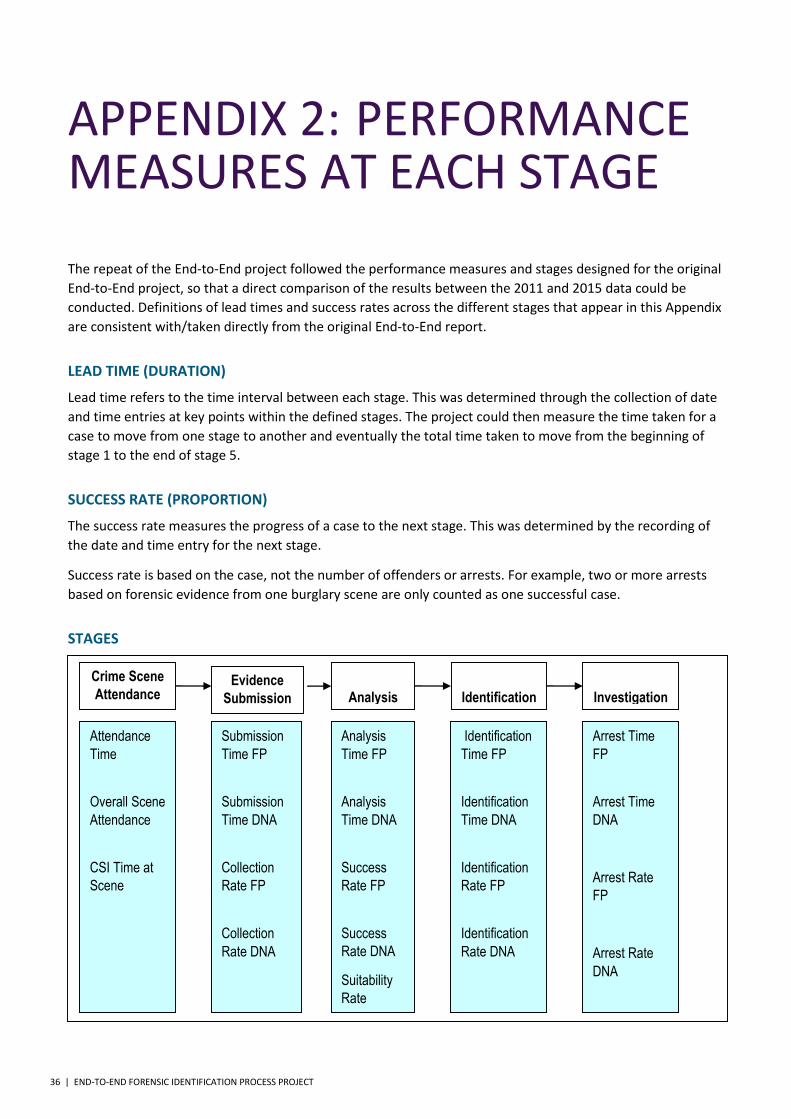
APPENDIX 2: PERFORMANCE MEASURES AT EACH STAGE
The repeat of the End-to-End project followed the performance measures and stages designed for the original
End-to-End project, so that a direct comparison of the results between the 2011 and 2015 data could be
conducted. Definitions of lead times and success rates across the different stages that appear in this Appendix
are consistent with/taken directly from the original End-to-End report.
LEAD TIME (DURATION)
Lead time refers to the time interval between each stage. This was determined through the collection of date
and time entries at key points within the defined stages. The project could then measure the time taken for a
case to move from one stage to another and eventually the total time taken to move from the beginning of
stage 1 to the end of stage 5.
SUCCESS RATE (PROPORTION)
The success rate measures the progress of a case to the next stage. This was determined by the recording of
the date and time entry for the next stage.
Success rate is based on the case, not the number of offenders or arrests. For example, two or more arrests
based on forensic evidence from one burglary scene are only counted as one successful case.
STAGES
Crime Scene
Attendance Evidence
Submission
Identification
Investigation
Attendance
Time
Overall Scene
Attendance
CSI Time at
Scene
Submission
Time FP
Submission
Time DNA
Collection
Rate FP
Collection
Rate DNA
Identification
Time FP
Identification
Time DNA
Identification
Rate FP
Identification
Rate DNA
Arrest Time
FP
Arrest Time
DNA
Arrest Rate
FP
Arrest Rate
DNA
Analysis
Analysis
Time FP
Analysis
Time DNA
Success
Rate FP
Success
Rate DNA
Suitability
Rate
END-TO-END FORENSIC IDENTIFICATION PROCESS PROJECT | 37
STAGE 1: CRIME SCENE ATTENDANCE
This stage relates to the response by police personnel to the crime scene.
Stage 1 data relates to the time when a crime was reported, the crime scene examination start time and the
crime scene examination end time. From this data the following three measures were determined.
ATTENDANCE TIME
The time lapse between the report of the crime and scene attendance by CSI.
The purpose of this measure is to determine the typical lag time between the victim reporting the crime to
the police and CSI attending.
OVERALL SCENE ATTENDANCE
The proportion of scenes attended by CSI.
Police jurisdictions have differing policy in regard to responding to volume crime. It is not always deemed
practical or feasible to attend all scenes, however the goal of 100% scene assessment is desirable and was a
recommendation arising from the E2E1 report for improved use of resources.
CSI TIME AT THE SCENE
The time spent at a scene by CSI.
This measure determines the time required at a crime scene for the most efficient and effective collection of
evidence that maximises success rates through all stages of the process. Good quality evidence collection is
required to ensure successful analysis, identification and investigation.
STAGE 2: EVIDENCE SUBMISSION
From stage 2 onwards, the data is separated into fingerprint evidence and DNA evidence. This stage contains
data identifying the collection of DNA and/or fingerprints and the date/time entry for submission to the DNA
laboratory or fingerprint bureau.
SUBMISSION LEAD TIME
The time lapse between the fingerprint and DNA evidence being collected at the scene and the time it is
submitted to the DNA laboratory or fingerprint bureau.
The date/time entry relates to the time the laboratory or bureau records the case as having been received, as
opposed to the time when the CSI may send the evidence. There may be a lag time in relation to the
submission, but this lag time is not calculated separately as it is included in the time that the CSI has control of
the evidence.
COLLECTION RATE
The proportion of scenes attended from which fingerprints or DNA are collected and subsequently submitted
for analysis.
STAGE 3: ANALYSIS OF EVIDENCE
Stage 3 includes the date and time that analysis of the evidence was commenced and whether the evidence
was suitable for upload on the NAFIS or NCIDD.
38 | END-TO-END FORENSIC IDENTIFICATION PROCESS PROJECT
Both databases have a national standard for upload, which provides the project with a perspective on the
suitability of the evidence for analysis. However, each jurisdiction can analyse and conduct comparisons with
internal databases or records, outside of the requirements for NAFIS and NCIDD. Therefore identification may
still occur even if the evidence is not suitable for upload according to the national standard.
ANALYSIS LEAD TIME
The time lapse between the time the case file was received for analysis and the time the analysis was
commenced.
In some jurisdictions the time the case file was received for analysis, is also considered the time the analysis
was commenced.
ANALYSIS RATE
The proportion of cases containing evidence that was analysed.
SUITABILITY RATE
The proportion of cases containing evidence of a standard suitable for upload to a national database.
STAGE 4: IDENTIFICATION
Stage 4 relates to the identification of a suspect from the evidence analysed. The identification might occur as
a result of a search on the national database, or it may result from a direct comparison between the evidence
and a suspect.
Stage 4 contains two date/time entries: one referring to the date/time when the identification was made; and
the second referring to date/time when the identification was forwarded to the investigating officer (IO). The
purpose of the two entries was to allow for an evaluation of the time lapse between the achievement of
identification and the transmission of that information for investigation.
IDENTIFICATION LEAD TIME
The time lapse between the analysis commencing and the time identification is achieved.
IDENTIFICATION RATE
The proportion of cases that were analysed and resulted in at least one identification.
STAGE 5: INVESTIGATION
Stage 5 relates to the investigation of a case file pertinent to the identification of a suspect through the
forensic process. It is acknowledged that a suspect may be arrested prior to the commencement or
completion of the forensic analysis as a result of normal investigative procedures, or as a result of witness
involvement. Furthermore, unlike the other stages, an investigator has to physically locate the suspect to take
action that is recorded in this stage.
A large range of actions could be taken against a person identified through the forensic process. In some cases
a person identified through the forensic process can ultimately be eliminated from the investigation as they
may be the victim or complainant with legitimate reasons for their fingerprints or DNA being at the scene.
Only data indicating the arrest of a suspect subsequent to the identification was included in this analysis.

END-TO-END FORENSIC IDENTIFICATION PROCESS PROJECT | 39
ARREST LEAD TIME
Time lapse between the time the identification was achieved and the time the nominated suspect was
arrested or charged.
ARREST RATE
The proportion of cases where identification is achieved and the nominated suspect was arrested or charged.
STAGE 1 – STAGE 5: END-TO-END PERFORMANCE
Analysis has also been carried out on the overall performance from the report of the crime to the arrest of the
suspect as opposed to the stage-by-stage analysis. This is represented in the overall forensic performance
section of the Findings.
40 | END-TO-END FORENSIC IDENTIFICATION PROCESS PROJECT
APPENDIX 3: DATA COLLECTION, QUALITY & DESCRIPTIVE STATISTICS DATA COLLECTION
Date collection and analysis was consistent with the approach adopted in the original End-to-End project.
Cases were recorded across an Excel spread-sheet requiring date/time entries (dd/mm/yyyy h:min) and
information on the success or otherwise of the progress of the case regarding fingerprint and DNA evidence.
The data collection period for E2E phase 2 was between May and 30 September 2015.
Each case was identified through a unique case identifier applied by each jurisdiction. This was later converted
to a Project Case ID for the purposes of ensuring the anonymity of each case. Jurisdictional performance is de-
identified (e.g. A, B, C etc)
The data collection in some jurisdictions was still manually intensive with little alignment between police and
forensic data management systems. The organisations that were better able to manage the data collection
primarily utilised a forensic case management system networked to a police management system.
DATA QUALITY
There are limitations around the data collected and the methodology applied. For example, the data collected
is only across a five month window and from sites nominated by jurisdictions as opposed to being selected by
the project team.
For some jurisdictions the data collection window fell outside of timeframes for organisational review/service
delivery enhancement changes which means that for some agencies this data may be outdated where as for
other jurisdictions it still reflects current practice.
The category of ‘forensic evidence’ reflects combining fingerprint and DNA information where available for
the same case. This may be less than the individual totals for fingerprint or DNA information on their own.
Where necessary, comments were added to each stage to explain any anomalies or deviations from the
project requirements and to identify at which stage the case was finalised.
DESCRIPTIVE STATISTICS
Success rates at each stage and lead times between stages were summarised for each:
site
jurisdiction (aggregating across forensic sites for that State or Territory)
location (aggregating across all regional sites and across all metropolitan sites)
overall/national (aggregating across all 17 sites).

END-TO-END FORENSIC IDENTIFICATION PROCESS PROJECT | 41
The precision in the estimates of success rates was measured by 95% confidence intervals for proportions.
Due to the attrition of fingerprint and DNA cases across the different stages, the precision of the estimates is
greater in the earlier stages than in the later stages where the sample size decreases.
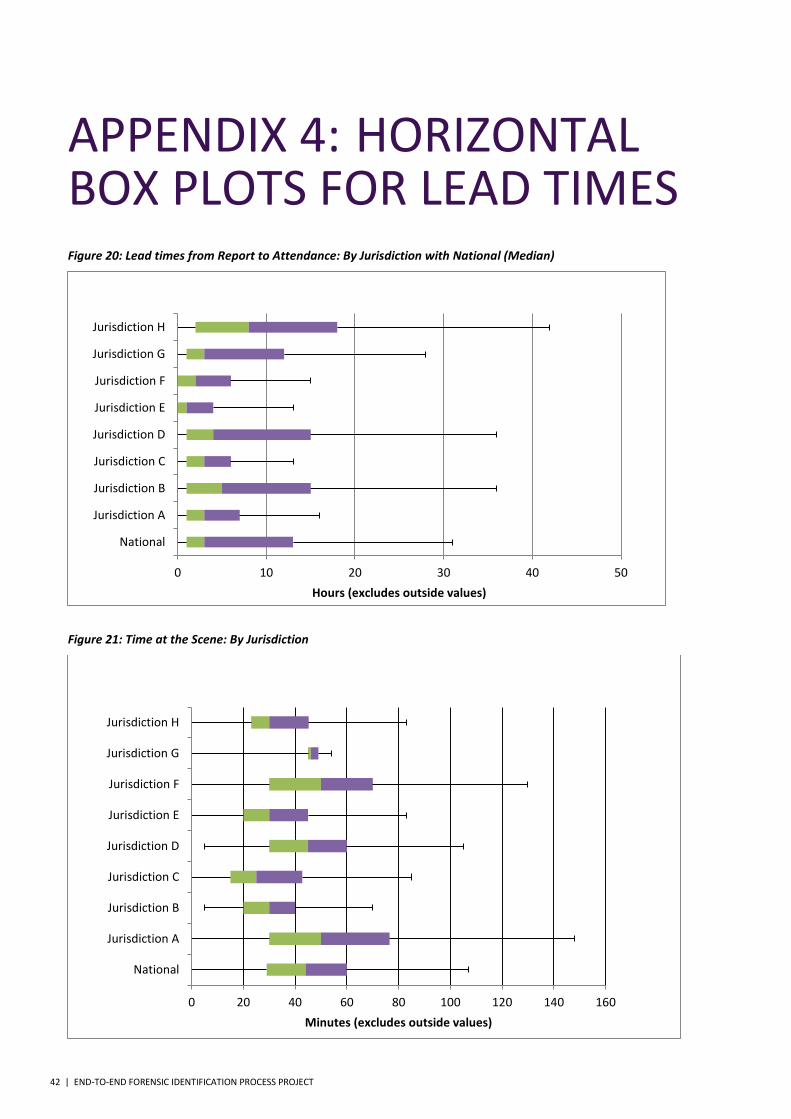
The lead time data follow skewed distributions and are therefore summarised using medians (50th percentile)
rather than means. Lead times are illustrated with box and whisker plots (Appendix 4). The boxes show the
25th, 50th and 75th percentiles and the whiskers show the range (excluding outliers).
42 | END-TO-END FORENSIC IDENTIFICATION PROCESS PROJECT
APPENDIX 4: HORIZONTAL BOX PLOTS FOR LEAD TIMES Figure 20: Lead times from Report to Attendance: By Jurisdiction with National (Median)
Figure 21: Time at the Scene: By Jurisdiction
0 10 20 30 40 50
National
Jurisdiction A
Jurisdiction B
Jurisdiction C
Jurisdiction D
Jurisdiction E
Jurisdiction F
Jurisdiction G
Jurisdiction H
Hours (excludes outside values)
0 20 40 60 80 100 120 140 160
National
Jurisdiction A
Jurisdiction B
Jurisdiction C
Jurisdiction D
Jurisdiction E
Jurisdiction F
Jurisdiction G
Jurisdiction H
Minutes (excludes outside values)
END-TO-END FORENSIC IDENTIFICATION PROCESS PROJECT | 43
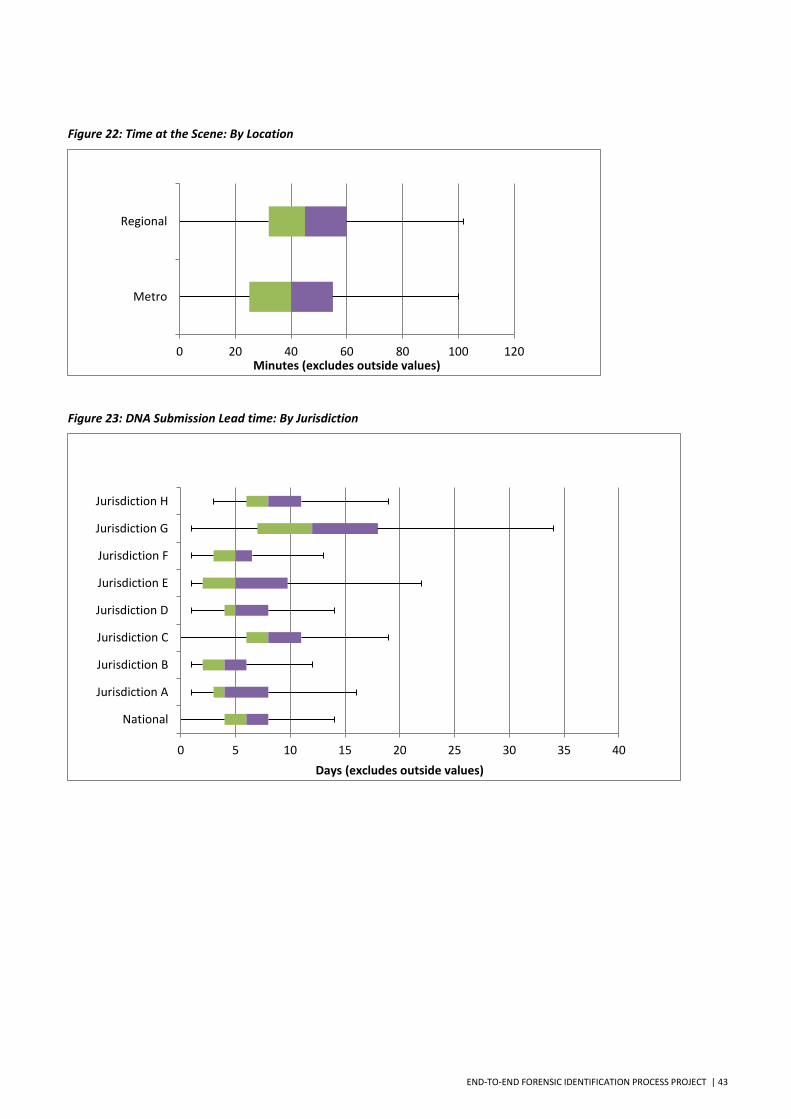
Figure 22: Time at the Scene: By Location
Figure 23: DNA Submission Lead time: By Jurisdiction
0 20 40 60 80 100 120
Metro
Regional
Minutes (excludes outside values)
0 5 10 15 20 25 30 35 40
National
Jurisdiction A
Jurisdiction B
Jurisdiction C
Jurisdiction D
Jurisdiction E
Jurisdiction F
Jurisdiction G
Jurisdiction H
Days (excludes outside values)

44 | END-TO-END FORENSIC IDENTIFICATION PROCESS PROJECT
Figure 24: DNA Submission Lead time: By Location
Figure 25: Fingerprint Analysis Lead time: By Jurisdiction with National (Median)
0 10 20 30 40
Metro
Country
Days (excludes outside values)
0 20 40 60 80 100
National
Jurisdiction A
Jurisdiction B
Jurisdiction C
Jurisdiction D
Jurisdiction E
Jurisdiction F
Jurisdiction G
Jurisdiction H
Days (excludes outside values)
END-TO-END FORENSIC IDENTIFICATION PROCESS PROJECT | 45
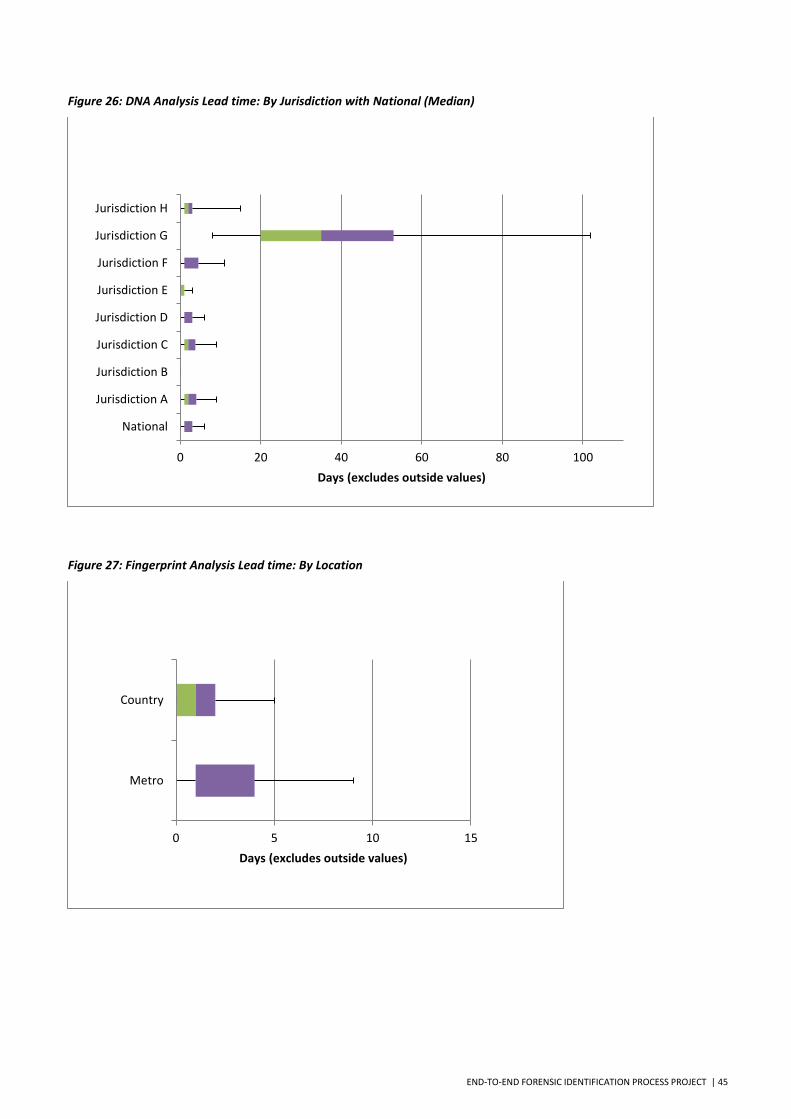
Figure 26: DNA Analysis Lead time: By Jurisdiction with National (Median)
Figure 27: Fingerprint Analysis Lead time: By Location
0 20 40 60 80 100
National
Jurisdiction A
Jurisdiction B
Jurisdiction C
Jurisdiction D
Jurisdiction E
Jurisdiction F
Jurisdiction G
Jurisdiction H
Days (excludes outside values)
0 5 10 15
Metro
Country
Days (excludes outside values)
46 | END-TO-END FORENSIC IDENTIFICATION PROCESS PROJECT
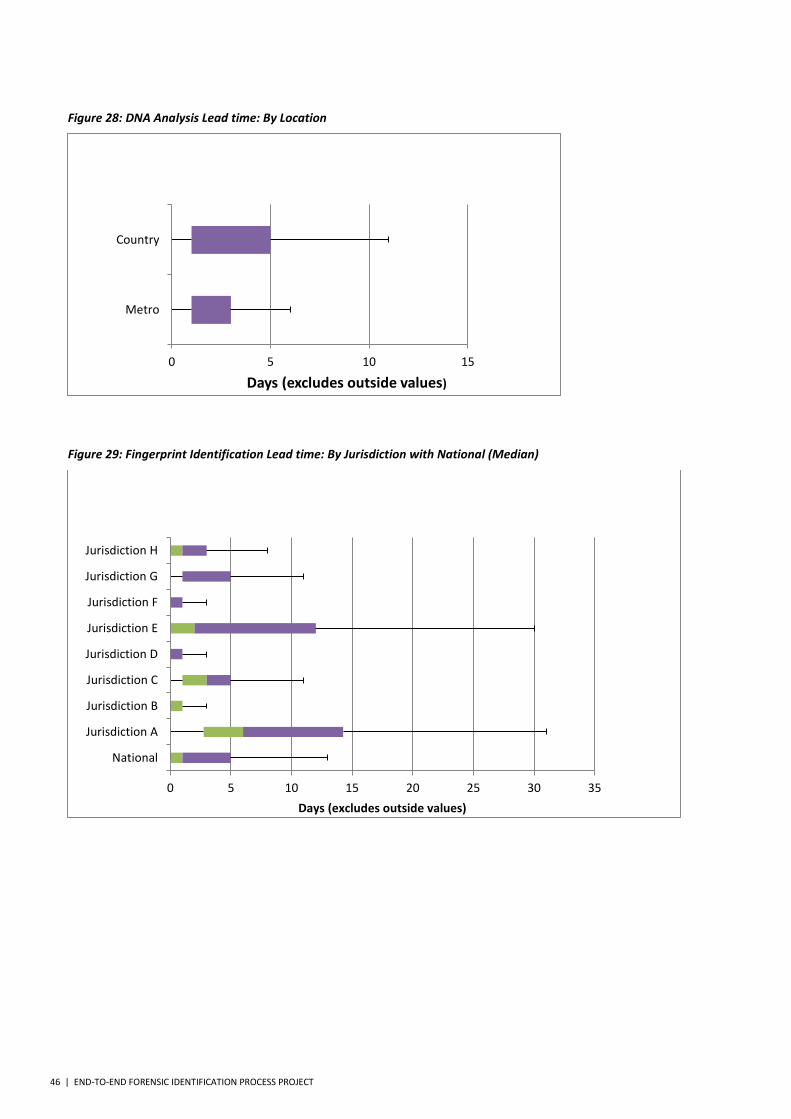
Figure 28: DNA Analysis Lead time: By Location
Figure 29: Fingerprint Identification Lead time: By Jurisdiction with National (Median)
0 5 10 15
Metro
Country
Days (excludes outside values)
0 5 10 15 20 25 30 35
National
Jurisdiction A
Jurisdiction B
Jurisdiction C
Jurisdiction D
Jurisdiction E
Jurisdiction F
Jurisdiction G
Jurisdiction H
Days (excludes outside values)
END-TO-END FORENSIC IDENTIFICATION PROCESS PROJECT | 47
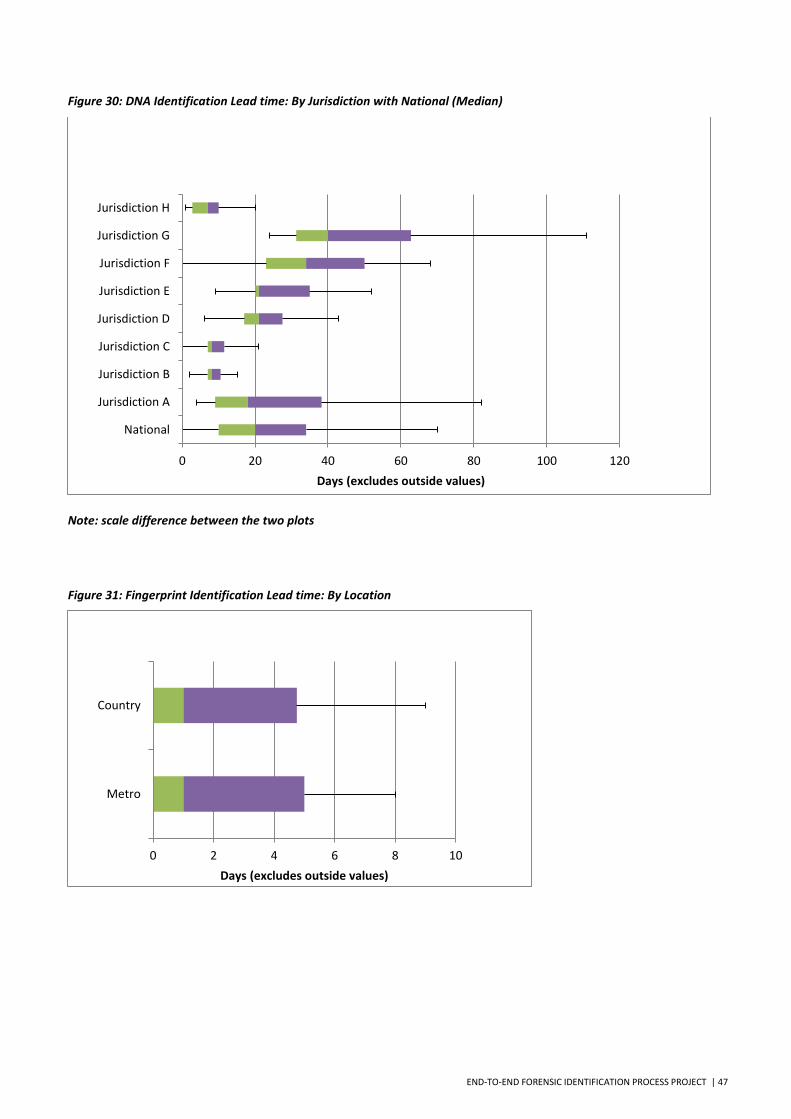
Figure 30: DNA Identification Lead time: By Jurisdiction with National (Median)
Note: scale difference between the two plots
Figure 31: Fingerprint Identification Lead time: By Location
0 20 40 60 80 100 120
National
Jurisdiction A
Jurisdiction B
Jurisdiction C
Jurisdiction D
Jurisdiction E
Jurisdiction F
Jurisdiction G
Jurisdiction H
Days (excludes outside values)
0 2 4 6 8 10
Metro
Country
Days (excludes outside values)
48 | END-TO-END FORENSIC IDENTIFICATION PROCESS PROJECT
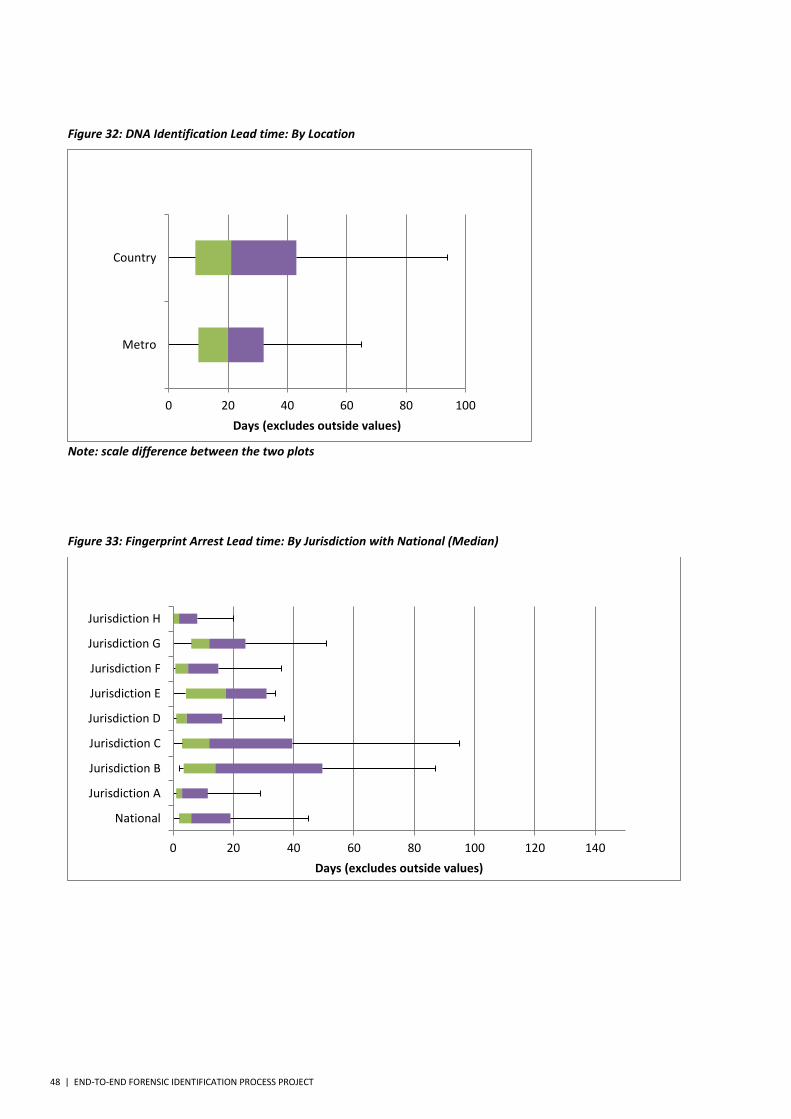
Figure 32: DNA Identification Lead time: By Location
Note: scale difference between the two plots
Figure 33: Fingerprint Arrest Lead time: By Jurisdiction with National (Median)
0 20 40 60 80 100
Metro
Country
Days (excludes outside values)
0 20 40 60 80 100 120 140
National
Jurisdiction A
Jurisdiction B
Jurisdiction C
Jurisdiction D
Jurisdiction E
Jurisdiction F
Jurisdiction G
Jurisdiction H
Days (excludes outside values)
END-TO-END FORENSIC IDENTIFICATION PROCESS PROJECT | 49
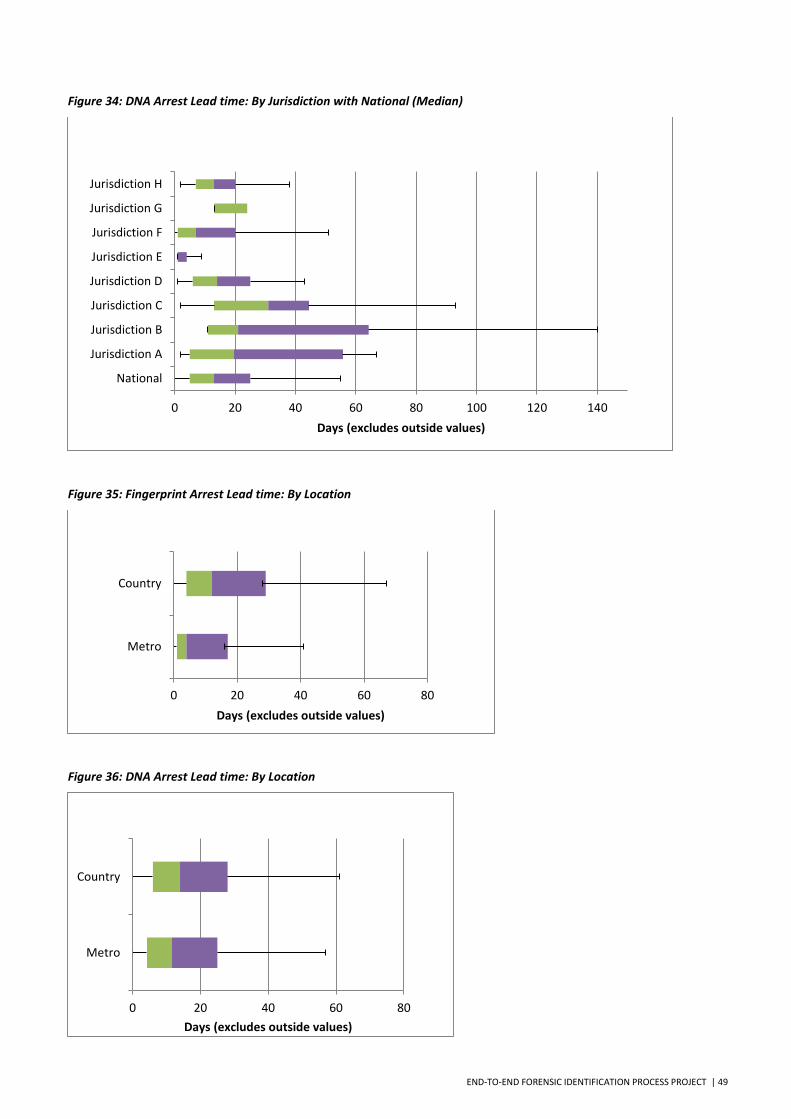
Figure 34: DNA Arrest Lead time: By Jurisdiction with National (Median)
Figure 35: Fingerprint Arrest Lead time: By Location
Figure 36: DNA Arrest Lead time: By Location
0 20 40 60 80 100 120 140
National
Jurisdiction A
Jurisdiction B
Jurisdiction C
Jurisdiction D
Jurisdiction E
Jurisdiction F
Jurisdiction G
Jurisdiction H
Days (excludes outside values)
0 20 40 60 80
Metro
Country
Days (excludes outside values)
0 20 40 60 80
Metro
Country
Days (excludes outside values)

50 | END-TO-END FORENSIC IDENTIFICATION PROCESS PROJECT
REFERENCES
1. END-TO-END FORENSIC IDENTIFICATION PROCESS PROJECT, VOLUME CRIME REPORT, MAY 2012, ANZPAA NIFS. DOI: HTTP://WWW.ANZPAA.ORG.AU/FORENSIC-SCIENCE/OUR-WORK/PRODUCTS/PUBLICATIONS


Level 6, Tower 3, World Trade Centre 637 Flinders Street, Docklands Victoria 3008 DX 210096 Melbourne
T +61 3 9628 7211 F +61 3 9628 7253 E [email protected]
www.nifs.org.au


