digitales archivZBW – Leibniz-Informationszentrum WirtschaftZBW – Leibniz Information Centre for Economics
Other participants: Komlósi, László Imre; Kelle, Péter; Djukec, Damira
BookEconomic and social development : 58th International ScientificConference on Economic and Social Development : book ofproceedings : Budapest, 04-05 September, 2020
Provided in Cooperation with:Varazdin Development and Entrepreneurship Agency
This Version is available at:http://hdl.handle.net/11159/4696
Kontakt/ContactZBW – Leibniz-Informationszentrum Wirtschaft/Leibniz Information Centre for EconomicsDüsternbrooker Weg 12024105 Kiel (Germany)E-Mail: [email protected]://www.zbw.eu/econis-archiv/
Standard-Nutzungsbedingungen:Dieses Dokument darf zu eigenen wissenschaftlichen Zweckenund zum Privatgebrauch gespeichert und kopiert werden. Siedürfen dieses Dokument nicht für öffentliche oder kommerzielleZwecke vervielfältigen, öffentlich ausstellen, aufführen, vertreibenoder anderweitig nutzen. Sofern für das Dokument eine Open-Content-Lizenz verwendet wurde, so gelten abweichend von diesenNutzungsbedingungen die in der Lizenz gewährten Nutzungsrechte.
Terms of use:This document may be saved and copied for your personaland scholarly purposes. You are not to copy it for public orcommercial purposes, to exhibit the document in public, toperform, distribute or otherwise use the document in public. Ifthe document is made available under a Creative CommonsLicence you may exercise further usage rights as specified inthe licence.
zbw Leibniz-Informationszentrum WirtschaftLeibniz Information Centre for Economics
Varazdin Development and Entrepreneurship Agency and University North
in cooperation with Faculty of Management University of Warsaw
Faculty of Law, Economics and Social Sciences Sale - Mohammed V University in Rabat Polytechnic of Medimurje in Cakovec
Szechenyi Istvan University
Economic and Social Development
58th International Scientific Conference on Economic and Social Development Development
Book of Proceedings
Editors:
Laszlo Komlosi, Peter Kelle, Damira Djukec
Budapest, 04-05 September, 2020
Varazdin Development and Entrepreneurship Agency and University North in cooperation with
Faculty of Management University of Warsaw Faculty of Law, Economics and Social Sciences Sale - Mohammed V University in Rabat
Polytechnic of Medimurje in Cakovec Szechenyi Istvan University
Editors: Laszlo Komlosi, Szechenyi Istvan University, Hungary
Peter Kelle, Lousiana State University, USA Damira Djukec, Medjimursko Veleuciliste, Croatia
Economic and Social Development 58th International Scientific Conference on Economic and Social Development Development
Book of Proceedings
Budapest, 04-05 September, 2020
Title ◼ Economic and Social Development (Book of Proceedings), 58th International Scientific Conference on Economic and Social
Development Development
Editors ◼ Laszlo Komlosi, Peter Kelle, Damira Djukec
Scientific Committee / Programski Odbor ◼ Marijan Cingula (President), University of Zagreb, Croatia; Sannur Aliyev, Azerbaijan State
University of Economics, Azerbaijan; Ayuba A. Aminu, University of Maiduguri, Nigeria; Anona Armstrong, Victoria University, Australia;
Gouri Sankar Bandyopadhyay, The University of Burdwan, Rajbati Bardhaman, India; Haimanti Banerji, Indian Institute of Technology,
Kharagpur, India; Victor Beker, University of Buenos Aires, Argentina; Asmae Benthami, Mohammed V University, Morocco; Alla Bobyleva,
The Lomonosov Moscow State University, Russia; Leonid K. Bobrov, State University of Economics and Management, Novosibirsk, Russia;
Rado Bohinc, University of Ljubljana, Slovenia; Adnan Celik, Selcuk University, Konya, Turkey; Angelo Maia Cister, Federal Un iversity of
Rio de Janeiro, Brasil; Mirela Cristea, University of Craiova, Romania; Taoufik Daghri, Mohammed V University, Morocco; Oguz Demir,
Istanbul Commerce University, Turkey; T.S. Devaraja, University of Mysore, India; Onur Dogan, Dokuz Eylul University, Turkey; Darko
Dukic, University of Osijek, Croatia; Gordana Dukic, University of Osijek, Croatia; Alba Dumi, Vlora University, Vlore, Albania; Gal ina
Pavlovna Gagarinskaya, Samara State University, Russia; Mirjana Gligoric, Faculty of Economics - Belgrade University, Serbia; Maria Jose
Angelico Goncalves, Porto Accounting and Business School - P.Porto, Portugal; Mehmet Emre Gorgulu, Afyon Kocatepe University, Turkey;
Klodiana Gorica, University of Tirana, Albania; Aleksandra Grobelna, Gdynia Maritime University, Poland; Liudmila Guzikova, Peter the
Great Saint-Petersburg Polytechnic University, Russia; Anica Hunjet, University North, Koprivnica, Croatia; Khalid Hammes, Mohammed V
University, Morocco; Oxana Ivanova, Ulyanovsk State University, Ulyanovsk, Russia; Irena Jankovic, Faculty of Economics, Belgrade
University, Serbia; Myrl Jones, Radford University, USA; Hacer Simay Karaalp, Pamukkale University, urkey; Dafna Kariv, The College of
Management Academic Studies, Rishon Le Zion, Israel; Hilal Yildirir Keser, Uludag Universi ty, Bursa, Turkey; Sophia Khalimova, Institute
of Economics and Industrial Engineering of Siberian Branch of Russian Academy of Science, Novosibirsk, Russia; Marina Klacmer Calopa,
University of Zagreb, Croatia; Igor Klopotan, Medjimursko Veleuciliste u Cakovcu, Croatia; Vladimir Kovsca, University of Zagreb, Croatia;
Goran Kozina, University North, Koprivnica, Croatia; Dzenan Kulovic, Univeristy of Zenica, Bosnia and Herzegovina; Robert Lewis, Les
Roches Gruyere University of Applied Sciences, Bulle, Switzerland; Ladislav Lukas, Univ. of West Bohemia, Faculty of Economics, Czech
Republic; Mustapha Machrafi, Mohammed V University, Morocco; Joao Jose Lourenco Marques, University of Aveiro, Portugal; Pasc al
Marty, University of La Rochelle, France; Vaidotas Matutis, Vilnius University, Lithuania; Daniel Francois Meyer, North West University,
South Africa; Marin Milkovic, University North, Koprivnica, Croatia; Abdelhamid Nechad, Abdelmalek Essaadi University, Morocco; Gratiela
Georgiana Noja, West University of Timisoara, Romania; Zsuzsanna Novak, Corvinus University of Budapest, Hungary; Tomasz Ochinowski,
University of Warsaw, Poland; Barbara Herceg Paksic, University of Osijek, Croatia; Vera Palea, Universita degli Studi di Tor ino, Italy; Dusko
Pavlovic, Libertas International University, Zagreb, Croatia; Igor Pihir, University of Zagreb, Croatia; Dmitri Pletnev, Chelyabinsk State
University, Russian Federation; Miroslaw Przygoda, University of Warsaw, Poland; Karlis Purmalis, University of Latvia, Latvi a; Nicholas
Recker, Metropolitan State University of Denver, USA; Kerry Redican, Virginia Tech, Blacksburg, USA; Humberto Ribeiro, Univer sity of
Aveiro, Portugal; Robert Rybnicek, University of Graz, Austria; Elzbieta Szymanska, Bialystok University of Technology , Poland; Katarzyna
Szymanska, The State Higher School of Vocational Education in Ciechanow, Poland; Ilaria Tutore, University of Naples Parthenope, Italy;
Sandra Raquel Alves, Polytechnic of Leiria, Portugal; Joanna Stawska, University of Lodz, Poland; Ilko Vrankic, University of Zagreb, Croatia;
Stanislaw Walukiewicz, Bialystok University of Technology, Poland; Thomas Will, Agnes Scott College, USA; Li Yongqiang, Victo ria
University, Australia; Peter Zabielskis, University of Macau, China; Silvija Zeman, Medjimursko Veleuciliste u Cakovcu, Croatia; Tao Zeng,
Wilfrid Laurier University, Waterloo, Canada; Snezana Zivkovic, University of Nis, Serbia.
Review Committee / Recenzentski Odbor ◼ Marina Klacmer Calopa (President); Ana Aleksic; Sandra Raquel Alves; Ayuba Aminu; Mihovil
Andjelinovic; Josip Arneric; Lidija Bagaric; Tomislav Bakovic; Sanja Blazevic; Leonid Bobrov; Ruzica Brecic; Anita Ceh Casni; Iryna
Chernysh; Mirela Cristea; Oguz Demir; Stjepan Dvorski; Robert Fabac; Ivica Filipovic; Sinisa Franjic; Fran Galetic; Mirjana Gligoric;
Tomislav Globan; Anita Goltnik Urnaut; Tomislav Herceg; Irena Jankovic; Emina Jerkovic; Dafna Kariv; Oliver Kesar; Hilal Yild irir Keser;
Martina Dragija Kostic; Tatjana Kovac; Vladimir Kovsca; Angelo Maia Cister; Katarina Marosevic; Vaidotas Matutis; Marjana Merkac Skok;
Daniel Francois Meyer; Natanya Meyer; Josip Mikulic; Ljubica Milanovic Glavan; Guenter Mueller; Ivana Nacinovic Braje; Zlatko Nedelko;
Gratiela Georgiana Noja; Zsuzsanna Novak; Alka Obadic; Claudia Ogrean; Igor Pihir; Najla Podrug; Vojko Potocan; Dinko Primorac; Zeljka
Primorac; Sanda Renko; Humberto Ribeiro; Vlasta Roska; Souhaila Said; Armando Javier Sanchez Diaz; Tomislav Sekur; Lorena Sku flic;
Mirko Smoljic; Petar Soric; Mario Spremic; Matjaz Stor; Tomasz Studzieniecki; Lejla Tijanic; Daniel Tomic; Boris Tusek; Rebeka Daniela
Vlahov; Ilko Vrankic; Thomas Will; Zoran Wittine; Tao Zeng; Grzegorz Zimon; Snezana Zivkovic; Berislav Zmuk .
Organizing Committee / Organizacijski Odbor ◼ Domagoj Cingula (President); Djani Bunja; Marina Klacmer Calopa; Spomenko Kesina;
Erlino Koscak; Tomasz Ochinowski; Miroslaw Przygoda; Michael Stefulj; Rebeka Danijela Vlahov; Sime Vucetic.
Publishing Editor ◼ Spomenko Kesina, Mario Vrazic, Domagoj Cingula
Publisher ◼ Design ◼ Print ◼ Varazdin Development and Entrepreneurship Agency, Varazdin, Croatia / University North, Koprivnica,
Croatia / Faculty of Management University of Warsaw, Warsaw, Poland / Faculty of Law, Economics and Social Sciences Sale - Mohammed
V University in Rabat, Morocco / Polytechnic of Medimurje in Cakovec, Cakovec, Croatia / Szechenyi Istvan University, Gyor, Hungary
Printing ◼ Online Edition
ISSN 1849-7535
The Book is open access and double-blind peer reviewed.
Our past Books are indexed and abstracted by ProQuest, EconBIZ, CPCI (Web of Science) and EconLit databases and available for download
in a PDF format from the Economic and Social Development Conference website: http://www.esd-conference.com
© 2020 Varazdin Development and Entrepreneurship Agency, Varazdin, Croatia; University North, Koprivnica, Croatia; Faculty of
Management University of Warsaw, Warsaw, Poland; Faculty of Law, Economics and Social Sciences Sale - Mohammed V University
in Rabat, Morocco; Polytechnic of Medimurje in Cakovec, Cakovec, Croatia; Szechenyi Istvan University, Gyor, Hungary. All rights
reserved. Authors are responsible for the linguistic and technical accuracy of their contributions. Authors keep their copyrights for further
publishing.
CONTENTS
THE FUNCTIONS OF THE BULGARIAN PROSECUTOR`S OFFICE TO
GUARANTEE COMPLIANCE WITH THE LAW DURING INVESTIGATIONS ........1
Venelin Terziev, Marin Georgiev, Stefаn Bankov
INTERNET MARKETING COMMUNICATION CHALLENGES - OPINIONS OF
CROATIAN CUSTOMERS AND MARKETING AGENCIES .........................................6 Petra Odeljan, Iva Gregurec
SMART AGRICULTURE AND ERP BENEFITS IN THE CONTEXT OF DIGITAL
TRANSFORMATION ....................................................................................................... 21 Ana Kutnjak, Igor Pihir, Katarina Tomicic-Pupek
RESEARCH ON THE FINANCIAL LITERACY ON CAPITAL MARKET AMONG
STUDENTS......................................................................................................................... 34
Karlo Strahija, Marina Klacmer Calopa, Ivana Dundek Kokotec
THE BANK INSOLVENCY: FROM LEHMAN BROTHERS TO COVID-19
(INTERNATIONAL REMARKS AND NATIONAL PECULIARITIES) ...................... 44 Andrey Zahariev, Stoyan Prodanov, Anelya Radulova, Galina Zaharieva, Maryana Pavlova-
Banova, Petko Angelov, Taner Ismailov, Aleksandrina Aleksandrova, Kristi Marinova
THE INFLUENCE OF COVID-19 ON TOURISM – THE CASE OF THE ISLAND OF
HVAR.................................................................................................................................. 60 Fran Galetic
LABOR PRODUCTIVITY IN THE COMPLEX INTERPLAY BETWEEN HEALTH
AND WELL-BEING OF OLDER EMPLOYEES: A FOCUS ON THE NEW
EUROPEAN UNION MEMBER STATES UNDER THE COVID-19 PANDEMIC
CRISIS ................................................................................................................................ 69
Mirela Cristea, Gratiela Georgiana Noja, Constantin Stefan Ponea, Ioana Banaduc
ERP SYSTEMS IN THE CONTEXT OF SMART FACTORIES ................................... 79
Larisa Hrustek, Neven Vrcek, Martina Tomicic Furjan
ON THE DETERMINANTS OF THE TUNISIAN ECONOMIC GROWTH RATE:
EVIDENCE FROM A MSI-VAR MODEL ....................................................................... 89 Knani Ramzi
CYBERCRIME AND PROTECTION OF BUSINESS INFORMATION IN TOURISM
INDUSTRY- CROATIAN PERSPECTIVE ...................................................................... 98 Vlatka Ruzic, Dario Matika
THE RELATIONSHIP BETWEEN UNIVERSITY-INDUSTRY CO-PUBLICATION
OUTPUTS ......................................................................................................................... 109
Zsolt Kohus, Zoltan Baracskai, Katalin Czako
A REVIEW OF BIG DATA FOR THE SUSTAINABILITY OF AGRI-FOOD SUPPLY
CHAINS ............................................................................................................................ 123 Abderahman Rejeb
BLACK BOX OF CSR: LITERATURE REVIEW ........................................................ 135 Loma Mashne, Zoltan Baracskai
DEPLOYING LEAN TRANSFORMATION IN SERVICES: AN ENTERPRISE-LEVEL
CONCEPTUAL FRAMEWORK .................................................................................... 148
Padmaka Mirihagalla
AGGREGATION METHODS INFLUENCE THE EMPLOYEE PERFORMANCE
RANKING LIST............................................................................................................... 163 Peter Horvath, Andrea Bencsik
ICE-HOCKEY AS A POTENTIAL IMPROVEMENT OF EMOTIONAL
INTELLIGENCE AND RESILIENCE: INCREASING PSYCHOLOGICAL CAPITAL
........................................................................................................................................... 175 Gergely Geczi, Laszlo Imre Komlosi
THE CHALLENGES OF THE SHARING ECONOMY USERS AND THE IMPACTS
OF PANDEMIC (COVID19) ........................................................................................... 185
Ali Ilhan
CHALLENGES AND BENEFITS OF VIRTUAL TEAMS: A LEADERSHIP
PERSPECTIVE ................................................................................................................ 193 Krisztina Kupa
INNOVATION AND THE ROLE OF EMPLOYEE AGILITY - A CASE STUDY IN
JORDANIAN BANKS...................................................................................................... 203 Lusan rawashdeh, Dory Tibor
NATURE OF CONNECTION BETWEEN EMOTIONAL INTELLIGENCE AND
ORGANIZATIONAL LEARNING ................................................................................. 213
Adrienn Cseresznyes
DIVERSITY IN BUSINESS WITH THE INTEGRATION OF LABOUR MIGRANTS
........................................................................................................................................... 222 Pal Bite, Marta Konzosne Szombathelyi, Krisztina Galos
DRIVER AND BARRIER FACTORS OF SUPPLY CHAIN MANAGEMENT FOR
SMALL AND MEDIUM-SIZED ENTERPRISES: AN OVERVIEW ........................... 238
Santi Setyaningsih, Peter Kelle, Azmi Sulaiman Maretan
UNETHICAL BEHAVIOR IN ORGANIZATIONS – AN AGENT-BASED APPROACH
........................................................................................................................................... 250 Tamas Sneider
AN ANALYSIS OF FACTORS DRIVING GENDER DIVERSITY AND INCLUSION IN
JAPANESE ORGANIZATIONS ..................................................................................... 262
Elza Saitova, Carmela Di Mauro
COVEY’S 7HABITS AND THE BIG FIVE PERSONALITY TRAITS: CURE FOR
HIGH NEUROTICISM?.................................................................................................. 273 Miklos Szerdahelyi, Laszlo Imre Komlosi
FORMULA SAE AS A MODEL ENVIRONMENT TO INNOVATE AUTOMOTIVE
PRODUCT DEVELOPMENT ......................................................................................... 283
Tamas Kolossvary, Tibor Dory, Daniel Feszty
THE IMPACT AND URGENCY OF TEACHING OPPORTUNITY - RECOGNITION
TO HIGH SCHOOLS STUDENTS ................................................................................. 294 Kevin M. Jackson, Marta Konczosne Szombathelyi
THE MODERATING EFFECT OF FIRMS’ CASH HOLDING ON THE RELATION
BETWEEN CASH CONVERSION CYCLE AND FIRM PERFORMANCE .............. 307
Heba Zaher, Gilberto Marquez Illescas
ESSENTIAL CHARACTERISTICS OF LEAD-USERS RELATED TO MEDICAL
INSTRUMENTS INNOVATIONS .................................................................................. 317 Bela Venesz, Tibor Dory
UNDERSTANDING POSITIVE ORGANISATIONAL CHANGE THROUGH SOCIAL
CONSTRUCT OF PSYCHOLOGICAL SAFETY: AN INTRAPERSONAL LEVEL
PERSPECTIVE ................................................................................................................ 326 Anna Svibovich
THE INFLUENCE OF PERCEIVED SOCIAL MEDIA MARKETING ACTIVITIES
ON BRAND LOYALTY – SEM APPROACH................................................................ 339
Ivana Geric, Damir Dobrinic
BEHAVIOURAL ACCEPTANCE PROCESS IN THE CONTEXT OF HIV
PREVENTION AMONG RESIDENTS OF LATVIA .................................................... 351
Janis Duboviks, Jelena Salkovska, Anda Batraga
CHALLENGES THAT THE NATIONAL LEGISLATION ARE FACING IN THE ERA
OF SOCIAL AND ECONOMIC CHANGES CAUSED BY DIGITALISATION ......... 360 Borislav Boric
THE BROKERAGE INSURANCE COMPANIES UNDER COVID-19 FRAMEWORK
(THE BULGARIAN EXPERIENCE).............................................................................. 369
Andrey Zahariev, Stoyan Prodanov, Galina Zaharieva, Lyudmil Krastev, Dimitar Kostov,
Tsvetan Pavlov, Stefan Stanimirov, Silvia Zarkova, Nikolay Zdravkov
ACHIEVED RESULTS OF THE BULGARIAN PROSECUTOR`S OFFICE IN THE
PROSECUTION AND INVESTIGATION OF CRIMES OF CORRUPTION ............. 384
Venelin Terziev, Marin Georgiev, Stefаn Bankov
58th International Scientific Conference on Economic and Social Development – Budapest, 04-05 September, 2020
1
THE FUNCTIONS OF THE BULGARIAN PROSECUTOR`S OFFICE
TO GUARANTEE COMPLIANCE WITH THE LAW DURING
INVESTIGATIONS
Venelin Terziev
Georgi Rakovski Military Academy, Sofia, Bulgaria
University of Rousse, Rousse, Bulgaria
Kaneff University Hospital, Rousse, Bulgaria
Marin Georgiev
Kaneff University Hospital, Rousse, Bulgaria
Stefаn Bankov
Ministry of Interior, Sofia, Bulgaria
ABSTRACT
The actions of the Prosecutor`s Office of the Republic of Bulgaria are positively recognized not
only by the Bulgarian society, but also by the previous European Commission in relation to the
Cooperation and Verification Mechanism in the field of justice and home affairs. Thus, the last
Monitoring Report on the progress of Bulgaria acknowledged the fulfillment of all criteria and
the Commission expressed the opinion that the progress made by the Republic of Bulgaria on
the Cooperation and Verification Mechanism is sufficient to meet the country`s commitments
made at the moment of EU accession. This opinion does not minimize the expectations for
outcomes in the fight against corruption and organized crime in the country. Therefore the
efforts of the law enforcement authorities in recent years will not remain on an occasional
basis, but will impose a lasting trend to strengthen the rule of law in the Republic of Bulgaria.
Keywords: Functions, Powers, Bulgarian Prosecutor`s Office, Progress, Bulgaria, Positive
Outcomes, Good practices
1. INTRODUCTION
In last few years, significant progress has been made by the Republic of Bulgaria in relation to
combating crime and enforcing the rule of law. As a result of the excellent interaction between
the judiciary presented by the Prosecutor`s Office of Bulgaria on the one hand and on the other
hand the executive presented by the bodies of the Ministry of Interior, State Agency for National
Security, Commission for Combating Corruption and Confiscation of Illegally Acquired
Property and other institutions, a number of actions have been taken to prosecute persons
occupying high state positions for committed corruption crimes. As a result of these activities
the sense of justice and equality before the law for all citizens, regardless of their property – or
social status, is becoming more and more clearly reaffirmed. This naturally led to high public
approval of the actions of law enforcement authorities in last two years. The actions of the
Prosecutor`s Office of the Republic of Bulgaria are positively recognized not only by the
Bulgarian society, but also by the previous European Commission in relation to the Cooperation
and Verification Mechanism in the field of justice and home affairs. Thus, the last Monitoring
Report on the progress of Bulgaria acknowledged the fulfillment of all criteria and the
Commission expressed the opinion that the progress made by the Republic of Bulgaria on the
Cooperation and Verification Mechanism is sufficient to meet the country`s commitments made
at the moment of EU accession.
58th International Scientific Conference on Economic and Social Development – Budapest, 04-05 September, 2020
2
This opinion does not minimize the expectations for outcomes in the fight against corruption
and organized crime in the country. Therefore the efforts of the law enforcement authorities in
recent years will not remain on an occasional basis, but will impose a lasting trend to strengthen
the rule of law in the Republic of Bulgaria. In addition to the above mentioned, there are some
specific results having direct impact on public life:
• The Republic of Bulgaria has one of the safest capitals in EU;
• Increased detection of many other criminal acts in connection of which the society is
particularly sensitive;
• One of the main highlights in the activity of the Prosecution of the Republic of Bulgaria in
the first half of this year was and still is the fight against another long-standing socially
dangerous phenomenon that has a direct impact on the lives of Bulgarian citizens, especially
in smaller settlements, namely the conventional or so-called “every day” crime (theft,
robbery, etc.);
• Last year, unprecedented actions were taken by the Prosecutor's Office against another
socially dangerous phenomenon, characteristic to a large extent for the territory of our
country, affecting mainly the elderly, namely - the so-called "Telephone fraud". After
profound analysis of this type of crime, a new approach was adopted to investigate these
crimes. All structural units of organized criminal groups, having concentrated their
activities of this type of frauds, are covered. The victims are most often elderly people due
to their sensitivity and possibility for psychological effect on the one hand and the
mechanism of committing crimes on the other hand (the fraudsters most often point out as
reason for the requested funds that the same are needed in connection with a police
investigation of telephone frauds or to provide treatment of a victim or of their relative who
is severely ill).
Despite the progress made and the results achieved, the Prosecutor`s Office of the Republic of
Bulgaria continues to face specific tasks and goals. The fight against conventional crime, in
particular crimes against the persons and corruption, continue to be a challenge for us. In this
direction we specify several groups of problems, especially when it comes to counteracting
corruption practices. At first place they are related to the existing legislation dealing with
criminal prosecution. The Criminal Code was adopted in 1968 in the conditions of the socialist
system and planned economy. Despite its amendments the Criminal Code does not sufficiently
meet the new socio-economic conditions. The excessive formalism of the Criminal Procedure
Code should be added to this, which aggravates the criminal proceedings to a significant degree
and hinders both the prosecutors and the investigative bodies in the performance of their official
duties and the court. From the latter follows the extremely high standard of proof, when the
indictment prepared by the respective prosecutor should reproduce the circumstances described
in it to the extent that as if the prosecutor witnessed the criminal act, which is unreasonably
increased level of detail. Another challenge we face is the correlation between independence
and responsibility of magistrates. In order to have such kind of responsibility, there should be
well-developed control mechanisms guaranteeing foreseeable disciplinary sanctions. Last but
not least, the lack of political will to set a stable legislative basis for an effectively functioning
judiciary (2020).
2. FUNCTIONS AND POWERS OF THE PROSECUTOR`S OFFICE
The main functions and powers of the Prosecution are regulated by the Constitution of the
Republic of Bulgaria (CRB), Judiciary System Act (JSA), Criminal Procedure Code (CPC), as
well as by other laws imposing obligations on the prosecutors in the field of law enforcement
(Terziev, Nichev, Bankov, 2016). The participation of prosecutors in civil cases is regulated in
the respective civil laws and is also on explicitly provided grounds related to the protection of
58th International Scientific Conference on Economic and Social Development – Budapest, 04-05 September, 2020
3
an important public interest, for example under the Family Code – claiming matrimony
annulment by the prosecutor according to Art. 47, para 1, point 3 and 4 as well as according to
para 2, contesting the recognition by the prosecutor according to Art. 66, para 5, participation
in adoption proceedings etc. In fact, the involvement of prosecutors in civil and administrative
cases requires a lot of human resources in the Prosecutor`s Office, that could be used for the
purpose of criminal prosecution. The management of the Prosecutor`s Office of Bulgaria
considers that the functions of the Prosecutor`s Office in civil and administrative cases and the
compatibility of these functions with the main task of the Prosecution to raise and uphold
charges in criminal cases should be reviewed. In this sense is the recommendation of the EU
experts magistrates, contained in the Independent Analysis of the Structural and Functional
Model of the Prosecutor`s Office of the Republic of Bulgaria and its Independence, dated
December 2016, prepared with the assistance of the Office for Support of Structural Reforms
of the European Commission (2020).
3. FUNCTIONS OF THE PROSECUTOR GENERAL
The functions of the Prosecutor General, including the functions of overseeing the legality and
providing methodological guidance, do not have an impact on any prosecutor in solving specific
criminal proceedings. Following the amendments of the Judiciary System Act, dated 2016, the
Prosecutor`s Office of the Republic of Bulgaria is no longer a centralized structure. The
hierarchical and centralized connection is preserved only between the administrative heads of
the prosecutor`s offices themselves and with the Prosecutor General. Power of competence of
the Prosecutor General in two separate directions and two separate powers:
• Methodological guidance of the activity of all prosecutors and investigators (Art. 136, para
5 Judicial system Act7, analogically Art. 46, para 5 Criminal Procedure Code) for accurate
and uniform application of laws and protection of the legal rights and interests of the
citizens, legal entities and the state, by issuing general methodological instructions and
guidelines regarding the activity of the Prosecution (power according to Art. 138, para 1,
point 6 of Judiciary System Act). These are general acts, they generally refer to the activity
of all prosecutors and investigators, they have the characteristic of recommendations, giving
organizational preconditions and containing methodological indications for accurate
application of law. Through the general methodological guidelines, containing principle
directions for similar cases (often in case of legislative amendments) it is precisely the
accurate and uniform application of laws by all prosecutors that is achieved. At the same
time the methodological guidelines and directions, as being general and of principle,
promote professional development and support the independent and autonomous exercise
of prosecutorial activity. They do not refer to a specific case. Examples of such
methodological acts containing methodological guidelines:
- concerning the application of certain provisions, separate legal institutes, certain general
issues: Guidelines for improving the organization of work of the Prosecutor`s office of
the Republic of Bulgaria in applying Art. 53 of Criminal Code and Art. 72 of Criminal
Procedure Code on pretrial proceedings (concerning seizure of object/means of crime )
for transport crimes; Order of the Prosecutor General on increasing the effectiveness of
combating crime by revealing the entire criminal activity and speeding up the
investigation of two or more pretrial proceedings against the same accused person;
Guideline for institutional and administrative supervision in the Prosecutor`s Office;
- Concerning the organization and tactics on counteracting specific types of crime:
Guidelines on the organization of work of the Prosecutor`s Office of the Republic of
Bulgaria on case files and pretrial proceedings, initiated following communication on
domestic violence, for death threats and for violation of order for protection from
domestic violence; Methodological guidelines for work on files and cases for crimes
58th International Scientific Conference on Economic and Social Development – Budapest, 04-05 September, 2020
4
against intellectual property; Guidelines on the organization of work and supervision of
legality from the Prosecutors Office of Bulgaria during elections and referendums;
Guidelines for the organization of the interaction between the bodies of the pre-trial
proceedings with general and special competence in case of particularly serious
accidents.
The experts who carried out the Independent Analysis of the Structural and Functional
Model of the Prosecution recommended that as much of the methodological guidelines and
written regulation of the criminal prosecution as possible should be made public, as far as
this is compatible with national security and effective criminal prosecution. This
recommendation has been partially implemented, and the current leadership of the
Prosecutor's Office considers that the positive practice of publishing more acts of this kind
should be continued, which will lead to full transparency in cases where the Prosecutor
General has exercised his powers of methodological guidance.
• The exercise of legally regulated powers and supervision of legality in specific cases, in
accordance with what is explicitly provided in the law (for example Art. 243, para 10 of
Criminal Procedure Code, claims for reopening of criminal cases in line with Chapter thirty
three of the Criminal Procedure Code etc. ) By exercising the explicit power of competence
of the Prosecutor General for supervision of legality (Art. 46, para. 5 of the CPC) in specific
cases, the legal principle for supervision of legality is put into effect concerning certain
hypotheses, falling within the competence of the Prosecutor General, in accordance with
the legal requirements. There is a relation between both jurisdictions of the Prosecutor
General. This relation is expressed in the fact that with the effective methodological
guidance, with the accurate and uniform application of the law by all prosecutors and
investigators, the need for the Prosecutor General to rule on specific cases is objectively
limited.
There are many legal guaranties that the power of competence of the Prosecutor General is not
unlimited and is exercised according to legally regulated procedures. Moreover, the experts
who carried out the Independent Analysis of the Structural and Functional Model of the
Prosecutor`s Office ascertained this circumstances and made recommendations for more active
involvement of the Prosecutor General in specific cases, which is the practice in many
prosecution services of EU. Recommendations have also been made that “the administrative
heads of prosecutors' offices should refer their staff and be accountable to the Prosecutor
General for matters relating to the work of specific sensitive cases carried out under their
direction. The information on sensitive cases should be provided upstream so that the
Prosecutor General is informed about the work of his staff in cases where he may be asked to
explain the actions of the Prosecution. Of course, all opinions on cases expressed by superior
prosecutors must be documented in writing in the case file, so that there is an audit trail of the
decision - making process. It is again in the independent analysis of the structural and functional
model of the Prosecution found that most prosecutors work on the most of their cases with very
little or without any interference from above. Attention should also be paid to the
recommendation in the Independent Analysis of the Structural and Functional Model of the
Prosecution that “the standard for decision-making on internal conviction should be amended,
especially what concerns the part of the Prosecution.” For this to happen amendments to the
structural Judiciary System Act are needed as well as to the Criminal Procedure Code. We
support the view, expressed in the independent analysis, that the lack of opportunity for anyone
to intervene in the final decision of a junior or other prosecutor assigned with the case (even
when the case is supervised by an appellate prosecutor) is a characteristic of the Bulgarian
58th International Scientific Conference on Economic and Social Development – Budapest, 04-05 September, 2020
5
system, which causes problems. Furthermore, the experts do not hide their surprise that at
present administrative heads have no role in confirming, amending or revoking the
prosecutorial decisions of their subordinates, given the fact that prosecutors at regional and
district level are subordinate to their administrative heads. We also share the opinion that if the
current legal framework is preserved in this form, it is necessary to take appropriate measures
to issue an instruction that will give clear methodological guidelines on the application and
interpretation of Article 14 of the CPC. The Experts have expressed the view that “it is precisely
the change of this standard, together with providing more guidelines by the Prosecutor General
that would lead to greater consistency in the decision-making process within the prosecution
service and increase the likelihood of achieving a final conviction.”
4. CONCLUSION
The cited recommendations show that the legal powers of the Prosecutor General of the
Republic of Bulgaria are even more limited than the powers of similar figures in the judicial
systems of the other EU states. The Prosecutor General exercises his / her powers only in
exceptional cases and according to previously prescribed legal procedures (Terziev, Bankov,
Georgiev, 2018-a).
LITERATURE:
1. Terziev, V., Nichev, N., Bankov, S. (2016). Corruption and national security. //
Mezhdunarodnayy nauchnnayy zhurnal Inovatsionnaya nauka, №10-3/2016, Chastyah 3,
Ufa, Rossiya, ISSN 2410-6070, s.189-196 (Terziev, V., Nichev, N., Bankov, S. Corruption
and national security. // Международный научнный журнал Иновационная наука, №10-
3/2016, Частях 3, Уфа, Россия, ISSN 2410-6070, с.189-196).
2. Terziev, V., Nichev, N., Bankov, S. (2016a). National security of the republic of Bulgaria.
// Science and practice: Collection of scientific articles. Thoroe-Bowker, Melbourne,
Australia, 2016, ISBN 978-0-9942661-3-2, pp.12-21.
3. https://www.parliament.bg/bg/const (2020).
4. Terziev, V., Bankov, S., Georgiev, M. (2018). The Stability and growth pact: pursuing
sound public finances and coordinating fiscal policies in the EU member states. // Journal
of Innovations and Sustainability, Plovdiv, Bulgaria, 4, 2018, 3, pp. 53-68, ISSN 2367-
8127 (CD-ROM), ISSN 2367-8151 (on-line).
5. Terziev, V., Bankov, S., Georgiev, M. (2018a). The Change in the approach of the court of
justice of the European Union in the context of market freedoms and internal situations. //
Journal of Innovations and Sustainability, Plovdiv, Bulgaria, 4, 2018, 3, pp. 85-112, ISSN
2367-8127 (CD-ROM), ISSN 2367-8151 (on-line).
58th International Scientific Conference on Economic and Social Development – Budapest, 04-05 September, 2020
6
INTERNET MARKETING COMMUNICATION CHALLENGES -
OPINIONS OF CROATIAN CUSTOMERS AND MARKETING
AGENCIES
Petra Odeljan
Faculty of organization and informatics, University of Zagreb
Pavlinska 2, 42 000 Varaždin, Croatia
Iva Gregurec
Faculty of organization and informatics, University of Zagreb
Pavlinska 2, 42 000 Varaždin, Croatia
ABSTRACT
Internet and digital technology have played a major role in the development of digital
marketing and marketing branch in general. According to previous research internet marketing
become a significant and indispensable part of contemporary business due to the fact that it is
often more profitable than the traditional one, and also because it offers better results. But for
this to be the case, it is crucial to manage quality communication with consumers. Internet
marketing communication is in many ways different from the traditional one, so choosing one
itself is a challenge for businesses. The internet helps globalization, so saturation creates a lot
of pressure for businesses. It's not easy to survive, much less to be the best and to be competitive,
so companies need to respond to new situations in a timely manner. However, the question is
whether internet marketing is the right choice for all businesses with respect to their target
groups. Therefore, it is extremely important to predict the future, and as the pace of
technological development increases with age, it is necessary to assume the characteristics of
future generations, as well as the new characteristics of already existing target groups. There
are therefore many challenges facing businesses that communicate with their consumers on a
daily basis, and this paper aims to investigate and present all the current challenges of internet
marketing communication that businesses should consider to survive. On the other hand, it is
also important to see how consumers themselves accept these challenges. So, this paper
provides insight into the theoretical part, based on secondary data and presents the results of
qualitative research conducted on consumers and marketing agencies to gain a better
understanding of what is happening on the Croatian market.
Keywords: challenges, consumers, internet, internet marketing communication, marketing
agencies
1. INTRODUCTION
Because internet marketing is the most dynamic area of marketing, companies need to
continuously work on new skills and knowledge. Marketing communication is thus a field that
always presents a challenge for companies, especially for those that base their success on
relationships with their customers. So, the usage of the internet can rise various challenges in
the field of internet marketing communications. This paper was created as a presentation of the
results of the conducted research for the purpose of writing a final thesis on graduate study. The
paper covers current challenges that arise in internet marketing communication. The first part
presents a theoretical overview of the secondary data research and introducing challenges
related to internet marketing communication, while the second part of the paper presents results
of research conducted with consumers and managers of marketing agencies that exist on the
Croatian market.
58th International Scientific Conference on Economic and Social Development – Budapest, 04-05 September, 2020
7
2. CHALLENGES OF INTERNET MARKETING COMMUNICATION
Internet marketing communication is based on features that differentiate it from the traditional
one. These characteristics often, by themselves, present the challenges that companies need to
deal with when communicating with consumers via the internet. Based on existing literature
(Abashidze; 2017; Broderick and Pickton; 2005; Chaffey et al .; 2009; Dehghani and Tumer;
2015; Hofacker and Belanche; 2016; Leeflang et al; 2014; Okazaki and Taylor; 2013; Quraishi
et al. .; 2017, Stokes; 2009) the challenges related to integrated marketing communication,
which were later covered by research, are divided into six categories: target groups, consumer
activity, internet marketing communication management, changes, security and characteristics
of the internet marketing communication. Each category consists of several types of challenges,
which actually represent the characteristics of internet marketing communication.
2.1. Target groups
The target group category refers to the challenges posed by the consumer groups that represent
the intended recipients of the company’s internet marketing communication massages. These
challenges are relating to: customer tracking (Leeflang et al., 2014), cultural factors (Okazaki
and Taylor, 2013), new audiences (Abashidze, 2017), and generations (Quraishi et al., 2017).
Technology intelligence and the development of the same gives online marketing
communication a new dimension that enables companies to deeply monitor their customers.
Creating and exploiting rich and effective insights into customer traits, behaviors, wants and
needs becomes a necessity for competition (Leeflang et al., 2014). Because the use of
technological intelligence requires specific knowledge and involvement of users in the
development of the same, not all companies are ready to monitor clients the way the internet
allows them to. Consumers' desires and needs are influenced by the environment, so cultural
factors also affect their behavior on the internet. This is related to cultural dimensions such as
individualism or collectivism, a tendency to seek novelties, communal or agentic tendencies in
friendship, and monochrome or polychromatic consumer orientations. Cultural factors make it
a particular challenge for companies using international promotion. Significant differences are
evident in consumer behavior on social networks, and even when using standardized strategies,
marketing communication must be tailored to individual groups (Okazaki and Taylor, 2013),
and situational analysis is required for each country (Chaffey et al., 2009). Although cultural
factors influence consumer behavior when using social media, social media itself has an impact
on consumers, and so new groups of them have evolved. Young consumers and those who use
new technologies, regardless of culture, similarly respond to certain marketing communications
via social networks and the internet in general. Also, these groups have similar reactions to a
certain product category equally advertised in different countries (Okazaki and Taylor, 2013).
Abashidze (2017) cites three groups of consumers related to their behavior on the internet:
hyper-active consumers, active consumers, passive consumers. In the category of target
audience challenges, in addition to these new groups, the challenge of online marketing
communication is also posed by certain generations of people. There are still many consumers
who are not adept at using the internet, so a corporate focus solely on internet marketing can
cause consumer loss (Quraishi et al., 2017), but also the omission of these potential target
groups that need to be addressed through traditional media.
2.2. Consumer activity
The category of challenges related to consumer activity consists of several features of internet
marketing communication. These characteristics are described below as types of challenges,
relating to: managing customer creation and engagement (Leeflang et al., 2014), word of mouth,
reviews (Abashidze, 2017), and ad blockers and pop-up blockers (Stokes, 2009). As online
consumers take an active role in brand building, another challenge for companies is managing
58th International Scientific Conference on Economic and Social Development – Budapest, 04-05 September, 2020
8
their online reputation. Governance becomes even more challenging in a marketing
environment where social networks play an important role (Leeflang et al., 2014). It also means
merely encouraging consumer activation around products, such as encouraging customers to
buy via Facebook (Harris and Dennis, 2011). Whether it's advertising, sales, direct marketing,
or public relations, and since customer negative reactions can result in a campaign or even brand
breakdown, companies should first test their online marketing communications on focus groups
and do extensive research (Abashidze, 2017). Managing customer creation and engagement
involves a process whose stages need to be elaborated to help the company cope with potential
crises or avoid them altogether. Oral messaging with consumers plays a big role in traditional
marketing, and on the internet it is taking on a new dimension that further empowers this role.
Spreading the message of consumers can reach immense proportions, so monitoring and
managing them becomes a big challenge for companies. According to Campbell et al. (2011,
Retrieved from Abashidze, 2017), consumers have three basic motives for creating and
disseminating such messages: inner pleasure, self-promotion, and change in perception.
Reviews are the ratings of customers to whom they share their view of a product, brand, or
companies globally, with the aim of alerting other potential customers. This can easily influence
others 'opinions, so companies need to be aware of their customers' reviews. They can also be
seen as quantitative or qualitative analytical data for comparing companies. Because negative
reviews can be shared around the globe around the world, the horn effect (the opposite of the
halo effect) occurs, which can affect many people's perceptions, and thus further business
development. Negative reviews of one product affect the perception of the other products of
that company and thus the overall image (Abashidze, 2017). As the internet became saturated
with numerous ads, users were offered the option of installing programs that block those ads,
appearing as ad blockers and popup blockers. Internet browsers offer extensions that behave in
this way, and internet users who follow technology developments are increasingly using these
methods to limit visible promotion (Stokes, 2009). Companies need to discover the extent to
which their target groups are using such tools and how to reach potential customers with their
use.
2.3. Managing of internet marketing communication
Because internet marketing communication itself is a challenge for companies, once selected,
managing it becomes a new challenge. This category thus applies to: choosing the internet over
traditional media (Okazaki and Taylor, 2013), adapting to reactive marketing management
(Hofacker and Belanche, 2016), relationship building, monitoring (Quraishi et al., 2017),
collecting and measuring results. campaign management (pay per click) (Stokes, 2009),
budgeting (Broderick and Pickton, 2005), message design, multimedia and integrated internet
marketing communication. Whether the company chooses the internet as the sole or main
medium of marketing communication depends primarily on the characteristics of the target
group, and the task of the companies is to do in-depth research that will discover whether,
regardless of all the advantages it carries, it is the internet medium that they need to use. It is
necessary to find out if global social media has greater brand building potential than traditional
media (Okazaki and Taylor, 2013), and if so, whether the company is prepared to cope with the
other challenges of online marketing communication. Internet marketing communication is
often initiated by consumers, which speaks to their active position, as opposed to the passivity
that characterized them before the development of the internet as a medium. As this has caused
a massive dissemination of information, companies need to become reactive and apply this
characteristic to managing internet marketing. Internet marketing lacks the presence of a man
who makes an important part of selling live products. This prevents companies from building a
special type of customer relationship that is of particular importance in recurring sales (Quraishi
et al., 2017). Companies need to figure out how to replace the role of online marketers in order
58th International Scientific Conference on Economic and Social Development – Budapest, 04-05 September, 2020
9
to give them a special touch with their customers. Tracking, collecting and measuring results is
extremely important in all marketing activities, and especially in the field of internet marketing.
The internet provides numerous tools that make it easy to collect and analyze data. However,
companies can easily just fix themselves on numbers instead of using them to optimize
campaign growth. The results should always be analyzed statistically, without assumptions, and
decisions should be made based on them (Stokes, 2009). Campaign management is generally a
challenge for companies, and the internet is usually a pay per click campaign that requires
quality management. As the campaign grows, more time is needed to manage it. Pay per click
campaigns can provide an exceptional return on investment, but sufficient time must be
allocated to such a campaign before entering such a campaign (Stokes, 2009). There are also a
number of tools available today to help you manage your pay per click campaign, as well as
other types of online campaigns. Nevertheless, this still poses a potential challenge for online
marketing communications for companies. Costs on the internet can vary depending on various
factors, so they are low for some companies and high for some. In any case, the challenge is to
determine the budget of internet marketing communication. For example, when it comes to
websites, they can be extremely cost effective and efficient, but the real cost of developing and
updating a quality site can be high (Broderick and Pickton, 2005). Yet, as is often the case with
public relations, online marketing communication is sometimes considered free (Broderick and
Pickton, 2005). It is important for companies to be aware of the potential costs of this form of
communication when choosing the internet as a medium. If a company chooses to communicate
online, it is necessary to consider what form of the message will produce the best results.
Whether the message is formal, informal, written, visual, or combined depends largely on the
target group. When the decision is made to use the internet as a medium of marketing
communication, the challenge is the decision to use other media. The combination depends on
various aspects, so it is extremely important to conduct research that will answer the question
about multimedia. Integrated marketing communication refers to the use of multiple tools, so
when using the internet, it is also important to determine whether it is integrated internet
marketing communication or whether only one communication tool will be used. So the
company has to decide between social networks, online public relations, Google ads, a website
or a combination of these and other tools.
2.4. Changes
The development of technology has brought a number of changes to the world and has thus
affected marketing. The change category poses the challenge of: adapting to the changing
buying process, the challenge of adapting to a changing set of marketing skills (Hofacker and
Belanche, 2016), and the challenge of rapid technological change (Quraishi et al., 2017). The
traditional buying process is usually described through several typical phases, which change
with the advent of online purchasing. The traditional steps according to Hofacker and Belanche
(2016) are: problem recognition, search, evaluation, purchase, post-purchase evaluation. With
the development of social networks, the act of consumption becomes public, and as such it must
be included in the above steps. Consumers share their experiences in the form of photos and
videos, whether in restaurants, shops or other places of consumption. Companies need to be
aware of this step, but also of a new approach to post-purchase engagement that includes
reviews and other ways of disseminating business information (Hofacker and Belanche, 2016).
Internet marketing communication requires continuous monitoring of trends and changes,
which is why it is challenging for companies to adapt to a set of new marketing skills.
Theoretical knowledge is only the foundation of internet marketing, and professionals need the
skills to use new tools and study digital data, which is important to companies, except in textual,
image and video formats (Hofacker and Belanche, 2016). Companies are faced with the
challenge of rapid technological change, which constantly needs to be kept up to date, and often
58th International Scientific Conference on Economic and Social Development – Budapest, 04-05 September, 2020
10
only ahead of time. Changes require constant attention and management so that the company
does not use outdated marketing strategies (Quraishi et al., 2017).
2.5. Security
Although systems are constantly being promoted for improving internet security, this category
is still a challenge for internet marketing communication. In doing so, it consists of challenges
relating to: trust (Broderick and Pickton, 2005), others' fraudulent (fake) activities (Quraishi et
al., 2017) and data protection (Chaffey et al., 2009, p. 137). From former push promotional
strategies, the development of online marketing communication has resulted in a trust-based
promotion (Dehghani and Tumer, 2015). Such online marketing communication is needed
because of the conservative nature of customers who do not trust online sales, which is a major
stumbling block for companies (Broderick and Pickton, 2005). Many customers still use the
internet solely to inform the product, but prefer to buy it in physical stores (Quraishi et al.,
2017). This is a problem of intangibility, and it is up to companies to overcome this challenge
with potential new solutions. The biggest drawback to internet marketing according to Quraishi
et al (2017) is the vulnerability due to fraudulent activities. This applies to hackers as well as
to public activities such as fake websites that can mislead customers and thus affect the
companies and image of companies. Companies also face click fraud in frequently used pay per
click campaigns. Because a company pays for each click on an ad, competitors can organize
deliberate ad opening, which can cause huge costs (Stokes, 2009). Therefore, it is important to
continually monitor the campaign and report any suspicious activity on time. Every company
needs to be well versed in data protection laws and regulations since any failure to do so is
detrimental to consumers and thus potentially to the image of the company. But, because it is a
complex area with frequent changes, policy monitoring and compliance is a challenge of
internet marketing communication, which must be based on data protection. This refers to
socially acceptable ethical behavior, the use of which can prevent potential losses arising from
non-compliance with laws and regulations. In order for companies to comply with data
protection and privacy laws, they must properly collect, store, use and delete personal
information (Chaffey et al., 2009, p. 137), since these laws address more thoroughly all internet
tools marketing communications, monitoring and following them can be a challenge for
companies.
2.6. Characteristics of internet marketing communication
Although internet marketing communication is characterized by features that often present
advantages over traditional ones, these characteristics can also present challenges. This
category thus presents challenges related to loss and response (Quraishi et al., 2017), creating
attractive and profitable interactions (Hofacker and Belanche, 2016), technology dependency
(Quraishi et al., 2017), automated interactions (Leeflang et al.., 2014), a bilateral mode of
communication (Abashidze, 2017), internet saturation (Stokes, 2009), and search (Broderick
and Pickton, 2005). Internet marketing communication can manifest itself in losses in terms of
poor consumer response. It is normal for certain losses to exist, but the goal of such
communication should still be interactivity. In order to avoid excessive losses, the company
should apply an accurate targeting strategy before initiating communication. This is done using
parameters such as location and keywords, and losses can also be avoided by eliminating
constraints on interaction creation (Quraishi et al., 2017). In internet marketing communication,
it is possible to combine audio and video technologies to present the message with sound, music
and image (Quraishi et al., 2017). It is important that the message is attractive in order to be
profitable, and for this purpose to make good use of interaction based on techniques and game
elements. Such an approach results in a hedonistic experience with rapid response, clear goals,
and undisturbed communication (Hofacker and Belanche, 2016).
58th International Scientific Conference on Economic and Social Development – Budapest, 04-05 September, 2020
11
Although the technology of marketing communication has many advantages, the dependency
of internet marketing communication has its disadvantages. This refers to failures and errors
that, regardless of progress, occur with technological devices. An example of such an error is
when a potential buyer opens an ad, but a technical failure does not allow the purchase of the
product. The prospective buyer is likely to make their purchase with a competitor because of
dissatisfaction (Quraishi et al., 2017). When planning online marketing communications, the
company should consider the automated interaction option and the real interaction option. The
decision, on the one hand, depends on the characteristics of the company and the product, and
on the other, on the characteristics of the target group. In any case, automated customer
interaction management services can lead to customer dissatisfaction and thus undermine the
value that the company provides them (Leeflang et al., 2014). As consumers on the internet
take an active role in communicating with companies, this changes the type of communication
from traditional monologues used by companies to reach consumers, to bilateral
communication in which consumers play an important role. Regardless of customer loyalty,
there is always a risk of unexpected behavior, so companies need to choose the right
communication style (Abashidze, 2017). It is up to them to overcome the challenge of the
bilateral mode of communication and to discover the benefits that such marketing
communication brings. Using the internet, one receives a great deal of information in a short
period of time as it is presented with different contents. The internet is saturated with various
forms of internet marketing communication and is increasingly ignored by consumers (Stokes,
2009). As more and more companies use the internet as a medium, there is a problem of standing
out from the competition. Nevertheless, a proactive internet search that characterizes many
consumers increases the likelihood of visiting a company website (Broderick and Pickton,
2005), and so does the likelihood of responding to communication. It is the saturation of the
internet that makes it difficult to search, so companies need to make sure they are in a good
position among the results. Particularly for casual users, searching for certain information or
websites can be difficult, time consuming and frustrating (Broderick and Pickton, 2005).
However, with the saturation of the internet, search engine optimization and content
optimization tools have emerged that allow companies to stand out. It is important to
continuously monitor the position of the company in order to optimize it in a timely manner.
3. RESEARCH
By researching and analyzing existing literature (secondary data) we have highlighted the
characteristics of internet marketing communication that pose potential challenges for
companies. In order to gain new insights into the extent to which of these challenges arise,
empirical research has been conducted. We conducted two researches, one among customers
and the other among managers of marketing agencies on the Croatian market. In order to present
the results as precisely as possible the answers to the research topic, two comparable
questionnaires as instruments of primary data collection were created. A consumer survey (non-
probability sampling, snowball sampling) was published on social networks in three rounds. A
total of 228 consumers accessed the questionnaire, and 113 of them fully answered all the
questions and a statistical analysis was presented on their answers, as shown below. During the
same period, 107 marketing agencies (non-probability sampling, judgmental sampling) were
contacted via e-mail, of which 11 fully completed survey questionnaires were collected and the
analysis of the answers is presented below.
Table following on the next page
58th International Scientific Conference on Economic and Social Development – Budapest, 04-05 September, 2020
12
CHALLENGES
FOR THE
COMPANIES
EX
AM
INE
E
1 I
t nev
er p
rese
nts
a
chal
lenge
2 I
t ra
rely
pre
sents
a
chal
lenge
3 S
om
etim
es i
t
pre
sents
a c
hal
lenge
4 I
t oft
en p
rese
nts
a
chal
lenge
5 I
t al
way
s pre
sents
a ch
alle
nge
9 D
on't
know
/don't
wan
t to
answ
er/
can't
answ
er
Med
ium
gra
de
Investigating
and monitoring
of the
characteristics, desires and
needs of
consumers
through the
internet.
Number of
experts
(N=11)
0 1 4 1 5 0 3,91
Percentage
of consumers
(N=113) 5,42% 21,24% 26,55% 30,09% 16,81% 0,88% 3,34
Detecting of
cultural factors
that affect
consumer
characteristics
related to
internet use.
Number of
experts
(N=11)
0 2 6 3 0 0 2,82
Percentage
of
consumers
(N=113)
6,19% 10,62% 33,63% 36,28% 11,50% 1,77% 3,73
The redefinition
of traditional target groups
into those
groups created
by the
emergence of
social networks.
Number of
experts (N=11)
1 2 4 2 2 0 3,18
Percentage
of
consumers
(N=113)
3,54% 8,58% 38,05% 30,09% 12,39% 7,08% 3,42
Communication
with different
generations of
people on the
internet.
Number of
experts
(N=11)
1 4 3 3 0 0 2,73
Percentage
of
consumers
(N=113)
4,42% 12,39% 24,78% 30,97% 24,78% 2,65% 3,61
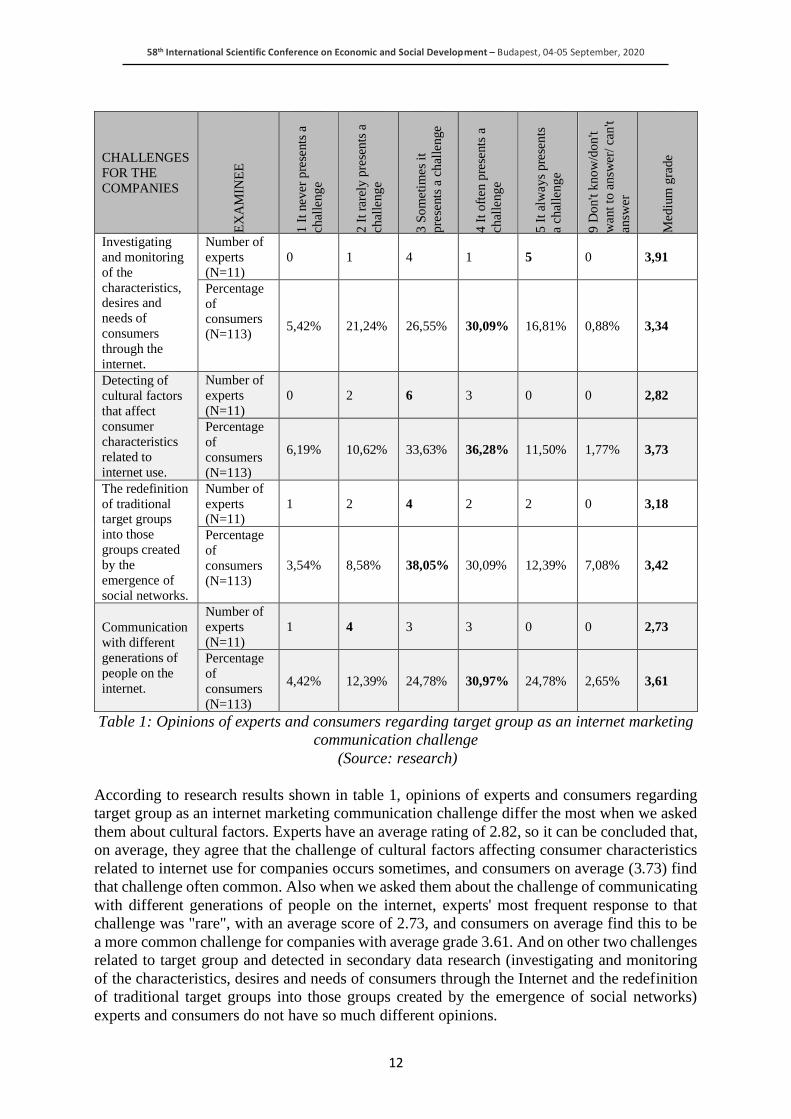
Table 1: Opinions of experts and consumers regarding target group as an internet marketing
communication challenge
(Source: research)
According to research results shown in table 1, opinions of experts and consumers regarding
target group as an internet marketing communication challenge differ the most when we asked
them about cultural factors. Experts have an average rating of 2.82, so it can be concluded that,
on average, they agree that the challenge of cultural factors affecting consumer characteristics
related to internet use for companies occurs sometimes, and consumers on average (3.73) find
that challenge often common. Also when we asked them about the challenge of communicating
with different generations of people on the internet, experts' most frequent response to that
challenge was "rare", with an average score of 2.73, and consumers on average find this to be
a more common challenge for companies with average grade 3.61. And on other two challenges
related to target group and detected in secondary data research (investigating and monitoring
of the characteristics, desires and needs of consumers through the Internet and the redefinition
of traditional target groups into those groups created by the emergence of social networks)
experts and consumers do not have so much different opinions.
58th International Scientific Conference on Economic and Social Development – Budapest, 04-05 September, 2020
13
CHALLENGES
FOR THE
COMPANIES
EX
AM
INE
E
1 I
t nev
er p
rese
nts
a
chal
lenge
2 I
t ra
rely
pre
sents
a
chal
lenge
3 S
om
etim
es i
t
pre
sents
a c
hal
lenge
4 I
t oft
en p
rese
nts
a
chal
lenge
5 I
t al
way
s pre
sents
a ch
alle
nge
9 D
on't
know
/don't
wan
t to
answ
er/
can't
answ
er
Med
ium
gra
de
Tracking of
content about a
business, brand
or product
created by
consumers on
the internet.
Number of
experts
(N=11)
1 5 2 2 1 0 2,73
Percentage
of
consumers
(N=113)
9,73% 24,78% 26,55% 25,66% 12,39% 0,88% 3,06
Managing of content about a
business, brand,
or product
created online
by consumers.
Number of experts
(N=11)
0 3 2 2 4 0 3,64
Percentage
of
consumers
(N=113)
4,42% 17,70% 30,97% 30,97% 13,27% 2,65% 3,32
Tracking of
consumer
reviews on the
internet.
Number of
experts
(N=11)
6 3 0 2 0 0 1,82
Percentage
of
consumers
(N=113)
10,62% 27,43% 26,55% 22,12% 12,39% 0,88% 2,98
Managing of online consumer
reviews.
Number of
experts (N=11)
1 4 2 1 3 0 3,09
Percentage
of
consumers
(N=113)
5,31% 19,47% 29,20% 23,89% 19,47% 2,65% 3,37
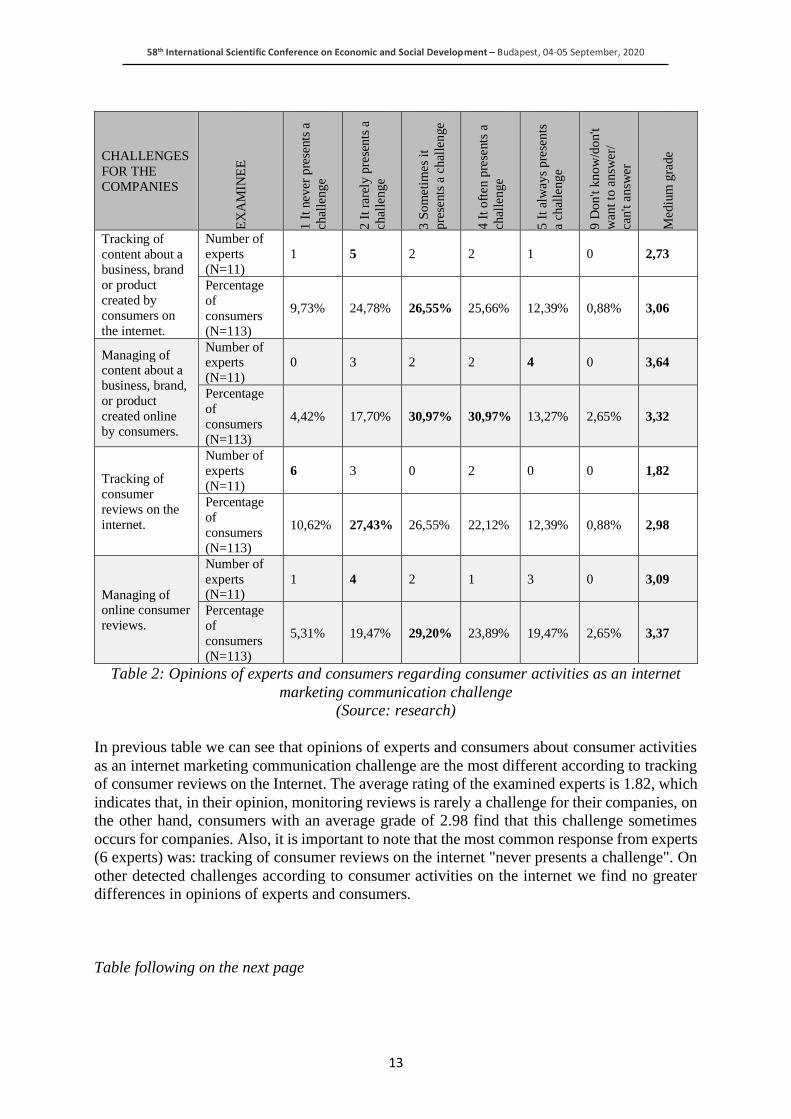
Table 2: Opinions of experts and consumers regarding consumer activities as an internet
marketing communication challenge
(Source: research)
In previous table we can see that opinions of experts and consumers about consumer activities
as an internet marketing communication challenge are the most different according to tracking
of consumer reviews on the Internet. The average rating of the examined experts is 1.82, which
indicates that, in their opinion, monitoring reviews is rarely a challenge for their companies, on
the other hand, consumers with an average grade of 2.98 find that this challenge sometimes
occurs for companies. Also, it is important to note that the most common response from experts
(6 experts) was: tracking of consumer reviews on the internet "never presents a challenge". On
other detected challenges according to consumer activities on the internet we find no greater
differences in opinions of experts and consumers.
Table following on the next page
58th International Scientific Conference on Economic and Social Development – Budapest, 04-05 September, 2020
14
CHALLENGES FOR
THE COMPANIES
EX
AM
INE
E
1 I
t n
ever
pre
sen
ts a
chal
len
ge
2 I
t ra
rely
pre
sen
ts a
chal
len
ge
3 S
om
etim
es i
t
pre
sen
ts a
ch
alle
nge
4 I
t o
ften
pre
sen
ts a
chal
len
ge
5 I
t al
way
s p
rese
nts
a
chal
len
ge
9 D
on
't k
no
w/d
on
't
wan
t to
an
swer
/ ca
n't
answ
er
Med
ium
gra
de
Managing of a brand
on the internet
Number of
experts
(N=11)
0 3 1 5 2 0 3,55
Percentage of
consumers
(N=113)
5,31% 14,16% 36,28% 29,20% 10,62% 4,42% 3,30
Reactive management
of internet marketing
communication.
Number of
experts
(N=11)
0 1 5 5 0 0 3,36
Percentage of
consumers
(N=113)
2,65% 10,62% 45,13% 30,09% 4,42% 7,08% 3,25
Building consumer
relationships online
vs. building
relationships in live
environment.
Number of
experts
(N=11)
1 1 6 2 1 0 3,09
Percentage of
consumers
(N=113)
5,31% 18,58% 28,32% 32,74% 14,16% 0,88% 3,32
Tracking and
measuring of
communication results
in online environment.
Number of
experts
(N=11)
3 1 3 2 2 0 2,91
Percentage of
consumers
(N=113)
10,62% 23,01% 27,43% 30,09% 8,85% 0,00% 3,04
Managing of pay per
click campaigns on the
internet.
Number of
experts
(N=11)
2 4 3 1 1 0 2,55
Percentage of
consumers
(N=113)
11,50% 18,58% 29,20% 19,47% 14,16% 7,08% 3,07
Setting and managing
of a budget online.
Number of
experts
(N=11)
2 3 4 1 1 0 2,64
Percentage of
consumers
(N=113)
7,08% 12,39% 33,63% 30,09% 15,04% 1,77% 3,34
Formatting a message
on the internet.
Number of
experts
(N=11)
1 7 1 1 1 0 2,45
Percentage of
consumers
(N=113)
7,96% 13,27% 35,40% 28,32% 10,62% 4,42% 3,21
Selecting of
(traditional) media in
addition to the
internet.
Number of
experts
(N=11)
1 4 4 2 0 0 2,64
Percentage of
consumers
(N=113)
3,54% 21,24% 36,28% 28,32% 9,73% 0,88% 3,20
Selecting and using of
multiple tools of
integrated internet
marketing
communication.
Number of
experts
(N=11)
0 2 7 1 1 0 3,09
Percentage of
consumers
(N=113)
3,54% 13,27% 38,94% 23,89% 16,81% 3,54% 3,39
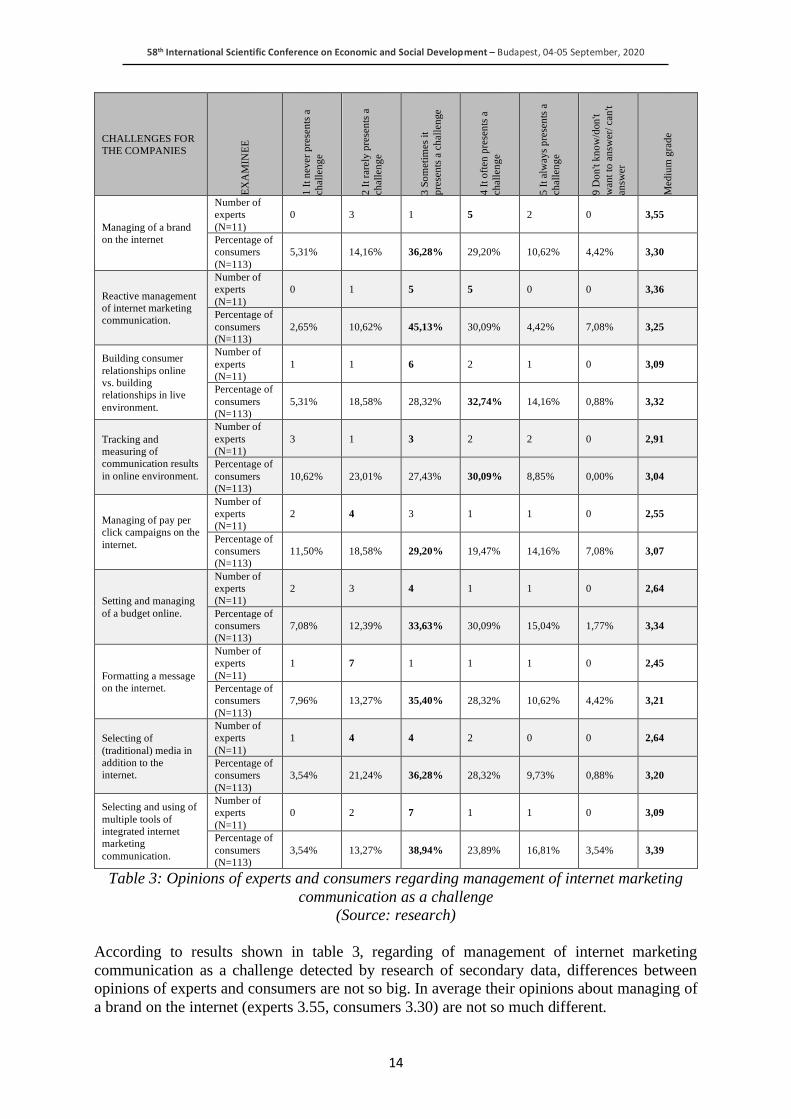
Table 3: Opinions of experts and consumers regarding management of internet marketing
communication as a challenge
(Source: research)
According to results shown in table 3, regarding of management of internet marketing
communication as a challenge detected by research of secondary data, differences between
opinions of experts and consumers are not so big. In average their opinions about managing of
a brand on the internet (experts 3.55, consumers 3.30) are not so much different.
58th International Scientific Conference on Economic and Social Development – Budapest, 04-05 September, 2020
15
Experts consider brand management on the internet a common challenge of internet marketing
communication for companies they work for, and consumers on average find that this challenge
sometimes occurs for companies. The average rating of the examined experts about reactive
communication management is 3.36, so in their opinion on average it sometimes presents a
challenge of internet marketing communication. From another perspective, consumers are, on
average (3.25) quite aware of the frequency of this challenge for companies. The most common
response of experts for building consumer relationships online vs. building relationships in live
environment as a challenge of Internet marketing communication is “sometimes,” and so their
average score is 3.09, which suggests that, in their opinion, building relationships sometimes
presents a challenge for internet marketing communication. The most common answer
(32.74%) of consumers is "often", but their average (3.32) coincides with the experts' answers.
In addition, the average rating of the experts (2.91) and consumers (3.04) about tracking and
measuring of communication results in online environment is, which indicates that for them,
on average, this detected challenge occurs sometimes. The average rating of the experts (2.55)
and of consumers (3.07) means that managing of a pay per click campaign on average
sometimes occurs as a challenge of internet marketing communication. Experts, on average
(2.64), find that the budgeting sometimes occurs as a challenge of internet marketing
communications for companies, and consumers (3.34) consider this challenge to be somewhat
more common on average. And the most common answers from both experts and consumers
are “sometimes”. The most common response of experts (7 of 11) to the challenge of message
formulation is "rare", while the largest percentage of consumers (35.40%) believe that this
challenge sometimes occurs for businesses. The average rating of the experts (2.64) indicates
that in their opinion multimedia is sometimes a challenge of internet marketing communication
for companies. From a consumer perspective, this is a more common challenge, but on average
(3.20), they, as well as experts, find that choosing additional media over the internet sometimes
presents a challenge for companies. And the last detected challenge in a group of management
internet marketing communication challenges is connected with selecting and using of multiple
tools of integrated internet marketing communication. The average rating of the experts is 3.09,
which indicating that in their opinion this sometimes presents a challenge for companies, and
consumers (3.39) are quite aware, on average, of the frequency of occurrence of this challenge.
Table following on the next page
58th International Scientific Conference on Economic and Social Development – Budapest, 04-05 September, 2020
16
CHALLENGES
FOR THE
COMPANIES
EX
AM
INE
E
1 I
t nev
er p
rese
nts
a
chal
lenge
2 I
t ra
rely
pre
sents
a
chal
lenge
3 S
om
etim
es i
t
pre
sents
a c
hal
lenge
4 I
t oft
en p
rese
nts
a
chal
lenge
5 I
t al
way
s pre
sents
a ch
alle
nge
9 D
on't
know
/don't
wan
t to
answ
er/
can't
answ
er
Med
ium
gra
de
Adaptation to
communication
related to online
shopping.
Number of
experts
(N=11)
1 6 0 4 0 0 2,64
Percentage
of
consumers
(N=113)
4,42% 12,39% 36,28% 31,86% 14,16% 0,88% 3,39
Adaptation to a
changing set of
marketing skills.
Number of
experts (N=11)
1 3 4 2 1 0 2,91
Percentage
of
consumers
(N=113)
1,77% 18,58% 29,20% 33,63% 14,16% 2,65% 3,41
Monitoring
technological
changes and
decision making
related to them.
Number of
experts
(N=11)
0 2 4 5 0 0 3,27
Percentage
of
consumers
(N=113)
6,19% 13,27% 33,63% 31,86% 15,04% 0,00% 3,36
Table 4: Opinions of experts and consumers regarding changes as an internet marketing
communication challenge
(Source: research)
From the results shown in table 4, regarding changes as an internet marketing communication
challenge, we can see that also in this group of challenges opinions of experts and consumers
are similar. The average rating of the experts (2.64) and consumers (3.39) about adaptation to
communication related to online shopping as a challenge is, suggesting that, in their view,
adapting to the changing purchasing process sometimes presents a challenge for companies. It
is also interesting that 6 of 11experts consider this challenge rare, while 4 of them consider this
challenge often. The average rating of the examined experts about adaptation to a changing set
of marketing skills is 2.91, which indicates that on average they find this challenge sometimes
present for companies. Consumers also on average (3.41) find this challenge somewhat more
common, and the mean score about this challenge matches the average rating of the experts.
And the last challenge in this group shows that on average opinions of experts and consumers
are similar. The average rating of the experts is 3.27, and consumers 3.36 which indicates that,
on average, monitoring technological changes and decision making related to them sometimes
presents a challenge for companies.
Table following on the next page
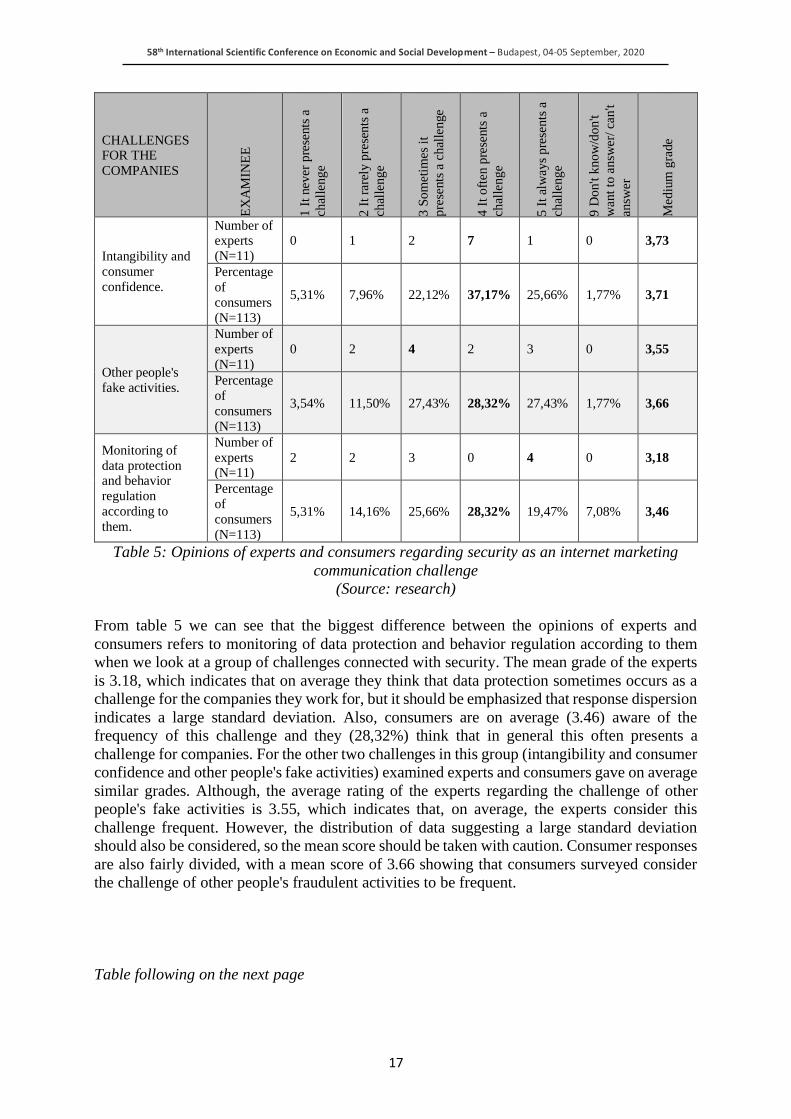
58th International Scientific Conference on Economic and Social Development – Budapest, 04-05 September, 2020
17
CHALLENGES FOR THE
COMPANIES
EX
AM
INE
E
1 I
t nev
er p
rese
nts
a
chal
lenge
2 I
t ra
rely
pre
sents
a
chal
lenge
3 S
om
etim
es i
t
pre
sents
a c
hal
lenge
4 I
t oft
en p
rese
nts
a
chal
lenge
5 I
t al
way
s pre
sents
a
chal
lenge
9 D
on't
know
/don't
wan
t to
answ
er/
can't
answ
er
Med
ium
gra
de
Intangibility and
consumer
confidence.
Number of experts
(N=11)
0 1 2 7 1 0 3,73
Percentage
of
consumers
(N=113)
5,31% 7,96% 22,12% 37,17% 25,66% 1,77% 3,71
Other people's
fake activities.
Number of
experts
(N=11)
0 2 4 2 3 0 3,55
Percentage
of
consumers
(N=113)
3,54% 11,50% 27,43% 28,32% 27,43% 1,77% 3,66
Monitoring of
data protection and behavior
regulation
according to
them.
Number of
experts (N=11)
2 2 3 0 4 0 3,18
Percentage
of
consumers
(N=113)
5,31% 14,16% 25,66% 28,32% 19,47% 7,08% 3,46
Table 5: Opinions of experts and consumers regarding security as an internet marketing
communication challenge
(Source: research)
From table 5 we can see that the biggest difference between the opinions of experts and
consumers refers to monitoring of data protection and behavior regulation according to them
when we look at a group of challenges connected with security. The mean grade of the experts
is 3.18, which indicates that on average they think that data protection sometimes occurs as a
challenge for the companies they work for, but it should be emphasized that response dispersion
indicates a large standard deviation. Also, consumers are on average (3.46) aware of the
frequency of this challenge and they (28,32%) think that in general this often presents a
challenge for companies. For the other two challenges in this group (intangibility and consumer
confidence and other people's fake activities) examined experts and consumers gave on average
similar grades. Although, the average rating of the experts regarding the challenge of other
people's fake activities is 3.55, which indicates that, on average, the experts consider this
challenge frequent. However, the distribution of data suggesting a large standard deviation
should also be considered, so the mean score should be taken with caution. Consumer responses
are also fairly divided, with a mean score of 3.66 showing that consumers surveyed consider
the challenge of other people's fraudulent activities to be frequent.
Table following on the next page
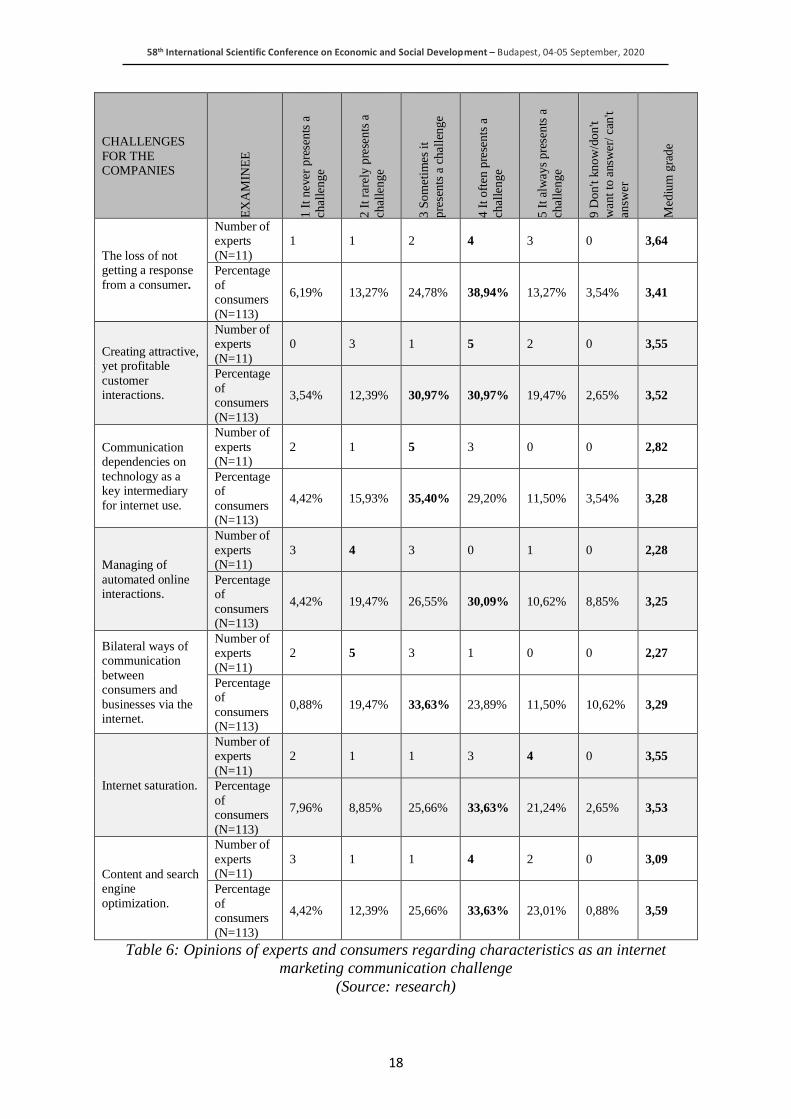
58th International Scientific Conference on Economic and Social Development – Budapest, 04-05 September, 2020
18
CHALLENGES
FOR THE COMPANIES
EX
AM
INE
E
1 I
t nev
er p
rese
nts
a
chal
lenge
2 I
t ra
rely
pre
sents
a
chal
lenge
3 S
om
etim
es i
t
pre
sents
a c
hal
lenge
4 I
t oft
en p
rese
nts
a
chal
lenge
5 I
t al
way
s pre
sents
a
chal
lenge
9 D
on't
know
/don't
wan
t to
answ
er/
can't
answ
er
Med
ium
gra
de
The loss of not getting a response
from a consumer.
Number of experts
(N=11)
1 1 2 4 3 0 3,64
Percentage
of consumers
(N=113)
6,19% 13,27% 24,78% 38,94% 13,27% 3,54% 3,41
Creating attractive, yet profitable
customer interactions.
Number of experts
(N=11)
0 3 1 5 2 0 3,55
Percentage
of consumers
(N=113)
3,54% 12,39% 30,97% 30,97% 19,47% 2,65% 3,52
Communication dependencies on
technology as a key intermediary
for internet use.
Number of
experts (N=11)
2 1 5 3 0 0 2,82
Percentage of
consumers (N=113)
4,42% 15,93% 35,40% 29,20% 11,50% 3,54% 3,28
Managing of
automated online interactions.
Number of
experts (N=11)
3 4 3 0 1 0 2,28
Percentage of
consumers (N=113)
4,42% 19,47% 26,55% 30,09% 10,62% 8,85% 3,25
Bilateral ways of communication
between consumers and
businesses via the internet.
Number of experts
(N=11)
2 5 3 1 0 0 2,27
Percentage of
consumers (N=113)
0,88% 19,47% 33,63% 23,89% 11,50% 10,62% 3,29
Internet saturation.
Number of experts
(N=11)
2 1 1 3 4 0 3,55
Percentage
of consumers
(N=113)
7,96% 8,85% 25,66% 33,63% 21,24% 2,65% 3,53
Content and search engine
optimization.
Number of
experts (N=11)
3 1 1 4 2 0 3,09
Percentage
of consumers
(N=113)
4,42% 12,39% 25,66% 33,63% 23,01% 0,88% 3,59
Table 6: Opinions of experts and consumers regarding characteristics as an internet
marketing communication challenge
(Source: research)
58th International Scientific Conference on Economic and Social Development – Budapest, 04-05 September, 2020
19
From the results shown in the last table we can see that the opinions of experts and consumers
also are not so different as they might be. So, in general experts and consumers agree that on
average the creating attractive yet profitable customer interactions, communication
dependencies on technology as a key intermediary for internet use, internet saturation presents
the same challenge for both experts and consumers. And on the other hand, the average rating
of the experts when we look at the loss due to response as a challenge is 3.64, and the average
rate of consumers is 3.41 which means that experts often find this as a challenge for companies
they work for, and their consumers think this sometimes presents a challenge for that same
companies. Automated interaction management on average experts (2.28) consider as a rare
challenge and distribution of consumer responses compared to expert responses indicates that
consumers find this challenge to occur more frequently, and thus their average score is 3.25.
This means that, on average, consumers find that this challenge for businesses occurs
sometimes. The average of the examined experts when looking at bilateral communication as a
challenge is 2.27, which indicates that the experts consider this challenge rare. Consumers, on
the other hand (3.29), find that this challenge comes up more often than experts. The opinions
of the experts regarding the emergence of the challenges of content optimization and search
engine diverge optimization, that are shown in this table, indicates that on average experts think
that content optimization sometimes presents a challenge for companies, and consumers (3.59)
consider this challenge to occur more frequently.
4. CONCLUSION
This paper is based on a field closely related to technological development, which is of utmost
importance for modern companies. The paper deals with the field of internet marketing
communication and the challenges companies can occur with by doing business in online
environment. By systematically summarizing the literature, six categories of potential
challenges were identified, and both empirical research was based on them. The research found
that the challenges identified were based on various features of internet marketing
communication, but also on general marketing influencing events. Conducting research into
two groups, one consisting of consumers and the other marketing professionals, ensured
significant data collection. The data were processed by descriptive statistics, which showed that
experts are well aware of consumers when it comes to internet marketing communications, but
also that consumers are well versed in this area when considering potential challenges for
companies. According to experts, the most common challenges for companies are monitoring
the characteristics, desires and needs of consumers online, the use of ad blockers and / or pop-
up blockers by consumers, consumer distrust, the loss of not receiving consumer responses, and
the challenge of managing content about a company, brand, or product created by consumers
on the internet. On the other hand, the most common challenges are the challenge of monitoring
consumer reviews on the internet, the challenge of message formatting, the challenge of
managing automated online interactions, and the challenge of bilateral communication between
consumers and companies via the internet. At the same time, the opinions of consumers and
companies are only slightly different, which indicates the consumer's awareness of the topic of
internet marketing communication. In addition to the classical empirical research, the paper
went a step further, providing data that reflects more than the current challenges of internet
marketing communication. It has been revealed whether experts but also consumers can be put
in the opposite position and how skilled they are. Therefore, this work can serve as a significant
basis for further research, which would include, in addition to descriptive, detailed statistical
analyses. In addition, all the results obtained can be used as a basis for research and business
decision-making related to internet marketing communication.
58th International Scientific Conference on Economic and Social Development – Budapest, 04-05 September, 2020
20
LITERATURE:
1. Abashidze, I. (2017) Integrated Marketing Communications in web 2.0 environment:
Challenges and Opportunities of online presence. Journal of Research in Marketing, 8(1),
617-623
2. Broderick, A., Pickton, D. (2005) Integrated marketing communications. Harlow: Pearson
Education
3. Chaffey, D., Ellis-Chadwick, F., Mayer, R., Johnston, K. (2009) Internet marketing:
strategy, implementation and practice. Pearson Education
4. Dehghani, M., Tumer, M. (2015) A research on effectiveness of Facebook advertising on
enhancing purchase intention of consumers. Computers in Human Behavior, 49, 597-600
5. Harris, L., Dennis, C. (2011) Engaging customers on Facebook: Challenges for e‐retailers.
Journal of Consumer Behaviour, 10(6), 338-346
6. Hofacker, C. F., Belanche, D. (2016) Eight social media challenges for marketing managers.
Spanish Journal of Marketing-ESIC, 20(2), 73-80
7. Kimiloglu, H. (2004) The "E-Literature": A Framework for Understanding the
Accumulated Knowledge about Internet Marketing. Academy of Marketing Science
Review, 2004, 1
8. Leeflang, P. S., Verhoef, P. C., Dahlström, P., Freundt, T. (2014) Challenges and solutions
for marketing in a digital era. European management journal, 32(1), 1-12
9. Okazaki, S., Taylor, C. R. (2013) Social media and international advertising: theoretical
challenges and future directions. International marketing review, 30(1), 56-71
10. Quraishi, F. F., Butt, M. A., Zaman, M., & Khan, S. M. (2017). Marketing Online: A
Descriptive Approach
11. Stokes, R. (2009) eMarketing: The essential guide to online marketing. South Africa: Quirk
eMarketing
58th International Scientific Conference on Economic and Social Development – Budapest, 04-05 September, 2020
21
SMART AGRICULTURE AND ERP BENEFITS IN THE CONTEXT OF
DIGITAL TRANSFORMATION
Ana Kutnjak
University of Zagreb, Faculty of Organization and Informatics,
Pavlinska 2, Varaždin, Croatia
Igor Pihir
University of Zagreb, Faculty of Organization and Informatics,
Pavlinska 2, Varaždin, Croatia
Katarina Tomicic-Pupek
University of Zagreb, Faculty of Organization and Informatics,
Pavlinska 2, Varaždin, Croatia
ABSTRACT
Enterprise Resource Planning (ERP) systems are designed to support operational processes in
the organization and ensure more efficient and quality business performance. Although the ERP
implementation is a demanding project, it is well known that organizations investing in ERP
systems, achieve many benefits. In current business trends, ERP systems are considered as main
source of business data for successful company management and common ground for Digital
Transformation (DT) of modern enterprise. Digital Transformation paradigm indicates the
importance of these systems, which become the basis for data collection and allocation during
transformation. Smart Agriculture uses emerging technologies of Industry 4.0 to provide
automation, real-time data, prediction and management of agricultural business which extend
the standard production, sales, procurement and inventory management processes. This paper
deals with literature review on ERP benefits and questions ERP usefulness, in the Digital
Transformation era, process improvement and enrichment by emerging technologies in the field
of agriculture. In the context of Digital Transformation, the adaptation of ERP systems is
needed to ensure that organizations can enhance their digital capabilities and create the
preconditions for innovation and Smart Agriculture.
Keywords: ERP Systems, Digital Transformation, Smart Agriculture, Benefits
1. INTRODUCTION
Enterprise Resource Planning (ERP) systems are business information systems designed to
provide complete control of business processes in organization. Their emergence was recorded
during the 1990s, with the development of simple applications into customizable software
systems. ERP systems apply and integrate various business functions in organizations (among
others, accounting, human resources, customer relationship, sales, purchasing, distribution)
(Hamundu, Wibowo & Budiarto, 2012), (de Araújo Santos, Lima & Filho, 2010) so that each
employee has access to relevant information at any time (Gattiker & Goodhue, 2004). As far as
databases is concerned, ERP uses logically a single database for data entry, recording,
processing and monitoring, ERP encompasses all functions and departments within an
organization and enhances interdepartmental collaboration and coordination among them
(Hamundu, Wibowo & Budiarto, 2012). This eliminates redundancies and input errors, while
the reporting function is easily achieved (Murphy & Simon, 2002). The purpose of an ERP
system is to create a more optimal business process that will deliver potential savings and affect
58th International Scientific Conference on Economic and Social Development – Budapest, 04-05 September, 2020
22
final productivity (Koh, Gunasekaran & Rajkumar, 2008). The implementation of ERP systems
enables organizations to move to an expanded business model that will increase value across
the supply chain (Kelle & Akbulut, 2005). Greater interdependence of organizational units is
closely related to the benefits of implementation, while differentiation is correlated with high
costs of an ERP project (Gattiker & Goodhue, 2004). Due to its complexity, high costs and a
strict timetable, ERP implementation is a very risky project (Ahituv, Neumann & Zviran, 2002)
and it often combines the implementation of a new information system with business process
redesign. The recent emergence of Industry 4.0, which emphasizes a focus on collecting,
analysing and deploying large data sets to improve business efficiency, calls into question the
functionality and obsolescence of standard ERP systems. For this reason, individual
organizations have begun to move from a standard system that essentially captures and collects
data to systems that enable engagement, notification and decision support, referred to as
intelligent ERP systems (i-ERP) (Trillium Network for Advanced Manufacturing, 2020). Given
that information and communication technologies (ICTs) influence the improvement of
business processes (Ellram & Zsidisin, 2002), the question is how to manage and improve the
business of the entire organization. One way of empowering organizations and achieving
competitiveness in the market is certainly the Digital Transformation (DT) of businesses.
Guided by changing business models and processes and focusing them on improving the
customer experience, it is one of the more complex projects of organizations (Kutnjak, Pihir &
Tomičić Furjan, 2019). DT and the application of technological innovations have made it
possible to connect with customers at different levels - from exchanging information about
satisfaction and the buying process to helping with the purchase itself or custom-made pick-up.
The initial approach to the transformation process is, among other things, seen in the analysis
of large amounts of data and their efficient utilization. This is where ERP systems come to the
fore, as collectors and providers of relevant data in the DT process. In the context of Digital
Transformation agriculture advanced to a broader use of Industry 4.0 technologies in order to
become Smart Agriculture or Agriculture 4.0 (Lezoche al, 2020), (Mazzetto, Gallo & Sacco,
2020). These new concepts use all available Industry 4.0 technologies such as Big Data et.,
Internet of Things (IoT), Artificial Intelligence (AI), Cloud Computing (CC), Blockchain and
other emerging technologies to support among other Precision and Smart Agriculture
development. This all together digitally transforms farming and food production with
supporting the whole supply chains (Lezoche et al, 2020), (Agrawal & Kamboj, 2019),
(Zaripova et al, 2019). In that sense, this research systematizes benefits for Smart Agriculture
and its digital transformation with use of / relying on ERP systems as a base ICT support in
business processes extended with large use of emerging technologies of Industry 4.0. When
implementing any complex information system, it is necessary to consider the profitability of
such investment. As the role of information technology (IT) is steadily increasing and
occupying a central place in business, it is questioned what are the resources that organizations
are willing to invest in IT assets, and what are the benefits of such investments (Johansson et
al, 2016). The aim of this research is to identify the two previously mentioned parameters -
costs and benefits, through Cost-Benefit Analysis (CBA) when implementing ERP projects.
CBA allows companies to compare the expected cost of the investment and its benefits. If the
costs are balanced with benefits, it is very likely that the organization will decide to implement
the initiated projects (Chang & Hsu, 2017). The current market situation creates global
competition that forces organizations to continually improve their performance (Hamundu,
Wibowo & Budiarto, 2012) and to initiate competing projects. For this purpose, the Digital
Transformation paradigm has also been considered, and in correlation with ERP. Accordingly,
the role of ERP in the context of Digital Transformation of Smart Agriculture has been
explored, with an insight into CBA. Research in this paper focuses on research questions related
to (1) investigate which costs and benefits of implementing or owning an ERP system of any
58th International Scientific Conference on Economic and Social Development – Budapest, 04-05 September, 2020
23
kind (with support for key business functions, common database, integrated operation and
availability of transactional data supporting key business processes) are reported in existing
literature and (2) to contribute to the understanding which same or similar benefits occur in
Smart Agriculture in time of Digital Transformation, i.e. the application of Industry 4.0
technologies. Additional research questions were dealing with the multiplication effect of
benefits when ERP is used together with emerging technologies such as IoT, Big Data, Cloud
Computing, AI and similar in field of agriculture. The paper is structured as follows. At the
outset, a research methodology is defined. Next, the systematization of the conducted literature
analysis enabled the identification of costs and benefits related to the implementation and use
of ERP. The following chapter deals with ERP systems and its role in Digital Transformation,
followed by the analysis of ERP role in Smart Agriculture extended with use of emerging
technologies of Industry 4.0. Final results in following chapters show costs and benefits of ERP
in general and additional benefits of ERP in of the context of Digital Transformation and use
in Smart Agriculture with Industry 4.0 technologies.
2. RESEARCH METHODOLOGY
In order to gain insights into research related to benefits of ERP, Smart Agriculture and Digital
Transformation, literature analysis was performed. Literature review was focused on published
papers in journals and conference proceedings. The aforementioned papers were searched in
the recognized databases and platforms such as: Scopus, Web of Science (WoS), IEEE and
finally Google Scholar. The analysis was performed in two phases:
1. The first phase included papers searched by a complex query with keywords: "cost benefit"
and "enterprise resource planning" or “ERP”; and in
2. The second phase additional analysis was made separately with same terms “cost benefit”
and "enterprise resource planning" or “ERP” but this time with extension to additional terms
“Digital Transformation” and “Smart Agriculture” without limiting the year of publication
in both searches.
The mix of terms was also used to limit the number of hits and exclude non-valid research
results. While all searched platforms gave some results additional criterion to include papers in
this research was the relevance to topic of research. Furthermore, it was found that some results
were found in several databases, i.e. platforms, while the basic analysis (abstract, introduction,
conclusion) indicated that some papers were not related to the chosen research topic, which led
to their exclusion from the analysis. Finally, the first phase of the literature review and research
resulted with an analysis of 17 selected papers relevant to the implementation of ERP projects
and a cost-benefit analysis. In the second phase the pool of papers was updated with addition
of 18 new papers (1 is the same as in first phase) concerning also “Smart Agriculture” and
“Digital Transformation”. This second phase literature review was conducted to review another
research question related to the benefits of applying ERP systems in Smart Agriculture and its
Digital Transformation.
3. COST-BENEFIT ANALYSIS OF ERP IMPLEMENTATION AND USAGE
Organizational managers are quite reserved when deciding to invest in ERP systems because
of the high investment costs and complexity of the implementation process (Hamundu, Wibowo
& Budiarto, 2012). Differentiation of subunits in an organization makes it difficult to ERP
implementation, which leads to incompatibility of ERP with certain operational and
information needs of subunits (Gattiker & Goodhue, 2004). In this way, design and trade-off
costs are created, while in contrast, the high integration and standardization of ERPs increase
the interdependence of organizational units, thereby improving sharing information, quality of
service and cost savings (Kelle & Akbulut, 2005).
58th International Scientific Conference on Economic and Social Development – Budapest, 04-05 September, 2020
24
The most common motivation for implementing ERP is to replace the existing system, to
automate and streamline business processes. Implementations focused on the entire structure of
an organization and its business processes increase focus and lead to better financial results in
a shorter period of time (Murphy & Simon, 2002). The implementation project is a
comprehensive and complex process that involves high costs, a large number of human
resources and a short timetable for activities. Organizations that strategically and structurally
approach ERP implementation can achieve 10% savings in total IT costs within 5 years (Ahituv,
Neumann & Zviran, 2002), and careful project planning and management can be a source of
competitive advantage (Koh, Gunasekaran & Rajkumar, 2008). Successful justification of ERP
implementation project requires a monetary assessment of its benefits and costs (Murphy &
Simon, 2002). A common approach to identifying and evaluating investments is CB analysis
(Johansson et al, 2016). It provides a comprehensive overview of the costs and benefits
associated with an investment and allows for an assessment of the net investment benefits. In
CB analysis, organizations include the Return on Investment (ROI) method, Net Present Value
(NPV) and Internal Rate of Return (IRR) (Murphy & Simon, 2001) to quantify the value of
their investments. As such, CB analysis provides an approach that, in addition to considering
multiple criteria, also provides an efficiency standard for assessing and managing the key
factors for (un)success of ERP implementation (Hamundu, Wibowo & Budiarto, 2012). When
evaluating IT projects, it is more challenging to quantify and determine adequate financial value
of some benefits. Although managers are often focused on quantitative results when they
evaluating projects, which is understandable because of the large amount of capital investment,
the increasing importance of intangible investments suggests that they need to be included in
the assessment of implementation success (Murphy & Simon, 2002). For this reason, intangible
measures need to be added to quantitative techniques (Hamundu, Wibowo & Budiarto, 2012)
(such as influencing customer satisfaction, creating perceived value for business, facilitating
decision making) in order for evaluation to be comprehensive (Johansson et al, 2016). Although
all business disciplines face the issue of quantifying intangible benefits, it is important to
include them in a comprehensive analysis to make the final assessment of investment results as
accurate as possible (Murphy & Simon, 2001). The research found that organizations lacked
the ambition to evaluate ERP investments and to quantify soft, intangible values. Organizations
show structured monitoring of investment costs (Johansson et al, 2016), however they do not
focus on the return on investment. Managers find it difficult to evaluate the success of ERP
implementation, and if the value of the implementation is quantified, the accuracy and relia-
bility of its evaluation will be questioned (Hamundu, Wibowo & Budiarto, 2012). It can be
concluded that those organizations that track their return on investment and make a
comprehensive assessment are rare. For companies to gain a competitive edge, they must define
the correct way to verify the viability of IT investments. The results show that the traditional
CB analysis method can be applied to large IT projects (such as ERP system implementation),
but with the inclusion of intangible measures. Therefore, an enhanced and comprehensive
analysis is provided that gives managers a more realistic view of the yield of introducing an
ERP system into the business. In this way, intangible values are used as a complement to CB
analysis, and it itself shows results that were not once considered measurable (Murphy &
Simon, 2001). Successful and strategically planned investing in ERP shows a positive cost-
benefit ratio, although it takes several years for capitalization of investments (de Araújo Santos,
Lima & Filho, 2010).
4. ERP SYSTEMS IN THE CONTEXT OF DIGITAL TRANSFORMATION
Once implemented, the ERP system requires adaptation to market changes. The current digital
era is questioning the features of an ERP system and its functionality. According to authors
(Cocca et al, 2018) “ERP systems represent the central core of the entire suite of enterprise
58th International Scientific Conference on Economic and Social Development – Budapest, 04-05 September, 2020
25
systems and they are considered the backbone for the Industry 4.0 (Haddaraab and Elragala,
2015)”. ERP is also driven by constantly changing customer needs and expectations (Kryvinska
& Bickel, 2020).. Defining a strategic plan focused on new technology, people and processes
(Sultana, Sabir & Shah, 2018) will enable the transformation of ERP into a system appropriate
to the new digital age (Asprion, Schneider & Grimberg, 2018). Organizations accelerate their
innovation processes (Menshikova, Piunova & Makhova, 2019) and make supply chains more
flexible, while supporting role of ERP managing financial resources, creating new values and
new business models (Križanić, Šestanj-Perić & Tomičić-Pupek, 2019) . The increasing amount
of data (collected on social networks, mobile devices, based on various analytics) requires
system compatibility with the ability to store them (Westerman & Bonnet, 2019) but also to
process them in real time. ERP systems will need to deliver extensive solutions as part of the
standard package, while on the other hand, the emphasis will be on its flexibility and adap-
tation to different organizational structures. In addition, the system needs to focus on taking on
routine tasks, but also to focus on non-routine, analytical and creative activities aimed at end-
user satisfaction (Aleš, 2017). ERP systems must enable users to better predict and plan
business results (Chuong, Hung & Diep, 2019), define recommendations regarding best
business decisions and process automation, that is, enable innovation at the level of customer
experience, business processes and data (Morris et al, 2016). The task of business architects in
companies is to be as involved as possible in planning the strategy of Digital Transformation
(Singha, Klarner and Hess, 2019) in order to ensure the proper design of the entire system, but
also the design of alternative configurations (Babar & Yu, 2015). ERP systems, adequate to the
digital age, must enable access to information through multiple information systems,
information general exchange and integration with other applications (Williams and Schubert,
2018) , systems (Temel & Ayaz, 2019) and modern package solutions (Sotnyk et al, 2020)
within the company (Strutynska et al, 2019). Such integration will enable the creation of a mod-
ern business tool (Sotnyk et al, 2020) that will be more responsive to the needs of the company,
and will allow precise adaptation of business operations and improved the integration of data
and processes. In addition to the internal integration of the system, the importance of the
integration of the ERP system of business partners is emphasized (Ghannam et al, 2019) for the
purpose of global coordination and mutual harmonization of production (Kilimis et al, 2019).
Current ERP market trends are Cloud ERP and Internet of Things (IoT) ERP. Cloud ERP,
because it reduces the costs of ERP suppliers, allows for easy upgrades, easier access and
centralized control (Hartley & Sawaya, 2019), while the integration of IoT into ERP could
promises to affect the collection of highly relevant data for the company with the ability to
visualize them (Sokač & Picek, 2019) . In order for the system to function satisfactorily, it is
necessary to implement the necessary ERP changes before implementing technologies that will
use ERP data (Hartley & Sawaya, 2019), with an emphasis on the holistic application of the
ERP system (Kilimis et al, 2019). Intuitiveness, easy understanding, rapid implementation,
meeting standard customer needs, monitoring changes in technology and market demands
(Aleš, 2017), are characteristics of ERP systems that must be met in the new digital age
supporting and enabling the Digital Transformation of modern companies.
5. ERP, EMERGING TECHNOLOGIES, INDUSTRY 4.0 AND SMART
AGRICULTURE
According to major trends in Digital Transformation of agriculture (Zaripova et al, 2019) and
similar papers (Asprion, Schneider & Grimberg, 2018), (Mazzetto, Gallo & Sacco, 2020),
Smart Agriculture with use of Industry 4.0 technologies and integrated ERP solutions
incorporates benefits of technology to improve management efficiency, creation, scheduling
and aggregation of data flows to create end-to-end chains from production to consumption.
Smart agriculture, Precise Agriculture and Smart Farming improve food production and safety
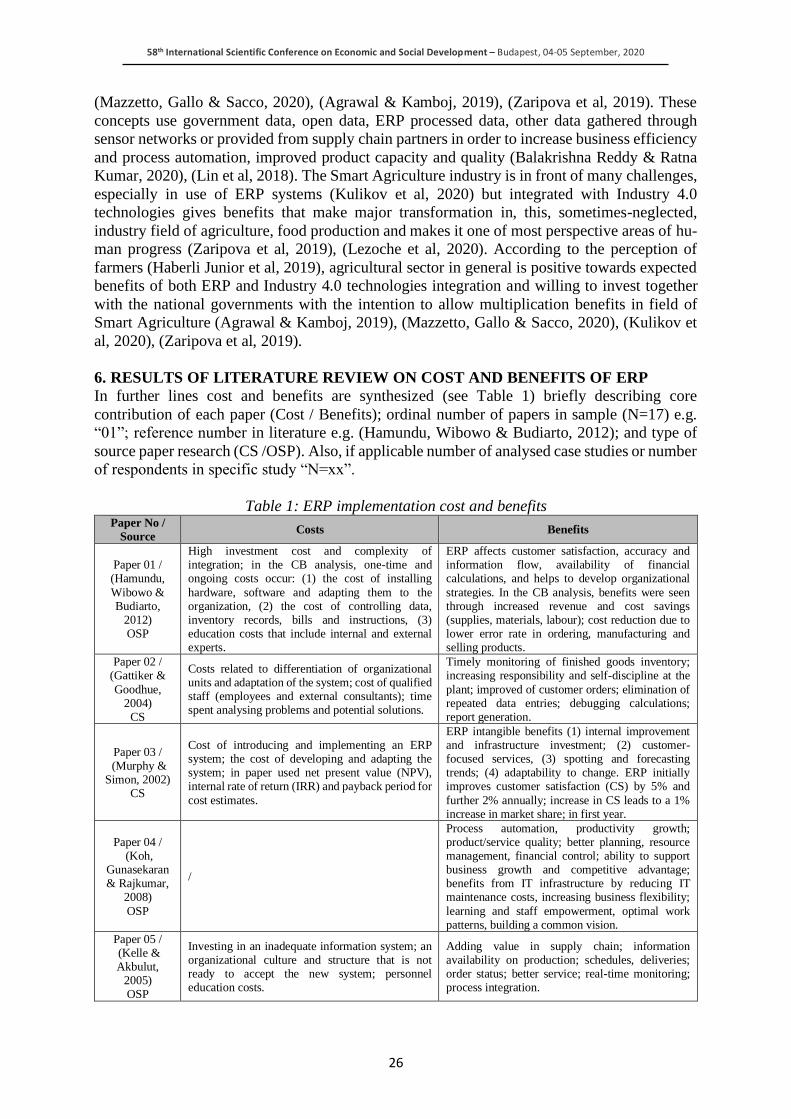
58th International Scientific Conference on Economic and Social Development – Budapest, 04-05 September, 2020
26
(Mazzetto, Gallo & Sacco, 2020), (Agrawal & Kamboj, 2019), (Zaripova et al, 2019). These
concepts use government data, open data, ERP processed data, other data gathered through
sensor networks or provided from supply chain partners in order to increase business efficiency
and process automation, improved product capacity and quality (Balakrishna Reddy & Ratna
Kumar, 2020), (Lin et al, 2018). The Smart Agriculture industry is in front of many challenges,
especially in use of ERP systems (Kulikov et al, 2020) but integrated with Industry 4.0
technologies gives benefits that make major transformation in, this, sometimes-neglected,
industry field of agriculture, food production and makes it one of most perspective areas of hu-
man progress (Zaripova et al, 2019), (Lezoche et al, 2020). According to the perception of
farmers (Haberli Junior et al, 2019), agricultural sector in general is positive towards expected
benefits of both ERP and Industry 4.0 technologies integration and willing to invest together
with the national governments with the intention to allow multiplication benefits in field of
Smart Agriculture (Agrawal & Kamboj, 2019), (Mazzetto, Gallo & Sacco, 2020), (Kulikov et
al, 2020), (Zaripova et al, 2019).
6. RESULTS OF LITERATURE REVIEW ON COST AND BENEFITS OF ERP
In further lines cost and benefits are synthesized (see Table 1) briefly describing core
contribution of each paper (Cost / Benefits); ordinal number of papers in sample (N=17) e.g.
“01”; reference number in literature e.g. (Hamundu, Wibowo & Budiarto, 2012); and type of
source paper research (CS /OSP). Also, if applicable number of analysed case studies or number
of respondents in specific study “N=xx”.
Table 1: ERP implementation cost and benefits Paper No /
Source Costs Benefits
Paper 01 / (Hamundu,
Wibowo & Budiarto,
2012) OSP
High investment cost and complexity of integration; in the CB analysis, one-time and ongoing costs occur: (1) the cost of installing
hardware, software and adapting them to the organization, (2) the cost of controlling data, inventory records, bills and instructions, (3) education costs that include internal and external experts.
ERP affects customer satisfaction, accuracy and information flow, availability of financial calculations, and helps to develop organizational
strategies. In the CB analysis, benefits were seen through increased revenue and cost savings (supplies, materials, labour); cost reduction due to lower error rate in ordering, manufacturing and selling products.
Paper 02 / (Gattiker &
Goodhue, 2004)
CS
Costs related to differentiation of organizational units and adaptation of the system; cost of qualified staff (employees and external consultants); time spent analysing problems and potential solutions.
Timely monitoring of finished goods inventory; increasing responsibility and self-discipline at the
plant; improved of customer orders; elimination of repeated data entries; debugging calculations; report generation.
Paper 03 / (Murphy &
Simon, 2002) CS
Cost of introducing and implementing an ERP system; the cost of developing and adapting the system; in paper used net present value (NPV), internal rate of return (IRR) and payback period for
cost estimates.
ERP intangible benefits (1) internal improvement and infrastructure investment; (2) customer-focused services, (3) spotting and forecasting trends; (4) adaptability to change. ERP initially improves customer satisfaction (CS) by 5% and
further 2% annually; increase in CS leads to a 1% increase in market share; in first year.
Paper 04 / (Koh,
Gunasekaran & Rajkumar,
2008)
OSP
/
Process automation, productivity growth; product/service quality; better planning, resource management, financial control; ability to support business growth and competitive advantage; benefits from IT infrastructure by reducing IT maintenance costs, increasing business flexibility;
learning and staff empowerment, optimal work patterns, building a common vision.
Paper 05 / (Kelle & Akbulut,
2005) OSP
Investing in an inadequate information system; an organizational culture and structure that is not ready to accept the new system; personnel education costs.
Adding value in supply chain; information availability on production; schedules, deliveries; order status; better service; real-time monitoring; process integration.
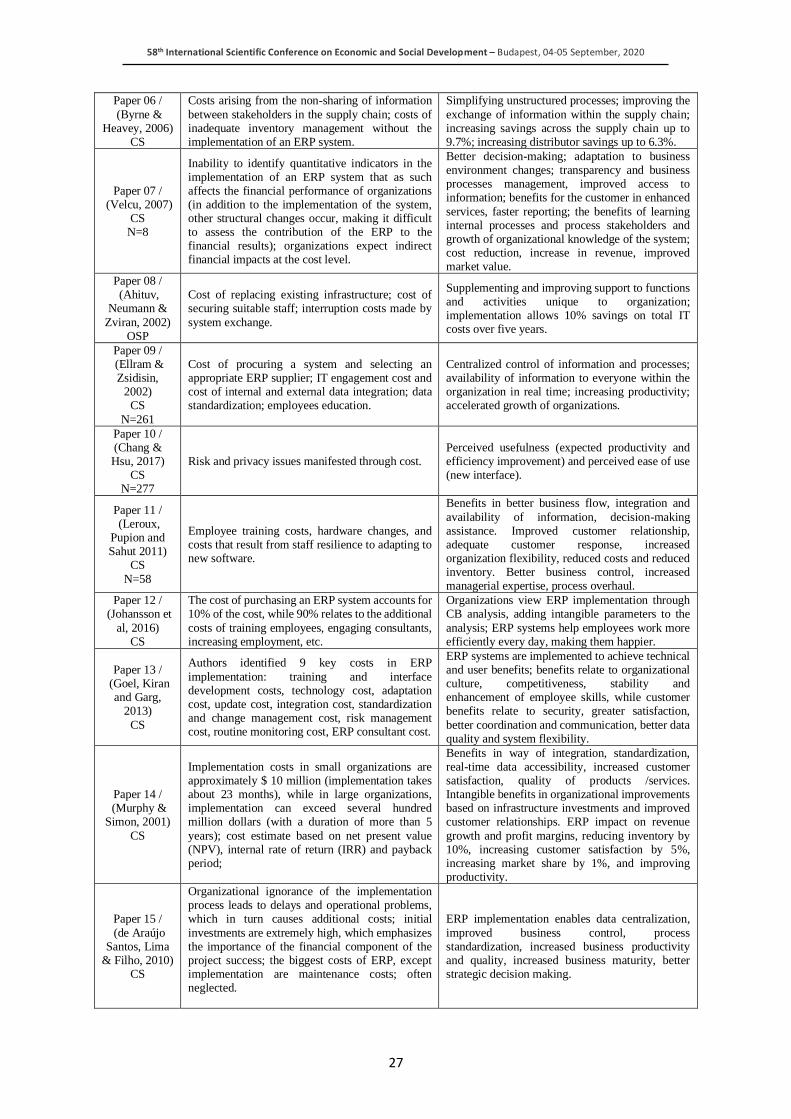
58th International Scientific Conference on Economic and Social Development – Budapest, 04-05 September, 2020
27
Paper 06 /
(Byrne & Heavey, 2006)
CS
Costs arising from the non-sharing of information
between stakeholders in the supply chain; costs of inadequate inventory management without the implementation of an ERP system.
Simplifying unstructured processes; improving the
exchange of information within the supply chain; increasing savings across the supply chain up to 9.7%; increasing distributor savings up to 6.3%.
Paper 07 / (Velcu, 2007)
CS N=8
Inability to identify quantitative indicators in the implementation of an ERP system that as such affects the financial performance of organizations (in addition to the implementation of the system, other structural changes occur, making it difficult to assess the contribution of the ERP to the financial results); organizations expect indirect financial impacts at the cost level.
Better decision-making; adaptation to business environment changes; transparency and business processes management, improved access to information; benefits for the customer in enhanced
services, faster reporting; the benefits of learning internal processes and process stakeholders and growth of organizational knowledge of the system; cost reduction, increase in revenue, improved market value.
Paper 08 / (Ahituv,
Neumann &
Zviran, 2002) OSP
Cost of replacing existing infrastructure; cost of securing suitable staff; interruption costs made by
system exchange.
Supplementing and improving support to functions and activities unique to organization; implementation allows 10% savings on total IT costs over five years.
Paper 09 / (Ellram & Zsidisin,
2002) CS
N=261
Cost of procuring a system and selecting an appropriate ERP supplier; IT engagement cost and cost of internal and external data integration; data standardization; employees education.
Centralized control of information and processes; availability of information to everyone within the organization in real time; increasing productivity; accelerated growth of organizations.
Paper 10 / (Chang & Hsu, 2017)
CS N=277
Risk and privacy issues manifested through cost. Perceived usefulness (expected productivity and efficiency improvement) and perceived ease of use (new interface).
Paper 11 / (Leroux,
Pupion and Sahut 2011)
CS
N=58
Employee training costs, hardware changes, and costs that result from staff resilience to adapting to new software.
Benefits in better business flow, integration and
availability of information, decision-making assistance. Improved customer relationship, adequate customer response, increased organization flexibility, reduced costs and reduced inventory. Better business control, increased managerial expertise, process overhaul.
Paper 12 / (Johansson et
al, 2016) CS
The cost of purchasing an ERP system accounts for 10% of the cost, while 90% relates to the additional
costs of training employees, engaging consultants, increasing employment, etc.
Organizations view ERP implementation through CB analysis, adding intangible parameters to the
analysis; ERP systems help employees work more efficiently every day, making them happier.
Paper 13 / (Goel, Kiran
and Garg, 2013)
CS
Authors identified 9 key costs in ERP
implementation: training and interface development costs, technology cost, adaptation cost, update cost, integration cost, standardization and change management cost, risk management cost, routine monitoring cost, ERP consultant cost.
ERP systems are implemented to achieve technical and user benefits; benefits relate to organizational culture, competitiveness, stability and enhancement of employee skills, while customer benefits relate to security, greater satisfaction,
better coordination and communication, better data quality and system flexibility.
Paper 14 / (Murphy &
Simon, 2001)
CS
Implementation costs in small organizations are approximately $ 10 million (implementation takes about 23 months), while in large organizations, implementation can exceed several hundred million dollars (with a duration of more than 5
years); cost estimate based on net present value (NPV), internal rate of return (IRR) and payback period;
Benefits in way of integration, standardization, real-time data accessibility, increased customer satisfaction, quality of products /services. Intangible benefits in organizational improvements based on infrastructure investments and improved customer relationships. ERP impact on revenue
growth and profit margins, reducing inventory by 10%, increasing customer satisfaction by 5%, increasing market share by 1%, and improving productivity.
Paper 15 /
(de Araújo Santos, Lima
& Filho, 2010) CS
Organizational ignorance of the implementation process leads to delays and operational problems, which in turn causes additional costs; initial
investments are extremely high, which emphasizes the importance of the financial component of the project success; the biggest costs of ERP, except implementation are maintenance costs; often neglected.
ERP implementation enables data centralization,
improved business control, process standardization, increased business productivity and quality, increased business maturity, better strategic decision making.
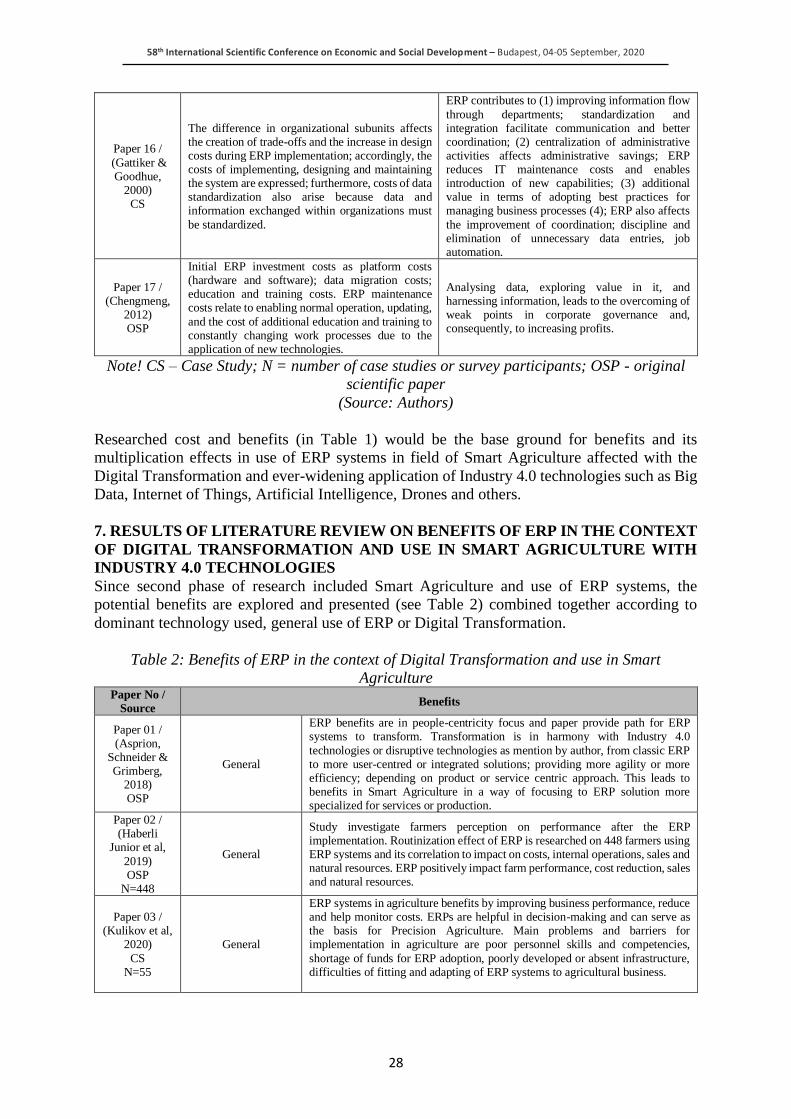
58th International Scientific Conference on Economic and Social Development – Budapest, 04-05 September, 2020
28
Paper 16 /
(Gattiker & Goodhue,
2000) CS
The difference in organizational subunits affects the creation of trade-offs and the increase in design costs during ERP implementation; accordingly, the costs of implementing, designing and maintaining the system are expressed; furthermore, costs of data standardization also arise because data and information exchanged within organizations must
be standardized.
ERP contributes to (1) improving information flow
through departments; standardization and integration facilitate communication and better coordination; (2) centralization of administrative activities affects administrative savings; ERP reduces IT maintenance costs and enables introduction of new capabilities; (3) additional value in terms of adopting best practices for managing business processes (4); ERP also affects
the improvement of coordination; discipline and elimination of unnecessary data entries, job automation.
Paper 17 / (Chengmeng,
2012) OSP
Initial ERP investment costs as platform costs (hardware and software); data migration costs; education and training costs. ERP maintenance costs relate to enabling normal operation, updating,
and the cost of additional education and training to constantly changing work processes due to the application of new technologies.
Analysing data, exploring value in it, and harnessing information, leads to the overcoming of weak points in corporate governance and, consequently, to increasing profits.
Note! CS – Case Study; N = number of case studies or survey participants; OSP - original
scientific paper
(Source: Authors)
Researched cost and benefits (in Table 1) would be the base ground for benefits and its
multiplication effects in use of ERP systems in field of Smart Agriculture affected with the
Digital Transformation and ever-widening application of Industry 4.0 technologies such as Big
Data, Internet of Things, Artificial Intelligence, Drones and others.
7. RESULTS OF LITERATURE REVIEW ON BENEFITS OF ERP IN THE CONTEXT
OF DIGITAL TRANSFORMATION AND USE IN SMART AGRICULTURE WITH
INDUSTRY 4.0 TECHNOLOGIES
Since second phase of research included Smart Agriculture and use of ERP systems, the
potential benefits are explored and presented (see Table 2) combined together according to
dominant technology used, general use of ERP or Digital Transformation.
Table 2: Benefits of ERP in the context of Digital Transformation and use in Smart
Agriculture Paper No /
Source Benefits
Paper 01 / (Asprion,
Schneider & Grimberg,
2018) OSP
General
ERP benefits are in people-centricity focus and paper provide path for ERP systems to transform. Transformation is in harmony with Industry 4.0
technologies or disruptive technologies as mention by author, from classic ERP to more user-centred or integrated solutions; providing more agility or more efficiency; depending on product or service centric approach. This leads to benefits in Smart Agriculture in a way of focusing to ERP solution more specialized for services or production.
Paper 02 / (Haberli
Junior et al,
2019) OSP
N=448
General
Study investigate farmers perception on performance after the ERP implementation. Routinization effect of ERP is researched on 448 farmers using ERP systems and its correlation to impact on costs, internal operations, sales and natural resources. ERP positively impact farm performance, cost reduction, sales and natural resources.
Paper 03 / (Kulikov et al,
2020)
CS N=55
General
ERP systems in agriculture benefits by improving business performance, reduce and help monitor costs. ERPs are helpful in decision-making and can serve as the basis for Precision Agriculture. Main problems and barriers for implementation in agriculture are poor personnel skills and competencies,
shortage of funds for ERP adoption, poorly developed or absent infrastructure, difficulties of fitting and adapting of ERP systems to agricultural business.
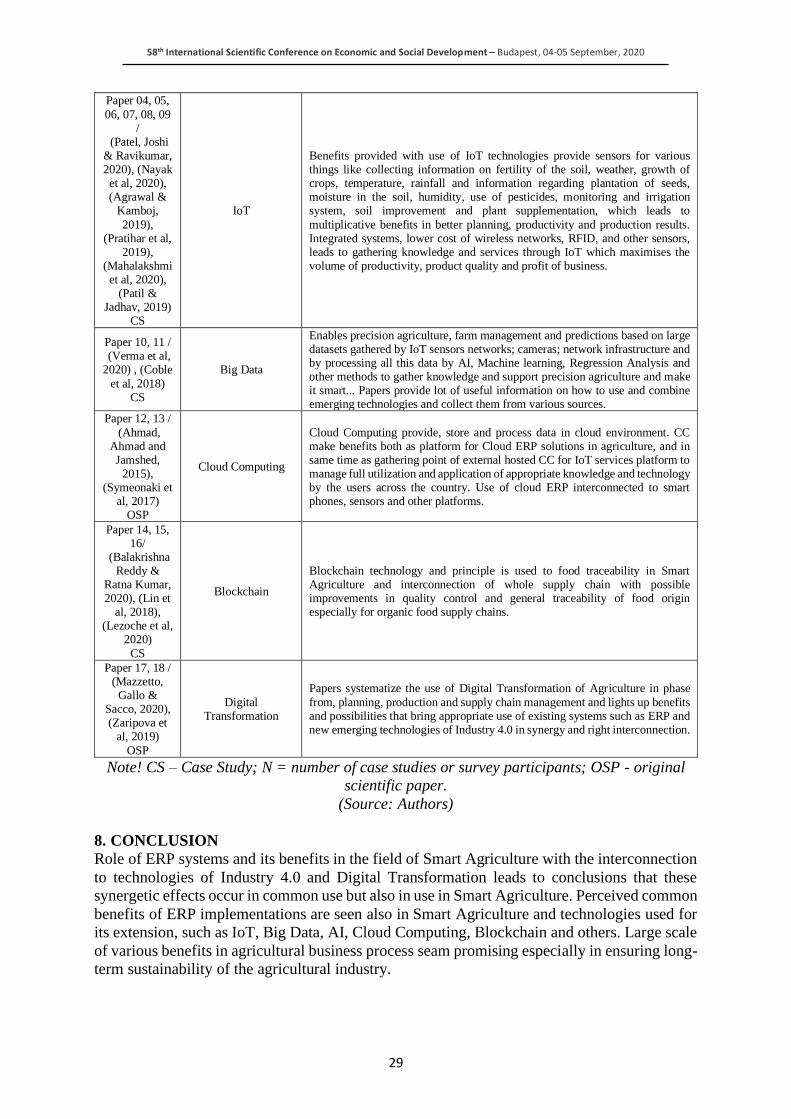
58th International Scientific Conference on Economic and Social Development – Budapest, 04-05 September, 2020
29
Paper 04, 05,
06, 07, 08, 09 /
(Patel, Joshi & Ravikumar, 2020), (Nayak et al, 2020), (Agrawal &
Kamboj,
2019), (Pratihar et al,
2019), (Mahalakshmi et al, 2020),
(Patil & Jadhav, 2019)
CS
IoT
Benefits provided with use of IoT technologies provide sensors for various things like collecting information on fertility of the soil, weather, growth of crops, temperature, rainfall and information regarding plantation of seeds, moisture in the soil, humidity, use of pesticides, monitoring and irrigation system, soil improvement and plant supplementation, which leads to
multiplicative benefits in better planning, productivity and production results. Integrated systems, lower cost of wireless networks, RFID, and other sensors, leads to gathering knowledge and services through IoT which maximises the volume of productivity, product quality and profit of business.
Paper 10, 11 / (Verma et al, 2020) , (Coble
et al, 2018) CS
Big Data
Enables precision agriculture, farm management and predictions based on large datasets gathered by IoT sensors networks; cameras; network infrastructure and by processing all this data by AI, Machine learning, Regression Analysis and other methods to gather knowledge and support precision agriculture and make it smart... Papers provide lot of useful information on how to use and combine emerging technologies and collect them from various sources.
Paper 12, 13 /
(Ahmad, Ahmad and Jamshed,
2015), (Symeonaki et
al, 2017) OSP
Cloud Computing
Cloud Computing provide, store and process data in cloud environment. CC make benefits both as platform for Cloud ERP solutions in agriculture, and in same time as gathering point of external hosted CC for IoT services platform to manage full utilization and application of appropriate knowledge and technology by the users across the country. Use of cloud ERP interconnected to smart phones, sensors and other platforms.
Paper 14, 15, 16/
(Balakrishna Reddy &
Ratna Kumar, 2020), (Lin et
al, 2018), (Lezoche et al,
2020)
CS
Blockchain
Blockchain technology and principle is used to food traceability in Smart Agriculture and interconnection of whole supply chain with possible improvements in quality control and general traceability of food origin especially for organic food supply chains.
Paper 17, 18 / (Mazzetto,
Gallo & Sacco, 2020), (Zaripova et
al, 2019)
OSP
Digital Transformation
Papers systematize the use of Digital Transformation of Agriculture in phase
from, planning, production and supply chain management and lights up benefits and possibilities that bring appropriate use of existing systems such as ERP and new emerging technologies of Industry 4.0 in synergy and right interconnection.
Note! CS – Case Study; N = number of case studies or survey participants; OSP - original
scientific paper.
(Source: Authors)
8. CONCLUSION
Role of ERP systems and its benefits in the field of Smart Agriculture with the interconnection
to technologies of Industry 4.0 and Digital Transformation leads to conclusions that these
synergetic effects occur in common use but also in use in Smart Agriculture. Perceived common
benefits of ERP implementations are seen also in Smart Agriculture and technologies used for
its extension, such as IoT, Big Data, AI, Cloud Computing, Blockchain and others. Large scale
of various benefits in agricultural business process seam promising especially in ensuring long-
term sustainability of the agricultural industry.
58th International Scientific Conference on Economic and Social Development – Budapest, 04-05 September, 2020
30
Additionally, when ERP is integrated in digital transformation efforts multiplication effect of
benefits can be expected in terms of better planning, prediction, monitoring, productivity and
production in relation to customer expectations and satisfaction.
ACKNOWLEDGEMENT: This research has been conducted as part of the wider research in
the project Competence Centre for Digital Transformation of the Food Industry in Rural Areas,
which is funded by European Union through the European Regional Development Fund
(ERDF).
LITERATURE:
1. Agrawal, K. and Kamboj, N. (2019). Smart agriculture using IOT: A futuristic approach.
International Journal of Information Dissemination and Technology, Vol. 9, No. 4, pp. 186-
190.
2. Ahituv, N., Neumann, S. and Zviran, M. (2002). A System Development Methodology for
ERP Systems. Journal of Computer Information Systems, Vol. 42, No. 3, pp. 56-67.
3. Ahmad, T., Ahmad, S. and Jamshed, M. (2015). A knowledge based Indian agriculture:
With cloud ERP arrangement. Proceedings of International Conference on Green
Computing and Internet of Things (ICGCIoT), US & Canada: IEEE, pp. 333-340.
4. Aleš, E. (2017). Three Challenges of Digital Transformations for Vendors of ERP Systems
for SMBs. Proceedings of International Conference on Information Technology for Practice,
pp. 47-51.
5. Asprion, P.M., Schneider, B. and Grimberg, F. (2018). ERP Systems towards Digital
Transformation. In: Dornberger, R. (eds.) Business Information Systems and Technology
4.0.: Studies in Systems, Decision and Control, Vol. 141, Cham: Springer.
6. Babar, Z. and Yu, E. (2015). Enterprise Architecture in the Age of Digital Transformation.
Proceedings of International Conference on Advanced Information Systems Engineering,
Heidelberg: Springer, pp. 438-443.
7. Balakrishna Reddy, G. and Ratna Kumar, K. (2020). Quality Improvement in Organic Food
Supply Chain Using Blockchain Technology. In B. Deepak, D. Parhi and P. Jena (ed.),
Innovative Product Design and Intelligent Manufacturing Systems (pp. 887-896).
Singapore: Springer.
8. Byrne, P.J. and Heavey, C. (2006). The impact of information sharing and forecasting in
capacitated industrial supply chains: A case study. International Journal of Production
Economics, Vol. 103, pp. 420-437.
9. Chang, Y.W. and Hsu, P.Y. (2017). An empirical investigation of organizations switching
intention to cloud enterprise resource planning: a cost-benefit perspective. Information
Development, pp. 1-13.
10. Chengmeng, X. (2012). An Analysis of the Cost of the Application of ERP System. IEEE
Symposium on Robotics and Applications, US & Canada: IEEE, pp. 5-8.
11. Chuong, L.V., Hung, P.D. and Diep, V.T. (2019). Robotic Process Automation and
Opportunities for Vietnamese Market. Proceedings of International Conference on
Computer and Communications Management, New York: Association for Computing
Machinery, pp. 86-90.
12. Coble, K.H., Mishra, A.K., Ferrell, S. and Griffin, T. (2018). Big Data in Agriculture: A
Challenge for the Future. Applied Economic Perspectives and Policy, Vol. 40, No. 1, pp.
79–96.
13. Cocca, P., Marciano, F., Rossi, D. and Alberti, M. (2018). Business Software Offer for
Industry 4.0: the SAP case. IFAC-PapersOnline, Vol. 51, No. 11, pp. 1200-1205.
58th International Scientific Conference on Economic and Social Development – Budapest, 04-05 September, 2020
31
14. de Araújo Santos, A., de Lima, J.S.A. and Filho, E.C.B.C. (2010). Benefits of ERP Systems
Implementation in Business in Brazil: Case Studies. Proceedings of 5th Iberian Conference
on Information Systems and Technologies 2010, pp. 1-6.
15. Ellram, L.M. and Zsidisin, G.A. (2002). Factors That Drive Purchasing and Supply
Management's Use of Information Technology. IEEE Transactions on Engineering
Management, Vol. 49, No. 3, pp. 269-281.
16. Gattiker, T.F. and Goodhue, D.L. (2000). Understanding the Plant Level Costs and Benefits
of ERP: Will the Ugly Duckling Always Turn Into a Swan? Proceedings of Hawaii
International Conference on System Sciences, US & Canada: IEEE, pp. 1-10.
17. Gattiker, T.F. and Goodhue, D.L. (2004). Understanding the local-level cost and benefit of
trough organizational information processing theory. Information & Management, Vol.
41, pp. 431-443.
18. Ghannam, A.N., Mansour, H., El-Bastawissy, A. and Hamed, M. (2019). Perspectives of
an Enterprise Integration Plug-in System Architecture for Networked Manufacturing
Systems. Engineering, Technology & Applied Science Research, Vol. 9, No. 2, pp. 4075-
4078.
19. Goel, S., Kiran, R. and Garg, D. (2013). Enterprise Resource Planning in Technical
Educational Institutions: Benefits and Cost. Proceedings of International Conference in
MOOC, Innovation and Technology in Education (MITE), US & Canada: IEEE, pp. 306-
309.
20. Haberli Junior, C., Oliveira, T., Yanaze, M. and Spers, E.E. (2019). Performance, farmer
perception, and the routinisation (RO) moderation on ERP post-implementation. Heliyon,
Vol. 5, No. 6, pp. 1-13.
21. Hamundu, F.M., Wibowo, S. and Budiarto, R. (2012). A hybrid fuzzy-Monte Carlo
simulation approach for economical assessment of the impact of ERP technology. Journal
of ICT, Vol. 11, pp. 93-111.
22. Hartley, J.L. and Sawaya, W.J. (2019). Tortoise, not the hare: Digital transformation of
supply chain business processes. Business Horizons, Vol. 62, No. 6, pp. 707-715.
23. Johansson, B., Karlsson, L., Laine, E. and Wiksell, V. (2016). After a Successful Business
Case of ERP – What happens then?, Procedia Computer Science, Vol. 100, pp. 383-392.
24. Kelle, P. and Akbulut, A. (2005). The role of ERP tools in supply chain information sharing,
cooperation, and cost optimization. International Journal of Production Economics, Vol.
93-94, pp. 41-52.
25. Kilimis, P., Zou, W., Lehmann, M. and Berger, U. (2019). A Survey on Digitalization for
SMEs in Brandenburg, Germany. IFAC-PapersOnline, Vol. 52, No. 13, pp. 2140-2145.
26. Koh, S.C.L, Gunasekaran, A. and Rajkumar, D. (2008). ERP II: The involvement, benefits
and impediments of collaborative information sharing. International Journal of Production
Economics, Vol. 113, pp. 245-268.
27. Križanić, S., Šestanj-Perić, T. and Tomičić-Pupek, K. (2019). The Changing Role of ERP
and CRM in Digital Transformation. Proceedings of International Scientific Conference on
Economic and Social Development 2019, Varazdin Development and Entrepreneurship
Agency, Varazdin, Croatia / Megatrend University, Belgrade, Serbia / University North,
Koprivnica, Croatia / Faculty of Management University of Warsaw, Warsaw, Poland /
Faculty of Law, Economics and Social Sciences Sale - Mohammed V University in Rabat,
Morocco, pp. 248-256.
28. Kryvinska, N. and Bickel, L. (2020). Scenario-Based Analysis of IT Enterprises
servitization as a Part of Digital Transformation of Modern Economy. Applied Sciences,
Vol. 10, No. 3, pp. 1-30.
58th International Scientific Conference on Economic and Social Development – Budapest, 04-05 September, 2020
32
29. Kulikov, I., Semin, A., Skvortsov, E., Ziablitckaia, N. and Skvortsova, E. (2020).
Challenges of enterprise resource planning (ERP) implementation in agriculture.
Entrepreneurship and Sustainability Issues, Vol. 7, No. 3, pp. 1847-1857.
30. Kutnjak, A., Pihir, I. and Tomičić Furjan, M. (2019). Digital Transformation Case Studies
across Industries – Literature Review. Proceedings of International Convention on
Information and Communication Technology, Electronics and Microelectronics 2019,
Rijeka, Croatia: MIPRO, pp. 1498-1503.
31. Leroux, E., Pupion, P.C. and Sahut, J.M. (2011). ERP diffusion and mimetic behaviours.
International journal of business, Vol. 16, No. 2, pp. 1-27.
32. Lezoche, M., Hernandez, J.E., Alemany Diaz, M.M.E., Panetto, H. and Kacprzyk, J. (2020).
Agri-food 4.0: A survey of the supply chains and technologies for the future agriculture.
Computers in Industry, Vol. 117, pp. 1-15.
33. Lin, J., Shen, Z., Zgang, A. and Chai, Y. (2018). Blockchain and IoT based Food
Traceability for Smart Agriculture. Proceedings of International Conference on Crowd
Science and Engineering, ACM Digital Library, pp. 1-6.
34. Mahalakshmi, J., Kuppusamy, K., Kaleeswari, C. and Maheswari, P. (2020). IoT Sensor-
Based Smart Agricultural System. In B. Subramanian, S.S. Chen and K. Reddy (ed.),
Emerging Technologies for Agriculture and Environment (pp. 39-52). Singapore: Springer.
35. Mazzetto, F., Gallo, R. and Sacco, P. (2020). Reflections and Methodological Proposals to
Treat the Concept of “Information Precision” in Smart Agriculture Practices. Sensors, Vol.
20, No. 10, pp. 2847.
36. Menshikova, M.A., Piunova, Y.V. and Makhova, M.N. (2019). Digital Transformation in
the Quality Management System. Proceedings of International Conference Quality
Management, Transport and Information Security, Information Technologies
(IT&QM&IS) 2019, US & Canada: IEEE, pp. 42-46.
37. Morris, H.D., Mahowald, R.P., Jimenez, D.Z., Stratis, A., Rizza, M.N., Hayward D. and
Motai, Y. (2016). i-ERP (Intelligent ERP): The New Backbone for Digital Transformation.
Industry Developments and Models, pp. 1-12.
38. Murphy, K.E. and Simon, S.J. (2001). Using Cost Benefit Analysis for Enterprise Resource
Planning Project Evaluation: A Case for Including Intangibles. Proceedings of 34th Hawaii
International Conference on System Sciences 2001, pp. 1-11.
39. Murphy, K.E. and Simon, S.J. (2002). Intangible benefits valuation in ERP projects. Info
Systems Journal, Vol. 12, pp. 301-320.
40. Nayak, P., Kavitha, K., Mallikarjuna, Rao, C. (2020). IoT-Enabled Agricultural System
Applications, Challenges and Security Issues. In P. Pattnaik, R. Kumar, S. Pal and S. Panda
(ed.), IoT and Analytics for Agriculture, (pp. 139-163). Singapore: Springer.
41. Patel, D.N., Joshi, S.L.G. and Ravikumar, V. (2020). Agriculture Monitoring System Using
IoT-A Survey. In M. Pant, T. Sharma, O. Verma, R. Singla and A. Sikander (ed.), Soft
Computing: Theories and Applications, Advances in Intelligent Systems and Computing
(pp. 631-648). Singapore: Springer.
42. Patil, S.N. and Jadhav, M.B. (2019). Smart Agriculture Monitoring System Using IOT.
International Journal of Advanced Research in Computer and Communication Engineering,
Vol. 8, No. 4, pp. 116-120.
43. Pratihar, R., Bhowmick, R., Ray, B., Sadhukhan, D., Mullik, A. and Deb Majumder, B.
(2019). Smart Agriculture Monitoring and Irrigation System Using IoT. Proceedings of
International Conference on Industry Interactive Innovations in Science, Engineering and
Technology.
44. Singha, A., Klarner, P. and Hess, T. (2019). How do chief digital officers pursue digital
transformation activities? The role of organization design parameters. Long Range
Planning, Vol. 53, No. 3, pp. 1-14.
58th International Scientific Conference on Economic and Social Development – Budapest, 04-05 September, 2020
33
45. Sokač, D. and Picek, R. (2019). Methodological Approach of Integrating the Internet of
Things with Enterprise Resource Planning Systems. Proceedings of International
Conference on Enterprise Information Systems, INSTICC / SCITEPRESS – Science and
Technology Publications, Avenida de S. Francisco Xavier, pp. 320-328.
46. Sotnyk, I., Zavrazhnyi, K., Kasianenko, V., Roubík, H. and Sidorov, H. (2020). Investment
Management of Business Digital Innovations. Marketing and Management of Innovations,
Vol. 1, pp. 95-109.
47. Strutynska, I., Kozbur, G., Dmytrotsa, L., Sorokivska, O. and Melnyk, L. (2019). Influence
of Digital Technology on Roadmap Development for Digital Business Transformation.
Proceedings of International Conference on Advanced Computer Information Technologies
(ACIT), US & Canada: IEEE, pp. 333-337.
48. Sultana, K., Sabir, S.S. and Shah, N. (2018). Qualitative Study on Complementary Resource
Integration: a Case of ERP Implementation. Proceedings of International Conference on
Education and Social Sciences 2018, pp. 241-249.
49. Symeonaki, E.G., Arvanitis, K.G. and Piromalis, D.D. (2017). Cloud Computing for IoT
Applications in Climate-Smart Agriculture: A Review on the Trends and Challenges
Toward Sustainability. In A. Theodoridis, A. Ragkos and M. Salampasis (ed.), Innovative
Approaches and Applications for Sustainable Rural Development (pp. 147-167). Chania
Crete, Greece: Springer, Cham.
50. Temel, A. and Ayaz, M. (2019). Digital Transformation Design of Banbury Mixing Unit in
Tire Manufacturing. Proceedings of International Conference on Applied Automation and
Industrial Diagnostics, US & Canada: IEEE, pp. 1-6.
51. Trillium Network for Advanced Manufacturing. (2020). Retrieved 15.01.2020 from
http://trilliummfg.ca/i-erp-intelligent-enterprise-resource-planning.
52. Velcu, O. (2007). Exploring the effects of ERP systems on organizational performance:
Evidence from Finnish companies. Industrial Management & Data Systems, Vol. 107, No.
9, pp. 1316-1334.
53. Verma, S., Bhatia, A., Chug, A. and Singh, A.P. (2020). Recent Advancements in
Multimedia Big Data Computing for IoT Applications in Precision Agriculture:
Opportunities, Issues, and Challenges. In S. Tanwar, S. Tyagi and N. Kumar (ed.),
Multimedia Big Data Computing for IoT Applications, (pp. 391-416). Singapore: Springer.
54. Westerman, G. and Bonnet, D. (2019). Revamping Your Business Through Digital
Transformation. MIT Sloan Management Review, pp. 1-5. (2015).
55. Williams, S.P. and Schubert, P. (2018). Designs for the Digital Workplace. Procedia
Computer Science, Vol. 138, pp. 478-485.
56. Zaripova, R., Tyurina, M., Rocheva, O., Chupaev, A. and Sharifullina, A. (2019). Major
Trends in the Digital Transformation of Agriculture. In: Advances in Economics, Business
and Management Research 2019, “New Silk Road: Business Cooperation and Prospective
of Economic Development”, Vol. 131, pp. 271-275. France: Atlantis Press.
58th International Scientific Conference on Economic and Social Development – Budapest, 04-05 September, 2020
34
RESEARCH ON THE FINANCIAL LITERACY ON CAPITAL MARKET
AMONG STUDENTS
Karlo Strahija
Student, Faculty of Organization and Informatics Varazdin,
University of Zagreb, Croatia
Marina Klacmer Calopa
Professor, Faculty of Organization and Informatics Varazdin,
University of Zagreb, Croatia
Ivana Dundek Kokotec
Assistant, Faculty of Organization and Informatics Varazdin,
University of Zagreb, Croatia
ABSTRACT
The capital market has developed to an unprecedentedly high level. The participation on the
capital market requires a certain level of financial literacy. Financial literacy is defined as a
combination of awareness, knowledge, skills, attitudes and behaviors essential for making
sensible financial decisions. Financial literacy plays a major role in the business world as well
as in the private sphere of individuals. Nevertheless, not enough attention is given to the
education of citizens and improvement of their financial literacy. This study examines students
in the city of Varaždin at the Faculty of Organization and Informatics (FOI) of the University
of Zagreb and their financial literacy, interest in investing in the capital market and starting
their own business in the future. The research was conducted among 336 students of all study
programs and at all levels of study, and it involved a questionnaire mostly based on the
OECD/INFE (2014) Toolkit for measuring financial literacy and inclusion, while some
questions were proposed by the authors themselves. The object of this research is to determine
the level of financial literacy according to various variables. The research aims to discover
how students’ financial knowledge impacts their aversion towards risks as well as their
inclination towards investing later in life. Finally, the paper aims to establish a link between
students’ inclination towards risks and investment ambitions for the future. The results obtained
by this research show that there is a difference in the level of financial literacy between the
economics majors and students majoring in other subjects. Furthermore, the results indicate
that senior students score higher and demonstrate a higher level of financial literacy than
freshman and sophomore students. Considering that in this study there is a correlation between
the level of financial literacy, study programme and degree level, it can be concluded that
students obtain their financial education and literacy from their study program curricula, which
is confirmed by higher scores achieved by economics majors. Although investing in the capital
market is the first step in generating alternative sources of income and achieving financial
security, the majority of the respondents still expresses no interest in investing in the capital
market.
Keywords: Faculty of Organization and Informatics, Financial literacy, Investment, Education,
Capital market
58th International Scientific Conference on Economic and Social Development – Budapest, 04-05 September, 2020
35
1. INTRODUCTION
According to the OECD International Network on Financial Education (OECD/INFE),
financial literacy is defined as a combination of awareness, knowledge, skills, attitudes and
behavior necessary to make sound financial decisions and ultimately achieve individual
financial well-being. It is important to extend knowledge on financial literacy during one’s
lifetime since each person is faced with at least a dozen financial decisions on a daily basis,
ranging from a desire to spend their money on one thing, invest it in another one or keep it in a
savings account. The understanding of financial terms and concepts has become the key
prerequisite for an efficient and safe money management, which will eventually lead to wealth
accumulation in the future my means of investments. Consequently, individuals have to be
aware of the risks associated with an insufficient level of financial education and how it could
affect their lives (oecd.org, 2014). The concept of financial literacy has still not received enough
attention considering the level of importance it has in people’s everyday lives. The Ministry of
Finance (2019) indicates that every day the banking sector provides new financial services and
products which the majority of people continue using all their lives without ever knowing more
than just the basic information available to them. If the significance of financial literacy and
education on finance and money management remains neglected, individuals could face
numerous financial difficulties, which could ultimately lead them to lose their accommodation
or even life savings. This is precisely the reason why possessing financial knowledge has
become a prerequisite for resolving and averting financial problems, which ultimately results
in a secure life in the third age. Seeing that the results of the financial literacy survey are quite
sobering, the Croatian Ministry of Finance, the main authority responsible for financial literacy
in the Republic of Croatia, developed the National Strategic Framework for Consumer
Financial Literacy for the period 2015 – 2020. The Framework is aimed at improving financial
literacy through various activities including citizens from all age groups and connecting
government bodies, non-government organizations, financial institutions and other legal
entities in their joint participation in financial education programs. (Government Conclusion on
the acceptance of the National Strategic Framework for Consumer Financial Literacy for the
period 2015 – 2020, Official Gazette 11/15). Additionally, in 2005 the OECD Council (2005)
published recommendations on financial education and raising financial awareness as a result
of bad financial literacy statistics worldwide. The Council indicated that financial literacy
programs should be implemented in every citizen’s life and become an important part of their
life. Furthermore, the Council pointed out that financial literacy should be integrated in
regulatory and administrative systems of countries with the aim of providing financial
knowledge, information and advice, and protecting consumers as well. The Council argued that
banks should be the main initiators of financial education of their clients. Moreover, the Council
stressed that bank employees should be the first ones to receive financial education in order to
be able to transfer their knowledge onto citizens (oecd.org, 2005). At the beginning of 2016,
the Croatian Financial Services Supervisory Agency (HANFA) in cooperation with the
Croatian National Bank (HNB) published the results of their joint financial literacy survey
conducted in the Republic of Croatia. This is the largest survey that has ever been conducted at
the national level, and its principal objective was to gather information on financial literacy and
competency level of the citizens of the Republic of Croatia. The results obtained by the survey
suggest that citizens under the age of 19 demonstrate the lowest level of financial knowledge
and skills, and have the least appropriate attitude towards money (Hanfa.hr, 2016). These are
the individuals who have enrolled in tertiary education (university) and three-year vocational
school graduates who already participate in the labor market while still not possessing the level
of financial knowledge sufficient for a responsible management of they own financial assets.
58th International Scientific Conference on Economic and Social Development – Budapest, 04-05 September, 2020
36
Considering the given results, it can be concluded that there is a need for conducting further
research among young people with the ultimate goal of providing youth with financial
education and literacy programs.
2. LITERATURE REVIEW
Recently, extensive research has been conducted on financial literacy of not only students, but
entire populations of particular countries as well. The results of this research suggest that
financial education of citizens is necessary at the global level, but the research undertaken in
the Republic of Croatia shows that it is especially youth that should be the main target of this
type of education. In Croatia, the principal problem is the fact that not much attention is given
to financial literacy, which should be taught from an early age. Instead, citizens acquire most
of their financial knowledge from the media or by individual engagement. As far as students
are concerned, the concepts of financial literacy and the importance of appropriate financial
behavior and attitude towards money can be identified only among students of economics-
oriented universities. These results do not come as a surprise since there already is a large
amount of research supporting precisely this statement, including Chen & Volpe (1998),
Mišević, Pavković i Šoštarić (2016) and (Sarigül, 2014). A significant number of studies
dealing with financial literacy and financial knowledge of students suggest that there is a direct
correlation between various factors and students’ financial literacy. Sarigül (2014) undertook a
study on financial literacy among more than 1.127 students from three universities. The goal of
the study was to determine whether there is a relationship between financial literacy and certain
student characteristics. Sarigül (2014) used a questionnaire of 29 items pertaining to general
financial knowledge on saving and spending, banking, risks and insurance, and investing. The
results of the study indicate that social sciences students demonstrate a higher level of financial
knowledge than students majoring in other subjects. A direct link was identified between
students’ level of financial literacy and knowledge and being a business or economics major.
Furthermore, the results show that senior students scored higher than all the other students,
especially freshman students. Oseifuah, Gyekye and Formadi (2018) conducted a study on the
level of financial literacy of college students in northern Ghana. The main goal of the study was
to examine whether gender, age, study program, study year, parents’ incomes and students’
financial status affect students’ level of financial literacy. The study was based on the
OECD/INFE questionnaire for measuring financial literacy and it included 384 college students
at the University for Development Studies (UDS) in Ghana. The results of the study indicate
that more than 81% of students use financial products, while only 53.5% of the respondents are
financially literate. Moreover, it was noted that students set their own budgets, they do not
exceed the planned monthly budget, and have placed funds into a savings account at a bank.
The majority of students stated having acquired their financial literacy, knowledge and
understanding of financial products and services from their parents, previous experience
involving financial management, and finally educational institutions. The final results suggest
that 45.5% of students are financially illiterate. Danes and Tahira (1987) conducted a study on
money management knowledge of college students. The study included 716 students, 323 of
whom were asked to answer 51 questions in order to establish a correlation between students’
knowledge and money management skills. Danes and Tahira used a questionnaire of 51 items
pertaining to areas of knowledge such as credit cards, insurance, personal loans, spending, and
overall financial management. The study found that senior students demonstrate a higher level
of knowledge of credit cards than freshman students, supporting the statement that students’
age correlates with higher levels of financial knowledge. Furthermore, the results suggest that
the students in employment are more knowledgeable on credit cards than the unemployed
students, that the students not living in a dormitory are more knowledgeable about credit cards
and personal loans than the students living on campus, and that male students have higher levels
58th International Scientific Conference on Economic and Social Development – Budapest, 04-05 September, 2020
37
of insurance and personal loan knowledge than female students. Overall, the study results show
that only 28% of the respondents are familiar with life insurance, while only 27% of the
surveyed students could calculate the annual interest rate. Shahrabani (2013) conducted a study
on the level of financial literacy of college students in Israel. The main goals of the study were
to get an insight into financial literacy levels of Israeli college students, examine gaps in
financial literacy between Jews and Arabs, and determine the factors affecting students’
financial literacy. The study was conducted by means of a questionnaire consisting of multiple-
choice questions. The study’s sample comprised 574 students from two universities in Israel.
The questions that were given to students tested their knowledge in areas such as savings,
simple financial transactions, financial planning, investing, inflation and risk diversification.
The hypothesis that more than 60% of Israeli students is financially literate was not confirmed.
However, the students considering themselves financially literate are senior students who
pursue economics and business degrees, which therefore confirms that there is a correlation
between students’ financial literacy, study program and age. Additionally, the study found that
male students have a higher level of financial literacy. When nationality is taken into account,
the majority of correct answers was provided by Jews, who exhibit higher levels of financial
literacy. Bestari and Nidar (2012) conducted a study on financial literacy of college students in
Indonesia with the aim of determining the level of financial literacy of students in Indonesia
and making a comparison with students from other countries. The study surveyed 400 college
students of Padjadjaran University and collected data by means of a questionnaire. The
questions students had to answer related to areas such as personal finances, income and
spending, credit and debt, savings and investing, and insurance. Bestari i Nidar (2012)
formulated 24 hypotheses based on 24 variables which included socioeconomic characteristics
as well as financial and business parameters. The results suggest that the majority of students
could only answer questions relating to incomes and spending (63.21%), while only a minority
could provide correct answers to questions pertaining to credits and debs (31.97%) and savings
and investing (34.19%). The consolidated results suggest that only 42% of students is
financially literate. According to Bestari and Nidar, the bad results are a consequence of the
respondents’ age (18-22) and their lack of work experience. Rodrigues, Vieira, Amaral and
Martins (2012) undertook a study on financial literacy of college students in Portugal. The
objective of their study was to demonstrate the level of financial literacy and financial behaviors
of college students in Portugal. The study was conducted by means of a survey questionnaire
and it involved a sample of 612 students from seven universities in Portugal. The students had
to answer questions testing their knowledge in areas such as interest rates, inflation, credit cards,
annual effective interest rate and financial behaviors. The results obtained by the study show
that the respondents provided most of the correct answers to questions relating to the annual
effective interest rate (86.93%), while the smallest portion of correct answers was in the credit
cards section of the questionnaire (29.41) Furthermore, the majority of students stated their own
parents as their main incentive to deposit money. Finally, the results of the survey show that
students correctly answered, on average, 5.48 out of 8 questions relating to financial literacy,
which can be considered encouraging. Mišević, Pavković and Šoštarić (2016) conducted a
study on the level of financial literacy of students from the University of Zagreb. The objective
of the study was to estimate the level of financial literacy of students from the University of
Zagreb and determine whether particular student characteristics influence their level of
financial literacy. The study was conducted in two steps – by using qualitative and quantitative
research methodology. Quantitative research was carried out by means of a survey
questionnaire distributed to 1.600 students of the University of Zagreb. The respondents had to
answer the questions from the questionnaire which was based on the OECD’s methodology.
The study found that there is a difference in financial literacy levels between the students taking
an economics course and the students not taking it.
58th International Scientific Conference on Economic and Social Development – Budapest, 04-05 September, 2020
38
Moreover, it was noted that students’ work experience positively affects their level of financial
literacy. Nevertheless, the findings indicate that there is no correlation between the level of
financial literacy and the gender of students from the University of Zagreb.
3. RESEARCH METHODOLOGY
For the purposes of this paper, empirical research was conducted at the Faculty of Organization
and Informatics in Varaždin, which included Bachelor’s and Master’s students of Informatics
and Economics of Entrepreneurship and undergraduate students of the professional study
program Information Technology Business Application (PITUP). The main purpose of this
study is to examine, analyze and demonstrate students’ level of readiness to invest in the capital
market, their level of financial literacy, as well as to explore whether there is a link between the
students exhibiting low levels of risk aversion and investment ambitions and the desire of the
students at the Faculty of Organization and Informatics in Varaždin to found a company of their
own after finishing their studies. The sample used in this study was deliberately chosen, i.e.
convenience sampling method, a sampling technique that involves choosing a research sample
based on convenience, was used (Šošić and Serdar 1995; Mejovšek, 2013). The study surveyed
a sample size of 336 students at the Faculty of Organization and Informatics in Varaždin out of
the total of 2.725 students of undergraduate and postgraduate studies. There were 190 female
and 146 male students among the respondents. Of the 336 surveyed students, there were 244
undergraduate level students, while 92 students were postgraduates. Moreover, of the 244
undergraduate students, 80 students are informatics majors (23.81%), 87 students major in
Economics of Entrepreneurship (25.89%), and 77 students are PITUP majors (22.92%). The
rest of the surveyed students are at the postgraduate study level, i.e. 10.42% of the surveyed
students are Informatics majors, while 16.96% of the students are major in Economics of
Entrepreneurship. The instrument used in this empirical research was an online survey
questionnaire whose aim was to investigate students’ level of financial literacy and their
readiness to invest in the capital market. The survey was conducted in the period between 8
April and 15 August 2019 and it was administered to students at the Faculty of Organization
and Informatics in Varaždin via the online learning platform Moodle, closed Facebook groups
created by the students of the Faculty, the official website of the Student Support and Career
Development Centre (CPSRK), the student association Business club@FOI and the Faculty’s
student newspaper STAK. The survey questionnaire was created following the 2015
OECD/INFE Toolkit for measuring financial literacy and financial inclusion. Most of the
questions are based on the 2015 Toolkit, while some were modified in order to adjust the
questionnaire for students and obtain as precise and significant results as possible for the
purposes of this study. Additionally, two questions were taken from the research methodology
of the Standard&Poor’s Global Financial Literacy Survey (gflec.org, 2014), and one from the
OECD/INFE survey (oecd.org, 2016). The questionnaire itself is composed of three parts:
General information about the respondent, Financial literacy, and finally Readiness to invest in
the capital market.
4. RESEARCH RESULTS
Before distributing the final version of the questionnaire, a pilot survey was conducted on a
smaller sample in order to test the quality and reliability of the research instrument. After the
test, the survey questionnaire was sent to 2.725 students at graduate and undergraduate study
levels. The questionnaire was completed by 336 students, i.e. 12.33% of all students at the
Faculty. A detailed overview of the sample with participants data is presented in Table 1.
Table following on the next page
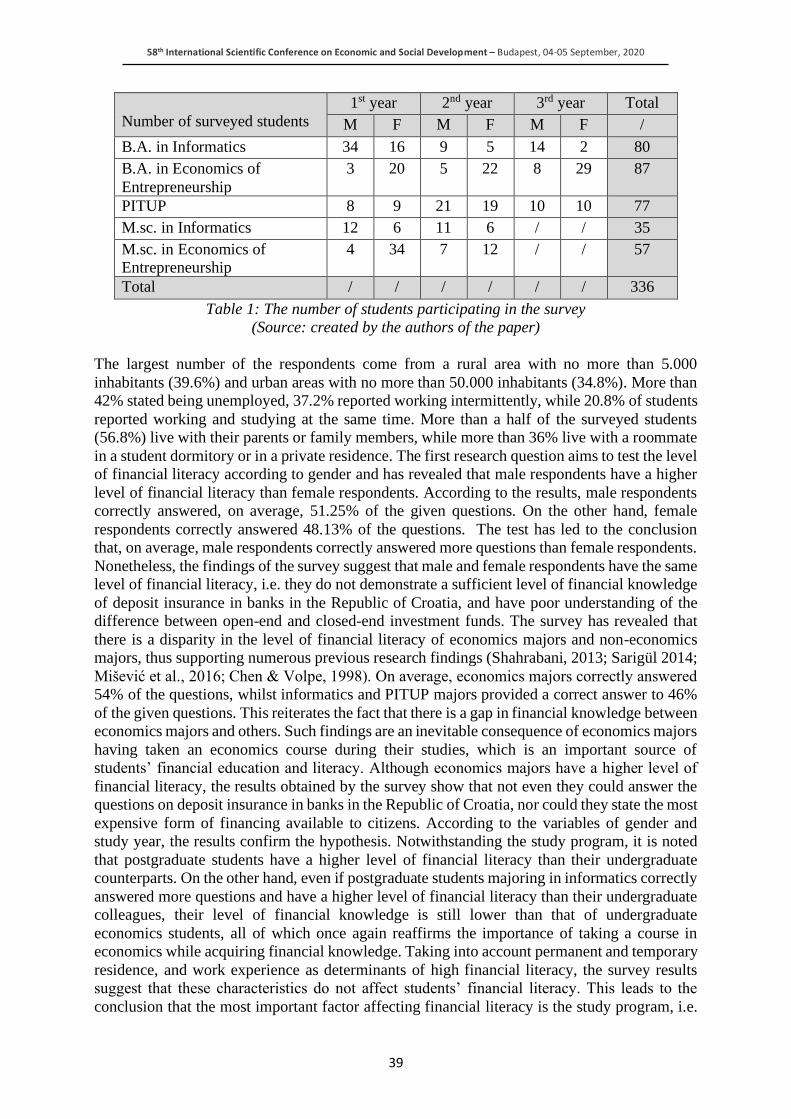
58th International Scientific Conference on Economic and Social Development – Budapest, 04-05 September, 2020
39
Number of surveyed students
1st year 2nd year 3rd year Total
M F M F M F /
B.A. in Informatics 34 16 9 5 14 2 80
B.A. in Economics of
Entrepreneurship
3 20 5 22 8 29 87
PITUP 8 9 21 19 10 10 77
M.sc. in Informatics 12 6 11 6 / / 35
M.sc. in Economics of
Entrepreneurship
4 34 7 12 / / 57
Total / / / / / / 336
Table 1: The number of students participating in the survey
(Source: created by the authors of the paper)
The largest number of the respondents come from a rural area with no more than 5.000
inhabitants (39.6%) and urban areas with no more than 50.000 inhabitants (34.8%). More than
42% stated being unemployed, 37.2% reported working intermittently, while 20.8% of students
reported working and studying at the same time. More than a half of the surveyed students
(56.8%) live with their parents or family members, while more than 36% live with a roommate
in a student dormitory or in a private residence. The first research question aims to test the level
of financial literacy according to gender and has revealed that male respondents have a higher
level of financial literacy than female respondents. According to the results, male respondents
correctly answered, on average, 51.25% of the given questions. On the other hand, female
respondents correctly answered 48.13% of the questions. The test has led to the conclusion
that, on average, male respondents correctly answered more questions than female respondents.
Nonetheless, the findings of the survey suggest that male and female respondents have the same
level of financial literacy, i.e. they do not demonstrate a sufficient level of financial knowledge
of deposit insurance in banks in the Republic of Croatia, and have poor understanding of the
difference between open-end and closed-end investment funds. The survey has revealed that
there is a disparity in the level of financial literacy of economics majors and non-economics
majors, thus supporting numerous previous research findings (Shahrabani, 2013; Sarigül 2014;
Mišević et al., 2016; Chen & Volpe, 1998). On average, economics majors correctly answered
54% of the questions, whilst informatics and PITUP majors provided a correct answer to 46%
of the given questions. This reiterates the fact that there is a gap in financial knowledge between
economics majors and others. Such findings are an inevitable consequence of economics majors
having taken an economics course during their studies, which is an important source of
students’ financial education and literacy. Although economics majors have a higher level of
financial literacy, the results obtained by the survey show that not even they could answer the
questions on deposit insurance in banks in the Republic of Croatia, nor could they state the most
expensive form of financing available to citizens. According to the variables of gender and
study year, the results confirm the hypothesis. Notwithstanding the study program, it is noted
that postgraduate students have a higher level of financial literacy than their undergraduate
counterparts. On the other hand, even if postgraduate students majoring in informatics correctly
answered more questions and have a higher level of financial literacy than their undergraduate
colleagues, their level of financial knowledge is still lower than that of undergraduate
economics students, all of which once again reaffirms the importance of taking a course in
economics while acquiring financial knowledge. Taking into account permanent and temporary
residence, and work experience as determinants of high financial literacy, the survey results
suggest that these characteristics do not affect students’ financial literacy. This leads to the
conclusion that the most important factor affecting financial literacy is the study program, i.e.
58th International Scientific Conference on Economic and Social Development – Budapest, 04-05 September, 2020
40
the number of courses students have taken in economics and their year of study. It is noted that
students’ financial literacy level is proportional to the level of study (Danes M. and Tahira K.,
1987). Such findings support the conclusions of the 2016 study (Hanfa.hr, 2016) stating that
people under the age of 19 are the least financially educated cohort in the Republic of Croatia.
It should be emphasized that significant answers to certain questions have been obtained on the
basis of the survey results. Although male respondents have a higher level of financial literacy
than female respondents, and respondents majoring in economics of entrepreneurship
demonstrate a higher degree of financial knowledge than respondents majoring in informatics
and PITUP, the largest number of respondents could not provide answers to the questions on
the insurance of client deposits in banks in Croatia and the difference between open-end and
closed-end investment funds, which indicates that there is a need for further financial education
in these particular fields. As far as the knowledge of concepts pertaining to interests and interest
rates, the majority of wrong answers were provided by economics majors, which is in contrast
with much of the previous research on this topic. In 2015, a survey on the understanding of
concepts related to interest rates and the way it functions was undertaken by Standard & Poor’s
Ratings Services (Gflec.org, 2015). The survey questions tested the knowledge of interest rates
and the amount of interest that can be yielded while saving money in an interest-earning account
over a certain period of time. More than 140 countries participated in the survey and the average
correct answer rate worldwide was 45%. In developed countries (US, Japan, France, Canada,
UK, Germany), the rate was around 55% (US 70%; Japan 37%), while in developing economies
(Brazil, China, India, South Africa, Turkey) the rate was 40% (Brazil 20%; Turkey 15%).
According to the findings of the survey comprising 336 students at the Faculty of Organization
and Informatics, 58.19% of the respondents answered correctly. A more detailed stratification
of the sample has revealed that male respondents score higher than females in this field, which
is in accordance with the findings of the research conducted by Shahrabani in 2013. Moreover,
according to the study program, students majoring in economics and in related branches are the
most knowledgeable, which complies with previous research findings (Shahrabani, 2013;
Sarigül 2014; Mišević et al., 2016; Chen & Volpe, 1998). Therefore, it can be concluded that
FOI students have more knowledge in the field of interest rates in comparison with the average
level of knowledge worldwide. Moreover, the 58.19% correct answer rate suggests that FOI
students’ level of knowledge is not only higher than the average level, but also higher than the
average level of knowledge in developing countries, which is 55%. These findings can be linked
to the development of the national economy and the country itself, as well as Croatia’s
alienation from Eastern and North Eastern Europe and closer ties with Western European
countries, which was partly aided by its entry in the EU.
5. CONCLUSION
This study involving 336 students from the Faculty of Organization and Informatics was
conducted with the goal of testing students’ level of financial literacy and readiness to invest in
the capital market. The survey results are in accordance with the findings of previous studies
indicating that there is a relationship between financial literacy and demographic characteristics
of students such as age, gender, study program and taking a course in economics as part of
academic education (Shahrabani, 2013; Sarigül 2014; Mišević et al., 2016; Chen & Volpe,
1998). The findings of the survey lead to the conclusions that male respondents are more
financially knowledgeable than their female colleagues, economics majors have a higher level
of financial literacy than informatics and PITUP majors, postgraduate economics students have
more knowledge of finance than their undergraduate counterparts, who are in turn more
knowledgeable than undergraduate informatics and PITUP majors. However, the study
questions helped to verify that there is no difference in financial literacy level between students
living with their parents and independently, students living in urban and rural areas, and
58th International Scientific Conference on Economic and Social Development – Budapest, 04-05 September, 2020
41
students who have some past work experience and those who are not in employment and have
no work experience. The survey has revealed that students majoring in economics of
entrepreneurship have the highest level of knowledge about inflation, financial concepts and
risk diversification, while also being the least knowledgeable in matters related to interest rates.
Furthermore, the study has shown that undergraduate informatics students have the lowest level
of financial literacy. The majority of them incorrectly answered the questions on the inflation
rate in Croatia, the most expensive form of financing available to citizens, and general financial
concepts. This is due to the fact that undergraduate informatics students are not taking as many
courses related to economics, finance and capital markets since they are not part of the
curriculum, which is quite evident from the results. Additionally, the survey has shown that
PITUP majors are more knowledgeable than informatics majors because they have been obliged
to take more courses in economics and finance, which confirms that there is a correlation
between students’ financial literacy and having taken an economics course during one’s studies
(Chen & Volpe, 1998; Mišević et al., 2016; Sarigül, 2014). In addition, only 14.6% of students
provided correct answers to the questions on the difference between open-end and closed-end
funds – a fact testifying of all students’ insufficient level of financial literacy, regardless of their
major, in the field this question pertains to. Furthermore, this study aims to examine whether
there is a relationship between students’ risk levels and readiness to invest in the capital market,
i.e. start up their own business. The findings show that most of the students are still not sure
whether they will invest in the capital market, stating the fear of losing their money, insufficient
understanding of the capital market and insufficient development of the capital market as the
main reasons. Moreover, the majority of the students is still not sure whether they will start up
their own business in the future, stating endless bureaucratic red-tape, the stress experienced in
the process of founding a company, and a bad entrepreneurial climate in their country as the
main obstacles to their entrepreneurial ambitions. On the other hand, the results show that there
is a relationship between the level of risk and participation in the capital market. The largest
number of students exhibit a medium degree of risk aversion, and do not plan or are not certain
whether they will invest in the capital market. However, students expressing low levels of risk
aversion, or those not expressing it at all, report that they intend to invest in the capital market.
The findings of this study indicate that there is a need for further financial education of students.
It is expected that this study will prompt students to invest more time into their financial
education and motivate them to start thinking about investing in the capital market since they
will soon become part of this market themselves. As the survey results suggest, it is necessary
to implement economics courses and courses dealing with financial literacy and education in
non-economics study programs.
LITERATURE:
1. Anđelinović, M., Mišević, D., Pavković, A. (2016). Mjerenje financijske pismenosti
studenata Sveučilišta u Zagreb. https://hrcak.srce.hr/169662
2. Berelson, B. (1952). Content analysis in communication research.
3. Bestari, S., Nidar R., S. (2012). Personal Financial Literacy Among University Students
(Case Study at Padjadjaran University Students, Bandung, Indonesia).
https://www.academia.edu/6887073/Personal_Financial_Literacy_Among_University_Stu
dents_Case_Study_at_Padjadjaran_University_Students_Bandung_Indonesia
4. Chen, H., Volpe P., R. (1998). An Analysis of Personal Financial Literacy Among College
Students.
https://gradsense.org/ckfinder/userfiles/files/An_Analysis_of_Personal_Financial_Lit_Am
ong_College_Students.pdf
58th International Scientific Conference on Economic and Social Development – Budapest, 04-05 September, 2020
42
5. Danes M., S., Hira K., T. (1987). Money Management Knowledge of College Student.
https://publications.nasfaa.org/cgi/viewcontent.cgi?referer=&httpsredir=1&article=1435&
context=jsfa
6. Gflec.org (2014). S&P GLOBAL FINLIT SURVEY. https://gflec.org/initiatives/sp-global-
finlit-survey/
7. Gflec.org (2014a). S&P GLOBAL FINLIT SURVEY – METHODOLOGY.
https://gflec.org/sp-global-finlit-survey-methodology/
8. Gflec.org (2015). Financial Literacy Around the World: INSIGHTS FROM THE
STANDARD & POOR’S RATINGS SERVICES GLOBAL FINANCIAL LITERACY
SURVEY. https://gflec.org/wp-content/uploads/2015/11/3313-Finlit_Report_FINAL-
5.11.16.pdf?x37611
9. Hanfa.hr (2016). Predstavljeni rezultati istraživanja Mjerenje financijske pismenosti.
https://www.hanfa.hr/vijesti/04022016-predstavljeni-rezultati-istrazivanja-mjerenje-
financijske-pismenosti/
10. Hanfa.hr (2019). Tržište kapitala. https://www.hanfa.hr/trziste-kapitala/
11. Hnb.hr (2016). Mjerenje financijske pismenosti i financijske uključenosti u Hrvatskoj.
https://www.hnb.hr/documents/20182/499482/hp04022016_prezentacija.pdf/120e9a61-
eb20-4410-8efe-372a6e27afde
12. Kidwell, D.S. i dr. (2003). Financial institutions, markets and money. Danvers: John Wiley
and Sons, 2003.
13. Mejovšek, M. (2013). Metode znanstvenog istraživanja u društvenim i humanističkim
znanostima. Jastrebarsko : Naklada Slap
14. Merriam, S. B., & Tisdell, E. J. (2015). Qualitative research: A guide to design and
implementation. John Wiley & Sons
15. Ministarstvo financija (bez dat.). Financijska pismenost potrošača.
http://www.mfin.hr/hr/financijska-pismenost-potrosaca
16. Oecd.org (2005). Recommendation on Principles and Good Practices for Financial
Education and Awareness. https://www.oecd.org/daf/fin/financial-education/35108560.pdf
17. Oecd.org (2014). PISA 2012 Results: Students and Money: Financial Literacy Skills for the
21st Century (Volume VI). http://www.oecd.org/pisa/keyfindings/PISA-2012-results-
volume-vi.pdf
18. Oecd.org (2015). National Strategies for Financial Education: OECD/INFE Policy
Handbook. http://www.oecd.org/daf/fin/financial-education/National-Strategies-Financial-
Education-Policy-Handbook-Highlights.pdf
19. Oecd.org (2015a). 2015 OECD/INFE Toolkit for measuring financial literacy and financial
inclusion. https://www.oecd.org/daf/fin/financial-
education/2015_OECD_INFE_Toolkit_Measuring_Financial_Literacy.pdf
20. Oecd.org (2016). OECD/INFE International Survey of Adult Financial Literacy
Competencies.
http://www.oecd.org/daf/fin/financial-education/OECD-INFE-International-Survey-of-
Adult-Financial-Literacy-Competencies.pdf
21. Opploans.com (bet dat.). Financial Literacy: A Definition.
https://www.opploans.com/mooc/answers/definition-financial-literacy/
22. Oseifuah, E., Gyekye, A., Formadi, P. (2018). FINANCIAL LITERACY AMONG
UNDERGRADUATE STUDENTS: EMPIRICAL EVIDENCE FROM GHANA.
https://www.abacademies.org/articles/Financial-Literacy-Among-Undergraduate-Students
-Empirical-Evidence-From-Ghana-1528-2635-22-6-299.pdf

58th International Scientific Conference on Economic and Social Development – Budapest, 04-05 September, 2020
43
23. Rodrigues S., C., Vieira D., F., Amaral A., Martins V., F. (2012) Financial Literacy of
University Students.
https://repositorium.sdum.uminho.pt/bitstream/1822/21813/1/Financial%20Literacy%20o
f%20University%20Students_vers%C3%A3o%20final.pdf
24. Sarigül, H. (2014). A Survey of Financial Literacy Among University Students.
http://www.journal.mufad.org/attachments/article/767/11.pdf
25. Shahrabani, S. (2013). Financial Literacy Among Israeli College Student.
https://www.researchgate.net/publication/254861824_Financial_Literacy_Among_Israeli_
College_Students
26. Šošić, I., Serdar, V. (1995). Uvod u statistiku. Školska knjiga: Zagreb
27. Vranešević, T. (2014). Tržišna istraživanja u poslovnom upravljanju. Zagreb: Accent
28. Zaključak Vlade Republike Hrvatske o prihvaćanju Nacionalnog strateškog okvira
financijske pismenosti potrošača za razdoblje od 2015. do 2020. Godine NN 11/15.
https://narodne-novine.nn.hr/clanci/sluzbeni/2015_01_11_224.html
29. Zakon o tržištu kapitala NN 65/18.
https://narodne-novine.nn.hr/clanci/sluzbeni/2018_07_65_1329.html
58th International Scientific Conference on Economic and Social Development – Budapest, 04-05 September, 2020
44
THE BANK INSOLVENCY: FROM LEHMAN BROTHERS TO COVID-
19 (INTERNATIONAL REMARKS AND NATIONAL PECULIARITIES)
Andrey Zahariev
D.A. Tsenov Academy of Economics, Svishtov, Bulgaria
Stoyan Prodanov
D.A. Tsenov Academy of Economics, Svishtov, Bulgaria
Anelya Radulova
D.A. Tsenov Academy of Economics, Svishtov, Bulgaria
Galina Zaharieva
D.A. Tsenov Academy of Economics, Svishtov, Bulgaria
Maryana Pavlova-Banova
D.A. Tsenov Academy of Economics, Svishtov, Bulgaria
Petko Angelov
D.A. Tsenov Academy of Economics, Svishtov, Bulgaria
Taner Ismailov
D.A. Tsenov Academy of Economics, Svishtov, Bulgaria
Aleksandrina Aleksandrova
D.A. Tsenov Academy of Economics, Svishtov, Bulgaria
Kristi Marinova
D.A. Tsenov Academy of Economics, Svishtov, Bulgaria
ABSTRACT
A study of the international experience of applicable policies for crisis management in the credit
system in bank insolvency, identifies three types of solutions, including: elimination of the "toxic
element" in the banking system following the example of "Lehman Brothers" in the US from
15.09. 2008 through a voluntary insolvency procedure declared by the bank's management
before the respective regulatory body; support for the financially troubled institution through
nationalization and a reform plan following the example of Northern Rock in the UK from 2007-
2008 and Greek banks from the Greek debt crisis after 2010; liquidation of the "toxic element"
in the banking system, following the example of CCB in Bulgaria (2014-2020), through a
regulatory insolvency procedure. Each of the three policies has its pros and cons, but it
definitely has a "stressful" impact on banking systems and economic agents with long-term
58th International Scientific Conference on Economic and Social Development – Budapest, 04-05 September, 2020
45
consequences, incl. in the context of the TBTF doctrine. On this basis, international regulators
are introducing the methodology of bank stress tests for early warning of bank insolvency. The
study of the experience of the central banks, BIS and ECB for conducting stress tests brings to
the fore their grouping by three criteria: first criteria - Type of stress test, which distinguishes
stress tests conducted by macroprudential authorities for the purpose of assessing broad
systemic risks, stress tests conducted by microprudential authorities for supervisory purposes
and stress tests by the internal bank risk management for the purposes of assessing capital
adequacy policies; second criteria - Focus of the stress test, which distinguishes systematic
assessments at the institutional level, measuring mainly solvency or liquidity, assessments on
the first and second pillars of Basel II, as well as assessments of financial instruments,
investment portfolios, business sectors from institutional positions to prepare models for
decision-making by the central banking management regarding the response to the various
risks; and third criteria - Approach to conducting the stress test, which is grouped into two
categories, top - down and vice versa, bottom - up. These approaches must be tested with the
new environment for COVID-19 as a global systemic risk generator. Its impact on the
creditworthiness of companies, households and the state can be assessed as extremely negative
and testing the capital adequacy of commercial banks under BASEL III framework.
Keywords: Bank Insolvency, Lehman Brothers, TBTF, Bank Stress test, COVID-19
1. INTRODUCTION
The structure of the banking system and its main regulatory functions give the Central Bank the
right to arrange in hierarchy, subordinate and notify the units of the banking system in a way
that provides for the stability of the system itself. The very structure of central bank governance
gives broad powers to banking supervision thus transforming the supervisory responsibility
described on paper into a stable information flow of reports, instructions, regulations, measures
and actions for the needs of the decision-making on maintaining the stability of the banking
system. However, in all circumstances, the banking system at its fundamental level - credit
institutions - may be subject to circumstances of unfavourable external, macroeconomic, or
adverse, internal management nature, as well as to a combination of these. In such a situation
or in case of a combination of adverse influences, the stability of the banking system may turn
out to be under pressure. Respectively, the units that have taken exorbitant risks can be
measured as carriers or holders of such a volume of "toxic assets" that, due to the effect of
interconnection through loans and deposits of credit institutions, "infects" the entire system in
a cascade manner. Such "toxification" calls for the implementation of a set of measures, which
are normally regulated in an Insolvency Act. These measures lead to temporary or permanent
delicensing of the "toxic" credit institution, incl. and until the appointment of new management,
through conservators to administrators. This stage of the life cycle of the banking institution
gives rise to two alternatives: recovery through measures and a support program or winding up
of the respective credit institution. However, commercial banks are not legal entities with
limited influence and role in the economic life and monetary turnover in an economy. They are
also international operators in payment systems. There are tens of thousands of depositors in
the liabilities of their balance sheets, resp. depositors who, against the confidence of security
and return, perform the savings function of money. The status of a depositor is acquired when
depositing funds on a deposit in a commercial bank. The assets of the balance sheet include
loan applicants and borrowers, who in turn use the resources in the liabilities in the form of
loans for various purposes. These are practically two types of clients, each with its own interests
and legal protection. However, the key difference between the two types of clients is that the
interests of depositors within the European Union are legally protected by the Bank Deposit
Protection Act, as well as by the national institution Deposit Insurance Fund.
58th International Scientific Conference on Economic and Social Development – Budapest, 04-05 September, 2020
46
There exist two bank insolvency situations:
• The first is related to the comparison between what the bank owns (its assets) and what it
owes (its liabilities). In case of negative coverage of liabilities with assets, the bank is
considered to be insolvent. The insolvency is established on an accounting basis by
comparison of the documents that evidence the value of the assets and the liabilities of the
bank. When the insolvency is confirmed by a decision of the competent court, a procedure
regulated in the Law on Bankruptcy is opened.
• In the second situation, when comparing the assets and the liabilities of the bank the value
is positive, but if the bank is unable to service its current payments, cash flow insolvency
or lack of bank liquidity is established. Thus, the bank may be endangered by a cascading
increase in the claims of depositors for withdrawal of a resource, at the expense of
operations with a respective time lag in the asset. This usually results in a request from the
bank management for liquidity support from the Central Bank, which can be approved but
can also be refused. If liquidity support is not approved, the CB may proceed to treat the
bank as a "toxic" component in the banking system, which must be temporarily delicensed
until authorized persons (conservators) assess its actual condition: assets, liabilities,
property and capital.
2. BANK CRISES AND BANK INSOLVENCY
2.1. Theoretic evidence
The studies of (Hannan, Henweck, 1988; Hainz, 2005; Lastra, 2008; Strobel, 2011c; Campbell,
2006) systematise modern views on crisis management in the credit system in the event of bank
insolvency. These studies outline a wide range of internationally applicable policies for credit
crisis management in the event of bank insolvency, including:
• Liquidation of the "toxic element" in the banking system following the example of "Lehman
Brothers" in the USA from 15.09.2008 through a voluntary insolvency procedure, declared
by the bank's management before the relevant regulatory authority. Such liquidation
definitely has a “cascading” effect on many other financial institutions under the rule that
“it was primarily large banks, savings and loans and brokerage firms who were impacted
the most.” (Johnson, Mamun, 2012a);
• Support for the troubled financial institution, through nationalization and a reform plan
following the example of Northern Rock in the UK from 2007-2008 (Lastra, 2008a) and the
Greek banks from the Greek debt crisis after 2010 (Vogiazas, Alexiou, 2013).
• Liquidation of the “toxic element” in the banking system following the example of Bulgaria
with Corporate Commercial Bank in 2014 through a insolvency procedure under regulation.
There is evidence of research related to this doctrine long before the latest negative findings in
the 21st century, cf. (Pettway, 1980; Hannan, Henweck, 1988). A more recent study from 2017
(Kazandzhieva-Yordanova, 2017) confirms that the TBTF doctrine has negative consequences
and this requires "measures to limit government intervention in cases of insolvency of
systemically important banks", as "… in the EU such measures were taken mostly in the
supervision of systemically important banks, the capital requirements, the capacity of banks to
absorb losses by using domestic resources, and deposit guarantee schemes.” The author
examines the evolution of deposit guarantee schemes and makes a parallel analysis of its impact
on the TBTF doctrine thus proving that the development of deposit insurance has a
contradictory impact on the TBTF doctrine.
Figure following on the next page
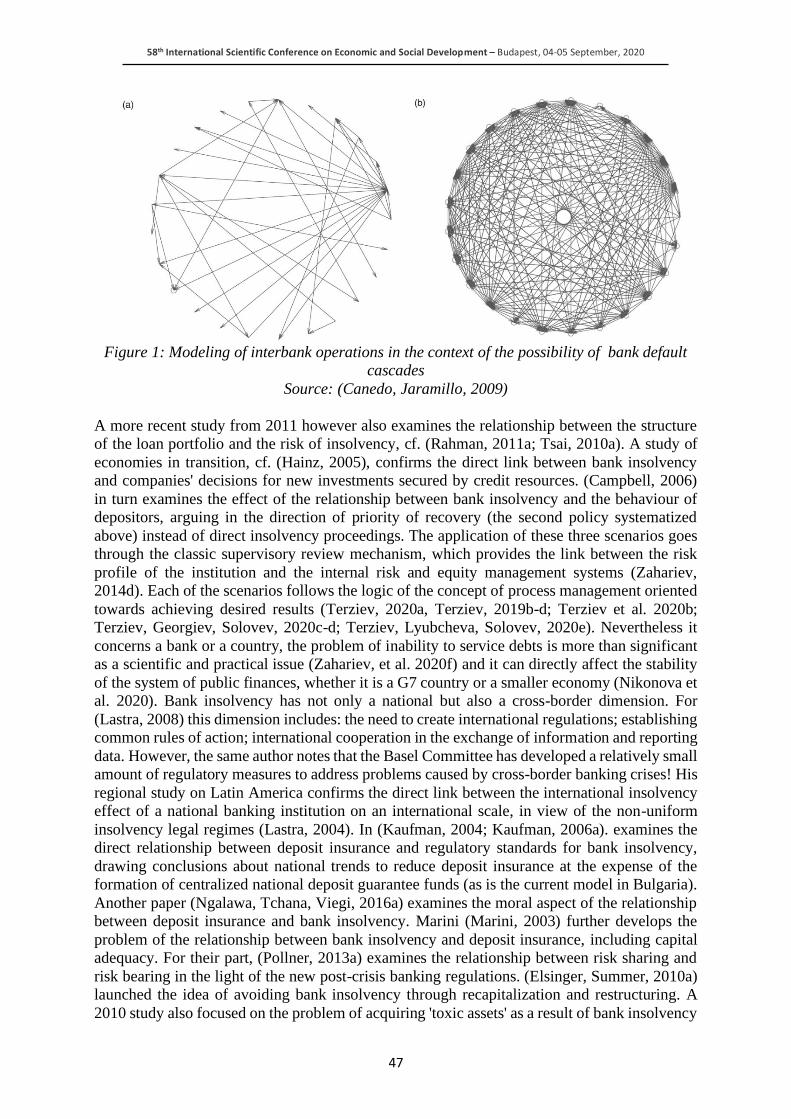
58th International Scientific Conference on Economic and Social Development – Budapest, 04-05 September, 2020
47
Figure 1: Modeling of interbank operations in the context of the possibility of bank default
cascades
Source: (Canedo, Jaramillo, 2009)
A more recent study from 2011 however also examines the relationship between the structure
of the loan portfolio and the risk of insolvency, cf. (Rahman, 2011a; Tsai, 2010a). A study of
economies in transition, cf. (Hainz, 2005), confirms the direct link between bank insolvency
and companies' decisions for new investments secured by credit resources. (Campbell, 2006)
in turn examines the effect of the relationship between bank insolvency and the behaviour of
depositors, arguing in the direction of priority of recovery (the second policy systematized
above) instead of direct insolvency proceedings. The application of these three scenarios goes
through the classic supervisory review mechanism, which provides the link between the risk
profile of the institution and the internal risk and equity management systems (Zahariev,
2014d). Each of the scenarios follows the logic of the concept of process management oriented
towards achieving desired results (Terziev, 2020a, Terziev, 2019b-d; Terziev et al. 2020b;
Terziev, Georgiev, Solovev, 2020c-d; Terziev, Lyubcheva, Solovev, 2020e). Nevertheless it
concerns a bank or a country, the problem of inability to service debts is more than significant
as a scientific and practical issue (Zahariev, et al. 2020f) and it can directly affect the stability
of the system of public finances, whether it is a G7 country or a smaller economy (Nikonova et
al. 2020). Bank insolvency has not only a national but also a cross-border dimension. For
(Lastra, 2008) this dimension includes: the need to create international regulations; establishing
common rules of action; international cooperation in the exchange of information and reporting
data. However, the same author notes that the Basel Committee has developed a relatively small
amount of regulatory measures to address problems caused by cross-border banking crises! His
regional study on Latin America confirms the direct link between the international insolvency
effect of a national banking institution on an international scale, in view of the non-uniform
insolvency legal regimes (Lastra, 2004). In (Kaufman, 2004; Kaufman, 2006a). examines the
direct relationship between deposit insurance and regulatory standards for bank insolvency,
drawing conclusions about national trends to reduce deposit insurance at the expense of the
formation of centralized national deposit guarantee funds (as is the current model in Bulgaria).
Another paper (Ngalawa, Tchana, Viegi, 2016a) examines the moral aspect of the relationship
between deposit insurance and bank insolvency. Marini (Marini, 2003) further develops the
problem of the relationship between bank insolvency and deposit insurance, including capital
adequacy. For their part, (Pollner, 2013a) examines the relationship between risk sharing and
risk bearing in the light of the new post-crisis banking regulations. (Elsinger, Summer, 2010a)
launched the idea of avoiding bank insolvency through recapitalization and restructuring. A
2010 study also focused on the problem of acquiring 'toxic assets' as a result of bank insolvency
58th International Scientific Conference on Economic and Social Development – Budapest, 04-05 September, 2020
48
proceedings (Wilson, 2010a). The special case of a bank holding company, where the parent
company is trying to support its financially troubled subsidiary, is considered in a study by
(Branch, Higgason, 2010). The subject of empirical analysis is the Bank of New England
Corporation (BNEC), which is owned by a Boston-based holding company. As a result of the
analysis, the authors establish the typical discrepancy in the interests of the banking regulator
and the holding owner of the bank that experiences solvency problems. Moreover, the bank's
claims for resource provision by the holding experience the problems with the fair valuation of
exchangeable equivalents, both in terms of positions in BNEC's assets and liabilities. The
problem of fair valuation of balance sheet items is also addressed in the study of (Swamy,
2009a) where arguments are given in support of ethical standards for financial analysis. An
empirical study of the banking sector in India in the same direction proposes a methodology for
assessing bank intellectual capital, which capital usually remains outside the scope of any
assessment of bank solvency (Ghosh, Maji, 2014b). A study on the illiquidity components of
credit risk advocates the theoretical differentiation between total credit risk, insolvency risk and
illiquidity risk (Morris, Shin, 2016). The authors define illiquidity risk as the probability of a
default due to a rapid sale of assets when the institution would otherwise have been solvent.
They conclude that “the illiquidity risk (i) decreasing in the “liquidity ratio" - the ratio of
realizable cash on the balance sheet to short term liabilities; (ii) decreasing in excess return to
debt; and (iii) increasing in the solvency uncertainty - a measure of ex post variance of the asset
portfolio “. The examined liquidity coverage ratio (LCR) is the basis of the Basel III regulatory
standard in the part on the rules for bank capital and liquidity. The derived interpretation of the
LCR indicator is the ratio of the stock of high-quality liquid assets to total net cash outflows,
where the weights range from 3% for retail deposits to 100% for corporate financing (Basel
Committee on Banking Supervision, 2013a). The problem of interbank liquidity support is
discussed from the position of reaching an agreement between banking institutions to ensure an
appropriate " the ex post transfer of reserves from liquid banks to illiquid banks, so it is possible
to select a socially efficient reserve ratio in the banking system that preserves the safety of bank
liabilities as a store of value and maximizes the rate of return paid to bank liability holders”
(Sanches, 2016b). Such interbank support naturally requires taking into account the interest rate
spread, where the "price" of the resource is essential for obtaining interbank refinancing. The
data for the Bulgarian banking system show significant levels of the interest rate spread, which
exceeded the EU average between 17% and 161% in the period 2008-2014 (Peshev, 2015c).
An innovative study on the banking market in India to analyze and assess the insolvency risk
in public and private sector credit institutions (Keshari, 2015a) applied sampling classification
using CAMEL parameters (i.e. capital adequacy, asset quality, management quality, earnings
and liquidity) establishing (Mäkinen, Solanko, 2017a), that in terms of this valuation
methodology, regardless of the sector, banks fall within the full range of the valuation scale,
which is function of the specifics of the banking business and the quality of the balance sheet
items. A study on the contribution of European banks to the instability of the banking sector in
credit institutions from Bulgaria, Latvia, Lithuania, Poland, Romania, Turkey, Ukraine and
Hungary was conducted using the CoVar method for measuring the systemic risk (Karkowska,
2014c). As a result, specific assessments of the systemic risk are given as a contribution of a
bank i in the analyzed banking sector of a country in its insolvency. The sample includes a total
of 40 banks traded on the public market, which provides a fair stock market assessment of
market capitalization of each of the examined credit institutions. By using the Systems’
Generalized Method of Moments estimator (System-GMM) to determine the impact of revenue
diversification on performance and banking risk, reliable evidence is provided of the benefits
of diversification for banks in emerging economies (Sanya, Wolfe, 2011b). Using the
arguments for option pricing, it is proven that even solvent banks will be willing to sell toxic
assets at market prices, because the bank's shareholders usually prefer to avoid insolvency, and
58th International Scientific Conference on Economic and Social Development – Budapest, 04-05 September, 2020
49
respectively being responsible for refinancing. The conclusion that "insolvency puts are more
valuable when the banks' assets are more volatile" infers that shareholders in banks will require
any buyer to pay for the lost volatility as well as the market price of the toxic assets, which
when activated public guarantee schemes means that “taxpayers must be willing to richly
overpay if they want banks to voluntarily part with their toxic assets” (Wilson, 2010a).
Therefore, risk provisioning is a logical response of the regulator to counteract the risk of bank
insolvency (Carmen-Mihaela, Camelia-Daniela, Ovidiu-Octavian, 2009a). A study of the
bank's growth limits shows that banks grow either by expanding their market presence within
the region within they are domiciled or by expanding their presence in other regions via new
implantations. Logically, growth leads to improved diversification, but definitely increases the
risk of bank failure. The conclusion is that there is a threshold size of the bank at which the
growth rate of its systemic risk exceeds the rate of decline in its risk of insolvency (McFadden,
2008b).
2.2. Capital requirements and benchmark evidences of credit policy
By introducing an “internal and external rating” of loan applicants and borrowers, international
accords Basel II and Basel III upgraded CB credit policy. Both standards should be considered
as integral parts of a single concept for bank development. It is built on the paradigm of the
increasing complexity of banking, in which the stability of individual CBs cannot and should
not be guaranteed by the traditional forms of banking supervision. The solution to this problem
is through the introduction of a control system through internal bank risk management. At the
same time, the mutual monitoring of banks and the single supervisory analysis strengthen
market discipline and curb the opportunities for abnormal development of certain CBs at the
expense of other by taking risks that are unacceptable for the system and the regulator. From
an evolutionary point of view, Basel III builds on Basel II, specifying the capital adequacy
requirements in terms of risk-weighted bank assets. The capital requirement imposes a standard
on banks that directly conflicts with their dividend policy. The logic of the regulator is that the
expansion in the banking business requires the bank management to have set aside enough
capital to cover unexpected losses. This in turn keeps the credit institution solvent in a crisis.
The main principle is that the amount of required capital directly depends on the risk attached
to the assets of a particular bank. The regulator introduces the concept of "own funds
requirements" and measures it as a percentage of risk-weighted assets. The logic of the concept
of risk-weighted assets is directly proportional: for less risky assets a smaller amount of capital
is set aside, and for riskier assets the requirement is for reciprocally larger scale of capital. Thus,
the riskier an asset is, the more shareholders have to increase their excess capital, measured by
the capital position and its components. The regulator assigns certain grades of capital
depending on its quality and the associated risk. Thus, Tier 1 capital is defined as the capital
that enables a credit institution to continue its activity while maintaining its solvency without
any problems. In terms of banking policy, the common equity Tier 1 capital is defined as the
highest quality capital. In turn, Tier 2 capital is associated with the balance sheet item for
supplementary capital. The regulatory requirement is that the supplementary capital must
enable a particular CB to repay the amounts due to depositors and privileged creditors in the
event of insolvency. On this basis, for every 100 units of risk-weighted assets, the bank should
have a minimum of 8 units of total capital. For its part, the share of common equity Tier 1
capital should be 4.5% of risk-weighted assets. The BNB and the ECB stipulate that at any
given time a CB must meet the following capital requirements: - common equity Tier 1 ratio of
4.5%; - Tier 1 capital ratio 6%; - total capital adequacy ratio 8%.
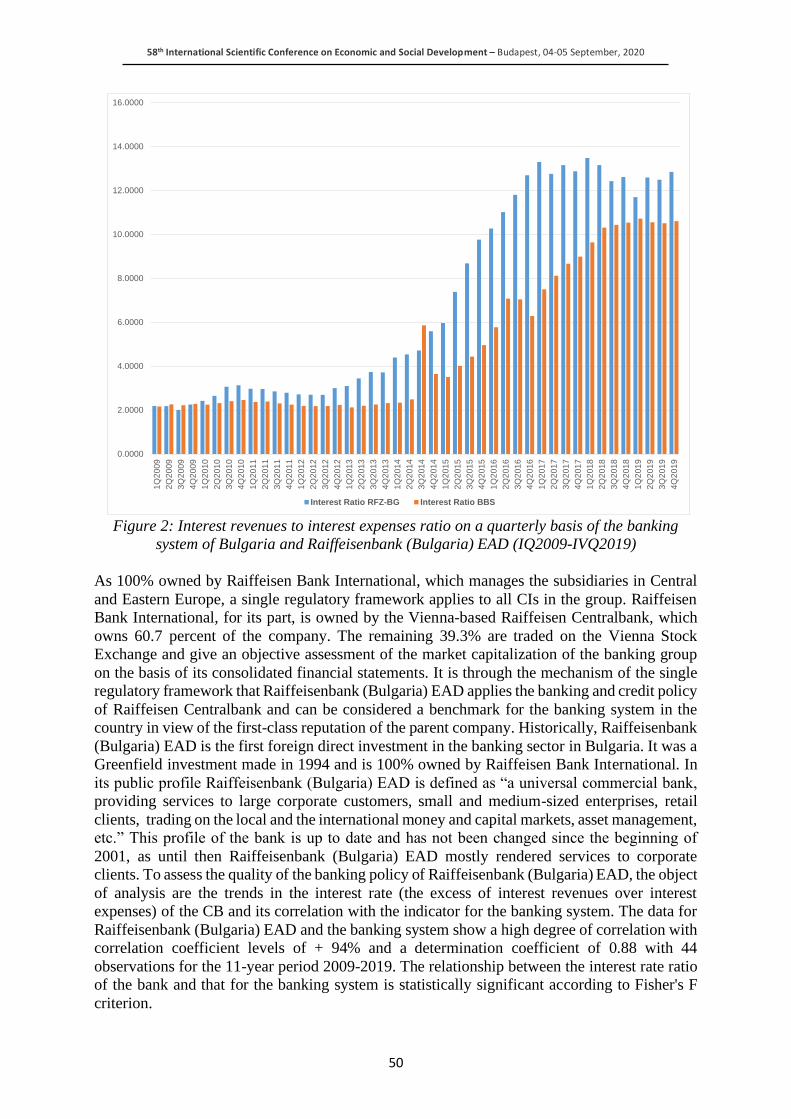
58th International Scientific Conference on Economic and Social Development – Budapest, 04-05 September, 2020
50
Figure 2: Interest revenues to interest expenses ratio on a quarterly basis of the banking
system of Bulgaria and Raiffeisenbank (Bulgaria) EAD (IQ2009-IVQ2019)
As 100% owned by Raiffeisen Bank International, which manages the subsidiaries in Central
and Eastern Europe, a single regulatory framework applies to all CIs in the group. Raiffeisen
Bank International, for its part, is owned by the Vienna-based Raiffeisen Centralbank, which
owns 60.7 percent of the company. The remaining 39.3% are traded on the Vienna Stock
Exchange and give an objective assessment of the market capitalization of the banking group
on the basis of its consolidated financial statements. It is through the mechanism of the single
regulatory framework that Raiffeisenbank (Bulgaria) EAD applies the banking and credit policy
of Raiffeisen Centralbank and can be considered a benchmark for the banking system in the
country in view of the first-class reputation of the parent company. Historically, Raiffeisenbank
(Bulgaria) EAD is the first foreign direct investment in the banking sector in Bulgaria. It was a
Greenfield investment made in 1994 and is 100% owned by Raiffeisen Bank International. In
its public profile Raiffeisenbank (Bulgaria) EAD is defined as “a universal commercial bank,
providing services to large corporate customers, small and medium-sized enterprises, retail
clients, trading on the local and the international money and capital markets, asset management,
etc.” This profile of the bank is up to date and has not been changed since the beginning of
2001, as until then Raiffeisenbank (Bulgaria) EAD mostly rendered services to corporate
clients. To assess the quality of the banking policy of Raiffeisenbank (Bulgaria) EAD, the object
of analysis are the trends in the interest rate (the excess of interest revenues over interest
expenses) of the CB and its correlation with the indicator for the banking system. The data for
Raiffeisenbank (Bulgaria) EAD and the banking system show a high degree of correlation with
correlation coefficient levels of + 94% and a determination coefficient of 0.88 with 44
observations for the 11-year period 2009-2019. The relationship between the interest rate ratio
of the bank and that for the banking system is statistically significant according to Fisher's F
criterion.
0.0000
2.0000
4.0000
6.0000
8.0000
10.0000
12.0000
14.0000
16.0000
1Q
20
09
2Q
20
09
3Q
20
09
4Q
20
09
1Q
20
10
2Q
20
10
3Q
20
10
4Q
20
10
1Q
20
11
2Q
2011
3Q
20
11
4Q
20
11
1Q
20
12
2Q
20
12
3Q
20
12
4Q
20
12
1Q
20
13
2Q
20
13
3Q
20
13
4Q
20
13
1Q
20
14
2Q
2014
3Q
20
14
4Q
20
14
1Q
20
15
2Q
20
15
3Q
20
15
4Q
20
15
1Q
20
16
2Q
20
16
3Q
20
16
4Q
20
16
1Q
20
17
2Q
20
17
3Q
20
17
4Q
20
17
1Q
20
18
2Q
20
18
3Q
2018
4Q
20
18
1Q
20
19
2Q
20
19
3Q
20
19
4Q
20
19
Interest Ratio RFZ-BG Interest Ratio BBS
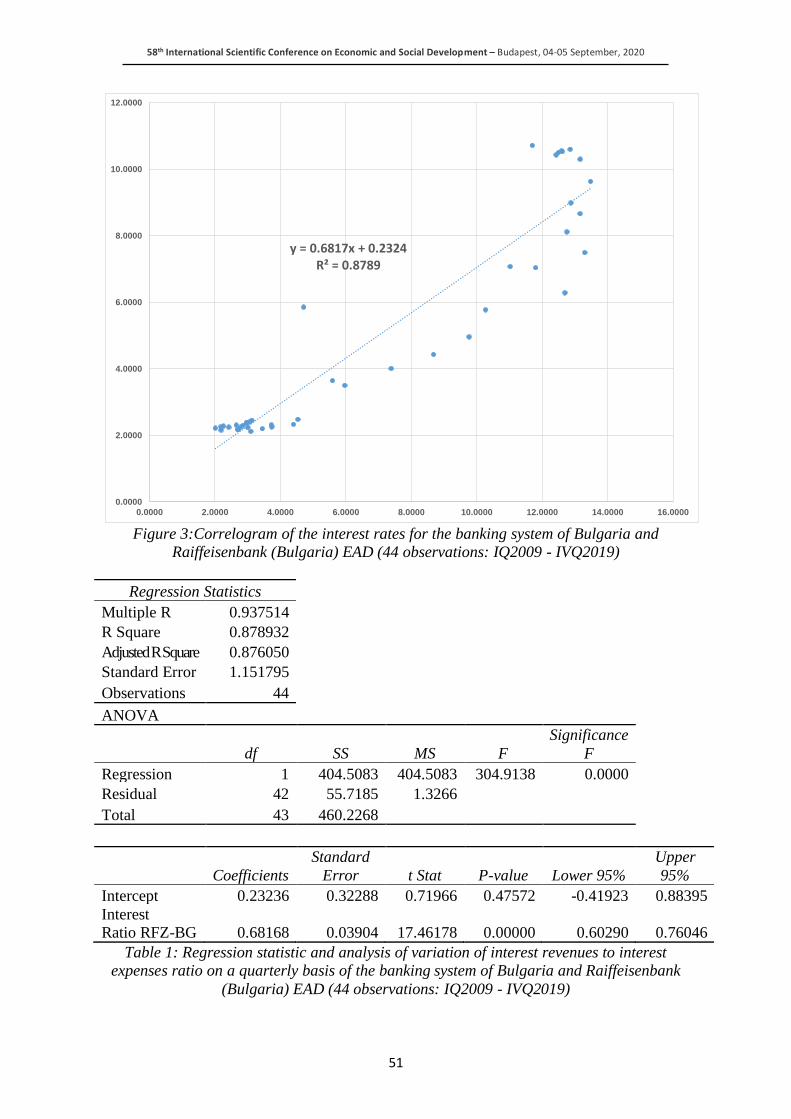
58th International Scientific Conference on Economic and Social Development – Budapest, 04-05 September, 2020
51
Figure 3:Correlogram of the interest rates for the banking system of Bulgaria and
Raiffeisenbank (Bulgaria) EAD (44 observations: IQ2009 - IVQ2019)
Regression Statistics Multiple R 0.937514 R Square 0.878932 Adjusted R Square 0.876050 Standard Error 1.151795 Observations 44
ANOVA
df SS MS F
Significance
F Regression 1 404.5083 404.5083 304.9138 0.0000 Residual 42 55.7185 1.3266 Total 43 460.2268
Coefficients
Standard
Error t Stat P-value Lower 95%
Upper
95%
Intercept 0.23236 0.32288 0.71966 0.47572 -0.41923 0.88395
Interest
Ratio RFZ-BG 0.68168 0.03904 17.46178 0.00000 0.60290 0.76046
Table 1: Regression statistic and analysis of variation of interest revenues to interest
expenses ratio on a quarterly basis of the banking system of Bulgaria and Raiffeisenbank
(Bulgaria) EAD (44 observations: IQ2009 - IVQ2019)
y = 0.6817x + 0.2324R² = 0.8789
0.0000
2.0000
4.0000
6.0000
8.0000
10.0000
12.0000
0.0000 2.0000 4.0000 6.0000 8.0000 10.0000 12.0000 14.0000 16.0000
58th International Scientific Conference on Economic and Social Development – Budapest, 04-05 September, 2020
52
3. SRESS TESTS AND BANK INSOLVENCY
3.1. The philosophy of stress tests
A study by (Apergis & Payne, 2013) with a focus on 90 EU banks found that the financial
health of a credit institution is a function of its latest reporting indicators, along with the
macroeconomic environment. This empirical conclusion supports the request of banking
regulators to use an early warning system to monitor the "health" of banks. Stress tests
themselves are subject to finding a unified international approach. As an alternative to the view
of international standards for stress tests as a tool for early warning of bank insolvency, a
number of central banks develop own methodologies. For example, the Bank of England applies
the RAMSI (Risk Assessment Model of Systemic Institutions) model, which works in a top-
down direction and is classified as a reliable way to assess the resilience of the financial system
to the risks that British banks may face (Burrows et al. 2012). The stress test method of the
Norwegian Central Bank (Norges Bank, The bank model and the stress test in the 2015
Financial Stability Report, 2015) and of the Bank of Lithuania (Bank of Lithuania, 2014) is
similar. A study of (Haben, Friedrich, 2015) compares the stress tests methods in terms of three
criteria:
• First criteria. The type of the test stress, where a distinction is made between stress tests
conducted by macroprudential authorities for the purpose of assessing broad-system risks,
stress tests conducted by microprudential authorities for supervisory purposes (Furlong,
2011) and internal stress tests conducted by the bank risk management for the purposes of
assessing capital adequacy policies;
• Second criteria. Focus of the stress test, where a distinction is made between systematic
assessments at the institutional level measuring basic solvency or liquidity (Basarir,
Toraman, 2014a), assessments on the first and second pillars of Basel II, as well as
assessments of financial instruments, investment portfolios, business branches from
institutional positions for preparation of models for decision-making by the central bank
management regarding reaction to the various risks.
• Third criteria. An approach to conducting the stress test, which is grouped into two
categories, top - down and vice versa, bottom - up.
All three criteria provide options for action and objects of analysis and supervisory control,
which in the context of unified policies of central banks reduce systemic risk and increase
confidence in banking systems. In summary of the many studies in the scope of the problem of
preparing and applying a reliable methodology for stress tests of banks as a way of early
warning and response to bank insolvency, it can be concluded that the focus of monitoring are
the balance sheet positions of the bank, the dynamics of credits and deposits (Wiszniowski,
2010b), as well as the effect of operating with them on the bank's capital and its adequacy in
terms of capital adequacy ratios.
3.2. The banking crisis in Bulgaria with the insolvency of Corporate Commercial Bank -
parameters and early warnings
The application of stress tests, Basel III capital adequacy requirements and the ECB's policy on
building early warning systems in the event of bank insolvency are not only available to banking
regulators at the end of the second decade of the 21st century, but are already the basis for
decision-making regarding recommendations to specific credit institutions for recapitalization,
incl. in the conditions of national applications to join the Banking Union. In terms of the bank
insolvency of one of the systemic Bulgarian banks - Corporate Commercial Bank from 2014,
of interest is the analysis and assessment of the balance sheet positions of the bank itself and of
the banking system as a whole so that dependencies and indicators that can successfully play
the role of warnings of the threat of entering into a regime of capital inadequacy and subsequent
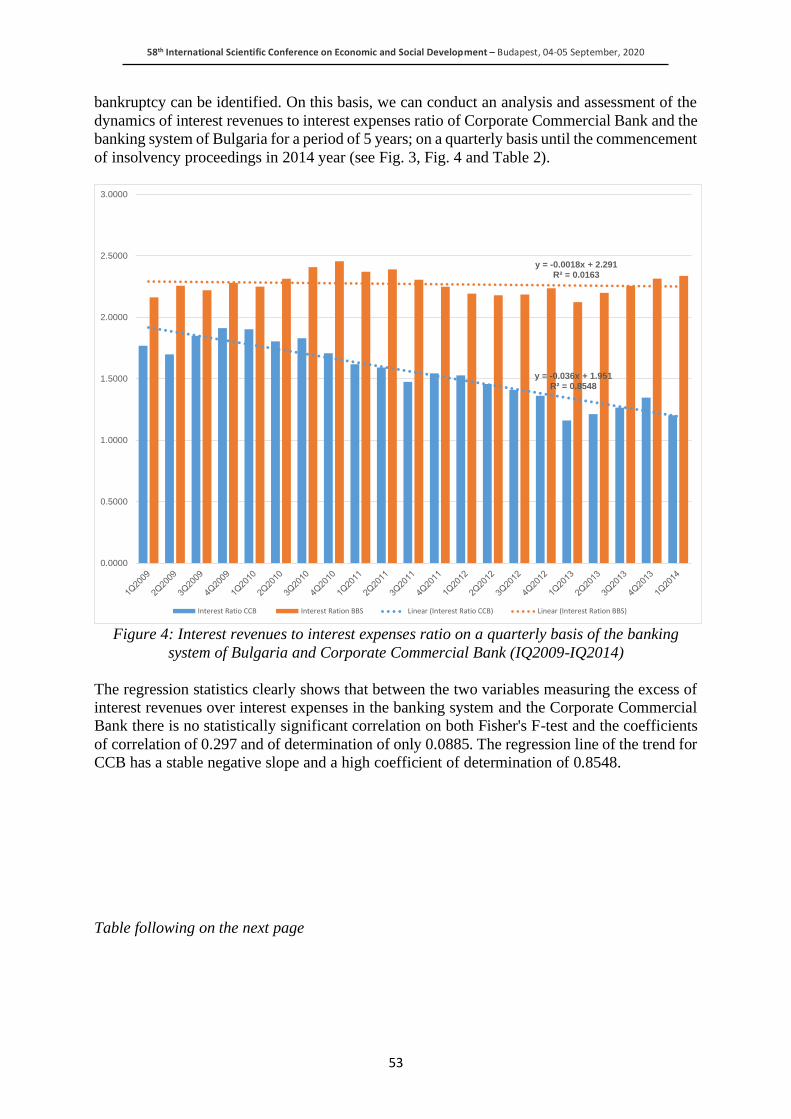
58th International Scientific Conference on Economic and Social Development – Budapest, 04-05 September, 2020
53
bankruptcy can be identified. On this basis, we can conduct an analysis and assessment of the
dynamics of interest revenues to interest expenses ratio of Corporate Commercial Bank and the
banking system of Bulgaria for a period of 5 years; on a quarterly basis until the commencement
of insolvency proceedings in 2014 year (see Fig. 3, Fig. 4 and Table 2).
Figure 4: Interest revenues to interest expenses ratio on a quarterly basis of the banking
system of Bulgaria and Corporate Commercial Bank (IQ2009-IQ2014)
The regression statistics clearly shows that between the two variables measuring the excess of
interest revenues over interest expenses in the banking system and the Corporate Commercial
Bank there is no statistically significant correlation on both Fisher's F-test and the coefficients
of correlation of 0.297 and of determination of only 0.0885. The regression line of the trend for
CCB has a stable negative slope and a high coefficient of determination of 0.8548.
Table following on the next page
y = -0.036x + 1.951R² = 0.8548
y = -0.0018x + 2.291R² = 0.0163
0.0000
0.5000
1.0000
1.5000
2.0000
2.5000
3.0000
Interest Ratio CCB Interest Ration BBS Linear (Interest Ratio CCB) Linear (Interest Ration BBS)
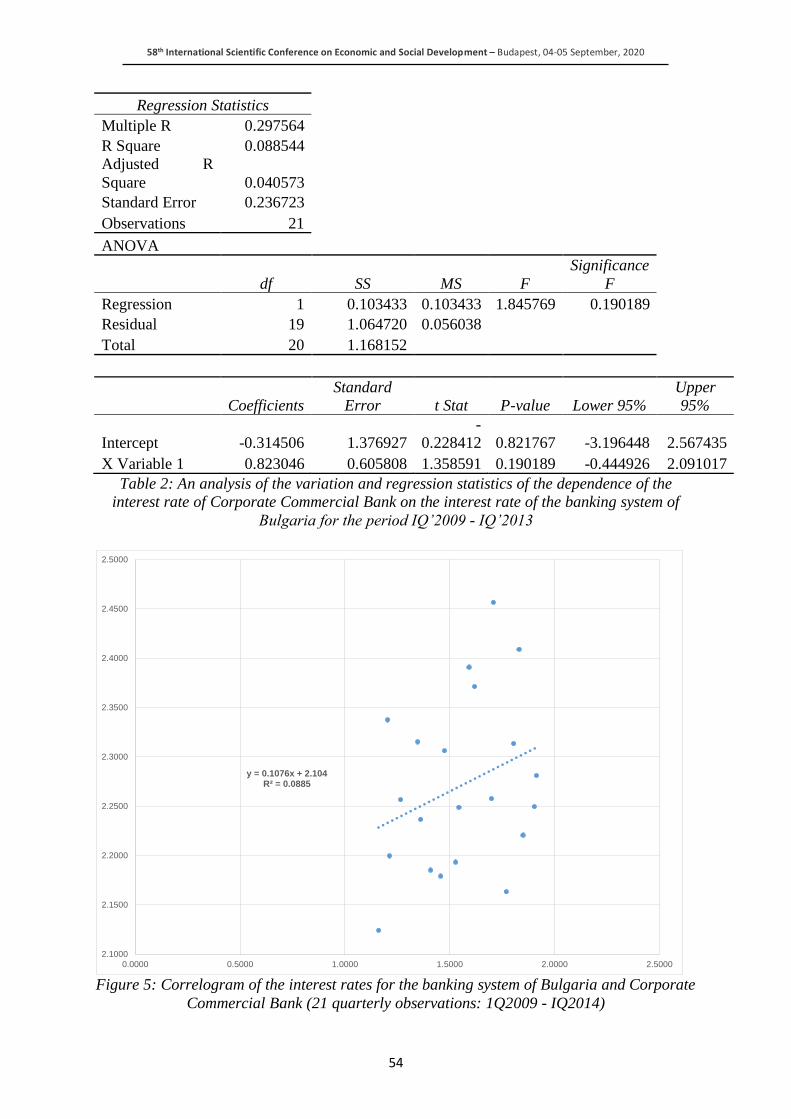
58th International Scientific Conference on Economic and Social Development – Budapest, 04-05 September, 2020
54
Regression Statistics Multiple R 0.297564 R Square 0.088544 Adjusted R
Square 0.040573 Standard Error 0.236723 Observations 21
ANOVA
df SS MS F
Significance
F Regression 1 0.103433 0.103433 1.845769 0.190189 Residual 19 1.064720 0.056038 Total 20 1.168152
Coefficients
Standard
Error t Stat P-value Lower 95%
Upper
95%
Intercept -0.314506 1.376927
-
0.228412 0.821767 -3.196448 2.567435
X Variable 1 0.823046 0.605808 1.358591 0.190189 -0.444926 2.091017
Table 2: An analysis of the variation and regression statistics of the dependence of the
interest rate of Corporate Commercial Bank on the interest rate of the banking system of
Bulgaria for the period IQ’2009 - IQ’2013
Figure 5: Correlogram of the interest rates for the banking system of Bulgaria and Corporate
Commercial Bank (21 quarterly observations: 1Q2009 - IQ2014)
y = 0.1076x + 2.104R² = 0.0885
2.1000
2.1500
2.2000
2.2500
2.3000
2.3500
2.4000
2.4500
2.5000
0.0000 0.5000 1.0000 1.5000 2.0000 2.5000
58th International Scientific Conference on Economic and Social Development – Budapest, 04-05 September, 2020
55
In contrast to the examined credit institution, the banking system maintains a stable level of the
ratio of about 2.2 times the excess of interest revenues over interest expenses at close to zero
slope of the regression trend line and also close to zero value of the coefficient of determination.
The trend of the interest rate for CCB shows that by the end of 2014 there will be parity of
interest revenues and interest expenses, which will automatically result in decapitalization and
cessation of self-financing of growth. The interest rate for CCB itself deteriorates with a
negative beta of minus 0.04 every quarter, which means that every three months the surplus of
the excess of BGN revenues over BGN interest expenses shrinks by BGN 0.04 (1 EURO =
BGN 1.95583) on a quarterly basis until reaching the last reported level of only 1.20 with an
alpha coefficient of 1.95 for the starting level of the regression line. On this basis, it was logical
that on November 6, 2014, the Governing Council of the BNB revoked the banking license of
CCB AD. This decision has marked the beginning of a legally unprecedented process of
managing the balance sheet positions and assets of a systemic commercial bank in insolvency
proceedings and management by insolvency administrators. In a publicly announced final
report of the insolvency administrators of the bank dated 23.9.2015, a 575-page detailed
description of the found in the Corporate Commercial Bank disruption in the regulatory
standards for capital adequacy with an expert valuation of the “perished” bank resources in the
amount of over 4 billion (approximately equal to 4.5% of Bulgaria's GDP in 2015).
4. THE BANKING SYSTEM IN BULGARIA UNDER COVID-19
On April 9, 2020 the BNB Governing Council approved the submitted by the Association of
Banks in Bulgaria draft Procedure for Deferral and Settlement of Liabilities Payable to Banks
and their Subsidiaries - Financial Institutions in relation to the state of emergency enforced by
the National Assembly on 13 March 2020. Once approved, the document constitutes a private
moratoria within the meaning of the European Banking Authority (EBA) Guidelines on
treatment of public and private moratoria in light of COVID-19 (EBA / GL / 2020/02). As of
June 30, 2020, a total of 118,584 claims for liabilities with a gross carrying value of EUR 5
billion were submitted under the Procedure for deferral and settlement of liabilities payable to
banks and their subsidiaries - financial institutions. Of these, 98,499 were approved for EUR
4.15 billion. The companies have requested 15,068 deferrals for EUR 3.85 billion, 13,156 of
which have been approved for EUR 3.17 billion. 103,516 applications were submitted by
households for EUR 1.14 billion, of which 85,343 applications were approved for EUR 0.98
billion (BNB, 2020). According to the first published data, the profit of the banking system of
Bulgaria for 1H2020 is EUR 263.32 million (against EUR 469.4 million for the first six months
of 2019). The total assets of the banking system amount to EUR 58.95 billion, increasing by
0.4 percent in June and by 0.1 percent compared to March 31, 2020. As of the end of June 2020
the banks in Bulgaria have granted loans to the amount of EUR 34.26 billion, 0.08% down to
the previous reporting quarter. in IIQ2020 the deposits in the banking system increased by 0.3
percent and reaching EUR 50 billion by the end of June. This growth is due to households, non-
financial corporations and the government sector. In the opposite direction a decrease was
reported in the deposits of credit institutions and other financial entities. The equity in the
balance sheet of the banking system increased in IIQ2020 by 1.0 percent and at the end of June
amounted to EUR 7.52 billion. The liquidity coverage ratio of the banking system reached 258.0
per cent the liquidity buffer being EUR 15.6 billion. The deteriorating indicators for the banking
system in the COVIOD-19 situation have their logical explanation. There is a significant rupture
of value chains and supply chains in all economic sectors - from supply chains of agricultural
products (Laktionova et al. 2019), to high-tech industries - with special emphasis on
international trade. No less important is the role of China (Kostov, 2016) in international trade
and its connection with the start of the pandemic. The desired effect can be assessed using
various methods.
58th International Scientific Conference on Economic and Social Development – Budapest, 04-05 September, 2020
56
The fact is, however, that behavioural finance offers viable models that clearly explain the
reasons for consumers' withdrawal from purchases and solvent demand. “All models of
heterogeneous investors have significant potential as they cover a wide range of variables (real
market restrictions), but the results of some studies are controversial and require additional
testing. With models involving catastrophic events and survivorship bias, it seems that their
basic assumptions have been consolidated as questionable” (Prodanov, Pavlov, 2016). Based
on the information about a significant contraction in GDP for the economies of the United States
and the European Union. “All models of heterogeneous investors have significant potential as
they cover a wide range of variables (real market restrictions), but the results of some studies
are controversial and require additional testing. With models involving catastrophic events and
survivorship bias, it seems that their basic assumptions have been consolidated as questionable”
(Prodanov, Pavlov, 2016a). Based on the information about a significant contraction of GDP of
the economies of the United States and the European Union, it can be logically concluded that
the health pandemic COVID-19 gave rise to an economic pandemic unknown in scale in world
history.
ACKNOWLEDGEMENT: This research was financially supported by the Academic
Foundation “Prof. d-r Minko Rousenov”, Svishtov, Bulgaria (Grant No. 1001003) and the
Institute of Scientific Research at D. A. Tsenov Academy of Economics, Svishtov, Bulgaria.
LITERATURE:
1. Apergis, N., Payne, J.E. (2013). European Banking Authority Stress Tests and Bank
Failure: Evidence from Credit Risk and Macroeconomic Factors. Banking & Finance
Review, 5(2), 23-32.
2. Bank of Lithuania. (2014). Financial Stability Review. Lietuvos bankas. Retrieved from
https://www.lb.lt/en/reviews-and-publications?query=&ff=1&series%5B%5D=169
3. Basarir, Ç., Toraman, C. (2014a). Financial stability analysis in banking sector: a stress
test method. Muhasebe ve Finansman Dergisi, (62), 129-144.
4. Basel Committee on Banking Supervision. (2013a). Basel III: The Liquidity Coverage Ratio
and liquidity risk monitoring tools, http://www.bis.org/publ/bcbs238.pdf.
5. BNB. (2020). BNB statistics, http://www.bnb.bg/Statistics/index.htm.
6. Branch, B.S., Higgason, J.D. (2010). Establishing Bank Holding Company Insolvency:
Lessons Learned From The Bank Of New England Corporation Bankruptcy. Banking &
Financial Services Policy Report.
7. Burrows, O., Learmonth, D., McKeown, J., Williams, R. (2012). RAMSI: a top-down stress-
testing model developed at the Bank of England. Bank of England Quarterly Bulletin, 52(3),
204-212.
8. Campbell, A. (2006). Bank insolvency and the interests of creditors. Journal of Banking
regulation, 7(1-2), 133-144.
9. Canedo, J. D., Jaramillo, S. M. (2009). A network model of systemic risk: stress testing the
banking system1. Intelligent systems in accounting, finance and management, 16(1‐2), 87-
110. doi:10.1002/isaf.295
10. Carmen-Mihaela, I., Camelia-Daniela, H., Ovidiu-Octavian, M. (2009a). Carmen-Mihaela,
I., Camelia-DanieProcedures And Mechanisms For Prevention Of The Risk Of Financial
Insolvency In The Banking System Through The Use Of Risk Provisions. Annals of Faculty
of Economics, 3(1), 1009-1013.
11. Elsinger, H., Summer, M. (2010a). The Economics of Bank Insolvency, Restructuring and
Recapitalization. Financial Stability Report.
12. Furlong, F. (2011). Stress testing and bank capital supervision. FRBSF Economic Letter,
2011(20), 1-5.
58th International Scientific Conference on Economic and Social Development – Budapest, 04-05 September, 2020
57
13. Ghosh, S.K., Maji, S.G. (2014b). The Impact of Intellectual Capital on Bank Risk: Evidence
from Indian Banking Sector. IUP Journal of Financial Risk Management, 11(3), 18-38.
14. Haben, P., Friedrich, B. (2015). Stress testing European banks: Lessons for risk managers.
Journal of Risk Management in Financial Institutions, 8(3), 264-276.
15. Hainz, C. (2005). Effects of bank insolvency on corporate incentives in transition
economies. Economics of Transition, 3(2), 261-286.
16. Hannan, T.H., Henweck, G.A. (1988). Bank insolvency risk and the market for large
certificates of deposit. Journal of Money, Credit and Banking, 20(2), 203-211.
17. Johnson, M., Mamun, A. (2012a). The Failure of Lehmon Brothers and its impact on other
finajncial institutions. Applied Financial Economics, 375-385.
18. Karkowska, R. (2014c). What Kind Of Systemic Risks Do We Face In The European
Banking Sector? The Approach Of CoVaR Measure. Folia Oeconomica Stetinensia, 14(2),
pp. 114-124. doi:10.1515/foli-2015-0017
19. Kaufman, G.G. (2004). Depositor liquidity and loss sharing in bank failure resolutions.
Contemporary Economic Policy, 22(2), 237-249.
20. Kaufman, G.G. (2006a). Using efficient bank insolvency resolution to solve the deposit
insurance problem. Journal of Banking Regulation, 8(1), 40-50.
21. Kazandzhieva-Yordanova, I. (2017). Too Big To Fail Doctrine And The Financial Safety
Net. Economic Archive / Narodnostopanski Arhiv, I, 15-37.
22. Keshari, M. (2015a). Analysing insolvency risk of selected indian public and private sector
banks through camel parameter. International Journal of Research in Commerce &
Management, 6(5), 39-47.
23. Kostov, D. (2016). A new yuan or a new monetary system. Economic Archive, LXIX(2),
стр. 68-90, https://www2.uni-svishtov.bg/nsarhiv/title.asp?title=559.
24. Laktionova, O., Dobrovolskyi, O., Karpova, T., Zahariev, A. (2019). Cost efficiency of
applying trade finance for agricultural supply chains. Management Theory and Studies for
Rural Business and Infrastructure Development, 41(1), pp. 62-73.
doi:10.15544/mts.2019.06.
25. Lastra, R. (2008). Northern Rock, UK Bank Insolvency and Cross-border Bank Insolvency.
Journal of Banking Regulation, 165-186.
26. Lastra, R.M. (2004). Cross-border bank insolvency: Legal implications in the case of banks
operating in different jurisdictions in Latin America. Journal of International Banking
Regulations, 5(3), 201-227.
27. Lastra, R.M. (2008a). Northern Rock, UK bank insolvency and cross-border bank
insolvency. Journal of Banking Regulation, 9(3), 165-186.
28. Mäkinen, M., Solanko, L. (2017a). Determinants of bank closures: Do changes of CAMEL
variables matter? BOFIT Discussion Papers 16/ 2017, 4-26.
29. Marini, F. (2003). Bank insolvency, deposit insurance, and capital adequacy. Journal of
Financial Services Research, 24(1), 67-78.
30. McFadden, R.L. (2008b). Regulatory optimal bank size. International Advances in
Economic Research, 14(2), 142-155. doi:DOI 10.1007/s11294-008-9138-y
31. Morris, S., Shin, H.S. (2016). Illiquidity component of credit risk. International Economic
Review, 57(4), 1135-1148.
32. Ngalawa, H., Tchana, F.T., Viegi, N. (2016a). Banking instability and deposit insurance:
The role of moral hazard. Journal of Applied Economics, 19(2), 323-350.
33. Nikonova, E., Sabitova, N., Shavaleeva, C., Khairullova, A., Zahariev, A. (2020). Tax
capacity of the Russian Federation constituent entities: problems of assessment and
unequal distribution. (S. L. Gabdrakhmanov N.) Springer Proceedings in Business and
Economics (Series Online ISSN: 2198-7254 ), pp. 79-86. doi:https://doi.org/10.1007/978-
3-030-39859-0_7.
58th International Scientific Conference on Economic and Social Development – Budapest, 04-05 September, 2020
58
34. Norges Bank. (2015b). The bank model and the stress test in the 2015 Financial Stability
Report. Norges Bank. Norges Bank.
35. Peshev, P. (2015c). Determinants of Interest Rate Spreads in Bulgaria. Discussion
papers/DP/99/2015, pp. 5-41.
36. Pettway, R.H. (1980). Potential insolvency, market efficiency, and bank regulation of large
commercial banks. Journal of Financial and Quantitative Analysis, 15(1), 219-236.
37. Pollner, J. (2013a). Risk Sharing and Risk Bearing: New Generation Regulations in Bank
Insolvency Resolution. Zeszyty BRE BANK-CASE, (124), (pp. 21-28).
38. Prodanov, S., Pavlov, T. (2016a). Comparative Analysis of the Leading Consumption-Based
Asset Pricing Models. Economic Archive, LXIX(1), pp. 20-46, https://www2.uni-
svishtov.bg/nsarhiv/title.asp?title=531.
39. Rahman, A. A. (2011a). Lending structure and insolvency risk of malaysian banks: A
sensitivity analysis. International Journal of Business and Society, 12(2), 16-36.
40. Sanches, D. (2016b). On the welfare properties of fractional reserve banking. International
Economic Review, 57(3), 935-954.
41. Sanya, S., Wolfe, S. (2011b). Can banks in emerging economies benefit from revenue
diversification? Journal of Financial Services Research, 40(1-2), 79-101. doi:DOI
10.1007/s10693-010-0098-z
42. Strobel, F. (2011c). Bank insolvency risk and Z-score measures with unimodal returns.
Applied Economics Letters, 18(17), 1683-1685. doi:10.1080/13504851
43. Swamy, M. (2009a). Financial management call for new approach to ethical-based
financial statement analysis. Journal of Financial Management and Analysis, 22(2), 70-84.
44. Terziev, V. (2020а). Programming as mechanism of managing, oriented towards results. //
50th International Scientific Conference on Economic and Social Development
Development, 13-14 February 2020, Chelyabinsk, Economic and Social Development,
2020, pp. 92-98, ISSN 1849-7535.
45. Terziev, V. (2019b). The role of business in society. // Proceedings of SOCIOINT 2019-
6th International Conference on Education, Social Sciences and Humanities 24-26 June
2019- Istanbul, Turkey, International Organization Center of Academic Research, Istanbul,
Turkey, 2019, pp. 324-330, ISBN: 978-605-82433-6-1.
46. Terziev, V. (2019c). Social entrepreneurship in Bulgaria and Europe. // Proceedings of
SOCIOINT 2019- 6th International Conference on Education, Social Sciences and
Humanities 24-26 June 2019- Istanbul, Turkey, International Organization Center of
Academic Research, Istanbul, Turkey, 2019, pp. 337-345, ISBN: 978-605-82433-6-1.
47. Terziev, V. (2019d). The role of social policy in economic development. // Proceedings of
SOCIOINT 2019- 6th International Conference on Education, Social Sciences and
Humanities 24-26 June 2019- Istanbul, Turkey, International Organization Center of
Academic Research, Istanbul, Turkey, 2019, pp. 396-404, ISBN: 978-605-82433-6-1.
48. Terziev, V., Bencheva, N., Stoeva, T., Georgiev, M. (2020b). Developing social
entrepreneurship in the EU: a cross-country analysis. // Proceedings of INTCESS 2020-
7th International Conference on Education and Social Sciences 20-22 January, 2020 -
DUBAI (UAE), International Organization Center of Academic Research, Istanbul, Turkey,
2020, pp. 746-753, ISBN: 978-605-82433-8-5.
49. Terziev, V., Georgiev, M., Solovev, D. (2020c). Management control in implementation of
the social program. // Proceedings of INTCESS 2020- 7th International Conference on
Education and Social Sciences 20-22 January, 2020 - DUBAI (UAE), International
Organization Center of Academic Research, Istanbul, Turkey, 2020, pp. 870-879, ISBN:
978-605-82433-8-5.
58th International Scientific Conference on Economic and Social Development – Budapest, 04-05 September, 2020
59
50. Terziev, V., Georgiev, M., Solovev, D. (2020d). Regulating social development and the
concept of controlling. // Proceedings of INTCESS 2020- 7th International Conference on
Education and Social Sciences 20-22 January, 2020 - DUBAI (UAE), International
Organization Center of Academic Research, Istanbul, Turkey, 2020, pp. 880-892, ISBN:
978-605-82433-8-5.
51. Terziev, V., Lyubcheva, M., Solovev, D. (2020e). The interaction: business- education-
investment for development. // Proceedings of INTCESS 2020- 7th International Conference
on Education and Social Sciences 20-22 January, 2020 - DUBAI (UAE), International
Organization Center of Academic Research, Istanbul, Turkey, 2020, pp. 865-869, ISBN:
978-605-82433-8-5.
52. Tsai, B. H. (2010a). Gauging bank efficiency during card insolvency crisis: the case of the
Taiwanese banks. The Journal of Developing Areas, 44(1), 267-285.
53. Vogiazas, S., Alexiou, C. (2013). Liquidity and the business cycle: empirical evidence from
the Greek banking sector. Economic Annals, 109-120.
54. Wilson, L. (2010a). The put problem with buying toxic assets. Applied Financial
Economics, 20(1-2), 31-35.
55. Wiszniowski, E. (2010b). Stress testing as a tool for simulating the effects of crisis in Banks.
Business and Economic Horizons, 1(1), 58-66.
56. Zahariev, A. (2014d). Issues of corporate capital optimisation in Bulgaria. Business
Management, 26-47.
57. Zahariev, A., Zveryakov, M., Prodanov, S., Zaharieva, G., Angelov, P., Zarkova, S.,
Petrova, M. (2020f). Debt management evaluation through support vector machines: on the
example of Italy and Greece. Entrepreneurship and Sustainability Issues, 7(3), 2382-2393.
doi:https://doi.org/10.9770/jesi.2020.7.3(61).
58th International Scientific Conference on Economic and Social Development – Budapest, 04-05 September, 2020
60
THE INFLUENCE OF COVID-19 ON TOURISM – THE CASE OF THE
ISLAND OF HVAR
Fran Galetic
Faculty of Economics and Business, University of Zagreb, Croatia
ABSTRACT
The pandemic of Covid-19 is one of the largest shocks in the economy on the worldwide level.
All economies have experienced the falls in GDP and rise of unemployment from the beginning
of 2020. Croatia is one of such countries, where the influence on economy if very large. As
Croatian economy is very much based in tourism, and tourism is suffering extremely during the
pandemic period, the expectations about the fall of GDP are about 10% in 2020. The aim of
this paper is to analyse the influence of Covid-19 pandemic on Croatian tourism, after 2019
which was the year of records with almost 20 million tourist arrival. The analysis will be done
on the example of the island of Hvar, one of the most visited tourism destinations in Croatia.
The island of Hvar is divided into 5 tourist places: Hvar (town), Stari Grad, Jelsa, Vrboska and
Sućuraj. Each of these five places will be analysed and compared. The analysis will show how
the number and the structure of tourists have changed due to the Covid-19.
Keywords: Croatia, Hvar, tourism, Covid-19
1. INTRODUCTION
The Covid-19 pandemic the ongoing pandemic od coronavirus which causes severe acute
respiratory problems. It was first detected at the end of 2019 in China, and rapidly it started to
appear in other countries. The first case of Covid-19 in Croatia was reported on 25 February
2020. In only two weeks the number of active cases surpassed 100, in April it surpassed 1000.
At the end of April, the number of active cases started to fall, but starting from June, is was
rising again. On 16 August the number of recorded cases in Croatia was 6500. The impact of
Covid-19 pandemic in Croatia can be regarded through various fields, from education to
economy and tourism. The whole education process was stopped in March and moved online.
Schools had the daily television program, and universities used more sophisticated methods for
video streaming of lectures and communication with students. Almost all culture and music
events were postponed or cancelled. Sport competitions were stopped, churches were closed,
restaurants and bars were partly closed and shops had the special regime. Due to the panic
which occurred among citizens, shops were full of people buying larger quantities of milk,
flower, oil, eggs, sugar, rice, meat, baby products, soaps, detergents and specially masks, gloves
and disinfectants. This led to the rise of prices of these products, especially the last three
mentioned. The prediction of the fall in GDP for 2020 vary from 7% to 10%. One of the key
components of Croatian GDP is tourism. Tourism is traditionally a significant source of income,
particularly during the summer months. Revenues from tourism are at the level of 20% of
Croatian GDP, which is the highest share in the European Union. About 13% of all employees
in Croatia work in tourism. These data show the importance of tourism for Croatian economy,
and the aim of this paper is to analyse how Covid-19 has influenced Croatian tourism on the
example of the island of Hvar, one of the most popular destinations in Croatia.
2. LITERATURE OVERVIEW
As Covid-19 is relatively new and unknown, not many researchers have analyzed how it
influences tourism. Here are presented some of the most relevant researches. Present-day mass
tourism uncannily resembles an auto-immune disease. Yet, self-destructive as it may be, it is
also self-regenerating, changing its appearance and purpose.
58th International Scientific Conference on Economic and Social Development – Budapest, 04-05 September, 2020
61
They are two modes that stand in contrast to each other. We can see them as opposites that
delimit a conceptual dimension ordering varieties of present-day mass tourism. The first pole
calls forth tourism as a force leaving ruin and destruction in its wake or at best a sense of
nostalgia for what has been lost, the other sees tourism as a force endlessly resuscitating and
re-inventing itself. Kroes1 highlights both sides of the story. These times of the Covid-19
pandemic, with large swathes of public life emptied by social lock-down, remind us of a second,
cross-cutting conceptual dimension, ranging from public space brimming with human life to its
post-apocalyptic opposite eerily empty and silent. The Covid-19 outbreak is a sharp reminder
that pandemics, like other rarely occurring catastrophes, have happened in the past and will
continue to happen in the future. Even if we cannot prevent dangerous viruses from emerging,
we should prepare to dampen their effects on society. The current outbreak has had severe
economic consequences across the globe, and it does not look like any country will be
unaffected. This not only has consequences for the economy; all of society is affected, which
has led to dramatic changes in how businesses act and consumers behave. This special issue is
a global effort to address some of the pandemic-related issues affecting society. Naveen and
Anders2 analyze 13 papers that cover different industry sectors (e.g., tourism, retail, higher
education), changes in consumer behavior and businesses, ethical issues, and aspects related to
employees and leadership. Marianna3 aims to critically review past and emerging literature to
help professionals and researchers alike to better understand, manage and valorize both the
tourism impacts and transformational affordance of Covid-19. To achieve this, first, the paper
discusses why and how the Covid-19 can be a transformational opportunity by discussing the
circumstances and the questions raised by the pandemic. By doing this, the author identifies the
fundamental values, institutions and pre-assumptions that the tourism industry and academia
should challenge and break through to advance and reset the research and practice frontiers.
The paper continues by discussing the major impacts, behaviours and experiences that three
major tourism stakeholders (namely tourism demand, supply and destination management
organisations and policy makers) are experiencing during three Covid-19 stages (response,
recovery and reset). This provides an overview of the type and scale of the Covid-19 tourism
impacts and implications for tourism research. Unquestionable, the Covid-19 pandemic is one
of the most impactful events of the 21st century and has tremendous effects on tourism. While
many tourism researchers worldwide are currently 'Covid-19 research gap spotting', Zenker and
Kock4 call for more deliberateness and rigor. While they agree that the coronavirus pandemic
is unique and relevant to research, they argue that not all effects are worth researching. Previous
research on crises and disasters do show similar patterns and existing theories can often very
well explain the current phenomena. Thus, six illustrative examples are shown how a research
agenda could look like. This includes parts where theoretical explanations from tourism are
missing, as well as where we think existing knowledge might be subject to a tourism paradigm-
shift due to the coronavirus pandemic. The coronavirus pandemic has led to revenue loss for
tourism enterprises and workers due to restrictions on movement. In response, governments
have made available temporary financial support, but not to those tourist enterprises and
workers in the undeclared economy. Reporting a 2019 Eurobarometer survey, Williams5 reveals
that one in 165 European citizens engage in undeclared work in tourism and the groups
involved.
1 Kroes, R. (2020) Present-Day Mass Tourism: its Imaginaries and Nightmare Scenarios, Society, Jul 2020 2 Naveen, D.; Anders, G. (2020) Effects of COVID-19 on business and research, Journal of business research, Volume:117, Pages:284-289 3 Marianna, S. (2020) Tourism and COVID-19: Impacts and implications for advancing and resetting industry and research, Journal of business research, Volume:117, Pages:312-321 4 Zenker, S.; Kock, F. (2020) The coronavirus pandemic - A critical discussion of a tourism research agenda, Tourism management, Volume: 81 5 Williams, C.C. (2020) Impacts of the coronavirus pandemic on Europe's tourism industry: Addressing tourism enterprises and workers in the undeclared economy, International Journal of Tourism Research, Jul 2020
58th International Scientific Conference on Economic and Social Development – Budapest, 04-05 September, 2020
62
To bring these enterprises and workers onto the radar of the state, a voluntary disclosure
initiative is advocated offering access to the temporary financial support for undeclared
enterprises and workers disclosing their previous undeclared work. Caribbean islands that are
highly dependent on tourism are facing compounding crises from climate-related disasters to
the Covid-19 pandemic travel disruption. The rebuilding of tourism infrastructure has often
been one of the main aims of international development aid and regional government responses
to natural disasters. Sheller6 seeks to identify other ways in which Caribbean small island states
and non-independent territories might rebuild more sustainable ecologies and economies as
they come out of the pandemic within the ongoing climate crisis. Farzanegan et al.7 examine
the relationship between international tourism and Covid-19 cases and associated deaths in
more than 90 nations. They use a cross-country regression analysis and find a positive
correlation between international tourism and the cumulated level of Covid-19 confirmed cases
and death by April 30, 2020. The regression analyses show that countries exposed to high flows
of international tourism are more prone to cases and deaths caused by the Covid-19 outbreak.
This association is robust even after controlling for other socioeconomic determinants of Covid-
19 outbreak and regional dummies. Based on the estimations, a 1% higher level of inbound and
outbound tourism is associated with 1.2% and 1.4% higher levels of confirmed Covid-19 cases
and death, respectively, controlling for other factors. After normalizing the number of cases and
death by size of population, the statistical significance remains robust, especially for the Covid-
19 deaths, while the effect size reduces. The Covid-19 is challenging the world. With no vaccine
and limited medical capacity to treat the disease, nonpharmaceutical interventions are the main
strategy to contain the pandemic. Unprecedented global travel restrictions and stay-at-home
orders are causing the most severe disruption of the global economy since World War II. With
international travel bans affecting over 90% of the world population and wide-spread
restrictions on public gatherings and community mobility, tourism largely ceased in March
2020. Early evidence on impacts on air travel, cruises, and accommodations have been
devastating. While highly uncertain, early projections from UNWTO for 2020 suggest
international arrivals could decline by 20 to 30% relative to 2019. Tourism is especially
susceptible to measures to counteract pandemics because of restricted mobility and social
distancing. Gossling, Scott and Hall8 compare the impacts of COVID-19 to previous
epidemic/pandemics and other types of global crises and explores how the pandemic may
change society, the economy, and tourism. They discuss why COVID-19 is an analogue to the
ongoing climate crisis, and why there is a need to question the volume growth tourism model
advocated by UNWTO, ICAO, CLIA, WTTC and other tourism organizations.
3. TOURISM IN CROATIA
Croatia is very well known tourist destination, famous by its summer tourism on the coast of
the Adriatic see. With the area of 56594 km2 and the population of 4,28 million, Croatia is a
smaller European country. The next table shows basic tourist indicators for Croatian Tourism.
Table following on the next page
6 Sheller, M. (2020) Reconstructing tourism in the Caribbean: connecting pandemic recovery, climate resilience and sustainable tourism through mobility justice, Journal of Sustainable Tourism, Jul 2020 7 Farzanegan, M.R.; Gholipour, H.F.; Feizi, M.; Nunkoo, R.; Andargoli, A.E. (2020) International Tourism and Outbreak of Coronavirus (COVID-19): A Cross-Country Analysis, Journal of Travel Research, Jul 2020 8 Gossling, S.; Scott, D.; Hall, C.M. (2020) Pandemics, tourism and global change: a rapid assessment of COVID-19, Journal of Sustainable Tourism, Apr 2020
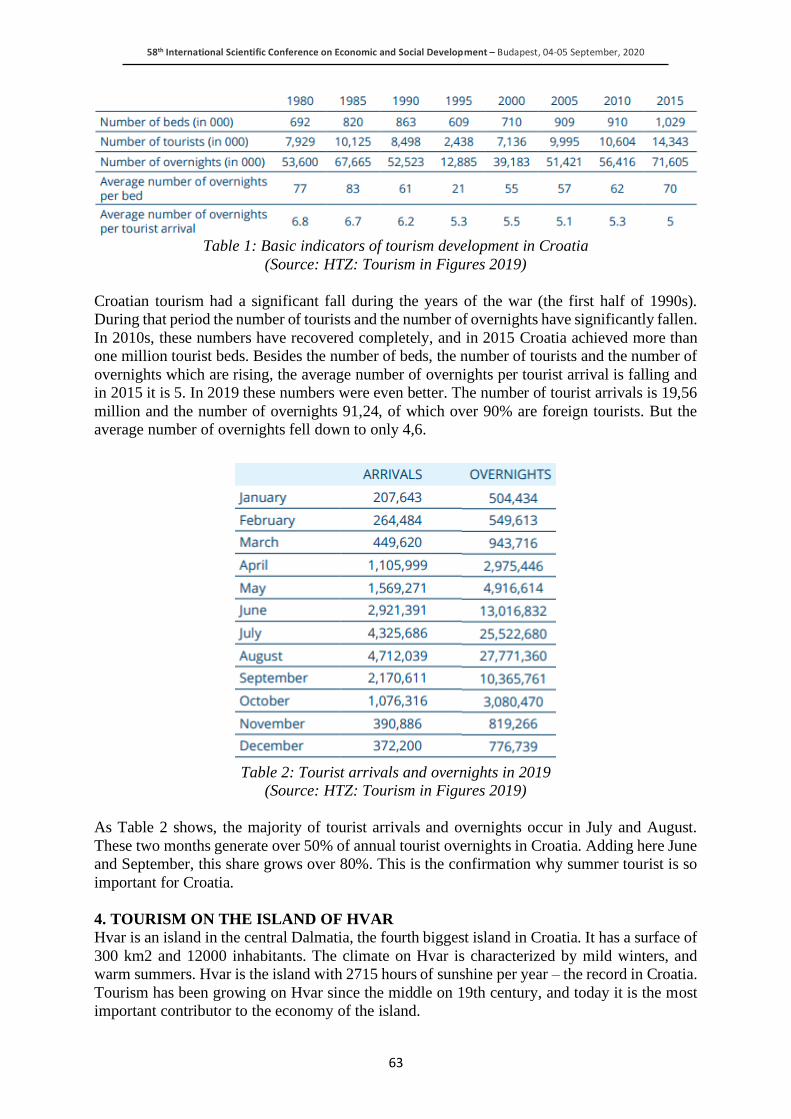
58th International Scientific Conference on Economic and Social Development – Budapest, 04-05 September, 2020
63
Table 1: Basic indicators of tourism development in Croatia
(Source: HTZ: Tourism in Figures 2019)
Croatian tourism had a significant fall during the years of the war (the first half of 1990s).
During that period the number of tourists and the number of overnights have significantly fallen.
In 2010s, these numbers have recovered completely, and in 2015 Croatia achieved more than
one million tourist beds. Besides the number of beds, the number of tourists and the number of
overnights which are rising, the average number of overnights per tourist arrival is falling and
in 2015 it is 5. In 2019 these numbers were even better. The number of tourist arrivals is 19,56
million and the number of overnights 91,24, of which over 90% are foreign tourists. But the
average number of overnights fell down to only 4,6.
Table 2: Tourist arrivals and overnights in 2019
(Source: HTZ: Tourism in Figures 2019)
As Table 2 shows, the majority of tourist arrivals and overnights occur in July and August.
These two months generate over 50% of annual tourist overnights in Croatia. Adding here June
and September, this share grows over 80%. This is the confirmation why summer tourist is so
important for Croatia.
4. TOURISM ON THE ISLAND OF HVAR
Hvar is an island in the central Dalmatia, the fourth biggest island in Croatia. It has a surface of
300 km2 and 12000 inhabitants. The climate on Hvar is characterized by mild winters, and
warm summers. Hvar is the island with 2715 hours of sunshine per year – the record in Croatia.
Tourism has been growing on Hvar since the middle on 19th century, and today it is the most
important contributor to the economy of the island.
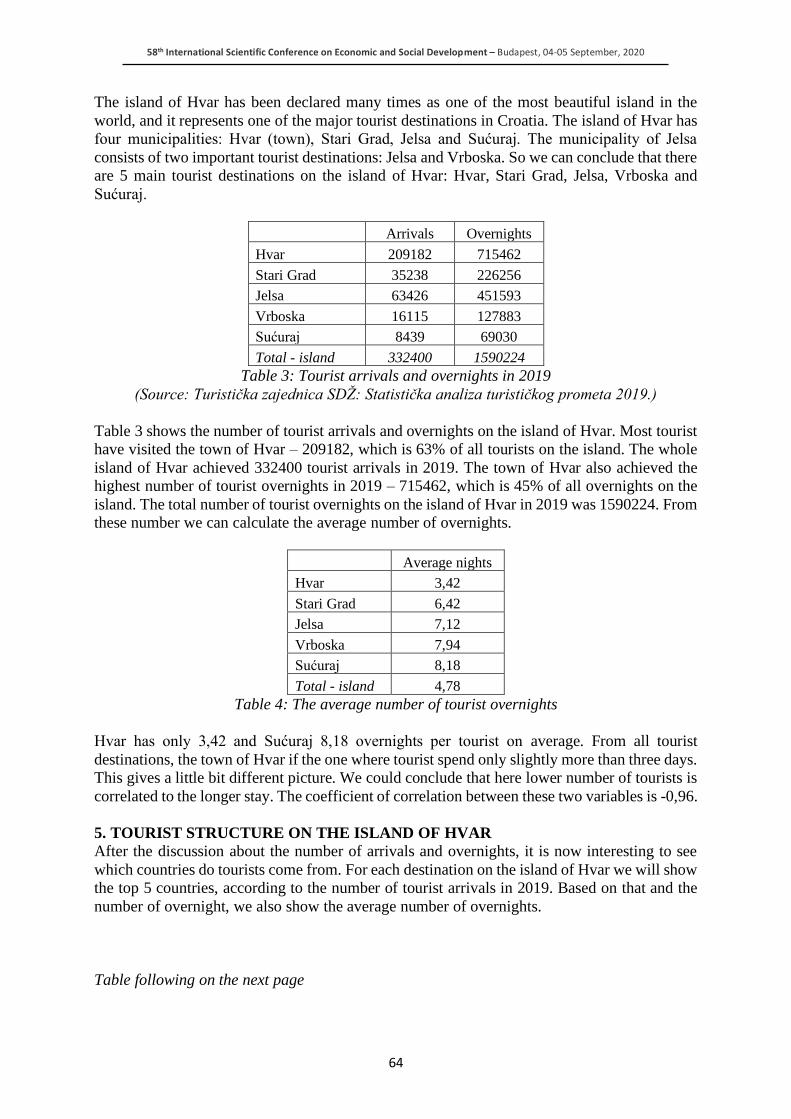
58th International Scientific Conference on Economic and Social Development – Budapest, 04-05 September, 2020
64
The island of Hvar has been declared many times as one of the most beautiful island in the
world, and it represents one of the major tourist destinations in Croatia. The island of Hvar has
four municipalities: Hvar (town), Stari Grad, Jelsa and Sućuraj. The municipality of Jelsa
consists of two important tourist destinations: Jelsa and Vrboska. So we can conclude that there
are 5 main tourist destinations on the island of Hvar: Hvar, Stari Grad, Jelsa, Vrboska and
Sućuraj.
Arrivals Overnights
Hvar 209182 715462
Stari Grad 35238 226256
Jelsa 63426 451593
Vrboska 16115 127883
Sućuraj 8439 69030
Total - island 332400 1590224
Table 3: Tourist arrivals and overnights in 2019
(Source: Turistička zajednica SDŽ: Statistička analiza turističkog prometa 2019.)
Table 3 shows the number of tourist arrivals and overnights on the island of Hvar. Most tourist
have visited the town of Hvar – 209182, which is 63% of all tourists on the island. The whole
island of Hvar achieved 332400 tourist arrivals in 2019. The town of Hvar also achieved the
highest number of tourist overnights in 2019 – 715462, which is 45% of all overnights on the
island. The total number of tourist overnights on the island of Hvar in 2019 was 1590224. From
these number we can calculate the average number of overnights.
Average nights
Hvar 3,42
Stari Grad 6,42
Jelsa 7,12
Vrboska 7,94
Sućuraj 8,18
Total - island 4,78
Table 4: The average number of tourist overnights
Hvar has only 3,42 and Sućuraj 8,18 overnights per tourist on average. From all tourist
destinations, the town of Hvar if the one where tourist spend only slightly more than three days.
This gives a little bit different picture. We could conclude that here lower number of tourists is
correlated to the longer stay. The coefficient of correlation between these two variables is -0,96.
5. TOURIST STRUCTURE ON THE ISLAND OF HVAR
After the discussion about the number of arrivals and overnights, it is now interesting to see
which countries do tourists come from. For each destination on the island of Hvar we will show
the top 5 countries, according to the number of tourist arrivals in 2019. Based on that and the
number of overnight, we also show the average number of overnights.
Table following on the next page
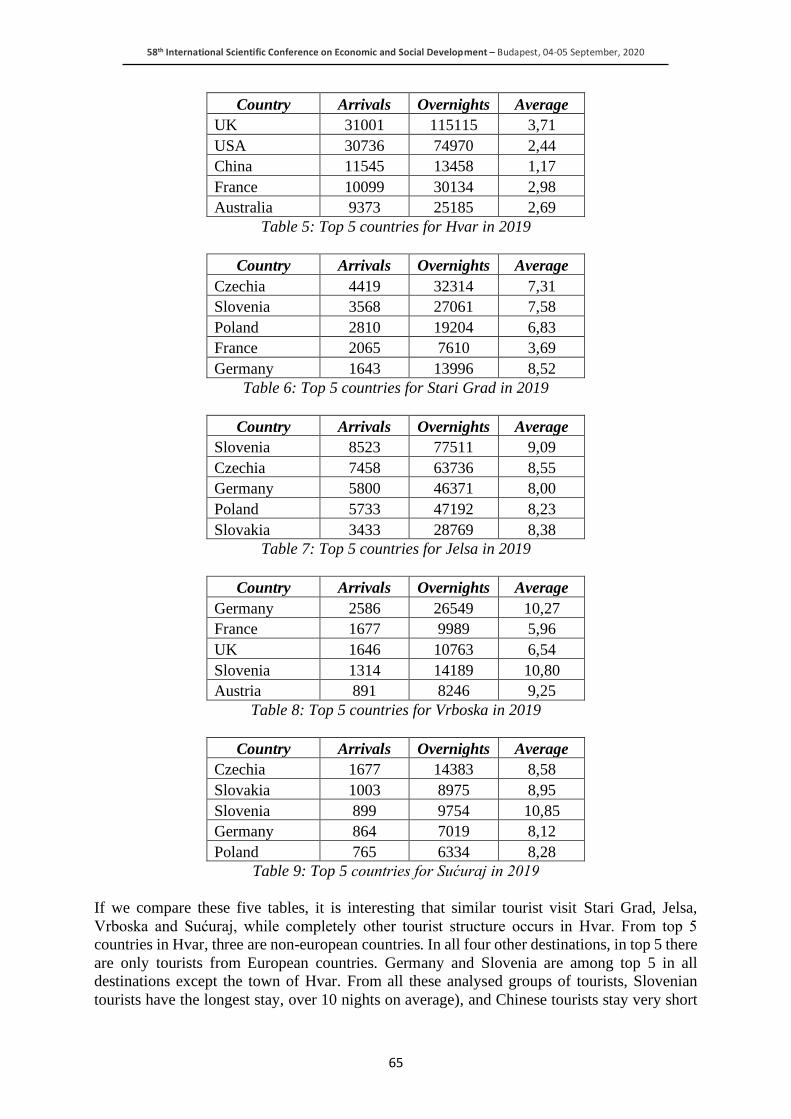
58th International Scientific Conference on Economic and Social Development – Budapest, 04-05 September, 2020
65
Country Arrivals Overnights Average
UK 31001 115115 3,71
USA 30736 74970 2,44
China 11545 13458 1,17
France 10099 30134 2,98
Australia 9373 25185 2,69
Table 5: Top 5 countries for Hvar in 2019
Country Arrivals Overnights Average
Czechia 4419 32314 7,31
Slovenia 3568 27061 7,58
Poland 2810 19204 6,83
France 2065 7610 3,69
Germany 1643 13996 8,52
Table 6: Top 5 countries for Stari Grad in 2019
Country Arrivals Overnights Average
Slovenia 8523 77511 9,09
Czechia 7458 63736 8,55
Germany 5800 46371 8,00
Poland 5733 47192 8,23
Slovakia 3433 28769 8,38
Table 7: Top 5 countries for Jelsa in 2019
Country Arrivals Overnights Average
Germany 2586 26549 10,27
France 1677 9989 5,96
UK 1646 10763 6,54
Slovenia 1314 14189 10,80
Austria 891 8246 9,25
Table 8: Top 5 countries for Vrboska in 2019
Country Arrivals Overnights Average
Czechia 1677 14383 8,58
Slovakia 1003 8975 8,95
Slovenia 899 9754 10,85
Germany 864 7019 8,12
Poland 765 6334 8,28
Table 9: Top 5 countries for Sućuraj in 2019
If we compare these five tables, it is interesting that similar tourist visit Stari Grad, Jelsa,
Vrboska and Sućuraj, while completely other tourist structure occurs in Hvar. From top 5
countries in Hvar, three are non-european countries. In all four other destinations, in top 5 there
are only tourists from European countries. Germany and Slovenia are among top 5 in all
destinations except the town of Hvar. From all these analysed groups of tourists, Slovenian
tourists have the longest stay, over 10 nights on average), and Chinese tourists stay very short
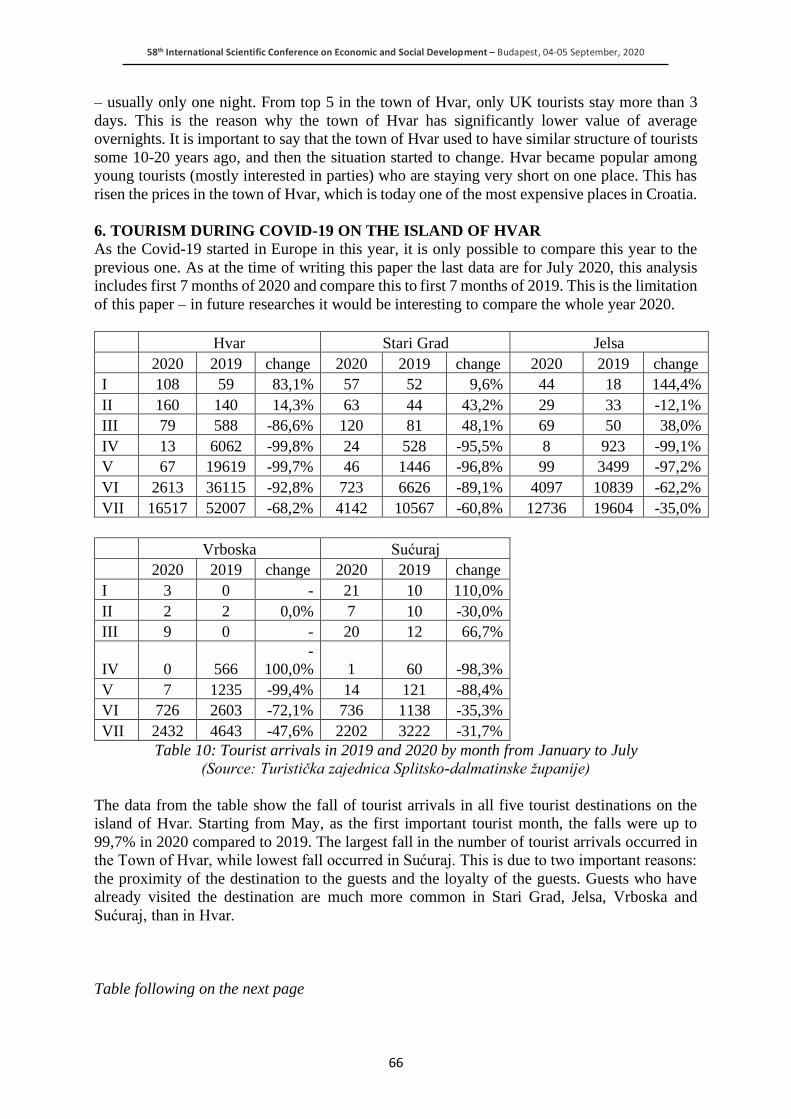
58th International Scientific Conference on Economic and Social Development – Budapest, 04-05 September, 2020
66
– usually only one night. From top 5 in the town of Hvar, only UK tourists stay more than 3
days. This is the reason why the town of Hvar has significantly lower value of average
overnights. It is important to say that the town of Hvar used to have similar structure of tourists
some 10-20 years ago, and then the situation started to change. Hvar became popular among
young tourists (mostly interested in parties) who are staying very short on one place. This has
risen the prices in the town of Hvar, which is today one of the most expensive places in Croatia.
6. TOURISM DURING COVID-19 ON THE ISLAND OF HVAR
As the Covid-19 started in Europe in this year, it is only possible to compare this year to the
previous one. As at the time of writing this paper the last data are for July 2020, this analysis
includes first 7 months of 2020 and compare this to first 7 months of 2019. This is the limitation
of this paper – in future researches it would be interesting to compare the whole year 2020.
Hvar Stari Grad Jelsa
2020 2019 change 2020 2019 change 2020 2019 change
I 108 59 83,1% 57 52 9,6% 44 18 144,4%
II 160 140 14,3% 63 44 43,2% 29 33 -12,1%
III 79 588 -86,6% 120 81 48,1% 69 50 38,0%
IV 13 6062 -99,8% 24 528 -95,5% 8 923 -99,1%
V 67 19619 -99,7% 46 1446 -96,8% 99 3499 -97,2%
VI 2613 36115 -92,8% 723 6626 -89,1% 4097 10839 -62,2%
VII 16517 52007 -68,2% 4142 10567 -60,8% 12736 19604 -35,0%
Vrboska Sućuraj 2020 2019 change 2020 2019 change I 3 0 - 21 10 110,0% II 2 2 0,0% 7 10 -30,0% III 9 0 - 20 12 66,7%
IV 0 566
-
100,0% 1 60 -98,3% V 7 1235 -99,4% 14 121 -88,4% VI 726 2603 -72,1% 736 1138 -35,3% VII 2432 4643 -47,6% 2202 3222 -31,7%
Table 10: Tourist arrivals in 2019 and 2020 by month from January to July
(Source: Turistička zajednica Splitsko-dalmatinske županije)
The data from the table show the fall of tourist arrivals in all five tourist destinations on the
island of Hvar. Starting from May, as the first important tourist month, the falls were up to
99,7% in 2020 compared to 2019. The largest fall in the number of tourist arrivals occurred in
the Town of Hvar, while lowest fall occurred in Sućuraj. This is due to two important reasons:
the proximity of the destination to the guests and the loyalty of the guests. Guests who have
already visited the destination are much more common in Stari Grad, Jelsa, Vrboska and
Sućuraj, than in Hvar.
Table following on the next page
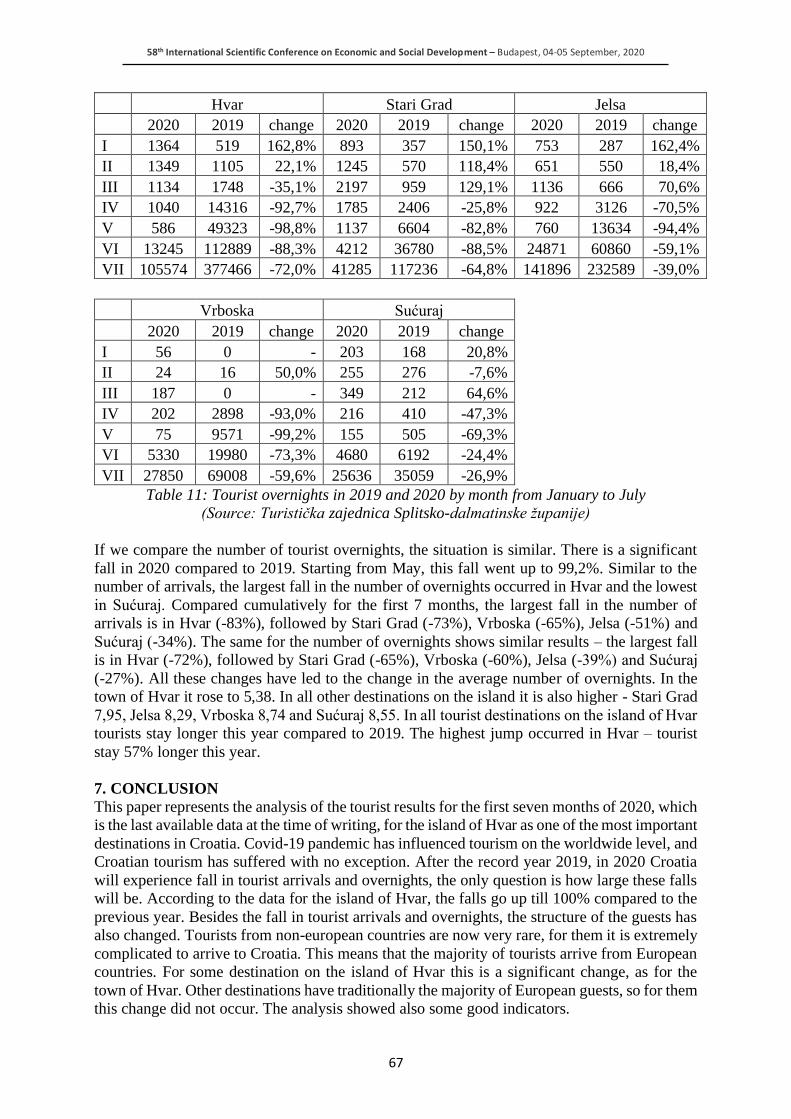
58th International Scientific Conference on Economic and Social Development – Budapest, 04-05 September, 2020
67
Hvar Stari Grad Jelsa
2020 2019 change 2020 2019 change 2020 2019 change
I 1364 519 162,8% 893 357 150,1% 753 287 162,4%
II 1349 1105 22,1% 1245 570 118,4% 651 550 18,4%
III 1134 1748 -35,1% 2197 959 129,1% 1136 666 70,6%
IV 1040 14316 -92,7% 1785 2406 -25,8% 922 3126 -70,5%
V 586 49323 -98,8% 1137 6604 -82,8% 760 13634 -94,4%
VI 13245 112889 -88,3% 4212 36780 -88,5% 24871 60860 -59,1%
VII 105574 377466 -72,0% 41285 117236 -64,8% 141896 232589 -39,0%
Vrboska Sućuraj 2020 2019 change 2020 2019 change I 56 0 - 203 168 20,8% II 24 16 50,0% 255 276 -7,6% III 187 0 - 349 212 64,6% IV 202 2898 -93,0% 216 410 -47,3% V 75 9571 -99,2% 155 505 -69,3% VI 5330 19980 -73,3% 4680 6192 -24,4% VII 27850 69008 -59,6% 25636 35059 -26,9%
Table 11: Tourist overnights in 2019 and 2020 by month from January to July
(Source: Turistička zajednica Splitsko-dalmatinske županije)
If we compare the number of tourist overnights, the situation is similar. There is a significant
fall in 2020 compared to 2019. Starting from May, this fall went up to 99,2%. Similar to the
number of arrivals, the largest fall in the number of overnights occurred in Hvar and the lowest
in Sućuraj. Compared cumulatively for the first 7 months, the largest fall in the number of
arrivals is in Hvar (-83%), followed by Stari Grad (-73%), Vrboska (-65%), Jelsa (-51%) and
Sućuraj (-34%). The same for the number of overnights shows similar results – the largest fall
is in Hvar (-72%), followed by Stari Grad (-65%), Vrboska (-60%), Jelsa (-39%) and Sućuraj
(-27%). All these changes have led to the change in the average number of overnights. In the
town of Hvar it rose to 5,38. In all other destinations on the island it is also higher - Stari Grad
7,95, Jelsa 8,29, Vrboska 8,74 and Sućuraj 8,55. In all tourist destinations on the island of Hvar
tourists stay longer this year compared to 2019. The highest jump occurred in Hvar – tourist
stay 57% longer this year.
7. CONCLUSION
This paper represents the analysis of the tourist results for the first seven months of 2020, which
is the last available data at the time of writing, for the island of Hvar as one of the most important
destinations in Croatia. Covid-19 pandemic has influenced tourism on the worldwide level, and
Croatian tourism has suffered with no exception. After the record year 2019, in 2020 Croatia
will experience fall in tourist arrivals and overnights, the only question is how large these falls
will be. According to the data for the island of Hvar, the falls go up till 100% compared to the
previous year. Besides the fall in tourist arrivals and overnights, the structure of the guests has
also changed. Tourists from non-european countries are now very rare, for them it is extremely
complicated to arrive to Croatia. This means that the majority of tourists arrive from European
countries. For some destination on the island of Hvar this is a significant change, as for the
town of Hvar. Other destinations have traditionally the majority of European guests, so for them
this change did not occur. The analysis showed also some good indicators.
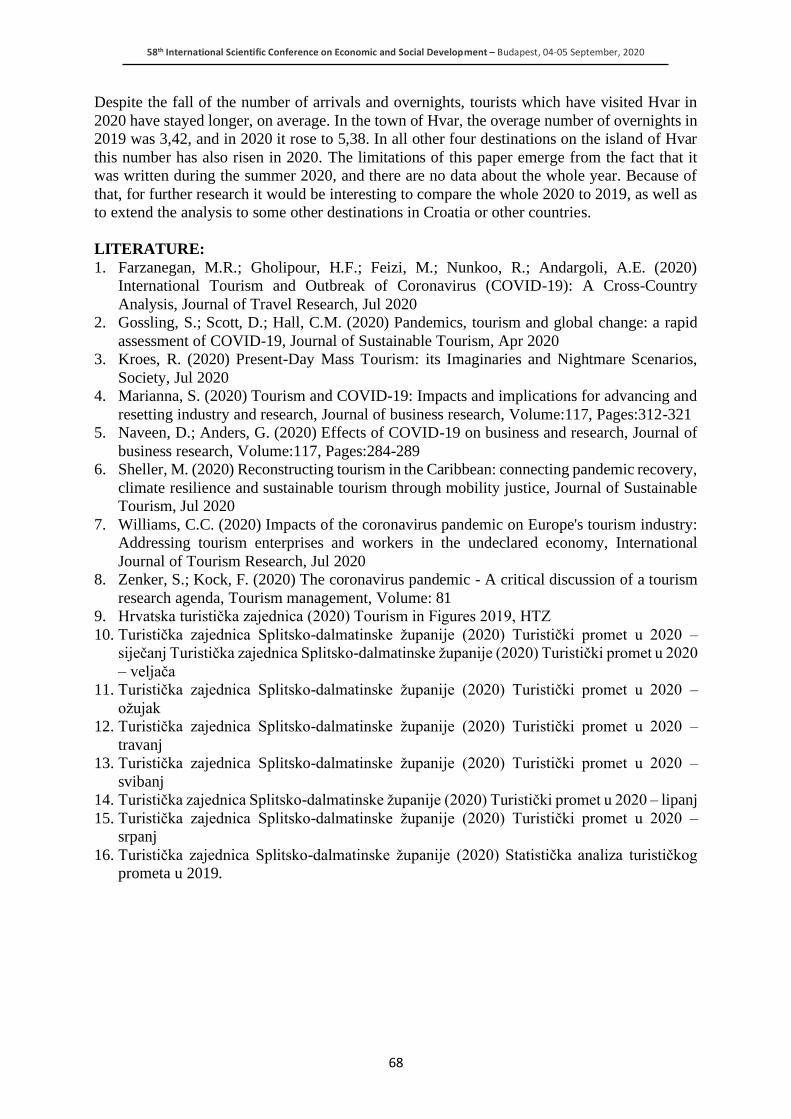
58th International Scientific Conference on Economic and Social Development – Budapest, 04-05 September, 2020
68
Despite the fall of the number of arrivals and overnights, tourists which have visited Hvar in
2020 have stayed longer, on average. In the town of Hvar, the overage number of overnights in
2019 was 3,42, and in 2020 it rose to 5,38. In all other four destinations on the island of Hvar
this number has also risen in 2020. The limitations of this paper emerge from the fact that it
was written during the summer 2020, and there are no data about the whole year. Because of
that, for further research it would be interesting to compare the whole 2020 to 2019, as well as
to extend the analysis to some other destinations in Croatia or other countries.
LITERATURE:
1. Farzanegan, M.R.; Gholipour, H.F.; Feizi, M.; Nunkoo, R.; Andargoli, A.E. (2020)
International Tourism and Outbreak of Coronavirus (COVID-19): A Cross-Country
Analysis, Journal of Travel Research, Jul 2020
2. Gossling, S.; Scott, D.; Hall, C.M. (2020) Pandemics, tourism and global change: a rapid
assessment of COVID-19, Journal of Sustainable Tourism, Apr 2020
3. Kroes, R. (2020) Present-Day Mass Tourism: its Imaginaries and Nightmare Scenarios,
Society, Jul 2020
4. Marianna, S. (2020) Tourism and COVID-19: Impacts and implications for advancing and
resetting industry and research, Journal of business research, Volume:117, Pages:312-321
5. Naveen, D.; Anders, G. (2020) Effects of COVID-19 on business and research, Journal of
business research, Volume:117, Pages:284-289
6. Sheller, M. (2020) Reconstructing tourism in the Caribbean: connecting pandemic recovery,
climate resilience and sustainable tourism through mobility justice, Journal of Sustainable
Tourism, Jul 2020
7. Williams, C.C. (2020) Impacts of the coronavirus pandemic on Europe's tourism industry:
Addressing tourism enterprises and workers in the undeclared economy, International
Journal of Tourism Research, Jul 2020
8. Zenker, S.; Kock, F. (2020) The coronavirus pandemic - A critical discussion of a tourism
research agenda, Tourism management, Volume: 81
9. Hrvatska turistička zajednica (2020) Tourism in Figures 2019, HTZ
10. Turistička zajednica Splitsko-dalmatinske županije (2020) Turistički promet u 2020 –
siječanj Turistička zajednica Splitsko-dalmatinske županije (2020) Turistički promet u 2020
– veljača
11. Turistička zajednica Splitsko-dalmatinske županije (2020) Turistički promet u 2020 –
ožujak
12. Turistička zajednica Splitsko-dalmatinske županije (2020) Turistički promet u 2020 –
travanj
13. Turistička zajednica Splitsko-dalmatinske županije (2020) Turistički promet u 2020 –
svibanj
14. Turistička zajednica Splitsko-dalmatinske županije (2020) Turistički promet u 2020 – lipanj
15. Turistička zajednica Splitsko-dalmatinske županije (2020) Turistički promet u 2020 –
srpanj
16. Turistička zajednica Splitsko-dalmatinske županije (2020) Statistička analiza turističkog
prometa u 2019.
58th International Scientific Conference on Economic and Social Development – Budapest, 04-05 September, 2020
69
LABOR PRODUCTIVITY IN THE COMPLEX INTERPLAY BETWEEN
HEALTH AND WELL-BEING OF OLDER EMPLOYEES: A FOCUS ON
THE NEW EUROPEAN UNION MEMBER STATES UNDER THE
COVID-19 PANDEMIC CRISIS
Mirela Cristea
University of Craiova,
Faculty of Economics and Business Administration, Romania
[email protected]; [email protected]
Gratiela Georgiana Noja
West University of Timisoara,
Faculty of Economics and Business Administration, Romania
Constantin Stefan Ponea
Spiru Haret University,
Faculty of Legal, Economic and Administrative Sciences, Romania
Ioana Banaduc
West University of Timisoara,
Department of Teacher Training, Romania
ABSTRACT
The COVID-19 pandemic crisis has severely impacted the good health and well-being of people
around the world. On these unforeseen challenges, decision makers reconfigure advanced
resilient policies and strategies for the labor markets, which have already been deeply impacted
by the amplitude of the ageing phenomenon (downsized birth rate jointly with an increasing
life expectancy). Consequently, the general objective of our research is to assay the labor
market productivity of workers in the New European Union (EU) Member States under the
complex implications of older employment and ageing dimensions, significantly shaped by
health and well-being. The methodological approach consisted in applying the structural
equation modelling (SEM) technique on a large dataset covering the 1995-2017 lapse of time.
The results obtained revealed the need for older employment (55-64 years) reconfiguration, on
the one hand, by: further sustaining the educational programs, new labor market policies
(active and passive) and increasing the public allocations for research & development,
especially adapted for nowadays digital online working. On the other hand, the weightiness of
government expenditures dedicated for improving the health perceptions for sustainable good
health and well-being, jointly with better health conditions of older people, will lead to an
increased life expectancy, emphasized birth rate and tackled poverty, with cumulative positive
effects on the labor market productivity in EU countries.
Keywords: Ageing phenomenon, Health, Labor productivity, New European Union countries,
Welfare
1. INTRODUCTION
Demographic ageing, reflected by an upturn in life expectancy, simultaneously with the
reduction of the birth/fertility ratio (Thalassinos et al., 2019; Cristea and Mitrica, 2016),
represents a phenomenon that affects all countries in the world, both developed and developing
58th International Scientific Conference on Economic and Social Development – Budapest, 04-05 September, 2020
70
ones. Its implications for economic and social life are manifold. Workforce ageing and the
impact on labor productivity represents a relevant area of research since this demographic
change has important consequences on the economic activity, social security systems and the
well-being of the population (Calvo-Sotomayor et al., 2019; Cristea et al., 2020). Despite its
significance, the research that brings solid evidence for bridging demographic ageing with labor
productivity in the framework of health and well-being of older workers still needs to be
strengthen by additional empirical evidence, in order to provide strategic guidelines for policy
makers and responsible authorities. Current study undertakes these important issues and
configures an ambitious empirical research to strengthen the knowledge in this field. Based on
the literature underpinnings and nowadays challenges for the ageing population induced by
worldwide infections with SARS-CoV-2 (Petretto and Pili, 2020), the general objective of our
research is to assay the labor market productivity of workers in the New European Union (EU)
Member States (a number of 13 countries that have adhered since 2004, EU-13, namely Croatia,
Bulgaria, Romania, Hungary, Slovenia, Slovakia, Poland, Malta, Lithuania, Latvia, Estonia, the
Czech Republic and Cyprus), under the complex implications of older employment and ageing
dimensions, significantly shaped by health and well-being. Our methodology comprises
structural equation modelling with latent class analysis (SEM – LCA), for the 1995-2017 time
span. The structure of the paper comprises a concise introduction on the motivation and
relevance of the research endeavour centered on assessing the ageing population and its
implications on labor productivity, followed by a brief critical review of the literature and a
complex empirical analysis, based on structural equations. Detailed results, discussion and
concluding remarks are encompassed in the final parts of the paper, supported by additional
information in the appendix.
2. BRIEF LITERATURE REVIEW
Numerous studies in this scientific field shed light on both a positive and a negative relationship
between demographic ageing and labor productivity. While most of the studies addressing this
issue find a negative interdependency or even no connection (Aiyar et al., 2016; Feyrer, 2008;
Maestas et al., 2016), the literature that evidences a positive relationship is quite small (Cristea,
Noja, Stefea et al., 2020; Liu and Westelius, 2016). Skirbekk (2005) entails that population
ageing has a negative impact on labor productivity due to the fact that a series of workers’ skills
decline with age (such as physical strength, speed, health or learning capacity). On the other
hand, Cristea, Noja, Stefea et al. (2020, p. 1367) evidenced that “a proper labour market
insertion of the population aged 55-64 years, placed under the indirect and bidirectional
influence of the other selected factors, induced positive effects upon labour productivity”.
Feyrer (2008) outlined the importance of the age structure in the interplay between ageing and
productivity and attested that changes in workforce age structure are strongly correlated with
productivity. Educational attainment, long-life training activities, workplace innovations
(Sharpe, 2011; Taylor, 2006; Thang, 2011) and labour market policies, such us “job-redesign”
(Christelis and Fonseca, 2016) represent relevant factors for enhancing labor productivity of
the worforce aged 55-64 years. Earnings bring also a meaningful motivation of older employees
(55-64 years) for better outputs at the workplace, thus inducing a higher labor productivity
(Thang, 2011). At the same time, people’s good health and well-being are also important
credentials that affect labour productivity, particularly in the case of older workers (Cristea,
Noja, Danacica et al., 2020; Cristea, Noja, Stefea et al., 2020; Kwan and Walsh, 2018; Randel
et al., 2017), this issue being highly relevant in the present context of Covid-19 pandemic crisis.
On these lines, Randel et al. (2017, p. 2) outline that „poverty and exclusion remain the greatest
threats to the well-being of older people all over the world“. Petretto and Pili (2020, p. 2)
highlight that „old adults could also face great barriers to access to the health service and
support, including an age-based discrimination, also for diseases and disorders different from
58th International Scientific Conference on Economic and Social Development – Budapest, 04-05 September, 2020
71
the ones caused by COVID-19”. Upon reviewing existing studies, their findings and limitations,
this research proposes a new integrated empirical model to assess the interplay between the
population ageing and labor productivity, with a keen focus on the role played by health and
well-being of older employees.
3. DATA AND METHODOLOGY
The variables included for our research are grouped into three main categories, as follows
(descriptive statistics are comprised in the Appendix, Table A1):
• ageing indicators: “Crude birth rate (number of live births per 1000 people)” (BR); “Life
expectancy at birth total population” (years) (LE) (SDG indicator, Goal 3 “Good health
and well-being”, [SDG_03_20]); “Old dependency ratio (population 65+ to population
15-64 years)” (%) (OD_65);
• health indicators: “Health government expenditure” (% of GDP) (HGE); “Healthy life
years in absolute value at 65 - females (years)” (HLY_F); “Healthy life years in absolute
value at 65 - males (years)” (HLY_M); “Share of people aged 16+ with good or very good
perceived health” (%) (SDG indicator, Goal 3 “Good health and well-being”,
[SDG_03_20]) (%) (PGPH);
• other economic and social variables: “Labor productivity per person employed and hour
worked (% from the EU-28 average)” (LP); “Employment rate, 55–64-year-old group”
(% of total population) (ER_55_64); “At-risk-of-poverty-rate of older people, 65+” (%)
(POV_R_65); “Annual net earnings of a two-earner married couple with two children
(Purchasing Power Standard)” (EARN); “Population with secondary, upper, post-
secondary and tertiary education (levels 3-8) (% of 15–64 years)” (EDU); “Tertiary
education level 30-34 age group (% of the population aged 30–34)” (TE_30_34); “Active
labor market policies” (% of GDP) (ALMP); “Passive labor market policies” (% of GDP)
(PLMP); “Total research and development expenditures” (% of GDP) (GERD).
The indicators for the new EU-13 countries were extracted from the Eurostat database
(European Commission, 2019a) and the Employment, Social Affairs & Inclusion (European
Commission, 2019b), for the period 1995-2017. Preliminary processing of the data consisted
in applying the logarithmic procedure in order to ensure an adequate comparison between
countries. The methodology consisted in structural equation modelling - latent class analysis
(SEM – LCA). SEMs are a tool used in the analysis of multivariate data, being applied mainly
for testing theories in social sciences, demography and economics (Acock, 2013; Bollen,
2014), much more complex than general regression models because they incorporate multiple
dependent and independent variables, in their direct, indirect and total connection, as well as
latent hypothetical constructions (latent class analysis, LCA), represented by groups of
observed variables. The set of structural equations is found in the form of a matrix, as follows
(equation 1) (Westland, 2015):
[Y1
Y2
Y3
]= [
α1
α2
α3
]+ [
0 0 0
β21
0 0
β31
β32
0
] [Y1
Y2
Y3
] + [
γ11
γ21
γ31
] [X1]+ [
ε1
ε2
ε3
] (1)
where:
α – the intercept associated with each endogenous/dependent variable (Y);
β – path or standardized path coefficient in the regression of endogenous variables over other
endogenous variables;
γ – the structural coefficient in the regression of endogenous variables over exogenous variables
(X);
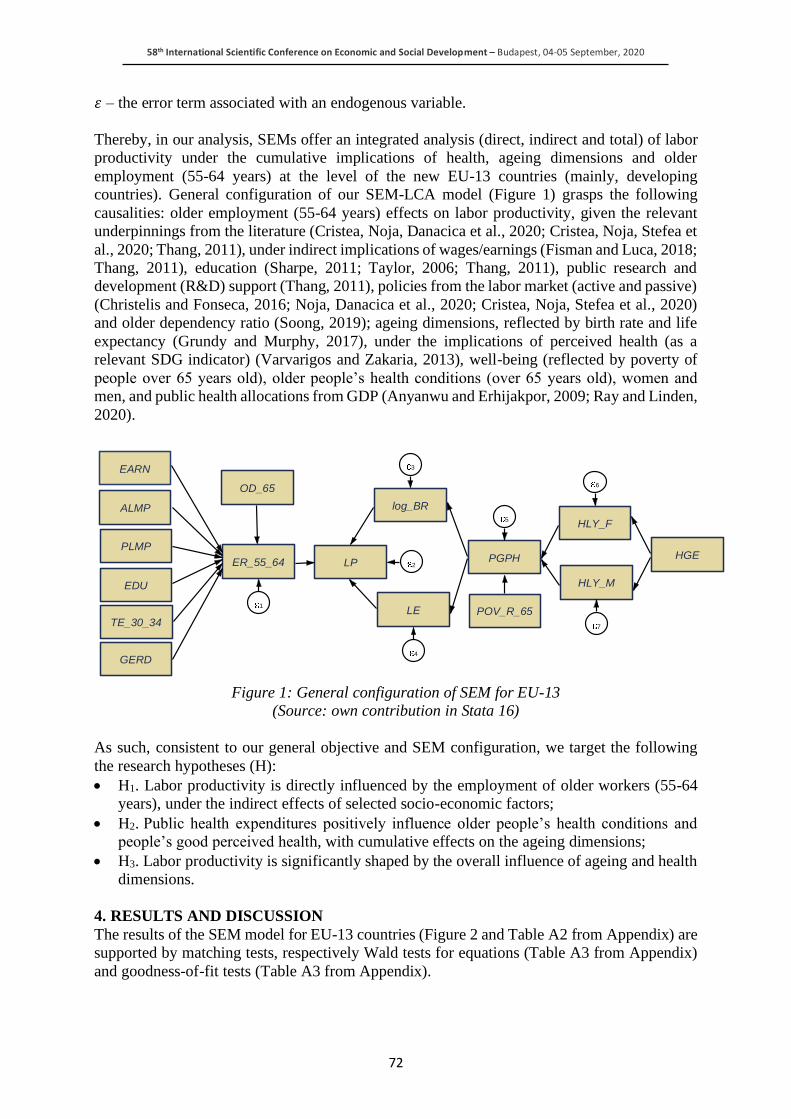
58th International Scientific Conference on Economic and Social Development – Budapest, 04-05 September, 2020
72
𝜀 – the error term associated with an endogenous variable.
Thereby, in our analysis, SEMs offer an integrated analysis (direct, indirect and total) of labor
productivity under the cumulative implications of health, ageing dimensions and older
employment (55-64 years) at the level of the new EU-13 countries (mainly, developing
countries). General configuration of our SEM-LCA model (Figure 1) grasps the following
causalities: older employment (55-64 years) effects on labor productivity, given the relevant
underpinnings from the literature (Cristea, Noja, Danacica et al., 2020; Cristea, Noja, Stefea et
al., 2020; Thang, 2011), under indirect implications of wages/earnings (Fisman and Luca, 2018;
Thang, 2011), education (Sharpe, 2011; Taylor, 2006; Thang, 2011), public research and
development (R&D) support (Thang, 2011), policies from the labor market (active and passive)
(Christelis and Fonseca, 2016; Noja, Danacica et al., 2020; Cristea, Noja, Stefea et al., 2020)
and older dependency ratio (Soong, 2019); ageing dimensions, reflected by birth rate and life
expectancy (Grundy and Murphy, 2017), under the implications of perceived health (as a
relevant SDG indicator) (Varvarigos and Zakaria, 2013), well-being (reflected by poverty of
people over 65 years old), older people’s health conditions (over 65 years old), women and
men, and public health allocations from GDP (Anyanwu and Erhijakpor, 2009; Ray and Linden,
2020).
Figure 1: General configuration of SEM for EU-13
(Source: own contribution in Stata 16)
As such, consistent to our general objective and SEM configuration, we target the following
the research hypotheses (H):
• H1. Labor productivity is directly influenced by the employment of older workers (55-64
years), under the indirect effects of selected socio-economic factors;
• H2. Public health expenditures positively influence older people’s health conditions and
people’s good perceived health, with cumulative effects on the ageing dimensions;
• H3. Labor productivity is significantly shaped by the overall influence of ageing and health
dimensions.
4. RESULTS AND DISCUSSION
The results of the SEM model for EU-13 countries (Figure 2 and Table A2 from Appendix) are
supported by matching tests, respectively Wald tests for equations (Table A3 from Appendix)
and goodness-of-fit tests (Table A3 from Appendix).
EARN
ALMP
PLMP
EDU
TE_30_34
GERD
ER_55_64
1
OD_65
LP 2
log_BR
3
LE
4
PGPH
5
POV_R_65
HLY_F
6
HLY_M
7
HGE
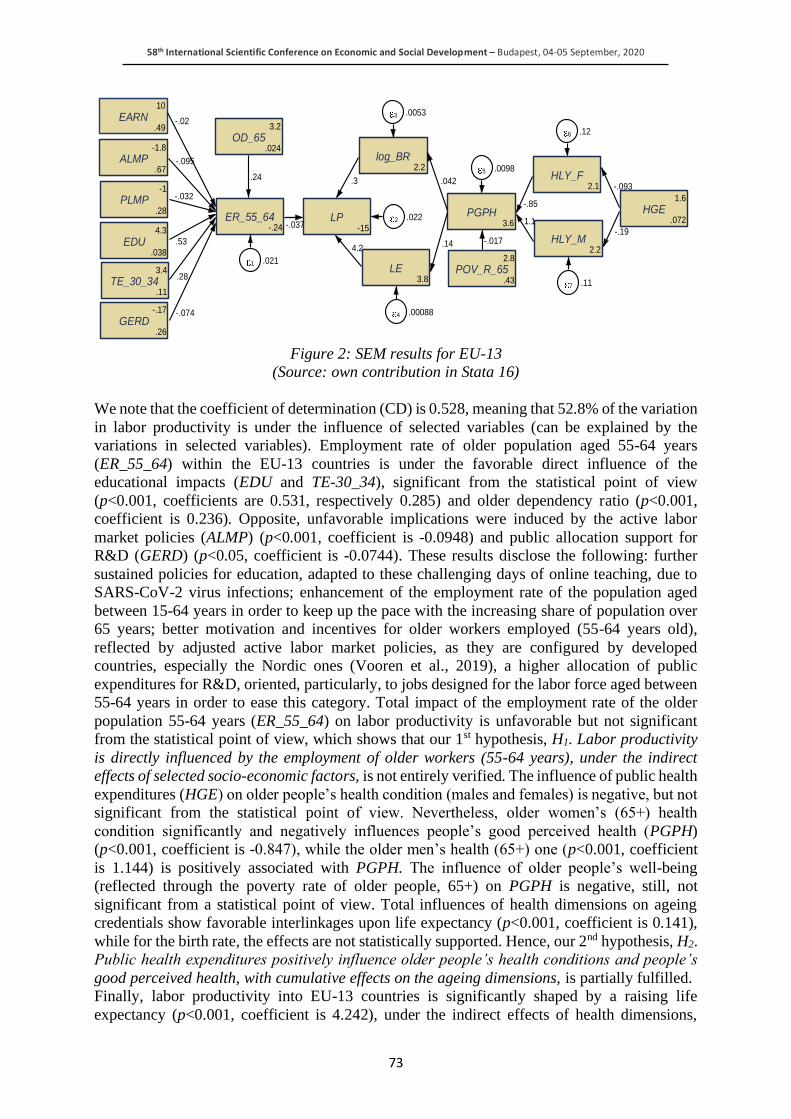
58th International Scientific Conference on Economic and Social Development – Budapest, 04-05 September, 2020
73
Figure 2: SEM results for EU-13
(Source: own contribution in Stata 16)
We note that the coefficient of determination (CD) is 0.528, meaning that 52.8% of the variation
in labor productivity is under the influence of selected variables (can be explained by the
variations in selected variables). Employment rate of older population aged 55-64 years
(ER_55_64) within the EU-13 countries is under the favorable direct influence of the
educational impacts (EDU and TE-30_34), significant from the statistical point of view
(p<0.001, coefficients are 0.531, respectively 0.285) and older dependency ratio (p<0.001,
coefficient is 0.236). Opposite, unfavorable implications were induced by the active labor
market policies (ALMP) (p<0.001, coefficient is -0.0948) and public allocation support for
R&D (GERD) (p<0.05, coefficient is -0.0744). These results disclose the following: further
sustained policies for education, adapted to these challenging days of online teaching, due to
SARS-CoV-2 virus infections; enhancement of the employment rate of the population aged
between 15-64 years in order to keep up the pace with the increasing share of population over
65 years; better motivation and incentives for older workers employed (55-64 years old),
reflected by adjusted active labor market policies, as they are configured by developed
countries, especially the Nordic ones (Vooren et al., 2019), a higher allocation of public
expenditures for R&D, oriented, particularly, to jobs designed for the labor force aged between
55-64 years in order to ease this category. Total impact of the employment rate of the older
population 55-64 years (ER_55_64) on labor productivity is unfavorable but not significant
from the statistical point of view, which shows that our 1st hypothesis, H1. Labor productivity
is directly influenced by the employment of older workers (55-64 years), under the indirect
effects of selected socio-economic factors, is not entirely verified. The influence of public health
expenditures (HGE) on older people’s health condition (males and females) is negative, but not
significant from the statistical point of view. Nevertheless, older women’s (65+) health
condition significantly and negatively influences people’s good perceived health (PGPH)
(p<0.001, coefficient is -0.847), while the older men’s health (65+) one (p<0.001, coefficient
is 1.144) is positively associated with PGPH. The influence of older people’s well-being
(reflected through the poverty rate of older people, 65+) on PGPH is negative, still, not
significant from a statistical point of view. Total influences of health dimensions on ageing
credentials show favorable interlinkages upon life expectancy (p<0.001, coefficient is 0.141),
while for the birth rate, the effects are not statistically supported. Hence, our 2nd hypothesis, H2. Public health expenditures positively influence older people’s health conditions and people’s
good perceived health, with cumulative effects on the ageing dimensions, is partially fulfilled.
Finally, labor productivity into EU-13 countries is significantly shaped by a raising life
expectancy (p<0.001, coefficient is 4.242), under the indirect effects of health dimensions,
EARN.49
10
ALMP.67
-1.8
PLMP.28
-1
EDU.038
4.3
TE_30_34.11
3.4
GERD.26
-.17
ER_55_64-.24
1 .021
OD_65.024
3.2
LP-15
2 .022
log_BR2.2
3 .0053
LE3.8
4 .00088
PGPH3.6
5 .0098
POV_R_65.43
2.8
HLY_F2.1
6 .12
HLY_M2.2
7 .11
HGE.072
1.6
-.02
-.095
-.032
.53
.28
-.074
.24
-.037
.3
4.2
.042
.14 -.017
-.85
1.1
-.093
-.19
58th International Scientific Conference on Economic and Social Development – Budapest, 04-05 September, 2020
74
while for the birth rate, the effects are not statistically supported. Therefore, our 3rd hypothesis,
H3. Labor productivity is significantly shaped by the overall influence of ageing and health
dimensions, is, also, partially fulfilled.
5. CONCLUSIONS
This study undertook the important issue of bridging ageing with labor productivity in the
interplay between older workers’ health and well-being and configured a comprehensive
theoretical and empirical research to strengthen the knowledge in this field. Our research was
driven by the needs of addressing the New EU countries’ responses to the ageing phenomenon.
It provides accurate empirical evidence on how labor productivity of workers in these countries
is shaped under the complex implications of older employment and ageing dimensions, further
connected to health and well-being. Three research hypotheses were employed in this respect,
assessed through structural equation modelling, and partially validated in this framework of
analysis. Several main findings emerge from the study performed: there is an essential need for
sustained educational policies anchored in the credentials of a digital economy and online
teaching, particularly in these challenging pandemic times; newly configured labor market
policies, particularly active labor market policies, tailored to the needs of older workers,
designed to significantly increase their labor market performance (reflected through upturns in
the employment rate of population aged 15-64 years); higher allocations of public expenditures
for R&D and for the healthcare system. The main limitations of this research may rely on the
fact that some of the countries considered in our sample did not have complete data series for
the entire analyzed timespan. Future research directions grasp a deeper understanding of the
mechanisms that provoke a negative interplay between population ageing and labor
productivity, in addition to older workers’ health and well-being implications.
LITERATURE:
1. Acock, A. (2013). Stata Bookstore: Discovering Structural Equation Modeling Using Stata,
Revised Edition. Retrieved 02.06.2020 from https://www.stata.com/bookstore/
discovering-structural-equation-modeling-using-stata/.
2. Aiyar, S., Ebeke, C., Shao, X. (2016). The impact of workforce aging on European
productivity, IMF Working Paper WP/16/238, Washington, DC: International Monetary
Fund.
3. Anyanwu, J. C., Erhijakpor, A. E. (2009). Health expenditures and health outcomes in
Africa. African Development Review, 21(2), pp. 400-433.
4. Bollen, K.A. (2014). Structural Equations with Latent Variables. John Wiley & Sons.
5. Calvo-Sotomayor, I., Laka, J.P., Aguado, R. (2019). Workforce ageing and labor
productivity in Europe. Sustainability, 11, 5851.
6. Christelis, D., Fonseca, R. (2016). Labor market policies and self-employment transitions
of older workers. http://dx.doi.org/10.2139/ssrn.2837804.
7. Cristea, M., Mitrică, A. (2016). Global ageing: Do privately managed pension funds
represent a long term alternative for the Romanian pension system? Empirical research.
Romanian Journal of Political Science, 16(1), pp.63-106.
8. Cristea, M., Noja, G.G., Dănăcică, D.E., Ştefea, P. (2020). Population ageing, labor
productivity and economic welfare in the European Union. Economic Research-Ekonomska
Istraživanja, 33(1), pp.1354-1376. https://doi.org/10.1080/1331677X.2020.1748507.
9. Cristea, M., Noja, G.G., Stefea, P., Sala, A.L. (2020). The impact of population aging and
public health support on EU labor markets. International Journal of Environmental
Research and Public Health, 17(4), p.1439. doi: 10.3390/ijerph17041439.
10. European Commission (2019a). Eurostat database. Retrieved 05.05.2020 from
https://ec.europa.eu/eurostat/data/database.
58th International Scientific Conference on Economic and Social Development – Budapest, 04-05 September, 2020
75
11. European Commission (2019b). Employment, Social Affairs & Inclusion. Labor market
Policy. Retrieved 05.05.2020 from
https://webgate.ec.europa.eu/empl/redisstat/databrowser/explore/all/lmp?display=card&so
rt=category
12. Feyrer, J. (2008). Aggregate evidence on the link between age structure and productivity.
Population and Development Review, 34, 78–99.
13. Fisman, R., Luca, M. (2018). How Amazon’s higher wages could increase productivity.
Harvard Business Review Digital Article. Retrieved 25.06.2020 from
https://hbsp.harvard.edu › product › H04LEC-PDF-ENG.
14. Grundy, E.M., Murphy, M. (2018). Population ageing in Europe. In J. P. Michel, B. L.
Beattie, F. C. Martin, J. D. Walston, Oxford Textbook of Geriatric Medicine (3rd edition)
(pp. 11-18), Oxford: Oxford University Press.
15. Kwan, C., Walsh, C.A. (2018). Old age poverty: A scoping review of the literature. Cogent
Social Sciences, 4(1), p. 1478479. https://doi.org/10.1080/23311886.2018.1478479.
16. Liu, Y., Westelius, N. (2016). The impact of demographics on productivity and inflation in
Japan. Journal of International Commerce, Economics and Policy, 8(2), 1–16.
17. Maestas, N., Mullen, K.J., Powell, D. (2016). The effect of population aging on economic
growth, the labor force and productivity. RAND Working Paper WR-1063-1, Santa Monica,
CA: RAND Corporation.
18. Petretto, D.R., Pili, R. (2020). Ageing and COVID-19: What is the role for elderly people?.
Geriatrics (Basel, Switzerland), 5(2). DOI: 10.3390/geriatrics5020025
19. Randel, J., German, T., Ewing, D. (2017). The ageing and development report: poverty,
independence and the world's older people. HelpAge International, Routledge.
20. Ray, D., Linden, M. (2020). Health expenditure, longevity, and child mortality: dynamic
panel data approach with global data. International Journal of Health Economics and
Management, 20(1), pp. 99-119.
21. Skirbekk, V. (2005). Population ageing negatively affects productivity. Vienna Yearbook
Population Research, pp. 5–6, Vienna: Austrian Academy of Sciences Press.
DOI:10.1553/populationyearbook2005s5.
22. Soong, J.J. (2019). Empowering active ageing into labor market: a new alternative human
resource for employment in Taiwan. In 16th International Symposium on Management
(INSYMA 2019). Atlantis Press. https://doi.org/10.2991/insyma-19.2019.21
23. Taylor, P. (2006). European foundation for the improvement of living and working
conditions. Employment Initiatives for an Ageing Workforce in the EU15, pp. 1–95,
Luxembourg: Office for Official Publications of the European Communities.
24. Thalassinos, E., Cristea, M., Noja, G.G. (2019). Measuring active ageing within the
European Union: implications on economic development. Equilibrium. Quarterly Journal
of Economics and Economic Policy, 14(4), pp. 591-609.
https://doi.org/10.24136/eq.2019.028
25. Thang, L.L. (2011). Population aging, older workers and productivity issues: the case of
Singapore. Journal of Comparative Social Welfare, 27(1), pp.17-33.
https://doi.org/10.1080/17486831.2011.532946.
26. Varvarigos, D., Zakaria, I. Z. (2013). Endogenous fertility in a growth model with public
and private health expenditures. Journal of Population Economics, 26(1), 67-85.
27. Vooren, M., Haelermans, C., Groot, W., Maassen van den Brink, H. (2019). The
effectiveness of active labor market policies: a meta‐analysis. Journal of Economic Surveys,
33(1), pp.125-149. https://doi.org/10.1111/joes.12269.
28. Westland, J.C. (2015). Structural Equation Models: From Paths to Networks. Springer.
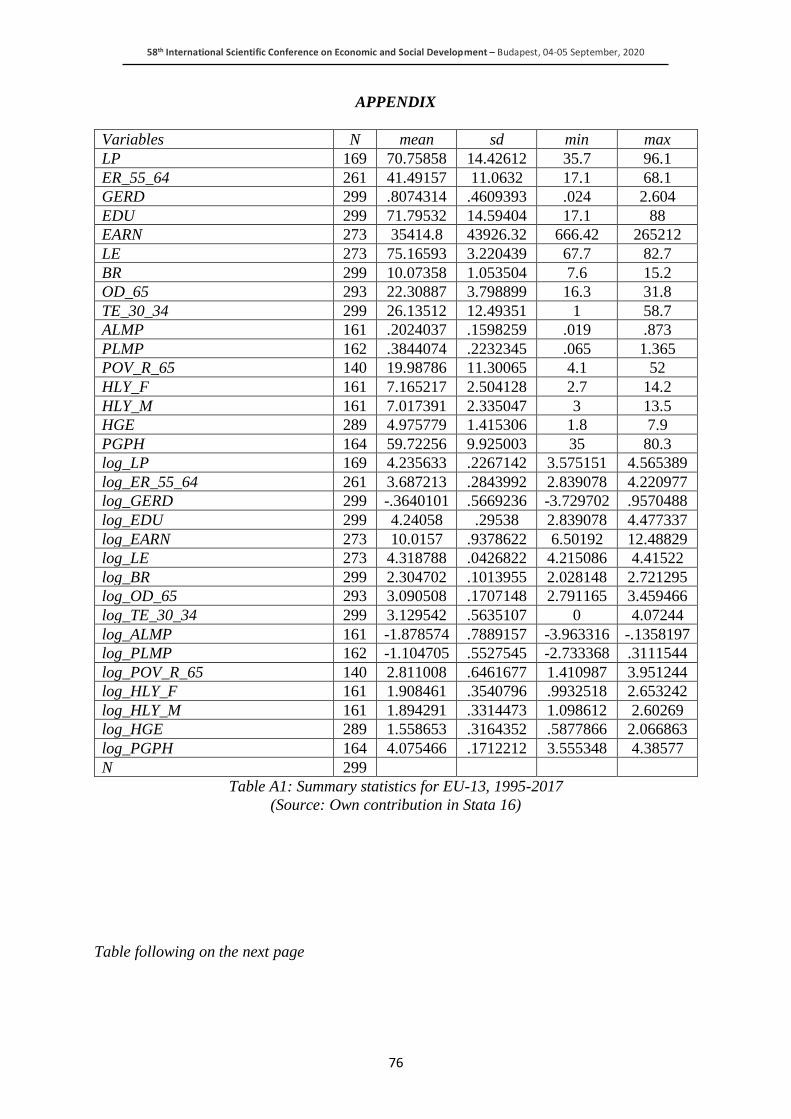
58th International Scientific Conference on Economic and Social Development – Budapest, 04-05 September, 2020
76
APPENDIX
Variables N mean sd min max
LP 169 70.75858 14.42612 35.7 96.1
ER_55_64 261 41.49157 11.0632 17.1 68.1
GERD 299 .8074314 .4609393 .024 2.604
EDU 299 71.79532 14.59404 17.1 88
EARN 273 35414.8 43926.32 666.42 265212
LE 273 75.16593 3.220439 67.7 82.7
BR 299 10.07358 1.053504 7.6 15.2
OD_65 293 22.30887 3.798899 16.3 31.8
TE_30_34 299 26.13512 12.49351 1 58.7
ALMP 161 .2024037 .1598259 .019 .873
PLMP 162 .3844074 .2232345 .065 1.365
POV_R_65 140 19.98786 11.30065 4.1 52
HLY_F 161 7.165217 2.504128 2.7 14.2
HLY_M 161 7.017391 2.335047 3 13.5
HGE 289 4.975779 1.415306 1.8 7.9
PGPH 164 59.72256 9.925003 35 80.3
log_LP 169 4.235633 .2267142 3.575151 4.565389
log_ER_55_64 261 3.687213 .2843992 2.839078 4.220977
log_GERD 299 -.3640101 .5669236 -3.729702 .9570488
log_EDU 299 4.24058 .29538 2.839078 4.477337
log_EARN 273 10.0157 .9378622 6.50192 12.48829
log_LE 273 4.318788 .0426822 4.215086 4.41522
log_BR 299 2.304702 .1013955 2.028148 2.721295
log_OD_65 293 3.090508 .1707148 2.791165 3.459466
log_TE_30_34 299 3.129542 .5635107 0 4.07244
log_ALMP 161 -1.878574 .7889157 -3.963316 -.1358197
log_PLMP 162 -1.104705 .5527545 -2.733368 .3111544
log_POV_R_65 140 2.811008 .6461677 1.410987 3.951244
log_HLY_F 161 1.908461 .3540796 .9932518 2.653242
log_HLY_M 161 1.894291 .3314473 1.098612 2.60269
log_HGE 289 1.558653 .3164352 .5877866 2.066863
log_PGPH 164 4.075466 .1712212 3.555348 4.38577
N 299
Table A1: Summary statistics for EU-13, 1995-2017
(Source: Own contribution in Stata 16)
Table following on the next page
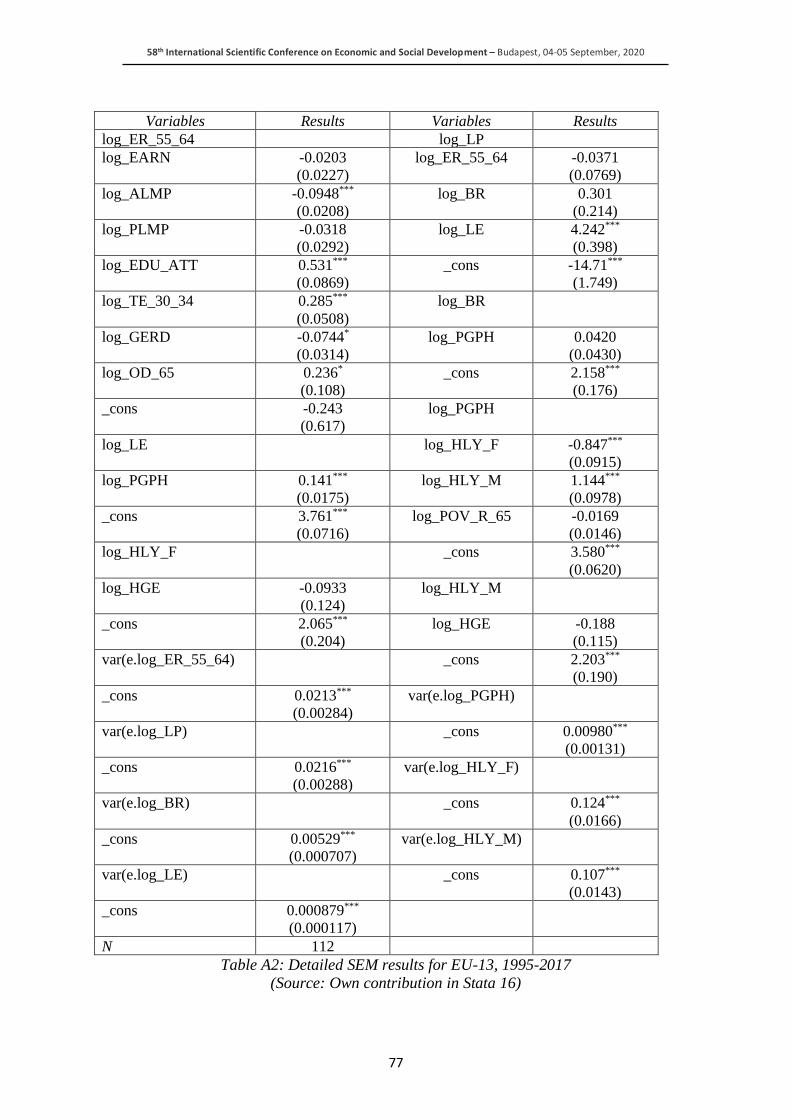
58th International Scientific Conference on Economic and Social Development – Budapest, 04-05 September, 2020
77
Variables Results Variables Results
log_ER_55_64 log_LP
log_EARN -0.0203
(0.0227)
log_ER_55_64 -0.0371
(0.0769)
log_ALMP -0.0948***
(0.0208)
log_BR 0.301
(0.214)
log_PLMP -0.0318
(0.0292)
log_LE 4.242***
(0.398)
log_EDU_ATT 0.531***
(0.0869)
_cons -14.71***
(1.749)
log_TE_30_34 0.285***
(0.0508)
log_BR
log_GERD -0.0744*
(0.0314)
log_PGPH 0.0420
(0.0430)
log_OD_65 0.236*
(0.108)
_cons 2.158***
(0.176)
_cons -0.243
(0.617)
log_PGPH
log_LE log_HLY_F -0.847***
(0.0915)
log_PGPH 0.141***
(0.0175)
log_HLY_M 1.144***
(0.0978)
_cons 3.761***
(0.0716)
log_POV_R_65 -0.0169
(0.0146)
log_HLY_F _cons 3.580***
(0.0620)
log_HGE -0.0933
(0.124)
log_HLY_M
_cons 2.065***
(0.204)
log_HGE -0.188
(0.115)
var(e.log_ER_55_64) _cons 2.203***
(0.190)
_cons 0.0213***
(0.00284)
var(e.log_PGPH)
var(e.log_LP) _cons 0.00980***
(0.00131)
_cons 0.0216***
(0.00288)
var(e.log_HLY_F)
var(e.log_BR) _cons 0.124***
(0.0166)
_cons 0.00529***
(0.000707)
var(e.log_HLY_M)
var(e.log_LE) _cons 0.107***
(0.0143)
_cons 0.000879***
(0.000117)
N 112
Table A2: Detailed SEM results for EU-13, 1995-2017
(Source: Own contribution in Stata 16)
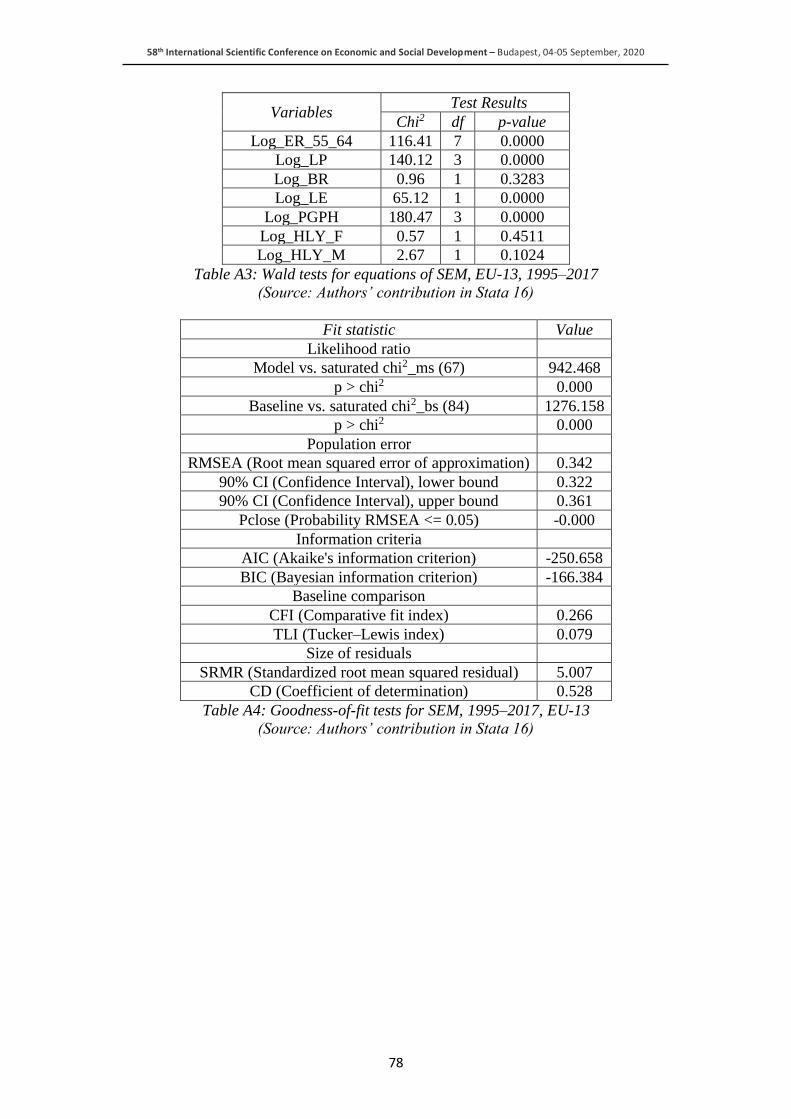
58th International Scientific Conference on Economic and Social Development – Budapest, 04-05 September, 2020
78
Variables Test Results
Chi2 df p-value
Log_ER_55_64 116.41 7 0.0000
Log_LP 140.12 3 0.0000
Log_BR 0.96 1 0.3283
Log_LE 65.12 1 0.0000
Log_PGPH 180.47 3 0.0000
Log_HLY_F 0.57 1 0.4511
Log_HLY_M 2.67 1 0.1024
Table A3: Wald tests for equations of SEM, EU-13, 1995–2017
(Source: Authors’ contribution in Stata 16)
Fit statistic Value
Likelihood ratio
Model vs. saturated chi2_ms (67) 942.468
p > chi2 0.000
Baseline vs. saturated chi2_bs (84) 1276.158
p > chi2 0.000
Population error
RMSEA (Root mean squared error of approximation) 0.342
90% CI (Confidence Interval), lower bound 0.322
90% CI (Confidence Interval), upper bound 0.361
Pclose (Probability RMSEA <= 0.05) -0.000
Information criteria
AIC (Akaike's information criterion) -250.658
BIC (Bayesian information criterion) -166.384
Baseline comparison
CFI (Comparative fit index) 0.266
TLI (Tucker–Lewis index) 0.079
Size of residuals
SRMR (Standardized root mean squared residual) 5.007
CD (Coefficient of determination) 0.528
Table A4: Goodness-of-fit tests for SEM, 1995–2017, EU-13
(Source: Authors’ contribution in Stata 16)
58th International Scientific Conference on Economic and Social Development – Budapest, 04-05 September, 2020
79
ERP SYSTEMS IN THE CONTEXT OF SMART FACTORIES
Larisa Hrustek
University of Zagreb, Faculty of Organization and Informatics
Pavlinska 2, Varaždin, Croatia
Neven Vrcek
University of Zagreb, Faculty of Organization and Informatics
Pavlinska 2, Varaždin, Croatia
Martina Tomicic Furjan
University of Zagreb, Faculty of Organization and Informatics
Pavlinska 2, Varaždin, Croatia
ABSTRACT
Today's industrial development is driven by global competition and demands of an ever-
changing market, being thereby exposed to the radical advancement of digital technologies.
The 4th industrial revolution has brought opportunities to improve products and services, but
it also poses a threat to industrial manufacturers in view of the demands and competition
present in the global market. Industrial manufacturers therefore can act successfully only if
they adapt their production by introducing these digital technologies into existing
manufacturing processes. The combination of digital technologies and virtual-physical systems
makes it possible to integrate business and manufacturing processes of all participants in the
value chain of the company (suppliers and customers), resulting in the development of smart
factories. In addition to the availability of digital technologies, traditional enterprise resource
planning (ERP) systems, which support manufacturers work-flow and contain a serious amount
of business data, are the foundation for seamless integration of production and business
processes with the new technologies. This paper explores recent relevant literature in the field
of ERP systems connected with the smart factory’s concept and technologies, and gives an
overview of main initiatives that can help exploit the most benefits out of their interrelated use.
The purpose of the review is to investigate how well ERP systems meet the needs of smart
factories, whereby the findings are systemized within a SWOT (strengths, weaknesses,
opportunities and threats) analysis. The SWOT analysis gives an overview where the future
strategies and activities should be directed to, in order to reduce the impact of negative
elements within SWOT and take full advantage of traditional ERP technologies to help
organizations transform to smart factories.
Keywords: enterprise resource planning (ERP) systems, smart factory, digital technologies
1. INTRODUCTION
The 4th industrial revolution, initiated by the development of digital technologies (or Industry
4.0 technologies), has led to many changes in production and information systems which are
driven by new innovative solutions. Technological basis for the change is the smart automation
of virtual-physical systems with decentralized control and advanced integration through all
possible functionalities of digital technologies. Implications on the industrial manufacturing
systems are seen in the reorganization and change of business processes through the integration
of digital technologies, machines and existing systems to a self-organizing virtual-physical
production systems, which allows flexible mass custom production and flexibility in the pro-
58th International Scientific Conference on Economic and Social Development – Budapest, 04-05 September, 2020
80
duction volume (Rojko, 2017). Digital technologies can be used individually or combined with
each other for development of new products (like smartphones), new services (like smart cities)
or complete rounded solutions (such as smart factories). National industrial programs of many
countries highlight key development strategies such as:
• implementation of Industry 4.0 technologies
• connecting virtual spaces and physical spaces
• development of smart factories with efficient self-management that can meet the diverse
requirements of the customers and more (Weng et al, 2019).
The main idea of the manufacturing industries development concept is to exploit the potential
of new technologies, to integrate technical processes and business processes in enterprises and
perform digital mapping and virtualization of the real world into that of smart factories,
including smart industrial assets and smart products (Rojko, 2017). Most production systems
base their business on existing information systems, and with the implementation of digital
technologies they adapt and accept new ways of doing things digitally, but some sectors (like
agriculture for example) are slow in adopting ERP systems and digital technologies. Kirikova
(2019) highlighted the most famous conference on information systems and analyzed emerging
topics covering the area of Industry 4.0 in line with traditional topics, one of which is certainly
enterprise resource planning (ERP). In the future, information systems will serve as the basis
for the development of systems of arbitrary combinations such as social, virtual and physical
systems. In fact, the information system is often a social, virtual, and physical system that
collects, organizes, stores, and distributes information, with each of these subsystems being the
receiver, operator, and provider of information (Kirikova, 2019). Embedded systems and global
networks, as the two major digital technologies, play a central role in smart factories, with
virtual-physical embedded systems interacting with each other and humans in real time via the
Internet of Things (Sun, Wu and Chan, 2018). The central idea of Industry 4.0 is to assign
"intelligence" to individual production machines and equipment so that they can identify and
adjust their own parameters, work in business processes and "collaborate" with related
machines to achieve optimization (Weng et al, 2019). It also supports information-centric
manufacturing and directs manufacturing companies to gain higher levels of digital capabilities
to use the available data efficiently. Unbundling operations by integrating information
technology systems along the supply chain will result in improved planning and execution of
supply chain activities, made possible by real-time exchange of information (Mantravadi,
Moller and Moller Christensen, 2018). With the introduction of Industry 4.0 technologies and
the trend of automation and data sharing in manufacturing technologies, a "smart factory" is
being created. Virtual-physical systems in production environments (such as manufacturing
plants, smart machines, storage systems, etc.) using Industry 4.0 technologies will be able to
exchange information on their own, resulting in improved supply chains (Mantravadi, Moller
and Moller Christensen, 2018). Information sharing of all supply chain actors is seen as
especially important in fresh food production, because of the short shelf life of fresh food
products. Data is supposed to be available to all partners with the value chain immediately when
it arises, enabling necessary reaction in real time (Mantravadi, Moller and Moller Christensen,
2018).
2. METHODOLOGY
For analysis of the selected research topic a review of published papers available in the relevant
scientific, bibliographic database Scopus was made. The search in the mentioned database was
performed on the basis of a complex query - “Enterprise resource planning” (ERP) and “smart
factory”. The search included all articles that contained the listed words from the query and
were found in the abstract, keywords, or title of the articles.
58th International Scientific Conference on Economic and Social Development – Budapest, 04-05 September, 2020
81
No special search restrictions were selected. All available articles and papers published in
conferences and journals were included in the processing, while no time limit was set, given
the topic is of recent times. The search resulted in 24 articles, of which 23 were further analyzed.
A total of 16 relevant articles was selected for the preparation of this paper. The articles are
more recent, ie they were published in the period from 2010 to 2020.
3. ERP AND SMART FACTORY ISSUESMETHODOLOGY
Existing systems in organizations, including resource management systems, are widely used to
manage operations and processes of manufacturers. Haddara and Elragal (2015) questioned
whether ERPs were prepared to accept factory operations of the future and effectively manage
them. In this section, ERP and smart factories are defined, and the existing issues on their
connection have been analyzed.
3.1. ERP systems
In the period of the previous industrial revolution, the advancement of production processes
was recognized in the automation of industrial processes and interaction with supply chain
activities, which was achieved by investing in the automation of production equipment and
assembly lines, as well as the use of ERP systems. Initially, ERP was used to report incoming
materials and represented the evolution of materials management. After that, ERP management
was responsible for the entire production inventory and use the Material Requirements Planning
(MRP) calculation as a tool for ordering materials based on the production plan and current
inventory levels (Ford, 2016). Today, the 4th Industrial Revolution, changes in the global
market and increasingly complex customer requirements have given a clear signal that progress
is needed in the manufacturing industry, with an accent on the connection between the
equipment and the business system. More detailed than ERP is the Manufacturing Execution
System (MES), which includes plant scheduling applications. MES systems often connect
directly to control machines and collect information such as status, rate, number of pieces,
parameter data, and coordinate with schedules developed by ERPs (Ayvarnam and
Mayurappriyan, 2017). Mantravadi et al. (2018) investigated the role of information systems
production (outside the ERP layer) to define the role in smart factories to improve "visibility"
in the supply chain. According to the vision of Industry 4.0, enterprise integration by
collaboration between organizations in the supply chain can achieve a competitive advantage.
However, not much research has been done on information systems that allow real-time
information exchange between integrated enterprises.
3.2. Smart factories
A smart factory refers to digital technology based manufacturing systems that can improve
overall production performance (Yoon et al, 2016) and meet different customer requirements
(Weng et al, 2019). Common aspects of smart factories are:
• networked components from which useful data can be collected;
• real-time visualization of production components;
• performance of autonomous and automatic processes based on optimized production plans;
• production of advanced and smart manufacturing services and products (Yoon et al, 2016).
The basic process of a smart factory is the digital conversion from physical into a configured
production system. The latest advances in manufacturing system development are renewable
production systems, which include a reconfigurable production system with customizable
hardware and software components. Machines in smart factories are physical systems
integrated with digital components. These are autonomous systems that, in large as well as
small organizations (Sun, Wu and Chan, 2018), collect real-time data and make their own
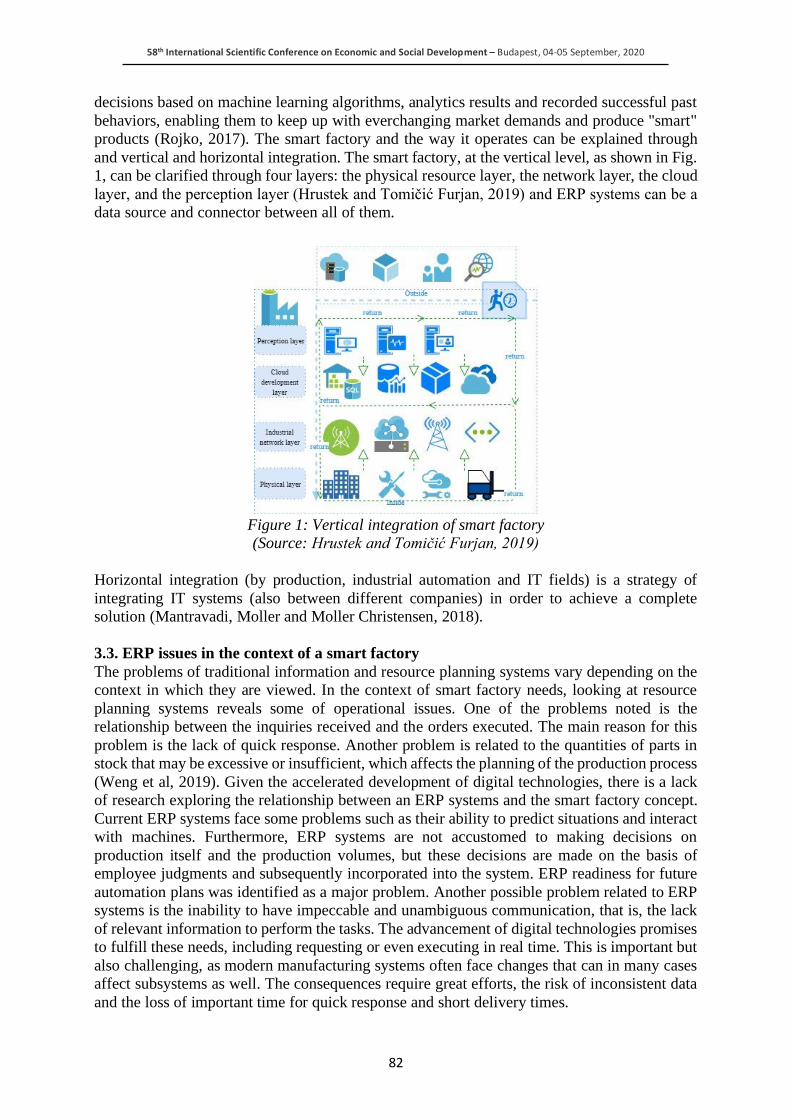
58th International Scientific Conference on Economic and Social Development – Budapest, 04-05 September, 2020
82
decisions based on machine learning algorithms, analytics results and recorded successful past
behaviors, enabling them to keep up with everchanging market demands and produce "smart"
products (Rojko, 2017). The smart factory and the way it operates can be explained through
and vertical and horizontal integration. The smart factory, at the vertical level, as shown in Fig.
1, can be clarified through four layers: the physical resource layer, the network layer, the cloud
layer, and the perception layer (Hrustek and Tomičić Furjan, 2019) and ERP systems can be a
data source and connector between all of them.
Figure 1: Vertical integration of smart factory
(Source: Hrustek and Tomičić Furjan, 2019)
Horizontal integration (by production, industrial automation and IT fields) is a strategy of
integrating IT systems (also between different companies) in order to achieve a complete
solution (Mantravadi, Moller and Moller Christensen, 2018).
3.3. ERP issues in the context of a smart factory
The problems of traditional information and resource planning systems vary depending on the
context in which they are viewed. In the context of smart factory needs, looking at resource
planning systems reveals some of operational issues. One of the problems noted is the
relationship between the inquiries received and the orders executed. The main reason for this
problem is the lack of quick response. Another problem is related to the quantities of parts in
stock that may be excessive or insufficient, which affects the planning of the production process
(Weng et al, 2019). Given the accelerated development of digital technologies, there is a lack
of research exploring the relationship between an ERP systems and the smart factory concept.
Current ERP systems face some problems such as their ability to predict situations and interact
with machines. Furthermore, ERP systems are not accustomed to making decisions on
production itself and the production volumes, but these decisions are made on the basis of
employee judgments and subsequently incorporated into the system. ERP readiness for future
automation plans was identified as a major problem. Another possible problem related to ERP
systems is the inability to have impeccable and unambiguous communication, that is, the lack
of relevant information to perform the tasks. The advancement of digital technologies promises
to fulfill these needs, including requesting or even executing in real time. This is important but
also challenging, as modern manufacturing systems often face changes that can in many cases
affect subsystems as well. The consequences require great efforts, the risk of inconsistent data
and the loss of important time for quick response and short delivery times.
58th International Scientific Conference on Economic and Social Development – Budapest, 04-05 September, 2020
83
Achieving these goals requires the most appropriate use of product and production information
at the right time at the right point of sale and all related systems in the value chain. A problem
is also the social component of the ERP system, namely the reliance on the role of people who
enter and maintain data, which creates data quality problems. Humans have inadequate time
and imperfect accuracy, which creates the problem of recording information about things in the
physical world. Therefore, in the context of smart factories, there is a need to collect digital
information and systems that support it (Postelnicu and Martinez Lastra, 2011). The 4th
industrial revolution has certainly brought opportunities in terms of improving business
processes, products and services through digital technologies, but it also poses a threat to
industrial manufacturers in view of the demands and competition present in the global market.
Industrial manufacturers should look at the strengths and weaknesses of the current state of
business, with assumptions and goals aimed at the pursuit of a smart factory.
4. SWOT ANALYSIS OF ERP SYSTEMS IN THE CONTEXT OF SMART
FACTORIES
The analysis of strengths, weaknesses, opportunities and threats (SWOT) (Nyarku and
Agyapong, 2011), (Phadermrod, Crowder and Wills, 2011) related to the development of ERP
systems was observed with respect to the features of the smart factory concept and they are
presented in Fig. 2. The strengths and weaknesses of existing ERP systems have been observed
and identified from the perspective of an industrial manufacturer. The opportunities and threats
in developing an ERP system relate to the external influence of a number of factors smart
factories imply. Strengths of existing ERP systems are mostly seen in the existing data within,
which can be used for preventative maintenance and can provide the manufacturer with useful
information on the life and reliability of their products (Rojko, 2017). The introduction of
service-oriented architecture (SOA) into existing systems can facilitate integration and
communication between machines and ERP. The developed integration framework that enables
communication between ERP and other objects determines the readiness of the ERP system for
a smart factory (Haddara and Elragal, 2015) and the introduction of RFID technology to
monitor production execution associated with the ERP system can significantly improve
production planning (Mladineo et al, 2019). In addition, establishment of technology-oriented
and modern organizational culture, proper mechanisms for knowledge transfer and employee
awareness of technology can be a stimulus for the establishment of smart factories of existing
organizations (Haddara and Elragal, 2015), and existing knowledge of employees about
handling ERP systems can be a good basis for realization of it.
Figure following on the next page
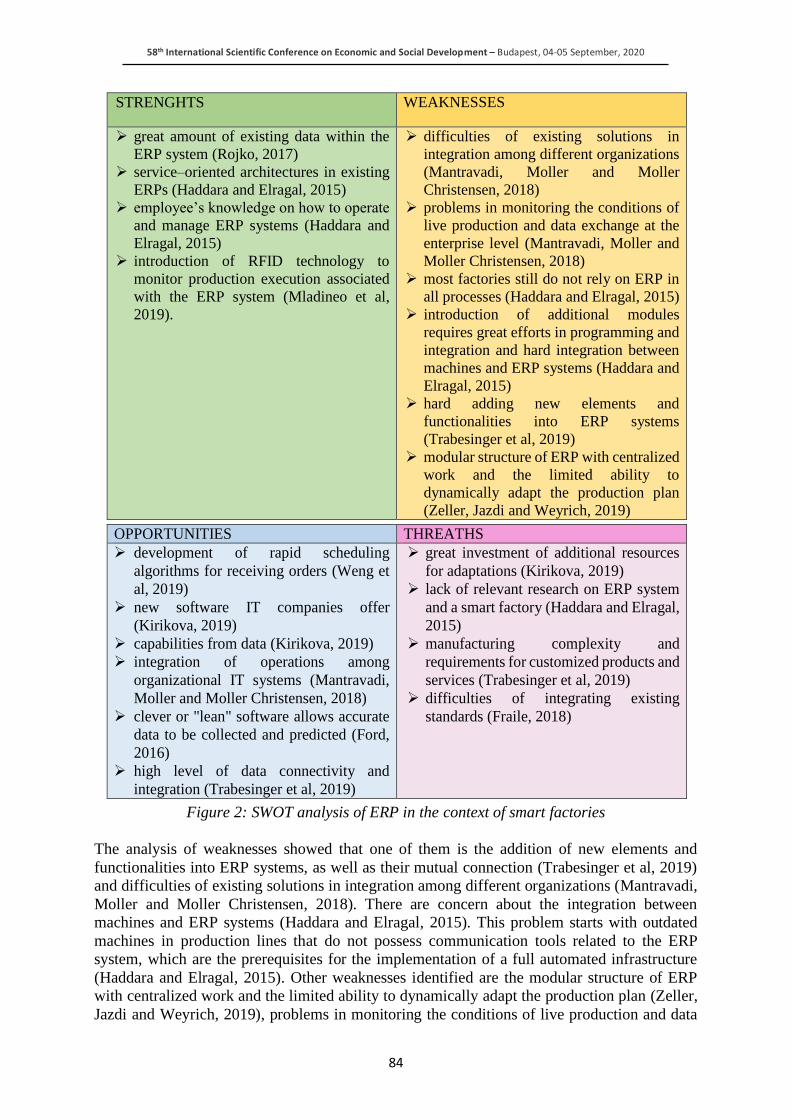
58th International Scientific Conference on Economic and Social Development – Budapest, 04-05 September, 2020
84
Figure 2: SWOT analysis of ERP in the context of smart factories
The analysis of weaknesses showed that one of them is the addition of new elements and
functionalities into ERP systems, as well as their mutual connection (Trabesinger et al, 2019)
and difficulties of existing solutions in integration among different organizations (Mantravadi,
Moller and Moller Christensen, 2018). There are concern about the integration between
machines and ERP systems (Haddara and Elragal, 2015). This problem starts with outdated
machines in production lines that do not possess communication tools related to the ERP
system, which are the prerequisites for the implementation of a full automated infrastructure
(Haddara and Elragal, 2015). Other weaknesses identified are the modular structure of ERP
with centralized work and the limited ability to dynamically adapt the production plan (Zeller,
Jazdi and Weyrich, 2019), problems in monitoring the conditions of live production and data
STRENGHTS WEAKNESSES
➢ great amount of existing data within the
ERP system (Rojko, 2017)
➢ service–oriented architectures in existing
ERPs (Haddara and Elragal, 2015)
➢ employee’s knowledge on how to operate
and manage ERP systems (Haddara and
Elragal, 2015)
➢ introduction of RFID technology to
monitor production execution associated
with the ERP system (Mladineo et al,
2019).
➢ difficulties of existing solutions in
integration among different organizations
(Mantravadi, Moller and Moller
Christensen, 2018)
➢ problems in monitoring the conditions of
live production and data exchange at the
enterprise level (Mantravadi, Moller and
Moller Christensen, 2018)
➢ most factories still do not rely on ERP in
all processes (Haddara and Elragal, 2015)
➢ introduction of additional modules
requires great efforts in programming and
integration and hard integration between
machines and ERP systems (Haddara and
Elragal, 2015)
➢ hard adding new elements and
functionalities into ERP systems
(Trabesinger et al, 2019)
➢ modular structure of ERP with centralized
work and the limited ability to
dynamically adapt the production plan
(Zeller, Jazdi and Weyrich, 2019)
OPPORTUNITIES THREATHS
➢ development of rapid scheduling
algorithms for receiving orders (Weng et
al, 2019)
➢ new software IT companies offer
(Kirikova, 2019)
➢ capabilities from data (Kirikova, 2019)
➢ integration of operations among
organizational IT systems (Mantravadi,
Moller and Moller Christensen, 2018)
➢ clever or "lean" software allows accurate
data to be collected and predicted (Ford,
2016)
➢ high level of data connectivity and
integration (Trabesinger et al, 2019)
➢ great investment of additional resources
for adaptations (Kirikova, 2019)
➢ lack of relevant research on ERP system
and a smart factory (Haddara and Elragal,
2015)
➢ manufacturing complexity and
requirements for customized products and
services (Trabesinger et al, 2019)
➢ difficulties of integrating existing
standards (Fraile, 2018)
58th International Scientific Conference on Economic and Social Development – Budapest, 04-05 September, 2020
85
exchange at the enterprise level (Mantravadi, Moller and Moller Christensen, 2018), as well as
the fact that most ERP systems have production planning modules, however, most factories still
do not rely on ERP in this process, and the inventory management process in most warehouses
is chaotic (Haddara and Elragal, 2015). The opportunities for developing ERP systems with the
use of digital technologies relate to the context of possibilities Industry 4.0. technologies bring,
which are integrated into new software IT companies offer (Kirikova, 2019), but also to: the
development of rapid scheduling algorithms for receiving orders (Weng et al, 2019),
capabilities from data that can be used in information systems (controlled classification into
developed centralized databases, data logs, open data capabilities and information available on
social networks and similar) (Kirikova, 2019), integration of operations among organizational
IT systems (Mantravadi, Moller and Moller Christensen, 2018), clever or "lean" software
allows accurate data to be collected and predicted (Ford, 2016), high level of data connectivity
and integration (Trabesinger et al, 2019) similar. Market research can contribute to the
development of highly innovative solutions that cross the boundaries of reality and are tailored
to the needs of industrial manufacturers and the market. Multiple adaptations and development
of multiple types of systems which have to be integrated with ERP systems, exploring
possibilities of integrating physical devices with virtual components and creating interaction of
devices with human beings requires great investment of additional resources (Kirikova, 2019),
and is therefore seen as a threat. In addition, financial decision making requires expert analysis
and engagement, so additional major investments. Other threats, such as manufacturing
complexity and requirements for customized products and services (Trabesinger et al, 2019),
difficulties of integrating existing standards that underpin existing business into new concepts
(Fraile, 2018) and the lack of relevant research exploring the relationship between an ERP
system and a smart factory (Haddara and Elragal, 2015) require additional research and
knowledge and can influence the success rate of ERP systems development.
5. ADVANCING ERP SYSTEMS TOWARDS THE CONCEPT OF SMART FACTORY
A key goal of many industrial manufacturers is certainly to realize the rich potential of Industry
4.0 technologies in a fast, secure and flexible way. Business Resource Planning systems (ERP)
are considered to be the backbone for Industry 4.0 (Haddara and Elragal, 2015), and in smart
factories, they are supposed to be integrated with two other major software applications, namely
Product Lifecycle Management (PLM) and Production Management System (MES) (Ayvarnam
and Mayurappriyan, 2017), with digital technologies. Manufacturers of ERP systems, like SAP,
Siemens (PLM), Oracle, IBM (Asset Management) and INFOR (BAAN) have already
developed parts of the intelligent manufacturing support solutions (Wieland et al, 2016). Using
digital technologies, industrial manufacturers are able to integrate business, demand and supply
chains, enabling them to engage with end customers in a very unique, unprecedented way.
Industry 4.0 is based on highly intelligent and connected systems that create a complete digital
value chain (Haddara and Elragal, 2015). The literature mainly cites the importance of ERP
systems in classical manufacturing systems to achieve smart factory. The application of ERP
and digital technologies easily establishes a digital supply chain, but again, problem arise in
some industries. This is clearly seen in agricultural production, where it comes to fresh food
supply chains, which need further consideration due to critical information such as short shelf
life of some food or agricultural products (Mantravadi, Moller and Moller Christensen, 2018).
The assumption is that ERP systems can significantly improve the operational efficiency of an
agricultural enterprise, but their low adoption rate is caused by many problems, including lack
of qualified staff and lack of knowledge about ERP capabilities among top managers and key
employees of agricultural enterprises (Kulikov et al, 2020). Decision makers in the agricultural
sector face unstable conditions and risks such as physical storage management, control of
transportation costs, exposure to climate problems, vulnerability to weeds, pests and diseases
58th International Scientific Conference on Economic and Social Development – Budapest, 04-05 September, 2020
86
(Haberli, Oliveira and Yanaze, 2017). Experts estimate that, projects related to the agricultural
industry account for 1-2% to 10-15% of projects of leading software and hardware
manufacturers (Kulikov et al, 2020). Yoon et al. have proposed a smart factory reference bus
architecture, that is, an information service bus for a smart factory, which can be used to collect
data, analyze and apply it at various stakeholders at the planning levels for machines, factories
and businesses (Yoon et al, 2016), (Phadermrod, Crowder and Wills, 2016). Also, a great deal
of research highlights the importance of assigning intelligence to machines and integrating
machines, equipment, ERP systems, user interfaces and humans (Weng et al, 2019),
(Mantravadi, Moller and Moller Christensen, 2018), (Trabesinger et al, 2019), (Fraile, 2018),
(Foidl and Felderer, 2016), (Wieland et al, 2016). Some research shows go one step further, and
in addition to experimentation with the development, partly designing and integrating the smart
factory they are also testing its perfor-mance (Mladineo et al, 2019). When focused on the
modeling of socio-virtual-physical systems, it is necessary to single out the Industry 4.0 Model
Reference Architecture (RAMI 4.0) as a three-dimensional framework that incorporates
hierarchy levels, life cycles, and values and layers, which is also designed to serve smart
factories (Rojko, 2017), (Kirikova, 2019). Wisdom Manufacturing has been seen as a synthesis
of organizational wisdom, collaborative learning, innovation and creativity, artificial
intelligence and the integration of all listed, with the aim of using knowledge to establish and
achieve efficient and effective production of custom-tailored, personalized products and
services or creation new markets for innovative products (Haddara and Elragal, 2015), which
is also the goal of smart factories. Much of the relevant literature looks at and explains MES
and ERP as two separate systems in terms of integration with smart factories (Mantravadi,
Moller and Moller Christensen, 2018), (Ayvarnam and Mayurappriyan, 2017), (Postelnicu and
Martinez Lastra, 2011). The Production Execution System (MES) is tasked with producing the
required products using minimal waste in terms of time, cost and energy consumption.
Production orders come from the higher level represented by the ERP (Postelnicu and Martinez
Lastra, 2011).
6. CONCLUSION
Resource Planning Systems (ERPs) are considered the backbone and foundation for Industry
4.0 technologies implementation. In order to realize the concept of a smart factory, it is
necessary to analyze the current state of the industrial manufacturers and the systems they use,
in order to improve the use new digital technologies. In this paper, a survey of relevant literature
in the field of resource planning (ERP) systems and smart factories has been conducted. The
analyzed literature revealed current topics of the concepts of industry 4.0 and smart factories
and the issues and the role of ERP in the context of the smart factory concept. Also, based on
the literature analysis, the strengths and weaknesses and opportunities and threats of developing
an ERP system were identified. Strengths and weaknesses relate to existing ERP systems from
industrial manufacturers considered in terms of smart factory. Opportunities and threats to the
development of ERP systems have been observed in view of the opportunities and challenges
posed by the concepts of Industry 4.0 and smart factories in terms of the development of new
digital systems, products and services. Developing new digital systems where processes are
timely, real-time data is processed and key decisions are made, then smart products
characterized by embedded sensors and other functional components, and quality and seamless
digital services that follow the user experience lifecycle are characterizing smart factory in the
future. An analysis of the opportunities has shown that ERP can in the future become systems
that will be integrated with other systems and equipment through digital technologies, and there
is a possibility of upgrading additional functionalities that have been not covered so far. The
threats ERP systems face are great spending of resources on considering integration and
exploring additional functionality.
58th International Scientific Conference on Economic and Social Development – Budapest, 04-05 September, 2020
87
The complexity of production systems and the sluggishness of change must also be emphasized.
Only when a new production system is planned from scratch, is it possible to design it according
to the requirements of the Industry 4.0 concept. Therefore, one of the threats are also standards
already in place that have to be integrated into the new concept. Certainly, in the face of
traditional ERP and existing production systems, transformation to smart factory is a big
challenge. The integration of digital technologies and the adaptation of existing systems
requires efforts in terms of resources, which should certainly be viewed at a strategic level, as
it requires a long-term view.
ACKNOWLEDGEMENT: This research has been conducted as part of the wider research in
the project Center of competencies for digital transformation of the food industry in rural areas
(RDI) which is funded by European Union through the European Regional Development Fund
(ERDF).
LITERATURE:
1. Ayvarnam, N., Mayurappriyan, P.S. (2017). Dynamic Scheduling of Machines Towards the
Vision of Industry 4.0 Studio - A Case Study. Proceedings of 2nd International Conference
on Intelligent Computing and Applications, pp. 103-111.
2. Foidl, F., Felderer, M. (2016). Research Challenges of Industry 4.0 for Quality
Management. ERP Future 2015 – Research, pp. 121-136.
3. Ford, M. (2016). Smart for Smart’s Sake, Part 2: Material Management. SMT Magazine,
pp. 40-44.
4. Fraile, F., Flores, J.L., Anaya, V., Saiz, E. and Poler, R. (2018). A Scaffolding Design
Framework for Developing Secure Interoperability Components in Digital Manufacturing
Platforms. 2018 International Conference on Intelligent Systems (IS), pp. 564-569.
5. Haberli J.C., Oliveira, T. and Yanaze, M. (2017). Understanding the determinants of
adoption of enterprise resource planning (ERP) technology within the agrifood context: the
case of the Midwest of Brazil. International Food and Agribusiness Management Review,
Vol. 20, No. 5, pp. 729-746.
6. Haddara, M., Elragal, A. (2015). The Readiness of ERP Systems for the Factory of the
Future. Procedia Computer Science 64, pp. 721-728.
7. Hrustek, L., Tomičić Furjan, M. (2019). Implementation of digital technologies in smart
factory processes. Proceedings of the 30th International Scientific Central European
Conference on Information and Intelligent Systems, pp. 125-132.
8. Kirikova, M. (2019). Challenges in Enterprise and Information Systems Modeling in the
Contexts of Socio Cyber Physical Systems. Enterprise and Organizational Modeling and
Simulation, pp. 60-69.
9. Kulikov, I., Semin, A., Skvortsov, E., Ziablitckaia, N. and Skvortsova, E. (2020).
Challenges of Enterprise Resource Planning (ERP) implementation in agriculture.
Entrepreneurship and sustainability issues, Vol. 7, No. 3, pp. 1847-1857.
10. Mantravadi, S., Moller, C. and Moller Christensen, F.M. (2018). Perspectives on Real-Time
Information Sharing through Smart Factories: Visibility via Enterprise Integration.
International Conference on Smart Systems and Technologies (SST), pp. 133-137.
11. Mladineo, M., Veza, I., Gjeldum, N., Crnjac, M., Aljinovic, A. and Basic, A. (2019).
Integration and testing of the RFID-enabled Smart Factory concept within the Learning
Factory. Precendia manufacturing 31, pp. 384-389.
12. Nyarku, K., Agyapong, G. (2011). Rediscovering SWOT Analysis: The Extended Version.
Academic Leadership: The Online Journal, Vol. 9, No. 2, Article 28
58th International Scientific Conference on Economic and Social Development – Budapest, 04-05 September, 2020
88
13. Phadermrod, B., Crowder, R.M. and Wills, G.B. (2016). Importance-Performance Analysis
based SWOT analysis. International Journal of Information Management, Vol. 44, pp. 194-
203.
14. Postelnicu, C., Martinez Lastra, J.L. (2011). Applicability of Market-based Competition
models for Energy Efficient Factory Automation Systems. IFIP International Conference on
Advances in Production Management Systems, pp. 519-527.
15. Rojko, A. (2017). Industry 4.0 Concept: Background and Overview. iJIM – International
Journal of Interactive Mobile Technologies, Vol. 11, No. 5, pp. 77-90.
16. Sun, X., Wu, C.C. and Chen, L.R. (2018). An automated warehouse sorting system for small
manufacturing enterprise applying discrete event simulation. 2nd IEEE Advanced
Information Management, Communicates, Electronic and Automation Control Conference
(IMCEC 2018), pp. 1597-1601.
17. Trabesinger, S., Pichler, R., Schall, D. and Gfrerer R. (2019). Connectivity as a prior
challenge in establishing CPPS on basis of heterogeneous IT-software environments.
Procedia Manufacturing, Vol. 31, pp. 370-376.
18. Weng, J., Mizoguchi, S., Akasaka, S. and Onari, H. (2019). Smart manufacturing operating
systems considering parts utilization for engineer-to-order production with make-to-stock
parts. International Journal of Production Economics, Vol. 220, pp. 1-7.
19. Wieland, M. et al. (2016). Towards a Rule-based Manufacturing Integration Assistant.
Procedia CIRP, Vol 57, pp. 213-218.
20. Yoon, S.C., Um, J., Suh, S.H., Stroud, I. and Yoon, J.S. (2016). Smart Factory Information
Service Bus (SIBUS) for manufacturing application: requirement, architecture and
implementation. Journal of Intelligence Manufacturing, Vol. 30, No. 1, pp. 363-382.
21. Zeller, A., Jazdi, N. and Weyrich, M. (2019). Functional verification of distributed
automation systems - Assisting production line operators by an automated model
composition. The International Journal of Advanced Manufacturing Technology, Vol. 105,
No 9, pp. 3991-4004.
58th International Scientific Conference on Economic and Social Development – Budapest, 04-05 September, 2020
89
ON THE DETERMINANTS OF THE TUNISIAN ECONOMIC GROWTH
RATE: EVIDENCE FROM A MSI-VAR MODEL
Knani Ramzi
University of Sousse, Faculty of Economic Sciences and Management,
Department of Quantitative Methods, City of Erriadh, 4023, Sousse, Tunisia
ABSTRACT
In this paper, we employed a two-dimensional Markov-switching vector autoregression model
with regime shifts in intercept to study the regime shifts of the Tunisian economic growth rate.
Results revealed that the economic growth rate is strongly affected by investment and
consumption while trade openness and international financial integration have a little effect.
Such results imply that the Tunisian government has to improve economic strategy along with
trade and capital openness to promote economic growth.
Keywords: Multivariate Markov switching, Tunisian economic growth rate, international
financial integration
1. INTRODUCTION
The analysis of economic cycles and fluctuations is of great interest to economic agents. For
the decision maker, the objective is to stabilize the macroeconomic environment and for the
private agent; it is necessary that operates in business climate favorable to it’s inter temporal
choices. Dating and detection of cyclical turning points allows policymakers anticipating and
knowing the dates of change in the economy and thus taking appropriate economic policies.
Studies of economic cycles back to the pioneering works of the National Bureau of Economic
Research (NBER) in (1920), Mitchell (1927) and Burns and Mitchell (1946).These authors
identified the asymmetrical character and the co-movement among economic series. Linear
models that assume symmetry throughout the cycles do not take into account the cyclical
turning points. Thus, cyclical fluctuations, which have multiple sources (variability of
economic policy, relative price shocks, productivity shock, supply shock, demand shock, etc.)
can be studied by nonlinear switching models regimes among which the Markov switching
model popularized by Hamilton (1989). This model implies the existence of different regimes
where the series acts differently depending on the states of an unobservable transition variable.
Among the extensions of Hamilton (1989) model, we find a multivariate generalization of the
Hamilton’s single equation model: the Markov Switching vector autoregressive (MS-VAR)
model developed by Krolzig (1997). In these extended models there is an unobserved state
driven by an ergodic Markov process that is common to all series. In a sequence of papers,
Krolzig has studied the statistical analysis of the MS-VAR models and their application to
dynamic multivariate systems (Krolzig (1998, 2000, 2001), Krolzig et al (2002)). In subsequent
studies, Clements and Krolzig (2002, 2003) discussed the characterization and the testing of
business cycle asymmetries based on MS-VAR model. Pelagatti (2002) estimated a duration
dependent MS-VAR model by using a multimove Gibbs sampler since the computational
burden in using the ML approach to such models is high. Ehrmann et al. (2003) combined both
Markov-switching and structural identifying restrictions in a VAR model to analyze the
reaction of variables to fundamental disturbances. Over the last decades, developing and
emerging economies experienced considerable economic and financial integration in the global
economy, especially with the signing of free trade agreements and the abolition of restrictive
measures on capital movements. The aim is to stimulate economies and promote economic
growth. Among the determinants of economic growth, investment and government spending
are the means used by the government to stimulate economic growth.
58th International Scientific Conference on Economic and Social Development – Budapest, 04-05 September, 2020
90
This leads us to question the impact of government policies on economic growth according to
the cyclical phases of the economy. Our study attempts to show the asymmetric effects of the
various shocks on economic growth conditional on the state of the economy. We analyze the
characteristics of the economic growth cycle and the impulse responses functions resulting from
estimating a MS-VAR model with regime shifts in intercept. We present implications of such
results and economic policy recommendations for the Tunisian government. The paper is
organized as follows. Section 2 describes the various specifications of the MS-VAR model and
the estimation process via the EM algorithm. Section 3provides the empirical results and
analysis. Section 4 concludes.
2. THE MS-VAR MODEL
Since the pioneering work of Sims (1980), the vector autoregression (VAR) model has been
widely used in empirical macroeconomics to study the effects of macroeconomic shocks and
the response of the economy to these shocks. The assumption subjacent to this model is that the
evolution of the economy can be explained by the dynamic behavior of a vector of variables
linearly dependent of the past. This model has undergone many extensions, among which the
markov switching VAR (MS-VAR) model proposed by Krolzig (1997). This author discusses
them in some categories depending on which parameters are allowed to vary across regimes.
The change can be in the mean (MSM models), in the intercept (MSI model), in the variance
(MSH models), in the mean and variance (MSMH models) and in the intercept and variance
(MSIH models). According to Krolzig (1998): “the mean adjusted form and the intercept form
of an MS(M)–VAR(p) model are not equivalent. These forms imply different dynamic
adjustments of the observed variables after a change in regime. While a permanent regime shift
in the mean causes an immediate jump of the observed time series vector onto its new level, the
dynamic response to a once-and-for-all regime shift in the intercept term is identical to an
equivalent shock in the white noise series”. In this work, we suggest using a Markov Switching
Intercept VAR model rather than using a Markov Switching Mean VAR model.
The MSI(M)-VAR(p)models, as defined in Krozig (1997), is written as:
++++
++++
=
−−
−−
tptptM
tptpt
t
yy
yy
y
...
...
11
111
(1)
Where ),...,( 1 nttt yyy = is an n dimensional time series vector, ),...,( 1 M = is the vector of
intercepts, p ,...,1 are the matrices containing the autoregressive parameters and t is a white
noise vector.
In the MS-VAR specifications, it is assumed that the unobserved state st follows a first-order
Markov-process. The implication is that the current regime st depends only on the regime one
period ago, st-1:
ijtttttpisjsPksisjsP =======
−−−}{,...},{
121 (2)
Where pij gives the probability that the state i is followed by the state j.
The Hamilton’s (1989) algorithm consists of two parts. In the first part, population parameters
including the joint probability density of unobserved states are estimated and in the second part,
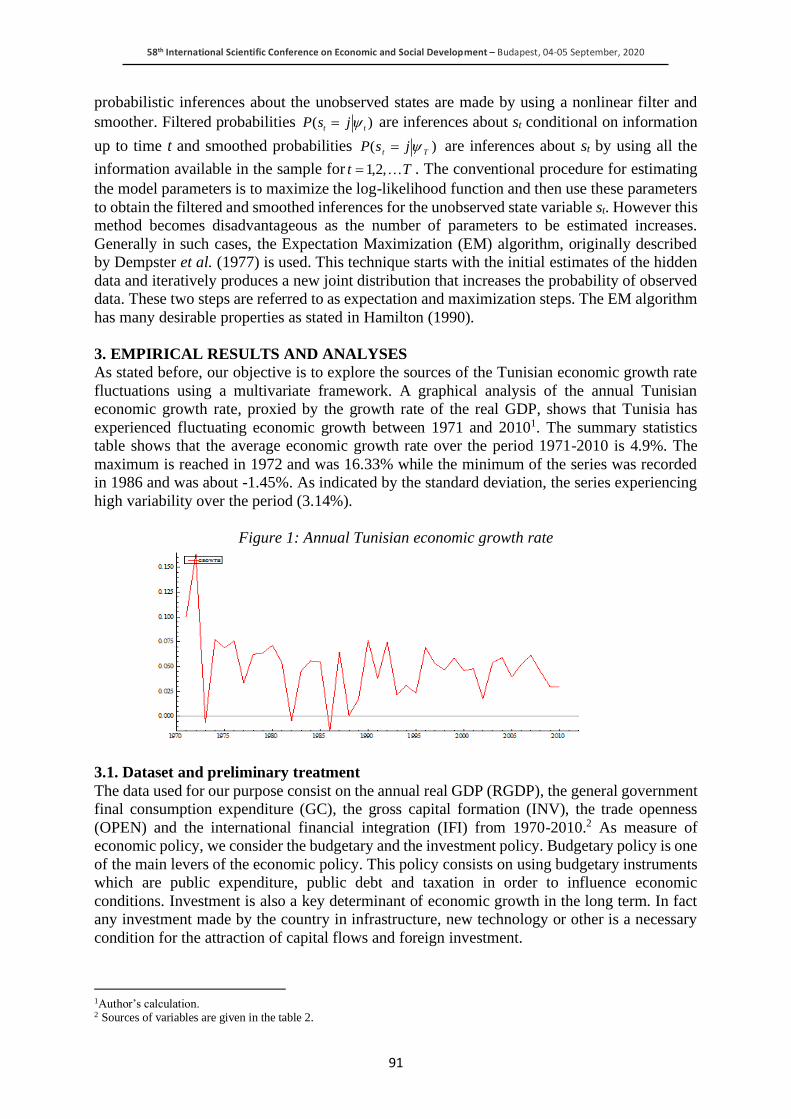
58th International Scientific Conference on Economic and Social Development – Budapest, 04-05 September, 2020
91
probabilistic inferences about the unobserved states are made by using a nonlinear filter and
smoother. Filtered probabilities )(tt
jsP = are inferences about st conditional on information
up to time t and smoothed probabilities )(Tt
jsP = are inferences about st by using all the
information available in the sample for Tt ,2,1= . The conventional procedure for estimating
the model parameters is to maximize the log-likelihood function and then use these parameters
to obtain the filtered and smoothed inferences for the unobserved state variable st. However this
method becomes disadvantageous as the number of parameters to be estimated increases.
Generally in such cases, the Expectation Maximization (EM) algorithm, originally described
by Dempster et al. (1977) is used. This technique starts with the initial estimates of the hidden
data and iteratively produces a new joint distribution that increases the probability of observed
data. These two steps are referred to as expectation and maximization steps. The EM algorithm
has many desirable properties as stated in Hamilton (1990).
3. EMPIRICAL RESULTS AND ANALYSES
As stated before, our objective is to explore the sources of the Tunisian economic growth rate
fluctuations using a multivariate framework. A graphical analysis of the annual Tunisian
economic growth rate, proxied by the growth rate of the real GDP, shows that Tunisia has
experienced fluctuating economic growth between 1971 and 20101. The summary statistics
table shows that the average economic growth rate over the period 1971-2010 is 4.9%. The
maximum is reached in 1972 and was 16.33% while the minimum of the series was recorded
in 1986 and was about -1.45%. As indicated by the standard deviation, the series experiencing
high variability over the period (3.14%).
Figure 1: Annual Tunisian economic growth rate
3.1. Dataset and preliminary treatment
The data used for our purpose consist on the annual real GDP (RGDP), the general government
final consumption expenditure (GC), the gross capital formation (INV), the trade openness
(OPEN) and the international financial integration (IFI) from 1970-2010.2 As measure of
economic policy, we consider the budgetary and the investment policy. Budgetary policy is one
of the main levers of the economic policy. This policy consists on using budgetary instruments
which are public expenditure, public debt and taxation in order to influence economic
conditions. Investment is also a key determinant of economic growth in the long term. In fact
any investment made by the country in infrastructure, new technology or other is a necessary
condition for the attraction of capital flows and foreign investment.
1Author’s calculation. 2 Sources of variables are given in the table 2.
58th International Scientific Conference on Economic and Social Development – Budapest, 04-05 September, 2020
92
As such, the infrastructure that exists in a country affects the cost of doing business and,
therefore, it may affect business decisions to settle in this country. In this study, we consider
the gross capital formation as a proxy for the gross domestic investment which consists of
outlays on additions to the fixed assets of the economy plus net changes in the level of
inventories (WDI, 2013). Given that Tunisia is a small open economy for witch trade and capital
openness could be an important vehicle for economic growth, we consider a trade openness
indicator approximated by the sum of imports and exports of goods and services (current US$).
As a measure of the degree of international financial integration, we consider the updated and
extended version of dataset constructed by Lane and Milesi-Ferretti (2007). These authors have
broken foreign assets and liabilities for a large sample of countries for the period 1970-2011
into four types: foreign direct investment, portfolio investment, debt and derivatives and official
reserves.3We prefer these quantities based on de facto measures rather than de jure measures as
the latter do not reflect the degree of enforcement of capital controls and therefore the actual
degree of financial integration in the world financial markets. So we consider as a degree of
international financial integration the sum of inflows and outflows of capital, expressed in
current U.S. dollars.
3.2. Preliminary tests
In the preliminary tests, we are going to verify the stationary of the time series, the Garnger-
causality and we finished by the linear test in order to check the appropriate model. To properly
specify the MS-VAR model, we check the stationary of each variable in our sample at 10%
significance level. The Augmented Dickey–Fuller (ADF) test has a unit root as the null
hypothesis and has stationary as alternative hypothesis. We reject the null hypothesis of non
stationary if the statistical value is greater than the ADF critical value. ADF test results show
that all variables are not stationary in levels. In log difference, the variables are stationary at
10% significance level.4 The log difference of the real GDP gives the economic growth rate
such as:
1lnln −−= tt RGDPRGDPGrowth
The log difference of GC, INV, OPEN and IFI provides the change between two subsequent
years of these variables.5 To determine the autoregressive orders of the model, we use the
Akaike Information Criterion (AIC). Lag 2 is appropriate for our MS-VAR model. That is, we
estimate a two regimes Markov Switching Intercept Vector Autoregression model with lag 2,
MSI(2)-VAR(2). A common method for testing Granger causality is to regress y on its own
lagged values and on lagged values of x and tests the null hypothesis that the estimated
coefficients on the lagged values of x are jointly zero. Failure to reject the null hypothesis is
equivalent to failing to reject the hypothesis that x does not cause y .6
The equation to be tested is done in the following regression:
t
m
t
iti
m
t
iti
m
t
iti
m
t
iti
m
t
itit IFIOpenINVGCGrowthGrowth ++++++= =
−
=
−
=
−
=
−
=
−
11111
0
3We are grateful to Philip R. Lane and Gian Maria Milesi-Ferretti for providing us with the database on capital flows. 4ADF test results of the log differenced variables are reported in appendix. 5 Descriptive statistics of the log differenced variables are presented in appendix. 6 Source : STATA manual
58th International Scientific Conference on Economic and Social Development – Budapest, 04-05 September, 2020
93
To test the non-Granger causality from GC, INV, Open and IFI to Growth, we test the nullity
of all coefficients iiii and ,,, . To this end, we employ a Fisher test based on the statistic,
1S :
)12,(~)12()(
1
101 −−
−−−= pTpF
p
pT
RSS
RSSRSSS
However, this test is not an accurate due to the existence of endogenous delayed variables in
the OLS regression. That is, the Fisher test is replaced by an asymptotic )(2 p test based on the
statistic, 2S :
)(~T)( 2
1
10
2 pRSS
RSSRSSS
−=
The results of pairwise Granger Causality Tests are given in table1.
Table 1: Pairwise Granger Causality Tests Null Hypothesis Chi2 Df Probability
GROWTH does not Granger Cause GC 6.0109 2 0.050
GC does not Granger Cause GROWTH 1.561 2 0.458
GROWTH does not Granger Cause INV 8.8645 2 0.012
INV does not Granger Cause GROWTH 3.9634 2 0.138
GROWTH does not Granger Cause OPEN 1.9549 2 0.376
OPEN does not Granger Cause GROWTH 0.01772 2 0.991
GROWTH does not Granger Cause IFI 6.176 2 0.046
IFI does not Granger Cause GROWTH 2.1791 2 0.336
At 10% significance level, test results suggest that we cannot reject the null hypothesis that GC,
INV, OPEN and IFI does not Granger Cause GROWTH. We accept also the hypothesis that
GROWTH does not Granger cause OPEN. On other hand, the results suggest that GROWTH
granger cause GC, INV and IFI. Also, results show that there is no feedback between all
variables included in the regression. To test the quality of MS-VAR model against a linear VAR
model, the likelihood ratio (LR) test is applied, which is asymptotically X2(r) distributed.
However, this test requires normal conditions that are not verified in this case due to the
existence of unidentified nuisance parameters under the null hypothesis. Therefore, using a X2(r)
distribution will cause a bias of the estimate. Thus, to circumvent this problem, the LR test
statistic is compared to the X2(r+n) tabulated statistics where n is the number of nuisance
parameters. In our estimation, the LR statistic is 21.4489 while the X2(7)=0.0032 so the MS-
VAR model is more appropriate than the VAR one’s.
4. EMPIRICAL FINDING AND INTERPRETATIONS
The main parameters estimated of the MSI(2)-VAR(2) model are presented in table 3. The
results show that the asymmetry of the economic growth rate cycle is well characterized by the
properties of the regimes and the transition probability matrix. From the table 3, we show that
the Tunisian economic growth rate is characterized by two states. The first regime )1( =ts
represents the recession state while the second )2( =ts represents the expansion one.
58th International Scientific Conference on Economic and Social Development – Budapest, 04-05 September, 2020
94
The constant associated to the GROWTH equation is about 0.062 if the first regime holds and
0.0927 if the second state is prevailing. Economic growth rate at 1−t and 2−t negatively
affects the GROWTH variable (about -0.671 and -0.074 respectively). The GC and the INV
variables positively affect the GROWTH one at 1−t and 2−t . The coefficients associated to
OPEN and IFI are negative at the period 1−t and 2−t . The negative effect is more important
at period 1−t than 2−t for both variables. An expansionary policy has a positive effect on
economic growth but trade openness and international financial integration are decreasing the
economic growth. Through the transition matrix, we find that the transition probabilities from
one state to another are different from zero. The probability of remaining in a recession state is
74% against a probability of 66% to remain in a state of expansion. Therefore, the probability
of moving from a state of recession to a state of expansion is lower than that the probability of
moving from a state of expansion to a state of recession (respectively 26% and 34%). Regime
properties show that the first regime is observed 21 times with a probability of 57% while the
second regime is observed 17 times with a probability of 43%. The duration of a state of
recession is more important than the duration of the second regime, respectively 3.85 and 2.94.
Correlation matrix shows a negative linear relation between the economic growth rate and all
variables. The correlation coefficient is about -0.2558 between GROWTH and GC. It is less
important between GROWTH and INV, OPEN and IFI, respectively of about -0.0342, -0.0731
and -0.1173. Figure 2 shows the filtered, smoothed and predicted probabilities to being in
different state. As indicated by the intercept coefficients of the estimated model, the state 1
corresponds to a recession period while the state 2 corresponds to an expansion period. The
results show that the recession period has dominated regime for about 20 periods against 16
periods for the expansionist one. The impulses response functions responses of growth to
different shocks are given in Figure 3. A unit shock to growth has a deceasing positive effect
on growth at the first year where the response is about -0.4. This effect is decreasing and tends
to be stable over all periods. Such result is not surprising because Tunisia was marked for long
run year by recessive and persistent state. Similarly, shocks on trade openness and international
financial integration are negatively affecting GROWTH for all periods. The negative effect is
more important for OPEN than IFI. To the contrary, the impulse response functions show that
GC and INV shocks affect positively economic growth. Positive changes in the GC and INV
increase economic growth at all the time horizon.
5. SUMMARY AND CONCLUDING REMARKS
The results for Granger Causality test suggested that there is no feedback effect between
GROWTH, GC INV, OPEN and IFI. There is a unidirectional effect from GROWTH to GC,
INV and IFI. Correlation matrix shows the existence of a negative relationship between all the
variable of the model. From the Linearity test and the adjustment model presented in the figure
4, we show the adequacy of the MSI-VAR model to explain the Tunisian economic growth rate
fluctuations. Empirical finding show Tunisia was marked for the most time by recessionary
period where the recession regime is more persistent than the expansionary one. The probability
of moving from a recession state to an expansion one is less important than moving from an
expansion state to recession one. Results obtained from the impulse responses functions support
the hypothesis of a positive relationship between economic growth and general consumption
and growth and investment. However, these impulses functions show the negative effect of
trade openness and international financial integration on growth. From our results, we conclude
that the economic policies are the main driver of the economic growth in Tunisia. The
government has to improve economic strategy along with trade and capital openness measures
to promote economic growth.
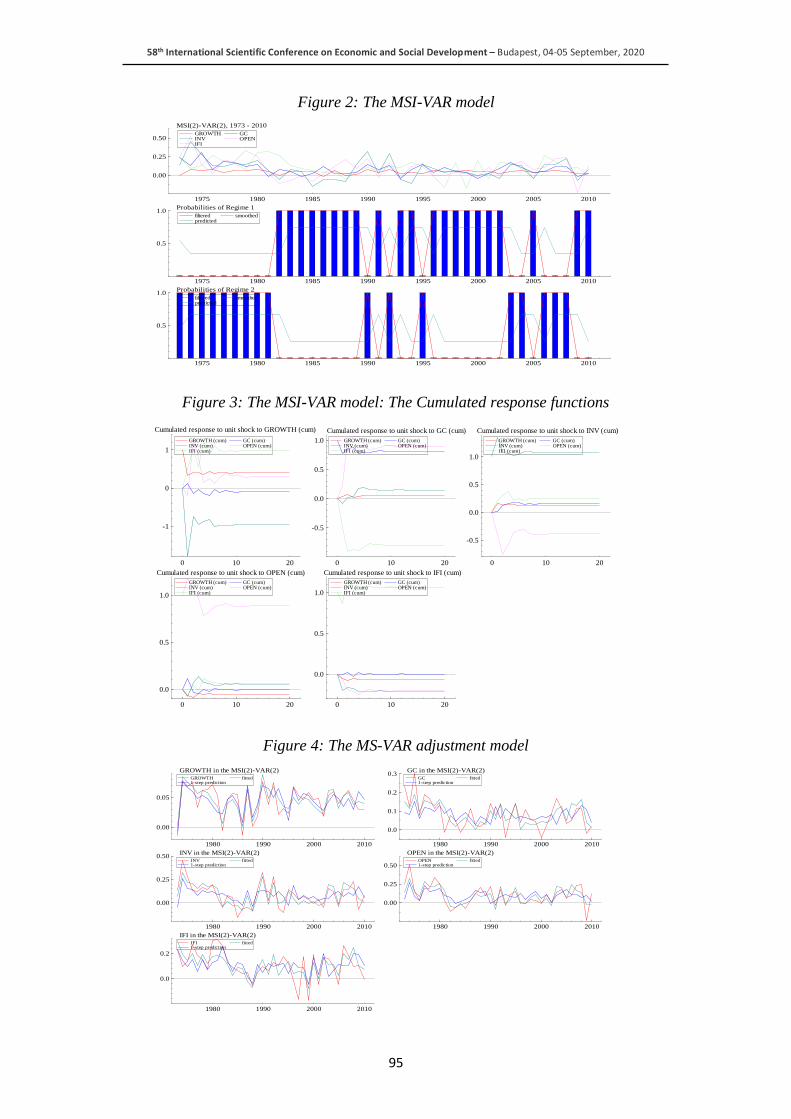
58th International Scientific Conference on Economic and Social Development – Budapest, 04-05 September, 2020
95
Figure 2: The MSI-VAR model
Figure 3: The MSI-VAR model: The Cumulated response functions
Figure 4: The MS-VAR adjustment model
1975 1980 1985 1990 1995 2000 2005 2010
0.00
0.25
0.50
MSI(2)-VAR(2), 1973 - 2010
GROWTH INV IFI
GC OPEN
1975 1980 1985 1990 1995 2000 2005 2010
0.5
1.0Probabilities of Regime 1
filtered predicted
smoothed
1975 1980 1985 1990 1995 2000 2005 2010
0.5
1.0Probabilities of Regime 2
filtered predicted
smoothed
0 10 20
-1
0
1
Cumulated response to unit shock to GROWTH (cum)
GROWTH (cum) INV (cum) IFI (cum)
GC (cum) OPEN (cum)
0 10 20
-0.5
0.0
0.5
1.0
Cumulated response to unit shock to GC (cum)
GROWTH (cum) INV (cum) IFI (cum)
GC (cum) OPEN (cum)
0 10 20
-0.5
0.0
0.5
1.0
Cumulated response to unit shock to INV (cum)
GROWTH (cum) INV (cum) IFI (cum)
GC (cum) OPEN (cum)
0 10 20
0.0
0.5
1.0
Cumulated response to unit shock to OPEN (cum)
GROWTH (cum) INV (cum) IFI (cum)
GC (cum) OPEN (cum)
0 10 20
0.0
0.5
1.0
Cumulated response to unit shock to IFI (cum)
GROWTH (cum) INV (cum) IFI (cum)
GC (cum) OPEN (cum)
1980 1990 2000 2010
0.00
0.05
GROWTH in the MSI(2)-VAR(2)GROWTH 1-step prediction
fitted
1980 1990 2000 2010
0.0
0.1
0.2
0.3GC in the MSI(2)-VAR(2)
GC 1-step prediction
fitted
1980 1990 2000 2010
0.00
0.25
0.50INV in the MSI(2)-VAR(2)
INV 1-step prediction
fitted
1980 1990 2000 2010
0.00
0.25
0.50
OPEN in the MSI(2)-VAR(2)OPEN 1-step prediction
fitted
1980 1990 2000 2010
0.0
0.2
IFI in the MSI(2)-VAR(2)IFI 1-step prediction
fitted
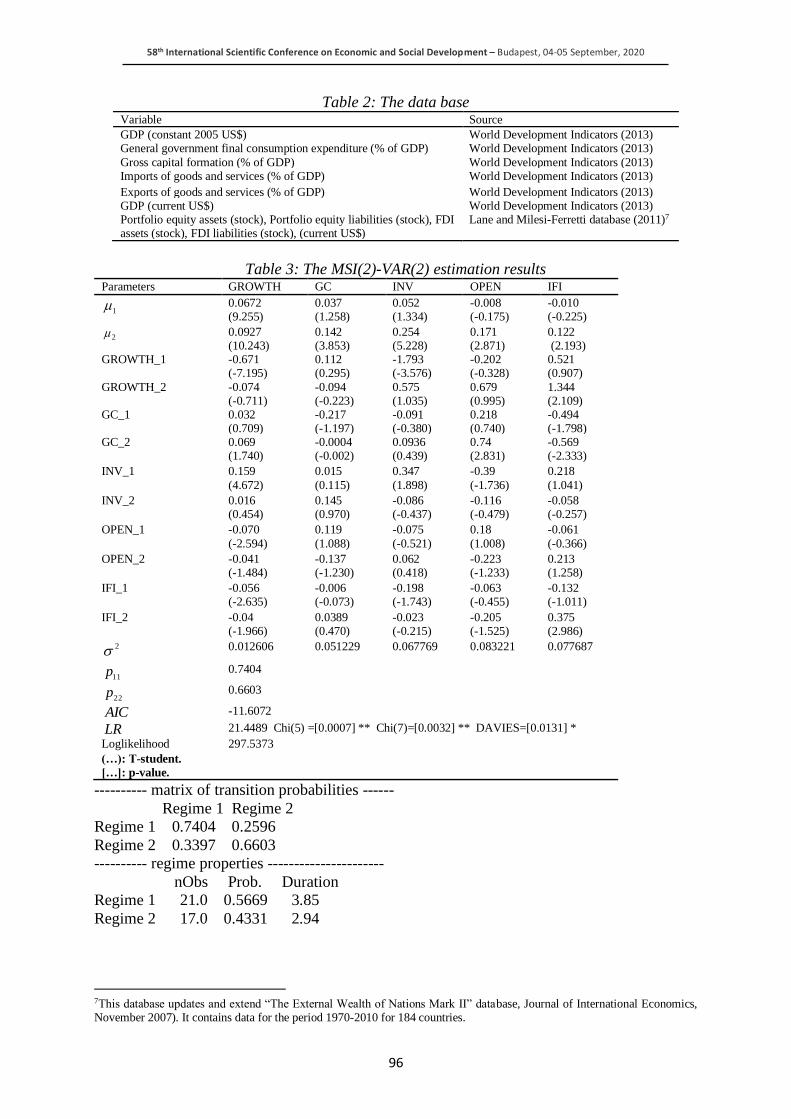
58th International Scientific Conference on Economic and Social Development – Budapest, 04-05 September, 2020
96
Table 2: The data base Variable Source
GDP (constant 2005 US$) World Development Indicators (2013) General government final consumption expenditure (% of GDP) World Development Indicators (2013)
Gross capital formation (% of GDP) World Development Indicators (2013) Imports of goods and services (% of GDP) World Development Indicators (2013)
Exports of goods and services (% of GDP) World Development Indicators (2013) GDP (current US$) World Development Indicators (2013) Portfolio equity assets (stock), Portfolio equity liabilities (stock), FDI assets (stock), FDI liabilities (stock), (current US$)
Lane and Milesi-Ferretti database (2011)7
Table 3: The MSI(2)-VAR(2) estimation results Parameters GROWTH GC INV OPEN IFI
1
0.0672 (9.255)
0.037 (1.258)
0.052 (1.334)
-0.008 (-0.175)
-0.010 (-0.225)
2 0.0927 (10.243)
0.142 (3.853)
0.254 (5.228)
0.171 (2.871)
0.122 (2.193)
GROWTH_1 -0.671 (-7.195)
0.112 (0.295)
-1.793 (-3.576)
-0.202 (-0.328)
0.521 (0.907)
GROWTH_2 -0.074 (-0.711)
-0.094 (-0.223)
0.575 (1.035)
0.679 (0.995)
1.344 (2.109)
GC_1 0.032 (0.709)
-0.217 (-1.197)
-0.091 (-0.380)
0.218 (0.740)
-0.494 (-1.798)
GC_2 0.069 (1.740)
-0.0004 (-0.002)
0.0936 (0.439)
0.74 (2.831)
-0.569 (-2.333)
INV_1 0.159
(4.672)
0.015
(0.115)
0.347
(1.898)
-0.39
(-1.736)
0.218
(1.041)
INV_2 0.016 (0.454)
0.145 (0.970)
-0.086 (-0.437)
-0.116 (-0.479)
-0.058 (-0.257)
OPEN_1 -0.070
(-2.594)
0.119
(1.088)
-0.075
(-0.521)
0.18
(1.008)
-0.061
(-0.366)
OPEN_2 -0.041 (-1.484)
-0.137 (-1.230)
0.062 (0.418)
-0.223 (-1.233)
0.213 (1.258)
IFI_1 -0.056 (-2.635)
-0.006 (-0.073)
-0.198 (-1.743)
-0.063 (-0.455)
-0.132 (-1.011)
IFI_2 -0.04 (-1.966)
0.0389 (0.470)
-0.023 (-0.215)
-0.205 (-1.525)
0.375 (2.986)
2 0.012606 0.051229 0.067769 0.083221 0.077687
11p
0.7404
22p
0.6603
AIC -11.6072
LR 21.4489 Chi(5) =[0.0007] ** Chi(7)=[0.0032] ** DAVIES=[0.0131] *
Loglikelihood 297.5373
(…): T-student.
[…]: p-value.
---------- matrix of transition probabilities ------
Regime 1 Regime 2
Regime 1 0.7404 0.2596
Regime 2 0.3397 0.6603
---------- regime properties ----------------------
nObs Prob. Duration
Regime 1 21.0 0.5669 3.85
Regime 2 17.0 0.4331 2.94
7This database updates and extend “The External Wealth of Nations Mark II” database, Journal of International Economics, November 2007). It contains data for the period 1970-2010 for 184 countries.
58th International Scientific Conference on Economic and Social Development – Budapest, 04-05 September, 2020
97
LITERATURE:
1. Alexander W. Hoffmaister, Jorge E. Roldos, and Peter Wickham (1998): “Macroeconomic
fluctuations in Sub-Saharan Africa”. International Monetary Fund.Vol. 45, No.1.
2. Ayhan Kose and Raymond Riezman (1999): “Trade Shocks and Macroeconomic
Fluctuations in Africa”. CSGR Working Paper No. 43/99.
3. Backus David K., Kehoe Patrick J. and Kydland Finn E. (1992): “International business
cycles: Theory vs. evidence”. The Journal of Political Economy; 100, 4.
4. Burns A. F. and Mitchell W E. (1946): “Measuring Business Cycles”. NBER, Columbia
University Press.
5. Clements M.C. and Krolzig H.M. (2001): "Modelling Business Cycle Features Using
Switching Regime Models". Economics Series Working Papers 9958, University of Oxford,
Department of Economics.
6. Dimitrios Tsoukalas, (2006), “Macroeconomic Shocks in the cypriot economy and the
Emu-Area countries”. International Business & Economics Research Journal.Vol. 5, No.6.
7. Goldfeld S.M. and Quandt R.E. (1973a): “A Markov model for switching regressions”.
Journal of Econometrics, 1, 3-16.
8. Hamilton, J. D. (1989), “A new approach to the economic analysis of non-stationary time
series and the business cycle”. Econometrica, vol. 57, p. 357-384.
9. Krolzig H.M. (1997): “Markov-Switching Vector Autoregressions Modelling, Statistical
Inference, and Application to Business Cycle Analysis”.
10. Krolzig H.M. (1998): “Econometric Modelling of Markov-Switching Vector
Autoregressions using MSVAR for Ox”. Institute of Economics and Statistics and Nuffield
College, Oxford.
11. Levine R and Renelt D. (1992): “A sensitivity analysis of cross-country growth
regressions”. American Economic Review, 82, 942-963.
12. Mansor H Ibrahim (2003): “International disturbances and domestic macroeconomic
fluctuations in Malaysia”. ASEAN Economic Bulletin; Apr 2003; 20, 1; ABI/INFORM
Global.
13. Moreira R. R., Chaiboonsri Ch. and Chaitp P. (2013): “Relationships between effective and
expected interest rates as a transmission mechanism for monetary policy: Evidence on the
Brazilian economy using MS-models and bayesian VAR”. Procedia Economics and
Finance, 5, 562-570.
14. Odia Ndongo and Yves Francis (2007): “Les sources des fluctuations macroéconomiques
au Cameroun”. MPRA Paper No. 1308, posted 07.
15. Philip R. L. and Gian Maria M. F. (2006): “The External Wealth of Nations Mark II:
Revised and Extended Estimates of Foreign Assets and Liabilities, 1970–2004”.
International Monetary Fund WP/06/69
16. Philip R. Lane and Gian Maria Milesi-Ferretti (2007): “The external wealth of nations mark
II: Revised and extended estimates of foreign assets and liabilities, 1970–2004”. Journal of
International Economics 73, November, 223-250.
17. Plosser C. (1992): “The search for growth in policies for long-run economic growth”.
Federal Reserve Bank of Kansas City, Kansas City, MO.
18. Rzigui Lotfi (2005): “External shocks and economic fluctuations: evidence from Tunisia”.
MPRA Paper No. 630, posted 07.
19. Simo-Kengne B. D., Balcilar M., Gupta R., Reid M. and Aye G. C. (2013): “Is the
relationship between monetary policy and house prices asymmetric across bull and bear
markets in South Africa? Evidence from a Markov-switching vector autoregressive model”.
Economic Modelling, 32, 161-171.
20. Sims Christopher A, (1980): "Macroeconomics and Reality," Econometrica, Econometric
Society, vol. 48(1), pages 1-48, January.
58th International Scientific Conference on Economic and Social Development – Budapest, 04-05 September, 2020
98
CYBERCRIME AND PROTECTION OF BUSINESS INFORMATION IN
TOURISM INDUSTRY- CROATIAN PERSPECTIVE
Vlatka Ruzic
Polytechnic “Nikola Tesla” Gospić, Croatia
Dario Matika
University professor, Croatian Military Academy “Dr. Franjo Tuđman”, Croatia
ABSTRACT
This paper investigates the effects of cybercrime security threats on business entities in tourism
in Croatia in terms of safety of business information. Cybercrime is a real threat to business
processes in general, and since Croatia is a country where tourism accounts for 20% of GDP
and there are no exact statistics about the impact of cybercrime on business information on
tourism in Croatia, it was important to research this topic. The paper shows that computer
crime has risen trend while at the same time the number of other crimes in Croatia declines; In
the period of five years, computer crime trend in Croatia has doubled (from 1,63% in 2015 to
3,49% in 2019); at the same time when we compare 2019 to 2018, numbers show that cyber
crimes in Croatia increased by 87,3 per cent. Results of a conducted survey on a sample of five
and four star hotels and five and four star campsites in Croatia show that managers of business
entities in tourism know where to look for reliable information in order to make a good and
quality decision on reasonable cybercrime protection of business information, as well as that
managers of business entities in tourism are sufficiently informed about security procedures
when using the Internet, laptops, office phone and e-mail system in terms of a reasonable
cybercrime protection of business information. Surprisingly, the research also showed that
there is a discrepancy between the willingness of managers to protect business data from cyber
attacks and the relevance of business entities' documents that prescribe it. Limitations of
research are manifested in sample size, relatively short research period and focus on certain
destinations.
Keywords: business information, Croatia, cybercrime, tourism
1. INTRODUCTION
Although it seems obvious that security threats affect tourism, security researches suggest that
tourists prefer to travel to countries with similar levels of safety and security as exist in their
origin country (Foury et al, 2020; 2017). It could be therefore expected that tourists also expect
the level of security of their personal data to be at the same level when they are involved in
tourism activities. On the other side, organisations are aware of the threats to information
systems security, in particular cyber attacks (Choo, 2011; 727-728) and the infringement of
confidential data (Shabtai et al, 2012; 39-46). Security of the business information in tourism
in general, Croatia included, has not been thoroughly investigated and it is mostly difficult to
isolate the data from the general data compression (both on cybercrime and on the security of
business information in general). All of the previous researches have been significantly focused
on the technical controls of information security (Venter et al., 2003., Cavusoglu et al., 2009),
and it is often argued that, as opposed from today, early information systems’ security studies
approach perceptions of security from a technology acceptance angle (Hu et al., 2007).
However, experts growingly argue that the main cause of information security incidents lies
mainly with employees’ behavioural factors rather than technical issues per se, which implies
a turn to internal problems attributed to the users of information systems (Dhillon et al, 2000,
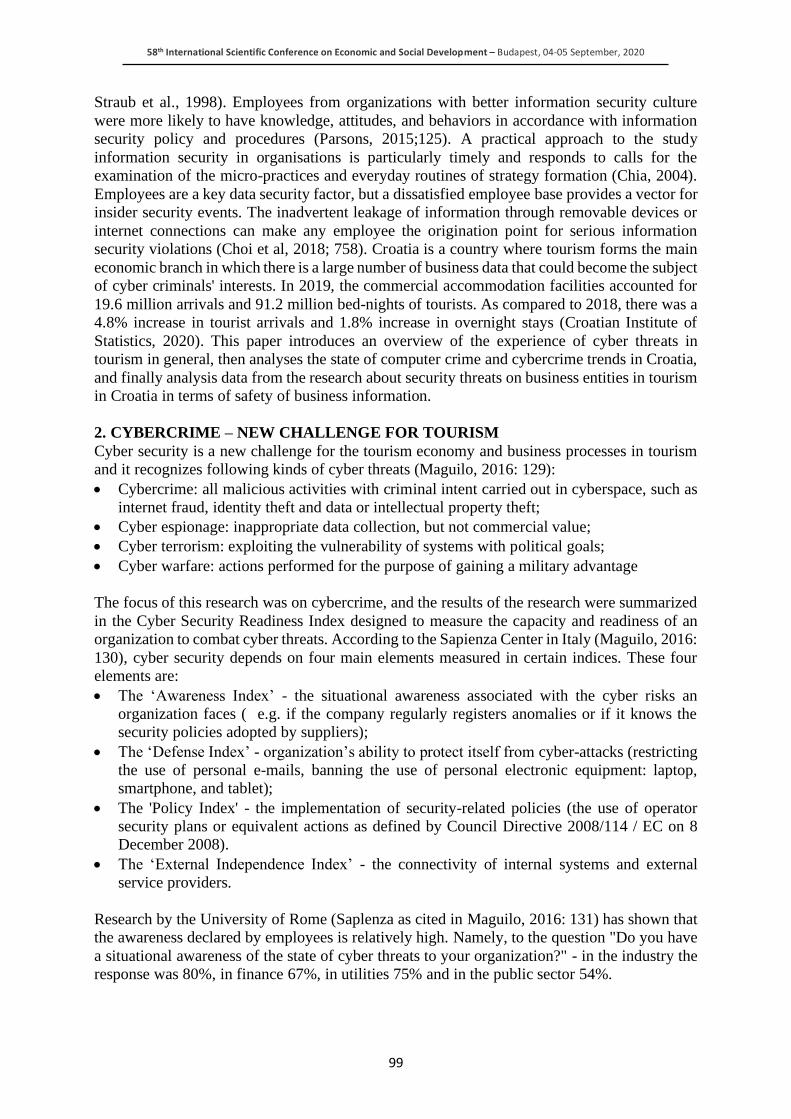
58th International Scientific Conference on Economic and Social Development – Budapest, 04-05 September, 2020
99
Straub et al., 1998). Employees from organizations with better information security culture
were more likely to have knowledge, attitudes, and behaviors in accordance with information
security policy and procedures (Parsons, 2015;125). A practical approach to the study
information security in organisations is particularly timely and responds to calls for the
examination of the micro-practices and everyday routines of strategy formation (Chia, 2004).
Employees are a key data security factor, but a dissatisfied employee base provides a vector for
insider security events. The inadvertent leakage of information through removable devices or
internet connections can make any employee the origination point for serious information
security violations (Choi et al, 2018; 758). Croatia is a country where tourism forms the main
economic branch in which there is a large number of business data that could become the subject
of cyber criminals' interests. In 2019, the commercial accommodation facilities accounted for
19.6 million arrivals and 91.2 million bed-nights of tourists. As compared to 2018, there was a
4.8% increase in tourist arrivals and 1.8% increase in overnight stays (Croatian Institute of
Statistics, 2020). This paper introduces an overview of the experience of cyber threats in
tourism in general, then analyses the state of computer crime and cybercrime trends in Croatia,
and finally analysis data from the research about security threats on business entities in tourism
in Croatia in terms of safety of business information.
2. CYBERCRIME – NEW CHALLENGE FOR TOURISM
Cyber security is a new challenge for the tourism economy and business processes in tourism
and it recognizes following kinds of cyber threats (Maguilo, 2016: 129):
• Cybercrime: all malicious activities with criminal intent carried out in cyberspace, such as
internet fraud, identity theft and data or intellectual property theft;
• Cyber espionage: inappropriate data collection, but not commercial value;
• Cyber terrorism: exploiting the vulnerability of systems with political goals;
• Cyber warfare: actions performed for the purpose of gaining a military advantage
The focus of this research was on cybercrime, and the results of the research were summarized
in the Cyber Security Readiness Index designed to measure the capacity and readiness of an
organization to combat cyber threats. According to the Sapienza Center in Italy (Maguilo, 2016:
130), cyber security depends on four main elements measured in certain indices. These four
elements are:
• The ‘Awareness Index’ - the situational awareness associated with the cyber risks an
organization faces ( e.g. if the company regularly registers anomalies or if it knows the
security policies adopted by suppliers);
• The ‘Defense Index’ - organization’s ability to protect itself from cyber-attacks (restricting
the use of personal e-mails, banning the use of personal electronic equipment: laptop,
smartphone, and tablet);
• The 'Policy Index' - the implementation of security-related policies (the use of operator
security plans or equivalent actions as defined by Council Directive 2008/114 / EC on 8
December 2008).
• The ‘External Independence Index’ - the connectivity of internal systems and external
service providers.
Research by the University of Rome (Saplenza as cited in Maguilo, 2016: 131) has shown that
the awareness declared by employees is relatively high. Namely, to the question "Do you have
a situational awareness of the state of cyber threats to your organization?" - in the industry the
response was 80%, in finance 67%, in utilities 75% and in the public sector 54%.
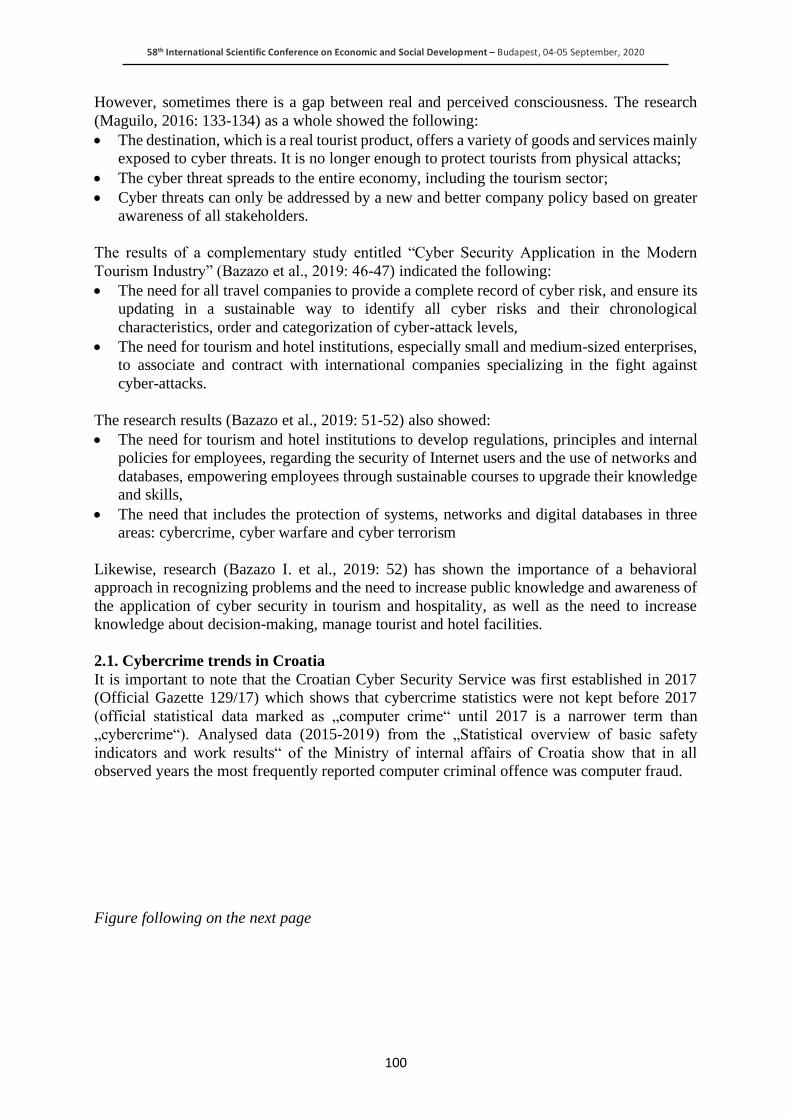
58th International Scientific Conference on Economic and Social Development – Budapest, 04-05 September, 2020
100
However, sometimes there is a gap between real and perceived consciousness. The research
(Maguilo, 2016: 133-134) as a whole showed the following:
• The destination, which is a real tourist product, offers a variety of goods and services mainly
exposed to cyber threats. It is no longer enough to protect tourists from physical attacks;
• The cyber threat spreads to the entire economy, including the tourism sector;
• Cyber threats can only be addressed by a new and better company policy based on greater
awareness of all stakeholders.
The results of a complementary study entitled “Cyber Security Application in the Modern
Tourism Industry” (Bazazo et al., 2019: 46-47) indicated the following:
• The need for all travel companies to provide a complete record of cyber risk, and ensure its
updating in a sustainable way to identify all cyber risks and their chronological
characteristics, order and categorization of cyber-attack levels,
• The need for tourism and hotel institutions, especially small and medium-sized enterprises,
to associate and contract with international companies specializing in the fight against
cyber-attacks.
The research results (Bazazo et al., 2019: 51-52) also showed:
• The need for tourism and hotel institutions to develop regulations, principles and internal
policies for employees, regarding the security of Internet users and the use of networks and
databases, empowering employees through sustainable courses to upgrade their knowledge
and skills,
• The need that includes the protection of systems, networks and digital databases in three
areas: cybercrime, cyber warfare and cyber terrorism
Likewise, research (Bazazo I. et al., 2019: 52) has shown the importance of a behavioral
approach in recognizing problems and the need to increase public knowledge and awareness of
the application of cyber security in tourism and hospitality, as well as the need to increase
knowledge about decision-making, manage tourist and hotel facilities.
2.1. Cybercrime trends in Croatia
It is important to note that the Croatian Cyber Security Service was first established in 2017
(Official Gazette 129/17) which shows that cybercrime statistics were not kept before 2017
(official statistical data marked as „computer crime“ until 2017 is a narrower term than
„cybercrime“). Analysed data (2015-2019) from the „Statistical overview of basic safety
indicators and work results“ of the Ministry of internal affairs of Croatia show that in all
observed years the most frequently reported computer criminal offence was computer fraud.
Figure following on the next page
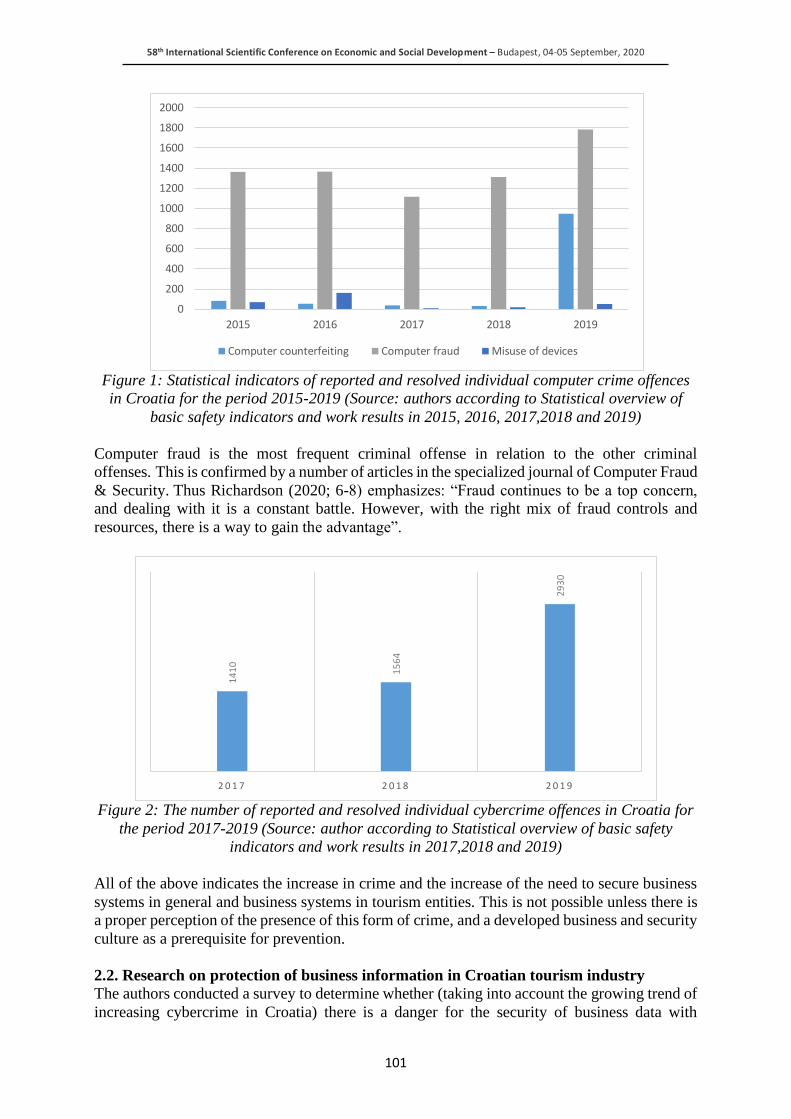
58th International Scientific Conference on Economic and Social Development – Budapest, 04-05 September, 2020
101
Figure 1: Statistical indicators of reported and resolved individual computer crime offences
in Croatia for the period 2015-2019 (Source: authors according to Statistical overview of
basic safety indicators and work results in 2015, 2016, 2017,2018 and 2019)
Computer fraud is the most frequent criminal offense in relation to the other criminal
offenses. This is confirmed by a number of articles in the specialized journal of Computer Fraud
& Security. Thus Richardson (2020; 6-8) emphasizes: “Fraud continues to be a top concern,
and dealing with it is a constant battle. However, with the right mix of fraud controls and
resources, there is a way to gain the advantage”.
Figure 2: The number of reported and resolved individual cybercrime offences in Croatia for
the period 2017-2019 (Source: author according to Statistical overview of basic safety
indicators and work results in 2017,2018 and 2019)
All of the above indicates the increase in crime and the increase of the need to secure business
systems in general and business systems in tourism entities. This is not possible unless there is
a proper perception of the presence of this form of crime, and a developed business and security
culture as a prerequisite for prevention.
2.2. Research on protection of business information in Croatian tourism industry
The authors conducted a survey to determine whether (taking into account the growing trend of
increasing cybercrime in Croatia) there is a danger for the security of business data with
0
200
400
600
800
1000
1200
1400
1600
1800
2000
2015 2016 2017 2018 2019
Computer counterfeiting Computer fraud Misuse of devices
14
10
15
64
29
30
2 0 1 7 2 0 1 8 2 0 1 9
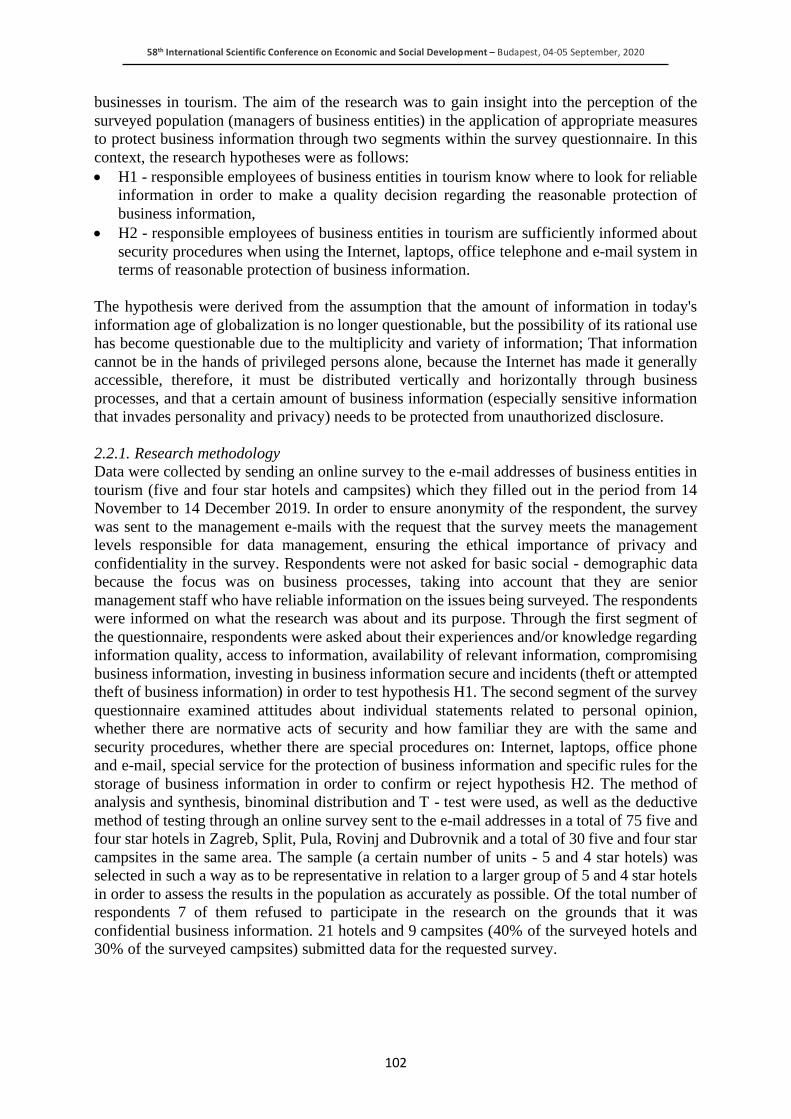
58th International Scientific Conference on Economic and Social Development – Budapest, 04-05 September, 2020
102
businesses in tourism. The aim of the research was to gain insight into the perception of the
surveyed population (managers of business entities) in the application of appropriate measures
to protect business information through two segments within the survey questionnaire. In this
context, the research hypotheses were as follows:
• H1 - responsible employees of business entities in tourism know where to look for reliable
information in order to make a quality decision regarding the reasonable protection of
business information,
• H2 - responsible employees of business entities in tourism are sufficiently informed about
security procedures when using the Internet, laptops, office telephone and e-mail system in
terms of reasonable protection of business information.
The hypothesis were derived from the assumption that the amount of information in today's
information age of globalization is no longer questionable, but the possibility of its rational use
has become questionable due to the multiplicity and variety of information; That information
cannot be in the hands of privileged persons alone, because the Internet has made it generally
accessible, therefore, it must be distributed vertically and horizontally through business
processes, and that a certain amount of business information (especially sensitive information
that invades personality and privacy) needs to be protected from unauthorized disclosure.
2.2.1. Research methodology
Data were collected by sending an online survey to the e-mail addresses of business entities in
tourism (five and four star hotels and campsites) which they filled out in the period from 14
November to 14 December 2019. In order to ensure anonymity of the respondent, the survey
was sent to the management e-mails with the request that the survey meets the management
levels responsible for data management, ensuring the ethical importance of privacy and
confidentiality in the survey. Respondents were not asked for basic social - demographic data
because the focus was on business processes, taking into account that they are senior
management staff who have reliable information on the issues being surveyed. The respondents
were informed on what the research was about and its purpose. Through the first segment of
the questionnaire, respondents were asked about their experiences and/or knowledge regarding
information quality, access to information, availability of relevant information, compromising
business information, investing in business information secure and incidents (theft or attempted
theft of business information) in order to test hypothesis H1. The second segment of the survey
questionnaire examined attitudes about individual statements related to personal opinion,
whether there are normative acts of security and how familiar they are with the same and
security procedures, whether there are special procedures on: Internet, laptops, office phone
and e-mail, special service for the protection of business information and specific rules for the
storage of business information in order to confirm or reject hypothesis H2. The method of
analysis and synthesis, binominal distribution and T - test were used, as well as the deductive
method of testing through an online survey sent to the e-mail addresses in a total of 75 five and
four star hotels in Zagreb, Split, Pula, Rovinj and Dubrovnik and a total of 30 five and four star
campsites in the same area. The sample (a certain number of units - 5 and 4 star hotels) was
selected in such a way as to be representative in relation to a larger group of 5 and 4 star hotels
in order to assess the results in the population as accurately as possible. Of the total number of
respondents 7 of them refused to participate in the research on the grounds that it was
confidential business information. 21 hotels and 9 campsites (40% of the surveyed hotels and
30% of the surveyed campsites) submitted data for the requested survey.
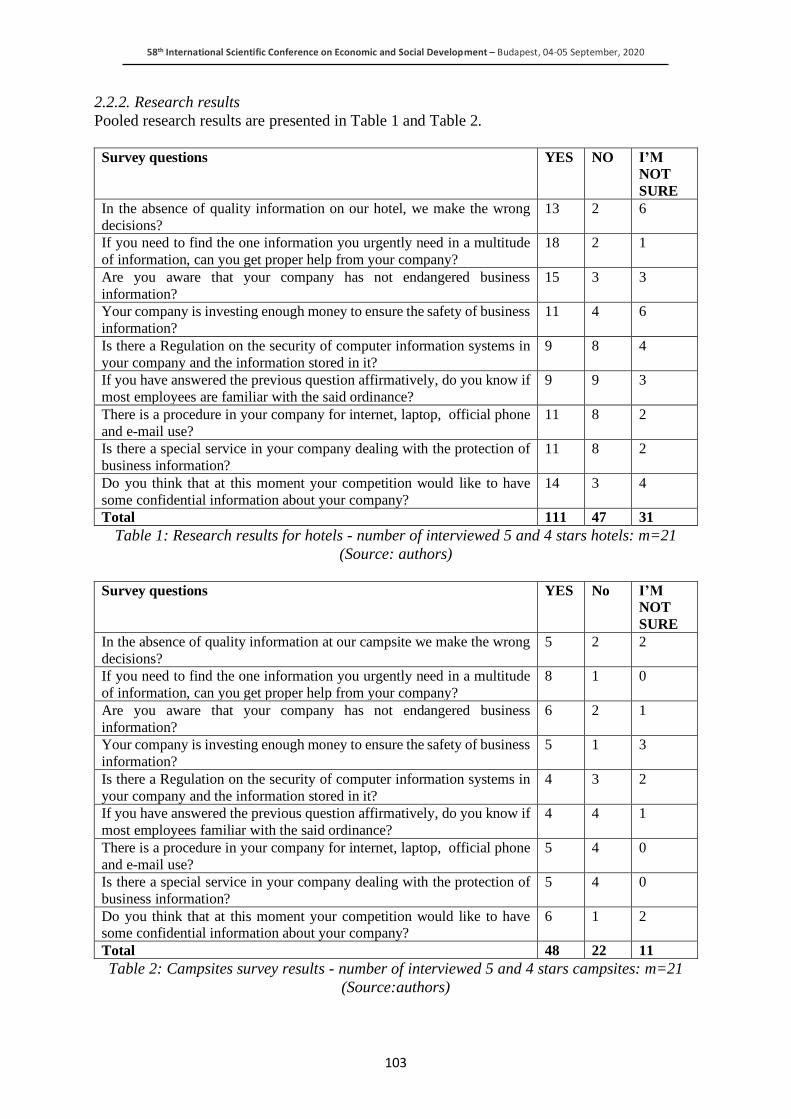
58th International Scientific Conference on Economic and Social Development – Budapest, 04-05 September, 2020
103
2.2.2. Research results
Pooled research results are presented in Table 1 and Table 2.
Survey questions YES NO I’M
NOT
SURE
In the absence of quality information on our hotel, we make the wrong
decisions?
13 2 6
If you need to find the one information you urgently need in a multitude
of information, can you get proper help from your company?
18 2 1
Are you aware that your company has not endangered business
information?
15 3 3
Your company is investing enough money to ensure the safety of business
information?
11 4 6
Is there a Regulation on the security of computer information systems in
your company and the information stored in it?
9 8 4
If you have answered the previous question affirmatively, do you know if
most employees are familiar with the said ordinance?
9 9 3
There is a procedure in your company for internet, laptop, official phone
and e-mail use?
11 8 2
Is there a special service in your company dealing with the protection of
business information?
11 8 2
Do you think that at this moment your competition would like to have
some confidential information about your company?
14 3 4
Total 111 47 31
Table 1: Research results for hotels - number of interviewed 5 and 4 stars hotels: m=21
(Source: authors)
Survey questions YES No I’M
NOT
SURE
In the absence of quality information at our campsite we make the wrong
decisions?
5 2 2
If you need to find the one information you urgently need in a multitude
of information, can you get proper help from your company?
8 1 0
Are you aware that your company has not endangered business
information?
6 2 1
Your company is investing enough money to ensure the safety of business
information?
5 1 3
Is there a Regulation on the security of computer information systems in
your company and the information stored in it?
4 3 2
If you have answered the previous question affirmatively, do you know if
most employees familiar with the said ordinance?
4 4 1
There is a procedure in your company for internet, laptop, official phone
and e-mail use?
5 4 0
Is there a special service in your company dealing with the protection of
business information?
5 4 0
Do you think that at this moment your competition would like to have some confidential information about your company?
6 1 2
Total 48 22 11
Table 2: Campsites survey results - number of interviewed 5 and 4 stars campsites: m=21
(Source:authors)
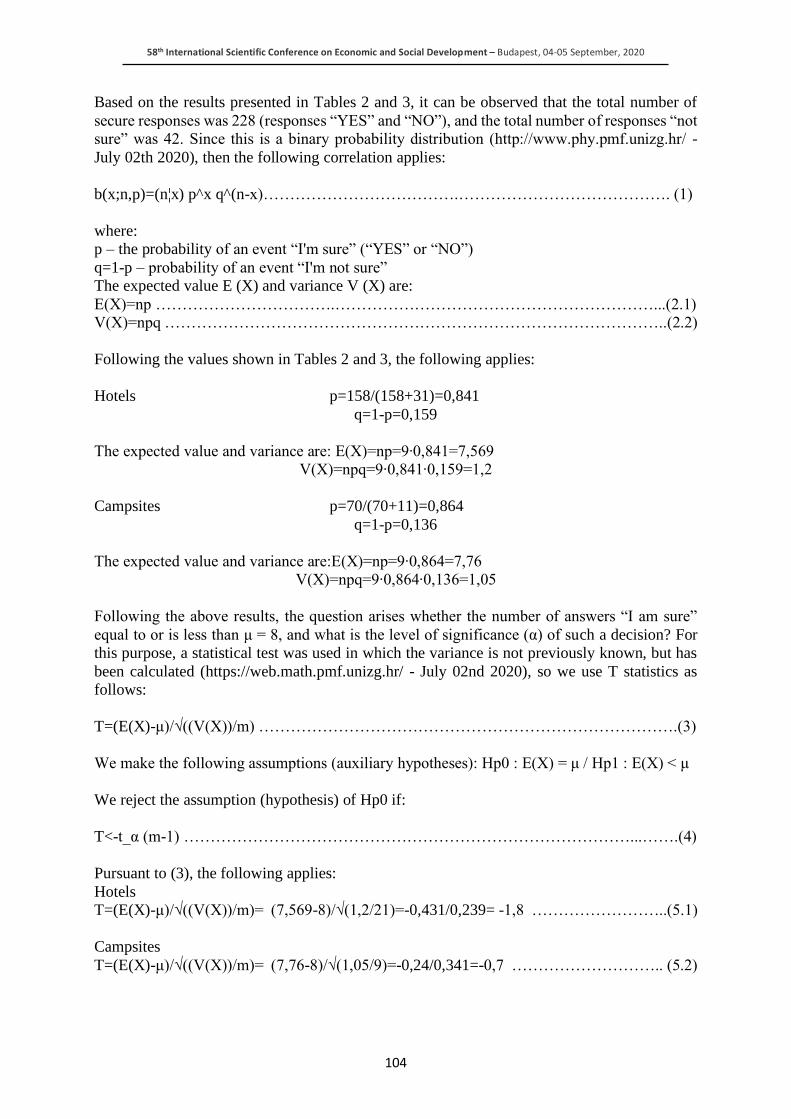
58th International Scientific Conference on Economic and Social Development – Budapest, 04-05 September, 2020
104
Based on the results presented in Tables 2 and 3, it can be observed that the total number of
secure responses was 228 (responses “YES” and “NO”), and the total number of responses “not
sure” was 42. Since this is a binary probability distribution (http://www.phy.pmf.unizg.hr/ -
July 02th 2020), then the following correlation applies:
b(x;n,p)=(n¦x) p^x q^(n-x)……………………………….…………………………………. (1)
where:
p – the probability of an event “I'm sure” (“YES” or “NO”)
q=1-p – probability of an event “I'm not sure”
The expected value E (X) and variance V (X) are:
E(X)=np …………………………….……………………………………………………...(2.1)
V(X)=npq …………………………………………………………………………………..(2.2)
Following the values shown in Tables 2 and 3, the following applies:
Hotels p=158/(158+31)=0,841
q=1-p=0,159
The expected value and variance are: E(X)=np=9∙0,841=7,569
V(X)=npq=9∙0,841∙0,159=1,2
Campsites p=70/(70+11)=0,864
q=1-p=0,136
The expected value and variance are:E(X)=np=9∙0,864=7,76
V(X)=npq=9∙0,864∙0,136=1,05
Following the above results, the question arises whether the number of answers “I am sure”
equal to or is less than μ = 8, and what is the level of significance (α) of such a decision? For
this purpose, a statistical test was used in which the variance is not previously known, but has
been calculated (https://web.math.pmf.unizg.hr/ - July 02nd 2020), so we use T statistics as
follows:
T=(E(X)-μ)/√((V(X))/m) …………………………………………………………………….(3)
We make the following assumptions (auxiliary hypotheses): Hp0 : E(X) = μ / Hp1 : E(X) < μ
We reject the assumption (hypothesis) of Hp0 if:
T<-t_α (m-1) …………………………………………………………………………...…….(4)
Pursuant to (3), the following applies:
Hotels
T=(E(X)-μ)/√((V(X))/m)= (7,569-8)/√(1,2/21)=-0,431/0,239= -1,8 ……………………..(5.1)
Campsites
T=(E(X)-μ)/√((V(X))/m)= (7,76-8)/√(1,05/9)=-0,24/0,341=-0,7 ……………………….. (5.2)
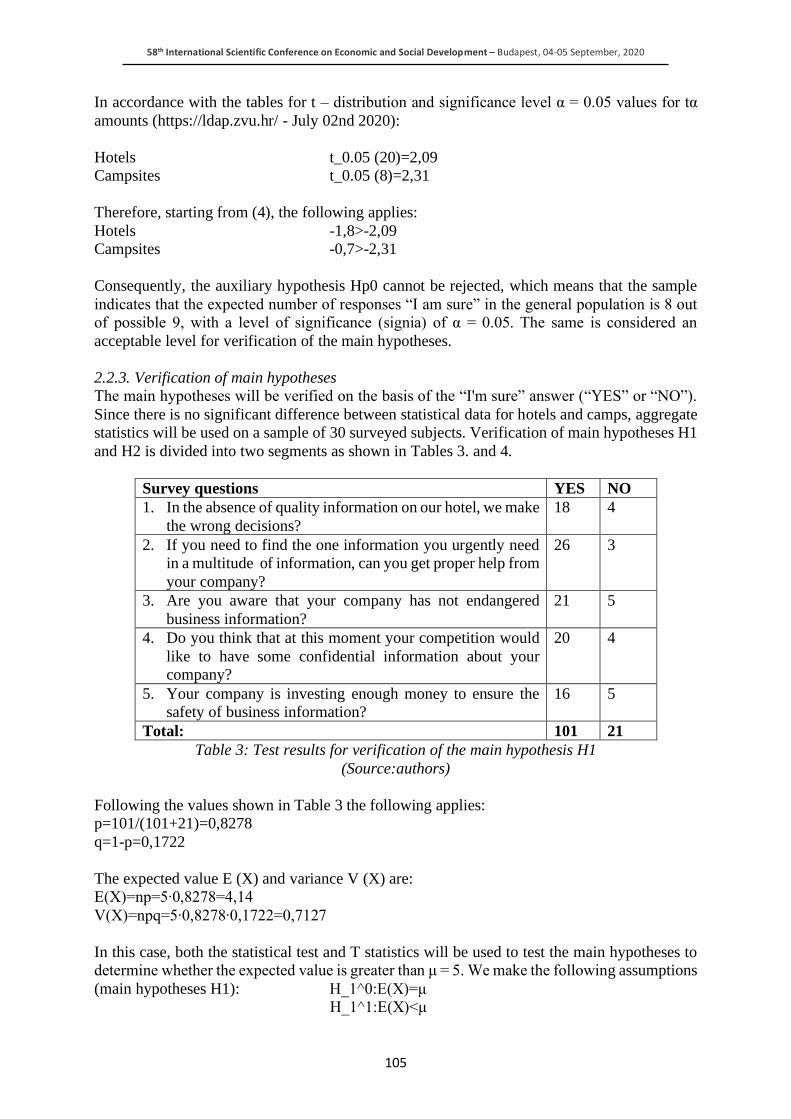
58th International Scientific Conference on Economic and Social Development – Budapest, 04-05 September, 2020
105
In accordance with the tables for t – distribution and significance level α = 0.05 values for tα
amounts (https://ldap.zvu.hr/ - July 02nd 2020):
Hotels t_0.05 (20)=2,09
Campsites t_0.05 (8)=2,31
Therefore, starting from (4), the following applies:
Hotels -1,8>-2,09
Campsites -0,7>-2,31
Consequently, the auxiliary hypothesis Hp0 cannot be rejected, which means that the sample
indicates that the expected number of responses “I am sure” in the general population is 8 out
of possible 9, with a level of significance (signia) of α = 0.05. The same is considered an
acceptable level for verification of the main hypotheses.
2.2.3. Verification of main hypotheses
The main hypotheses will be verified on the basis of the “I'm sure” answer (“YES” or “NO”).
Since there is no significant difference between statistical data for hotels and camps, aggregate
statistics will be used on a sample of 30 surveyed subjects. Verification of main hypotheses H1
and H2 is divided into two segments as shown in Tables 3. and 4.
Survey questions YES NO
1. In the absence of quality information on our hotel, we make
the wrong decisions?
18 4
2. If you need to find the one information you urgently need
in a multitude of information, can you get proper help from
your company?
26 3
3. Are you aware that your company has not endangered
business information?
21 5
4. Do you think that at this moment your competition would
like to have some confidential information about your
company?
20 4
5. Your company is investing enough money to ensure the
safety of business information?
16 5
Total: 101 21
Table 3: Test results for verification of the main hypothesis H1
(Source:authors)
Following the values shown in Table 3 the following applies:
p=101/(101+21)=0,8278
q=1-p=0,1722
The expected value E (X) and variance V (X) are:
E(X)=np=5∙0,8278=4,14
V(X)=npq=5∙0,8278∙0,1722=0,7127
In this case, both the statistical test and T statistics will be used to test the main hypotheses to
determine whether the expected value is greater than μ = 5. We make the following assumptions
(main hypotheses H1): H_1^0:E(X)=μ
H_1^1:E(X)<μ
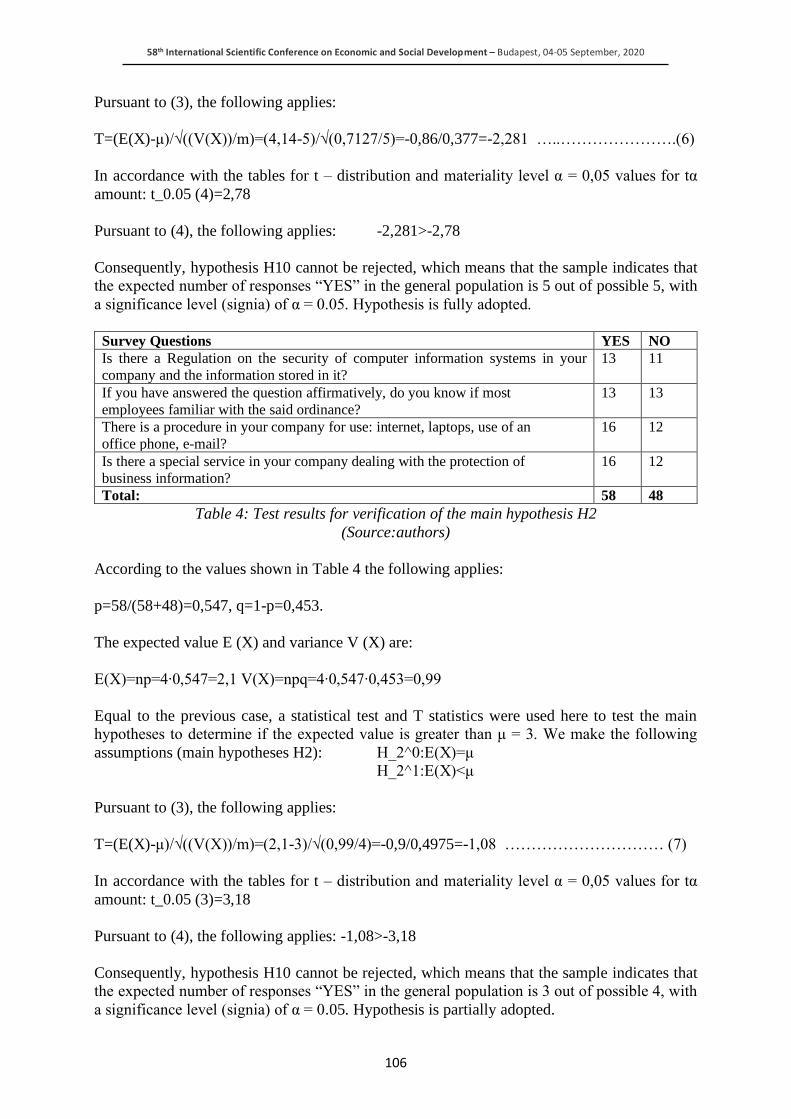
58th International Scientific Conference on Economic and Social Development – Budapest, 04-05 September, 2020
106
Pursuant to (3), the following applies:
T=(E(X)-μ)/√((V(X))/m)=(4,14-5)/√(0,7127/5)=-0,86/0,377=-2,281 …..………………….(6)
In accordance with the tables for t – distribution and materiality level α = 0,05 values for tα
amount: t_0.05 (4)=2,78
Pursuant to (4), the following applies: -2,281>-2,78
Consequently, hypothesis H10 cannot be rejected, which means that the sample indicates that
the expected number of responses “YES” in the general population is 5 out of possible 5, with
a significance level (signia) of α = 0.05. Hypothesis is fully adopted.
Survey Questions YES NO
Is there a Regulation on the security of computer information systems in your
company and the information stored in it?
13 11
If you have answered the question affirmatively, do you know if most
employees familiar with the said ordinance?
13 13
There is a procedure in your company for use: internet, laptops, use of an
office phone, e-mail?
16 12
Is there a special service in your company dealing with the protection of
business information?
16 12
Total: 58 48
Table 4: Test results for verification of the main hypothesis H2
(Source:authors)
According to the values shown in Table 4 the following applies:
p=58/(58+48)=0,547, q=1-p=0,453.
The expected value E (X) and variance V (X) are:
E(X)=np=4∙0,547=2,1 V(X)=npq=4∙0,547∙0,453=0,99
Equal to the previous case, a statistical test and T statistics were used here to test the main
hypotheses to determine if the expected value is greater than μ = 3. We make the following
assumptions (main hypotheses H2): H_2^0:E(X)=μ
H_2^1:E(X)<μ
Pursuant to (3), the following applies:
T=(E(X)-μ)/√((V(X))/m)=(2,1-3)/√(0,99/4)=-0,9/0,4975=-1,08 ………………………… (7)
In accordance with the tables for t – distribution and materiality level α = 0,05 values for tα
amount: t_0.05 (3)=3,18
Pursuant to (4), the following applies: -1,08>-3,18
Consequently, hypothesis H10 cannot be rejected, which means that the sample indicates that
the expected number of responses “YES” in the general population is 3 out of possible 4, with
a significance level (signia) of α = 0.05. Hypothesis is partially adopted.
58th International Scientific Conference on Economic and Social Development – Budapest, 04-05 September, 2020
107
2.2.4. Research limitations
Research limitations are reflected primarily in the size of the sample, available financial
resources, relatively short research time, focusing on certain destinations, as well as the time
when the research can affect the results. The implementation of further research will certainly
be necessary, because it is an insufficiently explored problem, a growing threat and because
there is a need for greater awareness of both business entities in the tourism industry and persons
responsible (including at the level of personal safety), of the growing challenge of cybercrime
and its impact on the business process in tourism.
3. CONCLUSION
The field of information security has increasingly acknowledged the importance of studying
the human issues as well as technical elements of information security (Parsons, 2015; 127).
This paper highlights some of the complex issues that can influence human behavior and the
complicated relationships between these variables, and it also demonstrates that further research
is required to adequately understand the human factors of information security in tourism and
information security decision making. The scientific contribution of the paper is evident from
the fact that the results from our analysis could be useful for public and private sector initiatives
in measuring the risk of business information security in tourism, especially in tourist countries
like Croatia. The conducted research has shown that the hypothesis H1 is completely adopted -
responsible employees of business entities in tourism know where to look for reliable
information in order to make a quality decision on the reasonable protection of business
information, while H2 hypothesis are partially adopted - responsible employees of business
entities in tourism are only partially sufficiently informed about security procedures when using
the Internet, laptops, office phone and e-mail system in terms of reasonable protection of
business data (in testing hypothesis H2 a discrepancy between the willingness of managers to
protect business data from cyber attacks and the relevance of business entities' documents that
prescribe it is noticeable). One limitation of our research is data availability while the sample
size is considerably reduced when cybercrime variables are included in the analysis. To
conclude, it is important to use behavioral approach in recognizing problems and the need to
increase public knowledge and awareness of the application of cyber security in tourism and
hospitality, as well as the need to increase knowledge about decision-making, manage tourist
and hotel facilities. In terms of future research, the recommendation was to identify different
cyber security tools and techniques, which could be of interest to tourism, especially those
related to cyber risk insurance in airlines, catering and tourism offices. Therefore, the
development and encouragement of scientists in research in the field of malware analysis,
digital evidence analysis, and in the field of protection and security of tourist database systems
in the field of artificial intelligence and the Internet are encouraged.
LITERATURE:
1. Bazazo I. et al. (2019), Cyber Security Application in the Modern Tourism Industry. Journal
of Tourism, Hospitality and Sport, Vol. 43; pp 46-55
2. Cavusoglu, H, Raghunathan, S, Cavusoglu, H. (2009). Configuration of and interaction
between information security technologies: the case of firewalls and intrusion detection
systems. Information Systems Research, Researchgate, 20(2): 198–217.
3. Chia, R. (2004). Strategy-as-practice: reflections on the research agenda. University of
Bath, European Management Review (1): 29–34.
4. Choi,S., Martins, J.T., Bernik I. ( 2018). Information security: listening to the percpective
of organizational insiders. SAGE. Journal of Information Science, vol. 44, 6: pp. 752-767.
5. Choo, K.K. (2011). The cyber threat landscape: challenges and future research directions.
Computer and Security, Elsevier 30(8): 719–731.
58th International Scientific Conference on Economic and Social Development – Budapest, 04-05 September, 2020
108
6. COUNCIL DIRECTIVE 2008/114/EC (2008) COUNCIL DIRECTIVE 2008/114/EC of 8
December 2008 on the identification and designation of European critical infrastructures
and the assessment of the need to improve their protection, Official Journal of the European
Union, 2008/114. Retrieved 11.08.2020. from https://eur-lex.europa.eu/
LexUriServ/LexUriServ.do?uri=OJ:L:2008:345:0075:0082:EN:PDF)
7. Dhillon, G, Backhouse, J. (2000). Technical opinion: information system security
management in the new millennium. Researchgate. Communications of the ACM, 43(7):
125–128.
8. Fourie, J., Rosello-Nadal, J.,Santana- Gallego, M. (2020). Fatal Attraction: How Security
Threats Hurt Tourism. Journal of Travel research, SAGE, vol 59(2) 209-219.
9. Hu, Q, Hart, P, Cooke, D. (2007). The role of external and internal influences on
information systems security: a neo-institutional perspective. Journal of Strategic
Information Systems, Elsevier, 16(2): 153–172.
10. Maguilo A. (2016). Cyber Security an Tourism Competitiveness. EJTHR, Journal of
Hospitality and Tourism Reserch, 7(2):128-134.
11. Parsons, K.M.,Young, E., Butavicius, M.A., McCormac, A., Pattison, M.R., Jerram, C.
(2015). The influence of organisational information security culture on information security
decision making. Journal of Cognitive Engineering and Decision Making 117-129 vol. 9, 2:
pp. 117-129.
12. Regulation ( 2017) Regulation on Amendments to the Regulation on Internal Organization
of the Ministry of the Interior, Official Gazette 129/17. Retrieved 17.08.2020. from
https://narodne-novine.nn.hr/clanci/sluzbeni/2017_12_129_2947.html
13. Richardson, J. (2020). Is there a silver bullet to stop cybercrime? Journal of Computer
Fraud & Security, Elsevier, vol.20. issue 5, pp 6-8
14. Shabtai, A, Elovici, Y, Rokach, L.(2012) A survey of data leakage detection and prevention
solutions. Berlin: Springer.
15. Straub, DW, Welke, RJ. (1998). Coping with systems risk: security planning models for
management decision making. Researchgate. MIS Quarterly 22(4): 441–469.
16. Tourist arrivals and nights in 2019 (2020). First release, tourist arrivals and nights 2019.
Croatian Bureau of statistics, number 4.3.2. Retrieved 17.08.2020. from
https://www.dzs.hr/Hrv_Eng/publication/2019/04-03-02_01_2019.htm
17. Venter, H.S., Eloff, J.H. ( 2003). A taxonomy for information security technologies.
Elsevier. Computer Security, 22(4): 299–307.
58th International Scientific Conference on Economic and Social Development – Budapest, 04-05 September, 2020
109
THE RELATIONSHIP BETWEEN UNIVERSITY-INDUSTRY CO-
PUBLICATION OUTPUTS
Zsolt Kohus
Széchenyi István University, 9026 Győr, Egyetem tér 1, Hungary
Zoltan Baracskai
Széchenyi István University, 9026 Győr, Egyetem tér 1, Hungary
Katalin Czako
Széchenyi István University, 9026 Győr, Egyetem tér 1, Hungary
ABSTRACT
The response of universities to the regional needs has been most explicitly developed in the
area of research and innovation. The growth of public-private research collaboration has
created a demand for information for decision making, suggesting a set of different indicators
able to describe the current trends and outcomes of university-industry collaboration.
University-industry interaction is considered as a multifaceted phenomenon, and in some cases,
because of the lack of publicly accessible information, the measurement is impossible. Because
of the lack of necessary data describing university-industry cooperation and its outputs
(number and type of contracts with industrial partners, income from research-development
contract, number of licensed technologies, exchange of persons and researchers, involvement
of industrial partners in educational programs and trainings…), the aim of the present paper
is to partially overcome these problems and analyze university-industry interactions through
the co-publication output. To avoid the assumption that the number of joint papers is not a good
proxy of university-industry collaboration, we extended our analysis with the type of interaction
among different scientific fields (single interdisciplinary or transdisciplinary, based on the
OECD categorization). In this sense, our data analysis and data corrected with the interaction
among different scientific fields encompass a potential tool to investigate university-industry
cooperation outcomes. The chosen approach through Hungarian universities shows that even
in the lack of major indicators, the analysis of university-industry co-published papers in the
light of interplay between scientific disciplines could be a potential tool suitable to characterize
university-industry collaboration.
Keywords: University-industry cooperation, co-publication, disciplinary interplay
1. INTRODUCTION
In the modern society, the production and utilization of knowledge have become increasingly
important, and the concept of the third mission activity (TMA) of higher educational institutions
(HEI) has attracted more and more interest (Piirainen, Andersen & Andersen, 2016). The TMA,
in addition to the two fundamental missions – teaching and research activity – has appeared
since the 1900s, defined as all activities that HEIs perform in relation to their external
environment. These actions deal with social, and more importantly, the economic impact of
universities (Glaser, O’Shea & de Gery, 2014). The major “trigger” behind TMA is the
transformation of the economy to knowledge-based economy. Thus, universities provide the
necessary knowledge and innovation capacity for local and global businesses to be a
competitive partner in the business ecosystem, with special attention on innovation (Etzkowitz
& Leydesdorff, 1997; Laredo, 2007).
58th International Scientific Conference on Economic and Social Development – Budapest, 04-05 September, 2020
110
Therefore, universities, and within universities academicians, managers and decision makers
started to focus more on the role of HEIs in local and global businesses as well as on their
commitment to the community (Zomer & Benneworth, 2011). Universities are continuously
shifting from their traditional teaching and scientific knowledge providing role to a more
complex “entrepreneurial” university model, in order to incorporate commercialization of
created knowledge to their portfolio and actively contribute to the development of the local and
global region (Etzkowitz & Leydesdorff, 2000; Etkowitz, 2003). The interaction and
knowledge transfer between universities and industrial partners has been proven to be mutually
beneficial for both partners, including the potential increase of local and global economic
growth, (Yegros-Yegros et al., 2016), which, in turn, serves as a channel boosting exchange
and co-production of information, knowledge, and other resources (Perkmann & Walsh, 2007).
As described in the work of Ankrah & AL-Tabbaa (2015), university-industry collaboration
(UIC) corresponds to the interaction between any parts of HEIs and industry aiming mainly to
encourage knowledge and technology exchange (Bekker & Freitas, 2008; Siegel, Waldman, &
Link, 2003). Universities and industrial partners are increasingly recognizing the benefits of
collaboration and co-creation. On one hand, industrial partners are gradually utilizing open
innovation strategies to better incorporate relevant information enabling the cooperation with
universities. On the other hand, universities have begun to adopt advanced teaching and
research methods helping to rectify the challenges faced by industry and directly contribute to
economic success. Thus, the TMA has an extensive impact on the regional and global economic
growth and can be perceived as a driving force of UIC (Glaser, O’Shea & de Gery, 2014). As
reviewed by Ankrah and Al-Tabbaa (2015); Franco & Haase (2015); Tijssen, Yegros &
Winnink (2016); Yegros-Yegros et al. (2016) and Rybnicek & Königsgruber (2019), UIC has
a long tradition and play a significant role in the economic growth of the knowledge-based
societies. The UIC represent a significant support of TMA, particularly in the research,
development and innovation dimension, when both HEI and industry representatives set out to
define common vision and goals (Piirainen, Andersen & Andersen, 2016). Based on the work
of Santoro and Chakrabarti (2002) and Wong & Singh (2013), the collaboration between HEIs
and industry may be categorized into four different components based on the degree of
interactivity and specificity of focus. The first category, research support, is the lowest degree
of interactivity and is characterized by direct financial or equipment contribution from the
industrial partner. The cooperative research shows higher degree of interactivity and specificity
through contract research or consultancy, when HEIs solve the problem of industrial partners
through fixed conditions. The knowledge transfer includes ongoing personal interactions,
cooperative education, characterized by more interactive but less focused interactions. Finally,
the technology transfer is highly interactive and more focused compared to previous three
categories, and is responding to specific industry issues through commercialization of
university-based knowledge. In addition, D’Este et el. (2019) proposed an analytical framework
to provide a comprehensive map of the diversity of University-Industry links. They categorized
this interaction based on two critical dimensions: the type of contractual agreement and the
degree of specificity. The type of contractual agreement refers to the extent to which UICs are
governed by frequent and personal-based relationships; and to the extent of tacit and codified
knowledge exchange. A crucial driver of this collaboration is the market, triggering knowledge
commercialization. Jensen & Thursby (2001) confirmed that these market-mediated activities
often require the direct involvement of inventors and technology-transfer offices from the
university. The common goal is to commercialize the technology. The type of goal specificity
can be described by a situation when a university researcher, based on frequent interactions
with industrial partners, reflects on the targeted industry needs. The cooperation can be
manifested in a Research & Development agreement or contract, when the industrial partner,
based on the expertise and knowledge of researchers, defines the goals.
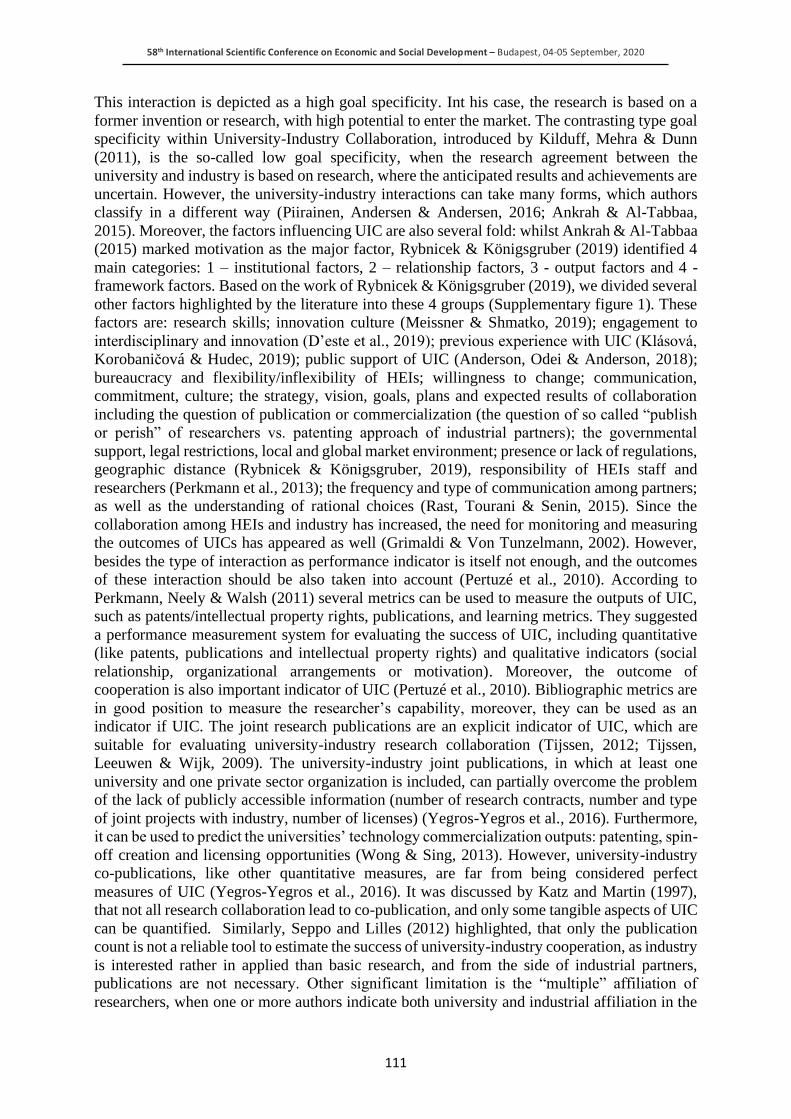
58th International Scientific Conference on Economic and Social Development – Budapest, 04-05 September, 2020
111
This interaction is depicted as a high goal specificity. Int his case, the research is based on a
former invention or research, with high potential to enter the market. The contrasting type goal
specificity within University-Industry Collaboration, introduced by Kilduff, Mehra & Dunn
(2011), is the so-called low goal specificity, when the research agreement between the
university and industry is based on research, where the anticipated results and achievements are
uncertain. However, the university-industry interactions can take many forms, which authors
classify in a different way (Piirainen, Andersen & Andersen, 2016; Ankrah & Al-Tabbaa,
2015). Moreover, the factors influencing UIC are also several fold: whilst Ankrah & Al-Tabbaa
(2015) marked motivation as the major factor, Rybnicek & Königsgruber (2019) identified 4
main categories: 1 – institutional factors, 2 – relationship factors, 3 - output factors and 4 -
framework factors. Based on the work of Rybnicek & Königsgruber (2019), we divided several
other factors highlighted by the literature into these 4 groups (Supplementary figure 1). These
factors are: research skills; innovation culture (Meissner & Shmatko, 2019); engagement to
interdisciplinary and innovation (D’este et al., 2019); previous experience with UIC (Klásová,
Korobaničová & Hudec, 2019); public support of UIC (Anderson, Odei & Anderson, 2018);
bureaucracy and flexibility/inflexibility of HEIs; willingness to change; communication,
commitment, culture; the strategy, vision, goals, plans and expected results of collaboration
including the question of publication or commercialization (the question of so called “publish
or perish” of researchers vs. patenting approach of industrial partners); the governmental
support, legal restrictions, local and global market environment; presence or lack of regulations,
geographic distance (Rybnicek & Königsgruber, 2019), responsibility of HEIs staff and
researchers (Perkmann et al., 2013); the frequency and type of communication among partners;
as well as the understanding of rational choices (Rast, Tourani & Senin, 2015). Since the
collaboration among HEIs and industry has increased, the need for monitoring and measuring
the outcomes of UICs has appeared as well (Grimaldi & Von Tunzelmann, 2002). However,
besides the type of interaction as performance indicator is itself not enough, and the outcomes
of these interaction should be also taken into account (Pertuzé et al., 2010). According to
Perkmann, Neely & Walsh (2011) several metrics can be used to measure the outputs of UIC,
such as patents/intellectual property rights, publications, and learning metrics. They suggested
a performance measurement system for evaluating the success of UIC, including quantitative
(like patents, publications and intellectual property rights) and qualitative indicators (social
relationship, organizational arrangements or motivation). Moreover, the outcome of
cooperation is also important indicator of UIC (Pertuzé et al., 2010). Bibliographic metrics are
in good position to measure the researcher’s capability, moreover, they can be used as an
indicator if UIC. The joint research publications are an explicit indicator of UIC, which are
suitable for evaluating university-industry research collaboration (Tijssen, 2012; Tijssen,
Leeuwen & Wijk, 2009). The university-industry joint publications, in which at least one
university and one private sector organization is included, can partially overcome the problem
of the lack of publicly accessible information (number of research contracts, number and type
of joint projects with industry, number of licenses) (Yegros-Yegros et al., 2016). Furthermore,
it can be used to predict the universities’ technology commercialization outputs: patenting, spin-
off creation and licensing opportunities (Wong & Sing, 2013). However, university-industry
co-publications, like other quantitative measures, are far from being considered perfect
measures of UIC (Yegros-Yegros et al., 2016). It was discussed by Katz and Martin (1997),
that not all research collaboration lead to co-publication, and only some tangible aspects of UIC
can be quantified. Similarly, Seppo and Lilles (2012) highlighted, that only the publication
count is not a reliable tool to estimate the success of university-industry cooperation, as industry
is interested rather in applied than basic research, and from the side of industrial partners,
publications are not necessary. Other significant limitation is the “multiple” affiliation of
researchers, when one or more authors indicate both university and industrial affiliation in the
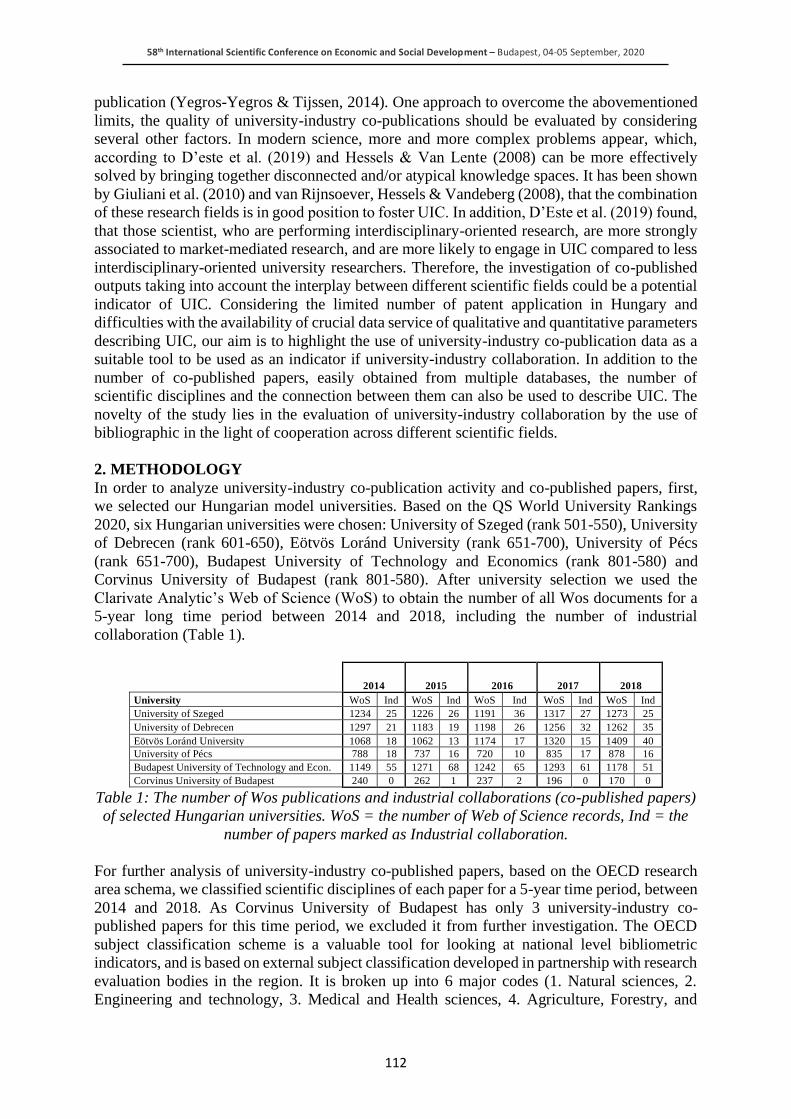
58th International Scientific Conference on Economic and Social Development – Budapest, 04-05 September, 2020
112
publication (Yegros-Yegros & Tijssen, 2014). One approach to overcome the abovementioned
limits, the quality of university-industry co-publications should be evaluated by considering
several other factors. In modern science, more and more complex problems appear, which,
according to D’este et al. (2019) and Hessels & Van Lente (2008) can be more effectively
solved by bringing together disconnected and/or atypical knowledge spaces. It has been shown
by Giuliani et al. (2010) and van Rijnsoever, Hessels & Vandeberg (2008), that the combination
of these research fields is in good position to foster UIC. In addition, D’Este et al. (2019) found,
that those scientist, who are performing interdisciplinary-oriented research, are more strongly
associated to market-mediated research, and are more likely to engage in UIC compared to less
interdisciplinary-oriented university researchers. Therefore, the investigation of co-published
outputs taking into account the interplay between different scientific fields could be a potential
indicator of UIC. Considering the limited number of patent application in Hungary and
difficulties with the availability of crucial data service of qualitative and quantitative parameters
describing UIC, our aim is to highlight the use of university-industry co-publication data as a
suitable tool to be used as an indicator if university-industry collaboration. In addition to the
number of co-published papers, easily obtained from multiple databases, the number of
scientific disciplines and the connection between them can also be used to describe UIC. The
novelty of the study lies in the evaluation of university-industry collaboration by the use of
bibliographic in the light of cooperation across different scientific fields.
2. METHODOLOGY
In order to analyze university-industry co-publication activity and co-published papers, first,
we selected our Hungarian model universities. Based on the QS World University Rankings
2020, six Hungarian universities were chosen: University of Szeged (rank 501-550), University
of Debrecen (rank 601-650), Eötvös Loránd University (rank 651-700), University of Pécs
(rank 651-700), Budapest University of Technology and Economics (rank 801-580) and
Corvinus University of Budapest (rank 801-580). After university selection we used the
Clarivate Analytic’s Web of Science (WoS) to obtain the number of all Wos documents for a
5-year long time period between 2014 and 2018, including the number of industrial
collaboration (Table 1).
2014 2015 2016 2017 2018
University WoS Ind WoS Ind WoS Ind WoS Ind WoS Ind
University of Szeged 1234 25 1226 26 1191 36 1317 27 1273 25
University of Debrecen 1297 21 1183 19 1198 26 1256 32 1262 35
Eötvös Loránd University 1068 18 1062 13 1174 17 1320 15 1409 40
University of Pécs 788 18 737 16 720 10 835 17 878 16
Budapest University of Technology and Econ. 1149 55 1271 68 1242 65 1293 61 1178 51
Corvinus University of Budapest 240 0 262 1 237 2 196 0 170 0
Table 1: The number of Wos publications and industrial collaborations (co-published papers)
of selected Hungarian universities. WoS = the number of Web of Science records, Ind = the
number of papers marked as Industrial collaboration.
For further analysis of university-industry co-published papers, based on the OECD research
area schema, we classified scientific disciplines of each paper for a 5-year time period, between
2014 and 2018. As Corvinus University of Budapest has only 3 university-industry co-
published papers for this time period, we excluded it from further investigation. The OECD
subject classification scheme is a valuable tool for looking at national level bibliometric
indicators, and is based on external subject classification developed in partnership with research
evaluation bodies in the region. It is broken up into 6 major codes (1. Natural sciences, 2.
Engineering and technology, 3. Medical and Health sciences, 4. Agriculture, Forestry, and
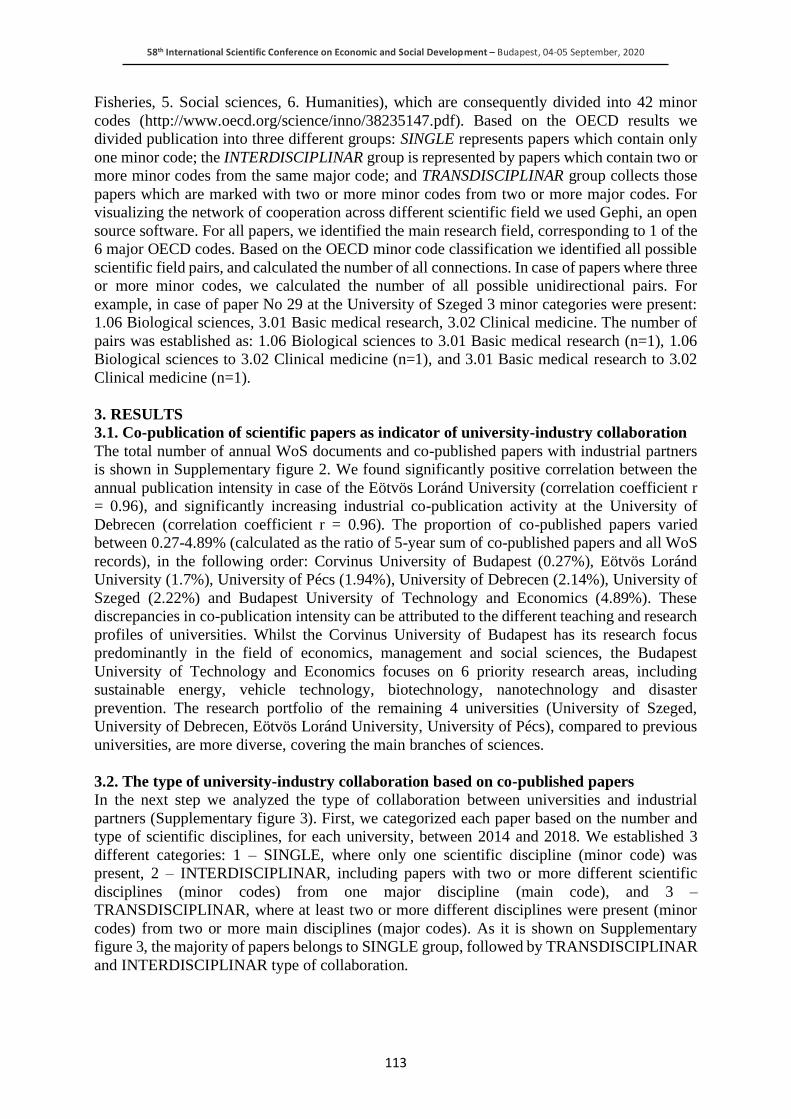
58th International Scientific Conference on Economic and Social Development – Budapest, 04-05 September, 2020
113
Fisheries, 5. Social sciences, 6. Humanities), which are consequently divided into 42 minor
codes (http://www.oecd.org/science/inno/38235147.pdf). Based on the OECD results we
divided publication into three different groups: SINGLE represents papers which contain only
one minor code; the INTERDISCIPLINAR group is represented by papers which contain two or
more minor codes from the same major code; and TRANSDISCIPLINAR group collects those
papers which are marked with two or more minor codes from two or more major codes. For
visualizing the network of cooperation across different scientific field we used Gephi, an open
source software. For all papers, we identified the main research field, corresponding to 1 of the
6 major OECD codes. Based on the OECD minor code classification we identified all possible
scientific field pairs, and calculated the number of all connections. In case of papers where three
or more minor codes, we calculated the number of all possible unidirectional pairs. For
example, in case of paper No 29 at the University of Szeged 3 minor categories were present:
1.06 Biological sciences, 3.01 Basic medical research, 3.02 Clinical medicine. The number of
pairs was established as: 1.06 Biological sciences to 3.01 Basic medical research (n=1), 1.06
Biological sciences to 3.02 Clinical medicine (n=1), and 3.01 Basic medical research to 3.02
Clinical medicine (n=1).
3. RESULTS
3.1. Co-publication of scientific papers as indicator of university-industry collaboration
The total number of annual WoS documents and co-published papers with industrial partners
is shown in Supplementary figure 2. We found significantly positive correlation between the
annual publication intensity in case of the Eötvös Loránd University (correlation coefficient r
= 0.96), and significantly increasing industrial co-publication activity at the University of
Debrecen (correlation coefficient r = 0.96). The proportion of co-published papers varied
between 0.27-4.89% (calculated as the ratio of 5-year sum of co-published papers and all WoS
records), in the following order: Corvinus University of Budapest (0.27%), Eötvös Loránd
University (1.7%), University of Pécs (1.94%), University of Debrecen (2.14%), University of
Szeged (2.22%) and Budapest University of Technology and Economics (4.89%). These
discrepancies in co-publication intensity can be attributed to the different teaching and research
profiles of universities. Whilst the Corvinus University of Budapest has its research focus
predominantly in the field of economics, management and social sciences, the Budapest
University of Technology and Economics focuses on 6 priority research areas, including
sustainable energy, vehicle technology, biotechnology, nanotechnology and disaster
prevention. The research portfolio of the remaining 4 universities (University of Szeged,
University of Debrecen, Eötvös Loránd University, University of Pécs), compared to previous
universities, are more diverse, covering the main branches of sciences.
3.2. The type of university-industry collaboration based on co-published papers
In the next step we analyzed the type of collaboration between universities and industrial
partners (Supplementary figure 3). First, we categorized each paper based on the number and
type of scientific disciplines, for each university, between 2014 and 2018. We established 3
different categories: 1 – SINGLE, where only one scientific discipline (minor code) was
present, 2 – INTERDISCIPLINAR, including papers with two or more different scientific
disciplines (minor codes) from one major discipline (main code), and 3 –
TRANSDISCIPLINAR, where at least two or more different disciplines were present (minor
codes) from two or more main disciplines (major codes). As it is shown on Supplementary
figure 3, the majority of papers belongs to SINGLE group, followed by TRANSDISCIPLINAR
and INTERDISCIPLINAR type of collaboration.
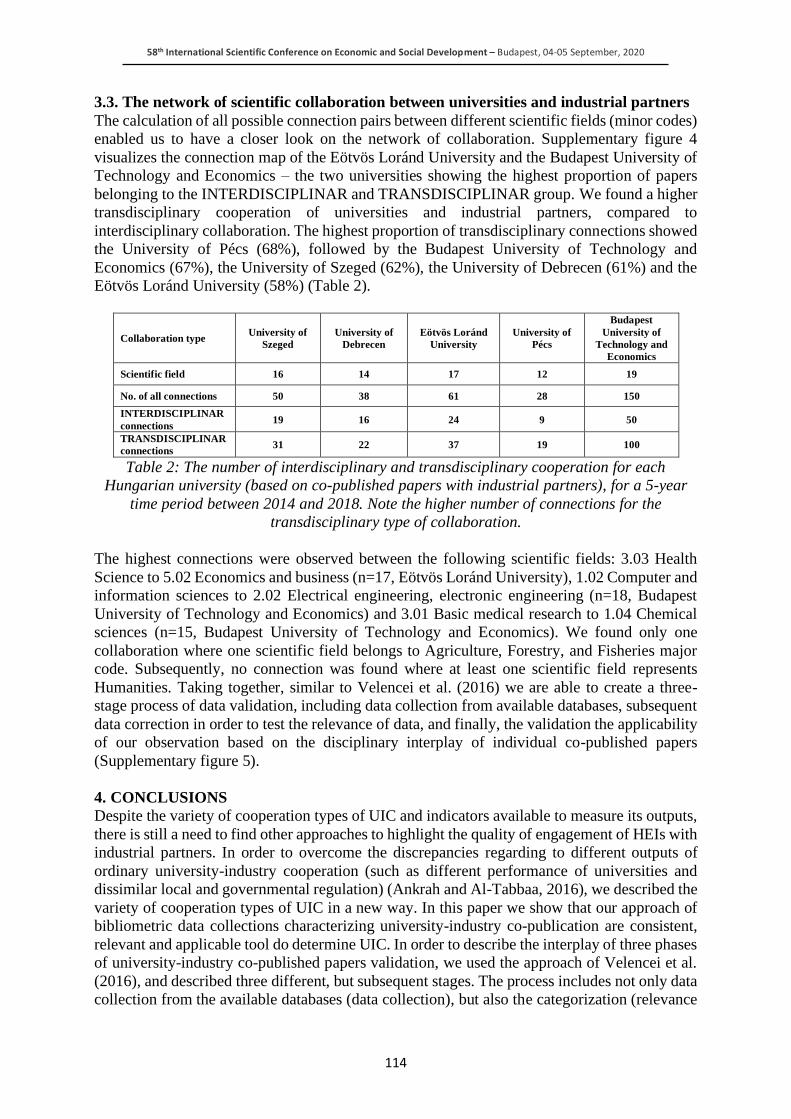
58th International Scientific Conference on Economic and Social Development – Budapest, 04-05 September, 2020
114
3.3. The network of scientific collaboration between universities and industrial partners
The calculation of all possible connection pairs between different scientific fields (minor codes)
enabled us to have a closer look on the network of collaboration. Supplementary figure 4
visualizes the connection map of the Eötvös Loránd University and the Budapest University of
Technology and Economics – the two universities showing the highest proportion of papers
belonging to the INTERDISCIPLINAR and TRANSDISCIPLINAR group. We found a higher
transdisciplinary cooperation of universities and industrial partners, compared to
interdisciplinary collaboration. The highest proportion of transdisciplinary connections showed
the University of Pécs (68%), followed by the Budapest University of Technology and
Economics (67%), the University of Szeged (62%), the University of Debrecen (61%) and the
Eötvös Loránd University (58%) (Table 2).
Collaboration type University of
Szeged
University of
Debrecen
Eötvös Loránd
University
University of
Pécs
Budapest
University of
Technology and
Economics
Scientific field 16 14 17 12 19
No. of all connections 50 38 61 28 150
INTERDISCIPLINAR
connections 19 16 24 9 50
TRANSDISCIPLINAR
connections 31 22 37 19 100
Table 2: The number of interdisciplinary and transdisciplinary cooperation for each
Hungarian university (based on co-published papers with industrial partners), for a 5-year
time period between 2014 and 2018. Note the higher number of connections for the
transdisciplinary type of collaboration.
The highest connections were observed between the following scientific fields: 3.03 Health
Science to 5.02 Economics and business (n=17, Eötvös Loránd University), 1.02 Computer and
information sciences to 2.02 Electrical engineering, electronic engineering (n=18, Budapest
University of Technology and Economics) and 3.01 Basic medical research to 1.04 Chemical
sciences (n=15, Budapest University of Technology and Economics). We found only one
collaboration where one scientific field belongs to Agriculture, Forestry, and Fisheries major
code. Subsequently, no connection was found where at least one scientific field represents
Humanities. Taking together, similar to Velencei et al. (2016) we are able to create a three-
stage process of data validation, including data collection from available databases, subsequent
data correction in order to test the relevance of data, and finally, the validation the applicability
of our observation based on the disciplinary interplay of individual co-published papers
(Supplementary figure 5).
4. CONCLUSIONS
Despite the variety of cooperation types of UIC and indicators available to measure its outputs,
there is still a need to find other approaches to highlight the quality of engagement of HEIs with
industrial partners. In order to overcome the discrepancies regarding to different outputs of
ordinary university-industry cooperation (such as different performance of universities and
dissimilar local and governmental regulation) (Ankrah and Al-Tabbaa, 2016), we described the
variety of cooperation types of UIC in a new way. In this paper we show that our approach of
bibliometric data collections characterizing university-industry co-publication are consistent,
relevant and applicable tool do determine UIC. In order to describe the interplay of three phases
of university-industry co-published papers validation, we used the approach of Velencei et al.
(2016), and described three different, but subsequent stages. The process includes not only data
collection from the available databases (data collection), but also the categorization (relevance
58th International Scientific Conference on Economic and Social Development – Budapest, 04-05 September, 2020
115
of data, e.g. correction) and further analysis (applicability) of university-industry co-published
papers in the light of research performance interplay between different scientific disciplines
within and between major superordinate scientific fields (Figure 5). By determining the type of
collaboration and correcting the data considering the number and connection of scientific
disciplines, we can provide a new tool reliable to evaluate university-industry cooperation.
Now, our aim is to reach a next level of validation that has never been used to analyze
university-industry cooperation. To do so, we are going to test our approach by including other,
significant and available output indicators of university-industry co-published papers.
LITERATURE:
1. Anderson, H.J., Odei S.A., Anderson, H. (2018). The Influence of Public Support on
University-Industry-Governmental Collaboration: The Case of the Czech Republic,
Slovakia, Hungary and Romania. Statistika
2. Ankrah, S.N., Al-Tabbaa, O. (2015). University-Industry Collaboration: A Systematic
Review. Forthcoming: Scandinavian Journal of Management, 31, 387-408
3. Bekker, R., Freitas, I.M.B. (2008). Analysing Knowledge Transfer Channels Between
Universities and Industry: To What Degree do Sectors also Matter? Research Policy,
37(10), 1837-1853
4. D’Este, P., Llopis, O., Rentocchini, F., Yegros, A. (2019). The Relationship Between
Interdisciplinary and Distinct Modes of University-Industry Interaction. Research
Policy, 48(9)
5. Etzkowitz, H. (2003). Innovation in Innovation: The Triple Helix of University-
Industry-Government Relations. Social Science Information, 42(3), 293-337
6. Etzkowitz, H., Leydesdorff, L. (1997). Universities and the Global Knowledge Economy:
a Triple Helix of University-Industry-Government Relations. London: Pinter.
7. Etzkowitz, H., Leydesdorff. L. (2000). The Dynamics of Innovation: From National
Systems and ’Mode 2’ to a Triple Helix of University-Industry-Government Relations.
Research Policy, 29(2), 109-123
8. Franko, M., Haase, H. (2015). University-Industry Cooperation: Researcher’s
Motivations and Interaction Channels. Journal of Engineering and Technology
Management (forthcoming), 36, 41-51
9. Giuliani, E., Morrison, A., Pietrobelli, C., Rabellotti, R. (2010). Who are the
Researchers that are Collaborating with Industry? An Analysis of the wine sectors in
Chile, South Africa and Italy. Research Policy, 39, 748-761
10. Glaser, A., o’Shea, N., de Gery, C. (2014). Measuring Third Mission Activities of Higher
Education Institutes. Constructing and Evaluation Framework. British Academy of
Management (BAM) conference, Belfast, Northern Ireland
11. Grimaldi, R., Von Tunzelmann, N. (2002). Assessing Collaborative, Pre-Competitive
R&D projects: The Case of the Uk Link Scheme. R&D Management. 32(2), 165-173
12. Hessels L.K., can Lente H. (2008). Re-Thinking New Knowledge Production: A
Literature Review and a Research Agenda. Research Policy, 37(4), 740-760
13. Jensen, R., Thursby, M. (2001). Proofs and Prototypes for Sale: The Licensing of
University Inventions. American Economic Review, 91(1), 240-259
14. Katz, J.S., Martin, B. (1997). What is Research Collaboration? Research Policy, 26(1),
1-18
15. Kilduff, M., Mehra, A., Dunn, M. (2011). From Blue Sky Research to Problem Solving:
A Philosophy of Science Theory of New Knowledge Production. The Academy of
Management Review, 36(2)
58th International Scientific Conference on Economic and Social Development – Budapest, 04-05 September, 2020
116
16. Klásová, S., Korobaničová, I., Hudec, O. (2019). University-Industry Links in Slovakia:
What are the Factors underlying the Number of Interactions with Industry? Quality
Innovation Prosperity 23(1), 102-118
17. Laredo, P. (2007). Revisiting the Third Mission of Universities: Toward a Renewed
Categorization of University Activities? Higher Education Policy, 20(4), 441-456
18. Meissner, D., Shmatko, N. (2019). Integrating Professional and Academic Knowledge:
The Link between Researchers Skills and Innovation Culture. The Journal of
Technology Transfer, 44(4), 1273-1289
19. Perkmann, M., Neely, A., Walsh, K. (2011). How Should Firms Evaluate Success in
University-Industry Alliances? A Performance Measurement System . R&D
Management, 41(2), 202-216
20. Perkmann, M., Walsh, K. (2007). University-Industry Relationships and Open
Innovation: Towards a Research Agenda. International Journal of Management
Reviews, 9(4). 259-280
21. Pertuze, J., Calder, E.S., Greitzer, E.M., Lucas W.A. (2010). Best Practices of
University-Industry Collaboration. MIT Sloan Management Review, 51(4), 83-90
22. Piirainen, K. A., Andersen, A. D., & Andersen, P. D. (2016). Foresight and the Third
Mission of Universities: the Case for Innovation System Foresight. Foresight, 18(1), 24–40.
23. Rast, S., Tourani, A., Senin, A.A. (2015). Effect of Organizational Factors on
University-Industry Collaboration: A Concenptual Model. International Journal of
Business and Management, 10(6)
24. Rybnicek, R., Königsgruber, R. (2019). What Makes Industry-University Collaboration
Succeed? A Systematic Review of the Literature. Journal of Business Economics,
Springer, 89(2), 221-250
25. Santoro, M.D., Chakrabarti, A.K. (2002). Firm Size and Technology Centrality in
Industry-University Interactions. Research Policy, 31(7), 1163-1180
26. Seppo, M., Lilles, A. (2012). Indicators Measuring University-Industry Cooperation.
Discussion on Estonian Economic Policy, 20(1)
27. Siegel, D., Waldman, D., Link, A. (2003). Assessing the Impact of Organizational
Practices on the Relative Productivity of University Technology Transfer Offices: An
Exploratory Study. Research Policy, 32(1), 27-48
28. Tijssen, E. (2012). Joint Research Publications: A Performance Indicator of University-
Industry Collaboration. Assessment & Evaluation in Higher Education, 5(2), 19-40
29. Tijssen, R., Van Leeuwen, T., Wijk E.V. (2009). Benchmarking University-Industry
Research Cooperation Worldwide: Performance Measurements and Indicators Based
on Co-Authorship Data for the World’s Largest Universities. Research Evaluation,
18(1), 13-24
30. Tijssen, R., Yegros, A., Winnink, J. (2016). University-Industry R &D Linkage Metrcis:
Validity and Applicability in World University Rankings. Scientometrics, 109(2), 677-
696
31. van Rijnsoever, F.J., Hessels, L.K., Vandeberg, R.L.J. (2008). A Resource-Based View
on the Interactions of University Researchers. Research Policy, 37, 1255-1266
32. Velencei, J., Baracskai Z., Dörfler V., Stierand, M. (2016). Supporting the Competent
Practitioner: Trans-Disciplinary Coaching with a Knowledge-Based Expert System.
International Journal of Management Science and Business Administration, 2(12), 20-
27
33. Wong, P.K., Singh, A. (2013). Do Co-Publications with Industry Lead to Higher Levels
of University Technology Commercialization Activity? Scientometrics, 978(2), 245-265

58th International Scientific Conference on Economic and Social Development – Budapest, 04-05 September, 2020
117
34. Yegros-Yegros, A., Azagra-Caro, J.M., López-Ferrer, M., Tijssen R.J.W. (2016). Do
University-Industry Co-Publication outputs Correspond with University Funding from
Firms? Research Evaluation, 25(2), 136-150
35. Yegros-Yegros, A., Tijssen, R.J.W. (2014). University-Industry Dual Appointments:
Global Trends and their Role in the Interaction with Industry. Science and Technology
Incitators Conference 2014, 3-5 September, Leiden, the Netherlands
36. Zomer, A., Benneworth, P. (2011). The Rise of the University’s Third Mission. In: Enders,
J., de Boer, H.F., Westerheijden D.F. (eds) Reform of the Higher Education in Europe.
SensePublishers. https://doi.org/10.1007/978-94-6091-555-0_6
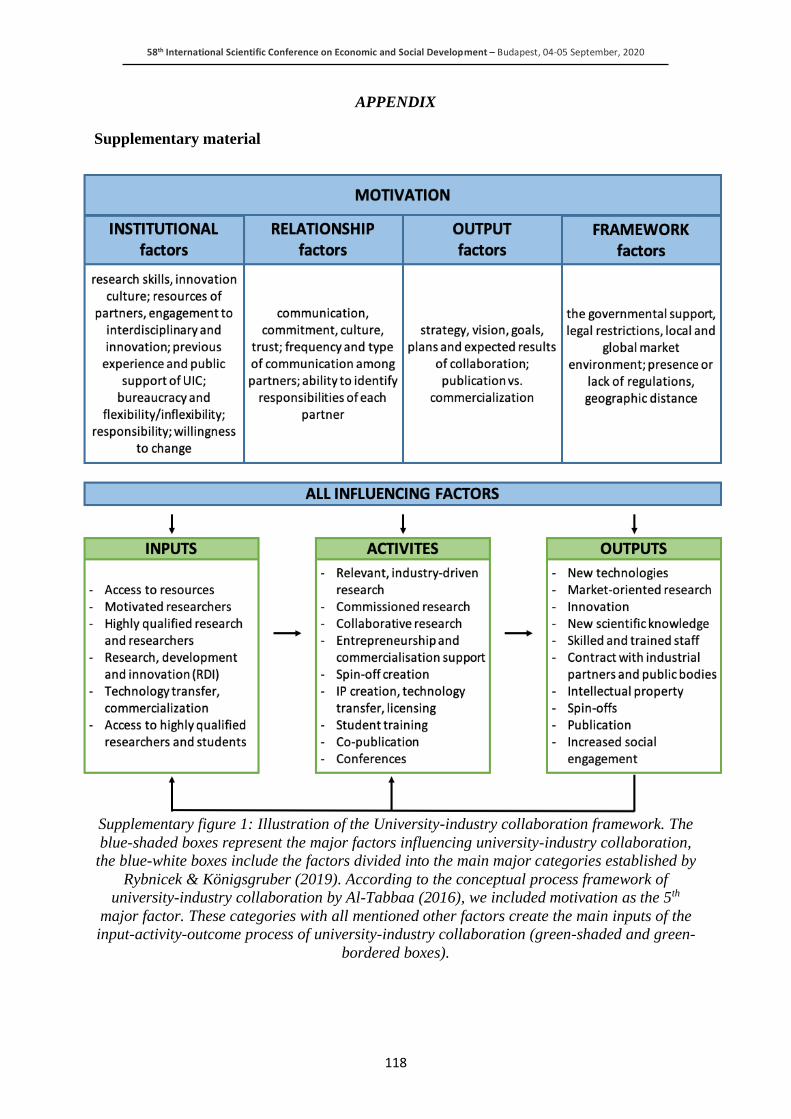
58th International Scientific Conference on Economic and Social Development – Budapest, 04-05 September, 2020
118
APPENDIX
Supplementary material
Supplementary figure 1: Illustration of the University-industry collaboration framework. The
blue-shaded boxes represent the major factors influencing university-industry collaboration,
the blue-white boxes include the factors divided into the main major categories established by
Rybnicek & Königsgruber (2019). According to the conceptual process framework of
university-industry collaboration by Al-Tabbaa (2016), we included motivation as the 5th
major factor. These categories with all mentioned other factors create the main inputs of the
input-activity-outcome process of university-industry collaboration (green-shaded and green-
bordered boxes).
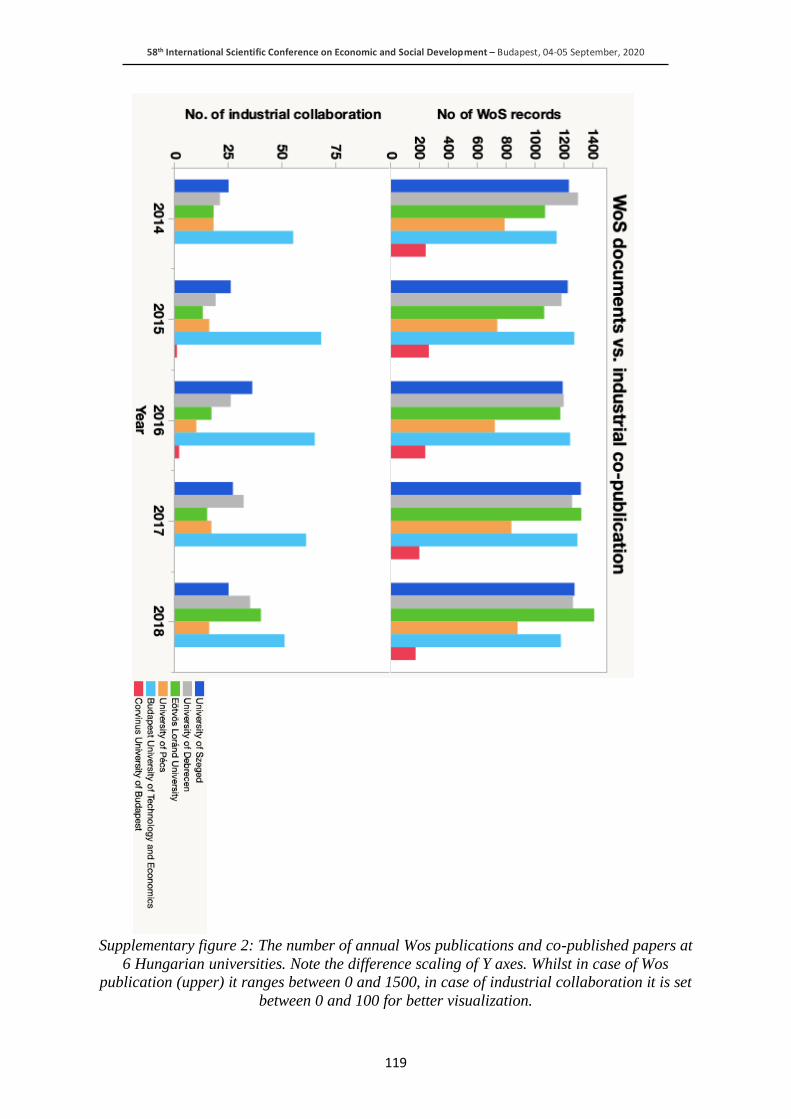
58th International Scientific Conference on Economic and Social Development – Budapest, 04-05 September, 2020
119
Supplementary figure 2: The number of annual Wos publications and co-published papers at
6 Hungarian universities. Note the difference scaling of Y axes. Whilst in case of Wos
publication (upper) it ranges between 0 and 1500, in case of industrial collaboration it is set
between 0 and 100 for better visualization.
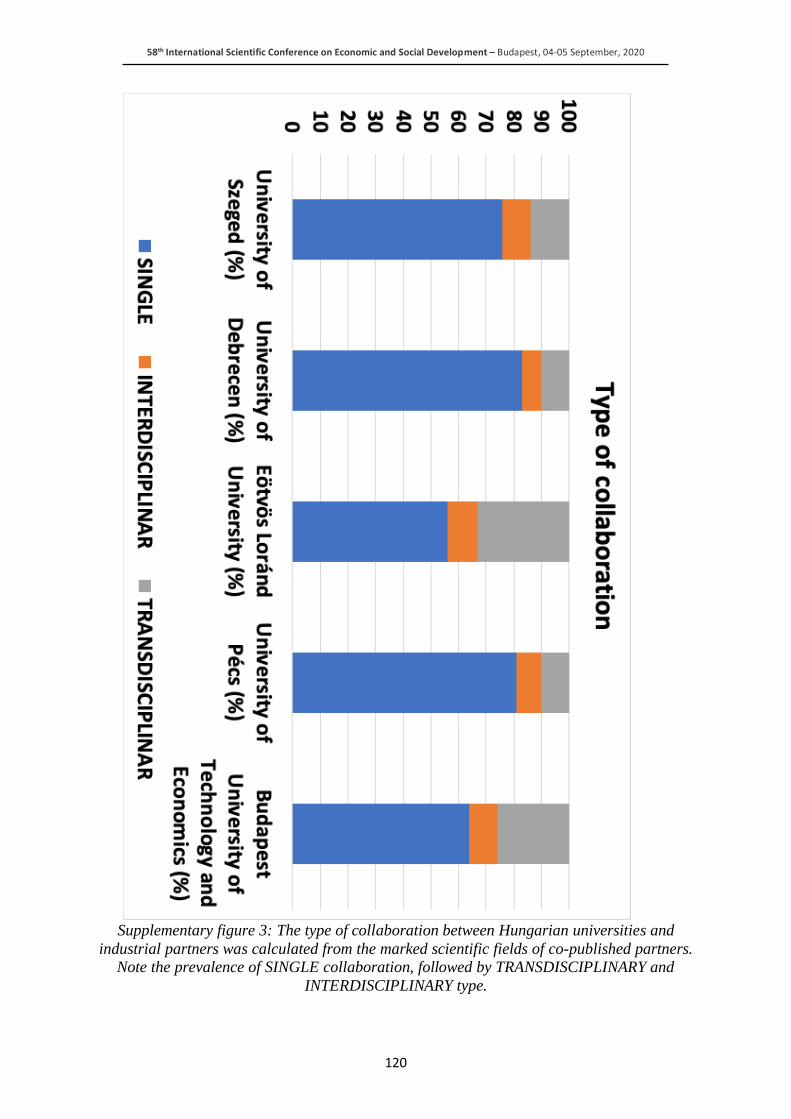
58th International Scientific Conference on Economic and Social Development – Budapest, 04-05 September, 2020
120
Supplementary figure 3: The type of collaboration between Hungarian universities and
industrial partners was calculated from the marked scientific fields of co-published partners.
Note the prevalence of SINGLE collaboration, followed by TRANSDISCIPLINARY and
INTERDISCIPLINARY type.
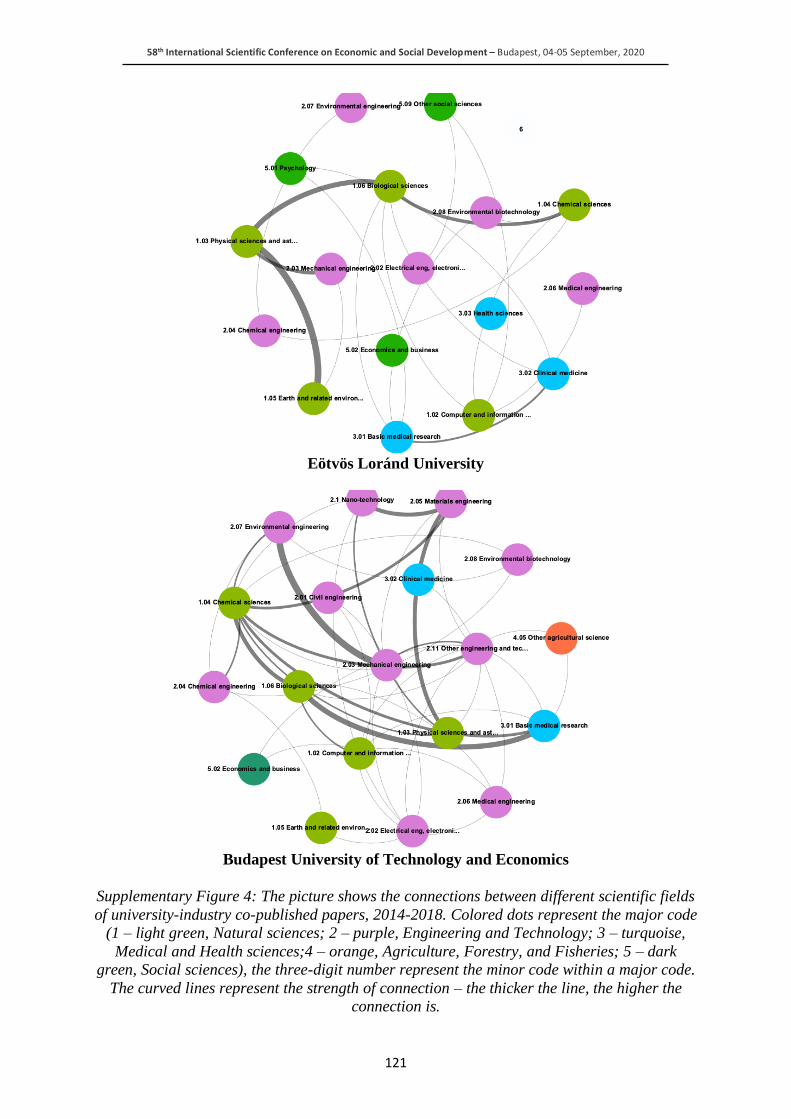
58th International Scientific Conference on Economic and Social Development – Budapest, 04-05 September, 2020
121
Eötvös Loránd University
Budapest University of Technology and Economics
Supplementary Figure 4: The picture shows the connections between different scientific fields
of university-industry co-published papers, 2014-2018. Colored dots represent the major code
(1 – light green, Natural sciences; 2 – purple, Engineering and Technology; 3 – turquoise,
Medical and Health sciences;4 – orange, Agriculture, Forestry, and Fisheries; 5 – dark
green, Social sciences), the three-digit number represent the minor code within a major code.
The curved lines represent the strength of connection – the thicker the line, the higher the
connection is.
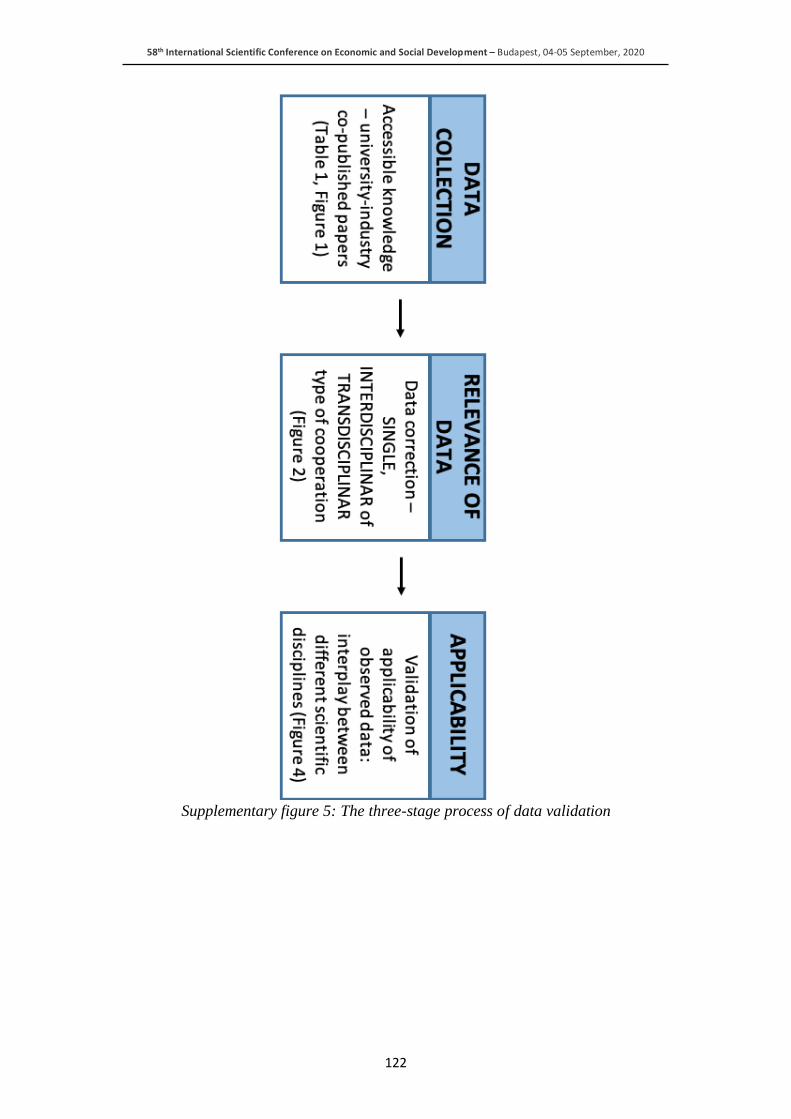
58th International Scientific Conference on Economic and Social Development – Budapest, 04-05 September, 2020
122
Supplementary figure 5: The three-stage process of data validation
58th International Scientific Conference on Economic and Social Development – Budapest, 04-05 September, 2020
123
A REVIEW OF BIG DATA FOR THE SUSTAINABILITY OF AGRI-
FOOD SUPPLY CHAINS
Abderahman Rejeb
Doctoral School of Regional Sciences and Business Administration,
Széchenyi István University, 9026 Győr, Hungary
ABSTRACT
Research on the sustainable management of agri-food supply chains (AFSCs) has garnered
much attention in recent years. The reason for this increased focus is attributed to pressing
consumer demands for food safety and quality. To sustain their operations, agri-food
organizations have to reconsider new ways, methods, and technologies that can consolidate
AFSCs and ensure a consistent supply of safe foods to consumers. A potent example of such
solutions is big data. Therefore, the goal of this paper is to explore the possibilities of big data
for AFSC sustainability. A sample of 128 journal articles was considered to identify the critical
role of big data in the agri-food industry. To systematize the extant literature, the author
abductively developed a framework consisting of well-established concepts in AFSCs and
analyzed the literature accordingly. The results of the review revealed that big data has the
potential to improve the management of AFSC resources and processes. In this respect,
resources mainly include soil and water, whereas processes include plant/ crop management,
livestock management, waste management, and traceability management. The barriers to big
data adoption in AFSCs are highlighted briefly along with some concluding remarks. To the
author's best knowledge, this study represents the first of its kind to investigate big data as a
driver for sustainable AFSCs.
Keywords: Agri-food supply chains, Big data, Sustainability, Soil, Water
1. INTRODUCTION
More recently, agri-food supply chains (AFSCs) have undergone a series of fundamental
changes that have remarkably reshaped the ways firms operate and deliver food products to
consumers (Marques Vieira et al., 2013). Besides being characterized by their complex,
fragmented, and disjointed processes, AFSCs face pressing challenges associated with several
parameters, such as cost, raw material availability, and volatile exchange rates (Christopher,
2011; Holweg et al., 2005; Vlajic et al., 2013). Consumer concerns over food quality and safety
have increased as a result of the recurrent food scandals and ethical lapses, ranging from the
horsemeat scandal in Europe to the melamine incident in china (Elliot, 2014). The management
of AFSCs is a challenging task since several vulnerabilities are arising from the limited shelf-
life of food products, their high perishability, and the rapid degradation of their quality. In
addition to these concerns, increased calls for sustainability in the agri-food industry have
intensified, and there is a need to consider new technologies as better alternatives to the
traditional ones (Sun, 2014) to manage AFSCs more sustainably. Through the digitization of
AFSCs, it would be feasible to enlarge the market potential of agri-food firms and enhance their
competitive position in the increasingly dynamic market of food products. Big data represents
one of the new emerging technologies that agri-food firms can rely on to improve the
management of their AFSCs. As per Subudhi et al. (2019), big data consists of large,
heterogeneous, and massive datasets that require high processing capabilities. The concept of
big data is new, and it highlights the importance of data to extract relevant insights. This data
is generated from a variety of sources like the internet of things (IoT) devices, agricultural
sensors, and other consumer tracking methods. In the academic literature, several attributes of
big data exist, including volume, velocity, variety, and value (Aljunid and Manjaiah, 2019).
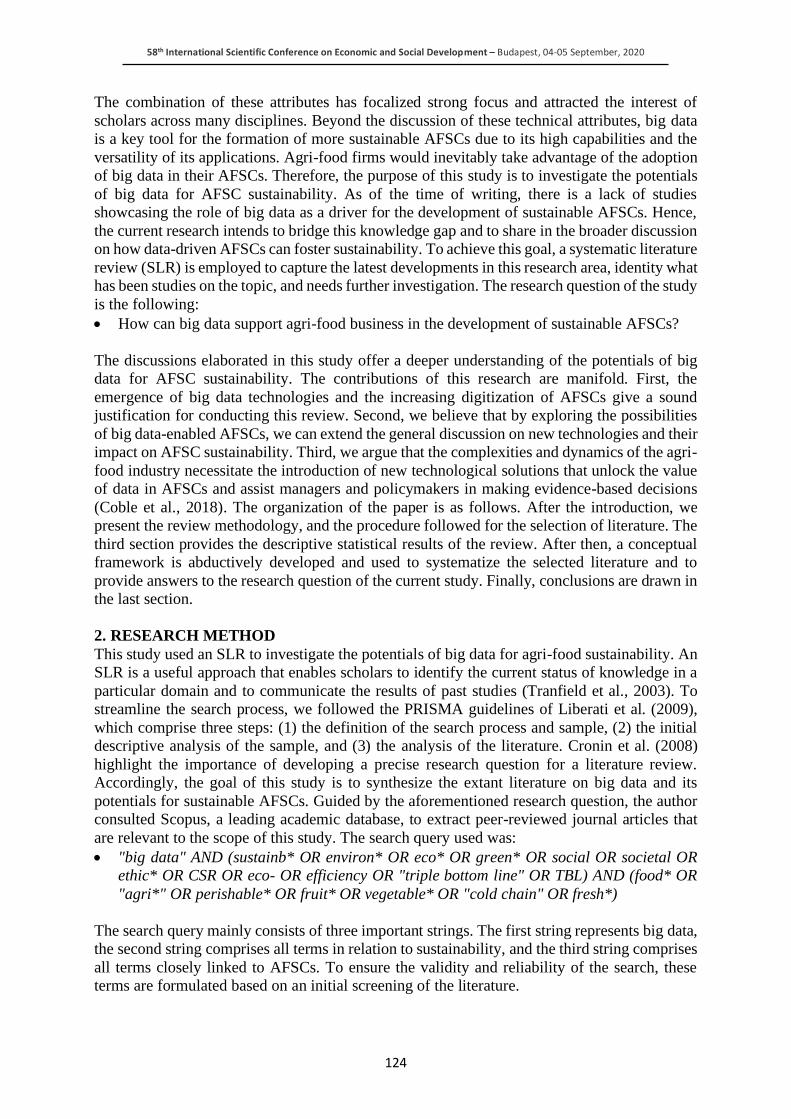
58th International Scientific Conference on Economic and Social Development – Budapest, 04-05 September, 2020
124
The combination of these attributes has focalized strong focus and attracted the interest of
scholars across many disciplines. Beyond the discussion of these technical attributes, big data
is a key tool for the formation of more sustainable AFSCs due to its high capabilities and the
versatility of its applications. Agri-food firms would inevitably take advantage of the adoption
of big data in their AFSCs. Therefore, the purpose of this study is to investigate the potentials
of big data for AFSC sustainability. As of the time of writing, there is a lack of studies
showcasing the role of big data as a driver for the development of sustainable AFSCs. Hence,
the current research intends to bridge this knowledge gap and to share in the broader discussion
on how data-driven AFSCs can foster sustainability. To achieve this goal, a systematic literature
review (SLR) is employed to capture the latest developments in this research area, identity what
has been studies on the topic, and needs further investigation. The research question of the study
is the following:
• How can big data support agri-food business in the development of sustainable AFSCs?
The discussions elaborated in this study offer a deeper understanding of the potentials of big
data for AFSC sustainability. The contributions of this research are manifold. First, the
emergence of big data technologies and the increasing digitization of AFSCs give a sound
justification for conducting this review. Second, we believe that by exploring the possibilities
of big data-enabled AFSCs, we can extend the general discussion on new technologies and their
impact on AFSC sustainability. Third, we argue that the complexities and dynamics of the agri-
food industry necessitate the introduction of new technological solutions that unlock the value
of data in AFSCs and assist managers and policymakers in making evidence-based decisions
(Coble et al., 2018). The organization of the paper is as follows. After the introduction, we
present the review methodology, and the procedure followed for the selection of literature. The
third section provides the descriptive statistical results of the review. After then, a conceptual
framework is abductively developed and used to systematize the selected literature and to
provide answers to the research question of the current study. Finally, conclusions are drawn in
the last section.
2. RESEARCH METHOD
This study used an SLR to investigate the potentials of big data for agri-food sustainability. An
SLR is a useful approach that enables scholars to identify the current status of knowledge in a
particular domain and to communicate the results of past studies (Tranfield et al., 2003). To
streamline the search process, we followed the PRISMA guidelines of Liberati et al. (2009),
which comprise three steps: (1) the definition of the search process and sample, (2) the initial
descriptive analysis of the sample, and (3) the analysis of the literature. Cronin et al. (2008)
highlight the importance of developing a precise research question for a literature review.
Accordingly, the goal of this study is to synthesize the extant literature on big data and its
potentials for sustainable AFSCs. Guided by the aforementioned research question, the author
consulted Scopus, a leading academic database, to extract peer-reviewed journal articles that
are relevant to the scope of this study. The search query used was:
• "big data" AND (sustainb* OR environ* OR eco* OR green* OR social OR societal OR
ethic* OR CSR OR eco- OR efficiency OR "triple bottom line" OR TBL) AND (food* OR
"agri*" OR perishable* OR fruit* OR vegetable* OR "cold chain" OR fresh*)
The search query mainly consists of three important strings. The first string represents big data,
the second string comprises all terms in relation to sustainability, and the third string comprises
all terms closely linked to AFSCs. To ensure the validity and reliability of the search, these
terms are formulated based on an initial screening of the literature.
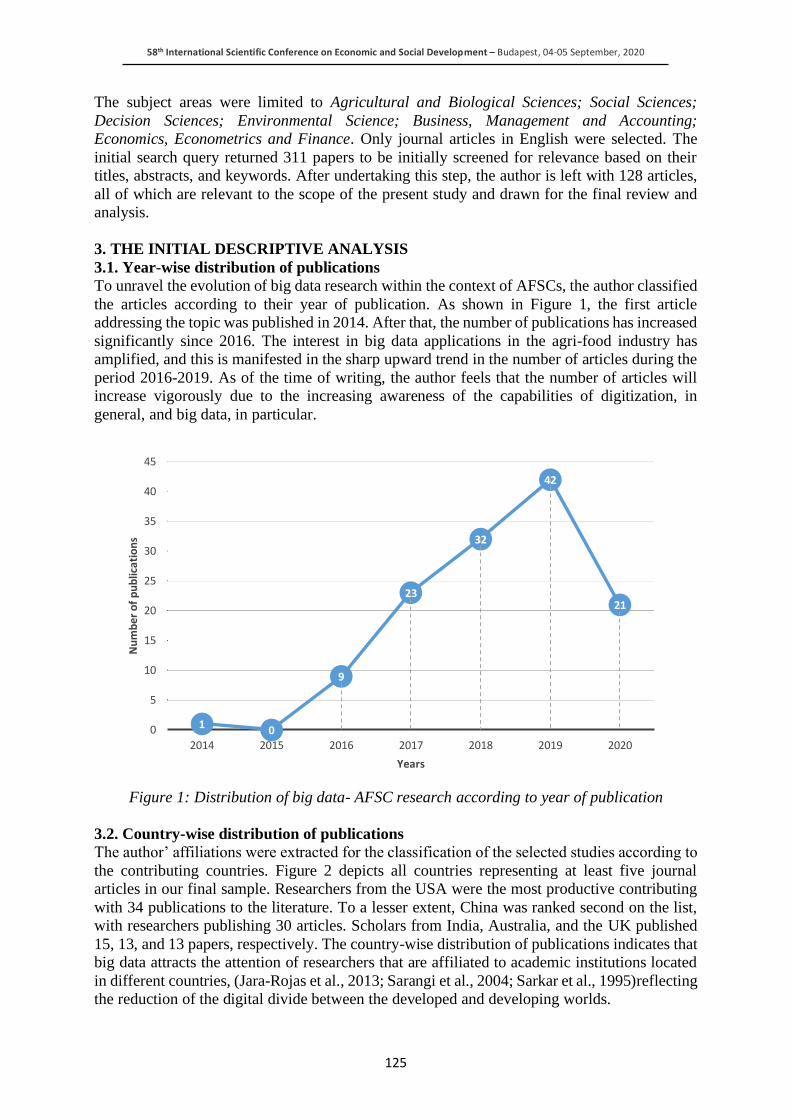
58th International Scientific Conference on Economic and Social Development – Budapest, 04-05 September, 2020
125
The subject areas were limited to Agricultural and Biological Sciences; Social Sciences;
Decision Sciences; Environmental Science; Business, Management and Accounting;
Economics, Econometrics and Finance. Only journal articles in English were selected. The
initial search query returned 311 papers to be initially screened for relevance based on their
titles, abstracts, and keywords. After undertaking this step, the author is left with 128 articles,
all of which are relevant to the scope of the present study and drawn for the final review and
analysis.
3. THE INITIAL DESCRIPTIVE ANALYSIS
3.1. Year-wise distribution of publications
To unravel the evolution of big data research within the context of AFSCs, the author classified
the articles according to their year of publication. As shown in Figure 1, the first article
addressing the topic was published in 2014. After that, the number of publications has increased
significantly since 2016. The interest in big data applications in the agri-food industry has
amplified, and this is manifested in the sharp upward trend in the number of articles during the
period 2016-2019. As of the time of writing, the author feels that the number of articles will
increase vigorously due to the increasing awareness of the capabilities of digitization, in
general, and big data, in particular.
Figure 1: Distribution of big data- AFSC research according to year of publication
3.2. Country-wise distribution of publications
The author’ affiliations were extracted for the classification of the selected studies according to
the contributing countries. Figure 2 depicts all countries representing at least five journal
articles in our final sample. Researchers from the USA were the most productive contributing
with 34 publications to the literature. To a lesser extent, China was ranked second on the list,
with researchers publishing 30 articles. Scholars from India, Australia, and the UK published
15, 13, and 13 papers, respectively. The country-wise distribution of publications indicates that
big data attracts the attention of researchers that are affiliated to academic institutions located
in different countries, (Jara-Rojas et al., 2013; Sarangi et al., 2004; Sarkar et al., 1995)reflecting
the reduction of the digital divide between the developed and developing worlds.
1 0
9
23
32
42
21
0
5
10
15
20
25
30
35
40
45
2014 2015 2016 2017 2018 2019 2020
Nu
mb
er o
f p
ub
licat
ion
s
Years
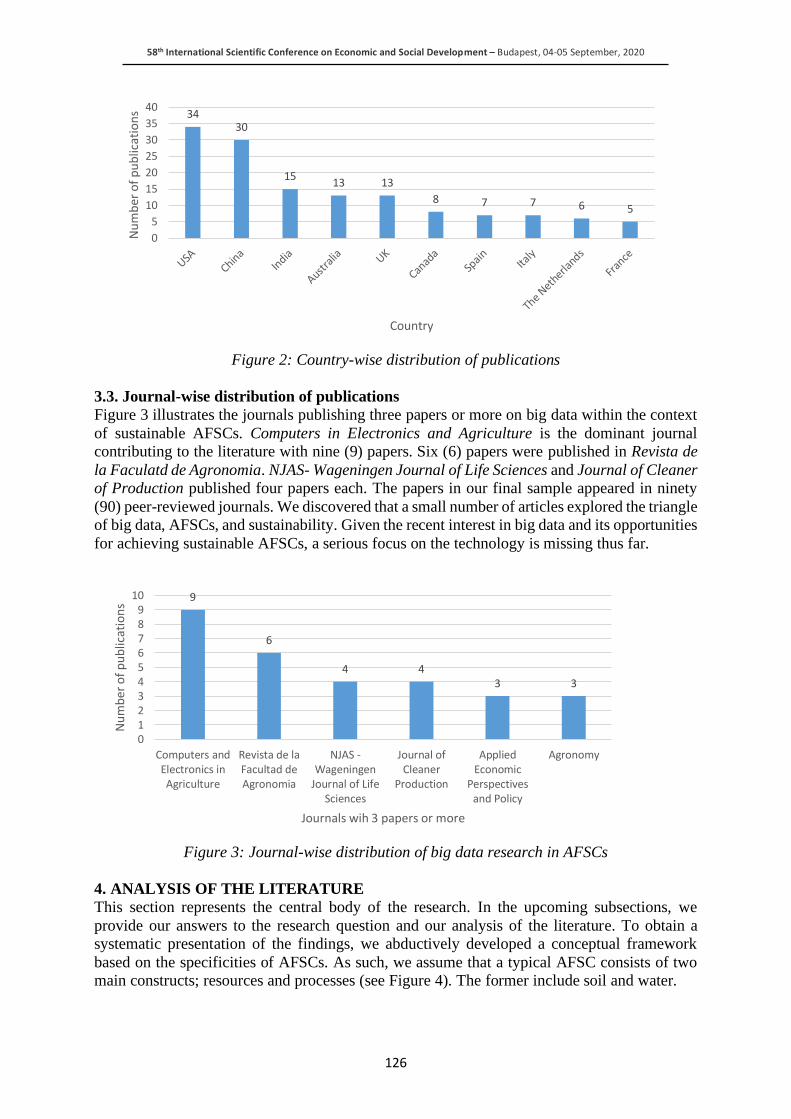
58th International Scientific Conference on Economic and Social Development – Budapest, 04-05 September, 2020
126
Figure 2: Country-wise distribution of publications
3.3. Journal-wise distribution of publications
Figure 3 illustrates the journals publishing three papers or more on big data within the context
of sustainable AFSCs. Computers in Electronics and Agriculture is the dominant journal
contributing to the literature with nine (9) papers. Six (6) papers were published in Revista de
la Faculatd de Agronomia. NJAS- Wageningen Journal of Life Sciences and Journal of Cleaner
of Production published four papers each. The papers in our final sample appeared in ninety
(90) peer-reviewed journals. We discovered that a small number of articles explored the triangle
of big data, AFSCs, and sustainability. Given the recent interest in big data and its opportunities
for achieving sustainable AFSCs, a serious focus on the technology is missing thus far.
Figure 3: Journal-wise distribution of big data research in AFSCs
4. ANALYSIS OF THE LITERATURE
This section represents the central body of the research. In the upcoming subsections, we
provide our answers to the research question and our analysis of the literature. To obtain a
systematic presentation of the findings, we abductively developed a conceptual framework
based on the specificities of AFSCs. As such, we assume that a typical AFSC consists of two
main constructs; resources and processes (see Figure 4). The former include soil and water.
3430
1513 13
8 7 7 6 5
0
5
10
15
20
25
30
35
40
Nu
mb
er o
f p
ub
licat
ion
s
Country
9
6
4 43 3
0123456789
10
Computers andElectronics inAgriculture
Revista de laFacultad deAgronomia
NJAS -Wageningen
Journal of LifeSciences
Journal ofCleaner
Production
AppliedEconomic
Perspectivesand Policy
Agronomy
Nu
mb
er o
f p
ub
licat
ion
s
Journals wih 3 papers or more
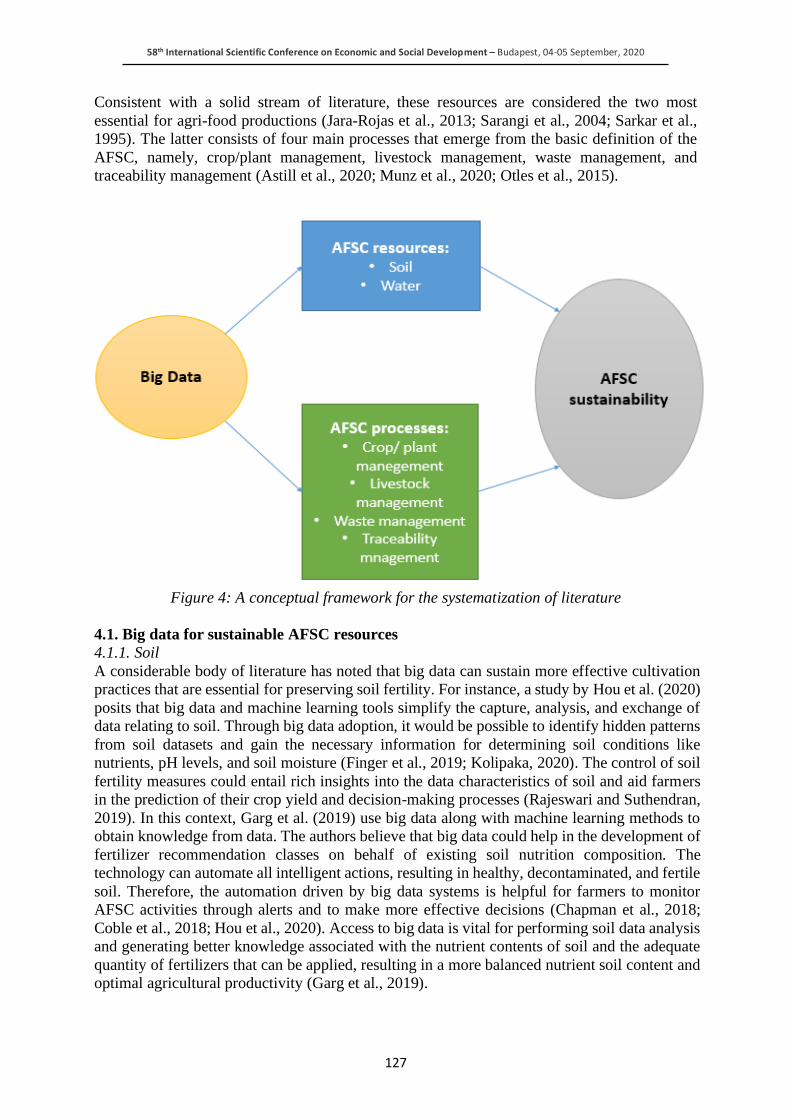
58th International Scientific Conference on Economic and Social Development – Budapest, 04-05 September, 2020
127
Consistent with a solid stream of literature, these resources are considered the two most
essential for agri-food productions (Jara-Rojas et al., 2013; Sarangi et al., 2004; Sarkar et al.,
1995). The latter consists of four main processes that emerge from the basic definition of the
AFSC, namely, crop/plant management, livestock management, waste management, and
traceability management (Astill et al., 2020; Munz et al., 2020; Otles et al., 2015).
Figure 4: A conceptual framework for the systematization of literature
4.1. Big data for sustainable AFSC resources
4.1.1. Soil
A considerable body of literature has noted that big data can sustain more effective cultivation
practices that are essential for preserving soil fertility. For instance, a study by Hou et al. (2020)
posits that big data and machine learning tools simplify the capture, analysis, and exchange of
data relating to soil. Through big data adoption, it would be possible to identify hidden patterns
from soil datasets and gain the necessary information for determining soil conditions like
nutrients, pH levels, and soil moisture (Finger et al., 2019; Kolipaka, 2020). The control of soil
fertility measures could entail rich insights into the data characteristics of soil and aid farmers
in the prediction of their crop yield and decision-making processes (Rajeswari and Suthendran,
2019). In this context, Garg et al. (2019) use big data along with machine learning methods to
obtain knowledge from data. The authors believe that big data could help in the development of
fertilizer recommendation classes on behalf of existing soil nutrition composition. The
technology can automate all intelligent actions, resulting in healthy, decontaminated, and fertile
soil. Therefore, the automation driven by big data systems is helpful for farmers to monitor
AFSC activities through alerts and to make more effective decisions (Chapman et al., 2018;
Coble et al., 2018; Hou et al., 2020). Access to big data is vital for performing soil data analysis
and generating better knowledge associated with the nutrient contents of soil and the adequate
quantity of fertilizers that can be applied, resulting in a more balanced nutrient soil content and
optimal agricultural productivity (Garg et al., 2019).
58th International Scientific Conference on Economic and Social Development – Budapest, 04-05 September, 2020
128
4.1.2. Water
The digitalization of AFSCs through the use of big data is an auspicious opportunity for
overcoming water sustainability issues. An influential study by Wolfert et al. (2017) highlights
the value of big data applications in arming farmers with the predictive capabilities that are
required for saving water while optimizing crop yields. Big data can optimize water use
efficiency (Ciruela-Lorenzo et al., 2020) across various decision-making units in the agri-food
industry. Similarly, big data-based climate models can help in the evaluation of annual
agricultural conditions, development of annual agricultural production plans, the efficient use
of water, and the mitigation of land degradation (Zhang and Huisingh, 2018). Big data has the
potential to devise prescriptive plans for AFSC firms and assist in performing water audits and
developing effective water policies (Weersink et al., 2018). To illustrate, Weersink et al. (2018)
state that the combination of big data with IoT technologies for controlling water pollution of
farms paves the way for developing predictive algorithms that can help organizations to adapt
to the stochasticity of the environment. For regions lacking water resources, these algorithms
can inform AFSCs players on how to combat water shortages and increase the sustainability of
water systems. In addition, the analysis of big data enables AFSC actors to monitor water
quality from the enormous data produced unceasingly from various sources (Kamilaris et al.,
2018). Therefore, this assists AFSC stakeholders to develop more accurate and precise
predictions of soil water patterns, to efficiently and effectively manage water resources, and to
maximize crop yields (Cai et al., 2019). In a similar vein, big data is valuable for assessing
environmental risks and raises AFSC actors’ awareness regarding water issues. The
incorporation of big data in the AFSC can significantly optimize water consumption, reduce
the permanent loss of water (Reynolds et al., 2018), and solve issues related to water
accessibility.
4.2. Big data for sustainable AFSC processes
4.2.1. Plant/ crop management
The exponential generation of data could represent a gold mine of knowledge regarding the
performance of plants in terms of nutrient quality, stress tolerance, overall crop quality in
different weather conditions, soils, and management practices (Halewood et al., 2018). The
variety and richness of big data have the potential to increase the willingness of breeders and
farmers to develop crop improvement programs and create more effective decision support
tools (Chapman et al., 2018; Finger et al., 2019; Halewood et al., 2018; Serazetdinova et al.,
2019). Moreover, big data aids farmers in mitigating the harmful issues that result from
inappropriate crop protection practices as firms would be able to excavate valuable insights
about the impacts of pesticides and other chemicals on crops (Carbonell, 2016). In their recent
study, Zhang and Huisingh (2018) emphasize that big data is a foremost step towards more
improved pest control, stating that research in this direction would forge a pathway to
sustainable AFSCs. Li (2019) argues that the investment in a big data- based crop cultivation
system could provide farmers with access to timely information, which is imperative to enhance
the economic performance of AFSCs and maximize the added value of science and technology
in AFSCs. Furthermore, Coble et al. (2018) propose that big data has prospective roles in
resolving nutrient runoff concerns, which are the main reason for the degradation of water
quality. The authors further argue that the use of big data tools could manage nutrient concerns
by providing better evaluations, policies, and models of nutrient management strategies. Thus,
big data can benefit cropping systems and enable to renovate management practices and
enhance environmental sustainability through the mitigation of negative impacts and the
formation of resilient AFSCs (Delgado et al., 2019).
58th International Scientific Conference on Economic and Social Development – Budapest, 04-05 September, 2020
129
4.2.2. Livestock management
Through the reliance on modern technologies, farmers can optimize their efficiency levels,
while bringing less disturbances to the environment. On this point, Finger et al. (2019) and
Weersink et al. (2018) assert that big data represents a key driver for smart animal farming,
enabling farmers to meet the needs of each animal in real time. Tan and Yin (2017) argue that
big data systems support animal breeders in producing sufficient animal feed, enhancing the
usage of additives, eliminating wastage, and monitoring pollution from animal production. By
analyzing big data, AFSC trading partners can gain a large amount of data to control their
livestock and ameliorate animal health and welfare (Eastwood et al., 2019; Ramirez et al.,
2019). Real-time data that are generated from IoT sensors could be treated, processed, and
analyzed in order to unlock higher value from animal farming operations and promote more
data-driven decisions (Astill et al., 2020). Additionally, the precious knowledge obtained from
big data can lead to the development of individual diagnostic and herd-level management tools
that are crucial for the monitoring of animal health and controlling high-risk physiological
periods, thereby resulting in higher production and animal health benefits (Pralle and White,
2020). For sustainability to be realized, AFSC partners may capitalize on big data to extract
actionable insights, maintain increased control over the ambient conditions of the farm, and
enhance the economic return of their animal management operations. Overall, big data is a
valuable supporting tool for precision livestock farming practices as it provides a variety of
farm data, which is a baseline for analytical tools to enhance the care and management of
livestock (Astill et al., 2020).
4.2.3. Waste management
Since AFSC firms need to devise proactive practices to enhance resource recovery from waste
(Sgarbossa and Russo, 2017; Xia et al., 2016), they can use big data to produce a reliable
analysis of the extensive misuse of AFSC resources and thereby reduce food waste (Kamble et
al., 2020). Furthermore, by using big data, AFSCs can mitigate the waste of production inputs,
such as soil, water, land, and foster environmental sustainability. The collaborative capabilities
of big data applications are a foremost step toward the acceleration of effective waste
management and disposal solutions (Sharma et al., 2020). In other words, increasing
collaboration with big data solutions can optimize AFSCs, support effective food waste
reduction strategies, and prevent food spoilage. Related to these points, Mishra and Singh
(2018) submit that AFSC retailers can harness big data analytics to eliminate waste by
considering consumer complaints made in retail stores or rely on social media data. Agri-food
businesses can use big data to reduce resource waste throughout all the stages of the AFSC. The
role of big data to reduce AFSC waste is highlighted in the study of Singh et al. (2018) who
proposed a big data cloud-computing framework to help farmers in quantifying their carbon
footprint more cheaply. While the carbon footprint of foods causes substantial GHG emissions
annually, big data can be a promising technological tool for agri-food organizations to plan and
develop waste prevention initiatives.
4.2.4. Traceability management
Advances in big data have the potential to reshape AFSC traceability, enabling agri-food
organizations to verify the environmental stewardship traits throughout the whole AFSC from
the farmer to the final consumer (Khanna et al., 2018). By incorporating big data in AFSC
traceability systems, agri-food organizations would have the ability to enhance their process
control, optimize the use of resources, and efficiently manage production. For instance, in the
grain market, Jakku et al. (2019) suggest that big data applications could improve supply chain
traceability and create value for consumers, retailers, processors, and growers. In the AFSC,
the confluence of big data, the IoT, and blockchain can ensure higher levels of visibility,
58th International Scientific Conference on Economic and Social Development – Budapest, 04-05 September, 2020
130
transparency, traceability, authenticity, and quality of food products (Kamble et al., 2020). The
automation of data collection, coupled with big data analytics, can significantly facilitate food
traceability and shift AFSCs towards consumer-driven chains (Lioutas et al., 2019). The
implementation of sensor-based technologies and big data analytics enables agri-food
organizations to carefully control their AFSCs and trace any unsafe foods to their source. This
increased food traceability may increase consumer willingness to pay for sustainable AFSC
products (Khanna et al., 2018). As a result, big data has the potential to radically transform
AFSCs and make them more data-driven supply chains, helping to achieve sustainable goals,
efficient exchange of information, and effective decision-making processes. All of these
benefits have been reported in the study of Kamble et al. (2020) who suggest that big data could
facilitate traceability, shorten the whole AFSC, and serve deprived and poorer communities in
the agri-food industry. Therefore, the integration of big data in the AFSC helps to forge a path
towards agri-food sustainability. In many ways, big data supports the effective management of
AFSC resources and processes, which represent a critical factor for successfully delivering
higher yields at greater degrees of efficiencies (Ryan, 2020). Despite the many potentials of big
data, several challenges lay ahead so far and inhibit the wide-scale shift of AFSCs to big data-
based AFSCs. For the sake of brevity and balanced presentation of the topic under study, some
challenges of big data in the context of AFSC are discussed in the upcoming section.
4.3. Challenges of big data in AFSCs
The integration of big data in AFSCs raises several issues for data analysis due to the
complexity, variety, and heterogeneity of datasets (Villa-Henriksen et al., 2020). This implies
that agri-food organizations need to use highly sophisticated and advanced data analytical
techniques to be able to extract insightful information in the AFSC. The shift to big data-enabled
AFSCs might expose agri-food organizations to the risk of lacking the necessary mechanisms
and capabilities to symmetrically compete, afford the cost of big data infrastructure, and
effectively make big data analysis (Lioutas and Charatsari, 2020). The poor technological
infrastructure, the non-availability of resources, and the lack of skilled and talented
professionals and data scientists (Eastwood et al., 2019; Kamilaris et al., 2017; Lioutas and
Charatsari, 2020) might restrain the capabilities of big data in precision livestock farming
(Ramirez et al., 2019). To effectively manage their AFSCs, agri-food organizations will be
obliged to recruit highly knowledgeable data experts (Wolfert et al., 2017) for the analysis and
management of AFSC data (Kamble et al., 2020). Therefore, agri-food organizations will have
to commit additional financial resources to initiate big data investments (Reynolds et al., 2018)
and to rejuvenate their current infrastructure so that data from a variety of on-farm systems,
equipment, and records can be manageable (Ramirez et al., 2019). The lack of governance
modes constitutes a barrier to big data adoption in the AFSC (Astill et al., 2020). Moreover, the
transition towards big data-enabled AFSCs is not a simple task because the mechanisms of data
governance, security, and legal compliance should be established in order to ensure data quality
and integrity (Astill et al., 2020). Therefore, organizational, ethical, and legal arrangements of
data sharing are unavoidable as they are imperative to improve collaboration and coordination
between agri-food organizations and data scientists (van Evert et al., 2017).
5. CONCLUSION
This research employs an SLR method to obtain insights into the potentials of big data for
sustainable AFSCs. The sustainability of AFSCs is a hot topic and an emerging research area
with multi-disciplinary nature. The increasing trend in the number of articles at the intersection
of big data, sustainability, and AFSCs confirms this tendency. The findings of the review point
are summarized according to a framework that is abductively developed and which encapsulates
the primary resources (i.e., soil, water) and processes (i.e., plant/crop management, livestock
58th International Scientific Conference on Economic and Social Development – Budapest, 04-05 September, 2020
131
management, waste management, traceability management) of AFSCs. Although this is not the
first time the environmental impacts of AFSCs have been studied, our proposed framework
showcases the role of big data to enhance sustainability, efficiency, and competitiveness for
AFSCs. This framework highlights the role of big data for achieving sustainable AFSCs, the
ones with a focus on food security, food safety, and environmental sustainability. While the
environmental dimension of sustainable AFSCs currently revolves on the reduction of
emissions, our study suggests that big data can be easily applied to enhance other environmental
factors. For instance, the impact of big data on soil and water resources is substantial, and the
technology can be considered to develop more comprehensive strategies for generally
sustainable development. Increased awareness of the elements of the agri-food system,
including climate, soil properties, and related agronomic parameters, is required. In spite of
policymakers’ interests, most AFSC stakeholders are more concerned with cost efficiencies
than reduction of carbon footprints, and incentive barriers and technological limitations hinder
the development of mitigation options in the agri-food industry (Smith et al., 2007).
Nonetheless, through the integration of big data in the AFSC, this study submits that it would
be possible for agri-food organizations to reduce the environmental impacts generated
throughout the different stages of the AFSC. Not only that, they can empower the social aspects
of the AFSC through ensuring food safety, food security, and the inclusiveness of small actors
and farmers in the agri-food industry. Indeed, another goal of this study is to call for further
investigation on how to promote more sustainable AFSCs with big data.
ACKNOWLEDGEMENT: The author is grateful to Prof. László Imre Komlósi, Dr. Katalin
Czakó and Ms. Tihana Vasic for their valuable support.
LITERATURE:
1. Aljunid, M.F., Manjaiah, D.H., 2019. Movie Recommender System Based on Collaborative
Filtering Using Apache Spark, in: Balas, V.E., Sharma, N., Chakrabarti, A. (Eds.), Data
Management, Analytics and Innovation, Advances in Intelligent Systems and Computing.
Springer, Singapore, pp. 283–295. https://doi.org/10.1007/978-981-13-1274-8_22
2. Astill, J., Dara, R.A., Fraser, E.D.G., Roberts, B., Sharif, S., 2020. Smart poultry
management: Smart sensors, big data, and the internet of things. Computers and Electronics
in Agriculture 170. https://doi.org/10.1016/j.compag.2020.105291
3. Cai, Y., Zheng, W., Zhang, X., Zhangzhong, L., Xue, X., 2019. Research on soil moisture
prediction model based on deep learning. PLoS ONE 14.
https://doi.org/10.1371/journal.pone.0214508
4. Carbonell, I.M., 2016. The ethics of big data in big agriculture. Internet Policy Review 5.
https://doi.org/10.14763/2016.1.405
5. Chapman, R., Cook, S., Donough, C., Lim, Y.L., Vun Vui Ho, P., Lo, K.W., Oberthür, T.,
2018. Using Bayesian networks to predict future yield functions with data from commercial
oil palm plantations: A proof of concept analysis. Computers and Electronics in Agriculture
151, 338–348. https://doi.org/10.1016/j.compag.2018.06.006
6. Christopher, M., 2011. Logistics and supply chain management : creating value-adding
networks, Fourth Edi. ed. Financial Times/ Prentice Hall.
7. Ciruela-Lorenzo, A.M., Del-Aguila-Obra, A.R., Padilla-Meléndez, A., Plaza-Angulo, J.J.,
2020. Digitalization of agri-cooperatives in the smart agriculture context. Proposal of a
digital diagnosis tool. Sustainability (Switzerland) 12. https://doi.org/10.3390/su12041325
8. Coble, K.H., Mishra, A.K., Ferrell, S., Griffin, T., 2018. Big data in agriculture: A challenge
for the future. Applied Economic Perspectives and Policy 40, 79–96.
https://doi.org/10.1093/aepp/ppx056
58th International Scientific Conference on Economic and Social Development – Budapest, 04-05 September, 2020
132
9. Cronin, P., Ryan, F., Coughlan, M., 2008. Undertaking a literature review: a step-by-step
approach. Br J Nurs 17, 38–43. https://doi.org/10.12968/bjon.2008.17.1.28059
10. Delgado, J.A., Short, Jr., N.M., Roberts, D.P., Vandenberg, B., 2019. Big Data Analysis for
Sustainable Agriculture on a Geospatial Cloud Framework. Frontiers in Sustainable Food
Systems 3. https://doi.org/10.3389/fsufs.2019.00054
11. Eastwood, C., Klerkx, L., Ayre, M., Dela Rue, B., 2019. Managing Socio-Ethical
Challenges in the Development of Smart Farming: From a Fragmented to a Comprehensive
Approach for Responsible Research and Innovation. Journal of Agricultural and
Environmental Ethics 32, 741–768. https://doi.org/10.1007/s10806-017-9704-5
12. Elliot, C.T., 2014. Elliott review into the integrity and assurance of food supply networks—
final report a national food crime prevention framework. … , Food & Rural Affairs Food
….
13. Finger, R., Swinton, S.M., El Benni, N., Walter, A., 2019. Precision Farming at the Nexus
of Agricultural Production and the Environment. Annual Review of Resource Economics
11, 313–335. https://doi.org/10.1146/annurev-resource-100518-093929
14. Garg, R., Aggarwal, H., Centobelli, P., Cerchione, R., 2019. Extracting knowledge from
big data for sustainability: A comparison of machine learning techniques. Sustainability
(Switzerland) 11. https://doi.org/10.3390/su11236669
15. Halewood, M., Chiurugwi, T., Sackville Hamilton, R., Kurtz, B., Marden, E., Welch, E.,
Michiels, F., Mozafari, J., Sabran, M., Patron, N., Kersey, P., Bastow, R., Dorius, S., Dias,
S., McCouch, S., Powell, W., 2018. Plant genetic resources for food and agriculture:
opportunities and challenges emerging from the science and information technology
revolution. New Phytologist 217, 1407–1419. https://doi.org/10.1111/nph.14993
16. Holweg, M., Disney, S., Holmström, J., Sm\a aros, J., 2005. Supply chain collaboration:
Making sense of the strategy continuum. European Management Journal 23, 170–181.
https://doi.org/10.1016/j.emj.2005.02.008
17. Hou, D., Bolan, N.S., Tsang, D.C.W., Kirkham, M.B., O’Connor, D., 2020. Sustainable soil
use and management: An interdisciplinary and systematic approach. Science of the Total
Environment 729. https://doi.org/10.1016/j.scitotenv.2020.138961
18. Jakku, E., Taylor, B., Fleming, A., Mason, C., Fielke, S., Sounness, C., Thorburn, P., 2019.
“If they don’t tell us what they do with it, why would we trust them?” Trust, transparency
and benefit-sharing in Smart Farming. NJAS - Wageningen Journal of Life Sciences 90–
91. https://doi.org/10.1016/j.njas.2018.11.002
19. Jara-Rojas, R., Bravo-Ureta, B.E., Engler, A., Díaz, J., 2013. An analysis of the joint
adoption of water conservation and soil conservation in Central Chile. Land Use Policy 32,
292–301. https://doi.org/10.1016/j.landusepol.2012.11.001
20. Kamble, S.S., Gunasekaran, A., Gawankar, S.A., 2020. Achieving sustainable performance
in a data-driven agriculture supply chain: A review for research and applications.
International Journal of Production Economics 219, 179–194.
https://doi.org/10.1016/j.ijpe.2019.05.022
21. Kamilaris, A., Anton, A., Blasi, A.B., Boldú, F.X.P., 2018. Assessing and mitigating the
impact of livestock agriculture on the environment through geospatial and big data analysis.
IJSAMI 4, 98. https://doi.org/10.1504/IJSAMI.2018.094809
22. Kamilaris, A., Kartakoullis, A., Prenafeta-Boldú, F.X., 2017. A review on the practice of
big data analysis in agriculture. Computers and Electronics in Agriculture 143, 23–37.
https://doi.org/10.1016/j.compag.2017.09.037
23. Khanna, M., Swinton, S.M., Messer, K.D., 2018. Sustaining our Natural Resources in the
Face of Increasing Societal Demands on Agriculture: Directions for Future Research. Appl
Econ Perspect Policy 40, 38–59. https://doi.org/10.1093/aepp/ppx055

58th International Scientific Conference on Economic and Social Development – Budapest, 04-05 September, 2020
133
24. Kolipaka, V.R.R., 2020. Predictive analytics using cross media features in precision
farming. International Journal of Speech Technology 23, 57–69.
https://doi.org/10.1007/s10772-020-09669-z
25. Li, B., 2019. Recommendation System of Crop Planting Books Based on Big Data. Revista
de la Facultad de Agronomia de la Universidad del Zulia 36.
26. Liberati, A., Altman, D.G., Tetzlaff, J., Mulrow, C., Gøtzsche, P.C., Ioannidis, J.P., Clarke,
M., Devereaux, P.J., Kleijnen, J., Moher, D., 2009. The PRISMA statement for reporting
systematic reviews and meta-analyses of studies that evaluate health care interventions:
explanation and elaboration. Annals of internal medicine 151, W–65.
27. Lioutas, E.D., Charatsari, C., 2020. Big data in agriculture: Does the new oil lead to
sustainability? Geoforum 109, 1–3. https://doi.org/10.1016/j.geoforum.2019.12.019
28. Lioutas, E.D., Charatsari, C., La Rocca, G., De Rosa, M., 2019. Key questions on the use
of big data in farming: An activity theory approach. NJAS - Wageningen Journal of Life
Sciences 90–91. https://doi.org/10.1016/j.njas.2019.04.003
29. Marques Vieira, L., Dutra De Barcellos, M., Hoppe, A., Bitencourt da Silva, S., 2013. An
analysis of value in an organic food supply chain. British Food Journal 115, 1454–1472.
https://doi.org/10.1108/BFJ-06-2011-0160
30. Mishra, N., Singh, A., 2018. Use of twitter data for waste minimisation in beef supply chain.
Ann Oper Res 270, 337–359. https://doi.org/10.1007/s10479-016-2303-4
31. Munz, J., Gindele, N., Doluschitz, R., 2020. Exploring the characteristics and utilisation of
Farm Management Information Systems (FMIS) in Germany. Computers and Electronics
in Agriculture 170. https://doi.org/10.1016/j.compag.2020.105246
32. Otles, S., Despoudi, S., Bucatariu, C., Kartal, C., 2015. Food waste management,
valorization, and sustainability in the food industry, in: Food Waste Recovery. Elsevier, pp.
3–23.
33. Pralle, R.S., White, H.M., 2020. Symposium review: Big data, big predictions: Utilizing
milk Fourier-transform infrared and genomics to improve hyperketonemia management.
Journal of Dairy Science 103, 3867–3873. https://doi.org/10.3168/jds.2019-17379
34. Rajeswari, S., Suthendran, K., 2019. C5.0: Advanced Decision Tree (ADT) classification
model for agricultural data analysis on cloud. Computers and Electronics in Agriculture
156, 530–539. https://doi.org/10.1016/j.compag.2018.12.013
35. Ramirez, B.C., Xin, H., Halbur, P.G., Beermann, D.H., Hansen, S.L., Linhares, D.C.L.,
Peschel, J.M., Rademacher, C.J., Reecy, J.M., Ross, J.W., Shepherd, T.A., Koltes, J.E.,
2019. At the intersection of industry, academia, and government: How do we facilitate
productive precision livestock farming in practice? Animals 9.
https://doi.org/10.3390/ani9090635
36. Reynolds, M., Kropff, M., Crossa, J., Koo, J., Kruseman, G., Molero Milan, A., Rutkoski,
J., Schulthess, U., Singh, B., Sonder, K., Tonnang, H., Vadez, V., 2018. Role of modelling
in international crop research: Overview and some case studies. Agronomy 8.
https://doi.org/10.3390/agronomy8120291
37. Ryan, M., 2020. Agricultural Big Data Analytics and the Ethics of Power. Journal of
Agricultural and Environmental Ethics 33, 49–69. https://doi.org/10.1007/s10806-019-
09812-0
38. Sarangi, A., Madramootoo, C.A., Cox, C., 2004. A decision support system for soil and
water conservation measures on agricultural watersheds. Land Degradation & Development
15, 49–63. https://doi.org/10.1002/ldr.589
39. Sarkar, M.B., Butler, B., Steinfield, C., 1995. Intermediaries and cybermediaries: Sarkar,
butler and steinfield. Journal of Computer-Mediated Communication 1, JCMC132.
58th International Scientific Conference on Economic and Social Development – Budapest, 04-05 September, 2020
134
40. Serazetdinova, L., Garratt, J., Baylis, A., Stergiadis, S., Collison, M., Davis, S., 2019. How
should we turn data into decisions in AgriFood? Journal of the Science of Food and
Agriculture 99, 3213–3219. https://doi.org/10.1002/jsfa.9545
41. Sgarbossa, F., Russo, I., 2017. A proactive model in sustainable food supply chain: Insight
from a case study. International Journal of Production Economics, Closed Loop Supply
Chain (CLSC): Economics, Modelling, Management and Control 183, 596–606.
https://doi.org/10.1016/j.ijpe.2016.07.022
42. Sharma, R., Kamble, S.S., Gunasekaran, A., Kumar, V., Kumar, A., 2020. A systematic
literature review on machine learning applications for sustainable agriculture supply chain
performance. Computers and Operations Research 119.
https://doi.org/10.1016/j.cor.2020.104926
43. Singh, A., Kumari, S., Malekpoor, H., Mishra, N., 2018. Big data cloud computing
framework for low carbon supplier selection in the beef supply chain. Journal of Cleaner
Production 202, 139–149. https://doi.org/10.1016/j.jclepro.2018.07.236
44. Smith, P., Martino, D., Cai, Z., Gwary, D., Janzen, H., Kumar, P., McCarl, B., Ogle, S.,
O’Mara, F., Rice, C., Scholes, B., Sirotenko, O., Howden, M., McAllister, T., Pan, G.,
Romanenkov, V., Schneider, U., Towprayoon, S., 2007. Policy and technological
constraints to implementation of greenhouse gas mitigation options in agriculture.
Agriculture, Ecosystems & Environment 118, 6–28.
https://doi.org/10.1016/j.agee.2006.06.006
45. Subudhi, B.N., Rout, D.K., Ghosh, A., 2019. Big data analytics for video surveillance.
Multimed Tools Appl 78, 26129–26162. https://doi.org/10.1007/s11042-019-07793-w
46. Sun, D.-W., 2014. Emerging Technologies for Food Processing. Elsevier.
47. Tan, B., Yin, Y., 2017. Environmental Sustainability Analysis and Nutritional Strategies of
Animal Production in China. Annual Review of Animal Biosciences 5, 171–184.
https://doi.org/10.1146/annurev-animal-022516-022935
48. Tranfield, D., Denyer, D., Smart, P., 2003. Towards a Methodology for Developing
Evidence-Informed Management Knowledge by Means of Systematic Review. British
Journal of Management 14, 207–222. https://doi.org/10.1111/1467-8551.00375
49. van Evert, F.K., Fountas, S., Jakovetic, D., Crnojevic, V., Travlos, I., Kempenaar, C., 2017.
Big Data for weed control and crop protection. Weed Research 57, 218–233.
https://doi.org/10.1111/wre.12255
50. Villa-Henriksen, A., Edwards, G.T.C., Pesonen, L.A., Green, O., Sørensen, C.A.G., 2020.
Internet of Things in arable farming: Implementation, applications, challenges and
potential. Biosystems Engineering 191, 60–84.
https://doi.org/10.1016/j.biosystemseng.2019.12.013
51. Vlajic, J.V., Lokven, S.W.M. van, Haijema, R., Vorst, J.G.A.J. van der, 2013. Using
vulnerability performance indicators to attain food supply chain robustness. Production
Planning & Control 24, 785–799. https://doi.org/10.1080/09537287.2012.666869
52. Weersink, A., Fraser, E., Pannell, D., Duncan, E., Rotz, S., 2018. Opportunities and
Challenges for Big Data in Agricultural and Environmental Analysis. Annual Review of
Resource Economics 10, 19–37. https://doi.org/10.1146/annurev-resource-100516-053654
53. Wolfert, S., Ge, L., Verdouw, C., Bogaardt, M.-J., 2017. Big Data in Smart Farming – A
review. Agricultural Systems 153, 69–80. https://doi.org/10.1016/j.agsy.2017.01.023
54. Xia, H., Houghton, J.A., Clark, J.H., Matharu, A.S., 2016. Potential Utilization of
Unavoidable Food Supply Chain Wastes–Valorization of Pea Vine Wastes. ACS
Sustainable Chem. Eng. 4, 6002–6009. https://doi.org/10.1021/acssuschemeng.6b01297
55. Zhang, Z., Huisingh, D., 2018. Combating desertification in China: Monitoring, control,
management and revegetation. Journal of Cleaner Production 182, 765–775.
https://doi.org/10.1016/j.jclepro.2018.01.233
58th International Scientific Conference on Economic and Social Development – Budapest, 04-05 September, 2020
135
BLACK BOX OF CSR: LITERATURE REVIEW
Loma Mashne
Széchenyi István University, Győr, Hungary
Zoltan Baracskai
Széchenyi István University, Győr, Hungary
ABSTRACT
Our study on Corporate Social Responsibility (CSR) literature reveales different gaps. The key
questions here are: Is CSR ready for understanding? What are the gaps in CSR liretaure
reviews? A literaure synthesis shows the heterogeneity of definitions, theories, and approaches
of CSR. However, our study had some limitations in terms of time allocated for the study of
literuature, as well as the limitation that most studies of CSR were conducted at orgganizational
level, while very few were found at the individual or social level.This shows that CSR is a typical
transdisciplinary problem space that can’t be solved using mono discpline. The CSR decision-
makers cognition and mindset have a huge influence on CSR engagement, but, no sufficient
studies were conducted, in fact, it is considered as a black box. Though, we perceive it as a
strength since it has defined the gap on which our further research and dissertation will be
dedicated to solving the CSR decision-makers cognition and mindset, using the
transdisciplinary approach.
Keywords: Corporate Social Responsibility (CSR), Decision-Makers Mindset, Cognitive
processes
1. DEFINITION OF CSR IN LITERATURE
Several years ago, the company social concerns have been examined by scholars (e.g. Berle
1931; Bowen 1953; Davis 1960; Carroll 1993). CSR has a long and divers’ history in literature
(Carroll 1999). It has been a subject of research for 70 years (Whitehouse 2006). Yet, scholars
have not reached to consensus definition for CSR. “One concern regarding CSR research is the
lack of clarity with respect to its definition and the dimensionality of the construct” (Rowley
and Berman 2000; McWilliam et al. 2006; cited in Yang et al. 2013). Defining CSR is
complicated (Sheehy 2014 cited in Kumar et al. 2016). It does not have a paradigm of its own
(Crane et al. 2008; Grafstorm and Windell 2011 cited in Kraus and Brtitzelmaier 2012; Preuss
et al. 2009; Carroll 1979; Bhattacharya and Sen 2004; Crowther and Capaldi 2008 cited in Cook
and He 2010). In addition, the definition has been varying in meaning and practice (Secchi
2007; Lee 2008; cited in Ismail 2009). Some scholars predicted that even in the future, there
will no common CSR definition (Okoye 2009 cited in Kraus and Brtitzelmaier 2012). Crane et
al. (2008, p. 5) state “few subjects in management arouse as much controversy and disputation
as CSR”. They also mention “fields of scholarship that CSR represents is a broad and diverse
one, encompassing debates from many perspectives, disciplines, and ideological positions”
(Crane et al. 2008, p. 7). Aguinis and Glavas (2012) conducted a literature review study based
on 588 journal articles and 102 books and book chapters, they emphasize the fragmentation of
CSR literature review in terms of level of analysis, and consider the reason for such
fragmentation is due to: 1) CSR is often studied from one level of analysis at a time. 2) CSR is
often studied at the macro level (institutions as well firms’ level) while neglecting the micro
level (individual level). They emphasize the urge for multilevel and multidisciplinary review
that encompasses and synthesize the various CSR research in a full and comprehensive fashion
(Aguinis and Glavas 2012).
58th International Scientific Conference on Economic and Social Development – Budapest, 04-05 September, 2020
136
The debate of CSR is traced back in 1930s when arguments of E. Merrick Dodd regarding the
role of managers, indicating that they have social responsibilities toward societies. In 1953,
CSR has been further conceptualized as a social obligation by Bowen (Taneja et al. 2011, p.
343), who had been identified as the “Father of corporate social responsibility” by (Carroll
1999, p. 270). Crane et al. (2008, p. 7) state that although CSR is lacking a well-defined
paradigm, however, this should not be considered as a weakness, since CSR is still in an
emerging status. Dahlsrud (2008, p.2) argued the phenomenon of biased definitions of CSR,
and examined 37 definitions by five dimensions: stakeholder dimension, social dimension,
economic dimension, voluntariness dimension and the environmental dimension. His results
found that environment aspect of CSR has less attention and is used haphazardly in the 37
definitions. Hopkins (2007, p. 15) states that defining CSR is an essential issue, he defines CSR
as “CSR is concerned with treating the stakeholders of the firm ethically or in a responsible
manner”. “ethically or responsible” indicates handling them and treating them in a way that is
considered acceptable in civilized societies. Davis (1973) cited in Jamali and Keshishian (2008)
defines CSR as “the firm’s consideration of, and response to issues beyond the narrow
economic, technical, and legal requirements of the firm …(that leads to accomplishment of)
social benefits along with the traditional economic gains which firm seeks”. Lantos (2001) cited
in Jamali and Keshishian (2008) classify CSR as per the nature of the activities in to: 1)
Obligatory versus voluntary, and 2) Purpose of company’s activities, has benefit for
shareholders, other stakeholders, or all. Vos (2003) defines CSR as “the obligations or duties
of an organization to a specific system of stakeholders”. Russell (2010, p. 44-50) provides a
comprehensive overview on different definitions of CSR, arguing that there is only a general
consensus among scholars on the core of the CSR idea, and that “social responsibility,
according to these definitions, refers to idealistic views on organizations execution activities
that protect and improve society’s wellbeing beyond the extent required to serve the direct
economic and technical interest of these organizations, thus the society at large”. Russell (2010,
p. 53-54) also discuss CSR definitions by businesses and society groups and concludes that
efforts to identify CSR “are more practical, localised and more often focused on sustainability”.
Regarding sustainability, Marrewijk (2003, p. 101-102) states that CSR and corporate
sustainability (CS) are synonyms, and defined both as: “In general, corporate sustainability and,
CSR refer to company activities- voluntary by definition, demonstrating the inclusion of social
and environmental concerns in business operation and in interactions with stakeholders”.
Blowfield and Murray (2008, p. 15) state that because of the several variables, it is not easy to
clarify what mix of responsibilities a company will face Therefore, companies should not search
for universal definition of CSR, instead they should plan their strategies around the perspective
of their stakeholders. Despite the variety of views on CSR, specific CSR characteristics are
identified. As most agree that CSR is compatible with profit-making and fulfilling societal
demands (Doane 2004a). As Vogel (2005, p. 19) states “virtually all contemporary writing on
CSR emphasizes its link to corporate profitability”. In addition, contemporary views of CSR
practices highlight the voluntary aspect of it that goes beyond what imposed by legislative
norms (e.g. Carroll 1979; Davis 1973; McWilliams and Siegel 2001). Even more, CSR can be
viewed as an initiative that encourage self-regulation of business as a substitute for state
regulation (Albareda 2008; Crane et al. 2008; Zadek 2001). Based on the literature review, we
understand the existence of different CSR definitions, such definitions hold the core idea of
CSR, which is the social responsibility of organizations to protect and improve the well-being
of the society, beyond their direct economic interest. Some scholars argue that there will be no
universal definition of CSR, and firms should plan their CSR strategies around the perspective
of their own stakeholders. More research is encouraged to cover this gap.
58th International Scientific Conference on Economic and Social Development – Budapest, 04-05 September, 2020
137
2. OVERLAPPING TERMS
With the increasing recognition of CSR concept, several overlapping terms and concepts
emerged, for example, sustainability, social accountability, corporate citizenship, corporate
responsiveness, business ethics and corporate social performance (Lozano 2013). However,
comprehensive, and commonly accepted definition of these terms and concepts have not been
established yet. Therefore, CSR can be considered as a starting point for these overlapping
terms, as they embrace the CSR logic into them and can be viewed as another approach of
framing the CSR (Grafstrom and Windell 2011, p. 221). We believe that CSR is still an
emerging field, and there is a need for further research to identify commonalities and
differences between these terms.
3. CSR PRACTICES
CSR is considered as perception oriented, thus, its’ practices may differ in every society
(Wether and Chandler 2006 cited Kraus and Brtitzelmaier 2012); Husted and De Jesus Salazar
2006; McWilliams et al. 2006 cited in Fenwick and Beirema 2008), due to cultural differences
and the relative importance of certain practice to such society which is affected by the
availability and absence of such resources, for example; finance, organization size, traditions,
as well as societal position toward various issues (Yang et al. 2013). Its practice may even differ
in each industry (Tuzzolino and Armadi 1981). The CSR practice can be categorized into seven
categories: environmental sustainability, enhancing local community well-being, promoting
rights of employees and suppliers, competitors or customers, transparent and honest
accountability, legal and honest operations, and global citizenship to promote social and
environmental justice (Crowther and Rayman-Bacchus 2004; Hopkins 2003; cited in Fenwick
and Bierema 2008). Organizational responsibilities and duties toward their society are social,
economic, and environmental (Enderle 2004 cited in Yang et al. (2013), as the triple bottom
line of an organization (Porter and Kramer 2006 cited in Yang et al. 2013; Davis and Crane
2010). According to L’Etang (1995), there are three CSR classification for practical guidance:
1) Direct responsibility: it refers to responsibilities and duties included in the company’s
mission, culture, objectives, and issues related to well-being of employees. The scope of which
decision-making is shared and advanced would affect which CSR can be recognized to the
company (as a whole). 2) Indirect responsibility: it comes from the company’s position in the
society, which is difficult to define, for example; with the respect to environment, it is
challenging to localize CSR, as environmental effects do not recognize national boundaries. 3)
Corporate philanthropy: it is not CSR, as it is performed because of perceiving it as a good act.
We understand that CSR is viewed as perception-oriented, thus, its practices may differ from
one society to another according to the cultural differences and the relative importance of the
practice to its society. Some scholars support the fact that no universal practice can be reached.
Others argue that it is a challenging issue to localization CSR practices. Thus, we suggest more
research on this topic to cover this gap in CSR literature review.
4. FRAMEWORKS AND THEORIES
Another evidence of CSR fragmentation, and its focus on one level of analysis at a time, is the
existence of different CSR theories. For example, scholars researching CSR at the institutional
level of analysis, often use institutional theory. Others studying the CSR at the organizational
level, tend to use different theories, such as resource-based view of the firm. Whilst scholars
studying CSR at the individual level, often tend to use different theoretical frameworks such as
organizational justice, and social influence theories (Aguinis and Glavas 2012). Gray, Owen,
and Adams (2010, p. 6), define theory as “Theory is, at its simplest, a conception of relationship
between things. It refers to a mental state or framework and, as a result, determines, inter alia,
how we look at things, how we perceive things, what things we see as being joined to other
58th International Scientific Conference on Economic and Social Development – Budapest, 04-05 September, 2020
138
things and what we see as good and what we see as bad”. However, a combination of
interrelated concepts is considered a theoretical framework which may contain a single theory
or a collection of several theories (Collis and Hussey 2009; An et al. 2011). The literature
review shows that firms, are increasingly adopting CSR, although no commonly agreed
theoretical perspective exists in explaining firm’s behaviour in connection to CSR practices,
and there is several variation in theoretical perspectives that have been applied (Gray et al.
1995a; Deegan et al. 2002; Belal 2008; Gray et al. 2010). The CSR discipline is a highly
complex one, thus, no single theory can explain it. Gray et al. (2010, p. 9) state that “we tend
to assume that theory is always incomplete in social sciences”, they also emphasize that the
existing of several theories should be seen as complementary to each others, rather than
competing. Several theoretical perspectives emerged to clarify the firm’s adoption of CSR
(McWilliams et al. 2006). According to Ismail (2009), there are three classification for CSR
theories:
a) The Utilitarian Theory: Firm’s aim is economic in nature, and they perform CSR activities
with the focus on local community, such acts are related to competitive strategy (Friedman,
1970). The classification of this theory goes under “social cost” of the organization as well
as “functionalism”. The social cost refers to the non-economic factors that affect the
socioeconomic factors of the local community. Functionalism refers that the organization
is part of the economy with the objective of making profit (Porter and kramer 2002; Litz
1996).
b) The Managerial Theory: External elements are considered in this theory. It is classified into
corporate social performance (CSP), Social Accountability Auditing and Reporting
(SAAR), and Social Responsibility for multinationals. It is about measuring the economic
impact of socially responsible activities (Garriga and Mele 2004; Wood and Logsdon 2002;
Detomasi 2008).
c) The Relational Theory: It is based on the relation between the business and its environment
and categorized into 1) Business and society: viewing business as part of its environment,
thus has obligations toward it. 2) Stakeholder approach: managers need to balance the need
of their stakeholders. 3) Corporate citizenship: it is related to local community. 4) Social
contract: the economic act of the business must be ethical in nature (Garriga and Mele’s
2004).
Based on the literature review above, we understand the existence of different CSR theories
and frameworks. The CSR discipline a highly complex discipline. Some scholars advocate that
no single theory can explain the full discipline in a comprehensive fashion. Others call for a
comprehensive theoretical framework that encompasses all CSR disciplines. Thus, it is a good
opportunity for further future study and research to cover this gap in CSR literature review.
5. MOTIVES FOR CSR
Previously, CSR was perceived as a tool of managing reputation, and was viewed as voluntary
act (Waddock 2004; Googins et al. 2008; cited in Lavine 2012). However, the perception has
evolved, and CSR is seen as adding value to the company, therefore, strategic CSR came into
place (Lavine 2012). Studies have proved that CSR practices benefit the firms by increasing
return on stocks (Cornell and Shapiro 1987 cited in Edmans 2012). The employee welfare
dimension of CSR improves stock returns (Edmans 2012). Bragdon and Marlin 1972; Parket
and Eilbirt 1975; Cochran and Wook 1984; McGuire et al. 1988 cited in Edmans (2012) observe
positive relation between CSR and company’s accounting performance. Roman et al. 1999;
Margolis and Walsh 2003 cited in Edmans (2012) found that most studies result a positive
relationship between CSR and finance performance of a firm, also CSR increase job satisfaction
of employees and promote citizenship attitude (Organ 1988 cited in Edmans 2012).
58th International Scientific Conference on Economic and Social Development – Budapest, 04-05 September, 2020
139
It contributes not just, in attracting, but also in retaining high quality employees (Greening and
Turban 2002; Greening and Turban 1997; cited in Edmans 2012). Thus, we can say that the
main objective is to make the adoption of CSR practice more attractive to managers (King and
Toffel 2009). Illustrating that adoption of CSR may be beneficial for them and contribute to
help the managers to understand why they need to pay attention to social and environmental
concerns, while, also it presents the CSR as a topic that add to shareholders value, or at least
not decreasing it (Blowfield and Murray 2008). Nevertheless, reverse causality in such studies
has been debatable (Waddock and Graves 1997; Orlitzky et al. 2003; cited in Edmans 2012).
Suggestions have been raised to further study the causality issue (Cochran and Wood 1984 cited
in Edmans 2012). The literature is largely split between approaches that consider CSR as
externally driven, or internally driven, or a mix of both at the same time. No firm conclusion
has been reached yet (Muller and Kolk 2010).
5.1. External Motives
Several studies highlighting the influence of external factors, which motivate firms to adopt
CSR practices. Muller and Kolk (2010) emphasize the link between external pressure as
shareholders demands, regulations or peers’ pressure and adoption of CSR practices. For
example, (Deegan et al. 2002) indicate a positive relationship between media attention and
firm’s social and environmental actions. The role of government is considered a substantial
driver for firm’s engaging with CSR. According to (Aguilera et al. 2007; Moon and Vogel
2008) governments motivate firms to be socially responsible through: First, enforcement of
laws supporting adoption of CSR. Second, endorsement, this could be for example, through
governments attempts in raising business awareness to deal with specific CSR matters that the
government is incapable to deal with, thus, endorse the firms to do so. Third, guidance, where
governments offer supporting several self-regulatory tools to facilitate the implementation of
CSR by firms. Finally, partnering, such cases when government inter into partnership with
businesses to fulfil CSR matters (Bartley 2003; Darnall and Edwards Jr 2006; Delmas and
Toffel 2003; Jiang and Bansal 2003; Waddock et al. 2002; Weaver et al. 1999).
5.2. Internal Motives
Some scholars perceive that firms voluntarily adopt CSR practices to facilitate opportunistic
rather than responsible act (Campbell 2007; Lenox 2006). Others view that firms adopt CSR as
a signal of superior performance over their competitors (Campbell 2007; Lenox 2006), and as
a sign to secure legitimacy and competitive advantage. Some scholars argue that firms engage
in CSR to be able to satisfy their own benefits, including reputation enhancement; avoid costs
stemming from litigation; attract investors; improve their competitiveness and market
positioning; as well as improve their operational efficiency (Bansal and Hunter 2003; Waddock
and Graves 1997). While others argue that firms engage in CSR because of obligations and
sense of responsibility that they develop, and not for economic reason (Davis et al. 1997;
Heugens et al. 2008).
5.3. Combining Internal and External Motives
Some scholars like Husted and Salazar (2006), identify three categories for motives: a) Strategic
CSR, its when firms expecting economic returns from engaging into CSR practices. b) Coerced
egoism, its when firms engage in CSR because being compelled by regulations to act so. c)
Altruism, its when firms engage in CSR because they believe in it, and believe it is the right
thing to do. Weaver et al. (1999) argue that CSR engagement is influenced by both external
expectations of legitimacy and top management commitments to ethics as well as to financial,
operational, and strategic concerns.
58th International Scientific Conference on Economic and Social Development – Budapest, 04-05 September, 2020
140
We understand from the review, that no solid conclusion has been reached regarding the CSR
motives, is it externally driven? Internally driven? Or a combination of both? Another literature
gap is identified here. The reverse causality between shareholders value and the existence of
CSR practices is also another gap in CSR literature. We believe such gaps in the literature
review need further study and research.
6. DECISION-MAKERS COGNITION
The managerial cognition referes to the capacity and tendency to coduct thorough analytical
details using the intuitive processing strategies (Hodgkinson and Clarke 2004), and refers to the
ability to process complex information by performing analytical thinking, including the ability
to switch from past experience to present situation (Messick 1984). Each person uses different
ways to process information. Lewis (2002) states that each strategic decision-maker choose
approaches depented on his circumstances, objectives and personal preferences, and his
decision is consrained by societal, sectoral, environmental and organizational factors. Thus, if
strategiest choose the appraoch depending on their personal circumstance, this suggests that
strategic thinking is a concious individual mental process. Hodgkinson and Sparrow (2002)
expalain that the decision-making process has two complementary processes: 1) A largely
automatic , pre-conscoius process that includes developing and using heuristics (based on past
expeince); and 2) A deeper, more effortful process that includes detailed analysis. Thus, people
construct meanings and make sense by establishing mental representations that direct their
thinking and ultimately their decisions (Rumelhart and Norman 1985). This reveal how
strategiest decisions often reflect their personal views that is formulated upon their past
experience, it is called as reasoning by analogy (Jarzabkowski and Seidl 2007), which is subject
to biases, since complex problems being based on personal past expeirences (Hambrick and
Frederickson 2001).
6.1. Individual and Corporate Values
Schwartz (1992, p. 2) defines values as “desirable states, objects, goals or behaviours
transcending specific situations and applied as normative standaards to judge and choose among
alternative modes of behavoiur”. Values, are seen as strong informal regulatory guids during
the decision-making, that influence individuals as well as manegerial cognition. For example,
values determain modes of behaviour that are socially acceptable and act as normative
regulatory guid for individuals (Meglino and Ravlin 1998). Pech and Durden (2003) illustrate
that decisions are normally filtered through attitudes, beliefs and values; where poor decision-
making happenes when filtering of information conflicts with individual perceptions and
values. Thus, resulting in poor evaluationa and assessment. In a study made by Gallen (2006)
on 70 managers, he found that managers cognitive style and values affect the strategies they
preferred. Therefore, strategy is linked to strategist’s view of how firms should operate and
fuction (Hambrick and Mason 2001; Pant 1998). Given that managerial cognition influences
decisoin-making and competitive strategies, hence, the congnitive side of strategist is a key to
our understanding of how competitive organizations are developed (Buksar 1999). Personal
values are part of the decision-making processes whether the person notice it or not, hence, it
is essential to understand how values affect participation in CSR. We understand from the
review that managers cognitive style and values affect the strategies they preferred, and influnce
their decisions, thus, we believe that understanding their cognitive style and values would
enhance the overall performance of the firms and positively affect their competitive positions.
6.2. CSR Mindset
A mindset has several terms as cognitive structure, cognitive filter, mental model, and cognitive
framework, all can be as an abstract model comprising of conceptual structure for symbolizing
58th International Scientific Conference on Economic and Social Development – Budapest, 04-05 September, 2020
141
the knowledge and sets of processes that work on those structures (Aitkenhead and Slack 1985).
A person’s mindset influences the process of attention (i.e. information acquisition) through
focusing his attention on selective aspects of the surroundings, interpretations, sensemaking
(information perception, interpretation, assimilation, as well as comprehension), decision-
making, and action (Daft and Weick 1984). The cognitive side of CSR and the CSR mindset of
managers, is still in need for investigation to be understood, some scholars argue that the reason
for this is that the term CSR is not considered at the personal/individual level (Secchi 2009).
Others relate it to considering the cognitive structure of CSR is conceptualized as a one-
dimensional form that is connected to managerial values (Waddock and Graves 1997;
Hemingway and Maclagan 2004). According to Hay and Gray (1974) study on
conceptualization of CSR, they considered managerial behaviours toward CSR are
characterized by number of values and are categorized into three categories: the profit-
maximization manager, the trusteeship manager, and the quality of life manager. Nevertheless,
it is more reasonable to conceptualize CSR mindset from a multi-dimensional perspective. Boal
and Peery (1985) identified three conceptually distinctive cognitive dimensions of CSR: 1)
economic/market values vs, non-economic/human values (this was the most important
dimension), 2) ethics, and 3) consequences for relevant interest group. The multidimensional
attitudes of CSR have been further confirmed by Waldman et al. (2006) study of the values of
top management in 15 countries, where they identify CSR dimensions as: 1) shareholder/owner,
2) broader stakeholder relations (responsibility toward non-financial stakeholders, such as
employees and consumers groups), and 3) community state welfare (responsibilities for the
larger societal group beyond the immediate stakeholder groups). Secchi (2009) also believes in
conceptualizing CSR mindset as a multidimensional one that consists of economic and non-
economic dimensions. In Aguinis and Glavas (2012) literature review of CSR at individual
level, they find that managers’ assertiveness on CSR values is linked with employees’ view of
visionary leadership, that is positively encouraging employees to perform better, thus, affecting
the firm performance positively. They also find that several normative incentives affect
conducting CSR activities, such as being consistence with individual’s values and concerns,
thus, if both are on the same track (normative incentives as well as individual values and
concerns) that is a strong indication of person’s engagement in CSR. Abugre and Nyuur (2015)
state that managers are the role model within the firms, they infuse the corporate values to the
employees, and when senior managers express commitments to such values, this attitude is
usually spread all over the firm to all levels (Hawkins 2006). This is emphasized by the
statement of Abugre and Nyuur (2015, p. 166) “Today, organizations cannot survive or prosper
without members behaving as good citizens by engaging in positive organization-relevant
behaviour associated with CSR. Corporate social responsibility is a critical emerging issue in
organization management”. Hence, managers have a role in identifying and demonstrating
behaviours that encourage as well as advance CSR in the firms. The research on CSR
considered management mindset and the potential impact of managerial values and attitudes
toward CSR as the main driving forces in directing the firms toward socially responsible targets
(Swanson 2008). William and Aguilera (2008) also emphasize that managerial values towards
CSR will possibly affect on organizational level decisions. Hay and Gray (1974) argue that
CSR managerial mindset can be affected by the individual manager’s own system of core
beliefs and values, where the content of individual manager’s CSR mindset in terms of
information, knowledges are usually processed and stored. According to Aguilera et al. (2007)
study, they argue that managerial values and attitudes towards CSR are not the same in all
countries, rather, they vary across countries due to different local norms, social institutional
constraints, and the level of industrialization in each country. Thus, the content of individual
manager’s CSR mindset may vary due to differences between individuals and across cultures
(Steinbruner 1974; Walsh 1995).
58th International Scientific Conference on Economic and Social Development – Budapest, 04-05 September, 2020
142
We realize from the literature review that CSR is a critical emerging issue in organization
management, and the cognitive side of CSR and the CSR mindset of managers, is still in need
for more research, since it has not been investigated sufficiently. Some scholars argue that the
reason for such gap in literature review, is that the term CSR has been neglected at the
personal/individual level, and advocate to be investigated as a multidimensional discipline that
consists of economic and non-economic dimensions. Therefore, we believe more studies and
research should focus on this essential topic to bridge the existing gap in CSR literature review.
7. RESEARCH GAP
A research gap refers to having available knowledge, while missing needed knowledge to
bridge the gap in the literature. In our study we find that the managerial decision-making
process in CSR is considered as a black box. the decision-makers cognitive side and mindset is
still in need for more research and study since it has not been studied sufficiently (Wang et al.
2015). Financial benefits as profit maximization and other non-financial benefits such as talent
management (Bhattacharya et al. 2008), risk aversion (Kytle and Singh 2005), as well as brand
differentiation (Paluszek 2005), have mentioned as incentives for managers to engage in social
responsibility (Waldman et al. 2004), such studies contributed toward conceptualization of
CSR, while there is little research on the influence of managerial attitude toward CSR, and
regarding the role of senior management in CSR practice. Waldman et al. (2004, p. 4) state that
the existing views and models of CSR “do not take into account the personal attributes or
qualities of senior managers which may affect the extent to which firms engage in CSR”.
Several scholars mentioned the lack of research on organizational and managerial perspective
of CSR (Maak and Pless 2009; Metcalfe and Sayed 2012).
8. FINDING
Our study on CSR literature proves the heterogeneity, transdisciplinary, and fragmentation of
CSR, which provide golden opportunities for further future research. We conclude that there is
a problem lies in the research of CSR, as our finding proves that CSR has not been investigated
at a transdisciplinary level of approach. Most articles were covering the CSR at the
organizational level, but not at the individual or social level. The managerial decision-making
is based on the consideration of where the firm has been in the past, where it is currently now,
and how it endure and compete in a dynamic atmosphere in the future. In our study, we find
that the decision-makers cognition and mindset have a huge influence on CSR engagement.
Nevertheless, no sufficient studies covering this essential topic were found. The novelty of my
research is that I would like to conduct my dissertation using the transdisciplinary approach in
solving the CSR decision-markers cognition and mindset, to bridge the gap in CSR literature in
this particular problem that we discovered.
LITERATURE:
1. Abugre, J.B, & Nyuur, R. B. (2015) Organization’s commitment to and communication of
CSR activities: Insights from Ghana. Social Responsibility Journal, 11(1), 161-178.
2. Aguinis, H., & Glavas, A. (2012). What we know and don’t know about corporate social
responsibility. Journal of Management, 38(4), 932–968.
3. Aguilera, R.V., Rupp, D.E., Williams, C. A., & Ganapathi, J. (2007). Putting the S back in
corporate social responsibility: A multilevel theory of social change in organizations.
Academy of Management Review, 32 (3), 836-863.
4. Albareda, L. (2008). Corporate responsibility, governance, and accountability: From self
regulation to co-regulation. Corporate Governance, 8(4), 430-439.
5. An, Y., et. al. (2011). Towards a comprehensive theoretical framework for voluntary IC
disclosure. Journal of Intellectual Capital, 12(4), 571-585.
58th International Scientific Conference on Economic and Social Development – Budapest, 04-05 September, 2020
143
6. Aitkenhead, A., & Slack, J. (1995). Issues in cognitive modelling. London: Erlbaum in
association with the Open University.
7. Bansal, P., & Hunter, T. (2003). Strategic explanations for the early adoption of ISO 14001.
Journal of Business Ethics, 46(3), 289-299.
8. Bartley, T. (2003). Certifying forest and factories: States, social movements, and the rise of
private regulation in the apparel and forest products field. Politics and Society, 31(3), 433-
464.
9. Belal, I., A. R. (2008). Corporate social responsibility reporting in developing countries:
The case of Bangladesh. Ashgate Publishing, Aldershot, U.K.
10. Berle, A. A. (1931). Corporate powers as powers in trust. Harvard Law Review, 44, 1049-
1074.
11. Bhattacharya, C. B., Sankar, S., & Korschun, D. (2008). Using corporate social
responsibility to win the war for talent. MIT Sloan Management Review, 49(2), 37-44.
12. Blowfield, M., & Murray, A. (2008). Corporate responsibility: A critical introduction.
Oxford: University Press.
13. Boal, K., B., & Peery, N. (1985). The cognitive structure of corporate social responsibility.
Journal of Management, 11(3), 71-82.
14. Bowen, H. R., (1953). Social responsibility of the businessman. New York: Harper-Row.
15. Buksar, J. R. (1999). Strategic Bias: The impact of cognitive biases on strategy. Canadian
Journal of Administrative Sciences, 16(2), 105-117.
16. Campbell, J. L. (2007). Why would corporates behave in socially response ways? An
institutional theory of corporate social responsibility. Academy of Management Review,
32(3), 946-967.
17. Carroll, A. B. (1979). A three-dimensional conceptual model of corporate performance.
Academy of Management Review, 4(4), 497-505.
18. Carroll, A. B. (1993). Business and society: Ethics and stakeholder management. 2nd ed.,
Cincinnati, OH: South Western Publishing.
19. Carroll, A. B. (1999). Corporate social responsibility: Evolution of a definitional construct.
Business Society, 38(3), 268-295.
20. Collis, J., & Hussey, R. (2009). Business research: A practical guide for undergraduate
and postgraduate students. Palgrave Macmillan, Basingstoke, U.K.
21. Cook, F. L., & He, Q. (2010). Corporate social responsibility and HRM in China: A study
of textile and apparel enterprises. Asia Pacific Business Review, 16(3),355-376.
22. Crane, A., McWilliams, A., Matten, D., & Siegel, D. (2008). The oxford handbook of
corporate social responsibility. Oxford: Oxford University Press, pp 3-15.
23. Dahlsrud, A. (2008). How corporate social responsibility is defined: An analysis of 37
definitions. Corporate Social Responsibility and Environments Management, 15(1), 1-13.
24. Darnall, N., & Edwards Jr, D. (2006). Predicting the cost of environmental management
system adoption: The role of capabilities, resources, and ownership structure. Strategic
Management Journal, 27(4), 301-320.
25. Davis, K. (1960). Can business afford to ignore social responsibility? California
Management Review, 2, 70-76.
26. Davis, K. (1973). The case for and against business assumption of social responsibilities.
Academy of Management Journal, 16(2), 312-322.
27. Davis, J. H., Schoorman, F. D., & Donaldson, L. (1997). Toward a stewardship theory of
management. Academy of Management Journal, 22(1), 20-47.
28. Davis, I. A., & Crane, A. (2010). Corporate social responsibility in small and medium size
enterprises: Investigating employee engagement in fair trade companies. Business Ethics:
A European Review, 19(2), 126-139.
58th International Scientific Conference on Economic and Social Development – Budapest, 04-05 September, 2020
144
29. Deegan, C., Rankin, M., & Tobin, J. (2002). An examination of the corporate social and
environmental disclosures of BHP from 1983- 1997: A test of legitimacy theory.
Accounting, Auditing & Accountability Journal, 15(3), 312-343.
30. Delmas, M. A. & Toffel, M., W. (2003). Institutional pressure and environmental
management practices, 11th International conference of the Greening of Industry Network.
San Francisco: University of Berkeley.
31. Detomasi, D. (2008). The Political roots of corporate social responsibility. Journal of
Business Ethics, 82(4), 807-819.
32. Doane, D. (2004a). Beyond corporate social responsibility: Minnows, mammoths, and
markets. Future, 37(2-3), 215-229.
33. Daft, R. L., & Weick, K. E. (1984). Toward a model of organizations as interpretation
systems. Academy of Management Review, 9(2), 284-295.
34. Edmans A. (2012). The link between job satisfaction and firm value, with implications for
corporate social responsibility. Academy of Management Journal, 26(4), 1-19.
35. Fenwick, T., & Bierema, L. (2008). Corporate social responsibility: Issues for human
resource development professionals. International Journal of Training and Development,
12(1), 24-35.
36. Friedman, M. (1970). The social responsibility of business is to increase its profits. The New
York Times Magazine, 122-126.
37. Gallen, T. (2006). Managers and strategic decisions: Does the cognitive style really matter.
Journal of Management Development, 25(2), 118-133.
38. Garriga, E., & Mele, C. (2004). Corporate social responsibility theories: Mapping the
territory. Journal of Business Ethics, 53, 51-71.
39. Grafstrom, M., & Windell, K. (2011). The role of infomediaries: CSR in the business press
during 2000-2009. Journal of Business Ethics, 103(2), 221-237.
40. Gray, R., et. al. (1995a). Corporate social and environmental reporting: A review of the
literature and longitudinal study of UK disclosure. Accounting, Auditing & Accountability
Journal, 8(2), 47-77.
41. Gray, R., et. al. (2010). Some theories for social accounting: a review essay and a tentative
pedagogic categorisation of theorisations around social accounting. In: M. Freedman & B.
Jaggi (Ed.), Sustainability, environmental performance and disclosure: Advances in
environmental accounting and management, Emerald Group Publishing, Bingley, UK,
pp154.
42. Hambrick, D. C., & Freferickson, J. (2001). Are you sure you have a strategy? Academy of
Management Executive, 15(4), 48-59.
43. Hambrick, D. C., & Mason, P.A. (2001). Upper echelons: The organization as a reflection
of its top manager. Academy of Management Review, 9, 193-206.
44. Hawkins, D. E. (2006). Corporate social responsibility: Balancing tomorrow’s
sustainability and today’s profitability. United Kingdom: Palgrave Macmillan.
45. Hay, R., & Gray, E. (1974). Social responsibilities of business managers. Academy of
Management Journal, 17(1), 135-143.
46. Hemingway, C. A., & Maclagan, P.W. (2004). Managerial personal values as drivers of
corporate social responsibility. Journal of Business Ethics, 50(1), 33–44.
47. Heugens, P.P. M. A. R., Kaptein, M., & Oosterhout, J. V. (2008). Contracts to communities:
A process model of organizational virtue. Journal of Management Studies, 45(1), 100-121.
48. Hodgkinson, G. P., & Sparrow, P. R. (2002). The competent organization: A psychological
analysis of the strategic management process. Open University Press, Buckingham.
49. Hodgkinson, G. P., & Clarke, I. (2004). Toward a cognitive resource theory of
organizational strategizing. Advanced Institute of Management, Leeds.
58th International Scientific Conference on Economic and Social Development – Budapest, 04-05 September, 2020
145
50. Hopkins, M. (2007). Corporate social responsibility & international development: Is
business the solution? Earthscan, London.
51. Husted, B. W., & Salazar, J. D. J. (2006). Taking Friedman seriously: maximizing profits
and social performance. Journal of Management Studies, 43(1), 75-91.
52. Ismail, M. (2009). Corporate social responsibility and its role in community development:
An international perspective. The Journal of International Social Research, 2(9), 199-209.
53. Jamali, D., & Keshishian, T. (2008). Uneasy alliances: Lessons learned from partnerships
between business and NGOs in the context of CSR. Journal of Business Ethics, 84, 277-
295.
54. Jarzabkowski, B. J., & Saidl, D. (2007). Strategizing: the challenges of a practice
perspective. Human Relations, 60(1), 5-27.
55. Jiang, R. J., & Bansal, P. (2003). Seeing the need for ISO 14001. Journal of Management
Studies, 40(4), 1047-1067.
56. King, A. A., & Toffel, M. (2009). Self-regulation institutions for solving environmental
problems: Perspectives and contributions from the management literature. In: Delmas, M.,
& Young, O. (Eds), Governance for the environment. New perspectives: 98-116,
Cambridge: Cambridge University Press.
57. Kraus, P., & Brtitzelmaier, B. (2012). A literature review on corporate social responsibility:
Definitions, theories, and recent empirical research. International Journal of Management
Cases, 14(4), 282-296.
58. Kumar, S., Das, S., & Kumar, S. (2016). Understanding of management challenges that
diminish the effectiveness of corporate social responsibility initiatives. In: B.S. Sahay, S.
Das, B. Chatterjee, G. Subramaniam, & R. Venkata Rao (Ed). Corporate Social
Responsibility, The New Paradigm, (83-101). New Delhi: Bloomsbury.
59. Kytle, B. & Singh, P. (2005). Corporate social responsibility as risk management: A model
for multinationals, social responsibility initiative (working paper No. 10), John, F. Kennedy
School of Government, Harvard University, Cambridge, MA.
60. Lavine, M. (2012). Exploring the relationship between corporate social performance and
work meaningfulness. Journal of Corporate Citizenship, 53-70.
61. Lenox, M. J. (2006). The role of private decentralized institutions in sustaining industry
self-regulations. Organization Science, 17(6), 677-690.
62. L’Etang, J. (1995). Ethical corporate social responsibility: a framework for managers.
Journal of Business Ethics, 14(2), 125-135.
63. Lewis, D. (2002). The place of organizational politics in strategic change. Strategic Change,
11, 25-34.
64. Litz, R. A. (1996). A resource-based-view of the socially responsible firm: Stakeholder
interdependence, ethical awareness, and issue responsiveness as strategic assets. Journal of
Business Ethics, 15(12), 1355–1363.
65. Lozano, R. (2013). Are companies planning for organizational change for corporate
sustainability? An analysis of three case studies on resistance to change and their strategies
to overcome it. Corporate Social Responsibility and Environmental Management, 20(5),
275-295.
66. Maak, T. & Pless, N. M. (2009). Business leaders as citizen of the world. Advancing
humanism on a global scale. Journal of Business Ethics, 88(3), 537-550.
67. Marrewijk, M. van, (2003). Concepts and definitions of CSR and corporate sustainability:
Between agency and communication. Journal of Business Ethics, 44(2/3), 95-105.
68. McWilliams A., & Siegel, D. (2001). Corporate social responsibility: A theory of the firm
perspective. Academy of Management Review, 26(1), 117-127.
69. McWilliams A., Siegel, D., & Wright, P. (2006). Guest editors’ introduction, corporate
social responsibility: Strategic implications. Academy of Management Studies, 43(1), 1-18.
58th International Scientific Conference on Economic and Social Development – Budapest, 04-05 September, 2020
146
70. Meglino, B. M., & Ravlin, E. C. (1998). Individual values in organizations: Concepts,
controversies, and research. Journal of Management, 24(3), 351-389.
71. Messick, S. (1984). The nature of cognitive styles: problems and promises in educational
practice. Educational Psychologist, 19(2), 59-74.
72. Metcalfe, B. D. & Syed, J. (2012). Globalization, development, and Islamic business ethics.
Call for papers for the special issue of Journal of Business Ethics.
73. Moon, J. & Vogel, D. (2008). Corporate social responsibility, government, and society. In:
Crane, A., McWilliams, A., Matten, D., Moon, J., & Siegel, D. (Eds). The oxford handbook
of corporate social responsibility: 303-323, Oxford: Oxford University Press.
74. Muller, A. & Kolk, A. (2010). Extrinsic and intrinsic drivers of corporate social
performance: Evidence from foreign firms in Mexico. Journal of Management Studies,
47(1), 1-26.
75. Okoye, A. (2009). Theorising corporate social responsibility as an essential contested
concept: Is a definition necessary? Journal of Business Ethics, 89(4), 613-627.
76. Paluszek, J. (2005). Ethics and brand value: Strategic definition. PowerPoint presentation
at the business and organizational ethics partnership meeting at the Markkula centre for
applied ethics, Santa Clara University, April 6-7.
77. Pant, P. N. (1998). Value incongruity and strategic choice. Journal of Management Studies,
35(2), 195-212.
78. Pech, R. J., & Durden, G. (2003). Manoeuvre warfare: A new paradigm for business
decision making. Management Decision, 41(2), 168-179.
79. Porter M.E., & Kramer, M. R. (2002). The competitive advantage of corporate
philanthropy. Harvard Business Review, 80(12), 56-68.
80. Rumelhart, D. E., & Norman, D. A. (1985). Representation of knowledge. In: Aitkenhead,
A. M., and Slacks, J. M., (Eds), Issues in cognitive modelling, Lawrence Erlbaum
Associates, London.
81. Russell, E. O. (2010). CEO and CSR: Business leaders and corporate social responsibility.
In: Dissertation.
82. Schwartz, S. H. (1992). Universals in the content and structure of values: Theory and
empirical tests in 20 countries in Zanna, M. (ed), Advance in experimental social
psychology. Academic Press, New York, NY, 1-65.
83. Secchi, D. (2009). The cognitive side of social responsibility. Journal of Business Ethics,
88(3), 565-581.
84. Steinbruner, J. D. (1974). The cybernetic theory of decision: New dimensions of political
analysis. Princeton, NJ: Princeton University Press.
85. Swanson, D. L. (2008). Top managers as drivers for corporate social responsibility. In. A.
Crane, D. Matten, A. McWilliams, J. Moon, & D. Siegel (Ed.), The Oxford Handbook of
Corporate Social Responsibility (pp 227-248). Oxford, UK: Oxford University Press.
86. Taneja, S. S., Taneja, P. K., & Gupta, R. K. (2011). Research in corporate social
responsibility: A review of shifting focus, paradigms, and methodologies. Journal of
Business Ethics, 101(3), 343-364.
87. Tuzzolino, F., & Armandi, B. R. (1981). A need-hierarchy framework for assessing
corporate social responsibility. Academy of Management Review, 6(1), 21-28.
88. Vos, J. F. (2003). Corporate social responsibility and the identification of stakeholders.
Corporate Social Responsibility and Environmental Management, 10(3), 141-152.
89. Waddock, S., & Graves, S. B. (1997). Corporate social performance, finance performance
link. Strategic Management Journal, 18(4), 30-319.
90. Waddock, S., Bodwell, C., & Graves, S. B. (2002). Responsibility: The new business
imperative. Academy of Management Executive, 16(2), 132,148.
58th International Scientific Conference on Economic and Social Development – Budapest, 04-05 September, 2020
147
91. Walsh, J. O. (1995). Managerial and organizational cognition: Notes from a trip down
memory lane. Organization Science, 6(3), 280-321.
92. Waldman, D., Siegen, D., & Javidan, M. (2004). CEO transformational leadership and
corporate social responsibility, (working paper No. 0415). NY, USA: Rensselaer Working
Papers in Economics, Department of Economics, Rensselaer Polytechnic Institute.
93. Waldman, D. A., et. al. (2006). Cultural and leadership predictors of corporate social
responsibility values of top management: A GLOBE study of 15 countries. Journal of
International Business Studies, 37(6), 823-837.
94. Wang, S., Gao, Y., Hodgkinson, G. P., Rousseau, D. M., & Flood, P. C. (2015). Opening
the black box of CSR decision making: A policy-capturing study of charitable donation
decisions in China. Journal of Business Ethics, 128(3), 665-683.
95. Weaver, G. R., Trevino, L. K., & Cochran, P. L. (1999). Integrated and decoupled corporate
social performance: Management commitments, external pressures and corporate ethics
practices. Academy of Management Journal, 42(5), 539-552.
96. Whitehouse, L. (2006). Corporate social responsibility: Views from the frontline. Journal
of Business Ethics, 63(3), 279-296.
97. Williams, C. A., & Aguilera, R. (2008). Corporate social responsibility in a comparative
perspective. In: A. Crane, A. McWilliams, D. Matten, J. Moon, & D. Siegel, (Eds.), The
oxford handbook of corporate social responsibility, (452-472). Oxford: Oxford University
Press.
98. Wood, D. J, & Logsdon, J. (2002). Business citizenship: from individuals to organizations.
Journal of Business Ethics, 12(2), 155-187.
99. Yang, N., Clovin, C., & Wong, Y. Y. (2013). Navigating corporate social responsibility
components and strategic options: The IHR perspective. Academy of Strategic Management
Journal, 12(1), 39-58.
100. Zadek, S. (2001). The civil corporate: The new economy of corporate citizenship.
Stirling, VA Earthscan.
58th International Scientific Conference on Economic and Social Development – Budapest, 04-05 September, 2020
148
DEPLOYING LEAN TRANSFORMATION IN SERVICES: AN
ENTERPRISE-LEVEL CONCEPTUAL FRAMEWORK
Padmaka Mirihagalla
Széchenyi István University, Hungary
ABSTRACT
By deploying lean transformation at enterprise-level, many manufacturing organizations have
gained significant financial and cultural competitive advantages. Following their
manufacturing counterparts, some service organizations have started adopting lean. Since
then, studies about application of lean in service processes have become a crowded space in
academic journals, however, attention on enterprise-level lean transformation in services from
academia is unsatisfactory. This paper reviews note-worthy literature on lean to surface this
research gap and proposes a conceptual framework for lean transformation in services.
Keywords: Lean services, lean transformation in services, enterprise lean transformation, lean
maturity
1. INTRODUCTION
Toyota Corporation over half-a-dozen of decades of practicing Toyota Production System
(TPS), has out-smarted and out-performed its nearest competition by a considerable margin
(Womack et el, 1990). Since the introduction of Toyota insights (lean) in 1988 by Ohno and
expanded in 1990 by Womack et el, the contribution lean has made to the performance
improvement of different industries is immense (Liker, 2004, Krafcik, 1988, Slack, Lewis and
Bates, 2004, Pilkington and Fitzgerald, 2006). With increased understanding of lean as an
enterprise management philosophy (Liker, 2004 and Womack and Jones, 2005), practicing lean
enterprises have been able to gain not only financial but also multi-dimensional gains including
significantly reduced customer returns and reduced employee grievances (Sim and Banerjee,
2015). Womack et el (1990), defines lean as “Fusion of mass and craft production consisting
of set of principles and best practices aiming at continuous improvement” and Shah and Ward
(2003) defines lean as “an integrated system consisting of inter-related elements and
management practices aimed at delivering value to customers”. For this paper, these two
definitions are chosen as the basis of viewing ‘lean’ as they both represent a holistic enterprise
view covering aspects beyond narrow ‘waste elimination. Approximately within the past two
decades, service sector organizations have started adopting lean management principles within
their processes, work systems and in the organizational behavior, and these organizations have
gained similar financial as well as cultural benefits in comparison to their manufacturing
counterparts (Liker and Morgan, 2006 and Liker and Ross, 2017, McKinsey & Company
Publications, 2014). Apart from this, the amateur argument of increasing customer value and
financial gains as ‘conflicting priorities of lean in services’ has been proven a myth by credible
research (Carlborg et el, 2013). Global development indicators show that the services sector
has accounted to almost 71% of global GDP in 2016 and this growth is faster than in 1980s and
90s (World Bank national accounts data, 2017). This shows the commercial significance of
improved productivity and effectiveness of the service sectors which calls for greater demand
for application of lean from an impact point of view. However, even with such magnitude of
global significance, the quantity and quality of academic research dedicated to understanding
lean transformations within service sector is unsatisfactory. Transformational lean deployments
in services is rare, however, few medium to large service corporations have done it over the
part 15 years and gained significant benefits (McKinsey & Company Publications, 2014) and
these programs have not been exposed sufficiently within academic research.
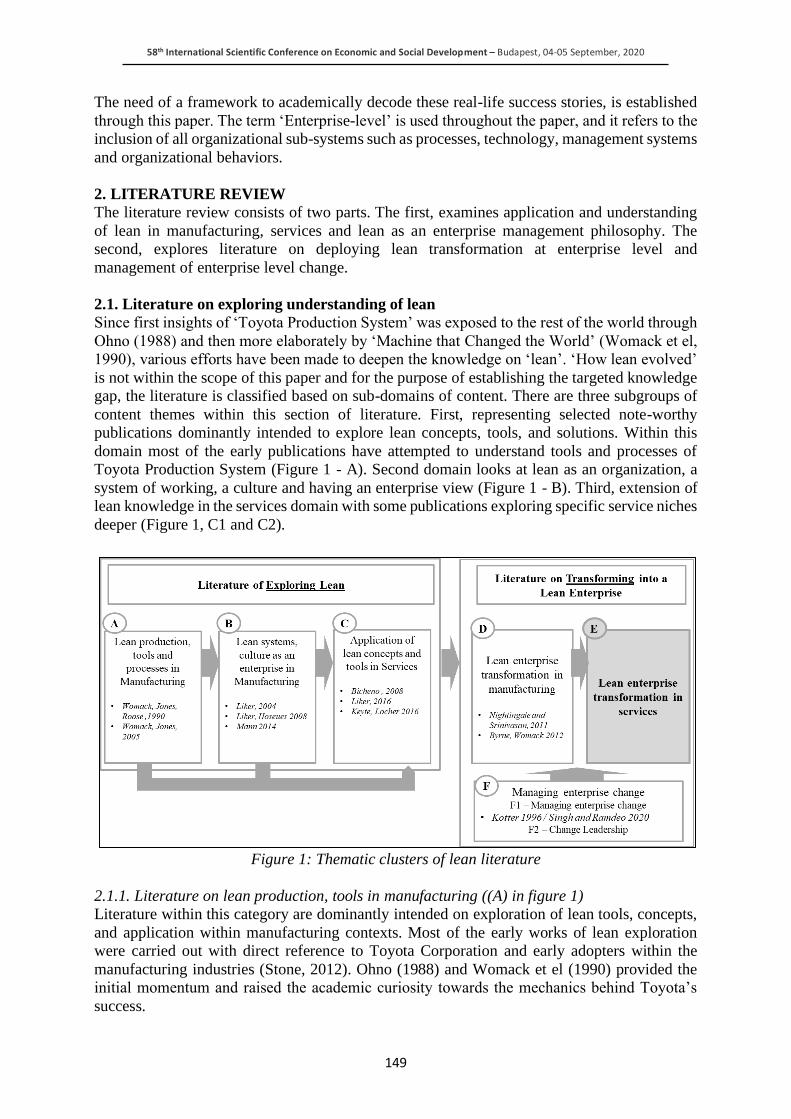
58th International Scientific Conference on Economic and Social Development – Budapest, 04-05 September, 2020
149
The need of a framework to academically decode these real-life success stories, is established
through this paper. The term ‘Enterprise-level’ is used throughout the paper, and it refers to the
inclusion of all organizational sub-systems such as processes, technology, management systems
and organizational behaviors.
2. LITERATURE REVIEW
The literature review consists of two parts. The first, examines application and understanding
of lean in manufacturing, services and lean as an enterprise management philosophy. The
second, explores literature on deploying lean transformation at enterprise level and
management of enterprise level change.
2.1. Literature on exploring understanding of lean
Since first insights of ‘Toyota Production System’ was exposed to the rest of the world through
Ohno (1988) and then more elaborately by ‘Machine that Changed the World’ (Womack et el,
1990), various efforts have been made to deepen the knowledge on ‘lean’. ‘How lean evolved’
is not within the scope of this paper and for the purpose of establishing the targeted knowledge
gap, the literature is classified based on sub-domains of content. There are three subgroups of
content themes within this section of literature. First, representing selected note-worthy
publications dominantly intended to explore lean concepts, tools, and solutions. Within this
domain most of the early publications have attempted to understand tools and processes of
Toyota Production System (Figure 1 - A). Second domain looks at lean as an organization, a
system of working, a culture and having an enterprise view (Figure 1 - B). Third, extension of
lean knowledge in the services domain with some publications exploring specific service niches
deeper (Figure 1, C1 and C2).
Figure 1: Thematic clusters of lean literature
2.1.1. Literature on lean production, tools in manufacturing ((A) in figure 1)
Literature within this category are dominantly intended on exploration of lean tools, concepts,
and application within manufacturing contexts. Most of the early works of lean exploration
were carried out with direct reference to Toyota Corporation and early adopters within the
manufacturing industries (Stone, 2012). Ohno (1988) and Womack et el (1990) provided the
initial momentum and raised the academic curiosity towards the mechanics behind Toyota’s
success.
58th International Scientific Conference on Economic and Social Development – Budapest, 04-05 September, 2020
150
TPS (Toyota Production System) exposed by both these publications revealed mainly the
process and process management mechanics of TPS and addressed the comparative advantages
over the mass production model of General Motors. Womack et al (1990) also suggests possible
application of TPS techniques in non-manufacturing industries such as healthcare and retail
distribution. Later, Womack and Jones (2003) take understanding of TPS to a perspective
broader than process management, establish the term ‘lean’ firmly as a direct representation of
TPS and introduces 5 core principles; namely, value, value creating steps, value stream, pull by
customer demand and continuous strive towards perfection (Womack and Jones, 2003).
Womack and Jones (2015) take lean process point of view a further step forward by introducing
customer experience mapping as a lean tool to diagnose an existing process and find solutions
to fix issues from a customer point of view (Womack and Jones, 2015). Within the lean
knowledge in manufacturing contexts, these publications constitute bulk of the knowledge, and
most other studies have attempted testing or deep diving into the concepts which are already
revealed within these landmark literatures.
2.1.2. Literature of lean as a system, culture, and a way of working in manufacturing context
((B) of figure 1)
Literature within this domain takes an enterprise view and investigates broader organizational
aspects such as culture, behaviors, interdepdant systems and looks at lean at an enterprise level.
Attempts in decoding lean principles of Toyota have not been frequent in academic or
mainstream research. With an attempt to interpret principles behind a lean system, Spear and
Bowen (1999) and Spear (1999) introduced four principles; task specification, streamlined
communication, simple process architecture and hypothesis-driven problem solving. However,
the works of Spear and Bowen (1999) and Spear (1999) lacked the enterprise level holisticness
in identifying principles of lean. Introduction of 14 principles of a lean enterprise by Jeffrey
Liker expanded conceptual horizons of Toyota Production into Toyota Way (Liker 2004).
Principles such as, having a long-term management philosophy, root-cause problem solving,
work-load leveling, standard tasks at all levels of the hierarchy, having visual controls, leaders
performing ‘gemba’ (go see where the problem is), developing leaders and capable front-line
employees etc. provided a broader view of a lean enterprise (Liker, 2004). Liker and Hoseues
(2008) consolidated Toyota Way within 4 key pillars where the 14 principles are embedded in,
which are, problem solving, people and systems, process, and philosophy (Liker and Hoseues,
2008). ‘Creating a Lean Culture’ (Mann, 2014), reviews at a granular level on how these
principles could be lived on a day–to-day level as behaviors of organizational culture. Primarily
using manufacturing environments as context, the author describes pillars of a lean management
system as, standard works for leaders, visual controls, daily accountability system, and problem
solving. Mike Rother, in his work on ‘creation of a sustainable lean culture’, shows importance
of management routines (Rother, 2010) and argues that sustainable results can only be achieved
by continuously practiced behavior routines or ‘Katas’. Another important dimension within
lean-enterprise domain of knowledge is lean leadership (expansion of one of the principles out
of 14 (Liker, 2004). Liker (2011) introduces Toyota Way lean leadership model that includes 4
key aspects of leadership which are, commitment to self-development, coach and develop
others, support daily kaizen and creating vision and aligning goals (Liker, 2011). Building on
Liker (2011), Dombrowski and Mielke (2013, 2014) discuss their own 15 principles of lean
leadership mapped within lean concepts namely, improvement culture, self-development,
qualification, gemba, and hoshin kanri. Most of the literature within this domain addresses
holistic lean enterprise aspects within manufacturing industries with little reference to services.
58th International Scientific Conference on Economic and Social Development – Budapest, 04-05 September, 2020
151
2.1.3. Literature on application of lean in service processes ((C) of figure 1)
Primary intent of literature within this domain is the exploration of application of lean within
services, and they belong to two categories, one, literature exploring application of lean in
services industries and two, literature exploring application of lean in specific service industry
niches. Early days of ‘lean in services’ literature mostly attempted clearing doubts and testing
of possibilities of lean application in services. Eventually some literature emerged with
examples and cases of complete lean process application in services. Bicheno (2008), showed
how lean in service could be in principle the same, yet in practice need different lenses of
prioritization in focus of application. Ahlstrom (2004), attempts directly translating lean in
manufacturing to lean in services and proves that such translation as logical and applicable
within the service industries if contingencies are taken care of (Ahlstrom, 2004). Ahlstrom
(2004) goes on to conclude the importance of understanding principle similarities between
manufacturing and services rather than letting the differences limit the meaningful application
of lean concepts in services (Ahlstrom, 2004). Expanding Toyota production system and Toyota
Way thinking, Liker et el (2006) outline and illustrate the principles of TPS that can be applied
not only in manufacturing but in any technical or service process. Liker et el (2006), take a
systems approach to explain how the integration can happen between people, processes, and
technology of a service organization. Liker et el (2006) also claim that the adoption of the
principles should happen as a continual, comprehensive and a coordinated approach to create
change-learning for the entire service organization. Liker et el (2006) provide examples of how
TPS has been replicated in some of the service-based industries, however they do not provide
a roadmap of lean transformation towards becoming a matured lean service enterprise. Liker
extends the work on Toyota way principles (philosophy, process, people, and problem solving)
directly into services industry through ‘Toyota way to Service excellence’ (Liker, 2016).
Taking Toyota Way pillars a step forward with practical lessons learnt, Sarkar (2012), shares
53 ideas on implementation of lean within services. These ideas take the form of practice
routines and author keeps it relevant to services industry, while using the framework of Toyota
culture. In another note-worthy attempt of lean in services is the value stream approach for
services (Keyte and Locher, 2016) where the author extensively elaborates service value
streams and management systems diagnosis methods for service performance to be improved.
When it comes to literature exploring application of lean in specific service niches, Apte and
Goh (2004), examines lean in insurance which is an information intensive service environment
and suggests modifications to the manufacturing lean principles. For example, due to the
absence of inventory, reduction of cycle time should be treated as a priority (Apte and Goh,
2004). Allway and Corbett (2002) using a case study demonstrates how successful outcomes
have been achieved using lean in insurance processes. Allway and Corbett (2002) claim that
principles as in manufacturing industry could be equally applied in service specific processes
and gain similarly impressive benefits (Allway and Corbett, 2002). Piercy and Rich (2009)
attempts to assess success of lean in call center operations and reveals how significant
improvements in quality and cost positions have been achieved with minimal investment in
adoption of lean (Piercy and Rich, 2009). Gonzalez-Rivas and Larsson (2011) extensively
elaborate the nature of waste exist in knowledge worker processes and environments by
drawing parallels with principles from lean manufacturing schools. Content of Gonzalez-Rivas
and Larsson (2011) is less about launching and program management of end-to-end deployment
of lean in work environments with knowledge workers but examine concepts such as best
practices adoption, process engineering, sustainability, visual management, and lean team
formation. ‘Lean IT’ by Bell and Orzen (2010); extensively review how lean could be applied
in areas such as integration of lean IT with various organizational sub-functions and IT
operational excellence. Other than Bell and Orzen (2010), multiple other attempts have been
made to understand lean within knowledge-worker or IT based organizations (e.g. Staatsa et el
58th International Scientific Conference on Economic and Social Development – Budapest, 04-05 September, 2020
152
2011). Asif et. el. (2015) claim that the challenges of implementing lean within information
intense processes and industries are not yet fully understood. They elaborate how application
of some of the waste reduction principles of lean thinking might be challenging in application
within services and when some of the wastes when eliminated, trigger increment of other types
of waste and vice versa (Asif et el 2015).
2.2. Literature on enterprise lean transformation
Literature within (D), (E) and (F) on figure 1 primarily address the ‘how’ of taking a non-lean
organization towards lean. They address roadmaps, approaches of lean deployment and
managing change. The literature uses manufacturing as the context and considers change at
enterprise level. With the enterprise view implying organizational transformation, research in
lean has evolved into a broader transdisciplinary domain bridging strategic management,
organizational behavior, and operations management (Forza 1996, Emiliani, 1998 and
Atkinson, 2010).
2.2.1. Literature on lean transformation in manufacturing ((D) of figure 1)
Literature within this domain focus on the implementation/deployment aspects of lean within
manufacturing contexts. Henderson and Larco (1999) extensively goes through implementation
of lean in manufacturing and procedural routines of a lean enterprise, though defines
‘enterprise’ from a narrower scope compared to the authors from post 2000 era such as Byrne
and Womack (2012) and Nightingale and Srinivasan (2011). ‘The going Lean’ (Ruffa, 2008)
explores how contextual differences between organizations can make the nature of the lean
journey different and examines pillars of a lean change journey such as, having a case for
change, structuring lean dynamics, transforming from the top, and creating sustainable
excellence. Nightingale and Srinivasan (2011) focus on transformation programs catered for
manufacturing industry and propose an actionable transformation plan based on cases covering
different management systems. Nightingale and Srinivasan (2011) also organize their
observations within a set of lean principles of transformation which includes lean lenses such
as process, performance, and people (Nightingale and Srinivasan, 2011). Covering deployment
challenges, Jadhav et el (2014) reveals 24 lean barriers and argue that the lean implementation
will not be a full success with reliance on tools and techniques alone, but also on the top
managements’ engagement, employees’ attitude and prevailing culture within the organization.
Transformation perspective of lean enterprise implies a status of ‘leanness’ present in an
organization and achieving a target ‘leanness’ status. Leanness is the extent to which the lean
philosophy has been adopted by the organization and several research attempts have been made
to give clarity to this point of view. Karlsson and Ahlstrom (1996) uses a collection of measures
in the form of a checklist, McIvor (2001) and Soriano-Meier and Forrester (2002) measures
leanness by use of a set of variables such as production cost, quality and lean supply chain.
Radnor and Boaden (2004) argues that measurement of leanness is context-dependent, and it is
based on the needs of each organization. However, these measures only look at outcomes of
lean and not the leanness of the enterprise behavior, hence with limited applicability within a
transformation framework. Tightly related to transformation, another perspective similar to
‘leanness’ is lean maturity. Although not a crowded academic space, there are a few note-
worthy researches related to lean maturity (e.g. Nightingale and Mize, 2002, Sánchez and Pérez,
2001, Nesensohn et al, 2014, Donovan, 2015, Ray et al, 2006 and Urban, 2015). These maturity
models, unlike the research on ‘leanness’ have attempted to focus on organizational aspects of
a lean enterprise instead of outcomes such as cost efficiency. However, only the maturity
assessment model of Urban (2015) keeps it applicable within any industry while all the other
models focus on either manufacturing or construction industries.
58th International Scientific Conference on Economic and Social Development – Budapest, 04-05 September, 2020
153
Urban measures lean maturity using the dimensions organization’s leadership associated with
the value stream, operational improvement, people treatment and lean results obtained (Urban,
2015).
2.2.2. Literature on lean transformation in services ((E) of figure 1)
Literature within this domain addresses the ‘how’ question of taking a non-lean service
organization towards lean. They primarily address approaches of implementation and managing
change. The domain of holistic transformation approaches of a service organization from non-
lean to lean, has considerably limited academic or mainstream literature. Toyota Way to Service
Excellence (Liker, 2016), provides a view on how each of the 14 lean enterprise principle
(Liker, 2004), could look in a lean service and how each principle could be implemented.
However, Liker (2016) does not show how an enterprise at holistic level could drive change
from non-lean to lean by looking at interdependencies, managing change, and related holistic
organizational elements. Bell and Orzen (2010), address some of the lean service
transformation aspects such as having a structured program, leadership in change, strategy,
planning, creation of a lean change team etc. Although the authors cover some of these aspects
related to managing transformation, the scope is not from an enterprise point-of-view but from
a functional point-of-view. Similarly, Gonzalez-Rivas and Larsson (2011) keeps it narrowly
within the functional scope and less expanded to the holistic enterprise level. Within the view
of driving lean transformation in healthcare industry, Dean (2013) proposes a lean enterprise
transformation approach which covers transformational elements such as lean transformation
process, senior leadership team, transformation using value stream model, designing
governance of implementation, planning and execution of a lean summit, results assurance and
managing sustainability, current state analysis, future state design, and deploying rapid
improvement events (Dean, 2013). Keyte and Locher (2016) discuss how lean transformation
could be implemented using value stream approach, though they do not cover aspects such as
driving lean behavioral changes, strategic program management of change and governance as
Dean (2013) does.
2.2.3. Literature on managing enterprise change ((F) of figure 1)
Literature within this domain is independent from lean related themes and address angles of
driving change within an organization and its culture. With the assumption that a lean
transformation requires a systematic approach to change an organization in its many different
aspects including organizational culture, this domain reviews note-worthy publications related
to change management of an enterprise.
2.2.3.1 (F1) of figure 1: Managing organizational changes and changing organizational
culture
Van de Ven and Sun (2011) explore the common breakdowns in implementation of four main
change process models, namely, planned change, regulated change, conflictive change, and
competitive change. Greenwood and Hinings (1996) take a neo-institutional theoretical
perspective, and as the principle theoretical issue, address the interaction of organizational
context and the action taken by the organization itself as critical elements. Greenwood and
Hinings (1996) also argue within process view by stating that the individual organizations
retain, adopt and discard templates of change within the conditional institutionalized nature of
the organization’s multiple fields. Cameron and Robert (2011), explores changing
organizational culture using the value framework and provide ways in which understanding and
changing organizational culture to make an organization more effective (Cameron and Quinn,
2011) and claim to provide validated tools and instruments for diagnosing organizational
culture and competencies using ‘competing value framework’ (Cameron and Quinn, 2011).
58th International Scientific Conference on Economic and Social Development – Budapest, 04-05 September, 2020
154
Scenario planning is another school of thought in changing organizational culture and Korte
and Chermack (2006) present scenarios as a proactive tool for developing alternative, potential
cultures as an initial step in the deployment of changes in organization (Korte and Chermack,
2006). There are a several literatures reviewed here that takes in to account transformational
organizational change management. Abudi (2017) takes a pragmatic approach and explores
ways in which change implementation could be done by creating an organizational culture that
is receptive for continuous improvement and as a result acceptance and driving of change
(Abudi, 2017). To achieve this, Abudi (2017) proposes a project management approach to
achieve change and reduce the negative perceptions on change within the organization (Abudi,
2017). Beitler (2013) in ‘Strategic Organizational Change’ provides a holistic method which
includes a systematic approach to diagnosing organizational issues and converting them into a
step-by-step action items to design and implementation of change (Beitler, 2013). In terms of
exploring potential challenges within the transformational journey (Klein and Sorra, 1996)
looks at implementation as a process of gaining targeted audience to commit to use of intended
solutions and suggest that effectiveness of implementation is a function of the consistency and
quality of the targeted audience, the strength of the organization’s climate for the
implementation of the innovation and the fit of the innovation to the shared value system of the
target audience (Klein and Sorra 1996). Bartunek et el (2011) argue that contemporary real-life
corporate approaches are far ahead in knowledge compared to the academic knowledge related
to planned organizational changes (Bartunek et el 2011) and point out that even if these issues
have been given focus by many scholarly authors over the years, the depth and the width of
these issues are under-informed in their publications. Apart from these, the most celebrated
enterprise change management approaches such as Kotter (1996) and Lewin (1951) worth a
mention. Kotter (1996) proposes an 8-step process to manage enterprise change that goes
through, creating sense of urgency, building a guiding coalition, form vision, enlist volunteers,
enable action, generate short-term wins, sustain acceleration, and institutionalize change.
Judging by these dimensions it can be argued that Kotter (1996) covers primarily managing
softer aspects of change and these aspects need not happen in a sequence. Singh and Ramdeo
(2020) establishes a project management approach that covers a sequence of steps, namely,
entering and contracting change, diagnosis, data collection, data analysis, development and
implementation, and evaluation and follow-up (Singh and Ramdeo, 2020). For the proposed
framework in this paper, a combination of Kotter (1996) and Singh and Ramdeo (2020) is
suggested as they both address different, yet important dimensions of enterprise change
management.
2.2.3.2. (F2) of figure 1: Literature addressing aspects related to change leadership in driving
organizational changes
Out of factors of organizational change efforts and innovation, leadership of the organization
at various levels had been a factor that has attracted research attention. Jung et el (2003)
examine the style of top leadership within the organization as the most important factor and
they show the gap of research targeted on examining the link between this factor and
organizational innovation. Eisenbach, et el (1999) draw parallels between the change related
scholarly work and leadership literature, specifically the transformational leadership school.
They argue that capabilities within the organization as a key determining factor of successful
change implementation and transformational leadership as the key driver of these capabilities
(Eisenbach, et el 1999). Anderson and Anderson (2010) provides a change process
methodology, as well as a roadmap to the leaders engaged in driving transformational change
in complex organizational situations.
58th International Scientific Conference on Economic and Social Development – Budapest, 04-05 September, 2020
155
3. DEVELOPING AN ENTERPRISE LEVEL LEAN TRANSFORMATION
FRAMEWORK FOR SERVICES
Towards proposing a transformational framework for a lean enterprise using currently
established theories requires establishing connections meaningfully. Transformation implies
achieving a new status from the existing, and this implies the need of objective awareness of
the starting status, and management of the journey towards achieving a defined future status.
Below sections explain, how the theories already explored within the literature review are
strung together to create a transformation approach. This also answers the issue highlighted by
(Farshid et. el (2006) the need of a framework of application for lean in services from a
transformational point of view.
3.1. Creating objective awareness of the starting point and the targeted future status
(assessing lean maturity)
In a lean transformation journey the starting point could be the pre-transformational lean
maturity level that can be measured using existing lean maturity models (e.g. Nightingale and
Mize, 2002, Sánchez and Pérez, 2001, Nesensohn et al, 2014, Donovan, 2015, Ray et al, 2006
and Urban, 2015). Out of these, only Urban (2015), can be directly used in services lean
transformation as the rest are intended for different industries. However, Urban (2015) does not
comprehensively cover lean principles (Spear and Bowen, 1999, Spear 1999 and Liker, 2004)
and does not interpret specifically lean principles service industry language (Liker, 2016). To
ensure objectivity of assessing current lean maturity of a service organization, lean principles
need to be expanded into representative and observable tools and behavior routines. For this to
be achieved, an academic exercise is needed to map a comprehensive list of observable lean
service behaviors and generic tools to the lean service principles. To achieve this, lean kata
behaviors (Rother, 2010) translated into services and lean service tools (Bicheno, 2008) can be
used. However, these tangible and observable behaviors will only provide the measurement
dimension of lean maturity and not the maturity level. Different scaling systems are used by the
above-mentioned lean maturity models to assess the maturity levels (e.g. 0-5 rating of existence
of the lean principle in Urban, 2015 index). Although within the lean sphere, there is no maturity
model with each maturity level is defined with observable behaviour and routines, there are
other domains such as Capability Maturity Model Integration CMMI – Developed by Carnegie
Mellon University (Curtis et el, 1995). CMMI maturity index structure has been accepted
widely and used in developing different maturity models for example, Project Management
Maturity Model by Office of Government Commerce, UK. In this paper, it is proposed to use
an adopted version of CMMI (table 3) to measure the maturity of lean in a service. An
objectively developed maturity model can be used throughout the lean transformation journey
from pre-transformation phase, achieving a defined target phase, and in the journey of
continuous improvement. Maturity model serves the purpose of answering the two critical
questions ‘where’ is the organization now and ‘what’ status to achieve as an enterprise.
3.2. Managing the lean transformational journey for services (maturing in lean)
As stated earlier lean transformation demands for a thorough strategic change management
effort that covers various systems within the organization, processes, and behaviour routines.
To be able to manage this process in a structured manner, it requires approaches that cover,
hard project management of change (e.g. change processes of Abudi, 2017, Singh and Ramdeo,
2020), soft change management (e.g. change steps by Kotter, 1996 and Klein and Sorra, 1996),
an approach to diagnose current issues deeply including processes, systems and behaviour
aspects (Keyte and Locher, 2016, Beitler, 2013, Bell and Orzen, 2010 and Dean, 2013). Unlike
in 3.1 above, the paper does not attempt to compare alternative approaches of change
management due to the vastness of the field.
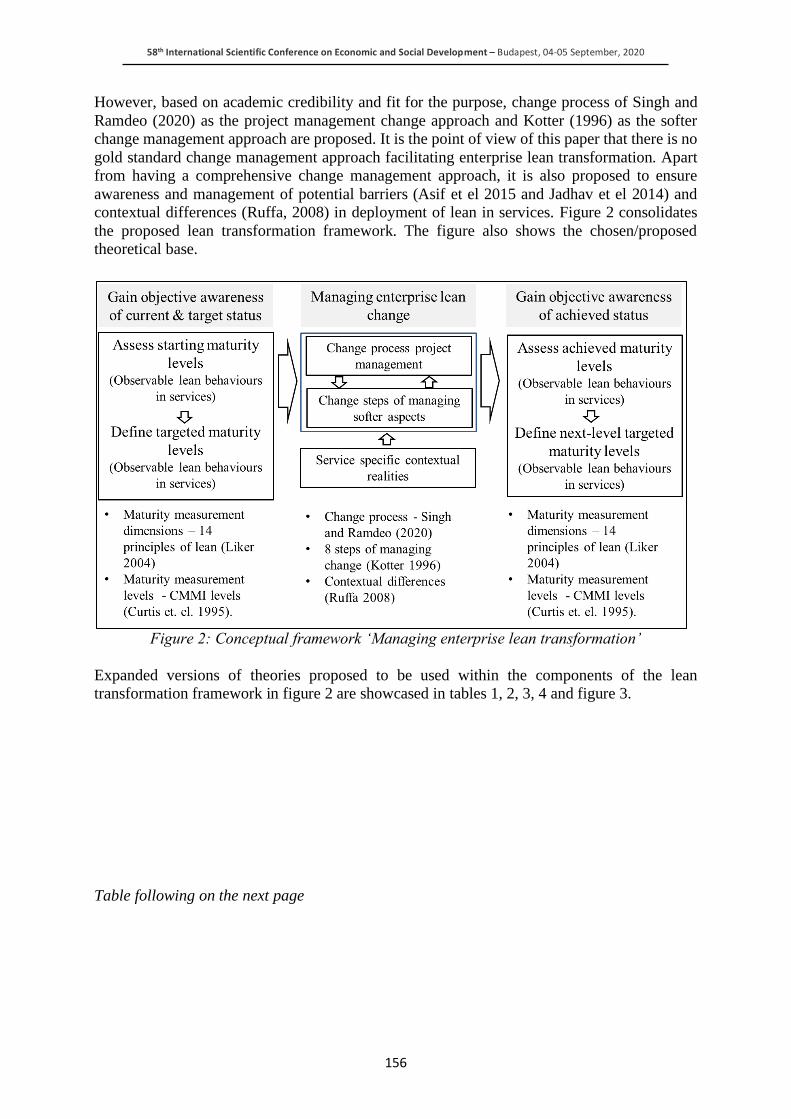
58th International Scientific Conference on Economic and Social Development – Budapest, 04-05 September, 2020
156
However, based on academic credibility and fit for the purpose, change process of Singh and
Ramdeo (2020) as the project management change approach and Kotter (1996) as the softer
change management approach are proposed. It is the point of view of this paper that there is no
gold standard change management approach facilitating enterprise lean transformation. Apart
from having a comprehensive change management approach, it is also proposed to ensure
awareness and management of potential barriers (Asif et el 2015 and Jadhav et el 2014) and
contextual differences (Ruffa, 2008) in deployment of lean in services. Figure 2 consolidates
the proposed lean transformation framework. The figure also shows the chosen/proposed
theoretical base.
Figure 2: Conceptual framework ‘Managing enterprise lean transformation’
Expanded versions of theories proposed to be used within the components of the lean
transformation framework in figure 2 are showcased in tables 1, 2, 3, 4 and figure 3.
Table following on the next page
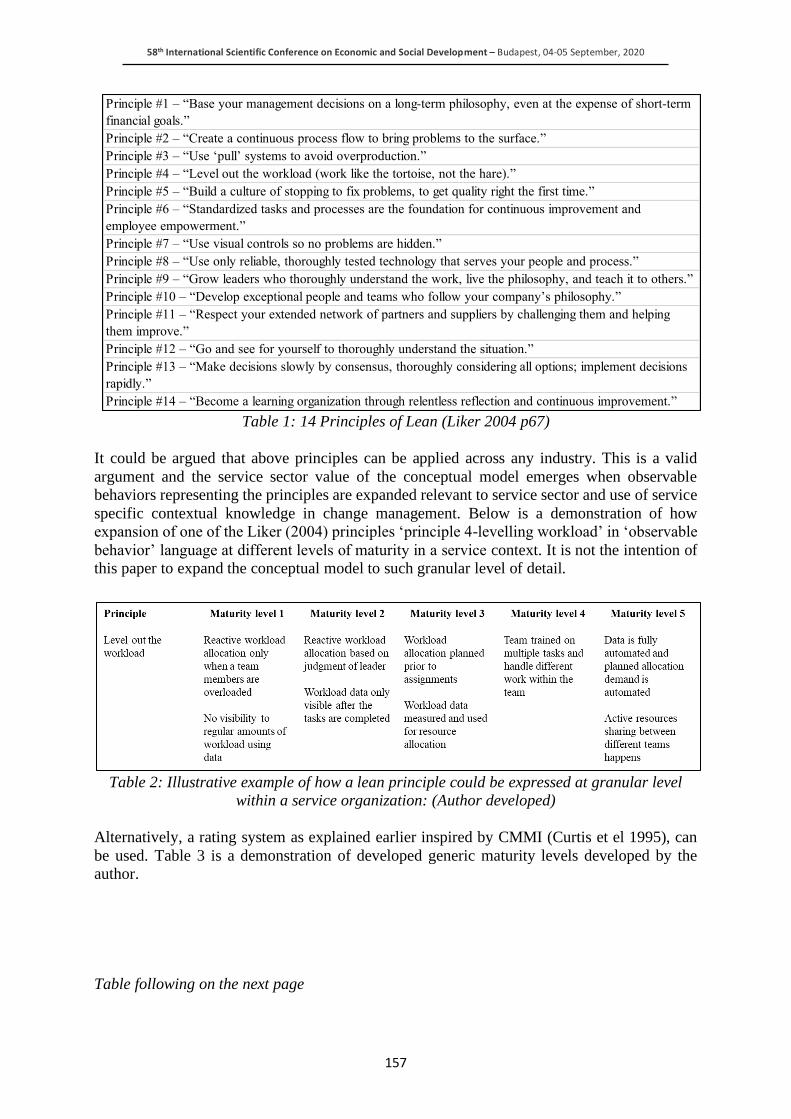
58th International Scientific Conference on Economic and Social Development – Budapest, 04-05 September, 2020
157
Table 1: 14 Principles of Lean (Liker 2004 p67)
It could be argued that above principles can be applied across any industry. This is a valid
argument and the service sector value of the conceptual model emerges when observable
behaviors representing the principles are expanded relevant to service sector and use of service
specific contextual knowledge in change management. Below is a demonstration of how
expansion of one of the Liker (2004) principles ‘principle 4-levelling workload’ in ‘observable
behavior’ language at different levels of maturity in a service context. It is not the intention of
this paper to expand the conceptual model to such granular level of detail.
Table 2: Illustrative example of how a lean principle could be expressed at granular level
within a service organization: (Author developed)
Alternatively, a rating system as explained earlier inspired by CMMI (Curtis et el 1995), can
be used. Table 3 is a demonstration of developed generic maturity levels developed by the
author.
Table following on the next page
Principle #1 – “Base your management decisions on a long-term philosophy, even at the expense of short-term
financial goals.”
Principle #2 – “Create a continuous process flow to bring problems to the surface.”
Principle #3 – “Use ‘pull’ systems to avoid overproduction.”
Principle #4 – “Level out the workload (work like the tortoise, not the hare).”
Principle #5 – “Build a culture of stopping to fix problems, to get quality right the first time.”
Principle #6 – “Standardized tasks and processes are the foundation for continuous improvement and
employee empowerment.”
Principle #7 – “Use visual controls so no problems are hidden.”
Principle #8 – “Use only reliable, thoroughly tested technology that serves your people and process.”
Principle #9 – “Grow leaders who thoroughly understand the work, live the philosophy, and teach it to others.”
Principle #10 – “Develop exceptional people and teams who follow your company’s philosophy.”
Principle #11 – “Respect your extended network of partners and suppliers by challenging them and helping
them improve.”
Principle #12 – “Go and see for yourself to thoroughly understand the situation.”
Principle #13 – “Make decisions slowly by consensus, thoroughly considering all options; implement decisions
rapidly.”
Principle #14 – “Become a learning organization through relentless reflection and continuous improvement.”
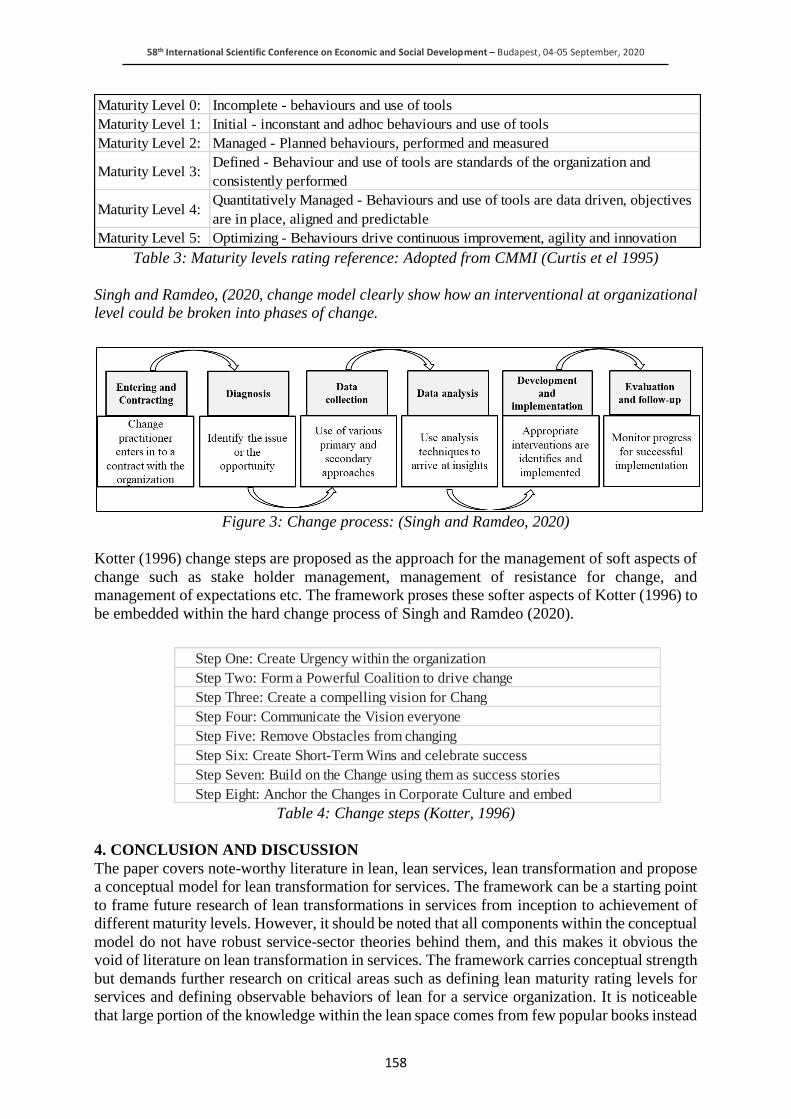
58th International Scientific Conference on Economic and Social Development – Budapest, 04-05 September, 2020
158
Table 3: Maturity levels rating reference: Adopted from CMMI (Curtis et el 1995)
Singh and Ramdeo, (2020, change model clearly show how an interventional at organizational
level could be broken into phases of change.
Figure 3: Change process: (Singh and Ramdeo, 2020)
Kotter (1996) change steps are proposed as the approach for the management of soft aspects of
change such as stake holder management, management of resistance for change, and
management of expectations etc. The framework proses these softer aspects of Kotter (1996) to
be embedded within the hard change process of Singh and Ramdeo (2020).
Table 4: Change steps (Kotter, 1996)
4. CONCLUSION AND DISCUSSION
The paper covers note-worthy literature in lean, lean services, lean transformation and propose
a conceptual model for lean transformation for services. The framework can be a starting point
to frame future research of lean transformations in services from inception to achievement of
different maturity levels. However, it should be noted that all components within the conceptual
model do not have robust service-sector theories behind them, and this makes it obvious the
void of literature on lean transformation in services. The framework carries conceptual strength
but demands further research on critical areas such as defining lean maturity rating levels for
services and defining observable behaviors of lean for a service organization. It is noticeable
that large portion of the knowledge within the lean space comes from few popular books instead
Maturity Level 0: Incomplete - behaviours and use of tools
Maturity Level 1: Initial - inconstant and adhoc behaviours and use of tools
Maturity Level 2: Managed - Planned behaviours, performed and measured
Maturity Level 3: Defined - Behaviour and use of tools are standards of the organization and
consistently performed
Maturity Level 4: Quantitatively Managed - Behaviours and use of tools are data driven, objectives
are in place, aligned and predictable
Maturity Level 5: Optimizing - Behaviours drive continuous improvement, agility and innovation
Step One: Create Urgency within the organization
Step Two: Form a Powerful Coalition to drive change
Step Three: Create a compelling vision for Chang
Step Four: Communicate the Vision everyone
Step Five: Remove Obstacles from changing
Step Six: Create Short-Term Wins and celebrate success
Step Seven: Build on the Change using them as success stories
Step Eight: Anchor the Changes in Corporate Culture and embed
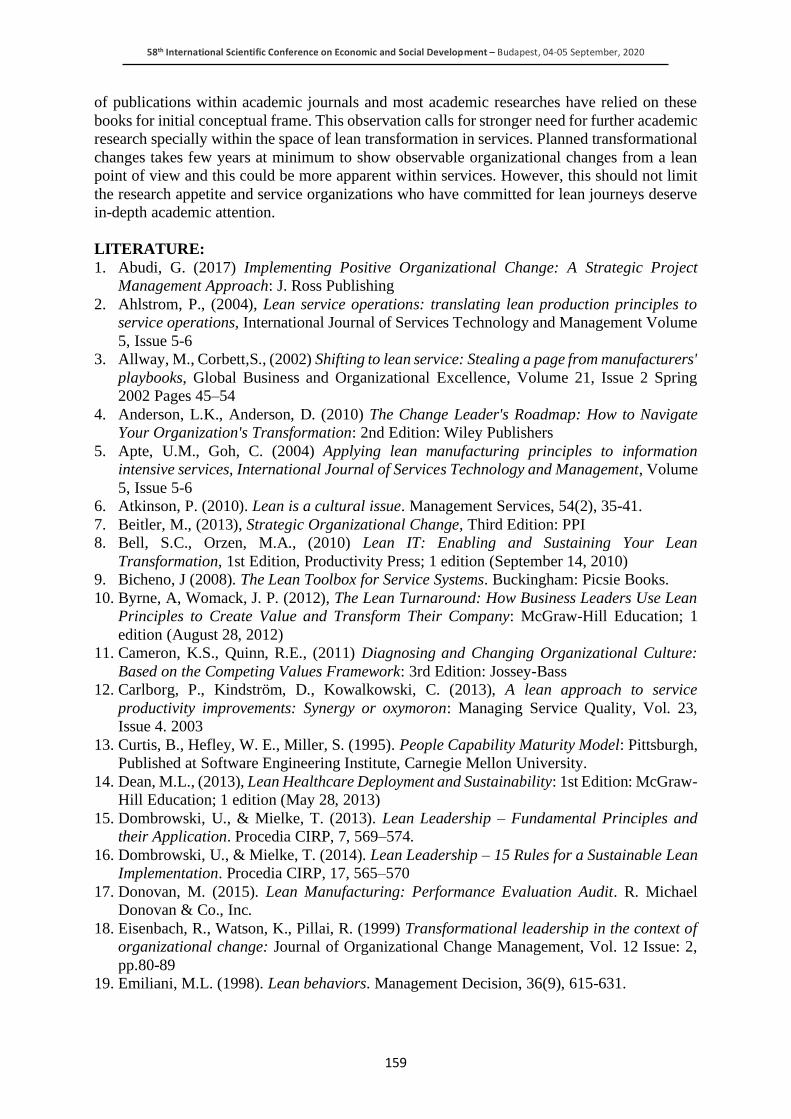
58th International Scientific Conference on Economic and Social Development – Budapest, 04-05 September, 2020
159
of publications within academic journals and most academic researches have relied on these
books for initial conceptual frame. This observation calls for stronger need for further academic
research specially within the space of lean transformation in services. Planned transformational
changes takes few years at minimum to show observable organizational changes from a lean
point of view and this could be more apparent within services. However, this should not limit
the research appetite and service organizations who have committed for lean journeys deserve
in-depth academic attention.
LITERATURE:
1. Abudi, G. (2017) Implementing Positive Organizational Change: A Strategic Project
Management Approach: J. Ross Publishing
2. Ahlstrom, P., (2004), Lean service operations: translating lean production principles to
service operations, International Journal of Services Technology and Management Volume
5, Issue 5-6
3. Allway, M., Corbett,S., (2002) Shifting to lean service: Stealing a page from manufacturers'
playbooks, Global Business and Organizational Excellence, Volume 21, Issue 2 Spring
2002 Pages 45–54
4. Anderson, L.K., Anderson, D. (2010) The Change Leader's Roadmap: How to Navigate
Your Organization's Transformation: 2nd Edition: Wiley Publishers
5. Apte, U.M., Goh, C. (2004) Applying lean manufacturing principles to information
intensive services, International Journal of Services Technology and Management, Volume
5, Issue 5-6
6. Atkinson, P. (2010). Lean is a cultural issue. Management Services, 54(2), 35-41.
7. Beitler, M., (2013), Strategic Organizational Change, Third Edition: PPI
8. Bell, S.C., Orzen, M.A., (2010) Lean IT: Enabling and Sustaining Your Lean
Transformation, 1st Edition, Productivity Press; 1 edition (September 14, 2010)
9. Bicheno, J (2008). The Lean Toolbox for Service Systems. Buckingham: Picsie Books.
10. Byrne, A, Womack, J. P. (2012), The Lean Turnaround: How Business Leaders Use Lean
Principles to Create Value and Transform Their Company: McGraw-Hill Education; 1
edition (August 28, 2012)
11. Cameron, K.S., Quinn, R.E., (2011) Diagnosing and Changing Organizational Culture:
Based on the Competing Values Framework: 3rd Edition: Jossey-Bass
12. Carlborg, P., Kindström, D., Kowalkowski, C. (2013), A lean approach to service
productivity improvements: Synergy or oxymoron: Managing Service Quality, Vol. 23,
Issue 4. 2003
13. Curtis, B., Hefley, W. E., Miller, S. (1995). People Capability Maturity Model: Pittsburgh,
Published at Software Engineering Institute, Carnegie Mellon University.
14. Dean, M.L., (2013), Lean Healthcare Deployment and Sustainability: 1st Edition: McGraw-
Hill Education; 1 edition (May 28, 2013)
15. Dombrowski, U., & Mielke, T. (2013). Lean Leadership – Fundamental Principles and
their Application. Procedia CIRP, 7, 569–574.
16. Dombrowski, U., & Mielke, T. (2014). Lean Leadership – 15 Rules for a Sustainable Lean
Implementation. Procedia CIRP, 17, 565–570
17. Donovan, M. (2015). Lean Manufacturing: Performance Evaluation Audit. R. Michael
Donovan & Co., Inc.
18. Eisenbach, R., Watson, K., Pillai, R. (1999) Transformational leadership in the context of
organizational change: Journal of Organizational Change Management, Vol. 12 Issue: 2,
pp.80-89
19. Emiliani, M.L. (1998). Lean behaviors. Management Decision, 36(9), 615-631.
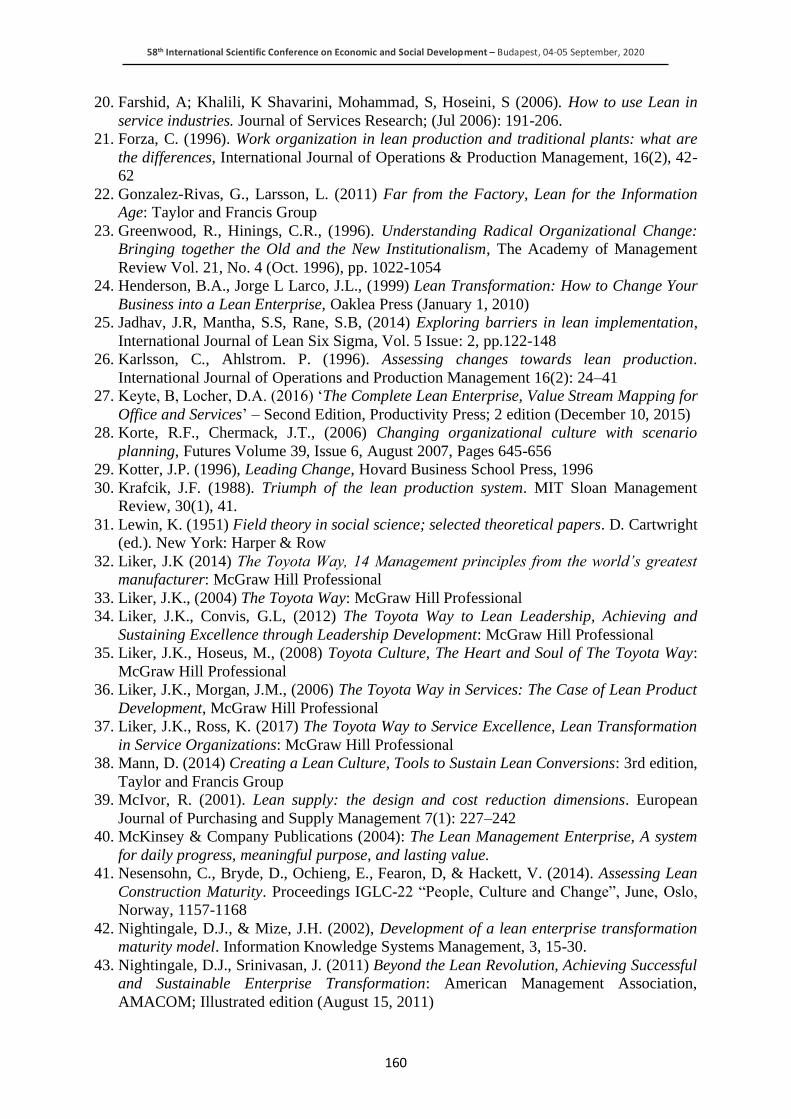
58th International Scientific Conference on Economic and Social Development – Budapest, 04-05 September, 2020
160
20. Farshid, A; Khalili, K Shavarini, Mohammad, S, Hoseini, S (2006). How to use Lean in
service industries. Journal of Services Research; (Jul 2006): 191-206.
21. Forza, C. (1996). Work organization in lean production and traditional plants: what are
the differences, International Journal of Operations & Production Management, 16(2), 42-
62
22. Gonzalez-Rivas, G., Larsson, L. (2011) Far from the Factory, Lean for the Information
Age: Taylor and Francis Group
23. Greenwood, R., Hinings, C.R., (1996). Understanding Radical Organizational Change:
Bringing together the Old and the New Institutionalism, The Academy of Management
Review Vol. 21, No. 4 (Oct. 1996), pp. 1022-1054
24. Henderson, B.A., Jorge L Larco, J.L., (1999) Lean Transformation: How to Change Your
Business into a Lean Enterprise, Oaklea Press (January 1, 2010)
25. Jadhav, J.R, Mantha, S.S, Rane, S.B, (2014) Exploring barriers in lean implementation,
International Journal of Lean Six Sigma, Vol. 5 Issue: 2, pp.122-148
26. Karlsson, C., Ahlstrom. P. (1996). Assessing changes towards lean production.
International Journal of Operations and Production Management 16(2): 24–41
27. Keyte, B, Locher, D.A. (2016) ‘The Complete Lean Enterprise, Value Stream Mapping for
Office and Services’ – Second Edition, Productivity Press; 2 edition (December 10, 2015)
28. Korte, R.F., Chermack, J.T., (2006) Changing organizational culture with scenario
planning, Futures Volume 39, Issue 6, August 2007, Pages 645-656
29. Kotter, J.P. (1996), Leading Change, Hovard Business School Press, 1996
30. Krafcik, J.F. (1988). Triumph of the lean production system. MIT Sloan Management
Review, 30(1), 41.
31. Lewin, K. (1951) Field theory in social science; selected theoretical papers. D. Cartwright
(ed.). New York: Harper & Row
32. Liker, J.K (2014) The Toyota Way, 14 Management principles from the world’s greatest
manufacturer: McGraw Hill Professional
33. Liker, J.K., (2004) The Toyota Way: McGraw Hill Professional
34. Liker, J.K., Convis, G.L, (2012) The Toyota Way to Lean Leadership, Achieving and
Sustaining Excellence through Leadership Development: McGraw Hill Professional
35. Liker, J.K., Hoseus, M., (2008) Toyota Culture, The Heart and Soul of The Toyota Way:
McGraw Hill Professional
36. Liker, J.K., Morgan, J.M., (2006) The Toyota Way in Services: The Case of Lean Product
Development, McGraw Hill Professional
37. Liker, J.K., Ross, K. (2017) The Toyota Way to Service Excellence, Lean Transformation
in Service Organizations: McGraw Hill Professional
38. Mann, D. (2014) Creating a Lean Culture, Tools to Sustain Lean Conversions: 3rd edition,
Taylor and Francis Group
39. McIvor, R. (2001). Lean supply: the design and cost reduction dimensions. European
Journal of Purchasing and Supply Management 7(1): 227–242
40. McKinsey & Company Publications (2004): The Lean Management Enterprise, A system
for daily progress, meaningful purpose, and lasting value.
41. Nesensohn, C., Bryde, D., Ochieng, E., Fearon, D, & Hackett, V. (2014). Assessing Lean
Construction Maturity. Proceedings IGLC-22 “People, Culture and Change”, June, Oslo,
Norway, 1157-1168
42. Nightingale, D.J., & Mize, J.H. (2002), Development of a lean enterprise transformation
maturity model. Information Knowledge Systems Management, 3, 15-30.
43. Nightingale, D.J., Srinivasan, J. (2011) Beyond the Lean Revolution, Achieving Successful
and Sustainable Enterprise Transformation: American Management Association,
AMACOM; Illustrated edition (August 15, 2011)
58th International Scientific Conference on Economic and Social Development – Budapest, 04-05 September, 2020
161
44. Ohno T., 1988. Toyota Production System: Beyond Large-Scale Production. Productivity
Press, Cambridge, MA.
45. Piercy, N., Rich, N. (2009) Lean transformation in the pure service environment: the case
of the call service centre, International Journal of Operations & Production Management,
Vol. 29 Issue: 1, pp.5476
46. Pilkington, A., & Fitzgerald, R. (2006). Operations management themes, concepts and
relationships: a forward retrospective of IJOPM. International Journal of Operations &
Production Management, 26(11), 1255-1275.
47. Radnor, Z. J., Boaden. R., (2004). Developing and understanding of corporate anorexia.
International Journal of Operations and Production Management 24(4): 424–440
48. Ray, C.D., Zuo, X., Michael, J.H., & Wiedenbeck, J.K. (2006). The Lean Index:
Operational “Lean” Metrics for The Wood Products Industry. Wood and Fiber Science,
38, 238-255
49. Ruffa, S.A., (2011) The Going Lean Fieldbook – A Practical Guide To Lean
Transformation and Sustainable Success, American Management Association. AMACOM
(December 1, 2010)
50. Sarkar, D. (2012) Lessons in Lean Management, 53 Ideas to Transform Services: first
edition, Westland publishers
51. Sim, K.L., Banerjee, C.A., (2015) Lean Production Systems and Worker Satisfaction: A
Field Study, Advances in business research 2015, Volume 6, pages 79-100
52. Singh, R., & Ramdeo, S. (2020). Leading Organizational Development and Change.
https://doi.org/10.1007/978-3-030-39123-2
53. Slack, N., Lewis, M., & Bates, H. (2004). The two worlds of operations management
research and practice: can they meet, should they meet? International Journal of Operations
& Production Management, 24(4), 372-387.
54. Soriano-Meier, H., Forrester. P. L. (2002). A model for evaluating the degree of leanness of
manufacturing firms. Integrated Manufacturing Systems 13(2): 104–109
55. Spear, S., Bowen, H.K., (1999). Decoding the DNA of the Toyota Production System.
Harvard Business Review 77 (5), 97–106.
56. Spear, S.J., (1999). The Toyota Production System: An Example of Managing Complex
Social/Teaching Systems. Harvard Business School, Unpublished doctoral dissertation.
57. Staatsa R, Brunnerb D, Uptonc D (2011), Lean principles, learning, and knowledge work:
Evidence from a software services provider. Journal of Operations Management 29 (2011)
376–390
58. Stone, K.B., (2012) Four decades of lean: a systematic literature review, International
Journal of Lean Six Sigma, Vol. 3 Issue: 2, pp.112-132
59. Urban, W. (2015). The Lean Management Maturity Self-Assessment Tool Based on
Organizational Culture Diagnosis. Procedia - Social and Behavioral Sciences 213 (2015)
728 – 733
60. Van de Ven, A. H., Sun, K. (2011). Breakdowns in Implementing Models of Organization
Change. Academy of Management Perspectives, 25(3), 58–74.
61. Womack, J.P., Jones, D.T (2015) Lean Solutions, How Companies and Customers Can
Create Value and Wealth Together: Simon and Schuster - Free Press; Reprint edition
(August 18, 2015)
62. Womack, J.P., Jones, D.T, Roos, D. (1990) The Machine That Changed the World: The
Story of Lean Production-- Toyota's Secret Weapon in the Global Car Wars That Is Now
Revolutionizing World Industry: Free Press; Reprint edition (March 13, 2007)
63. Womack, J.P., Jones, D.T., (2003) Lean Thinking: Banish Waste and Create Wealth in Your
Corporation: Free Press; 2nd edition (June 10, 2003)

58th International Scientific Conference on Economic and Social Development – Budapest, 04-05 September, 2020
162
64. World Bank national accounts data and OECD National Accounts data files for 2016.
(2017)
58th International Scientific Conference on Economic and Social Development – Budapest, 04-05 September, 2020
163
AGGREGATION METHODS INFLUENCE THE EMPLOYEE
PERFORMANCE RANKING LIST
Peter Horvath
Széchenyi István University, Hungary
Andrea Bencsik
University of Pannonia, Hungary
J. Selye University Komarno, Slovakia
ABSTRACT
The purpose of this study is to examine the effect of aggregation methods of subjective
performance ratings on performance ranking list. Subjective rating is key part of the individual
performance evaluation. As the consequence of subjectivity, there are strict raters who
generally use lower rates while generous raters give rather higher rates. Raters can influence
the final ranking. Therefore, there are methods to reduce subjectivity in ratings. This study
contributes to the performance evaluation literature with analyzing 4 aggregation methods and
their effect on the ranking list. Data is collected from a medium size IT service firm. t-test is
used to compare strict raters with generous raters and poor performers with good performers.
Four different aggregation methods are tested, and their ranked lists are compared. This study
shows that employees ranked at the bottom because strict raters evaluated them. There are
methods to eliminate the subjective differences, however these methods affect the final ranking.
The top n or bottom n group of employees are different for the tested methods. Practitioners
must be aware of the fact that there are strict and generous raters. Assigning more strict or
more generous raters to a ratee may influence the final ranking. Instead of ratings. managers
can collect subjective information such as examples and make the final ratings themselves.
This paper sheds a light on the sensitivity of methods attempting to reduce the personal
differences in subjective performance evaluation.
Keywords: Performance evaluation, subjective performance rating, performance ranking,
aggregation methods
1. INTRODUCTION
Performance evaluation of individuals consists of objective criteria that can be measured and
subjective criteria that are evaluated using subjective rating scales. Subjective evaluation has
two types. It can be numeric or linguistic (Espinilla et al., 2013). Subjective performance
evaluation is effective only if the superior makes fair and unbiased decision (Bellavance et al.,
2013). Subjective ratings and objective measures are not interchangeable (Bommer et al., 1995)
Subjectivity is based on personal feelings, impressions and opinion. It is a judgement, therefore
cannot be verified by a third person (Bol, 2008). Three forms of the subjectivity appear in the
performance appraisal literature: judgement of performance, flexibility in weighting
performance measures and deciding how to use the measures (Gibbs et al, 2004). The ex post
flexibility effects the perception of procedural justice. The quality of superior and employee
relationship reduces those effects. While, voice opportunity increases the effect (Bellavance et
al., 2013). Subjective scales of performance evaluation contain number of items. Examples for
end points are: Totally disagree and totally agree, never and extremely often, (e.g. Woods, 2012,
Gordon et al. 2018). The raters may interpret differently these items as they are not exactly
defined. Objective measurement extended with additional subjective evaluation is superior to
the purely objective performance measurement (Kunz, 2015).
58th International Scientific Conference on Economic and Social Development – Budapest, 04-05 September, 2020
164
Compared to objective measurements, subjective evaluation has several benefits. Objective
measures are incomplete, they are noisy, as their outcome may depend on factors that are out
of the employee’s control. They deficient when they are not congruent with the organization’s
objectives or when they can be manipulated (Woods, 2012). Employees ignores dimensions of
their job that is not measured. Ex post subjective evaluations can consider information that were
not known when objective measures are ex ante set (Bol, 2008). Value enhancing job
dimensions may be difficult to capture on objective manner. The effect of unforeseen or
uncontrollable external factors may be compensated by subjective evaluations (Voußem et al.
2016). Subjectivity can be used to encourage cooperation (Gibbs et al., 2004). Besides
advantages, subjective performance evaluation has some drawbacks, too. Cognitive distortion
may happen, if the objective measures are known at the time of subjective evaluation. When
the objective measures are relatively high, the subjective evaluation will also be higher. In
addition, the effect of objective measures depends on how much the individual can control
them. Subjective evaluations may adjust the impact of uncontrollable events (Bol & Smith,
2011). Subjective performance evaluation has two main limitation: leniency and centrality bias
(Golman & Bhatia, 2012). The first refer to the situation where there are moo many employees
in the upper range. Noisy performance signals and asymmetry in manager’s preferences are the
main reasons why managers overrate employee’s performance. The later means too little
variation in the ratings. Subjectivity raises behavioral issues such as trust or conflict in
perception between manager and subordinate. Subjectivity has positive effect on performance
when there is a trust between the subordinate and the manager (Gibbs et al., 2004). Performance
appraisal is a relevant process which is used in most of the organizations. Its result may be used
in several other processes and decisions such as promotion, compensation (salary or bonus) or
trainings and development (Espinilla, 2013). In order to make those decisions, different
appraisals may be used. Knowing the raters are biased, some of them rather overrate the
employee’s performance some others are more certain in the performance or more strict may
give lower rates. It is assumed, the rater’s behavior affects the final ranking. Those employees’
overall ratings are lower who are rated by more certain or strict evaluators. Despite of its
drawbacks, subjective performance is an important part of the performance appraisals. For
example, there is an inverted U-shaped relationship between subjectivity emphasis and
perception of distributive and procedural justice (Voußem et al., 2016). Therefore, it is
important to understand how subjective rating may affect the final evaluation. This knowledge
may help practitioners to better understand how they influence the final ranking when applying
methods to reduce subjectivity in rating. When employees are rated by several other persons,
average rate may be calculated for all evaluated persons and ranking list is created. Due to
subjective evaluation some of the raters are stricter and use lower rates while others are rather
generous and gives higher rates. This assumption leads to the research question as: Are those
employees who are located at the end (or beginning) of the ranked list are evaluated by more
(or fewer) strict rater? This article uses rating data from an IT services firm to find the answer
to the research question using statistical tests. Four different method is analyzed and compare
the ranked lists. The next section summarizes the literature on subjective ratings. Followed by
the description of the data and research methods as well as results. Finally, a conclusion is
drawn with recommendation for practitioners.
2. LITERATURE REVIEW
Performance evaluation literature deals with two cases. One is concerned with the manager’s
evaluation of her employee’s performance (e.g. Golman & Bhatia, 2012). The other, widely
used method, is the 360-degree performance evaluation. In this case, several persons are
involved to rate one individual: manager, coworkers, collaborators, subordinates, customers
and even some cases the employees evaluate themselves (Espinilla et al., 2013).
58th International Scientific Conference on Economic and Social Development – Budapest, 04-05 September, 2020
165
Involving various groups in the evaluation provides rich information. Evaluations from within
the group have high reliability. However, performance evaluation from different groups may
reflect the performance from different perspectives and the measures coming from different
groups may not easily be compared (Chenhall & Langfield-Smith, 2007). The raters evaluate
one individual’s performance based on several criteria which provides a heterogenous
information. All those evaluations made about an individual’s performance need to be
aggregated to get the final rating and ranking within the organization. It may be sophisticated
process by using different weights assigned to evaluators and criteria (Moon, et al., 2010). 3
step process may be used for aggregation which includes creating collective criteria values,
global criteria values and global values (de Andrés et al., 2010, Espinilla et al., 2013, Titkanloo
et al., 2018). First, the aggregation is made within each evaluation group, i.e. managers,
coworkers, subordinates, etc. Next, result of all groups are aggregated for each criterion.
Finally, each evaluated individual is assigned with a single value evaluation by aggregating all
criteria. Several methods may be used for making the aggregation. Simple or weighted average,
fuzzy operators or mathematical models such as goal programming may be used (Titkanloo et
al., 2018). Before making the aggregation, the original evaluations may be transformed.
Espinilla et al., (2013) uses a 2-step transformation called unification. First, the numeric,
linguistic and interval parameters are transformed into fuzzy sets. Second, they are transformed
into linguistic 2-tuples. The aggregation is made in the linguistic domain. Normalization is
another way of preprocessing the evaluations before the aggregation. In this process, each
evaluator’s rates are transferred to a value between 0 and 1, where the lowest rate is transformed
to 0 and the highest rate to 1 (de Andrés et al., 2010). When the aggregated ratings for all
individuals within the organization are available, they are calibrated. The purpose of this
activity is to adjust ratings. It is mainly used to remove leniency bias. The relatively high rates
are lowered. On the other hand, the relatively low rates are not increased (Demeré et al., 2019).
Some organizations use forced distribution, which means they define the distribution what the
final evaluations must follow. Forced distribution positively effect the performance on short
term. On longer term, the effect is negative via mediators as motivation, attraction and retention
of high performers. Citizenship performance is also negative effected via perception of injustice
and dysfunctional. In addition, it generates counterproductive performance (Moon et al., 2016).
Selection of the evaluators and the aggregation method influences the final evaluation. In order
to reduce the effect of the extreme evaluations, too high or too low evaluations may be excluded
from the final evaluation. As it is not known how to remove some of the evaluations, methods
are needed that considers all information. (Moon et al., 2010). Not all evaluators are able to
evaluate all criteria for all individuals (de Andrés et al., 2010). There are personal differences
in the subjective evaluations. Different raters may use different dimensions of performance or
define these dimensions differently. When dimension is not defined for each job, but one
definition exists for everyone or group of jobs within an organization, the rater defines the
dimension and evaluate accordingly. Additionally, scales may be defined in with expressions
(e.g. Woods, 2012, Gordon et al. 2018). It also gives the possibility to the raters to interpret
according to own judgement. In case of same definition or weighting, rates may have different
opportunities to observe the individuals whom they evaluate (Chenhall & Langfield-Smith,
2007). Even working closely to each other, different rater may value other contributions or
behaviors of the evaluated person. Evaluators may consider uncontrollable events differently.
They may be ignored or compensated. Moreover, not all events may be known to all evaluators.
As subjective judgement or weights set by humans are considered in an algorithmic procedure,
different final ranking of the employees may happen when any of those parameters are altered.
This means different final ranking of the employees are created. Authors made effort to
eliminate the subjectivity by norming (de Andrés et. al., 2010) or unifying (Espinilla et al.,
2013) the judgement of raters.
58th International Scientific Conference on Economic and Social Development – Budapest, 04-05 September, 2020
166
Apart from the subjectivity, there may be several reasons why raters give lower some other
gives higher rates. One reason may be a rater who gives lower rates asked to evaluate employees
with lower performance. According to the prior literature and the assumptions the following
hypotheses are made that help answering the research question and will serve the basis of the
analysis.
• Hypothesis 1: Employees are ranked higher because they are evaluated by more generous
evaluators.
• Hypothesis 2: Employees are ranked lower because they are evaluated by more strict
evaluators.
• Hypothesis 3: Generous raters gives higher rates because they evaluate more good
performers
• Hypothesis 4: Strict raters gives lower rates because they evaluate more poor performers
In order to test the hypotheses, rating data is collected from an IT firm and statistically tested.
Poor performer ratees are those employees who are in the bottom third of the ranked list of
employees. The top third employees of the ranked list are the good performers. An ordered list
of raters is created based on their average rate. The top third of the raters called generous raters.
The bottom third are the strict raters. The following section describes in details the data and the
method. Statistical method compares the top and bottom third of both raters and ratees.
3. RESEARCH METHOD
3.1. Data
Subjective performance data is collected from a middle size IT service company Central
Europe. The evaluation criteria consist of 5 behavior elements derived from the firm’s values
and additional 3 items for managers. The scale is from 1 to 6, where 4 is the expected behavior.
There are 2 items above and 3 below the expectations. There are 54 employees who were rated
by 50 colleagues. The raters got information as the explanation of the categories and the
definition of rates. The same method has been used for 6 years. Therefore, it is well known for
most of the raters. HR manager prepared and distributed the spreadsheets to all raters. One
spreadsheet contained all names (rows). The columns contained all 5 items with the definitions.
Raters could give a rate between 1 and 6 as well as a textual evaluation for each category
separately and an overall evaluation text. In case of managers, an additional spreadsheet was
used. It contained columns for all three managerial skills. Both, a rate between 1 and 6 as well
as a comment could be given for each. In additional an overall evaluation could be given. After
explaining the process, HR manager distributed the Excel sheets to all raters via email. The
raters sent back the Excel sheets in email after they made the evaluations. HR manager collected
all Excel sheets and made summary for all ratees. Average rate is calculated for each rater.
Bases on the ratio of each rater’s average and all raters’ average, the all rates of each rater are
recalculated in order to eliminate the differences between the averages. The final ranking list
of employees is calculated from the recalculated rates. After processing all evaluations, HR
manager presented the top 4 employees, without the exact rank, to the whole company. The
bottom 10% (5 employees) had a “how to continue” discussion with their managers. In order
to process the data, the original data in Excel sheets is transformed to rater-ratee-rate-category
data sets for the analysis. Other variables as groups of rate and rater (figure 1) were added. This
format was used as the input to the JMP pro 13.1.0 statistical software.
3.2. Descriptive statistics
One rater gave minimum 5, maximum 128, average 40.8 rates with standard deviation of 24.1.
Altogether 2040 rates are given. The average of all raters’ average is 4.77, standard deviation
is 0.31. The rates are rather above expectations even the items of the scale are clearly defined.
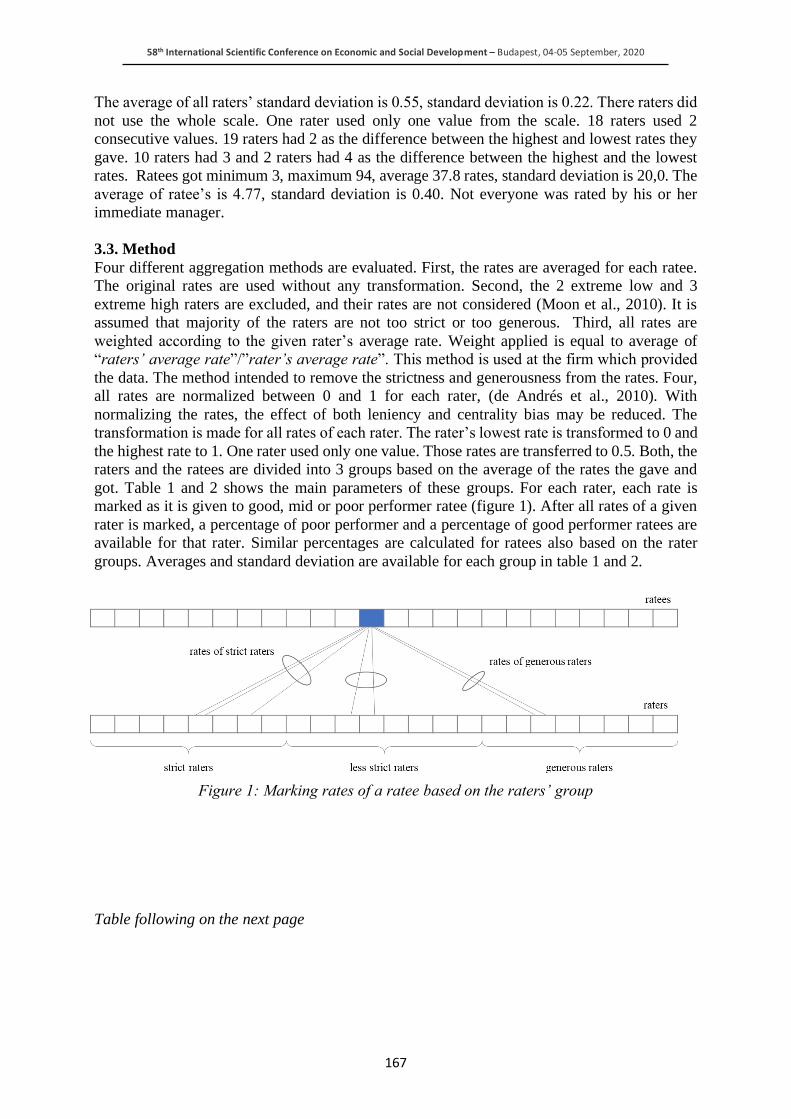
58th International Scientific Conference on Economic and Social Development – Budapest, 04-05 September, 2020
167
The average of all raters’ standard deviation is 0.55, standard deviation is 0.22. There raters did
not use the whole scale. One rater used only one value from the scale. 18 raters used 2
consecutive values. 19 raters had 2 as the difference between the highest and lowest rates they
gave. 10 raters had 3 and 2 raters had 4 as the difference between the highest and the lowest
rates. Ratees got minimum 3, maximum 94, average 37.8 rates, standard deviation is 20,0. The
average of ratee’s is 4.77, standard deviation is 0.40. Not everyone was rated by his or her
immediate manager.
3.3. Method
Four different aggregation methods are evaluated. First, the rates are averaged for each ratee.
The original rates are used without any transformation. Second, the 2 extreme low and 3
extreme high raters are excluded, and their rates are not considered (Moon et al., 2010). It is
assumed that majority of the raters are not too strict or too generous. Third, all rates are
weighted according to the given rater’s average rate. Weight applied is equal to average of
“raters’ average rate”/”rater’s average rate”. This method is used at the firm which provided
the data. The method intended to remove the strictness and generousness from the rates. Four,
all rates are normalized between 0 and 1 for each rater, (de Andrés et al., 2010). With
normalizing the rates, the effect of both leniency and centrality bias may be reduced. The
transformation is made for all rates of each rater. The rater’s lowest rate is transformed to 0 and
the highest rate to 1. One rater used only one value. Those rates are transferred to 0.5. Both, the
raters and the ratees are divided into 3 groups based on the average of the rates the gave and
got. Table 1 and 2 shows the main parameters of these groups. For each rater, each rate is
marked as it is given to good, mid or poor performer ratee (figure 1). After all rates of a given
rater is marked, a percentage of poor performer and a percentage of good performer ratees are
available for that rater. Similar percentages are calculated for ratees also based on the rater
groups. Averages and standard deviation are available for each group in table 1 and 2.
Figure 1: Marking rates of a ratee based on the raters’ group
Table following on the next page
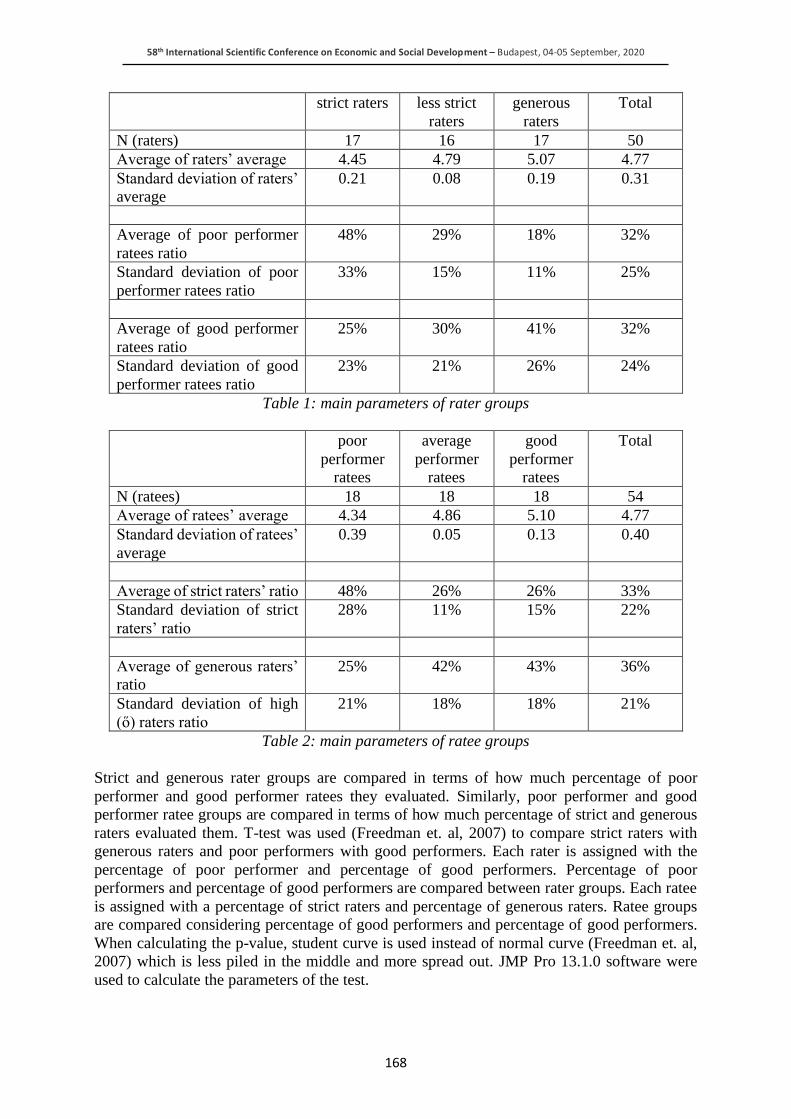
58th International Scientific Conference on Economic and Social Development – Budapest, 04-05 September, 2020
168
strict raters less strict
raters
generous
raters
Total
N (raters) 17 16 17 50
Average of raters’ average 4.45 4.79 5.07 4.77
Standard deviation of raters’
average
0.21 0.08 0.19 0.31
Average of poor performer
ratees ratio
48% 29% 18% 32%
Standard deviation of poor
performer ratees ratio
33% 15% 11% 25%
Average of good performer
ratees ratio
25% 30% 41% 32%
Standard deviation of good
performer ratees ratio
23% 21% 26% 24%
Table 1: main parameters of rater groups
poor
performer
ratees
average
performer
ratees
good
performer
ratees
Total
N (ratees) 18 18 18 54
Average of ratees’ average 4.34 4.86 5.10 4.77
Standard deviation of ratees’
average
0.39 0.05 0.13 0.40
Average of strict raters’ ratio 48% 26% 26% 33%
Standard deviation of strict
raters’ ratio
28% 11% 15% 22%
Average of generous raters’
ratio
25% 42% 43% 36%
Standard deviation of high
(ő) raters ratio
21% 18% 18% 21%
Table 2: main parameters of ratee groups
Strict and generous rater groups are compared in terms of how much percentage of poor
performer and good performer ratees they evaluated. Similarly, poor performer and good
performer ratee groups are compared in terms of how much percentage of strict and generous
raters evaluated them. T-test was used (Freedman et. al, 2007) to compare strict raters with
generous raters and poor performers with good performers. Each rater is assigned with the
percentage of poor performer and percentage of good performers. Percentage of poor
performers and percentage of good performers are compared between rater groups. Each ratee
is assigned with a percentage of strict raters and percentage of generous raters. Ratee groups
are compared considering percentage of good performers and percentage of good performers.
When calculating the p-value, student curve is used instead of normal curve (Freedman et. al,
2007) which is less piled in the middle and more spread out. JMP Pro 13.1.0 software were
used to calculate the parameters of the test.
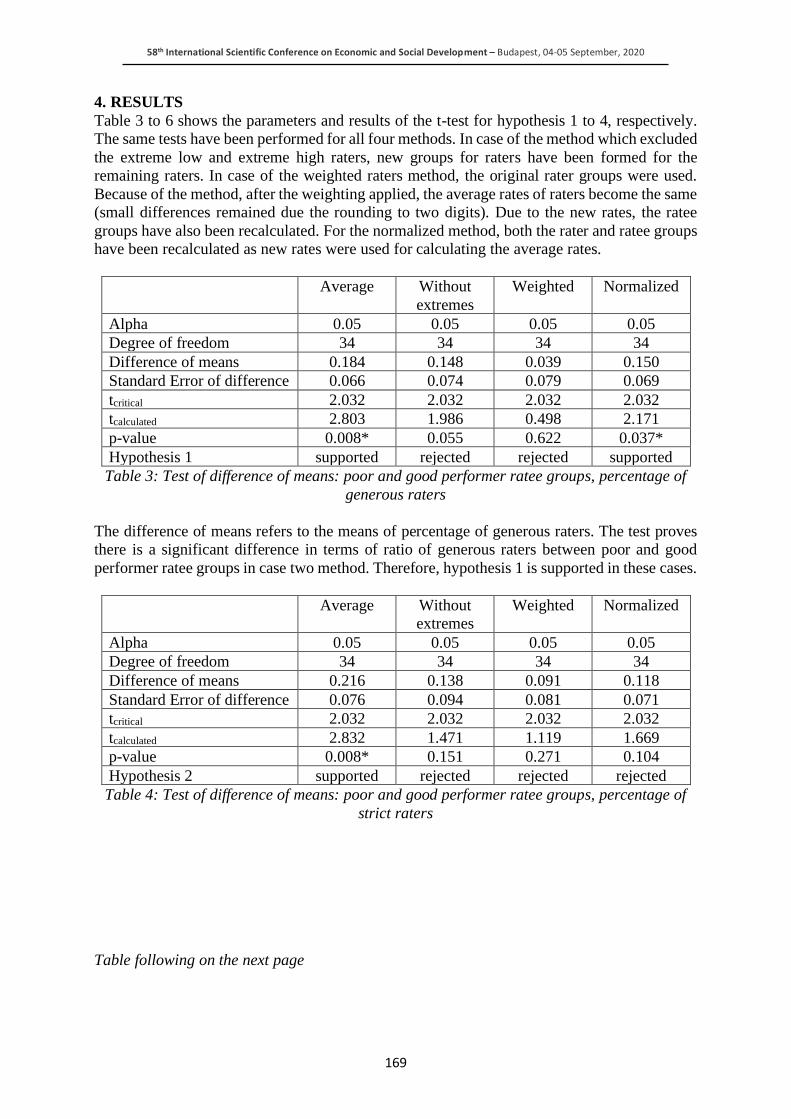
58th International Scientific Conference on Economic and Social Development – Budapest, 04-05 September, 2020
169
4. RESULTS
Table 3 to 6 shows the parameters and results of the t-test for hypothesis 1 to 4, respectively.
The same tests have been performed for all four methods. In case of the method which excluded
the extreme low and extreme high raters, new groups for raters have been formed for the
remaining raters. In case of the weighted raters method, the original rater groups were used.
Because of the method, after the weighting applied, the average rates of raters become the same
(small differences remained due the rounding to two digits). Due to the new rates, the ratee
groups have also been recalculated. For the normalized method, both the rater and ratee groups
have been recalculated as new rates were used for calculating the average rates.
Average Without
extremes
Weighted Normalized
Alpha 0.05 0.05 0.05 0.05
Degree of freedom 34 34 34 34
Difference of means 0.184 0.148 0.039 0.150
Standard Error of difference 0.066 0.074 0.079 0.069
tcritical 2.032 2.032 2.032 2.032
tcalculated 2.803 1.986 0.498 2.171
p-value 0.008* 0.055 0.622 0.037*
Hypothesis 1 supported rejected rejected supported
Table 3: Test of difference of means: poor and good performer ratee groups, percentage of
generous raters
The difference of means refers to the means of percentage of generous raters. The test proves
there is a significant difference in terms of ratio of generous raters between poor and good
performer ratee groups in case two method. Therefore, hypothesis 1 is supported in these cases.
Average Without
extremes
Weighted Normalized
Alpha 0.05 0.05 0.05 0.05
Degree of freedom 34 34 34 34
Difference of means 0.216 0.138 0.091 0.118
Standard Error of difference 0.076 0.094 0.081 0.071
tcritical 2.032 2.032 2.032 2.032
tcalculated 2.832 1.471 1.119 1.669
p-value 0.008* 0.151 0.271 0.104
Hypothesis 2 supported rejected rejected rejected
Table 4: Test of difference of means: poor and good performer ratee groups, percentage of
strict raters
Table following on the next page
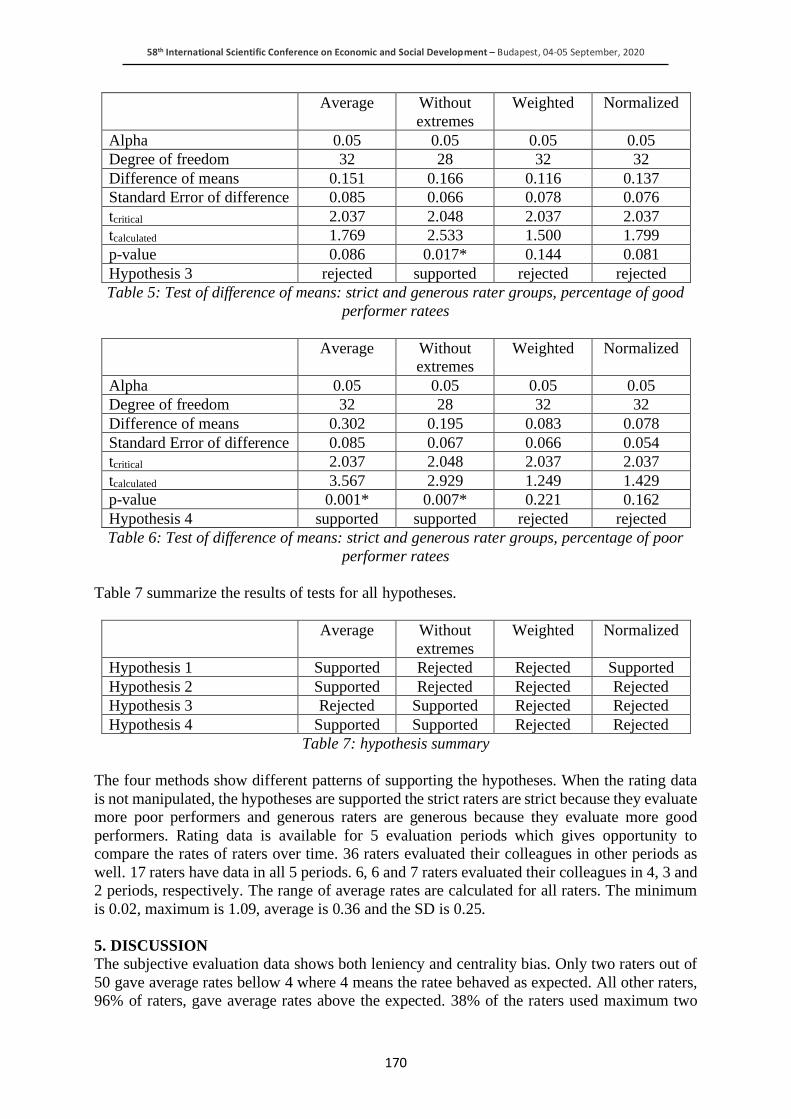
58th International Scientific Conference on Economic and Social Development – Budapest, 04-05 September, 2020
170
Average Without
extremes
Weighted Normalized
Alpha 0.05 0.05 0.05 0.05
Degree of freedom 32 28 32 32
Difference of means 0.151 0.166 0.116 0.137
Standard Error of difference 0.085 0.066 0.078 0.076
tcritical 2.037 2.048 2.037 2.037
tcalculated 1.769 2.533 1.500 1.799
p-value 0.086 0.017* 0.144 0.081
Hypothesis 3 rejected supported rejected rejected
Table 5: Test of difference of means: strict and generous rater groups, percentage of good
performer ratees
Average Without
extremes
Weighted Normalized
Alpha 0.05 0.05 0.05 0.05
Degree of freedom 32 28 32 32
Difference of means 0.302 0.195 0.083 0.078
Standard Error of difference 0.085 0.067 0.066 0.054
tcritical 2.037 2.048 2.037 2.037
tcalculated 3.567 2.929 1.249 1.429
p-value 0.001* 0.007* 0.221 0.162
Hypothesis 4 supported supported rejected rejected
Table 6: Test of difference of means: strict and generous rater groups, percentage of poor
performer ratees
Table 7 summarize the results of tests for all hypotheses.
Average Without
extremes
Weighted Normalized
Hypothesis 1 Supported Rejected Rejected Supported
Hypothesis 2 Supported Rejected Rejected Rejected
Hypothesis 3 Rejected Supported Rejected Rejected
Hypothesis 4 Supported Supported Rejected Rejected
Table 7: hypothesis summary
The four methods show different patterns of supporting the hypotheses. When the rating data
is not manipulated, the hypotheses are supported the strict raters are strict because they evaluate
more poor performers and generous raters are generous because they evaluate more good
performers. Rating data is available for 5 evaluation periods which gives opportunity to
compare the rates of raters over time. 36 raters evaluated their colleagues in other periods as
well. 17 raters have data in all 5 periods. 6, 6 and 7 raters evaluated their colleagues in 4, 3 and
2 periods, respectively. The range of average rates are calculated for all raters. The minimum
is 0.02, maximum is 1.09, average is 0.36 and the SD is 0.25.
5. DISCUSSION
The subjective evaluation data shows both leniency and centrality bias. Only two raters out of
50 gave average rates bellow 4 where 4 means the ratee behaved as expected. All other raters,
96% of raters, gave average rates above the expected. 38% of the raters used maximum two
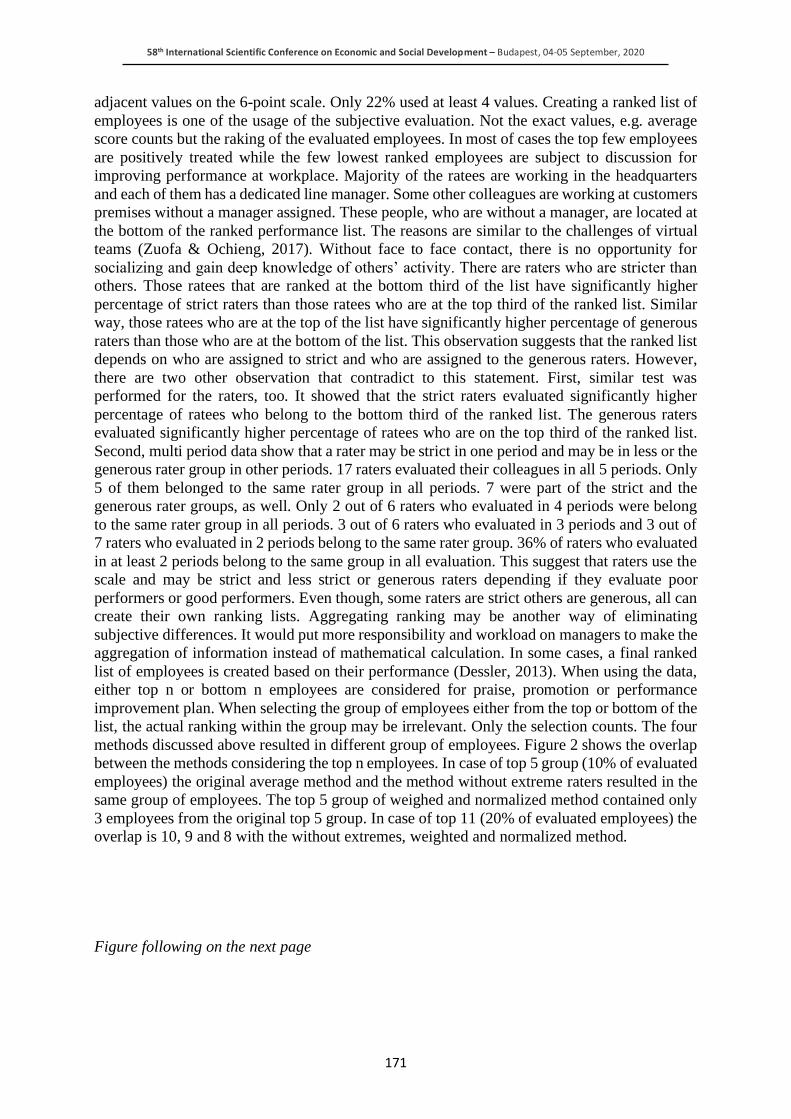
58th International Scientific Conference on Economic and Social Development – Budapest, 04-05 September, 2020
171
adjacent values on the 6-point scale. Only 22% used at least 4 values. Creating a ranked list of
employees is one of the usage of the subjective evaluation. Not the exact values, e.g. average
score counts but the raking of the evaluated employees. In most of cases the top few employees
are positively treated while the few lowest ranked employees are subject to discussion for
improving performance at workplace. Majority of the ratees are working in the headquarters
and each of them has a dedicated line manager. Some other colleagues are working at customers
premises without a manager assigned. These people, who are without a manager, are located at
the bottom of the ranked performance list. The reasons are similar to the challenges of virtual
teams (Zuofa & Ochieng, 2017). Without face to face contact, there is no opportunity for
socializing and gain deep knowledge of others’ activity. There are raters who are stricter than
others. Those ratees that are ranked at the bottom third of the list have significantly higher
percentage of strict raters than those ratees who are at the top third of the ranked list. Similar
way, those ratees who are at the top of the list have significantly higher percentage of generous
raters than those who are at the bottom of the list. This observation suggests that the ranked list
depends on who are assigned to strict and who are assigned to the generous raters. However,
there are two other observation that contradict to this statement. First, similar test was
performed for the raters, too. It showed that the strict raters evaluated significantly higher
percentage of ratees who belong to the bottom third of the ranked list. The generous raters
evaluated significantly higher percentage of ratees who are on the top third of the ranked list.
Second, multi period data show that a rater may be strict in one period and may be in less or the
generous rater group in other periods. 17 raters evaluated their colleagues in all 5 periods. Only
5 of them belonged to the same rater group in all periods. 7 were part of the strict and the
generous rater groups, as well. Only 2 out of 6 raters who evaluated in 4 periods were belong
to the same rater group in all periods. 3 out of 6 raters who evaluated in 3 periods and 3 out of
7 raters who evaluated in 2 periods belong to the same rater group. 36% of raters who evaluated
in at least 2 periods belong to the same group in all evaluation. This suggest that raters use the
scale and may be strict and less strict or generous raters depending if they evaluate poor
performers or good performers. Even though, some raters are strict others are generous, all can
create their own ranking lists. Aggregating ranking may be another way of eliminating
subjective differences. It would put more responsibility and workload on managers to make the
aggregation of information instead of mathematical calculation. In some cases, a final ranked
list of employees is created based on their performance (Dessler, 2013). When using the data,
either top n or bottom n employees are considered for praise, promotion or performance
improvement plan. When selecting the group of employees either from the top or bottom of the
list, the actual ranking within the group may be irrelevant. Only the selection counts. The four
methods discussed above resulted in different group of employees. Figure 2 shows the overlap
between the methods considering the top n employees. In case of top 5 group (10% of evaluated
employees) the original average method and the method without extreme raters resulted in the
same group of employees. The top 5 group of weighed and normalized method contained only
3 employees from the original top 5 group. In case of top 11 (20% of evaluated employees) the
overlap is 10, 9 and 8 with the without extremes, weighted and normalized method.
Figure following on the next page
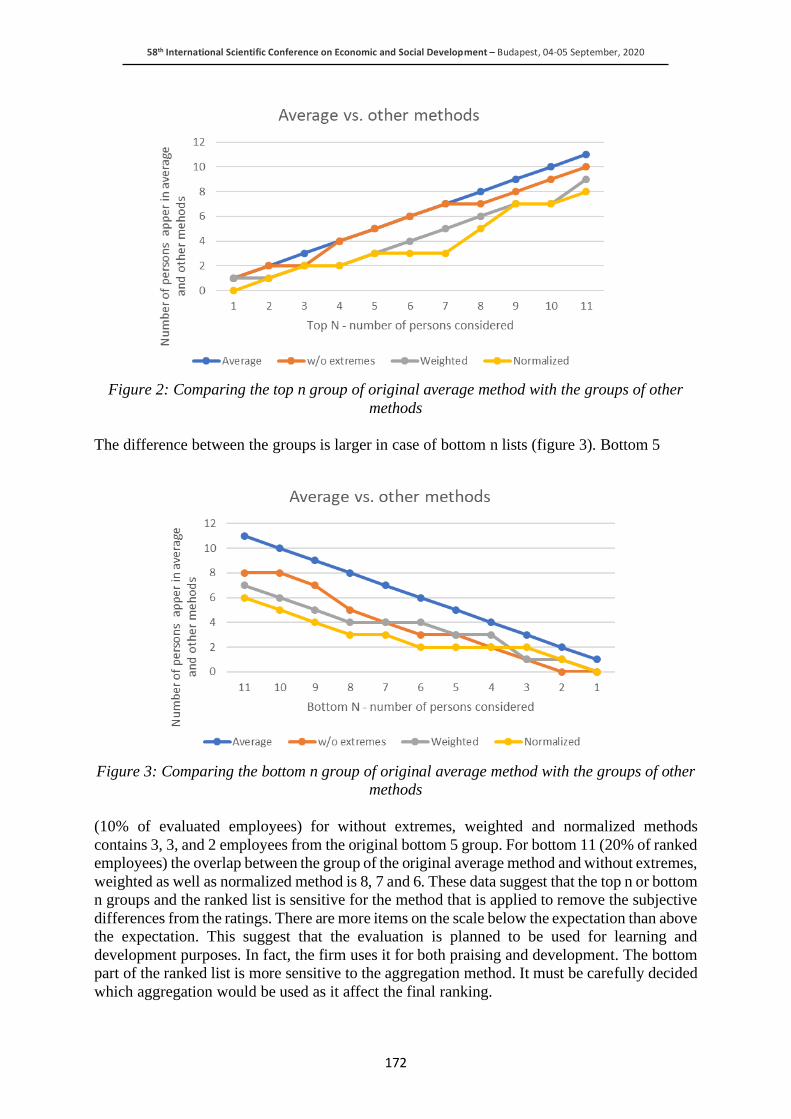
58th International Scientific Conference on Economic and Social Development – Budapest, 04-05 September, 2020
172
Figure 2: Comparing the top n group of original average method with the groups of other
methods
The difference between the groups is larger in case of bottom n lists (figure 3). Bottom 5
Figure 3: Comparing the bottom n group of original average method with the groups of other
methods
(10% of evaluated employees) for without extremes, weighted and normalized methods
contains 3, 3, and 2 employees from the original bottom 5 group. For bottom 11 (20% of ranked
employees) the overlap between the group of the original average method and without extremes,
weighted as well as normalized method is 8, 7 and 6. These data suggest that the top n or bottom
n groups and the ranked list is sensitive for the method that is applied to remove the subjective
differences from the ratings. There are more items on the scale below the expectation than above
the expectation. This suggest that the evaluation is planned to be used for learning and
development purposes. In fact, the firm uses it for both praising and development. The bottom
part of the ranked list is more sensitive to the aggregation method. It must be carefully decided
which aggregation would be used as it affect the final ranking.
58th International Scientific Conference on Economic and Social Development – Budapest, 04-05 September, 2020
173
Even the group of bottom n employees without exact ranking differs if another ranking method
is chosen. Therefore, different group of employees are subject to treatment, e.g. performance
improvement plan.
6. CONCLUSION
Performance evaluation contains objective and subjective elements. Subjectivity may be
included as the scale may not be fully defined, the raters interpret the scale differently or they
may be biased. Despite of the subjectivity, ratings are widely used for employee performance
evaluation. This paper contributes to the literature by comparing four methods used for reducing
subjective differences in ratings. Rating data is collected from an IT service company operates
in Central Europe. 54 employees are evaluated by 50 colleagues at the beginning of 2019. Data
show that those employees who are located at the bottom of the list (poor performers) are
evaluated by more strict raters that those colleagues who are at the top third of the ranking list
(good performers). On the other hand, those employees who are at the top third of the list are
evaluated by more generous raters. However, the strict raters are strict because they evaluated
more poor performance ratees. 36 raters rated in other periods, out of which 12 raters belong to
the same rater group. Namely, a strict rater may belong to less strict or generous rater groups in
other evaluation periods. Besides simple average method, three other methods are used to
calculate the overall ratings. One method excluded the extreme low and extreme high raters.
Another method uses weights to eliminate the difference between the averages of raters. Finally,
a normalized method is used to transform all rates of each rater to a number between 0 and 1.
The weighted and normalized method do not show the same behavior as the original method.
The employees are the bottom third do not have more strict raters than the employees at the top
third of the ranked list. The different methods result different group of top n and bottom n
employees. The top or the bottom part of the ranking lists are sensitive to the method applied
to reduce the subjective differences. Practitioners and managers must be aware of the effect of
methods they may use to reduce subjectivity. Different groups of employees may be the subject
of treatment, either positive or negative. Subjective rating may be used without any
transformation. The effect of subjectivity shall be reduced by better defined scales or trainings
rather than transforming the rates. Alternatively, ratings may be avoided, and the evaluators
provides textual description of the given behavior. The manager of the evaluated employee can
make the final evaluation based on the descriptions. Trainings need to be improved in order to
ensure the consistency in ratings. Despite of the fact of conducting training on the categories
and the rates, only 3 ratees got average rate below 4 which represents the expected behavior.
This result is achieved on a 6 items scale, where there are more items for performance below
expectation. It could also be a cultural effect that most of the rates are above expectation.
However, if it is real performance where most of the employees perform above expectation, the
company may consider employing less senior staff. Doing so, cheaper operation could make
the required quality work. As for the first limitation, the data is collected at one medium size
company. 50 raters’ evaluations are used. Second, only the rates are available, no
supplementary data such as ratees’ satisfaction with their average or rank. The managers did
not tell the employees those pieces of information, therefore they are not available.
LITERATURE:
1. Bellavance, F. Landry, S. and Schiehll, E. (2013). “Procedural justice in managerial
performance evaluation: Effects of subjectivity, relationship quality, and voice
opportunity”, The British Accounting Review, Vol. 45, No. 3, pp. 149-166.
2. Bol, J.C. (2008), Subjectivity in Compensation Contracting, Journal of Accounting
Literature, Vol 27., pp. 1-24.
58th International Scientific Conference on Economic and Social Development – Budapest, 04-05 September, 2020
174
3. Bol, J.C. and Smith, S.D. (2011). Spillover effects in subjective Performance Evaluation,
Bias and Asymmetric Influence of controllability, The Accounting Review, Vol. 86, No. 4,
pp. 1213-1230.
4. Bommer, W.H. Johnson, J.L. and Rich, G.A. (1995). On the Interchangeability of Objective
and Subjective Measures of Employee Performance: A Meta-Analysis, Personnel
Psychology, Vol 48., pp. 587-605.
5. Chenhall, R.H. and Langfield-Smith, K. (2007). Multiple Perspectives of Performance
Measures, European Management Journal, Vol. 25, No. 4, pp. 266-282.
6. de Andrés, R. García-Lapresta, J.L. and González-Pachón, J. (2010). Performance
appraisal based on distance function methods, European Journal of Operational Research,
Vol. 207, No. 3, pp. 1599-1607.
7. Demeré, B.W. Sedatole, K. and Woods, A., (2019). The Role of Calibration Committees in
Subjective Performance Evaluation Systems, Management Science, Vol. 65. No. 4, pp.
1455-1497.
8. Dessler, G. (2013). Human Resource Management, 13th edition, Pearson,
9. Espinilla, M. de Andres, R. Martinez F.J. and Martinez, L. (2013). A 360-degree
performance appraisal model dealing with heterogeneous information and dependent
criteria, Information Sciences, Vol. 222, pp. 459-471.
10. Freedman, D. Pisani R. Purves, R. (2007). Statistics, 4th edition, W.W. Norton & Company
Inc., New York
11. Gibbs, M. Merchant, K. Stede, W. and Vargus, M. (2004). Determinants and Effects of
Subjectivity in Incentives, The Accounting Review, Vol. 79., No. 2., pp. 409-436.
12. Golman, R. and Bhatia, S. (2012). Performance evaluation inflation and compression,
Accounting, Organizations and Society, Vol. 37, No. 8, pp. 534-543.
13. Gordon, H.J. Demerouti, E. Le Blanc, P.M. Bakker, A.B. Bipp, T. and Verhagen, M.A.M.T.
(2018). Individual job redesign: Job crafting interventions in healthcare, Journal of
Vocational Behavior, Vol. 104, pp. 98-114.
14. Kunz, J. (2015). Objectivity and subjectivity in performance evaluation and autonomous
motivation: An exploratory study, Management Accounting Research, Vol. 27, pp. 27-46.
15. Moon, C. Lee, J. and Lim, S. (2010). A performance appraisal and promotion ranking
system based on fuzzy logic: An implementation case in military organizations, Applied
Soft Computing, Vol. 10, No. 2, pp. 512-519.
16. Moon, S.H. Scullen, S.E. and Latham, G.P. (2016). Precarious curve ahead: The effects of
forced distribution rating systems on job performance, Human Resource Management
Review, Vol. 26, No. 2, pp. 166-179.
17. Titkanloo, H.N. Keramati, A. and Fekri, R. (2018). Data aggregation in multi-source
assessment model based on evidence theory, Applied Soft Computing, Vol. 69, pp. 443-
452.
18. Voußem, L. Kramer, S. and Schäffer, U. (2016). Fairness perceptions of annual bonus
payments: The effects of subjective performance measures and the achievement of bonus
targets, Management Accounting Research, Vol. 30, pp. 32-46.
19. Woods, A. (2012). Subjective adjustments to objective performance measures: The
influence of prior performance, Accounting, Organizations and Society, Vol. 37, No. 6, pp.
403-425.
20. Zuofa, T. and Ochieng, E. (2017). Working separately but together: appraising virtual
project team challenges, Team Performance Management, Vol. 23 No. 5/6, pp. 227-242.
58th International Scientific Conference on Economic and Social Development – Budapest, 04-05 September, 2020
175
ICE-HOCKEY AS A POTENTIAL IMPROVEMENT OF EMOTIONAL
INTELLIGENCE AND RESILIENCE: INCREASING
PSYCHOLOGICAL CAPITAL
Gergely Geczi
Szechenyi Istvan University, Hungary
Laszlo Imre Komlosi
Szechenyi Istvan University, Hungary
ABSTRACT
Playing ice-hockey is a fun activity that may bring joy to the life of the players. In this research,
the author seeks the answer whether playing ice-hockey has a contributing effect to the
emotional intelligence and resilience levels of people. The authors processed the most recent
scientific literature in the field and concluded that it is possible that playing this sport has such
a causal relationship with the two psychological factors. The research uses quantitative data,
collected from 104 participants. To measure emotional intelligence and resilience, validated
scales were used. Cronbach’s alpha values showed that both scales were reliable measurers of
the ability levels. Results suggested that playing ice-hockey only partially contribute to the two
measured abilities of people directly, as the improvement in these abilities are stronger
connected to the age of the participants than their years of playing ice-hockey. This means if a
company wants to increase its psychological capital and gain a competitive edge, it is suggested
that they look for other training methods, and employ older employees, as they are likely to
possess a stronger psychological power. The research must be continued to identify whether
playing other sports may have stronger contributing effect to the psychological capital of
companies.
Keywords: Emotional intelligence, Resilience, Ice-hockey, Skills improvement, Psychological
capital
1. INTRODUCTION
Playing ice-hockey is a fun activity that brings joy to the life of the players, as it offers complex
mental and physical challenges to tackle within different in-game and social situations. As one
of the authors is a passionate lover of the sport, the authors of this paper became curious if
playing ice-hockey can contribute to the psychological abilities of the persons involved.
According to Montgomery (1988) and Vescovi et al. (2006), ice-hockey is one of the fastest
team sports in the world, physical force, speed, complicated technical elements, cunning tactics
and the fight body against body describes it. The speed, the number of stimuli may create
situations that require strong psychological power. In the work of Bhullar (2020), emotional
intelligence is defined as the competencies related to understanding, managing and utilizing the
emotions of self and other people. In a competitive environment in which many of the existing
companies operate, emotionally intelligent employees can contribute much to the overall
performance of their companies, mainly by utilizing emotions. In the article of Southwick et al.
(2014), different definitions of resilience were identified, but they share some fundamentals:
successfully bounce back to harmonic state after an event pushes us out from it. They also claim
that it is possible to become even more harmonious after such an event. Resilience is also part
of the psychological capital definition of Luthans et al. (2007). When working in an
environment that often requires us to mobilize much energy that we use to maintain our mental
well-being, resilience becomes a must-have ability.
58th International Scientific Conference on Economic and Social Development – Budapest, 04-05 September, 2020
176
Therefore, if playing ice-hockey is proven to be an efficient contributor for emotional
intelligence and resilience, companies can use it as a method to contribute to their employees’
ability, and increase its psychological capital. If playing ice-hockey can contribute to the
examined two abilities, companies may use it as a method to gain competitive edge over the
competitors. On the society level, such a knowledge is absolutely must-have, as in the 21st
century, the importance of having strong psychological power is increasing, especially on the
labor market. Luthans et al. (2007) claims that the competitive edge of any company in the 21st
century can be earned by people in the company having psychological toughness. The scientific
literature uses the term psychological capital when dealing with the psychological toughness of
employees of given companies. Building psychological capital is done in two ways: hiring new
employees that have such a psychological toughness and keeping them, and encouraging the
existing employees to do activities that are proven to contribute to their psychological power.
2. LITERATURE REVIEW
In their meta-analysis, Mattingly and Kraiger (2019) investigated whether emotional
intelligence can be trained. They identified 58 published and unpublished longitudinal studies,
and calculated Cohen’s d to calculate effect size, in order to estimate the effect of the trainings.
They found a moderate positive effect, concluding emotional intelligence can be trained and
improved. Jonker (2009) examined the effect of an aimed emotional intelligence development
program in a longitudinal study with accountant participants. In this research, the Bar-On EQ-
i scale was used, in a control group design. The results showed that the group participating in
the development program achieved higher scores than the control group, meaning it is possible
to improve emotional intelligence with aimed development programs. Foster et al. (2017)
claims that emotional intelligence scores of nurses improve over time when applying to a
nursing education program. In their longitudinal study, they proved that a significant
increasement was measurable in the utilizing emotions part of the scale they used. McEnrue et
al. (2009) examined 135 business students in a control-group designed way, in a leadership
development program. The participants showed an improvement in trait emotional intelligence,
suggesting that well-performed leadership program may have a developing effect on emotional
intelligence. Eika et al. (2019) examined the resilience development of nursing students in a
longitudinal study. They suggest that resilience may be highly improved when a trustworthy
learning culture is built. Taylor (2019) focused on Resilience trainings to decide whether
resilience training is a usable intervention method against burnout. She concluded that without
dealing with the environmental factors contributing to burnout, resilience training is an
incomplete solution. This means a resilience training, along with focusing with the
environmental factors are capable of developing the resilience of people, and protect them
against burnout. Denkova et al. (2020) examined whether giving short-form mindfulness
training to firefighters can contribute to these people’s resilience. After receiving the training,
the participants showed a significantly higher resilience level than the control group. According
to Azavedo and Shane (2019), the MBA students of a Californian university reached higher
levels of resilience when tested after finishing the problem, than on the test before. This
suggests the examined MBA program was capable of improving the resilience of the
participating students. Trottier et al. (2017) claims that when playing sports, coaches may have
a positive, developing effect on the life-skills of the players. The coach plays an important role
in this development. Friesen (2013) made an analysis on how 16 ice-hockey players from the
English professional league regulated the emotions of their teammates when in tough situations
which is part of emotional intelligence. As different strategies were identified, the teammates
of these examined players could see and learn different strategies to regulate other’s emotions.
This suggests that playing ice-hockey offers a chance to improve the ability to successfully
regulate others emotions, which may become an important ability when working together with
58th International Scientific Conference on Economic and Social Development – Budapest, 04-05 September, 2020
177
colleagues in their companies. Battochio and Stambulova (2019) revealed the coping strategies
of 23 Canadian National Hockey League players. As their different carrier situations required
different coping strategies, the players learned different strategies when pursuing their carrier
goals. Based on this finding, playing ice-hockey may create situations that requires the person
to make use of his/her emotions the best to reach the wanted solution to the situation and be
resilient. Côté et al. (2014) claims that personal development through sport is possible - they
used the Personal Assets Framework to identify the factors determining personal development.
The first factor is personal engagement in activities, the second is quality relationships, and the
third is appropriate settings. If a player of ice-hockey gives the chance to this sport to contribute
to his/her personal development and these three factors are focused on, playing ice-hockey may
have a developing effect on the personality of the player. This paper also suggests that playing
ice-hockey does have a developing effect on the person, however, the paper does not mention
psychological power as subject of development. Géczi et al. (2009) used CSAI-2, ACSI-28 and
STPI-Y self-evaluation questionnaires on the U16, U18 and U20 national ice-hockey team of
Hungary. They found significant difference between the age groups in terms of psychological
power, meaning psychological power may change when becoming older. Kaplánová (2019)
used self-report scales to measure the self-esteem, anxiety and coping strategies to handle stress
on 40 male ice-hockey players. They found that coping strategies against stress varies according
to the level of self-esteem and anxiety. Reduced anxiety level and increased self-esteem may
increase the success in coping with stress. This paper suggests that ice-hockey players face
stressful situations, in which coping strategies can be learnt. When in stressful situations, being
resilient is an important ability as it may contribute to the efficient management of stress,
according to Lester et al. (2020). In addition, Malinauskas et al. (2019) studied the relationship
between emotional intelligence and stress coping strategies. They used the Schutte Self-
Assessment Questionnaire to measure emotional intelligence, and the questionnaire by
Grakauskas and Valickas (2006) questionnaire to identify stress coping strategies. On a sample
of 123 participants, they found a significant relationship between the stress coping strategy and
the ability to evaluate and express own emotions, which is part of emotional intelligence. This
means, when ice-hockey players face stressful situations and learn the possible coping strategy
against it, their emotional intelligence may improve as well. Géczi et al. (2008) explored the
differences between U18 and adult ice-hockey players with the use of CSAI-2, ACSI-28 and
STPI-Y psychometric measures. They found that adult players can handle stressful situations
easier than U18 players, which may be caused by having more experience. Kurudirek et al.
(2016) found that teaching ice-hockey through educational games has a positive impact on the
cognitive development of children aged 8-12. According to McBride (2010), cognitive
development is positively correlated with the development of emotional intelligence. Therefore,
this paper suggests playing ice-hockey might have a developing effect on the emotional
intelligence of the players through their cognitive development. Based on the processed
literature, emotional intelligence and resilience abilities of people can be improved through
different activities. Older and more experienced ice-hockey players are having stronger coping
ability and psychologically measurable differences compared to young ice-hockey players,
suggesting that playing ice-hockey may be an activity that improves these abilities.
3. METHOD
Firstly, the author had two research questions, and a targeted literature review was done to
identify whether this field is covered by scientific knowledge, and whether the research
questions need modification. Though the literature review revealed that there is knowledge
connectible with the research questions, the coverage was not satisfactory.
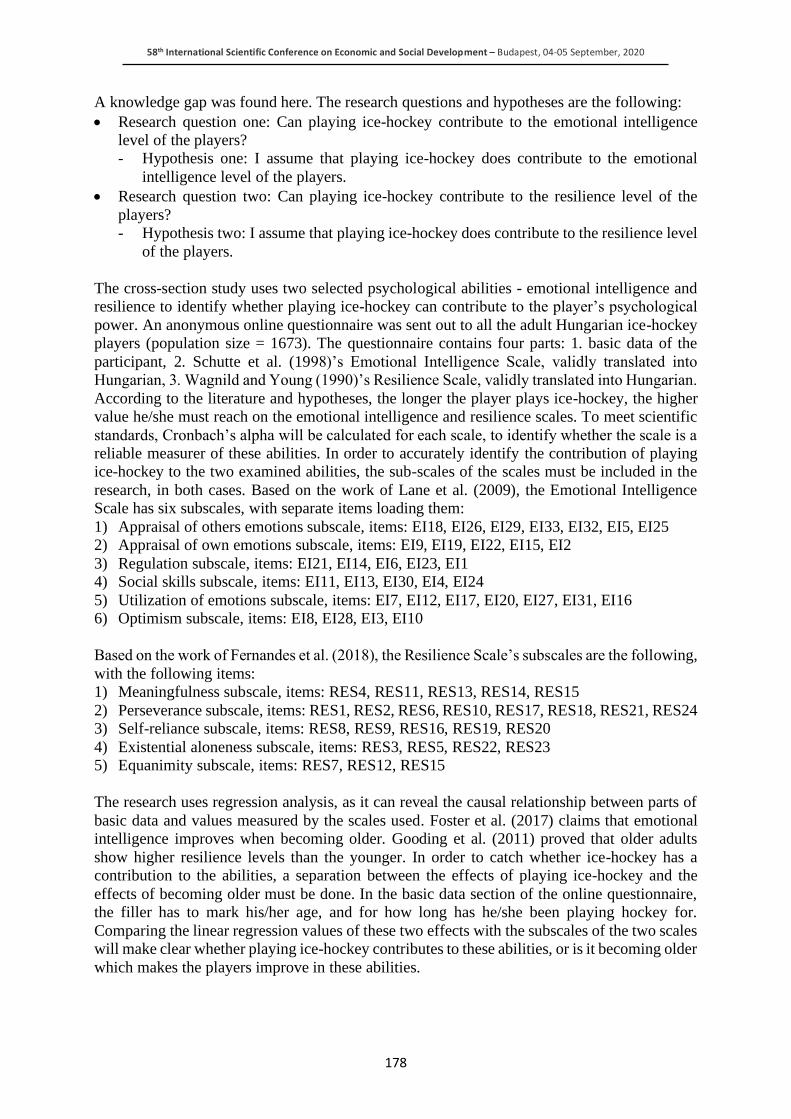
58th International Scientific Conference on Economic and Social Development – Budapest, 04-05 September, 2020
178
A knowledge gap was found here. The research questions and hypotheses are the following:
• Research question one: Can playing ice-hockey contribute to the emotional intelligence
level of the players?
- Hypothesis one: I assume that playing ice-hockey does contribute to the emotional
intelligence level of the players.
• Research question two: Can playing ice-hockey contribute to the resilience level of the
players?
- Hypothesis two: I assume that playing ice-hockey does contribute to the resilience level
of the players.
The cross-section study uses two selected psychological abilities - emotional intelligence and
resilience to identify whether playing ice-hockey can contribute to the player’s psychological
power. An anonymous online questionnaire was sent out to all the adult Hungarian ice-hockey
players (population size = 1673). The questionnaire contains four parts: 1. basic data of the
participant, 2. Schutte et al. (1998)’s Emotional Intelligence Scale, validly translated into
Hungarian, 3. Wagnild and Young (1990)’s Resilience Scale, validly translated into Hungarian.
According to the literature and hypotheses, the longer the player plays ice-hockey, the higher
value he/she must reach on the emotional intelligence and resilience scales. To meet scientific
standards, Cronbach’s alpha will be calculated for each scale, to identify whether the scale is a
reliable measurer of these abilities. In order to accurately identify the contribution of playing
ice-hockey to the two examined abilities, the sub-scales of the scales must be included in the
research, in both cases. Based on the work of Lane et al. (2009), the Emotional Intelligence
Scale has six subscales, with separate items loading them:
1) Appraisal of others emotions subscale, items: EI18, EI26, EI29, EI33, EI32, EI5, EI25
2) Appraisal of own emotions subscale, items: EI9, EI19, EI22, EI15, EI2
3) Regulation subscale, items: EI21, EI14, EI6, EI23, EI1
4) Social skills subscale, items: EI11, EI13, EI30, EI4, EI24
5) Utilization of emotions subscale, items: EI7, EI12, EI17, EI20, EI27, EI31, EI16
6) Optimism subscale, items: EI8, EI28, EI3, EI10
Based on the work of Fernandes et al. (2018), the Resilience Scale’s subscales are the following,
with the following items:
1) Meaningfulness subscale, items: RES4, RES11, RES13, RES14, RES15
2) Perseverance subscale, items: RES1, RES2, RES6, RES10, RES17, RES18, RES21, RES24
3) Self-reliance subscale, items: RES8, RES9, RES16, RES19, RES20
4) Existential aloneness subscale, items: RES3, RES5, RES22, RES23
5) Equanimity subscale, items: RES7, RES12, RES15
The research uses regression analysis, as it can reveal the causal relationship between parts of
basic data and values measured by the scales used. Foster et al. (2017) claims that emotional
intelligence improves when becoming older. Gooding et al. (2011) proved that older adults
show higher resilience levels than the younger. In order to catch whether ice-hockey has a
contribution to the abilities, a separation between the effects of playing ice-hockey and the
effects of becoming older must be done. In the basic data section of the online questionnaire,
the filler has to mark his/her age, and for how long has he/she been playing hockey for.
Comparing the linear regression values of these two effects with the subscales of the two scales
will make clear whether playing ice-hockey contributes to these abilities, or is it becoming older
which makes the players improve in these abilities.
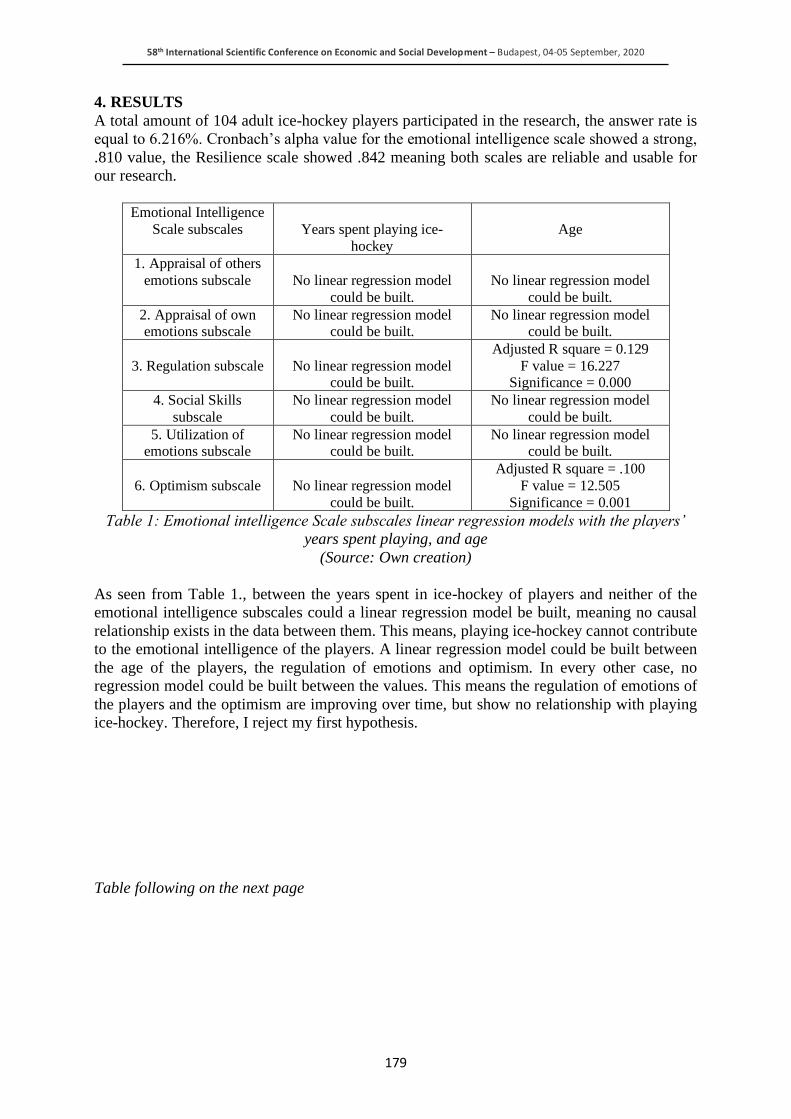
58th International Scientific Conference on Economic and Social Development – Budapest, 04-05 September, 2020
179
4. RESULTS
A total amount of 104 adult ice-hockey players participated in the research, the answer rate is
equal to 6.216%. Cronbach’s alpha value for the emotional intelligence scale showed a strong,
.810 value, the Resilience scale showed .842 meaning both scales are reliable and usable for
our research.
Emotional Intelligence
Scale subscales
Years spent playing ice-
hockey
Age
1. Appraisal of others
emotions subscale
No linear regression model
could be built.
No linear regression model
could be built.
2. Appraisal of own emotions subscale
No linear regression model could be built.
No linear regression model could be built.
3. Regulation subscale
No linear regression model could be built.
Adjusted R square = 0.129
F value = 16.227 Significance = 0.000
4. Social Skills
subscale
No linear regression model
could be built.
No linear regression model
could be built.
5. Utilization of emotions subscale
No linear regression model could be built.
No linear regression model could be built.
6. Optimism subscale
No linear regression model
could be built.
Adjusted R square = .100
F value = 12.505
Significance = 0.001
Table 1: Emotional intelligence Scale subscales linear regression models with the players’
years spent playing, and age
(Source: Own creation)
As seen from Table 1., between the years spent in ice-hockey of players and neither of the
emotional intelligence subscales could a linear regression model be built, meaning no causal
relationship exists in the data between them. This means, playing ice-hockey cannot contribute
to the emotional intelligence of the players. A linear regression model could be built between
the age of the players, the regulation of emotions and optimism. In every other case, no
regression model could be built between the values. This means the regulation of emotions of
the players and the optimism are improving over time, but show no relationship with playing
ice-hockey. Therefore, I reject my first hypothesis.
Table following on the next page
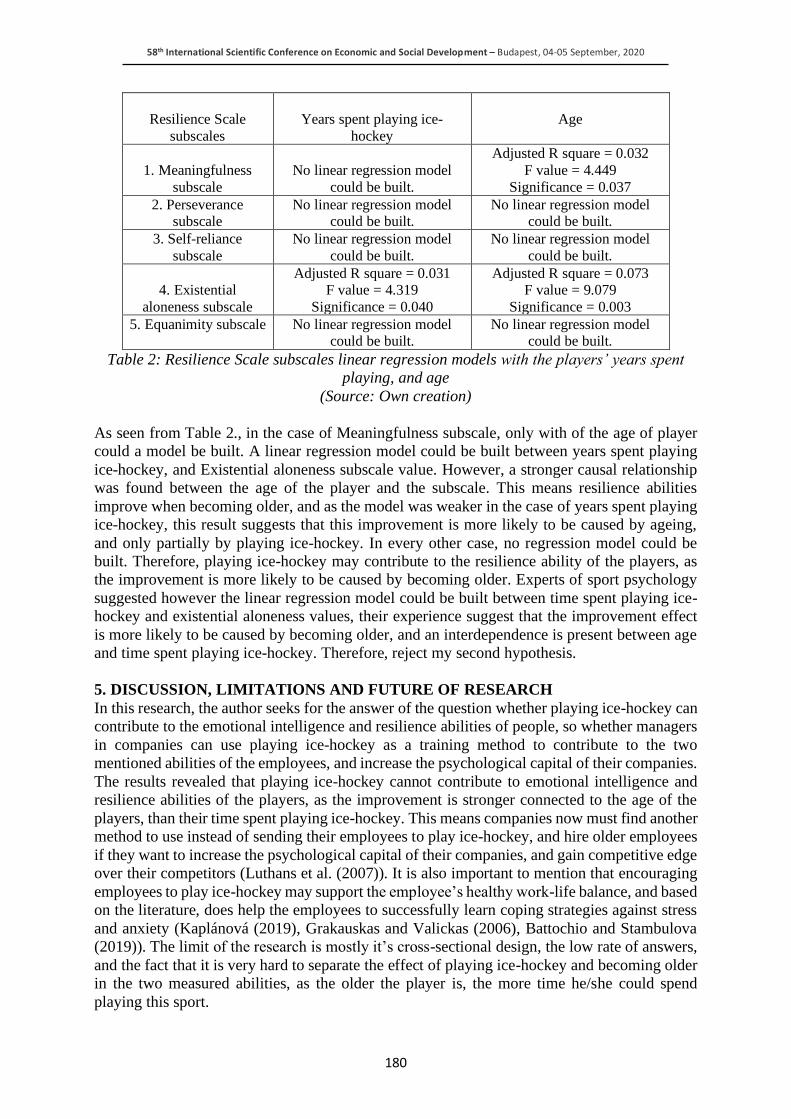
58th International Scientific Conference on Economic and Social Development – Budapest, 04-05 September, 2020
180
Resilience Scale
subscales
Years spent playing ice-
hockey
Age
1. Meaningfulness
subscale
No linear regression model
could be built.
Adjusted R square = 0.032
F value = 4.449
Significance = 0.037
2. Perseverance subscale
No linear regression model could be built.
No linear regression model could be built.
3. Self-reliance
subscale
No linear regression model
could be built.
No linear regression model
could be built.
4. Existential
aloneness subscale
Adjusted R square = 0.031 F value = 4.319
Significance = 0.040
Adjusted R square = 0.073 F value = 9.079
Significance = 0.003
5. Equanimity subscale No linear regression model could be built.
No linear regression model could be built.
Table 2: Resilience Scale subscales linear regression models with the players’ years spent
playing, and age
(Source: Own creation)
As seen from Table 2., in the case of Meaningfulness subscale, only with of the age of player
could a model be built. A linear regression model could be built between years spent playing
ice-hockey, and Existential aloneness subscale value. However, a stronger causal relationship
was found between the age of the player and the subscale. This means resilience abilities
improve when becoming older, and as the model was weaker in the case of years spent playing
ice-hockey, this result suggests that this improvement is more likely to be caused by ageing,
and only partially by playing ice-hockey. In every other case, no regression model could be
built. Therefore, playing ice-hockey may contribute to the resilience ability of the players, as
the improvement is more likely to be caused by becoming older. Experts of sport psychology
suggested however the linear regression model could be built between time spent playing ice-
hockey and existential aloneness values, their experience suggest that the improvement effect
is more likely to be caused by becoming older, and an interdependence is present between age
and time spent playing ice-hockey. Therefore, reject my second hypothesis.
5. DISCUSSION, LIMITATIONS AND FUTURE OF RESEARCH
In this research, the author seeks for the answer of the question whether playing ice-hockey can
contribute to the emotional intelligence and resilience abilities of people, so whether managers
in companies can use playing ice-hockey as a training method to contribute to the two
mentioned abilities of the employees, and increase the psychological capital of their companies.
The results revealed that playing ice-hockey cannot contribute to emotional intelligence and
resilience abilities of the players, as the improvement is stronger connected to the age of the
players, than their time spent playing ice-hockey. This means companies now must find another
method to use instead of sending their employees to play ice-hockey, and hire older employees
if they want to increase the psychological capital of their companies, and gain competitive edge
over their competitors (Luthans et al. (2007)). It is also important to mention that encouraging
employees to play ice-hockey may support the employee’s healthy work-life balance, and based
on the literature, does help the employees to successfully learn coping strategies against stress
and anxiety (Kaplánová (2019), Grakauskas and Valickas (2006), Battochio and Stambulova
(2019)). The limit of the research is mostly it’s cross-sectional design, the low rate of answers,
and the fact that it is very hard to separate the effect of playing ice-hockey and becoming older
in the two measured abilities, as the older the player is, the more time he/she could spend
playing this sport.
58th International Scientific Conference on Economic and Social Development – Budapest, 04-05 September, 2020
181
This interdependence limits the research. Further, longitudinal research with higher
representativity is required to measure if such an increasing effect exists in playing different
sports. Still, the research focused on the psychological capital increasement option, so whether
it is a good decision for companies to hire ice-hockey players, or purposely send them to play
this sport. Though the results showed that this increasement is more likely to be caused by
becoming older, the literature suggests that playing ice-hockey does contribute a lot to its
players life, maybe even in emotional intelligence, and resilience.
ACKNOWLEDGEMENT: The authors are thankful to all the participants of the research: the
players and the professionals.
LITERATURE:
1. Amsrud, K.E., Lyberg, A., Elisabeth, S. (2019). Development of resilience in nursing
students: A systematic qualitative review and thematic synthesis. United Kingdom: Nurse
Education in Practice.
2. Azavedo, A., Shane, M.J. (2019). A new training program in developing cultural
intelligence can also improve innovative work behaviour and resilience: A longitudinal
pilot study of graduate students and professional employees. Netherlands: The International
Journal of Management Education.
3. Battochio, R. C., Stambulova, N. (2019). Coping resources and strategies of Canadian ice-
hockey players: An empirical National Hockey League career model. United Kingdom:
International Journal of Sports Science and Coaching.
4. Bhullar, N. (2020). The Wiley-Blackwell Encyclopedia of Personality and Individual
Differences. (Vol.I.). United Kingdom: John Wiley and Sons.
5. Côté, J., Turnnidge, J., and Evans, M. B. (2014). The Dynamic Process of Development
through Sport. / Dinamični Proces Razvoja Prek Športa. Slovenia: Kinesiologia Slovenica.
6. Denkova, E., Zanesco, A.P., Rogers, S.L., Jha, A.P. (2020). Is resilience trainable? An
initial study comparing mindfulness and relaxation trainings in firefighters. Ireland:
Psychiatry Research.
7. Foster, K.N., Fethney, J., McKenzie, H., Fisher, M.J., Harkness, E., Kozlowski, D. (2017).
Emotional intelligence increases over time: A longitudinal study of Australian pre-
registration nursing students. United Kingdom: Nurse Education Today.
8. Friesen, A.P. (2013): “Catching” emotions : emotion regulation in sport dyads. (Doctoral
Dissertation). [A.P.F. Friesen].
9. Géczi, G., Bognár, J., Tóth, L., Sipos, K., and Balázs Fügedi. (2008). Anxiety and Coping
of Hungarian National Ice-hockey Players. United Kingdom: International Journal of
Sports Science and Coaching.
10. Géczi, G., Tóth, L., Sipos, K., Fügedi, B., Dancs, H., Bognár, J. (2009). Psychological
Profile of Hungarian National Young Ice-hockey Players. Croatia: Kinesiology.
11. Gooding, P.A., Hurst, A., Johnson, J., Tarrier, N. (2011). Psychological resilience in young
and older adults. United States: International Journal of Geriatric Psychiatry.
12. Grakauskas, Ž., Valickas, G. (2006). Streso įveikos klausimynas: Keturių faktorių modelio
taikymas [Coping with Stress Questionnaire: Application of the Four-Factor
Model]. Latvia: Psichologija.
13. Jonker, C. (2009). Emotional intelligence development in an accounting setting. South
Africa: SA Journal of Human Resource Management.
14. Kaplánová, A. (2019). Self-esteem, anxiety and coping strategies to manage stress in ice-
hockey. Czech Republic: Acta Gymnica.
58th International Scientific Conference on Economic and Social Development – Budapest, 04-05 September, 2020
182
15. Kurudirek, M.I. et al. (2016). The Effects of Teaching 8-12-year-old Children Ice-hockey
with Educational Games on Psychomotor and Cognitive Development. Turkey:
International Journal of Sport Studies.
16. Lester, S.V., Sacra, M.M., Durham, J. C., Nirola, D.K. (2020). Youth and Young Adult
Suicide in Bhutan: a Stress and Resilience Approach. United States: International Journal
for the Advancement of Counselling.
17. Luthans, F., Youseff, C.M., Avolio, B.J. (2007). PSYCHOLOGICAL CAPITAL Developing
the Human Competitive Edge. Oxford: Oxford University Press.
18. Mattingly, V., Kraiger, K. (2019). Can emotional intelligence be trained? A meta-analytical
investigation. United Kingdom: Human Resource Management Review.
19. McBride, E. A. (2010). Emotional intelligence and Cognitive Moral Development in
Undergraduate Business Students (Doctoral Dissertation). Capella University: [E.A.
McBride]
20. McEnrue, M.P., Groves, K.S., Shen, W. (2009). Emotional intelligence development:
Leveraging individual characteristics. United Kingdom: Journal of Management
Development.
21. Montgomery, D.L. (1988). Physiology of ice hockey. New Zealand: Sports Medicine.
22. Schutte N.S. et al. (1998). Development and validation of a measure of emotional
intelligence. United Kingdom: Personality and Individual Differences.
23. Soutwich, S.M., Bonnano, G.A., Masten, A.S., Panter-Brick, C., Yehuda, R. (2014).
Resilience definition, theory and challenges. Sweden: European Journal of
Psychotraumatology.
24. Taylor, R.A. (2019). Contemporary issues: Resilience training alone is an incomplete
intervention. United Kingdom: Nurse Education Today.
25. Trottier, C., Migneron, E., Robitaille, S. (2017). How coaches learn to teach life skills to
adolescent athletes. France: Staps.
26. Vescovi J. D., Murray T.M., VanHeest J.L. (2006). Positional performance profiling of elite
ice-hockey players. United States: International Journal of Sports Physiology and
Performance.
27. Wagnild, G., Young, H.M. (1990). Resilience Among Older Women. United Kingdom:
Journal of Nursing Scholarship.
58th International Scientific Conference on Economic and Social Development – Budapest, 04-05 September, 2020
183
APPENDIX
1. Schutte et al. (1998) - Emotional intelligence Scale, validly translated into Hungarian (5-item
Likert scale):
EI1: I know when to speak about my personal problems to others
EI2: When I am faced with obstacles, I remember times I faced similar obstacles and overcame
them
EI3: I expect that I will do well on most things I try
EI4: Other people find it easy to confide in me
EI5: I find it hard to understand the non-verbal messages of other people*
EI6: Some of the major events of my life have led me to re-evaluate what is important and not
important
EI7: When my mood changes, I see new possibilities
EI8: Emotions are one of the things that make my life worth living
EI9: I am aware of my emotions as I experience them
EI10: I expect good things to happen
EI11: I like to share my emotions with others
EI12: When I experience a positive emotion, I know how to make it last
EI13: I arrange events others enjoy
EI14: I seek out activities that make me happy
EI15: I am aware of the non-verbal messages I send to others
EI16: I present myself in a way that makes a good impression on others
EI17: When I am in a positive mood, solving problems is easy for me
EI18: By looking at their facial expressions, I recognize the emotions people are experiencing
EI19: I know why my emotions change
EI20: When I am in a positive mood, I am able to come up with new ideas
EI21: I have control over my emotions
EI22: I easily recognize my emotions as I experience them
EI23: I motivate myself by imagining a good outcome to tasks I take on
EI24: I compliment others when they have done something well
EI25: I am aware of the non-verbal messages other people send
EI26: When another person tells me about an important event in his or her life, I almost feel as
though I have experienced this event myself
EI27: When I feel a change in emotions, I tend to come up with new ideas
EI28: When I am faced with a challenge, I give up because I believe I will fail*
EI29: I know what other people are feeling just by looking at them
EI30: I help other people feel better when they are down
EI31: I use good moods to help myself keep trying in the face of obstacles
EI32: I can tell how people are feeling by listening to the tone of their voice
EI33: It is difficult for me to understand why people feel the way they do*
2. Wagnild and Young (1990)’s Resilience Scale, validly translated into Hungarian (7-item
Likert scale). Used with purchased license from The Resilience Center (PO Box 313, Worden,
MT 59088-0313).
RES 1: When I make plans, I follow through with them.
RES 2: I usually manage one way or another.
RES 3: I am able to depend on myself more than anyone else.
RES 4: Keeping interested in things is important to me.
RES 5: I can be on my own if I have to.
RES 6: I feel proud that I have accomplished things in life.

58th International Scientific Conference on Economic and Social Development – Budapest, 04-05 September, 2020
184
RES 7: I usually take things in stride.
RES 8: I am friends with myself.
RES 9: I feel that I can handle many things at a time.
RES 10: I am determined.
RES 11: I seldom wonder what the point of it all is.
RES 12: I take things one day at a time.
RES 13: I can get through difficult times because I’ve experienced difficulty before.
RES 14: I have self-discipline.
RES 15: I keep interested in things.
RES 16: I can usually find something to laugh about.
RES 17: My belief in myself gets me through hard times.
RES 18: In an emergency, I’m someone people can generally rely on.
RES 19: I can usually look at a situation in a number of ways.
RES 20: Sometimes I make myself do things whether I want to or not.
RES 21: My life has meaning.
RES 22: I do not dwell on things that I can’t do anything about.
RES 23: When I’m in a difficult situation, I can usually find my way out of it.
RES 24: I have enough energy to do what I have to do.
RES 25: It’s okay if there are people who don’t like me.
58th International Scientific Conference on Economic and Social Development – Budapest, 04-05 September, 2020
185
THE CHALLENGES OF THE SHARING ECONOMY USERS AND THE
IMPACTS OF PANDEMIC (COVID19)
Ali Ilhan
Szechenyi Istvan University, Hungary
ABSTRACT
The sharing economy is a growing platform, as well as a new business model derived as part
of the modern age, digital economy. During this renovation, the leading players in the sharing
economy start facing several issues, especially comparing the traditional economy. During this
research, the sharing economy and gig users' challenges are identified in detail. Furthermore,
the study indicates the effect of the current pandemic crisis (Covid-19). The changes before and
after the pandemic impact are also discussed. Therefore, the main focus area refers to the gig
economy users and pandemic crisis on sharing economy.
Keywords: covid19, entrepreneur, gig economy, gig economy users, independent contractor,
pandemic, sharing economy
1. INTRODUCTION
The fundamental concept of trade is changing dramatically. It also derives from the new
aggregate demand at the global scope. The sharing economy is a unique concept that gets
essential day by day. The concerns about the new system attract new entrepreneurs rapidly. It
also opens new doors to people to earn money. The sharing economy is one of the trend areas
in the early 2000s. It is highly possible to hear the sharing economy with further names. Such
as collaborative consumption or peer-to-peer economy. Practically, sharing economy targets
the means of the shares, swaps, and the things that can be idle or expensive to obtain. Critically,
it derives from the person-to-person transaction. The gig economy refers to the individuals or
initial actors in part of the sharing economy. The name of the "gig" expresses as any work
within a specified time frame. In this discussion, gig economy users indicate an independent
individual working for a specific period of a given time in the free market, such as Uber drivers
and Airbnb renters. On the other hand, the main objective of the study is to analyze the
challenges of gig economy users that are expected to face after the pandemic crisis (Covid-19).
2. COMPARISON OF TRADITIONAL ECONOMY AND SHARING ECONOMY
There is a distinct shift from the traditional economy to the sharing economy since the last
decades. Chohan (2020) states that the sharing economy has born into the digital economy
during the 20th century. There is a distinct time difference between traditional theories and
today's digital economy. According to the author, the digital economy is a digital age with its
major players and discussions, such as "globalization, social media monopolies,
cryptocurrencies, digital governance, and the cashless society." Beyond these significant
implications, the author highlights the existence gap from traditional theories besides on digital
age' bringing. Apart from the traditional economy, the monopolistic market is also existing in
the digital economy. Few big firms monopolize the markets and even sub-markets. For
example, google leads to search engines as well as Facebook leads for social media.
Consequently, the author highlights the need for incumbents' interference in the market for
reshaping the monopolization power positively. Shankar (2016) underlines how sharing
economy distributes the channels comparing to the traditional economy. The main difference
is that the traditional economy shifts the goods or services through companies or a middleman.
However, sharing economy reshapes this path by eliminating firms as well as creating a direct
connection with customers.
58th International Scientific Conference on Economic and Social Development – Budapest, 04-05 September, 2020
186
Therefore the distinct line between suppliers to customers is blurred as because customer-to-
customer relation becomes without any middleman. Another difference compared to the
traditional economy appears on environmental and financial purposes. As proof, today, most of
the users are eager to use mobile apps for ordering a taxi rather than calling the taxi company
for the same request. The sharing economy also claims to be faster than the traditional taxi
sector because several drivers might become to be part of this business model quicky.
Simplycity and personalization create the premiere value of this new business model comparing
to traditional business models. Mleczko (2017) compares the sharing economy and traditional
economy in terms of the regulation patterns. The traditional economy already has substantial
legislation and rules for the service sectors, such as taxi and hotel business. However, the same
rules are not applied to the sharing economy based on its new business model, Such as uber taxi
besides taxi service as well as Airbnb besides the accommodation sector. The issue arises with
the question of while the applied rules of the traditional economy could create a barrier for
sharing economy as well as it helps to boost the sharing economy. Competition exists between
the traditional economy and the sharing economy. Moreover, regulations play a crucial role in
understanding the regularity position of two different economies accordingly. The author
discusses in case the same rules apply to sharing economy. It could create a barrier for the
competition within sectors, such as the taxi industry Mleczko (2017). In conclusion, the
difference between the two economies shows how the traditional economy is negatively
affected despite the new business model, sharing economy. Moreover, this negative impact
raises the need for regularity for the sharing economy to leverage the local businesses within
the traditional economy. However, the current research highlights that the need for adoption
and learning progress is a more useful approach for such new upcoming trends and business
models (Shankar, 2016).
3. THE CHALLENGES OF GIG USERS
This research seeks ongoing challenges that gig economy users face daily. In this section, the
research endeavors to identify a couple of primary problems, such as social rights,
discrimination, and regularity. Ravelle (2017) explores the similarities and differences in
entrepreneurship within the concept of the "sharing economy." According to the author, the
definition of gig user's employment status changes from country to country. Therefore, the
author highlights that this variety of interpretations affects individuals' social protection, such
as pensions. Another study also elaborates on the distinct identity of individuals in sharing
economy. According to the research, individuals need to gain legitimate social rights; likewise,
any workers in the traditional economy within Europe. The article states that the importance of
particular social rights, such as pensions, maternity cover, and health insurance, on workers
should be observed to create equity between the "sharing economy" and "traditional economy."
(Forde et al., 2019). On the other hand, Ravelle (2017) states the disparity exists between single
workers and corporate workers with an example of the "Airbnb" (hosting company), such as
the aggregate position of Airbnb in the New York market. Moreover, corporate users of Airbnb
are increasing compared to individuals in New York. However, the author highlights that
corporate users create risks on single users because of stagnating the individual's revenue in
sharing economy. Moreover, Edelman, Luca, and Svirsky (2017) exposes potential
discrimination of ethnicity for gig economy users. The article primarily explores whether being
African American ethnicity creates bias while booking a room through the Airbnb platform.
The result shows that African American names have 8 percent less chance to be accepted of
booking a room comparing to the White-sounding names. Secondly, there is a bias that African
American users usually have fake accounts. Therefore, some of the requests for the Airbnb
platform receive "conditional yes" by the hosts. Due to the author's research, it also brings an
inverse relation between hosts that they are white or African.
58th International Scientific Conference on Economic and Social Development – Budapest, 04-05 September, 2020
187
Because receiving "yes" is likely possible for white ethnicity rather than Africans. The authors
finalize their study by questioning whether to identify or ethnicity matters during Airbnb
booking requests. Schor and Attwood-Charles (2017) also explore the possibility of
discrimination based on ethnicity. However, the authors highlight the person to person
discrimination in different fields. Airbnb guest rates show significant differences due to
ethnicity. The scores for African American users are lower than white American users. There
are also biases due to the same reason about "acceptance" and "rejection" by Airbnb hosts.
Authors also investigate ride-sharing platforms such as Uberx and Lyft. The result shows that
ethnicity appears especially on a waiting period of drivers that coming late comparing to
ethnicities—the other discrimination claims on gender status. Due to the research, women
passengers in ride-sharing platforms are taken longer distances comparing to the men.
Therefore, women passengers are supposed to charge more compared to the men passengers
for the same intervals. Also, the author highlights the mismatch on location by the Task-Rabit's
user samples. TaskRabbit is a platform that people provide daily task services to customers,
such as cleaning and handyman work. The result shows that particular neighborhoods are
charged for higher prices. It shows that there are not regular prices for the same services
depending on the region. Moreover, it claims that safety issue is an essential matter on this price
differences. Airi Lampinen, Huotari, & Cheshire (2015) examines the individuals rather than
the platforms. The observation of the users and interviews are exposed during the research. The
article focuses on the platform, which leads single parents to meet virtually. In time, the
platform starts converting itself into a network by meet-up appointments. The major challenge
of the users is highlighted as "trust." Individuals are not comfortable when they need to identify
themselves. The main argument of the article indicates that the users seek for privacy and
information trust while sharing any information about themselves. The situation appears
especially in such platforms that are not exchanging tangible services rather exchanging mental
services comparing to ride-sharing or accommodation-renting. Hossain (2020) examines the
challenges of the broader approach. Instead of individuals, the author criticizes the sectors that
will face specific difficulties. The car manufacturers might face a decline in demand based on
the increase in car-sharing companies. Furthermore, investment opportunities through hotels
might monitor the reluctant growth thanks to lodging platforms, such as Airbnb. In terms of the
users, research exposes anxiety and uncertainty. The hosts are supposed to accept the guests
virtually through the platform after a request of the host. This fact creates such uncertainty.
Moreover, the potential of reservation cancelation on the last day generates anxiety for guests.
Laa & Günter (2020) specifically focus on the bike-sharing business centralized in Vienna.
Authors generate comparison with a few other countries and outcomes in terms of its
challenges. The study includes interviews by experts and an extensive literature review. Mainly,
research focuses on regularity approaches, legal framework, permits, and contracts. The study
introduces four leading startups and newly launched bike-sharing business in Vienna. Authors
review these businesses and conclude that vandalism is one of the main reasons that users do
not be careful in terms of usage of bikes and parking restrictions. Moreover, Vienna regulates
the market with new rules, such as forcing the bikes with its vehicle identification number.
Additional new regulations, such as a high amount of violation fees, trigger the company
owners that running a business is not feasible anymore. On the other hand, the study includes
the cultural differences which play a crucial role in these businesses. The percentage of people
using bikes differs from cities to cities. Therefore, it is not vital to expect the same reaction by
neither users and nor regulators despite bike-sharing businesses. The author also identifies that
bike qualities are essential facts in terms of business efficiency (Laa & Günter, 2020). On the
other hand, users require to register through application to be part of using bikes. In this matter,
the information security subject raises by regulators during registration. Finally, these
challenges, especially new regulations, limit the bike-sharing businesses in Vienna, although
58th International Scientific Conference on Economic and Social Development – Budapest, 04-05 September, 2020
188
these challenges might differ country by country (Laa & Günter 2020). Fleming, P., Rhodes,
C., & Yu, K.-H. (2019) criticize the economic perspective of the sharing economy (digital
platforms). The authors claim that these digital platforms are not rapidly growing—the reason
beyond occurred by the neoliberalism approach. The main argument derives from the main
characteristics of digital platforms, such as individualism, ultra-marketization. The authors
match especially individualistic approach as it is a part of the neoliberal economic approach.
The study claims that the size of labor-based digital platforms is small comparing to particular
OECD countries. Moreover, the actual number of digital platforms are rarely seen despites that
the media exaggerates the size of digital platforms. Even though the gig economy provides the
flexibility of work, it also leads to volatility on financial imbalance for workers as well as risks.
Finally, the research claims that the gig economy is a more capitalist based economistic tool
comparing to employee-friendly structures, such as part-time or freelancer possibilities.
Moreover, it is highly advised in the study that a legacy is an essential tool for classifying the
gig users. Additionally, the new regulation should cover the fundamental subjects, such as
bargaining power during the online contract or labor-based medical benefits (Fleming et al.,
2019).
3.1. Employment Status Challenge Of Gig Users
Mujtaba (2020) states that there is an essential need for a clarification of the gig worker's as
because they are counted as an entrepreneur or an independent contractor. Due to the research,
online platforms named the workers as "independent contractors" instead of "employees" that
supported by law. The author analyzed the relationship between entrepreneurship and gig
workers' status for online platforms. According to the article, the reason beyond being in a
dilemma in terms of "employee status" is the "micro-entrepreneurship" status. Due to the
sharing platform owners, they carry the position of being entrepreneurship. Therefore, the users
count as micro-entrepreneurship status. Cornelissen and Cholakova (2020) examine the gig
users' status into two different categories. Firstly, the user's status is taken into consideration as
personal benefits, such as employer securities and their protections. Secondly, the author also
discusses the political and moral situation of the user's status. In both categories, the authors
recognize the need for gig users' identity in terms of their legal status as being either
"independent workers" or an "entrepreneur." Due to the author, there might be a decent
classification of gig users' status if ideas, policies, and aims. Converge by the political decisions.
The recent study by Hagiu and Wright (2018) shows that calling gig economy users as either
an independent contractor or an employee is adopted within online platforms. In the case of the
uber company, the reason behind this is being able to decide the working duration and choosing
the customers through the Uber mobile application. The author also accepts this situation as a
positive element of being independent contractors. On the other hand, the author also lists the
adverse facts that lead to calling the gig users as an employer rather than an independent
contractor. For instance, uber drivers have a lack of bargain power during their registration into
the uber system. Therefore the drivers only have the right to accept the online contract. The
uber company also controls the price mechanism per minute of a drive. On the other hand,
Gleim, Johnson, and Lawson (2019) explore the type of workers in two categories, which are
"sharing economy" and "direct selling." The research aims to expose the main similarities and
differences between the two types. The authors indicate that the fundamental similarity of the
two categories is as an independent contractor. The reason beyond this occurs by able to obtain
supplemental income based on their preferences. Moreover, the findings show that individuals
in both categories determine the amount of work, likewise the duration of action. Indeed, the
research states that "direct sellers" have a better relation comparing to individuals in sharing
economy in terms of "self-congruence," where "direct sellers" create more extended
connections and loyalty with their customers.
58th International Scientific Conference on Economic and Social Development – Budapest, 04-05 September, 2020
189
On the other hand, individuals in the "sharing economy" obtain a higher level of commerciality
where the scope of the potential market is broader due to online platforms. Luke, N. (2019)
states the "importance of the gig users' rights." The author begins his study and analysis in
Australia. His findings indicate that gig users underestimate the need and importance of their
employee rights and employee benefits, such as superannuation, sick leave, and holiday pay.
Moreover, his findings reveal that gig users are also being ignored by the minimum wage
guarantee and any financial support for loans. These circumstances raise the question of
whether gig users are an employee or contractor. The example of Foodora (online food ordering
company) states that Foodora gig users are a contractor and not an employee. Because they
have flexible work hours based on their preferences, however, it reveals that these benefits and
employee rights are not valid for Foodora gig users. In the end, the outcome shows that the
protection of contractors does not match with the Fair Work Act 2009. Foodora accused to paid
compensation for their riders. The author highlights the need for consultancy or advisory with
lawyers to seek his/her benefits, especially during the position of gig users. Consequently, the
research states that the general classification of "gig workers" varies from country to country
due to different reasons, such as the prevailing of "sharing economy" or legislative approaches.
However, the research expects the vital development of the legal framework through the "gig
workers" at both the European and national levels (Luke, N. 2019).
4. PANDEMIC IMPACT ON SHARING ECONOMY
The current pandemic Covid19 impacts the sharing economy gradually. The platforms perform
to avoid potential risks. This research includes a couple of chances, such as financial impact,
avoiding crowds, and safety. Conger & Griffith (2020) highlights the financial impact of the
pandemic crisis in the sharing economy. During the crisis, Airbnb declared to lay off 25% of
its employee, whereas Uber company indicated the loss of about 80% of revenue. Beyond these
data, the author shows that expectations of a decline in the sharing economy are assumed by
about 30% in two years unless valid solutions found, such as the vaccine against COVID-19.
Currently, the only option for sharing economy platforms shows intensive care, such as Airbnb
declares the period cleaning of 24 hours to 72 hours between per customers. Adversely, the
pandemic crisis also brings benefits for the different fields of the sharing economy, such as
Uber food delivery as people enforced to stay at home and ordering food online. Vynck,
Carville & Chapman, (2020) exposes the severe damage to gig users through their investments.
Today, several people devoted their financial savings for sharing economy, such as loans for
cars or houses for gainful activity. The study clarifies that not only sharing economy companies
are severely affected, but also the pandemic issue profoundly impacts gig users. Keller (2020)
identifies the role of sharing business within the pandemic crisis. He states that the term
"sharing" is the essence of the facts that might directly increase the infection risk. Despite that,
repeatedly sanitizing entire vehicles is unfeasible. Therefore, the author highlights the
importance of pathogen transmission that leads to the spread of infection. On the other hand,
the uncertainty of customer trends is shifting amid pandemic. Lever (2020) exhibits social
impacts that appear after the epidemic, such as urbanization. People started to stay away from
the population density and as well as starting migrates to rural areas. This shift should be taken
into consideration for sharing business strategies as the customer target was mostly located in
capital cities. By the pandemic impact, sharing platforms are enforced to build "trust" and
"safety" aside from "sharing" and "collaborating" that is used as the primary dimension of
sharing economies. On the other hand, the pandemic effect is a potential for the ride-hailing
business, such as car-sharing and bike-sharing, to avoid density. Moreover, the pandemic effect
also plays an essential role in shifting the sharing economy into new fields, such as education
and medicine, which are dominantly needed in the case of the pandemic periods. National Real
Estate Investor (2020) examines the effect of the pandemic crisis in two sharing businesses,
58th International Scientific Conference on Economic and Social Development – Budapest, 04-05 September, 2020
190
which are co-working and co-living. According to the study, the Co-working business has
impacted negatively as the pandemic crisis pushes people to work from home. However, co-
living, in which the places where people are more enthusiastic about sharing familiar places in
the same apartment, is less affected due to contract procedures. Because people usually signed
long-term contracts. Overall, the topic is still controversial, and impacts are uncertain.
Therefore, the study advises that this pandemic crisis can be supported with less damage by
various attempts, such as applications on socializing virtually with cooking and sports activities.
On the other hand, Furedi (2002) oversees the fear effect on people and their reactions.
According to him, the hazard is the perception, probability of leading any activity that people
obtained psychologically. However, the danger is not a physical fact like food poison. People's
reactions are changing, and these reactions can quickly grow at extreme levels. Therefore
people's opinions are much faster than actual needs that are advised by authorities. Especially
today, issues firstly bring fear instead of focus on a solution. If we compare the situation with
COVID-19 and people's reaction, we might observe final results which might be even
dangerous against the protection purpose, such as, cleaning the vegetables with chemical
materials in the belief of disinfection. The author also indicates the potential adverse effect in
the future. People might observe the situation negatively. However, this approach can be
changed adversely by the next generation. Today's attitudes are not stable and unchangeable.
The same ideology can be applied to the relation between the current pandemic crisis and the
sharing economy. The entire adverse outcomes might turn out by opening a new era with better
opportunities. It can also reveal that people's reactions and perceptions might change contrary
to today's beliefs.
5. CONCLUSION
Based on the studies included in this research, there are a couple of suggestions and hypotheses
on the convergence issue of gig users. However, the practice of proposed solutions is rarely
found. The reason may be derived by being the challenge itself that being fresh and newly
started discussions. In general, gig users are expected to face a couple of central issues, such as
a tax situation, social rights, competition, and legislation. Moreover, the question continually
raises about whether the gig users are entrepreneurs or independent contractors. Furthermore,
the current pandemic crisis has been shown as an essential threat or the digital economy,
especially within the sharing economy. Most of the companies face critical financial damages
as well as growing uncertainty. Meanwhile, users also face extreme difficulty, considering some
of the users that are invested in this business model, such as loan payments for vehicles or
residences. Consequently, the pandemic crisis directly threatens the future of the sharing
economy, along with its extreme challenges. The inclusion of the users and first parties for
further discussions would play a crucial role in terms of observing ongoing challenges'
outcomes of the digital economy.
LITERATURE:
1. Ahsan, M. Entrepreneurship and Ethics in the Sharing Economy: A Critical Perspective. J
Bus Ethics 161, 19–33 (2020). https://doi.org/10.1007/s10551-018-3975-2
2. Conger, K., & Griffith, E. (2020). The results are in for the sharing economy. They are ugly.
Retrieved 28 May 2020, from https://www.business-standard.com/article/international/the-
results-are-in-for-the-sharing-economy-they-are-ugly-120051000008_1.html
3. Cornelissen, J., & Cholakova, M. (2019). Profits Uber everything? The gig economy and
the morality of category work. Strategic Organization.
https://doi.org/10.1177/1476127019894506
58th International Scientific Conference on Economic and Social Development – Budapest, 04-05 September, 2020
191
4. "Co-Living Was Built Around Sharing Living Spaces with Strangers. Will It Survive
Through a Pandemic?" National Real Estate Investor, 28 Apr. 2020, p. NA. Gale General
OneFile,
https://link.gale.com/apps/doc/A622199320/GPS?u=ussd&sid=GPS&xid=18dcb6be.
Accessed 23 Aug. 2020.
5. Edelman, Benjamin, Michael Luca, and Dan Svirsky. 2017. "Racial Discrimination in the
Sharing Economy: Evidence from a Field Experiment." American Economic Journal:
Applied Economics, 9 (2): 1-22.
6. Ford, C., Stuart, M., Joyce, S., Oliver, L., Valizade, D., Alberti, G., . . . Carson, C. (2017,
November). The Social Protection of Workers in the Platform Economy. European
Parliament, Policy Department A: Economic and Scientific Policy. Retrieved from
Europarl.europa.eu.:
http://www.europarl.europa.eu/RegData/etudes/STUD/2017/614184/IPOL_STU(2017)61
4184_EN.pdf
7. Furedi, F. (2002). Culture of Fear. In F. Furedi, Risk Taking and The Morality of Low
Expectation (pp. 15-40). Continuum.
8. Ganapati, S., & Reddick, C. G. (2018). Prospects and challenges of sharing economy for
the public sector. Government Information Quarterly, 35(1), 77-87.
9. Gleim, M. R., Johnson, C. M., & Lawson, S. J. (2019). Sharers and sellers: A multi-group
examination of gig economy workers' perceptions. Journal of Business Research, 98, 142-
152.
10. Hagiu, A., & Wright, J. (2019). The status of workers and platforms in the sharing economy.
Journal of Economics & Management Strategy, 28(1), 97-108.
11. Keller, M. (2020). The Sharing Economy After The Pandemic. Retrieved 22 June 2020,
from https://www.forbes.com/sites/maryannkeller/2020/03/26/the-sharing-economy-after-
the-pandemic/#458f4bef7ccf
12. Laa, B., & Emberger, G. (2020). Bike sharing: Regulatory options for conflicting interests–
Case study Vienna. Transport Policy.
13. Lever, R. (2020). Rocky road ahead for 'sharing economy' platforms amid pandemic.
Retrieved 15 July 2020, from https://www.thejakartapost.com/news/2020/05/13/rocky-
road-ahead-for-sharing-economy-platforms-amid-pandemic.html
14. Liu, W., He, C., Jiang, Y., Ji, R., & Zhai, X. (2020). Effect of Gig Workers' Psychological
Contract Fulfillment on Their Task Performance in a Sharing Economy—A Perspective
from the Mediation of Organizational Identification and the Moderation of Length of
Service. International Journal of Environmental Research and Public Health, 17(7), 2208.
15. Luke, N. (2019). Contractor or employee – the grey area of the gig economy. Retrieved 16
June 2020, from https://www.mondaq.com/australia/contract-of-employment/844268/
contractor-or-employee-the-grey-area-of-the-gig-economy
16. Mleczko, M. (2017). Sharing and traditional economy: a matter of substitutability…
between cats and dogs?. Retrieved 19 July 2020, from
http://competitionlawblog.kluwercompetitionlaw.com/2017/03/24/sharing-traditional-
economy-matter-substitutability-cats-dogs/?doing_wp_cron=1593035422.781605958
9385986328125
17. PwC Legal A Multidisciplinary law firm. (2019, PwC Legal). PwC Legal. Retrieved June
2020, from Gig economy Employment status:
https://www.pwclegal.be/en/documents/may-2019-gig-economy-report.pdf
18. Ravenelle, A. J. (2017). Sharing economy workers: selling, not sharing. Cambridge Journal
of Regions, Economy and Society, 10(2), 281-295.
19. Schor, J. B., & Attwood‐Charles, W. (2017). The "sharing" economy: labor, inequality, and
social connection on for‐profit platforms. Sociology Compass, 11(8), e12493.
58th International Scientific Conference on Economic and Social Development – Budapest, 04-05 September, 2020
192
20. Shankar, S. (2016). Sharing economy shaking up traditional business models. Retrieved 17
July 2020, from https://medium.com/global-intersection/sharing-economy-shaking-up-
traditional-business-models-dce017c6b90
21. Vynck, G., Carville, O., & Chapman, L. (2020). Uber's CEO, a seasoned dealmaker, pursues
his biggest one yet. Retrieved 22 June 2020, from
https://economictimes.indiatimes.com/small-biz/startups/features/ubers-ceo-a-seasoned-
dealmaker-pursues-his-biggest-one-yet/articleshow/75750181.cms
22. Margaret, R. (2020). What is a gig economy?. Retrieved 8 August 2020, from
https://whatis.techtarget.com/definition/gig-economy#:~:text=A%20gig%20economy%20
is%20a,is%20typically%20used%20by%20musicians.
23. Chohan, Usman W., Some Precepts of the Digital Economy (January 1, 2020). Critical
Blockchain Research Initiative (CBRI) Working Papers, 2020, Available at SSRN:
https://ssrn.com/abstract=3512353 or http://dx.doi.org/10.2139/ssrn.3512353
24. TRT World. (2020, May). Money Talks. Retrieved from Coronavirus pandemic devastates
sharing economy | Money Talks: https://www.youtube.com/watch?v=96gEMbmXaa8
58th International Scientific Conference on Economic and Social Development – Budapest, 04-05 September, 2020
193
CHALLENGES AND BENEFITS OF VIRTUAL TEAMS: A
LEADERSHIP PERSPECTIVE
Krisztina Kupa
Széchenyi University, Hungary
SZEEDSM Doctoral Program in Business Administration
ABSTRACT
Organisations employ members with different disciplinary and cultural backgrounds who, at
the same time, represent diversity in age, gender, ethnicity and a wide range of other factors as
well. These teams usually operate fully or partially virtually, using communication and IT tools
to collaborate, share ideas and altogether perform their daily activities while being
geographically dispersed all around the globe – complexity bringing increased virtuality to the
team set-up. Virtual teams have several benefits, such as availability, diversity, better access to
resources and flexibility, however the virtual working environment imposes several challenges
on the team members. Thus, a virtual team set-up requires various sets of skills, competences
and tools from both the leaders’ and the team members’ perspectives. The paper explains the
concept of virtual teams, the benefits and challenges that arise in this specific form of team set-
ups. The paper also explores the leadership aspects that affect the operation of these teams,
and suggests how leadership should focus on team and individual levels and what the
implications of technology-mediated leadership are.
Keywords: Virtual Teams, technology-mediated leadership, complexity in team set-up
1. INTRODUCTION
The digital transformation changed not only our everyday lives, but the nature of work and how
organisations operate. The information and communication technologies transform the ways of
working in many ways, starting from new organisational structures, utilisation of the global
talent pool or fundamentally reshaping how team members work together on the same thing
they did completely differently before. The first instance was enabling individuals to work
together even if they are geographically dispersed, however the new information and
communication technologies, such as enterprise social media (e.g. Yammer, Slack) or
collaborative editing platforms (e.g. Microsoft Teams, Google Drive) joined the basic
messaging and video conferencing tools to enable teams to come together, scale up in larger
networks of teams and even creating self-managing teams (Larson and DeChurch, 2020).
Virtual teams emerged as part of this phenomenon, providing benefits to both the organisations
and the employees as well (Maruping and Agrawal, 2004). Virtual teams have several benefits
that attract employers in applying these team set ups: working virtually is flexible, makes 24/7
working possible, reduces the overhead and rental costs at the company and at the same time
remote working could also increase the job satisfaction of the employees. Being globally open
due to limitless communication opportunities between different parts of the world, virtual teams
are diverse, organisations can access subject matter experts in all areas, even if the knowledge
they require is not present in their home location. Besides the benefits, there are several
challenges in teams that mostly rely on virtual collaboration. Benefits can easily turn to
challenges, if the team is not managed properly: if diversity is not managed well, if there is no
trust within the team, conflicts and issues may arise. Bell and Kozlowski (2002) suggests that
all benefits that are listed in the academic literature assume that virtual teams are well managed,
thus highlighting the pivotal role of leadership in the success of virtual teamwork. Leading
virtual teams is more challenging than conventional, face to face teams, since the lack of social
interactions and interpersonal communications, it is harder to build trust, keep the members
58th International Scientific Conference on Economic and Social Development – Budapest, 04-05 September, 2020
194
motivated and develop them both individually and as a team. The paper focuses on the most
important attributes of virtual teams and how leaders are affected by this new way of
collaboration. The paper reviews the literature available and draws conclusions based on the
academic research and studies published in this topic. The structure of the paper is as follows.
Section 2 with its subsections highlight the importance of virtuality and the benefits and
challenges these teams face during their operation. Section 3 explains how leaders are affected
by the virtual nature of their teams – what focal points they have to focus on at a team level and
at the level of the individual and what technology brings to their everyday lives. Section 4
concludes the claims and the research results.
2. VIRTUAL TEAMS
2.1. Definition
According to Cohen and Bailey (1997) a team is a set of individuals sharing the responsibility
of the outcomes of their interdependent tasks, who are seen – both by themselves and others –
as a complete social entity in one or more bigger social system, such as a department or a
corporation. Ricketts and Ricketts (2010) defines team as a group of people, which was set up
to work together on a common goal, while contributing via performing different tasks using
their individual skills and providing support to each other and meshing their functions. The
virtual team concept started to receive academic recognition in the early 1990’s, with primary
focus on describing virtual teams and highlighting their benefits as seen at Byrne at al. (1993)
and Dess et al. (1995). However, as noted by Bell and Kozlowski (2002), the initial literature
did not focus on the challenges and leadership implications of these teams. Virtual teams have
the unique ability to work together while located across offices, countries or fully globally using
communication and IT tools to cooperate and accomplish a tax or project without the need for
meeting face to face (Berry, 2011; Bell and Kozlowski, 2002). As noted by Lipnack and Stamps
(2000), virtual teams are usually small and task-focused groups of individuals, who mostly
work in technology-mediated ways toward a common goal. This aspect of technology-
mediation can also be found at Hovde (2014), who notes that a virtual team – to some extent –
always uses technology, especially communication technology to interact within the team. The
goals, tasks or the mission of the team does not necessarily differ in a virtual team compared to
a conventional, face to face team, the basic difference is that – as Bell and Kozlowski (2002,
pp. 25) stated – “members of virtual teams are not physically proximal”. At the same time this
does not mean that the members of the virtual teams prefer this virtual cooperation, that may
not be their first choice, however due to this geographically disperse nature of their location,
they have to expect and accept this way of communication.
2.2. Virtual nature
Another important aspect of virtual teams is that their virtualness, i.e. the degree to which the
team is virtual, is a complex and multidimensional construct. Even when two teams use exactly
the same technologies in doing their work, one team meets regularly face to face, while the
other mostly uses the email, chat software and other telecommunication technologies. Thus, the
latter is more virtual than the other (Berry, 2011). To illustrate that nowadays almost all the
teams can be considered virtual to some extent, Mittleman and Briggs (1998) categorised the
virtual interactions as follows on the time and place attributes of different scenarios:
Table following on the next page
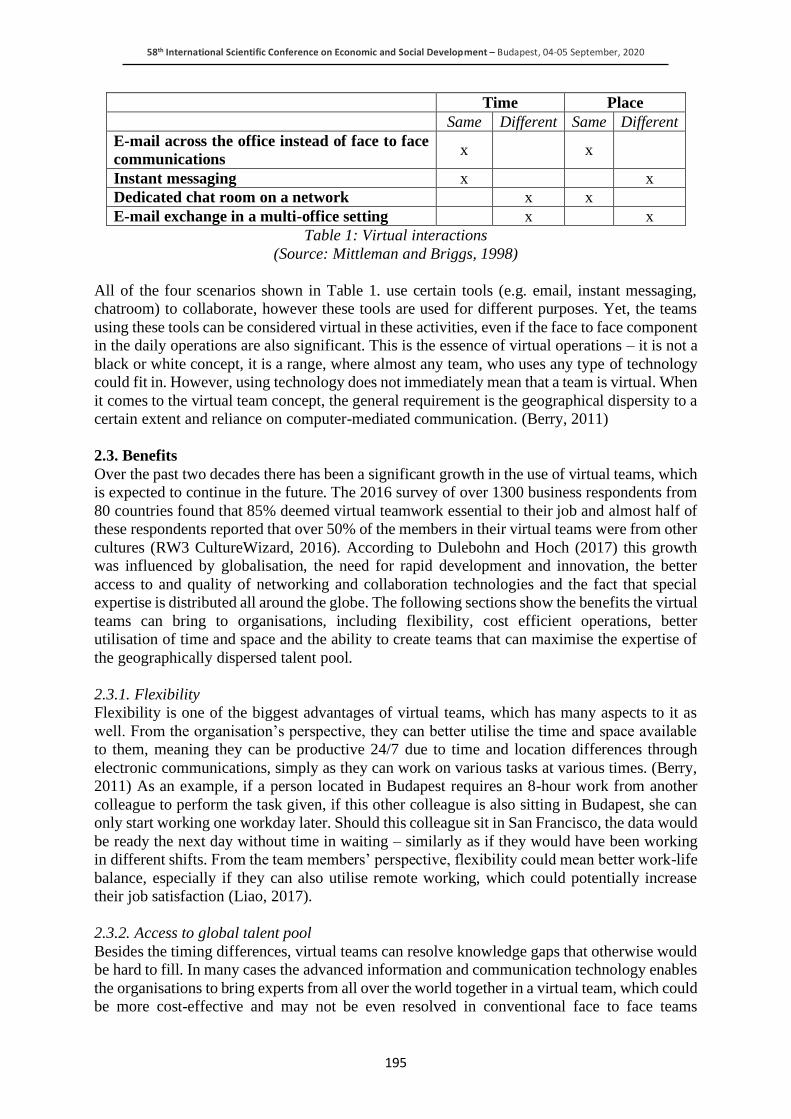
58th International Scientific Conference on Economic and Social Development – Budapest, 04-05 September, 2020
195
Time Place
Same Different Same Different
E-mail across the office instead of face to face
communications x x
Instant messaging x x
Dedicated chat room on a network x x
E-mail exchange in a multi-office setting x x
Table 1: Virtual interactions
(Source: Mittleman and Briggs, 1998)
All of the four scenarios shown in Table 1. use certain tools (e.g. email, instant messaging,
chatroom) to collaborate, however these tools are used for different purposes. Yet, the teams
using these tools can be considered virtual in these activities, even if the face to face component
in the daily operations are also significant. This is the essence of virtual operations – it is not a
black or white concept, it is a range, where almost any team, who uses any type of technology
could fit in. However, using technology does not immediately mean that a team is virtual. When
it comes to the virtual team concept, the general requirement is the geographical dispersity to a
certain extent and reliance on computer-mediated communication. (Berry, 2011)
2.3. Benefits
Over the past two decades there has been a significant growth in the use of virtual teams, which
is expected to continue in the future. The 2016 survey of over 1300 business respondents from
80 countries found that 85% deemed virtual teamwork essential to their job and almost half of
these respondents reported that over 50% of the members in their virtual teams were from other
cultures (RW3 CultureWizard, 2016). According to Dulebohn and Hoch (2017) this growth
was influenced by globalisation, the need for rapid development and innovation, the better
access to and quality of networking and collaboration technologies and the fact that special
expertise is distributed all around the globe. The following sections show the benefits the virtual
teams can bring to organisations, including flexibility, cost efficient operations, better
utilisation of time and space and the ability to create teams that can maximise the expertise of
the geographically dispersed talent pool.
2.3.1. Flexibility
Flexibility is one of the biggest advantages of virtual teams, which has many aspects to it as
well. From the organisation’s perspective, they can better utilise the time and space available
to them, meaning they can be productive 24/7 due to time and location differences through
electronic communications, simply as they can work on various tasks at various times. (Berry,
2011) As an example, if a person located in Budapest requires an 8-hour work from another
colleague to perform the task given, if this other colleague is also sitting in Budapest, she can
only start working one workday later. Should this colleague sit in San Francisco, the data would
be ready the next day without time in waiting – similarly as if they would have been working
in different shifts. From the team members’ perspective, flexibility could mean better work-life
balance, especially if they can also utilise remote working, which could potentially increase
their job satisfaction (Liao, 2017).
2.3.2. Access to global talent pool
Besides the timing differences, virtual teams can resolve knowledge gaps that otherwise would
be hard to fill. In many cases the advanced information and communication technology enables
the organisations to bring experts from all over the world together in a virtual team, which could
be more cost-effective and may not be even resolved in conventional face to face teams
58th International Scientific Conference on Economic and Social Development – Budapest, 04-05 September, 2020
196
(Maruping and Agrawal, 2004). Global talent means more diverse teams, which can arise from
both their cultural, educational or simply different backgrounds. The studies in this field are
contradictory whether diversity can be considered as a positive or negative attribute when it
comes to effectiveness; the information processing theory (Simon, 1978) or the resource-based
view (Barney, 1991) suggest that there is a positive correlation, while the similarity-attraction
theory (Tajfel, 1974) or the social identity theory (Kirkman et al. 2004) found negative effects
towards productivity. Although, these theories contradict in outcome, both of them suggest that
diversity – if managed properly – could significantly contribute to effectiveness. Managing and
leading diverse teams effectively is the key factor in its success. As Taras et al. (2019) notes,
diversity of perspective and the resources brought in by the members can increase creativity
and enhance problem solving.
2.3.3. Cost efficiency
Another aspect of virtual teams is that this set-up can save costs for the companies. Since virtual
teams use information and communication technologies, there is no need to travel to meet in
person or relocate colleagues who are living in different countries (Lipnack and Stamps, 2000).
Companies frequently use videoconferencing tools, organise townhalls, all-hands meetings,
where they meet frequently, however it is also common to organise quarterly face to face
meetings in one of the central locations of the company. Due to the remote working possibilities
that are frequently utilised in virtual teams, companies could also reduce their operational costs
by not building or renting physical offices or only renting smaller spaces (e.g. an office with
only 60% of the required seats). This reduces rental and overhead costs and could save money
in travel-related expense reimbursements. (Choi and Cho, 2019)
2.3.4. Better and more diverse knowledge sharing
According to Cohen and Gibson (2003) most interactions, commitments and the outcomes in
virtual teams are easier to document, review and store as these are archived automatically and
electronically, which makes sharing and accessing the knowledge also more efficient.
Harnessing the knowledge and talent 24/7 from anywhere in the world is another great attribute
to virtual teams. Virtual teams have proven to have the necessary tools to perform tasks and
utilise the diversity of their nature in different complexities. In case of less complex tasks,
virtual teams using asynchronous communication media (e.g. email) could effectively manage
their information and collaboration requirements. In case of complex and challenging tasks,
virtual teams use synchronous and tightly linked media to facilitate collaboration, information
richness and group decision making. (Bell and Kozlowski, 2002)
2.4. Challenges
The initial literature focused mostly on the benefits of the virtual teams, however there are
several challenges that shall be overcome in this type of collaboration. The recent survey of
RW3 CultureWizard (2016) showed that 41% of the respondents, who work in virtual teams
(85% of the respondents) have never met in person and only 22% of the respondents received
any kind of training on how to increase effectiveness and productivity in a virtual team. The
lack of personal connections, the issue of different cultures and languages – which on one hand
can be used as a benefit for the organisation –, the technological issues can both hinder the
effectiveness of virtual teamwork and pose challenges to the team members.
2.4.1. Language
One of the biggest barriers can be due to different language skills, since many virtual teams
operate cross-country, using one single common language (such as English). The different
proficiency levels can create status differences between the team members and could also lead
58th International Scientific Conference on Economic and Social Development – Budapest, 04-05 September, 2020
197
to misunderstandings, misinterpretations and conflicts (Neeley, 2012). Reinares-Lara et al.
(2016) also highlights that members of virtual teams, who are less proficient in this working
language usually are less engaged in group discussions and exclude themselves from
communication. Presbitero (2020) also found empirical support that skill of the common
foreign language is positively and significantly associated with the individual performance of
the virtual team member.
2.4.2. Lack of social presence
Virtual communication is highly reliant on the verbal communication; however, a significant
portion of our communication is non-verbal. Loosing, or at least limiting the possibilities for
non-verbal expressions causes misunderstandings, especially in written communication such as
chatrooms or emails (Daim et al., 2012; Hollingshead et al., 1993). The other issue with the
lack of social presence is the issue of engagement without face to face meetings, no team
buildings, no real human contact with the colleagues – which can be as simple as a short coffee
break in a common room of the office or a quick chat before the meeting starts. These simple
interactions create trust, which takes crucial part in creating an engaged team, where members
feel their social needs satisfied, however virtual teams many times lack this opportunity due to
their geographically disperse nature (Walther,1995). Thus, virtual teams in many cases increase
uncertainty as team members encounter first as strangers, which is not easy to transform in a
virtual setting, leading to anxiety, negative feelings and mistrust (Glikson and Erez, 2019;
Cohen and Gibson, 2003).
2.4.3. Technology used
Another hindering factor is one of the biggest advantages as well, which is the use of different
communication technology, such as teleconferencing software. Substituting face to face
communication with an online or electronic tool can distort the messages and make the
misunderstandings and conflicts more frequent than in face to face communication. Similarly,
technology requires certain infrastructural elements (i.e. continuous access to electricity, high-
speed internet, etc.), which are not always available for everyone within the team. It is also
important to find the best suitable tool to be used in a given situation. The “this could have been
an email” era shows that in many cases a simple asynchronous form of communication results
in better distribution of information and use of time, than organising a meeting for the same
task and vice versa. Not choosing the correct tool could negatively affect the resource allocation
and reduce the effectiveness of information sharing (Bell and Kozlowski, 2002). Kock and
DeLuca (2007) investigated four US and four New Zealand groups and found that using
technology increased the cognitive effort from group members to communicate their ideas to
the team – at the same time having a positive impact of information sharing.
2.4.4. Culture
Being connected via virtual tools in a global setting, cultural considerations become inevitable
in a team. When team members come from different cultures (which can be due to their
nationality, religion, education, etc.), the differences in communication norms and rules for
politeness, directness and knowledge exchange shall be considered. For example, in several
Asian countries nodding during a meeting could simply mean showing respect to the speaker
and is not the sign of acknowledgement or understanding. A study conducted by Leung and
Tjosvold (1998) and Olekans (1998) about essays published on conflict management in Asia
Pacific countries show that Australians tend to be direct, blunt as they care about honesty and
transparency, while Thais avoid open criticism as that is considered rude and would not enter
into conflict as that is destructive to the harmony of their relationships (Brew and Cairns, 2004).
58th International Scientific Conference on Economic and Social Development – Budapest, 04-05 September, 2020
198
3. LEADERSHIP OF VIRTUAL TEAMS
Leadership is a crucial element in realizing the benefits of virtual teams and at the same time
can help the team overcome the challenges and exploit the underlying opportunities. The key
characteristics of virtual teams from a leadership standpoint draw attention to two primary
functions: performance management and team development. Monitoring team and individual
performance is restricted in the lack of face to face interactions and at the same time – even in
case of using videoconferencing or other tools – the typical mentoring, coaching and
developmental functions are difficult to perform (Bell and Kozlowski, 2002). Besides these two
functions, there are several other attributes in virtual teams that a leader shall focus, both on a
team or an individual level in a virtual team setting. Section 3.1 and 3.2 summarise the findings
of Liao (2017) on multidimensional leadership, while Section 3.3. focuses on the leadership
implications of technology.
3.1. Leadership at the team level
At the team level, Liao (2017) and Bell and Kozlowski (2002) suggested that there are several
factors that are especially crucial in virtual teams. One of these key areas is collaboration, where
the leader shall act as a trainer and guide to the members and is responsible for providing the
necessary resources required. This includes not only process shaping and development or
resource allocation but building relationships within the team to ensure true collaboration
(Kirkman et al, 2004). Another important aspect as noted by Mathieu et al (2000) and Liao
(2017) is the role of shared mental models, where the role of the leader is to contribute to the
development of these behavioural rules and guides (such as shared knowledge about how the
team interacts or about the technology in use) via facilitating knowledge sharing and enhancing
the interactions within the team members. Since the face to face interaction is limited in virtual
teams, the leaders shall be open to a more collaborative shared leadership scheme as well, which
can serve as a supplementary technique in a virtual setting. Shared leadership represents the
process, where the team members influence each other, share responsibilities and make
decisions collaboratively. This makes the task allocation more efficient, the team more
productive and due to shared responsibilities and tasks, the team members may become more
engaged even in a virtual setting (Hoch and Kozlowski, 2014). Closely related to collaboration
is trust – which increase team engagement and could reduce the psychological distance in
virtual teams, acting as a glue sticking the fragmented team together. Several authors in the
academic literature (Jarvenpaa and Leidner, 1999; Maznevski, and Chudoba, 2000; Suchan and
Hayzak, 2001) suggest a relatively contradictory approach to resolve the issues of mistrust:
launching virtual teams with face to face kick-offs, noting that the in-person meetings are
irreplaceable for trust building. In virtual teams – or especially in the era of travel bans and
reduced travel agreements – this is not always possible, however as noted previously this is a
common practice at companies to organise at least quarterly meetings or workshops, where
globally dispersed teams could meet. The emergence of conflicts within a virtual team is
frequent – amongst others due to cultural differences, language barriers and the lack of social
interaction, resolving these issues can be challenging for a leader. Since the issue resolution
(should that be relationship-focused or task-focused) requires more from the leader of a virtual
or partially virtual team than the leader of a conventional team and thus, they should pay
particular attention to bridging members who are geographically dispersed and should focus on
building strong relationships within the team as well (Cheshin et al., 2013).
3.2. Leadership at the individual level
Besides the team level, individuality and managing tasks and relationships on an individual
level is also a focus area. The leader-member exchange (LMX) theory is widely used to focus
on leader interactions with the individual team members and the quality of their relationships
58th International Scientific Conference on Economic and Social Development – Budapest, 04-05 September, 2020
199
(Dulebohn et al., 2012). According to Liden and Maslyn (1998), the leader’s interaction with
the individual team members is based on four dimensions:
• Affect
• Loyalty
• Contribution
• Professional respect
Affect means the mutual affection that a leader and a member have for each other, which is
mainly influenced by non-task related aspects, such as chatting about some personal matters,
customizing information in emails. Loyalty means the public support from each other, which
can solidify the relationship between the parties. It can be strengthened in situations, where the
leader defends his follower (i.e. does not put blame on her, instead comes to her defence and
helps explaining the situation). When it comes to contribution, the direction and quality of task
efforts the leader shows towards the team member is a crucial factor. Simple techniques, such
as private chats about the needs and questions of the follower, providing constructive feedback
or setting personalised work goals could strengthen their relationship and would make the
performance of the individual more effective. In the case of professional respect, the role of
trust is also a crucial factor as leaders have to be confident in the team members’ abilities, skills
and knowledge, while the members shall also acknowledge the leader’s abilities. As noted in
case of contribution, personalised goals, providing guidance towards completing their tasks can
help utilising their individual strengths and knowledge.
3.3. Leadership implications of technology
Technology always affected leadership, the new ways of collaboration – such as the
introduction of telephony services or emails to everyday work in the past century, which now
seems the most everyday phenomenon – imposed challenges on leaders and team members to
figure out how to exploit the opportunities of the new kind of communication media. Team
members have to overcome complexities of these technologies and new processes, which have
to be understood, accountabilities and protocols has to be set up and non-compliance sanctions
shall be communicated as well (Berry, 2011). With the shift to virtual work and virtual teams,
the leaders need to focus on how to compensate for the challenges their followers face due to
remote communication, diversity, etc. At the same time leaders have the ability to shape the
technology practices to help their followers cope with these challenges via shared leadership,
team formation technologies and relationship building within the team. This also means shaping
the ways they send and receive information and provide feedback or gather data while relying
on information and communication technology (Larson and DeChurch, 2020). Technology can
bring new ways of team formations, and digital technologies can shape the leadership structures
and the interactions during team formation may influence who will emerge as a leader in the
team. The leaders can also use the team formation technologies to manage boundaries,
determine the team members, define phases of the teamwork and re-evaluate the membership
periodically. According to Cohen and Gibson (2003) the formation activities shall include
establishing easy communication, technology training so the technology to be used can be
understood and explicit norms and expectations are set-up. Team formation now does not only
mean creating teams from human resources only – there can be synthetic team members, whose
roles and responsibilities shall be defined together with the limits of technology, where the
human team members need to take back the control (Larson and DeChurch, 2020). Technology
– as the integral part of virtual teams – provides new opportunities for leaders in redefining how
performance is managed or tracked. There are several platforms (as simple as timesheets) that
can help as the administrative tool for tracking the actual time spent on projects, and there are
several technologies, which can track the progress real time.
58th International Scientific Conference on Economic and Social Development – Budapest, 04-05 September, 2020
200
The leaders have to know how to combine these technologies with more in person strategies –
i.e. one-on-one conversations, personal check-ins or regular reporting. Studies found that in
case of less complex tasks, there is no significant difference between the performance of face
to face teams and virtual teams, the challenge comes with the more complex tasks. However,
this could be also overcome with the right choice of communication media, i.e. choosing
synchronous communication for resolving complex issues (Bell and Kozlowski, 2002).
4. CONCLUSION
“Virtual teams are here, and they are here to stay.” – Bell and Kozlowski, 2002, p.45
The nature of work is changing, the activities of organisations have become more global and
technology based. Technology enabled faster change, created more complex and dynamic jobs,
which were followed by organisational changes, implementation of new, more flexible and
adaptive structures and ways of working (Berry, 2011). Virtual teams offer several benefits to
organisations and became increasingly common at organisations. Virtual teams impose
challenges on both the organisations, leaders and team members as well, however those
organisations that are not willing or not able to apply virtual team settings lose a significant
competitive advantage in the rapidly changing global economic and social environment (Berry,
2011). Since the effectiveness of virtual teams depends on the resolution of these challenges
i.e. conflict resolution, skill development, insufficient communication, the role of a leader is
crucial in the success of virtual teamwork. Leaders shall acknowledge these difficulties and
establish a social presence in the virtual interactions and find new ways of building trust, respect
and loyalty – the tools are there via information and communication technologies. This paper
provided a literature review on the benefits and challenges with virtual teams, with a special
focus on the leadership aspects of these teams. The academic literature presented varies from
the early academic researches to the current, in some cases in press articles, thus providing a
summary of all current views and researches present in this research area. In the academic
literature there is still a gap on how team building, and development shall be done, what toolkits
are available for the leaders as even the current research focused on more of the theoretical side
of leadership with a special emphasis on the aspects of virtual teams.
LITERATURE:
1. Barney, J.B. (1991). Firm resources and sustained competitive advantage. Journal of
Management Issue 1, Pages 99-120
2. Bell, B.S., and Kozlowski, S.W. (2002). A typology of virtual teams. Group and
Organization Management, 27, 14-49.
3. Berry, G.R. (2011). Enhancing effectiveness on virtual teams: understanding why
traditional team skills are insufficient. Journal of Business Communication, Volume 48,
Number 2, April 2011 pp. 186-206
4. Brew, F.P and Cairns, D.R., (2004). Do culture or situational constraints determine choice
of direct or indirect styles in intercultural workplace conflicts? International Journal of
Intercultural Relations, Volume 28, Issue 5, 2004, Pages 331-352
5. Byrne, J.; Brandt, R. and Port, O. (1993). The virtual corporation. Business Week. 8, 98-
102.
6. Cheshin, A.; Kim, Y.; Nathan, D.B.; Ning, N. and Olson, J.S. (2013). Emergence of
differing electronic communication norms within partially distributed teams. Journal of
Personnel Psychology, 12 (2013), pp. 7-21
7. Choi O.K., Cho E. (2019). The mechanism of trust affecting collaboration in virtual teams
and the moderating roles of the culture of autonomy and task complexity. Computers in
Human Behavior, Volume 91, 2019, Pages 305-315
58th International Scientific Conference on Economic and Social Development – Budapest, 04-05 September, 2020
201
8. Cohen, S.G. and Bailey, D.R. (1997): What makes teams work: group effectiveness research
from the shop floor to the executive suite? Journal of Management. 23(4), pp. 238–290.
1997
9. Cohen, S.G., and Gibson, C.B. (2003). In the beginning: Introduction and framework. In C.
B. Gibson and S. G. Cohen (Eds.), Virtual teams that work: Creating Conditions for virtual
team effectiveness (pp. 1-14). San Francisco, CA: Jossey-Bass
10. Daim, T.U.; Ha, A.; Reutiman, S.; Hughes, B.; Pathak, U.; Bynum, W. and Ashok, B.
(2012). Exploring the communication breakdown in global virtual teams. International
Journal of Project Management, 30 (2) (2012), pp. 199-212,
11. Dess, G.; Rasheed, A.; McLaughlin, K. and Priem, R. (1995). The new corporate
architecture. Academy of Management Executive. 9. 7-20.
12. Dulebohn, J.H.; Bommer, W.H.; Liden, R.C.; Brouer, R.L. and Ferris, G.R. (2012). A meta-
analysis of antecedents and consequences of leader-member exchange integrating the past
with an eye toward the future. Journal of Management, 38 (6) (2012), pp. 1715-1759
13. Dulebohn, J.H. and Hoch J.E. (2017): Virtual teams in organizations. Human Resource
Management Review, Volume 27, Issue 4, 2017, Pages 569-574.
14. Glikson E. and Erez M. (2019). The emergence of a communication climate in global virtual
teams, Journal of World Business, 2019, https://doi.org/10.1016/j.jwb.2019.101001
(Article in press)
15. Hoch, J.E. and Kozlowski, S.W. (2014). Leading virtual teams: Hierarchical leadership,
structural supports, and shared team leadership. Journal of Applied Psychology, 99 (3)
(2014), p. 390
16. Hollingshead, A.B.; McGrath. J.E. and O’Connor, M. (1993). Group task performance and
communication technology: a longitudinal study of computer-mediated versus face-to-face
work groups. Small Group Research, 24 (3) (1993), pp. 307-324
17. Hovde, M.R. (2014). Factors that enable and challenge international engineering
communication: a case study of a United States/British design team. IEEE Transactions on
Professional Communication, Volume 57, pp. 242-265
18. Jarvenpaa, S.L. and Leidner D.E. (1999). Communication and trust in global virtual teams.
Organization Science, 10 (1999), pp. 791-815
19. Kirkman, B.L.; Rosen, B.; Tesluk, P.E. and Gibson, C.B. (2004). The impact of team
empowerment on virtual team performance: The moderating role of face-to-face
interaction. Academy of Management Journal Volume 47, Issue 2, April 2004, Pages 175-
192
20. Kock, N. and DeLuca, D. (2007). Improving business processes electronically: an action
research study in New Zealand and the US. Journal of Global Information Technology
Management, 10 (3) (2007), pp. 6-27
21. Larson, L. and DeChurch, L.A. (2020): Leading teams in the digital age: Four perspectives
on technology and what they mean for leading teams. The Leadership Quarterly, Volume
31, Issue 1, February 2020, 101377
22. Leung, K. and Tjosvold, D. (1998): Conflict management in the Asia Pacific: assumptions
and approaches in diverse cultures, Wiley, Singapore, 1998
23. Liden, R.C. and Maslyn, J.M. (1998). Multidimensionafity of leader-member exchange: An
empirical assessment through scale development. Journal of Management, 24 (1) (1998, pp.
43-72
24. Lipnack, J. and Stamps, J. (2000). Virtual Teams: People Working Across Boundaries with
Technology (Second edition), John Wiley & Sons, New York
25. Mittleman, D.D. and Briggs, B.O. (1998). Communication technology for teams: electronic
collaboration. In E. Sunderstrom & Associates (Eds.), Supporting work team effectiveness:
Best practices for fostering high-performance. San Francisco, CA: Jossey-Bass
58th International Scientific Conference on Economic and Social Development – Budapest, 04-05 September, 2020
202
26. Liao, C. (2017). Leadership in virtual teams: A multilevel perspective. Human Resource
Management Review, Volume 27, Issue 4, 2017, Pages 648-659.
27. Maruping, L.M. and Agarwal, R. (2004). Managing team interpersonal processes through
technology: A task–technology fit perspective. Journal of Applied Psychology, 89 (6)
(2004), pp. 975-990
28. Maznevski, M.L. and Chudoba, K.M. (2000). Bridging space over time: Global virtual team
dynamics and effectiveness. Organization Science, 11 (5) (2000), pp. 473-492
29. Mathieu, J.E.; Heffner, T.S.; Goodwin, G.F.; Salas, E. and Cannon-Bowers J.A. (2000). The
influence of shared mental models on team process and performance. Journal of Applied
Psychology, 85 (2) (2000), p. 273
30. Neeley, T.B. (2012). Language matters: Status loss and achieved status distinctions in
global organizations. Organization Science, 24 (2) (2012), pp. 319-644
31. Olekans, M. (1998): Negotiating with Australia: the individual among us. K. Leung, D.
Tjosvold (Eds.), Conflict management in the Asia Pacific: assumptions and approaches in
diverse cultures, Wiley, Singapore (1998), pp. 277-301
32. Presbitero, A. (2020). Foreign language skill, anxiety, cultural intelligence and individual
task performance in global virtual teams: A cognitive perspective. Journal of International
Management, Volume 26, Issue 2, 2020,
33. Reinares-Lara, E.; Martín-Santana, J.D.E. and Muela-Molina, C. (2016). The Effects of
Accent, Differentiation, and Stigmatization on Spokesperson Credibility in Radio
Advertising, Journal of Global Marketing, 29:1, 15-28
34. Ricketts, C. and Ricketts, J. (2010). Leadership: Personal Development and Career
Success. Cengage Learning, 2010
35. RW3 CultureWizard (2016). Trends in global virtual teams. Retrieved 18th August 2020
from http://info.rw-3.com/virtual-teams-survey-0
36. Simon H.A. (1978). Information-processing theory of human problem solving. Handbook
of Learning and Cognitive Processes, 5 (1978), pp. 271-295
37. Suchan, J. and Hayzak, G. (2001). The communication characteristics of virtual teams: A
case study. IEEE Transactions on Professional Communication, 44 (2001), pp. 174-186
38. Tajfel, H. (1974). Social identity and intergroup behavior. Social Science Information
Volume 13, Issue 2, Pages 65-93
39. Taras, V.; Baack, D.; Caprar, D.; Dow, D.; Froese, F.; Jimenez, S. and Magnusson, P.
(2019). Diverse effects of diversity: Disaggregating effects of diversity in global virtual
teams. Journal of International Management, Volume 25, Issue 4, 2019, 100689
40. Walther, J.B. (1995). Related aspects of computer-mediated communication: Experiential
observations. Organizational Science, 6, 180-203.
58th International Scientific Conference on Economic and Social Development – Budapest, 04-05 September, 2020
203
INNOVATION AND THE ROLE OF EMPLOYEE AGILITY - A CASE
STUDY IN JORDANIAN BANKS
Lusan rawashdeh
Szechenyi istvan university, Hungary
Dory Tibor
Szechenyi istvan university, Hungary
ABSTRACT
Innovation and agility are interrelated phenomena that have been considered fundamental for
organizational Survival, Success, and growth in the bank sector in the Hashemite Kingdom of
Jordan. Employee Agility considers an important element of individual capabilities which may
be leading to innovative output. However, the purpose of this study is to examine the impact of
the employee agility on the innovation output in three banks. With attempted to extend the
studies in the context of innovation and employee agility. To achieve these objectives, a
questionnaire was developed and used to collect data by 100 employees. The SPSS Statistical
program was used to test the hypotheses. The findings of the study showed that there is a
significant effect on employee agility on innovation output in the banking sector. Furthermore,
“proactivity” and “Adaptability” skills of the employee yields a significant predictive value for
generating innovative behaviour in the workplace. Despite the plenty studies of innovation, this
study is prepared to be one of the first studies that shed the light on the role of agility skills of
an employee on innovation process especially at service sector with the aim to help the
managers to develop and improve their employee capabilities and stimulate their innovative
behaviour. As well as and due to the lack of previous researches focused on the study of the
importance of the agility capabilities in the developing countries.
Keywords: Employee agility, agile, Innovation
1. INTRODUCTION
The rapid developments and growing global competition worldwide has led to a noticeable rise
in complexity and rapid changes in the work environment, making it difficult for their leader to
predict the future consequences of the organizations (Jaiswal, Neeraj& Dhar.2015). Innovation
has become an essential tool to achieve success and long term survival (Anderson, K, & J.
2014). And agile is a 21st-century philosophy that means” be able to deal with new situations
or changes quickly and successfully’ (Sharifi, H. y Zhang .2001). However, the emerging
concept of agility has been widely discussed in the manufacturing organizations with the aim
to enhance the organization's competitiveness and be innovative (Rajan, 2012), when they
witnessed rapid changes in the industry's environment (Alavi, S & Wahab, D. 2013). Moreover,
in order to survive in banks today, having agility capabilities become a necessity rather than a
purpose. Thus innovation accompanied by agility has become essential capabilities required to
meet those unpredictable changes and gain a competitive advantage as well (Winby, S., &
Worley, C. 2014). However, the process of addressing and responding to changes relies mostly
on the employees who are considered the fundamental source of potential innovative
capabilities (Kanter, 1988: Janssen 2000). Furthermore, agility at employee level refers to the
extent in which employee can immediately respond to the changes in the work environment
with the ability to exploit those changes for the organization's benefit. (Alavi et al., 2014; 2018)
Therefore, the organization now days put a lot of effort to invest in their employees and improve
their agility skills, furthermore, researchers give more attention to study the factors that
58th International Scientific Conference on Economic and Social Development – Budapest, 04-05 September, 2020
204
influence and stimulate innovative behaviour, therefore they called for more research models
of innovation as dependent variable (Janssen, van de Vliert, and West 2004). As a result,
previous researches have tried to study the determinants and the key influences of innovation
as debated by Scott and Bruce (1984) and Van de Ven (1986), Janssen (2004). However, despite
the plenty of studies on the innovation factors as agility in the manufacturing organizations, but
there are scarce studies that have tried to examine the effect of employee agility capabilities
especially in the service sector (Pitafi, A., Liu, H. and Cai, Z., 2018). Given the importance of
innovative behaviour, the major motivation of this study is to improve our understanding of the
processes by which innovation influences. By examining the role of agility capabilities of
employees to gain deeper insights on the determinants of innovative output that would help to
fill the existing gap in the literature. Therefore, this working paper aims to examine the
influence of employee agility that may consider possible predictors of innovative output in the
banking sector. Drawing on the study of the (Alavi, 2014) agility capabilities of employees
consists of three main constructs ( proactivity, adaptability, resilience) and the study extends
the literature by developing predictions about how a specific agility psychological constructs
will affect employee innovation behaviour in the workplace.
2. THEORETICAL BACKGROUND
2.1. Employee agility and innovation
Although the concept of agility has been defined from different disciplines and perspectives,
all definitions agreed on the significance of the change adaptation process when referring to
agility. Thus, agility could be considered as the ability to act effectively in a competitive
environment in order to meet customer needs fluctuations (Gunasekaran, 1999). Agility defines
as the quick and effective response to unexpected changes in the market (Alavi, 2013). In
particular, the agility would be the ability in face, survive, and even take the advantage of
unexpected changes or threats (Sharifi, H. 2001). While organizational agility refers to the
ability of the organization’s structure that allows firms to be infinitely adaptable and innovative
without the need to change (Dyer and Shafer, 1999). Based on the studies of (Alavi et al., 2014),
researchers deemed the agility capabilities as a multistage behaviour that starts with
“proactivity”, then “adaptability”, and need “resilience”. Individuals with high proactive
behaviour are initiative people, identify the opportunities, and pursue them until the change
happened. (Crant 1995) demonstrate that being proactive means be predictive of the work
objectives. This kind of personality consider unique and is related to the need for achievement.
(Crant, 1993). Furthermore, employees with proactive attitudes try to seek and create optimal
situations with the aim to enhance the work performance. By knowledge obtaining and engage
more in the work's management activates .eventually proactive employees’ act by anticipating
the changes in the environment and react with constructive changes. (Morrison 1993)
Adaptability, mean the ability of the employees to convert or adjust their behaviour to fit new
work procedures when changes happened in the work environment (Alavi et al., 2014; Liu, Li,
Cai, & Huang, 2015). Resilience is the employee's ability to accept and improve changes in
terms of interactions and behaviours with other employees and procedures in the work
environment. (Nguyen, & Malinen, S. 2016). Some researcher emphasizes on the role of the
organization in improving and facilitate such behaviours to ensure efficient use of its resources
when dealing with work uncertainty. However, the link between these interrelated constructs,
proactive, adaptable, and resilient have received far less attention in examining how it's affected
in work environments. Companies with an agile mind-set must be innovative because first of
all, they compete in a turbulent environment that requires meets the need and the want of the
customers with innovative ideas. Second, the nature of the uncertainty and the rhythm of these
rapid changes drive organizations to invest more in their resources to improve their capacity
with the aim to meet thus changes in a way that ensure ultimately efficient and effective
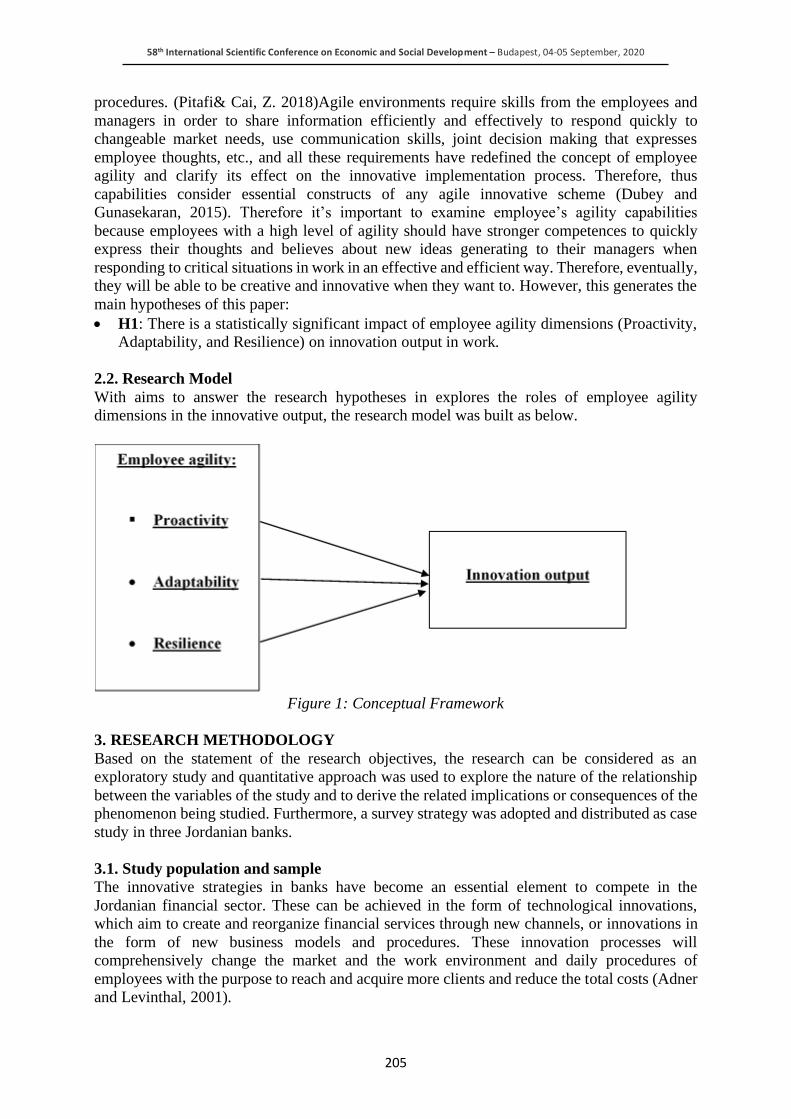
58th International Scientific Conference on Economic and Social Development – Budapest, 04-05 September, 2020
205
procedures. (Pitafi& Cai, Z. 2018)Agile environments require skills from the employees and
managers in order to share information efficiently and effectively to respond quickly to
changeable market needs, use communication skills, joint decision making that expresses
employee thoughts, etc., and all these requirements have redefined the concept of employee
agility and clarify its effect on the innovative implementation process. Therefore, thus
capabilities consider essential constructs of any agile innovative scheme (Dubey and
Gunasekaran, 2015). Therefore it’s important to examine employee’s agility capabilities
because employees with a high level of agility should have stronger competences to quickly
express their thoughts and believes about new ideas generating to their managers when
responding to critical situations in work in an effective and efficient way. Therefore, eventually,
they will be able to be creative and innovative when they want to. However, this generates the
main hypotheses of this paper:
• H1: There is a statistically significant impact of employee agility dimensions (Proactivity,
Adaptability, and Resilience) on innovation output in work.
2.2. Research Model
With aims to answer the research hypotheses in explores the roles of employee agility
dimensions in the innovative output, the research model was built as below.
Figure 1: Conceptual Framework
3. RESEARCH METHODOLOGY
Based on the statement of the research objectives, the research can be considered as an
exploratory study and quantitative approach was used to explore the nature of the relationship
between the variables of the study and to derive the related implications or consequences of the
phenomenon being studied. Furthermore, a survey strategy was adopted and distributed as case
study in three Jordanian banks.
3.1. Study population and sample
The innovative strategies in banks have become an essential element to compete in the
Jordanian financial sector. These can be achieved in the form of technological innovations,
which aim to create and reorganize financial services through new channels, or innovations in
the form of new business models and procedures. These innovation processes will
comprehensively change the market and the work environment and daily procedures of
employees with the purpose to reach and acquire more clients and reduce the total costs (Adner
and Levinthal, 2001).
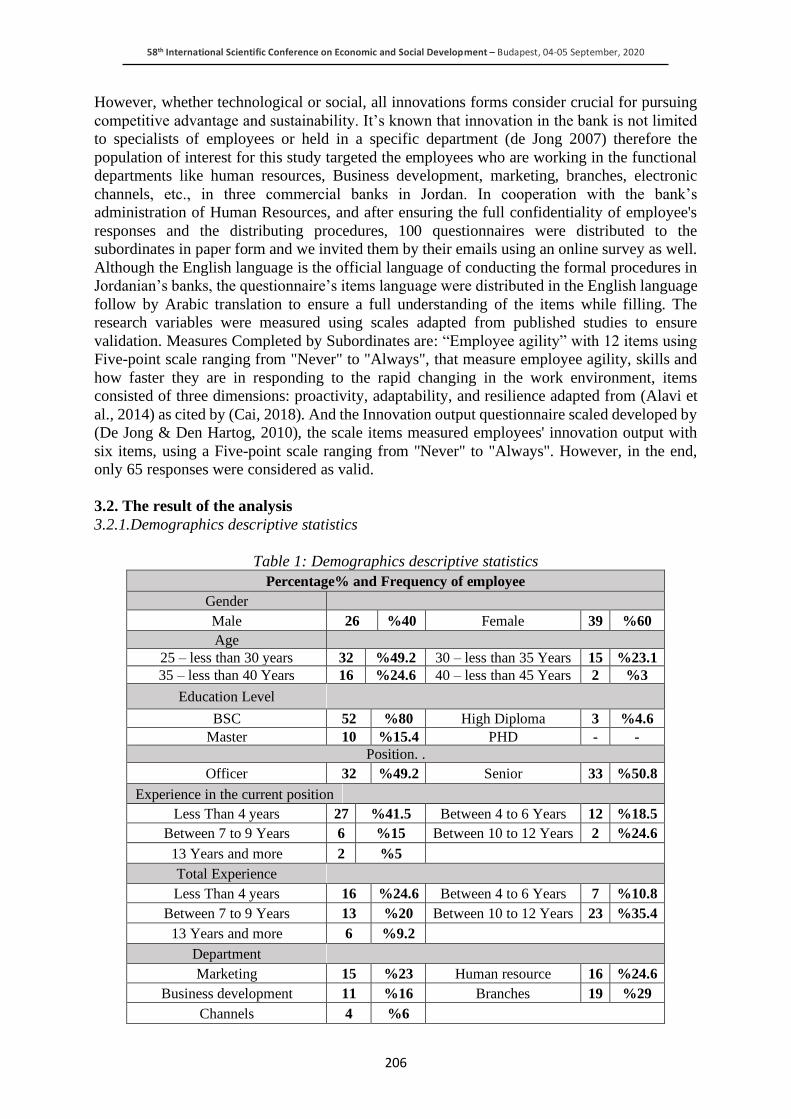
58th International Scientific Conference on Economic and Social Development – Budapest, 04-05 September, 2020
206
However, whether technological or social, all innovations forms consider crucial for pursuing
competitive advantage and sustainability. It’s known that innovation in the bank is not limited
to specialists of employees or held in a specific department (de Jong 2007) therefore the
population of interest for this study targeted the employees who are working in the functional
departments like human resources, Business development, marketing, branches, electronic
channels, etc., in three commercial banks in Jordan. In cooperation with the bank’s
administration of Human Resources, and after ensuring the full confidentiality of employee's
responses and the distributing procedures, 100 questionnaires were distributed to the
subordinates in paper form and we invited them by their emails using an online survey as well.
Although the English language is the official language of conducting the formal procedures in
Jordanian’s banks, the questionnaire’s items language were distributed in the English language
follow by Arabic translation to ensure a full understanding of the items while filling. The
research variables were measured using scales adapted from published studies to ensure
validation. Measures Completed by Subordinates are: “Employee agility” with 12 items using
Five-point scale ranging from "Never" to "Always", that measure employee agility, skills and
how faster they are in responding to the rapid changing in the work environment, items
consisted of three dimensions: proactivity, adaptability, and resilience adapted from (Alavi et
al., 2014) as cited by (Cai, 2018). And the Innovation output questionnaire scaled developed by
(De Jong & Den Hartog, 2010), the scale items measured employees' innovation output with
six items, using a Five-point scale ranging from "Never" to "Always". However, in the end,
only 65 responses were considered as valid.
3.2. The result of the analysis
3.2.1.Demographics descriptive statistics
Table 1: Demographics descriptive statistics
Percentage% and Frequency of employee
Gender
%60 39 Female %40 26 Male
Age
%23.1 15 30 – less than 35 Years %49.2 32 25 – less than 30 years
%3 2 40 – less than 45 Years %24.6 16 35 – less than 40 Years
Education Level
%4.6 3 High Diploma %80 52 BSC
- - PHD %15.4 10 Master
Position. .
%50.8 33 Senior %49.2 32 Officer
Experience in the current position
%18.5 12 Between 4 to 6 Years %41.5 27 Less Than 4 years
%24.6 2 Between 10 to 12 Years %15 6 Between 7 to 9 Years
%5 2 13 Years and more
Total Experience
%10.8 7 Between 4 to 6 Years %24.6 16 Less Than 4 years
%35.4 23 Between 10 to 12 Years %20 13 Between 7 to 9 Years
%9.2 6 13 Years and more
Department
%24.6 16 Human resource %23 15 Marketing
%29 19 Branches %16 11 Business development
%6 4 Channels
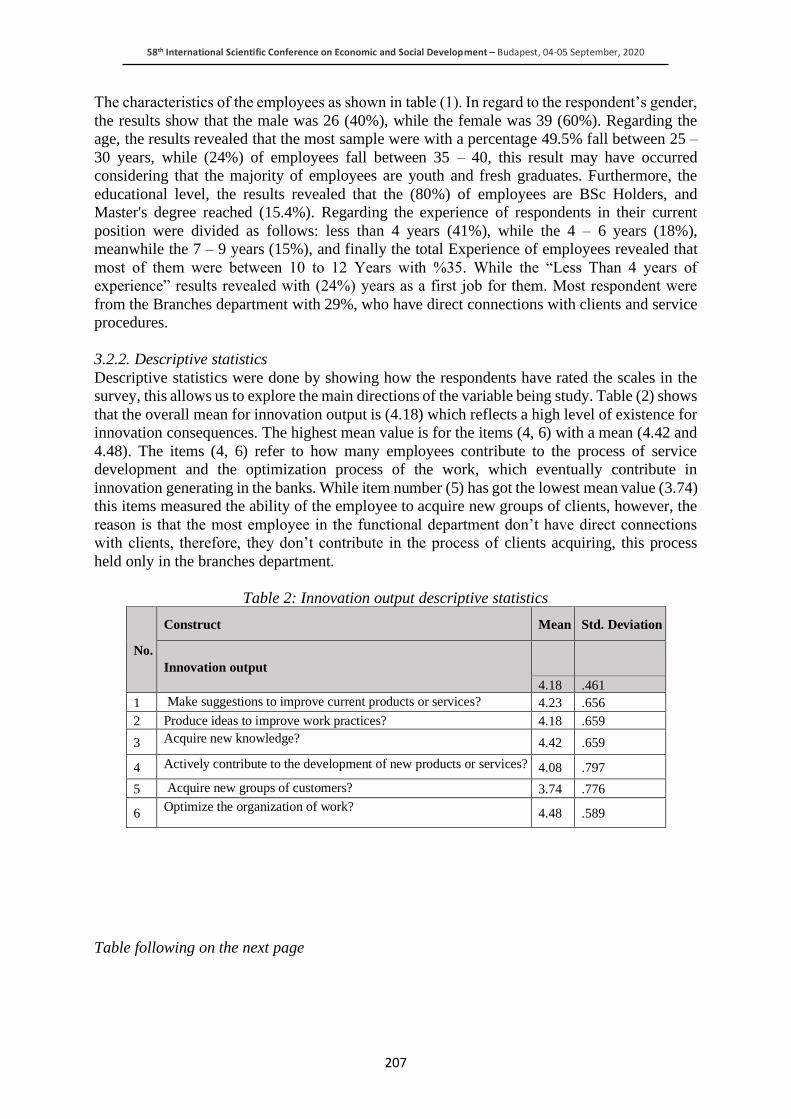
58th International Scientific Conference on Economic and Social Development – Budapest, 04-05 September, 2020
207
The characteristics of the employees as shown in table (1). In regard to the respondent’s gender,
the results show that the male was 26 (40%), while the female was 39 (60%). Regarding the
age, the results revealed that the most sample were with a percentage 49.5% fall between 25 –
30 years, while (24%) of employees fall between 35 – 40, this result may have occurred
considering that the majority of employees are youth and fresh graduates. Furthermore, the
educational level, the results revealed that the (80%) of employees are BSc Holders, and
Master's degree reached (15.4%). Regarding the experience of respondents in their current
position were divided as follows: less than 4 years (41%), while the 4 – 6 years (18%),
meanwhile the 7 – 9 years (15%), and finally the total Experience of employees revealed that
most of them were between 10 to 12 Years with %35. While the “Less Than 4 years of
experience” results revealed with (24%) years as a first job for them. Most respondent were
from the Branches department with 29%, who have direct connections with clients and service
procedures.
3.2.2. Descriptive statistics
Descriptive statistics were done by showing how the respondents have rated the scales in the
survey, this allows us to explore the main directions of the variable being study. Table (2) shows
that the overall mean for innovation output is (4.18) which reflects a high level of existence for
innovation consequences. The highest mean value is for the items (4, 6) with a mean (4.42 and
4.48). The items (4, 6) refer to how many employees contribute to the process of service
development and the optimization process of the work, which eventually contribute in
innovation generating in the banks. While item number (5) has got the lowest mean value (3.74)
this items measured the ability of the employee to acquire new groups of clients, however, the
reason is that the most employee in the functional department don’t have direct connections
with clients, therefore, they don’t contribute in the process of clients acquiring, this process
held only in the branches department.
Table 2: Innovation output descriptive statistics
No.
Construct Mean Std. Deviation
Innovation output
4.18 .461
1 Make suggestions to improve current products or services? 4.23 .656
2 Produce ideas to improve work practices? 4.18 .659
3 Acquire new knowledge? 4.42 .659
4 Actively contribute to the development of new products or services? 4.08 .797
5 Acquire new groups of customers? 3.74 .776
6 Optimize the organization of work?
4.48 .589
Table following on the next page
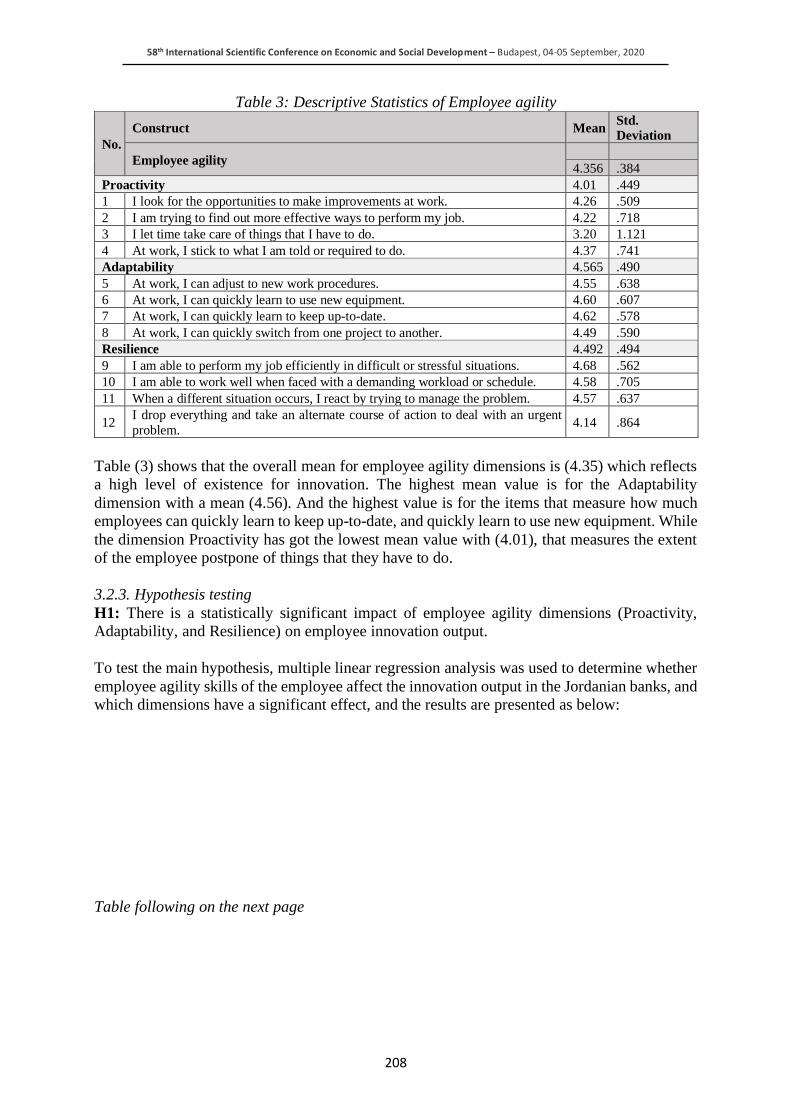
58th International Scientific Conference on Economic and Social Development – Budapest, 04-05 September, 2020
208
Table 3: Descriptive Statistics of Employee agility
Table (3) shows that the overall mean for employee agility dimensions is (4.35) which reflects
a high level of existence for innovation. The highest mean value is for the Adaptability
dimension with a mean (4.56). And the highest value is for the items that measure how much
employees can quickly learn to keep up-to-date, and quickly learn to use new equipment. While
the dimension Proactivity has got the lowest mean value with (4.01), that measures the extent
of the employee postpone of things that they have to do.
3.2.3. Hypothesis testing
H1: There is a statistically significant impact of employee agility dimensions (Proactivity,
Adaptability, and Resilience) on employee innovation output.
To test the main hypothesis, multiple linear regression analysis was used to determine whether
employee agility skills of the employee affect the innovation output in the Jordanian banks, and
which dimensions have a significant effect, and the results are presented as below:
Table following on the next page
No.
Construct Mean Std.
Deviation
Employee agility
4.356 .384
Proactivity 4.01 .449
1 I look for the opportunities to make improvements at work. 4.26 .509
2 I am trying to find out more effective ways to perform my job. 4.22 .718
3 I let time take care of things that I have to do. 3.20 1.121
4 At work, I stick to what I am told or required to do. 4.37 .741
Adaptability 4.565 .490
5 At work, I can adjust to new work procedures. 4.55 .638
6 At work, I can quickly learn to use new equipment. 4.60 .607
7 At work, I can quickly learn to keep up-to-date. 4.62 .578
8 At work, I can quickly switch from one project to another. 4.49 .590
Resilience 4.492 .494
9 I am able to perform my job efficiently in difficult or stressful situations. 4.68 .562
10 I am able to work well when faced with a demanding workload or schedule. 4.58 .705
11 When a different situation occurs, I react by trying to manage the problem. 4.57 .637
12 I drop everything and take an alternate course of action to deal with an urgent
problem. 4.14 .864
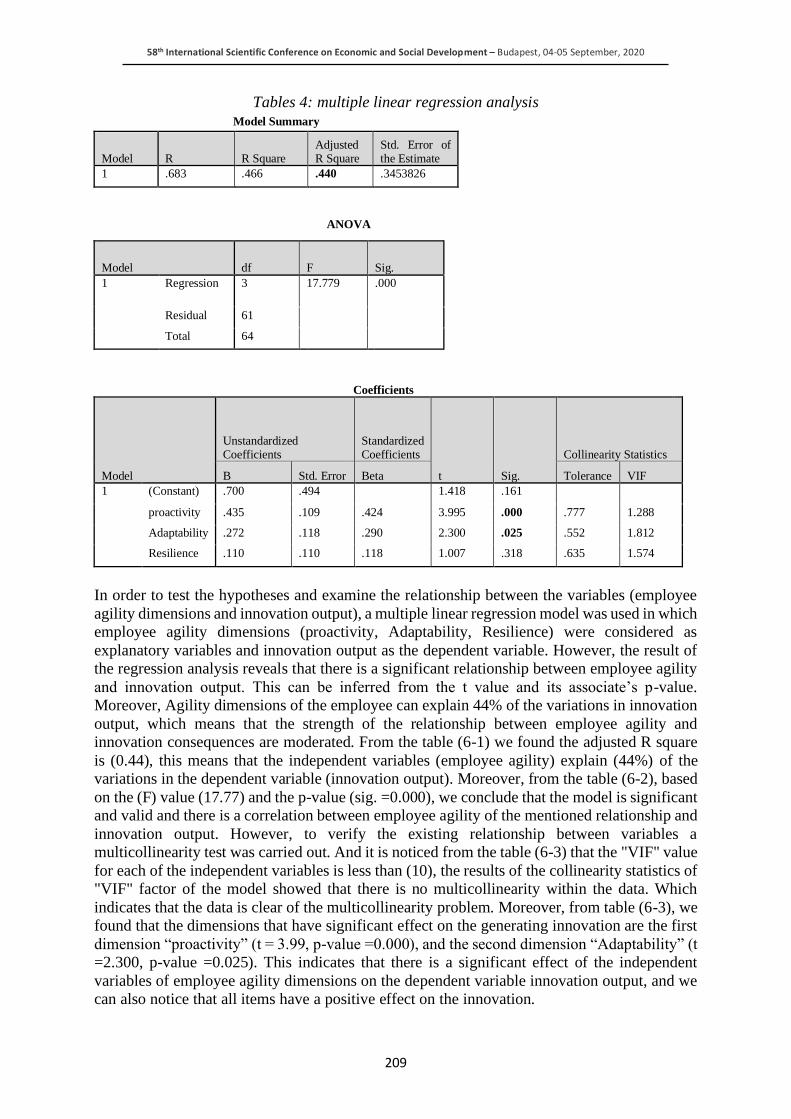
58th International Scientific Conference on Economic and Social Development – Budapest, 04-05 September, 2020
209
Tables 4: multiple linear regression analysis
Model Summary
Model R R Square Adjusted R Square
Std. Error of the Estimate
1 .683 .466 .440 .3453826
ANOVA
Model df F Sig. 1 Regression 3 17.779 .000
Residual 61 Total 64
Coefficients
Model
Unstandardized Coefficients
Standardized Coefficients
t Sig.
Collinearity Statistics
B Std. Error Beta Tolerance VIF
1 (Constant) .700 .494 1.418 .161
proactivity .435 .109 .424 3.995 .000 .777 1.288
Adaptability .272 .118 .290 2.300 .025 .552 1.812
Resilience .110 .110 .118 1.007 .318 .635 1.574
In order to test the hypotheses and examine the relationship between the variables (employee
agility dimensions and innovation output), a multiple linear regression model was used in which
employee agility dimensions (proactivity, Adaptability, Resilience) were considered as
explanatory variables and innovation output as the dependent variable. However, the result of
the regression analysis reveals that there is a significant relationship between employee agility
and innovation output. This can be inferred from the t value and its associate’s p-value.
Moreover, Agility dimensions of the employee can explain 44% of the variations in innovation
output, which means that the strength of the relationship between employee agility and
innovation consequences are moderated. From the table (6-1) we found the adjusted R square
is (0.44), this means that the independent variables (employee agility) explain (44%) of the
variations in the dependent variable (innovation output). Moreover, from the table (6-2), based
on the (F) value (17.77) and the p-value (sig. =0.000), we conclude that the model is significant
and valid and there is a correlation between employee agility of the mentioned relationship and
innovation output. However, to verify the existing relationship between variables a
multicollinearity test was carried out. And it is noticed from the table (6-3) that the "VIF" value
for each of the independent variables is less than (10), the results of the collinearity statistics of
"VIF" factor of the model showed that there is no multicollinearity within the data. Which
indicates that the data is clear of the multicollinearity problem. Moreover, from table (6-3), we
found that the dimensions that have significant effect on the generating innovation are the first
dimension “proactivity” (t = 3.99, p-value =0.000), and the second dimension “Adaptability” (t
=2.300, p-value =0.025). This indicates that there is a significant effect of the independent
variables of employee agility dimensions on the dependent variable innovation output, and we
can also notice that all items have a positive effect on the innovation.
58th International Scientific Conference on Economic and Social Development – Budapest, 04-05 September, 2020
210
As regression analysis results have shown, when employees have more agility capabilities,
more innovation output will result. Based on that our results confirm the main hypothesis which
indicates that there is a statistically significant impact of employee agility on innovation output.
4. DISCUSSIONS & CONCLUSIONS
Our findings have shown that employee with a high presence of agile capabilities is able to
generate and implement greater innovative output in the banking sector. Furthermore, there is
a greater presence of the proactive skills and adaptable skills between employees compare to
the presence of resilience behaviours, which mean that employee in banks constantly looking
for the opportunities to make improvements at work and constantly trying to find out more
effective ways to perform their job. At the same time, our finding reveals that most employees
are not able to behave innovatively in stressful situations or with demanding schedules.
Furthermore, they mostly committed to their timeline work program which may affect their
innovative consequences in their workplace. Therefore managers or decision-makers in banks
should try to enable a more flexible and creative environment in the workplace to ensure a
healthy work environment that helps the employee to be innovative and agile even in most
critical situations. However, the importance of innovation in organizations has been received
growing attention from scholars and continues to be one of the most interesting to researchers
and practitioners. Despite the number of studies on innovation and its related disciplines, still,
some gaps remain due to the factors that influence and stimulate innovation. Therefore, in this
study we shed light on the role of agility skills of the employee in the banking sector, there are
rare studies regarding this variable. Therefore the purpose of this study is to explore the role of
employee agility dimensions in generating innovation in the bank’s functional department in
Jordan. Moreover, the literature extended with the aim to help managers to understand the
importance of the factors that ensure promote innovation practices. And to advance our
understanding regarding the importance of agility capabilities in the employment process in the
banking sector. Furthermore, the findings provide directions for managers who need to
designate the work environment with appropriate capabilities to ensure efficient behaviour and
the ultimate innovation process. However, our research advances knowledge on how the agility
performances of employees can be improved by developing the role of specific psychological
characteristics. Despite the well-recognized value of agility, investigations on how to foster
agility at employees' levels are limited. Therefore this paper has extended the limited published
literature on employee agility. The concept of agility has been extended to the human resources
in any organization therefore agility should be a part of the successful management, together
with other capacities such as the alignment between the employees and their manager
(Rawashdeh, L, & dory, T. 2020,).
5. LIMITATION
This study was conducted in the banking sector of Jordanian sample, however, future studies
can also examine the employee agility skills in different sector such as telecommunication firms
that relay the most on the agility skills of their employee to promote innovation. Moreover,
there is only few studies that built a scale to measure the agility capabilities of the employee,
future research could develop and examine new items to measure the agility capabilities of
employee especially in service sector. This study examine the employee agility as independent
variable, future research could investigate the role of agile capabilities as mediating variable
that may use to simulate innovative behaviour for example employee voice.
58th International Scientific Conference on Economic and Social Development – Budapest, 04-05 September, 2020
211
LITERATURE:
1. Alavi, S., & Wahab, D. A. (2013). A review on workforce agility. Research Journal of
Applied Sciences, Engineering and Technology, 5, 4195–4199.
2. Alavi, S., Wahab, D. A., Muhamad, N., & Shirani, B. A. (2014). Organic structure and
Organisational learning as the main antecedents of workforce agility. International Journal
of Production Research, 52, 6273–6295
3. Adner, R. y Levinthal, D. (2001). Demand heterogeneity and technology evolution:
implications for product and process innovation. Management Science, 47(5), 611-628.
4. Anderson, N, & Potočnik, K & Zhou, J. (2014). Innovation and Creativity in Organizations:
A State-of-the-Science Review, Prospective Commentary, and Guiding Framework.
Journal of Management. 40(5),
5. Anderson, N. R., & West, M. A. (1998). Measuring climate for work group innovation:
Development and validation of the team climate inventory. Journal of Organizational
Behaviour, 19, 235-258.
6. Anderson, N., De Dreu, C.K. & Nijstad, B.A. (2004). The routinization of innovation
research: a constructively critical review of the state-of-the-science, Journal of
Organizational Behaviour, 25 (2), pp. 147-173.
7. Cai, Zhao & Huang, Qian & Liu, Hefu & Wang, Xiaoyan. (2018). improving the agility of
employees through enterprise social media: The mediating role of psychological conditions.
International Journal of Information Management. 38. pp.52-63.
8. Crant, J. M. (1995). The Proactive Personality Scale and objective job performance among
real estate agents. Journal of Applied Psychology, 80(4), 532–537.
9. Dubey, R., Singh, T. and Gupta, O. K. (2015) ‘Impact of Agility, Adaptability and
Alignment on Humanitarian Logistics Performance: Mediating Effect of Leadership’,
Global Business Review, 16(5), pp. 812–831.
10. Fletcher, D. & Sarkar, M. (2013). Psychological resilience: A review and critique of
definitions, concepts and theory. European Psychologist, 18(1), 12-23.
11. Gunasekaran, A. y Yusuf, Y.Y. (2002), “Agile manufacturing: a taxonomy of strategic and
technological imperatives”, International Journal of Production Research, Vol. 40 No. 6,
pp. 1357-1385
12. Gunasekaran, A. 1999. Agile manufacturing: a framework for research and development.
International Journal of Production Economics, 62(1–2): 87–105.
13. Jaiswal, Neeraj Kumar, and Rajib Lochan Dhar. (2015) “Transformational Leadership,
Innovation Climate, Creative Self-Efficacy and Employee Creativity: A Multilevel
Study.” International Journal of Hospitality Management, 51, pp. 30–41,
14. Janssen, O. (2004). How Fairness Perceptions make innovative behaviour more or less
stressful, ‘Journal of Organizational Behaviour’, 25, 201-215.
15. Jaiswal, Neeraj Kumar, and Rajib Lochan Dhar. (2015) “Transformational Leadership,
Innovation Climate, Creative Self-Efficacy and Employee Creativity: A Multilevel
Study.” International Journal of Hospitality Management’, 51, pp. 30–41,
16. Jong, J. D., & Hartog, D. D. (2010). Measuring Innovative Work Behaviour. Creativity and
Innovation Management, 19(1), pp. 23–36
17. Kanter, R. (1988). When a thousand flowers bloom: Structural, collective and social
conditions for innovation in organizations. Research in Organizational Behaviour, 10, pp.
169-211.
18. Morrison EW, Milliken FJ. 2000. Organizational silence: a barrier to change and
development in a pluralistic world. Acad. Manag. Rev. 25:706–25
19. Nguyen, Q., Kuntz, J. R. C., Näswall, K., & Malinen, S. (2016). Employee resilience and
leadership styles: The moderating role of proactive personality and optimism. New Zealand
Journal of Psychology, 45(2), 13–21.
58th International Scientific Conference on Economic and Social Development – Budapest, 04-05 September, 2020
212
20. NARASIMHALU, Arcot Desai. Agile Innovation Management. (2011). Research
Collection School of Information Systems.
21. Parker, S. K., & Collins, C. G. (2010). Taking stock: Integrating and differentiating multiple
proactive behaviours. Journal of Management, 36(3), pp. 633-662.
22. Rank, J., Pace, V. L., & Frese, M. (2004). Three avenues for future research on creativity,
innovation, and initiative. Applied Psychology: An International Review, 53, pp. 518-528.
23. Pitafi, A., Liu, H. and Cai, Z., 2018. Investigating the relationship between workplace
conflict and employee agility: The role of enterprise social media. Telematics and
Informatics, 35(8), pp.2157-2172
24. Rajan, P. V., Solairajan, A. S., & Jose, C. G. (2012). Agile Product Development in
Submersible Pump through CAD Modelling (CFD). International Journal of Emerging
Technology and Advanced Engineering, 2(11), 397-400.
25. Rawashdeh, L, & dory, T. (2020, August). ALIGNED EMPLOYEE VOICE AND
MANAGER VOICE AFFECTING INNOVATION WORK BEHAVIOUR 57th
International Scientific Conference on Economic and Social Development, 20–35.
26. Scott, S.G. and Bruce, R.A. (1994), “Determinants of innovative behaviour: a path model
of individual innovation in the workplace”, The Academy of Management Journal, 37 (3),
pp. 580-607.
27. Sharifi, H. y Zhang, Z. (2001). Agile manufacturing in practice: application of
methodology. International Journal of Operations and Production Management, 21(5‐6),
772‐794.)
28. SHAFER, R.; DYER, L.; KILTY, J.; AMOS, J.; ERICKSEN,J. (2001): “Crafting a Human
Resource Strategy to Foster Organizational Agility: A Case Study”,Human Resource
Management, 3(40), pp.197-211.
29. Winby, S., & Worley, C. (2014). Management processes for agility, speed, and innovation.
Organizational Dynamics, 43, 225-234.
58th International Scientific Conference on Economic and Social Development – Budapest, 04-05 September, 2020
213
NATURE OF CONNECTION BETWEEN EMOTIONAL
INTELLIGENCE AND ORGANIZATIONAL LEARNING
Adrienn Cseresznyes
Széchenyi István University, Doctoral School of Business Administration, Hungary
ABSTRACT
The purpose of this paper is to explain the nature of the connection between emotional
intelligence and organizational learning. After examining the academic researches in the field
of organizational management and leadership, I’ve found that learning organization models
have several keypoints referring to subscales of emotional intelligence models. In this
conceptual paper, I describe the common detected interface of emotional intelligence and
learning organization models. I draw a parallel between the models by examining the
hypothesis about the positive correlation between them. I assume that The higher proportion of
employees with high emotional intelligence, the easier it is for the organization to reach the
phase of “learning organization. This study is the theoretical background, which helps to
identify the proper models and surveys for future data gathering.
Keywords: Connection, Emotional intelligence, Organizational learning
1. INTRODUCTION
Organizational effectiveness has become an important research subject in organizational
management. Looking at the recent studies, it is observed that effectiveness is one core
competence of an organization; people need to be more creative and have to manage huge
amounts of information. This information has to be transformed in a way that supports the
learning process of the organization. Learning has become a crucial component of
organizations. At the same time, employees need to work together more effectively and drive
innovation; otherwise, the organization easily lags behind in the market. The life of the
organization is determined by the manners of its members and the quality of its relationships.
The organization does not have emotions, but employees being part of the organization express
emotions during their life in the workplace. People working in an organization have different
sets of goals. In pursuing such goals, they show different behaviors from attractive to
ambiguous, like manipulating others. The emotionally intelligent organization invests in the
development of people and understands that how well it uses its employees it leads to
developing core competencies. Emotional intelligence is well-grounded as a crucial element to
individual and team performance. Landy (1983) stated that 80% of actions in an organization
involve some collaboration; however, establishing EI within teams will not necessarily lead to
an EI organization. Learning organization theory and emotional intelligence models has a lot
in common, without learning, organization repeat old practices and produce short-lived
improvements. To able to reach being a learning organization, companies need creative
employees with high inner motivation, openness and willingness to learn and develop
themselves. Emotional Intelligence is not developed through knowledge but experience.
Gardner (2013) states that learning from past experiences is one point that transforms
companies into a learning organization. The fundamental learning units in an organization are
working teams (people who need one another to produce an outcome); this is the “core learning
capabilities” of teams (Senge,1990). When there is no inner drive for development -in the
absence of learning, companies, and individuals simply repeat old practices, and improvements
are short-lived (Garvin, 2013). Developing employees emotional intelligence leads to a higher
level of learning in organizations.
58th International Scientific Conference on Economic and Social Development – Budapest, 04-05 September, 2020
214
2. THEORETICAL BACKGROUND
2.1. Emotional Intelligence Theory
Thorndike (1920) recognized that intellectual capacity only is insufficient to explain human
competences and behavior. He was the first researcher who used the term ’social intelligence’,
which concerned the ability to understand and manage people and to behave carefully in human
relations. The first model of intelligence concentrated on the adaptive use of cognition. Gardner
(1983) introduced the concept of intrapersonal and interpersonal intelligence, which gave the
foundation for later models of emotional intelligence. The models of emotional intelligence
have been categorized into three models known as (1) ability model, (2) mixed model, and (3)
trait model as different researchers defined EI differently. Salovey and Mayer (1990) created
the first model of „emotional intelligence.” It concentrates on emotional skills that can be
developed through learning and experience (Lopés 2003); they theorized that emotional
intelligence consists of three categories of abilities: appraisal and expression of emotions,
regulation of emotion, and the utilization of emotions (Schutte et al. 1998). Appraisal and
expression of emotions have two components: non-verbal perception and empathy. Regulation
of emotion can be divided into two components: the regulation of emotions in the self and
others. The utilization of emotions includes flexible planning, creative thinking, redirected
attention, and motivation. Goleman (2000) published his book „Emotional Intelligence at
Workplace”; according to his findings, there is four main domain of EI in his model: self-
awareness, self-management, social awareness, and relationship management. In self-
management, four main subcategories are distinguished: emotional self-control, accurate self-
assessment, and self-confidence. Social awareness has three components: empathy,
organizational awareness, and service orientation. Relationship management has nine
components: influence, leading others, developing others, communication, conflict
management, visionary leadership, catalyzing change, building bonds, and teamwork and
collaboration. Goleman (1995) declared that EI increased with age and linked to maturity, and
it could be developed through practice and training. While Salovey and Mayer (2003)
approached the theory from the psychological point of view, Goleman was the first who created
a connection with leadership, and still, his researches are the most relevant in this field. The
ability model of EI was proposed by Mayer and Salovey (1997). The model determines EI as a
set of abilities at the interface of emotion and cognition (Lopes 2016). They revised their first
model of EI and gave more priority to the cognitive components. The new model consists of
four branches of emotional intelligence: perceive emotions, use of emotions, manage emotions,
and understand emotions. Each of the four domains was theorized to have multiple subskills
(Waterhouse 2006). Mayer and Salovey (1999) created the Multifactor Emotional Intelligence
Scale (MEIS), which included the factors mentioned above and a general total EI score. Mayer
and Salovey later improved on their existing measurement and created MSCEIT (Mayer-
Salovey-Caruso Emotional Intelligence Test). They considered EI as the following
characteristics:
1. the ability to understand and integrate emotions with cognitions
2. the ability to be able to manage such emotions
3. the ability to appropriately control and regulate emotions
4. the ability to recognize, understand and empathize with the emotions of others
5. the ability to manage relationships
This model, compared with Goleman’s model, is the more psychological approach to emotional
intelligence. It is a reasonable basis for future academic researches and more suitable for
quantitative analysis, while the Goleman model is more assimilate to business practices.
According to Stein and Book (2000), individuals who are emotionally intelligent can naturally
understand what others want and need; they are aware of their strengths and weaknesses; can
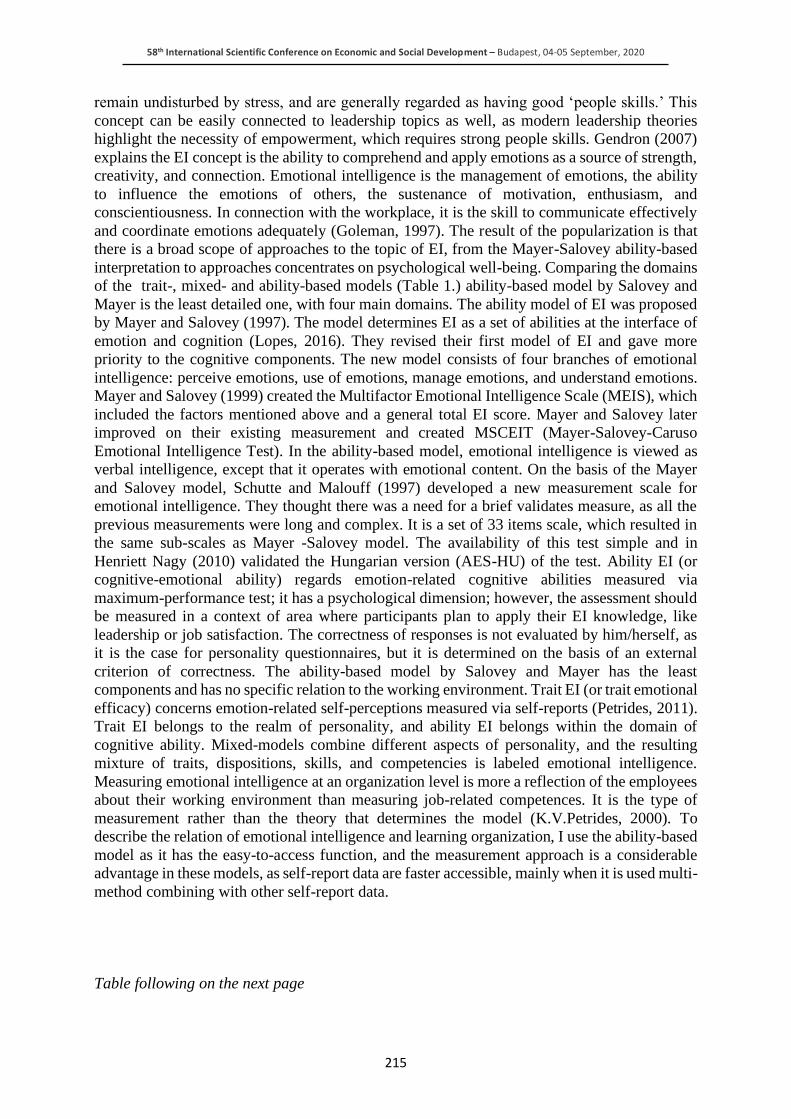
58th International Scientific Conference on Economic and Social Development – Budapest, 04-05 September, 2020
215
remain undisturbed by stress, and are generally regarded as having good ‘people skills.’ This
concept can be easily connected to leadership topics as well, as modern leadership theories
highlight the necessity of empowerment, which requires strong people skills. Gendron (2007)
explains the EI concept is the ability to comprehend and apply emotions as a source of strength,
creativity, and connection. Emotional intelligence is the management of emotions, the ability
to influence the emotions of others, the sustenance of motivation, enthusiasm, and
conscientiousness. In connection with the workplace, it is the skill to communicate effectively
and coordinate emotions adequately (Goleman, 1997). The result of the popularization is that
there is a broad scope of approaches to the topic of EI, from the Mayer-Salovey ability-based
interpretation to approaches concentrates on psychological well-being. Comparing the domains
of the trait-, mixed- and ability-based models (Table 1.) ability-based model by Salovey and
Mayer is the least detailed one, with four main domains. The ability model of EI was proposed
by Mayer and Salovey (1997). The model determines EI as a set of abilities at the interface of
emotion and cognition (Lopes, 2016). They revised their first model of EI and gave more
priority to the cognitive components. The new model consists of four branches of emotional
intelligence: perceive emotions, use of emotions, manage emotions, and understand emotions.
Mayer and Salovey (1999) created the Multifactor Emotional Intelligence Scale (MEIS), which
included the factors mentioned above and a general total EI score. Mayer and Salovey later
improved on their existing measurement and created MSCEIT (Mayer-Salovey-Caruso
Emotional Intelligence Test). In the ability-based model, emotional intelligence is viewed as
verbal intelligence, except that it operates with emotional content. On the basis of the Mayer
and Salovey model, Schutte and Malouff (1997) developed a new measurement scale for
emotional intelligence. They thought there was a need for a brief validates measure, as all the
previous measurements were long and complex. It is a set of 33 items scale, which resulted in
the same sub-scales as Mayer -Salovey model. The availability of this test simple and in
Henriett Nagy (2010) validated the Hungarian version (AES-HU) of the test. Ability EI (or
cognitive-emotional ability) regards emotion-related cognitive abilities measured via
maximum-performance test; it has a psychological dimension; however, the assessment should
be measured in a context of area where participants plan to apply their EI knowledge, like
leadership or job satisfaction. The correctness of responses is not evaluated by him/herself, as
it is the case for personality questionnaires, but it is determined on the basis of an external
criterion of correctness. The ability-based model by Salovey and Mayer has the least
components and has no specific relation to the working environment. Trait EI (or trait emotional
efficacy) concerns emotion-related self-perceptions measured via self-reports (Petrides, 2011).
Trait EI belongs to the realm of personality, and ability EI belongs within the domain of
cognitive ability. Mixed-models combine different aspects of personality, and the resulting
mixture of traits, dispositions, skills, and competencies is labeled emotional intelligence.
Measuring emotional intelligence at an organization level is more a reflection of the employees
about their working environment than measuring job-related competences. It is the type of
measurement rather than the theory that determines the model (K.V.Petrides, 2000). To
describe the relation of emotional intelligence and learning organization, I use the ability-based
model as it has the easy-to-access function, and the measurement approach is a considerable
advantage in these models, as self-report data are faster accessible, mainly when it is used multi-
method combining with other self-report data.
Table following on the next page
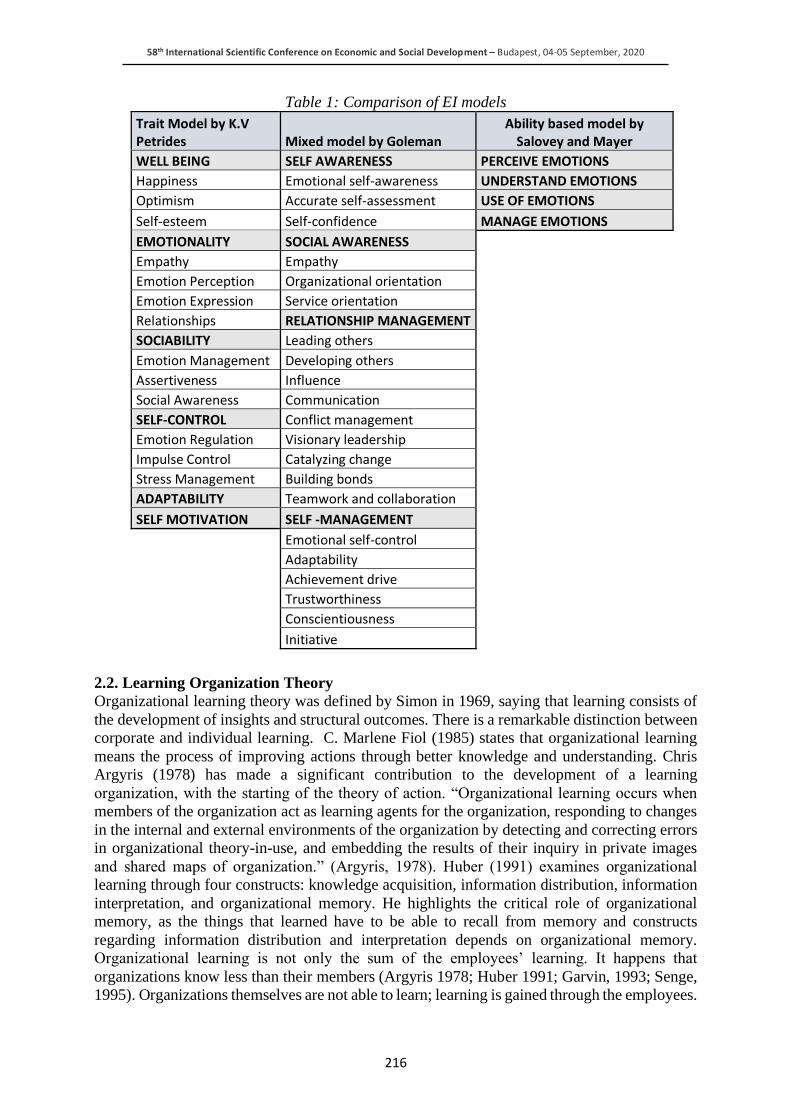
58th International Scientific Conference on Economic and Social Development – Budapest, 04-05 September, 2020
216
Table 1: Comparison of EI models
2.2. Learning Organization Theory
Organizational learning theory was defined by Simon in 1969, saying that learning consists of
the development of insights and structural outcomes. There is a remarkable distinction between
corporate and individual learning. C. Marlene Fiol (1985) states that organizational learning
means the process of improving actions through better knowledge and understanding. Chris
Argyris (1978) has made a significant contribution to the development of a learning
organization, with the starting of the theory of action. “Organizational learning occurs when
members of the organization act as learning agents for the organization, responding to changes
in the internal and external environments of the organization by detecting and correcting errors
in organizational theory-in-use, and embedding the results of their inquiry in private images
and shared maps of organization.” (Argyris, 1978). Huber (1991) examines organizational
learning through four constructs: knowledge acquisition, information distribution, information
interpretation, and organizational memory. He highlights the critical role of organizational
memory, as the things that learned have to be able to recall from memory and constructs
regarding information distribution and interpretation depends on organizational memory.
Organizational learning is not only the sum of the employees’ learning. It happens that
organizations know less than their members (Argyris 1978; Huber 1991; Garvin, 1993; Senge,
1995). Organizations themselves are not able to learn; learning is gained through the employees.
Trait Model by K.V Petrides Mixed model by Goleman
Ability based model by Salovey and Mayer
WELL BEING SELF AWARENESS PERCEIVE EMOTIONS
Happiness Emotional self-awareness UNDERSTAND EMOTIONS
Optimism Accurate self-assessment USE OF EMOTIONS
Self-esteem Self-confidence MANAGE EMOTIONS
EMOTIONALITY SOCIAL AWARENESS Empathy Empathy Emotion Perception Organizational orientation Emotion Expression Service orientation Relationships RELATIONSHIP MANAGEMENT SOCIABILITY Leading others Emotion Management Developing others Assertiveness Influence Social Awareness Communication SELF-CONTROL Conflict management Emotion Regulation Visionary leadership Impulse Control Catalyzing change Stress Management Building bonds ADAPTABILITY Teamwork and collaboration SELF MOTIVATION SELF -MANAGEMENT
Emotional self-control
Adaptability
Achievement drive
Trustworthiness
Conscientiousness
Initiative
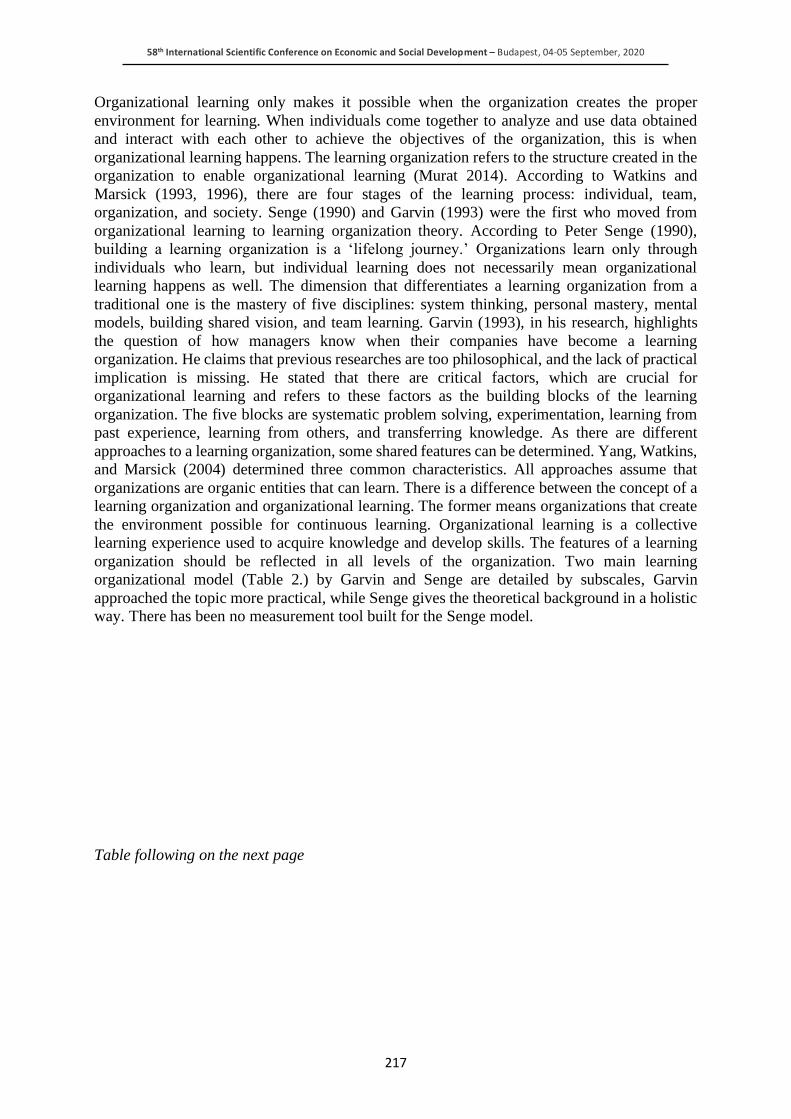
58th International Scientific Conference on Economic and Social Development – Budapest, 04-05 September, 2020
217
Organizational learning only makes it possible when the organization creates the proper
environment for learning. When individuals come together to analyze and use data obtained
and interact with each other to achieve the objectives of the organization, this is when
organizational learning happens. The learning organization refers to the structure created in the
organization to enable organizational learning (Murat 2014). According to Watkins and
Marsick (1993, 1996), there are four stages of the learning process: individual, team,
organization, and society. Senge (1990) and Garvin (1993) were the first who moved from
organizational learning to learning organization theory. According to Peter Senge (1990),
building a learning organization is a ‘lifelong journey.’ Organizations learn only through
individuals who learn, but individual learning does not necessarily mean organizational
learning happens as well. The dimension that differentiates a learning organization from a
traditional one is the mastery of five disciplines: system thinking, personal mastery, mental
models, building shared vision, and team learning. Garvin (1993), in his research, highlights
the question of how managers know when their companies have become a learning
organization. He claims that previous researches are too philosophical, and the lack of practical
implication is missing. He stated that there are critical factors, which are crucial for
organizational learning and refers to these factors as the building blocks of the learning
organization. The five blocks are systematic problem solving, experimentation, learning from
past experience, learning from others, and transferring knowledge. As there are different
approaches to a learning organization, some shared features can be determined. Yang, Watkins,
and Marsick (2004) determined three common characteristics. All approaches assume that
organizations are organic entities that can learn. There is a difference between the concept of a
learning organization and organizational learning. The former means organizations that create
the environment possible for continuous learning. Organizational learning is a collective
learning experience used to acquire knowledge and develop skills. The features of a learning
organization should be reflected in all levels of the organization. Two main learning
organizational model (Table 2.) by Garvin and Senge are detailed by subscales, Garvin
approached the topic more practical, while Senge gives the theoretical background in a holistic
way. There has been no measurement tool built for the Senge model.
Table following on the next page
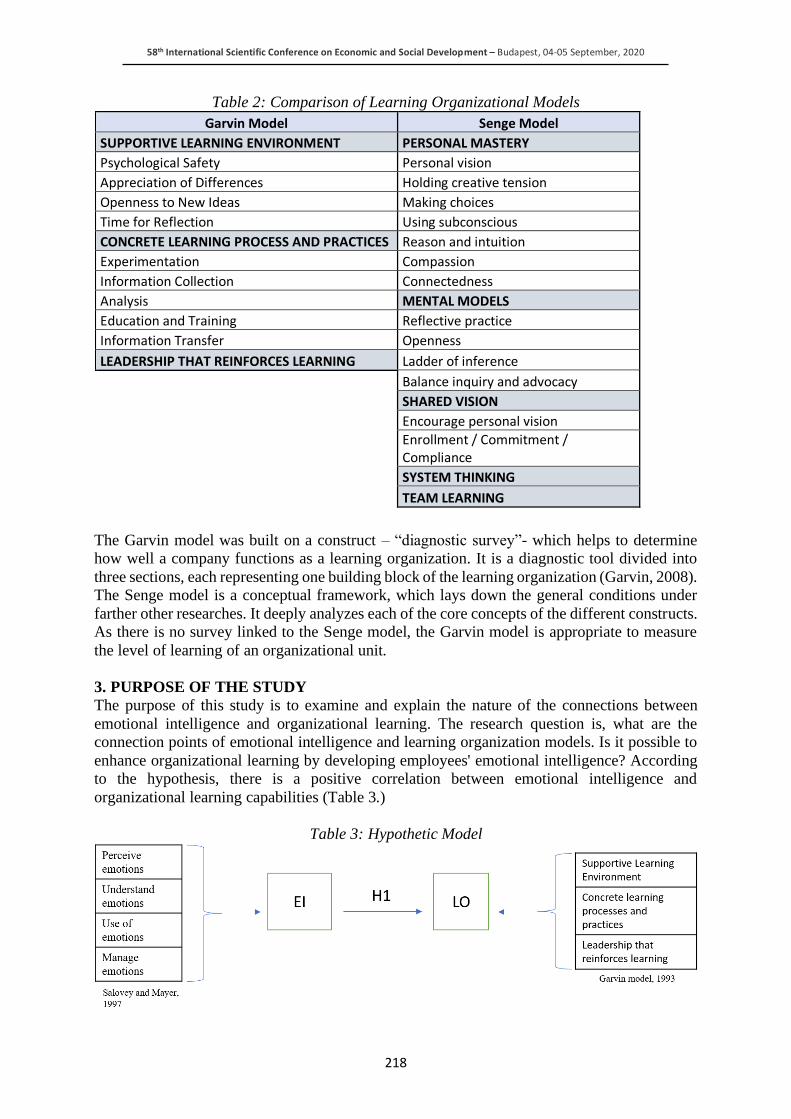
58th International Scientific Conference on Economic and Social Development – Budapest, 04-05 September, 2020
218
Table 2: Comparison of Learning Organizational Models
The Garvin model was built on a construct – “diagnostic survey”- which helps to determine
how well a company functions as a learning organization. It is a diagnostic tool divided into
three sections, each representing one building block of the learning organization (Garvin, 2008).
The Senge model is a conceptual framework, which lays down the general conditions under
farther other researches. It deeply analyzes each of the core concepts of the different constructs.
As there is no survey linked to the Senge model, the Garvin model is appropriate to measure
the level of learning of an organizational unit.
3. PURPOSE OF THE STUDY
The purpose of this study is to examine and explain the nature of the connections between
emotional intelligence and organizational learning. The research question is, what are the
connection points of emotional intelligence and learning organization models. Is it possible to
enhance organizational learning by developing employees' emotional intelligence? According
to the hypothesis, there is a positive correlation between emotional intelligence and
organizational learning capabilities (Table 3.)
Table 3: Hypothetic Model
Garvin Model Senge Model
SUPPORTIVE LEARNING ENVIRONMENT PERSONAL MASTERY
Psychological Safety Personal vision
Appreciation of Differences Holding creative tension
Openness to New Ideas Making choices
Time for Reflection Using subconscious
CONCRETE LEARNING PROCESS AND PRACTICES Reason and intuition
Experimentation Compassion
Information Collection Connectedness
Analysis MENTAL MODELS
Education and Training Reflective practice
Information Transfer Openness
LEADERSHIP THAT REINFORCES LEARNING Ladder of inference
Balance inquiry and advocacy
SHARED VISION
Encourage personal vision
Enrollment / Commitment / Compliance
SYSTEM THINKING
TEAM LEARNING
58th International Scientific Conference on Economic and Social Development – Budapest, 04-05 September, 2020
219
According to hypothesis 1, employees' emotional intelligence has a positive correlation to the
level of learning in organizations. The higher proportion of employees with high emotional
intelligence, the easier it is for the organization to reach the phase of “learning organization.”
One main activity of learning organizations is systematic problem-solving. It's not easy to
establish the necessary mindset; employees must become more disciplined in their thinkings
(Garvin,1993). In the ability model of emotional intelligence, the use of emotions for problem-
solving is a crucial element of the whole EI score. If an employee can make use of his good
mood, he will come to new ideas or conclusions much easier than those who are easily
captivated by bad mood. (Nagy, 2010). Learning from others and experience is also a
cornerstone of the learning organization, which requires a certain extent of reflection.
According to Garvin, managers must be open to criticism and can’t be defensive. Learning
organizations cultivate the art of open, attentive listening. (Garvin 1993). Organization learning
is a process of detecting and correcting the error. When the process enables the organization to
continue its current policies, it is called single-loop learning. When employees began to
question these underlying organizational policies, it is called double-loop learning (Argyris,
1977). It is complicated from the employee behavior side; not everybody is ready to question
some well-used” norms. They risk getting in trouble, but in the long run, double-loop learning
is what really takes the company forward. People with higher emotional intelligence are more
initiative and self-reflective. They have an inner drive for development and ready to take actions
without strong external pressure; they open for feedback and learn from past mistakes
(Boyatzis, 1999). For appropriate learning, knowledge must spread fast and effective through
the organization. Ideas have to be shared broadly rather than held to be successful.
Organizations have several information transfer solutions, but absorbing facts by reading or
seeing them demonstrated is not as effective as experiencing them personally (Garvin, 1998).
Self-management is one major part of emotional intelligence, which includes- among others -
achievement drive and initiative. These components of EI may drive employees more proactive
in terms of seeking new knowledge and solutions. The leadership component is highlighted in
all LO and EI models. Building emotional intelligence in an organization starts with leadership.
As stated in learning organization studies: leadership is that reinforce learning within the
organization. The first step is that managers need to provide a proper environment and
necessary time for employees. Once this supportive and open environment is established,
managers can facilitate learning units with explicit learning goals (Garvin, 1993). Chris Argyris
(1977) mentions the “dilemmas of power,” which represent important issues for leaders.
According to the six points, managers have to be strong, but at the same time, admit the
existence of dilemmas, they have to behave openly, but yet not controlling. How to be an
advocate but still encourage confrontation of their views. Managers have to find a way how to
respond effectively to employees' doubts in spite of their own. They need to learn how to
manage fear and yet ask employees to overcome their fears and become more open. They need
to understand how to explore the fear of understanding gear. Finally, they need to learn how to
gain credibility for attempts to change leadership style when they are not comfortable with such
style. For all these difficulties, the answer can be found in the development of the emotional
intelligence of the leaders. One main cluster of emotional intelligence is relationship
management. Developing others involves sensing people’s developmental needs and bolstering
their abilities. The most effective managers sense other’s reactions and are able to adjust their
own responses to move communication in the best direction. People with high EQ are good
communicators, listen well, and welcome sharing information fully, foster open
communication, and stay receptive to bad news as well as good. They have developed conflict
management competence; they can handle difficult people and situations with diplomacy,
encourage debate, and open discussion (Goleman, 2010.).
58th International Scientific Conference on Economic and Social Development – Budapest, 04-05 September, 2020
220
According to Peter Senge (1990), shared vision is one of the necessary blocks to build a learning
organization. A shared vision is not an idea; it is rather a force in people’s hearts, a force of
impressive power. It is a vision that many people are truly committed to because it reflects their
own personal vision. Visionary leadership is also a subscale of emotional intelligence. Those
who adept visionary leadership competence, they are able to articulate and arouse enthusiasm
for a shared vision and mission, to step forward as needed, to guide the performance of others
while holding them accountable and to lead by example (Goleman, 1999). According to the
emotional intelligence model, we can find the crucial elements of EI among the requirements
of becoming a learning organization.
4. METHOD
For theoretical research, I used local and international literature in the field of knowledge
management and organizational management. The academic articles were gathered from
ScienceDirect, Scopus, and Elsevier. After collecting the different models for emotional
intelligence and organizational learning, I gathered the key points for each subcategory of the
model to find the common interface of the two topics.
5. FUTURE RESEARCH
According to the plans, I intend to demonstrate the hypothesis with statistical analysis, with a
mixed method of survey and interview. For measuring emotional intelligence AES-HU survey
will be used, because this is an ability model-based self-report test, easily accessible and brief.
For measuring the level of organizational learning, I’m going to use “The Learning
Organization Survey” developed by Garvin (2008). As I mentioned in Chapter 2, this is the
only valid survey, which is practical and brief. I plan to choose employees of a Hungarian based
multinational retail company. After gathering primer data with survey and interview, I plan to
examine the employee's emotional intelligence level and investigate the nature of the
connection with the level of learning in the organization after I will be able to prove the
hypothesis and draw further conclusions.
6.CONCLUSION
After a relevant literature review, I found that organizational effectiveness has become an
important research subject. The emotionally intelligent organization invests in the development
of people and understands that how well it uses its employees it leads to developing core
competencies. Organizations themselves are not able to learn; learning is gained through the
employees. Organizational learning only makes it possible when the organization creates the
proper environment for learning. The aim of the paper was to examine the nature of the
connection between emotional intelligence and organizational learning. There is a common
interface found in a way that the organizational learning model refers to certain subscales of the
emotional intelligence model. Two measures were found to start to gather primary data. Among
the emotional intelligence measures, I chose AES-HU, a validated 33-item scale self- report
test. For measuring organizational learning, I chose Learning Organization Survey by Garvin.
To prove the hypothesis 1 statistically, future research is necessary by obtaining primary data.
LITERATURE:
1. Antonakis, J., Ashkanasy, N. M., & Dasborough, M. T. (2009). Does leadership need
emotional intelligence? The Leadership Quarterly, 20(2), 247-261.
2. Argyris, Chris (1977) Double Loop Learning in Organizations - Harvard Business Review
Double Loop Learning in Organizations - Harvard Business Review How Organizations
Survive,” no. 77502: 1–9.
58th International Scientific Conference on Economic and Social Development – Budapest, 04-05 September, 2020
221
3. Argyris, Chris, and Donald A. Schon.( 1978) Organizational learning: a theory of action
perspective. Reading, Mass: Addison-Wesley Publishing Company.
4. Ashkanasy, N. M., & Daus, C. S. (2005). Rumors of the death of emotional intelligence in
organizational behavior are vastly exaggerated. Journal of Organizational Behavior, 26(4),
441-452
5. Boyatzis, Richard. (2011). Managerial and Leadership Competencies A Behavioral
Approach to Emotional, Social and Cognitive Intelligence. Vision: The Journal of Business
Perspective. 15. 91-100.
6. Brackett M., A., Mayer J., D., (2003). Convergent, discriminant, and incremental validity
of competing measures of emotional intelligence. Pers Soc Psychol Bull. 2003
Sep;29(9):1147-58
7. Cherniss, Cary, and Daniel Goleman. The Emotionally Intelligent Workplace: How to
Select For, Measure, and Improve Emotional Intelligence in Individuals, Groups, and
Organizations. San Francisco: Jossey-Bass, 2001. Print
8. David R. Caruso,John D. Mayer &Peter Salovey (2002). Relation of an Ability Measure of
Emotional Intelligence to Personality. Journal of Personality Assessment. Vol. 79 Issue: 2.
pp.306-320.
9. Fiol, C. Marlene, and Marjorie A. Lyles. (1985) Organizational Learning. The Academy of
Management Review 10, no. 4 (1985): 803-13.
10. Garvin, D.A. (1993) Building a Learning Organization.Harvard Business Review, 71, 78-
91.
11. Garvin, David & Edmondson, Amy & Gino, Francesca. (2008). Is Yours a Learning
Organization?. Harvard business review. 86. 109-16, 134.
12. Goh, Swee. 1998. Toward a Learning Organization: The Strategic Building Blocks.SAM
Advanced Management Journal 63 (2): 15.
13. Huber, G. P. (1991) Organizational Learning: The Contributing Processes and the
Literatures. Organization Science, 2(1), 88–115.
14. Lopes, P. N., Salovey, P., & Straus R., (2003). Emotional intelligence, personality and
perceived quality of social relationships. Personality and Individual Differences, 35, 641-
658.
15. Lopes, P. N. (2016). Emotional Intelligence in Organizations: Bridging Research and
Practice. Emotion Review, 8(4), 316–321.
16. Nagy Henriett (2012). Az érzelmek mérése skála (AES-HU) faktorszerkezetének és
validitásának elemzése. Magyar Pszichológiai Szemle, 2012, 67.3.431-447
17. Mayer, J. D., Caruso, D. R., & Salovey, P. (1999). Emotional intelligence meets traditional
standards for an intelligence. Intelligence, 27(4), 267-298.
18. Senge, P. M. (1990). The fifth discipline: The art and practice of the learning organization.
New York: Doubleday/Currency.
19. Yang, B., Watkins, K. E., & Marsick, V. J. (2004) The Construct of the Learning
Organization: Dimensions, Measurement, and Validation. Human Resource Development
Quarterly, 204.Vol.15, 1, 31-55
58th International Scientific Conference on Economic and Social Development – Budapest, 04-05 September, 2020
222
DIVERSITY IN BUSINESS WITH THE INTEGRATION OF LABOUR
MIGRANTS
Pal Bite
Szechenyi Istvan University, Hungary
Marta Konzosne Szombathelyi
Szechenyi Istvan University, Hungary
Krisztina Galos
Szechenyi Istvan University, Hungary
ABSTRACT
Several empirical findings as well as theoretical constructs support the fact that “diversity
makes business sense”. Researches about the potential contribution of culturally diverse
employees suggest that companies cannot and should not swim against the tide, when it comes
to labour migration and foreigner employees. The integration or inclision of labour migrants,
or with other words, making them trustful, satisfied, committed and retaining them is a difficult
task and constantly actual research area. This paper aims to contribute to this knowledge and
provides practical implications about the integration of labour migrants. The authors present
some integration-oriented models in the field of cross-cultural management. Our goal was to
test these theories in the practice by qualitative, in-depth interviews. The method we used was
an own-developed questionnaire in order to reveal the interviewees’ own perception of
integration or “inclusion”, through their unique cultural lens. Each question indirectly asks on
a cited integration theory. Based on the analysis of the responses, we drew up conclusions and
present the theories’ connection with each other if occur. The results are contextualized in the
interviewees’ cultural mind-sets. The used theories provide practical insights into the attributes
and elements of integration through the eyes of employees, who are from diverse cultural
background.
Keywords: Labour mingrant, integration, diversity in business, in-depth interview
1. INTRODUCTION
The question whether labour migration is a beneficial phenomenon on the global and national
scale is not doubted anymore. Another known fact is, that it bears challenges concerning their
integration within an organization. The difficulties originate from the diverse backgrounds of
labour migrant employees. Although as researchers investigated diversity and its consequences
in detail, they found and supported many times the fact that diversity indeed has enormous
potential to improve organizational performance through greater efficiency, enhanced work
processes and further merits as well (Gonzalez et al, 2009). Several concepts have been
developed along the investigation of ways and issues of integrating diverse individuals (Thomas
et al, 1996), yet there are several gaps in our knowledge in this field. As highlighted by literature
reviewers (Shore et al, 2011), theoretical background of integration is extremely affluent long
since, however, practical insights fall short. To address this problem, we gathered some well-
established theoretical concepts in this paper and investigated them in practice. Offering an
exclusive overview of diversity and integration literature would be impossible and it is not the
aim of this paper. This paper filles gaps in the general academic knowledge by empirical
examinations and discoveries. Although, as later explained, this paper also contributes to the
theoretical base.
58th International Scientific Conference on Economic and Social Development – Budapest, 04-05 September, 2020
223
2. THEORETICAL BACKGROUND
Earlier, researchers approached diversity as a problem to cope with. Cope with bias,
discrimination, exclusiveness and other negative phenomenon. Although as globalization
evolved and labour migration has intensified, diversity was realized rather as an opportunity to
exploit. Since the early 90’s (Cox, 1991; Thomas et al, 1996), scholars have been discovering
and analyzing means for integration. The theoretical development of the field is quite abundant
to cover it by one paper comprehensively; the framework we applied for the present study is
inclusive workplace and inclusiveness (Mor Barak, 2000; Shore et al, 2011). The concept of
inclusion was initially developed by Mor Barak in the millennial. He had encountered
employees with diverse characteristics (gender, skin color, culture, racial minorities etc.) who
felt “excluded” from organizational culture or expected to assimilate to it (Berry et al, 1988;
Mor Barak, 2015). As he puts, diversity may take many forms, categorizing them will not help
to manage it, but investigating its manifestations and consequences will do. The outcomes can
occur at numerous levels, in this study we reflected to the individuals’ perception of their own
inclusiveness into their working community. To gain a detailed picture of their emotions, we
grounded our questionnaire by several, more or less, distinct models those were focusing on the
experience and feelings of diverse people within working groups. Consequently, our concept is
based on two fundamental pillars: diversity and inclusion. Diversity used to be grasped
culturally. However, as sociology evolved, this perspective turned out to be extremely short
sighting. Diversity is a summarizing term for differences in individual characteristics that might
be racial, ethnic, physical, socioeconomic, gender identity, personality, genetic, etc. attributes.
The list is endless, the key is that these features are “irrespective of job-related skills and
qualifications” (Mor Barak, 2014). Nishi (2013) noted at this point that the relevant attributes
might not be observable or unambiguous (e. g. educational level and intelligence). Inclusion in
the community “…refers to the individual’s sense of being part of the organizational
system…(Mor Barak, 2014).” To synthesize and clarify the concepts, Shore et al (2011) warned
that belongingness and uniqueness have equal significance. She cited the façade of conformity
(Hewlin, 2009), that occur when someone suppresses his/her personal opinion or value and
adjust to the organizational or supervisory expectations. Apart from these theories, we
addressed further ones while conceptualizing and “grounding” our research. The need for such
research is underlined by numerous empirical and theoretical findings. First of all, each human
being has social needs to be satisfied (e. g. Maslow, 1943; Herzberg, 1968). Brewer (1999)
stated such psychological needs are insured within workplaces with inclusive climate, although
Nishii (2013) highlighted that empirical tests are still scarce. Psychologists also pondered the
results of inclusion (Firth-Cozens & Hardy 1992) and found hard evidence that inclusion indeed
preserves mental health for example, by reducing stress and procrastinate burnout (Shaufeli, et
al, 1996). Researchers, who entertained economic viewpoints, has also argued for proper
organizational climate because diversity is a pervasive feature that must be considered while
strategy making and should be regarded as an opportunity for both individuals and an
organization as a whole to learn and evolve (Chrobot-Mason et al, 2002). The benefits of
inclusiveness were more precisely analyzed and supported later. For instance, Acquivita et al
(2009) associated inclusion with job satisfaction. Cho and Mor Barak (2008) found evidence
that perception of inclusion is a predictor of job performance and commitment. Den Hartog et
al (2007) reported also strong correlation between performance and inclusiveness, emphasizing
how fair and equal treatment of employees facilitates trust and reciprocity among the members
of the group. On the other hand, insufficiently inclusive climate results in excessive costs for
the company, in terms of higher absenteeism, turnover (Harvey, 2012) and more frequent
conflicts (Herring, 2009). As we can see, inclusion is a definitely important and actual topic to
investigate, not even to mention the accelerating population movements around the globe. Some
specific research gap has been highlighted.
58th International Scientific Conference on Economic and Social Development – Budapest, 04-05 September, 2020
224
The existing literature should be enriched by various methodological approaches (Jacqueline et
al, 2007; Shore et al, 2011). They called for interviews first of all. Secondly, theories regarding
diversity and inclusion are overlapping, so addressing them jointly might produce a more
holistic understanding of the issue (Buttner et al, 2012).
3. ACTUALITY OF THE RESEARCH
The goal of the paper is to introduce some more thoroughly researched theoretical constructs
related to labour migrant diversity and integration literature and test them in practice. This effort
is quite actual because, according to statistics, migration has become more diverse in terms of
origin (Migration Data Portal). An increase has been indicated in the overall migratory balance
of Europe is positive and it remained the main destination area with its inflow of 3,1 million
migrants in 2018. This figure has been growing for the past 5 years (OECD). On the other hand,
Europe’s economically active population is forecasted to decline persistently, as expressed by
the old dependency ratio (Eurostat). Labour migration improves a country’s age structure,
boosts significantly labour mobility and offers new, innovative skills and abilities from the
perspective of the native working population at all times. Europe’s aging population, labour
shortage and the ongoing globalization make these contributions even more valuable. There
were more events since the millennium (EU enlargements, great financial crisis) those have
given new swings to labour migration. The most seriously affected ones are, both by emigration
and immigration, Central and Eastern Europe. The region is stricken with significant
asymmetric labour shocks: the highly-skilled, English-speaking generation is leaving, and there
is a massive migration to Eastern Europe form the Middle East and Asia (Bite et al, 2020).
Actuality is enhanced by the industrializing emerging countries, basically, in Asia. The insofar
nascent Asian markets conceal a range of new business opportunities, apart from the
accumulation of redistributable wealth of citizens. Conquering them requires to adapt to the
needs and expectations of people, who has completely different cultural and individual
characteristics as Europeans have. For revelation, various insights offered by migrant labourers
have to be utilized. A third relevant and rather timeless aspect is concerning organizational and
group performance in general. Researchers reported (Cho et al, 2008) that perception of
inclusion through successful integration leads to commitment, enhanced work performance and
lower turnover intentions (Nishii et al, 2009). We yet conclude it more actual now than before
because examinations of diversity greatly ignored Central and Eastern Europe as a geographic
area driven by the fact that it did not use to be such a popular destination as they are nowadays.
4. PROPOSITION
The objective of this research is to offer practical implications in association with the existing
theories regarding inclusive workplaces and cultural diversity. “Inclusive workplace is an
action-oriented model for integration (Mor Barak, 2015)”: We planned to complement this
model of Mor Barak by involving further theories related to integration and its circumstances.
It is important to note that we do not question any of the theories but accept as, referring to the
applied methodology, “ground” of our empirical investigation and resultant induction
procedure (Haig, 1995). In the next paragraphs the used theories are briefly introduced. A
community can be collectivistic or individualistic at distinct contexts and situations (Correll et
al, 2005; Pickett et al, 2001). Optimal distinctiveness theory (Brewer, 1991) concerns the
balance between feelings of uniqueness and belongingness. During the interview, whether “I”
or “we” occur more frequently, we can conclude that the community is more collectivistic
(prefers validation) or more individualistic (prefers uniqueness). The words interviewees use
informs us what they regard as problems, neutral statuses or preferential outcomes (Mor Barak,
2015). Thus, we can find out more about the nature of these elements, where are insufficiencies
or there if there is a satisfactory balance between the two desires, how employees interpret it.
58th International Scientific Conference on Economic and Social Development – Budapest, 04-05 September, 2020
225
Is inclusion a common goal or not? (Ramarajan, 2009). Sometimes to foster one’s own
inclusiveness, the person may withdraw his/her distinct opinion in order to adjust or assimilate
to the organizational values or to the common sense (façade of conformity: Hewlin, 2009). How
do employees feel about direct supervision? It is especially a crucial point for newcomers
whether they feel themselves less trusted or somehow positively, e. g. mentored through their
bosses’ personal attention and advisory (leadership-membership exchange, Nishii et al, 2009).
According to the similarity paradigms, people have higher propensity to agree and support
individuals who they feel themselves more similar in terms of race, skin color, education etc.
(similarity-attraction paradigm: Riordan, 2000). In this sense demographic similarities predict,
horribile dictum determine inclusiveness (Nishii, 2012). The most illustrative example is when
citizens from nations, those are historically enemies are less supportive toward each other
(France-Germany e. g.) However, younger generations are less likely to act upon such things,
then older ones. Another ground for similarity paradigms are gender identities (identity
characteristics, Nishii, 2012). As far as genders are concerned, especially a couple of decades
ago. many researchers developed theories about unequal treatment (Wagner, et al 1986.) or
tokenism (Chatman et al, 2004). The focus has been usually on how men should approach
women. Should they be polite, courteous at all fronts? Should they act differently around them?
It also depends on the interpretation of women, because such behavior might suggest that
women are held less capable or as someone, who requires special treatment and that is a sort of
bias in the sense. There are controversial arguments whether common knowledge or distinct
competences foster or hinder inclusiveness and integration (Ely et al, 2001). Commonalities
mean more shared grounds for conversations or activities, so there is more room for connections
to develop. Although differences can peak interests from counterparts, that can result in the
same outcome. It is important to note however, that soft items, such levels of extroversion and
openness are excluded from the described learning-effectiveness perspective of Ely and
Thomas (2001). As an amendment, some researchers suggested that invitation into
participation, team processes - those are related to individual abilities - mediate exclusion effect
(Mohammed & Angell, 2004). Usually, there are some “ranking” among colleagues in
workplaces, based on knowledge, seniority or other features (status characteristics theory and
evident status hierarchies, Berger, et al, 1972; Ridgeway et al, 2006; self-categorization, Shore,
2011). The ranking can stem from constructive differences, as some colleagues might perceive
each other as role models and in that case, employees are provided with extra motivation to
work harder and achieve esteem from co-workers. But stereotyping can lead to categorization
too. So the basis of such “order” determines whether inclusion is not hindered or it is. Larkey
(1996) put that unlike ranking, categorization always leads to conflict. Conflict resolution is
perceived as something that fosters inclusion and acceptance (Nishii, 2012). Although many
empirical evidences suggest the opposite, namely that norms for openness makes relationships
vicious (Jehn, 1995). Mutual trust is jeopardized by discussing problems above a certain extent
(Brewer, 1999), while ignorance can attenuate destructive intensity in relationships (Fiol, 2009;
Nishii, 2012). To what extent it disputes, both in term of topic and depth, should be discussed?
Try to resolve them or just move on casually? These theoretical constructs served as grounding
for our empirical analysis. Employees from various backgrounds, with various circumstances
have tremendously various perspective of the world. That consists culture, religion, political
orientation, habits, ritual, competences, relationships, attitude toward personal relationships or
perception of time and achievements. The unique personalities endow unique soft skills and
those are unique resources for the community they work in and for. It is inevitable to face the
challenge deriving from fluctuating and migrating labour force of present times. To live up to
it, first step is to map the current conditions and attitudes of workplace integration. It is our
purpose and to contribute to the comprehension of integration and inclusive workplaces (Shore
et al, 2011).
58th International Scientific Conference on Economic and Social Development – Budapest, 04-05 September, 2020
226
5. METHODOLOGY
Our proposed research method is qualitative, semi-structured in-depth interviewing with open-
ended questions and on the other hand, we applied grounded theory methodology. Grounded
theory is quite the opposite of traditional, hypothesis-driven methodologies. When formulating
hypothesizes, researchers choose a theoretical framework and collect data, that will either
confirm or reject the original belief. In contrast, grounded theory employs deductive reasoning.
It is triggered by an opened question (“what is going on” or “what is the problem?” etc.) or
collection of qualitative data. That is why grounded theory methodology is more suitable for
qualitative investigations because those offer some flexibility that is required in human sciences
(Strauss et al, 1997). As a start, data are broken down into “its elements”, which are compared.
During the process, new theories will emerge along the elements’ conceptualization. So briefly,
grounded theory is a systematic generation of theoretical frameworks based on existing theories
and knowledge, those were already empirically tested. With other words, hypothesizes are the
output of data collection or learning process and not the data is collected appointed by the
hypothesis in advance. A fundamental drawback of the later order is that having a hypothesis
seriously confines the range, scale of data collection and comprehension by “tube-kind”
thinking. The nascent theory we had in mind is built up or “grounded” by several authors’
works. Grounded theorists also have assumptions they can lean on, but those are regarded as
“how or why do they work” instead as “they are true or false”, where “they” refers to those
selected assumptions. There are two main reasons why we have chosen this approach.
According to its developers, grounded theory offers autonomy in generating concepts in
explaining human behavior (Glaser et al, 1967). It is useful when theorizing is proceeded by a
literature review, interviews and observations like in this paper (Ralph et al, 2014), when
distinct ideas are found. Another important thing is that, as mentioned, we intended to fill a
research gap in diversity literature by providing practical insights and researchers noted that
turning to qualitative investigation such as interviewing would be quite timely and useful. As
far as the interviewing is concerned, we applied a qualitative investigation, that is more
interpretative and subjective, so personal attendance is desirable (Denzin et al, 2011). This
scientific method focuses on personal meaning-makings of the environment. Personal
experiences, artifacts, life stories, believes, thoughts, feelings, expressions, imagination are in
focus (Deniz et al 2005; Wertz et al, 2011). After these information are highly subjective
matters, proper and scientific interpretation of them demands background knowledge from the
researcher (Given, 2008). Another argument for indispensable personal presence is that direct
observation, description of the interviewee’s unconscious, physical reactions is also a valid
source of primary data and because the interviewer controls the way of the conversation to
avoid misunderstanding or wondering to irrelevant matters during the event, that is a waste of
time and resource. Here comes the next crucial point, that is the length of the questionnaire and
interviews. An interview is always exhausting for both participants. In order to preserve
thoughtful, honest responding and patience from the subject, we developed a relatively short,
10-questions-long survey. Although we were eager to engage in distinct matters from the core
of the questions in the belief that semi-structured interviews trigger more reflection in the
participants on the circumstances of a particular situation. Additional meaning-makings might
serve with new traits for future studies. Briefly, we set up a relatively short questionnaire
questionnaire to allow more time and room for the interviewees’ unforeseeable input. There are
also disadvantages of qualitative research methods in general. As responses are unique, findings
can hardly be generalized or compared. Controversial research findings suggest that the
interviewer presence might lead to dishonesty provoked by unanimity, but that was not proven
in all cases. Personal interviews also bear geographic limitations too. But having those specifics
set correlates with a more precise sampling and clear inclusion criteria.
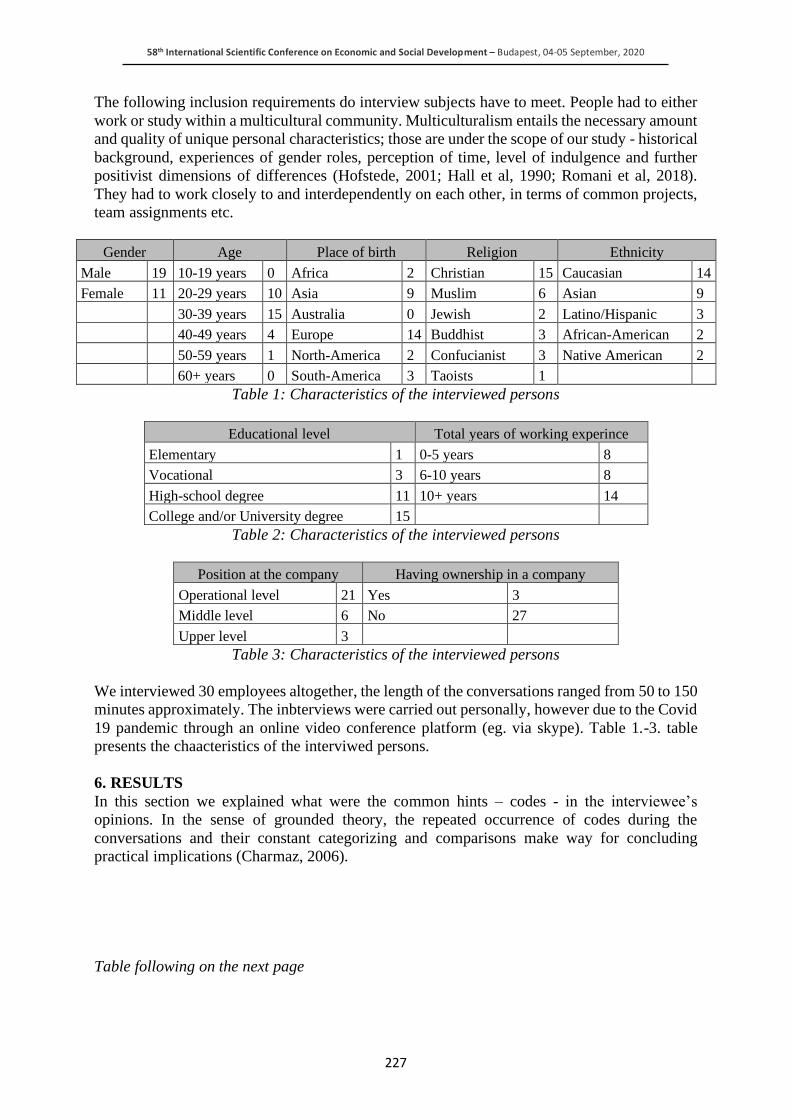
58th International Scientific Conference on Economic and Social Development – Budapest, 04-05 September, 2020
227
The following inclusion requirements do interview subjects have to meet. People had to either
work or study within a multicultural community. Multiculturalism entails the necessary amount
and quality of unique personal characteristics; those are under the scope of our study - historical
background, experiences of gender roles, perception of time, level of indulgence and further
positivist dimensions of differences (Hofstede, 2001; Hall et al, 1990; Romani et al, 2018).
They had to work closely to and interdependently on each other, in terms of common projects,
team assignments etc.
Gender Age Place of birth Religion Ethnicity
Male 19 10-19 years 0 Africa 2 Christian 15 Caucasian 14
Female 11 20-29 years 10 Asia 9 Muslim 6 Asian 9
30-39 years 15 Australia 0 Jewish 2 Latino/Hispanic 3
40-49 years 4 Europe 14 Buddhist 3 African-American 2
50-59 years 1 North-America 2 Confucianist 3 Native American 2
60+ years 0 South-America 3 Taoists 1 Table 1: Characteristics of the interviewed persons
Educational level Total years of working experince
Elementary 1 0-5 years 8
Vocational 3 6-10 years 8
High-school degree 11 10+ years 14
College and/or University degree 15 Table 2: Characteristics of the interviewed persons
Position at the company Having ownership in a company
Operational level 21 Yes 3
Middle level 6 No 27
Upper level 3 Table 3: Characteristics of the interviewed persons
We interviewed 30 employees altogether, the length of the conversations ranged from 50 to 150
minutes approximately. The inbterviews were carried out personally, however due to the Covid
19 pandemic through an online video conference platform (eg. via skype). Table 1.-3. table
presents the chaacteristics of the interviwed persons.
6. RESULTS
In this section we explained what were the common hints – codes - in the interviewee’s
opinions. In the sense of grounded theory, the repeated occurrence of codes during the
conversations and their constant categorizing and comparisons make way for concluding
practical implications (Charmaz, 2006).
Table following on the next page
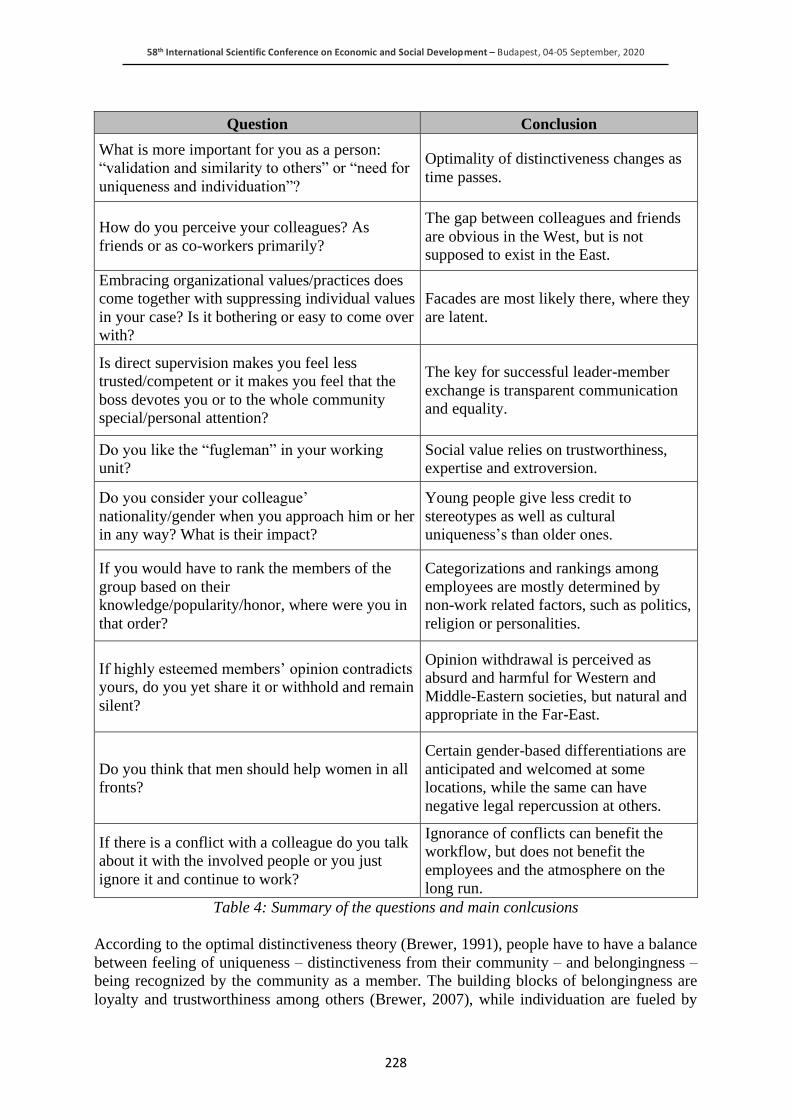
58th International Scientific Conference on Economic and Social Development – Budapest, 04-05 September, 2020
228
Question Conclusion
What is more important for you as a person:
“validation and similarity to others” or “need for
uniqueness and individuation”?
Optimality of distinctiveness changes as
time passes.
How do you perceive your colleagues? As
friends or as co-workers primarily?
The gap between colleagues and friends
are obvious in the West, but is not
supposed to exist in the East.
Embracing organizational values/practices does
come together with suppressing individual values
in your case? Is it bothering or easy to come over
with?
Facades are most likely there, where they
are latent.
Is direct supervision makes you feel less
trusted/competent or it makes you feel that the
boss devotes you or to the whole community
special/personal attention?
The key for successful leader-member
exchange is transparent communication
and equality.
Do you like the “fugleman” in your working
unit?
Social value relies on trustworthiness,
expertise and extroversion.
Do you consider your colleague’
nationality/gender when you approach him or her
in any way? What is their impact?
Young people give less credit to
stereotypes as well as cultural
uniqueness’s than older ones.
If you would have to rank the members of the
group based on their
knowledge/popularity/honor, where were you in
that order?
Categorizations and rankings among
employees are mostly determined by
non-work related factors, such as politics,
religion or personalities.
If highly esteemed members’ opinion contradicts
yours, do you yet share it or withhold and remain
silent?
Opinion withdrawal is perceived as
absurd and harmful for Western and
Middle-Eastern societies, but natural and
appropriate in the Far-East.
Do you think that men should help women in all
fronts?
Certain gender-based differentiations are
anticipated and welcomed at some
locations, while the same can have
negative legal repercussion at others.
If there is a conflict with a colleague do you talk
about it with the involved people or you just
ignore it and continue to work?
Ignorance of conflicts can benefit the
workflow, but does not benefit the
employees and the atmosphere on the
long run.
Table 4: Summary of the questions and main conlcusions
According to the optimal distinctiveness theory (Brewer, 1991), people have to have a balance
between feeling of uniqueness – distinctiveness from their community – and belongingness –
being recognized by the community as a member. The building blocks of belongingness are
loyalty and trustworthiness among others (Brewer, 2007), while individuation are fueled by
58th International Scientific Conference on Economic and Social Development – Budapest, 04-05 September, 2020
229
contributing in a unique, irreplaceable way into the whole (Snyder & Fromkin, 1980). It was
also suggested that various contexts may make one of the two items temporarily salient (Correll
& Park, 2005). Correll’s and Park’s point found validation during our interviews: all subjects
agreed on the determining factor of time. Trust was mentioned as a crucial pillar cooperation is
built on and it also ensures that inner cohesion that bridges over the distinctive characteristics
and roles of the employees. Most of the interviewees’ reported that showing their personal skills
is a must, presenting something that is indispensable for efficiency and no one else can
substitute. Although Arabic subjects highlighted that such high level of individualism is
acceptable only if the unique skills are of extreme importance from the perspective of the task,
otherwise an Arabic community would exclude the person. Anglo-Saxon subjects represented
an utterly different opinion. Western employees in general uniqueness-oriented as oppose to
the Asian ones, thus proportionately larger degree of distinctiveness makes them feel included
and satisfied. The differentiation of nationalities is not the core scope of this paper, however
could be an interesting topic to add on to this research. We noted also that subject in leader
positions argued rather for uniqueness. They believed that a leader faces other requirements of
inclusion then a subordinate: the team does not include the boss unless it does not prove its
exceptional expertise - in some sense - as an evidence for authority. Beside unlocking optimal
distinctiveness, trust divides collegiality and friendship according to the majority of the
subjects. In certain more collectivistic cultures, improving business partnerships into
friendships is anticipated. The emphasize lies on interpersonal relationships, not on group
cohesion, although the proper quantity and quality of interpersonal connections is a must for
inclusiveness (Reich & Hershcovis, 2011). The point of multiple identities theory is that
everyone has different quality of relationships toward different people (Ramarajan, 2009),
however the situation also matters. Like before, time bears significance: subjects reported that
the more time they spend together, professional relationships ascend to friendships
automatically. The depth of interpersonal relationships is in positive correlation with the feeling
of inclusiveness and wellbeing at the workplace, because it fulfils fundamental psychological
needs (see Maslow e. g.) affirmed by our examination too. Apart from time, the following
aspects were cited as constituents toward friendship: common circle or interest, engagement in
discussions of personal issues, time spent together off the work. Cultural background and
location are of severe impact as well. Basically, Western interviewees stated that they mark an
unequivocal line between friendship and collegiality, while for Eastern people, the two overlap
and when the two perspectives collide, usually the location decides which party adapts the
practice of the other. Leaders represented here a quite distinctive stance: they consensually
believed that tight personal connection poses a huge threat to headship, which is not
counterbalanced by its benefits at their positions. They rather keep things professional at all
times. For them, the respect enables inclusion, instead of personal connections. In an
environment, when minority groups’ integration is insufficient, the affected one tries to fulfil
their need for belongingness through the apparent embrace of organizational culture including
supervisory expectations. However, it is counterproductive, because they achieve that by
suppressing their own identities and values. This phenomenon is called the façade of conformity
(Hewlin, 2009). Most respondents told that they never hold back their ideas, creativity and
engage in conflicts with their supervisory, if necessary. Interestingly, Western interviewees
who have worked in an Eastern environment reported that façade of conformity is quite
common there, however, it does not restrain Eastern colleagues feeling of inclusion, because
obedience and total assimilation to the working community is a must. Maybe that is the reason
why Eastern subject did not approve at all. They do feel included when their personalities merge
into the organizational culture. With other words, they willingly internalize corporate virtues,
furthermore, they spend their whole lifetime working for the same company (lifetime-
employment, Shshin-Koyo).
58th International Scientific Conference on Economic and Social Development – Budapest, 04-05 September, 2020
230
Oppositions between external expectations and personal commitments are tensive for Western
employees (continental Europe and Anglo-Saxon regions) and as stated, they never submit. We
concluded that most of them has never experienced facades. A third stance was presented by
basically Middle-Eastern ones. We noted that the subject manner of speaking was quite
confident in term of this adversity. This is the location where façade of conformity appeared
and virtually hindered inclusion according to the perception of our interviewees from there, as
predicted by Hewlin (2009). The leader-membership exchange (LMX) theory is used to analyze
how leadership styles affects subordinates, in respect of their feeling of inclusion (Nishii and
Mayer, 2009; Douglas et al, 2003). Examine each aspect of the various leaderships styles are
beyond the framework of this study, therefore we choose to scrutinize only one feature: direct
supervision (Shore et al, 2011). Nishii and Mayer (2009) claimed that differentiation between
the members hinders inclusion, however high level of LMX supports it. It was confirmed that
directly supervised employees perform better and feel advancement in their integration
(Wasserman, 2008), but such favoritism damages group inclusiveness in general (Shore et al,
2011), which was claimed by many of our subjects as well. We encountered analogues opinions
here. Each subject emphasized the importance of transparency and proper communication about
the reason of special attention on someone, because, as we heard, colleagues usually surmise
negative notions behind, such as nepotism. Contrarily though, the person who is actually treated
exceptionally, felt good about it, as being coached or mentored. To sum up, the affected
individual feels included and that its process of integration is facilitated and supervised
personally by the boss. On the other hand, the inclusive climate of the community decreases
through the negative assumptions attached to the special treatment, for instance as the other
perceive themselves less valuable (Douglas et al, 2003). Some individuals bear exceptionally
high social value and favored status in a group (Nishii, 2012). Manifestations of these are higher
share of voice and level of inclusion as well (Brewer, 1991). These dominant and very
extroverted individuals are likely prevail interactions, while the others are expected to
assimilate and this phenomenon hinders inclusion (Wagner et al 1986). Through high share of
voice signalizes high social value, we grasped this abstraction as “fugleman” (Jasso, 2001); one
of our subjects on the other hand, called such persons “influencers”. The fugleman person
enjoys trust and admiration from their colleagues in case of indulgent cultures (e. g. Brazilian,
Mexican), but if trustworthiness is doubted, respect turns into condemn instantly. For Middle-
Eastern and also collectivistic cultures, the approach to and affect posed by the fugleman is
dependent on knowledge and not on personality traits, such as humbleness and temperance. If
the fugleman meets the set up requirements, he or she becomes capable of compromising the
boss’s authority, which was supported by each participant, through the greater value assigned
to him or her respectively. The supervisor’s reaction also affects the impact of the influencer.
A straightforward objection would only strengthen the commitment toward the individual,
however whether it enhances inclusiveness or not, we could not clarify. A sort of symbiotic
partnership is suggested to be the wisest according to some of our interviewees: the boss may
use the person as an intermediary, therefore utilizing its trust and influence over the community.
The final consequence of people with higher social value is if they have certain attributes -
varying by cultures – they increase the feeling of inclusiveness, but if not, negative, even hateful
atmosphere is likely to evolve and ripple further. The inclination for greater belongingness or
distinctiveness is affected by demographic and other similarities. According to the similarity
attraction paradigm, people have positive attitudes toward individuals with for instance, same
origin, gender, race, etc. (Byrne, 1971). We intended to find out to what extent and for whom
are such characteristics – or others – considered when approaching colleagues for the first time.
We concluded two things after the analysis of the sixth question. First, younger employees build
much less on presumptions attached to personal characteristics. Younger interviewees stated
that considering the other’s being, ultimately undermines honesty, because one may not express
58th International Scientific Conference on Economic and Social Development – Budapest, 04-05 September, 2020
231
self freely, as concerned about the reception of its words. On the other hand, older respondents
are more circumspect, they confirmed the paradigm. Senior employees argued that bearing in
mind the other’s ethnicity and being aware of its cultural taboos is rather beneficial than harmful
when it comes to business dealings. They mentioned that religion, history and contemporary
political discourse should be considered during negotiations, consequentially, they rather turn
to their compatriots for instance, because they know their taboos for example. Secondly, we
found that Asian cultures’ representatives rather turn to their “similar” fellows in terms of age
(Japanese), ethnicity (Palestinian) and intentionally avoid interactions with those outside of this
circle. A Japanese participant mentioned that sometimes they are forbidden even to talk to
seniors in the workplace. Inclusiveness is higher among similar people, especially in the Eastern
part of the globe, but it is less significant for younger colleagues. As a consequence of personal
characteristics – demographic, seniority, knowledge, experience – employees rank or categorize
each other in the workplace (Homan et al, 2008; Turner et al, 2006). It was suggested that proper
rankings can increase inclusiveness, however categorization never can (Larkey, 1996). We
encountered that different cultures build on different characteristics when developing categories
or rankings. Each participant reported of certain ranks in their working communities, however
we encountered categorization only once. This case was deeply rooted in politics and cultural
stereotyping. Muslim subjects felt extremely unfair the bias toward them, particularly, that
Muslims are violent, disrespectful to women, and unwilling to adapt to the Christian culture.
They divided their colleagues as the following: hostile-suspicious toward him; neutral ones and
“fairies”. One subject explained the last group as some people are more kind because they are
aware of the humiliating and oversimplifying believes about them. In this respect, our fieldwork
affirmed Larkey’s (1996) results: categorization has negative notions. As far as rankings are
concerned, several bases were mentioned by different people: trustworthiness, reliability,
helpfulness, seniority, experience, knowledge, etc. Typically, hard items were fetched by
employees from the Anglo-Saxon world and continental Europe, while soft attributes were by
Latinos and Asian interviewees. No one told that rankings would harm integrational processes
and inclusion, however the opposite was not undoubtedly supported either. An anticipated
outcome of rankings and categorizations is opinion or creativity withdrawal (Shore et al, 2011;
Turner et al, 2006). This is an instinctual act, as “less esteemed” individuals afraid of
confronting highly regarded ones, even on a rational and professional ground. They may fear
that the other takes counterarguments personally. This perception is established in the
sociological concept of “face”, which is incorporated in Hofstede dimension of power distance
(Cambridge Dictionary, 2018; Hofstede, 1994). Our participants confirmed the fact of opinion
withholding, especially the Asian ones. These participants measure their words and the
circumstances more cautiously: who are they dealing with, how important is the issue at all,
where and when confront if necessary, what will be the reception like. If they found the pros
for arguing insufficient, they remain silent indeed. Their speech suggested though, that they do
not find this compulsion right, they feel bad about the danger deriving from the egoism of the
influential “antagonist” in the end. On the other hand, Western employees confirmed too but
find the whole phenomenon absurd and extremely harmful. Interviewees in leader positions
held it inappropriate as well, arguing that a boss should not stick to fixations, because that
undermines corporate efficiency. They all suggested that showing powerfulness and saying “I
am the boss” definitely damage inclusion, as subordinates feel disrespected by being turned
down with irrational arguments. Several theoretical constructs and empirical findings suggested
that gender based differentiation exists and affects business environment to a relatively greater
extent in comparison with other visible personal characteristics (Herring, 2009; Ely, 1995); for
example, status differences (Berger et al, 1972), similarity attraction paradigm in association
with gender (Shapcott et al, 2006), climate for inclusion (Nishii, 2012). Considering the cultural
background of our respondents, we concluded that female emancipation is less advanced as
58th International Scientific Conference on Economic and Social Development – Budapest, 04-05 September, 2020
232
going to the East, however whose opinions showed high variability were of Middle-Eastern
subjects. Except for this location, Hofstede’s gender-related statements proven to be correct yet
in 2020. Accordingly, gender differentiation is less visible and daily in Europe and America,
but if it occurs, its legal and social consequences are severe, while in the Far-East,
differentiations are considered traditionally natural and not outrageous at all. In line with that,
gender differentiation fosters inclusion in the East and hinders in the West in general. As for
the Middle-East, the picture is more complex. Some interviewees thought that women are less
reliable because they are more emotion-driven and it should never affect the work. A third
approach was gender neutral. Consequentially, the respective tendencies require further,
specific investigation in association with the Middle-Eastern cultures. Approaches to and
consideration of interpersonal conflicts varies by locations and cultures (see e. g. Hofstede,
1994). Majority of studies proclaim the long-lasting benefits of conflict discussions and
resolution attempts as they serve the understanding of the other side’s perspectives and
therefore deepens cultural knowledge, which in return enables integration of employees with
diverse backgrounds (Fiol et al, 2009; Ely et al, 2001). However, other conflict concerning
strategies found empirical evidences too. Jehn (1995) stated that dwelling on disagreements
makes relationships vicious, while ignorance is a viable path toward smooth cooperation in the
workplace. We found that, apart from certain exceptions, more power distant cultures claim the
merits of conflict ignorance. We heard analogues responses from Middle-Eastern and African
subjects, who experienced that the engagement into resolution makes them feel excluded as it
casts a “frozen” atmosphere around them. Contrarily, in Europe, America and in some Latin-
American countries, oppositions and instant but not forced settlements of disputes are
welcomed. In correlation with that, unsettled debates erodes interpersonal trust and therefore
leads to exclusion from the community, supported by Brewer (1991). Apart from the Far-East,
resolution attempts are anticipated, but with various measure of circumspection. Employees
from Eastern-Europe and Middle-East are less frontal, similarly to their attitudes toward
opinion-sharing, described above. We had the impression that indiscretion is what actually
makes them feel excluded, while their status suffers from the decreased trust resulting from
buried quarrels, however no participants confirmed this belief unambiguously.
7. LIMITATIONS, FUTURE RESEARCH
The limitations of our research is methodological in nature. Glaser (1978) noted that in the cases
of grounded theory, a data collection is confined by an emerging and not existing, well-based
theory and that means the absence of conceptual depth (Benoliel, 1996). Qualitative studies
usually produce ungeneralizable findings (Hussein et al, 2014). Knowledge is born through
confirmation (repetition) and not by testing theories (that is what we did), even if they result in
new ones (Polit et al, 2010). Our recommendation for future studies is to find confirming or
refuting evidences to our own results. On the other hand, we encountered controversial elements
in our gathered database, those need clarifications, for that end, we recommend a precise
analysis both of the theoretical background and the related empirical findings, including our
results as well. A precise and quantitative investigation would significantly reduce the
ambiguity of the empirical evidence and can serve as a trial. Below, we summarized in
bulletpoints, which questions we suggest for future studying. Reflecting to the grounded theory,
this debates occurred frequently enough to develop codes from, but the respective opinions of
the subjects were at conflict as a result of conceptualization stage of the method.
1) Do leaders have to present more uniqueness than belongingness than subordinates in respect
of the optimal distinctiveness theory?
2) What contextual factors contribute to the transmission between collegiality and friendship;
for example, time spent within the company or trust?
3) Can façade of conformity evolve under Eastern kind of corporate cultures?
58th International Scientific Conference on Economic and Social Development – Budapest, 04-05 September, 2020
233
4) Does high level of leader-membership exchange with only one employee erodes group
cohesion?
5) How shall supervisors handle subordinates with high social value to increase inclusiveness?
6) To what extent does one’s age affect its consideration of demographic characteristics?
7) Do rankings foster or hinder integration procedure of new employees?
8) How would unrestrained negotiations affect inclusion in case of Eastern cultures?
9) What is the relationship between gender based differentiation and inclusion in the Middle-
Eastern culture?
10) Is immediate conflict resolution attempts lead to exclusion in Middle-Eastern cultures?
8. CONCLUSION
The aim of this research was to offer empirical findings about integration oriented models by
testing these theories in practice (Mor Barak, 2015). Massive labour migration is a challenge to
cope with but simultaneously, an opportunity to seize. We intended to produce some practical
insights and understanding of the nature of integration driven by the fact that implementing the
unique perspectives of newcomer employees with diverse cultural backgrounds and
characteristics bears competitive advantage for companies and industries (Gonzalez et al,
2009). Previous studies suggested that inclusive workplaces correlate with lower turnover
intentions, greater job satisfaction and higher performance (Cho et al, 2008; Nishii et al, 2009).
However, such inquiries are absent if we reflect to Central and Eastern Europe. To address this
gap we conducted our investigation in this region with employees working and living there. A
self-developed questionnaire questionnaire was applied consisting ten open-ended questions.
During the semi-structured interviews, the subjects were asked to tell their experiences and
feelings about their own perceived inclusiveness in their working communities. We applied a
holistic way in the belief that it is more beneficial if we apply the knowledge of the field
comprehensively. Each interview served with unique findings; our final and general
consequence is that, more “included” workers, that is to say successfully integrated ones, are
more satisfied, committed and hard-working.
LITERATURE:
1. Acquavita, S.P. & Castellanos, K. (2009). Personal and Organizational Diversity Factors’
Impact on Social Workers’ Job Satisfaction: Results from a National Internet-Based Survey.
Administration in Social Work, 33(2): 151-166.
2. Benoliel, J. Q. (1996). Grounded theory and nursing knowledge. Qualitative Health
Research, 6: 406-428.
3. Berger, J., Cohen, B.P., & Zelditch, M. (1972). Status characteristics and social interaction.
American Sociological Review, 37: 241-55.
4. Berry J.W., & Kim U. (1988). Acculturation and mental health. In: Dasen P, Berry JW,
Sartorius N, editors. Health and cross-cultural psychology. Newbury Park, CA: Sage;. 207–
236.
5. Bite P.Z., Konczosne M., Vasa L.(2020) The Concept of Labour Migration from the
Perspective of Central and Eastern Europe. Journal of Economis and Socilogy, Vol 13
6. Brewer, M. B. (1991). The social self: On being the same and different at the same time.
Personality and Social Psychology Bulletin, 17: 475-482.
7. Brewer, M., B. (2007). The importance of being we: Human nature and intergroup relations.
American Psychologist, 62(8): 728-738.
8. Brewer, M.B. (1999). The psychology of prejudice: Ingroup love or outgroup hate? Journal
of Social Issues, 55, 429–444.
58th International Scientific Conference on Economic and Social Development – Budapest, 04-05 September, 2020
234
9. Buttner, E. H., Lowe, K. B., & Billings-Harris, L. (2012). An empirical test of diversity
climate dimensionality and relative effects on employee of color outcomes. Journal of
Business Ethics, 110(3), 247–258.
10. Byrne, D. (1971). The attraction paradigm. New York, Academic Press.
11. Charmaz, K. (2006). Constructing grounded theory. 2nd edition, London: Sage Publishing.
12. Chatman, J. A., & O’Reilly, C. A. (2004). Asymmetric reactions to work group sex diversity
among men and women. Academy of Management Journal, 47(2): 193-208.
13. Cho, S., & Mor Barak, M. E. (2008). Understanding of diversity and inclusion in a perceived
homogeneous culture: A study of organizational commitment and job performance among
Korean employees. Administration in Social Work, 32(4): 100-126.
14. Chrobot-Mason, D., & Thomas, K. M. (2002). Minority employees in majority
organizations: The intersection of individual and organizational racial identity in the
workplace. Human Resource Development Review, 1(3): 323-344.
15. Correll, J., & Park, B. (2005). A model of the ingroup as a social resource. Personality and
Social Psychological Review, 9(4): 341-359.
16. Cox, T. H. (1991). The multicultural organization. Academy of Management Executive, 5:
34-47.
17. Den Hartog, D. N., De Hoogh, A. H. B., & Keegan, A. E. (2007). The interactive effects of
belongingness and charisma on helping and compliance. Journal of Applied Psychology,
92(4): 1131-1139.
18. Denzin, N. K. & Lincoln, Y. S. (2005). The Discipline and Practice of Qualitative Research.
The SAGE Handbook of Qualitative Research (3rd ed.) Thousand Oaks, California. SAGE
Publications, 3-4.
19. Denzin, N. K., & Lincoln, Y. S. (2011). The SAGE Handbook of qualitative research ( 4th
ed.). Los Angeles: Sage Publications.
20. Douglas, C., Ferris, G., R., Buckley, M., R. & Gundlach, M., J. (2003). Organizational and
social influences on leader-member exchange process: Implications for the management of
diversity. In Graen, G., Dealing with diversity. Greenwich, Information Age Publishing.
21. Ely, R. J., & Thomas, D. A. (2001). Cultural diversity at work: The effects of diversity
perspectives on work group processes and outcomes. Administrative Science Quarterly, 46:
229–273.
22. Ely, R., J. (1995). The power of demography: women’s social construction of gender
identity at work. Academy of Management Journal, 38(3): 589-634.
23. Eurostat (2020). Projected old-age dependency ratio. |online| |Accessed: 03. 14. 2020|.
24. Fiol, C. M., Pratt, M. G., & O’Connor, E. J. (2009). Managing 1770 Academy of
Management Journal December intractable identity conflicts. Academy of Management
Review, 34: 32–55.
25. Firth-Cozens, J. & Hardy, G.E. (1992). Occupational stress, clinical treatment, and changes
in job perceptions. Journal of Occupational and Organizational Psychology, 65(2): 81-88.
26. Given L. M. (2008). The Sage Encyclopedia of Qualitative Research Methods. SAGE
Publications.
27. Glaser B. & Strauss, A. (1967). The Discovery of Grounded Theory: strategies for
qualitative research. Chicago: Aldine.
28. Glaser, B. (1978). Theoretical sensitivity: Advances in methodology of grounded theory.
San Francisco, CA: University of California Press.
29. Gonzalez, J.A., & DeNisi, A.S. (2009). Cross-level effects of demography and diversity
climate on organizational attachment and firm effectiveness. Journal of Organizational
Behavior, 30: 21-40.
58th International Scientific Conference on Economic and Social Development – Budapest, 04-05 September, 2020
235
30. Gonzalez, J.A., & DeNisi, A.S. (2009). Cross-level effects of demography and diversity
climate on organizational attachment and firm effectiveness. Journal of Organizational
Behavior, 30: 21-40.
31. Haig, B. D. (1995). Grounded Theory as Scientific Method. Philosophy of Education.
|online|. Available at:
http://jan.ucc.nau.edu/~pms/cj355/readings/Haig%20Grounded%20Theory%20as%20Scie
ntific%20Method.pdf |Accessed: 03. 14. 2020.|
32. Hall, E. T.; & Hall, M. R. (1990). Understanding cultural differences. Intercultural Press
Yarmouth ME.
33. Harvey, C.P. (2012). Understanding and Managing Diversity. New Jersey: Pearson
Education, Inc. 51–55.
34. Herring, C. (2009). Does diversity pay? Race, gender, and the business case for diversity.
American Sociological Review, 74: 208–224.
35. Herzberg, F. (1968). One More Time. How do you motivate Employees? Harvard Business
Review, 65(5).
36. Hewlin, P.F. (2009). Wearing the cloak: Antecedents and consequences of creating facades
of conformity. Journal of Applied Psychology, 94(3): 727-741.
37. Hofstede, G. (1994). The Business of International Business is Culture. International
Business Review, 3(1): 1-14.
38. Hofstede, G: (2001). Culture's Consequences: comparing values, behaviors, institutions,
and organizations across nations (2nd ed.). Thousand Oaks, CA: SAGE Publications.
39. Homan, A., C., Hollenbeck, J., R., Humphrey, S., E., van Knippenberg, D., Ilgen, D., R. &
Van Kleef, G., A. (2008). Facing differences with an open mind: Openness to experience,
salience of intragroup differences and performance of diverse work groups. Academy of
Management Journal, 51(6): 1204-1222.
40. Hussein, M.E., Hirst, S., Salyers, V. & Osuji, J. (2014). Using Grounded Theory as a
Method of Inquiry: Advantages and Disadvantages. The Qualitative Report, 19(27), 1-15.
41. Jacqueline, A-M.C-S., Shore, L.M. (2007). The Employee-Organizational Relationship:
Where do we go from here? Human Resource Management Review, 17(2), 166-179.
42. Jasso, G. (2001). Studying status: An integrated framework. American Sociological Review,
66(1): 96-124.
43. Jehn, K. A. (1995). A multimethod examination of the benefits and detriments of intragroup
conflict. Administrative Science Quarterly, 40: 256–282.
44. Larkey, L. K. (1996). Toward a theory of communicative interactions in culturally diverse
workgroups. Academy of Management Review, 21: 463–491.
45. Maslow, A. H. (1943). A theory of human motivation. Psychological Review, 50(4), 370-
96.
46. Migration Data Portal (2020). Migration Data in Europe. |online|. Available at:
https://migrationdataportal.org/regional-data-overview/europe|Accessed: 03. 14. 2020.|
47. Mohammed, S., & Angell, L. C. (2004). Surface- and deep level diversity in workgroups:
Examining the moderating effects of team orientation and team process on relationship
conflict. Journal of Organizational Behavior, 25: 1015–1039.
48. Mor Barak, M. E. (2000). Beyond affirmative action: Toward a model of diversity and
organizational inclusion. Administration in Social Work, 23: 47-68.
49. Mor Barak, M. E. (2014). Managing diversity: Toward a globally inclusive workplace (3rd
ed.). Thousand Oaks, CA: Sage.
50. Mor Barak, M.E., (2015). Inclusion is the key to Diversity Management, but What is
Inclusion? Human Service Organizations Management, 39(2): 37-41.
51. Nishii, L. H. (2012). The benefits of Climate for Inclusion for Gender-Diverse Groups. The
Academy of Management Journal, 56(6): 1754-1774.
58th International Scientific Conference on Economic and Social Development – Budapest, 04-05 September, 2020
236
52. Nishii, L. H. (2013). The benefits of climate for inclusion for gender-diverse groups.
Academy of Management Journal, 56, 1754–1774.
53. Nishii, L.H., & Mayer, D.M. (2009). Do inclusive leaders help to reduce turnover in diverse
groups? The moderating role of leader-member exchange in the diversity to turnover
relationship. Journal of Applied Psychology, 94(6): 1412-1426.
54. OECD (2020). 2019 International Migration and Displacement Trends and Policies Report
to the G20. |online|. Available at: https://www.oecd.org/migration/mig/G20-migration-and-
displacement-trends-and-policies-report-2019.pdf |Accessed: 03. 14. 2020.|
55. Pickett, C.L., & Brewer, M.B. (2001). Assimilation and differentiation needs as
motivational determinants of perceived in-group and out-group homogeneity. Journal of
Experimental Social Psychology, 37: 341-348.
56. Polit, D., & Beck, T. B. (2010). Generalization in quantitative and qualitative research:
Myths and strategies. International Journal of Nursing Studies, 47, 1451-1458.
57. Queensborough Community College (2020). Definition for Diversity, |online|. Available at:
https://www.qcc.cuny.edu/diversity/definition.html. |Accessed: 03. 13. 2020.|
58. Ralph, N., Birks, M. & Chapman, Y. (2014). Contextual Positioning: Using Documents as
Extant Data in Grounded Theory Research. SAGE Open. 4(3).
59. Ramarajan, L. (2009). Opening up or shutting down? The effects of multiple identities on
problem solving. Harvard Business School working paper series no. 10-041. Boston.
60. Redstone, I. (2019). The Conversation about Workplace Diversity We Should Be Having.
Foundation for Economic Education, |online|. Available at: https://fee.org/articles/the-
conversation-about-workplace-diversity-we-should-be-having/. |Accessed: 03. 13. 2020.|
61. Reich, T. & Hershcovis, S. (2011). Interpersonal relationships at work. In: Handbook of
industrial and organizational psychology, 3rd Edition, Publisher: American Psychological
Association.
62. Ridgeway, C. L., & Correll, S. J. (2006). Consensus and the creation of status beliefs. Social
Forces, 85: 431–453.
63. Riordan, C. M. (2000). Relational demography within groups: Past developments,
contradictions, and new directions. Research in Personnel and Human Resources
Management, 19: 131- 173.
64. Romani, L., Mahadevan, J. & Primecz, H. (2018). Critical Cross-Cultural Management:
Outline and Emerging Contributions. International Studies of Management &
Organization, 48(4), 403-418.
65. Shapcott, K., M., Carron, A., V., Burke, S., M., Bradshaw, M., H. & Estabrooks, P., A.
(2006). Member diversity and cohesion and performance in walking groups. Small group
Research, 37(6): 701-720.
66. Shaufeli, W. B.,van Dierdendonck, D., & van Gorp, K. (1996). Burnout and reciprocity:
Towards a dual-level social Exchange model. Work and Stress, 10: 225-237.
67. Shore, L.M., Randel, A.E., Chung, B.G., & Dean, M.A. (2011). Inclusion and Diversity in
Work Groups: A review and Model for Future Research. Journal of Management, 37(4): 1-
58.
68. Snyder, C., R. & Fromkin, H., L. (1980). Uniqueness, the human pursuit of difference. New
York: Plenum.
69. Strauss, A., Corbin, J., M. (1997). Grounded theory in practice. Sage Publications, Inc.
70. Thomas, D. A., & Ely, R.D. (1996). Making differences matter: A new paradigm for
managing diversity. Harvard Business Review, 74(5): 79-90.
71. Turner, J., H., Stets, J., E., Cook, K., S. & Massey, D., S. (2006). Sociological theories of
human emotions. Annual Review of Sociology, 32(1): 25-52.
72. Wagner, D. G., Ford, R. S., & Ford, T. W. (1986). Can gender inequalities be reduced?
American Sociological Review, 51: 47–61.

58th International Scientific Conference on Economic and Social Development – Budapest, 04-05 September, 2020
237
73. Wasserman, I., C., Gallegos, P., V. & Ferdman, B., M. (2008). Dancing with resistance:
Leadership challenges in fostering a culture of inclusion. In Thomas, K., M., Diversity
resistance in organizations. New York, Taylor & Francis Group/Lawrence Erlbaum
Associates.
74. Wertz, F.J., Charmaz, K., McMullen L. M., Josselson, R., Anderson, R. & McSpadden, E.
(2011). Five Ways of Doing Qualitative Analysis: Phenomenological Psychology,
Grounded Theory, Discourse Analysis, Narrative Research, and Intuitive inquiry. 16-18.
The Guilford Press, (1st ed.).
58th International Scientific Conference on Economic and Social Development – Budapest, 04-05 September, 2020
238
DRIVER AND BARRIER FACTORS OF SUPPLY CHAIN
MANAGEMENT FOR SMALL AND MEDIUM-SIZED ENTERPRISES:
AN OVERVIEW
Santi Setyaningsih
Szechenyi Istvan University, Hungary
Peter Kelle
Louisiana State University, USA
Azmi Sulaiman Maretan
Szechenyi Istvan University, Hungary
ABSTRACT
Small and Medium-Sized Enterprises (SMEs) have not got appropriate attention in the Supply
Chain strategy area, though they are integrated in big supply chains, having an important role
in the economic growth of every country. The purpose of this research is to explore the role of
drivers and barriers in the Supply Chain Management (SCM) implementation in the practice
of SMEs. Small companies often operate with limited financial, management, knowledge, and
technology resources. However, implementing the SCM strategy in the organization could
secure a favorable position, build a competitive advantage as well as improve the
organization’s performance. Over fifty research papers, mainly from referred international
journals have been reviewed to identify focus areas of research. Based on the review, variables
for a future research agenda are being proposed. This paper has identified five key drivers
(market pressure, social pressure, organizational culture, organizational characteristic, and
corporate strategy) with 22 variables as a subgroup. Besides, we identified five key barriers
(organization, financial, knowledge, technology, and outsourcing) with also 22 variables as a
subgroup that can support experts to implement SCM. This research will contribute
academically to provide additional literature for SCM focusing on SMEs and is also the basis
of a future research investigating the effect of geographical structure and supply chain
structure on the importance of drivers and barriers in SCM.
Keywords: barriers, drivers, small and medium enterprises, supply chain management
1. INTRODUCTION
Traditional SCM considers the forward flow of materials and the backward flow of information
(Manzouri, et al., 2010). However, according to Chopra and Meindl (2016), SCM is part of the
company's strategies in which to collaborate directly or indirectly between related parties to
meet customer demand. Another definition from Stadtler, et al. (2015), SCM is a system of
some organizations that are implicated, through upstream and downstream connections, in the
different procedures and actions that create value in the type of products and services for their
ultimate consumer. Based on the definitions above, SCM gave several strategic benefits to the
organization process. Firstly, it can support reducing the production, delivery, and distribution
costs, inventory, secures manufacturing flexibility, and drives for more productivity (Hsu,
2005). Besides, it also can streamline the manufacturing process, avoid the bullwhip effect, and
improve the product and service quality (Yu and Cheng, 2001). Despite the several benefits for
the organization, SMEs could not fully adopt the superior features of SCM strategy in
comparison to large enterprises (Thakkar, et al., 2008). Research from Meehan and Muir (2008)
58th International Scientific Conference on Economic and Social Development – Budapest, 04-05 September, 2020
239
found that SMEs faced several barriers such as lack of skilled personnel in SCM, experience,
lack of power, and trust. They identified that the fundamental reason was a lack of interest
participating in the SCM strategy. SMEs currently have an important role in economic
development due to an attractive and effective innovation system (Neagu, 2016). In the OECD
countries, SMEs are the predominant form of enterprise, up to 99% of all firms, and provide as
a main source of employment to 70% (OECD, 2016). The importance of SMEs in the supply
chain and the specifics of SCM strategy implementation for SMEs requires specific research
consideration. In response to the current problems of SMEs above, this research aims to achieve
the following objectives:
1) To map the current state of research on driver and barrier factors of SCM implementation
in SMEs.
2) To identify important directions for future research in SCM implementation for SMEs
In summary, to cover the objectives mentioned above, this study utilized a literature review
method to examine the SCM implementation in SMEs in a broad picture. The paper is organized
as follows: section two presents the methodology used which also includes the descriptive
analysis of this literature review process. Section three deals with the driver and barrier factors
of SCM implementation. Section four provides future research directions based on the current
findings and limitations of our research.
2. RESEARCH METHODOLOGY
A systematic literature review was conducted to summarize the drivers and barriers of SCM
strategy implementation for SMEs. A literature review is one of the research methods to
understand the literature before shaping, argument, and justification. This type of literature
review is used usually to answer a highly structured and specific research question (Arshed and
Danson, 2015). Our research uses a procedure that is quite similar to the research conducted by
Seuring and Müller (2008) in the process of retrieving and selecting the articles. The following
phases were adopted from their research: sourcing, screening, analyzing the articles, and
describing the sample characteristics.
2.1. Sourcing the Articles
For the literature review, the first important step is defining clear boundaries to eliminate the
articles that are not directly related. In our sample, we used only the articles that have been in
peer-reviewed scientific journals in the English language with specific research focused on
drivers or barriers for SCM strategy implementation in SMEs. We conducted a structured
keyword search in ProQuest (https://search.proquest.com/) and Science Direct
(https://www.sciencedirect.com/) databases. We considered all articles published until 2020
containing the key word combinations and the number of retrieved articles as described in Table
1. We did a quick content check, to decide whether the articles included or excluded in the next
research analysis phase. A total of 838 articles have been selected in this sourcing phase.
2.2. Screening the Articles
At this screening phase, we checked the abstracts of the papers and retained those that covered
research about SCM in the SME context. In the beginning, only one of the authors did the
screening process. The unclear abstracts were categorized as a backlog and being discussed
with another author through an in-depth discussion about whether to exclude or include the
paper for further processing. This screening process successfully identified 66 relevant papers.
The articles that being gathered by search keywords in a broad term that included many articles
that did not unequivocally incorporate with “SCM strategy” and “SCM for SME”.
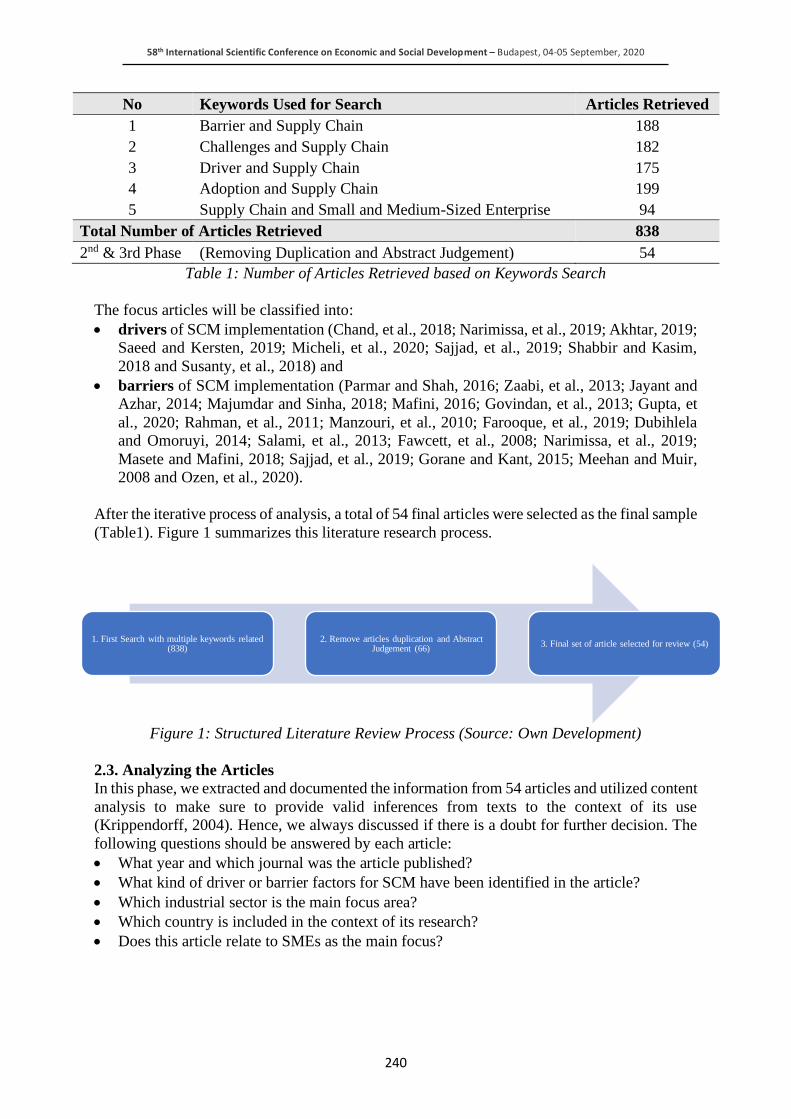
58th International Scientific Conference on Economic and Social Development – Budapest, 04-05 September, 2020
240
No Keywords Used for Search Articles Retrieved
1 Barrier and Supply Chain 188
2 Challenges and Supply Chain 182
3 Driver and Supply Chain 175
4 Adoption and Supply Chain 199
5 Supply Chain and Small and Medium-Sized Enterprise 94
Total Number of Articles Retrieved 838
2nd & 3rd Phase (Removing Duplication and Abstract Judgement) 54
Table 1: Number of Articles Retrieved based on Keywords Search
The focus articles will be classified into:
• drivers of SCM implementation (Chand, et al., 2018; Narimissa, et al., 2019; Akhtar, 2019;
Saeed and Kersten, 2019; Micheli, et al., 2020; Sajjad, et al., 2019; Shabbir and Kasim,
2018 and Susanty, et al., 2018) and
• barriers of SCM implementation (Parmar and Shah, 2016; Zaabi, et al., 2013; Jayant and
Azhar, 2014; Majumdar and Sinha, 2018; Mafini, 2016; Govindan, et al., 2013; Gupta, et
al., 2020; Rahman, et al., 2011; Manzouri, et al., 2010; Farooque, et al., 2019; Dubihlela
and Omoruyi, 2014; Salami, et al., 2013; Fawcett, et al., 2008; Narimissa, et al., 2019;
Masete and Mafini, 2018; Sajjad, et al., 2019; Gorane and Kant, 2015; Meehan and Muir,
2008 and Ozen, et al., 2020).
After the iterative process of analysis, a total of 54 final articles were selected as the final sample
(Table1). Figure 1 summarizes this literature research process.
Figure 1: Structured Literature Review Process (Source: Own Development)
2.3. Analyzing the Articles
In this phase, we extracted and documented the information from 54 articles and utilized content
analysis to make sure to provide valid inferences from texts to the context of its use
(Krippendorff, 2004). Hence, we always discussed if there is a doubt for further decision. The
following questions should be answered by each article:
• What year and which journal was the article published?
• What kind of driver or barrier factors for SCM have been identified in the article?
• Which industrial sector is the main focus area?
• Which country is included in the context of its research?
• Does this article relate to SMEs as the main focus?
1. First Search with multiple keywords related (838)
2. Remove articles duplication and Abstract Judgement (66)
3. Final set of article selected for review (54)
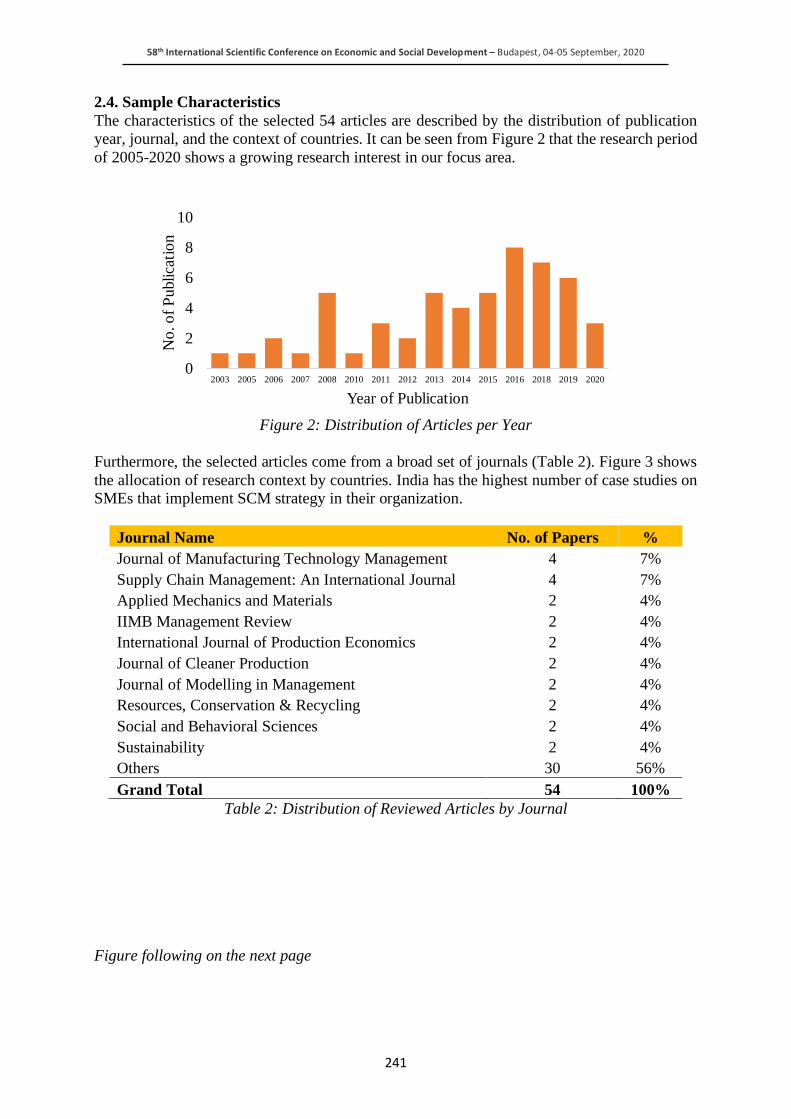
58th International Scientific Conference on Economic and Social Development – Budapest, 04-05 September, 2020
241
2.4. Sample Characteristics
The characteristics of the selected 54 articles are described by the distribution of publication
year, journal, and the context of countries. It can be seen from Figure 2 that the research period
of 2005-2020 shows a growing research interest in our focus area.
Figure 2: Distribution of Articles per Year
Furthermore, the selected articles come from a broad set of journals (Table 2). Figure 3 shows
the allocation of research context by countries. India has the highest number of case studies on
SMEs that implement SCM strategy in their organization.
Journal Name No. of Papers %
Journal of Manufacturing Technology Management 4 7%
Supply Chain Management: An International Journal 4 7%
Applied Mechanics and Materials 2 4%
IIMB Management Review 2 4%
International Journal of Production Economics 2 4%
Journal of Cleaner Production 2 4%
Journal of Modelling in Management 2 4%
Resources, Conservation & Recycling 2 4%
Social and Behavioral Sciences 2 4%
Sustainability 2 4%
Others 30 56%
Grand Total 54 100%
Table 2: Distribution of Reviewed Articles by Journal
Figure following on the next page
0
2
4
6
8
10
2003 2005 2006 2007 2008 2010 2011 2012 2013 2014 2015 2016 2018 2019 2020
No
. o
f P
ublica
tio
n
Year of Publication
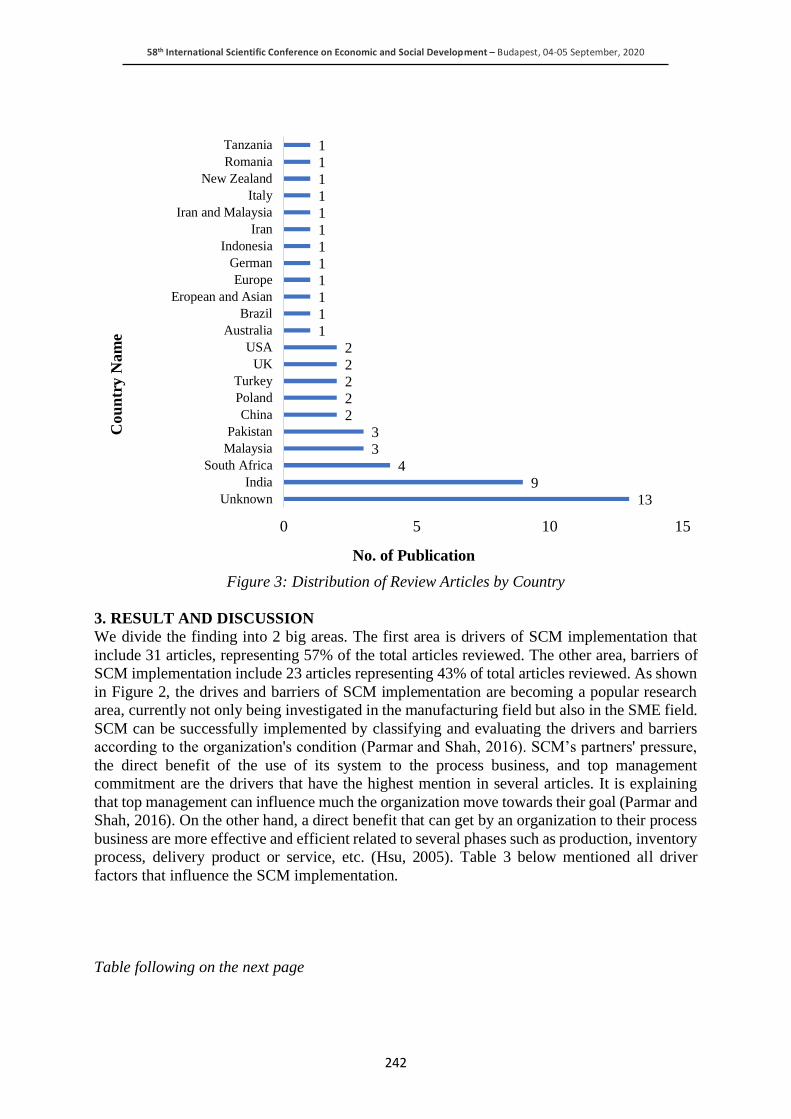
58th International Scientific Conference on Economic and Social Development – Budapest, 04-05 September, 2020
242
Figure 3: Distribution of Review Articles by Country
3. RESULT AND DISCUSSION
We divide the finding into 2 big areas. The first area is drivers of SCM implementation that
include 31 articles, representing 57% of the total articles reviewed. The other area, barriers of
SCM implementation include 23 articles representing 43% of total articles reviewed. As shown
in Figure 2, the drives and barriers of SCM implementation are becoming a popular research
area, currently not only being investigated in the manufacturing field but also in the SME field.
SCM can be successfully implemented by classifying and evaluating the drivers and barriers
according to the organization's condition (Parmar and Shah, 2016). SCM’s partners' pressure,
the direct benefit of the use of its system to the process business, and top management
commitment are the drivers that have the highest mention in several articles. It is explaining
that top management can influence much the organization move towards their goal (Parmar and
Shah, 2016). On the other hand, a direct benefit that can get by an organization to their process
business are more effective and efficient related to several phases such as production, inventory
process, delivery product or service, etc. (Hsu, 2005). Table 3 below mentioned all driver
factors that influence the SCM implementation.
Table following on the next page
13
9
4
3
3
2
2
2
2
2
1
1
1
1
1
1
1
1
1
1
1
1
0 5 10 15
Unknown
India
South Africa
Malaysia
Pakistan
China
Poland
Turkey
UK
USA
Australia
Brazil
Eropean and Asian
Europe
German
Indonesia
Iran
Iran and Malaysia
Italy
New Zealand
Romania
Tanzania
No. of Publication
Cou
ntr
y N
am
e
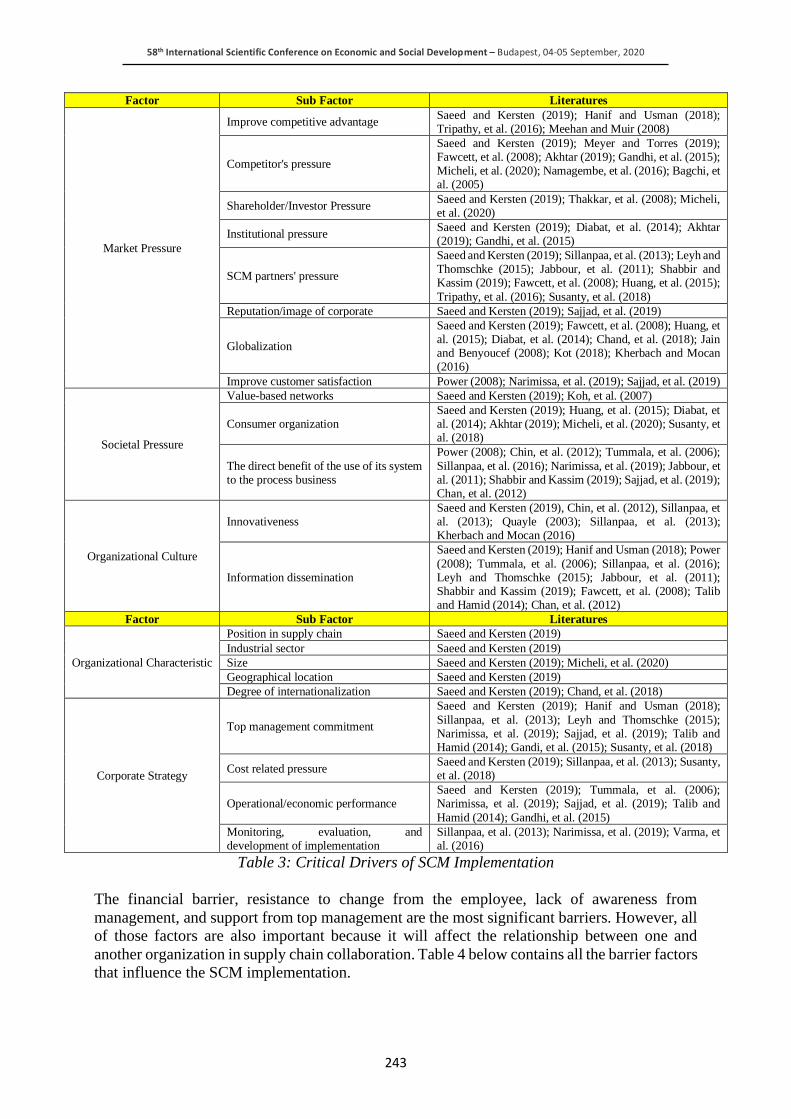
58th International Scientific Conference on Economic and Social Development – Budapest, 04-05 September, 2020
243
Factor Sub Factor Literatures
Market Pressure
Improve competitive advantage Saeed and Kersten (2019); Hanif and Usman (2018); Tripathy, et al. (2016); Meehan and Muir (2008)
Competitor's pressure
Saeed and Kersten (2019); Meyer and Torres (2019); Fawcett, et al. (2008); Akhtar (2019); Gandhi, et al. (2015); Micheli, et al. (2020); Namagembe, et al. (2016); Bagchi, et al. (2005)
Shareholder/Investor Pressure Saeed and Kersten (2019); Thakkar, et al. (2008); Micheli, et al. (2020)
Institutional pressure Saeed and Kersten (2019); Diabat, et al. (2014); Akhtar (2019); Gandhi, et al. (2015)
SCM partners' pressure
Saeed and Kersten (2019); Sillanpaa, et al. (2013); Leyh and Thomschke (2015); Jabbour, et al. (2011); Shabbir and Kassim (2019); Fawcett, et al. (2008); Huang, et al. (2015);
Tripathy, et al. (2016); Susanty, et al. (2018)
Reputation/image of corporate Saeed and Kersten (2019); Sajjad, et al. (2019)
Globalization
Saeed and Kersten (2019); Fawcett, et al. (2008); Huang, et al. (2015); Diabat, et al. (2014); Chand, et al. (2018); Jain and Benyoucef (2008); Kot (2018); Kherbach and Mocan (2016)
Improve customer satisfaction Power (2008); Narimissa, et al. (2019); Sajjad, et al. (2019)
Societal Pressure
Value-based networks Saeed and Kersten (2019); Koh, et al. (2007)
Consumer organization Saeed and Kersten (2019); Huang, et al. (2015); Diabat, et al. (2014); Akhtar (2019); Micheli, et al. (2020); Susanty, et al. (2018)
The direct benefit of the use of its system to the process business
Power (2008); Chin, et al. (2012); Tummala, et al. (2006);
Sillanpaa, et al. (2016); Narimissa, et al. (2019); Jabbour, et al. (2011); Shabbir and Kassim (2019); Sajjad, et al. (2019); Chan, et al. (2012)
Organizational Culture
Innovativeness Saeed and Kersten (2019), Chin, et al. (2012), Sillanpaa, et al. (2013); Quayle (2003); Sillanpaa, et al. (2013); Kherbach and Mocan (2016)
Information dissemination
Saeed and Kersten (2019); Hanif and Usman (2018); Power
(2008); Tummala, et al. (2006); Sillanpaa, et al. (2016); Leyh and Thomschke (2015); Jabbour, et al. (2011); Shabbir and Kassim (2019); Fawcett, et al. (2008); Talib and Hamid (2014); Chan, et al. (2012)
Factor Sub Factor Literatures
Organizational Characteristic
Position in supply chain Saeed and Kersten (2019)
Industrial sector Saeed and Kersten (2019)
Size Saeed and Kersten (2019); Micheli, et al. (2020)
Geographical location Saeed and Kersten (2019)
Degree of internationalization Saeed and Kersten (2019); Chand, et al. (2018)
Corporate Strategy
Top management commitment
Saeed and Kersten (2019); Hanif and Usman (2018);
Sillanpaa, et al. (2013); Leyh and Thomschke (2015); Narimissa, et al. (2019); Sajjad, et al. (2019); Talib and Hamid (2014); Gandi, et al. (2015); Susanty, et al. (2018)
Cost related pressure Saeed and Kersten (2019); Sillanpaa, et al. (2013); Susanty, et al. (2018)
Operational/economic performance Saeed and Kersten (2019); Tummala, et al. (2006); Narimissa, et al. (2019); Sajjad, et al. (2019); Talib and
Hamid (2014); Gandhi, et al. (2015)
Monitoring, evaluation, and development of implementation
Sillanpaa, et al. (2013); Narimissa, et al. (2019); Varma, et al. (2016)
Table 3: Critical Drivers of SCM Implementation
The financial barrier, resistance to change from the employee, lack of awareness from
management, and support from top management are the most significant barriers. However, all
of those factors are also important because it will affect the relationship between one and
another organization in supply chain collaboration. Table 4 below contains all the barrier factors
that influence the SCM implementation.
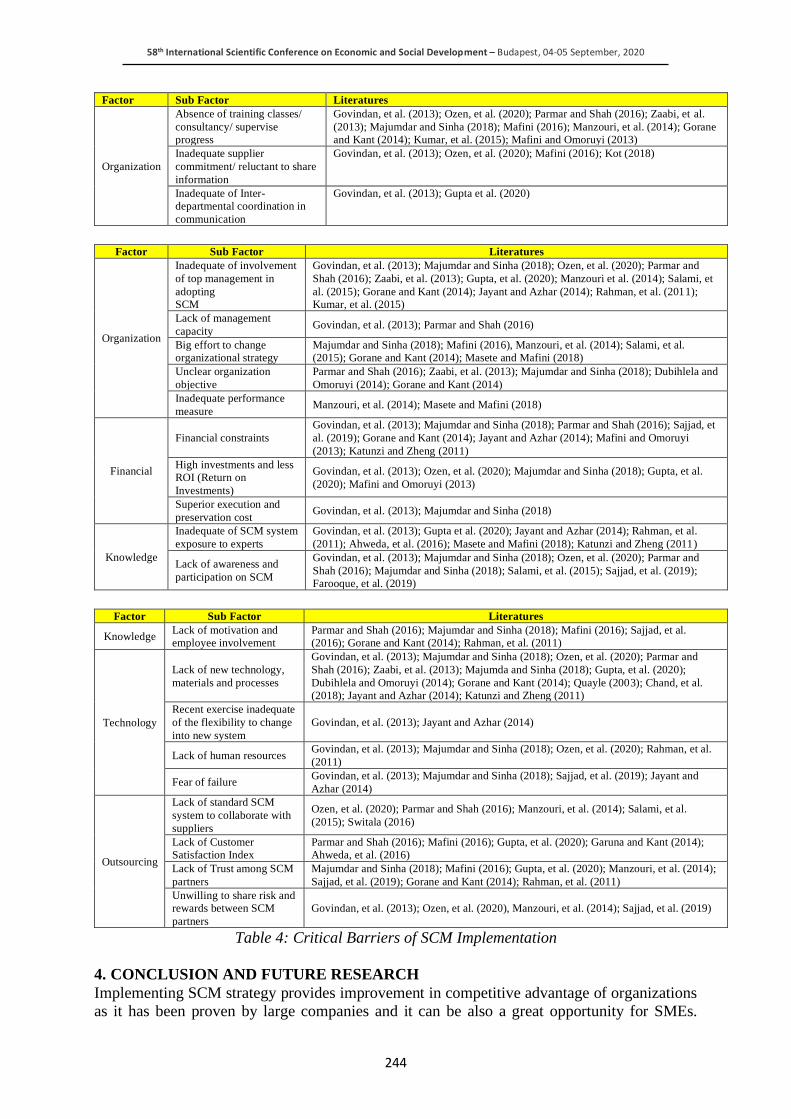
58th International Scientific Conference on Economic and Social Development – Budapest, 04-05 September, 2020
244
Factor Sub Factor Literatures
Organization
Absence of training classes/
consultancy/ supervise
progress
Govindan, et al. (2013); Ozen, et al. (2020); Parmar and Shah (2016); Zaabi, et al.
(2013); Majumdar and Sinha (2018); Mafini (2016); Manzouri, et al. (2014); Gorane
and Kant (2014); Kumar, et al. (2015); Mafini and Omoruyi (2013)
Inadequate supplier
commitment/ reluctant to share
information
Govindan, et al. (2013); Ozen, et al. (2020); Mafini (2016); Kot (2018)
Inadequate of Inter-
departmental coordination in
communication
Govindan, et al. (2013); Gupta et al. (2020)
Factor Sub Factor Literatures
Organization
Inadequate of involvement
of top management in
adopting
SCM
Govindan, et al. (2013); Majumdar and Sinha (2018); Ozen, et al. (2020); Parmar and
Shah (2016); Zaabi, et al. (2013); Gupta, et al. (2020); Manzouri et al. (2014); Salami, et
al. (2015); Gorane and Kant (2014); Jayant and Azhar (2014); Rahman, et al. (2011);
Kumar, et al. (2015)
Lack of management
capacity Govindan, et al. (2013); Parmar and Shah (2016)
Big effort to change
organizational strategy
Majumdar and Sinha (2018); Mafini (2016), Manzouri, et al. (2014); Salami, et al.
(2015); Gorane and Kant (2014); Masete and Mafini (2018)
Unclear organization
objective
Parmar and Shah (2016); Zaabi, et al. (2013); Majumdar and Sinha (2018); Dubihlela and
Omoruyi (2014); Gorane and Kant (2014)
Inadequate performance
measure Manzouri, et al. (2014); Masete and Mafini (2018)
Financial
Financial constraints
Govindan, et al. (2013); Majumdar and Sinha (2018); Parmar and Shah (2016); Sajjad, et
al. (2019); Gorane and Kant (2014); Jayant and Azhar (2014); Mafini and Omoruyi
(2013); Katunzi and Zheng (2011)
High investments and less
ROI (Return on
Investments)
Govindan, et al. (2013); Ozen, et al. (2020); Majumdar and Sinha (2018); Gupta, et al.
(2020); Mafini and Omoruyi (2013)
Superior execution and
preservation cost Govindan, et al. (2013); Majumdar and Sinha (2018)
Knowledge
Inadequate of SCM system
exposure to experts
Govindan, et al. (2013); Gupta et al. (2020); Jayant and Azhar (2014); Rahman, et al.
(2011); Ahweda, et al. (2016); Masete and Mafini (2018); Katunzi and Zheng (2011)
Lack of awareness and
participation on SCM
Govindan, et al. (2013); Majumdar and Sinha (2018); Ozen, et al. (2020); Parmar and
Shah (2016); Majumdar and Sinha (2018); Salami, et al. (2015); Sajjad, et al. (2019);
Farooque, et al. (2019)
Factor Sub Factor Literatures
Knowledge Lack of motivation and
employee involvement
Parmar and Shah (2016); Majumdar and Sinha (2018); Mafini (2016); Sajjad, et al.
(2016); Gorane and Kant (2014); Rahman, et al. (2011)
Technology
Lack of new technology,
materials and processes
Govindan, et al. (2013); Majumdar and Sinha (2018); Ozen, et al. (2020); Parmar and
Shah (2016); Zaabi, et al. (2013); Majumda and Sinha (2018); Gupta, et al. (2020);
Dubihlela and Omoruyi (2014); Gorane and Kant (2014); Quayle (2003); Chand, et al.
(2018); Jayant and Azhar (2014); Katunzi and Zheng (2011)
Recent exercise inadequate
of the flexibility to change
into new system
Govindan, et al. (2013); Jayant and Azhar (2014)
Lack of human resources Govindan, et al. (2013); Majumdar and Sinha (2018); Ozen, et al. (2020); Rahman, et al.
(2011)
Fear of failure Govindan, et al. (2013); Majumdar and Sinha (2018); Sajjad, et al. (2019); Jayant and
Azhar (2014)
Outsourcing
Lack of standard SCM
system to collaborate with
suppliers
Ozen, et al. (2020); Parmar and Shah (2016); Manzouri, et al. (2014); Salami, et al.
(2015); Switala (2016)
Lack of Customer
Satisfaction Index
Parmar and Shah (2016); Mafini (2016); Gupta, et al. (2020); Garuna and Kant (2014);
Ahweda, et al. (2016)
Lack of Trust among SCM
partners
Majumdar and Sinha (2018); Mafini (2016); Gupta, et al. (2020); Manzouri, et al. (2014);
Sajjad, et al. (2019); Gorane and Kant (2014); Rahman, et al. (2011)
Unwilling to share risk and
rewards between SCM
partners
Govindan, et al. (2013); Ozen, et al. (2020), Manzouri, et al. (2014); Sajjad, et al. (2019)
Table 4: Critical Barriers of SCM Implementation
4. CONCLUSION AND FUTURE RESEARCH
Implementing SCM strategy provides improvement in competitive advantage of organizations
as it has been proven by large companies and it can be also a great opportunity for SMEs.
58th International Scientific Conference on Economic and Social Development – Budapest, 04-05 September, 2020
245
Consequently, the implementation of SCM in SMEs has received growing research interest.
Larger companies have more resources in terms of people, finances, and other factors.
However, several barriers can be found for the SMEs related to SCM strategy implementation.
On the other hand, globalization amplifies drivers for SMEs to improve their supply chain
performance. This research provided a structured review of the literature to gain in-depth
understanding as well as a compilation of current driver and barrier factors of SCM
implementation. From the literature review we could identify 5 key factors and 22 sub-groups
both for the drivers and for the barriers of SCM implementation. Major problems are related to
the organization structure, financial dimension, pressure from an internal or external
organization, technology development, and outsourcing capability. Limitations of this research
include that we only considered articles being published in English and used only two sources
to gather the articles (ProQuest and Science Direct) which might limit the support of our
conclusions. This paper is part of a broader research scope to understand the effect of different
SCM structures on the implementation of SCM strategy. Selecting two different countries that
have different geographical and SCM structure, can be an approach investigating this effect.
Using the results of this paper, we can explore the different opinions towards driver and barrier
factors of SCM implementation. Further research can be built by measuring the main drivers
and barriers of SCM strategy implementation for SMEs. On the other hand, multiple case
studies in different countries and industry areas can also be valuable resources to enhance the
conclusions.
ACKNOWLEDGEMENT: This research has been supported by Széchenyi István University
and Stipendium Hungaricum scholarship.
LITERATURE:
1. Ahweda, A., Rahman, M.N.A., Ramli, R. and Arshad, H. (2016). Factors Related to
Performance of Supply Chain Members in SMEs. Journal of Manufacturing Technology
Management, Vol. 27, Issue 2.
2. Akhtar, P. (2019). Drivers of Green Supply Chain Initiatives and Their Impact on Economic
Performance of Firms: Evidence from Pakistan’s Manufacturing Sector. Journal of
Competitiveness, Vol. 11, No. 2, pp. 5-18.
3. Arshed, N. and Danson, M. (2015). Research Management Methods for Business &
Management. Goofellow Publisher Ltd, Wolvercote, Oxford OX2 8PS.
4. Bagchi, P.K., Ha, B.C., Larsen, T.S. and Soerensen, L.B. (2005). Supply Chain Integration:
A European Survey. The International Journal of Logistics Management, Vol. 16, No. 2,
pp. 275-294.
5. Chan, F.T.S., Chong, A.Y.L. and Zhou, L. (2012). An Empirical Investigation of Factors
Affecting e-Collaboration Diffusion in SMEs. International Journal Production Economics,
Vol. 138, pp. 329-344.
6. Chand, P., Thakkar, J.J. and Ghosh, K.K. (2018). Analysis of Supply Chain Complexity
Drivers for Indian Mining Equipment Manufacturing Companies Combining SAP-LAP and
AHP. Resources Policy, https://doi.org/10.1016/j.resourpol.2018.08.011.
7. Chin, T.A., Hamid, A.B.A., Rasli, A. and Baharun, R. (2012). Adoption of Supply Chain
Management in SMEs. Social and Behavioral Sciences, Vol. 65, pp. 614-619.
8. Chopra, S. and Meindl, P. (2016). Supply Chain Management Strategy, Planning and
Operation, 6th Edition, Pearson.
9. Diabat, A., Kannan, D. and Mathiyazhagan, K. (2014). Analysis of Enablers for
Implementation of Sustainable Supply Chain Management - A Textile Case. Journal of
Cleaner Production, Vol. 83, pp. 391-403.
58th International Scientific Conference on Economic and Social Development – Budapest, 04-05 September, 2020
246
10. Dubihlela, J. and Omoruyi, O. (2014). Barriers to Effective Supply Chain Management,
Implementation and Impact on Business Performance of SMEs in South Africa. The Journal
of Applied Business Research, Vol. 30, No. 4, pp. 1019-1030.
11. Farooque, M., Zhang, A. and Liu, Y. (2019). Barriers to Circular Food Supply Chains in
China. Supply Chain Management: An International Journal, Vol. 24, No. 5, pp. 677-696.
12. Fawcett, S.E., Magnan, G.M. and McCarter, M.W. (2008). Benefits, Barriers and Bridges
to Effective Supply Chain Management. Supply Chain Management: An International
Journal, Vol. 13, No. 1, pp. 35-48.
13. Gandhi, S., Mangla, S.K., Kumar, P. and Kumar, D. (2015). Evaluating Factors in
Implementation of Successful Green Supply Chain Management using DEMATEL: A Case
Study. International Strategic Management Review, Vol. 3, pp. 96-109.
14. Gorane, S.J. and Kant, R. (2015). Modelling the SCM Implementation Barriers – An
Integrated ISM-fuzzy MICMAC Approach. Journal of Modelling in Management, Vol. 10,
No. 2, pp. 158-178.
15. Govindan, K., Kaliyan, M., Kannan, D. and Haq, A.N. (2013). Barriers Analysis for Green
Supply Chain Management Implementation in Indian Industries Using Analytic Hierarchy
Process. International Journal Production Economics, https://dx.doi.org/10.1016/j.ijpe.
2013.08.018.
16. Gupta, H., Sarpong, S.K. and Rezaei, J. (2020). Barriers and Overcoming Strategies to
Supply Chain Sustainability Innovation. Resources, Conservation & Recycling, Vol. 161,
104819.
17. Habib, M. (2011). Supply Chain Management (SCM): Theory and Evolution, Supply Chain
Management – Application and Simulation, pp. 1-14.
18. Hanif, Y. and Usman, M. (2018). Adoption & Implementation for Supply Chain
Management in Fast Food Industry in Pakistan. International Journal for Scientific
Research & Development, Vol. 6, Issue 1, ISSN: 2321-0613.
19. Huang, X., Tan, B.L. and Ding, X. (2015). An Exploratory Survey of Green Supply Chain
Management in Chinese Manufacturing Small and Medium-Sized Enterprises. Journal of
Manufacturing Technology Management, Vol. 26, No. 1, pp. 80-103.
20. Hsu, L.L. (2005). SCM System Effects on Performance for Interaction Between Suppliers
and Buyers. Industrial Management & Data Systems, Vol. 105, No. 7, pp. 857-875.
21. Jabbour, A.B.L.S., Filho, A.G.A., Viana, A.B.N. and Jabbour, C.J.C. (2011). Factors
Affecting the Adoption of Supply Chain Management Practices: Evidence from the
Brazilian Electro-Electronic Sector. IIMB Management Review, Vol. 23, pp. 208-222.
22. Jain, V. and Benyoucef, L. (2008). Managing Long Supply Chain Networks: Some
Emerging Issues and Challenges. Journal of Manufacturing Technology Management, Vol.
19, No. 4, pp. 469-496.
23. Jayant, A. and Azhar, M. (2014). Analysis of the Barriers for Implementing Green Supply
Chain Management (GSCM) Practices: An Interpretive Structural Modeling (ISM)
Approach. Engineering, Vol. 97, pp. 2157-2166.
24. Katunzi, T.M. and Zheng, Q. (2011). Supply Chain Management (SCM) and Small and
Medium-Sized Enterprises (SMEs): Is it a Myth?. Applied Mechanics and Materials, Vol.
58-60, pp. 2613-2620.
25. Kherbach, O. and Mocan, M.L. (2016). The Importance of Logistics and Supply Chain
Management in the Enhancement of Romanian SMEs. Social and Behavioral Sciences, Vol.
221, pp. 405-413.
26. Koh, S.C.L., Demirbag, M., Bayraktar, E., Tatoglu, E. and Zaim, S. (2007). The Impact of
Supply Chain Management Practices on Performance of SMEs. Industrial Management &
Data Systems. Vol. 107, No. 1, pp. 103-124.
58th International Scientific Conference on Economic and Social Development – Budapest, 04-05 September, 2020
247
27. Kot, S. (2018). Sustainable Supply Chain Management in Small and Medium Enterprises.
Sustainability, Vol. 10, doi: 10.3390/su10041143
28. Krippendorff, K. (2004). Content Analysis – An Introduction to Its Methodology. Sage
Publications, United States of Amarica.
29. Kumar, R., Singh, R.K. and Shankar, R. (2015). Critical Success Factors for
Implementation of Supply Chain Management in Indian Small and Medium Enterprises and
Their Impact on Performance. IIMB Management Review, https://dx.doi.org/
10.1016/j.iimb.2015.03.001.
30. Leyh, C. and Thomschke, J. (2015). Critical Success Factors for Implementing Supply
Chain Management Systems – The Perspective of Selected German Enterprises. Proceeding
of the Federal Conference on Computer Science and Information System, Vol. 5, pp. 1403-
1413.
31. Mafini, C. (2016). Barriers to Public Supply Chain Management Strategy Implementation:
An Exploratory Diagnosis. Problems and Perspective in Management, Vol. 14, Issue 3.
32. Mafini, C. and Omoruyi, O. (2013). Logistics Benefit and Challenges: The Case of SMEs
in a South African Local Municipality. The Southern African Journal of Entrepreneurship
and Small Business Management, Vol 6, pp. 145-167.
33. Majumdar, A. and Sinha, S.K. (2018). Analyzing the Barriers of Green Textile Supply Chain
Management in South East Asia using Interpretive Structural Modeling. Sustainable
Production and Consumption, https://doi.org/10.1016/j.spc.2018.10.005.
34. Manzouri, M., Rahman, M.N.A., Arshad, H. and Ismail, A.R. (2010). Barriers of Supply
Chain Management Implementation in Manufacturing Companies: A Comparison Between
Iranian and Malaysian Companies, Journal of the Chinese Institute of Industrial Engineers,
Vol. 27, No. 6, pp. 456-472.
35. Masete, M.Z. and Mafini, C. (2018). Internal Barriers to Supply Chain Management
Implementation in a South African Traditional University. Journal of Transport and Supply
Chain Management, Vol. 12, https://doi.org/10.4102/jtscm.v12i10.389
36. Meehan, J. and Muir, L. (2008). SCM in Merseyside SMEs: Benefits and Barriers. The
TQM Journal, Vol. 20, No. 3, pp. 223-232.
37. Meyer, C.M. and Torres, E.L.G. (2019). Success Factors for Supply Chain Management
Projects: An Empirical Analysis. IFAC Papers Online, Vol. 52, No. 13, pp. 153-158.
38. Micheli, G.J.L., Cagno, E., Mustillo, G. and Trianni, A. (2020). Green Supply Chain
Management Drivers, Practices and Performance: A Comprehensive Study on the
Moderators. Journal of Cleaner Production, Vol. 259, 121024.
39. Namagembe, S., Sridharan, S. and Ryan, S. (2016). Green Supply Chain Management
Practice Adoption in Ugandan SME Manufacturing Firms: The Role of Enviropreneurial
Orientation. World Journal of Science, Technology and Sustainable Development, Vol. 13,
Issue. 3.
40. Narimissa, O., Farahani, A.K. and Zavardehi, S.M.A. (2019). Drivers and Barriers for
Implementation and Improvement of Sustainable Supply Chain Management. Sustainable
Development, https://doi.org/10.1002/sd.1998.
41. Neagu, C. (2016). The Importance and Role of Small and Medium Sized Businesses.
Theoretical and Applied Economics, Vol. 23, No. 3, pp. 331-338.
42. OECD (2016). Enhancing the Contributions of SMEs in a Global and Digitalized Economy.
Retrieved 26.07.2020 from https://www.oecd.org/industry/C-MIN-2017-8-EN.pdf.
43. OECD (2019). International Trade Statistics: Trends in Second Quarter 2019, Retrieved
07.07.2020 from https://www.oecd.org/newsroom/international-trade-statistics-trends-in-
second-quarter-2019.htm.
58th International Scientific Conference on Economic and Social Development – Budapest, 04-05 September, 2020
248
44. Ozen, Y.D.O., Kazancoglu, Y. and Mangla, S.K. (2020). Synchronized Barriers for
Circular Supply Chain in Industry 3.5/Industry 4.0 Transition for Sustainable Resource
Management. Resources, Conservation & Recycling, Vol. 161, 104986.
45. Parmar, V. and Shah, H.G. (2016). A Literature Review on Supply Chain Management
Barriers in Manufacturing Organization. International Journal of Engineering
Development, Vol. 4, Issue 1, ISSN: 2321 – 9939.
46. Parmar, V. and Shah, H.G. (2016). To Identify Critical Barriers of Supply Chain
Management in Manufacturing Organization by ISM (Interpretive Structural Modeling).
International Research Journal of Engineering and Technology, Vol. 3, Issue 4, pp. 2548-
2559.
47. Power, D. (2008). Adoption of Supply Chain Management Enabling Technologies:
Comparing Small, Medium and Larger Organizations. Operations and Supply Chain
Management, Vol. 1, No. 1, pp. 31-42.
48. Quayle, M. (2003). A Study of Supply Chain Management Practice in UK Industrial SMEs.
Supply Chain Management: An International Journal, Vol. 8, No. 1, pp. 79-86.
49. Rahman, M.N.A., Wasilan, H., Deros, B.M. and Ghani, J.A. (2011). Barriers of SCM in
SMEs. Applied Mechanics and Materials, Vol. 44-47, pp. 3997-4001.
50. Saeed, M.A. and Kersten, W. (2019). Drivers of Sustainable Supply Chain Management:
Identification and Classification. Sustainability, Vol. 11, doi:10.3390/su11041137.
51. Sajjad, A., Eweje, G. and Tappin, D. (2019). Managerial Perspectives on Drivers for and
Barriers to Sustainable Supply Chain Management Implementation: Evidence from New
Zealand. Business Strategy and the Environment, pp. 1-13, doi: 10.1002/bse.2389
52. Salami, E., Aydinli, S. and Oral, E.L. (2013). Barriers to the Implementation of Supply
Chain Management Case of Small to Medium Sized Contractors in Turkey. International
Journal of Science and Research, Vol. 5, Issue 9, pp. 516-520.
53. Seuring, S. and Müller, M. (2008). From Literature Review to a Conceptual Framework for
Sustainable Supply Chain Management. Journal of Cleaner Production, Vol. 16, pp. 1699-
1710.
54. Shabbir, M.S. and Kassim, N.M. (2018). Supply Chain Management Drivers and
Sustainability of Green Initiatives in Manufacturing Enterprises: A Case in Pakistan.
International Journal of Entrepreneurship, Vol. 22, Special Issue.
55. Silanpaa, I., Malek, N.A.A. and Takala, J. (2013). Critical Attributes on Supply Chain
Strategy Implementation: Case Study in Europe and Asia. Management and Production
Engineering Review, Vol. 4, No. 4, pp. 66-75.
56. Stadtler, H., Kilger, C. and Meyr, H. (2015). Supply Chain Management and Advanced
Planning – Concepts, Models, Software, and Case Studies, 5th Edition, Springer.
57. Susanty, A., Sari, D.P., Rinawati, D.I. and Setiawan, L. (2018). The Role of Internal and
External Drivers for Successful Implementation of GSCM Practices. Journal of
Manufacturing Technology Management, doi: 10.1108/JMTM-07-2018-0217.
58. Switala, M. (2016). Enterprises’ Readiness to Establish and Develop Collaboration in the
Area of Logistics, Scientific Journal of Logistics, Vol. 12, No. 3, pp. 215-224.
59. Talib, M.S.A. and Hamid, A.B.A. (2014). Application of Critical Success Factors in Supply
Chain Management. International Journal Supply Chain Management, Vol. 3, No. 1, pp.
21-33.
60. Thakkar, J., Kanda, A. and Deshmukh, S.G. (2008). A Conceptual Role Interaction Model
for Supply Chain Management, Journal of Small Business and Enterprise Development,
Vol. 15, No. 1, pp. 74-95.
61. Thakkar, J., Kanda, A. and Deshmukh, S.G. (2008). Supply Chain Management in SMEs:
Development of Constructs and Propositions. Asia Pacific Journal of Marketing and
Logistics, Vol. 20, No. 1, pp. 97-131.

58th International Scientific Conference on Economic and Social Development – Budapest, 04-05 September, 2020
249
62. Tripathy, S., Aich, S., Chakraborty, A. and Lee, G.M. (2016). Information Technology is
an Enabling Factor Affecting Supply Chain Performance in Indian SMEs. Journal of
Modelling in Management. Vol. 11, No. 1, pp. 269-287.
63. Tummala, V.M.R., Phillips, C.L.M. and Johnson, M. (2006). Assessing Supply Chain
Management Success Factors: A Case Study. Supply Chain Management: An International
Journal, Vol. 11, No. 2, pp. 179-192.
64. Varma, S., Wadhwa, S. and Deshmukh, S.G. (2006). Implementing Supply Chain
Management in a Firm: Issues and Remedies. Asia Pacific Journal of Marketing and
Logistics, Vol. 18, No. 3, pp. 223-243.
65. Yu, D.Z. and Cheng, T.C.E. (2001). Benefits of Information Sharing with Supply Chain
Partnerships. Industrial Management & Data Systems, Vol. 101, No. 3, pp. 114-119.
66. Zaabi, S.A., Dhaheri, N.A. and Diabat, A. (2013). Analysis of Interaction Between the
Barriers for the Implementation of Sustainable Supply Chain Management. International
Journal Advance Manufacturing Technology, Vol. 68, pp. 895-905.
58th International Scientific Conference on Economic and Social Development – Budapest, 04-05 September, 2020
250
UNETHICAL BEHAVIOR IN ORGANIZATIONS – AN AGENT-BASED
APPROACH
Tamas Sneider
Széchenyi István University
9026, Egyetem square 1, Győr, Hungary
ABSTRACT
This paper introduces an agent-based modelling approach to understanding unethical behavior
in organizations. Understanding why people behave unethically is a widely researched topic in
the field of business ethics, but researchers tend to use a static approach to this question,
resulting in findings with rather limited applicability. This paper builds on the theoretical
foundations of complex systems and the method of computational modelling in presenting the
process of building an agent-based model that simulates the spread of unethical behavior. The
initial observations of this model are discussed along with its limitations and its potential for
future improvement.
Keywords: unethical behavior, complex adaptive system, agent-based modelling
1. INTRODUCTION
Understanding the causes and consequences of unethical behavior in organizations is a highly
relevant topic in our contemporary business environment. Large companies invest heavily in
building up their compliance departments and combating the harmful consequences of unethical
behavior, still always new scandals emerge that shock people and often ruin corporations. We
can think of the example of Enron, but also more recently Volkswagen or Boeing. It has been
a challenge from academic perspective to produce valuable knowledge that can help businesses
face this issue. Scholarly work in that looks at unethical behavior in business mostly follows
the standards of cognitive and behavioral psychology, trying to uncover correlational and causal
relationships between individual and contextual factors and mental processes that lead
individuals to engage in unethical behavior (Treviño, 1986). However, the models produced by
this type of research are necessarily static, and always look at one level of reality at a time
(individual or organizational). In this paper I suggest a relatively underutilized approach for
studying unethical behavior: computational modelling, and more specifically agent-based
modelling. Using an approach in business ethics which is built on a complex systems approach
is not without example, but it is certainly rare. Brass et al. (1998), for example, connected
network theory with organizational and personal characteristics to propose hypotheses on what
influences the spread of unethical behavior in organizations. Zuber, (2015) also proposed a
framework which provides a basis for the development of a formal stochastic actor-oriented
model of network dynamics which can be used to simulate the spread of unethical behavior.
Ashforth & Anand (2003), as well as den Nieuwenboer and Kaptein, (2008) look at the
dynamics of the growth of organizational corruption. Building on these previous works, in this
paper, I describe an attempt at creating an agent-based model which can simulate the spread of
unethical behavior and can help in understanding the role of certain organizational and personal
factors. It is important to highlight that here I only aim to lay down the foundations of this
possible research project. Therefore this paper has the following goals: (i) summarize the basic
understanding of computational modelling and how this is used in social and organizational
studies; (ii) find which parts of the existing literature in business ethics can be used to build a
computational model; and (iii) build an initial model that can be revised in further iterations.
The next section starts with an introduction to computational models of social life and continues
with the discussion of how this method can be applied in organizational research.
58th International Scientific Conference on Economic and Social Development – Budapest, 04-05 September, 2020
251
2. THEORY OF COMPUTATIONAL MODELLING IN SOCIAL SCIENCES
2.1. Complex adaptive systems
As Miller and Page (2009) describe, Adam Smith’s analysis of the driving forces of the
economy was one of the earliest descriptions of complex systems where the outcomes of the
system are the result of the action of independent agents. As social sciences developed, the
emphasis shifted from theorizing to tool-building, which led to ‘smart but not wise’ science.
Models built in this tradition are often static and have unrealistic premises, such as very few or
infinitely many agents who are not very diverse either. With the help of complex systems
science, we can look at ‘in between’ states and stages that are much closer to real life. Miller
and Page also highlight, that although many traditional mathematical models can provide a
good understanding of phenomena that are complicated, they usually break down when being
used for complex systems with emergent features. The difference between complicated and
complex can best be captured this way: in a complicated system, there may be various different
elements, and they tend to be independent from each other. Removing one element will not
change the system’s behavior fundamentally. In a complex system however, the dependence
between the elements is of utmost importance. In a complex system removing an element
changes the dynamics of the system in a way that is not deducible from the properties of the
element that has been removed. Therefore, a complicated system can be reduced to its atomic
parts, those parts can be studied separately, and the finding can be summed up in order to answer
questions about the system, but this is theoretically impossible in case of complex systems.
Social agents form complex systems through their connections that may continually undergo
adaptive changes. They make choices with the help of their cognitive abilities, but as these are
limited they often rely on simplifications and heuristics (Simon, 1997). With computational
modelling that incorporates the basic features of complexity, we can investigate issues that are
not yet well understood, such as the relationship between agent sophistication and system
outcomes, the role of heterogeneity in the robustness of a system, and the role of control on
social worlds. In computational modelling, we want to find out how the lower level entities
form the higher-level entities, i. e. we are interested in emergence. Emergence at its most basic
form suggests that the behavior of a system is in some way different from what one can
understand by aggregating the behavior of its parts. Well known and established theorems
related to emergence are the Law of Large Numbers and the Central Limit Theorem. These are
built on the idea of disorganized complexity, where the variation in the variables averages out,
since extremely high values are cancelled out by extremely low values. Theorems built on
disorganized complexity are useful in an environment where the parts are not interdependent
and variable values are random. However, much of the social world exhibits different patterns,
what we can call organized complexity. In such cases, the resulting distributions will not be
normal, and feedback, especially of the positive type, plays an important role. In agent-based
computational modelling, the aim is to understand bottom-up mechanisms. The models’ basic
elements are agents, who are endowed with certain features and attributes. The object of
investigation is the interaction of these agents, and the systemwide features and attributes that
emerge from these interactions. A potential weakness of computational approaches is that
axiomatic proofs may be claimed as superior, as they deductively guarantee their outcome,
while computational experiments provide only inductive proof in most cases. However, the
deductive elegance often has the cost of the reduction of the problem and its elements to a level
where they do not sufficiently resemble reality anymore. Perhaps the best overall approach is
to find where computational models can have added value, and where we should stick to more
traditional modelling techniques. Old tools and new ones are not substitutes but complements
to each other.
58th International Scientific Conference on Economic and Social Development – Budapest, 04-05 September, 2020
252
2.2. Agent-based modelling in organizational research
Gómez-Cruz, Loaiza Saa and Ortega Hurtado, (2017) provide a comprehensive overview of the
use of agent-based approaches used in the organizational studies literature. As they point out,
organizations inherently contain complexity and uncertainty. However, the use of
computational modelling is still not as widely adopted as in other disciplines, especially in
natural sciences. They also distinguish three concepts that are interrelated but cover different
meanings. Agent-based complex systems refer to the systems in the real world, that can be
understood as the result of the interaction of its parts (agents). They display some common
features, such as sensitivity to initial conditions and path-dependence. Agent-based models are
abstractions of the agent-based complex systems, and they include three key components: (i)
the agents that form the system; (ii) an environment; and (iii) the interaction between the agents
and the environment. An agent is defined as “an autonomous computational entity that has its
own behavior and attributes” (Gómez-Cruz et al., 2017, p. 314). In the case of modelling
organizations, agents can represent social actors, such as employees, customers or suppliers,
but they can also represent entities on a lower level such as ‘strategies’ (as in game theory) or
entities on a higher level, such as clusters or countries. The environment always has a
predefined topology that can be a network, a Euclidian space, or a geospatial landscape. Agent-
based simulations are the computational implementation of agent-based models and they
provide the means for gathering data about the system and its dynamics. As the goal of such
simulations is to represent interactions and emergent phenomena that are caused by them, they
are usually not focused on technical implementation but on conceptual clarity. In addition to
understanding complex phenomena, agent-based models and simulations may also be used for
aiding decision-making and problem-solving, thus they can become useful tools in management
theory and practice. Agent-based approaches are specifically suitable for studying
organizational behavior, because the most interesting problems are non-linear, and simple
causal relationships are overwritten with complex dynamics. Organizations are systems that
have autonomous and heterogeneous agents who do not possess global knowledge of the
system. They act locally, in parallel, and distributed ways, that result in discontinuous, non-
linear, and asynchronous interactions. The spatial and temporal components are also important,
as they provide the opportunity for learning and adaptation. A specific example of using agent-
based modelling in an organizational setting is the analysis of flock leadership by Will (2016).
Leadership and management in general are often associated with command and control,
however it is pointed out by Will that effective leadership is rather about being able to
understand interactive dynamics of the organization. Some groundwork on the theoretical side
has been laid down earlier that uses complexity theory as a basis for leadership research, but
there is still a lot of room for answering specific questions building on these fundamentals. Will
uses a flocking model implemented in NetLogo, that is a specific type of agent-based model
suitable for representing autonomous agents’ behavior resulting in emergent collective
phenomena. In such a model, the agents have specific interaction rules that take into
consideration the behavior of other agents in the model. There are three basic types of
behavioral rules in Will’s model: separation, alignment and coherence. Behavioral rules are
translated into spatial concepts, where turning and moving towards or away from peers
represents closeness in working out solutions to problems. Three collective behavioral patterns
are found and described in the model: convergent, volatile and non-convergent. Convergent
patterns are equated to technical capacity in behavioral terms, since they represent a tendency
of the group to move forward effectively in the same direction to solve challenges posed by the
environment. Volatility is translated into adaptive capacity, as this pattern leads to quick
transformations that can be understood as new perspectives and cognitive content. Non-
convergence is mapped to incapacity, as the group in this case shows net movement close to
zero, meaning that there is a lack of capacity for systematic change.
58th International Scientific Conference on Economic and Social Development – Budapest, 04-05 September, 2020
253
Will uses BehaviorSearch (Stonedahl, 2010), a software that uses a heuristic-based search
problem approach to discover the parameter space and generated data in NetLogo. This can
lead to identifying rule parameter values that most likely result in specific collective behaviors.
For example, it is found that technical capacity is best achieved by a moderately strong
separation parameter, very strong alignment and peer exposure parameters and weak coherence
and conformity intolerance parameters. Similarly, the parameter setups are discussed for the
remaining two collective behavioral patterns.
3. MODELS IN BUSINESS ETHICS
Business ethics is a now established discipline that is centered around studying the questions of
morality, as well as ethical and unethical behavior in business. Understanding the causes of
unethical behavior in organizations has been an important topic within the business ethics
literature since the conception of the field, and despite how dedicated business ethics outlets
highlight the importance of conceptual and methodological diversity, there are some dominant
trends in how well-accepted research on this topic is done. In this section I discuss these trends
through examples and pinpoint some of the limitations they have.
3.1. Methodology in business ethics
Most business ethics research is based on the positivist or post-positivist paradigm. “Positivism
is a belief system arising out of practices in the natural sciences which assume that matters that
are the subject of research are susceptible of being investigated objectively, and that their
veracity can be established with a reasonable degree of certainty.”(Brand, 2009, p. 432) Post-
positivism, on the other hand, postulates that the world cannot be fully known in its objectivity,
but we can get closer and closer to an ideal state of knowledge through setting up hypotheses,
and attempting to falsify them. As long as the hypothesis cannot be falsified, it can be accepted
as the best possible answer or explanation (Popper, 2002). The practical application of this
relies most heavily on verification of hypotheses through statistical significance testing, which
is also the most widespread approach in business ethics research. Likert scale surveys and
laboratory experiments are the most typical tools used for data gathering. A typical research
method can be illustrated through the paper of Brunner & Ostermaier (2019). Based on
established concepts in the literature, the authors develop five hypotheses about the relation of
honesty in reporting costs for reimbursement and peer influence. They recruited 174 students
from a large European university, who participated in a set of experiments. In one setting, there
are two reporting managers and one supervisor. Managers have an endowment of 200 units and
have a random investment to make with costs between 20 and 100 units, with expected value
of 60 units. The expected profit with random variation is 200 units. The supervisors refund the
costs but keep the profit that was received from the investment. The expected payoff, in case of
honesty is 200 units for both the managers and the supervisors. Report submission is successive,
so the reactive behavior of the second manager can be observed. Also, each manager gives an
expectation of the report of the other manager. The conditions are separated by how much
information the managers have about the other’s activity. Under full transparency, managers
know each other’s reports and actual costs. Under partial transparency, managers know each
other’s reports, but not their actual costs. The question in each condition is that how big of a
‘slack’ the managers put on top of their costs in their reports. The participants do ten rounds of
the game, and after each round, participants keep their role but are paired up with different
participants. The rules are common knowledge to the participants, and they gain actual
monetary rewards based on how many units they earned throughout the experiments. Using
statistical analysis of the amounts of slack in the different conditions, the authors find support
for all their hypothesis and they draw the conclusion that information about peers’ behavior has
significant impact on the honesty of reporting costs.
58th International Scientific Conference on Economic and Social Development – Budapest, 04-05 September, 2020
254
Another typical research method is followed by Valle, Kacmar and Zivnuska (2019). This paper
investigates the effect of moral disengagement on unethical pro-organizational behavior (UPB).
The first hypothesis of the paper is that moral disengagement will positively mediate the
relationship between Perception of Organizational Politics (POP) an UPB. The other
hypotheses are centered around regulatory focus theory, distinguishing between promotion
focus and prevention focus. In their first study 101 university students were asked to evaluate
a described internship experience, one group assigned to a high politics perceptions condition,
and the other assigned to a low politics perception framed narrative. Survey questions measured
the participants’ propensity to moral disengage and unethical pro-organizational behaviors. The
second study was based on an online survey with two rounds, six weeks apart. The first round
measured POP, the second measured moral disengagement, UPB and regulatory focus. Through
the statistical analysis of the data gathered from the survey responses, the hypotheses were
supported, and the paper concludes that there is statistically significant relationship between
POP and unethical behavior that is mediated by moral disengagement. Due to the sensitive
nature of the core questions of business ethics, data are hard to get, and it is probably going to
get even harder as we move forward. Even when researchers get data, there is always a
considerable level of doubt if the data is the true reflection, of what the researchers want to
investigate. There are two main issues that can often make findings questionable: the use of
proxy variables and the use of proxy subjects. The use of proxy variables means that an ethics
related concept cannot be measured directly, therefore the researcher needs to find something
that is measurable and is in strong correlation with the specific concept. For example in the case
of CEO narcissism, a composite measure that is based on the size of the CEO-s picture in
company reports and the relative earnings of the CEO are used as proxies for narcissism
(Marquez-Illescas et al., 2019). There is no question about the objective measurability of these
data, and their stochastic relation to the concept of narcissism, but it is far from obvious whether
they actually capture narcissism as a personality trait. The use of proxy subjects means that
researchers use a population that they have access to, most often university students or faculty
members, but they draw conclusions in a business context. For example Wang, Zhong, and
Murnighan (2014) present interesting findings about the relation of calculative decision making
and unethical outcomes that can be highly relevant in the context of business organizations.
However, the fact that their research subjects were all undergraduate students may raise some
doubts if the same result could be replicated with professionals in different business contexts.
I do not aim to question the rigor or the validity of findings in these works, but I agree with
Campbell and Cowton (2015) that in business ethics, an implicit assumption has been formed
that only statistical data can be robust and legitimate, while other approaches are often
neglected, although mixed methods may provide a better way for answering some of the
questions in this domain.
3.2. Concepts in business ethics
Trevino’s paper (1986) on ethical decision-making in organizations is one of the foundational
and most highly cited works in the behavioral ethics literature. She proposed an interactionist
model, in which the cognitive moral development of the individual is the most important
element, but other individual and situational factors also play a role in making a decision about
an ethical dilemma. This model has inspired a lot of empirical research, which have been
reviewed by Treviño et al. (2006). They present an expanded model which considers cognitive
processes (moral awareness, moral judgement, moral disengagement, cognitive biases) as well
as affective and identity-based factors. Among organizational contextual factors they include
language, reward/punishment, ethical infrastructure, ethical climate/culture and leadership in
the model. Kish-Gephart et al. (2010) published a meta-analytic study in which they analyzed
a large set of available empirical data in relation to the propositions of these models. They found
58th International Scientific Conference on Economic and Social Development – Budapest, 04-05 September, 2020
255
support for the relation to unethical choices and behavior of cognitive moral development; the
moral philosophy of idealism and relativism; Machiavellianism; locus of control; job
satisfaction; gender; age; the moral intensity of the issue; egoistic, benevolent and principled
ethical climates; the strength of ethical cultures; and the enforcement of code of conducts.
However, they did not find support for the relation of education level and the existence of a
code of conduct to unethical intention and behavior. On the one hand, this richness of factors
that influences unethical behavior in organizations can be informative, on the other hand, it
makes it very difficult to model unethical behavior in a dynamic way. Therefore I would like
to merge this group of models with that of Zsolnai (2012). He presents a two-factor model in
which the moral character of the agents and the relative cost of ethical behavior determine if
the agent behaves ethically or unethically. Though his model was not created specifically for
studying organizational unethical behavior, its general framework makes it applicable in this
setting as well. The first factor in this model can be understood as a combination of all
individual factors described above, while the second factor can provide a more systematic
understanding of the situational factors through understanding them in the economic terms of
relative costs. This enables the building of a dynamic model that is discussed in the next section.
4. BUILDING A MODEL IN NETLOGO
4.1. Building the initial model
In this project, NetLogo (Wilensky, 1999) is used for building the model. As Wilensky and
Rand (2015) highlight, NetLogo is the most widely used agent-based modelling environment.
It was created by Uri Wilensky in 1999 and has continuously been developed since then. The
tool has extensive documentation and another great advantage of it is that it is open source and
free to use. Wilensky and Rand (2015) provide guidance on how one can build a model from
ground up. They distinguish two types models based on the model’s objective: phenomena-
based modelling and exploratory modelling. In the former the goal is to reproduce a known
pattern on a higher level and investigate the mechanisms on the lower level that can provide
explanation for the emergence of the pattern. In the latter, the agents are created with a preset
behavior and the modeler observes the patterns that emerge on the system level (perhaps this is
also a reason why the person running the model is referred to as the observer in NetLogo
terminology). The first type corresponds to a top-down approach, where the research questions
are preset and more exact, while the second corresponds to a bottom-up approach, where the
research questions might be less clearly formulated, and the conceptual model is continuously
evolving as the model is being built up and perfected. The bottom-up approach is closer to the
way I attempt to use NetLogo in this project. The authors also call attention to the ‘ABM design
principle’ which basically instructs modelers to keep their models as simple as possible and
free from redundant elements. The process of modelling in Netlogo includes setting up agents
with specific features and rules of behavior. Agents can be one of three types: turtles, patches
and links. Turtles represent agents that are ‘alive’, they can move around and reproduce. Patches
can be considered as the building blocks of the environment, and they can also be set up with
rules. Links are relations among the previous two types of agents. When a model is run, a timer
moves forward in discrete time steps that are called ‘ticks’, and the agents can interact with
each other based on the coded rules. The observer can run the model and observe the results of
the interactions as ticks progress. The observer can rerun the model as many times as necessary
to make multiple observations. The initial model that I have already set up consists of a number
of initial turtles, their initial endowment of score and ethicality and two general variables, one
representing the relative cost of ethical behavior and another that is named diversity. Based on
the previously mentioned model of Zsolnai (2013) the two most important parameters in the
model are the moral character of the agents (termed ethicality in the model) and the relative
cost of ethical behavior.
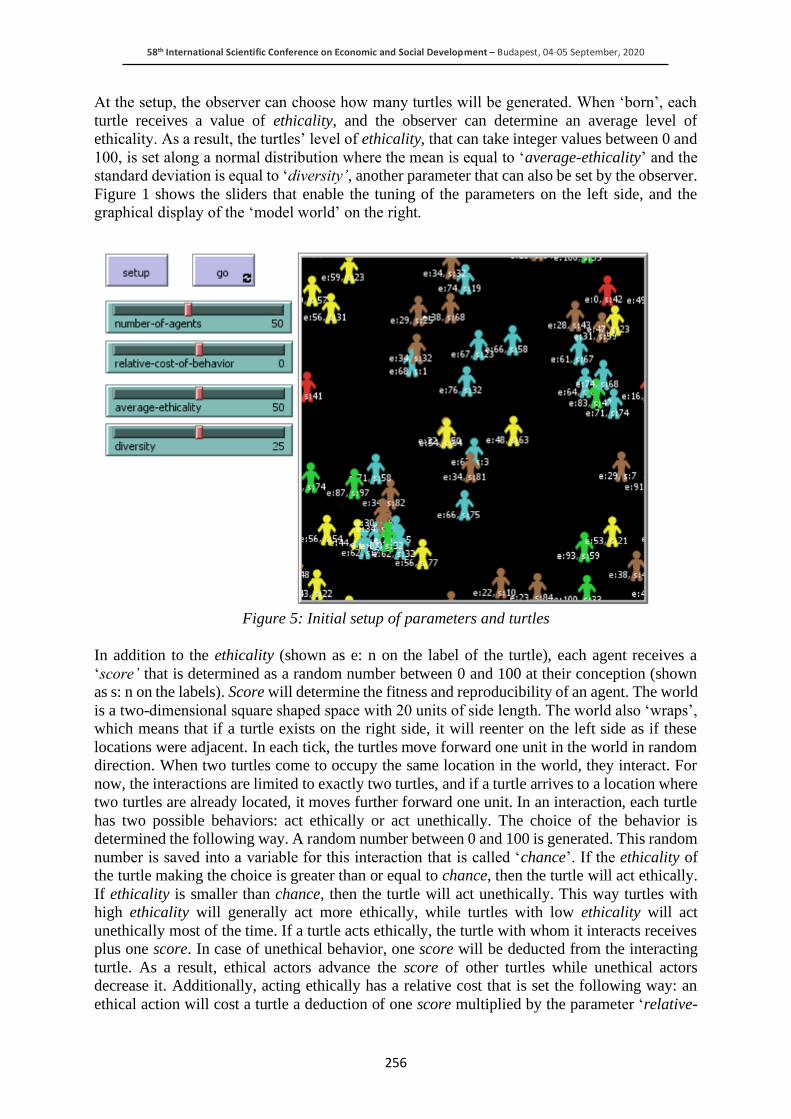
58th International Scientific Conference on Economic and Social Development – Budapest, 04-05 September, 2020
256
At the setup, the observer can choose how many turtles will be generated. When ‘born’, each
turtle receives a value of ethicality, and the observer can determine an average level of
ethicality. As a result, the turtles’ level of ethicality, that can take integer values between 0 and
100, is set along a normal distribution where the mean is equal to ‘average-ethicality’ and the
standard deviation is equal to ‘diversity’, another parameter that can also be set by the observer.
Figure 1 shows the sliders that enable the tuning of the parameters on the left side, and the
graphical display of the ‘model world’ on the right.
Figure 5: Initial setup of parameters and turtles
In addition to the ethicality (shown as e: n on the label of the turtle), each agent receives a
‘score’ that is determined as a random number between 0 and 100 at their conception (shown
as s: n on the labels). Score will determine the fitness and reproducibility of an agent. The world
is a two-dimensional square shaped space with 20 units of side length. The world also ‘wraps’,
which means that if a turtle exists on the right side, it will reenter on the left side as if these
locations were adjacent. In each tick, the turtles move forward one unit in the world in random
direction. When two turtles come to occupy the same location in the world, they interact. For
now, the interactions are limited to exactly two turtles, and if a turtle arrives to a location where
two turtles are already located, it moves further forward one unit. In an interaction, each turtle
has two possible behaviors: act ethically or act unethically. The choice of the behavior is
determined the following way. A random number between 0 and 100 is generated. This random
number is saved into a variable for this interaction that is called ‘chance’. If the ethicality of
the turtle making the choice is greater than or equal to chance, then the turtle will act ethically.
If ethicality is smaller than chance, then the turtle will act unethically. This way turtles with
high ethicality will generally act more ethically, while turtles with low ethicality will act
unethically most of the time. If a turtle acts ethically, the turtle with whom it interacts receives
plus one score. In case of unethical behavior, one score will be deducted from the interacting
turtle. As a result, ethical actors advance the score of other turtles while unethical actors
decrease it. Additionally, acting ethically has a relative cost that is set the following way: an
ethical action will cost a turtle a deduction of one score multiplied by the parameter ‘relative-
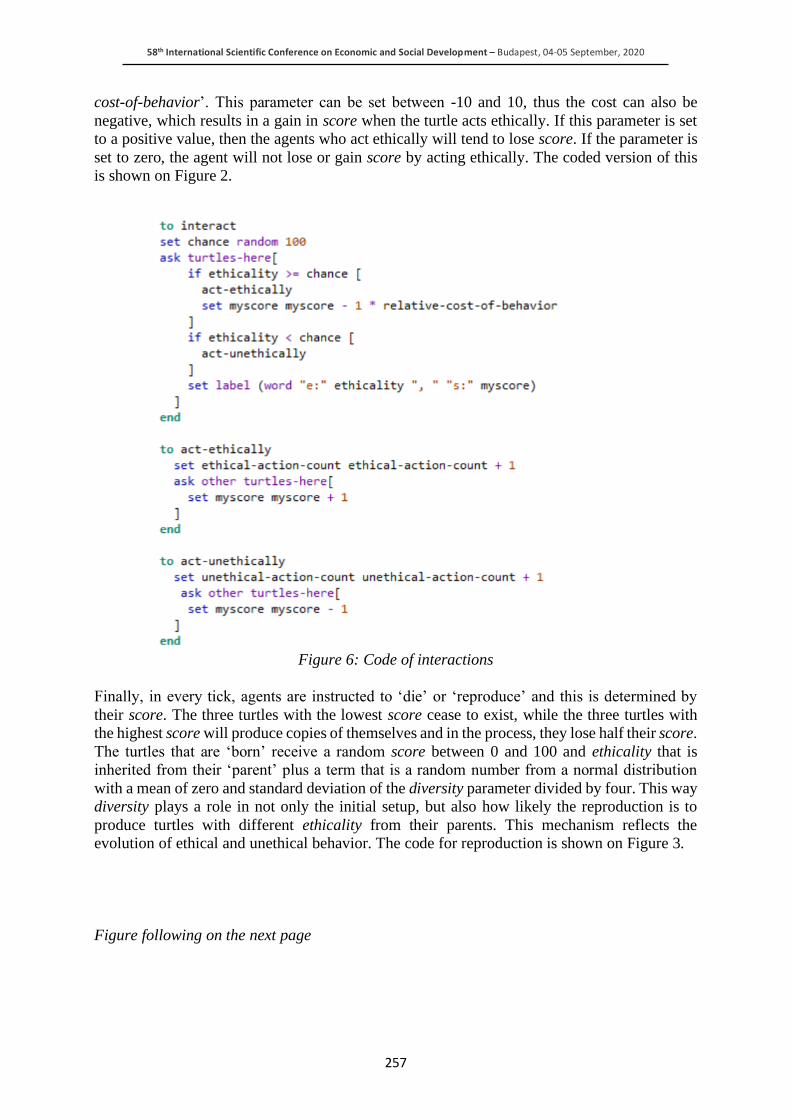
58th International Scientific Conference on Economic and Social Development – Budapest, 04-05 September, 2020
257
cost-of-behavior’. This parameter can be set between -10 and 10, thus the cost can also be
negative, which results in a gain in score when the turtle acts ethically. If this parameter is set
to a positive value, then the agents who act ethically will tend to lose score. If the parameter is
set to zero, the agent will not lose or gain score by acting ethically. The coded version of this
is shown on Figure 2.
Figure 6: Code of interactions
Finally, in every tick, agents are instructed to ‘die’ or ‘reproduce’ and this is determined by
their score. The three turtles with the lowest score cease to exist, while the three turtles with
the highest score will produce copies of themselves and in the process, they lose half their score.
The turtles that are ‘born’ receive a random score between 0 and 100 and ethicality that is
inherited from their ‘parent’ plus a term that is a random number from a normal distribution
with a mean of zero and standard deviation of the diversity parameter divided by four. This way
diversity plays a role in not only the initial setup, but also how likely the reproduction is to
produce turtles with different ethicality from their parents. This mechanism reflects the
evolution of ethical and unethical behavior. The code for reproduction is shown on Figure 3.
Figure following on the next page
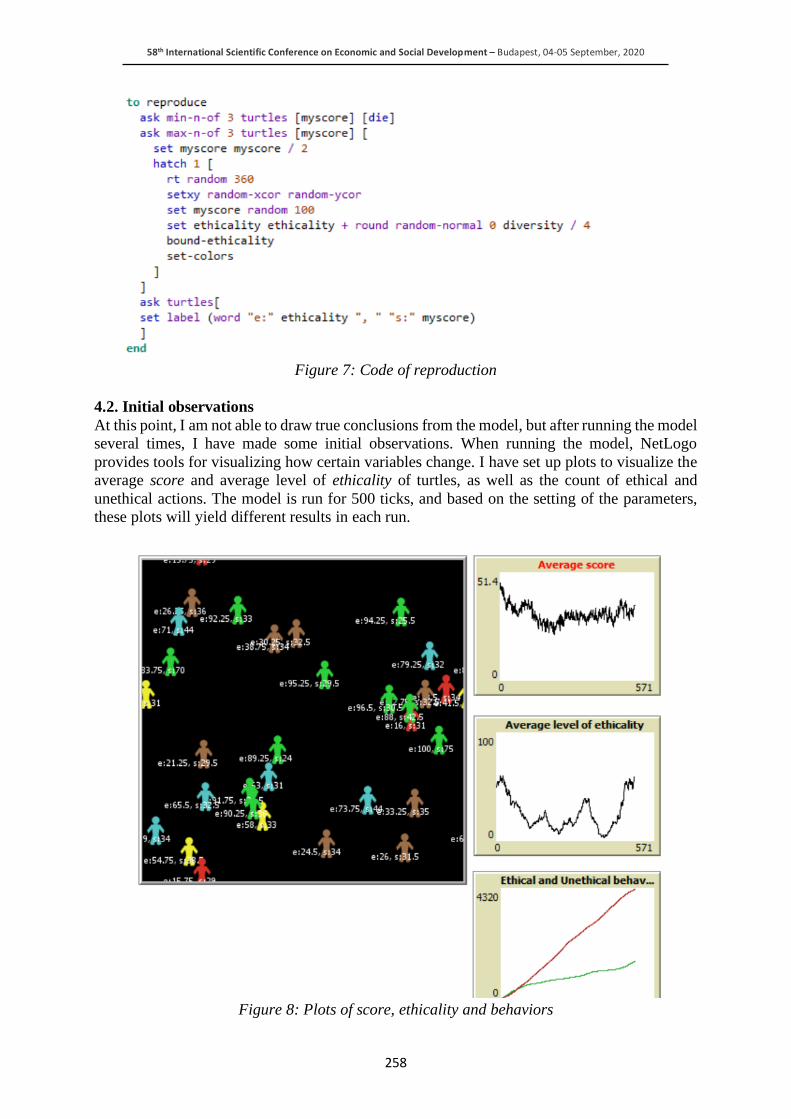
58th International Scientific Conference on Economic and Social Development – Budapest, 04-05 September, 2020
258
Figure 7: Code of reproduction
4.2. Initial observations
At this point, I am not able to draw true conclusions from the model, but after running the model
several times, I have made some initial observations. When running the model, NetLogo
provides tools for visualizing how certain variables change. I have set up plots to visualize the
average score and average level of ethicality of turtles, as well as the count of ethical and
unethical actions. The model is run for 500 ticks, and based on the setting of the parameters,
these plots will yield different results in each run.
Figure 8: Plots of score, ethicality and behaviors
58th International Scientific Conference on Economic and Social Development – Budapest, 04-05 September, 2020
259
From the runs I have completed so far, it seems that the setting of the relative cost of ethical
behavior has the largest impact on the measured variables. Mathematically, this is no surprise,
since in the current model design it is the only variable whith a multiplicative effect. However,
what seems somewhat surprising is that a small value, on either the positive or the negative side
of the spectrum, did not seem to produce very different results in terms of the measured
variables compared to a large value on the same side. I.e. when the relative cost of ethical
behavior was set to 1 and when it was set to 10, the results seemed to be very similar – the level
of ethicality dropped and tended to remain low, but with all other parameters being the same,
the drop was not visibly faster when the parameter was ten times larger. Another observation
that was somewhat unexpected was that the initial level of ethicality did not matter too much.
With positive relative cost of ethical behavior, a generally low level of ethicality seemed to
arise almost as quickly when starting from an average level of ethicality near the middle as
when starting from near the maximum. The impact of diversity was also interesting, since a
high level of diversity allowed for changes in tendencies of ethicality. For example, when it was
driven to a low level by the positive relative cost of ethical behavior, it could bounce back and
even show considerable upward trends for shorter periods.
4.3. Limitations and future directions
As highlighted earlier, this is just a very initial phase of the modelling project and therefore
there are many limitations and possibilities for improvement. In terms of the model setup, the
conceptual ideas have to be thoroughly reviewed. The basic building blocks are probably
feasible, but the relationships among them might require changes in the model. For example,
the relative cost of ethical behavior is currently a constant that is not impacted by the other
variables, and this might be revised. A feedback mechanism from the average level of ethicality
could possibly be included, that would influence this parameter during the run of the model.
Also, the evolution of ethicality is now captured in terms of turtles ceasing to exist and others
coming to life. This way, the turtles do not represent persons, rather memes that go through an
evolution on their own level, but this might be different from looking at the behavior of persons.
As an alternative, a mechanism could be applied in which the turtles do represent persons, and
their level of ethicality changes as a result of interactions with other turtles and perhaps other
factors as well. Again, a further limitation is the arbitrariness of choices in terms of numbers
that are currently in the model. This could be addressed by analyzing mathematically if a
different choice of numbers has a serious impact on the outcome and enhancing the model in a
way that the arbitrary choice of numbers does not influence the dependent variables. In general,
to draw any valid conclusions, rigorous analysis of the results is necessary, which is not
provided here. This can be accomplished by using automated reruns of the model and finding
patterns of certain combination of parameter values leading to certain sorts of outcomes.
Similarly to the paper presented in the theoretical section, BehaviorSearch (Stonedahl, 2010)
could be used as a tool for this exercise.
5. CONCLUSION
Complex systems are qualitatively different from complicated systems, and they cannot be well
understood with reductionist models. Social systems, such as organizations are inherently
complex, as they are comprised of conscious, autonomous agents whose behavior is often not
random and is full of interdependencies and feedback mechanisms. Research in business ethics
usually relies on methods that aim to capture static relationships between different concepts,
and such research can certainly produce interesting and useful findings, but it also has some
limitations including its inability to capture dynamic phenomena. In this paper, I have proposed
the use of computational modelling to gain understanding of the dynamic nature of unethical
behavioral patterns in organizations.
58th International Scientific Conference on Economic and Social Development – Budapest, 04-05 September, 2020
260
I created and described an initial model using the NetLogo programming environment. I have
managed to observe a few interesting patterns with the help of this initial model, but much more
work is needed to strengthen the model and apply tools with which more general conclusions
can be drawn.
LITERATURE:
1. Ashforth, B. E., & Anand, V. (2003). The Normalization of Corruption in Organizations.
Research in Organizational Behavior, 25(3), 1–52. https://doi.org/10.1016/S0191-
3085(03)25001-2
2. Brand, V. (2009). Empirical business ethics research and paradigm analysis. Journal of
Business Ethics, 86(4), 429–449. https://doi.org/10.1007/s10551-008-9856-3
3. Brass, D. J., Butterfield, K. D., & Skaggs, B. C. (1998). Relationships and Unethical
Behavior: A Social Network Perspective. The Academy of Management Review, 23(1), 14–
31. https://doi.org/10.2307/259097
4. Brunner, M., & Ostermaier, A. (2019). Peer Influence on Managerial Honesty: The Role of
Transparency and Expectations. Journal of Business Ethics, 154(1), 127–145.
https://doi.org/10.1007/s10551-017-3459-9
5. Campbell, D., & Cowton, C. J. (2015). Method issues in business ethics research: Finding
credible answers to questions that matter. Business Ethics, 24(S1), S3–S10.
https://doi.org/10.1111/beer.12093
6. den Nieuwenboer, N. A., & Kaptein, M. (2008). Spiraling down into corruption: A dynamic
analysis of the social identity processes that cause corruption in organizations to grow.
Journal of Business Ethics, 83(2), 133–146. https://doi.org/10.1007/s10551-007-9617-8
7. Gómez-Cruz, N. A., Loaiza Saa, I., & Ortega Hurtado, F. F. (2017). Agent-based simulation
in management and organizational studies: a survey. European Journal of Management and
Business Economics, 26(3), 313–328. https://doi.org/10.1108/EJMBE-10-2017-018
8. Kish-Gephart, J. J., Harrison, D. A., & Treviño, L. K. (2010). Bad Apples, Bad Cases, and
Bad Barrels: Meta-Analytic Evidence About Sources of Unethical Decisions at Work.
Journal of Applied Psychology, 95(1), 1–31. https://doi.org/10.1037/a0017103
9. Marquez-Illescas, G., Zebedee, A. A., & Zhou, L. (2019). Hear Me Write: Does CEO
Narcissism Affect Disclosure? Journal of Business Ethics, 159(2), 401–417.
https://doi.org/10.1007/s10551-018-3796-3
10. Miller, J. H., & Page, S. E. (2009). Complex adaptive systems: An introduction to
computational models of social life. In Complex Adaptive Systems: An Introduction to
Computational Models of Social Life. https://doi.org/10.1080/01488370802162558
11. Popper, K. (2002). Logic of scientific discovery. Routledge.
12. Simon, H. A. (1997). Models of bounded rationality. MIT Press.
13. Stonedahl, F. (2010). BehaviorSearch. Center for Connected Learning and Computer
BasedModeling, Northwestern University. http://www.behaviorsearch.org/
14. Treviño, L. K. (1986). Ethical Decision Making in Organizations: A Person-Situation
Interactionist Model. The Academy of Management Review, 11(3), 601–617.
15. Treviño, L. K., Weaver, G. R., & Reynolds, S. J. (2006). Behavioral ethics in organizations:
A review. In Journal of Management (Vol. 32, Issue 6).
https://doi.org/10.1177/0149206306294258
16. Valle, M., Kacmar, K. M., & Zivnuska, S. (2019). Understanding the Effects of Political
Environments on Unethical Behavior in Organizations. Journal of Business Ethics, 156(1),
173–188. https://doi.org/10.1007/s10551-017-3576-5
17. Wang, L., Zhong, C.-B., & Murnighan, J. K. (2014). The social and ethical consequences
of a calculative mindset. Organizational Behavior and Human Decision Processes, 125(1),
39–49. https://doi.org/10.1016/j.obhdp.2014.05.004

58th International Scientific Conference on Economic and Social Development – Budapest, 04-05 September, 2020
261
18. Wilensky, U. (1999). NetLogo. Center for Connected Learning and Computer-Based
Modeling, Northwestern University. http://ccl.northwestern.edu/netlogo/
19. Wilensky, U., & Rand, W. (2015). An Introduction to Agent-Based Modeling: Modeling
Natural, Social, and Engineered Complex Systems with NetLogo. MIT Press.
20. Will, T. E. (2016). Flock Leadership: Understanding and influencing emergent collective
behavior. Leadership Quarterly, 27(2), 261–279.
https://doi.org/10.1016/j.leaqua.2016.01.002
21. Zsolnai, L. (2013). The Moral Economic Man. In L. Zsolnai (Ed.), Handbook of Business
Ethics: Ethics in the New Economy (pp. 35–53). Peter Lang.
22. Zuber, F. (2015). Spread of Unethical Behavior in Organizations: A Dynamic Social
Network Perspective. Journal of Business Ethics, 131(1), 151–172.
https://doi.org/10.1007/s10551-014-2270-0
58th International Scientific Conference on Economic and Social Development – Budapest, 04-05 September, 2020
262
AN ANALYSIS OF FACTORS DRIVING GENDER DIVERSITY AND
INCLUSION IN JAPANESE ORGANIZATIONS
Elza Saitova
Szechenyi Istvan University, Hungary
Carmela Di Mauro
DICAR - Università di Catania, Catania, Italy
ABSTRACT
This study presents a literature review of success factors and barriers for gender diversity and
inclusion in managerial roles in Japanese organizations. Although the literature about gender
diversity in Japan slowly gains momentum, however many studies are based on experiences
from the United States and Western Europe. Using a holistic approach, the research addresses
the societal, organizational, inter-personal and individual level factors related to workplace
gender diversity and inclusion in Japanese organizations and identifies research gaps for a
future research agenda.
Keywords: gender diversity, literature review, women in Japanese organizations
1. INTRODUCTION
Equality Opportunity Law of 1985 in Japan bans gender discrimination; however, gender
discrimination remains (Nemoto, 2013; Benson and Debroux, 2013). Women are still
underrepresented in management level, characterized by pay gap in Japanese organizations
(Nemoto, 2013). Japanese government and institutions increase the pressure to put more women
into leadership (Koura et al, 2017), however the large listed companies in Japan still do not
represent diversity (Morikawa, 2016; Saito, 2018). Very few women hold managerial or board
positions in Japan today (Nemoto, 2016). In 2017, the percentage of women on the boards of
publicly traded companies in Japan was only 3.7% in comparison with the US, where the
percentage was 18.7% (Tanaka, 2018). In Japan, gender diversity has traditionally been low
because traditional cultural values, which are then embedded in organizational cultures, are
male-centered (Sugihara and Katsurada, 2002). Against this backdrop, the global diffusion of
the norms of CSR has undoubtedly put pressure on Japanese businesses to employ more women
(Brinton and Mun, 2016; Haak, 2006; Mun and Jung, 2018) and closing the gender gap has
recently become one of the key strategies to boost labour participation and improve economic
growth in Japan (Iwaasa et al, 2017). However, the “glass ceiling” that prevents women from
accessing to higher positions in the organizational hierarchy appears to persist (Mun and Jung,
2018). This research seeks to summarize the papers about gender diversity in Japan and build
a literature review of the academic literature within Japanese context in order to contribute to
organizational studies and understand the factors and reasons of female underrepresentation in
Japanese organization. While management research on gender diversity in the Japanese
workplace is slowly gaining momentum (Kato and Kodama, 2018; Mun and Jung, 2018;
Nakagawa and Schreiber, 2014; Tanaka, 2014), most contributions on antecedents of diversity
present macro-level analyses such as parental leave legislation (Asai 2015; Lee and Lee 2014),
or focus their attention on specific factors that affect the presence and extent of workplace
gender diversity, such as CSR (Kato and Kodama, 2018; Mun and Jung, 2018). In order to
understand the factors influencing better female participation in decision making, all the
findings from the literature were integrated into several layers: institutional, organizational,
team, and individual level and this way helped to organize the existing literature and based on
this analysis, literature gaps were identified that may need more empirical evidence.
58th International Scientific Conference on Economic and Social Development – Budapest, 04-05 September, 2020
263
This “holistic” approach captures all complications related to gender diversity and inclusion in
the Japanese organizations. Specifically, the research paper addresses the following the
question: What is the interplay among system-wide, organizational, inter-personal and
individual level factors? In order to investigate the impact of different layers of factors and to
organize them, insights were obtained from different theoretical approaches: Hofstede cultural
dimensions (Hofstede, 2009), Neo-institutional Theory (Meyer and Rowan, 1977), the
Categorization-Elaboration Model (CEM) of diversity (van Knippenberg et al., 2004), and
Intersectionality theory (Holvino, 2010). Finally, the paper has practical relevance as it may
help HRM and top managers of the Japanese organizations to pay attention on uncovered areas
of management practices and corporate culture in order to increase the diversity and inclusion.
2. LITERATURE REVIEW APPROACH
This paper focused on the studies published in English, in peer-reviewed academic journals and
books. Additionally, a few discussion papers were added to our study, since the data published
there is considered highly relevant. Workplace gender diversity is a multidisciplinary topic, and
there are cross-disciplinary studies in the fields of business, economics, psychological, social
and gender studies. The following electronic databases and sources were used for searching:
Scopus, Science Direct and EBSCO, using the search words “gender diversity in Japan”,
“women in Japanese organizations”, “inequality in Japan”. The search was done in August
2019. By means of this search strategy, more than 100 contributions were identified. A
significant part of this literature was related to history of equality in Japan and equal
employment opportunities and education, as well as gender roles as being women/mothers in
Japan and gender stereotyping and social studies, work-life balance, in addition to studies about
women participation in civil and official political institutions of power in Japan. These articles
were removed unless they provided evidence of gender diversity in the workplace. The final
list of relevant literature related to Japanese context consists of 28 contributions (Table 1).
Table following on the next page
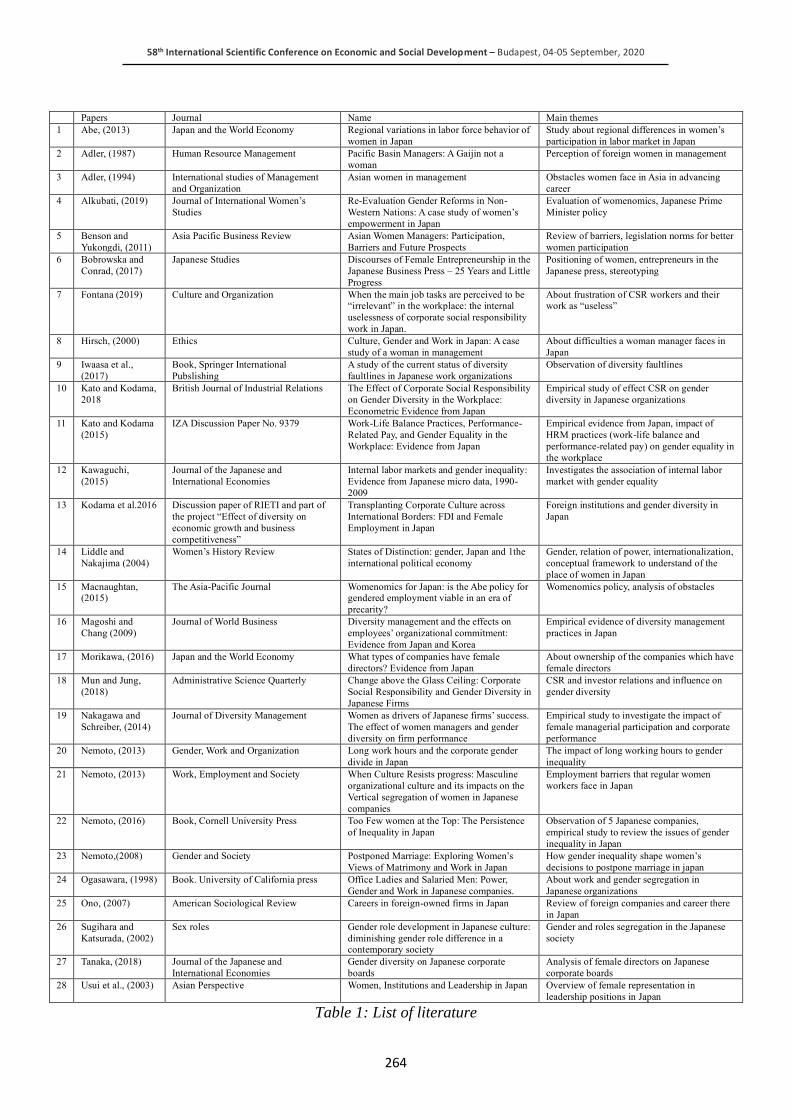
58th International Scientific Conference on Economic and Social Development – Budapest, 04-05 September, 2020
264
Papers Journal Name Main themes
1 Abe, (2013) Japan and the World Economy Regional variations in labor force behavior of
women in Japan
Study about regional differences in women’s
participation in labor market in Japan
2 Adler, (1987) Human Resource Management Pacific Basin Managers: A Gaijin not a
woman
Perception of foreign women in management
3 Adler, (1994) International studies of Management
and Organization
Asian women in management Obstacles women face in Asia in advancing
career
4 Alkubati, (2019) Journal of International Women’s
Studies
Re-Evaluation Gender Reforms in Non-
Western Nations: A case study of women’s
empowerment in Japan
Evaluation of womenomics, Japanese Prime
Minister policy
5 Benson and
Yukongdi, (2011)
Asia Pacific Business Review Asian Women Managers: Participation,
Barriers and Future Prospects
Review of barriers, legislation norms for better
women participation
6 Bobrowska and
Conrad, (2017)
Japanese Studies Discourses of Female Entrepreneurship in the
Japanese Business Press – 25 Years and Little
Progress
Positioning of women, entrepreneurs in the
Japanese press, stereotyping
7 Fontana (2019) Culture and Organization When the main job tasks are perceived to be “irrelevant” in the workplace: the internal
uselessness of corporate social responsibility
work in Japan.
About frustration of CSR workers and their work as “useless”
8 Hirsch, (2000) Ethics Culture, Gender and Work in Japan: A case
study of a woman in management
About difficulties a woman manager faces in
Japan
9 Iwaasa et al.,
(2017)
Book, Springer International
Pubslishing
A study of the current status of diversity
faultlines in Japanese work organizations
Observation of diversity faultlines
10 Kato and Kodama,
2018
British Journal of Industrial Relations The Effect of Corporate Social Responsibility
on Gender Diversity in the Workplace:
Econometric Evidence from Japan
Empirical study of effect CSR on gender
diversity in Japanese organizations
11 Kato and Kodama
(2015)
IZA Discussion Paper No. 9379 Work-Life Balance Practices, Performance-
Related Pay, and Gender Equality in the
Workplace: Evidence from Japan
Empirical evidence from Japan, impact of
HRM practices (work-life balance and
performance-related pay) on gender equality in
the workplace
12 Kawaguchi,
(2015)
Journal of the Japanese and
International Economies
Internal labor markets and gender inequality:
Evidence from Japanese micro data, 1990-
2009
Investigates the association of internal labor
market with gender equality
13 Kodama et al.2016 Discussion paper of RIETI and part of
the project “Effect of diversity on
economic growth and business
competitiveness”
Transplanting Corporate Culture across
International Borders: FDI and Female
Employment in Japan
Foreign institutions and gender diversity in
Japan
14 Liddle and
Nakajima (2004)
Women’s History Review States of Distinction: gender, Japan and 1the
international political economy
Gender, relation of power, internationalization,
conceptual framework to understand of the
place of women in Japan
15 Macnaughtan, (2015)
The Asia-Pacific Journal Womenomics for Japan: is the Abe policy for gendered employment viable in an era of
precarity?
Womenomics policy, analysis of obstacles
16 Magoshi and
Chang (2009)
Journal of World Business Diversity management and the effects on
employees’ organizational commitment:
Evidence from Japan and Korea
Empirical evidence of diversity management
practices in Japan
17 Morikawa, (2016) Japan and the World Economy What types of companies have female
directors? Evidence from Japan
About ownership of the companies which have
female directors
18 Mun and Jung,
(2018)
Administrative Science Quarterly Change above the Glass Ceiling: Corporate
Social Responsibility and Gender Diversity in
Japanese Firms
CSR and investor relations and influence on
gender diversity
19 Nakagawa and
Schreiber, (2014)
Journal of Diversity Management Women as drivers of Japanese firms’ success.
The effect of women managers and gender
diversity on firm performance
Empirical study to investigate the impact of
female managerial participation and corporate
performance
20 Nemoto, (2013) Gender, Work and Organization Long work hours and the corporate gender
divide in Japan
The impact of long working hours to gender
inequality
21 Nemoto, (2013) Work, Employment and Society When Culture Resists progress: Masculine
organizational culture and its impacts on the
Vertical segregation of women in Japanese
companies
Employment barriers that regular women
workers face in Japan
22 Nemoto, (2016) Book, Cornell University Press
Too Few women at the Top: The Persistence
of Inequality in Japan
Observation of 5 Japanese companies,
empirical study to review the issues of gender
inequality in Japan
23 Nemoto,(2008) Gender and Society Postponed Marriage: Exploring Women’s
Views of Matrimony and Work in Japan
How gender inequality shape women’s
decisions to postpone marriage in japan
24 Ogasawara, (1998) Book. University of California press Office Ladies and Salaried Men: Power,
Gender and Work in Japanese companies.
About work and gender segregation in
Japanese organizations
25 Ono, (2007) American Sociological Review Careers in foreign-owned firms in Japan Review of foreign companies and career there
in Japan
26 Sugihara and
Katsurada, (2002)
Sex roles Gender role development in Japanese culture:
diminishing gender role difference in a contemporary society
Gender and roles segregation in the Japanese
society
27 Tanaka, (2018) Journal of the Japanese and
International Economies
Gender diversity on Japanese corporate
boards
Analysis of female directors on Japanese
corporate boards
28 Usui et al., (2003) Asian Perspective Women, Institutions and Leadership in Japan Overview of female representation in
leadership positions in Japan
Table 1: List of literature
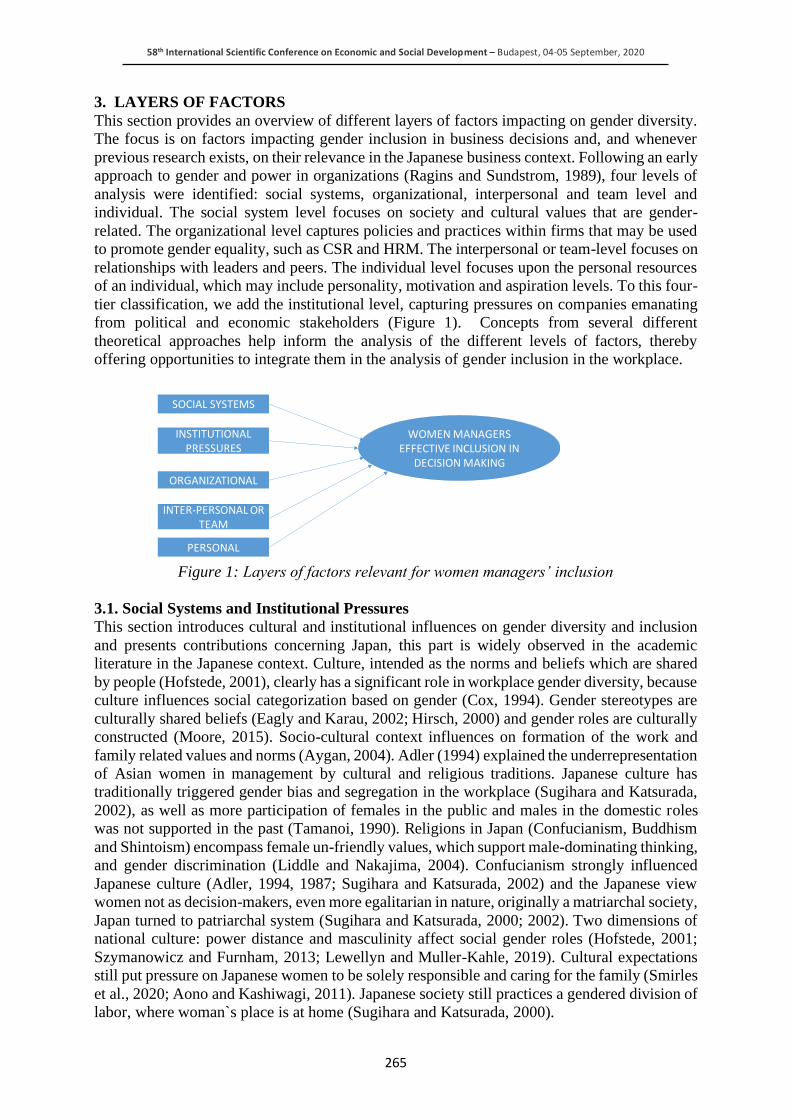
58th International Scientific Conference on Economic and Social Development – Budapest, 04-05 September, 2020
265
3. LAYERS OF FACTORS
This section provides an overview of different layers of factors impacting on gender diversity.
The focus is on factors impacting gender inclusion in business decisions and, and whenever
previous research exists, on their relevance in the Japanese business context. Following an early
approach to gender and power in organizations (Ragins and Sundstrom, 1989), four levels of
analysis were identified: social systems, organizational, interpersonal and team level and
individual. The social system level focuses on society and cultural values that are gender-
related. The organizational level captures policies and practices within firms that may be used
to promote gender equality, such as CSR and HRM. The interpersonal or team-level focuses on
relationships with leaders and peers. The individual level focuses upon the personal resources
of an individual, which may include personality, motivation and aspiration levels. To this four-
tier classification, we add the institutional level, capturing pressures on companies emanating
from political and economic stakeholders (Figure 1). Concepts from several different
theoretical approaches help inform the analysis of the different levels of factors, thereby
offering opportunities to integrate them in the analysis of gender inclusion in the workplace.
Figure 1: Layers of factors relevant for women managers’ inclusion
3.1. Social Systems and Institutional Pressures
This section introduces cultural and institutional influences on gender diversity and inclusion
and presents contributions concerning Japan, this part is widely observed in the academic
literature in the Japanese context. Culture, intended as the norms and beliefs which are shared
by people (Hofstede, 2001), clearly has a significant role in workplace gender diversity, because
culture influences social categorization based on gender (Cox, 1994). Gender stereotypes are
culturally shared beliefs (Eagly and Karau, 2002; Hirsch, 2000) and gender roles are culturally
constructed (Moore, 2015). Socio-cultural context influences on formation of the work and
family related values and norms (Aygan, 2004). Adler (1994) explained the underrepresentation
of Asian women in management by cultural and religious traditions. Japanese culture has
traditionally triggered gender bias and segregation in the workplace (Sugihara and Katsurada,
2002), as well as more participation of females in the public and males in the domestic roles
was not supported in the past (Tamanoi, 1990). Religions in Japan (Confucianism, Buddhism
and Shintoism) encompass female un-friendly values, which support male-dominating thinking,
and gender discrimination (Liddle and Nakajima, 2004). Confucianism strongly influenced
Japanese culture (Adler, 1994, 1987; Sugihara and Katsurada, 2002) and the Japanese view
women not as decision-makers, even more egalitarian in nature, originally a matriarchal society,
Japan turned to patriarchal system (Sugihara and Katsurada, 2000; 2002). Two dimensions of
national culture: power distance and masculinity affect social gender roles (Hofstede, 2001;
Szymanowicz and Furnham, 2013; Lewellyn and Muller-Kahle, 2019). Cultural expectations
still put pressure on Japanese women to be solely responsible and caring for the family (Smirles
et al., 2020; Aono and Kashiwagi, 2011). Japanese society still practices a gendered division of
labor, where woman`s place is at home (Sugihara and Katsurada, 2000).
SOCIAL SYSTEMS
ORGANIZATIONAL
INSTITUTIONAL PRESSURES
PERSONAL
WOMEN MANAGERS EFFECTIVE INCLUSION IN
DECISION MAKING
INTER-PERSONAL OR TEAM
58th International Scientific Conference on Economic and Social Development – Budapest, 04-05 September, 2020
266
According to the Hofstede dimensions, Japan is a hierarchical society, putting higher value in
group interests than in individualistic ones. Power distance is “the extent to which the less
powerful members of institutions and organizations within a country expect and accept that
power is distributed unequally”, (Hofstede, 2001, p. 98). Japan’s power distance has an
intermediate score of 54, it is not so hierarchical as other Asian countries, however all the
decisions must be confirmed by each hierarchical level. Japan has one of the highest indexes of
uncertainty avoidance with score 92, and a score of 95 in masculinity as a consequence of the
fact that gender roles in the society are rigid and assign greater importance to masculine values
(Hofstede, 2003). As noted by Hofstede (2001, p.297) “social gender roles are clearly distinct”
in countries with high scores of masculinity. Male characteristics like achievement and status
are emphasized and encouraged as a source of pride. And women shall be focused on roles,
involving personal relationships (Hofstede, 2001). Hall (1966) distinguishes high and low
context cultures and classifies Japan as a “high context” culture, where formal, indirect and
implicit communication convey the messages: sensitive topics and direct expressions of opinion
tend to be avoided in order to reach the intergroup harmony and shun conflicts. Trompenaars
and Hampden-Turner (1997) classified Japan as having an upper-middle level degree of
“universalism”, whereby formal rules are much more important than human relationships. In
the same direction, the GLOBE project (House et al., 2004), which extends the Hofstede model
(Ralston et al., 2018; Schneid et al., 2015) shows the Japanese culture as being relatively low
gender-egalitarian (GLOBE project, 2019). By representing formal and informal constraints
(North, 1990), institutions influence organizational structure and business behavior (Iannotta et
al., 2015; Meyer, 2010; North, 1990; DiMaggio and Powell, 1983). Iannotta et al. (2015)
suggested that cultural institutions, multiple institutional domains, regulatory policies, welfare
provision, labor markets are interrelated and can positively influence gender diversity on
corporate boards. Various institutional barriers remain preventing the equal women
participation in the labor market (Ono, 2007). The discussion on gender quotas in corporate
boards is often associated with the concept of “Tokenism” (Kanter, 1977). When boards include
few women, they are considered as tokens (Torchia et al., 2011), leading to conjecture that
tokenism characterises Japanese boards. Tokenism explains the importance of organizational
structure and context in the underrepresentation of women in decision-making positions (King
et al., 2010). Token women experience high level of visibility, since the token are in scarce
present, which creates a social isolation and feel the pressure to be in line with social role and
gender stereotypes (Kanter, 1977a; King et al., 2010). A woman is considered to be a token, if
females are less than 15% in the given context according to tokenism theory. In the last twenty
years, there has been a pressure from international institutions and from foreign investors to
align Japanese companies’ corporate governance with international standards and introduce
gender diversity in boards (Saito, 2018). In foreign companies the Japanese women have more
career opportunities than in Japanese firms, historically foreign companies utilized more female
talents in Japan according to White Paper of Gender Equality published by Cabinet office in
Japan as their host countries are more advanced in term of gender equality. The effects of gender
diversity on Japanese organizations have proved to be beneficial. Siegel and Kodama (2011)
and Niikura and Seko (2017) show that organizations with more female directors have a positive
effect on ROA. Additionally, a recent empirical study by Tanaka (2018) shows that publicly
traded Japanese firms with more women directors exhibit higher performance. Notwithstanding
increasing pressure, Morikawa (2016) reported that the boards of the large listed companies do
not necessarily exhibit greater diversity. This state of things aligns with Oliver's (1991)
contribution on organisations' strategic responses to institutional pressures, which highlights
that diversity policies represent a “contested institutional terrain”. In effect, failure to fully
embrace policies that are considered standard in different national settings reflects more broadly
“Institutional distance”, i.e. a difference between two 'countries’ institutional profile' (CIP)
58th International Scientific Conference on Economic and Social Development – Budapest, 04-05 September, 2020
267
based on the regulatory, normative and cognitive institutions of a country (Ferner et al., 2005;
Kostova, 1999; Scott, 1995). Cultural stereotypes affect Japanese women’s career aspirations,
work-life goals and confidence in own leadership potential (Yamamoto and Ran, 2014; Smirles
et al., 2020; Aono and Kashiwagi, 2011). Recent researchers show that Japanese culture has
become more supportive of egalitarian view of gender roles and women in the workplace due
to recent demographic and economic change (Yamamoto and Ran, 2014; Hashimoto, 2017;
Piotrowski et al., 2019; Smirles et al, 2020).
3.2. Organizational level
Several studies have underscored the role of corporate culture and climate in influencing gender
diversity (McDonald, 2003). Additionally, King et al., (2010) considered about psychological
climate of gender inequity as a critical and broader indicator of women’s interpretation of the
work and social contexts and gender inequity, focused on individual perceptions of policies and
practices in the organizations which were interpreted as unfair. The importance of creating an
organizational climate for diversity (Guillaume et al., 2013) has been identified as an effective
way to make “diversity at work to work” (McKay et al., 2008). Cox (1993) argues that climate
plays an important role as moderator in the impact of diversity on team performance. van
Knippenberg et al. (2013) suggest that a diversity mindset in organizations moderates the
relation between diversity and performance, and proposes three aspects of this mindset:
accuracy, sharedness and awareness of diversity cognition. Mor Barak (1998) conceptualized a
diversity-prone environment using two dimensions: individual views and prejudices towards
people who are different from themselves and organizational policies and procedures
concerning minorities and women. Analogous dimensions were suggested by Cox (1994)
individual-level and organizational level factors to assess the organizational diversity climate.
Adler (1993) already mentioned that male-dominant organizational culture is an obstacle to
women’s career advancement, with difficulty to enter “old boys’ network” (Aygan, 2004;
Davidson and Cooper, 1992). Macnaughtan (2015) argues that it is hard for women to make
career in Japan, since the workplace culture is based upon with the male breadwinner model,
prescribing women to work on the same way. Most women work in occupations which are
associated with lower power, nurses, elementary school teachers, secretaries, assistants (King
et al., 2010; Lips, 2001; Thornborrow and Sheldon, 1995). Fritz and Van Knippenberg (2017)
suggest that organizational climate as well as cooperative climate may encourage leadership
aspiration therefore it is important to create such an environment and stimulate female
leadership aspiration. Moreover, Japanese working environment is characterized by complex
value system, high formality and hierarchical system and top-down culture (Demise, 2005;
Fontana, 2019). As being hierarchical society in which relationships are defined as subordinate-
superior, obedience and loyalty to bosses and companies are naturally driven by influence of
Confucian teaching (Sugihara and Katsurada, 2000; Hamada, 1996). Workplace culture in
Japan force women to choose between career or family orientation, “emulating masculinity or
opting out” (Nemoto, 2013 p.514), stereotyping woman who want to combine the roles, while
men career opportunities are not limited by fatherhood (Lyon and Woodward, 2004; Watts,
2009; Nemoto, 2013). The environment of long working hours also doesn’t support women
career advancement in Japanese organizations, intensifies the separation between work and
family (Nemoto, 2013). Gender diversity has a central place within CSR policies and practices.
The literature argues for a significant bi-directional relationship between CSR and board
diversity, since gender-diverse boards provide more effective monitoring of CSR performance
(Bear et al, 2010; Harjoto et al., 2015; Williams, 2003). Vice versa, Sugita (2006) suggested
that CSR should support a mechanism to promote gender equality in organizations and link
with work-life balance. Tanimoto (2017) noted about increased number of CSR employees
since this activity started in Japan in 2003.
58th International Scientific Conference on Economic and Social Development – Budapest, 04-05 September, 2020
268
Mun and Jung (2018) investigated how Japanese firms responded to global standards of CSR
norms in terms of gender diversity in the workplace and added that CSR used to be attracted to
external investors In their comparative study of Germany and Japan, Kemper et al. (2016)
pointed that Japanese organizations expect more negative outcomes from diversity practices
than the German ones. Kato and Kodama (2016) connect work-life balance practices and CSR
and suggested CSR practices positively impact on gender diversity in the workplace even
though not immediately after the inception of CSR but after two to three years. There is study
of Fontana (2019) who critically observed CSR as “an emotionally tainted occupation” in Japan,
confirmed that CSR in Japan is used for public recognition, while the workers in CSR field feel
themselves useless. Other scholars who confirmed the Japanese workplace is still contradictory
even with CSR policies (Mun and Jung, 2018; Kimura and Nishikawa, 2018). Concerning
HRM, Japanese organizations implement more top-down HR practices, since such an approach
is believed to be more effective, because in Japan the rules applied by superiors and based on a
high-context culture with many unwritten rules are always strictly followed (Sekiguchi et al.,
2016). HRM in Japanese organizations was successful with in the internationalization of
operations management but not in the internationalization of management, characterizing by
ethnocentric management style (Sekiguchi at al., 2016). There is big chance to be discriminated
through HRM practices, like selection, evaluation or promotion (Aygan, 2004). Magoshi and
Chang (2009) evidenced the implementation of gender related HRM practices is notably weaker
compared to western companies. Nevertheless, HRM practices such as work-life balance and
family-friendly policies have proved helpful for the career development of women (Yanadori
and Kato, 2009; Wakisaka, 2007) but also for organization’s performance (Wakisaka, 2007).
There evidence that recent HRM practices use flexible employment and performance-related
payments (Sekiguchi, 2013).
3.3. The inter-personal and personal level
A significant amount of research on workplace gender diversity has addressed diversity within
workplace teams proposing two opposing perspectives: social categorization suggests that
diversity brings dysfunctional teamwork and conflicts and negative impacts on performance.
Conversely, the information/decision making perspective suggests that diversity will bring
more creativity, better decision-making. Van Knippenberg et al., (2004) and their
Categorization-Elaboration Model (CEM) integrate the two above mentioned concepts, by
arguing that both processes unfold simultaneously. According to CEM, the social categorization
processes caused by diversity lead to affective and evaluative reactions that moderate the main
relationship between diversity and elaboration of task-relevant information and perspectives,
which in turn influence group/organizational performance. CEM points to the importance of
other moderating variables at team level that strengthen benefits from diversity (e.g.
specialization and task complexity, effective conflict management, leadership), which had
previously been overlooked. Therefore, through the analysis of moderating effects, both
positive and negative outcomes can stem from increased diversity in the workgroup (Jackson
et al, 2003; Van Knippenberg and Schippers, 2007). Consistent with the above, gender diverse
teams seem to focus on the task accomplishment and have more formal job behavior (Schneid
et al., 2015). Intersectionality theory suggests that people are members of more than one
category or social group and examines the ways in which social and cultural categories interact
and intertwine. (Acker, 2006; Richadson and Loubier, 2008; Zander et al., 2010). Along the
same lines, Faultline theory (Lau and Murninghan, 1998; Van Knippenberg et al., 2010)
suggested that diversity dimensions should be considered in conjunction to understand the
overall impact of diversity within a team. Therefore, these theoretical approaches posit that
gender will interact with other sources of social status/categorization, e.g. nationality,
educational background, class, and ethnicity (Zander et al., 2010).
58th International Scientific Conference on Economic and Social Development – Budapest, 04-05 September, 2020
269
According to Gottfried (2008), Japan invented a monolithic culture through filtering
Japanese/non-Japanese. With respect to gender, Adler (1987) found that foreign women in
Japan are perceived not as women, meaning less discrimination compared to Japanese women.
According to gender studies women are more associated with caring, empathy and concern
others (Fondas, 1997). Such stereotypes, which put pressure on women to comply with that
particular behavioural model (Gutek and Morasch, 1982; Boulouta, 2013), could be felt more
strongly by Japanese women than by foreign ones. Women managers are expected to follow
masculine work norm and prioritize work over personal and family matters (Nemoto, 2012).
Women who choose career often remain single or childless to avoid “double pressure of being
good workers nad mothers” (Nemoto, 2013, p. 524). The literature on women’s career
advancement discussed individual and situational factors (Aycan, 2004). The personal factors
include attitude toward career development: high level of self-efficacy, strong desire to succeed,
positive attitude toward relocation, higher level of education, having extensive working
experience and knowledge: with these factors’ women have better chances of being in decision-
making positions (Aycan, 2004; Adler, 1993; Adler et al., 2000). In Japanese context a Japanese
person is normally being silent which equals to being polite or modest, that’s why women
hesitate to speak up and self-present to behave as expected by society (Takano, 2005). The
discrimination is often more apparent at the inter-personal level than within the organization as
a whole. In the relation with peers, women feel discriminated in their ability to express their
opinions and contribute to decisions because of the existence of strong male cliques within work
teams. Japanese media still supports traditional gender roles and societal expectation shows the
female character as being house wife (Arima, 2003; Aono and Kashiwagi, 2011) and on the
same time showing more stories about women in politics. Recently, in the Japanese mainstream
and public discourse Entrepreneurship is offered as a solution to work-life balance, portraying
a female as a “superwoman” (Bobrowska and Conrad, 2017), pushing to be responsible for
family obligations and being pioneers in male-dominated industries as women. In general,
situational factors may influence on women career advancement, as well as role models. There
is lack of female role models in Japanese organizations (Yoshida, 2018), in most cases mothers
play key role in creating self-confidence and ambitions for career (Aycan, 2004) or in the
contrary due to negative image of the mother as being housewife can force women to choose
career over marriage (Nemoto, 2008). The recent study of Kuroda and Yamamoto (2018)
showed that the relationship between a supervisor and employees affect employees’
productivity and well-being and bosses’ management and communication skills are critical to
improve worker’s well-being. Personal traits of the supervisor are essential and predict the
outcomes in social aspects. Still Japan characterized by gender differentiation and professional
career often associated with male-gender (Hirsch, 2000; Ogasawara, 1998).
4. CONCLUSIONS
This study has organized the literature on workplace gender diversity in Japan based on several
layers of factors. Five main areas of research were identified: Japanese culture, political
institutions in Japan, organizational changes through the prism of HRM and CRM practices,
inter-personal and personal issues that can support or hinder gender diversity and inclusion in
Japan. The literature review showed the scarcity of empirical evidence, in particular with
respect to the role of personal factors. Additionally, there is no evidence on the impact of
moderators of diversity at team level, e.g. if specializazion and task complexity or team tenure
can moderate the link with women participation in decision-making. Next, most of the studies
cover problems and issues the women face during career advancement, however there is not
much evidence of “success stories”, what the triggers and key factors of such favourable
outcomes are. Finally, institutional pressures engender higher gender diversity and better
practices for women inclusion in organizational decisions.
58th International Scientific Conference on Economic and Social Development – Budapest, 04-05 September, 2020
270
However, even if Japanese women are promoted and ready for career advancement, the
workplace situation will be not changed without changes in the work-life balance of Japanese
men. Therefore, future studies should investigate whether men in Japanese organizations are
ready to change and move forward in support of women in child-care and how this new balance
can be promoted.
LITERATURE:
1. Adler, N., (1987). Pacific Basin Managers: A Gaijin, Not a Woman. Human Resource
Management, 26(2), 169-191.
2. Adler, N., (1993). An international perspective on the barriers to the advancement of women
managers. Applied Psychology: An international review, 42(4), 289-300.
3. Adler, N., (1994). Asian women in management. International studies of Management and
Organization, 23(4), 23-38.
4. Aono, A., and Kashiwagi, K. (2011). III myth or fact: Conceptions and realities of Japanese
women/mothers. Feminism and Psychology, 21 (4), 516-521.
5. Aycan, Z. (2004). Key Success Factors for Women in Management in Turkey. Applied
Psychology: an international review, 53 (3), 453-477.
6. Barbulescu, R., and Bidwell, M. (2013). Do women choose different jobs from men?
Mechanisms of application segregation in the market for managerial workers. Organization
Science, 24(3), 737-756.
7. Benson, J., and Yukongdi, V. (2005). Asian women managers: Participation, barriers and
future prospects. Asia Pacific Business Review, 11(2), 283-291.
8. Bobrowska, S. and Conrad, H. (2017). Discourses of Female Entrepreneurship in the
Japanese Business Press – 25 Years and Little Progress. Japanese Studies, 1-22. Routlege
Taylor and Francis Group.
9. Castilla, E.J., (2015). Accounting the gap: A firm study manipulating organizational
accountability and transparency in pay decisions. Organizational Science, 26(2): 311-333
10. Cox, T. (1994). Cultural diversity in organizations: Theory, research and practice. Berrett-
Koehler Publishers.
11. Davidson, M., and Cooper, C (1992). Shattering the glass ceiling: The woman manager.
London: Paul Chapman Publishing.
12. Demise, N. (2005). Business Ethics and Corporate Governance in Japan. Business and
Society. 44(2), 211-217.
13. Fernando, D., Cohen, L., and Duberley, J. (2018). What managers can do to keep women
in engineering. Harvard Business Review, ISSN 0017-8012
14. Fontana, E. (2019). When the main job tasks are perceived to be “irrelevant” in the
workplace: the internal uselessness of corporate social responsibility work in Japan. Culture
and Organization,
15. Fritz, C. and Van Knippenberg, D (2017). Gender and leadership aspiration: Interpersonal
and collective elements of cooperative climate differentially influence women and men.
Journal of Applied Social Psychology, 47, 591-604.
16. Guillaume, Y., Dawson, J., Sacramento, C., and West, M. (2013). Getting diversity at work
to work: What we know and we still don’t know. The Journal of Occupational and
Organizational Psychology, 86 (2).
17. Hamada, T. (1996). Unwrapping Euro-American masculinity in a Japanese multinational
corporation. Masculinities in organizations, 160-176. Thousand Oaks, CA: Sage.
18. Hirsch, J. (2000). Culture, Gender, and Work in Japan: A Case Study of a Woman in
management. Ethics, 28(2), 248-269.
19. Hofstede, G. (2001). Culture's consequences: Comparing values, behaviors, institutions and
organizations across nations. Thousand Oaks: Sage publications.
58th International Scientific Conference on Economic and Social Development – Budapest, 04-05 September, 2020
271
20. Iwaasa, T., Shoji, N., and Mizuno, M. (2017). A study of the current status of diversity
faultlines in Japanese Work Organizations. Springer International Publishing. Switzerland.
21. Jackson, S. E., Joshi, A., and Erhardt, N. L. (2003). Recent research on team and
organizational diversity: SWOT analysis and implications. Journal of management, 29(6),
801-830.
22. Kambayashi, N. (2015). A discussion of the development of work-life balance in Japan:
From quantity to quality and diversity. In Japanese Management in Change (pp. 191-209).
Springer, Tokyo.
23. Kato, T., and Kodama, N. (2016). Corporate social responsibility and gender diversity in
the workplace: Evidence from Japan. RIETI Discussion Paper Series 16-E-063. Tokyo,
24. Kato, T., and Kodama, N. (2018). The effect pf corporate social responsibility on gender
diversity in the workplace: econometric evidence from Japan. British Journal of Industrial
Relations 56(1): 99-127.
25. Kimura, T. and Nishikawa, M. (2018). Ethical Leadership and its Cultural and Institutional
Context: An Empirical Study in Japan. Journal of Business Ethics, 151(3), 707-724.
26. King, E., and Hebl, M., and George, J., and Matusik, S (2010). Understanding Tokenism:
Antecedents and Consequences of a Psychological Climate of Gender Inequity. Journal of
Management, 36(2), 482-510.
27. Kuroda, S., and Yamamoto, I. (2018). Good boss, bad boss, workers’ mental health and
productivity: Evidence from Japan. Japan and the World Economy, 48, 106-118.
28. Little, J., and Nakajima, S. (2004). States of Distinction: gender, Japan and the international
political economy. Women’s History Review, 13(4), 521-540.
29. Lewellyn, K. and Muller-Kahle, M. 2019. The Corporate Board Glass Ceiling: The Role of
Empowerment and Culture in Shaping Board Gender Diversity. Journal of Business Ethics
30. Lyon, D. and Woodward, A.E. (2004). Gender and time at the top. European Journal
Women’s Studies, 11(2), 205-221.
31. Macnaughtan, H. (2015). Womenomics for Japan: is the Abe policy for gendered
employment viable in an era of precarity?. The Asia-Pacific Journal, 13(12/1).
32. Magoshi, E., and Chang, E. (2009). Diversity management and the effects on employees’
organizational commitment: Evidence from Japan and Korea. Journal of world business,
44(1), 31-40.
33. Mor Barak, M., Cherin D., and Berkman, S. (1998). Organizational and personal
dimensions in diversity climate: ethnic and gender differences in employee perceptions. The
Journal of Applied Behavioural Science, Vol. 34(1), 82-104.
34. Morikawa, M. (2016). What types of companies have female directors? Evidence from
Japan. Japan and the World Economy, 37, 1-7.
35. Mun, E., and Jung, J. (2018). Change above the glass ceiling: Corporate social responsibility
and gender diversity in Japanese firms. Administrative Science Quarterly, 63(2), 409-440.
36. Nemoto, K. (2008). Postponed marriage: Exploring women’s views of matrimony and work
in Japan. Gender and Society, 22(2), 219-237.
37. Nemoto, K. (2013). Long Working Hours and the Corporate Gender Divide in Japan.
Gender, Work and Organization, 20(5), 512-527.
38. Ogasawara, Y. (1998). Office Ladies and Salaried Men: Power, Gender and Work in
Japanese Companies. Berkeley: University of California Press.
39. Ono, H. (2007). Careers in foreign-owned firms in Japan. American Sociological Review,
72(2), 267-290.
40. Ragins, B. R., and Sundstrom, E. (1989). Gender and power in organizations: A longitudinal
perspective. Psychological Bulletin, 105, 51–88.
58th International Scientific Conference on Economic and Social Development – Budapest, 04-05 September, 2020
272
41. Sekiguchi, T. (2013). Theoretical implications from the case of performance-based human
resource management practices in Japan: management fashion, institutionalization and
strategic human resource management perspective. International Journal of Human
Resource Management, 24, 471-486.
42. Sekiguchi, T., Froese, F.J., Iguchi, C. (2016). International human resource management of
Japanese multinational corporations: Challenges and future directions. Asian Business and
Management, 15, 83-109.
43. Sugihara, Y. and Katsurada, E. (2000). Gender-role personality traits in Japanese culture.
Psychology of Women Quarterly, 24, 309-318.
44. Sugihara, Y., and Katsurada, E. (2002). Gender role development in Japanese culture:
Diminishing gender role differences in a contemporary society. Sex roles, 47(9), 443-452.
45. Takano, S. (2005). Re-examining linguistic power: Strategies uses of directives by
professional Japanese women in position of authority and leadership. Journal of Pragmatics,
37, 633-666.
46. Tamanoi, M. A. (1990). Women’s Voices: Their Critique of the Anthropology of Japan.
Annual Review of Anthropology, 19, 17-37.
47. Tanimoto, K. (2013). Sanpo-Yoshi and CSR. In Encyclopedia of Corporate Social
Responsibility, 2107-2113. Berlin: Springer.
48. Usui, C., Rose, S. and Kageyama, R. (2003). Women, institutions and leadership in Japan.
Asian Perspective, 27(3), 85-123.
49. Virick, M., and Greer, C. R. (2012). Gender diversity in leadership succession: Preparing
for the future. Human Resource Management, 51(4), 575-600.
50. Watts, J. (2009). Allowed into a man’s world’ meanings of work-life balance: perspectives
of women civil engineers as minority workers in construction. Gender, Work and
Organization, 16(1), 188-214.
51. Van Knippenberg, D., De Dreu, C. K., and Homan, A. C. (2004). Work group diversity and
group performance: an integrative model and research agenda. Journal of applied
psychology, 89(6), 1008-1022.
52. Yoshida, A. (2010). Role of cultural laf in marriage decline for Japan’s boom and bust
cohorts. Marrigae and Family Review, 46 (1-2), 60-78.
58th International Scientific Conference on Economic and Social Development – Budapest, 04-05 September, 2020
273
COVEY’S 7HABITS AND THE BIG FIVE PERSONALITY TRAITS:
CURE FOR HIGH NEUROTICISM?
Miklos Szerdahelyi Széchenyi University, Hungary
SZEEDSM Doctoral Program in Business Administration
Laszlo Imre Komlosi
Széchenyi István University, Hungary
ABSTRACT
Stephen Covey’s Seven Habits of the Highly Effective People is a long standing corporate
training aiming at the broadly understood personal development of the participants including
not just narrowly work-related attitudes but relationships, long term personal goals, personal
integrity, developing a personal philosophy, and work-life balance in general for long lasting
human effectiveness and success. Covey’s practical guide has merits according to and fits well
in the tradition of positive psychology. This was concluded in theoretical terms based on a
recent study by Szerdahelyi and Komlósi (2020), moreover a 7Habits scale was developed and
psychometrically validated. The authors in this new article take the next steps to look at the
7Habits from the point of view of the Big Five Personality Traits. Using multiple regression
models, we mostly take an exploratory approach as to what relationships are significant
statistically and relevant in terms of strength. Major expectations as to how personality traits
may relate to the 7Habits are formally hypothesized, but in all cases, implications are drawn
from the results and discussed also in practical training terms.
Keywords: Big Five Personality Traits, Corporate Trainings, Covey’s 7Habits, Positive
Psychology
1. LITERATURE REVIEW AND HYPOTHESES DEVELOPMENT
1.1. The 7Habits’ content and related literature
The Seven Habits of the Highly Effective People by Stephen Covey (1989) was only recently
put under the test of psychological coherency and psychometric validity. Szerdahelyi and
Komlósi in their 2020 article explored the positive psychological basis, measurement and
outcomes of Covey’s 7Habits. Previous peer reviewed literature on Covey’s framework
(Jackson, 1999; Mccabe, 2011; Starck, 1995; and Millar, 2013) avoided questions of
compatibility between current psychological research and the 7Habits, also no measurement
tool was reported in the literature. In their 2020 research paper Szerdahelyi and Komlósi
showed that Self-determination theory (SDT) (Deci and Ryan, 2000) theoretically is compatible
to Covey’s framework, moreover, through the scale they developed and psychometrically
validated they showed that the 7Habits are predictive of the basic need satisfaction scales of
autonomy, competence and relatedness of SDT. The 7Habits is a complex personality training
accessible through training sessions or individual reading. In short we now recap the 7Habits
content. Habit 1 is “Be proactive”. Habit 1, as Covey put it in his talks, is about “realizing that
each of us is the programmer of their lives”. Habit 2 is “Begin with the end in mind”. Habit 2
is about writing the program for ourselves that we want to run on. Habit 3 is “Put first things
first”. Habit 3 is running the program: executing. The first three Habits are part of what Covey
calls Private Victory that leads to Independence. In our regression models we will not only
focus on the 7Habits as a whole, but also on each Habit individually and also on Private Victory
as a separate entity that aggregates Habit 1 to 3. Habit 4 is “Think win-win”.
58th International Scientific Conference on Economic and Social Development – Budapest, 04-05 September, 2020
274
Is about the abundance mentality, that there is enough for both of us, thus enabling us to look
also for the “win” of the other person. Habit 5 is “Seek first to understand then to be
understood”. This is the communication strategy of the 7Habits. You will better know what to
do or say when you first understand the other, moreover other will be more inclined to be
influenced by you if they first feel understood. Habit 6 is “Synergy with others”. Looking for
alternatives together that are better. Habit 7 is “Sharpen the saw”. This is the maintenance Habit.
In Covey’s framework Habits 4 to 6 are aggregated in the Public Victory that leads to
Interdependence, and Habit 7 stands alone. In our present research we group Habit 7 to the
Public Victory for practical reasons because in the 12 item 7Habits scale Habit 7 is a relational
item. In our regression models we focus on each Habit individually and also on Public Victory
as a separate entity that aggregates Habit 4 to 7.
1.2. The Big Five Personality Traits and the 7Habits
The Big Five personality traits model of personality has been developed since the 80s and today
it is the most prevalent psychological personality model that has massive psychometric
evidence in support of (Rothmann and Coetzer, 2003). In this model the five personality traits
are openness to experience, conscientiousness, extraversion, agreeableness and neuroticism. In
None of the dimensions are good or bad, rather, they describe personality and the individual
mix of the traits is what counts. Extreme low or high values are regarded as problematic, but
both high or low values can have advantages on any given dimension. Openness to experience
is the dimension where inventiveness or curiousness (if high) and consistency or cautiousness
(if low) are measured. Conscientiousness is the dimension where efficiency or organized
personality (if high) and extravagancy or carelessness (if low) are measured. Extraversion is
the dimension where outgoingness or energetic personality (if high) and solitary or reserved
personality (if low) are measured. Agreeableness is the dimension where friendly or
compassionate (if high) and challenging or callous (if low) personality is measured.
Neuroticism is the dimension where sensitive or nervous (if high) and resilient or confident (if
low) personality is measured. In our study we use the Rammstedt and John (2007) 10 item
version of the Big Five inventory which is adequate to draw conclusions to the relationships of
the personality dimensions and other psychological variables also according to the literature
critical of the short scales (Credé, Harms, Niehorster, Gaye-Valentine, 2012). Personality traits
and habits can be predictive of each other. In our research we focus on the question to what
degree are personality traits predictive of the 7Habits as a whole and also of the individual
Habits and also of Private and Public Victory all of which are elements of Covey’s framework.
In general, we take an inquisitive or exploratory approach and we will draw conclusions based
on all of the results of the linear regression models. Nevertheless, we take care to formulate
three formal hypothesis that highlight our general expectations about the results of the 45
regression models that we run. We expect that when the complex 7Habits variable is put in
relation to the five personality dimensions neuroticism will be inversely predictive while the
other dimensions excluding Extraversion will be predictive of the 7Habits. This is because the
content of the 7Habits implies orderliness, and openness, trust towards others, while the
outgoingness and sociability don’t seem to be an intensively related dimension.
• Hypothesis 1: The 7Habits latent variable is positively related to Agreeableness,
Conscientiousness and Openness while negatively related to Neuroticism.
We expect that when Habits 1 to 3 and the Private Victory variables are put in relation to the
five personality dimensions Conscientiousness will be the most relevant predictor. This is
conscientiousness seems to be central to the first three habits.
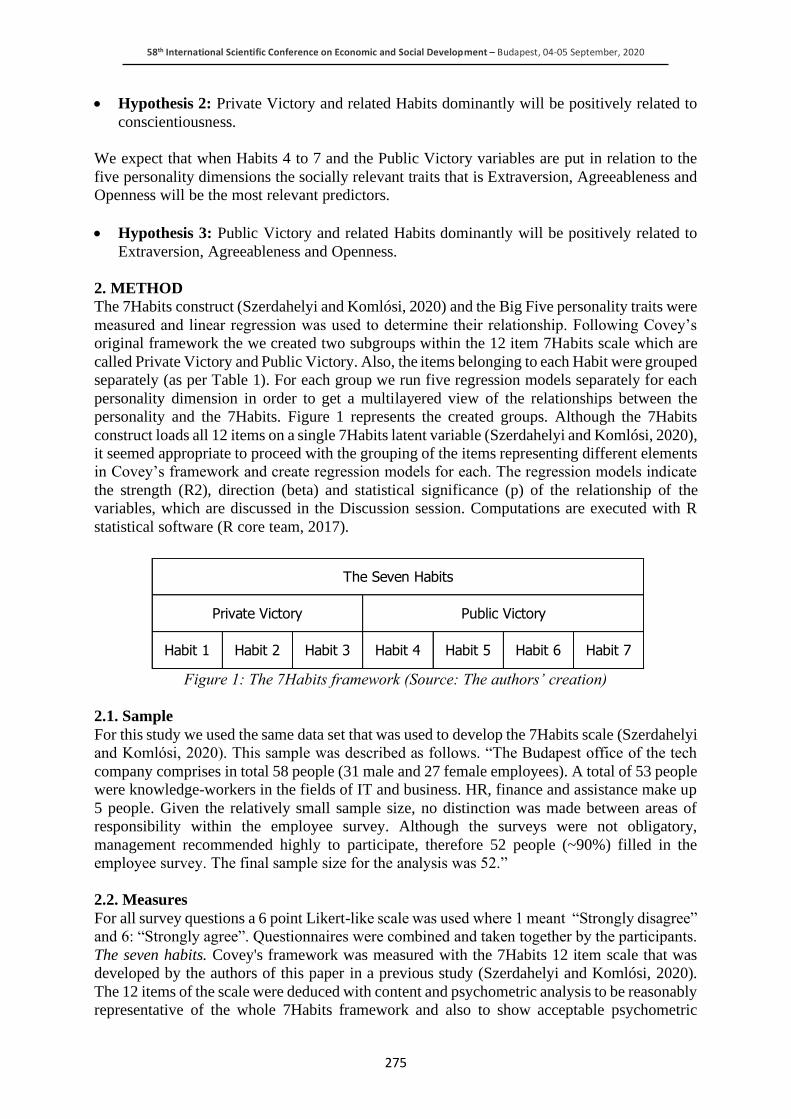
58th International Scientific Conference on Economic and Social Development – Budapest, 04-05 September, 2020
275
• Hypothesis 2: Private Victory and related Habits dominantly will be positively related to
conscientiousness.
We expect that when Habits 4 to 7 and the Public Victory variables are put in relation to the
five personality dimensions the socially relevant traits that is Extraversion, Agreeableness and
Openness will be the most relevant predictors.
• Hypothesis 3: Public Victory and related Habits dominantly will be positively related to
Extraversion, Agreeableness and Openness.
2. METHOD
The 7Habits construct (Szerdahelyi and Komlósi, 2020) and the Big Five personality traits were
measured and linear regression was used to determine their relationship. Following Covey’s
original framework the we created two subgroups within the 12 item 7Habits scale which are
called Private Victory and Public Victory. Also, the items belonging to each Habit were grouped
separately (as per Table 1). For each group we run five regression models separately for each
personality dimension in order to get a multilayered view of the relationships between the
personality and the 7Habits. Figure 1 represents the created groups. Although the 7Habits
construct loads all 12 items on a single 7Habits latent variable (Szerdahelyi and Komlósi, 2020),
it seemed appropriate to proceed with the grouping of the items representing different elements
in Covey’s framework and create regression models for each. The regression models indicate
the strength (R2), direction (beta) and statistical significance (p) of the relationship of the
variables, which are discussed in the Discussion session. Computations are executed with R
statistical software (R core team, 2017).
Figure 1: The 7Habits framework (Source: The authors’ creation)
2.1. Sample
For this study we used the same data set that was used to develop the 7Habits scale (Szerdahelyi
and Komlósi, 2020). This sample was described as follows. “The Budapest office of the tech
company comprises in total 58 people (31 male and 27 female employees). A total of 53 people
were knowledge-workers in the fields of IT and business. HR, finance and assistance make up
5 people. Given the relatively small sample size, no distinction was made between areas of
responsibility within the employee survey. Although the surveys were not obligatory,
management recommended highly to participate, therefore 52 people (~90%) filled in the
employee survey. The final sample size for the analysis was 52.”
2.2. Measures
For all survey questions a 6 point Likert-like scale was used where 1 meant “Strongly disagree”
and 6: “Strongly agree”. Questionnaires were combined and taken together by the participants.
The seven habits. Covey's framework was measured with the 7Habits 12 item scale that was
developed by the authors of this paper in a previous study (Szerdahelyi and Komlósi, 2020).
The 12 items of the scale were deduced with content and psychometric analysis to be reasonably
representative of the whole 7Habits framework and also to show acceptable psychometric
Private Victory Public Victory
The Seven Habits
Habit 1 Habit 2 Habit 3 Habit 4 Habit 5 Habit 6 Habit 7
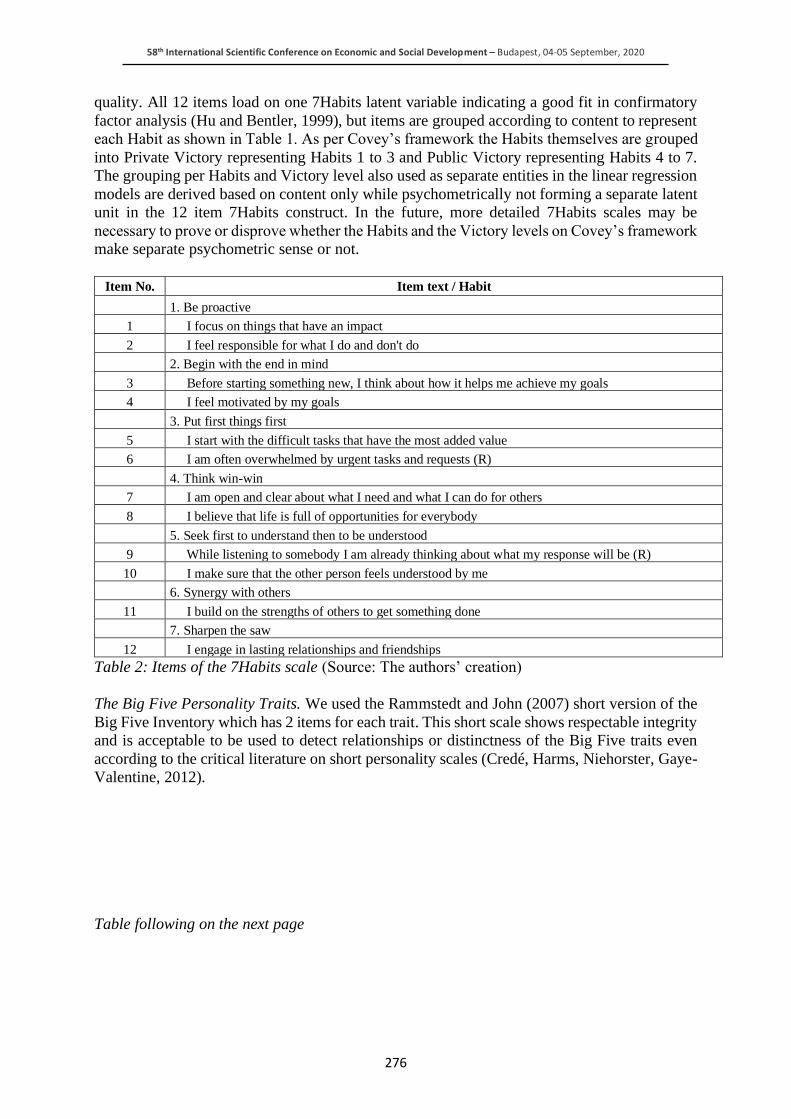
58th International Scientific Conference on Economic and Social Development – Budapest, 04-05 September, 2020
276
quality. All 12 items load on one 7Habits latent variable indicating a good fit in confirmatory
factor analysis (Hu and Bentler, 1999), but items are grouped according to content to represent
each Habit as shown in Table 1. As per Covey’s framework the Habits themselves are grouped
into Private Victory representing Habits 1 to 3 and Public Victory representing Habits 4 to 7.
The grouping per Habits and Victory level also used as separate entities in the linear regression
models are derived based on content only while psychometrically not forming a separate latent
unit in the 12 item 7Habits construct. In the future, more detailed 7Habits scales may be
necessary to prove or disprove whether the Habits and the Victory levels on Covey’s framework
make separate psychometric sense or not.
Item No. Item text / Habit
1. Be proactive
1 I focus on things that have an impact
2 I feel responsible for what I do and don't do
2. Begin with the end in mind
3 Before starting something new, I think about how it helps me achieve my goals
4 I feel motivated by my goals
3. Put first things first
5 I start with the difficult tasks that have the most added value
6 I am often overwhelmed by urgent tasks and requests (R)
4. Think win-win
7 I am open and clear about what I need and what I can do for others
8 I believe that life is full of opportunities for everybody
5. Seek first to understand then to be understood
9 While listening to somebody I am already thinking about what my response will be (R)
10 I make sure that the other person feels understood by me
6. Synergy with others
11 I build on the strengths of others to get something done
7. Sharpen the saw
12 I engage in lasting relationships and friendships
Table 2: Items of the 7Habits scale (Source: The authors’ creation)
The Big Five Personality Traits. We used the Rammstedt and John (2007) short version of the
Big Five Inventory which has 2 items for each trait. This short scale shows respectable integrity
and is acceptable to be used to detect relationships or distinctness of the Big Five traits even
according to the critical literature on short personality scales (Credé, Harms, Niehorster, Gaye-
Valentine, 2012).
Table following on the next page
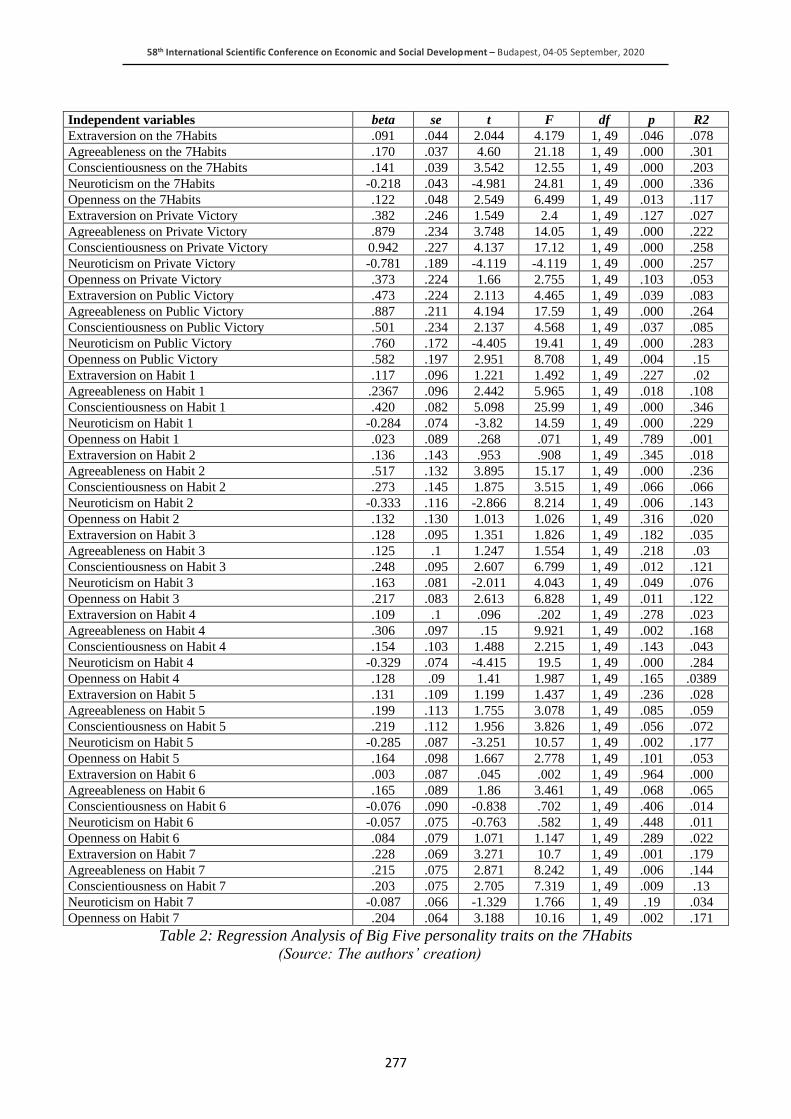
58th International Scientific Conference on Economic and Social Development – Budapest, 04-05 September, 2020
277
Independent variables beta se t F df p R2
Extraversion on the 7Habits .091 .044 2.044 4.179 1, 49 .046 .078
Agreeableness on the 7Habits .170 .037 4.60 21.18 1, 49 .000 .301
Conscientiousness on the 7Habits .141 .039 3.542 12.55 1, 49 .000 .203
Neuroticism on the 7Habits -0.218 .043 -4.981 24.81 1, 49 .000 .336
Openness on the 7Habits .122 .048 2.549 6.499 1, 49 .013 .117
Extraversion on Private Victory .382 .246 1.549 2.4 1, 49 .127 .027
Agreeableness on Private Victory .879 .234 3.748 14.05 1, 49 .000 .222
Conscientiousness on Private Victory 0.942 .227 4.137 17.12 1, 49 .000 .258
Neuroticism on Private Victory -0.781 .189 -4.119 -4.119 1, 49 .000 .257
Openness on Private Victory .373 .224 1.66 2.755 1, 49 .103 .053
Extraversion on Public Victory .473 .224 2.113 4.465 1, 49 .039 .083
Agreeableness on Public Victory .887 .211 4.194 17.59 1, 49 .000 .264
Conscientiousness on Public Victory .501 .234 2.137 4.568 1, 49 .037 .085
Neuroticism on Public Victory .760 .172 -4.405 19.41 1, 49 .000 .283
Openness on Public Victory .582 .197 2.951 8.708 1, 49 .004 .15
Extraversion on Habit 1 .117 .096 1.221 1.492 1, 49 .227 .02
Agreeableness on Habit 1 .2367 .096 2.442 5.965 1, 49 .018 .108
Conscientiousness on Habit 1 .420 .082 5.098 25.99 1, 49 .000 .346
Neuroticism on Habit 1 -0.284 .074 -3.82 14.59 1, 49 .000 .229
Openness on Habit 1 .023 .089 .268 .071 1, 49 .789 .001
Extraversion on Habit 2 .136 .143 .953 .908 1, 49 .345 .018
Agreeableness on Habit 2 .517 .132 3.895 15.17 1, 49 .000 .236
Conscientiousness on Habit 2 .273 .145 1.875 3.515 1, 49 .066 .066
Neuroticism on Habit 2 -0.333 .116 -2.866 8.214 1, 49 .006 .143
Openness on Habit 2 .132 .130 1.013 1.026 1, 49 .316 .020
Extraversion on Habit 3 .128 .095 1.351 1.826 1, 49 .182 .035
Agreeableness on Habit 3 .125 .1 1.247 1.554 1, 49 .218 .03
Conscientiousness on Habit 3 .248 .095 2.607 6.799 1, 49 .012 .121
Neuroticism on Habit 3 .163 .081 -2.011 4.043 1, 49 .049 .076
Openness on Habit 3 .217 .083 2.613 6.828 1, 49 .011 .122
Extraversion on Habit 4 .109 .1 .096 .202 1, 49 .278 .023
Agreeableness on Habit 4 .306 .097 .15 9.921 1, 49 .002 .168
Conscientiousness on Habit 4 .154 .103 1.488 2.215 1, 49 .143 .043
Neuroticism on Habit 4 -0.329 .074 -4.415 19.5 1, 49 .000 .284
Openness on Habit 4 .128 .09 1.41 1.987 1, 49 .165 .0389
Extraversion on Habit 5 .131 .109 1.199 1.437 1, 49 .236 .028
Agreeableness on Habit 5 .199 .113 1.755 3.078 1, 49 .085 .059
Conscientiousness on Habit 5 .219 .112 1.956 3.826 1, 49 .056 .072
Neuroticism on Habit 5 -0.285 .087 -3.251 10.57 1, 49 .002 .177
Openness on Habit 5 .164 .098 1.667 2.778 1, 49 .101 .053
Extraversion on Habit 6 .003 .087 .045 .002 1, 49 .964 .000
Agreeableness on Habit 6 .165 .089 1.86 3.461 1, 49 .068 .065
Conscientiousness on Habit 6 -0.076 .090 -0.838 .702 1, 49 .406 .014
Neuroticism on Habit 6 -0.057 .075 -0.763 .582 1, 49 .448 .011
Openness on Habit 6 .084 .079 1.071 1.147 1, 49 .289 .022
Extraversion on Habit 7 .228 .069 3.271 10.7 1, 49 .001 .179
Agreeableness on Habit 7 .215 .075 2.871 8.242 1, 49 .006 .144
Conscientiousness on Habit 7 .203 .075 2.705 7.319 1, 49 .009 .13
Neuroticism on Habit 7 -0.087 .066 -1.329 1.766 1, 49 .19 .034
Openness on Habit 7 .204 .064 3.188 10.16 1, 49 .002 .171
Table 2: Regression Analysis of Big Five personality traits on the 7Habits
(Source: The authors’ creation)
58th International Scientific Conference on Economic and Social Development – Budapest, 04-05 September, 2020
278
3. RESULTS
In the Results section we detail the results of the linear regression models that we run in order
to calculate the strength of the relationships between the Big Five personality traits and the
7Habits construct. The 7Habits is measured as one latent variable on which the12 items load
and these items are representative of the 7 habits. In order to follow the logic of Covey’s
framework and be able to deduce meaningful conclusions per Habit and per Private Victory
(including Habit 1 to 3) and the per Public Victory (including Habit 4 to 7), we run linear
regressions for each subcomponent of the 7Habits construct.
3.1. The Big Five Personality Traits and the 7Habits as a whole
We first tested the models measuring the relationship between the 12 item 7Habits construct
and each of the Big Five traits. The linear regression model measuring the effect of Extraversion
on the 7Habits is beta .091, se .044, t 2.044, F 4.179 and R2 .078 with significance level p .046.
That of Agreeableness on the 7Habits is beta .170, se .037, t 4.60, F 21.18 and R2 .301 with
significance level p .000. Conscientiousness on the 7Habits has an effect of beta .141, se .039,
t 3.542, F 12.55 and R2 .203 with significance level p .000. While the effect of Neuroticism on
the 7Habits is beta -0.218, se .043, t -4.981, F 24.81 and R2 .336 with significance level p .000.
Finally, the effect of Openness on the 7Habits is beta .122, se .048, t 2.549, F 6.499 and R2
.117 with significance level p .013.
3.2. The Big Five Personality Traits and the Privat Victory
Second, we tested the models measuring the relationship between Private Victory – making up
the first 6 items of the 7Habits construct including Habits 1 to 3 – and each of the Big Five
traits. The linear regression model measuring the effect of Extraversion on Private Victory is
beta .382, se .246, t 1.549, F 2.4 and R2 .027 with significance level p .127. That of
Agreeableness on Private Victory is beta .879, se .234, t 3.748, F 14.05 and R2 .222 with
significance level p .000. Conscientiousness on Private Victory has an effect of beta 0.942, se
.227, t 4.137, F 17.12 and R2 .258 with significance level p .000. While the effect of
Neuroticism on Private Victory is beta -0.781, se .189, t -4.119, F -4.119 and R2 .257 with
significance level p .000. Finally, the effect of Openness on Private Victory is beta .373, se
.224, t 1.66, F 2.755 and R2 .053 with significance level p .103.
3.3. The Big Five Personality Traits and the Public Victory
Third, we tested the models measuring the relationship between Private Victory – making up
the last 6 items of the 7Habits construct including Habits 4 to 7 – and each of the Big Five traits.
The linear regression model measuring the effect of Extraversion on Public Victory is beta .473,
se .224, t 2.113, F 4.465 and R2 .083 with significance level p .039. That of Agreeableness on
Public Victory is beta .887, se .211, t 4.194, F 17.59 and R2 .264 with significance level p .000.
Conscientiousness on Public Victory has an effect of beta .501, se .234, t 2.137, F 4.568 and
R2 .085 with significance level p .037. While the effect of Neuroticism on Public Victory is
beta .760, se .172, t -4.405, F 19.41 and R2 .283 with significance level p .000. Finally, the
effect of Openness on Public Victory is beta .582, se .197, t 2.951, F 8.708 and R2 .15 with
significance level p .004.
3.4. The Big Five Personality Traits and Habit 1: Be proactive
Then, we tested the models measuring the relationship between each Habit and the Big Five
traits. The linear regression model measuring the effect of Extraversion on Habit 1 is beta .117,
se .096, t 1.221, F 1.492 and R2 .02 with significance level p .227. That of Agreeableness on
Habit 1 is beta .2367, se .096, t 2.442, F 5.965 and R2 .108 with significance level p .018.
58th International Scientific Conference on Economic and Social Development – Budapest, 04-05 September, 2020
279
Conscientiousness on Habit 1 has an effect of beta .420, se .082, t 5.098, F 25.99 and R2 .346
with significance level p .000. While the effect of Neuroticism on Habit 1 is beta -0.284, se
.074, t -3.82, F 14.59 and R2 .229 with significance level p .000. Finally, the effect of Openness
on Habit 1 is beta .023, se .089, t .268, F .071 and R2 .001 with significance level p .789.
3.5. The Big Five Personality Traits and Habit 2: Begin with the end in mind
The linear regression model measuring the effect of Extraversion on Habit 2 is beta .136, se
.143, t .953, F .908 and R2 .018 with significance level p .345. That of Agreeableness on Habit
2 is beta .517, se .132, t 3.895, F 15.17 and R2 .236 with significance level p .000.
Conscientiousness on Habit 2 has an effect of beta .273, se .145, t 1.875, F 3.515 and R2 .066
with significance level p .066. While the effect of Neuroticism on Habit 2 is beta -0.333, se
.116, t -2.866, F 8.214 and R2 .143 with significance level p .006. Finally, the effect of
Openness on Habit 2 is beta .132, se .130, t 1.013, F 1.026 and R2 .020 with significance level
p .316.
3.6. The Big Five Personality Traits and Habit 3: Put first things first
The linear regression model measuring the effect of Extraversion on Habit 3 is beta .128, se
.095, t 1.351, F 1.826 and R2 .035 with significance level p .182. That of Agreeableness on
Habit 3 is beta .125, se .1, t 1.247, F 1.554 and R2 .03 with significance level p .218.
Conscientiousness on Habit 3 has an effect of beta .248, se .095, t 2.607, F 6.799 and R2 .121
with significance level p .012. While the effect of Neuroticism on Habit 3 is beta .163, se .081,
t -2.011, F 4.043 and R2 .076 with significance level p .049. Finally, the effect of Openness on
Habit 3 is beta .217, se .083, t 2.613, F 6.828 and R2 .122 with significance level p .011.
3.7. The Big Five Personality Traits and Habit 4: Think win-win
The linear regression model measuring the effect of Extraversion on Habit 4 is beta .109, se .1,
t .096, F .202 and R2 .023 with significance level p .278. That of Agreeableness on Habit 4 is
beta .306, se .097, t .15, F 9.921 and R2 .168 with significance level p .002. Conscientiousness
on Habit 4 has an effect of beta .154, se .103, t 1.488, F 2.215 and R2 .043 with significance
level p .143. While the effect of Neuroticism on Habit 4 is beta -0.329, se .074, t -4.415, F 19.5
and R2 .284 with significance level p .000. Finally, the effect of Openness on Habit 4 is beta
.128, se .09, t 1.41, F 1.987 and R2 .0389 with significance level p .165.
3.8. The Big Five Personality Traits and Habit 5: Seek first to understand then to be
understood
The linear regression model measuring the effect of Extraversion on Habit 5 is beta .131, se
.109, t 1.199, F 1.437 and R2 .028 with significance level p .236. That of Agreeableness on
Habit 5 is beta .199, se .113, t 1.755, F 3.078 and R2 .059 with significance level p .085.
Conscientiousness on Habit 5 has an effect of beta .219, se .112, t 1.956, F 3.826 and R2 .072
with significance level p .056. While the effect of Neuroticism on Habit 5 is beta -0.285, se
.087, t -3.251, F 10.57 and R2 .177 with significance level p .002. Finally, the effect of
Openness on Habit 5 is beta .164, se .098, t 1.667, F 2.778 and R2 .053 with significance level
p .101.
3.9. The Big Five Personality Traits and Habit 6: Synergize with others
The linear regression model measuring the effect of Extraversion on Habit 6 is beta .003, se
.087, t .045, F .002 and R2 .000 with significance level p .964. That of Agreeableness on Habit
6 is beta .165, se .089, t 1.86, F 3.461 and R2 .065 with significance level p .068.
Conscientiousness on Habit 6 has an effect of beta -0.076, se .090, t -0.838, F .702 and R2 .014
with significance level p .406.
58th International Scientific Conference on Economic and Social Development – Budapest, 04-05 September, 2020
280
While the effect of Neuroticism on Habit 6 is beta -0.057, se .075, t -0.763, F .582 and R2 .011
with significance level p .448. Finally, the effect of Openness on Habit 6 is beta .084, se .079,
t 1.071, F 1.147 and R2 .022 with significance level p .289.
3.10. The Big Five Personality Traits and Habit 7: Sharpen the saw
The linear regression model measuring the effect of Extraversion on Habit 7 is beta .228, se
.069, t 3.271, F 10.7 and R2 .179 with significance level p .001. That of Agreeableness on Habit
7 is beta .215, se .075, t 2.871, F 8.242 and R2 .144 with significance level p .006.
Conscientiousness on Habit 7 has an effect of beta .203, se .075, t 2.705, F 7.319 and R2 .13
with significance level p .009. While the effect of Neuroticism on Habit 7 is beta -0.087, se
.066, t -1.329, F 1.766 and R2 .034 with significance level p .19. Finally, the effect of Openness
on Habit 7 is beta .204, se .064, t 3.188, F 10.16 and R2 .171 with significance level p .002.
4. DISCUSSION
45 linear regression models have been run on the 7Habits and the component groups defined as
Private and Public Victory and as the 7 Habits. Our general expectations are confirmed, but
there are also surprising results which highlight opportunities or betray the weaknesses of the
scales applied. Looking at the models where the 7Habits construct as a whole was predicted by
the five personality dimensions all came out as statistically significant although not all very
relevant in terms of degree or strength. Extraversion was the weakest predictor as per our
hypothesis, although still significant. Neuroticism curiously came out as the dominant predictor
of the 7Habits followed closely by Agreeableness. Neuroticism is inversely related to the
7Habits variable which means that the lower the Neuroticism trait the higher the 7Habits
variable in general on our sample. This is true for most levels of analysis to follow. The
conclusion to discuss in terms of training and practice is that maybe people high on Neuroticism
could be helped by practicing the Seven Habits, provided that we assume that the relationship
is reversable in practice and good habits can help to compensate for high Neuroticism trait.
Agreeableness is also surprisingly the second most powerful predictor of the 7Habits, whereas
it was assumed that it would be mostly predictive of Public Victory and related Habits. Looking
at the models where the Private Victory (encompassing the Habits of Independence) was
predicted by the five personality dimensions only three came out as statistically significant.
Conscientiousness was expected to be the most powerful predictor, which is so, but only by a
negligible margin: Neuroticism inversely is almost as predictive, while curiously Agreeableness
is also strongly predictive. Looking at the models where the Public Victory (encompassing the
Habits of Interdependence) was predicted by the five personality dimensions all came out as
statistically significant, however curiously extraversion is the least important predictor.
Conscientiousness is also very weak, however this was expected. According to the pattern so
far observed, Neuroticism is the strongest predictor (inversely) of the Public Victory, followed
by Agreeableness and finally by Openness to experience. We also run regression models for
each of the Habits. In Hypothesis 2 we suggested that for Habits 1 to 3 Conscientiousness would
be the dominant predictor. In the case of Habit 1 (Be proactive!) this is clearly so with
Neuroticism (reversed effect) being in the second place. In the case of Habit 2 (Begin with the
end in mind) however Conscientiousness is not a strong predictor. Agreeableness is the leading
predictors, while Neuroticism is also significant. This result doesn’t seem to fit with theory
about the personality traits or the 7Habits, therefore it is either reflective of a measurement error
or implies the inadequacy of the 7Habits items referring to Habit 2. As for Habit 3 (Put first
things first) Conscientiousness and Openness are equally (and neither of them very strongly)
predicting of the Habit. The former is according to our Hypothesis 2 and the latter is an
interesting additional finding. As for Habit 4 (Think Win-Win), Neuroticism is the strongest
(invers) predictor according to the trend discovered across most regression models.
58th International Scientific Conference on Economic and Social Development – Budapest, 04-05 September, 2020
281
Agreeableness as per our Hypothesis 3 is also a rather strong predictor, however Extraversion
and Openness are not significant. As for Habit 5 (Seek first to understand and then to be
understood) only the invers effect of Neuroticism is statistically significant contrary to
Hypothesis 3. Habit 6 (Synergize with others) didn’t have any significant predictors as per our
regression models. Habit 7 (Sharpen the saw) which in the case of the 12 item 7Habits scale is
really about the quality of relationships, is as per Hypothesis 3 showing as predictors
Extraversion, Agreeableness and Openness. Results indicate that people low in Neuroticism
and high in Conscientiousness and Agreeableness will be better at the 7Habits while
Extraversion and Openness have less to do with the Habits. Assuming the premise that the
relationship is reversable in the sense that by practicing the Habits one can compensate for
certain low personality traits, the Seven Habits training and practicing the Habits could
compensate for lower levels of Conscientiousness, Agreeableness and higher levels of
Neuroticism. The strongest and most consistent predictor of the Habits was Neuroticism in
reverse, therefore from a personality perspective practicing the Habits may be come most handy
for those who are high in Neuroticism.
5. LIMITATIONS AND CONCLUSIONS
The 45 regression models run on the 12 7Habits items and the Big Five personality traits
revealed to a large extent the predicted relationships while as a major surprise came that
Neuroticism was with few exceptions the top predictor of the 7Habits and its components. From
a training and personality perspective, the practicing or learning about the Seven Habits may
be most helpful to those who would like to compensate for low Conscientiousness and low
Agreeableness and high Neuroticism. Results also indicate that those already high in
Conscientiousness and Agreeableness and low in Neuroticism will do best in practicing the
Seven Habits. The personality traits Extraversion and Openness are less related to the Habits.
Certain relationships resulting from the regression models are not compatible with the theory
of Seven Habits and the personality traits, therefore they either indicate a measurement error or
the deficiency of the 7Habits scale. Both of these points are reflective of the limitations of this
paper and are opportunities for future research. On the one hand larger sample sizes allow for
more reliable measurements, on the other hand a more elaborate 7Habits scale is probably
possible to develop with more items that would capture more of the content of the Seven Habits
and would allow for a each of the Habits (or at least each group of Habits) to load on separate
latent variables at factor analysis. A more complete 7Habits measurement tool may allow for
more precise results when put in relation to the Big Five Personality Traits.
LITERATURE:
1. Covey, SR (1989). The 7 Habits of Highly Effective People: Powerful Lessons in Personal
Change. London: Simon and Schuster
2. Credé, Harms, Niehorster, Gaye-Valentine (2012). An Evaluation of the Consequences of
Using Short Measures of the Big Five Personality Traits. Journal of Personality and Social
Psychology. 2012, Vol. 102, No. 4, 874–888.
3. Deci, E. L., Ryan, R. M., Gagné, M., Leone, D. R., Usunov, J., & Kornazheva, B. P. (2001).
Need satisfaction, motivation, and well-being in the work organizations of a former Eastern
Bloc country. Personality and Social Psychology Bulletin.
4. Deci, Edward L. and Ryan, Richard M. (2000). The “What” and “Why” of Goal Pursuits:
Human Needs and the Self-Determination of Behavior. Psychological Inquiry, Vol. 11, No.
4, 227–268.
5. Hu, L., & Bentler, P. M. (1999). Cutoff criteria for fit indexes in covariance structure
analysis: Conventional criteria versus new alternatives. Structural Equation Modeling: A
Multidisciplinary Journal, 6(1), 1–55.
58th International Scientific Conference on Economic and Social Development – Budapest, 04-05 September, 2020
282
6. Jackson, B (1999). The goose that laid the golden egg? A rhetorical critique of Stephen
Covey and the Effectiveness Movement. Journal of Management Studies 36(3): 353–378.
7. Kasser, T., Davey, J., & Ryan, R. M. (1992). Motivation, dependability, and
employeesupervisor discrepancies in psychiatric vocational rehabilitation settings.
Rehabilitation Psychology, 37, 175-187.
8. Maslow, MH (1954). Motivation and Personality (1st edition: 1954, 2nd edition: 1970, 3rd
edition 1987)
9. Mccabe, D (2011). Opening Pandora’s box: The unintended consequences of Stephen
Covey’s effectiveness movement. Management Learning 42(2):183-197
10. Millar, M. (2013). "Using the 7 Habits programme to develop effective leadership".
NURSING MANAGEMENT, October 2013 | Volume 20 | Number 6
11. R Core Team (2017). R: A language and environment for statistical computing. R
Foundation for Statistical Computing, Vienna, Austria. URL https://www.R-project.org/.
12. Rammstedt, B. and John, O. P. (2007). Measuring personality in one minute or less: A 10-
item short version of the Big Five Inventory in English and German. Journal of Research in
Personality, 41 (2007) 203–212
13. Revelle W. (2019). psych: Procedures for Psychological, Psychometric, and Personality
Research. Northwestern University, Evanston, Illinois. R package version
1.9.12, https://CRAN.R-project.org/package=psych.
14. Rosseel, Yves (2012). lavaan: An R Package for Structural Equation Modeling. Journal of
Statistical Software, 48(2), 1-36.
15. Rothmann S, Coetzer EP (2003). "The big five personality dimensions and job
performance". SA Journal of Industrial Psychology. 29. doi:10.4102/sajip.v29i1.88.
16. Ryff, C. D., Keyes, C. L. M. (1995). The structure of psychological well-being revisited.
Journal of Personality and Social Psychology, 69, 4, 719-727.
17. Seligman, Martin & Csikszentmihalyi, Mihaly. (2000). Positive Psychology: An
Introduction. The American psychologist. 55. 5-14. 10.1037/0003-066X.55.1.5.
18. Stanton, J., Sinar, E., Balzer, W. and Smith, P. (2002). Issues and strategies for reducing
the length of self-report scales. Personnel Psychology. 55. 167-194. 10.1111/j.1744-
6570.2002.tb00108.x.
19. Starck, P. (1995). "Nurse-Managed Clinics: A Blueprint for Success Using the Covey
Framework". Journal of Professional Nursing, Vol 11, No 2 (March-April), 1995: pp 71-77
20. Szerdahelyi, M. and Komlósi, l. (2020). The positive psychological basis, measurement and
outcomes of covey’s 7habits. Economic and Social Development: 52nd International
Scientific Conference on Economic and Social Development. ISSN 1849-7535.
58th International Scientific Conference on Economic and Social Development – Budapest, 04-05 September, 2020
283
FORMULA SAE AS A MODEL ENVIRONMENT TO INNOVATE
AUTOMOTIVE PRODUCT DEVELOPMENT
Tamas Kolossvary
Széchenyi István University,
Győr, Egyetem tér 1. H-9026, Hungary
Tibor Dory
Széchenyi István University,
Győr, Egyetem tér 1. H-9026, Hungary
Daniel Feszty
Széchenyi István University,
Győr, Egyetem tér 1. H-9026, Hungary
ABSTRACT
This paper introduces a novel methodology on how to downscale a comprehensive industrial
problem into a model environment. The organizational properties of a Formula Society of
Automotive Engineers (FSAE) racecar team and industrial automotive product development
were analyzed based on the factors of the McKinsey 7S framework. Semi-structured in-depth
interviews were conducted with FSAE and automotive industrial managers. Questions were
synchronized and the insights of respondents were thoroughly analyzed. Results revealed that
the most determining factors of similarity have emerged from the Skills, Staff and Structure
sections while other sections have also shown strong similarities between FSAE and industry.
Departments in both sectors are currently organized in functional structures but independent
efforts are ongoing to reorganize towards a matrix structure. Power distance is low, and the
role of mutual trust is significant, and engineers are interested in the development of a quality
product with improved features. The skills that are required from employees are common in
FSAE and industry. The outcomes revealed numerous common features between FSAE and
industrial automotive product development. Thus, it was concluded that FSAE could be a
relevant scaled environment to conduct the development and implementation of a new
organizational model, that is based on Systems Engineering theory.
Keywords: Formula SAE, Automotive Product Development, Automotive Ecosystems, Systems
Engineering
1. INTRODUCTION
Automotive products became so complex in terms of requirements and functionality lately, that
it might be timely to rethink the conventional product development processes,, otherwise
complexity could reach an uncontrollable level that can impede effectivity and damage
competitiveness of an vehicle manufacturer. As customer requirements transform, many
companies offer smart product features and innovative transportation services (Ferràs-
Hernández et al., 2017) (Stolfa et al., 2019). The common understanding of the term
“automobile” has not changed fundamentally in the past decades. However, car manufacturers
face today new challenges, predominantly in the areas of cyber technology issues for
autonomous driving (Morris et al., 2018), emission restrictions (Klebaner, 2018) and
sustainable development of electric powertrains. Naturally, the list could be even longer and
thus, automotive giants tend to seek project-based alliances (Townsend et al., 2017) or even
58th International Scientific Conference on Economic and Social Development – Budapest, 04-05 September, 2020
284
consider revolutionizing their business model (Lasmar Jr. et al., 2019). Most of the recent
automotive innovations concern software related or software-hardware integrity issues. The
ecosystem that we have been assigned to cars in the past, has been changing significantly
towards the integration of digital technologies. (Nischak and Hanelt, 2019) Recent studies about
the new era of car industry not only deals with technological aspects. Donada and Attias (2015)
claim that car manufacturers need to reposition automobiles in the future transportation system,
in which it might be a complementary option among other solutions. They also highlight that
automotive firms need to re-think their strategy, organization of innovation processes and the
relationships between stakeholders. New manufacturers have emerged recently, which based
their product development philosophy on completely new grounds. A profound case study,
worked out by Agren et al. (2019), analyze practitioner views on their working standards with
requirements regarding the intended system developments. These issues led us to Systems
Engineering (SE), which is a comprehensive set of principles and theories, dealing with both
technological and organizational aspects in order to develop complex systems effectively (Falk
& Muller, 2019). The value of SE has been revealed by Elm (2008), who contributed with
quantitative evidence, that in general, the projects with better SE capabilities are likely to
deliver better performance. Vanek et al. (2017) approved this observation as they found that
early investments on SE will result in better project outcomes when considering New Product
Development. SE has widespread application in diverse industries, however, little evidence of
successful implementation has been encountered for the automotive case. Loureiro (2004)
applied a total view approach, although he justified SE through a review and a comparison of
two case studies, while missing primary implementation. Dumitrescu et al. (2013) introduced
an SE based model for variability management, but they discussed production-related aspects
instead of product development. Hosseini & Welo (2016) published a proof-of-concept case
study in the form of a student project, however they focused on the integration of SE with
reliability engineering but missing any organizational impacts of a comprehensive SE
framework. Clearly, there is a lack of literature on how to implement a SE based approach in
its full context for automotive product development. This, with the advent of new functions,
have reached such level of complexity, for which the traditional organization of the
development process might no longer be suitable. Therefore, the overall goal of the research
described in this paper is to develop a methodology for the implementation SE in the automotive
product development phase. However, this phase is rather lengthy and expensive and therefore
an implementation experiment in a scaled model environment appears to be a more attractive
solution. This should share the same characteristics as the automotive sector but should have a
much cheaper and faster development cycle, so that multiple implementation tests can be
conducted in a relatively short time. This paper aims to demonstrate, that Formula SAE is a
valid scaled model environment of the automotive sector in terms of technical development,
i.e. the design and prototyping phase of developing a new mobility product.
2. MODEL ENVIRONMENT
2.1. Obstructions in industrial environment
Despite our motivations to experiment with SE approach in automotive product development,
we find that such project is hardly feasible in industrial circumstances. The primary reasons are
the following: (a) new product development cycle is long for research – normally it takes 3-6
years, which obviously precludes to gain validated results from the actual environment; (b)
project costs run high – inherent changes of such experiment would generate high expenses in
a multinational automotive giant organization; (c) requires in-depth change process – despite
the demand for reorganization does exist, the openness of decision makers to immediately
implement a new experimental model proposed by external researchers is questionable;.
58th International Scientific Conference on Economic and Social Development – Budapest, 04-05 September, 2020
285
Consequently, a model environment needs to be considered, which is appropriate to conduct
experiments with SE based organizational models and to develop findings that are
implementable in industrial circumstances.
2.2. Selection criteria
In order to select an appropriate model environment, we defined a number of criteria. According
to our proposition, the model environment need to (a) have short development cycle in terms
of time; (b) budgetary volume should be order of magnitudes lower than industrial product
development; (c) show recognizable similarities in organizational properties and strategic
goals; (d) should be agile and flexible to be able to easily realize the inherent changes in their
organizational model. The Formula Society of Automotive Engineers (FSAE), in which high
performing student teams deal with the development, prototyping and racing of single-seater
formula prototype racecars, appear to provide an appropriate environment for our research as it
(a) has a 9 month product development cycle, which is short; (b) the budgetary volume is in the
order of tens of thousands of euros, which is relatively low; (c) it is also an automotive product
development segment with similar goals in nature; (d) it is an agile organization working with
normally 30-50 members. Additionally, the direct access and close relationship of the authors
to the FSAE environment is already established. Having influence over the model environment
might be critical to be able to steadily conduct any research experiment in the future.
2.3. Research objective
The main objective of this study is to reveal the organizational circumstances of two
environments within the automotive product development segment, and assess whether they
are similar in terms of main properties and therefore to enable to use FSAE as a model
environment for implementing SE oriented organizational experiments.
3. METHODOLOGICAL FRAMEWORK
Considering our main research goal described above, we preferred to collect primary data with
an in-depth interview technique rather than applying questionnaires, since sophisticated
information on managerial experience can be more accurately reflected if respondents have the
appropriate space to express their thoughts. Considering the fact that our study aims to provide
findings based on a comprehensive organizational analysis, we decided to apply a qualitative
method by conducting interviews with relevant experts of the two automotive sectors: FSAE
and industrial R&D.
3.1. Interview structure
The McKinsey 7S framework served as the basis for our analysis because it is one of the most
popular strategic planning tools for both academics and professionals, that provides valuable
guidelines in the domain of organizational design. (Ravanfar, 2015) Even though the model has
been frequently applied by practitioners and consultants over the past decades, recently, Sardos
(2017) proposed a new look on the 7S framework. In addition to the fact that they proposed a
revision on the names of the 7Ss, their view consists of modified positioning of the aspects on
the graphical outline of the model, but no major content-related improvement was suggested.
For our particular research, this reconsideration is not essential as the 7S framework only
provides a guide for the individually developed questions and we do not intend to deal with in-
depth analysis concerning the McKinsey 7S model itself. Therefore, following the 7 elements
enabled us to create a semi-structured interview guide, which is stated to be a proper tool for
qualitative data collection, improving the trustworthiness of the research in several ways (Kallio
et al., 2016).
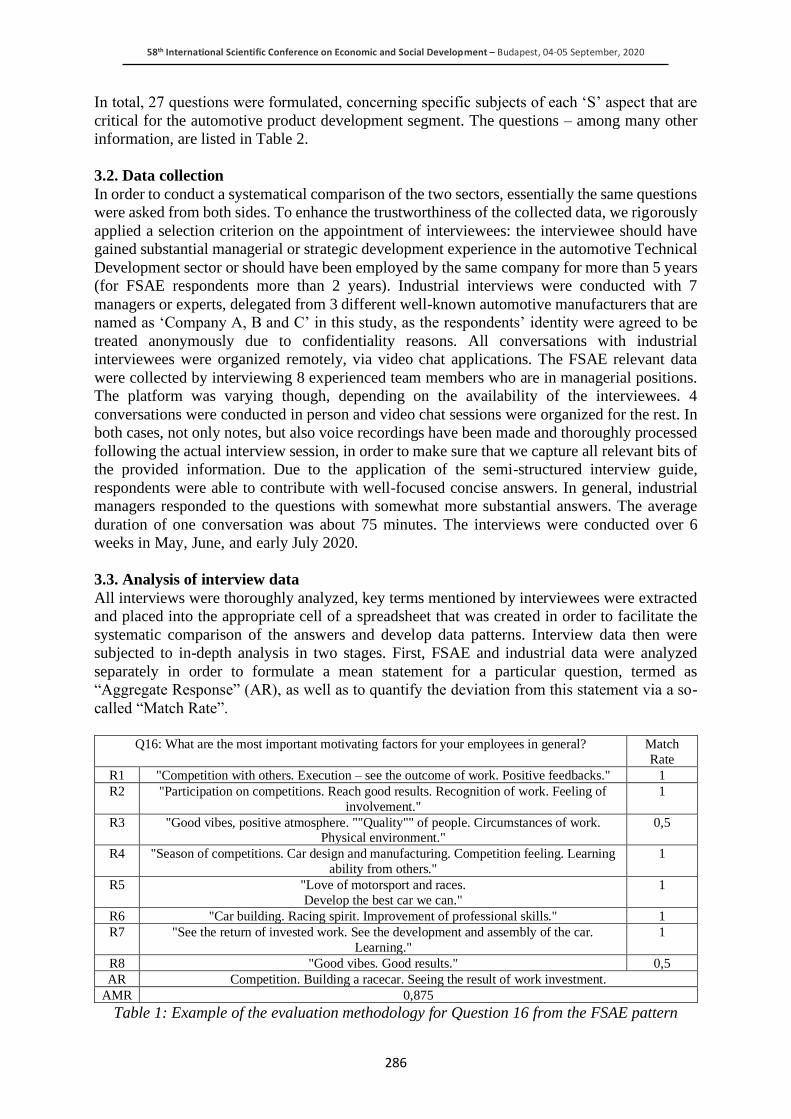
58th International Scientific Conference on Economic and Social Development – Budapest, 04-05 September, 2020
286
In total, 27 questions were formulated, concerning specific subjects of each ‘S’ aspect that are
critical for the automotive product development segment. The questions – among many other
information, are listed in Table 2.
3.2. Data collection
In order to conduct a systematical comparison of the two sectors, essentially the same questions
were asked from both sides. To enhance the trustworthiness of the collected data, we rigorously
applied a selection criterion on the appointment of interviewees: the interviewee should have
gained substantial managerial or strategic development experience in the automotive Technical
Development sector or should have been employed by the same company for more than 5 years
(for FSAE respondents more than 2 years). Industrial interviews were conducted with 7
managers or experts, delegated from 3 different well-known automotive manufacturers that are
named as ‘Company A, B and C’ in this study, as the respondents’ identity were agreed to be
treated anonymously due to confidentiality reasons. All conversations with industrial
interviewees were organized remotely, via video chat applications. The FSAE relevant data
were collected by interviewing 8 experienced team members who are in managerial positions.
The platform was varying though, depending on the availability of the interviewees. 4
conversations were conducted in person and video chat sessions were organized for the rest. In
both cases, not only notes, but also voice recordings have been made and thoroughly processed
following the actual interview session, in order to make sure that we capture all relevant bits of
the provided information. Due to the application of the semi-structured interview guide,
respondents were able to contribute with well-focused concise answers. In general, industrial
managers responded to the questions with somewhat more substantial answers. The average
duration of one conversation was about 75 minutes. The interviews were conducted over 6
weeks in May, June, and early July 2020.
3.3. Analysis of interview data
All interviews were thoroughly analyzed, key terms mentioned by interviewees were extracted
and placed into the appropriate cell of a spreadsheet that was created in order to facilitate the
systematic comparison of the answers and develop data patterns. Interview data then were
subjected to in-depth analysis in two stages. First, FSAE and industrial data were analyzed
separately in order to formulate a mean statement for a particular question, termed as
“Aggregate Response” (AR), as well as to quantify the deviation from this statement via a so-
called “Match Rate”.
Q16: What are the most important motivating factors for your employees in general? Match
Rate
R1 "Competition with others. Execution – see the outcome of work. Positive feedbacks." 1
R2 "Participation on competitions. Reach good results. Recognition of work. Feeling of
involvement."
1
R3 "Good vibes, positive atmosphere. ""Quality"" of people. Circumstances of work. Physical environment."
0,5
R4 "Season of competitions. Car design and manufacturing. Competition feeling. Learning
ability from others."
1
R5 "Love of motorsport and races.
Develop the best car we can."
1
R6 "Car building. Racing spirit. Improvement of professional skills." 1
R7 "See the return of invested work. See the development and assembly of the car.
Learning."
1
R8 "Good vibes. Good results." 0,5
AR Competition. Building a racecar. Seeing the result of work investment.
AMR 0,875
Table 1: Example of the evaluation methodology for Question 16 from the FSAE pattern
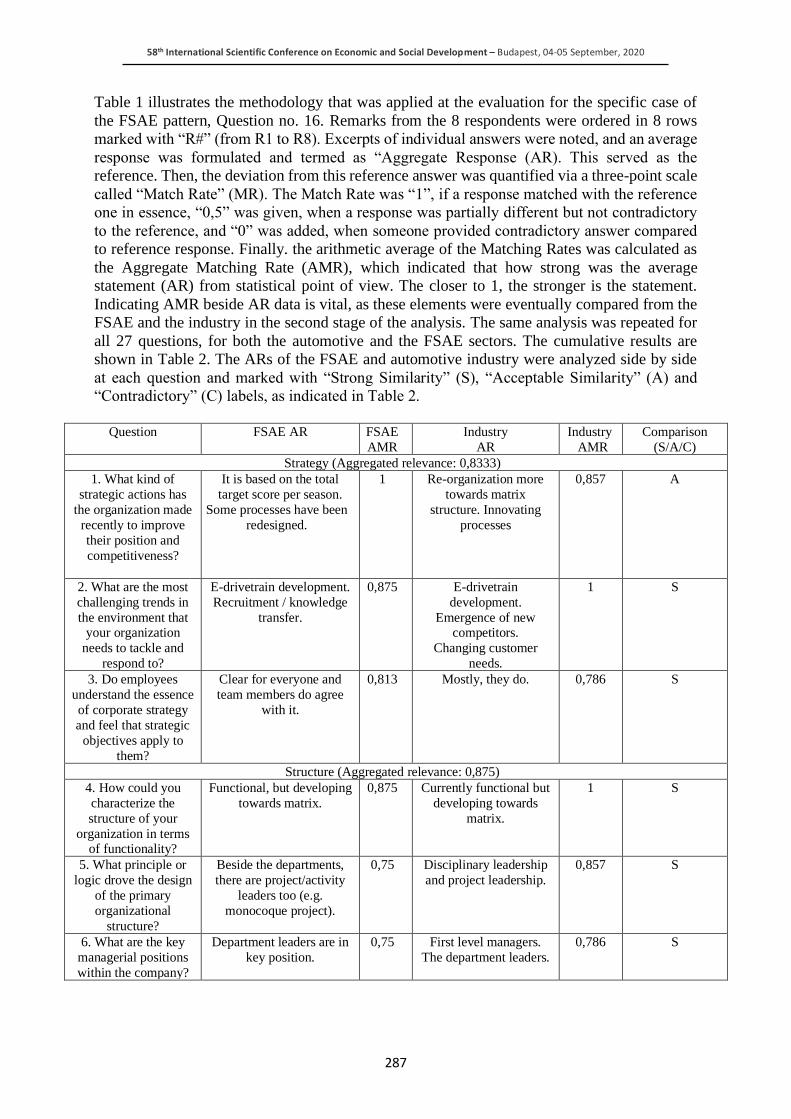
58th International Scientific Conference on Economic and Social Development – Budapest, 04-05 September, 2020
287
Table 1 illustrates the methodology that was applied at the evaluation for the specific case of
the FSAE pattern, Question no. 16. Remarks from the 8 respondents were ordered in 8 rows
marked with “R#” (from R1 to R8). Excerpts of individual answers were noted, and an average
response was formulated and termed as “Aggregate Response (AR). This served as the
reference. Then, the deviation from this reference answer was quantified via a three-point scale
called “Match Rate” (MR). The Match Rate was “1”, if a response matched with the reference
one in essence, “0,5” was given, when a response was partially different but not contradictory
to the reference, and “0” was added, when someone provided contradictory answer compared
to reference response. Finally. the arithmetic average of the Matching Rates was calculated as
the Aggregate Matching Rate (AMR), which indicated that how strong was the average
statement (AR) from statistical point of view. The closer to 1, the stronger is the statement.
Indicating AMR beside AR data is vital, as these elements were eventually compared from the
FSAE and the industry in the second stage of the analysis. The same analysis was repeated for
all 27 questions, for both the automotive and the FSAE sectors. The cumulative results are
shown in Table 2. The ARs of the FSAE and automotive industry were analyzed side by side
at each question and marked with “Strong Similarity” (S), “Acceptable Similarity” (A) and
“Contradictory” (C) labels, as indicated in Table 2.
Question FSAE AR FSAE
AMR
Industry
AR
Industry
AMR
Comparison
(S/A/C)
Strategy (Aggregated relevance: 0,8333)
1. What kind of
strategic actions has
the organization made
recently to improve
their position and
competitiveness?
It is based on the total
target score per season.
Some processes have been
redesigned.
1 Re-organization more
towards matrix
structure. Innovating
processes
0,857 A
2. What are the most
challenging trends in
the environment that your organization
needs to tackle and
respond to?
E-drivetrain development.
Recruitment / knowledge
transfer.
0,875 E-drivetrain
development.
Emergence of new competitors.
Changing customer
needs.
1 S
3. Do employees
understand the essence
of corporate strategy
and feel that strategic
objectives apply to
them?
Clear for everyone and
team members do agree
with it.
0,813 Mostly, they do. 0,786 S
Structure (Aggregated relevance: 0,875)
4. How could you
characterize the
structure of your
organization in terms of functionality?
Functional, but developing
towards matrix.
0,875 Currently functional but
developing towards
matrix.
1 S
5. What principle or
logic drove the design
of the primary
organizational
structure?
Beside the departments,
there are project/activity
leaders too (e.g.
monocoque project).
0,75 Disciplinary leadership
and project leadership.
0,857 S
6. What are the key
managerial positions
within the company?
Department leaders are in
key position.
0,75 First level managers.
The department leaders.
0,786 S
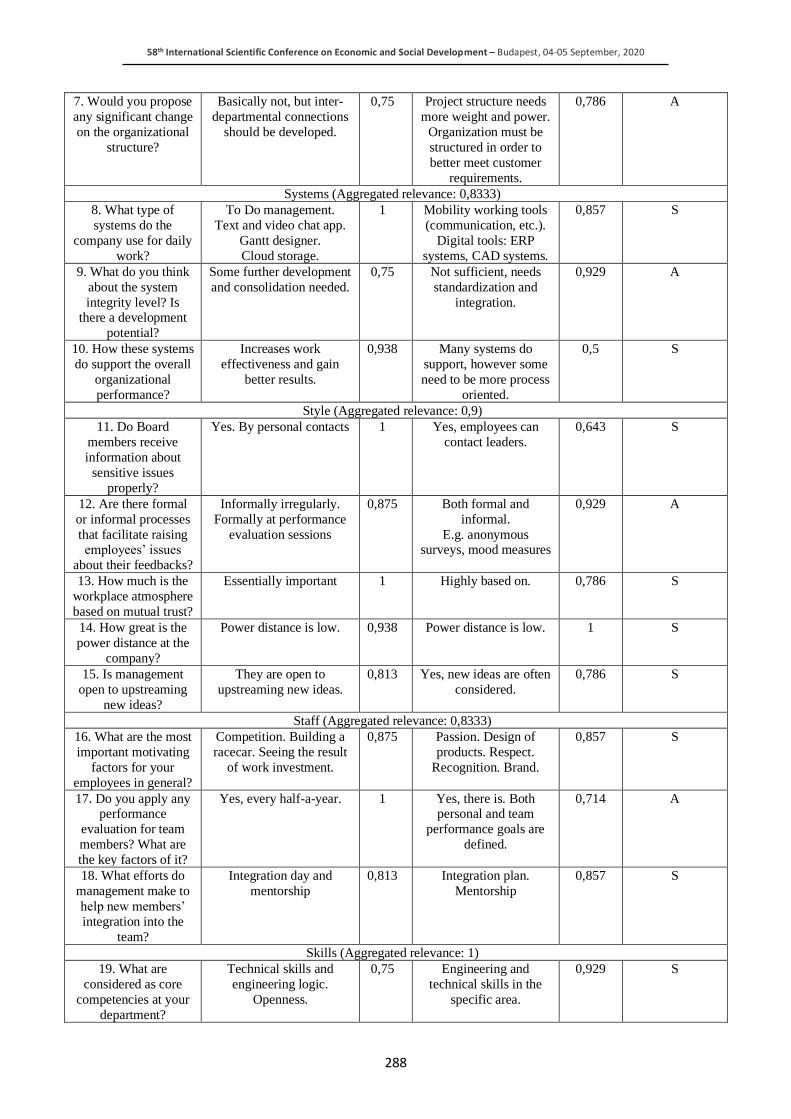
58th International Scientific Conference on Economic and Social Development – Budapest, 04-05 September, 2020
288
7. Would you propose
any significant change
on the organizational
structure?
Basically not, but inter-
departmental connections
should be developed.
0,75 Project structure needs
more weight and power.
Organization must be
structured in order to
better meet customer
requirements.
0,786 A
Systems (Aggregated relevance: 0,8333)
8. What type of
systems do the
company use for daily
work?
To Do management.
Text and video chat app.
Gantt designer.
Cloud storage.
1 Mobility working tools
(communication, etc.).
Digital tools: ERP
systems, CAD systems.
0,857 S
9. What do you think
about the system
integrity level? Is there a development
potential?
Some further development
and consolidation needed.
0,75 Not sufficient, needs
standardization and
integration.
0,929 A
10. How these systems
do support the overall
organizational
performance?
Increases work
effectiveness and gain
better results.
0,938 Many systems do
support, however some
need to be more process
oriented.
0,5 S
Style (Aggregated relevance: 0,9)
11. Do Board
members receive
information about
sensitive issues
properly?
Yes. By personal contacts 1 Yes, employees can
contact leaders.
0,643 S
12. Are there formal
or informal processes
that facilitate raising employees’ issues
about their feedbacks?
Informally irregularly.
Formally at performance
evaluation sessions
0,875 Both formal and
informal.
E.g. anonymous surveys, mood measures
0,929 A
13. How much is the
workplace atmosphere
based on mutual trust?
Essentially important 1 Highly based on. 0,786 S
14. How great is the
power distance at the
company?
Power distance is low. 0,938 Power distance is low. 1 S
15. Is management
open to upstreaming
new ideas?
They are open to
upstreaming new ideas.
0,813 Yes, new ideas are often
considered.
0,786 S
Staff (Aggregated relevance: 0,8333)
16. What are the most
important motivating
factors for your
employees in general?
Competition. Building a
racecar. Seeing the result
of work investment.
0,875 Passion. Design of
products. Respect.
Recognition. Brand.
0,857 S
17. Do you apply any performance
evaluation for team
members? What are
the key factors of it?
Yes, every half-a-year. 1 Yes, there is. Both personal and team
performance goals are
defined.
0,714 A
18. What efforts do
management make to
help new members’
integration into the
team?
Integration day and
mentorship
0,813 Integration plan.
Mentorship
0,857 S
Skills (Aggregated relevance: 1)
19. What are
considered as core
competencies at your
department?
Technical skills and
engineering logic.
Openness.
0,75 Engineering and
technical skills in the
specific area.
0,929 S
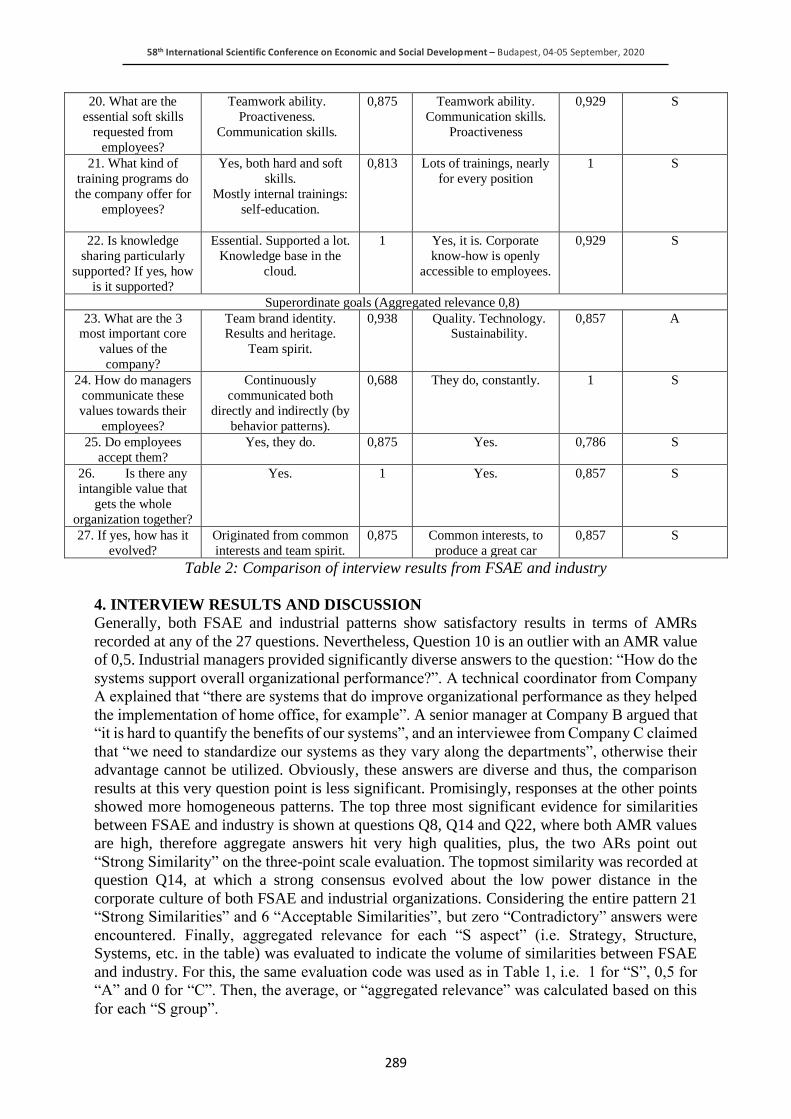
58th International Scientific Conference on Economic and Social Development – Budapest, 04-05 September, 2020
289
20. What are the
essential soft skills
requested from
employees?
Teamwork ability.
Proactiveness.
Communication skills.
0,875 Teamwork ability.
Communication skills.
Proactiveness
0,929 S
21. What kind of
training programs do
the company offer for
employees?
Yes, both hard and soft
skills.
Mostly internal trainings:
self-education.
0,813 Lots of trainings, nearly
for every position
1 S
22. Is knowledge
sharing particularly
supported? If yes, how
is it supported?
Essential. Supported a lot.
Knowledge base in the
cloud.
1 Yes, it is. Corporate
know-how is openly
accessible to employees.
0,929 S
Superordinate goals (Aggregated relevance 0,8)
23. What are the 3 most important core
values of the
company?
Team brand identity. Results and heritage.
Team spirit.
0,938 Quality. Technology. Sustainability.
0,857 A
24. How do managers
communicate these
values towards their
employees?
Continuously
communicated both
directly and indirectly (by
behavior patterns).
0,688 They do, constantly. 1 S
25. Do employees
accept them?
Yes, they do. 0,875 Yes. 0,786 S
26. Is there any
intangible value that
gets the whole
organization together?
Yes. 1 Yes. 0,857 S
27. If yes, how has it
evolved?
Originated from common
interests and team spirit.
0,875 Common interests, to
produce a great car
0,857 S
Table 2: Comparison of interview results from FSAE and industry
4. INTERVIEW RESULTS AND DISCUSSION
Generally, both FSAE and industrial patterns show satisfactory results in terms of AMRs
recorded at any of the 27 questions. Nevertheless, Question 10 is an outlier with an AMR value
of 0,5. Industrial managers provided significantly diverse answers to the question: “How do the
systems support overall organizational performance?”. A technical coordinator from Company
A explained that “there are systems that do improve organizational performance as they helped
the implementation of home office, for example”. A senior manager at Company B argued that
“it is hard to quantify the benefits of our systems”, and an interviewee from Company C claimed
that “we need to standardize our systems as they vary along the departments”, otherwise their
advantage cannot be utilized. Obviously, these answers are diverse and thus, the comparison
results at this very question point is less significant. Promisingly, responses at the other points
showed more homogeneous patterns. The top three most significant evidence for similarities
between FSAE and industry is shown at questions Q8, Q14 and Q22, where both AMR values
are high, therefore aggregate answers hit very high qualities, plus, the two ARs point out
“Strong Similarity” on the three-point scale evaluation. The topmost similarity was recorded at
question Q14, at which a strong consensus evolved about the low power distance in the
corporate culture of both FSAE and industrial organizations. Considering the entire pattern 21
“Strong Similarities” and 6 “Acceptable Similarities”, but zero “Contradictory” answers were
encountered. Finally, aggregated relevance for each “S aspect” (i.e. Strategy, Structure,
Systems, etc. in the table) was evaluated to indicate the volume of similarities between FSAE
and industry. For this, the same evaluation code was used as in Table 1, i.e. 1 for “S”, 0,5 for
“A” and 0 for “C”. Then, the average, or “aggregated relevance” was calculated based on this
for each “S group”.
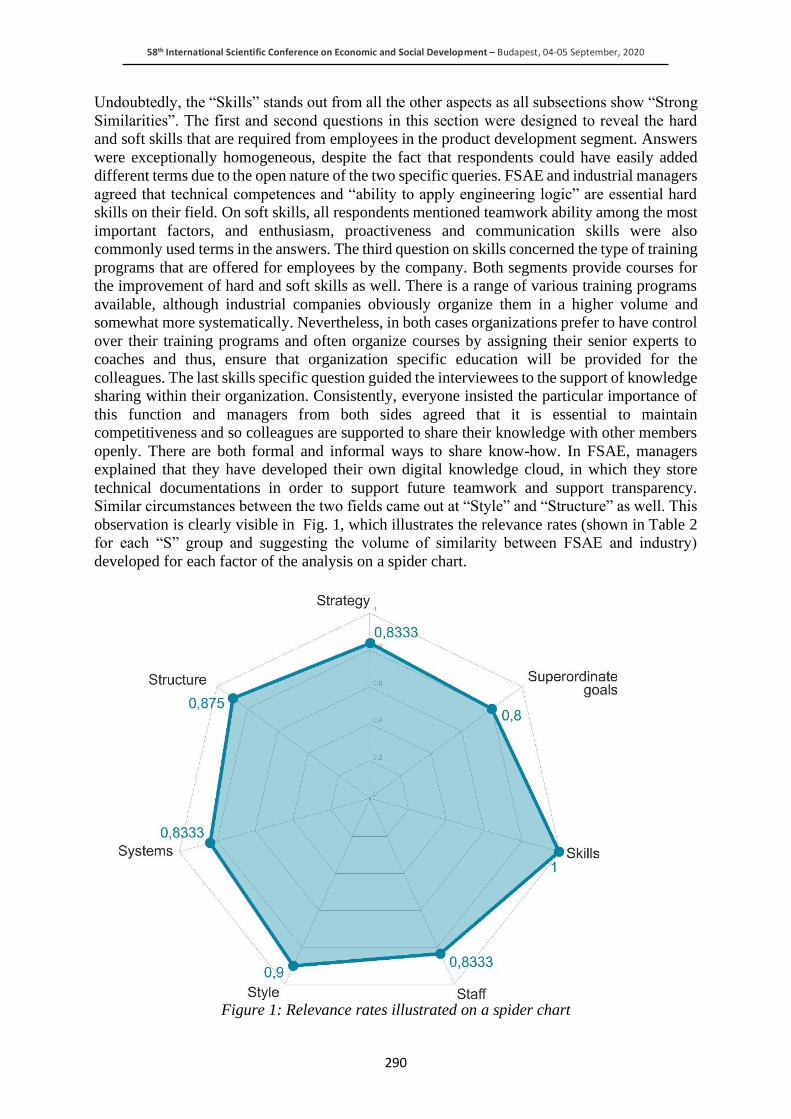
58th International Scientific Conference on Economic and Social Development – Budapest, 04-05 September, 2020
290
Undoubtedly, the “Skills” stands out from all the other aspects as all subsections show “Strong
Similarities”. The first and second questions in this section were designed to reveal the hard
and soft skills that are required from employees in the product development segment. Answers
were exceptionally homogeneous, despite the fact that respondents could have easily added
different terms due to the open nature of the two specific queries. FSAE and industrial managers
agreed that technical competences and “ability to apply engineering logic” are essential hard
skills on their field. On soft skills, all respondents mentioned teamwork ability among the most
important factors, and enthusiasm, proactiveness and communication skills were also
commonly used terms in the answers. The third question on skills concerned the type of training
programs that are offered for employees by the company. Both segments provide courses for
the improvement of hard and soft skills as well. There is a range of various training programs
available, although industrial companies obviously organize them in a higher volume and
somewhat more systematically. Nevertheless, in both cases organizations prefer to have control
over their training programs and often organize courses by assigning their senior experts to
coaches and thus, ensure that organization specific education will be provided for the
colleagues. The last skills specific question guided the interviewees to the support of knowledge
sharing within their organization. Consistently, everyone insisted the particular importance of
this function and managers from both sides agreed that it is essential to maintain
competitiveness and so colleagues are supported to share their knowledge with other members
openly. There are both formal and informal ways to share know-how. In FSAE, managers
explained that they have developed their own digital knowledge cloud, in which they store
technical documentations in order to support future teamwork and support transparency.
Similar circumstances between the two fields came out at “Style” and “Structure” as well. This
observation is clearly visible in Fig. 1, which illustrates the relevance rates (shown in Table 2
for each “S” group and suggesting the volume of similarity between FSAE and industry)
developed for each factor of the analysis on a spider chart.
Figure 1: Relevance rates illustrated on a spider chart
58th International Scientific Conference on Economic and Social Development – Budapest, 04-05 September, 2020
291
In “Style”, we observe equivalently high significance of mutual trust in the workplace
atmospheres, where managers can be contacted directly. Normally, board members are aware
of any sensitive issues that might occur within the organization and employees are supported
to discuss such issues in person with their superiors. In terms of “Structure”, organizations are
seeking the way to develop and reorganize their old shaped, silo-structures to a matrix format.
Both FSAE and industrial respondents explained that currently their structure is mostly
functional, however, they apply not only disciplinary but project leadership as well. This is a
cross function that is realized temporarily, for example in the manufacturing phase of FSAE
project, there is an assigned workshop leader who can coordinate members of any other
disciplinary department as well. Moreover, despite the functional structure, roles are organized
in a flat layout and processes are low on administration, plus brainstorming is highly supported.
Even though industrial structures are obviously more extensive vertically, these few features
might add an additional advantage to FSAE in terms of SE reorganization experiments.
5. CONCLUSION
Overall, the comparative analysis concerning organizational properties of the FSAE and the
industrial sector of automotive product development show well-balanced similarities based on
the elements of the McKinsey 7S model. Neither of the “Strategy, Structure, Systems, Style,
Staff, Skills, Superordinate goals” aspects show outlying values in terms of the rate of similarity
between the two automotive segments that are analyzed in our study. In other words, there is
no factor, in which the positive relationship of the two fields is not clearly observable.
Therefore, we can conclude that the Formula SAE field is indeed a valid scaled model
environment for automotive industrial product development segment. Thus, FSAE provides a
solid basis for our future research by enabling us to use it as a model environment to implement
SE oriented organizational experiments. FSAE is a segment that enables us to develop valuable
findings about the results of the implementation of a comprehensive Systems Engineering based
model, by using a similar methodology to Hosseini and Welo (2016), but applying a total view
approach (Loureiro et. al, 2004). Moreover, these findings underlie our previous assumption
that future research outcomes developed from FSAE will be relevant and might be implemented
in industrial circumstances as well. Outcomes of this study could provide R&D and innovation
managers as well as researchers in the field important insights about approaching a complex
development process via implementation tests of SE in a scaled model environment.
Additionally, it highlights the relevance of FSAE as a special branch of the automotive sector,
which could provide an appropriate environment to test innovative ideas and to serve as an
innovation incubator. Also, in a later stage of our research stream, we expect to introduce a
roadmap for industrial actors that includes best practices for managing innovation in an
automotive development ecosystem effectively, in a way that it facilitates strategic adaptation
to changing stakeholder requirements.
6. LIMITATIONS
In the end, we reveal two apparent limitations of our study.
First, despite the fact that answers developed homogenous patterns, interviewing more
industrial managers and FSAE leaders could further improve the statistical trustworthiness of
our results. Second, the McKinsey 7S based question guide concealed diverse key factors of an
organization, therefore it enabled us to analyze characteristics in their complexity. However,
developing an even more specified guideline for interviews might facilitate gaining more
sophisticated results and therefore, provide a basis to conduct a more precise comparison on the
two fields.
58th International Scientific Conference on Economic and Social Development – Budapest, 04-05 September, 2020
292
LITERATURE:
1. Agren, S. M., Knauss, E., Heldal, R., Pelliccione, P., Malmqvist, G., Boden, J. (2019). The
impact of requirements on systems development speed: a multiple-case study in automotive.
Requirements Eng 24, pp. 315–340.
2. Donada, C. and Attias, D. (2015). Food for thought: which organisation and ecosystem
governance to boost radical innovation in the electromobility 2.0 industry? Int. J.
Automotive Technology and Management, Vol. 15, No. 2
3. Dumitrescu, C., Mazo, R., Salinesi, C., Dauron, A. (2013). Bridging the gap between
product lines and systems engineering. An experience in variability management for
automotive model-based systems engineering, SPLC '13: Proceedings of the 17th
International Software Product Line Conference, pp. 254-263.
4. Elm, J. (2008). A Study of Systems Engineering Effectiveness – Initial Results, SysCon
2008 - IEEE International Systems Conference, Montreal, Canada, April 7-10
5. Falk, K. and Muller, G. (2019). Embedded Master’s Students Conduct Highly Relevant
Research Using Industry as Their Laboratory, Technology Innovation Management
Review, Vol. 9, No. 5, pp. 54-73.
6. Ferràs-Hernández, X., Tarrats-Pons, E., Arimany-Serrat, N. (2017). Disruption in the
automotive industry: A Cambrian moment, Business Horizons, 60, pp. 855-863.
7. Hosseini, H. N. and Welo, T. (2016). A framework for integrating reliability and systems
engineering: proof-of-concept experiences, 26th Annual INCOSE International
Symposium.
8. Kallio, H., Pietilä, A. M., Johnson M., and Kangasniemi M. (2016). Systematic
methodological review: developing a methodological framework for a qualitative semi-
structured interview guide, Journal of Advanced Nursing, Vol. 72, No. 12, pp. 2954-2965.
9. Klebaner, S. (2018). Isolated car manufacturers? The political positions of the automotive
industry on the real driving emissions regulation, Int. J. Automotive Technology and
Management, Vol. 18, No. 2, pp.119–141.
10. Lasmar Jr., E.L., Gandia, R.M., Sugano, J.Y., de Souza, T.A. and Rodriguez, D.Z. (2019).
New business models and the sharing economy: impacts and challenges for the traditional
automotive industry, Int. J. Automotive Technology and Management, Vol. 19, No. 3/4,
pp.301–320.
11. Loureiro, G., Leaney, P. G., Hodgson, M. (2004). A Systems Engineering Framework for
Integrated Automotive Development, Systems Engineering, Vol. 7, No. 2, pp. 153-166.
12. Morris, D, Madzudzo, G & Garcia-Perez, A (2018). Cybersecurity and the auto industry:
The growing challenges presented by connected cars, International Journal of Automotive
Technology and Management, Vol. 18, No. 2, pp. 105-118.
13. Nischak, F. and Hanelt, A. (2019). Ecosystem Change in the Era of Digital Innovation – A
Longitudinal Analysis and Visualization of the Automotive Ecosystem, Fortieth
International Conference on Information Systems, Munich, Germany
14. Ravanfar, M. M. (2015). Analyzing Organizational Structure Based on 7s Model of
McKinsey, Global Journal of Management and Business Research (A), Vol. 15, No. 10.
15. Sardos, P. (2017). Why McKinsey 7s model needs a new look. Retrieved: 08.07.2020 from
https://www.linkedin.com/pulse/why-mckinsey-7s-model-needs-new-look-panikos-
sardos/
16. Stolfa J, Stolfa S, Baio C, et al. (2019). DRIVES—EU blueprint project for the automotive
sector—A literature review of drivers of change in automotive industry, J. Softw. Evol.
Proc., Vol. 32, No. 3, e2222
17. Townsend, J.D., Balestra, S. and Schulze, A. (2017). Characteristics of project-based
alliances: evidence from the automotive industry, Int. J. Automotive Technology and
Management, Vol. 17, No. 1, pp.8–25.

58th International Scientific Conference on Economic and Social Development – Budapest, 04-05 September, 2020
293
18. Vanek, F., Jackson, P., Grzybowski, R., Whiting, M. (2017). Effectiveness of Systems
Engineering Techniques on New Product Development: Results from Interview Research
at Corning Incorporated, Modern Economy, 8, pp. 141-160.
58th International Scientific Conference on Economic and Social Development – Budapest, 04-05 September, 2020
294
THE IMPACT AND URGENCY OF TEACHING OPPORTUNITY -
RECOGNITION TO HIGH SCHOOLS STUDENTS
Kevin M. Jackson
Szechenyi Istvan University, Hungary
Marta Konczosne Szombathelyi
Szechenyi Istvan University, Hungary
ABSTRACT
The coronavirus COVID-19 pandemic is a global health crisis and the greatest challenge the
world has faced since World War II. This pandemic, however, represents far more than a health
crisis, but also has the potential to inflict crippling social, economic, and political effects that
will be felt for decades to come. All nations must now fully realize that the policies of the past
will not produce economies benefits in the future. A system for the creation of high growth
entreprises (HGEs) is essential, therefore, to drive economic growth and promote job creation.
Education must play a key role in this process as entrepreneurs are the key drivers behind the
evolution of HGEs. This means entrepreneurship must be taught in all high schools and
embraced as a core discpline that will develop an entrepreneurial mindset in younger
generations. While it is certain that only a small fraction of the population will become
entrepreneurs, there must be the necessary “social electricity” from all parts of the economy
to full embrace and promote entrepreneurship. Education must lead the way to creating a new
class of entrepreneurs who will create tomorrow’s HGEs.
Keywords: entrepreneurship, uncertainty, entrepreneur training, opportunity recognition,
opportunity creation
1. INTRODUCTION
Joseph Schumpeter in his 1942 work, Capitalism, Socialism, and Democracy (CSD), describes
Creative Destruction as a "process of industrial mutation that incessantly revolutionizes the
economic structure from within, incessantly destroying the old one, incessantly creating a new
one" (Schumpeter, 1942). Schumpeter argued that Creative Destruction drives a continuous
flow of technical opportunities that is fueled by constant disruptions in markets, industries,
national economies, and the world economy. At the heart of Schumpeterian Theory is his firm
belief that the entrepreneur is the key driver of innovation, the realizer of profitable
opportunities, the discoverer of better business combinations, the implementor of more efficient
production processes, and the launcher of effective marketing strategies. According to
Schumpeter, the competitiveness of a nation relies on the competitiveness of its firms, which
depends on the competitiveness of its entrepreneurs. Governments in developed nations
predominately agree with Schumpeter and devote significant resources to promoting
entrepreneurship (Shane, 2009; Acs, 2016). The European Union itself has devoted significant
resources to entrepreneurship by creating the Entrepreneurship Competence Framework or
“EntreComp” that is designed to boost the entrepreneurial mindset and activity of European
citizens. There is a global public policy debate, however, that questions whether or not
government supported entrepreneurship programs actually spawn the kind of startup companies
that fuel innovation and create high paying jobs. Those on the other side of the Schumpeterian
coin remain skeptical of a strong correlation between absolute entrepreneurship and economic
growth and argue that “Encouraging more and more people to start businesses won’t enhance
economic growth or create a lot of jobs because startup, in general aren’t the source of our
58th International Scientific Conference on Economic and Social Development – Budapest, 04-05 September, 2020
295
economic vitality or job creation” (Shane, 2009). One of the principle reasons for this failure
stems from the fact that “when governments intervene to encourage the creation of new
businesses, they stimulate more people to to start new companies disproportionately in
competitive industries with lower barriers to entry and high rates of failure” (Shane, 2009).
While research clearly supports that entrepreneurship drives economic growth, this is only true
if the entrepreneurs themselves are able to avoid early exits (Santarelli, 2007). Entrepreneurs
commonly make the mistake of choosing industries and markets that offer the easiest entry, yet
do not represent the best startup opportunities (Johnson, 2005). The result for most nations is a
situation where most of the benefits realized from entrepreneurship programs are derived from
a small number of High Growth Enterprises (HGEs), whereas the vast majority of enterprises
struggle to survive (Block, 2017). The European Union (EU) fully recognizes the importance
of HGEs and “their impact on job creation, industrial renewal and the leverage effect they can
have on sectoral productivity or regional competitiveness” (JRC, 2020). According to the 2020
JRC Technical Report on HGEs, they make up 10.7% of the total number of EU enterprises
across all sectors. While there is a consensus on the importance of HGEs, its definitions vary
according to choices of growth indicators, growth measurements, time dimensions, and the
processes through which firms grow (JRC, 2020). The OECD defines HGEs as “enterprises
with average annualised growth in the number employees greater than 20% per year, over a
three-year period, and with ten or more employees at the beginning of the observation period,”
(JRC, 2020) while the Eurostat definition specifies that "HGEs are enterprises with at least 10
employees in the beginning of their growth and having average annualised growth in number
of employees greater than 10% per annum, over a three year period. (Eurostat, 2016)." As one
can see, both definitions define success in terms of the abilities of HGEs to significantly boost
employment. It is also notable that HGEs across all EU nations are predominantly younger than
average enterprises, proven innovators, and more present in knowledge intensive services than
in manufacturing (JRC, 2020). This is consistent with the makeup of HGEs in other developed
nations. Based on these statistics, Schumpeter would likely recognize that entrepreneurs in the
EU are creating HGEs that are innovating, driving economic growth, and boosting employment.
Scott Shane would point out, however, that the HGEs in the EU on average only account for
10.7% of the total number of enterprises and that economic growth and jobs creation is a
function of “encouraging high quality, high growth companies to be founded (Shane, 2009).”
Overall, both Schumpeter and Shane would both agree that policy makers need to create a
pipeline that steadily generates more HGEs year over year as their impact of economic growth
and job creation is indisputable. The EU’s 2020 Entrepreneurship Action Plan indicates a
troubling, long-standing downtrend in entrepreneurial activity where:
“since 2004, the share of people preferring self-employment to being an employee has dropped
in 23 out of the 27 EU Member States. While three years ago for 45% of Europeans self-
employment was their first choice, now this percentage is down to 37%. By contrast in the USA
and China this proportion is much higher: 51% and 56% respectively. Moreover, when new
enterprises are founded, they grow more slowly in the EU than in the USA or emerging
countries, and fewer of them join the ranks of the world's largest firms” (EU Entrepreneurship
Action Plan, 2020).
It clear that the EU and member state policy makers must find ways to boost economic
growth and job creation. It is also clear that HGEs are key economic drivers, but they are
not created without the support of a dynamic ecosystem. An HGE pipeline, therefore,
must be one that extends the right support, education, motivation, and opportunities to
those most capable of maximizing its benefits.
58th International Scientific Conference on Economic and Social Development – Budapest, 04-05 September, 2020
296
2. THE HGE PIPELINE
The flow through an HGE pipeline comes from a diverse set of individuals who identify
with one or more of the following groups before becoming entrepreneurs.
2.1. The unemployed
For policy makers, the prospect of turning unemployed individuals into successful
entrepreneurs is very attractive. Not only do they become employed, but they create enterprises
that employ others. The problem with this reasoning is that unemployed people often suffer
from a lower opportunity cost of their time (Shane, 2009). “Desperate entrepreneurship,” often
involves a situation where an unemployed individual starts a business due to a lack of
opportunities in the labor market” (Mühlbock, 2018). Perhaps starting a business is a better
option than sitting at home and playing games. This is not an effective way to build a powerful
HGE pipeline, yet it is commonly supported by many nations for reasons often more political
than economic. The research paper “Does self employment reduce unemployment?” analyzed
data from 23 OECD countries and concluded that “the results of this paper unequivocally
suggest that public policy to generate jobs and reduce unemployment would be best served by
focusing more on innovative and high-growth entrepreneurship than on inducing the
unemployed into entering into self-employment” (Audretsch, 2001). As this data shows,
incentivizing the unemployed to become self-employed may drive up the number of startups,
but ones that significantly contribute to robust economic growth and job creation with be the
exceptions rather than norm. As of June 2020, the unemployment rate in the Euro area was
7.8%, up from 7.7% in May (Eurostat, 2020). Policy makers now face the enormous challenge
of addressing rising unemployment during a global pandemic that has inflicted serious
economic damage. It will be tempting to hope that a portion of the unemployed can quickly be
converted successful entrepreneurs. Unfortunately, the data proves otherwise, and nations will
need to utilize other sources for their HGE pipelines.
2.2. Leap of faith vs. Hybrid entrepreneurship
Many entrepreneurs develop great ideas, quit their jobs, and start a business. While we hear a
lot about the success stories, the reality is that there is a high frequency of new business failure
(Shane, 2003). A way to reduce the risk of failure is to keep your day job while developing a
business. A broad range of entrepreneurs, including Apple co-founder Steve Wozniak, worked
for other firms while building their own (Raffiee, 2014). The significant takeawy for policy
makers is the importance of directing support to those who have the best chance to succeed.
Shoveling funds indiscriminately to those who want to be entrepreneurs is most likely to result
in wasted funds and higher unemployment. In a COVID 19 world, great care needs to be made
to ensure that scarce funds are reaching the most capable hands.
2.3. Young People (Under 25 years old, Non-Students)
In June of 2020, there were 2.962 million unemployed people under the age of twenty-five in
the EU, of whom 2.360 million were in the euro area (Eurostat, 2020). The youth
unemployment rate was 16.8 % in the EU and 17.0 % in the euro area in June, up from 16.2 %
and 16.5 % respectively in the previous month. COVID-19 (Eurostat, 2020). A recent research
paper forecasts that “The youth unemployment rate will increase to 26%, and the number of
young people not in education, employment and training (NEET) will increase from 4.7 to 6.7
million” (Tamasberger, 2020). The EU faces the enormous challenge of addressing rising youth
unemployment. Like with older, unemployed individuals, it is not reasonable to think that
polices will be able to seamlessly transform the unemployed youth into vibrant entrepreneurs
on their way to creating the next HGEs. This is not to say that those under twenty-five years
old cannot create HGEs, but rather that the process that requires education and training.
58th International Scientific Conference on Economic and Social Development – Budapest, 04-05 September, 2020
297
As it was mentioned before, the transition from being unemployed to becoming an entrepreneur
is a bumpy road with a low speed limit and requires the right support, mindset, and dedication.
2.4. Active Students (15-25 years of age)
Entrepreneurship education frequently stimulates lively debates as it involves a “rich and
diverse pool of collaborative educators—academics, entrepreneurs, consultants, investors, full-
time, part- time, academically qualified, and professionally qualified—with a common
understanding that entrepreneurship education is important” (Neck, 2011). Despite the fact that
entrepreneurship education is widely recognized as being important, in the EU “education does
not offer the right foundation for an entrepreneurial career, difficult access to credits and
markets, difficulty in transferring businesses, the fear of punitive sanctions in case of failure,
and burdensome administrative procedures” (EU Entrepreneurship Action Plan, 2020). The
2020 EU Entrepreneurship Action Plan further explains that “there is a widespread culture that
does not recognise or reward entrepreneurial endeavours enough” and that “To make
entrepreneurship the growth engine of our economy Europe needs a thorough, far-reaching
cultural change (EU Entrepreneurship Action Plan, 2020).” This negative sentiment is in spite
of positive data indicating that “Investing in entrepreneurship education is one of the highest
return investments Europe can make. Surveys suggest that between 15% and 20% of students
who participate in a mini-company programme in secondary school will later start their own
company, a figure that is about three to five times that for the general population” (Jenner,
2012). The harsh reality is that far too few high schools and universities in the EU are making
investments in entrepreneurship education and this negatively impacts HGE pipelines.
3. THE ICELANDIC SPORT PIPELINE
Iceland, a nation of only 364,000 people, shocked the world when it qualified for the 2018
World Cup Finals. They were the smallest nation to qualify in the 88-year history of the
tournament and this left many larger nations, with much deeper pockets, scratching their heads
and wondering how Iceland was able to achieve such a remarkable feat. The reason for this
achievement is that Iceland has built a sustainable pipeline for success. Like entrepreneurship,
merely participating in a sport does guarantee an elite status. It can be said, however, that
Iceland’s incredibly high sports participation rate, where 80% of sixth graders play in organized
leagues, has taken on a “pedagogical role for children and adolescents as a gateway into society”
(Þórlindsson, 1994). Icelandic football creates “social electricity” that galvanizes entire
communities and creates collective energy (Durkheim, 1965). Despite its tiny population,
Iceland harnesses this communal energy to motivate people at all stages of their sport pipeline.
This creates a sense of identity and an atmosphere that “transports enthusiasm, increases
individual well-being, unites citizens and enhances their level of communication and collective
sentiments – as is common in religion” (Birrell, 1981; Durkheim, 1965). This sense of identity
runs seamlessly through their pipeline, from young kids playing for the first time, to the parents,
to the high schools, to the universities, to the elite few that were able to represent Iceland in the
World Cup in 2018 cheered by fans doing the famous “thunder clap.” The Icelandic Sport
Pipeline is the opposite of what we see in EU entrepreneurship. Despite the existence of
comprehensive frameworks and action plans, member states herd entrepreneurs into
disproportionately in competitive industries with lower barriers to entry and high rates of
failure” (Shane, 2009). As we have discussed, the addition of more entrepreneurs can actually
make an economy worse, not better. Please recall that the 2020 EU Entrepreneurship Action
Plan specifically stated that “To make entrepreneurship the growth engine of our economy
Europe needs a thorough, far-reaching cultural change.” This cultural change, however,
requires “social electricity,” which means that the perception of entrepreneurship must change
from one of ambivalence to one of inclusion (Figure 1).
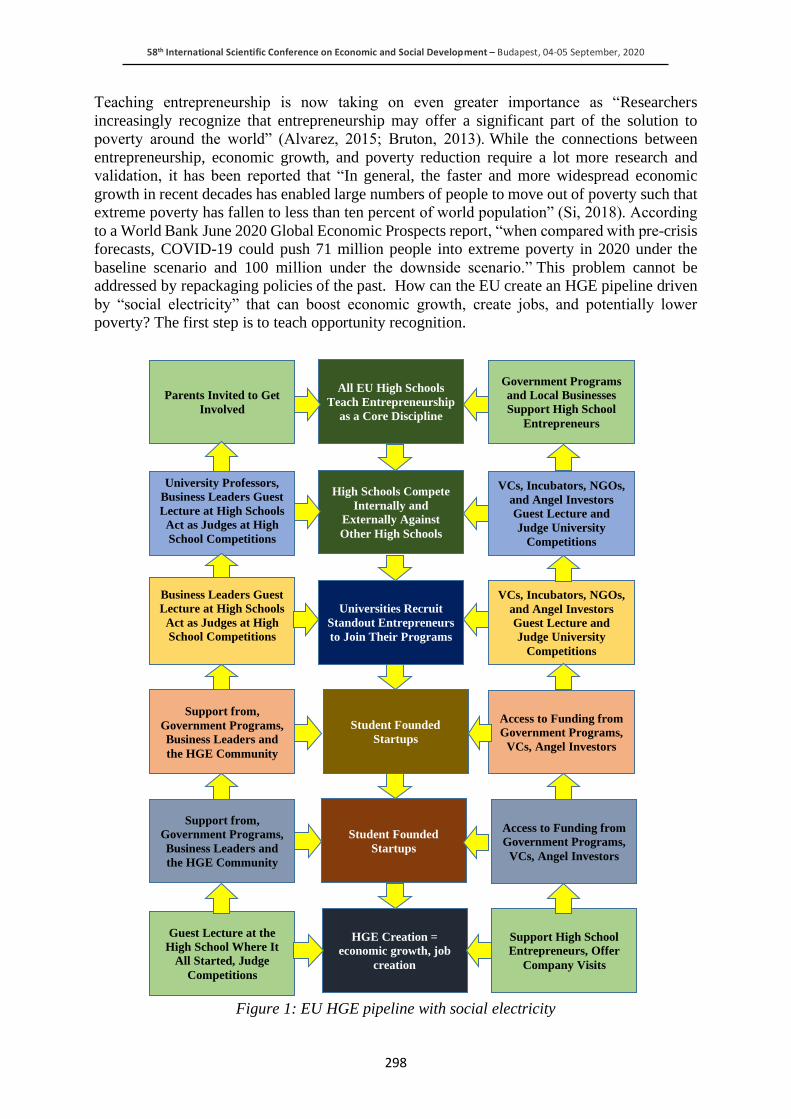
58th International Scientific Conference on Economic and Social Development – Budapest, 04-05 September, 2020
298
Teaching entrepreneurship is now taking on even greater importance as “Researchers
increasingly recognize that entrepreneurship may offer a significant part of the solution to
poverty around the world” (Alvarez, 2015; Bruton, 2013). While the connections between
entrepreneurship, economic growth, and poverty reduction require a lot more research and
validation, it has been reported that “In general, the faster and more widespread economic
growth in recent decades has enabled large numbers of people to move out of poverty such that
extreme poverty has fallen to less than ten percent of world population” (Si, 2018). According
to a World Bank June 2020 Global Economic Prospects report, “when compared with pre-crisis
forecasts, COVID-19 could push 71 million people into extreme poverty in 2020 under the
baseline scenario and 100 million under the downside scenario.” This problem cannot be
addressed by repackaging policies of the past. How can the EU create an HGE pipeline driven
by “social electricity” that can boost economic growth, create jobs, and potentially lower
poverty? The first step is to teach opportunity recognition.
Figure 1: EU HGE pipeline with social electricity
All EU High Schools
Teach Entrepreneurship
as a Core Discipline
High Schools Compete
Internally and
Externally Against
Other High Schools
Government Programs
and Local Businesses
Support High School
Entrepreneurs
Parents Invited to Get
Involved
Universities Recruit
Standout Entrepreneurs
to Join Their Programs
University Professors,
Business Leaders Guest
Lecture at High Schools
Act as Judges at High
School Competitions
VCs, Incubators, NGOs,
and Angel Investors
Guest Lecture and
Judge University
Competitions
Business Leaders Guest
Lecture at High Schools
Act as Judges at High
School Competitions
VCs, Incubators, NGOs,
and Angel Investors
Guest Lecture and
Judge University
Competitions
Student Founded
Startups
Support from,
Government Programs,
Business Leaders and
the HGE Community
Access to Funding from
Government Programs,
VCs, Angel Investors
Student Founded
Startups
Support from,
Government Programs,
Business Leaders and
the HGE Community
Access to Funding from
Government Programs,
VCs, Angel Investors
HGE Creation =
economic growth, job
creation
Guest Lecture at the
High School Where It
All Started, Judge
Competitions
Support High School
Entrepreneurs, Offer
Company Visits
58th International Scientific Conference on Economic and Social Development – Budapest, 04-05 September, 2020
299
4. THE JOURNEY BEGINS WITH OPPORTUNITY RECOGNITION
Entrepreneurship can be defined the study of opportunities (Shane, 2000) and entrepreneurial
opportunities can be defined as “situations in which new goods, services, raw materials, markets
and organizing methods can be introduced through the formation of new means, ends, or means-
ends relationships (Casson, 1982; Shane, 2000). Over the past two decades, there has also been
a debate regarding how opportunities are created. The Discovery Theory argues that the
existence of market imperfections, such as technological changes, political and regulatory
changes, social and demographical changes, and global pandemics that disrupt the competitive
equilibrium (Shane, 2003). These disruptions, therefore, create opportunities to launch new
products and services. This theory, however, relies on the fact that opportunities to produce new
goods and services emanate from industries and markets that already exist (Kirzner, 1973). It
furthers states that entrepreneurs take on a more passive role and only become activated when
there is an opportunity to be exploited (Shane, 2003). As the name suggests, the Discovery
Theory means that entrepreneurs are endlessly scanning the environment and searching for
opportunities as if they are panning for gold. The famous economist, Israel Kirzner, reasoned
that the key distinction between entrepreneurs and non-entrepreneurs is “entrepreneurial
alertness” (Kirzner, 1973). It is this alertness that enables certain individuals to dissect causal
relationships, to harness the power of Big Data, to comprehend economic and social processes,
to challenge the status quo, and to think counterintuitively (Gaglio, 2001; Shane, 2003). The
Creation Theory, therefore, requires an active entrepreneur since opportunities are not created
from pre-existing industries or markets. In other words, “entrepreneurship is not about
“climbing mountains”, but rather, about “building mountains of opportunities that are
recognized, only after they have been exploited” (Alvarez, 2006). While search for
opportunities plays a leading role in the Discovery Theory, the role of search does not hold a
significant place in Creation Theory. The logic here is that entrepreneurs act when they see an
opportunity, but have little ability to anticipate whether or not one is about to be created. Given
the level of uncertainty in our current world, this is more true than ever before. The distinction
between Discovery Theory and Creation Theory is very consequential for entrepreneurship
education. While opportunities arise from information asymmetry, not everyone in society can
see recognize these opportunities. It is a select few that is able to recognize particular
opportunity at a particular time (Kirzner, 1973). While Entrepreneurship education will not
transform every student into the next Jeff Bezos or Elon Musk, it will help all students to not
only better recognize opportunities, but to also develop the problem solving and critical thinking
skills that are useful in nearly every occupation. After teaching entrepreneurship to both high
school and university for many years, I have realized that I overestimated their ability to
recognize opportunities. This is not a poor reflection on these students, but rather the
understanding that opportunity recognition, like playing a sport or the piano, takes repetition
and practice. This is why we devoted an entire high school semester to opportunity recognition.
By doing this, we wanted to answer the key question “Can opportunity recognition be taught?”
If yes, then “How can we measure its effect on high school and does it justify having
entrepreneurship as a core high school discipline?” These questions are of critical importance
given the pressing need of EU nations to create High Growth Enterprises.
5. THE LEAN LEARN CHALLENGE
5.1. Lean learn challenge (February 2020)
As a part of the Lean Learn Academy, began teaching the Lean Learn Program (LLP) at the
Bornemisza Péter High School (BPG) in September of 2019. Classes were conducted in English
and were held every Wednesday from 15:00 –17:00 in the school gymnasium. The focus of the
Fall 2019 semester was on opportunity recognition, which was mainly facilitated by group
work.
58th International Scientific Conference on Economic and Social Development – Budapest, 04-05 September, 2020
300
Guest speakers were frequently brought in to not only speak, but to run activities based on their
own business challenges. The program was run inspired by the Creation Theory rather than the
Discovery Theory. In February of 2020, we convinced some of the entrepreneurship class to
take the LLP Challenge in order to individually assess their progress. One week before the LLP
Challenge, each student was given the opportunity to ask their family, friends, neighbors, and
all other interested parties about what business opportunities they were observing and what they
thought were the most promising. In teaching opportunity recognition, it is critical that students
learn how to recognize and utilize the resources available to them. The LLP Challenge was
given in the high school computer lab where each student had a maximum of two hours to
complete the challenge. Use of the Internet was allowed, but not the use of live messaging or
email.
The LLP Challenge:
1) Describe your brainstorming and ideation process during the past week. While there are lots
of problems that needs to be solved, how did you choose the one that offers the best
opportunity?
2) Lay out your vision for a Minimum Viable Product (MVP) as the solution to this problem
and discuss what features you chose to include and not include. Be as visual as possible.
3) How will you create your MVP at a minimal cost?
4) How will you test the MVP?
5) Validated learning involves the constant testing of an MVP using the “Build, Measure,
Learn” process. What is your plan to maximize the amount of interactions between your
MVP and potential customers?
6) How will you define success and what are your milestones?
7) Why is NOW a great time to start this business?
5.2. The adult LLP test
In order to understand the level of opportunity recognition of the BPG students, we wanted to
see how adults of various ages and backgrounds would perform on the same test under similar
conditions. The first attempt to administer Adult LLP Challenges in early March was
unsuccessful. The failure was a function of the global pandemic and also a poor test format.
Starting in June of 2020, we created a Five Day Sprint that allowed each registered adult to take
an opportunity recognition and minimum viable product (MVP) crash course in order to clarify,
inspire, and motive them to take the same LLP Challenge the BPG students took in February.
This format has proven to be far more successful and better received than just an email with the
chalneg questions. We have run eight sprints this summer and have been slowly collecting tests
from a wide variety of individuals with diverse backgrounds (Table 1). More tests are coming
constantly coming in and will continuously be added to our research.
Table following on the next page
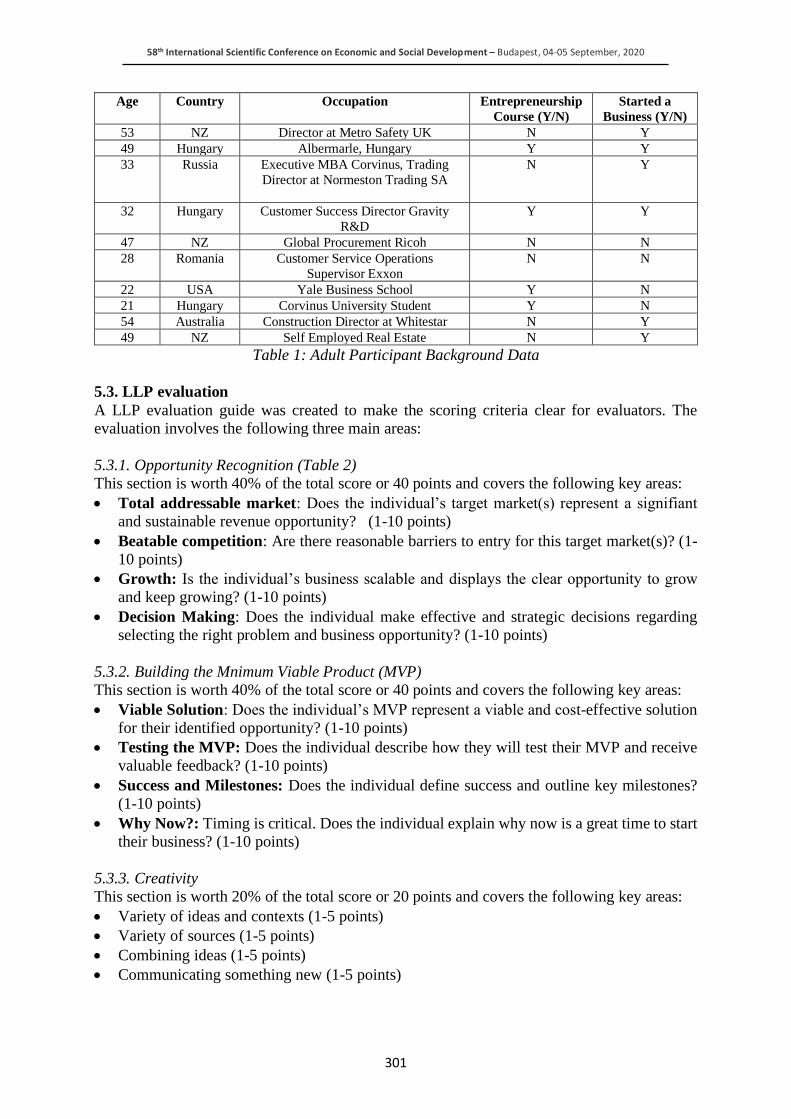
58th International Scientific Conference on Economic and Social Development – Budapest, 04-05 September, 2020
301
Age Country Occupation Entrepreneurship
Course (Y/N)
Started a
Business (Y/N)
53 NZ Director at Metro Safety UK N Y
49 Hungary Albermarle, Hungary Y Y
33 Russia Executive MBA Corvinus, Trading
Director at Normeston Trading SA
N Y
32 Hungary Customer Success Director Gravity
R&D
Y Y
47 NZ Global Procurement Ricoh N N
28 Romania Customer Service Operations
Supervisor Exxon
N N
22 USA Yale Business School Y N
21 Hungary Corvinus University Student Y N
54 Australia Construction Director at Whitestar N Y
49 NZ Self Employed Real Estate N Y
Table 1: Adult Participant Background Data
5.3. LLP evaluation
A LLP evaluation guide was created to make the scoring criteria clear for evaluators. The
evaluation involves the following three main areas:
5.3.1. Opportunity Recognition (Table 2)
This section is worth 40% of the total score or 40 points and covers the following key areas:
• Total addressable market: Does the individual’s target market(s) represent a signifiant
and sustainable revenue opportunity? (1-10 points)
• Beatable competition: Are there reasonable barriers to entry for this target market(s)? (1-
10 points)
• Growth: Is the individual’s business scalable and displays the clear opportunity to grow
and keep growing? (1-10 points)
• Decision Making: Does the individual make effective and strategic decisions regarding
selecting the right problem and business opportunity? (1-10 points)
5.3.2. Building the Mnimum Viable Product (MVP)
This section is worth 40% of the total score or 40 points and covers the following key areas:
• Viable Solution: Does the individual’s MVP represent a viable and cost-effective solution
for their identified opportunity? (1-10 points)
• Testing the MVP: Does the individual describe how they will test their MVP and receive
valuable feedback? (1-10 points)
• Success and Milestones: Does the individual define success and outline key milestones?
(1-10 points)
• Why Now?: Timing is critical. Does the individual explain why now is a great time to start
their business? (1-10 points)
5.3.3. Creativity
This section is worth 20% of the total score or 20 points and covers the following key areas:
• Variety of ideas and contexts (1-5 points)
• Variety of sources (1-5 points)
• Combining ideas (1-5 points)
• Communicating something new (1-5 points)
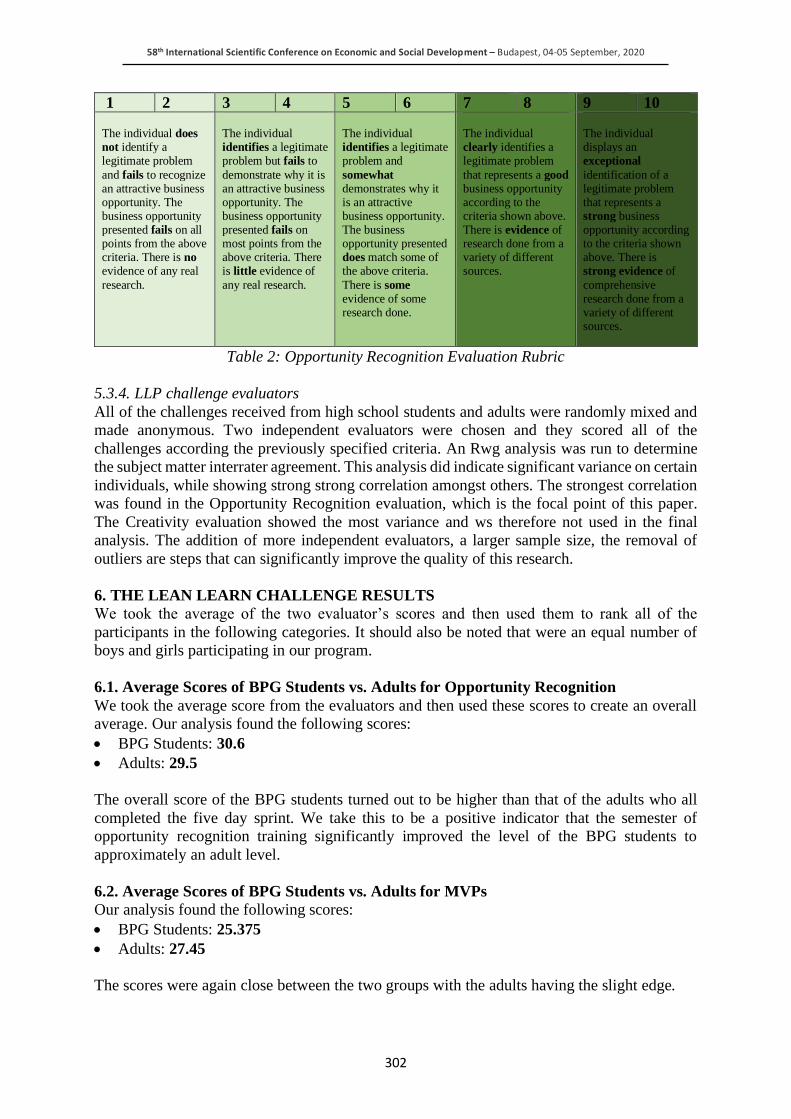
58th International Scientific Conference on Economic and Social Development – Budapest, 04-05 September, 2020
302
1 2 3 4 5 6 7 8 9 10 The individual does
not identify a legitimate problem
and fails to recognize an attractive business opportunity. The business opportunity presented fails on all points from the above criteria. There is no evidence of any real
research.
The individual identifies a legitimate problem but fails to
demonstrate why it is an attractive business opportunity. The business opportunity presented fails on most points from the above criteria. There is little evidence of
any real research.
The individual identifies a legitimate problem and
somewhat demonstrates why it is an attractive business opportunity. The business opportunity presented does match some of the above criteria.
There is some evidence of some research done.
The individual clearly identifies a legitimate problem
that represents a good business opportunity according to the criteria shown above. There is evidence of research done from a variety of different sources.
The individual displays an exceptional
identification of a legitimate problem that represents a strong business opportunity according to the criteria shown above. There is strong evidence of
comprehensive research done from a variety of different sources.
Table 2: Opportunity Recognition Evaluation Rubric
5.3.4. LLP challenge evaluators
All of the challenges received from high school students and adults were randomly mixed and
made anonymous. Two independent evaluators were chosen and they scored all of the
challenges according the previously specified criteria. An Rwg analysis was run to determine
the subject matter interrater agreement. This analysis did indicate significant variance on certain
individuals, while showing strong strong correlation amongst others. The strongest correlation
was found in the Opportunity Recognition evaluation, which is the focal point of this paper.
The Creativity evaluation showed the most variance and ws therefore not used in the final
analysis. The addition of more independent evaluators, a larger sample size, the removal of
outliers are steps that can significantly improve the quality of this research.
6. THE LEAN LEARN CHALLENGE RESULTS
We took the average of the two evaluator’s scores and then used them to rank all of the
participants in the following categories. It should also be noted that were an equal number of
boys and girls participating in our program.
6.1. Average Scores of BPG Students vs. Adults for Opportunity Recognition
We took the average score from the evaluators and then used these scores to create an overall
average. Our analysis found the following scores:
• BPG Students: 30.6
• Adults: 29.5
The overall score of the BPG students turned out to be higher than that of the adults who all
completed the five day sprint. We take this to be a positive indicator that the semester of
opportunity recognition training significantly improved the level of the BPG students to
approximately an adult level.
6.2. Average Scores of BPG Students vs. Adults for MVPs
Our analysis found the following scores:
• BPG Students: 25.375
• Adults: 27.45
The scores were again close between the two groups with the adults having the slight edge.
58th International Scientific Conference on Economic and Social Development – Budapest, 04-05 September, 2020
303
6.3. Average Scores of BPG Students vs. Adults for Opportunity Recognition + MVPs
Our analysis found the following scores:
• BPG Students: 56.5
• Adults: 55
We were pleased to see the BPG students scored slightly better than the adults further indicating
that the impact of opportunity recognition training at the high school level can have a significant
impact on high school students.
6.4. Improving the research results
Further ways to improve the research will be to give the challenge to high school students who
have not taken the opportunity training course and to more high school students who have.
Adding more adults of various backgrounds will benefit the research, along with the tesing of
university students before and after opportunity recognition training.
7. CONCLUSION
In its July 25th, 2020 edition, The Economist wrote that “The pandemic has also exposed and
accentuated inequities in the economic system. Those in white-collar jobs can work from home,
but “essential” workers—the delivery drivers, the rubbish cleaners—must continue to work,
and are therefore at greater risk of contracting covid-19, all the while for poor pay. Those in
industries such as hospitality (disproportionately young, female and with black or brown skin)
have borne the brunt of job losses” (Economist, July 2020). This level of market disequilibrium
requires the help of entrepreneurs who are ready to build mountains rather than just climb them.
Nations are searching for answers regarding how to create HGE pipelines to drive the economic
growth and job creation that their people are demanding. The problem is that the policies of the
past are being applied to a world that has changed dramatically just this year. The greatest
wealth of any nation is its future generations. Entrepreneurship education does not seek to turn
every student into an entrepreneur, but rather to help younger generations to become better
prepared to live in a world that is more like to become more uncertain than certain. The results
of our research are a first step towards providing definite proof that entrepreneurship does have
an impact and should be taught in all high school out of necessity rather than as an
accommodation. Igniting the “social electricity” around entrepreneurship in Europe could do
wonders for its future. There is a very real urgency to do so.
ACKNOWLEDGEMENT: A special thanks to the students, teachers, and supports of the Péter
Bornemisza High School.
LITERATURE:
1. Acs, Astebro, Audretsch, Robinson, (2016). Public Policy to promote entrepreneurship: a
call to arms. Small Business Economics, 47:35–51 DOI 10.1007/s11187-016-9712-2
2. Alvarez, S. A., & Barney, J. B. (2005). How do entrepreneurs organize firms under
conditions of uncertainty? Journal of Management, 31(5), 776–793.
3. Alvarez, S. A., & Barney, J. B. (2007). Discovery and creation: Alternative theories of
entrepreneurial action. Strategic Entrepreneurship Journal, 1, 11-26.
4. Alvarez, S.A., & Barney, J.B. (2008). Opportunities, organizations, and entrepreneur-
ship: Theory and debate. Strategic Entrepreneurship Journal, 2(3), 171–173.
5. Alvarez, Barney, Newman, (2015). The poverty problem and the industrialization solution.
Asia Pacific Journal of Management, 2015, vol. 32, issue 1, 23-37
58th International Scientific Conference on Economic and Social Development – Budapest, 04-05 September, 2020
304
6. Audretsch, Thurik, (2001). Capitalism and democracy in the 21st Centry: from the managed
to the entrpreneurial economy. Journal of Evolutonary Economics,
10.1007/s001910050003
7. Baron, R. A., & Ensley, M. D. (2006). Opportunity recognition as the detection of
meaningful patterns: Evidence from comparisons of novice and experienced entrepreneurs.
Management Science, 52, 1331-1344.
8. Baron, R.A. (2008). The role of affect in the entrepreneurial process. Academy of
Management Review, 33(2), 328–340.
9. Birrell S (1981) Sport as ritual: Interpretations from Durkheim to Goffman. Social Forces
60(2): 354–376.
10. Block, Fisch, van Praag (2017) The Schumpeterian entrepreneur: a review of the empirical
evidence on the antecedents, behaviour and consequences of innovative entrepreneurship,
Industry and Innovation, 24:1, 61-95, DOI: 10.1080/13662716.2016.1216397
11. Bruton, Ketchen, Ireland, (2013). Entrepreneurship as a solution to poverty. Journal of
Business Venturing, 28(6):683–689
12. Busentiz (2007). Progress in Understanding Entrepreneurial Behavior. Strategic
Entrepreneurship Journal, 1: 183–185
13. Casson, M. 1982. The Entrepreneur. Barnes and Noble Books, Totowa, NJ.
14. C. Jenner, (2012), Business and Education: Powerful Social Innovation Partners, Stanford
Social Innovation Review.
15. Dew, N., Read, S., Sarasvathy, S.D., Wiltbank, R., (2009). Effectual versus predictive logics
in entrepreneurial decision-making: differences between experts and novices. J. Bus.
Venturing 24 (4), 287–309.
16. Drucker, P. F. (1985). Innovation and entrepreneurship. New York: Harper & Row.
17. Durkheim E (1965) The Elementary Forms of the Religious Life. New York: Free Press.
1915.
18. Eckhardt, Shane, (2003). Opportunties and Entrepreneurship. Journal of Management,
29(3) 333–349
19. European Commission in its Entrepreneurship Action Plan (2020)
20. Flachenecker, Gavigan, Beldarrain, Pasi, Preziosi, Stamenov, (2020). High Growth
Enterprises: demogprahics, finance & policy measures. JRC Technical Report, EUR 30077
EN
21. Gaglio, C.M., & Katz, J.A. (2001). The psychological basis of opportunity identification:
Entrepreneurial alertness. Small Business Economics, 16(2), 95–111.
22. Gre goire, Shepherd, Schurer Lambert (2010). Measuring Opportunity-Recognition Beliefs
– Illustrating and Validating an Experimental Approach. Organizational Reseach Methods,
Volume 13 Number 1
23. Halldorsson, (2020). National sport success and the emgent atmosphere: The case of
Iceland, International Review for the Sociology of Sport, DOI: 10.177/1012690220912415
24. Henry, Hill , Leitch, (2005). Entrepreneruship education and training: can
entrepreneurship be taught? Part I. Education + Training. Vol. 47 No. 2, 2005
25. Johnson, P.S. (2005), Targeting Firm Births and Economic Regeneration in a Lagging
Region, Small Business Economics, 24, 451-64.
26. Kirzner, I. (1973). Competition and entrepreneurship. Chicago: University of Chicago
Press.
27. Kirzner, I. M. (1985). Discovery and the capitalist process. Chicago: The University of
Chicago Press.
28. Kirzner, I. M. (1997). Entrepreneurial discovery and the competitive market process: An
Austrian approach. Journal of Economic Literature, 35, 60-85.
58th International Scientific Conference on Economic and Social Development – Budapest, 04-05 September, 2020
305
29. Maine, E., et al., (2015) The role of entrepreneurial decision-making in opportunity
creation and recognition. Technovation 39-40(May/June):53-72
30. McMullen, J. S., & Shepherd, D. A. (2006). Entrepreneurial action and the role of
uncertainty in the theory of the entrepreneur. Academy of Management Review, 31, 132-
152.
31. Mühlböck, Warmuth, Holienka, Kittel, (2018). Desperate entrepreneurs: no opportunities,
no skills, International Entrepreneurship and Management Journal, 14 (4), 975-997
32. Neck, Greene, (2019). Entrpreneurship Education: Known Worlds and New Frontiers.
Journal of Small Business Management, 49(1), pp. 55–70
33. Raffiee, Feng, (2014). Should I Quit My Day Job? A Hybrid Path to Entrpreneurship.
Academy of Management Journal, Vol. 57, No. 4, 936–963.
34. Santarelli, Vivarelli, (2007). Entrepreneurship and the Process of Firms Entry, Survival
and Growth. Industrial and Corporate Change, 16(3):455-488
35. Sarasvathy, S. D. (2001). Effectual reasoning in entrepreneurial decision making:
Existence and bounds. Academy of Management Conference Proceedings. ENT: D1-D6.
36. Sarasvathy, S.D. (2001). Causation and effectuation: Toward a theoretical shift from
economic inevitability to entrepreneurial contingency. Academy of Management Review,
26(2), 243–263.
37. Sarasvathy, Dew, (2005). New market creaton through transformation. Journal of
Evolutionary Economics. 15: 533–565
38. Si, Ahlstrom, Wei, Cullen. Business, Entrepreneurship and Innovation Toward
Poverty Reduction. Entrepreneurship and Regional Development,
10.1080/08985626.2019.1640485
39. Shane, S. A. (2000). Prior knowledge and the discovery of entrepreneurial opportunities.
Organization Science, 11, 448-469.
40. Shane, S. A., & Venkataraman, S. (2000). The promise of entrepreneurship as a field of
research. Academy of Management Review, 25, 217-226.
41. Shane, (2009). Why Encouraging More People to Become Entrepreneurs Is Bad Public
Policy. Small Business Economics, Vol. 33, No. 2 (Aug., 2009), pp. 141-149
42. Sharon A. Alvarez & Jay B. Barney (2010): Entrepreneurship and Epistemology: The
Philosophical Underpinnings of the Study of Entrepreneurial Opportunities. The Academy
of Management Annals, 4:1, 557-583
43. Shepherd, D. A., & DeTienne, D. R. (2005). Prior knowledge, potential financial reward,
and opportunity identification. Entrepreneurship Theory and Practice, 29, 91-112.
44. Shepherd, D., (2011). Multilevel entrepreneurship research: opportunities for study- ing
entrepreneurial decision making. J. Manag. 37 (2), 412–420.
45. Schumpeter, J. A. (1934). The theory of economic development: An inquiry into profits,
capital, credit, interest, and the business cycle (2000 ed.). London: Transaction.
46. Schumpeter, J. (1942). Capitalism, Socialism and Democracy. New York: Harper.
47. Tamesberger, Bacher, (2020). COVID 19 Crisis: How to Avoid a “Lost Generation.”
Intereconomics, DOI: 10.1007/s10272-020-0908-y
48. The covid-19 pandemic is forcing a rethink in macroecomics, The Economist, July 25th,
2020 edition
49. Venkataraman S (1997) The distinctive domain of entrepreneurship research. In: Advances
in entrepreneurship, firm emergence and growth, vol. 3, pp 119–138. JAI Press, Greenwich,
CT
50. Venkataraman, S. (2003). Foreword. In S. Shane, A general theory of entrepreneurship. The
individual–opportunity nexus (pp. xi–xii). Northampton, MA: Edward Elgar.
51. Global Economic Prospects, 2020, World Bank Group Flagship Report

58th International Scientific Conference on Economic and Social Development – Budapest, 04-05 September, 2020
306
52. Þórlindsson Þ, Halldórsson V, Hlynur Hallgrimsson J, et al. (2015) Iþrottir á Islandi:
Umfang og hagræn áhrif – áfangaskyrsla 2015 (Sports in Iceland: Scale and economic
impact). Reykjavik: Félagsvisindastofnun Háskóla Islands (Social Science Research
Institute, University of Iceland).
58th International Scientific Conference on Economic and Social Development – Budapest, 04-05 September, 2020
307
THE MODERATING EFFECT OF FIRMS’ CASH HOLDING ON THE
RELATION BETWEEN CASH CONVERSION CYCLE AND FIRM
PERFORMANCE
Heba Zaher
Szechenyi Istvan University, Hungary
Gilberto Marquez Illescas
University of Rhode Island, United states
ABSTRACT
While different studies found contradicting results on the relation between firm's cash
conversion cycle (CCC) and firm's profitability, our previous work on a sample of 255
companies (in 16 countries) in the European Automotive Industry during the period 2009-2018
found an inverted (U) shape relation between the two variables. Moreover, we found that this
relation is moderated by firms' access to external credit both at the country and firm levels. In
the previous work, we used firm size as a determinant of the firm's access to external credit. In
this study we extend our analysis and test the moderated effect of firm's internal financial
constraints on the relationship between firm's performance and firm's CCC. We gathered firm-
level financial information from the Amadeus Database and information about the countries
growth in GDPPC from the World Bank database. The final sample includes the financial
information of 745 firms in 24 countries in the European Automotive Industry during the period
2010-2019. To test our hypotheses we use unbalanced panel data models with firm-level
clustered errors. The results confirm our first hypothesis that the relation between firms' CCC
and firm profitability takes an inverted (U) shape. The results also confirm our second
hypothesis that the relation between the firm's CCC and firm's performance is moderated by
the firm's internal financial constraints measured by the firm's cash holding. Specifically, we
found that less internally financially constrained firms can increase their profitability by
increasing their CCC to its optimal level. Our results may help practitioners on the way of
managing CCC to improve their firms' performance.
Keywords: cash conversion cycle (CCC), firm profitability, cash holdings
1. INTRODUCTION
This study uses the firm's cash conversion cycle (CCC) as a measure of firm efficiency in
managing its supply chain operations (Tsai, 2011; Wang, 2019). The CCC expresses the
difference in time needed for the company to receive the money from selling its products and
the time needed for the firm to pay its obligations. The CCC is calculated as the average days
started from the day of purchasing the inventory and selling it as final products, plus the average
days started from the day of selling the products on credit until the day of receiving the money
from their customers, minus the average days needed to pay their obligations to their suppliers.
As prior studies found mixed results on the relation between the firm's CCC and its
performance, this study is trying to investigate this relation and also expand prior work in testing
the moderated effect of other factors on this relation. This paper complements our prior work
testing other factors that may moderate the relation between the firm's CCC and its profitability,
therefore, we test if this relation depends on the level of firm's access to internal credit. To
measure the firm's internal financial constraints, we use the cash holding to total capital ratio as
a proxy for the firm's access to internal credit. We assume that firms with more access to internal
credit can increase their profitability by increasing the CCC comparing with firms with less
58th International Scientific Conference on Economic and Social Development – Budapest, 04-05 September, 2020
308
access to internal credit. To investigate the hypotheses, we accessed firms' financial information
from Amadeus database and we use the data about countries’ growth in GDPPC from the World
Bank Database to control for the difference in development among countries. The final sample
contains (5,827) firm-year information for (745) firms working in the automotive industry from
(24) European countries from 2010- 2019. Findings confirm the hypotheses. In this study, we
found that the relationship between a firm's CCC and its profitability takes an inverted (U)
shape. Moreover, the results support our second hypothesis, suggesting that the firm's access to
internal credit moderate the relation between a firm's CCC and its performance. Specifically,
we found that the optimal level of CCC for companies with a higher level of cash holdings is
higher than the optimal level for companies with lower level of cash holdings. Our study may
help practitioners to have a broader vision about the relationship between CCC and
performance, which may help them to make better managerial decisions regarding their CCC
and cash management. Moreover, our study provides a proposal for future studies to investigate
other factors that affect the relationship between CCC and firm performance.
2. LITERATURE REVIEW AND HYPOTHESES DEVELOPMENT
2.1. Cash conversion cycle and firm profitability
The Cash Conversion Cycle (CCC) is equal to the average days the inventory stays in the firm
plus the days it takes for the company to collect its accounts receivable minus the days it takes
the firm to pay its accounts payable (Özbayrak and Akgün, 2006). Therefore, the cash
conversion cycle refers to the time it takes for the company to receive the cash from its sales
minus the time it takes the company to pay for its purchases (Wang, 2019). Previous studies
examining the relationship between a firm's CCC and its performance found conflicting results,
and these different findings could be a result of differentiation in the factors that each studies
implements in its analysis. Several studies found a negative relation between firm's CCC and
its performance (Zhang et al, 2019; Chang, 2018; Zeidan and Shapir 2017; Ukaegbu, 2014; De
Almeida and Jr., 2014; Ebben and Johnson, 2011; Wang, 2002; Enqvist et al, 2014; Randall
and Farris, 2009; Garcia-Teruel and Martinez‐Solano, 2007), others found a positive relation
(Bigelli and Sánchez-Vidal 2012; Gill et al, 2010). Moreover, other studies found no relation
between CCC and firm performance (Kroes and Manikas, 2014; Deloof, 2003), or found a non-
linear relation (Wetzel and Hofmann, 2019; Mun and Jang, 2015; Baños-Caballero et al, 2014).
In the studies that found an inverted (U) shape relationship between firm's CCC and its
performance, these findings mean that increasing the firm's CCC could result in increasing the
firms' sales by increasing their inventory to prevent interruption in their operations (Chang,
2018), or increasing the level of sales with credit (Kieschnick et al., 2013), which will result in
increasing their profitability. Moreover, increasing the CCC by decreasing the level of accounts
payable means the firm is trying to keep a constant relation with supply chain partners, or
getting discounts to pay their obligations earlier (Ng et al., 1999), which also resulted in
increasing their profitability. Increasing the CCC could result in improving the firm's
performance but until an optimal level (Wetzel and Hofmann, 2019; Mun and Jang, 2015;
Baños-Caballero et al, 2014), whereas increasing the CCC beyond this point could result in
increasing the cash flow risk for the firm. In this study, we expect to find an optimal level of
CCC that is necessary to increase firm performance. According to this expectation, a firm with
a low level of CCC can increase its profitability by increasing its CCC until the optimal point,
therefore our first hypothesis is:
• H1: the relation between firms' CCC and profitability follows an inverted (U) shape.
58th International Scientific Conference on Economic and Social Development – Budapest, 04-05 September, 2020
309
2.2. The moderating effect of firms' cash holding on the relationship between cash
conversion cycle and firms' profitability
According to Kaplan and Zingales (1997), the precise and broad definition of financially
constrained firms are firms that face a wedge between the internal and external costs of funds.
According to this definition, almost all firms are classified as financially constrained, therefore,
the authors considered the firm as more financially constrained when the difference between
the external and internal costs increases. Another definition of firm's financial constraints refers
to whether a firm has not enough funds to finance its potential investment in the right time (Han
and Qiu, 2007), therefore, it is expected that firms with a high level of cash holding to be less
financially constrained (Kaplan and Zingales, 1997). Our previous study investigated the
moderated effect of firm access to external credit outside its supply chain on the relationship
between the CCC level and its performance, while in this study we expand the previous analysis
by using a different firm-level proxy for firm's internal financial constraint to test if the level of
firm's internal funding moderates this relationship. The indicator of firms' financial constraints
in this study is the cash holding ratio. The cash holding receive more interest in academic
research after the financial crisis when the credit from financial institutions collapsed
dramatically (Nguyen and Qian, 2014), which increased the cash flow risk and motivated firms
to increase their level of cash holding. Previous studies found that the level of cash holding
depends on different factors such as the firm's access to external credit (Fazzari et al, 1988), the
cash flow risk of the firm (Marwick et al., 2020; Bates et al, 2009; Han and Qiu, 2007; Opler
et al., 1999) and the change in working capital of the firm (Bates et al, 2009). Therefore, we
expect to find the effect of the firm's CCC on its performance to depend on the level of its cash
holdings. Our proposition is motivated by the work of Mun and Jang (2015) who found an
effect of the firm's cash level on the relation between the firm's working capital management
and firms' performance. Moreover, Bigellia and Sánchez-Vidal (2012) found that firms with
longer CCC tend to have a higher level of cash holdings, and Kieschnick et al., (2013) found
that managing the firm's operating working capital depends on its financial constraints. In this
study, we expect that the CCC is likely to be more important for the firm's performance when
it is more internally financially constrained comparing to less financially constrained firms.
Financially constrained firms are expected to rely more on the financing from their supply chain
partners based on the long-relation with them, which resulted in decreasing the asymmetric
information risk. On the other hand, prior studies found the firms access to trade credit to be
positively affected by their level of cash holdings (e.g., Kling et al, 2014). Therefore, we expect
that the relationship between a firm's CCC and its performance to be moderated by its financing
constraints. More specifically, we expect that the optimal level of CCC for financially
constrained firms to be lower than for less financially constrained firms who have more internal
credit and can provide more credit to their customers (Ng et al., 1999), therefore, they will be
more profitable when increasing their CCC level. Based on that, we propose the following
hypotheses:
• H2: Increasing the firm's internal financing measured by the firm's cash holding will
increase the optimal level of firm's CCC.
3. RESEARCH METHOD
3.1. Data
We used the data about firms' financial information from Amadeus database and we control for
the difference between firms according to their countries by using the growth rate of countries
GDPPC from the World Bank Database. The final sample includes (5,827) firm-year
observations from (24) European countries in Automotive Industry over the 2010- 2019 period.
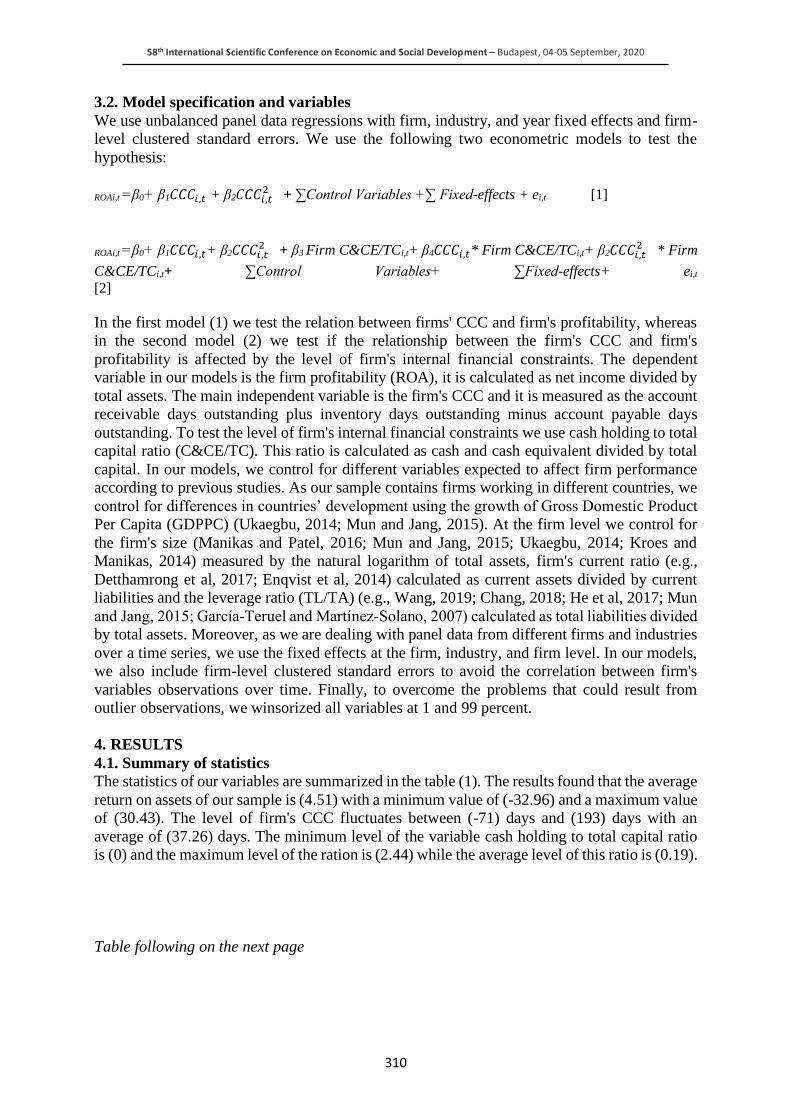
58th International Scientific Conference on Economic and Social Development – Budapest, 04-05 September, 2020
310
3.2. Model specification and variables
We use unbalanced panel data regressions with firm, industry, and year fixed effects and firm-
level clustered standard errors. We use the following two econometric models to test the
hypothesis:
ROAi,t =β0+ β1𝐶𝐶𝐶𝑖,𝑡 + β2𝐶𝐶𝐶𝑖,𝑡2 + ∑Control Variables +∑ Fixed-effects + ei,t [1]
ROAi,t =β0+ β1𝐶𝐶𝐶𝑖,𝑡+ β2𝐶𝐶𝐶𝑖,𝑡2 + β3 Firm C&CE/TCi,t+ β4𝐶𝐶𝐶𝑖,𝑡* Firm C&CE/TCi,t+ β2𝐶𝐶𝐶𝑖,𝑡
2 * Firm
C&CE/TCi,t+ ∑Control Variables+ ∑Fixed-effects+ ei,t
[2]
In the first model (1) we test the relation between firms' CCC and firm's profitability, whereas
in the second model (2) we test if the relationship between the firm's CCC and firm's
profitability is affected by the level of firm's internal financial constraints. The dependent
variable in our models is the firm profitability (ROA), it is calculated as net income divided by
total assets. The main independent variable is the firm's CCC and it is measured as the account
receivable days outstanding plus inventory days outstanding minus account payable days
outstanding. To test the level of firm's internal financial constraints we use cash holding to total
capital ratio (C&CE/TC). This ratio is calculated as cash and cash equivalent divided by total
capital. In our models, we control for different variables expected to affect firm performance
according to previous studies. As our sample contains firms working in different countries, we
control for differences in countries’ development using the growth of Gross Domestic Product
Per Capita (GDPPC) (Ukaegbu, 2014; Mun and Jang, 2015). At the firm level we control for
the firm's size (Manikas and Patel, 2016; Mun and Jang, 2015; Ukaegbu, 2014; Kroes and
Manikas, 2014) measured by the natural logarithm of total assets, firm's current ratio (e.g.,
Detthamrong et al, 2017; Enqvist et al, 2014) calculated as current assets divided by current
liabilities and the leverage ratio (TL/TA) (e.g., Wang, 2019; Chang, 2018; He et al, 2017; Mun
and Jang, 2015; Garcia‐Teruel and Martinez‐Solano, 2007) calculated as total liabilities divided
by total assets. Moreover, as we are dealing with panel data from different firms and industries
over a time series, we use the fixed effects at the firm, industry, and firm level. In our models,
we also include firm-level clustered standard errors to avoid the correlation between firm's
variables observations over time. Finally, to overcome the problems that could result from
outlier observations, we winsorized all variables at 1 and 99 percent.
4. RESULTS
4.1. Summary of statistics
The statistics of our variables are summarized in the table (1). The results found that the average
return on assets of our sample is (4.51) with a minimum value of (-32.96) and a maximum value
of (30.43). The level of firm's CCC fluctuates between (-71) days and (193) days with an
average of (37.26) days. The minimum level of the variable cash holding to total capital ratio
is (0) and the maximum level of the ration is (2.44) while the average level of this ratio is (0.19).
Table following on the next page
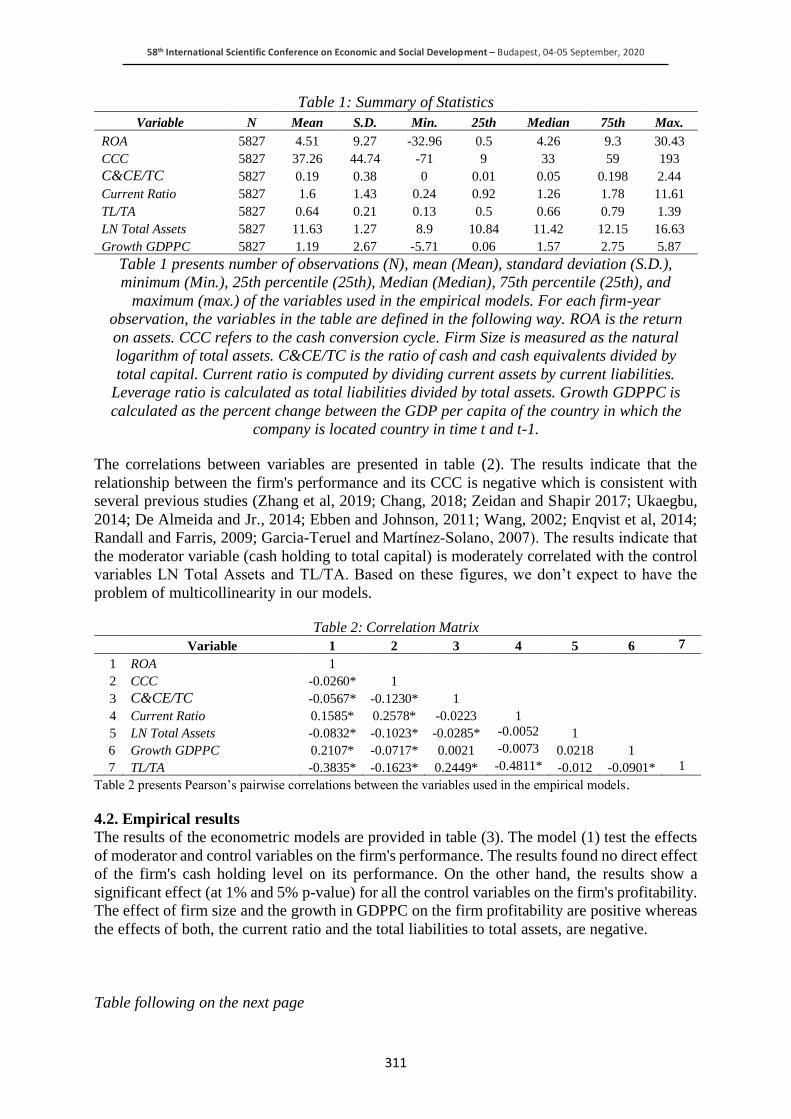
58th International Scientific Conference on Economic and Social Development – Budapest, 04-05 September, 2020
311
Table 1: Summary of Statistics
Variable N Mean S.D. Min. 25th Median 75th Max.
ROA 5827 4.51 9.27 -32.96 0.5 4.26 9.3 30.43
CCC 5827 37.26 44.74 -71 9 33 59 193
C&CE/TC 5827 0.19 0.38 0 0.01 0.05 0.198 2.44
Current Ratio 5827 1.6 1.43 0.24 0.92 1.26 1.78 11.61
TL/TA 5827 0.64 0.21 0.13 0.5 0.66 0.79 1.39
LN Total Assets 5827 11.63 1.27 8.9 10.84 11.42 12.15 16.63
Growth GDPPC 5827 1.19 2.67 -5.71 0.06 1.57 2.75 5.87
Table 1 presents number of observations (N), mean (Mean), standard deviation (S.D.),
minimum (Min.), 25th percentile (25th), Median (Median), 75th percentile (25th), and
maximum (max.) of the variables used in the empirical models. For each firm-year
observation, the variables in the table are defined in the following way. ROA is the return
on assets. CCC refers to the cash conversion cycle. Firm Size is measured as the natural
logarithm of total assets. C&CE/TC is the ratio of cash and cash equivalents divided by
total capital. Current ratio is computed by dividing current assets by current liabilities.
Leverage ratio is calculated as total liabilities divided by total assets. Growth GDPPC is
calculated as the percent change between the GDP per capita of the country in which the
company is located country in time t and t-1.
The correlations between variables are presented in table (2). The results indicate that the
relationship between the firm's performance and its CCC is negative which is consistent with
several previous studies (Zhang et al, 2019; Chang, 2018; Zeidan and Shapir 2017; Ukaegbu,
2014; De Almeida and Jr., 2014; Ebben and Johnson, 2011; Wang, 2002; Enqvist et al, 2014;
Randall and Farris, 2009; Garcia-Teruel and Martinez‐Solano, 2007). The results indicate that
the moderator variable (cash holding to total capital) is moderately correlated with the control
variables LN Total Assets and TL/TA. Based on these figures, we don’t expect to have the
problem of multicollinearity in our models.
Table 2: Correlation Matrix
Variable 1 2 3 4 5 6 7
1 ROA 1
2 CCC -0.0260* 1
3 C&CE/TC -0.0567* -0.1230* 1
4 Current Ratio 0.1585* 0.2578* -0.0223 1
5 LN Total Assets -0.0832* -0.1023* -0.0285* -0.0052 1
6 Growth GDPPC 0.2107* -0.0717* 0.0021 -0.0073 0.0218 1
7 TL/TA -0.3835* -0.1623* 0.2449* -0.4811* -0.012 -0.0901* 1
Table 2 presents Pearson’s pairwise correlations between the variables used in the empirical models.
4.2. Empirical results
The results of the econometric models are provided in table (3). The model (1) test the effects
of moderator and control variables on the firm's performance. The results found no direct effect
of the firm's cash holding level on its performance. On the other hand, the results show a
significant effect (at 1% and 5% p-value) for all the control variables on the firm's profitability.
The effect of firm size and the growth in GDPPC on the firm profitability are positive whereas
the effects of both, the current ratio and the total liabilities to total assets, are negative.
Table following on the next page
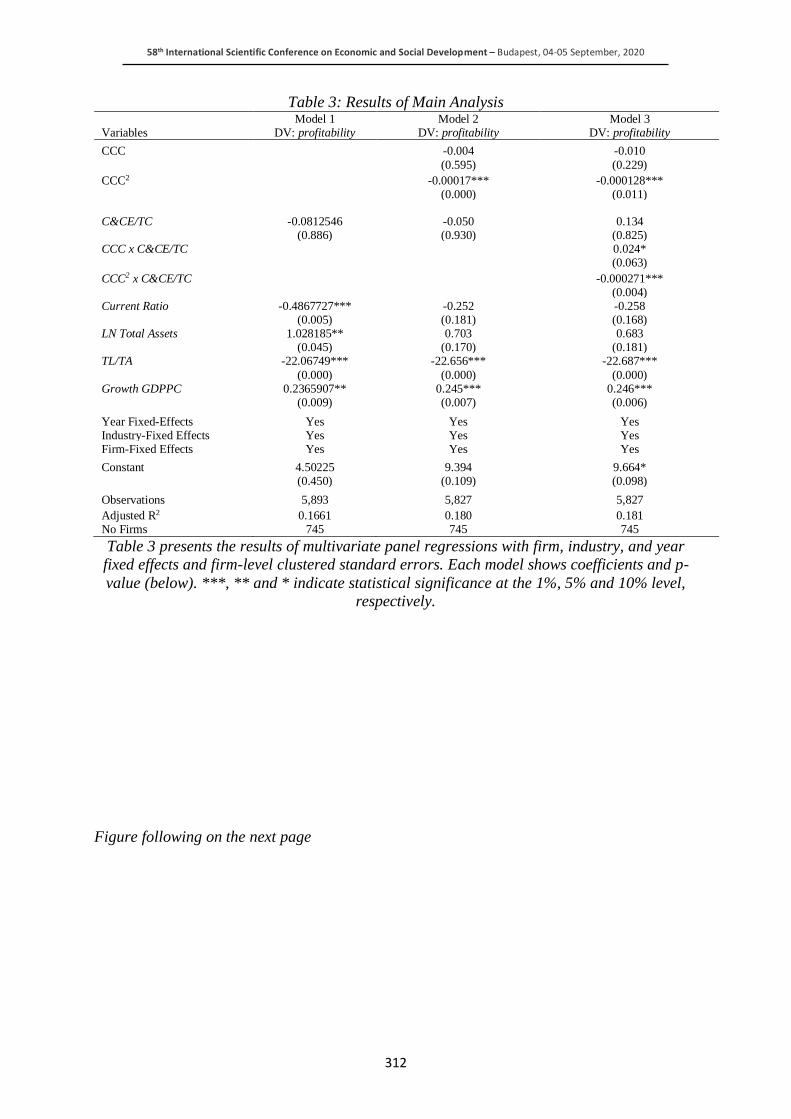
58th International Scientific Conference on Economic and Social Development – Budapest, 04-05 September, 2020
312
Table 3: Results of Main Analysis Model 1 Model 2 Model 3 Variables DV: profitability DV: profitability DV: profitability
CCC -0.004 -0.010
(0.595) (0.229)
CCC2 -0.00017*** -0.000128***
(0.000) (0.011)
C&CE/TC -0.0812546 -0.050 0.134
(0.886) (0.930) (0.825) CCC x C&CE/TC 0.024*
(0.063)
CCC2 x C&CE/TC -0.000271***
(0.004) Current Ratio -0.4867727*** -0.252 -0.258 (0.005) (0.181) (0.168) LN Total Assets 1.028185** 0.703 0.683
(0.045) (0.170) (0.181) TL/TA -22.06749*** -22.656*** -22.687***
(0.000) (0.000) (0.000) Growth GDPPC 0.2365907** 0.245*** 0.246***
(0.009) (0.007) (0.006)
Year Fixed-Effects Yes Yes Yes Industry-Fixed Effects Yes Yes Yes Firm-Fixed Effects Yes Yes Yes
Constant 4.50225 9.394 9.664*
(0.450) (0.109) (0.098)
Observations 5,893 5,827 5,827
Adjusted R2 0.1661 0.180 0.181 No Firms 745 745 745
Table 3 presents the results of multivariate panel regressions with firm, industry, and year
fixed effects and firm-level clustered standard errors. Each model shows coefficients and p-
value (below). ***, ** and * indicate statistical significance at the 1%, 5% and 10% level,
respectively.
Figure following on the next page
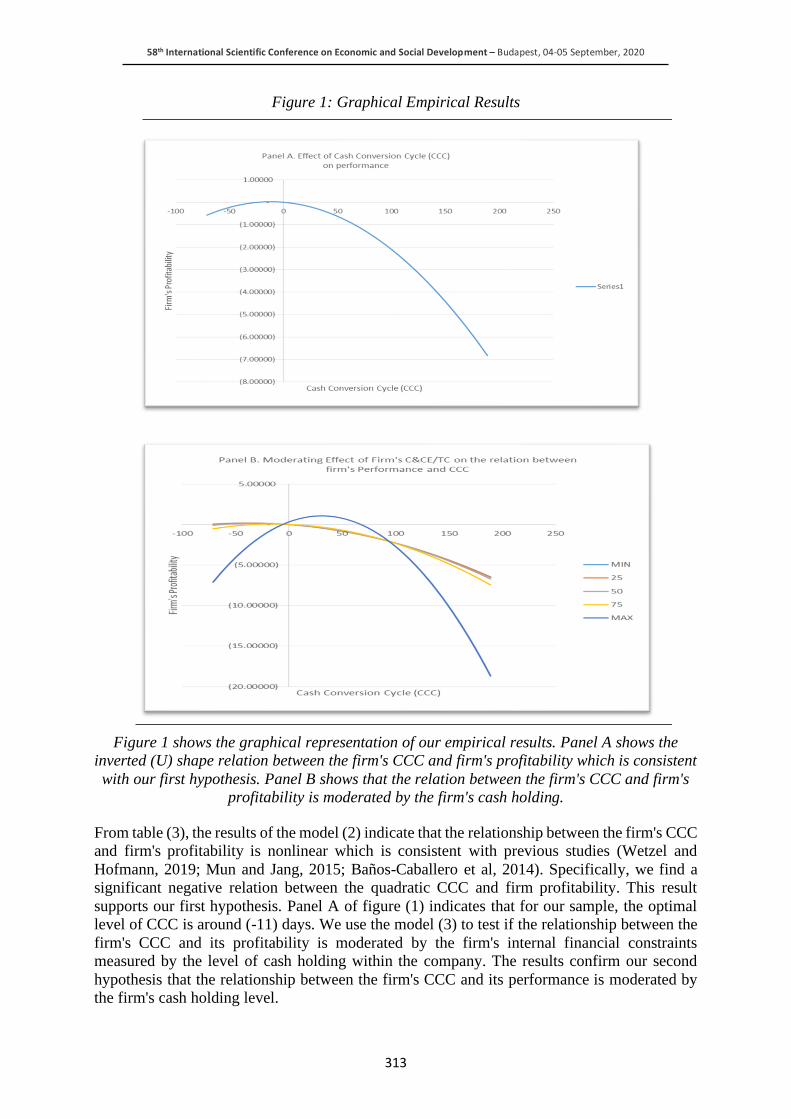
58th International Scientific Conference on Economic and Social Development – Budapest, 04-05 September, 2020
313
Figure 1: Graphical Empirical Results
Figure 1 shows the graphical representation of our empirical results. Panel A shows the
inverted (U) shape relation between the firm's CCC and firm's profitability which is consistent
with our first hypothesis. Panel B shows that the relation between the firm's CCC and firm's
profitability is moderated by the firm's cash holding.
From table (3), the results of the model (2) indicate that the relationship between the firm's CCC
and firm's profitability is nonlinear which is consistent with previous studies (Wetzel and
Hofmann, 2019; Mun and Jang, 2015; Baños-Caballero et al, 2014). Specifically, we find a
significant negative relation between the quadratic CCC and firm profitability. This result
supports our first hypothesis. Panel A of figure (1) indicates that for our sample, the optimal
level of CCC is around (-11) days. We use the model (3) to test if the relationship between the
firm's CCC and its profitability is moderated by the firm's internal financial constraints
measured by the level of cash holding within the company. The results confirm our second
hypothesis that the relationship between the firm's CCC and its performance is moderated by
the firm's cash holding level.
58th International Scientific Conference on Economic and Social Development – Budapest, 04-05 September, 2020
314
From panel (B) of figure (1), it is clear that the firms with a higher level of cash holding can
increase their profitability by increasing their level of CCC until an optimal level which is
higher than the optimal level for firms with a lower level of cash holding. We found that the
optimal level of CCC for firms with a higher level of cash holding is around (29) days whereas
the optimal level of the CCC for firms with a lower level of cash holding is approximately (-
41) days.
5. CONCLUSIONS
The empirical tests found an inverted (U) shape relationship between the firm's CCC and its
performance measured by the firm's profitability. Based on this finding, the firms can increase
their profitability by increasing the level of their CCC until the optimal level. However, it is
expected to find factors that affect this relation. In this study, we test if the relationship between
firm profitability and its CCC level is moderated by the level of cash holding in the firm. The
logic behind this expectation is that firms try to shorten their CCC to get their money back as
fast as possible, so they can invest it again in their operations. Therefore, increasing the level
of cash holding means that they can depend on the cash to support their operations while
increasing their CCC to increase their profitability. The findings confirm our second hypothesis
that the relation between the firm's performance and its CCC depends on the level of the firm's
cash holdings, which is consistent with some prior studies (e.g., Bigellia and Sánchez-Vidal,
2012). Concretely, we found that the optimal level of CCC for firms with a higher level of cash
holdings is higher than the optimal level of CCC for firms with a lower level of cash holdings.
To conclude, this research provides the managers with a new method of measuring and
managing the level of CCC of their firms while taking into consideration other factors
influencing the way of managing the CCC level and its potential effects on firm performance.
This work as any other work has some limitations. First, while this study contains a sample of
firms from different European countries, the study focus on the automotive industry, therefore,
future studies could check the robustness of our findings in different industries. Second, this
study uses the firm's cash holding level as a measure of firms' internal financial constraints.
Future studies can test the effect of other proxies of internal and external financial constraints
on the relationship between CCC and firm performance.
LITERATURE:
1. Baños-Caballero, S., García-Teruel, P. J., Martínez-Solano, P., 2014. Working capital
management, corporate performance, and financial constraints. Journal of Business
Research. Volume 67, Issue 3, 332-338.
2. Bates, T.W.; Kahle, K.M.; Stulz, R.M., 2009, Why do us firms hold so much more cash
than they used to? J. Financ., 64 (5) (2009), pp. 1985-2021
3. Bigellia, Marco; Sánchez-Vidal, Javier, 2012, Cash holdings in private firms, Journal of
Banking & Finance, Volume 36, Issue 1, January 2012, Pages 26-35.
4. Chang, C., 2018. Cash conversion cycle and corporate performance: Global evidence.
International Review of Economics and Finance. 56, 568–581.
5. Cleary, Sean, 2006, International corporate investment and the relationships between
constraint measures, Journal of Banking & Finance 30 (2006) 1559–1580.
6. De Almeida, J. R., Jr., W. E., 2014. Access to finance, working capital management and
company value: Evidences from Brazilian companies listed on BM & FBOVESPA. Journal
of Business Research. 67, 924–934.
7. Deloof, M., 2003, Does working capital management affect profitability of Belgian firms?.
J. Bus. Finance Accounting. 30 (3–4), 573-587.
58th International Scientific Conference on Economic and Social Development – Budapest, 04-05 September, 2020
315
8. Detthamrong, Umawadee; Chancharat, Nongnit; Vithessonthi, Chaiporn, 2017, Corporate
governance, capital structure and firm performance: Evidence from Thailand, Research in
International Business and Finance, Volume 42, December 2017, Pages 689-709.
9. Ebben, Jay J.; Johnson, Alec C., 2011, cash conversion cycle management in small firms:
relationships with liquidity, invested capital, and firm performance, journal of small
business & entrepreneurship, volume 24, 2011- issue 3.
10. Enqvist, J., Graham, M., Nikkinen, J., 2014. The impact of working capital management on
firm profitability in different business cycles: Evidence from Finland. Research in
International Business and Finance. Vol 32, 36-49.
11. Fazzari, Steven, Hubbard, R. Glenn, Petersen, Bruce, 1988. Financing constraints and
corporate
12. investment. Brookings Papers on Economic Activity, 141–195.
13. Garcia-Teruel, P. J., Martinez-Solano, P., 2007. Effects of working capital management on
SME profitability. International Journal of Managerial Finance., 3 (2), 164-177.
14. Gill, A., Biger, N., Mathur, N., 2010. The relationship between working capital
management and profitability: evidence from the United States. Bus. Econ. J. (BEJ-10), 1-
9.
15. Han, S.; Qiu, J., Corporate precautionary cash holdings, J. Corp. Financ., 13 (1) (2007), pp.
43-57.
16. He, Wei; Mukherjee, Tarun K.; Baker, H. Kent, 2017, The effect of the split share structure
reform on working capital management of Chinese companies, Global Finance Journal 33
(2017) 27–37.
17. Kaplan, Steven N.; Zingales, Luigi, 1997, Do Investment-Cash Flow Sensitivities Provide
Useful Measures of Financing Constraints?, The Quarterly Journal of Economics , Feb.,
1997, Vol. 112, No. 1 (Feb., 1997), pp. 169-215
18. Kieschnick, R., Laplante, M., Moussawi, R., 2013. Working capital management and
shareholders' wealth. Rev. Financ. 17, 1827–1852.
19. Kling, Gerhard; Paul, Salima Y.; Gonis, Eleimon, 2014, Cash holding, trade credit and
access to short-term bank finance, International Review of Financial Analysis Volume 32,
March 2014, Pages 123-131.
20. Kroes, J. R., Manikas, A. S., 2014. Cash flow management and manufacturing firm financial
performance: A longitudinal perspective. Int. J. Production Economics. 148, 37–50.
21. Lamont, Owen; Polk, Christopher; Saaá-Requejo, Jesús, Financial constraints and stock
returns, The review of financial studies, 2001, Vol. 14, No. 2, pp. 529- 554.
22. Manikas, Andrew S.; Patel, Pankaj C., 2016, Managing sales surprise: The role of
operational slack and volume flexibility, Int. J. Production Economics 179 (2016) 101–116.
23. Marwick, Alex; Hasan, Mostafa Monzur; Luo, Tianpei, 2020, Organization capital and
corporate cash holdings, International Review of Financial Analysis, Volume 68, March
2020, 101458.
24. Mun, Sung Gyun; Jang, SooCheong (Shawn), 2015, Working capital, cash holding, and
profitability of restaurant firms, international journal of hospitality management, Volume
48, 2015, pp. 1-11.
25. Ng, C. K., Smith, J. K., & Smith, R. L. (1999). Evidence on the determinants of credit terms
used in interfirm trade. Journal of Finance, 54, 1109–1129.
26. Nguyen, Ha; Qian, Rong, 2014, Demand collapse or credit crunch to firms? Evidence from
the World Bank's financial crisis survey in Eastern Europe, Journal of International Money
and Finance, Volume 47, October 2014, Pages 125-144.
27. Opler, Tim; Pinkowitz, Lee; Stulz, René; Williamson, Rohan, 1999, The determinants and
implications of corporate cash holdings, Journal of Financial Economics, Volume 52, Issue
1, April 1999, Pages 3-46.
58th International Scientific Conference on Economic and Social Development – Budapest, 04-05 September, 2020
316
28. Özbayrak, M., Akgün, M., 2006. The effects of manufacturing control strategies on the cash
conversion cycle in manufacturing systems. International Journal of Production Economics.
vol. 103, issue 2, 535-550.
29. Randall, Wesley S.; Farris, M. Theodore, 2009, supply chain financing: using cash-to- cash
variables to strengthen the supply chain, international journal of physical distribution &
logistics management, 39 (8) (2009), pp. 669- 689.
30. Tsai, C. Y., 2011. On delineating supply chain cash flow under collection risk. Int. J.
Production Economics. 129, 186–194.
31. Ukaegbu, B., 2014. The significance of working capital management in determining firm
profitability: Evidence from developing economies in Africa. Research in International
Business and Finance. 31, 1–16.
32. Wang, B., 2019. The cash conversion cycle spread. Journal of financial economics. Vol
133, Issue 2, 472-497.
33. Wang, Y. J., 2002. Liquidity management, operating performance, and corporate value:
evidence from Japan and Taiwan. Journal of Multinational Financial Management. 12, 159–
169.
34. Wetzel, P., Hofmann, E., 2019. Supply chain finance, financial constraints and corporate
performance: An explorative network analysis and future research agenda. International
Journal of Production Economics. Vol 216, 364-383.
35. Zhang, T., Zhang, C. Y., Pei, Q., 2019. Misconception of providing supply chain finance:
Its stabilising role. International Journal of Production Economics. Vol 213, 175-184.
36. Zeidan, R., Shapir, M., 2017. Cash conversion cycle and value-enhancing operations:
Theory and evidence for a free lunch. Journal of Corporate Finance. Vol 45, 203-219.
58th International Scientific Conference on Economic and Social Development – Budapest, 04-05 September, 2020
317
ESSENTIAL CHARACTERISTICS OF LEAD-USERS RELATED TO
MEDICAL INSTRUMENTS INNOVATIONS
Bela Venesz
Szechenyi Istvan University, Hungary
Győr, Egyetem tér 1. 9026, Hungary
Tibor Dory
Szechenyi Istvan University, Hungary
Győr, Egyetem tér 1. 9026, Hungary
ABSTRACT
The availability of creative ideas is a necessary but insufficient condition for the successful
innovation process. Despite the talented lead user’s ideas, the success rate of the innovation
process and the level of effectiveness are varying and most of the cases remain low during the
entire co-creation process. We have realised that the characteristics of lead-users have a
significant impact on the average quality of the entire co-creation and innovation process. The
study determinates essential characteristics of lead-users as traits, qualities, features which
unambiguously classify them to user-innovators and primarily important for co-creation. In
order to gain user’s experience during the co-creation lead users need to be expert in their
domain, own tacit knowledge, have a high number and complex cognitive patterns, highly
educated and have technical expertise. We have found that the five-stage model of knowledge
acquisition created by Dreyfus & Dreyfus (1986) strongly corresponds to the lead-user
identification in the experience space defined by Prahalad & Ramaswamy (2003).
Keywords: co-creation, experience space, expert level experience, medical instruments lead-
users
1. INTRODUCTION
Crowd contests usually aggregate a large number of contributors and generate a high number
of submissions (Füller, Hutter, Hautz, & Matzler, 2016). Asking for ideas related a human
health Google received more than 154.000 submissions, and they assigned 3000 internal
workers to the evaluation process (Füller, Hutter, & Hautz, 2013). We have recognised during
our initial research the existence of multiple reliable solutions for efficient idea selection. The
availability of creative ideas is a necessary but insufficient condition for the successful
innovation process. There is an increasingly significant role of open innovation, co-creation,
lead-users and user-innovators. We have performed experiments in a high-tech embedded
hardware and software developer company. We have found that despite the talented lead user’s
ideas, the success rate of the innovation process and the level of effectiveness are varying and
most of the cases remain low during the entire co-creation process. We have realised that the
characteristics of lead-users have a significant impact on the average quality of the entire co-
creation and innovation process. The result of the observation forced us to change our interest
in the analysis of lead-user’s characteristics. Different market segments require different
characteristics. As little attention has been received in academic literature to the characteristics
of lead users during the co- creation process related to medical innovations, our interest turned
to the health-care instruments innovations and the investigation is performed on the medical
domain. The study determinates essential characteristics as traits, qualities, features which
unambiguously classify user-innovators and primarily important for co-creation. We have
found a link between a major characteristic (expert level of user innovator) and a five-stage
58th International Scientific Conference on Economic and Social Development – Budapest, 04-05 September, 2020
318
model of knowledge acquisition. This model is described in the research design part. The next
section provides a literature review and develops the research gap.
2. LITERATURE REVIEW
2.1. Open innovation
Firms are recently increasing their activities to engage user innovators to get fresh ideas and set
up collaboration (Bayus, 2013; Dahlander & Piezunka, 2014). Open innovation and
crowdsourcing are widely used to access user-innovators and utilize their knowledge, skills and
solutions (Majchrzak & Malhotra, 2013). Users become active members in the innovation
process of a corporation and participate in new product development (Piller, Ihl, & Vossen,
2011). They are identified and named as lead-users which have everyday user experience with
a novel process or product concept of interest. Open innovation has become a new imperative
for organising innovation. The innovation process combines internal and external ideas, inflow
and outflow of knowledge to improve the entire innovation success (Bogers, Chesbrough, &
Moedas, 2017).
2.2. Adaptors and innovators
According to Burkemper, Sarooghi, & Libaers (2014) creativity and innovations are the two
major activities of an innovation process. Creativity is the generation of novel and innovative
ideas (Amabile, Conti, Coon, Lazenby, & Herron, 1996), while innovation is the
implementation of these ideas (Rosing, Frese, & Bausch, 2011). The link is not straightforward
as the correlation is less than one between creativity and innovation. It is explained by the fact
that the implementation of creative ideas into innovations consist of two different and even
opposite processes (Rosing, Frese, & Bausch, 2011). This statement is corresponding to
Kirton’s adaptive-Innovation theory (Kirton, 1976) which identify tools to distinguish
individuals based on the cognitive style of creativity (idea generation) and problem-solving
(implementation). Kirton describes adaptors (creative individuals) as people who prefer to “do
things better” and innovators (problem solvers) who prefer to “do things differently” (Stum,
2009).
2.3. Lead users and user innovators
Studies apply lead-users and user-innovators as identical expressions. Hippel (1986, p. 796)
identifies lead-users based on their two main characteristics: “lead-users face needs that will be
general in a marketplace - but face them months or years before the bulk of that marketplace
encounters them and lead-users are positioned to benefit significantly by obtaining a solution
to those needs”. In the same article, Hippel stated that lead users are familiar with future
conditions and are in the position to provide exact data on the needs related to such future
attributes. Researchers define further characteristics of lead users as a demonstration of stronger
opinion leadership and high level of control (Schreier & Prügl, 2008). According to (Brem &
Bilgram, 2015) lead-user's creative skills can be identified based on their behaviour.
Pongtanalert & Ogawa (2015) define information disclosure and community membership of
user-innovators as two significant characteristics related to commercial success. User-
innovators tend to reveal or share their innovations with suppliers or other users or even their
competitors. According to Gürkan (2014), only a limited number of users provide valuable
contributions to the innovation process.
2.4. Technical expertise
Specialized knowledge resources drive competitive advantages for the firm during the
innovation process especially in the case of user co-creation (Sandeep, Manju, & Atreyi, 2020).
58th International Scientific Conference on Economic and Social Development – Budapest, 04-05 September, 2020
319
Hippel, Ogawa, & Jong (2013 p. 31) stated that user-innovators are “significantly more likely
than the average citizen to be highly educated, to have a technical education and to be male”.
Afuah & Tucci (2012) express that problem solvers (use the same terminology for user-
innovator as Kirton (1976), are 1. expert of their area (possess accumulated tacit knowledge for
complex problem solving and can evaluate different alternatives), 2. develop routines for
problem-solving, 3. know cognitive frames (cognitive patterns), 4. possess absorptive capacity
(skills for knowledge acquisition). The level of education, accumulated knowledge and
expertise in the specific field qualify them to co-creation in high quality (Füller, Hutter, Hautz,
& Matzler, 2016). The same study describes furthermore how the characteristics of
professionalism play a significant role and influence the quality of contribution related to a
Swarowsky design contest. It confirmes professionalism as essential characteristics which have
a positive impact on the average quality of the submitted designs. Professionalism as a
significant element of the person’s characteristics is strongly positively related to the quality of
the submission (Füller, Hutter, Hautz, & Matzler, 2016). Hippel (1986) presents previous
experiments in his study which confirms that the user's prior experience (familiarity with
product attributes and uses) determinates the ability to generate or evaluate novel product
possibilities.
2.5. Level of knowledge acquisition
Dreyfus & Dreyfus (1980) created a model of knowledge acquisition which can be applied to
identify the different knowledge and experience levels of users. The original idea was further
adjusted which lead to the five-stage model of knowledge acquisition from novice to expert.
The novice uses formalised and general rules, the expert act intuitively. Dreyfus & Dreyfus
(1986) stated that an individual usually passes through the five different stages of perceptions
of his activity of own skills improvement. The user will be an expert of a certain type of
problems in his area of skills. Not all individuals can achieve the highest expert level. Only a
very small portion of beginners can ever master their field. (Mérő, 1990) states two major
differences among the levels of the five-stage model. First is the number of the cognitive
patterns (schemata) the individual knows and secondly the complexity of their patterns. Based
on the above academic statements we assume that lead-users have one of the highest levels of
knowledge acquisition and they are expert of their domain.
2.6. Innovation disclosure
Researchers highlight the relevance of engaging lead users in the co-creation activities as idea
generation, design, refinement and testing of new concept and products (Prahalad &
Ramaswamy, 2003). Stock, Hippel and Gillert (2016) stated that personalities are significantly
associated with the failure or success of the innovation process. Successful ideation needs the
trait of openness to experience. Successful prototyping demands introversion and
conscientiousness. Studies show that user-innovators and product developers have a different
mindset (Lackner, 2013) and characteristics (Füller, Hutter, Hautz, & Matzler, 2016). Lead
users and product developers are usually different in terms of personality traits (Stock, Hippel
& Gillert, 2016) and a variety of emotions (Brinks, 2019). They have different cognitive factors,
motivations and work policies which influence the success of the innovation process. According
to Pongtanalert & Ogawa (2015) innovation disclosure is essential characteristics of a user-
innovator. In the medical field, Hienerth & Lettl (2011) stated that surgeons disclosed their new
surgery method at a medical conference which become later a worldwide standard by adapting
other surgeons. Pongtanalert & Ogawa (2015) classified user-innovators into three categories:
revealing innovators, social innovators and silent innovators. The research found that only the
revealing- and social innovators are willing to share their innovations. Hippel (1986) states that
a subset of users should have a real understanding of the need to share their solution to a new
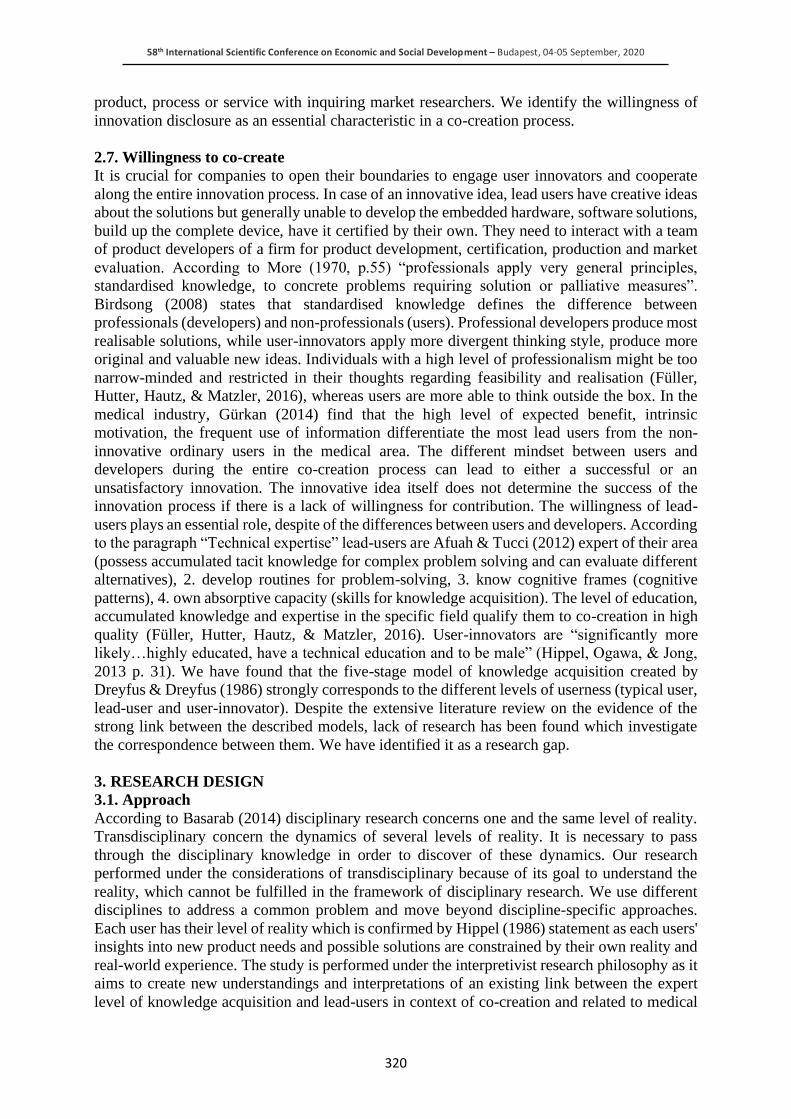
58th International Scientific Conference on Economic and Social Development – Budapest, 04-05 September, 2020
320
product, process or service with inquiring market researchers. We identify the willingness of
innovation disclosure as an essential characteristic in a co-creation process.
2.7. Willingness to co-create
It is crucial for companies to open their boundaries to engage user innovators and cooperate
along the entire innovation process. In case of an innovative idea, lead users have creative ideas
about the solutions but generally unable to develop the embedded hardware, software solutions,
build up the complete device, have it certified by their own. They need to interact with a team
of product developers of a firm for product development, certification, production and market
evaluation. According to More (1970, p.55) “professionals apply very general principles,
standardised knowledge, to concrete problems requiring solution or palliative measures”.
Birdsong (2008) states that standardised knowledge defines the difference between
professionals (developers) and non-professionals (users). Professional developers produce most
realisable solutions, while user-innovators apply more divergent thinking style, produce more
original and valuable new ideas. Individuals with a high level of professionalism might be too
narrow-minded and restricted in their thoughts regarding feasibility and realisation (Füller,
Hutter, Hautz, & Matzler, 2016), whereas users are more able to think outside the box. In the
medical industry, Gürkan (2014) find that the high level of expected benefit, intrinsic
motivation, the frequent use of information differentiate the most lead users from the non-
innovative ordinary users in the medical area. The different mindset between users and
developers during the entire co-creation process can lead to either a successful or an
unsatisfactory innovation. The innovative idea itself does not determine the success of the
innovation process if there is a lack of willingness for contribution. The willingness of lead-
users plays an essential role, despite of the differences between users and developers. According
to the paragraph “Technical expertise” lead-users are Afuah & Tucci (2012) expert of their area
(possess accumulated tacit knowledge for complex problem solving and can evaluate different
alternatives), 2. develop routines for problem-solving, 3. know cognitive frames (cognitive
patterns), 4. own absorptive capacity (skills for knowledge acquisition). The level of education,
accumulated knowledge and expertise in the specific field qualify them to co-creation in high
quality (Füller, Hutter, Hautz, & Matzler, 2016). User-innovators are “significantly more
likely…highly educated, have a technical education and to be male” (Hippel, Ogawa, & Jong,
2013 p. 31). We have found that the five-stage model of knowledge acquisition created by
Dreyfus & Dreyfus (1986) strongly corresponds to the different levels of userness (typical user,
lead-user and user-innovator). Despite the extensive literature review on the evidence of the
strong link between the described models, lack of research has been found which investigate
the correspondence between them. We have identified it as a research gap.
3. RESEARCH DESIGN
3.1. Approach
According to Basarab (2014) disciplinary research concerns one and the same level of reality.
Transdisciplinary concern the dynamics of several levels of reality. It is necessary to pass
through the disciplinary knowledge in order to discover of these dynamics. Our research
performed under the considerations of transdisciplinary because of its goal to understand the
reality, which cannot be fulfilled in the framework of disciplinary research. We use different
disciplines to address a common problem and move beyond discipline-specific approaches.
Each user has their level of reality which is confirmed by Hippel (1986) statement as each users'
insights into new product needs and possible solutions are constrained by their own reality and
real-world experience. The study is performed under the interpretivist research philosophy as it
aims to create new understandings and interpretations of an existing link between the expert
level of knowledge acquisition and lead-users in context of co-creation and related to medical
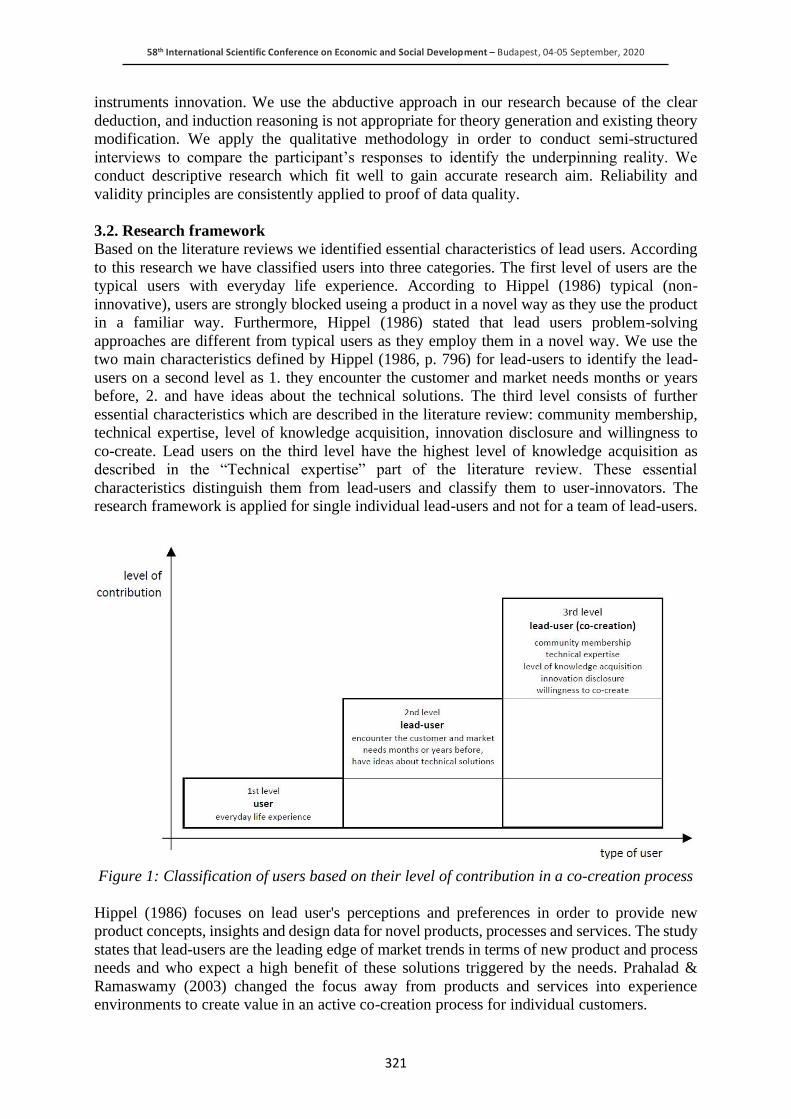
58th International Scientific Conference on Economic and Social Development – Budapest, 04-05 September, 2020
321
instruments innovation. We use the abductive approach in our research because of the clear
deduction, and induction reasoning is not appropriate for theory generation and existing theory
modification. We apply the qualitative methodology in order to conduct semi-structured
interviews to compare the participant’s responses to identify the underpinning reality. We
conduct descriptive research which fit well to gain accurate research aim. Reliability and
validity principles are consistently applied to proof of data quality.
3.2. Research framework
Based on the literature reviews we identified essential characteristics of lead users. According
to this research we have classified users into three categories. The first level of users are the
typical users with everyday life experience. According to Hippel (1986) typical (non-
innovative), users are strongly blocked useing a product in a novel way as they use the product
in a familiar way. Furthermore, Hippel (1986) stated that lead users problem-solving
approaches are different from typical users as they employ them in a novel way. We use the
two main characteristics defined by Hippel (1986, p. 796) for lead-users to identify the lead-
users on a second level as 1. they encounter the customer and market needs months or years
before, 2. and have ideas about the technical solutions. The third level consists of further
essential characteristics which are described in the literature review: community membership,
technical expertise, level of knowledge acquisition, innovation disclosure and willingness to
co-create. Lead users on the third level have the highest level of knowledge acquisition as
described in the “Technical expertise” part of the literature review. These essential
characteristics distinguish them from lead-users and classify them to user-innovators. The
research framework is applied for single individual lead-users and not for a team of lead-users.
Figure 1: Classification of users based on their level of contribution in a co-creation process
Hippel (1986) focuses on lead user's perceptions and preferences in order to provide new
product concepts, insights and design data for novel products, processes and services. The study
states that lead-users are the leading edge of market trends in terms of new product and process
needs and who expect a high benefit of these solutions triggered by the needs. Prahalad &
Ramaswamy (2003) changed the focus away from products and services into experience
environments to create value in an active co-creation process for individual customers.
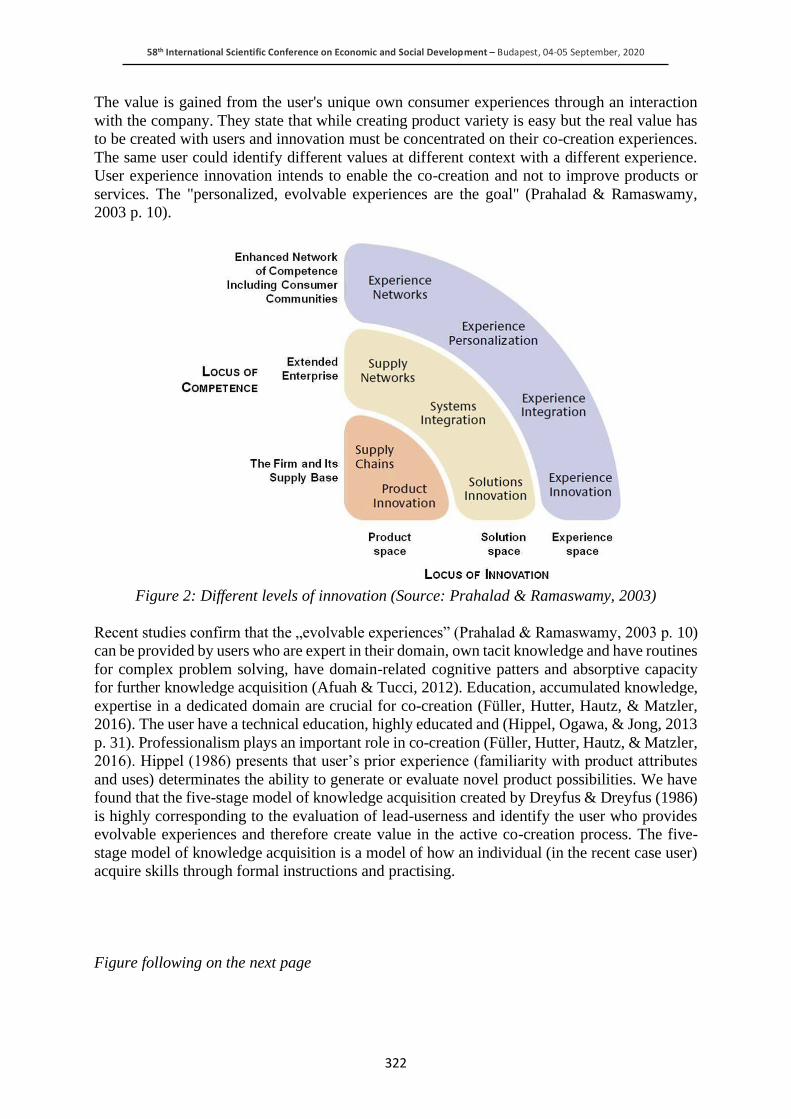
58th International Scientific Conference on Economic and Social Development – Budapest, 04-05 September, 2020
322
The value is gained from the user's unique own consumer experiences through an interaction
with the company. They state that while creating product variety is easy but the real value has
to be created with users and innovation must be concentrated on their co-creation experiences.
The same user could identify different values at different context with a different experience.
User experience innovation intends to enable the co-creation and not to improve products or
services. The "personalized, evolvable experiences are the goal" (Prahalad & Ramaswamy,
2003 p. 10).
Figure 2: Different levels of innovation (Source: Prahalad & Ramaswamy, 2003)
Recent studies confirm that the „evolvable experiences” (Prahalad & Ramaswamy, 2003 p. 10)
can be provided by users who are expert in their domain, own tacit knowledge and have routines
for complex problem solving, have domain-related cognitive patters and absorptive capacity
for further knowledge acquisition (Afuah & Tucci, 2012). Education, accumulated knowledge,
expertise in a dedicated domain are crucial for co-creation (Füller, Hutter, Hautz, & Matzler,
2016). The user have a technical education, highly educated and (Hippel, Ogawa, & Jong, 2013
p. 31). Professionalism plays an important role in co-creation (Füller, Hutter, Hautz, & Matzler,
2016). Hippel (1986) presents that user’s prior experience (familiarity with product attributes
and uses) determinates the ability to generate or evaluate novel product possibilities. We have
found that the five-stage model of knowledge acquisition created by Dreyfus & Dreyfus (1986)
is highly corresponding to the evaluation of lead-userness and identify the user who provides
evolvable experiences and therefore create value in the active co-creation process. The five-
stage model of knowledge acquisition is a model of how an individual (in the recent case user)
acquire skills through formal instructions and practising.
Figure following on the next page
58th International Scientific Conference on Economic and Social Development – Budapest, 04-05 September, 2020
323
Figure 3: Five-stage model of knowledge acquisition with the corresponding user categories
(Source: Dreyfus & Dreyfus, 1986)
The Novice uses formalised and general rules and features which is relevant to the skill. The
Novice wants to do a good job but missing any coherent sense and his performance is judged
by how well he followed the learned rules (Dreyfus & Dreyfus, 1986). The performance is
judged by the acquired application rules from the user manual of the product. Advanced
Beginner learns not by rules but by experience through practical activities. A student nurse can
distinguish by the learnt experience of the breathing sounds that suggesting oedema from those
that indicate pneumonia. Competence has more experience, the number of recognized
situational elements (cognitive patterns) is increasing. The nurse will assess the urgency of the
patient needs and will not go automatically from patient to patient (Dreyfus & Dreyfus, 1986).
The number of cognitive patterns are increased but still limited and mainly stored in a short
term memory. The level from novice to competence can be identical to the user with everyday
knowledge and life experiences. The Proficiency have sufficient knowledge and expertise to do
his task as the performer has experience about similar situations (patterns) from the past. The
number of cognitive patterns at this level in case of a doctor becomes over 60.000 and these
patterns are stored in the long term memory. On the expert level, the users have enough
experience about the product or services and store the highest number of the cognitive patterns
in the long term memory. Experts can not always give a rational explanation of their intuition
(know-how and intuition can be used as synonymous) but generally, they turn out to be correct
(Dreyfus & Dreyfus, 1986).
4. CONCLUSION
Based on our research we have understood better the problem of co-creation with different
knowledge and experience levels of users. We have found that some essential characteristics of
lead-users have a significant impact on the average quality of the entire co-creation and
innovation process. Only a limited number of lead users are able to provide such primary
important features and contribution to the innovation process. We have classified users based
on their level of contribution to the commercial success. We stated that the focus innovation
has been changed from products and services to experience environments to create value in an
active co-creation process to share evolvable experiences. In order to gain this experience
during the co-creation innovation lead users need to be expert in their domain, own tacit
knowledge, have a high number and complex cognitive patterns, highly educated and have
technical expertise. We find that the highest levels of the five-stage model created by Dreyfus
& Dreyfus (1986) are corresponding to the requirements of lead users in the experience space
described by Prahalad & Ramaswamy (2003).
5. LIMITATIONS
The investigation is made on the individual level in case of a single individual. The social and
organisational levels are not investigated. The study does not consider the fact that an accurately
composed team may contain different lead-users which members may not be suitable
58th International Scientific Conference on Economic and Social Development – Budapest, 04-05 September, 2020
324
separately. This assumption can lead to further investigation related to the composition of a
prosperous team, which includes all the crucial characteristics. An additional considerations
can be involved in further studies as different stages of the innovation process require different
skills and abilities. Our aim is to conduct a survey in a real environment in the health-care
domain related to medical instruments innovations. Further research can be performed on social
and organisation levels and also on different market fields.
LITERATURE:
1. Afuah, A., & Tucci, C. (2012). Crowdsourcing As A Solution To Distant Search. The
Academy of Management Review, 355-375.
2. Amabile, T., Conti, R., Coon, H., Lazenby, J., & Herron, M. (1996). Assessing the Work
Environment for Creativity. The Academy of Management Journal, 1154-1184.
3. Basarab, N., (2015). From Modernity to Cosmodernity: Science, Culture, and Spirituality.
New York: State University of New York Press
4. Bayus, L. B. (2013). Crowdsourcing New Product Ideas over Time: An Analysis of the
Dell IdeaStorm Community. Management Science, 226-244.
5. Birdsong, C. (2008). Perceptions of Professionalism: Interior Design Practitioners Working
for the Top 100 Firms. Interior Design, 20-34.
6. Bogers, M., Chesbrough, H., & Moedas, C. (2017). Open Innovation: Research, Practices,
and Policies. California Management Review, 5-16.
7. Brem, A., & Bilgram, V. (2015). The Search for Innovative Partners in Co-Creation:
Identifying Lead Users in Social Media through Netnography and Crowdsourcing. Journal
of Engineering and Technology Management, 40-51.
8. Brinks, V. (2019). Fun or frustration? How emotions shape user innovation processes.
Emotion, Space and Society, 100651.
9. Burkemper, A., Sarooghi, H., & Libaers, D. (2014). Examining the relationship between
creativity and innovation: A meta-analysis of organizational, cultural, and environmental
factors. Journal of Business Venturing.
10. Chesbrough, H., & Bogers, M. (2014). Explicating Open Innovation: Clarifying an
Emerging Paradigm for Understanding Innovation. New Frontiers in Open Innovation, 3-
28.
11. Dahlander, L., & Piezunka, H. (2014). Open to suggestions: How organizations elicit
suggestions through proactive and reactive attention. Research Policy, 812–827.
12. Dreyfus, E. S., & Dreyfus, E. H. (1980). A Five-Stage Model of the Mental Activities
Involved in Directed Skill Acquisition. The University of California.
13. Dreyfus, L. H., & Dreyfus, E. S. (1986). Mind Over Machine. New York: The Free Press.
14. Elsbach, K. (2003). How to Pitch a Brilliant Idea. Harvard business review.
15. Füller, J., Hutter, K., & Hautz, J. (2013). The Future of Crowdsourcing: From Idea Contests
to MASSive Ideation. MIT Press Scholarship Online.
16. Füller, J., Hutter, K., Hautz, J., & Matzler, K. (2016). The Role of Professionalism in
Innovation Contest Communities. Long Range Planning, 243-259.
17. Gürkan, C. (2014). Identification of Lead User Characteristics: The Case of Surgeons in
Turkey. European Journal of Business and Management.
18. Hienerth, C., & Lettl, C. (2011). Exploring How Peer Communities Enable Lead User
Innovations to Become Standard Equipment in the Industry: Community Pull Effects.
Journal of Product Innovation Management, 175-195.
19. Hippel, E., Ogawa, S., & Jong, J. P. (2013). The Age of the Consumer-Innovator. MIT Sloan
Management Review.
20. Hippel, v. E. (1986). Lead Users: An Important Source of Novel Product Concepts.
Management Science, 791-805.
58th International Scientific Conference on Economic and Social Development – Budapest, 04-05 September, 2020
325
21. Kirton, M. (1976). Adaptors and innovators: A description and measure. Journal of Applied
Psychology, 622–629.
22. Lackner , T. (2013). Open Innovation at Siemens AG. In S. A. Huff, M. K. Möslein,, & R.
Reichwald (Eds.), Leading Open Innovation (p. 318). Cambridge: The MIT Press.
23. Majchrzak, A., & Malhotra, A. (2013). Towards an Information Systems Perspective
and Research Agenda on Crowdsourcing for Innovation. The Journal of Strategic
Information Systems, 257- 268.
24. Mérő, L. (1990). Ways of Thinking: The Limits of Rational Thought and Artificial
Intelligence. Singapore: World Scientific Publishing Company.
25. Moore, E. W. (1970). The Professions: The: Roles and Rules. Russell Sage Foundation.
26. Piller, F., Ihl, C., & Vossen, A. (2011). Customer CoCreation: Open Innovation with
Customers. In V. Wittke, & H. Hanekop, New Forms of Collaborative Innovation and
Production on the Internet (pp. 33-61). Göttingen: Universitätsverlag Göttingen.
27. Pongtanalert, K., & Ogawa, S. (2015). Classifying user-innovators – An approach to
utilize user- innovator asset. Journal of Engineering and Technology Management, 32-39.
28. Prahalad, C., & Ramaswamy, V. (2003). The New Frontier of Experience Innovation. MIT
Sloan management review.
29. Rosing, K., Frese, M., & Bausch, A. (2011). Explaining the Heterogeneity of the
Leadership-Innovation Relationship: Ambidextrous Leadership. The Leadership Quarterly,
956-974.
30. Sandeep, G., Manju, A., & Atreyi, K. (2020). Does the Source of External Knowledge
Matter? Examining the Role of Customer Co-Creation and Partner Sourcing in Knowledge
Creation and Innovation. Information & Management.
31. Schreier, M., & Prügl, R. (2008). Extending Lead‐User Theory: Antecedents and
Consequences of Consumers' Lead Userness. Journal of Product Innovation Management,
331-346.
32. Sternberg, R., & Lubart, T. (1991). An Investment Theory of Creativity and Its
Development. Human Development, 1-31.
33. Stock, M. R., Hippel, v. E., & Gillert, L. N. (2016). Impacts of personality traits on consumer
innovation success. Research Policy, 757-769.
34. Stum, J. (2009). Kirton’s Adaption-Innovation Theory: Managing Cognitive Styles in Times
of Diversity and Change. Emerging Leadership Journeys, 66-78.
58th International Scientific Conference on Economic and Social Development – Budapest, 04-05 September, 2020
326
UNDERSTANDING POSITIVE ORGANISATIONAL CHANGE
THROUGH SOCIAL CONSTRUCT OF PSYCHOLOGICAL SAFETY:
AN INTRAPERSONAL LEVEL PERSPECTIVE
Anna Svibovich
Szechenyi Istvan University, Hungary
[email protected]; [email protected]
ABSTRACT
The postmodern perspective views an organisation as open complex system that changes and
develops through emergent interdependent collaborations between its members. This brings
into focus members’ ability of to communicate openly and effectively and raises need for a
fertile environment that encourages voice-behaviour, promotes learning, boosts innovation and
experimentation. The aim of this study is to explore the nature of psychological safety with its
underpinning theories and schools of thoughts, with particular attention to psychodynamic
approach to understanding psychology of leadership. We will look closely at personal-level
predispositions for creating and perceiving psychological safety in a leader-member exchange.
An additional objective is to determine if psychological safety influences followers hope,
efficacy, resilience, optimism.
Keywords: psychological safety, leadership, individual perceptions, psychological capital
Human organisations are an open book and their stories are constantly being co-authored.
Pasts, presents, and futures are endless sources of learning, inspiration, and interpretations.
We have a choice about what we study and what we study changes organisations.
David Cooperrider
1. INTRODUCTION
To understand why and to what extend a single member’s story plays a role in organizational
change and development, one must consider changes that occurred over the last 300 years in
viewing an organization in its entirety. In the latest postmodern perspective an organization is
seen, metaphorically speaking, as a living socially-constructed human system in which we all
participate (Lewis et al., 2008); an ever-changing space that enables human sense-making in a
work context (Weick, 1979). There is no definitive history of any organisation. All history is
composed of stories we tell each other to make sense of our experience of the world (Cantore,
Cooperrider, 2013). An organisation no longer positions itself as a separate entity (“Grand
Narrative), dominated by order and authoritative “top-down” approach to change, but rather as
“people organizing together in continually changing patterns of relationships and realities”. In
this light, organizational knowledge, problems and organizational change is likely to be seen as
a co-creation of its members through their stories, experiences, immediate perceptions, feelings
and beliefs. Organisational scientists and change theorists are looking at organisations through
the lens of transdisciplinarity and drawing inspiration from systems theory, complexity and
chaos theories, and psychology among others. The systems theory suggests an open systems
perspective, explaining that in order to survive a system needs to be responsive and actively
interact with its external environment. The main tenet of complexity theory movement, the
complex adaptive system, when applied to organisational-change theory interprets organisation
as something emerging from the relationships of its members rather than being determined by
the choice of individuals (Stacey et al., 2000). Both complexity theory and chaos theory
encompass characteristics of a new world that features rich interconnectivity, ambiguity, chaos
and rapid change. In this vocabulary, organisations are described as highly complex, nonlinear
feedback systems due to the human factor that shapes them.
58th International Scientific Conference on Economic and Social Development – Budapest, 04-05 September, 2020
327
The attributes of chaos that organisational change theorists most exploit are those of “orderly
disorder” and “self-organising” nature. Margaret Wheatley (2006) explained this self-
organising concept as “mess upon mess until something workable emerges”. The application
of this set of theories leads to a new envisioning of an organisation as dynamic collaboration,
occurring in continuously shifting configurations, where each individual member’s story,
“here-and-now” perceptions and beliefs shape the organisational change. These configurations,
a web of highly interdependent teams who need to communicate across boundaries to make
sense of their common reality (projects, goals), is a typical arrangement of work in the
knowledge era. Echoing with reality, research proves that today’s employees spend 50% more
time in collaboration than they used to do 20 years ago (Cross, Rebele & Grant, 2018). For new
type of organisations to develop and grow organically, these collaborations should feature
innovate and creative outcomes. Considering the volatile, complex and ambiguous nature of
interactions between members inside and outside an organisation, both stability and instability
are expected to occur at different points of organisational change processes. An important
discovery the scientists have made is that most exceptional creativity arises from instability; it
emerges at the edge between chaos and order. As Andersen and King put it in 1990, “creativity
is and intra-individual cognitive process, while innovation – inter-individual social process”.
The intention to innovate and associated attitudes and behaviours are directly related to the
thinking styles. For the benefit of organisational change, the members of a team should possess
different personality traits and emanate from different backgrounds. It calls for diversity in
organisational structure. All innovative and creative activities are associated with
experimentation, trial-and-error, risk-taking, and failure, i.e., they strive on “mess.” As
Tetenbaum et al. put it, “organizations need to acquire a culture in which rules are meant to be
broken and assumptions are being constantly tested.” Thus, for organisations to stand out and
truly thrive its members need to embrace the “fuzziness” of innovation process and the
messiness of experimentation with all their dark side concepts. Trial-and-error practice, risk-
taking and failure are stressful exercises for human beings. These activities push us outside the
levels of familiar, comfortable, and learned automatic behaviours. What enhances the stress is
the fact that postmodern organisation is conflictual in its nature; but the very tension that
produces conflict also produces genuinely creative fruitful ideas (Tetenbaum and Laurence).
Consequently, we are looking at a highly complex organisation in nature and function
experiencing continuous change at every level of its existence. We have been persuaded that its
members should be highly adaptive and resilient to stress, and fearless in their eagerness to
innovate and think creatively. If it makes sense in theory, the reality tells a completely different
story. Too often, knowledgeable, skilled, talented people cannot contribute what they know,
because they fail to recognise the need for their knowledge at that critical moment on the job.
The reality shows that more often people are reluctant to stand out, to speak up in fear to be
wrong, or offend a leader or a colleague, or be perceived as negative. Hiring smart, talented
individuals is not enough. For knowledge work to flourish, people need an environment where
they feel they are able to share their knowledge, they should be able to work together. The very
first recognition of the need for psychological safety “to help people cope with the uncertainty
and anxiety of organisational change” goes back to the early 1960s. MIT professors Edgar
Schein and Warren Bennis in their research on organisational change noted that psychological
safety helps people overcome “defensiveness” and “learning anxiety” at work, and allows them
to focus on achieving common goals rather than self-protection. In the 1990s Amy Edmondson
introduced and tested an idea that psychological safety is a group-level phenomenon. In a group
with high levels of psychological safety, people feel comfortable expressing and being
themselves, and what is essential today’s complex innovation-motivated organisations, people
feel safe to speak up, share concerns and mistakes without fear of being punished or
embarrassed.
58th International Scientific Conference on Economic and Social Development – Budapest, 04-05 September, 2020
328
It is reasonable to assume that psychological safety penetrates organisational reality at every
point, and to different extent is present during these interactions. Further we will investigate the
attributes of psychological safety, study the underpinning theories, and will look into the
composing blocks of this group-level phenomena: leadership, group members, personal
perceptions and beliefs. We will discuss whose responsibility it is to create psychological safety
in a team. What role does leader’s personality play in establishing the climate of psychological
safety? What role do members’ personal experiences, stories and beliefs play in assessing,
perceiving, the level of psychological safety in their teams? Finally, we will evaluate how the
perception of psychological safety climate affects members’ self-efficacy (confidence), hope,
optimism and resilience, a.k.a. state-like constructs of psychological capital.
2. THEORETICAL BACKGROUND
2.1. Underpinning theories of psychological safety
In this section we will consider different definitions of psychological safety and reflect on the
schools of thoughts to which this factor of organisational science belongs. In “The power of
Appreciative Inquiry”, Whitney et al. write: “It seems that psychologists like organisational
development consultants, have recognised that human systems move in the direction of what
they study and that to contribute constructively to human and society well-being we need to
develop a vocabulary of joy, hope and health. (Whitney et al. 2010). In the last couple of
decades, a huge advancement has been made in the “science and scholarship of the positive”,
including the development of emotional intelligence (Goleman et al. 2004), advances in
appreciative inquiry (Cooperrider et al. 2004), studies of positive emotions in organisations
(Fredrickson, 2003), and the science of happiness (Seligman, 2002). All these theories and
schools of thought reside under the umbrella of Positive Organisational Scholarship (POS),
which focuses on “dynamics in human organisations that lead to developing human strength,
producing restoration and resilience, fostering vitality and cultivating extraordinary
individuals” (http://www.centerforpos.org). Positive psychology is suggested as part of
psychological understanding and practice. Some theorists trace it back to the thoughts of
Aristotle, who “believed that there was a unique daimon or spirit within each of us; acting in
accordance with this daimon leads one to happiness.” (Boniwell et al., 2006). Gergen draws
attention to the notion held by another philosopher of mind, Descartes: “the more you know
about the mind, the more you know about human beings” (Cooperrider et al.). More recent
antecedents of positive psychology can be found in the domain of humanistic psychology (its
most famous theorist, Abraham Maslow), that concerns itself with human life fullness,
including meanings, values, freedom, human potential and self-actualisation. The founding
fathers of positive psychology are Martin Seligman and Mihaly Csikszentmihalyi (1990s, early
2000s). Although, almost 10 years before they coined the term “positive psychology”, David
Cooperrider wrote an integrative review of psychology and human sciences, exploring the role
of positive (emotions, language, learning, culture, etc.) as it relates to human systems
development. Cooperrider particularly recognises the role of the new positive language that
“gives life to human systems”, as in “words enable worlds”. (Cantore, Cooperrider, 2013).
Alongside existing theories, there is still room for game-changing practices and insights.
Naming Appreciative Inquiry, which emphasizes a view of human systems as a dialogic and
meaning-making system, and is described as “co-operative co-evolutionary search for the best
in people, their organisations, and the world around them… it involves the art and practice of
asking questions that strengthen a system’s capacity to apprehend, anticipate and heighten
positive potential” (Cantore, Cooperrider, 2013). The AI theory owns much to social
constructivism theory – an approach to human science which replaces the individual with
relationships as the locus of knowledge. In the domain of the AI, change is understood as an
implicit part of the very first question we ask, as part of things people talk about and think
58th International Scientific Conference on Economic and Social Development – Budapest, 04-05 September, 2020
329
about, things we discover and learn. The key element of AI is the notion of generativity, or
“generative capacity”, borrowed from social constructionism. Gergen defines it as “capacity to
challenge the guiding assumptions of the culture, to raise fundamental questions regarding
contemporary social life, to foster reconsideration of what which is taken for granted and therby
furnish new alternatives for social actions”. (Gergen, “Towards Generative Theory”). The
common ground these schools of thought share is the belief that human beings can and deserve
to flourish in organisational contexts (Seligman&Csikszentmihalyi, 2000), focus on how to use
strengths to grow new ways of living, talk about the positive, and encourage the development
of positive language to co-create organisational change. What we conclude from the above
mentioned is that an organisational science is going through its Renaissance, in a way that it is
re-discovering the “beauty” of an individual and his voice inside an organisation. The spotlight
of attention is now on members abilities to interact with each other with an inclination for
positive change.
2.2. Psychological safety
When asked to define “psychological safety”, people develop the following statements:
psychological safety is:
• ‘Ability to be whole self’;
• ‘Belonging: are people welcoming and warm, includes diversity, very open place, you can
be yourself’;
• ‘A place, both physically and mentally, where all individuals feel comfortable being
themselves, sharing thoughts and opinions’;
• ‘The belief, perception how team members think they are viewed by others in the group’;
• ‘Tool belt to tap into when something triggers’;
• ‘Emotional safety’;
• ‘Where I can feel safe to share my opinion or express my being in a space or environment’;
• ‘Vulnerability’;
• ‘A place where there’s a foundation of respect and value as a human being regardless of
differences’;
• ‘Feeling welcomed to share thoughts and feelings without fear of judgement or criticism’;
• ‘Mechanism to get back to a safe place when something triggers’;
• ‘Ability to feel comfortable to vulnerable sharing’;
• ‘Safe place to share’;
• ‘The freedom to take appropriate risks and be supported if you fail’;
• ‘A sense of belonging in a community’;
• ‘Understanding there are external and internal safety factors and being able to express
yourself comfortably’;
• ‘The opposite of the current heightened state where everyone feels attacked’.
Psychological safety appears in early discussion on organisational change in 1965. Edgar
Schein and Warren Bennis argued that psychological safety is essential for making people feel
secure and capable of change. In 1993 Schein wrote that psychological safety helps people to
overcome learning anxiety and defensiveness, that occurs when they are presented with data
that contradict their expectations or hopes. Similarly, in 1990 William Kahn presented the
results of quantitative studies showing that psychological safety enables personal engagement
at work by affecting individuals’ willingness to “employ or express themselves physically,
cognitively, and emotionally during performances”. Kahn introduced a defining characteristic
of psychological safety: when relationships withing the group are characterised by trust and
respect people are more likely to believe they will be given the benefit of a doubt.

58th International Scientific Conference on Economic and Social Development – Budapest, 04-05 September, 2020
330
The devoted researcher of psychological safety and learning in teams, and the author of
“Fearless organization”, Amy C. Edmondson, defines psychological safety as “the belief that
the work environment is safe for interpersonal risks, and risky behaviors, like asking for help
or admitting a failure, will not be punitive”. The last decade demonstrates the upsurge of interest
to the psychological safety. Among most recognisable reasons are:
• Generational: Millennials have become the major workforce, who do not recognise
hierarchy, expect inclusion in organisational decision-making processes, wired for
networking and collaboration, creative and enthusiastic;
• Globally expanded competition: innovation and creativity cannot thrive in environment
dominated by fear and silence;
• Societal: the movements such as #MeToo, #BlackLifeMatters encourages voice behaviours,
the call out for bad actors;
• Anxiety upsurge (25% of American students are on anti-anxiety medication)
• School dropouts (every 26 seconds a student drops out of high school in the US)
In this context, there is a risk of misunderstanding what psychological safety is and what it is
not.
Psychological safety does not equal trust:
• As Edmondson explains, trust is a belief that one person has about another, while
psychological safety is a belief about a group norm, how group members think they are
viewed by others in the group.
Having the psychological safety climate does not meant that everybody is nice and agreeing
with each other:
• It is not about “unequivocal praise and unconditional support”. On the contrary, it is about
candor and willingness to engage in productive conflict, it enables people candidly express
their concerns.
Psychological safety is not a personality factor:
• It refers to the work climate, where people with different personalities can openly express
their thoughts and ideas regardless personal traits.
Psychological safety is not about lowering performance standards.
Low Standards High Standards
High Psychological Safety Comfort Zone Learning&High
Performance Zone
Low Psychological Safety Apathy Zone Anxiety Zone
Figure 1: How Psychological Safety Relates to Performance Standards
(Source: Emy C. Edmondson, “Fearless organization”, p. 18)
Another prominent scholar of leadership, innovation, organisational change, and the author of
“Four Stages of Psychological Safety”, Timothy R. Clark, explains the factor of psychological
safety through the four stages of its development.
Figure following on the next page
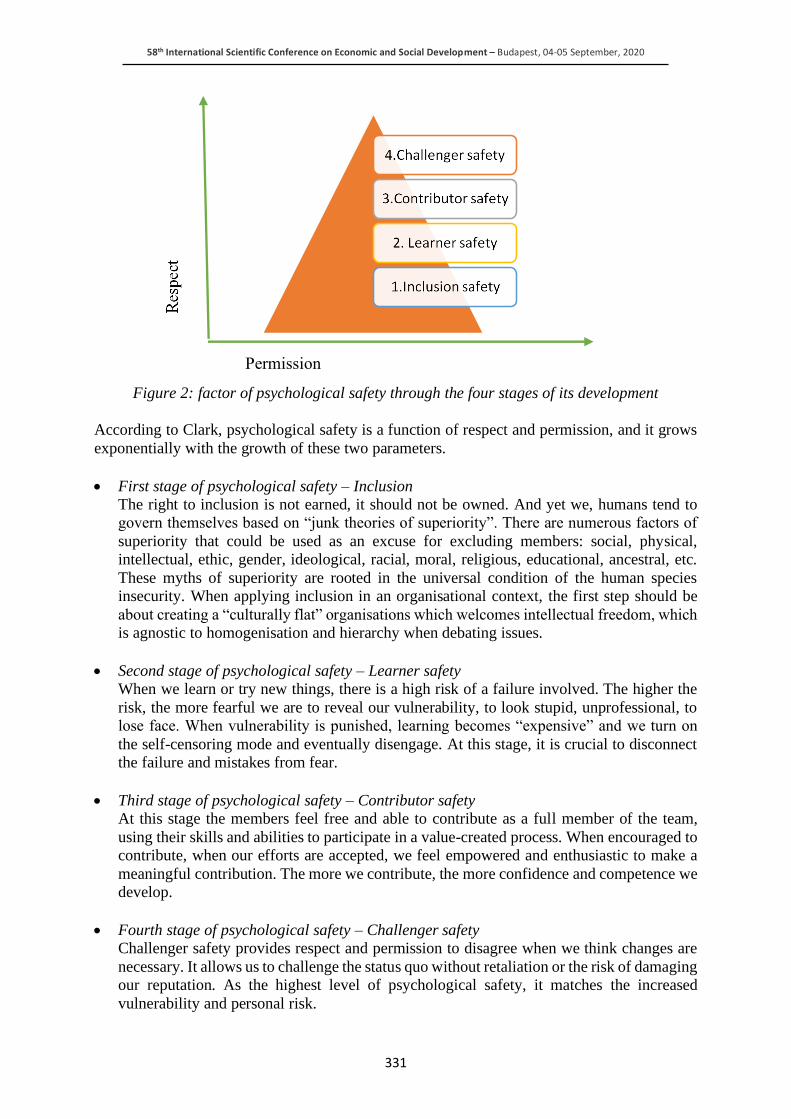
58th International Scientific Conference on Economic and Social Development – Budapest, 04-05 September, 2020
331
Figure 2: factor of psychological safety through the four stages of its development
According to Clark, psychological safety is a function of respect and permission, and it grows
exponentially with the growth of these two parameters.
• First stage of psychological safety – Inclusion
The right to inclusion is not earned, it should not be owned. And yet we, humans tend to
govern themselves based on “junk theories of superiority”. There are numerous factors of
superiority that could be used as an excuse for excluding members: social, physical,
intellectual, ethic, gender, ideological, racial, moral, religious, educational, ancestral, etc.
These myths of superiority are rooted in the universal condition of the human species
insecurity. When applying inclusion in an organisational context, the first step should be
about creating a “culturally flat” organisations which welcomes intellectual freedom, which
is agnostic to homogenisation and hierarchy when debating issues.
• Second stage of psychological safety – Learner safety
When we learn or try new things, there is a high risk of a failure involved. The higher the
risk, the more fearful we are to reveal our vulnerability, to look stupid, unprofessional, to
lose face. When vulnerability is punished, learning becomes “expensive” and we turn on
the self-censoring mode and eventually disengage. At this stage, it is crucial to disconnect
the failure and mistakes from fear.
• Third stage of psychological safety – Contributor safety
At this stage the members feel free and able to contribute as a full member of the team,
using their skills and abilities to participate in a value-created process. When encouraged to
contribute, when our efforts are accepted, we feel empowered and enthusiastic to make a
meaningful contribution. The more we contribute, the more confidence and competence we
develop.
• Fourth stage of psychological safety – Challenger safety
Challenger safety provides respect and permission to disagree when we think changes are
necessary. It allows us to challenge the status quo without retaliation or the risk of damaging
our reputation. As the highest level of psychological safety, it matches the increased
vulnerability and personal risk.
Permission
58th International Scientific Conference on Economic and Social Development – Budapest, 04-05 September, 2020
332
2.2.1. Research to date
The existing empirical research confirms the relationships between psychological safety and
job engagement, organisational commitment and creative work involvement (Kahn, 1990).
More recently Kark and Carmeli (2009) explored the compounds of psychological safety,
namely feelings of vitality, which impacts an individual’s involvement in creative work.
Siemsen et al. (2009) examined the effects of psychological safety on knowledge sharing and
argued that the level of confidence in knowledge would moderate this relationship. The growing
stream of research examines how psychological safety affects voice behaviours, defined as
upward-directed, promotive verbal communication. Liang et al. identified two types of voice
behaviours - promotive and prohibitive. Promotive voice is used for expressing how to improve
work practices and procedures for the benefit of an organisation (Van Dyne & LePine 1998).
Whereas prohibitive voice is necessary for expressing concerns about existing impending
practices, incidents or behaviours that may harm an organisation. The researchers established a
direct positive effect of psychological safety on voice, pointing out that psychological safety is
strongly related to prohibitive voice (Liang et al. (2012). To shed light on employees’ lack of
voice, Edmondson and Detert (2011) launched a series of studies that tested how implicit
theories of voice - specific belief about when and why speaking up is risky - explain significant
variance in speaking-up behaviours. Another group of studies at the organizational level of
analysis explored the relationships between psychological safety, commitment-based human
resources practices, social capital, high-quality relationships, climate for initiative, and firm
performance. (Collins & Smith, 2006, Baer & Frese 2003). Carmeli et al. (2007, 2009) focused
on psychological safety and learning from failure. Cataldo et al. (2009) examined psychological
safety implications for culture change. At the group-level of analysis, the research includes
studies of direct, mediating and moderating roles for psychological safety in team learning and
knowledge creation, effective communication, innovation, and performance (Edmondson 1996,
1999; Huang et al. 2008; Tucker et al. 2007; Choo et al. 2007; Mu & Gnyawali 2003). We have
seen that the biggest obstruction in the growth of psychological safety in teams is fear. It can
be fear to be judged, punished, embarrassed; fear of shame, or guilt of accidentally offending
another group member. Below we will draw on some basic facts from neurobiology of brain,
that will help us throw some light on why fear and likewise reactions make us behave like we
do in certain situations.
2.2.2. Neuroscience behind psychological safety
Before proceeding our consideration on how an individual’s unique experiences shape his/her
perception of psychological safety, we will briefly discuss the commonalities we as species
share when it comes to reactions to changes in the environment.
2.2.2.1. Fear, anxiety, aggression
The part of the brain that has been most actively called for witnesses when it comes to
explaining the effect of fear on human behaviour is the amygdala. What is less frequently heard,
but what considerable evidence implicates is that this part of the brain is also involved in feeling
anxiety and generating aggression. Another notable fact about the amygdala is that it is
particularly sensitive to ambiguity, or unsettling social circumstances. Being unsure of your
place is unsettling (Sapolsky “Behave”, 2017). As our basic need, we long to belong, and when
we are deprived of this possibility, the anxiety raises and throws us into a defensive mode. In
studies exploring the neurobiology of conforming, subjects who stick to their answer when the
majority disagrees, also showed amygdala activation. Speaking in layman’s terms, it is highly
stressful to disagree. Different findings suggest that “amygdala injects implicit distrust and
vigilance into social decision making” (Sapolsky, 2017). To paraphrase, we have inborn
altruistic behaviours and trust but through negative social experiences we learn the vigilance
58th International Scientific Conference on Economic and Social Development – Budapest, 04-05 September, 2020
333
and distrust. The unexpected results were shown in another study that confirmed that the
amygdala is responsive to positive stimuli when the value of the reward is shifting. As Sapolsky
explains that “it is not about the pleasure or experiencing pleasure, it is about the uncertain,
unsettled yearning for a potential pleasure, the anxiety and fear and anger that the reward may
be smaller than anticipated, or may not even happen.” (Sapolsky, “Behave”, 2017, p. 40). Thus,
uncertainty of change sparks in us both fear and excitement about the unknown future. If guided
right and maintained carefully, this could be the fuel that drives our innovative behaviours. The
fact that is particularly curious for the framework of our research is that the amygdala helps to
mediate both innate and learned fear. It has been confirmed through series of experiments that
fear can be engineered, or a false fear can be conditioned. The good news is that this process is
reversible. Fear conditioning occurs unconsciously, the “fear extinction” though, requires active
learning, it requires awareness. Let us introduce another important “player”. The frontal cortex
is the part of the brain that separates us from other apes, it is more complexly wired and the last
one to fully mature. Among its multiple functions, there is working memory, strategic
knowledge organisation and decision-making, gratification postponement, long-term planning,
regulation of emotion, and reining in impulsivity (J. Dalley et al. 2011). A remarkable fact for
leaders dealing with multi-generational workforce - the frontal cortex gets “fully online” only
when people reach their midtwenties (Sapolsky, “Behave”, 2017). Not only the frontal cortex
is responsible for cognitive functioning, this part of the brain processes social situations and
plays the central role in social behaviour. The more socially active we are, the more developed
our frontal cortex becomes. Being altogether a paragon of rationale and control in the brain, the
prefrontal cortex contains, among multiple others, two regions that are important for our
discussion and that influence our decision making – the cognition and emotion. And these two
regions constantly interact and work in a collaborative relationship. The amygdala is a reactive
initial response, while the frontal cortex stops to analyse the situation and do the “harder right
thing”. Finally, the frontal cortex mediates fear extinction. The experiment that perfectly
demonstrates this exhibits a situation when a subject in a game with two other people is made
believe that she is left out. Social isolation activates the subject’s amygdala and other brain
regions that help process physical pain (periaqueductal gray) and an anatomical picture of
anger, anxiety, pain, disgust, sadness (insula). After the subject turns on rational thinking –
“This is just a stupid game; I have friends; my dog loves me” – the amygdala et al. quiet down.
(Sapolsky, “Behave”, p. 59). Can we regulate emotion through thought then? If yes, what
strategies are effiecient? According to James Gross, who researched this topic, “antecedent”
strategies work better than “response”-focused. This knowledge is at the core of cognitive
behavioural therapy (CBT), which provides the tools to reappraise circumstances that evoke
anxiety. Gross has shown that using these tools for treating social anxiety, one can successfully
reappraise his/her beliefs (Sapolsky, 2017). Harvard psychologist Daniel Wegner has explained
the affect of stress on human behaviour in his book “How to think, say or do precisely the worst
thing on any occasion”. The main takeaway is that during stress, distraction, or heavy cognitive
load we lose control over two streams of information processing – the first one, labels an act as
being very important, and second one, decides whether or not to do it.
2.2.2.2. Stress, or famous fight-or-flight response
A “stressor” is anything that disrupts homeostatic balance. When facing a critical event, our
brain activates the stress response. The basic “fight-or-fligh” response is ancient physiology,
found in mammals, birds, fish and reptiles. But what is not ancient, Sapolsky notices, is that in
“smart, socially sophisticated, recently evolved primates”, a stressor expands beyond a physical
challenge to homeostasis (Sapolsky, “Behave”, p. 126). We have developed an anticipatory
stress response. As a result, if one is constantly but incorrectly convinced that he/she is about
to lose balance, one becomes an anxious, neurotic, paranoid, or hostile primate who is
58th International Scientific Conference on Economic and Social Development – Budapest, 04-05 September, 2020
334
psychologically stressed. Activating the stress response too often, too long leads to multiple
health issues, suppresses immunity. Interestingly, there exists stress that we humans love – the
stress that is mild and transient and occurs in a benevolent context (a ride on a roller-coaster).
Sapolsky calls this “optimal amount of stress” being engaged and challenged, playing, being
stimulated. “The core of psychological stress is loss of control and predictability. But in
benevolent settings we happily relinquish control and predictability to be challenged by the
unexpected,” – argues the author. Applied in an organisational change context and the topic at
hand, this “benevolent settings” that help us tolerate unpredictability and lack of control, is
psychological safety climate. Stress makes it easier to learn a fear association and makes it
harder to unlearn a conditioned fear association. Stress compromises our working memory,
impairs our ability to shift attention between tasks, makes us perseverative (running on
automatic mode, being habitual). During sustained stress we are more fearful, our risk assessing
skills are low, we are more prone to rapid, reactive aggression. Another remarkable fact is called
“stress-induced displacement aggression”, if put simply means that lashing out at your
colleague, family member or anyone nearby, when in distress reduces your own stress levels.
Other studies show that stress also makes us more biased towards selfishness. Jeffrey Mogil,
2006, also proved that stress decreases empathy towards “strangers”. It may not come as
surprise, that male and female response to stress are different. Shelley Taylor framed the female
stress response as being more about “tend and befriend”. The fact that speaks for diversity in
the workplace. The main takeaway from this segment is that stress can disrupt cognition,
impulse control, emotional regulation, decision making, empathy and prosociality (Sapolsky,
“Behave”, p. 134). Going back to our discussion of organisations, we conclude that stressed,
fear-stricken team members will not be capable of creative, innovative work and any healthy
productive collaboration unless they operate in a benevolent environment, feel psychologically
safe.
3. PSYCHOLOGICAL SAFETY AND HUMAN FACE OF LEADERSHIP
It feels safe to declare that psychological safety is everybody’s responsibility, and yet there is
no denying that stewardship of psychological safety in a team is in leader’s hands. Ethical,
authentic, inclusive leaders have been rated as the most effective in the process of developing
and maintaining of psychological safety climate through promotion of voice behaviours.
Unfortunately, this type of leadership is still rare. It was a regular day of teleworking when
David called Jeannine, the team assistant, for a word of advice. It has been a year since David
joined their small legal team, the human resources justice unit of an international organisation.
From the beginning David earned a reputation of a respectful and diplomatic communicator,
attentive listener and a helpful colleague. Normally, David didn’t give an impression of
someone who would lose his temper or get carried away by emotions, but Jeannine knew
something was wrong this time. Turned out that David forgot to send out an email in due time.
Neither his mistake would lead to major consequences, nor was David unable to fix it, but he
was terrified to bring the news to the team supervisors. Jeannine, who joined the team half a
year before David, was familiar with the feeling. She had already experienced first-hand the
inconsistency of their team leads’ reactions to erring, intimidating, mostly tell-mode
communication, lack of guidance and clarity in work tasks combined with splashes of optimism.
“I have never doubted my professionalism before! Now I am second-guessing my every move
in a fear to make a mistake, and then it happens anyway. It’s so unlike me!” – David said. Joined
by another colleague, the three of them spent an hour sharing their experiences, encouraging
and supporting each other. The sad and fundamental truth about this and suchlike scenarios is
that even when team members are aware of the problem the odds are, they will stay reticent.
On the surface the work flow runs uninterrupted, the team members and supervisors would
exchange niceties, but what remains unspoken is the need for a pep-talk from a support group
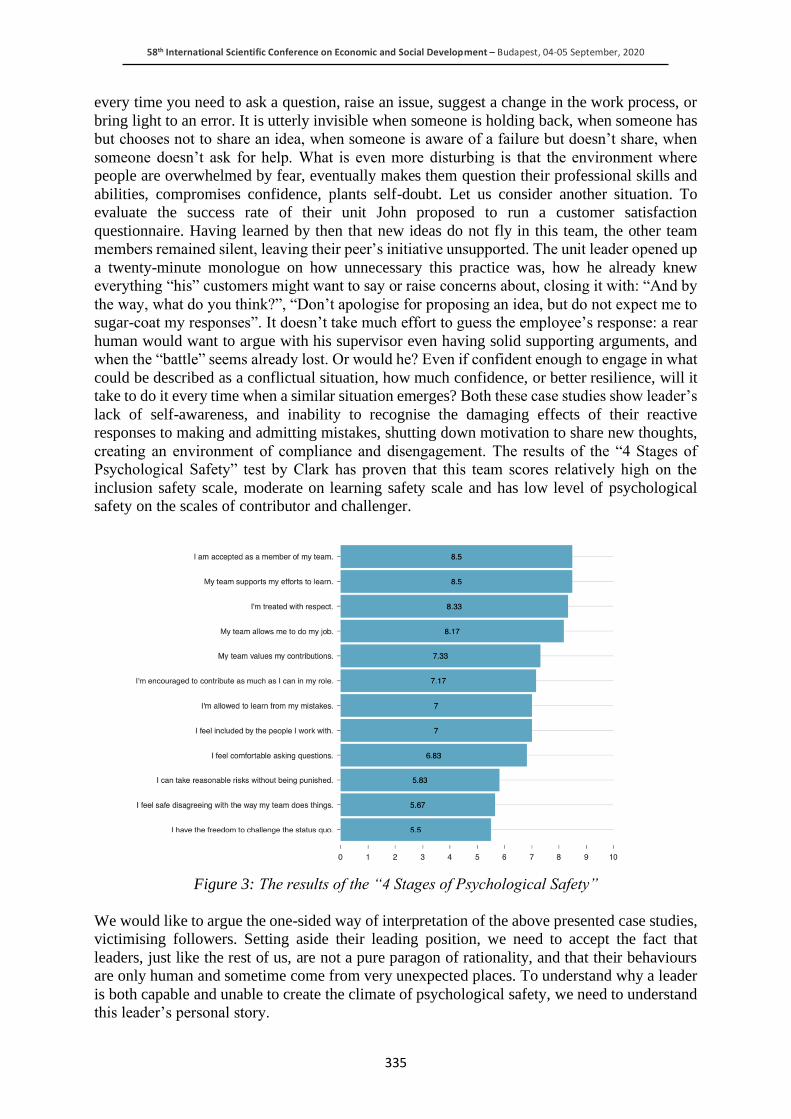
58th International Scientific Conference on Economic and Social Development – Budapest, 04-05 September, 2020
335
every time you need to ask a question, raise an issue, suggest a change in the work process, or
bring light to an error. It is utterly invisible when someone is holding back, when someone has
but chooses not to share an idea, when someone is aware of a failure but doesn’t share, when
someone doesn’t ask for help. What is even more disturbing is that the environment where
people are overwhelmed by fear, eventually makes them question their professional skills and
abilities, compromises confidence, plants self-doubt. Let us consider another situation. To
evaluate the success rate of their unit John proposed to run a customer satisfaction
questionnaire. Having learned by then that new ideas do not fly in this team, the other team
members remained silent, leaving their peer’s initiative unsupported. The unit leader opened up
a twenty-minute monologue on how unnecessary this practice was, how he already knew
everything “his” customers might want to say or raise concerns about, closing it with: “And by
the way, what do you think?”, “Don’t apologise for proposing an idea, but do not expect me to
sugar-coat my responses”. It doesn’t take much effort to guess the employee’s response: a rear
human would want to argue with his supervisor even having solid supporting arguments, and
when the “battle” seems already lost. Or would he? Even if confident enough to engage in what
could be described as a conflictual situation, how much confidence, or better resilience, will it
take to do it every time when a similar situation emerges? Both these case studies show leader’s
lack of self-awareness, and inability to recognise the damaging effects of their reactive
responses to making and admitting mistakes, shutting down motivation to share new thoughts,
creating an environment of compliance and disengagement. The results of the “4 Stages of
Psychological Safety” test by Clark has proven that this team scores relatively high on the
inclusion safety scale, moderate on learning safety scale and has low level of psychological
safety on the scales of contributor and challenger.
Figure 3: The results of the “4 Stages of Psychological Safety”
We would like to argue the one-sided way of interpretation of the above presented case studies,
victimising followers. Setting aside their leading position, we need to accept the fact that
leaders, just like the rest of us, are not a pure paragon of rationality, and that their behaviours
are only human and sometime come from very unexpected places. To understand why a leader
is both capable and unable to create the climate of psychological safety, we need to understand
this leader’s personal story.
58th International Scientific Conference on Economic and Social Development – Budapest, 04-05 September, 2020
336
3.1. Psychodynamic issues of leader-member relationships
Scholars and leaders who are seeking to understand the complexities of leader-member
exchange, become more curious about the hidden undercurrents that affect human behaviours.
Analysing both organisational leadership of unprecedented success (Richard Branson of Virgin,
Steve Jobs of Apple, Mark Zuckerberg of Facebook) and crashing failures (Jeffrey Skilling of
Enron, Bernie Madoff and Rajat Gupta of MacKinsey), scholars and practitioners now turn to
the systems psychodynamic approach as a new paradigm for analysing the dark side as well as
the atypical success associated with context-specific leadership practices. With the focus on the
dynamics of human behaviour, this approach effectively demonstrates that people are complex,
unique, and paradoxical beings who differ in their motivation patterns (Manfrend, Florent-
Treacy, Krotov, 2013). The psychodynamic paradigm adapted and broadened theories of
psychoanalysis from Freud and thinkers in other fields to encompass the hidden and overt
dynamics that influence the behaviour of groups and organisations. Applied to leadership, this
approach provides valuable frameworks and concepts for studying its various aspects. It
considers what is “within”: the inner world of individuals, including their emotions;
relationships between individuals: and the “reality” that is created by the dynamics of group
(Neumann&Hirschhorn, 1999). The psychodynamic orientation offers a practical way of
recognising how organisations really function by making sense of leaders’ and executives’
deeper “wishes and fantasies” and showing how these “wishes and fantasies” affect their
behaviours at work. Back in 1985 McDougall offered a perfect metaphor to describe the
concepts of psychodynamic paradigm. He referred to it as the “inner theatre”, which is filled
with people who have influenced us, shaped our experiences of life. These early experiences
create very unique response patterns, certain behaviours, which we later “transfer” to different
contexts and repeat with different people (Manfrend, Florent-Treacy, Krotov, 2013). Within the
“script” of person’s inner theatre, certain themes develop and evolve over time. These themes
– or “core conflictual relationship themes” - reflect the predominance of certain inner wishes
that contribute to our unique personality style and translate into consistent patterns by which
we relate to others (Luborsky & Crits-Cristoph, 1998). As Manfred et al. notices, “we project
our wishes on others and then, based on those wishes, rightfully or wrongly, anticipate how
others will react to us; then we react not to their actual reactions but to their perceived
reactions.” Sadly, the life-scripts, written in childhood, often become ineffective in adult life.
A special place the psychodynamic theory gives to motivational need systems, considering
them as operational code that drives personality (Lichtenberg, 1991; Lichtenberg and Schonbar,
1992). The need systems that particularly closely relate to life in organisations are the
attachment/affiliation (Bowlby, 1969), and the exploration/ assertion (Bandura, 1989; White,
1959). Applying the framework of psychological safety by Clark, ideally, we should satisfy
these needs moving to the next stage of psycholgocial safety on the Respect/Permission scale.
Depending on the way an organisation meets these needs, individuals assert their desire to be a
part of a community, their need for creativity and innovation. Manfred et al. in their discussion
of psychodynamic concepts outline the four premises of the clinical paradigm: 1) the logical
explanation behind every human act; 2) the “blind spots” to human awareness; 3) the ability to
regulate and express emotions at the core of assessing personality; 4) human development is an
inter- and intrapersonal process. Within the paradigm of psychodynamic approach, leader-
follower interactions are subject to influence of different transferential processes: mirroring
and idealising (Kets de Vries 2011; Kohut, 1971, 1985), narcissism (Freud, 1914; Kernberg,
1975; Kets de Vries, 1989; Kets de Vries & Miller, 1985; Kohut 1971, 1985; Maccoby, 1976),
identification with the aggressor (Freud, 1966; Kets de Vries, 2009a), folie á deux, or shared
madness, (Kets de Vries, 1979, 2001b). During and after the World War II, Freud’s
psychoanalysis raised a wave of interest among organisational scholars across Europe for
application of aspects of clinical paradigm to the workplace.
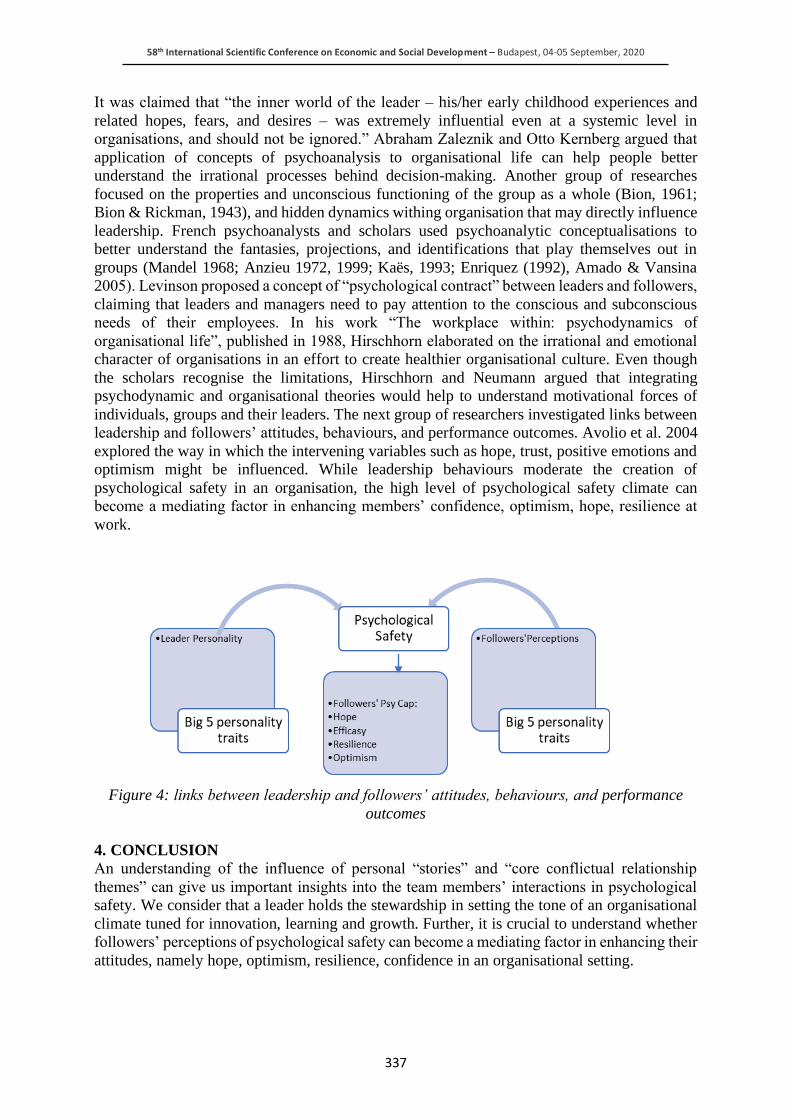
58th International Scientific Conference on Economic and Social Development – Budapest, 04-05 September, 2020
337
It was claimed that “the inner world of the leader – his/her early childhood experiences and
related hopes, fears, and desires – was extremely influential even at a systemic level in
organisations, and should not be ignored.” Abraham Zaleznik and Otto Kernberg argued that
application of concepts of psychoanalysis to organisational life can help people better
understand the irrational processes behind decision-making. Another group of researches
focused on the properties and unconscious functioning of the group as a whole (Bion, 1961;
Bion & Rickman, 1943), and hidden dynamics withing organisation that may directly influence
leadership. French psychoanalysts and scholars used psychoanalytic conceptualisations to
better understand the fantasies, projections, and identifications that play themselves out in
groups (Mandel 1968; Anzieu 1972, 1999; Kaës, 1993; Enriquez (1992), Amado & Vansina
2005). Levinson proposed a concept of “psychological contract” between leaders and followers,
claiming that leaders and managers need to pay attention to the conscious and subconscious
needs of their employees. In his work “The workplace within: psychodynamics of
organisational life”, published in 1988, Hirschhorn elaborated on the irrational and emotional
character of organisations in an effort to create healthier organisational culture. Even though
the scholars recognise the limitations, Hirschhorn and Neumann argued that integrating
psychodynamic and organisational theories would help to understand motivational forces of
individuals, groups and their leaders. The next group of researchers investigated links between
leadership and followers’ attitudes, behaviours, and performance outcomes. Avolio et al. 2004
explored the way in which the intervening variables such as hope, trust, positive emotions and
optimism might be influenced. While leadership behaviours moderate the creation of
psychological safety in an organisation, the high level of psychological safety climate can
become a mediating factor in enhancing members’ confidence, optimism, hope, resilience at
work.
Figure 4: links between leadership and followers’ attitudes, behaviours, and performance
outcomes
4. CONCLUSION
An understanding of the influence of personal “stories” and “core conflictual relationship
themes” can give us important insights into the team members’ interactions in psychological
safety. We consider that a leader holds the stewardship in setting the tone of an organisational
climate tuned for innovation, learning and growth. Further, it is crucial to understand whether
followers’ perceptions of psychological safety can become a mediating factor in enhancing their
attitudes, namely hope, optimism, resilience, confidence in an organisational setting.
58th International Scientific Conference on Economic and Social Development – Budapest, 04-05 September, 2020
338
LITERATURE:
1. Avolio, B.J., Gardner, W.L. (2005). “Authentic leadership development: getting to the root
of positive forms of leadership”. The Leadership Quarterly 16, 315-338.
2. Carmeli A. 2007. Social Capital, Psychological Safety And Learning Behaviours From
Failure In Organisations. Long Range Plan. 40(1):30–44
3. Carmeli A, Brueller D, Dutton JE. 2009. Learning behaviors in the workplace: the role of
high-quality interpersonal relationships and psychological safety. Syst. Res. Behav. Sci.
26:81–98.
4. Choo A, Linderman K, Schroeder RG. 2007. Social and method effects on learning
behaviors and knowledge creation in six sigma projects. Manag. Sci. 53(3):437–50
5. Csikszentmihalyi M (1996) Creativity: flow and the psychology of discovery and invention.
Harper Collins, New York
6. Edmondson AC. 1996. Learning from mistakes is easier said than done: group and
organizational influences on the detection and correction of human error. J. Appl. Behav.
Sci. 32(1):5–28
7. Edmondson AC. 1999. Psychological safety and learning behavior in work teams. Adm.
Sci. Q. 44(2):350–83
8. 7.Edmondson AC. 2004. Psychological safety, trust, and learning in organizations: a group-
level lens. In Trust and Distrust in Organizations: Dilemmas and Approaches, ed. RM
Kramer, KS Cook, pp. 239–72. New York: Russell Sage
9. Edmondson, AC. (2019). The fearless organisation: creating psychological safety in the
workplace for learning, innovation and growth. John Wiley & Sons, Hoboken, New Jersey
10. Fredrickson, B.L., (2004). The broaden-and-build theory of positive emotions. The Royal
Society, 1367-1377.
11. Heifetz, R. (1994). Leadership without easy answers. Cambridge, MA: Belkin Press of
Harvard University Press.
12. Kahn WA. 1990. Psychological conditions of personal engagement and disengagement at
work. Acad. Manag. J. 33:692–724
13. Lewis, S., Passmore, J., & Cantore, S. (2008). Appreciative inquiry for change
management: using AI to facilitate organisational development. London: Kogan Page.
14. Lewis, S. (2011). Positive psychology at work, 1st edition. Chichester, UK: Wiley-
Blackwell.
15. Linley, P.A., Joseph, S., Harrington, S. & Wood, A.M. (2006). Positive psychology : past,
present, and (possible) future.
16. Manfred, F.R., Kets de Vries, Florent-Treacy, E., Krotov, K. (2013). Psychodynamic Issues
In Organisational Leadership.
17. Sapolsky, R. (2017). Behave: The Biology Of Humans At Our Best And Worst. London:
Penguin Random House.
18. Seligman, M.E.P. (2002). Authentic happiness: using the new positive to realise your
potential for lasting fulfillment. New York: Free Press
19. Seligman, M.E.P.& Csikszentmihalyi, M. (2000). Positive psychology: an introduction.
American Psychologist, 55 (1), 5.
20. Schein EH, Bennis W. 1965. Personal and Organizational Change Through Group Methods.
New York: Wiley
21. Weick, K. (1995) Sensemaking in Organizations. London: Sage.
22. Whitney, D., Trosten-Bloom, A., & Cooperrider, D. (2010). The power of appreciative
inquiry: a practical guide to positive change. San Francisco: Berrett-Koehler.
23. Wiley, J. (2013). The Wiley-Lackwell Handbook of the Psychology of Leadership, Change,
and Organisational Developments. Published by John Wiley & Sons, Ltd.
58th International Scientific Conference on Economic and Social Development – Budapest, 04-05 September, 2020
339
THE INFLUENCE OF PERCEIVED SOCIAL MEDIA MARKETING
ACTIVITIES ON BRAND LOYALTY – SEM APPROACH
Ivana Geric
Faculty of organization and informatics, University of Zagreb,
Varaždin, Pavlinska 2, Croatia
Damir Dobrinic
Faculty of organization and informatics, University of Zagreb,
Varaždin, Pavlinska 2, Croatia
ABSTRACT
This research aims to investigate the impact of social networks marketing activities on brand
loyalty, value consciousness, and brand consciousness. In addition to this primary goal, the
direct impact of value consciousness and brand consciousness on brand loyalty was also
investigated. Based on previous research, a conceptual model was made, and hypotheses were
formed. The structural equation modeling method using the SPSS AMOS 26 software package
was used to test the models and hypotheses. Data for the implementation of the research were
collected through an online survey. An online survey was conducted in the Republic of Croatia.
During the survey period, five hundred and thirty-five (535) questionnaires were collected.
Empirical research shows a statistically significant positive association of social media
marketing activities with value consciousness, brand consciousness, and brand loyalty. A
negative correlation was found between value consciousness and brand loyalty and a positive
correlation between brand consciousness and brand loyalty. In addition to the scientific
contribution, the results can help marketing experts in the formation and implementation of
marketing activities on social networks.
Keywords: brand consciousness, brand loyalty, customers, social media marketing, value
consciousness
1. INTRODUCTION
The accelerated development of new information and telecommunication technologies, the
Internet and various social networks has affected all spheres of social life, especially marketing.
Social media are present in individuals' daily lives and have a strong influence on
communication that is increasingly changing and taking new forms. (Okazaki, 2009) According
to Eurostat data for the Republic of Croatia, in 2018, 56% of the population aged 16 to 74 were
active on social networks. As far as the European Union members are concerned, Denmark has
the most users of social networks (79%). In comparison, Belgium (73%), Sweden, and the
United Kingdom have a slightly smaller percentage of about 70%. (http://hr.n1info.com
/Znanost/a415025/Drustvene-mreze-koristi-97-mladih-u-Hrvatskoj.html). Social media has
become the most important method of reporting in the 21st century and allows its users to
express their beliefs, ideas, and views in a whole new way. (Bamini et al., 2014) This way of
communication has a substantial impact on the business of the company. Enterprises realize
that without the right social media plan and strategy, their chances of quickly becoming
prominent in consumers' minds are incredibly slim (Saravanakumar & Suganthalakshmi, 2012).
Social networks make it easier for companies to understand customer needs, their purchasing
behavior, and gain insight into their feelings and attitudes toward brands (Rockendorf, 2011).
It allows companies to establish communication with consumers, precisely define their
marketing message, and maintain the brand’s presence in markets (Evans, 2012).
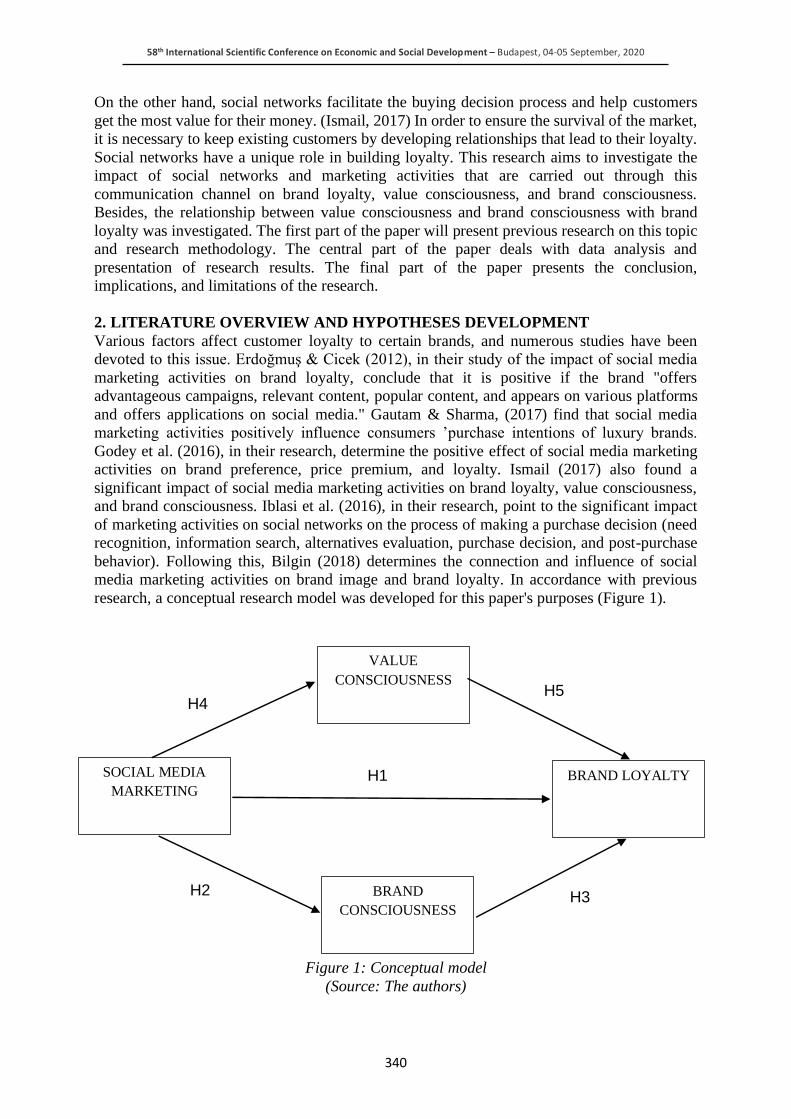
58th International Scientific Conference on Economic and Social Development – Budapest, 04-05 September, 2020
340
On the other hand, social networks facilitate the buying decision process and help customers
get the most value for their money. (Ismail, 2017) In order to ensure the survival of the market,
it is necessary to keep existing customers by developing relationships that lead to their loyalty.
Social networks have a unique role in building loyalty. This research aims to investigate the
impact of social networks and marketing activities that are carried out through this
communication channel on brand loyalty, value consciousness, and brand consciousness.
Besides, the relationship between value consciousness and brand consciousness with brand
loyalty was investigated. The first part of the paper will present previous research on this topic
and research methodology. The central part of the paper deals with data analysis and
presentation of research results. The final part of the paper presents the conclusion,
implications, and limitations of the research.
2. LITERATURE OVERVIEW AND HYPOTHESES DEVELOPMENT
Various factors affect customer loyalty to certain brands, and numerous studies have been
devoted to this issue. Erdoğmuş & Cicek (2012), in their study of the impact of social media
marketing activities on brand loyalty, conclude that it is positive if the brand "offers
advantageous campaigns, relevant content, popular content, and appears on various platforms
and offers applications on social media." Gautam & Sharma, (2017) find that social media
marketing activities positively influence consumers ’purchase intentions of luxury brands.
Godey et al. (2016), in their research, determine the positive effect of social media marketing
activities on brand preference, price premium, and loyalty. Ismail (2017) also found a
significant impact of social media marketing activities on brand loyalty, value consciousness,
and brand consciousness. Iblasi et al. (2016), in their research, point to the significant impact
of marketing activities on social networks on the process of making a purchase decision (need
recognition, information search, alternatives evaluation, purchase decision, and post-purchase
behavior). Following this, Bilgin (2018) determines the connection and influence of social
media marketing activities on brand image and brand loyalty. In accordance with previous
research, a conceptual research model was developed for this paper's purposes (Figure 1).
Figure 1: Conceptual model
(Source: The authors)
SOCIAL MEDIA
MARKETING
VALUE
CONSCIOUSNESS
BRAND
CONSCIOUSNESS
BRAND LOYALTY H1
H2 H3
H4 H5
58th International Scientific Conference on Economic and Social Development – Budapest, 04-05 September, 2020
341
2.1. Social media marketing
Social media has become a hub for the promotion of goods and services. It enables companies
to communicate with customers actively, represents a two-way communication channel, and
enable greater customer collaboration and the creation of a sense of equality between consumers
and their brands (Evans, 2012). Social media-based communication provides consumers with
relevant information and reduces their effort in seeking the necessary information (Laroche et
al., 2013). According to Kim & Co. (2010), social media can have a dramatic impact on a
brand’s reputation. According to a DEI Worldwide study (2008), 70% of consumers visited
social media sites to get information about products or services, 49% of these consumers made
a purchase decision based on information they found through a website or social network, 60
% of them stated that they are likely to use social networks to pass information to others.
Furthermore, Enli & Skorgerbo (2013) state that customers most often use Facebook and
Twitter to research products and services. Social media marketing offers many benefits to
businesses. It enables companies to present their products to potential customers, listen to
customer complaints and suggestions, and improve their product and adapt it to customers
(Sajid, 2015). Based on previous research, hypothesis H1 was formed.
H1: There is a positive correlation between social media marketing activities and brand loyalty.
2.2. Brand consciousness
Brand consciousness is described as a personal and intangible assessment of a customer’s
product that exceeds its objective significance (Lemon et al., 2002). Brand awareness helps
potential customers buy a product or service, reminds existing customers of the company’s
offering, and serves as a corporate emotional connection with all customers (Ou et al., 2014;
Vogel et al., 2008). Manrai et al., (2001) point out that consumers very often identify with
brands, while Escalas & Bettman, 2005 point out that consumers who possess higher brand
awareness consider brands to be symbols of higher status. It is interesting to note that brand-
conscious consumers buy expensive brands and remain loyal to the brand not because of the
perception of quality as such, but because of other people’s opinions (Bao & Mandrik, 2004).
Based on previous research, hypotheses H2 and H3 were formed.
H2: Social media marketing activities are positively related to brand consciousness.
H3: Brand consciousness is positively related to brand loyalty.
2.3. Value consciousness
According to Sharma (2011), Value consciousness customers are oriented towards lower prices
but not lower quality. In this context, social media platforms offer values in terms of achieving
savings through lower prices, but also identifying the right products that meet customer needs
and the ability to compare prices with other brands. According to Zeithaml et al. (2001), value
consciousness is described as a customer's assessment of a product based on the attitudes of
what is provided to him and what is received. On the other hand, Vogel et al., (2008) state the
existence of three types of influence on value consciousness: quality, price, and practicality,
while as key dimensions’ value consciousness Ismail (2017) states: price-quality ratio, the
convenience of purchase and usefulness of products and time. Based on the above, hypothesis
H4 was formed.
H4: Social media marketing activities are positively related to value consciousness.
According to Russo (2014), 78% of consumers admit that they are not loyal to any particular
brand.
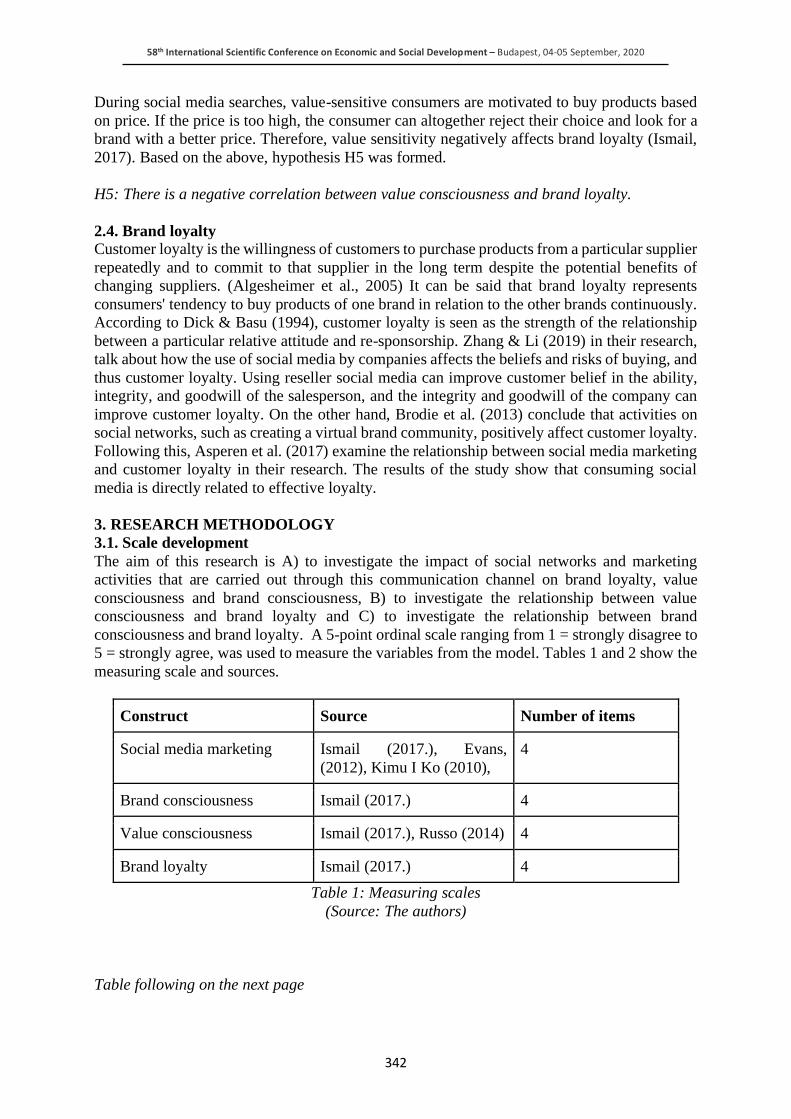
58th International Scientific Conference on Economic and Social Development – Budapest, 04-05 September, 2020
342
During social media searches, value-sensitive consumers are motivated to buy products based
on price. If the price is too high, the consumer can altogether reject their choice and look for a
brand with a better price. Therefore, value sensitivity negatively affects brand loyalty (Ismail,
2017). Based on the above, hypothesis H5 was formed.
H5: There is a negative correlation between value consciousness and brand loyalty.
2.4. Brand loyalty
Customer loyalty is the willingness of customers to purchase products from a particular supplier
repeatedly and to commit to that supplier in the long term despite the potential benefits of
changing suppliers. (Algesheimer et al., 2005) It can be said that brand loyalty represents
consumers' tendency to buy products of one brand in relation to the other brands continuously.
According to Dick & Basu (1994), customer loyalty is seen as the strength of the relationship
between a particular relative attitude and re-sponsorship. Zhang & Li (2019) in their research,
talk about how the use of social media by companies affects the beliefs and risks of buying, and
thus customer loyalty. Using reseller social media can improve customer belief in the ability,
integrity, and goodwill of the salesperson, and the integrity and goodwill of the company can
improve customer loyalty. On the other hand, Brodie et al. (2013) conclude that activities on
social networks, such as creating a virtual brand community, positively affect customer loyalty.
Following this, Asperen et al. (2017) examine the relationship between social media marketing
and customer loyalty in their research. The results of the study show that consuming social
media is directly related to effective loyalty.
3. RESEARCH METHODOLOGY
3.1. Scale development
The aim of this research is A) to investigate the impact of social networks and marketing
activities that are carried out through this communication channel on brand loyalty, value
consciousness and brand consciousness, B) to investigate the relationship between value
consciousness and brand loyalty and C) to investigate the relationship between brand
consciousness and brand loyalty. A 5-point ordinal scale ranging from 1 = strongly disagree to
5 = strongly agree, was used to measure the variables from the model. Tables 1 and 2 show the
measuring scale and sources.
Construct Source Number of items
Social media marketing Ismail (2017.), Evans,
(2012), Kimu I Ko (2010),
4
Brand consciousness Ismail (2017.) 4
Value consciousness Ismail (2017.), Russo (2014) 4
Brand loyalty Ismail (2017.) 4
Table 1: Measuring scales
(Source: The authors)
Table following on the next page
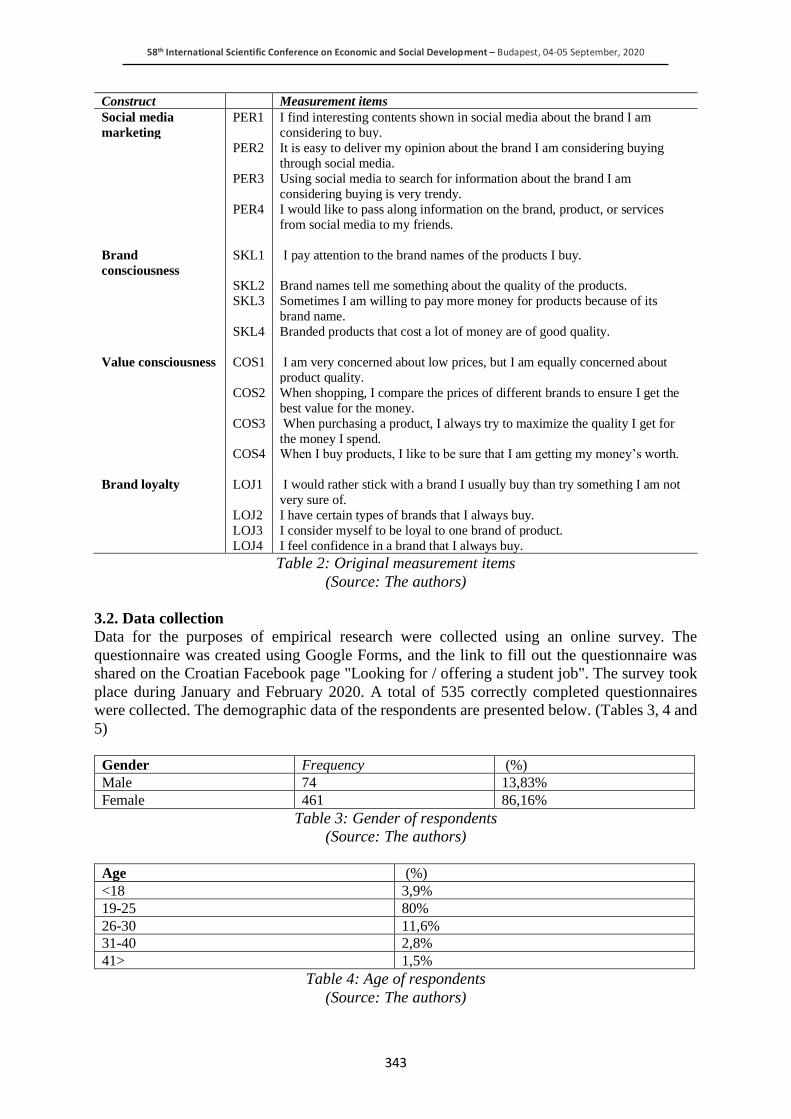
58th International Scientific Conference on Economic and Social Development – Budapest, 04-05 September, 2020
343
Construct Measurement items
Social media
marketing
PER1 I find interesting contents shown in social media about the brand I am
considering to buy.
PER2 It is easy to deliver my opinion about the brand I am considering buying
through social media.
PER3 Using social media to search for information about the brand I am
considering buying is very trendy.
PER4 I would like to pass along information on the brand, product, or services
from social media to my friends.
Brand
consciousness
SKL1 I pay attention to the brand names of the products I buy.
SKL2 Brand names tell me something about the quality of the products.
SKL3 Sometimes I am willing to pay more money for products because of its
brand name.
SKL4 Branded products that cost a lot of money are of good quality.
Value consciousness COS1 I am very concerned about low prices, but I am equally concerned about
product quality.
COS2 When shopping, I compare the prices of different brands to ensure I get the
best value for the money.
COS3 When purchasing a product, I always try to maximize the quality I get for
the money I spend. COS4 When I buy products, I like to be sure that I am getting my money’s worth.
Brand loyalty
LOJ1 I would rather stick with a brand I usually buy than try something I am not
very sure of.
LOJ2 I have certain types of brands that I always buy.
LOJ3 I consider myself to be loyal to one brand of product.
LOJ4 I feel confidence in a brand that I always buy.
Table 2: Original measurement items
(Source: The authors)
3.2. Data collection
Data for the purposes of empirical research were collected using an online survey. The
questionnaire was created using Google Forms, and the link to fill out the questionnaire was
shared on the Croatian Facebook page "Looking for / offering a student job". The survey took
place during January and February 2020. A total of 535 correctly completed questionnaires
were collected. The demographic data of the respondents are presented below. (Tables 3, 4 and
5)
Gender Frequency (%)
Male 74 13,83%
Female 461 86,16%
Table 3: Gender of respondents
(Source: The authors)
Age (%)
<18 3,9%
19-25 80%
26-30 11,6%
31-40 2,8%
41> 1,5%
Table 4: Age of respondents
(Source: The authors)
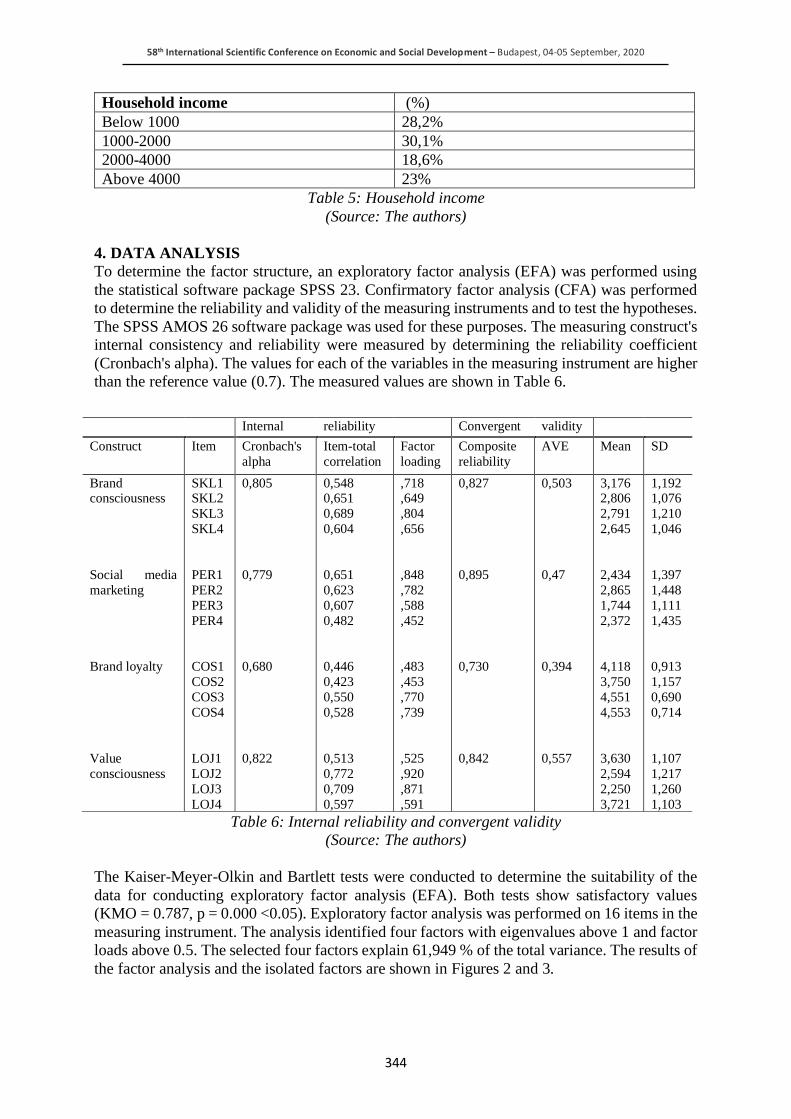
58th International Scientific Conference on Economic and Social Development – Budapest, 04-05 September, 2020
344
Household income (%)
Below 1000 28,2%
1000-2000 30,1%
2000-4000 18,6%
Above 4000 23%
Table 5: Household income
(Source: The authors)
4. DATA ANALYSIS
To determine the factor structure, an exploratory factor analysis (EFA) was performed using
the statistical software package SPSS 23. Confirmatory factor analysis (CFA) was performed
to determine the reliability and validity of the measuring instruments and to test the hypotheses.
The SPSS AMOS 26 software package was used for these purposes. The measuring construct's
internal consistency and reliability were measured by determining the reliability coefficient
(Cronbach's alpha). The values for each of the variables in the measuring instrument are higher
than the reference value (0.7). The measured values are shown in Table 6.
Table 6: Internal reliability and convergent validity
(Source: The authors)
The Kaiser-Meyer-Olkin and Bartlett tests were conducted to determine the suitability of the
data for conducting exploratory factor analysis (EFA). Both tests show satisfactory values
(KMO = 0.787, p = 0.000 <0.05). Exploratory factor analysis was performed on 16 items in the
measuring instrument. The analysis identified four factors with eigenvalues above 1 and factor
loads above 0.5. The selected four factors explain 61,949 % of the total variance. The results of
the factor analysis and the isolated factors are shown in Figures 2 and 3.
Internal reliability Convergent validity
Construct Item Cronbach's
alpha
Item-total
correlation
Factor
loading
Composite
reliability
AVE Mean SD
Brand consciousness
Social media
marketing
Brand loyalty
Value
consciousness
SKL1 SKL2
SKL3
SKL4
PER1
PER2
PER3
PER4
COS1
COS2
COS3
COS4
LOJ1
LOJ2
LOJ3
LOJ4
0,805
0,779
0,680
0,822
0,548 0,651
0,689
0,604
0,651
0,623
0,607
0,482
0,446
0,423
0,550
0,528
0,513
0,772
0,709
0,597
,718 ,649
,804
,656
,848
,782
,588
,452
,483
,453
,770
,739
,525
,920
,871
,591
0,827
0,895
0,730
0,842
0,503
0,47
0,394
0,557
3,176 2,806
2,791
2,645
2,434
2,865
1,744
2,372
4,118
3,750
4,551
4,553
3,630
2,594
2,250
3,721
1,192 1,076
1,210
1,046
1,397
1,448
1,111
1,435
0,913
1,157
0,690
0,714
1,107
1,217
1,260
1,103
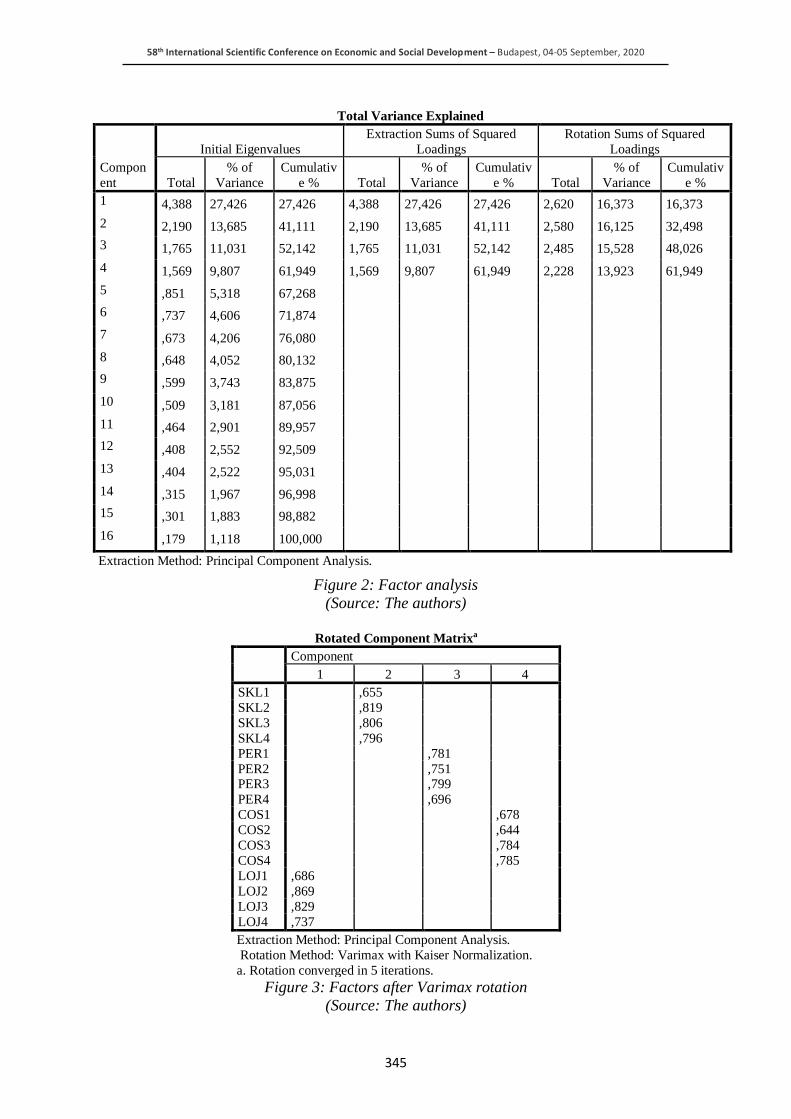
58th International Scientific Conference on Economic and Social Development – Budapest, 04-05 September, 2020
345
Total Variance Explained
Compon
ent
Initial Eigenvalues
Extraction Sums of Squared
Loadings
Rotation Sums of Squared
Loadings
Total
% of
Variance
Cumulativ
e % Total
% of
Variance
Cumulativ
e % Total
% of
Variance
Cumulativ
e %
1 4,388 27,426 27,426 4,388 27,426 27,426 2,620 16,373 16,373
2 2,190 13,685 41,111 2,190 13,685 41,111 2,580 16,125 32,498
3 1,765 11,031 52,142 1,765 11,031 52,142 2,485 15,528 48,026
4 1,569 9,807 61,949 1,569 9,807 61,949 2,228 13,923 61,949
5 ,851 5,318 67,268
6 ,737 4,606 71,874
7 ,673 4,206 76,080
8 ,648 4,052 80,132
9 ,599 3,743 83,875
10 ,509 3,181 87,056
11 ,464 2,901 89,957
12 ,408 2,552 92,509
13 ,404 2,522 95,031
14 ,315 1,967 96,998
15 ,301 1,883 98,882
16 ,179 1,118 100,000
Extraction Method: Principal Component Analysis.
Figure 2: Factor analysis
(Source: The authors)
Rotated Component Matrixa
Component
1 2 3 4
SKL1 ,655
SKL2 ,819
SKL3 ,806
SKL4 ,796
PER1 ,781
PER2 ,751 PER3 ,799
PER4 ,696
COS1 ,678
COS2 ,644
COS3 ,784
COS4 ,785
LOJ1 ,686
LOJ2 ,869
LOJ3 ,829
LOJ4 ,737
Extraction Method: Principal Component Analysis.
Rotation Method: Varimax with Kaiser Normalization.
a. Rotation converged in 5 iterations.
Figure 3: Factors after Varimax rotation
(Source: The authors)
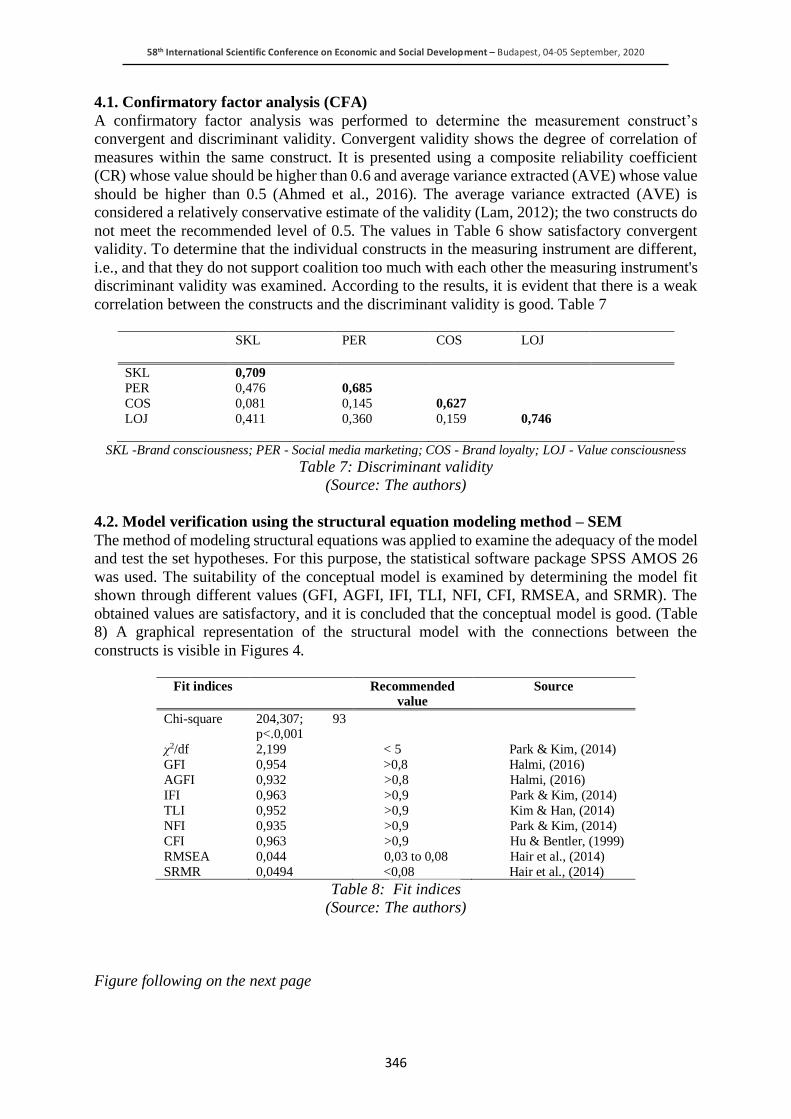
58th International Scientific Conference on Economic and Social Development – Budapest, 04-05 September, 2020
346
4.1. Confirmatory factor analysis (CFA)
A confirmatory factor analysis was performed to determine the measurement construct’s
convergent and discriminant validity. Convergent validity shows the degree of correlation of
measures within the same construct. It is presented using a composite reliability coefficient
(CR) whose value should be higher than 0.6 and average variance extracted (AVE) whose value
should be higher than 0.5 (Ahmed et al., 2016). The average variance extracted (AVE) is
considered a relatively conservative estimate of the validity (Lam, 2012); the two constructs do
not meet the recommended level of 0.5. The values in Table 6 show satisfactory convergent
validity. To determine that the individual constructs in the measuring instrument are different,
i.e., and that they do not support coalition too much with each other the measuring instrument's
discriminant validity was examined. According to the results, it is evident that there is a weak
correlation between the constructs and the discriminant validity is good. Table 7
SKL
PER
COS
LOJ
SKL 0,709
PER 0,476 0,685
COS 0,081 0,145 0,627
LOJ 0,411 0,360 0,159 0,746
SKL -Brand consciousness; PER - Social media marketing; COS - Brand loyalty; LOJ - Value consciousness
Table 7: Discriminant validity
(Source: The authors)
4.2. Model verification using the structural equation modeling method – SEM
The method of modeling structural equations was applied to examine the adequacy of the model
and test the set hypotheses. For this purpose, the statistical software package SPSS AMOS 26
was used. The suitability of the conceptual model is examined by determining the model fit
shown through different values (GFI, AGFI, IFI, TLI, NFI, CFI, RMSEA, and SRMR). The
obtained values are satisfactory, and it is concluded that the conceptual model is good. (Table
8) A graphical representation of the structural model with the connections between the
constructs is visible in Figures 4.
Fit indices Recommended
value
Source
Chi-square 204,307; 93 p<.0,001
χ2/df 2,199 < 5 Park & Kim, (2014)
GFI 0,954 >0,8 Halmi, (2016)
AGFI 0,932 >0,8 Halmi, (2016)
IFI 0,963 >0,9 Park & Kim, (2014)
TLI
NFI
0,952
0,935
>0,9
>0,9
Kim & Han, (2014)
Park & Kim, (2014)
CFI 0,963 >0,9 Hu & Bentler, (1999)
RMSEA 0,044 0,03 to 0,08 Hair et al., (2014)
SRMR 0,0494 <0,08 Hair et al., (2014)
Table 8: Fit indices
(Source: The authors)
Figure following on the next page
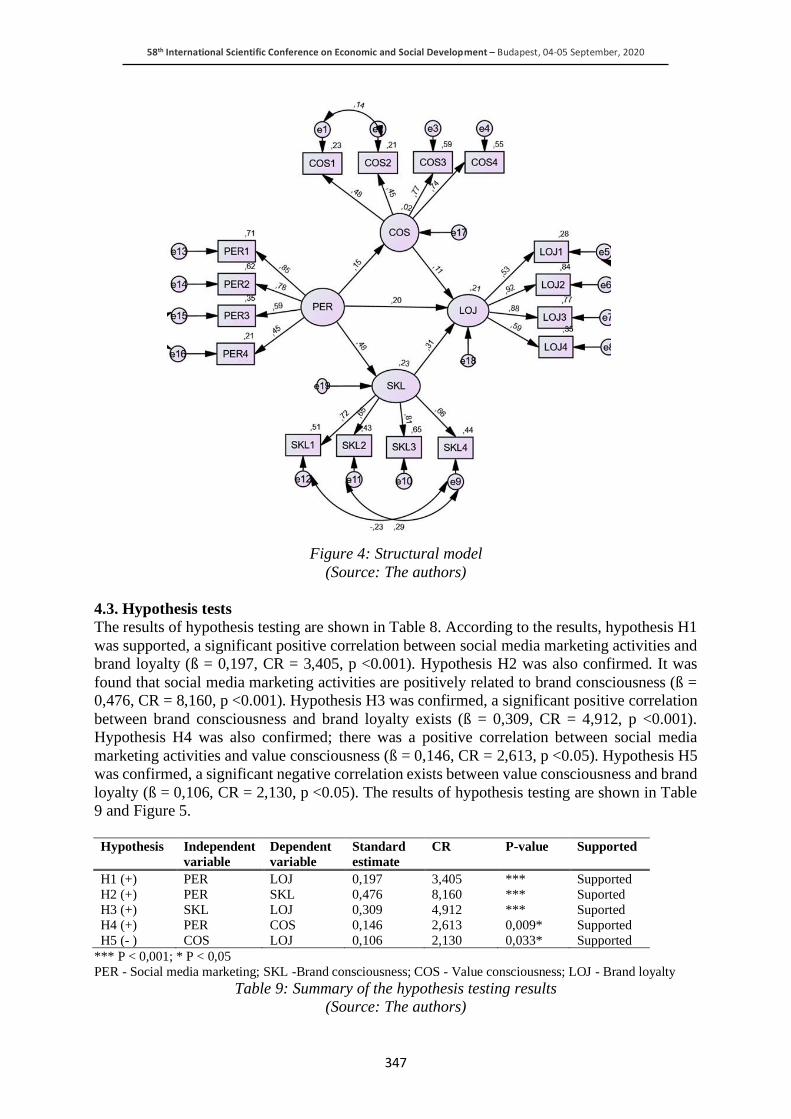
58th International Scientific Conference on Economic and Social Development – Budapest, 04-05 September, 2020
347
Figure 4: Structural model
(Source: The authors)
4.3. Hypothesis tests
The results of hypothesis testing are shown in Table 8. According to the results, hypothesis H1
was supported, a significant positive correlation between social media marketing activities and
brand loyalty (ß = 0,197, CR = 3,405, p <0.001). Hypothesis H2 was also confirmed. It was
found that social media marketing activities are positively related to brand consciousness (ß =
0,476, CR = 8,160, p <0.001). Hypothesis H3 was confirmed, a significant positive correlation
between brand consciousness and brand loyalty exists (ß = 0,309, CR = 4,912, p <0.001).
Hypothesis H4 was also confirmed; there was a positive correlation between social media
marketing activities and value consciousness (ß = 0,146, CR = 2,613, p <0.05). Hypothesis H5
was confirmed, a significant negative correlation exists between value consciousness and brand
loyalty (ß = 0,106, CR = 2,130, p <0.05). The results of hypothesis testing are shown in Table
9 and Figure 5.
Hypothesis Independent
variable
Dependent
variable
Standard
estimate
CR P-value Supported
H1 (+) PER LOJ 0,197 3,405 *** Supported
H2 (+) PER SKL 0,476 8,160 *** Suported
H3 (+) SKL LOJ 0,309 4,912 *** Suported
H4 (+) PER COS 0,146 2,613 0,009* Supported
H5 (- ) COS LOJ 0,106 2,130 0,033* Supported
*** P < 0,001; * P < 0,05
PER - Social media marketing; SKL -Brand consciousness; COS - Value consciousness; LOJ - Brand loyalty
Table 9: Summary of the hypothesis testing results
(Source: The authors)
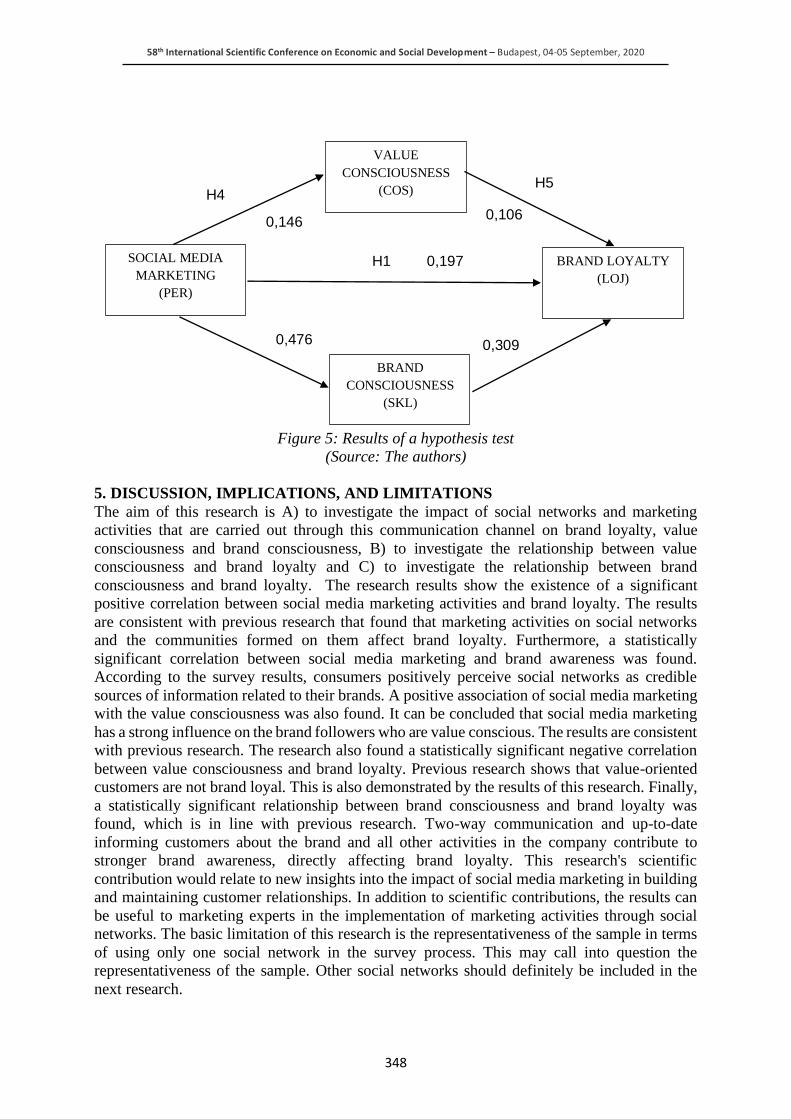
58th International Scientific Conference on Economic and Social Development – Budapest, 04-05 September, 2020
348
Figure 5: Results of a hypothesis test
(Source: The authors)
5. DISCUSSION, IMPLICATIONS, AND LIMITATIONS
The aim of this research is A) to investigate the impact of social networks and marketing
activities that are carried out through this communication channel on brand loyalty, value
consciousness and brand consciousness, B) to investigate the relationship between value
consciousness and brand loyalty and C) to investigate the relationship between brand
consciousness and brand loyalty. The research results show the existence of a significant
positive correlation between social media marketing activities and brand loyalty. The results
are consistent with previous research that found that marketing activities on social networks
and the communities formed on them affect brand loyalty. Furthermore, a statistically
significant correlation between social media marketing and brand awareness was found.
According to the survey results, consumers positively perceive social networks as credible
sources of information related to their brands. A positive association of social media marketing
with the value consciousness was also found. It can be concluded that social media marketing
has a strong influence on the brand followers who are value conscious. The results are consistent
with previous research. The research also found a statistically significant negative correlation
between value consciousness and brand loyalty. Previous research shows that value-oriented
customers are not brand loyal. This is also demonstrated by the results of this research. Finally,
a statistically significant relationship between brand consciousness and brand loyalty was
found, which is in line with previous research. Two-way communication and up-to-date
informing customers about the brand and all other activities in the company contribute to
stronger brand awareness, directly affecting brand loyalty. This research's scientific
contribution would relate to new insights into the impact of social media marketing in building
and maintaining customer relationships. In addition to scientific contributions, the results can
be useful to marketing experts in the implementation of marketing activities through social
networks. The basic limitation of this research is the representativeness of the sample in terms
of using only one social network in the survey process. This may call into question the
representativeness of the sample. Other social networks should definitely be included in the
next research.
0,106
SOCIAL MEDIA
MARKETING
(PER)
VALUE
CONSCIOUSNESS
(COS)
BRAND
CONSCIOUSNESS
(SKL)
BRAND LOYALTY
(LOJ)
H1
H4 H5
0,197
0,476
0,146
0,309
1
58th International Scientific Conference on Economic and Social Development – Budapest, 04-05 September, 2020
349
LITERATURE:
1. Ahmad, S., Zulkurnain, N.N.A., & Khairushalimi, F.I., (2016). Assessing the Validity and
Reliability of a Measurement Model in Structural Equation Modeling (SEM), British
Journal of Mathematics & Computer Science, 15(3), 1-8
2. Algesheimer, R. & Dholakia, M. (2005), The Social Influence of Brand Community:
Evidence from European Car Clubs, Journal of Marketing 69(4), 19-34
3. Asperen, M., Rooij, P., Dijkmans, C. ( 2017). Engagement-Based Loyalty: The Effects of
Social Media Engagement on Customer Loyalty in the Travel Industry, Internationality
Journal of Hospitality & Tourism Administration, 19(1), 78-94
4. Bamini K.P.D.Balakrishnan, Mohd Irwan Dahnil, Wong Jiunn (2014.), The Impact of
Social Media Marketing Medium toward Purchase Intention and Brand Loyalty among
Generation Y, Procidia - Social and Behavioral Sciences, 148 (2014), 177-185
5. Bao, Y., & Mandrik, C. A. (2004). Discerning store brand users from value consciousness
consumers: the role of prestige sensitivity and need for cognition. Advances in Consumer
Research, 31(1), 707-712
6. Bilgin Y. (2018), The Effect Of Social Media Marketing Activities On Brand Awareness,
Brand Image And Brand Loyalty, BMIJ, 6(1): 128-148
7. Brodie, J.R., Juric, B., Ilic, A. & Hollebeek, L.D. (2011), Consumer Engagement in a
Virtual Brand Community: An Exploratory Analysis, Journal of Business Research 66(1),
105-114
8. Cui, G. and Liu, Q. (2001), “Executive insights: emerging market segments in a transitional
economy: a study of urban consumers in China”, Journal of International Marketing, Vol.
9 No. 1, pp. 84-106
9. DEI Worldwide. The impact of social media on purchasing behavior. Engaging Consumers
Online. available at www.deiworldwide.com/files/DEIStudy-Engaging% 20Consumers
Online-Summary.pdf, 2008. (Retrieved January 25th, 2020)
10. Dick, A.S., & Basu, K. (1994). Customer loyalty: Toward an integrated framework. Journal
of the Academy of Markting Science, 22(2), 99-113
11. Društvene mreže koristi 97% mladih u Hrvatskoj, Available at http://hr.n1info.com/
Znanost/a415025/Drustvene-mreze-koristi-97-mladih-u-Hrvatskoj.html, (Retrieved
January 25th, 2020.)
12. Enli, G. S., & Skogerbø, E. (2013). Personalized campaigns in party-centred politics.
Information, Communication & Society, 16, 757–774.
13. Erdoğmuş, I.E., &, Çiçek, M. (2012.), The Impact of Social Media Marketing on Brand
Loyalty, Procedia – Social and Behavioral Sciences, 58(12), 1353-1360
14. Escalas, J. E., & Bettman, J. R. (2005). Self-construal, reference groups, and brand meaning.
Journal of Consumer Research, 32(3), 378-389.
15. Evans, D. (2012), Social Media Marketing: An Hour a Day, John Wiley & Sons,
Indianapolis, IN
16. Gautam, V., & Sharma, V. (2017). The Mediating Role of Customer Relationship on the
Social Media Marketing and Purchase Intention Relationship with Special Reference to
Luxury Fashion Brands. Journal of Promotion Management, 23(6), 872–888.
17. Godey,B., Mathiou, A, Pederzoli,D., Rokka,J., Aiello,G. & Raffaele Rahul Singh, (2016.),
Social media marketing efforts of luxury brands: Influence on brand equity and consumer
behavior, Journal of Business Research, 69(12), 5833-5841
18. Hair Jr. F.J., Black, R.E., Babin, J.B., & Anderson, E.R., (2014). Multivariate Dana
Analysis-7th Edition, Pearson, Harlov, 2014, pp.579
19. Halmi, A., (2016). Multivarijantna analiza, Alineja, Zagreb, 2016, p. 175
58th International Scientific Conference on Economic and Social Development – Budapest, 04-05 September, 2020
350
20. Hu, L., & Bentler, P. M. (1999). Cutoff criteria for fit indexes in covariance structure
analysis: Conventional criteria versus new alternatives, Structural Equation Modeling, 6(1),
1 – 55.
21. Iblasi, W.N., Dr. Dojanah M.K. Bader, Sulaiman Ahmad Al-Qreini , (2016.), The Impact
of Social Media as a Marketing Tool on Purchasing Decisions (Case Study on SAMSUNG
for Electrical Home Appliances), 4(1), 14-28
22. Ismail, A., R., (2017.), The influence of perceived social media marketing activities on
brand loyalty, Asia Pacific Journal of Marketing and Logistics, 29(1), 129-144
23. Kim AJ, Ko E. (2010) Impacts of luxury fashion brand's social media marketing on
customer relationship and purchase intention. J Glob Fashion Mark 2010a;1(3):164–71.
24. Lam, Long W., (2012), Impact of competitiveness on salespeople’s commitment and
performance, Journal of Business Research, 65(2012), 1328-1334
25. Laroche, M., Habibi, M.R. and Richard, M.O. (2013), “To be or not to be in social media:
how brand loyalty is affected by social media?”, International Journal of Information
Management, 33(1), 76-82.
26. Lemon, K.N., White, T.B. and Winer, R.S. ( 2002.) Dynamic customer relationship
management: Incorporating future considerations into the service retention decision.
Journal of Marketing, 66(1): 1-14.
27. Liao, J. and Wang, L. (2009) ‘Face as a mediator of the relationship between material value
and brand consciousness’, Psychology and Marketing, Vol. 26, No. 11, pp.987–1001.
28. Manrai, L.A., Lascu, D-N., Manrai, A.K. and Babb, H.W. (2001) ‘A cross-cultural
comparison of style in Eastern European emerging markets’, International Marketing
Review, 18)3), 270–285.
29. Okazaki, S., (2009) Social influence model and electronic word of mouth, International
Journal of Advertising, 28:3, 439-472,
30. Park, E., & Kim, K. J. (2014). An Integrated Adoption Model of Mobile Cloud Services:
Exploration of Key Determinants and Extension of Technology Acceptance Model.
Telematics and Informatics, 31(3), 376–385.
31. Rockendorf, D., 2011., Continental 2011 Social Media Strategy, [Interview] (Personal
Communication, 14 June 2011)
32. Russo, J. (2014), “Connecting through the clutter: stay ahead of consumers to win in today’s
fragmented markets”, Aviable at:: www.nielsen.com/us/en/insights/news/2014/connecting-
through-theclutter-stay-ahead-of-consumers-to-win-in-todays-fragmented-markets.html ,
(Retrieved February 25th, 2020)
33. Sajid, Si., (2015). Social Media and Its Role in Marketing. Business and Economics
Journal. 7(1), 1-5
34. Saravanakumar, M. & Suganthalakshmi, T, (2012), Social Media Marketing, Life Science
Journal, 9(4): 4444-4451
35. Sharma, P. (2011), “Country of origin effects in developed and emerging markets: exploring
the contrasting roles of materialism and value consciousness”, Journal of International
Business Studies, Vol. 42 No. 2, pp. 285-306
36. Vikas Gautam & Vikram Sharma (2017) The Mediating Role of Customer Relationship on
the Social Media Marketing and Purchase Intention Relationship with Special Reference to
Luxury Fashion Brands, Journal of Promotion Management, 23:6, 872-888
37. Vogel, V., Evanschitzky, H. and Ramaseshan, B. (2008.) Customer equity drivers and
future sales. Journal of Marketing, 72(6): 98-108.
38. Vogel, V., Evanschitzky, H. and Ramaseshan, B. 2008. Customer equity drivers and future
sales. Journal of Marketing, 72(6): 98-108.
39. Zeithaml, V.A., Lemon, K.N. and Rust, R.T. 2001. Driving customer equity: How customer
lifetime value is reshaping corporate strategy: Simon and Schuster, Free Press (2001)
58th International Scientific Conference on Economic and Social Development – Budapest, 04-05 September, 2020
351
BEHAVIOURAL ACCEPTANCE PROCESS IN THE CONTEXT OF HIV
PREVENTION AMONG RESIDENTS OF LATVIA
Janis Duboviks
University of Latvia (FBME)
5 Aspazijas Blvd., Riga, Latvia
Jelena Salkovska
University of Latvia (FBME)
5 Aspazijas Blvd., Riga, Latvia
Anda Batraga
University of Latvia (FBME)
5 Aspazijas Blvd., Riga, Latvia
ABSTRACT
Regardless of the fact that numerous social marketing interventions has been carried out,
Latvia has steadily taken the leading position in the number of newly diagnosed HIV cases per
100,000 of the population in the European Union (EU). The Joint United Nations Programme
on HIV/AIDS (UNAIDS) points out social marketing as one of the most important tool in the
fight against HIV/AIDS. Social marketing eases the acceptance, rejection, modification,
abandonment or maintenance of certain behavior. Thus, it aims to benefit society at large, or
any part thereof, through the behavior change. To achieve a goal it applies traditional
marketing principles and techniques to create, communicate and deliver value. Given that
traditional marketing techniques are used in social marketing, it can be considered that
behavioral acceptance can also be viewed through the prism of the purchase decision-making
process, where purchase is the acceptance of a particular behavior. Moreover, social
marketing practitioners should understand how and what may affect the purchase decision-
making (behavioral acceptance) process of the target audience in order to understand how to
influence their behavior. The aim of this study is to assess behavioral acceptance process of the
residents of Latvia through the prism of the purchase decision-making process in the context of
HIV prevention. To obtain data a survey of residents of Latvia was carried out. The research
results show that respondents do not always reach the behavioral acceptance due to the lack of
information or a product (service) that would facilitate the acceptance of the particular
behavior. Thereby, it points to a gap in the social marketing communications. Based on the
research findings authors developed proposals for social marketing communications
improvements. Also further research directions are indicated.
Keywords: Behavioral acceptance, HIV/AIDS, Marketing communications, Purchase decision-
making process, Social marketing
1. INTRODUCTION
Regardless of the fact that numerous social marketing interventions has been carried out, Latvia
has steadily taken the leading position in the number of newly diagnosed HIV cases per 100,000
of the population in the European Union (EU) (ECDC, WHO, 2019) . The Joint United Nations
Programme on HIV/AIDS (UNAIDS) points out social marketing as one of the most important
tool in the fight against HIV/AIDS (Andreasen, 2002, p. 3). The aim of a social marketing is to
benefit society as a whole or its part by influencing its behavior.
58th International Scientific Conference on Economic and Social Development – Budapest, 04-05 September, 2020
352
To achieve a goal it applies traditional marketing principles and techniques to create,
communicate and deliver value (Kotler, Lee, 2008, p. 7). Social marketing differs from the
traditional in several ways. For instance, its products are more complex, the demand is diverse,
reaching the target audience is more challenging and consumer involvement is more intense. In
the same way as in traditional marketing, the focus is on the consumer and exploring what
people really want (Jha, 2013, pp. 1 – 2). Social marketing eases the acceptance, rejection,
modification, abandonment or maintenance of certain behaviors (Grier, Bryant, 2005, p. 321)
Thus, it can be asserted that social marketing benefits society by selling behavior and/or
providing accessible a product which can influence a behavior of a target audience. In other
words, a purchase as a result of social marketing is the acceptance of a particular behavior. The
effectiveness of the use of social marketing for HIV prevention can be increased by
implementing an integrated approach to marketing communication, which has been extensively
studied by Batraga A., Skiltere D., Salkovska J., Bormane S., Legzdina A. (Batraga, Skiltere,
Salkovska, Bormane, Legzdina, 2019, pp. 53 – 63). Given that traditional marketing techniques
are used in social marketing, it can be considered that behavioral acceptance can also be viewed
through the prism of the purchase decision-making process, where purchase is the acceptance
of a particular behavior. According to World Health Organization (WHO) there are several HIV
prevention ways, for instance, male and female condom use, testing and counselling, use of
ARVs (Antiretroviral drugs) for prevention, harm reduction for people who inject and use
drugs, elimination of mother-to-child transmission of HIV (WHO, 2020). For HIV prevention
purposes, the behaviors that would be desired as a result of social marketing interventions and
benefit the large groups of a society, rather than only small groups like drug users, are regular
condom use during sexual contact and HIV testing. The purpose of this study is to assess
behavioral acceptance process of the residents of Latvia through the prism of the purchase
decision-making process in the context of HIV prevention. The tasks are to analyze academic
and specialized literature on the theoretical aspects of purchase decision-making process, to
conduct a survey among the residents of Latvia with the aim to assess behavioral acceptance
process in the context of HIV prevention, based on the results of the study draw conclusions
and develop proposals for social marketing communications improvements. Research methods
used are the analysis of scientific literature and survey.
2. THEORETICAL BACKGROUND
Usually a purchase decision-making process consists of five stages: motivation (problem
recognition), information search, assessment of alternatives, purchase decision and action after
the purchase. The consumer can go through each of these stages one by one, as well as some of
them can be skipped or sequence can be reverse. Also, it can be argued that the purchase
decision-making process for the consumer begins long before the physical purchase of the
product or service, but the consequences may appear long enough after that (Kotler, Keller,
2012, pp. 167 – 173). At the first stage, the consumer recognizes a problem, or in other words
is aware of a need, which is a difference between the consumer's ideal (desired) and current
situation, and this means that there is a difference between what the consumer wants and what
he actually has. Thus, finding motivation for future purchase. The motivation can be caused by
both internal and external irritants (Evans, Jamal, Foxall, 2006, p. 263). The authors believe
that in terms of health, everyone recognizes the motivation to be healthy and does everything
possible to protect their health. The consumer, aware of the need at the beginning of the process,
gradually receiving information and evaluating alternatives, goes through the other stages of
the process. Depending on the intensity of the need and the interest in the product, two types of
information search are distinguished. The first one is a heightened attention when a consumer
becomes more attentive and better perceives the information related to the product of interest.
58th International Scientific Conference on Economic and Social Development – Budapest, 04-05 September, 2020
353
The second, where the consumer shows more interest and activity in the search for information
about the product is defined as an active information search (Kotler, Keller, 2012, pp. 167).
Regardless the intensity of search, the information received by the consumer can be internal
and external. Internal information is that already is stored in the consumer's memory. If the
consumer does not have enough internal information, then he turns to external sources (Belch,
Belch, p. 112). Based on the information that is obtained during the information search,
customers compile alternatives. Often, customers exclude several alternatives by carrying out
only a cursory assessment and draw up a short list of alternatives that can meet the needs that
arise and meet the purchase criteria. Alternative comparison can be both rational and irrational
(Capon, Capon, 2009, pp. 103 – 104.) One the main determinant of the customer’s choice is
their level involvement. There are high and low levels of involvement that determine different
evaluation processes. In general, in the case of a high level of involvement, the consumer will
evaluate the purchase more carefully, but in the case of a low level of involvement, the
evaluation of the purchase will be much simpler. In the case of a high level of involvement,
consumer behavior is characterized by a model of motivated choice, but in the case of a low
level of involvement, it is characterized by a repeat purchase model (Jobber, Ellis-Chadwick,
2013, p. 122). Depending on the consumer, in one case each brand and criteria may be carefully
evaluated, but in the other case the consumer will simply consider his/her daily alternative to
be the best, without even considering the other alternatives (Solomon, Bamossy, Askegaard,
etc., p. 273). It is very important to find out the criteria by which the consumer evaluates the
alternatives, as well as the level of its involvement, as these two factors influence further
communication with a consumer and possible promotion activities. Communication is crucial
in the context of social marketing, as it can have a significant impact on the next stage of
decision-making process – purchase decision (Krekula, Malenicka, Linder, etc., 2009, pp. 343
– 350). As was mentioned above one of the main goal of social marketing is to focus on
population-based behavior change, what in result will be a purchased product of social
marketing intervention. These behavioral changes may include acceptance and use of the
product, access to services, or treat health protection/prevention. However, behavioral
acceptance as a result of social marketing interventions is essential as the focus and
responsibility shifts from productivity to use and satisfaction rates. Thereby, this affects the
consumer's behavior after a purchase (Lefebvre, 2011, p. 60). Post-purchase evaluation is very
important as it will affect both the consumer's own future (repeat) purchases and the purchases
of other people who are influenced by the consumer (Capon, Capon, 2009, pp. 103). As
discussed, a consumer behavior and purchase decision-making is a complex process that
depends on a number of factors. Therefore, organizations use various communication measures
to attract and retain consumer attention, make first and repeat purchases. In terms of HIV
prevention an integrated marketing communication plays an important role in general, because,
similarly to traditional marketing, the communication created in the case of social marketing
can influence the behavioral acceptance of the target audience. Marketing communication with
the HIV prevention target audience can be implemented through various communication
channels. One of the most effective channels for maximizing audience engagement is the digital
environment. Radionova-Girsa E., Batraga A., Salkovska J. study the use of the online channel
in the context of marketing communication (Radionova-Girsa, Batraga, Salkovska, 2019). This
means that behavior of a target audience also in the context of HIV prevention can be
influenced, but social marketing practitioners need to pay attention to consumer behavior and
try to find out what have a greater impact on it, with the aim of understanding how to influence
this behavior in the future. In order to assess behavioral acceptance process of the residents of
Latvia through the prism of the purchase decision-making process in the context of HIV
prevention the population survey was conducted.
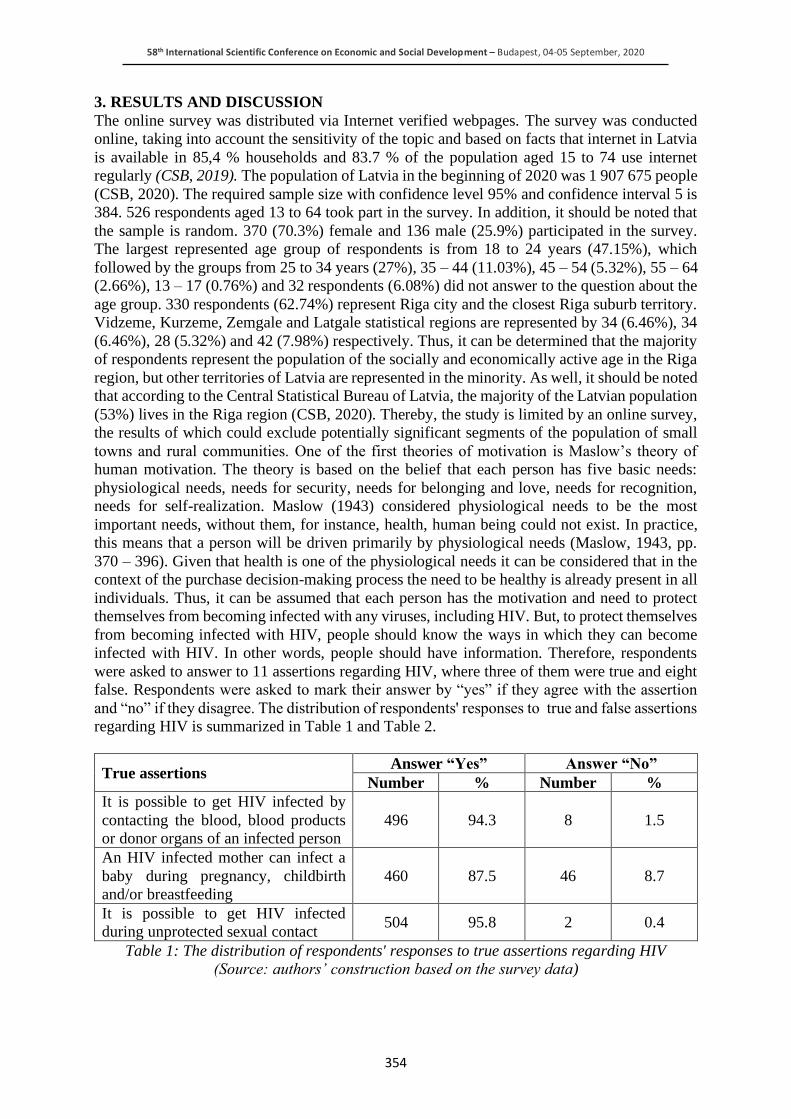
58th International Scientific Conference on Economic and Social Development – Budapest, 04-05 September, 2020
354
3. RESULTS AND DISCUSSION
The online survey was distributed via Internet verified webpages. The survey was conducted
online, taking into account the sensitivity of the topic and based on facts that internet in Latvia
is available in 85,4 % households and 83.7 % of the population aged 15 to 74 use internet
regularly (CSB, 2019). The population of Latvia in the beginning of 2020 was 1 907 675 people
(CSB, 2020). The required sample size with confidence level 95% and confidence interval 5 is
384. 526 respondents aged 13 to 64 took part in the survey. In addition, it should be noted that
the sample is random. 370 (70.3%) female and 136 male (25.9%) participated in the survey.
The largest represented age group of respondents is from 18 to 24 years (47.15%), which
followed by the groups from 25 to 34 years (27%), 35 – 44 (11.03%), 45 – 54 (5.32%), 55 – 64
(2.66%), 13 – 17 (0.76%) and 32 respondents (6.08%) did not answer to the question about the
age group. 330 respondents (62.74%) represent Riga city and the closest Riga suburb territory.
Vidzeme, Kurzeme, Zemgale and Latgale statistical regions are represented by 34 (6.46%), 34
(6.46%), 28 (5.32%) and 42 (7.98%) respectively. Thus, it can be determined that the majority
of respondents represent the population of the socially and economically active age in the Riga
region, but other territories of Latvia are represented in the minority. As well, it should be noted
that according to the Central Statistical Bureau of Latvia, the majority of the Latvian population
(53%) lives in the Riga region (CSB, 2020). Thereby, the study is limited by an online survey,
the results of which could exclude potentially significant segments of the population of small
towns and rural communities. One of the first theories of motivation is Maslow’s theory of
human motivation. The theory is based on the belief that each person has five basic needs:
physiological needs, needs for security, needs for belonging and love, needs for recognition,
needs for self-realization. Maslow (1943) considered physiological needs to be the most
important needs, without them, for instance, health, human being could not exist. In practice,
this means that a person will be driven primarily by physiological needs (Maslow, 1943, pp.
370 – 396). Given that health is one of the physiological needs it can be considered that in the
context of the purchase decision-making process the need to be healthy is already present in all
individuals. Thus, it can be assumed that each person has the motivation and need to protect
themselves from becoming infected with any viruses, including HIV. But, to protect themselves
from becoming infected with HIV, people should know the ways in which they can become
infected with HIV. In other words, people should have information. Therefore, respondents
were asked to answer to 11 assertions regarding HIV, where three of them were true and eight
false. Respondents were asked to mark their answer by “yes” if they agree with the assertion
and “no” if they disagree. The distribution of respondents' responses to true and false assertions
regarding HIV is summarized in Table 1 and Table 2.
True assertions Answer “Yes” Answer “No”
Number % Number %
It is possible to get HIV infected by
contacting the blood, blood products
or donor organs of an infected person
496 94.3 8 1.5
An HIV infected mother can infect a
baby during pregnancy, childbirth
and/or breastfeeding
460 87.5 46 8.7
It is possible to get HIV infected
during unprotected sexual contact 504 95.8 2 0.4
Table 1: The distribution of respondents' responses to true assertions regarding HIV
(Source: authors’ construction based on the survey data)
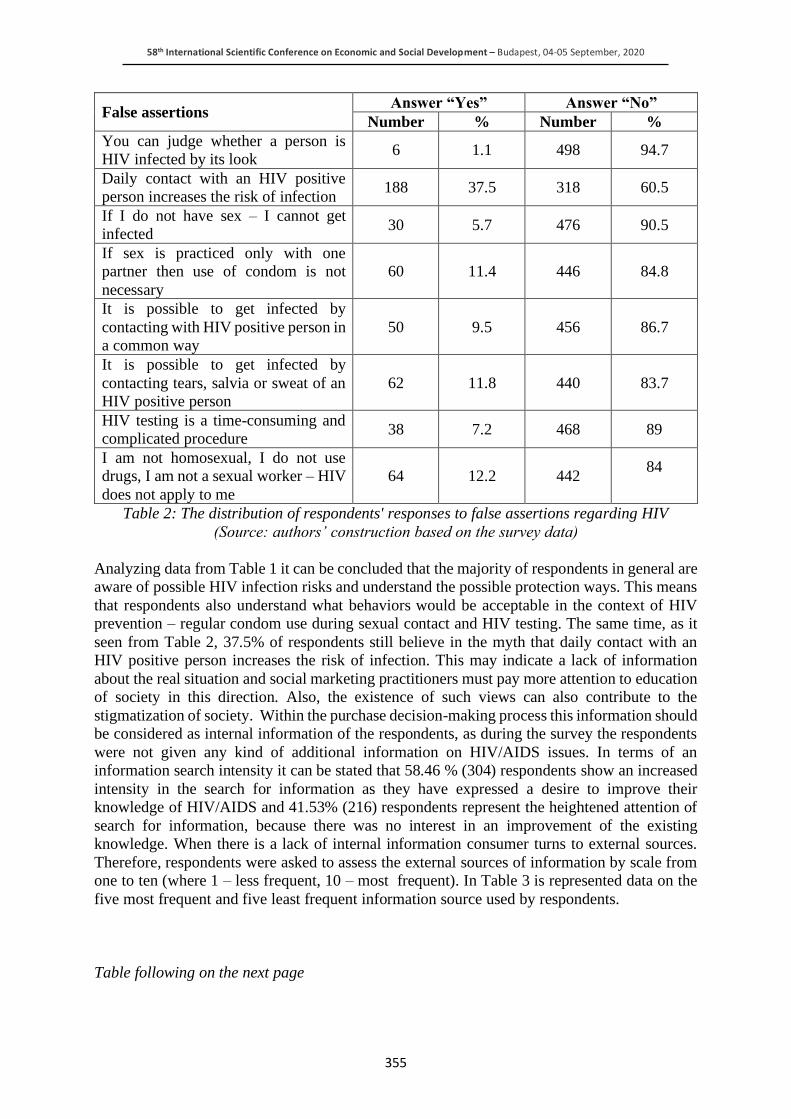
58th International Scientific Conference on Economic and Social Development – Budapest, 04-05 September, 2020
355
False assertions Answer “Yes” Answer “No”
Number % Number %
You can judge whether a person is
HIV infected by its look 6 1.1 498 94.7
Daily contact with an HIV positive
person increases the risk of infection 188 37.5 318 60.5
If I do not have sex – I cannot get
infected 30 5.7 476 90.5
If sex is practiced only with one
partner then use of condom is not
necessary
60 11.4 446 84.8
It is possible to get infected by
contacting with HIV positive person in
a common way
50 9.5 456 86.7
It is possible to get infected by
contacting tears, salvia or sweat of an
HIV positive person
62 11.8 440 83.7
HIV testing is a time-consuming and
complicated procedure 38 7.2 468 89
I am not homosexual, I do not use
drugs, I am not a sexual worker – HIV
does not apply to me
64 12.2 442 84
Table 2: The distribution of respondents' responses to false assertions regarding HIV
(Source: authors’ construction based on the survey data)
Analyzing data from Table 1 it can be concluded that the majority of respondents in general are
aware of possible HIV infection risks and understand the possible protection ways. This means
that respondents also understand what behaviors would be acceptable in the context of HIV
prevention – regular condom use during sexual contact and HIV testing. The same time, as it
seen from Table 2, 37.5% of respondents still believe in the myth that daily contact with an
HIV positive person increases the risk of infection. This may indicate a lack of information
about the real situation and social marketing practitioners must pay more attention to education
of society in this direction. Also, the existence of such views can also contribute to the
stigmatization of society. Within the purchase decision-making process this information should
be considered as internal information of the respondents, as during the survey the respondents
were not given any kind of additional information on HIV/AIDS issues. In terms of an
information search intensity it can be stated that 58.46 % (304) respondents show an increased
intensity in the search for information as they have expressed a desire to improve their
knowledge of HIV/AIDS and 41.53% (216) respondents represent the heightened attention of
search for information, because there was no interest in an improvement of the existing
knowledge. When there is a lack of internal information consumer turns to external sources.
Therefore, respondents were asked to assess the external sources of information by scale from
one to ten (where 1 – less frequent, 10 – most frequent). In Table 3 is represented data on the
five most frequent and five least frequent information source used by respondents.
Table following on the next page
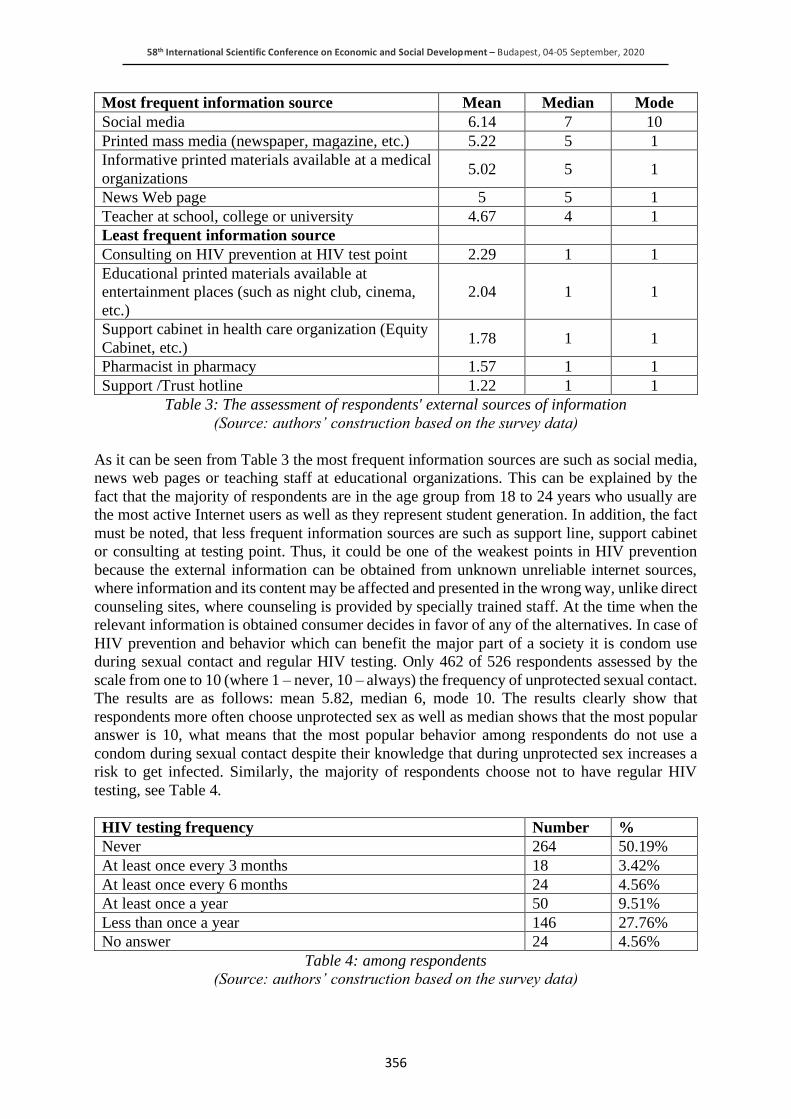
58th International Scientific Conference on Economic and Social Development – Budapest, 04-05 September, 2020
356
Most frequent information source Mean Median Mode
Social media 6.14 7 10
Printed mass media (newspaper, magazine, etc.) 5.22 5 1
Informative printed materials available at a medical
organizations 5.02 5 1
News Web page 5 5 1
Teacher at school, college or university 4.67 4 1
Least frequent information source
Consulting on HIV prevention at HIV test point 2.29 1 1
Educational printed materials available at
entertainment places (such as night club, cinema,
etc.)
2.04 1 1
Support cabinet in health care organization (Equity
Cabinet, etc.) 1.78 1 1
Pharmacist in pharmacy 1.57 1 1
Support /Trust hotline 1.22 1 1
Table 3: The assessment of respondents' external sources of information
(Source: authors’ construction based on the survey data)
As it can be seen from Table 3 the most frequent information sources are such as social media,
news web pages or teaching staff at educational organizations. This can be explained by the
fact that the majority of respondents are in the age group from 18 to 24 years who usually are
the most active Internet users as well as they represent student generation. In addition, the fact
must be noted, that less frequent information sources are such as support line, support cabinet
or consulting at testing point. Thus, it could be one of the weakest points in HIV prevention
because the external information can be obtained from unknown unreliable internet sources,
where information and its content may be affected and presented in the wrong way, unlike direct
counseling sites, where counseling is provided by specially trained staff. At the time when the
relevant information is obtained consumer decides in favor of any of the alternatives. In case of
HIV prevention and behavior which can benefit the major part of a society it is condom use
during sexual contact and regular HIV testing. Only 462 of 526 respondents assessed by the
scale from one to 10 (where 1 – never, 10 – always) the frequency of unprotected sexual contact.
The results are as follows: mean 5.82, median 6, mode 10. The results clearly show that
respondents more often choose unprotected sex as well as median shows that the most popular
answer is 10, what means that the most popular behavior among respondents do not use a
condom during sexual contact despite their knowledge that during unprotected sex increases a
risk to get infected. Similarly, the majority of respondents choose not to have regular HIV
testing, see Table 4.
HIV testing frequency Number %
Never 264 50.19%
At least once every 3 months 18 3.42%
At least once every 6 months 24 4.56%
At least once a year 50 9.51%
Less than once a year 146 27.76%
No answer 24 4.56%
Table 4: among respondents
(Source: authors’ construction based on the survey data)
58th International Scientific Conference on Economic and Social Development – Budapest, 04-05 September, 2020
357
Only 62 (17.49%) respondents choose to have HIV testing on a regular basis. This chosen
behavior of respondents also serves as a gap in HIV prevention, because, same as in case of
condom use, respondents have enough knowledge that HIV testing is not complicated and time
consuming procedure. Therefore, it would be desirable to choose behaviors that support more
frequent HIV testing. The data obtained also proves that respondents after chosen (purchased)
behavior re-select it again. Such repeated choice of risky behavior not only serves as a
shortcoming in the HIV prevention system, but also has a negative impact on people in the
respondents' environment. This, in turn, motivates these people to choose inappropriate
behavior in the context of HIV prevention.
4. CONCLUSION
Based on the results of the research and analyzing the acceptance of behavior through the prism
of the purchase decision-making process in the context of HIV prevention, it can be concluded
that respondents go through all of its stages. It assumed that each person has the motivation and
need to protect themselves from becoming infected with any viruses, including HIV. Thus,
there is a need for information. Results show that respondents have a high level of internal
information and in general are aware of possible HIV infection risks and understand the possible
protection ways as well as understand what behaviors would be acceptable in the context of
HIV prevention – regular condom use during sexual contact and HIV testing. However, there
is still a belief in some myths about HIV. The majority of the respondents show an increased
intensity in the search for information as they have expressed a desire to improve their
knowledge of HIV/AIDS related issues. The large part of the respondents are in the age group
from 18 to 24 years who usually are the most active Internet users as well as they represent
student generation, thus, this explains why such external information sources like social media
or internet web pages are the most frequently used. There is also a need to be aware that
information and its content in these sources may be affected and presented in the wrong way,
unlike direct counseling sites, where counseling is provided by specially trained staff, which,
in turn, are the least frequent sources of external information. Thus, the comparison of
alternatives also may be affected. Despite the fact that respondents have enough knowledge
about HIV/AIDS issues they do not choose a behavior suggested by social marketing
interventions, but choose the exact opposite pattern of behavior. This is indicated by several
results obtained during the study. The practice of unprotected sex is widespread among
respondents, and the majority of respondents do not perform HIV testing at all or regularly.
Moreover, respondents repeatedly choose such unfavorable behavior, thus influencing others.
This leads to a conclusion that preventive measures in Latvia have several gaps and more
attention must be paid to the factors that influence the choice of a target audience.
5. RECOMMENDATIONS
Taking into account that this study is limited by an online survey, the results of which could
exclude potentially significant segments of the population of small towns and rural
communities as well as the majority of respondents the age group from 18 to 34 years, the
authors recommend in future studies to pay more attention to geographical areas that may have
been excluded from this study, as well as to make a deeper study of the behavioral acceptance
of the population over the age of 34 years. By conducting these studies, it will be possible to
gain a full understanding of the acceptance of behavior in the context of HIV prevention among
all residents. Also study on all factors that influence the existing behavioral acceptance must be
conducted in order to undertand the existing unfavorable choise of respondents. Social
marketing practitioners need to pay increased attention to segmentation of target audience and
choice of communication channels. Also, as much as possible, efforts should be made to reach
all segments of the population in an accessible and comprehensible way.
58th International Scientific Conference on Economic and Social Development – Budapest, 04-05 September, 2020
358
In addition, the promotion of on-site counseling places, for instance, support cabinet in health
care organization, as a source of verified, unaffected and truthful information should be
encouraged. People should contribute to a greater awareness of the fact that the responsibility
for their own behavior is their responsibility.
LITERATURE:
1. Andreasen, A. R. (2002). Marketing Social Marketing in the Social Change Marketplace.
Journal of Public Policy and Marketing, 21 (1), pp. 3 – 13.
2. Batraga A., Skiltere D., Salkovska J., Bormane S., Legzdina A. (2019). Influence of
Integrated Marketing Communication Tools Upon Consumers’ Buying Decisions in the
Context of Sustainability. Latvia: Faculty of Business, Management and Economics,
University of Latvia Riga, pp. 53 – 63.
3. Belch, G. E., Belch, M. A. (2007). Advertising and promotion: An Integrated Marketing
Communications Perspective. Boston: McGraw-Hill.
4. Capon, N., Capon, R. (2009). Managing Marketing in the 21st Century: Developing &
Implementing the Market Strategy. European Edition. New York: Wessex.
5. Central Statistical Bureau of Latvia. (2020). The population in Latvia. Retrieved
30.06.2020. from
https://data.csb.gov.lv/pxweb/lv/iedz/iedz__iedzskaits__ikgad/ISG020.px/table/tableView
Layout1/
6. Central Statistical Bureau of Latvia. (2019). Household use of the Internet continues to
grow. Retrieved 30.06.2020. from https://www.csb.gov.lv/lv/statistika/statistikas-
temas/zinatne-ikt/datori-internets/meklet-tema/2580-iedzivotaju-interneta-lietosanas-
paradumi
7. European Centre for Disease Prevention and Control, World Health Organization (2019)
HIV / AIDS surveillance in Europe 2019: 2018 data, European Union. Retrieved from
https://www.ecdc.europa.eu/sites/default/files/documents/hiv-surveillance-report-
2019.pdf.
8. Evans, M., Jamal, A., Foxall, G. (2006). Consumer behaviour. Hoboken: John Wiley &
Sons.
9. Grier, G., Bryant, C. A. (2005). Social Marketing in Public Health. Public Health, 39, pp.
319 – 339.
10. Jha, N. (2013). Social Marketing in Health: Developing Country’s Perspective. NJOG, 8
(2), pp. 1 – 4.
11. Jobber, D., Ellis-Chadwick, F. (2013). Principles and Practice of Marketing (7th ed.).
London: McGraw-Hill Education.
12. Kotler, Ph., Keller, K. L. (2012). Marketing management. 14th ed., Prentice Hall: Boston.
13. Kotler, Ph., Lee, N. R. (2008). Social Marketing: Influencing Behaviors for Good (3rd ed.).
Los Angeles; London; New Delhi: Sage Publications.
14. Krekula, L. G., Malenicka, S., Linder, M., etc. (2009), From Words to Action – Influence
of Two Organ Donation Campaigns on Knowledge and Formal Decision-Making. Clinical
Transplantation, 23, pp. 343 – 350.
15. Lefebvre, C., R. (2011). An Integrative Model for Social Marketing. Journal of Social
Marketing. 1(1), pp. 54 – 72.
16. Maslow, A. H., (1943). A Theory of Human Motivation, Psychological Review, 50 (4) pp.
370 – 396.
17. Radionova-Girsa E., Batraga A., Šalkovska J. (2019). The determinants of online shopping:
building communication with customers in an online dimension. Latvia : Latvia University
of Life Sciences and Technologies. Faculty of Economics and Social Development Jelgava,
pp. 330 – 337.

58th International Scientific Conference on Economic and Social Development – Budapest, 04-05 September, 2020
359
18. Solomon, M., Bamossy, G., Askegaard, S., etc. (2006). Consumer behaviour: A European
Perspective. New York: Harlow.
19. World Health Organization. (2020). HIV/AIDS. Retrieved 30.06.2020. from
https://www.who.int/news-room/fact-sheets/detail/hiv-aids.
58th International Scientific Conference on Economic and Social Development – Budapest, 04-05 September, 2020
360
CHALLENGES THAT THE NATIONAL LEGISLATION ARE FACING
IN THE ERA OF SOCIAL AND ECONOMIC CHANGES CAUSED BY
DIGITALISATION
Borislav Boric
Pravni fakultet za privredu i pravosuđe Novi Sad, Serbia
ABSTRACT
Modern society is characterised by strong digitalisation of all aspects of life, from business to
personal ones. Elements that once required personal presence, such as theft, threats, data
misuse and abuse, sexual offenses and the like, are happening in the internet world nowadays.
It is clear that the new, changed environment gives birth to completely new types of offenses,
in addition to the fact that the old ones are moving into the electronic space. Therefore, national
and supranational legislation must respond dynamically to these changes, and since threats,
data theft, ransomware, sexual harassment, slut-shaming, harassment, theft of card money (or
PayPal money and similar payment platforms), or peer violence now migrating to the e-zone,
or they are predominantly happening there, it is urgently needed that the legislatures regulate
these until recently unregulated areas through the legal measures. In this paper, we will try to
make a comparative cross-section of legislative solutions in different countries and regions and
analyse the advantages and disadvantages of individual solutions.
Keywords: Cyber crime, digitalization, intenet, jurisdictions, law
1. INTRODUCTION
The times we are living in are constantly chanhing, becoming more digital year after year. The
corona-crisis only accelerated these processes, and the digitalization of the world has become
worldwide and an everyday phenomenon. We can argue that theses changes would have
appeared anyway, but the corona-crisis and the panic that followed suit, like avoiding personal
contact and physical and social distancing, made these changes more swifty imposed, and for
some people they really did come as a sudden surprise. But, the problems that existed in the
past have already triggered some legal responses and discussions. Things like data theft,
ransomware, sexual harassment, slut-shaming, harassment, theft of card money (or PayPal
money and similar payment platforms), or peer violence have already been analysed by
lawmakers, and some legal changed have been made to match the offences that did not exist in
the past, but are more than real nowadays. The following chapters will try to present a short
overview of the changes and challengesin the regulations and jurisdictions in the countries
worldwide, item by item addressed in the Introduction.
2. DATA THEFT
The term data theft is actually incorrect in the digital world, as the data is usually not stolen but
rather copied without authorisation. If the data theft occurs by influencing data processing, it is
also referred to as computer fraud. The data can, for example, be taken from letters, by
skimming or from the computer infrastructure. Computer criminals can also use phishing,
vishing or snarfing to gain access to data without being noticed. Often a user is faked to the side
of a known Internet service in order to illegally get to the data or to gain access to the
corresponding user account. ATMs are also frequently and in a variety of ways the target of
attackers who want to gain possession of information for logging into such devices, such as the
account number or the personal identification number (PIN). The crime itself is usually
primarily done by system administrators, who have the access to the database servers,
computers (either desktop compueters or laptop computers), as well as the growing variety of
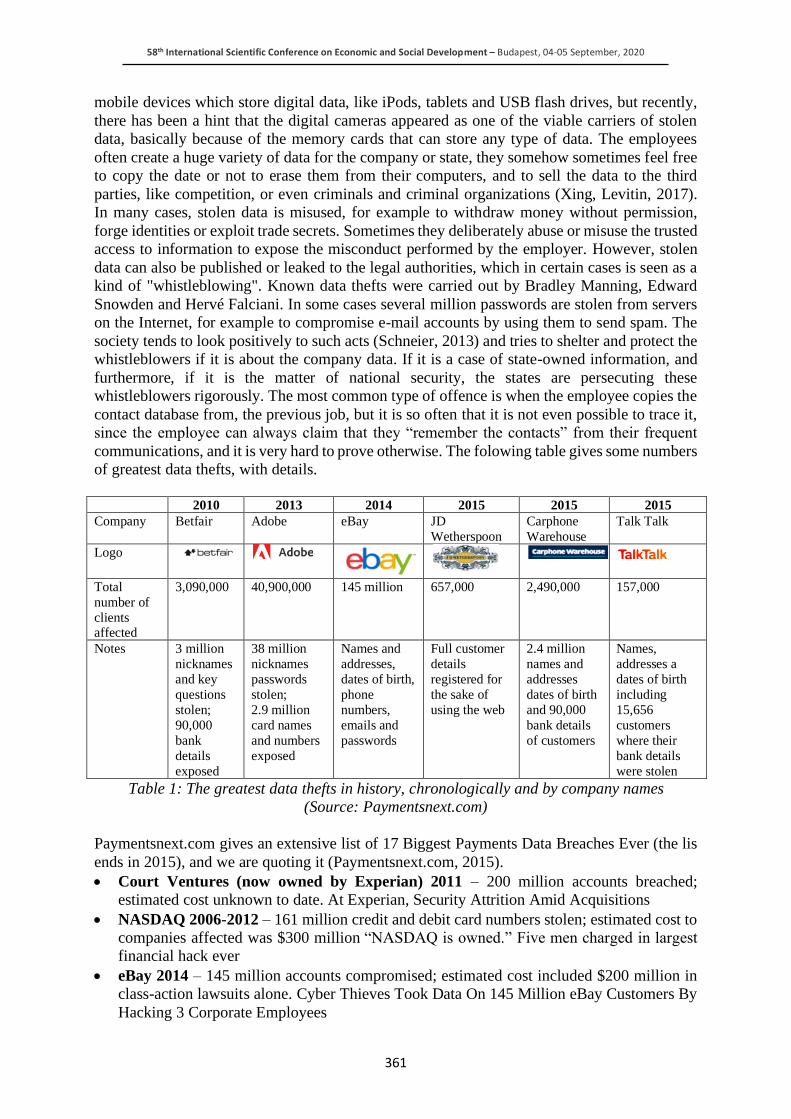
58th International Scientific Conference on Economic and Social Development – Budapest, 04-05 September, 2020
361
mobile devices which store digital data, like iPods, tablets and USB flash drives, but recently,
there has been a hint that the digital cameras appeared as one of the viable carriers of stolen
data, basically because of the memory cards that can store any type of data. The employees
often create a huge variety of data for the company or state, they somehow sometimes feel free
to copy the date or not to erase them from their computers, and to sell the data to the third
parties, like competition, or even criminals and criminal organizations (Xing, Levitin, 2017).
In many cases, stolen data is misused, for example to withdraw money without permission,
forge identities or exploit trade secrets. Sometimes they deliberately abuse or misuse the trusted
access to information to expose the misconduct performed by the employer. However, stolen
data can also be published or leaked to the legal authorities, which in certain cases is seen as a
kind of "whistleblowing". Known data thefts were carried out by Bradley Manning, Edward
Snowden and Hervé Falciani. In some cases several million passwords are stolen from servers
on the Internet, for example to compromise e-mail accounts by using them to send spam. The
society tends to look positively to such acts (Schneier, 2013) and tries to shelter and protect the
whistleblowers if it is about the company data. If it is a case of state-owned information, and
furthermore, if it is the matter of national security, the states are persecuting these
whistleblowers rigorously. The most common type of offence is when the employee copies the
contact database from, the previous job, but it is so often that it is not even possible to trace it,
since the employee can always claim that they “remember the contacts” from their frequent
communications, and it is very hard to prove otherwise. The folowing table gives some numbers
of greatest data thefts, with details.
2010 2013 2014 2015 2015 2015
Company Betfair Adobe eBay JD
Wetherspoon
Carphone
Warehouse
Talk Talk
Logo
Total
number of
clients affected
3,090,000 40,900,000 145 million 657,000 2,490,000 157,000
Notes 3 million
nicknames
and key
questions
stolen;
90,000
bank
details
exposed
38 million
nicknames
passwords
stolen;
2.9 million
card names
and numbers
exposed
Names and
addresses,
dates of birth,
phone
numbers,
emails and
passwords
Full customer
details
registered for
the sake of
using the web
2.4 million
names and
addresses
dates of birth
and 90,000
bank details
of customers
Names,
addresses a
dates of birth
including
15,656
customers
where their
bank details
were stolen
Table 1: The greatest data thefts in history, chronologically and by company names
(Source: Paymentsnext.com)
Paymentsnext.com gives an extensive list of 17 Biggest Payments Data Breaches Ever (the lis
ends in 2015), and we are quoting it (Paymentsnext.com, 2015).
• Court Ventures (now owned by Experian) 2011 – 200 million accounts breached;
estimated cost unknown to date. At Experian, Security Attrition Amid Acquisitions
• NASDAQ 2006-2012 – 161 million credit and debit card numbers stolen; estimated cost to
companies affected was $300 million “NASDAQ is owned.” Five men charged in largest
financial hack ever
• eBay 2014 – 145 million accounts compromised; estimated cost included $200 million in
class-action lawsuits alone. Cyber Thieves Took Data On 145 Million eBay Customers By
Hacking 3 Corporate Employees
58th International Scientific Conference on Economic and Social Development – Budapest, 04-05 September, 2020
362
• Equifax 2017 – 143 million accounts breached; estimated cost to be determined. The
Equifax Hack Has the Hallmarks of State-Sponsored Pros
• Target 2013/2014 – 30 million in 2013 and 70-110 million accounts in 2014 impacted;
estimated to cost Target up to $162 million. Target’s Data Breach Gets Worse: 70 Million
Customers Had Info Stolen, Including Names, Emails And Phones
• Heartland Payment Systems 2008/2009 – 108 million debit and credit cards affected;
estimated cost included $110 million in payments to Visa and MasterCard by
Heartland. Heartland Payment Systems Suffers Data Breach
• Sony 2011 – 100 million accounts breached; estimated cost includes 65 class-action
lawsuits totaling between $171 million and $1.5 billion. Sony Promises All PlayStation
Services Will Return This Week (Again)
• TJX/TJ Maxx 2003/2004 – 94 million accounts hacked; estimated cost to the company
was $256 million. TJ Maxx data theft largest ever
• JP Morgan Chase 2014 – 83 million personal and small business accounts hacked.
JP Morgan Chase reveals massive data breach affecting 76m households
• Home Depot 2014 – 56 million customers’ personal data compromised the company said
it cost them an estimated $33 million. Home Depot left customers’ unprotected personal
data online
• Cardsystems Solutions 2005 – 40 million credit card accounts stolen. CardSystems
Exposes 40 Million Identities
• RSA Security 2011 – 40 million security tokens affected; estimated cost of $66 million in
monitoring. Cyber attack on RSA cost EMC $66 million
• Adobe 2013 – 38 million credit card accounts hacked; estimated cost $1.1 million in legal
fees and unknown settlements to individuals. Adobe breach impacted at least 30 million
users
• Zappos 2012 – 24 million customers’ personal data, last four digits of credit cards and
passwords stolen; estimated cost $406,000. Zappos hacked, 24 million accounts accessed
• Ashley Madison 2015 – 37 million customers financial records and data stolen; $11.2
million paid in settlements so far. Ashley Madison will pay $11.2 million to data breach
victims
• Staples 2014 – 1.16 million customers financial records hacked; estimated cost $148
million. Staples Breach Impacts 1.1 Million, Adds To Ongoing Retail Lapses
• Global Payments 2012 – 1.5 million customer credit card accounts compromised;
estimated cost $94 million. Global Payments Breach Tab: $94 Million
2.1. Legal response to Data Theft problem
The variety of countries have reacted to the Data Theft problem with different measures. In
Germany, spying on data is punishable under Section 202a of the Criminal Code (StGB). In the
version that came into force in 1986, the legislature made the unauthorized provision of data as
spying on data a criminal offense. This provision only applies to data that is stored
electronically, magnetically or otherwise imperceptibly. According to this, the prerequisite for
the offense is that a perpetrator has not brought into his control of data that was intended for
him - and that was specially protected against unauthorized access. (Bundesamt für Justiz,
2020) This means that not all unauthorized access to a computer system in general, but only in
connection with spying on data is punishable. Preparing the crime is also a criminal offense,
for example procuring the appropriate software. In Switzerland, zhe word data theft appears in
media releases, but not in the criminal code. The Federal Prosecutor's Office has accused Hervé
Falciani of data theft, but the charge is "unauthorised data acquisition" (Art. 143 (1) StGB). In
the United States, there is an old law, which was entitled The Computer Fraud and Abuse Act
58th International Scientific Conference on Economic and Social Development – Budapest, 04-05 September, 2020
363
(CFAA). It was introduced and enacted in 1986, and subsequently the Cybersecurity Bill was
created as an amendment in the existing law under the code 18 U.S.C. § 1030. The law
“prohibits accessing a computer without authorization, or in excess of authorization” (Jarett,
Bailie, 2010). Before the computer-specific criminal laws were enacted, computer crimes were
prosecuted as mail and wire fraud but the application was not sufficiently good, since it was a
new technology and required a completely new bill. In Spain, the name of the law is named Ley
Orgánica de Protección de Datos y Garantía de Derechos Digitales (LOPDGDD). This law
came into force on December 6, 2018, replacing the old Organic Law 15/1999 on the Protection
of Personal Data. The objective of the LOPDGDD is to adapt Spanish legislation to European
regulations, defined by the General Data Protection Regulation (RGPD), in force since May 25,
2018. Since the Cambridge Analytica scandal there was a higher pressure to reduce the
collection of Big Data andit sale to interested parties. The Brexit referendum and Donald Trump
election as an American President showed that the analysing data can be powerful tool if it is
not regulated properly. As one of the analyses said: “and Kosinski soon developed simple but
brilliant analysis. I. e. he concentrated on “likes”: “he was able to evaluate a person better than
the average work colleague, merely on the basis of ten Facebook “likes.” Seventy “likes” were
enough to outdo what a person’s friends knew, 150 what their parents knew, and 300 “likes”
what their partner knew. More “likes” could even surpass what a person thought they knew
about themselves.” – says Vice“ (Milošević, 2017). Many jurisdictions tried to regulate the
collection and sales of Big Data after that.
2.2. Whistlebowing
The disclosure of this conduct can be of several types: the violation of a law, rule or regulation
that may be a threat to the public interest, such as fraud against health or safety laws or about
political corruption. Whistleblowers can make their allegations internally, with other people in
the organisation or externally to regulators, agencies, the media, or groups that have a
relationship with the issue. They are frequently forced to face retaliation at the hands of the
accused organisation or group, or indirectly related organisations and governments. Because of
this, some governments have passed legal regulations to give them protection. The origin of the
English term, whistleblower, comes from the practice of British police officers who blew their
whistles by blowing on them, when they became aware of the commission of a crime. The
whistle served to alert the public and other police officers to the danger.
2.3. Legal protection of whistleblowers
Legal protection for the practice of whistleblowing varies from country to country and may
depend on the country where the reported activity occurred, where and how the secrets were
disclosed, and how they came to be published or publicised. More than a dozen countries have
adopted comprehensive whistleblower laws that create mechanisms for reporting violations and
providing legal protection for whistleblowers. More than 50 other countries have adopted more
limited protections under their anti-corruption, freedom of information, or employment laws.
One of the most distinguished whistleblowers in the world was Erin Brockovich, a legal
assistant, who brought to the general public the danger of hexavalent chromium, commonly
used by the industry. She obtained 333 million dollars for the defendants of her process. This
event was the plot of the eponymous film, starring Julia Roberts. In December 2010, the United
States Senate passed a bill that protects government employees who report abuse, fraud, and
waste (Davidson, 2010). In the case of Spain, the protection of the whistleblower in the
framework of the complaint channels lacks any regulation at the state level, with only some
regulations at the regional level (Hernandez, 2019). In November 2018, the European
Parliament approved a whistleblower protection directive ("Whistleblower Protection
Directive") that contains broad protections for the freedom of expression of whistleblowers in
58th International Scientific Conference on Economic and Social Development – Budapest, 04-05 September, 2020
364
the public and private sectors, including journalists, in all EU member states. European Union.
The Directive prohibits direct or indirect retaliation against current and former employees in
both sectors (Control Capital, 2019). In Serbia, by the Law on the Anti-Corruption Agency, in
July 2011 the Director of the Agency adopted the Rulebook on the Protection of Persons
Reporting Suspicions of Corruption (on Whistleblowers), the first such regulation in Serbia
(Gočanin, Grujić, Đurić, 2013). The Serbian Parliament adopted the Law on the Protection of
Whistleblowers on November 25, 2014. As of October 8, 2013, 107 people had requested the
status of whistleblowers from the Anti-Corruption Agency, and a total of 53 people had
received that status. More than a third of the total number of protected whistleblowers are
employees of the special hospital in Sokobanja Gočanin, Grujić, Đurić, 2013). According to the
data provided by the Agency, out of 107 persons who sought protection, 31 sought protection
of anonymity, 72 did not seek protection of anonymity, and four did not state in the request
whether they sought that type of protection. (The Ordinance is not clear enough on how to
ensure the protection of anonymity, especially since the Agency should inform the head of the
body in which the whistleblower is employed about his identity (Gočanin, Grujić, Đurić,
2013).) The agency stripped one person of his status as a whistleblower "because he did not
report corruption in good faith." Although the law stipulates that a civil servant must file a
report "in good faith" (a term unknown in modern law in Europe and the United States), the
rulebook changed it to "good faith" and explained that it means that the whistleblower "has a
good reason" to believe that the information he reveals is true, even if it is later established to
the contrary and if he has no intention of achieving any illegal or unethical goal." The first
consequence of the whistleblowing alarm is the possibility of retaliation. According to Article
2 of the Ordinance on the Protection of Persons Reporting Suspicions of Corruption, retaliation
is defined as “any act or omission against a whistleblower that leads to the following harmful
consequences: psychological or physical harassment or abuse, disciplinary proceedings,
transfer to a lower position and detention. progress; making a decision on termination of
employment or termination of employment contract; taking or imposing a measure that
adversely affects employment status and working conditions; serious and real threats that any
of the above measures will be taken." Although in principle whistleblowers are protected by
the employer, it is very common for the employers to retaliate against them. For example, in
the United States in 2011, although there was an increase in whistleblowing acts of 11%, the
growth of retaliation increased by about 83%, which may have a negative effect on future
whistleblowing. The incidence of physical violence has also increased, with only 4% of
whistleblowers experiencing some form of physical violence in 2009, compared to 31% in 2011
and surpassing non-violent forms of retaliation (O’Rourke, 2012). The study found that those
people who experienced retaliation were less engaged, more likely to resign within a year, and
more likely to report their problems outside the company, to the media, or to regulators.
Retaliation also undermines employees' trust in the company's leadership and discourages other
employees from reporting illegalities (O’Rourke, 2012).
3. RANSOMWARE
A ransomware (a new word coined from the English ransom, and -ware, shortening of
software), or "data hijacking", is a type of malicious program that restricts access to certain
parts or files of the infected operating system and asks for a ransom in exchange for removing
this restriction. Some types of ransomware encrypt operating system files, rendering the device
unusable and coercing the user to pay the ransom. Some alternatives, for instance, have been
proposed in Spanish to the English term, such as "kidnapping program", "kidnapper",
"blackmail program" or "blackmailer". The same situation occured in other languages where
the “ransomware” is not easily pronounced. Although attacks have become popular since the
mid-2010s, the first known attack was carried out in the late 1980s by Dr. Joseph Popp.
58th International Scientific Conference on Economic and Social Development – Budapest, 04-05 September, 2020
365
Its use grew internationally in June 2013. The McAfee company noted in 2013 that in the first
quarter alone it had detected more than 250,000 unique types of ransomware.
3.1. Weak legal answer to ransomware attacks
The jurisdictions have acted differently when it came to punish the ransomware attacks legally.
The American state of Maryland tried to persecute ransomware attack severel, so in the first
draft of their HB 340 “made it a felony to create ransomware, punishable by up to 10 years in
prison” (Fields, 2017). This provision was found too harsh by later readings so it was dropped
from the final version of the bill. However, in Japan, a minor was arrested for creating and
distributing ransomware, thus extorting money from infected owners (Wei, 2017). But in the
UK, the things went very harsh for cyber criminals. Namely, “a British student Zain Qaiser (24)
from Barking, London was jailed for more than six years at Kingston Crown Court for his
ransomware attacks in 2019” (Casciani, 2019). He was widely considered to have been "the
most prolific cyber criminal to be sentenced in the UK" (Casciani, 2019). It is believed that he
earned more than £4 million in his career. Since he formed a whole malware gang called Luke
and got connected with Russian hackers, the legal persecutions followed in Russia and the USA.
Russian police “arrested 50 members of the Lurk malware gang in June 2016” (Rivera, 2016)
while “Raymond Odigie Uadiale, a naturalized US citizen of Nigerian descent, was jailed for
18 months” (Nichols, 2018). The more precise juridical answers to such a threat as ransomware
attacks is yet to be seen and drawn as bills in majority of countries, since the perpetrators are
being punished according to the huge variety of other laws and bills, so the comprehensive
approach which would take into an account the sophisticated nature of such crimes will be
needed in the nearest future.
4. ONLINE SEXUAL HARASSMENT AND CYBERSTALKING
Since a great deal of sexual encounters and communication migrated to an online world, the
acts that were previously restrained in the physical world are now prevalently happening in the
digital world, and the jurisdictions do not seem to be ready. Here are some facts and figures.
4.1. Online sexual harassment data
The United States Department of Justice statistics “suggest that 850,000 american adults—
mostly women—are targets of cyber-stalking each year, and 40 percent of women have
experienced dating violence delivered electronically” (Sweeney, 2014). Another study
“performed by the Pew Research Center found 40 percent of adult internet users have
experienced harassment online, with young women enduring particularly severe forms of it and
thirty-eight percent of women who had been harassed online reported the experience could be
described as extremely or very upsetting to them”. (Sweeney, 2014)
4.2. Online sexual harassment and cyber staling definition
Danielle Citron, a professor at the University of Maryland’s Francis King Carey School of Law
is an expert in this branch of the law, and we quote the following definitions of cyber stalking
made by her: “threats of violence (often sexual), spreading lies asserted as facts (like a person
has herpes, a criminal record, or is a sexual predator), posting sensitive information online
(whether that’s nude or compromising photos or social security numbers), and technological
attacks (falsely shutting down a person’s social-media account)” or a combination of various
or even all aforementioned behaviour or acts (Sweeney, 2014).
4.3. What can the jurisdiction do?
Cyberstalking in general is the use of the Internet or the use of other electronic communications
to spy on or harass an individual, group of individuals, or organisation. It may include false
58th International Scientific Conference on Economic and Social Development – Budapest, 04-05 September, 2020
366
accusations, surveillance and threats, identity theft, damage to data or equipment, seeking
minors for sex, or gathering information to harass others. The definition of harassment must
satisfy the criterion of being a reasonable person, possessing the same information, whether it
would be considered sufficient to cause suffering to another reasonable person (Bocij, 2004).
Cyberbullying is different from spatial or offline (non-Internet) stalking. However, this
sometimes leads to it, or is accompanied by the same. The legislation on cyberstalking, which
includes slut-shaming, sexual harassment and peer violence, is being very dynamically
developed across the world. We will, in this paper, try to enlist some of the leading solutions in
this area by jurisdictions.
4.4. What did the jurisdictions actually do?
4.4.1. United States
The current Federal law against cyber-stalking is at 47 USC sec. 223. The first U.S. cybercrime
law came into force in 1999 in California. Other states include a ban on cybercrime included in
harassment or harassment laws. In Florida, HB 479 was introduced in 2003 to ban
cyberstalking. The law was enacted in October 2003. Of all the Amrican states, Alabama,
Arizona, Connecticut, Hawaii, Illinois, New Hampshire, and New York have included
prohibitions against harassing electronic, computer or e-mail communications in their
harassment legislation, while the State of Texas has the Stalking by Electronic Communications
Act, enacted in 2001.
4.4.2. Australia
In Australia, the Stalking Amendment Act (1999) includes the use of any form of target attack
by cyber technology as a form of "criminal stalking".
4.4.3. United Kingdom
In the United Kingdom, the Malicious Communications Act (1998) classified cyberbullying as
a criminal offense.
4.4.4. Spain
In Spain, information on cybercrime can be obtained anonymously from security agencies:
• Telematics Group
• Mossos d'Esquadra in Catalonia
• Ertzaintz in the Basque Country
4.4.5. Poland
Stalking, including cyberstalking, was made a criminal offence under the Polish Criminal Code
on 6 June 2011.
4.4.6. Serbia
In Serbia, which is a signatory to the Convention on Cybercrime and which also has a special
prosecutor's office for high-tech crime, there are not enough legal regulations governing this
area. But as a country in transition, the NGO sector is expanding, so there are several NGOs
that deal with this problem and one of them is NOOR - one of the goals of which is to create
security on the Internet.
5. CONCLUSION
In the world nowadays there is a huge shift from the classical physical environment and social
life to an online world with non-physical presence on the Internet. The people’s choices and the
way of life are changing every year, and the year 2020 was especially interesting since the
58th International Scientific Conference on Economic and Social Development – Budapest, 04-05 September, 2020
367
whole process accelerated because of the corona-crisis. The jurisdictions have finally
understand the necessity of new lawmaking, in which the certain misconducts and crimes will
have to be punished properly, and not neglected simply because they are happening in the
virtual space, and not the real one. The new laws are appearing in every country and every state
around the globe. Cybel-stalking, online sexual harassment, data theft and digital ransoms by
ransomware hacker attacks are on the rise, so the legislation must follow suite. The recent
scandal by Cambridge Analytica which showed us that even the referenda and elections can be
altered or influenced by Big Data, its collection and selling for analysis, show us how fragile
our new world is, where the people educate online, form their political opinions online, date
online, pay online etc. The new juridical solutions have to be modern and flexible, and certain
countries are more efficient in the batte against new perpetrtators of new crimes, and the others
must follow suit immediately if they do not want to be left behind in a “dark criminal spots” of
the world
LITERATURE:
1. 17 biggest payments industry data breaches with highest impact, Retrieved 28.08.2020.
from https://paymentsnext.com/17-biggest-payments-industry-data-breaches-with-highest-
impact/
2. Bocij, P. (2004). Cyberstalking: Harassment in the Internet Age and How to Protect Your
Family. Westport: Praeger
3. Casciani, D. (2019). Zain Qaiser: Student jailed for blackmailing porn users worldwide,
Retrieved 28.08.2020. from www.bbc.com/news/uk-47800378
4. Citron, D. K. (2009). „Law's Expressive Value in Combating Cyber Gender Harassment”.
Michigan Law Review. 108: 373.
5. Davidson, J. (2010). Senate passes whistleblower protection bill, Retrieved 27.08.2020.
from http://voices.washingtonpost.com/federal-eye/2010/12/senate_passes_whistleblower
_pr.html?wprss=federal-eye,
6. Fields, L. M. (2017). "The Minority Report – Week 7 – The Half-Way Point". World News.
Retrieved 28.08.2020.
7. Gočanin, S; Đurić, S; Grujić, N. (Novembar 2013). „Dve godine zaštite: Svedočenja
uzbunjivača” (PDF). Beograd: Udruženje Eutopija. Retrieved 28.08.2020.
8. Jarrett, H. M; Bailie, M. W. (2010). "Prosecution of Computer" (PDF). Office of Legal
Education Executive Office for United States Attorneys. Retrieved 27.08.2020. from
justice.gov. Winters v. Houston Chronicle Pub. Co., 795 S.W.2d 723, 727 (Tex. 1990)
(Doggett, J., concurring).
9. Ley de Protección de Datos y Garantía de Derechos Digitales (LOPDGDD) 2018,
Retrieved 28.08.2020. from https://protecciondatos-lopd.com/empresas/nueva-ley-
proteccion-datos-2018
10. Milošević, Ž. (2017). The Power of big Data: Be afraid!, Diplomacy and Commerce,
Belgrade. Retrieved 28.08.2020. from www.diplomacyandcommerce.rs/the-power-of-big-
data-be-afraid
11. NetSec Editor (2017). "Maryland Ransomware Bill Makes Attacks Felonies". Network
Security News. Retrieved 28.08.2020.
12. Nichols, S. (2018). Florida Man laundered money for Reveton ransomware. Then Microsoft
hired him: Former network engineer gets 18 months in the clink. Retrieved 29.08.2020.
from https://www.theregister.com/2018/08/15/reveton_microsoft_hire/
13. O’Rourke, M. (2012). Whistleblower Retaliation on the Rise, Risk Management Magazine,
Retrieved 28.08.2020. from www.rmmagazine.com/2012/09/13/whistleblower-retaliation-
on-the-rise
58th International Scientific Conference on Economic and Social Development – Budapest, 04-05 September, 2020
368
14. Rivera, S. (2016). ngler by Lurk: Why the infamous cybercriminal group that stole millions
was renting out its most powerful tool, Retrieved 26.08.2020 from
https://usa.kaspersky.com/about/press-releases/2016_angler-by-lurk-why-the-infamous-
cybercriminal-group-that-stole-millions-was-renting-out-its-most-powerful-tool
15. Schneier, B. (2013), Government Secrets and the Need for Whistle-blowers, Retrieved
28.08.2020. from www.schneier.com/blog/archives/2013/06/government_secr.html,
16. Strafgesetzbuch (StGB), § 202a Ausspähen von Daten, Retrieved 28.08.2020.
17. Sweeney, M. S. (2014). What the Law Can (and Can't) Do About Online Harassment.
Retrieved 28.08.2020. from www.theatlantic.com/technology/archive/2014/11/what-the-
law-can-and-cant-do-about-online-harassment/382638
18. Wei, W. (2017). 14-Year-Old Japanese Boy Arrested for Creating Ransomware". The
Hacker News, Retrieved 27.08.2020. from https://thehackernews.com/2017/06/japanese-
ransomware-malware.html
19. Xing, L; Levitin, G. (2017). "Balancing theft and corruption threats by data partition in
cloud system with independent server protection". Reliability Engineering & System
Safety. 167: 248–254.
58th International Scientific Conference on Economic and Social Development – Budapest, 04-05 September, 2020
369
THE BROKERAGE INSURANCE COMPANIES UNDER COVID-19
FRAMEWORK (THE BULGARIAN EXPERIENCE)
Andrey Zahariev
D.A. Tsenov Academy of Economics, Svishtov, Bulgaria
Stoyan Prodanov
D.A. Tsenov Academy of Economics, Svishtov, Bulgaria
Galina Zaharieva
D.A. Tsenov Academy of Economics, Svishtov, Bulgaria
Lyudmil Krastev
D.A. Tsenov Academy of Economics, Svishtov, Bulgaria
Dimitar Kostov
D.A. Tsenov Academy of Economics, Svishtov, Bulgaria
Tsvetan Pavlov
D.A. Tsenov Academy of Economics, Svishtov, Bulgaria
Stefan Stanimirov
D.A. Tsenov Academy of Economics, Svishtov, Bulgaria
Silvia Zarkova
D.A. Tsenov Academy of Economics, Svishtov, Bulgaria
Nikolay Zdravkov
D.A. Tsenov Academy of Economics, Svishtov, Bulgaria
ABSTRACT
The history of insurance and insurance mediation in Bulgaria can be divided into four periods
- from 1878 to 1946; from 1946 to 1989; from 1989 to 2007; and after the accession of Bulgaria
to the EU in 2007. The most significant regulatory at the end of the penultimate period and the
last period are related to the establishment of the Financial Supervision Commission (2003),
the adoption of the first Insurance Code (2005) of the second, still valid new Insurance Code.
The analysis shows that the legislation of insurance intermediation in Bulgaria is undergoing
significant development in the direction of improvement and adaptation to evolving and
complicating modern market conditions. The most significant trends that are observed are in
the direction of explicitly differentiating the functions of brokers and agents; strengthening the
requirements for education and qualification of the persons managing and the persons directly
58th International Scientific Conference on Economic and Social Development – Budapest, 04-05 September, 2020
370
carrying out the activity of insurance mediation; development of the licensing and registration
regime; subordination of the requirements for brokers and agents and to other categories of
persons engaged in mediation (employees of the insurers themselves in direct sales, as well as
intermediaries developing insurance mediation as an additional activity). After 2007, all
changes are in the direction of synchronization with EU legislation and protection of consumers
of insurance products. The most significant features and current challenges of the global and
Bulgarian insurance market and in particular of the intermediaries working on it are related
to changes in the general economic conditions. Here are added changes in the financial system,
regulations, the emergence of new types of risk, changes in the insurance business
(digitalization), and the cycle of the insurance market. Among the changes with the most
significant impact since 2020 is COVID-19 as a new, global systemic risk with a huge impact
on all economic agents and on the value of insurance estimates.
Keywords: Insurance market, Brokerage insurance companies, COVID-19
1. INTRODUCTION
Risk management is one of the oldest issues in virtually all areas of human activity and
particularly in the financial and economic spheres. From a theoretical point of view, we can
distinguish three main methods of risk management - diversification, hedging and, of course,
insurance. Each of these methods is applied in a different field, where it is adjusted to address
different types of risk. Insurance is the most important and perhaps the oldest of these methods.
Its origins can be traced far back in the economic history of mankind. Insurance mitigates the
risk by distributing it among a large pool of individuals and/or legal entities. Written laws have
remained since ancient Babylon, according to which in cases of what we now refer to as
“catastrophic risk events” debtors were relieved from the obligation to repay their debts, i.e. the
effects of the event were, to a certain degree, transferred to the other people. One of the oldest
"relatives" of insurance in the course of its evolution is insurance intermediation. We can even
speculate which of the two types of business originated first and hatched the other. Anyway,
what is essential in this respect is that insurance is very closely related to and interdependent
with insurance intermediation.
2. INSURANCE INTERMEDIATION AND INSURANCE BUSINESS
2.1. Insurance development framework
The reason for this interdependence is that the insurance market is characterized by significant
information asymmetry, which is often to the detriment of the insurer rather than its clients as
would normally be the case in other markets. Consumers face the problem of insurance product
complexity, because the quality of these products cannot be assessed by the customer before
their purchase (experience goods) and quite often after they are purchased as well (credence
goods). This is why the role of insurance intermediaries is extremely important for both types
of agents in this market. Insurers compensate information asymmetry by providing the
consumers with information about product characteristics, popularity, etc. Intermediaries
provide clients with information that enables them to compare and evaluate the products and
thus gives them the opportunity to make an informed and effective choice. Since insurance
intermediaries play such an important role, the analysis and consequent optimization of their
activities are extremely important and relevant. This is also confirmed by the fact that modern
economic and social conditions are extremely dynamic – the general financial and economic
conditions constantly change, economic crises are followed by periods of economic growth,
new and unknown risks emerge and create demand for insurance coverage. On the other hand,
the insurance sector is one of the most strictly regulated sectors of the economy. Insurance
regulations strongly affect the operations of insurance intermediaries in several aspects. First
of all, the related regulations can be categorized into two groups: (1) those that directly affect
58th International Scientific Conference on Economic and Social Development – Budapest, 04-05 September, 2020
371
the insurance intermediaries, their administrative and legal organization, incl. the requirements
their employees should meet, etc. and (2) regulations intended for other sectors which have a
substantial indirect effects for insurance intermediaries’ business. The latter include
requirements for compulsory insurance lines which form a large percentage of insurance sales
in general (e.g. third-party liability.) Secondly, these regulations have both merits and demerits
- in some cases they increase the business volume and profits and in other cases they impair the
profitability of insurance intermediaries. This proves the relevance of a study on the
management of insurance intermediaries and justifies the need to refine their management
models for financial analysis of their activities so that their management decisions could take
into account both the specific conservatism of the insurance business and the dynamic
environment and regulatory changes.
2.2. Risk management and insurance products
Insurance has a number of advantages as well as disadvantages compared to other methods of
risk management. As we mentioned above, it requires a certain level of socio-economic
development, as the successful distribution of risk and the achievement of low premiums
depends on the size of the pool of insured entities as well as the insurance culture of the society.
Insurance is also not suitable for certain types of activities, such as investments, where risk
taking is essential for achieving results. At the same time, investment risk insurance would be
associated with such high premiums that it would offset the potential return. As Prodanov
(Prodanov, 2017) points out, "insurance is a conservative science in which innovation enters
slowly, and the dominant business model has remained unchanged since the beginning of the
twentieth century." Nonetheless, we can distinguish some technological and financial
innovations, which did not change the basic idea and logic of insurance, but radically affected
the way in which it is carried out. Such innovations were the Blockchain technology and Smart
Contracts, the Internet of Things concept, and insurance securitization – the transfer of
insurance risk to the capital markets изследване (Prodanov, 2017). The last one has been
increasingly popular for quite some time (for the last 20 to 30 years) and the integration of
different types of risk management and especially between insurance and hedging has been on
the increase. According Georges Dionne (Dionne, 2013), the use of derivatives as risk
management instruments arose during the 1970s, and expanded rapidly during the 1980s.
Another aspect of the above factors of change in insurance, the digitalization and digital
marketing, leads us to a very important element of insurance - the distribution of insurance
products. As in many other sectors of the economy and in particular in the sector of financial
services, market evolution in insurance has resulted in division of labour and specialization,
thus creating the role of the insurance intermediary as a link between the client and the insurance
company. Insurance intermediaries generally fall into two categories - insurance agents who
work for the insurance company and insurance brokers, who are independent of any insurance
company and represent the interests of the buyer in searching for insurance coverage. It should
be noted that this publication focuses primarily on and expresses the point of view of insurance
brokers due to a number of reasons, the most important of which is that since insurance agents
are in most cases employees of insurance companies, insurance brokers are actually the really
independent insurance intermediaries.
2.3. Insurance intermediation and insurance brokers
According to the Insurance Code in Bulgaria, insurance intermediaries are classified as
insurance brokers and insurance agents. Insurance broker is an intermediary who is independent
of any insurance company and who represents the interests of the buyer in searching for
insurance coverage. Insurance agents, on the other hand, protect the interests of the insurance
companies and are often de facto their employees.
58th International Scientific Conference on Economic and Social Development – Budapest, 04-05 September, 2020
372
Insurance agents (IA) are independent (multi-agents) if they work with multiple Insurance
Companies (IC) and dependent (tied) when they work exclusively for one IC. The specifics of
the activity of the insurance companies determine their tendency to focus on the insurance
product itself and to outsource most of its marketing to external contractors. Thus, through
functional specialization (which is essentially a type of socio-economic division of labour) a
higher efficiency of the whole system is achieved. Dahlen and Napel (Dahlen, Napel, 2004)
also argue that a mediated market of insurance products would be more efficient. They give
two reasons why mediated exchanges between two parties may lead to greater added value for
both parties than direct sales. First of all, there is a minimization of transaction costs. This seems
illogical because intermediation implies an additional markup. However, the authors explain
that an intermediary can provide an economy of scale in terms of the costs associated with
collection of information as well as product marketing. And this is really the case -
intermediaries already have networks of clients and information databases which an individual
insurer would have to incur a lot of costs to build. Dalen and Napel’s second argument for using
intermediaries to achieve greater efficiency is that they can diversify the risks and thus be
reliable third parties in transactions. This solves some problems associated with the unfair
behaviour of the party which is in a stronger position or the existence asymmetric information.
Both authors emphasize that these aspects of transactions have different weights in different
areas of economic activity but are crucial in the insurance industry. This draws attention to
another function of insurance intermediaries, which makes them particularly important for the
insurance market in general - the information function. Linking the client and the insurance
company, the insurance intermediary provides information flow in both directions. Information
about existing products, their characteristics and price is directed to customers and allows them
to compare them and make an informed decision. For insurers, the intermediary is a valuable
source of information about demand in quantitative and qualitative terms, about preferred
products, about the reaction of consumers to changes in market conditions. It is important here
to emphasize the advisory function of the broker where customers are often ignorant of the risks
associated with their activities. This advisory role gives the broker risk management functions
in relation to their clients. Since some of the intermediaries work with several or all insurers on
the market, they have and can provide the most accurate information about the competitive
structure and the market position of each insurance company. The information function of
insurance intermediaries was investigated by number of authors. Eckardt (Eckardt, 2007)
explores in depth its benefits by developing a theoretical model of insurance intermediation
from the standpoint of the general theory of information intermediation. According to him,
insurance markets are characterized by incomplete information for both parties. This can lead
to two problems – adverse selection due to reduced awareness of the existing risks and moral
hazard behaviour based on information advantage (in terms of asymmetric information).
Moreover, private insurance against the risks of longevity, unemployment, illness or disability
are goods whose quality is difficult to assess in advance (experience goods) or even after their
consumption (credence goods). The situation is aggravated further due to the long-term duration
of most such policies. This means that consumers need not only be informed about the
characteristics of the available products, but also advised on their quality and relevance for each
specific case. These problems require the intervention of intermediaries. According to the same
study (Eckardt, 2007), customers would rather use of the services of an intermediary when the
gain in intermediated exchange is greater than the gain in direct exchange. This problem can be
expressed with the following equation:
(1) (VD-CD)-(𝑇𝐶𝑜𝑛𝐷 + 𝑇𝐼𝑛𝑠
𝐷 ) < (VI-CI)-(𝑇𝐶𝑜𝑛𝐼 + 𝑇𝐼𝑛𝑠
𝐼 ),
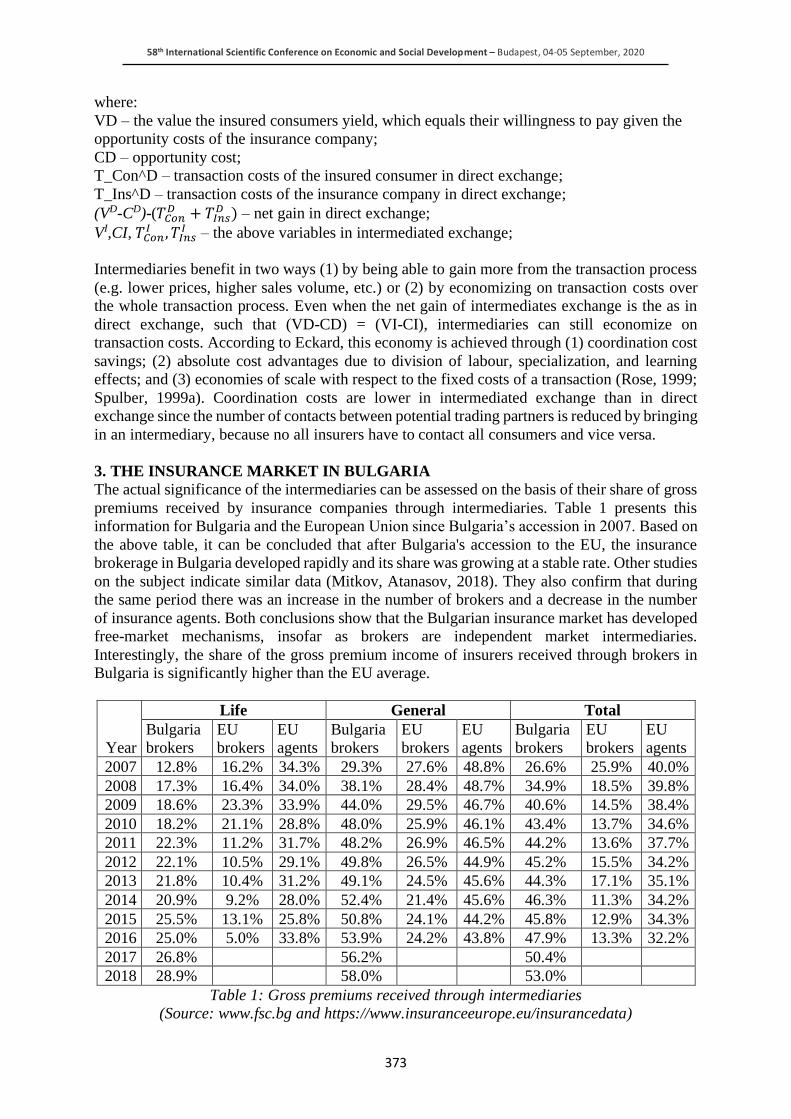
58th International Scientific Conference on Economic and Social Development – Budapest, 04-05 September, 2020
373
where:
VD – the value the insured consumers yield, which equals their willingness to pay given the
opportunity costs of the insurance company;
CD – opportunity cost;
T_Con^D – transaction costs of the insured consumer in direct exchange;
T_Ins^D – transaction costs of the insurance company in direct exchange;
(VD-CD)-(𝑇𝐶𝑜𝑛𝐷 + 𝑇𝐼𝑛𝑠
𝐷 ) – net gain in direct exchange;
VI,CI, 𝑇𝐶𝑜𝑛𝐼 , 𝑇𝐼𝑛𝑠
𝐼 – the above variables in intermediated exchange;
Intermediaries benefit in two ways (1) by being able to gain more from the transaction process
(e.g. lower prices, higher sales volume, etc.) or (2) by economizing on transaction costs over
the whole transaction process. Even when the net gain of intermediates exchange is the as in
direct exchange, such that (VD-CD) = (VI-CI), intermediaries can still economize on
transaction costs. According to Eckard, this economy is achieved through (1) coordination cost
savings; (2) absolute cost advantages due to division of labour, specialization, and learning
effects; and (3) economies of scale with respect to the fixed costs of a transaction (Rose, 1999;
Spulber, 1999a). Coordination costs are lower in intermediated exchange than in direct
exchange since the number of contacts between potential trading partners is reduced by bringing
in an intermediary, because no all insurers have to contact all consumers and vice versa.
3. THE INSURANCE MARKET IN BULGARIA
The actual significance of the intermediaries can be assessed on the basis of their share of gross
premiums received by insurance companies through intermediaries. Table 1 presents this
information for Bulgaria and the European Union since Bulgaria’s accession in 2007. Based on
the above table, it can be concluded that after Bulgaria's accession to the EU, the insurance
brokerage in Bulgaria developed rapidly and its share was growing at a stable rate. Other studies
on the subject indicate similar data (Mitkov, Atanasov, 2018). They also confirm that during
the same period there was an increase in the number of brokers and a decrease in the number
of insurance agents. Both conclusions show that the Bulgarian insurance market has developed
free-market mechanisms, insofar as brokers are independent market intermediaries.
Interestingly, the share of the gross premium income of insurers received through brokers in
Bulgaria is significantly higher than the EU average.
Year
Life General Total
Bulgaria
brokers
EU
brokers
EU
agents
Bulgaria
brokers
EU
brokers
EU
agents
Bulgaria
brokers
EU
brokers
EU
agents
2007 12.8% 16.2% 34.3% 29.3% 27.6% 48.8% 26.6% 25.9% 40.0%
2008 17.3% 16.4% 34.0% 38.1% 28.4% 48.7% 34.9% 18.5% 39.8%
2009 18.6% 23.3% 33.9% 44.0% 29.5% 46.7% 40.6% 14.5% 38.4%
2010 18.2% 21.1% 28.8% 48.0% 25.9% 46.1% 43.4% 13.7% 34.6%
2011 22.3% 11.2% 31.7% 48.2% 26.9% 46.5% 44.2% 13.6% 37.7%
2012 22.1% 10.5% 29.1% 49.8% 26.5% 44.9% 45.2% 15.5% 34.2%
2013 21.8% 10.4% 31.2% 49.1% 24.5% 45.6% 44.3% 17.1% 35.1%
2014 20.9% 9.2% 28.0% 52.4% 21.4% 45.6% 46.3% 11.3% 34.2%
2015 25.5% 13.1% 25.8% 50.8% 24.1% 44.2% 45.8% 12.9% 34.3%
2016 25.0% 5.0% 33.8% 53.9% 24.2% 43.8% 47.9% 13.3% 32.2%
2017 26.8% 56.2% 50.4%
2018 28.9% 58.0% 53.0%
Table 1: Gross premiums received through intermediaries
(Source: www.fsc.bg and https://www.insuranceeurope.eu/insurancedata)
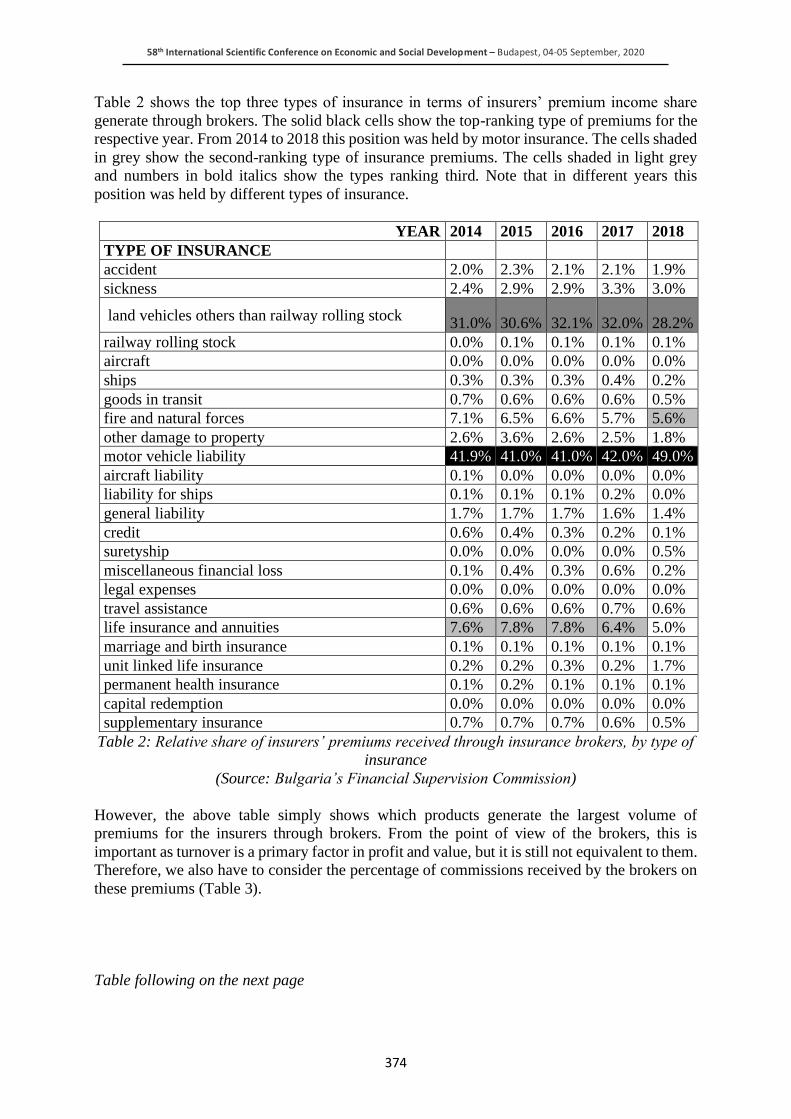
58th International Scientific Conference on Economic and Social Development – Budapest, 04-05 September, 2020
374
Table 2 shows the top three types of insurance in terms of insurers’ premium income share
generate through brokers. The solid black cells show the top-ranking type of premiums for the
respective year. From 2014 to 2018 this position was held by motor insurance. The cells shaded
in grey show the second-ranking type of insurance premiums. The cells shaded in light grey
and numbers in bold italics show the types ranking third. Note that in different years this
position was held by different types of insurance.
Table 2: Relative share of insurers’ premiums received through insurance brokers, by type of
insurance
(Source: Bulgaria’s Financial Supervision Commission)
However, the above table simply shows which products generate the largest volume of
premiums for the insurers through brokers. From the point of view of the brokers, this is
important as turnover is a primary factor in profit and value, but it is still not equivalent to them.
Therefore, we also have to consider the percentage of commissions received by the brokers on
these premiums (Table 3).
Table following on the next page
YEAR 2014 2015 2016 2017 2018
TYPE OF INSURANCE
accident 2.0% 2.3% 2.1% 2.1% 1.9%
sickness 2.4% 2.9% 2.9% 3.3% 3.0%
land vehicles others than railway rolling stock 31.0% 30.6% 32.1% 32.0% 28.2%
railway rolling stock 0.0% 0.1% 0.1% 0.1% 0.1%
aircraft 0.0% 0.0% 0.0% 0.0% 0.0%
ships 0.3% 0.3% 0.3% 0.4% 0.2%
goods in transit 0.7% 0.6% 0.6% 0.6% 0.5%
fire and natural forces 7.1% 6.5% 6.6% 5.7% 5.6%
other damage to property 2.6% 3.6% 2.6% 2.5% 1.8%
motor vehicle liability 41.9% 41.0% 41.0% 42.0% 49.0%
aircraft liability 0.1% 0.0% 0.0% 0.0% 0.0%
liability for ships 0.1% 0.1% 0.1% 0.2% 0.0%
general liability 1.7% 1.7% 1.7% 1.6% 1.4%
credit 0.6% 0.4% 0.3% 0.2% 0.1%
suretyship 0.0% 0.0% 0.0% 0.0% 0.5%
miscellaneous financial loss 0.1% 0.4% 0.3% 0.6% 0.2%
legal expenses 0.0% 0.0% 0.0% 0.0% 0.0%
travel assistance 0.6% 0.6% 0.6% 0.7% 0.6%
life insurance and annuities 7.6% 7.8% 7.8% 6.4% 5.0%
marriage and birth insurance 0.1% 0.1% 0.1% 0.1% 0.1%
unit linked life insurance 0.2% 0.2% 0.3% 0.2% 1.7%
permanent health insurance 0.1% 0.2% 0.1% 0.1% 0.1%
capital redemption 0.0% 0.0% 0.0% 0.0% 0.0%
supplementary insurance 0.7% 0.7% 0.7% 0.6% 0.5%
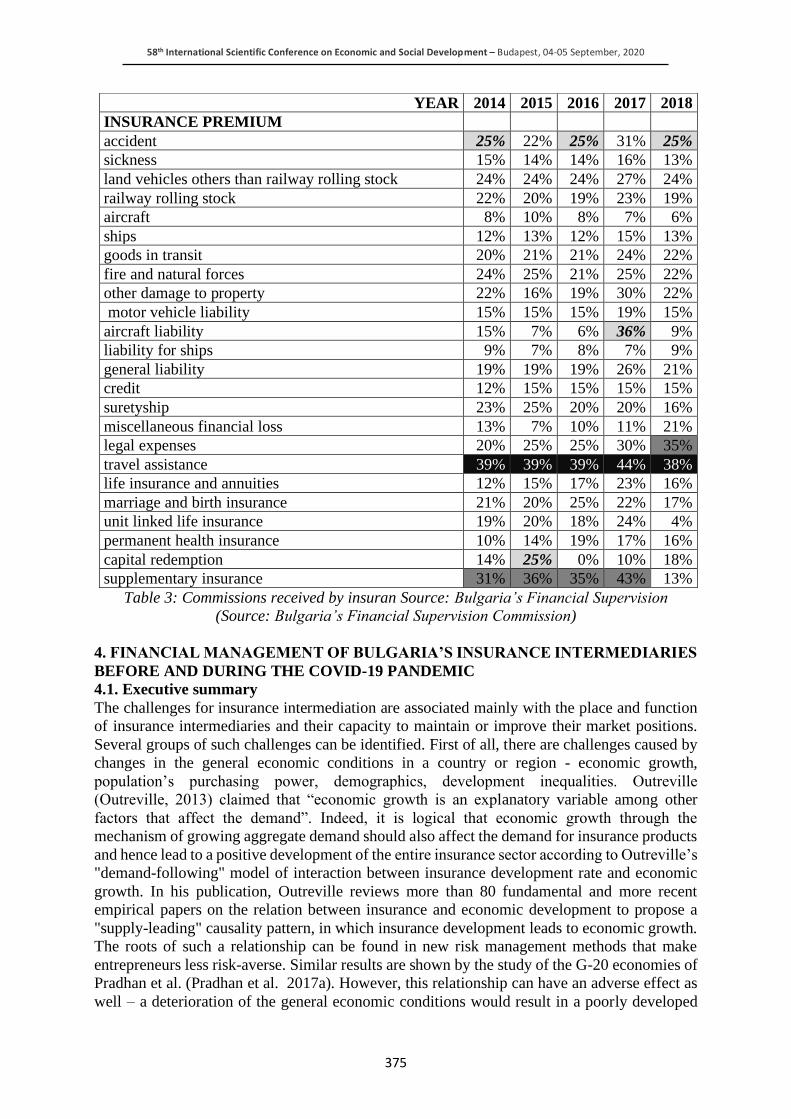
58th International Scientific Conference on Economic and Social Development – Budapest, 04-05 September, 2020
375
Table 3: Commissions received by insuran Source: Bulgaria’s Financial Supervision
(Source: Bulgaria’s Financial Supervision Commission)
4. FINANCIAL MANAGEMENT OF BULGARIA’S INSURANCE INTERMEDIARIES
BEFORE AND DURING THE COVID-19 PANDEMIC
4.1. Executive summary
The challenges for insurance intermediation are associated mainly with the place and function
of insurance intermediaries and their capacity to maintain or improve their market positions.
Several groups of such challenges can be identified. First of all, there are challenges caused by
changes in the general economic conditions in a country or region - economic growth,
population’s purchasing power, demographics, development inequalities. Outreville
(Outreville, 2013) claimed that “economic growth is an explanatory variable among other
factors that affect the demand”. Indeed, it is logical that economic growth through the
mechanism of growing aggregate demand should also affect the demand for insurance products
and hence lead to a positive development of the entire insurance sector according to Outreville’s
"demand-following" model of interaction between insurance development rate and economic
growth. In his publication, Outreville reviews more than 80 fundamental and more recent
empirical papers on the relation between insurance and economic development to propose a
"supply-leading" causality pattern, in which insurance development leads to economic growth.
The roots of such a relationship can be found in new risk management methods that make
entrepreneurs less risk-averse. Similar results are shown by the study of the G-20 economies of
Pradhan et al. (Pradhan et al. 2017a). However, this relationship can have an adverse effect as
well – a deterioration of the general economic conditions would result in a poorly developed
YEAR 2014 2015 2016 2017 2018
INSURANCE PREMIUM
accident 25% 22% 25% 31% 25%
sickness 15% 14% 14% 16% 13%
land vehicles others than railway rolling stock 24% 24% 24% 27% 24%
railway rolling stock 22% 20% 19% 23% 19%
aircraft 8% 10% 8% 7% 6%
ships 12% 13% 12% 15% 13%
goods in transit 20% 21% 21% 24% 22%
fire and natural forces 24% 25% 21% 25% 22%
other damage to property 22% 16% 19% 30% 22%
motor vehicle liability 15% 15% 15% 19% 15%
aircraft liability 15% 7% 6% 36% 9%
liability for ships 9% 7% 8% 7% 9%
general liability 19% 19% 19% 26% 21%
credit 12% 15% 15% 15% 15%
suretyship 23% 25% 20% 20% 16%
miscellaneous financial loss 13% 7% 10% 11% 21%
legal expenses 20% 25% 25% 30% 35%
travel assistance 39% 39% 39% 44% 38%
life insurance and annuities 12% 15% 17% 23% 16%
marriage and birth insurance 21% 20% 25% 22% 17%
unit linked life insurance 19% 20% 18% 24% 4%
permanent health insurance 10% 14% 19% 17% 16%
capital redemption 14% 25% 0% 10% 18%
supplementary insurance 31% 36% 35% 43% 13%
58th International Scientific Conference on Economic and Social Development – Budapest, 04-05 September, 2020
376
insurance and insurance intermediation sector. For example, in Bulgaria there is an unfavorable
combination of some of these factors - depopulation of some regions, over-concentration of
population in the capital city, low purchasing power and insurance culture of certain social
strata. This makes it difficult for intermediaries to find clients and to maintain profitability.
Sometimes these conditions result in an adverse causality between economic growth and the
development of the insurance sector. The study confirmed this hypothesis stating that in
developing economies, despite the efforts of governments to advance "adjustment" of the
financial system as well as despite the fast overall economic growth, insurance remains
underdeveloped. The second type of challenges are some changes in the financial system and
in particular the insurance intermediation sphere, such as decreasing interest rates, tariffs, etc.
There is, for example, a causality relationship between interest rates and the so-called insurance
cycle (underwriting cycle) (Wilson, 1981; Doherty, 1998). For example, the global financial
and economic crisis of 2008-2010 was followed by a wave of distrust of the financial system,
but also by a wave of regulatory changes. Baluch, Mutenga and Parsons (Baluch, Mutenga,
Parsons, 2011) investigated this and some previous financial and economic crises and found
out that recessions affect the insurance sector in several ways. First, a crisis leads to more
insurance events for risks underwritten by the insurance companies and thus to more claims and
benefits paid. The elasticity of demand for general insurance is relatively low due to certain
regulatory requirements for compulsory insurance (motor liability, etc.). However, as the
general demand inevitably decreases, insurers are forced to reduce their premiums (soft
market). Although the increase in life insurance benefits paid is not great, the demand for such
products decreases, as well as the withdrawal and redemption of funds on the policies increases.
An interesting aspect of the impact of the financial system and in particular financial crises on
insurance intermediaries is their interaction with banks as a distribution channel. Currently this
market segment is stagnant and banks are withdrawing from this type of "collaboration" with
insurers, and vice versa - some leading insurers are withdrawing as bank equity holders. This
is logical - as a result of the crisis, the pressure is primarily on banks and they have difficulty
being partners of insurers. In recent years, however, it has been proven that this process does
not have serious consequences and bank insurance continues to be a vital channel for
distribution of certain products. For example, according to the European (re)insurance
federation Insurance Europe (https://www.insuranceeurope.eu/insurancedata, 2019), this
insurance sales channel was used for selling large relative shares of life insurance in some
member states - 68.3% in Spain, 71.8% in Portugal, 76.9% in Italy, etc. Thus, the next type
challenge are normative regulations. They also have dual causality - on the one hand, they
"arrange" the market and restrict unfair competition, but on the other hand, they put higher
barriers to penetration of new businesses. An appropriate example is the evolution of the
normative regulation of insurance mediation in Bulgaria. The amendments of the legislation in
force provided for stricter requirements regarding the activities of intermediaries - first a
licensing regime was introduced, then a mandatory registration of brokers, followed by such
registration of agents. Gradually, more and more requirements are introduced regarding the
education level, qualifications, and professional experience of the persons entering the
managing bodies of brokers and/or managing and directly performing the activity of insurance
mediators. The same regulations apply to physical agents. With the latest versions of the
Insurance Code, these requirements are extended to cover other categories of physical persons
engaged in insurance intermediation - the insurers themselves when selling insurance products
directly, and intermediaries performing insurance intermediation as an ancillary activity. All
these changes are, on the one hand, a challenge to both existing and new entrants, but on the
other hand, they bring order and security to the market, which is entirely in the interest of
consumers. Regulatory changes often affect the unit price of insurance and deregulation can
lead to lower premiums (Berry‐Stolzle, Born, 2010), which modify supply, consumer demand
58th International Scientific Conference on Economic and Social Development – Budapest, 04-05 September, 2020
377
and inevitably affect the performance of intermediaries. There are also some challenges that are
specific for the intermediary segment of the insurance sector. Such a challenge are the infamous
contingent commissions which sometimes result in conflicts of interest regarding the activity
of brokers. Generally, a contingent commission is a commission paid to an intermediary by an
insurance or reinsurance company with a value dependent on the achievement of a certain goal,
such as a certain risk level of insurance policies sold, a certain level of profitability, a certain
volume of sales, etc. The closer the correspondence between what is achieved by the broker
and what is set by the insurer, the higher the commission. On the one hand, these commissions
can create a conflict of interest in the intermediary, giving him an incentive to direct clients not
to the most beneficial insurer, but to the one who pays the higher contingent commission rate.
In this context, they became infamous in 2004, when the New York Attorney General Eliot
Spitzer filed a lawsuit against the five largest brokerage firms for their business practices,
including for contingent commissions. It is believed that a significant number of insurers and
brokers have reduced the use of this type of commission since then (Ju, Browne, 2017). On the
other hand, according to some authors, contingent commissions are an important balancing
element of the market, because they overcome the typical information asymmetry and more
precisely that part of it that is to the detriment of the insurer (Cummins, Doherty, 2006). Yu-
Luen Ma et al. (Ma, Pope, Xie, 2014a) examined this practice and its effects for the financial
position of insurers with a focus on retrospectively paid commissions used in insurance to
improve the compliance with the goals of insurers and intermediaries. The authors analyzed the
financial efficiency of insurers who pay this type of commission and conclude that such insurers
are not significantly more cost-effective and efficient than insurers that do not pay contingent
commissions. However, among those who pay them, the insurers who have more of this type
of agreements with their intermediaries are more efficient and perform better than the others.
What is interesting in this case, is that the type of distribution channel used is important for the
validity of these results. Insurers generally use channels of independent intermediaries (brokers
and independent agents) who prefer contingent commissions, where the remuneration depends
on their individual performance. Conversely, the performance of the brokers determines
whether the large insurance companies would prefer to use their services if they are willing to
be paid through contingent commissions. On a more global level, there are new types of risk
caused by qualitatively new trends in social development (e.g. terrorism, climate change, digital
and cyber risks), which give rise to new insurance products with unclear long-term effect, which
in turn makes intermediaries uncertain regarding the promotion and distribution of such
contracts. Changes in the insurance sector have the greatest impact on intermediation. Prodanov
(Prodanov, 2017) points out three current trends that change the paradigm of insurance: (1)
securitization in insurance and the transfer of insurance products to financial markets; (2) the
Internet of Things concept; and (3) Blockchain technology and Smart Contracts. Quite
naturally, insurance intermediaries would be most concerned about these channels because the
Internet as a sales channel can help insurance companies increase the share of their direct sales
and displace brokers and agents or force them to "mutate" in IT aggregators. Insurance
securitization through insurance-linked (ILS) and risk-linked securities (RLS), on the other
hand, challenge the insurance sector in general and threaten to displace the insurance function
to the capital market. However, for brokers the threat may not be so great if they manage to
adjust quickly enough in the new conditions and offer the same level of information and advice
regarding these financial instruments as they do for insurance contracts. Historically, insurance
intermediation has gone through similar vicissitudes and has survived, and rightly so. The
reason lies mainly in the specific characteristics of the insurance products they sell and the fact
that their quality can often be assessed only after their consumption (experience goods) and
may not be assessed at all (credence goods). This means that customers will always need
additional consultation services regarding the insurance they need.
58th International Scientific Conference on Economic and Social Development – Budapest, 04-05 September, 2020
378
Taking into account the inherent information asymmetry of the insurance market as well, we
can confidently say that insurance intermediation will continue to play an important role in the
sector.
4.2. Selection of inputs for managerial financial analysis and financial management of
insurance intermediaries in Bulgaria
The underlying idea is that the aim of corporate financial management is to create value for the
owners or shareholders of the company (Prodanov, 2012). It is always related to the market and
the company's ability to sell its products on this market (Prodanov, Pavlov, 2016a). If this is
expressed by means of the basic model for valuation of financial assets (2), it is obvious that to
this end the performance of investments (i.e. the expected cash inflows E(CFt)) - E (CFt)) is
combined with the weighted average cost of capital (WACC as a discount rate) to achieve
optimality.
(2) 𝑉 = ∑ 𝑃𝑉[𝐸(𝐶𝐹𝑡)] = ∑𝐸(𝐶𝐹𝑡)
(1+𝑊𝐴𝐶𝐶)𝑡+∞𝑡=1
+∞𝑡=1 ,
where:
V is the value of the company;
PV[… ] is its present value; Е(CFt) is the expected cash flow at time t;
WACC is the weighted average cost of the capital of the company.
The analysis of the financial situation itself is always based on the macroeconomic environment
for business operations, where the financial sector, public debt and deficit, and fiscal regulations
(Nikonova et al. 2020) are crucial for the economic stability and growth (Zahariev et al., 2020f).
No less important are the opportunities for building supply channels, whether it is the real sector
of the economy (Laktionova et al. 2019) or the sector of financial and insurance services, where
the relationship between insurance intermediaries and insurance companies is more than
obvious. This leads to the following conclusions:
• Managerial financial analysis (Zahariev et al. 2015) is used by financial managers in their
day-to-day activities related to investment (capital budgeting) and financial decisions;
• This analysis provides information for optimal solutions of the above management
problems (Kostov, 2016);
• The optimization of financial and investment problems cannot be achieved without their
integration into a single criterion (Kanev, Terziev, 2017a; Terziev, 2020a, Terziev, 2019b-
d; Terziev et al. 2020b; Terziev, Georgiev, Solovev, 2020c-d; Terziev, Lyubcheva, Solovev,
2020e) for maximizing the company value.
Therefore, it is especially important to select factors that can provide objective grounds for
decision-making by the financial management of the insurance broker and take into account
equally well both the macroeconomic environment and the specifics of the concrete insurance
broker. Thus, in the latest study conducted in 2020, in medias res of the COVID-19 pandemic,
the following 15 key factors applicable to Bulgarian insurance brokers were identified and
empirically tested: Total average household income; Average salary per household; Total
average income per person; Average salary per person; GDP gross value added at basic prices;
Harmonized CPI; Interest rates; Wholesale and retail sales of motor vehicles and motorcycles,
maintenance and repair; Unemployed, percentage of active population; Corporate premiums;
Total premiums; Premiums central office; Retail premiums; Premiums capital city; Premiums
province (Zahariev, Stanimirov, Zdravkov, 2020h). All variables included in the model were
tested by the authors for stationarity and adjusted to the test results.
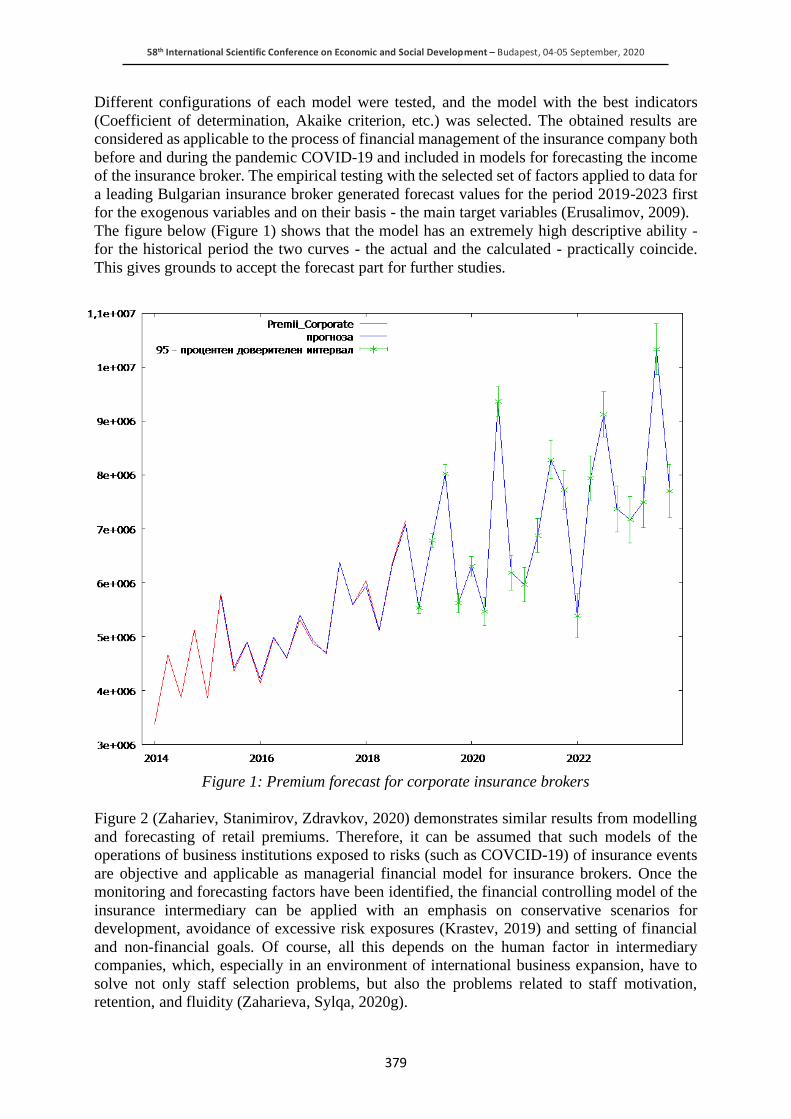
58th International Scientific Conference on Economic and Social Development – Budapest, 04-05 September, 2020
379
Different configurations of each model were tested, and the model with the best indicators
(Coefficient of determination, Akaike criterion, etc.) was selected. The obtained results are
considered as applicable to the process of financial management of the insurance company both
before and during the pandemic COVID-19 and included in models for forecasting the income
of the insurance broker. The empirical testing with the selected set of factors applied to data for
a leading Bulgarian insurance broker generated forecast values for the period 2019-2023 first
for the exogenous variables and on their basis - the main target variables (Erusalimov, 2009).
The figure below (Figure 1) shows that the model has an extremely high descriptive ability -
for the historical period the two curves - the actual and the calculated - practically coincide.
This gives grounds to accept the forecast part for further studies.
Figure 1: Premium forecast for corporate insurance brokers
Figure 2 (Zahariev, Stanimirov, Zdravkov, 2020) demonstrates similar results from modelling
and forecasting of retail premiums. Therefore, it can be assumed that such models of the
operations of business institutions exposed to risks (such as COVCID-19) of insurance events
are objective and applicable as managerial financial model for insurance brokers. Once the
monitoring and forecasting factors have been identified, the financial controlling model of the
insurance intermediary can be applied with an emphasis on conservative scenarios for
development, avoidance of excessive risk exposures (Krastev, 2019) and setting of financial
and non-financial goals. Of course, all this depends on the human factor in intermediary
companies, which, especially in an environment of international business expansion, have to
solve not only staff selection problems, but also the problems related to staff motivation,
retention, and fluidity (Zaharieva, Sylqa, 2020g).
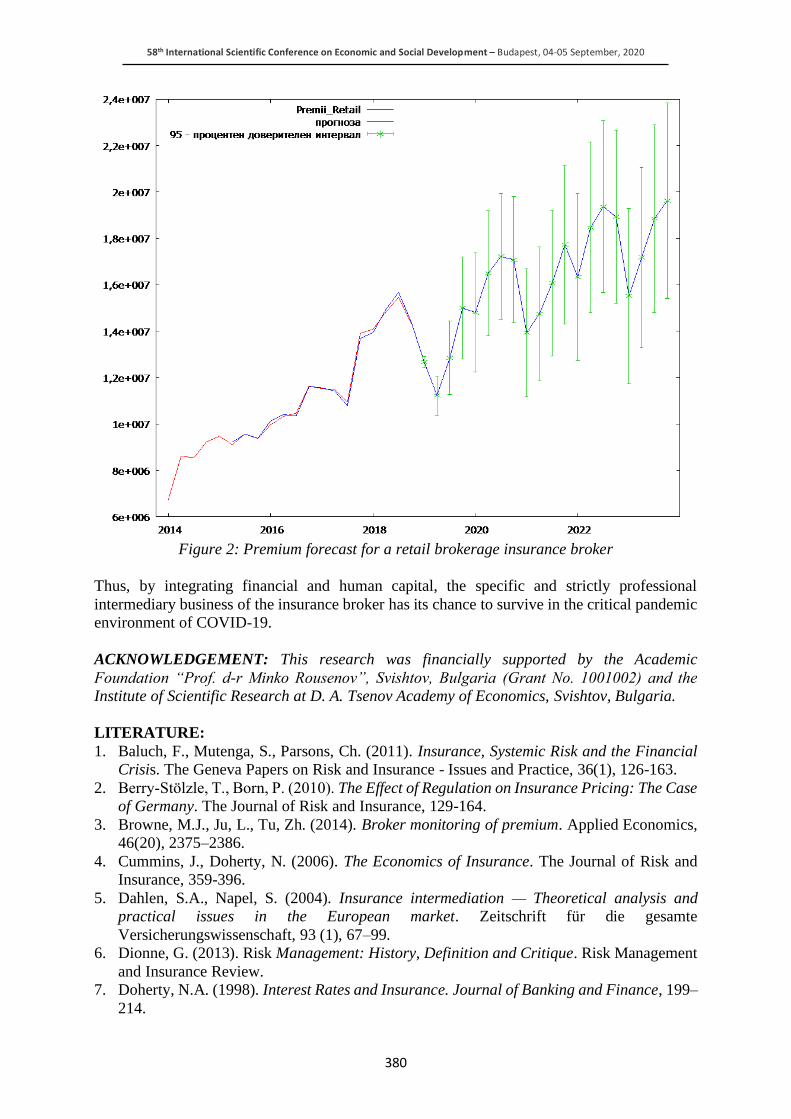
58th International Scientific Conference on Economic and Social Development – Budapest, 04-05 September, 2020
380
Figure 2: Premium forecast for a retail brokerage insurance broker
Thus, by integrating financial and human capital, the specific and strictly professional
intermediary business of the insurance broker has its chance to survive in the critical pandemic
environment of COVID-19.
ACKNOWLEDGEMENT: This research was financially supported by the Academic
Foundation “Prof. d-r Minko Rousenov”, Svishtov, Bulgaria (Grant No. 1001002) and the
Institute of Scientific Research at D. A. Tsenov Academy of Economics, Svishtov, Bulgaria.
LITERATURE:
1. Baluch, F., Mutenga, S., Parsons, Ch. (2011). Insurance, Systemic Risk and the Financial
Crisis. The Geneva Papers on Risk and Insurance - Issues and Practice, 36(1), 126-163.
2. Berry‐Stolzle, Т., Born, P. (2010). The Effect of Regulation on Insurance Pricing: The Case
of Germany. The Journal of Risk and Insurance, 129-164.
3. Browne, M.J., Ju, L., Tu, Zh. (2014). Broker monitoring of premium. Applied Economics,
46(20), 2375–2386.
4. Cummins, J., Doherty, N. (2006). The Economics of Insurance. The Journal of Risk and
Insurance, 359-396.
5. Dahlen, S.A., Napel, S. (2004). Insurance intermediation — Theoretical analysis and
practical issues in the European market. Zeitschrift für die gesamte
Versicherungswissenschaft, 93 (1), 67–99.
6. Dionne, G. (2013). Risk Management: History, Definition and Critique. Risk Management
and Insurance Review.
7. Doherty, N.A. (1998). Interest Rates and Insurance. Journal of Banking and Finance, 199–
214.
58th International Scientific Conference on Economic and Social Development – Budapest, 04-05 September, 2020
381
8. Eckardt, M. (2007). Insurance Intermediation: And Economic Analysis of the Information
Services Market. Heidelberg: Springer: Physica-Verlag.
9. Ju, L., Browne, M. J. (2017). Contingent Commissions and Market Cycles. www.aria.org:
http://www.aria.org/meetings/2007papers/IIIB%20-%201%20-%20Ju.pdf, (17 July 2007
r.).
10. Kanev, D., Terziev, V. (2017a). Behavioral economics: development, condition and
perspectives. // Proceedings of SOCIOINT 2017- 4th International Conference on
Education, Social Sciences and Humanities 10-12 July 2017- Dubai, UAE, 2017, ISBN:
978-605-82433-1-6, pp.595-606.
11. Kostov, D. (2016). A new yuan or a new monetary system. Economic Archive, LXIX(2),
pp. 68-90, https://www2.uni-svishtov.bg/nsarhiv/title.asp?title=559.
12. Krastev, L. (2019). Theoretic Aspects of Financial Controlling in the Firm. Economic
Archive, LXXII(3), pp. 17-27, https://www2.uni-svishtov.bg/NSArhiv/title.asp?title=1434
13. Laktionova, O., Dobrovolskyi, O., Karpova, T., & Zahariev, A. (2019а). Cost efficiency of
applying trade finance for agricultural supply chains. Management Theory and Studies for
Rural Business and Infrastructure Development, 41(1), стр. 62-73.
doi:10.15544/mts.2019.06
14. Ma, Y., Pope, N., Xie, X. (2014a). Contingent Commissions, Insurance Intermediaries, and
Insurance Performance. Risk Management & Insurance Review, 61-81.
15. Nikonova, E., Sabitova, N., Shavaleeva, C., Khairullova, A., & Zahariev, A. (2020). Tax
capacity of the Russian Federation constituent entities: problems of assessment and
unequal distribution. (S. L. Gabdrakhmanov N.) Springer Proceedings in Business and
Economics(Series Online ISSN: 2198-7254 ), pp. 79-86. doi:https://doi.org/10.1007/978-3-
030-39859-0_7
16. Outreville, J. (2013). The Relationship Between Insurance and Economic Development: 85
Empirical Papers for a Review of the Literature. Risk Management and Insurance Review.
17. Pradhan, R., Arvin, M., Nair, M., Hall, J., Gupta, A. (2017a). Is there a link between
economic growth and insurance and banking sector activities in the G-20 countries?
Review of Financial Economics, 33, 12-28.
18. Prodanov, S. (2012). Capital budgeting. Veliko Tarnovo: ABAGAR Publishing House.
19. Prodanov, S., Pavlov, T. (2016a). Comparative Analysis of the Leading Consumption-Based
Asset Pricing Models. Economic Archive, LXIX(1), стр. 20-46. Извлечено от
https://www2.uni-svishtov.bg/nsarhiv/title.asp?title=531
20. Rose, F. (1999). The Economics, Concept, and Design of Information Intermediaries.
Heidelberg: Physica-Verlag.
21. Spulber, D. (1999a). Market Microstructure: Intermediaries and the Theory of the Firm.
New York: Cambridge University Press.
22. Terziev, V. (2020a). Programming as mechanism of managing, oriented towards results. //
50th International Scientific Conference on Economic and Social Development
Development, 13-14 February 2020, Chelyabinsk, Economic and Social Development,
2020, pp. 92-98, ISSN 1849-7535.
23. Terziev, V. (2019b). The role of business in society. // Proceedings of SOCIOINT 2019-
6th International Conference on Education, Social Sciences and Humanities 24-26 June
2019- Istanbul, Turkey, International Organization Center of Academic Research, Istanbul,
Turkey, 2019, pp. 324-330, ISBN: 978-605-82433-6-1.
24. Terziev, V. (2019c). Social entrepreneurship in Bulgaria and Europe. // Proceedings of
SOCIOINT 2019- 6th International Conference on Education, Social Sciences and
Humanities 24-26 June 2019- Istanbul, Turkey, International Organization Center of
Academic Research, Istanbul, Turkey, 2019, pp. 337-345, ISBN: 978-605-82433-6-1.
58th International Scientific Conference on Economic and Social Development – Budapest, 04-05 September, 2020
382
25. Terziev, V. (2019d). The role of social policy in economic development. // Proceedings of
SOCIOINT 2019- 6th International Conference on Education, Social Sciences and
Humanities 24-26 June 2019- Istanbul, Turkey, International Organization Center of
Academic Research, Istanbul, Turkey, 2019, pp. 396-404, ISBN: 978-605-82433-6-1.
26. Terziev, V., Bencheva, N., Stoeva, T., Georgiev, M. (2020b). Developing social
entrepreneurship in the EU: a cross-country analysis. // Proceedings of INTCESS 2020-
7th International Conference on Education and Social Sciences 20-22 January, 2020 -
DUBAI (UAE), International Organization Center of Academic Research, Istanbul, Turkey,
2020, pp. 746-753, ISBN: 978-605-82433-8-5.
27. Terziev, V., Georgiev, M., Solovev, D. (2020c). Management control in implementation of
the social program. // Proceedings of INTCESS 2020- 7th International Conference on
Education and Social Sciences 20-22 January, 2020 - DUBAI (UAE), International
Organization Center of Academic Research, Istanbul, Turkey, 2020, pp. 870-879, ISBN:
978-605-82433-8-5.
28. Terziev, V., Georgiev, M., Solovev, D. (2020d). Regulating social development and the
concept of controlling. // Proceedings of INTCESS 2020- 7th International Conference on
Education and Social Sciences 20-22 January, 2020 - DUBAI (UAE), International
Organization Center of Academic Research, Istanbul, Turkey, 2020, pp. 880-892, ISBN:
978-605-82433-8-5.
29. Terziev, V., Lyubcheva, M., Solovev, D. (2020e). The interaction: business- education-
investment for development. // Proceedings of INTCESS 2020- 7th International Conference
on Education and Social Sciences 20-22 January, 2020 - DUBAI (UAE), International
Organization Center of Academic Research, Istanbul, Turkey, 2020, pp. 865-869, ISBN:
978-605-82433-8-5.
30. Wilson, W. C. (1981). The Underwriting Cycle and Investment Income. CCPU Journal (34),
225-232.
31. Zahariev, A., & others. (2015). Financial Analysis. Svishtov: AI "Tsenov", 2015.
32. Zahariev, A., Zveryakov, M., Prodanov, S., Zaharieva, G., Angelov, P., Zarkova, S., &
Petrova, M. (2020f). Debt management evaluation through support vector machines: on the
example of Italy and Greece. Entrepreneurship and Sustainability Issues, 7(3), 2382-2393.
doi:https://doi.org/10.9770/jesi.2020.7.3(61)
33. Zaharieva, G., Sylqa, D. (2020g). Personnel Turnover Management Practices in Bulgaria.
Economic Archive, LXXIII (2), стр. 30-42.
34. Erusalimov, R. (2009). Internet i zastrahovane. Panorama na truda, 37-42 (Ерусалимов, Р.
Интернет и застраховане. Панорама на труда, 2009, 37-42).
35. Zahariev, A., Stanimirov, S., Zdravkov, N. (2020h). Upravlenski finansov model na
zastrahovatelen broker v Balgariya – metodicheski i prilozhni aspekti. Dialog, str. 1-31.
Izvlecheno ot https://www2.uni-svishtov.bg/dialog/title.asp?title=1548 (Захариев, А.,
Станимиров, С., Здравков, Н. Управленски финансов модел на застрахователен
брокер в България – методически и приложни аспекти. Диалог, стр. 1-31, 2020,
Извлечено от https://www2.uni-svishtov.bg/dialog/title.asp?title=1548).
36. Mitkov, M., Atanasov, M. (2018). Predizvikatelstva pred zastrahovatelnite posrednitsi v
usloviyata na novi regulatsii. Almanah „Nauchni izsledvaniya“, 2018, 290-317. (Митков,
М., Атанасов, М. Предизвикателства пред застрахователните посредници в условията
на нови регулации. Алманах „Научни изследвания“, 2018, 290-317).

58th International Scientific Conference on Economic and Social Development – Budapest, 04-05 September, 2020
383
37. Prodanov, S. (2017). Finansovi i tehnologichni inovatsii, promenyashti paradigmata na
zastrahovaneto. Savremenni predizvikatelstva pred finansovata nauka v promenyashta se
Evropa: Mezhdunarodna nauchnoprakticheska konferentsiya: Sbornik dokladi, str. 284-
291, 2017, Svishtov. (Проданов, С. Финансови и технологични иновации, променящи
парадигмата на застраховането. Съвременни предизвикателства пред финансовата
наука в променяща се Европа: Международна научнопрактическа конференция:
Сборник доклади, стр. 284-291, 2017, Свищов).
58th International Scientific Conference on Economic and Social Development – Budapest, 04-05 September, 2020
384
ACHIEVED RESULTS OF THE BULGARIAN PROSECUTOR`S
OFFICE IN THE PROSECUTION AND INVESTIGATION OF CRIMES
OF CORRUPTION
Venelin Terziev
Georgi Rakovski Military Academy, Sofia, Bulgaria
University of Rousse, Rousse, Bulgaria
Kaneff University Hospital, Rousse, Bulgaria
Marin Georgiev
Kaneff University Hospital, Rousse, Bulgaria
Stefаn Bankov
Ministry of Interior, Sofia, Bulgaria
ABSTRACT
The Bulgarian Prosecutor's Office shall ensure that legality is observed by bringing charges
against criminal suspects and supporting the charges in indictable cases; overseeing the
enforcement of penalties and other measures of compulsion; taking action for the rescision of
all unlawful acts and for restoration in urgent cases of unwarrantedly exercised right, contested
also by another; taking part in civil and administrative suits whenever required to do so by law.
The main activity of the Bulgarian Prosecutor's Office, prosecuting and bringing charges
against specific individuals, is unthinkable without the operational capacity of the executive
bodies. In exercising its powers of detecting a specific criminal activity, it is necessary to
establish a number of data, which will then be collected as evidence and verified in the course
of criminal proceedings. This activity is worth much by detecting crimes of corruption.
Keywords: Bulgarian Prosecutor`s Office, Progress, Activity, Positive Results, Good Practices
1. INTRODUCTION
As repeatedly pointed, the corruption is one of the main priorities of the Prosecutor`s Office in
recent years. Our activity, however, is a small part of the whole process of counteracting such
kind of criminality – our activity is limited to criminal prosecution, under the current legislation,
of the persons who have committed the corruption crimes, as well as to the minimum degree of
prevention by supervising the legality. Decreasing the corruption level, not only in our country,
but also in Europe and worldwide, is a task and a challenge for every country. The criminal
proceedings themselves cannot eradicate this phenomenon, which is impossible without the
political will for tackling corruption, effective interaction between the judiciary and the
executive and an adequate legal basis.
2. THE CHALLENGES TO THE BULGARIAN PROSECUTOR`S OFFICE
One of the most significant results of the recent years reforms, carried out in the field of anti-
corruption, is the transfer of high level corruption cases from the territorial district courts and
prosecutor`s offices, respectively Sofia City Court and Sofia City Prosecutor`s Office (having
in mind their special competence under Art. 35, para 3 of the Criminal Procedure Code) to the
Specialized Criminal Court and the Specialized Prosecutor`s Office as. As mentioned above,
we share the opinion that creation of specialized jurisdictions is a good working European
practice, giving positive results, including in our country.
58th International Scientific Conference on Economic and Social Development – Budapest, 04-05 September, 2020
385
In this way, firstly the dependences were overcome at local level, within which quite often most
corruption cases against municipality and district mayors were finally resolved, as well as the
corruption risk among magistrates was significantly reduced. Secondly, a legal framework was
established under which bodies specialized in resolving the most serious cases in the country,
organized crime and terrorism, shall consider also corruption cases that are of no less public
importance. This facilitates the possibility of forming a sustainable practice, which in turn
would speed up the criminal process. In this way the recommendation contained in the
Independent Analysis of the Structural and Functional Model of the Prosecutor`s Office and its
Independence, carried out in 2016 by the EU Office for Technical Support, was implemented,
namely: to transfer corruption cases to the Specialized Criminal Court, “where there is more
constructive interaction between prosecutors and judges and less formalism”. It is a common
opinion amid the legal community in our country that the very formalistic Criminal Procedure
Code needs to be amended (even to be revised), while the Criminal Code dated 1968 need a
complete revision in order to fully reflect the contemporary phenomena and trends in
criminality. This opinion is to be found also in the Report on the Independent Analysis of the
Model of the Prosecution in 2016, highlighting a number of other shortcomings of the current
substantive and procedural criminal law, which hinders not only the detection of corruption
crimes but also conventional crime in general. For example, the results of "preliminary
inspections", in cases where the signal submitted by a citizen or an organization does not
contain sufficient evidence of a crime, have no procedural value in the course of criminal
proceedings. Therefore, it is necessary to repeat all these preliminary actions in the course of
the criminal proceedings, but performed through the means of proof provided for in the
Criminal Procedure Code and in compliance with the procedural guarantees provided in it that
in many cases are unnecessarily formalistic. This greatly complicates the procedural activity in
terms of the amount of evidence gathered in the course of the investigation, due to which the
two-month investigation period provided for in the law (although with the option to be extended
many times), seems unrealistic. Another example of increased formalism in terms of procedural
rules is the impossibility for public statements of guilt expressed by a particular person to have
probative value before the court. There is also an opinion and recommendation, given again by
the experts who carried out the independent analysis of the structural and functional model of
the prosecution, for a comprehensive revision of the principle of decision-making according to
internal conviction by prosecutors, which the experts believe should be amended, especially
what concerns the Prosecution. It should be noted that in case the current legal situation remains
unchanged, it is very likely that organizational methodological measures will be taken and that
the relevant instruction will be issued, which will give clear guidelines on the application and
interpretation of Article 14 of the Criminal Procedure Code. Another extremely serious problem
for law enforcement, related to the formalism of the Bulgarian criminal process, is the content
of the indictment, which is the final prosecutorial act by which the case is submitted for
consideration to the court. On this issue, some measures were taken at the legislative level to
simplify it, but the established practice continues, the content of the indictment to be so detailed
in fact that it is as if the prosecutor who prepared the indictment was a witness, an eyewitness
to the crime. This situation is a function of the excessive guarantees that the Criminal Procedure
Code provides for the right to defense of the accused. We fully support the recommendation
pointed in the Independent Analysis of the Structural and Functional Model of the Prosecutor`s
Office, that the content of the indictment should contain, in the shortest possible and synthesized
form, the circumstances related to the crime, as well as the institute of the so - called substantial
procedural violations should be seriously revised. We consider that the current provisions of
the Criminal Procedure Code dealing with indictments create problems not only for the
effectiveness of prosecutors, but also for the effectiveness of the entire criminal justice system.
58th International Scientific Conference on Economic and Social Development – Budapest, 04-05 September, 2020
386
Compared to other EU member states the indictments in our country require unnecessary
details. In order to be comprehensive, it should be noted that even in cases with a high level of
public interest (that should not be subject to unnecessary delays) it is common practice for
judges to return cases to prosecutors due to minor omissions in the preparation of the
indictment, which is quite possible to be removed during the trial phase of the process. We
should mention here some positive legislative amendments, facilitating the trial phase. For
example, it is no longer necessary to read the indictment before the court, a copy of which the
accused person has at its disposal before the court hearing and the content of which the accused
person was obliged to get acquainted with. Instead, an obligation was introduced for the
prosecutor to present to the court a summary of the facts of the indictment, determining the
criminal liability of the particular defendant. Thus, another one of the recommendations of the
experts carried out the independent analysis was implemented. There are also a number of
problems with the Criminal Code, especially with regard to the fight against corruption.
Currently, in our criminal law the provocation to bribe continues to be criminalized. Taking
into account the specific objectives that the "parties" pursue in the giving and receiving of the
respective benefit, we believe that this text of the Criminal Code completely undermines the
course of almost any criminal proceedings with such an object of investigation. The provision
itself was adopted in 2000, in a historical period accompanied by numerous corrupt practices,
mostly related to the privatization of state property, and high levels of corruption risk. That is
why we find that if, political will for tackling corruption is in fact to be demonstrated, a
mandatory step in this direction is the decriminalization of the provocation to bribery. We also
find that the state should apply a complex and differentiated approach to the individualization
of the punishment of persons who have committed corruption crimes. In this regard, legislative
changes are needed to ensure the wider use of accomplices and other participating defendants
(through agreements, if necessary) against the person who committed the corruption offense in
question (giving them the opportunity to be prosecuted first or to be granted immunity). Of
course, we also take into account the need to fully guarantee the protection of their physical
integrity, given the risks that arise as a result of their assistance to law enforcement agencies.
In this sense, is also one of the recommendations of the Independent Analysis. It is necessary
to be given a new meaning to the Art. 282 of the Criminal Code / malfeasance /as the violation
or abuse of official duties do not apply to the officials in the trade companies, and the corruption
crimes need to cover the private sector as well. In the same way, we believe that it makes sense
to adopt provisions that criminalize the commission of the criminal act itself, without the need
to prove any harm caused by the breach of the procurement rules. It is necessary to introduce a
legislative mechanism according to which seized illegally acquired assets should be
“reinvested” for the purposes of criminal proceedings or to compensate the victims of the crime.
Such a mechanism exists partially, with regard to citizens and legal entities, through the figure
of the “civil plaintiff”, but in cases of corruption offenses, for example, there is no mechanism
by which the subject of the crime - the material benefit seized to the benefit of the state to be
used for the purposes of forthcoming criminal proceedings (Terziev, Bankov, Georgiev, 2018-
a; 2020).
3. CONCLUSION
As a contribution to the reforms for counteracting corruption should be mentioned the
improvement of the legal basis in the field of securing and seizure (confiscation) of illegally
acquired assets. In accordance with the requirements of Directive 2014/42/EU of the European
Parliament and of the Council of 3 April 2014, definitions of “direct and indirect benefit” were
introduced, fully covering the definition of "benefit" under Art. 2, item 1 of the Directive (Art.
53, para. 3, point 1 and point 2 of the Criminal Code), the possibilities for confiscation of
property were expanded (Art. 53, para. 1, item “a” of the Criminal Code) and an adequate
58th International Scientific Conference on Economic and Social Development – Budapest, 04-05 September, 2020
387
mechanism was created for management of secured assets until its subsequent confiscation,
seizure according to an effective judicial act. The use of the procedural methods for application
of the protective measures under Art. 72 and Art. 72a of the Criminal Procedure Code (freezing
of property) guarantees the actual execution of property sanctions (fine, confiscation, seizure to
the benefit of the state). The normative and structural changes allow to effectively implementing
the interaction with the Commission for Combating Corruption and Confiscation of Illegally
Acquired Assets in the implementation of the activities under Chapter Nine by the bodies under
Article 16, para. 2 of Anti-corruption and Illegal Assets Forfeiture Act and the management of
the property in respect of which the measures were applied (Terziev, Nichev, Bankov, 2016-a).
LITERATURE:
1. Terziev, V., Bankov, S., Georgiev, M. (2018). The Stability and growth pact: pursuing
sound public finances and coordinating fiscal policies in the EU member states. // Journal
of Innovations and Sustainability, Plovdiv, Bulgaria, 4, 2018, 3, pp. 53-68, ISSN 2367-
8127 (CD-ROM), ISSN 2367-8151 (on-line).
2. Terziev, V., Bankov, S., Georgiev, M. (2018a). The Change in the approach of the court of
justice of the European Union in the context of market freedoms and internal situations. //
Journal of Innovations and Sustainability, Plovdiv, Bulgaria, 4, 2018, 3, pp. 85-112, ISSN
2367-8127 (CD-ROM), ISSN 2367-8151 (on-line).
3. https://www.parliament.bg/bg/const (2020).
4. Terziev, V., Nichev, N., Bankov, S. (2016). Corruption and national security. //
Mezhdunarodnayy nauchnnayy zhurnal Inovatsionnaya nauka, №10-3/2016, Chastyah 3,
Ufa, Rossiya, ISSN 2410-6070, s.189-196 (Terziev, V., Nichev, N., Bankov, S. Corruption
and national security. // Международный научнный журнал Иновационная наука, №10-
3/2016, Частях 3, Уфа, Россия, ISSN 2410-6070, с.189-196).
5. Terziev, V., Nichev, N., Bankov, S. (2016a). National security of the republic of Bulgaria.
// Science and practice: Collection of scientific articles. Thoroe-Bowker, Melbourne,
Australia, 2016, ISBN 978-0-9942661-3-2, pp.12-21.