figure 3-5 break line and dtm prepared by figure 3-6
TRANSCRIPT

44
(i) DTM generation
DTM was generated automatically with 50m grid interval using automatic generation method. Then, DTM was edited on sections with lower accuracy of automatic matching, such as the shadowy parts of valleys, forests, water bodies, and etc. The trainees learned this process without difficulties. Generally, an experienced operator edits about 10,000 points; the number of points edited by the trainees was about 5,000 at the time of training. How much to lower the points at tree tops comes with experiences; the initial level of operation was not as fast as expected. For the break lines, rivers were instructed to be extracted. Trees were also present along rivers; heights were also carefully extracted. The trainees were more experienced in stereoscopic viewing at this stage; there were fewer errors in heights.
Figure 3-5 Break line and DTM Prepared by
Trainees Figure 3-6 Contour lines generated by Trainees
(ii) Contour line drawing
The manual contour line drawing was included in one of the items to be transferred. The manual editing was more than a challenge, since generally it takes four or more years to produce respectable results of contour lines. Therefore, the method of contour line creation was focused on the editing of the automatically generated contour lines.
The index contour lines (100m) and the intermediate contour lines (20m) were auto-matically generated from corrected DTM and break lines. Then, the contour line data were put on the stereo images using "ImageStation" (superimposition), and the 3-dimensional inspection and data correction were conducted by viewing stereoscopic images.
3) Vector Data Editing
"MicroStation GeoGraphics" was used and plotting data were edited in the following procedure: 1) Inspection and correction on edges of adjoining plotting map sheets; 2)

45
Inspection and correction of data level, color and other referring to field identification results and existing survey maps; 3) Deletion of duplicated data, overlapping point, minute line, and minute polygon data; 4) Elimination of false notes and line thinning by attribute; 5) Segmentation of data by attribute; 6) Removal of gaps and dangles of data by attribute; 7) Inspection and correction of center points for polygon data preparation; 8) Polygon preparation; and 9) Data transfer to a dxf data format.
As shown in the plotting, the plotted results were edited. There are functions to edit gaps and dangles, but the instructor encouraged manual methods until the trainees get used to the operation and become capable of dealing with unwanted outcomes from automatic editing functions.
For contour line editing, contour lines did not come as smooth as they should have been. The instructor prepared, partially, contour lines of the trainees' OJT plotting areas. The instructor overlaid the results with the results from the trainees. The visual presenta-tion of the differences of contour lines produced by experts and novice were clearly identifiable on screen. The trainees acknowledge the difference and practiced to edit the contour lines as in the sample of the exact location prepared by the instructor.
One trainee had higher mathematics' skills than the others. The instructor selected the trainee and gave intensive training on aerial triangulation so that the trainee will become a future instructor for aerial triangulation in Nicaragua. Still more experiences will be necessary to anticipate outcomes from certain point selection and to deal with unwanted outcomes as often the case with incomplete models.
For DTM generation and editing, the trainees attained the satisfactory level. There is room of improvement in efficiency of DTM editing. Simply more practice will be re-quired; the instructor's guidance for this operation is no longer necessary.
The result of the contour line editing could not be used directly without correction of the instructors. This does not mean that the trainees cannot acquire the skill. The in-structors' assessment is that the trainees will be able to continue practicing without the instructors. With practice and experiences, the trainees will be able acquire the level of a professional.
(4) Introduction to GIS and Operations of ArcGIS
1) Structure and Schedule
The objectives of “Introduction to GIS and Operations of ArcGIS” were to acquire knowledge and skills on: 1) Concept of Geospatial database; 2) Functions and Capabili-ties of GIS; and 3) ArcGIS Software Operations. The course was designed for the staff of the Department of Geodesy & Cartography, and Geophysics in INETER. A total of Nineteen (19) trainees participated in this training course. This course consisted of four OJT sessions in Nicaragua, which was conducted during following period:
Along with the introduction to Geographic Information System (GIS), the OJT-1 fo-cused on basic operations of ArcInfo for the trainees to familiar the software. The main theme of the OJT-2 was to introduce the ArcCatalog and ArcMap components of ArcGIS with their basic operations. The OJT-3 aimed to the advanced operations of ArcGIS. The main covered operations were about screen digitizing, and symbolization. The OJT-4 covered the conversion of dxf data to coverage step by step.
The trainings were designed to be practical as much as possible. For that purpose, the format of GIS Technology was divided into three parts: lectures, demonstrations, and hands-on sessions. For each class, a lecture was conducted first including all the at-tended trainees. Moreover, the hands-on sessions were designed for immediate practice for the trainees on the personal computer. Since there were more trainees than available personal computers with ArcGIS Software, all the trainees were divided into three

46
groups with further up to two sub-groups to arrange the practice sessions on two per-sonal computers. The time for each group was allocated carefully so that all were able to use a terminal as much as possible. Following photographs show the training situation:
Photo 3-8 A Lecture Session of GIS Training
Photo 3-9 A Practice session GIS Training
The list of attended trainees is presented in following table:
Table 3-7 List of Participants (Introduction to GIS) Name Affiliation
Ramón Avilés Aburto Department of Geodesy & Cartography Mayra Silva Diaz Department of Geodesy & Cartography Dina Flores Huembes Department of Geodesy & Cartography Alberto Orozco Navarro Department of Geodesy & Cartography Francisco Pérez Pérez Department of Geodesy & Cartography Ramón Alonso Torrez Rodríguez Department of Geodesy & Cartography Nestor Rodríguez Department of Geodesy & Cartography Oliver Valladares Saballos Department of Geodesy & Cartography Fernando Osorio Salazar Department of Geodesy & Cartography Isidro Jarquín Vélez Department of Geodesy & Cartography Aaron Godoy Zamora Department of Geodesy & Cartography Ena Gámez Balmaceda Department of Geophysics Virginia Tenorio Bellanger Department of Geophysics Antonio Alvarez Castillo Department of Geophysics Edna Gómez Department of Geophysics Marisol Echaverry López Department of Geophysics Tupac Obando Rivera Department of Geophysics Armando Saballos Department of Geophysics Emilio Talavera Department of Geophysics

47
Table 3-8 List of Participants to the Course on Introduction to GIS and Operations of ArcGIS
Since many trainees participated during OJT-1 to OJT-3, they were divided into three groups with further into two sub-groups (two persons in each). During OJT-4, the trainees were divided into two groups with further into two sub-groups.
2) Content Description
(a) OJT-1
During OJT-1, the major items included were: 1) Introduction of GIS; 2) Introduction of ArcGIS Software; 3) Practice of Basic Commands at ArcInfo Workstation.
i. Introduction of GIS:
This was presented with emphasis on: What is GIS; Concepts of Geospatial Data; Why GIS is needed (its Benefits); Basic Functions of GIS; How GIS Works; What GIS Can Do; and Applications of GIS.
ii. Introduction to ArcGIS
ArcGIS is an integrated collection of GIS software products for building a complete GIS for an organization. This software, in combination with the geodatabase, provides the tools to assemble intelligent GIS. As presented in Figure 3-7, this software has wide range of products.
Attendance S. No. Name of Trainee Affiliation
OJT-1 OJT-2 OJT-3 OJT-41 Isidro Jarquín Vélez GC ● ● 2 Mayra Silva Diaz GC ● 3 Ramón Aviles Aburto GC ● 4 Dina Flores Huembes GC ● ● ● ● 5 Aaron Godoy Zamora GC ● ● ● ● 6 Ramón Alonso Torrez Rodríguez GC ● ● 7 Emilio Talavera G ● 8 Marisol Echaverry López G ● ● ● 9 Armando Saballos G ● ● 10 Ena Gámez Balmaceda G ● ● ● ● 11 Fernando Osorio Salazar GC ● ● 12 Alberto Orozoco Navarro GC ● ● 13 Oliver Valladares Saballos GC ● ● 14 Francisco Pérez Pérez GC ● ● ● 15 Virginia Tenorio Bellanger G ● ● 16 Nestor Rodríguez GC 17 Antonio Alvarez Castillo G ● 18 Tupac Obando Rivera G ● GC - General Management of Geodesy and Cartography; G - General Management of Geophysics; ● - Means Attended

48
ArcGIS Family of Products
ArcGIS Family of Products
ArcIMSArcGIS ServerArcSDEGIS Portal Toolkit
ArcGIS Engine ArcPadMobile ArcGIDesktop Syste
ArcReaderArcviewArcEditorArcInfo
ArcGIS DesktopExtensions, e.g.:
ArcGIS DesktopApplications, e.g.:
- ArcCatalog- ArcMap- ArcToolbox
-ArcGIS3D Analyst- ArcGIS Spatial Analyst- ArcGIS Survey Analyst
Desktop GIS Embedded GIS Mobile GISServer GIS
ArcGIS Family of Products
ArcGIS Family of Products
ArcIMSArcGIS ServerArcSDEGIS Portal Toolkit
ArcGIS Engine ArcPadMobile ArcGIDesktop Syste
ArcReaderArcviewArcEditorArcInfo
ArcGIS DesktopExtensions, e.g.:
ArcGIS DesktopApplications, e.g.:
- ArcCatalog- ArcMap- ArcToolbox
-ArcGIS3D Analyst- ArcGIS Spatial Analyst- ArcGIS Survey Analyst
ArcReaderArcviewArcEditorArcInfo
ArcGIS DesktopExtensions, e.g.:
ArcGIS DesktopApplications, e.g.:
- ArcCatalog- ArcMap- ArcToolbox
-ArcGIS3D Analyst- ArcGIS Spatial Analyst- ArcGIS Survey Analyst
Desktop GIS Embedded GIS Mobile GISServer GIS
Figure 3-7 ArcGIS Family of Products iii. Practice of Basic Commands at ArcInfo Workstation
The basic commands practiced during this trainig using ArcInfo Workstation were: ARCTOOLS, BUILD, CLEAN, CREATEWORKSPACE, CREATE, COPY, DESCRIBE, FREQUENCY, GENERATE, KILL, LISTCOVERAGES, LISTWORKSPACES, PROJECT, PROJECTDEFINE, QUIT, UNGENERATE, UNLOAD, WORKSPACE, and so on.
(b) OJT-2
Along with reviewing the contents of OJT-1, the Study Team included new major items during OJT-2. They were: 1) Introduction of ArcCatalog and ArcMap; 2) Data con-version; 3) DEM preparation; and 4) 3D & Spatial Extensions.
i. Introduction of ArcCatalog and ArcMap
Sample data were used and the basic functions and the operational approach to Arc-Catalog and ArcMap were explained. The main points were as follows:
ArcCatalog:
• Start and end ArcCatalog • Tool bar operation methods (copy, past, delete, icon operations, folder connection,
zoom, pan, attribute value display, etc.) • Display change method • Metadata display method
ArcMap:
• Start and end ArcMap • Data connection method • Data display method, and tool bar operation methods • Method to change the data depiction • Data retrieval method • Labeling method • Map Layout method (Figure 3-8 Example of Map Layout) • Method to save maps (.mxd preparation method)

49
Figure 3-8 Example of Map Laying-Out Work ii. Data Conversion
In INETER, since CAD data were mainly used, a mutual data conversion with the data format (coverage) of ArcGIS served as an important factor on practical use of data. Moreover, it was an item indispensable to data transfer with external organizations, also. Therefore, the CAD data format was set with the standard dxf format, as sure operation of data conversion and operation was kept in mind.
iii. DEM Preparation
Since there were various types of application in DEM (Digital Elevation Model) curios-ity and expectation of the INETER side was high, some types of creation methods along with characteristics of each type were explained. Training on the method to output to the ASCII format from an internal format of ArcGIS etc. was added for the training to cover wider application of the technology. Since the counterpart requested a training session on data transfer from DTED1 (NGA format), it was included in the training.
iv. 3D & Spatial Extensions
This was explained using DEM created during the DEM training sessions. To deepen understanding and get used the operations, more time for practice was assigned to each trainee. An example of 3D shade map created from DEM is shown in Figure 3-9.
Figure 3-9 Example of 3D shade created from DEM
(c) OJT-3
Along with reviewing the contents of previous OJTs, included new major items during this training were: 1) Data Capturing and 2) Symbolization.

50
i. Data Capturing from Aerial Photographs
This exercise comprised all the steps of data capturing. The available color photograph (approximate scale 1/2 000) covering a part of the Managua area was used for the exer-cise. Over the sample area, Points (such as scattered tree, road crossing), Line (such as road), and Polygons (such as vegetation) were digitized. This was followed by opera-tions like Cleaning and Building Topology, Labeling, adding other attribute data such as name of the feature, and so on. Figure 3-10 presents the digitized features (that carried out by a trainee) along with aerial photograph as background.
Figure 3-10 Data Capturing
ii. Symbolization
During this exercise, various options for selecting symbols that present in ArcGIS were presented. Moreover, training was also carried out how to modify the existing symbols as well as to create new symbol in ArcGIS or to import a symbol that was created using other software to ArcGIS.
(d) OJT-4
i. Conversion of dxf data to Coverage:
Considering the fact that in this project, the source data format for creation of GIS Da-tabase was dxf, the final format of plotted digital data, this exercise was conducted to practice with the procedure of converting dxf data to GIS database. This exercise was carried out with the 2852-I map sheet of 1/50,000 (Nagarote), for which plotting was also carried out by counterpart personnel.
This exercise was carried out in step by step along with detail discussion at each. Thus, the included major steps were as follows:
• Reviewing of GIS Database Specification • Creation of GIS Database Schema • Creation of Empty Coverage based on schema • Checking and conversion of dxf data to coverage • Preparing the converted coverage for further processing • Transferring the data from the converted coverage to empty coverages • Checking and applying necessary process to the coverages with transferred data.
Thus, at last GIS database for Nagarote Map sheet was created with data in the respec-tive coverage, referred to Figure 3-11 carried out by a trainee).
Data Capturing from Aerial Photograph

51
Figure 3-11 dxf Data to Converted and Arranged Coverage Data of 2852-I (Nagarote) Map
Sheet ii Introduction to data processing of coverage for GIS Analysis
OJT-4 on “Introduction to data processing of coverage” for GIS Analysis was conducted from 11th November to 9th December, 2005. During this session, some of the data processing method for GIS analysis was covered in step by step. Especially on this time, not only about overlay for GIS analysis but also AML programming for repetitive and time taking routine data handling work was introduced. The training was conducted with the same format as conducted during previous OJTs and it was divided into three parts: lectures, demonstrations, and hands-on sessions. For each class, the lecture was con-ducted at once including all the attended trainees. Topic of GIS analysis is as follows:
3) Results
This training course being attended by larger number of trainees, there were some chal-lenges, which were resolved with the optimum efforts. These are listed below:
i. Various levels of technical experience:
The attended trainees had various levels of technical experience and understanding. Thus, during practice, some of trainees used to do more mistakes and also repeating of same mistakes. This was resolved by demonstrating the required functions (opera-tions) repeatedly.
ii. Various levels of Understanding of English Language:
Trainees were diversified with respect to understanding of English language. The Ar-cGIS Software being in English language, the trainees with higher level of English un-derstating used to pick up the methodology faster compared to those with lower level of understanding. Communicating through translator; repeating the demonstration; watching their practice activity intensively; and promoting them to take note of opera-tions were some of the measures taken to resolve the challenge. .
iii. Tight schedule:
Along with the task of attending this training course, the attended trainees had also to do their regular task. Thus, some of trainees despite of their willingness to attend were unable join some of the training classes. After returning with such discontinuity, it was a little hard to make up the missed items. Arranging additional hands-on sessions for them to make-up the missed items resolve this difficulty.
Qualitative evaluation with some approaches was carried out to know the understanding level of trainees. One approach was to decrease the amount of instructor’s demonstration during the hands-on sessions. This, wait and see approach, was good to read their mental
Converted & arranged Coverages dxf Data

52
move. Considering the vast contents of training course, they were found relatively doing more amounts of mistakes during the early sessions, which was natural one. But, the amount such mistakes was drastically decreased with the advancement of sessions espe-cially during OJT-3 and OJT-4. Moreover, most of the commands and operations so used during OJT-1 and OJT-2 being repeated during these last two OJTs, this approach also helped to know how well they had grasped the contents of OJT-1 and OJT-2.
Another adapted approach was asking them to prepare the manual of previous hands-on sessions so that their understanding level could be checked. Some of them were unable to complete the task because of other regular tasks; some of them managed to follow the requirement.
Thus, these indicated that the trainees understood well about not only the concept of GIS but also how to operate ArcGIS software for creation of GIS Database as well as using the created database for various application purposes. A few trainees, having reached to a higher level in the ArcGIS operations, could become key persons in this field. Hereaf-ter, it would be very important for the counterpart agencies to establish a system for maintenance and updating of GIS database.
(5) Introduction to ERDAS Imagine and its Operations
1) Structure and Schedule
The objectives of “Introduction to ERDAS Imagine and its Operations” course were to acquire knowledge and skills on: 1) Concept of Raster Data; and 2) ERDAS Imagine Software Operations. The course was designed for the staff in INETER; however, two personnel from the Moviterra (UNAN, León), an affiliated agency of INETER had also joined the course. A total of twelve (12) trainees participated in this course.
Table 3-9 List of Participants (ERDAS IMAGINE) Name Affiliation
Josué Donado Figueroa Department of Geodesy & Cartography
Uberne Rueda Padilla Department of Geodesy & Cartography
Francisco Pérez Department of Geodesy & Cartography
Noel Ramírez Department of Geodesy & Cartography
Ramon Alonso Torrez Department of Geodesy & Cartography
Isidro Jarquín Vélez Department of Geodesy & Cartography
Marisol Echaverry Department of Geophysics Ena Gámez Department of Geophysics Armando Saballos Department of Geophysics Virginia Tenorio Department of Geophysics Eddy García Moviterra *
Ena Reyes Moviterra *
*Note: Moviterra is an institution which is collecting the real-time-volcanic-activity data around León City, and was taken as the candidate institution of training in response to the request of INETER.
The trainings were designed to be practical as much as possible. For this purpose, the format of trainings was divided into three parts: lectures, demonstrations, and hands-on sessions. Moreover, the hands-on sessions were designed for immediate practice for the trainees on the personal computer. Since there were higher number of trainees (nine in OJT-1 and five in OJT-2) compared to a single personal computer with ERDAS Imagine, all the trainees were divided into groups (with one or two trainee in each) to arrange the practice sessions. The time for each group was allocated carefully so that all were able to use a terminal as much as possible.

53
Since some of trainees of this course were the same who had to attend the ArcGIS course, the lecture of this course had to carry out at other time to avoid conflict with the lecture time of ArcGIS course. Thus, it was conducted only twice a week during OJT-1. Similarly, during OJT-3, the instructor being the same for this course and ArcGIS course, it could be conducted only for two weeks with three classes a week. The detail schedule of this course is listed in the following tables.
All the attended trainees, having technical background, were well familiar of using the Personal Computer and some of them had experience of working with a photogram-metry Software named MicroStation. However, these were their first opportunity of get-ting training regarding ERDAS Imagine. Despite that, they showed good desire to learn the contents of the training. For smooth communication, all lecture sessions and some of hands-on sessions were conducted with the help of Spanish Translator.
Table 3-10 List of Participants (ERDAS Imagine) Attendance S. No. Name of Trainee Affiliation
OJT-1 OJT-2 1 Josue Donaldo Figueroa GC ● 2 Ramón Alonso Torrez Rodríguez GC ● 3 Marisol Echaverry López G ● 4 Ena Gámez Balmaceda G ● ● 5 Francisco Pérez Pérez GC ● ● 6 Virginia Tenorio Bellanger G ● ● 7 Antonio Alvarez Castillo G ● 8 Ana Reyes Zavala M ● 9 Eddy García Padlla M ●
10 Isidro Jarquín Vélez GC ● 11 Uberne Rueda Padilla GC ●
GC - General Management of Geodesy and Cartography; G - General Management of Geo-physics; M - Moviterra (UNAN, León); ● - Means Attended
2) Content Description
(a) OJT-1
The main included training items were as follows:
i. Introduction to Raster Data and ERDAS Imagine
After introducing about the Raster Data, menus and general functions of ERDAS Imag-ine were explained. A file importing method from external file formats to the Imagine format (.img) was also demonstrated.
ii. Image Rectification
In this session, the geographic-coordinate-attachment method to a scanned image was demonstrated. Moreover, the expert showed that this function could be used to create the background image for the existing map digitizing, and application to the real situation was explained also.
iii. Image Sub-setting (Clipping)
Generally this function is applied to images of targeted areas of work, and there are sev-eral types of approaches, such as AOI (Area Of Interest) and the masking methods. In the training session, several methods were explained and practiced. Figure 3-12 shows an example of clipping using an AOI file (showing the boundary of necessary area).

54
Full Image Clipped Image
Area of Interest
Figure 3-12 Example of Clipping Using an AOI as Clipping File
iv. Introduction to Image Enhancement
v. Mosaicing
Through this function, methodology of combining two scanned images with identical coordinate system was shown and practiced.
vi. Map composition function
Through this function, designing layout of the image data as a map, and outputs it from a printer were shown and practiced.
vii. Export function
This function was practiced to export a file with IMG format to other formats such as GeoTIFF and GRID.
(b) OJT-2
The main items covered during OJT-2 were: 1) Ortho-rectification; 2) Generation of Anaglyph and 3) Topographic functions.
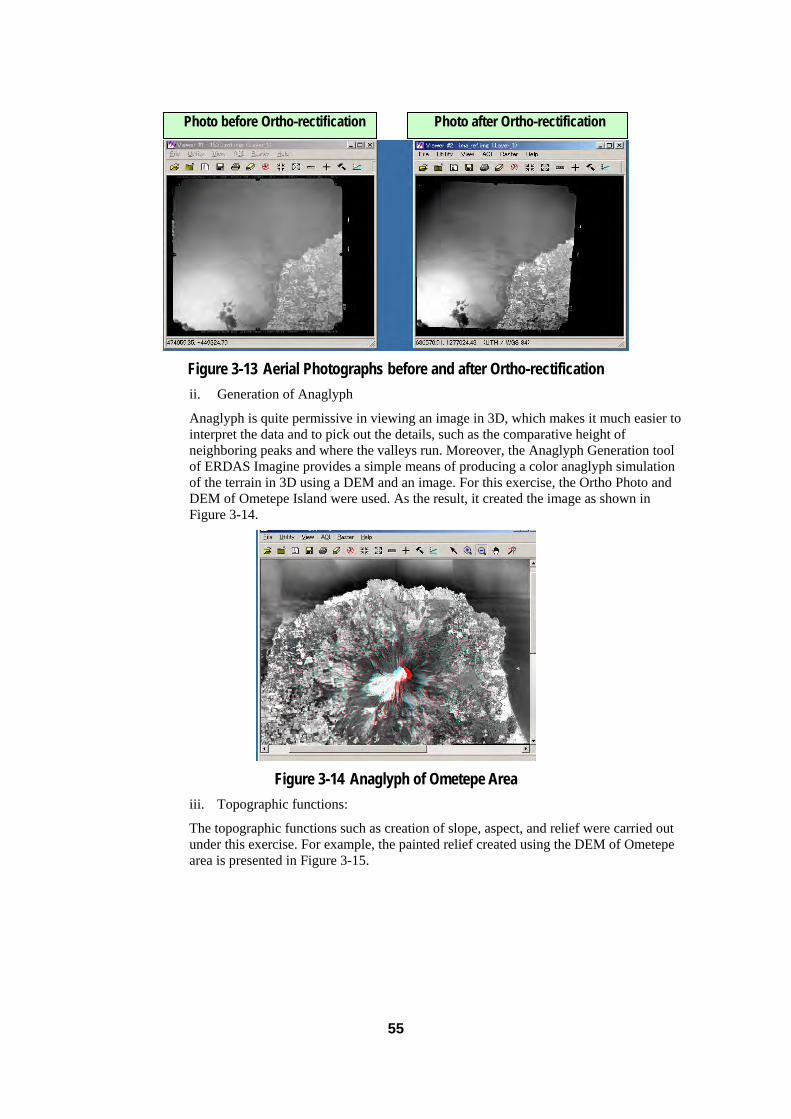
i. Ortho-rectification
This was carried out using a sample of scanned aerial photograph of part of Ometepe Is-land of the Study area. The contour data of this Study was used to create DEM, which was used to assign Z value for the Ortho-rectification. The following photograph shows the conversion of contour vector data to DEM (Digital Elevation Model) data. An example of scanned aerial photo and ortho-rectified aerial photo is shown in Figure 3-13. The difference in orientation can be easily noticed in the both photos.
55
Figure 3-13 Aerial Photographs before and after Ortho-rectification ii. Generation of Anaglyph
Anaglyph is quite permissive in viewing an image in 3D, which makes it much easier to interpret the data and to pick out the details, such as the comparative height of neighboring peaks and where the valleys run. Moreover, the Anaglyph Generation tool of ERDAS Imagine provides a simple means of producing a color anaglyph simulation of the terrain in 3D using a DEM and an image. For this exercise, the Ortho Photo and DEM of Ometepe Island were used. As the result, it created the image as shown in Figure 3-14.
Figure 3-14 Anaglyph of Ometepe Area
iii. Topographic functions:
The topographic functions such as creation of slope, aspect, and relief were carried out under this exercise. For example, the painted relief created using the DEM of Ometepe area is presented in Figure 3-15.
Photo before Ortho-rectification Photo after Ortho-rectification

56
Figure 3-15 DEM and Painted Relief of Ometepe Area
3) Results
Qualitative evaluation with some approaches was carried out to know the understanding level of trainees. One approach was to decrease the amount of instructor’s demonstration during the hands-on sessions. This, wait and see approach, was good to read their mental move. It was found that the amount went on decreasing level with the advancement of sessions. Another adapted approach was asking them to prepare the manual of previ-ous hands-on sessions, which despite of their busy schedule some of them could do so as well.
Thus, these indicated that the trainees understood well about not only the concept of raster data and operations of ERDAS Imagine Software. A few trainees, having reached to a higher level in the ERDAS Imagine operations, could become key persons in this field. Hereafter, it is very important for the counterpart agencies to establish a system for maintenance and updating of GIS database.
(6) Map Symbolization
Map symbolization of technology transfer aims to attain certain level of understandings symbolization from plotted vector data to cartographic symbols and on creation of com-plete printing map files.
1) Structure and Schedule
Four trainees took part in the map symbolization OJT. The names and their affiliations are listed in Table 3-11.
Table 3-11 List of Participants (Map Symbolization) Name Affiliation
Isidro Alberto Jarquín Vélez Cartography Section Dina Del Carmen Flores Huembes Cartography Section Aaron Anastasio Godoy Zamora Cartography Section Fernando José Osorio Salazar Cartography Section
The software used was Adobe Illustrator version 10 or 11. The training was conducted from 24 of October to 25 of November, 2005. The major items of training were: (a) Document setup and preference setup; (b) Preparation of spot colors and modification of swatches pallet; (c) Preparation of map symbols and pattern; (d) Data import or conver-sion for map editing with Adobe Illustrator; (e) Map Symbolization for each features as line, point, polygon and text; (f) Marginal design, grid and grid numbers completion; and (g) Methodology of checking for completed printing maps.
(a) Document setup and preference setup
DEM Data Painted Relief Data

57
In this session function of Adobe illustrator “Document setup” and “Preference” were explained. Those functions are concerned to set up art board size (sheet size) and units of drawing.
(b) Preparation of spot colors and modification of swatches pallet
It was instructed that the five colors specified are strictly followed. As a preparatory training, a method of preparing spot colors was explained. By registering the spot col-ors to the swatch pallet, unwanted mistakes can be avoided. The method of registration and the use of the pallet were instructed.
(c) Preparation of map symbols and pattern
Using the brush function makes operation efficient. The Study Team explained how the operation can be more efficient on converting point data to symbols. Registration of the symbols already specified it the specifications to the brush pallet and the methods of using the brush functions were explained. For vegetation symbols, the same princi-ple applied. The methods of registering the symbols to the swatches pallet and of using the pallet were explained.
Figure 3-16 Colors and Patterns Registered in Swatch Pallet
(d) Data import or conversion for map editing with Adobe Illustrator
The data format provided or acquired in INETER is dgn files produced using MicroSta-tion. Illustrator files are not compatible with the dgn files; therefore, the files cannot be imported directly. It was explained that the .dgn formatted files needed to be converted to compatible files so that the files can be imported to Illustrator. The process of con-version is shown in the following diagram; the technology was transferred to the coun-terpart.
Figure 3-17 Process of Data Format Changes
(e) Map Symbolization for each features as line, point, polygon and text
The editing process is necessary before symbolizing. Various types of editing were in-structed. After the editing training, training on symbolization was conducted.
(f) Marginal design, grid and grid numbers completion
Topographic data .dgn format
Neat line and Grid line .dgn format
Convert to .dxf format. Il-lustrator can lead layers of dxf file. But it doesn’t have actual scale.
Convert to .eps format. Eps file can show actual scale in the Illustrator. But layers of dgn file will be merged.
Illustrator Dxf file should be adjusted to actual scale to join with eps file.

58
In this session completion of Marginal design, grid number, Boundaries box, Elevation guide, Adjoining sheet and etc. were explained.
(g) Methodology of checking for completed printing map
Methods of inspection and proofing on usages of colors and fonts were instructed. Two trainees were selected from the Section of Cartography: Mrs. Dina Del Carmen Flores Huembes and Mr. Aaron Anastasio Godoy Zamora. They are versed cartogra-phers. They have knowledge of mapping based on “Mapping Specification of Defence Mapping Agency USA”. Mrs. Flores Huembes has fifteen years of experience in car-tography. She has been working on digital mapping in recent seven years. Mr. Godoy Zamora has six years of digital mapping experience. Both of them have re-ceived training on Adobe Illustrator from February to March 2005.
2) Results
The trainees already had experience in making print files using MicroStation. Making print files for offset prints was first time for them. Different methods of making print files between MicroStation and Adobe Illustrator were somehow confusing for them.
(a) Data Transfer from MicroStation to Adobe Illustrator
We tried to edit the data which were plotted by OJT trainees of digital plotting in the Section of Photogrammetry first. The data did not have any problem when they were printed from a printer. But the data required modification for easier editing with Adobe Illustrator. The trainer explained reasons of problems one by one when the trainees found errors in symbolization. The Study Team decided to have a workshop with OJT trainees of digital plotting after the trainees for symbolization understood causes of problems. At the workshop, solution of data transfer was explained by OJT trainers and solutions associated with data were discussed among trainees for plotting and symbolizing. Agendas for the workshop were follows: Methodology of data transfer MicroStation to Adobe Illustrator; and flow of data transfer from plotting to ed-iting--dgn to dxf to ai.
Table 3-12 Data Type for Adobe Illustrator Data type Scale conversion Level cg to Text Remark
Neat line actual dgn to eps File name Grid line no dgn to dxf Layer name as utm_grid
text_utm ll_grid text_ll
coordinate text
Lines no dgn to dxf layers Required join Contour no dgn to dxf layers value Required join Points no dgn to dxf layers Required simple symbols(cell) as
or Building 3051
no dgn to dxf Layer 3051 Required rotated shape
Spot height and BM,
no dgn to dxf Layers 508 to point 508t to text
elevation Required simple symbols(cell) as
Polygons no dgn to dxf layers Required closed polygons Plantation no dgn to dxf Layers
707 to point 707t to text
Kind of plants
Required closed polygons
Other data Admin bound-ary
no dgn to dxf layers Clipped by each neat line
Annotation no dgn to dxf Layers name as level Example: level1 to point Level 1t to text
yes Clipped by each neat line
* All of data required to attaches neat line.

59
The counterpart had experiences of offset printing on topographic maps of 1:250,000 compiled from the former edition of digitized 1:50,000 topographic maps that were symbolized using MicroStation. Moreover, since the counterpart had the experience in producing the digitized topographic map of 1:50,000. It was well versed on the edit regulation of DMA required. There was any problem in editing. The counterpart did possess full knowledge of the expected final results. Therefore, taking advantage of the functions of Adobe Illustrator to the maximum extent for efficient editing and sym-bolization was the main theme of the OJT.
It was the trainees' general impression that the results from Illustrator were more graphically appealing that those of MicroStation. Also the trainees understood that us-ing functions like brush, cutting or offset lines, time-consuming process of symbolizing such as tics could be converted efficiently. The trainees experienced all the process of editing and symbolizing within a limited schedule.
There was no opportunity to use Adobe Illustrator since OJT in February. During the training some functions and operations learned needed reviewing. It is a concern that there is a possibility that the software may not be used as often as they should to keep the technology. Even after the completion of the Study, it would be necessary to con-tinue using the software. For this purpose, continuous learning system would be nec-essary for better and efficient map symbolization.
The specifications on the map symbolization were based on the DMA. It was created in 1980 for the analogue symbols. Some of the symbols were unnecessarily complex for digital symbolization. The specifications need to be amended for more efficient symbolization.
(7) Field Completion
1) Structure and Schedule
The purpose of field completion is to investigate unidentifiable features during the field identification performed previously. Unreasonable parts, inconsistencies, questionable features compared to existing source materials are examined and confirmed. All field completion work was completed using draft maps. Handy GPS receivers which were introduced for technology transfer were also used during the work. The field comple-tion survey was performed by the following five INETER counterparts.
Table 3-13 List of Participants (Field Completion) Name Affiliation
Isidro Jarquín Vélez Geodesy and Cartography Oliver Valladares Ramón Avilés Aburto Geodesy and Cartography Alberto Orozco Geodesy and Cartography Javier Hernández Geodesy and Cartography Fernando Osorio Geodesy and Cartography
The field completion was carried out from October 31 to November 26, 2005. Ar-rangement of the field work results was carried out from November 28 to December 9, 2005. In INETER, the results were examined. The unknown places were reexamined in the phase of examination and organization of the results.
In the field completion, the following items were focused for investigation.
1. Planimetric feature
Omitted of planimetric features (especially point data) were extracted using Handy GPS and recorded onto the draft maps.
2. Annotation
60
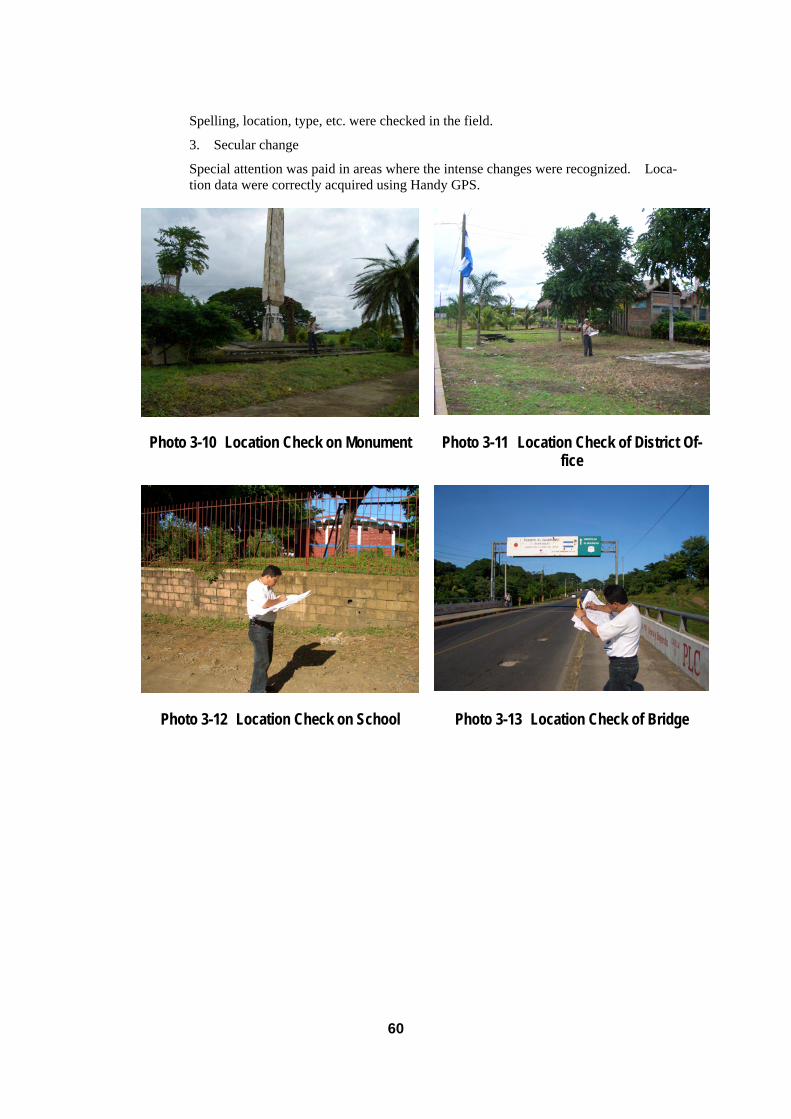
Spelling, location, type, etc. were checked in the field.
3. Secular change
Special attention was paid in areas where the intense changes were recognized. Loca-tion data were correctly acquired using Handy GPS.
Photo 3-10 Location Check on Monument Photo 3-11 Location Check of District Of-fice
Photo 3-12 Location Check on School Photo 3-13 Location Check of Bridge

61
Figure 3-18 Field Completion Map Indicating Coordinates from Handy GPS
2) Results
The chief engineer of INETER and the Study Team discussed methods of field work implementation. The chief engineer had an experience in field work in the former So-viet Union. He had adequate knowledge of quality control on field completion. The draft maps and map symbols and their application rules were given to the field team. The chief engineer instructed the guideline to the field team in accordance with the specifications. Five field teams were organized and areas to be verified were divided into six (6) regions as shown in Figure 3-19.
Figure 3-19 Division of Field Completion Area