figure 1.1 figure 1.2b figure 1.3 source: energy information administration. figure 1.4
TRANSCRIPT


Figure 1.1

Primary school enrollment
0
20
40
60
80
100
120
140
1982 1987 1989 1993 1997 1999 2000
%
Schl enrol't M
Schl enrol't F
Figure 1.2B

Figure 1.3

Source: Energy Information Administration. http://www.eia.doe.gov/emeu/cabs/iraq.html Figure 1.4

Bombing, and sanctions on spare parts, led to:
Before 1991 After 1991 war
1995
2003 (before destroying again)
Electricity
24 power plants 9500 MWs
4 power plants 2325 MWs
4000 MWs
5200 MWs
Sewage treatment plants
3 Baghdad 3 elsewhere
1 Baghdad (1)
Water supply
Baghdad 330 l/hd/day Other urban 270 l/hd/day Rural 180 l/hd/day
220 l/hd/day 170 l/hd/day 90 l/hd/day
Quality much reduced
March 1991, UN US-G Ahtisaari reported: ‘… nothing we had seen or read had quite prepared us for … the devastation which has … befallen the country. The recent conflict has wrought near-apocalyptic results … Iraq has for some time to come been relegated to a pre-industrial age.’

Date Event 2 August 1990
Iraqi forces invade Kuwait. On the same day, the Security Council adopts Resolution 660 and condemns the invasion.
6 August 1990
Resolution 661 is adopted by the Security Council which imposes sanctions on both Iraq and occupied Kuwait; and establishes the 661 Committee to implement the Resolution.
20 March 1991
Ahtisaari report to Security Council on humanitarian situation in Iraq
3 April 1991 The Security Council, in resolution 687, sets terms for a cease-fire - disarmament and removal of Iraq's capacity to develop weapons of mass destruction.
15 August 1991
The Security Council adopts resolution 706 offering an opportunity for Iraqi oil to be sold and the revenue used to purchase essential humanitarian supplies. This resolution is not accepted by the Government of Iraq.
14 April 1995
Resolution 986 (see box) is adopted by the Security Council. Iraq does not accept its terms
20 May 1996 Following extensive negotiations, a Memorandum of Understanding is signed between the Government of Iraq and the United Nations Secretariat regarding the implementation of resolution 986 (see box).
10 December 1996
Following the Secretary-General's report to the Council that all measures are in place for the implementation of resolution 986 (1995), phase I officially begins with the pumping of Iraqi oil for export. The first proceeds from the sale of oil are deposited in the United Nations Iraq Account (Escrow Account), at the Banque Nationale de Paris in New York on 15 January 1997.
Box 2.2

THE IMPACT OF THE OIL-FOR-FOOD PROGRAMME ON THE PEOPLE OF IRAQ.
Report of an independent Working Group
established by the Independent Inquiry Committee.
September 7, 2005
THE IMPACT OF THE OIL-FOR-FOOD PROGRAMME ON THE PEOPLE OF IRAQ.
Report of an independent Working Group
established by the Independent Inquiry Committee.
September 7, 2005
Members
John B Mason, PhD (Chair). Professor, Department of International Health and Development, School of Public Health and Tropical Medicine, Health Sciences Center, Tulane University, New Orleans, LA, USA.
Thierry Brun, PhD. Senior Scientific Advisor, Department of International Operations, French Red Cross, Paris; Professor, Institut d'Etudes Politiques, Sciences Po., Paris; Senior Researcher, National Institute for Health and Medical Research, (INSERM) France.
Junshi Chen, MD. Research Professor, Institute of Nutrition and Food Safety, Chinese Centre for Disease Control and Prevention
Kevin Frick, PhD. Associate Professor, Department of Health Policy and Management, Johns Hopkins University, MD, USA.
Richard Garfield, RN DrPH. Henrik H Bendixen Professor of Clinical International Nursing, Columbia University, New York, USA; and Visiting Professor, London School of Hygiene and Tropical Medicine, UK.
Kenneth Hill, PhD. Professor, Department of Population and Family Health, Johns Hopkins University, MD, USA.
Susan Horton, PhD. Professor of Economics and Vice-President Academic, Wilfrid Laurier University, Waterloo, Ontario, Canada. Philip Musgrove, PhD. Fogarty International Center, National Institutes of Health, MD, USA.
Advisor: Peter L. Pellett, Ph.D. Emeritus Professor of Nutrition, University ofMassachusetts, Amherst, MA, USA.

THE IMPACT OF THE OIL-FOR-FOOD PROGRAMME ON THE PEOPLE OF IRAQ.
Report of an independent Working Group
established by the Independent Inquiry Committee.
September 7, 2005
Research Assistants – Tulane School of Public Health and Tropical Medicine: Tina Lloren, MPH (team leader); Julie D Coski, RN; Grant Martsolf, BSN, BSE, RN; Nick Oliphant, BA.
Research Assistants, Paris – Institut d’Etudes Politiques, Sciences Po., University of Paris: Gabriela Beiu; Helene Ducate; Sawsen Ayari Pouliquen; Sami Stouli; Marie Venatzel. Institut Catholique de Paris, University of Paris: Marjorie Blackwell. Sorbonne, University of Paris: Dalia Hijazi.
Mansucript editor: Jonathan Harrington, PhD. Boston, USA.
Liason with IIC: Simeon Obidairo, LLB, LLM; Manisha Bharti, MPH, MBA

The Independent Inquiry Committee In April 2004, United Nations Secretary General Kofi Annan appointed an independent, high-level inquiry to investigate the administration and management of the Oil-for-Food Programme in Iraq. Following this, the United Nations Security Council unanimously adopted Resolution 1538 (21 April, 2004), which endorsed the inquiry and called for full cooperation in the investigation by all United Nations officials and personnel, the Coalition Provisional Authority, Iraq, and all other Member States, including their national regulatory authorities. (IIC, 2005) The appointed Independent Inquiry Committee (IIC) was chaired by Paul Volcker, former Chairman of the United States Federal Reserve. Committee Members were Mark Pieth of Switzerland, an expert on money-laundering in the Organization for Economic Cooperation and Development (OECD), and Richard Goldstone of South Africa, former Prosecutor of the International Criminal Tribunals for the former Yugoslavia and Rwanda. (IIC, 2005)
The terms of reference of the IIC were as follows (IIC, 2005).
“The independent inquiry shall collect and examine information relating to the administration and management of the Oil-for-Food Programme, including allegations of fraud and corruption on the part of United Nations officials, personnel and agents, as well as contractors, including entities that have entered into contracts with the United Nations or with Iraq under the Programme:
(a) to determine whether the procedures established by the Organization, including the Security Council and the Security Council Committee Established by Resolution 661 (1990) Concerning the Situation between Iraq and Kuwait (hereinafter referred to as the "661 Committee") for the processing and approval of contracts under the Programme …
(b) to determine whether any United Nations officials, personnel, agents or contractors engaged in any illicit or corrupt activities ...

The Working Group on the Impact of the Oil-for-Food Programme on the Iraqi People. Since the aim of the Oil-for-Food Programme (OFFP) was to avert a humanitarian crisis in Iraq, the IIC’s evaluation was considered to be incomplete without an assessment of the effectiveness in reaching its desired objectives or goals. The IIC in October 2004 therefore decided to establish a process for assessing the humanitarian impact of the Oil-for-Food Programme (OFFP).
“The primary goal of the Working Group is to assess the contribution of the OFFP to improving the lives and well being of the people of Iraq, specifically in the areas of hunger, poverty, nutrition, health, mortality and infrastructural development. The Working Group will also assess the overall cost effectiveness of the OFFP.
“The Working Group will examine trends in several broad development indicators over three distinct phases:
1) Mid-1980s (before the Gulf War of 1991) 2) Period of sanctions pre-OFFP (1990 – 1996) 3) OFFP (1996 – 2003)
“The Working Group will conduct some primary research by way of limited interviews and data collection. Most of the research will be conducted by reviewing, evaluating and synthesizing existing data, surveys and reports. The specific tasks are described in points A – D below. “The working group will to the extent possible, undertake the following tasks:
A. Outcome … B. Causes … C. OFFP aims … D. How much did OFFP change outcomes …?

Food available and child malnutrition, 1984-1996 Period Kcals Child underweight 1984-90 3340 9.0% (’91) 1991-93 2610 1994-96 1890 23.4% (’96)
Sources: FAO Food Balance Sheets; IST and UNICEF surveys. Compare with RDA approx 2200 kcals Child underweight: Center-South

Food prices, index (1990=100)
0
500000
1000000
1500000
Aug-90 Jun-93 Aug-95 Mar-97 Jun-97
%
Wheat
Veg oil
Meat
Eggs
Figure 2.1


Box 2.1


Phases I–VIII Volume of oil
(millions of barrels) Value of oil exported
(US$million)
US$/bar
rel Early 1997 120 2,150 17.92 Late 1997 127 2,125 16.73 Early 1998 182 2,085 11.46 Late 1998 308 3,027 9.83 Early 1999 360.8 3,947 10.94 Late 1999 389.6 7,402 19.00 Early 2000 343.4 8,302 24.18 Late 2000 375.7 9,564 25.46 Total 2,206.5 $38,602 (17.5)
Phases IX–XIII Volume of oil
(millions of barrels) Value of oil exported
(millions of euros or dollars)
Early 2001 293 €6,668 (or $5,638) 19.24 Late 2001 300.2 €6,004 (or $5,350) 17.82 Early 2002 225.9 €4,886 (or $4,589) 20.31 Late 2002 232.7 €5,517 (or $5,639) 24.23 Early 2003 169.6 €4,175 (or $4,413) 26.02 Total 1,221.4 €27,250 (or $25,629) (21.0) Overall Total 3,427.9 $64,231 (18.7)
Volume and value of oil sold under OFFP
Table 3.1

Flow chart showing allocation of overall OFFP resources (in US$)
GRL: Goods Review List Figure 3.4

Total DES by Cereal/Non-Cereals in Iraq, 1984/89-2003
0
1000
2000
3000
4000
1984
-198
919
9119
9319
9519
9719
9920
0120
03
Year
kcal
s/h
d/d
ay
Total DES*
Total Cereal kcals*
Total Non-cerealkcals*
PDS Ration
Figure 2.2

Net kcals from domestic production, 1990-2003
-400
-200
0
200
400
600
800
1000
1990
1991
1992
1993
1994
1995
1996
1997
1998
1999
2000
2001
2002
2003
kc
als
/hd
/da
y
Cereal
Non-cereals
Figure 2.3
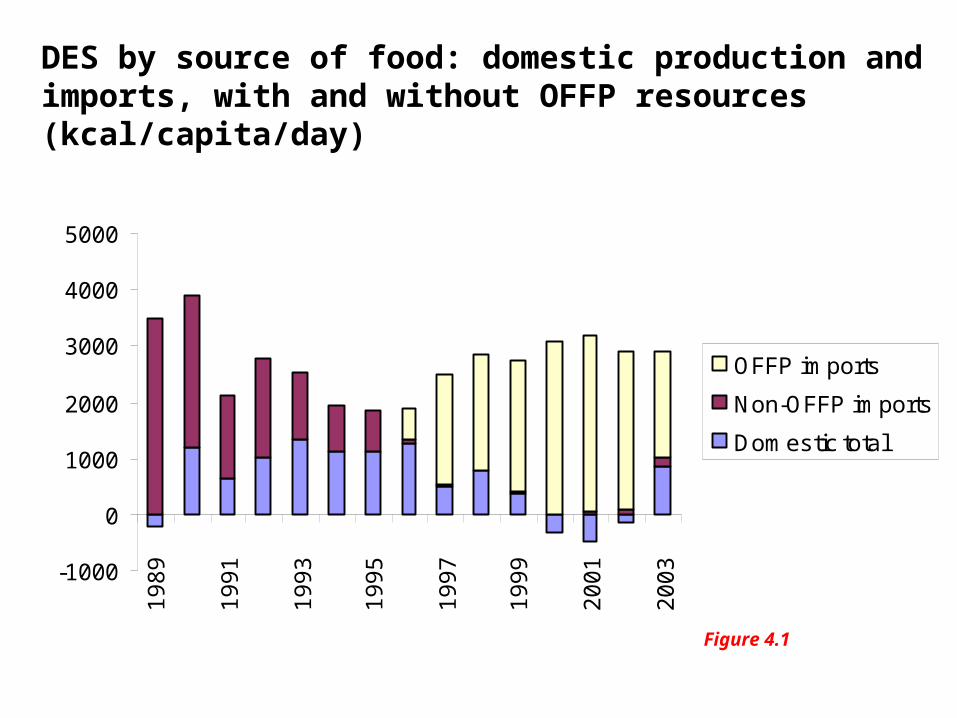
-1000
0
1000
2000
3000
4000
5000
19
89
19
91
19
93
19
95
19
97
19
99
20
01
20
03
OFFP imports
Non-OFFP imports
Domestic total
DES by source of food: domestic production and imports, with and without OFFP resources (kcal/capita/day)
Figure 4.1

Centre/South
0
10
20
30
40
1990 1992 1994 1996 1998 2000 2002
Pre
vale
nce
, % Stunting
Underw eight
Wasting
Figure 2.5
Indicators of child malnutrition from survey results
(% < -2SDs by WHO/NCHS standards, 6-59 mo)

Centre/South
0
10
20
30
40
1990 1992 1994 1996 1998 2000 2002
Pre
vale
nce
, % Stunting
Underw eight
Wasting
This % was reported
everywhere ...
This % was survey result !
Indicators of child malnutrition from survey results
(% < -2SDs by WHO/NCHS standards, 6-59 mo)
Implication is little OFFP impact on child nutrition vs restoring pre-war conditions …

S/C, surveys only
0
10
20
30
40
50
1991 1996 2000
24-35mo
36-47 mo
48-59 mo
Slope indicates worsening
Slope indicates improving
Figure 4.4
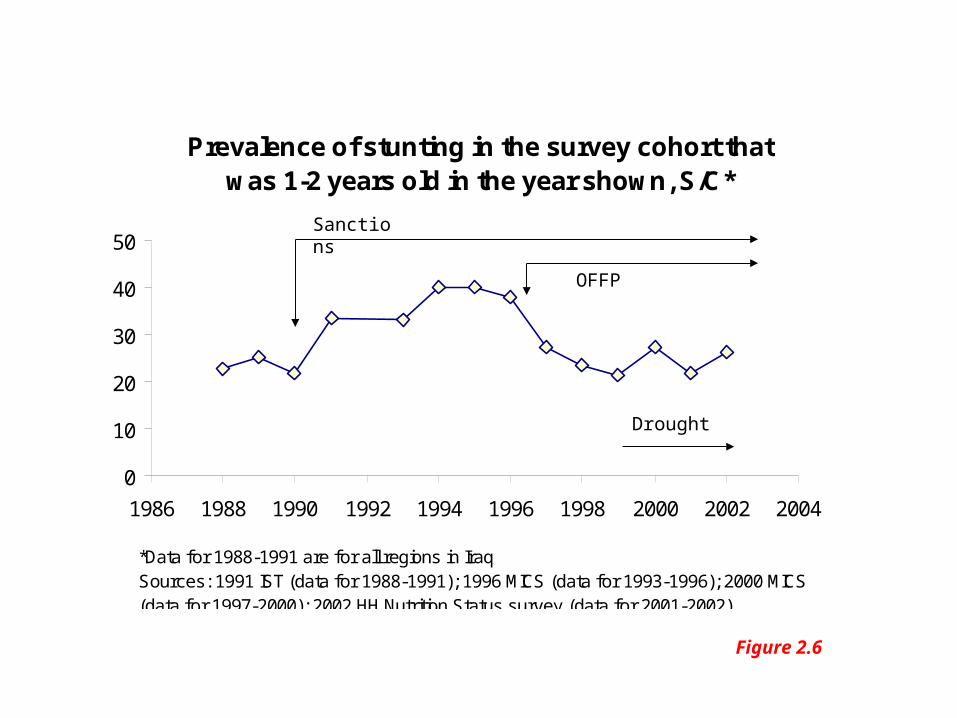
Prevalence of stunting in the survey cohort that was 1-2 years old in the year shown, S/C*
0
10
20
30
40
50
1986 1988 1990 1992 1994 1996 1998 2000 2002 2004
*Data for 1988-1991 are for all regions in IraqSources: 1991 IST (data for 1988-1991); 1996 MICS (data for 1993-1996); 2000 MICS (data for 1997-2000); 2002 HH Nutrition Status survey (data for 2001-2002)
Sanctions
OFFP
Drought
Figure 2.6

Dysentery and Giardia Cases in Iraq 1989-2001: thousands
0 200 400 600 800
1989
1990
1991
1992
1993
1994
1995
1996
1997
1998
1999
2000
2001
year
# cases
Amoebic dysentery Giardias
Figure 2.8

Measles cases
0
5000
10000
15000
20000
25000
30000
1985 1990 1995 2000 2005
Measles
Measles and tetanus immunization coverage, S/C
0
10
20
30
40
50
60
70
80
90
1989 1996 2000
Measles immn
Tetanus-last pregn
Figure 2.9

Ch 2. Extracts from Section on ‘Environmental Infrastructure and Health Conditions’, ‘Other risk factors’ Potential new hazards resulted from the 1991 war. First, the widespread oil fires and “black rain” that resulted (presumably from volatilised and aerosol oil from the fires) caused contamination with sulphur dioxide, soot, and hydrocarbons (including carcinogens).
According to a US Central Intelligence Agency report at the time referring to Kuwait and Iraq: On the basis of these pollution levels, morbidity and mortality will increase in the hardest hit region. Reliable US epidemiological studies that have established a relationship between sulfur dioxide and particulate levels and sickness and death form the basis of the findings that health problems will be most pronounced in the areas closest to the oilfields. (CIA, 1991) People were exposed to these toxic compounds in the water supply, in the air, and from particles settling on surfaces, ingesting them through the lungs and gut.
Many tons of depleted uranium were scattered as a result of the extensive use of this metal in ammunition during the 1991 and 2003 Gulf Wars. The effects of depleted uranium are similar to those of other heavy metals; the toxicity depends on a number of factors influencing dispersal and the routes by which people are exposed. The results to be expected from depleted uranium toxicity include malignancies at unusual sites (e.g., the kidney) and possible effects on the central nervous system. Both depleted uranium and black rain are risk factors for cancers and for developmental abnormalities in utero. Reliable data about the extent and severity of such new exposures have not been found. Moreover, agreement has not been reached on the possible resulting changes in patterns of disease, especially of cancers and birth defects, although both anecdotal reports and certain Government statistics indicate increased incidences. Linkages that can be made to health problems, such as cancers and birth defects, are therefore speculative.

Ch 2. Extracts from Section on ‘Environmental Infrastructure and Health Conditions’, ‘Non-Communicable Diseases’. WHO (2001) and a number of anecdotal reports led to the perception that childhood cancers in Iraq had increased after 1990 and became 10 times more common than in the West; given that children after infancy have a good chance of survival from communicable diseases (this was true even in Iraq in the 1990s), cancer must have become a significant cause of death in children in Iraq. Unusual birth defects were also widely believed to have increased. No additional statistics on childhood cancers or birth defects were available to confirm the popular perceptions of epidemics of these conditions.
WHO (2001) noted that “if early and adequate therapy could be offered to the exceptionally large number of children with tumours, up to two thirds may be cured.” (Alwan, Jervell, Stjernswärd, Roglic. WHO, 2001). Although we do not have numbers, adequate response in this area was not provided by the OFFP 1, which contributed to preventable childhood cancer deaths. Moreover, palliative medications were also in short supply, and as WHO noted in 2001, “Most of today's cancer patients die with much avoidable pain and suffering.”
1 The ‘661 Committee’ was responsible for the Goods Review List, controlling the purchase and import of potential dual use supplies

Cancers, women, 1992-4 and 2002-3
0
2
4
6
8
10
Breast
Leuk
emia
Lym
phom
a
Skin
Bronch
us, Lun
g
Bladde
r
Ovary
Brain/
CNS
Laryn
x, th
yroid
Cervix
1992-4
2002-3
Note: the y-scale is the relative ranking of each cancer, with 10 the most common (i.e. calculated as 11-rank)
Figure 2.10

This was the conventional wisdom, based on 1999 birth history survey: massive increase in child mortality starting in 1991
U5MR about 40

Figure 3: Estimates of U5MR by Time Period: Iraq, 1974 -2000; various sources
0
.02
.04
.06
.08
.1
.12
.14
.16
.18
.2
Pro
ba
bil
ity
of
Dyi
ng
by
Ag
e 5
1975 1980 1985 1990 1995 2000D ate
1987 Census (indirect) 1997 Census (indirect)
1997 Indirect - Adjus ted NS 1987 Indirect - Adjus ted NS
1999 CMM Survey (1Yr direct) 1991 ITS (direct)
Intercensal Ave (indirect) 1989 Ch Hlth Survey (direct)1990 Imm unization Survey (indirect) 2004 IMIR A Survey (direct)
Sources: Census–based estimates: author’s calculations. IM IRA estimates: Pedersen (2005) Chapter 2. Other estimates: W orksheet from Gareth Jones.
U5MR about 85
Figure 4.12
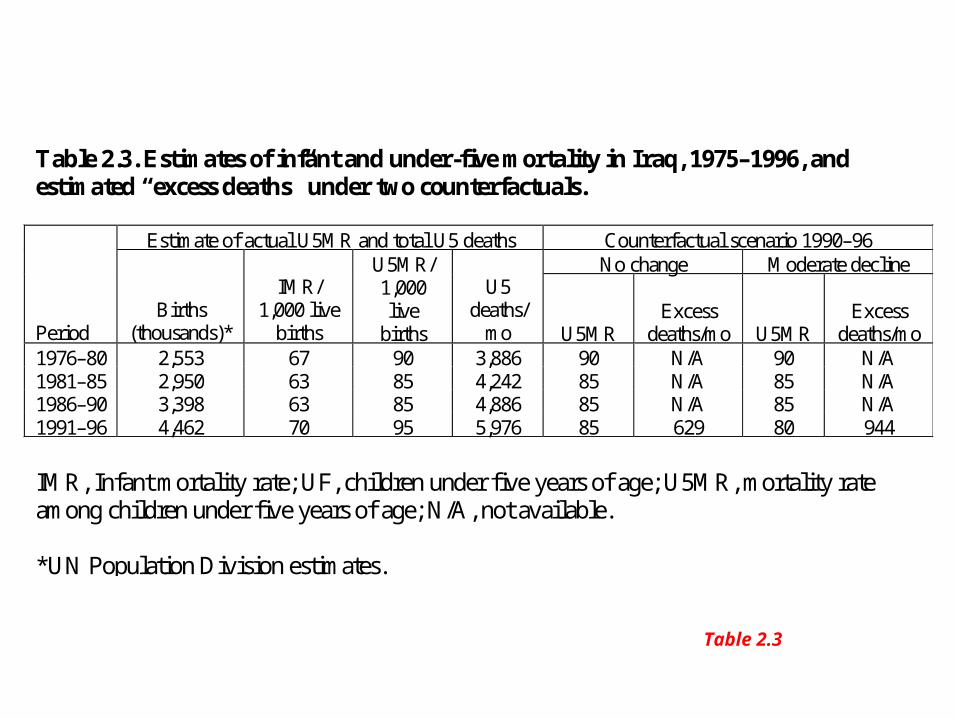
Table 2.3. Estimates of infant and under-five mortality in Iraq, 1975–1996, and estimated “excess deaths” under two counterfactuals.
Estimate of actual U5MR and total U5 deaths Counterfactual scenario 1990–96 No change Moderate decline
Period Births
(thousands)*
IMR/ 1,000 live
births
U5MR/ 1,000 live
births
U5 deaths/
mo U5MR Excess
deaths/mo U5MR Excess
deaths/mo 1976–80 2,553 67 90 3,886 90 N/A 90 N/A 1981–85 2,950 63 85 4,242 85 N/A 85 N/A 1986–90 3,398 63 85 4,886 85 N/A 85 N/A 1991–96 4,462 70 95 5,976 85 629 80 944 IMR, Infant mortality rate; UF, children under five years of age; U5MR, mortality rate among children under five years of age; N/A, not available. *UN Population Division estimates.
Table 2.3

Changes in U5MR 1990-2001
Source: Global Burden of Disease and Risk Factors. Lopez et al, 2006

OFFP c-c-recs-JM-17 Jun.doc
Conclusions – JBM, 17 Jun 05
1. OFFP food supplies reversed a serious and deteriorating food crisis, preventing widespread hunger and reducing deaths to which malnutrition was contributing; but while food intakes were nearly adequate in quantity for much of the population, the diet quality was very unsatisfactory for extended periods.
2. Equipment and medical supplies from OFFP were supplied sporadically and in an uncoordinated manner which much reduced their effectiveness, in large part due to administrative procedures and ‘holds’ imposed by the sanctions committee; while the medicines undoubtedly saved many lives and alleviated sickness, many preventable deaths and unnecessary suffering occurred. 3. The focus on short term relief rather than supporting livelihoods undermined the effectiveness of the resource use; one example is the disallowing of local procurement of food.
4. The control over the distribution of supplies (in C/S) further distorted the power relations, between the people and the government authorities.

Comments. 1. Sanctions violated the human rights of the people of Iraq, and certainly failed to protect them; UN involvement in sanctions thus, at a minimum, was in conflict with the UN Charter and basic principles of the United Nations. Sanctions on a population are a terrible idea and should be prohibited as an international policy option.
2. Trying to mitigate sanctions with a temporary relief effort, while better than nothing, should not be regarded as justifying the policy, nor as preventing the human rights violations.
3. If sanctions plus relief has ever to be done again, OFFP is not a good model; this is more because of the design and concept than because of the implementation, which under the circumstances was apparently reasonably effective.
Recommendations. 1. Never do any of that ever again.
2. Lessons therefore may only be drawn from components of OFFP. One may apply to relief for refugees and displaced populations (and has been stressed many times): use resources to establish and restore livelihoods – using the skills and working capacity of the people themselves – as much as feasible, even if just providing resources for immediate consumption seems easier and cheaper.
3. Give more priority to what is happening to people, including ensuring that objective information is collected and made available, with authority through trusted channels (that must not politicize or otherwise abuse that trust).
4. Urgently undertake a policy debate on the question of why people should be subjected to major deprivation, including loss of life, in order to undermine a government over which they have virtually no influence.

http://www.un.org/Overview/rights.html