fighting poverty in a tough economy, americans move in...
TRANSCRIPT
Monday, October 3, 2011
Fighting Poverty in a Tough Economy, Americans Move in with Their Relatives
Social & Demographic Trends
Paul Taylor, Director
Rakesh Kochhar, Senior Researcher
D’Vera Cohn, Senior Writer
Jeffrey S. Passel, Senior Demographer
Gabriel Velasco, Research Analyst
Seth Motel, Research Assistant
Eileen Patten, Research Assistant
FOR FURTHER INFORMATION CONTACT:
Pew Social & Demographic Trends
Tel (202) 419-4372
1615 L St, N.W., Suite 700
Washington, D.C. 20036
www.pewsocialtrends.org

www.pewsocialtrends.org
Copyright © 2011 Pew Research Center www.pewresearch.org
Table of Contents
PAGE
Executive Summary 1
Chapter 1: Introduction 8
Chapter 2: Income and Poverty in Multi-generational and Other Households 10
Chapter 3: Demographics of Multi-generational Households 23
References 32
Appendices
A: Notes on Terminology and Methodology 35
B: Adjusting Household Income for Household Size 37
C: Detailed Tables 38

1
Fighting Poverty in a Tough Economy, Americans Move in with Their Relatives
www.pewsocialtrends.org
Multi- generational
Other
11.5%
14.6%
Multi- generational
Other
$57,533 $59,002
Fighting Poverty in a Tough Economy, Americans Move in with Their Relatives By Rakesh Kochhar and D’Vera Cohn EXECUTIVE SUMMARY Without public debate or fanfare, large numbers of Americans enacted their own anti-poverty program in the depths of the Great Recession: They moved in with relatives. This helped fuel the largest increase in the number of Americans living in multi-generational households in modern history. From 2007 to 2009, the total spiked from 46.5 million to 51.4 million. Living in a multi-generational household appears to be a financial lifeline for many. Although their adjusted incomes overall are lower, the poverty rate among people in multi-generational households is substantially smaller than for those in other households—11.5% vs. 14.6% in 2009, according to a new Pew Research Center analysis of Census Bureau data. Moreover, the potential benefits of living in multi-generational households are greatest for the groups that have been most affected by the Great Recession. Among the unemployed, the poverty rate in 2009 was 17.5% for those living in multi-generational households, compared with 30.3% for those living in other households. Members of other economically vulnerable groups—young adults, Hispanics and blacks—who live in multi-generational households also experience sharply lower poverty rates than those in other households.1
In 2009, 11.9 million of 113.6 million households in the U.S. were multi-generational. The majority (6.9 million) consisted of two adult generations, for example, a household head with an adult child or with a parent. Slightly more than a third of multi-generational households (4.2 million) encompassed three or 1 Several reports by the Pew Research Center’s Social and Demographic Trends project have documented the varying impact of the Great Recession on different social and demographic groups (Pew Social and Demographic Trends, April 2008, June 2010, July 2010 and July 2011).
Economic Status of People in Multi-generational and Other Households, 2009
The poverty rate for people in multi-generational households is lower...
...even though, after adjusting for household size, their median household income is also lower.
Note: Household incomes are scaled to a household size of three (see Appendix B).
Source: Pew Research Center analysis of the 2009 American Community Survey (IPUMS)
PEW RESEARCH CENTER
2
PEW SOCIAL AND DEMOGRAPHIC TRENDS
www.pewsocialtrends.org
51
42
35
28
26
27
32
32
2009
2000
1990
1980
1970
1960
1950
1940
16.7 15.1
12.1 15.0
24.7
0
10
20
30
1940 1950 1960 1970 1980 1990 2000 2009
%
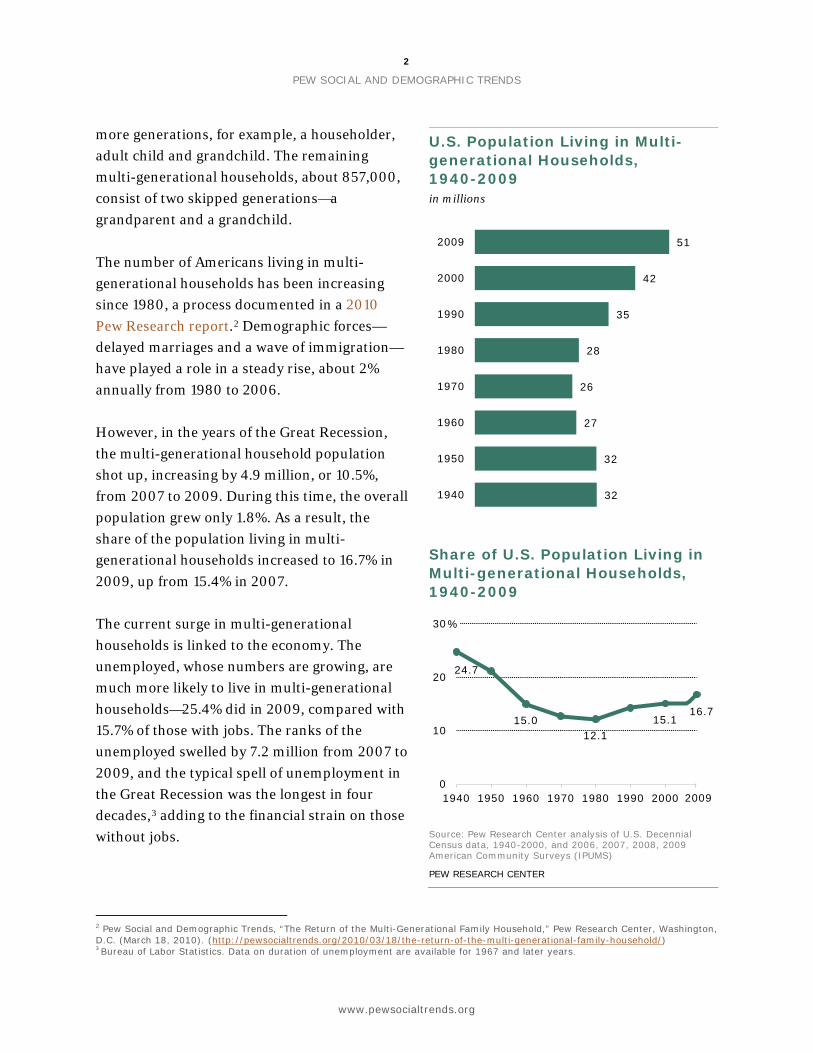
more generations, for example, a householder, adult child and grandchild. The remaining multi-generational households, about 857,000, consist of two skipped generations—a grandparent and a grandchild. The number of Americans living in multi-generational households has been increasing since 1980, a process documented in a 2010 Pew Research report.2
Demographic forces—delayed marriages and a wave of immigration—have played a role in a steady rise, about 2% annually from 1980 to 2006.
However, in the years of the Great Recession, the multi-generational household population shot up, increasing by 4.9 million, or 10.5%, from 2007 to 2009. During this time, the overall population grew only 1.8%. As a result, the share of the population living in multi-generational households increased to 16.7% in 2009, up from 15.4% in 2007. The current surge in multi-generational households is linked to the economy. The unemployed, whose numbers are growing, are much more likely to live in multi-generational households—25.4% did in 2009, compared with 15.7% of those with jobs. The ranks of the unemployed swelled by 7.2 million from 2007 to 2009, and the typical spell of unemployment in the Great Recession was the longest in four decades,3
adding to the financial strain on those without jobs.
2 Pew Social and Demographic Trends, “The Return of the Multi-Generational Family Household,” Pew Research Center, Washington, D.C. (March 18, 2010). (http://pewsocialtrends.org/2010/03/18/the-return-of-the-multi-generational-family-household/) 3 Bureau of Labor Statistics. Data on duration of unemployment are available for 1967 and later years.
U.S. Population Living in Multi-generational Households, 1940-2009 in millions
Share of U.S. Population Living in Multi-generational Households, 1940-2009
Source: Pew Research Center analysis of U.S. Decennial Census data, 1940-2000, and 2006, 2007, 2008, 2009 American Community Surveys (IPUMS)
PEW RESEARCH CENTER
3
Fighting Poverty in a Tough Economy, Americans Move in with Their Relatives
www.pewsocialtrends.org
A 2010 Pew Research survey also found that, during the recession, many young adults moved back in with their parents after living on their own. One-in-four of those ages 18 to 24 said they did so, and one-in-five of those ages 25 to 34 reported doing the same.4
Lack of work is a likely motive in pushing up the number of young adults living with their parents. Among young adults ages 18 to 29, the share unemployed or out of the workforce in 2010—38%—was the highest in nearly four decades.5
The recession’s impact on household finances is another factor likely to have driven the surge in multi-generational households. A recent report from the Census Bureau shows that, in 2010, the median income for U.S. households was below its 1997 level and the poverty rate—15.1%, up from 14.3% in 2009—had climbed to levels last seen in 1993.6
Under these circumstances, it is perhaps natural that more people would reach out to family for financial support.
The ability to pool financial resources is an advantage of multi-generational living, but it comes with a trade-off. Multi-generational households are relatively large—an average of 4.3 residents, compared with 2.4 in other households. After adjusting for differences in household size, incomes in multi-generational households, overall, are slightly lower than in other households. However, there are notable exceptions where multi-generational households provide a financial advantage for some groups. Among households with one or more unemployed residents, multi-generational households had much higher median incomes in 2009 than did other households—$48,542 vs. $41,115 (incomes adjusted for differences in household size and scaled to a household of three). Similarly, size-adjusted household incomes are higher in multi-generational households headed by Hispanics, blacks and immigrants. This report examines the growth in multi-generational households from 2007 to 2009 and the economic characteristics of those households compared with other households. The period of analysis overlaps with the Great Recession, which officially took place from December 2007 to June 2009. The research findings are based on the Pew Research Center’s analysis of microdata from the American Community Surveys (ACS) for 2007, 2008 and 2009. The ACS is conducted by the Census Bureau, and the microdata released for public use include records for about 1 million households, or about 3 million people.7
4 These are unpublished findings from a Pew Research Center survey. See Pew Social and Demographic Trends, “How the Great Recession Has Changed Life in America,” Pew Research Center, Washington, D.C. (June 30, 2010). (
http://pewsocialtrends.org/2010/06/30/how-the-great-recession-has-changed-life-in-america/) 5 These estimates are from the Bureau of Labor Statistics (BLS). 6 Median household income in the U.S. dropped from $50,599 in 2009 to $49,445 in 2010 (figures in 2010 dollars). See DeNavas-Walt, Proctor and Smith (2011) for the latest data on income and poverty published by the Census Bureau. 7 ACS microdata for 2010 were not available when this report was written. The specific data sources for this report are the 1% samples of the ACS Integrated Public Use Microdata Series (IPUMS) provided by the University of Minnesota. The IPUMS assigns uniform codes, to the extent possible, to data collected by the ACS in different years. More information about the IPUMS, including
4
PEW SOCIAL AND DEMOGRAPHIC TRENDS
www.pewsocialtrends.org
The economic analysis focuses on income and poverty. Unless otherwise mentioned, estimates of household income are adjusted for differences in the size of multi-generational and other households and are scaled to a uniform household size of three. Poverty rates are computed for people, not just heads of households. Generally speaking, most members of a household are assigned the same poverty status.8
The report also provides estimates of a generation’s and a person’s share of household income. Do young adults living with their parents or older parents living with their middle-age children account for a significant share of household income? What are the financial burdens on unemployed workers who live in multi-generational households compared with other households? In general, the report finds that the heads of multi-generational households account for a lower share of household income than do heads of other households, suggesting there is less of a burden on them to support the entire household. However, the report does not attempt to identify whether individual members of multi-generational households would be better or worse off living apart. Other key findings of the report include: Demographics of multi-generational households
• The number of Americans living in multi-generational households increased 4.9 million from 2007 to 2009. By contrast, the number of people in other households rose by only 333,000.
• The number of young adults (ages 25 to 34) in multi-generational households increased to 8.7 million in 2009 from 7.4 million in 2007. Both the numerical growth (1.3 million people) and the percentage increase it represents (16.8%) were larger than for any other age group.
• More than one-in-five (21.1%) young adults (ages 25 to 34) lived in multi-generational households in 2009.
• Among the major racial and ethnic groups, the sharpest growth in the multi-generational household population from 2007 to 2009 was among Hispanics (17.6%). The black population in these households grew by 8.7%, the white population by 8.5% and the Asian population by 7.3%.
• The most likely groups to live in multi-generational households are Asians (25.8% in 2009), blacks (23.7%) and Hispanics (23.4%). The share among whites was much lower (13.1%).
variable definition and sampling error, is available at http://usa.ipums.org/usa/design.shtml. Also, see Ruggles, Alexander, Genadek, Goeken, Schroeder and Sobek (2010). 8 There are exceptions to this rule. Details on the assignment of poverty status are available at http://usa.ipums.org/usa-action/variables/POVERTY#description_tab.

5
Fighting Poverty in a Tough Economy, Americans Move in with Their Relatives
www.pewsocialtrends.org
• In 2009, 16.2% of foreign-born heads of household and 9.6% of native-born heads of household lived in multi-generational households.
Household income and poverty rates
• After adjusting to a household size of three, the median income for multi-generational households was $57,533 in 2009, or 2% less than the $59,002 median income for other households.
• Among Hispanics, the adjusted median income of multi-generational households was $46,049 in 2009, compared with $38,710 for other households. Black multi-generational households also had higher incomes—$43,677 vs. $39,484. For Asian households the income difference is modest, and for whites it is nonexistent.
• In 2009, the median income of multi-generational households with foreign-born heads was 20% higher than for other households with foreign-born heads, $55,045 vs. $45,782.
• The poverty rate among young adults (ages 25 to 34) who lived in multi-generational households in 2009 was 8.7%, compared with 15.8% for these young adults in other households.
• In 2009, the poverty rate for Hispanics was 16.0% in multi-generational households and 25.5% otherwise. Among blacks, the poverty rate was 19.2% for those in multi-generational households and 27.3% elsewhere. For other groups, the differences in poverty across household types were more modest.
Income sharing in multi-generational households
• A household head typically accounts for about half (48.8% in 2009) of income in a multi-generational household. Heads of other households typically account for 85.7% of household income.
• In 2009, the median share of household income from a child 25 or older living with a parent head of household (with no other generation present) was 24.7%. Older parents, when they lived with their child who is the householder, accounted for virtually the same amount, 24.8%.
• In 2009, employed heads of multi-generational households typically accounted for 54.1% of household income. The share drops by a third among unemployed householders, to 35.3%. In other households, household heads account for about the same share of household income regardless of employment status—83.2% if employed and 80.8% if unemployed.

6
PEW SOCIAL AND DEMOGRAPHIC TRENDS
www.pewsocialtrends.org
About the Data
Data used in the report principally come from the U.S. Census Bureau’s American Community Surveys (ACS) in 2007, 2008 and 2009, provided by the Integrated Public-Use Microdata Series (IPUMS). The trends on Americans’ living arrangements come from Decennial Census data from 1900 to 2000 also provided by IPUMS. See Appendix A for more detailed information. Terminology
The racial and ethnic identity of a household is determined on the basis of the racial and ethnic identity of the head of the household. References to whites, blacks and Asians are to the non-Hispanic components of those populations. “Asian” refers to persons reporting their racial origin as Asian alone as well as native Hawaiians and other Pacific Islanders. “Black” refers to black alone, and “white” refers to white alone. “Foreign born” refers to persons born outside of the United States, Puerto Rico or other U.S. territories to parents neither of whom was a U.S. citizen. “Native born” or “U.S. born” refers to persons who are U.S. citizens at birth, including those born in the United States, Puerto Rico or other U.S. territories and those born abroad to parents at least one of whom was a U.S. citizen. Unless otherwise stated, all income estimates in this report are standardized to a household size of three and expressed in 2009 dollars.
Types of Households One-generation households
Households that consist of only one generation; for
example, a married or cohabiting couple, a single
person, siblings or roommates. These households can
be made up of families or non-families.
Two-generation households
Households that include a parent or parents and their
child or children under age 25 (including
stepchildren).
Multi-generational households
Multi-generational households include households
with:
• Two generations: parents (or in-laws) and
adult children ages 25 and older (or
children-in-law); either generation can
“head” the household
• Three generations: parents (or in-laws),
adult children (or children-in-law),
grandchildren
• “Skipped” generations: grandparents and
grandchildren, without parents
• More than three generations
The definition of a multi-generational household used
in this report is more expansive than the definition
used by the Census Bureau. For more details, see
Appendix A.

7
Fighting Poverty in a Tough Economy, Americans Move in with Their Relatives
www.pewsocialtrends.org
About the Report
This report was researched and written by Rakesh Kochhar, senior researcher, and D’Vera Cohn, senior writer, of the Social and Demographic Trends project of the Pew Research Center. The datasets for the analysis were prepared by Jeffrey S. Passel, senior demographer at the Center. The report was edited by Paul Taylor, executive vice president of the Pew Research Center and director of the Social and Demographic Trends project. Research assistants Seth Motel and Eileen Patten and Gabriel Velasco, research analyst, assisted with charts and numbers-checking. The report was copy-edited by Marcia Kramer.

8
PEW SOCIAL AND DEMOGRAPHIC TRENDS
www.pewsocialtrends.org
14.6
15.3
15.7
24.0
25.6
25.4
2007
2008
2009
Unemployed Employed
CHAPTER 1: INTRODUCTION The number of Americans living in multi-generational households rose sharply during the Great Recession. From 2007 to 2009, the population living in these households increased by 4.9 million. By contrast, the number of people in other households rose by 333,000 and the population in group quarters or of unidentified generation increased by only 156,000.9
The increase in adult children (ages 25 and older) living in their parents’ homes was a driving force boosting the number of multi-generational households. The number of households in which a child age 25 or older lived with a parent increased 590,000 from 2007 to 2009. That was a marked change of pattern from recent years—from 1990 to 2006, the number of these households did not significantly change. Moving in with family can make economic sense. For some groups, the incomes of multi-generational households are higher than the incomes of other households. Living together may also reduce poverty—in 2009, the poverty rate among residents of multi-generational households was 11.5%, compared with 14.6% for those in other households. The potential benefits are even greater for the most economically vulnerable—unemployed workers, young adults, Hispanics and blacks. The economic benefits of living in multi-generational households flow from the addition of earners to the household. The resulting increase in household income is often more than enough to compensate for the increase in household size. Shared living arrangements also can reduce the burden on any single member for supporting the household. This may help people in multi-generational households navigate through economic storms.
9 See Mykyta and Macartney (2011) for evidence of an increase in multi-generational living arrangements during other business downturns. Nursing homes and correctional facilities are examples of group quarters (see http://www.census.gov/acs/www/Downloads/data_documentation/GroupDefinitions/2010GQ_Definitions.pdf).
Share of Workers Living in Multi-generational Households, by Employment Status, 2007-2009 %
Source: Pew Research Center analysis of 2007, 2008 and 2009 American Community Surveys (IPUMS)
PEW RESEARCH CENTER
9
Fighting Poverty in a Tough Economy, Americans Move in with Their Relatives
www.pewsocialtrends.org
The rapid increase in multi-generational living arrangements during the Great Recession is associated with a spike in unemployment. The unemployed are much more likely than the employed to live in multi-generational households—25.4% vs. 15.7% in 2009. This differential did not change much during the recession, but the number of unemployed people did, increasing by 7.2 million from 2007 to 2009.10
Also, the resources of the unemployed were likely stretched more than usual in a recession that set a record for the duration of unemployment since these data first became available in 1967. When the recession started in December 2007, the median duration of unemployment was 8.4 weeks. By the end, in June 2009, the median duration was 17.4 weeks. The typical length of an unemployment spell continued to rise thereafter, peaking at 25.5 weeks in June 2010.11
Other than the unemployed, young adults ages 25 to 34, Hispanics, blacks and immigrants realize notable economic benefits from multi-generational living arrangements. These groups also registered among the greatest increases in those types of households from 2007 to 2009. Although household heads retain the principal burden of providing income in multi-generational households, adult children and parents of householders also account for significant shares of the income of these households.
10 The unemployment rate increased from 4.6% in 2007 to 9.3% in 2009. Unemployment estimates are from the Bureau of Labor Statistics and are derived from the Current Population Survey. Estimates from the ACS show a smaller increase in unemployment from 2007 to 2009 (5.9 million) because the level of unemployment in 2007 is believed to be overstated in the ACS. Details on this issue are available in a Census Bureau research note titled “Changes to the American Community Survey between 2007 and 2008 and the Effect on the Estimates of Employment and Unemployment.” (http://www.census.gov/hhes/www/laborfor/researchnote-report.pdf) 11 These estimates are from the Bureau of Labor Statistics.

10
PEW SOCIAL AND DEMOGRAPHIC TRENDS
www.pewsocialtrends.org
CHAPTER 2: INCOME AND POVERTY IN MULTI-GENERATIONAL AND OTHER HOUSEHOLDS Pooling resources can raise the income of a multi-generational household above the level for other households. There is a trade-off, however. Multi-generational living arrangements also mean there are more people in the household to support. In 2009, the average number of residents in multi-generational households was 4.3, compared with 2.4 in other households. Thus, sharing resources benefits all only if the economies realized from living together exceed the costs of adding people to the household. Because of the trade-off, it is possible that not every member of a multi-generational household is better off as a result of the living arrangement, but the arrangement can provide a safety net for some. For example, parents who take in an unemployed adult child may be financially strained as a result but their action may have pulled the child out of poverty. The analysis in this section uses two yardsticks to measure the potential economic benefits of multi-generational living arrangements: household income and poverty status. Because multi-generational households differ from other households in size, incomes of all households are standardized to reflect a household size of three (see Appendix B for the methodology). Poverty rates are computed across all people, not just household heads. Generally speaking, members of a household are assigned the same poverty status.12 It should be noted that the demographic characteristic of a person may not be the same as that of the household head. For example, some native-born people reside in households with foreign-born heads and vice versa. Similarly, people of a given race and ethnicity may live in a household with a head of another race and ethnicity. Poverty estimates in this report are based on the characteristics of people, not the characteristics of the head of the household in which they live. The report does not attempt to identify whether individual members of multi-generational households may be better or worse off living apart.13
The evidence suggests that the formation of multi-generational households may result in economic benefits for residents of those households—boosting household income, in spite of the increase in household size, and placing a safety net under those teetering on the economic ledge.
12 Details on the assignment of poverty status in IPUMS data are available at http://usa.ipums.org/usa-action/variables/POVERTY#description_tab. 13 Because we do not observe the counterfactual—the economic well-being of individuals if they departed from multi-generational households—it is difficult to ascribe cause and effect with respect to multi-generational living and economic welfare. Also, part of the observed differences in income and poverty across household types could be the result of differences in the characteristics of the residents of those households that correlate with income, e.g., education, job experience, and so on. See, for example, Speare and Avery (1993), Flippen and Tienda (1998), Cohen and Casper (2002), Kreider (2007) and Wiemers (2011).

11
Fighting Poverty in a Tough Economy, Americans Move in with Their Relatives
www.pewsocialtrends.org
For the overall population, living in multi-generational households does not necessarily yield higher incomes because the increase in household size effectively counters the rise in household income. But there are important exceptions: Hispanics, blacks, immigrants and unemployed workers experience significant gains from multi-generational living arrangements. The formation of multi-generational households does appear to lift people out of poverty. That is true for the overall population and for subpopulations that are generally less well off than average, including unemployed workers, young adults, Hispanics, blacks and immigrants. Poverty levels for many of these groups are substantially less within multi-generational households. The economic benefits associated with multi-generational households have been relatively constant from 2007 to 2009. But many more people appear to have sought those benefits during the recession. Thus, the rise of multi-generational households in the recession could be viewed as the American public’s self-designed anti-poverty program. Economic Outcomes for the Overall Population by Household Type The median income reported by multi-generational households is higher than the income reported by other households. In 2009, the reported median income of multi-generational households was $61,968 compared with $49,374 for other households, a gap of 26%. A similar gap existed in 2007 and 2008. It is necessary, however, to account for size differences: Multi-generational households average 4.3 residents, compared with only 2.4 for other households. Using the methodology described in the appendix, all household incomes are standardized to a household size of three. After differences in household size are accounted for, the income of multi-generational households is below that of other
Median Household Income, by Type of Household, 2007-2009 in 2009 dollars 2007 2008 2009
Type of household Multi-generational $63,892 $63,524 $61,968 Other $51,551 $50,738 $49,374
Source: Pew Research Center analysis of 2007, 2008 and 2009 American Community Surveys (IPUMS)
PEW RESEARCH CENTER
Median Income for a Household Size of Three, by Type of Household, 2007-2009 in 2009 dollars 2007 2008 2009
Type of household Multi-generational $59,916 $59,364 $57,533 Other $61,114 $61,147 $59,002
Note: See Appendix B for the method used to adjust household income.
Source: Pew Research Center analysis of 2007, 2008 and 2009 American Community Surveys (IPUMS)
PEW RESEARCH CENTER

12
PEW SOCIAL AND DEMOGRAPHIC TRENDS
www.pewsocialtrends.org
10.5 10.6 11.5
13.1 13.4 14.6
2007 2008 2009
Multi-generational Other
households. In 2009, the median of the adjusted income for multi-generational households was $57,533, or 2% less than the median $59,002 adjusted income for other households. The same modest difference, to the disadvantage of multi-generational households, existed in 2007 and 2008. Although multi-generational households may not necessarily provide higher incomes, they do seem to offer a safety net. The poverty rate among residents of multi-generational households is much lower than in other households—11.5%, compared with 14.6%, in 2009.14
This benefit has prevailed consistently since 2007. The poverty-reducing role of multi-generational households is notable in view of the fact that those who typically have lesser financial resources than average—unemployed workers, young adults, Hispanics, blacks and immigrants—are also more likely to reside in these households.
14 Poverty thresholds vary with family size. For example, in 2009, the poverty threshold for a family of two was about $13,991 and the threshold for a family of four was about $21,954. Precise levels of the thresholds vary with age of the household head and the number of children younger than 18 living with the family. (http://www.census.gov/hhes/www/poverty/index.html)
Poverty Rates of People, by Type of Household, 2007-2009 %
Note: Due to the way in which the IPUMS assigns poverty status, these estimates will differ from those that might be provided by the U.S. Census Bureau.
Source: Pew Research Center analysis of 2007, 2008 and 2009 American Community Surveys (IPUMS)
PEW RESEARCH CENTER
13
Fighting Poverty in a Tough Economy, Americans Move in with Their Relatives
www.pewsocialtrends.org
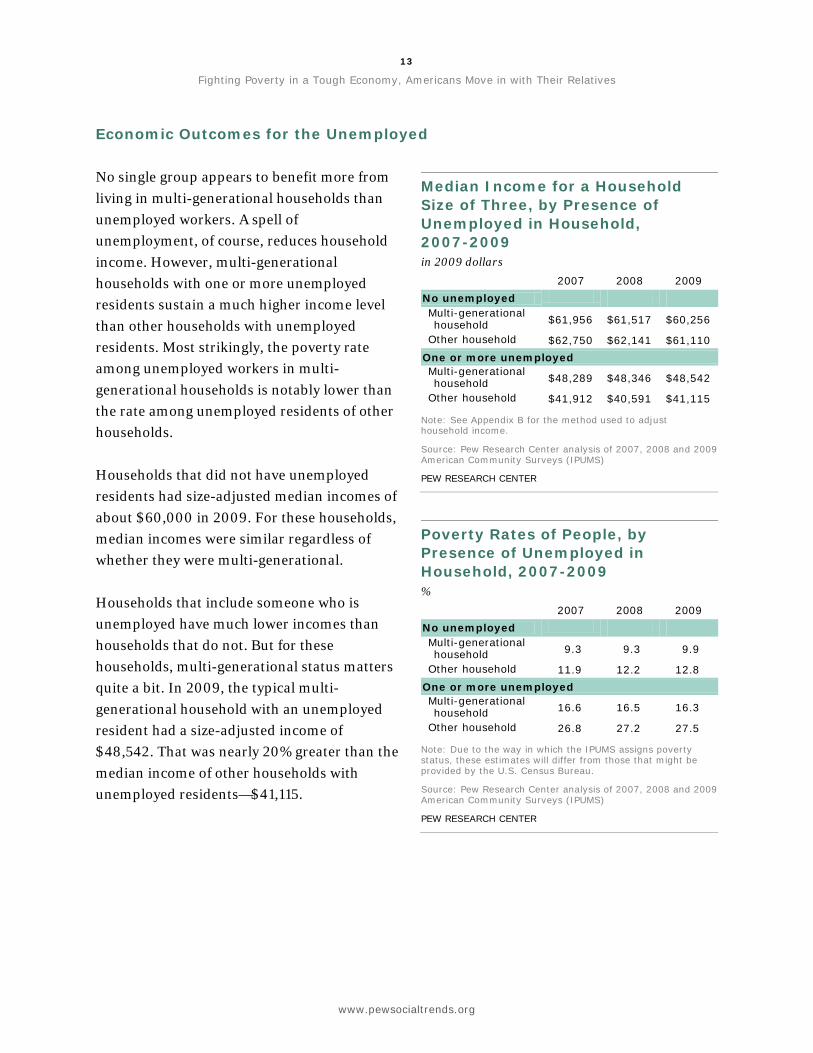
Economic Outcomes for the Unemployed No single group appears to benefit more from living in multi-generational households than unemployed workers. A spell of unemployment, of course, reduces household income. However, multi-generational households with one or more unemployed residents sustain a much higher income level than other households with unemployed residents. Most strikingly, the poverty rate among unemployed workers in multi-generational households is notably lower than the rate among unemployed residents of other households. Households that did not have unemployed residents had size-adjusted median incomes of about $60,000 in 2009. For these households, median incomes were similar regardless of whether they were multi-generational. Households that include someone who is unemployed have much lower incomes than households that do not. But for these households, multi-generational status matters quite a bit. In 2009, the typical multi-generational household with an unemployed resident had a size-adjusted income of $48,542. That was nearly 20% greater than the median income of other households with unemployed residents—$41,115.
Median Income for a Household Size of Three, by Presence of Unemployed in Household, 2007-2009 in 2009 dollars 2007 2008 2009
No unemployed Multi-generational household $61,956 $61,517 $60,256
Other household $62,750 $62,141 $61,110 One or more unemployed Multi-generational household $48,289 $48,346 $48,542
Other household $41,912 $40,591 $41,115
Note: See Appendix B for the method used to adjust household income.
Source: Pew Research Center analysis of 2007, 2008 and 2009 American Community Surveys (IPUMS)
PEW RESEARCH CENTER
Poverty Rates of People, by Presence of Unemployed in Household, 2007-2009 % 2007 2008 2009
No unemployed Multi-generational household 9.3 9.3 9.9
Other household 11.9 12.2 12.8 One or more unemployed Multi-generational household 16.6 16.5 16.3
Other household 26.8 27.2 27.5
Note: Due to the way in which the IPUMS assigns poverty status, these estimates will differ from those that might be provided by the U.S. Census Bureau.
Source: Pew Research Center analysis of 2007, 2008 and 2009 American Community Surveys (IPUMS)
PEW RESEARCH CENTER

14
PEW SOCIAL AND DEMOGRAPHIC TRENDS
www.pewsocialtrends.org
17.5
30.3
Multi-generational Other
Consistent with the finding on income, people experience higher poverty rates if they reside in households with at least one unemployed resident. But how much higher again depends on living arrangements. In households without any unemployed residents, the poverty rate ranges from about 10% in multi-generational households to about 13% in other households in 2009. Among households with unemployed residents, there is a striking advantage to multi-generational living arrangements. Some 16.3% of people who lived with unemployed workers in multi-generational households were in poverty in 2009. In sharp contrast, the poverty rate among people living in other households with unemployed workers was 27.5%. Looked at from another perspective—the poverty profile of unemployed workers themselves—the benefits of multi-generational living emerge in sharper relief. In 2009, the poverty rate among unemployed workers living in multi-generational households was 17.5%. That was only slightly more than half the 30.3% rate among unemployed workers who lived in other households. Income and Poverty by Demographic Characteristics The potential benefits of living in multi-generational households—higher income and lower poverty rates—vary across groups. By household type, the largest differentials in income and poverty are among Hispanics, blacks and immigrants. For Asians, the gains are small. Whites and the native born appear to experience minimal gains from multi-generational living arrangements. Economic outcomes, especially poverty rates, for young adults and the elderly also appear better in multi-generational households. Among racial and ethnic groups, Hispanic multi-generational households had a size-adjusted median income of $46,049 in 2009. That was 19% higher than the $38,710 median income for other Hispanic households. Black multi-generational households also had higher incomes than other households, $43,677 vs. $39,484. The estimated gain for Asian households is more
Poverty Rates for the Unemployed, by Type of Household, 2009 %
Note: Due to the way in which the IPUMS assigns poverty status, these estimates will differ from those that might be provided by the U.S. Census Bureau.
Source: Pew Research Center analysis of the 2009 American Community Survey (IPUMS)
PEW RESEARCH CENTER
15
Fighting Poverty in a Tough Economy, Americans Move in with Their Relatives
www.pewsocialtrends.org
$64,914
$46,049
$43,677
$73,446
$58,253
$55,045
$65,366
$38,710
$39,484
$72,222
$60,763
$45,782
White
Hispanic
Black
Asian
Native born
Foreign born
Multi-generational households Other households
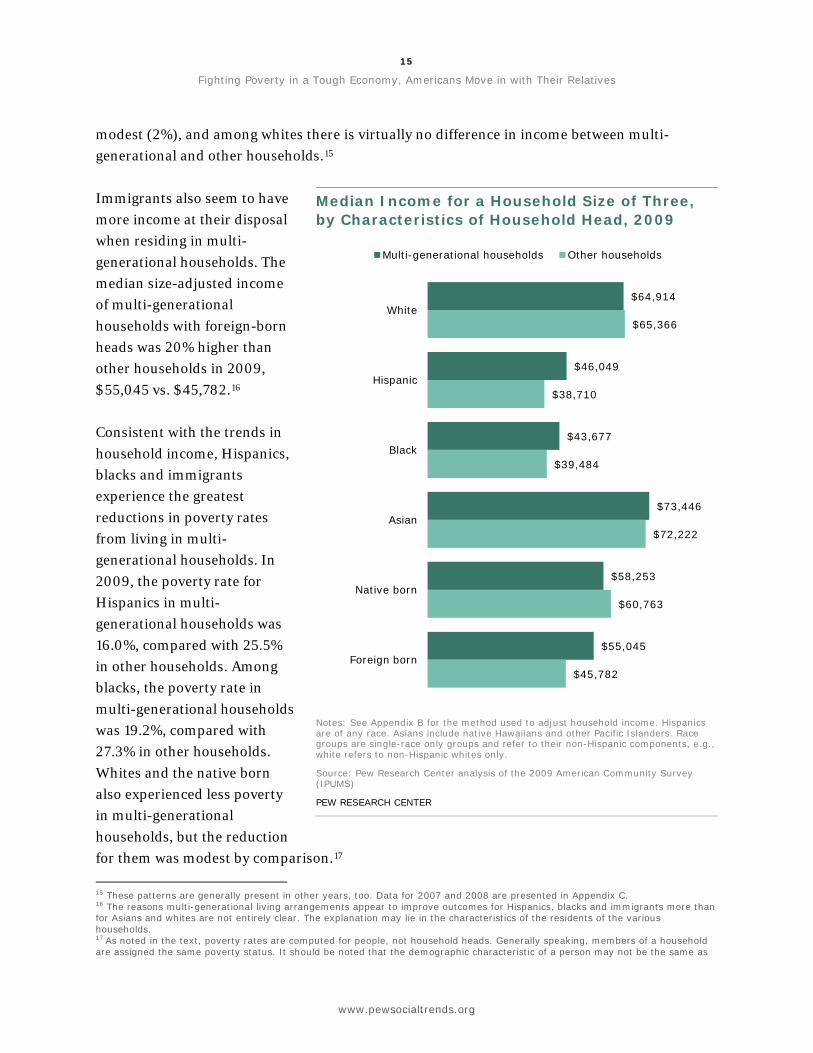
modest (2%), and among whites there is virtually no difference in income between multi-generational and other households.15
Immigrants also seem to have more income at their disposal when residing in multi-generational households. The median size-adjusted income of multi-generational households with foreign-born heads was 20% higher than other households in 2009, $55,045 vs. $45,782.16
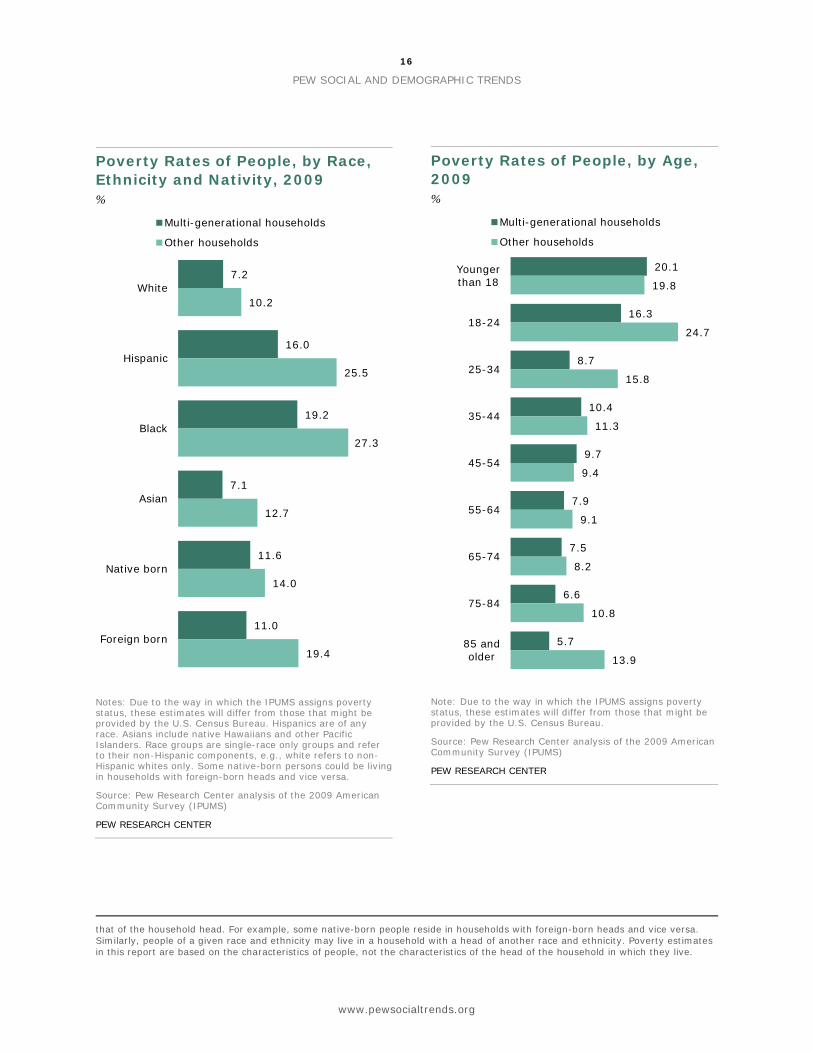
Consistent with the trends in household income, Hispanics, blacks and immigrants experience the greatest reductions in poverty rates from living in multi-generational households. In 2009, the poverty rate for Hispanics in multi-generational households was 16.0%, compared with 25.5% in other households. Among blacks, the poverty rate in multi-generational households was 19.2%, compared with 27.3% in other households. Whites and the native born also experienced less poverty in multi-generational households, but the reduction for them was modest by comparison.17
15 These patterns are generally present in other years, too. Data for 2007 and 2008 are presented in Appendix C.
16 The reasons multi-generational living arrangements appear to improve outcomes for Hispanics, blacks and immigrants more than for Asians and whites are not entirely clear. The explanation may lie in the characteristics of the residents of the various households. 17 As noted in the text, poverty rates are computed for people, not household heads. Generally speaking, members of a household are assigned the same poverty status. It should be noted that the demographic characteristic of a person may not be the same as
Median Income for a Household Size of Three, by Characteristics of Household Head, 2009
Notes: See Appendix B for the method used to adjust household income. Hispanics are of any race. Asians include native Hawaiians and other Pacific Islanders. Race groups are single-race only groups and refer to their non-Hispanic components, e.g., white refers to non-Hispanic whites only.
Source: Pew Research Center analysis of the 2009 American Community Survey (IPUMS)
PEW RESEARCH CENTER
16
PEW SOCIAL AND DEMOGRAPHIC TRENDS
www.pewsocialtrends.org
7.2
16.0
19.2
7.1
11.6
11.0
10.2
25.5
27.3
12.7
14.0
19.4
White
Hispanic
Black
Asian
Native born
Foreign born
Multi-generational households
Other households
20.1
16.3
8.7
10.4
9.7
7.9
7.5
6.6
5.7
19.8
24.7
15.8
11.3
9.4
9.1
8.2
10.8
13.9
Younger than 18
18-24
25-34
35-44
45-54
55-64
65-74
75-84
85 and older
Multi-generational households
Other households
that of the household head. For example, some native-born people reside in households with foreign-born heads and vice versa. Similarly, people of a given race and ethnicity may live in a household with a head of another race and ethnicity. Poverty estimates in this report are based on the characteristics of people, not the characteristics of the head of the household in which they live.
Poverty Rates of People, by Race, Ethnicity and Nativity, 2009 %
Notes: Due to the way in which the IPUMS assigns poverty status, these estimates will differ from those that might be provided by the U.S. Census Bureau. Hispanics are of any race. Asians include native Hawaiians and other Pacific Islanders. Race groups are single-race only groups and refer to their non-Hispanic components, e.g., white refers to non-Hispanic whites only. Some native-born persons could be living in households with foreign-born heads and vice versa.
Source: Pew Research Center analysis of the 2009 American Community Survey (IPUMS)
PEW RESEARCH CENTER
Poverty Rates of People, by Age, 2009 %
Note: Due to the way in which the IPUMS assigns poverty status, these estimates will differ from those that might be provided by the U.S. Census Bureau.
Source: Pew Research Center analysis of the 2009 American Community Survey (IPUMS)
PEW RESEARCH CENTER

17
Fighting Poverty in a Tough Economy, Americans Move in with Their Relatives
www.pewsocialtrends.org
Young adults living in multi-generational households, a population that rose sharply during the Great Recession, experience marked reductions in poverty. The poverty rate of those ages 25 to 34, if living in multi-generational households, was 8.7% in 2009. That was barely more than half the poverty rate of 15.8% for these young adults in other households.18
Elderly persons may also benefit economically from multi-generational living arrangements. For those ages 75 to 84 in multi-generational households, the poverty rate was 6.6% in 2009, compared with 10.8% for those in other households. Similarly large differences exist for those ages 85 and older.
18 This gap may understate the benefits of living in multi-generational households for young adults. Based on March 2011 Current Population Survey (CPS) data, the Census Bureau reports that young adults (ages 25 to 34) in “doubled-up” households had a poverty rate of 8.4% in 2010. However, based on their own income alone, the poverty rate among these young adults would have been 45.3%. The Census Bureau’s definition of doubled-up households differs from the definition of multi-generational households used in this report. For details, see http://blogs.census.gov/censusblog/2011/09/households-doubling-up.html.

18
PEW SOCIAL AND DEMOGRAPHIC TRENDS
www.pewsocialtrends.org
69.6
25.2
20.5
100.0
Multi-generational
Other
Household head or same generation
Child of head or same generation
Parent of head or same generation
Household head or same generation
Sources of Household Income in Multi-generational Households Who pays the bills? In most households with parents and minor children, it is mom, dad or both. But in multi-generational households it could also be the adult child, the elderly parent or the grandparent. This section considers the issue of financial responsibility from two perspectives: the share accounted for by a generation, for example, mom and dad together; and the share accounted for by an individual, such as mom or dad alone. The generation in charge of a household—the head alone or in combination with a spouse, sibling, sibling-in-law, partner or another individual of the same generation—typically accounts for the largest share of household income. But the distribution differs sharply by household type: There are more sources of household income in multi-generational households. In multi-generational households, the head and others of that generation account for a median 69.6% of household income. In half of the multi-generational households, the householder generation accounts for more; in the other half, the householder generation accounts for less.
Generations’ Shares of Household Income, by Type of Household, 2009 median of shares (%)
Note: Median values of shares are computed over different universes. For example, the median for "child of head or same generation" is computed only over households where such persons are present.
Source: Pew Research Center analysis of the 2009 American Community Survey (IPUMS)
PEW RESEARCH CENTER

19
Fighting Poverty in a Tough Economy, Americans Move in with Their Relatives
www.pewsocialtrends.org
When children ages 25 and older and others of that generation live in a multi-generational household, they typically account for 25.2% of household income.19
The parents of a household head also provide a significant share of household income—the median share among the multi-generational households in which they live is 20.5%.
In more than half of households without multiple generations, householders and others of that generation are the only sources of income. Thus, the median share of this generation in households that are not multi-generational is 100%. These share levels have been steady over duration of the recession. A similar pattern emerges when household income is sourced across individual members of the household. A household head alone accounts for slightly less than half (48.8%) of income in a multi-generational household. Myriad individuals also add to total income in these households. A child of the head of a multi-generational household typically accounts for 12.6% of income, a child-in-law 18.3% and a householder’s parent 19.3%.20
Significant shares also come from parents-in-law, siblings, partners and others.
Heads of other households account for 85.7% of household income. Because these households have fewer family members (and, therefore, fewer potential earners), typical shares of spouses (38.4%), siblings (28.6%) and siblings-in-law (20.3%) are also greater than in multi-generational households.
19 This calculation is not limited to the contributions of children 25 or older. The multi-generational households in which these adult children live could include their younger siblings or spouses. 20 The child or child-in-law could be of any age. If there is one child age 25 or older residing in a household, that household is a multi-generational household regardless of the ages of other children in the household.
People’s Shares of Household Income, by Relationship to Head of Household and Type of Household, 2009 median of shares (%) Type of household
Multi-generational Other
Relationship Household head 48.8 85.7 Spouse 26.3 38.4 Child 12.6 0.0 Child-in-law 18.3 0.0 Parent 19.3 --- Parent-in-law 11.4 --- Sibling 14.4 28.6 Sibling-in-law 13.5 20.3 Grandchild 0.0 --- Other relative 0.0 7.6 Partner, roommate 26.3 38.4 Other non-relative 11.4 14.8
Note: Median values of shares are computed over different universes. For example, the median for "spouse" is computed only over households where a spouse is present.
Source: Pew Research Center analysis of the 2009 American Community Survey (IPUMS)
PEW RESEARCH CENTER

20
PEW SOCIAL AND DEMOGRAPHIC TRENDS
www.pewsocialtrends.org
47.8
24.7
51.0
24.8
Household head
Child 25 or older
Household head
Parent
Head with child
Head with parent
Income Sharing in Two-Adult Generation Multi-generational Households The majority of multi-generational households (56%) consist of two adult generations: either a head with a child 25 or older or a head with a parent in the home.21
Both adult children and parents of householders account for sizable shares of the incomes of these households.
In 2009, the median share of household income from a child 25 or older in a two-generation multi-generational household was 24.7%. Parents living in their adult child’s household accounted for virtually the same amount—24.8%. The heads of these households accounted for 47.8% of income in households that included their adult children and 51.0% of income in households that included their parents. Shares of Household Income by Employment Status Household heads account for less of household income when they are unemployed, as might be expected. However, their share of household income is reduced more if they are part of a multi-generational household. In multi-generational households, it may be that the living arrangement eases the burden on an unemployed householder to provide for the household. In other households, however, there is less “make-up” income. In 2009, employed heads of multi-generational households typically accounted for 54.1% of household income. But if they were unemployed, their share dropped by a third, to 35.3%. In other households, the heads were responsible for about the same share of household income regardless of employment status—83.2% if employed and 80.8% if unemployed.
21 A small share of two-generation multi-generational households consists of a head with a grandchild 25 or older.
Shares of Household Income in Specified Two-Generation Multi-generational Households, 2009 median of shares (%)
Source: Pew Research Center analysis of the 2009 American Community Survey (IPUMS)
PEW RESEARCH CENTER

21
Fighting Poverty in a Tough Economy, Americans Move in with Their Relatives
www.pewsocialtrends.org
54.1
35.3
83.2
80.8
Employed head
Unemployed head
Employed head
Unemployed head
Multi-generational households
Other households
31.4
9.1
Employed child 25 or older
Unemployed child
25 or older
The shares in household income of adult children, 25 or older, who live in multi-generational households varies greatly by their employment status. Employed children 25 or older accounted for almost a third (31.4%) of household income in 2009; unemployed children of this age accounted for only 9.1%. Shares of Household Income for Heads of Households by Demographic Characteristics Reflecting differences in the average number of earners across households, there are more sources of income in Hispanic and Asian households than in white and black households. The same is true in immigrant households, the vast majority of which are headed by Hispanics and Asians, compared with headed by the native born. On average, a multi-generational home with an Hispanic or Asian householder has 2.6 earners in residence. That is higher than the average number in white (2.1) and black (2.0) multi-generational households. Consequently, in multi-generational households, the typical Hispanic head of the household accounted for 42.3% of total income and the typical Asian householder accounted for 43.9%. These shares were less than those of white (50.0%) and black (52.0%) heads of multi-generational households. The differences by race and ethnicity are also present in other households—Hispanic and Asian heads account for less household income than whites and blacks. Most notably, blacks who are the heads of other households typically account for all of household income. This pattern is also due to differences in the average number of earners in other households by race and ethnicity—1.6 in other households with Hispanic heads, 1.5 in Asian households, 1.3 in white households and 1.2 in black households.
Shares of Household Income, by Employment Status, 2009 median of shares (%)
Source: Pew Research Center analysis of the 2009 American Community Survey (IPUMS)
PEW RESEARCH CENTER

22
PEW SOCIAL AND DEMOGRAPHIC TRENDS
www.pewsocialtrends.org
50.0
42.3
52.0
43.9
50.1
42.7
84.1
75.6
100.0
79.2
86.6
79.2
White
Hispanic
Black
Asian
Native born
Foreign born
Multi-generational households Other households
Foreign-born heads of multi-generational households account for 42.7% of total income, compared with 50.1% for native-born heads of such households. In other households, immigrant householders account for 79.2% and native-born householders 86.6%.
Shares of Household Income for Heads of Households, by Race, Ethnicity and Nativity, 2009 median of shares (%)
Note: Hispanics are of any race. Asians include native Hawaiians and other Pacific Islanders. Race groups are single-race only groups and refer to their non-Hispanic components, e.g., white refers to non-Hispanic whites only.
Source: Pew Research Center analysis of the 2009 American Community Survey (IPUMS)
PEW RESEARCH CENTER

23
Fighting Poverty in a Tough Economy, Americans Move in with Their Relatives
www.pewsocialtrends.org
16.7 15.1
12.1 15.0
24.7
0
10
20
30
1940 1950 1960 1970 1980 1990 2000 2009
%
CHAPTER 3: DEMOGRAPHICS OF MULTI-GENERATIONAL HOUSEHOLDS The number of Americans living in multi-generational households grew more than five times as sharply as the overall population increased from 2007 to 2009, the years that spanned the Great Recession. The largest increase was among adults ages 25 to 34 who live with their parents. In 2009, a record 51.4 million Americans lived in a multi-generational household. These households included one-in-six Americans (16.7%) and more than one-in-five (21.1%) adults ages 25 to 34. Multi-generational households are those that include two or more adult generations, such as a parent and child, or a grandparent, parent and grown child, as well as a skipped-generation home with a grandparent and grandchild. This section focuses mainly on changes in U.S. multi-generational households from 2007 to 2009, the years that bracketed the Great Recession.22
The share of Americans living in multi-generational households has grown by a third since 1980, when it was 12.1%. The growth, chronicled in a previous report by the Pew Research Center, represents a sharp reversal of the pattern from 1940 to 1980. From 2007 to 2009, the number of Americans living in multi-generational households grew by nearly 5 million, a 10.5% increase at a time when the overall population grew only 1.8%. About half of the increase since 2000 in the number of Americans living in multi-generational households took place from 2007 to 2009. The rate of growth was also twice the rate that had prevailed from 1980 to 2006. By contrast to the sharp increase in multi-generational households, the number of Americans who live in households that are not multi-generational—such as those including a parent and a child younger than 25, married couples with or without children younger than 25, unrelated
22 The recession officially began in December 2007 and ended in June 2009.
Share of U.S. Population Living in Multi-generational Households, 1940-2009
Source: Pew Research Center analysis of U.S. Decennial Census data, 1940-2000, and 2006, 2007, 2008, 2009 American Community Surveys (IPUMS)
PEW RESEARCH CENTER

24
PEW SOCIAL AND DEMOGRAPHIC TRENDS
www.pewsocialtrends.org
adults or someone living alone—grew less than 1% from 2007 to 2009. (The remainder of the population, mainly Americans living in group quarters, increased 1.9% during that period.) Household Type In 2009, there were 11.9 million multi-generational households in the U.S., up from 11 million in 2007. Most of these households (6.9 million) consist of two adult generations. The second largest group, 4.1 million in 2009, consists of three generations. A small number of multi-generational households (about 88,000) include more than three generations—for example, a great-grandparent, grandparent, parent and grown child. Some 857,000 are skipped-generation households, with grandparents and grandchildren living together. Roughly equal numbers of Americans lived in multi-generational households with two generations (24 million) or three generations (23.9 million) in 2009. The populations living in these households grew rapidly from 2007 to 2009—9.9% for two-generation households and 12.5% for three-generation households. The population living in households with more than three family generations is relatively small—about 662,000 in 2009. But the number of residents in these households increased the most—17.4%—from 2007 to 2009. There was no growth in the number of residents of skipped-generation households, 2.8 million in both 2007 and 2009. Age Groups: 25 to 34 The number and share of Americans living in multi-generational households rose for all age groups from 2007 to 2009. The sharpest growth was among adults ages 25 to 34, 8.7 million of whom lived in multi-generational households in 2009, compared with 7.4 million in 2007. Both the numerical growth (about 1.3 million people) and the percentage increase it represents (16.8%) were larger than for any other age group.
U.S. Population by Type of Multi-generational Household, 2009 in thousands
Two generations 24,028 Three generations 23,877 More than three generations 662 Skipped generations 2,805
Note: See Terminology for definitions.
Source: Pew Research Center analysis of the 2009 American Community Survey (IPUMS)
PEW RESEARCH CENTER
25
Fighting Poverty in a Tough Economy, Americans Move in with Their Relatives
www.pewsocialtrends.org
The share of these adults in multi-generational households rose to 21.1% in 2009 from 18.7% in 2007. That 2.4 percentage point increase also was larger than for any other age group. The profile of adults ages 25 to 34 living in multi-generational households differs from the overall population of Americans who do. Most notably, these adults are markedly more likely to live in two-generation households than in other types of multi-generational households. Six-in-ten (62.0%) do, compared with slightly less than half (46.8%) of the total population in multi-generational homes. Most adults ages 25 to 34 in multi-generational households live in their parents’ home. In 2009, 79% of people in this age group who lived in multi-generational households were either the grown child of the householder or of that same generation, a group that includes spouses or partners of grown children. The share of adults ages 25 to 34 in multi-generational households who live in households headed by someone of their parents’ generation grew slightly since 2007, when it was 77.6%. A smaller share of these adults (12.7%) are heads of multi-generational households. Looked at in the broader context of population change, the number of adults 25 to 34 in multi-generational homes increased more sharply than their numbers overall: 16.8%, compared with 3.5%. One notable difference between adults 25 to 34 and the overall population in multi-generational households has to do with gender. Men living in multi-generational households outnumber women in this age group who do so (4.9 million to 3.8 million), but in multi-generational households overall there are more women than men. The next section looks in more detail at gender patterns.
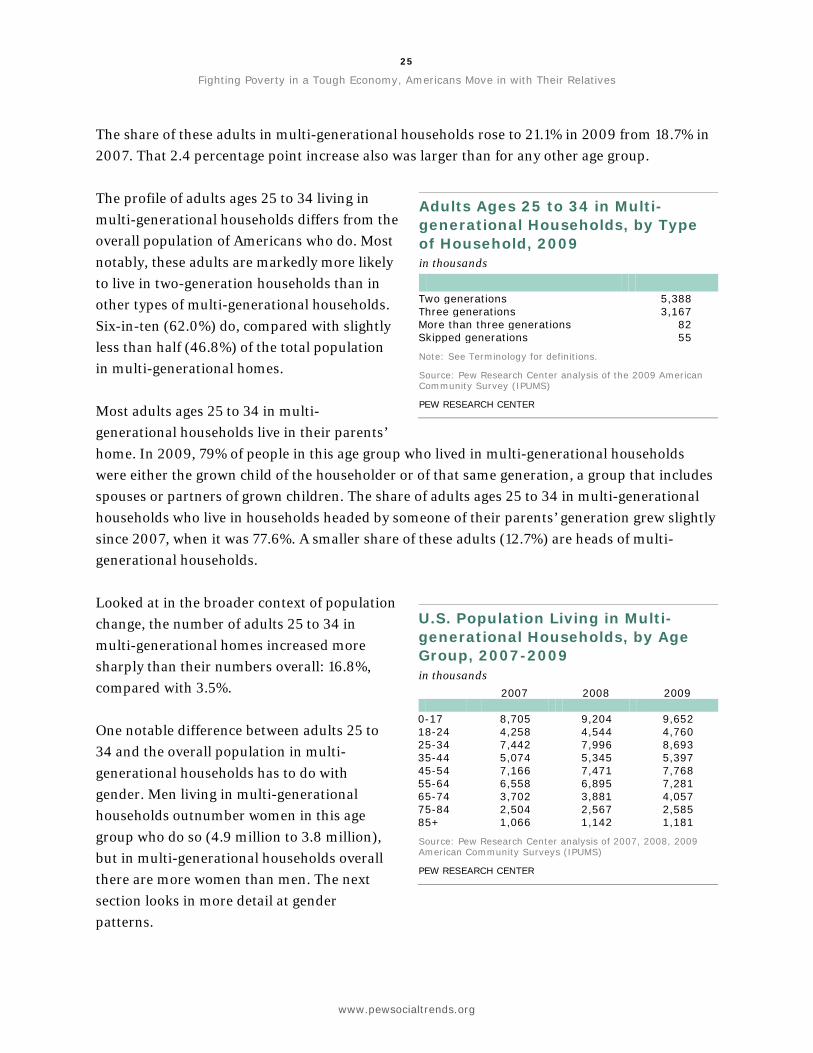
Adults Ages 25 to 34 in Multi-generational Households, by Type of Household, 2009 in thousands
Two generations 5,388 Three generations 3,167 More than three generations 82 Skipped generations 55
Note: See Terminology for definitions.
Source: Pew Research Center analysis of the 2009 American Community Survey (IPUMS)
PEW RESEARCH CENTER
U.S. Population Living in Multi-generational Households, by Age Group, 2007-2009 in thousands 2007 2008 2009
0-17 8,705 9,204 9,652 18-24 4,258 4,544 4,760 25-34 7,442 7,996 8,693 35-44 5,074 5,345 5,397 45-54 7,166 7,471 7,768 55-64 6,558 6,895 7,281 65-74 3,702 3,881 4,057 75-84 2,504 2,567 2,585 85+ 1,066 1,142 1,181
Source: Pew Research Center analysis of 2007, 2008, 2009 American Community Surveys (IPUMS)
PEW RESEARCH CENTER

26
PEW SOCIAL AND DEMOGRAPHIC TRENDS
www.pewsocialtrends.org
12 14
19
12
16
20 19 19 21
15 13
16
21
13
17
21 19 20
21
17
0-17 18-24 25-34 35-44 45-54 55-64 65-74 75-84 85+ All Ages
2007 2009
The share of 25- to 34-year-olds in multi-generational arrangements is similar to the share of adults ages 85 and older in such households (21.5% in 2009) and the share of older Baby Boomer adults ages 55 to 64 (20.9%). In the oldest age group, the number in multi-generational households rose more slowly, by 10.8% from 2007 to 2009. The number in the Baby Boomer group rose 11% from 2007 to 2009. The age groups least likely to live in multi-generational households are children under age 18 (13%) and adults ages 35 to 44 (12.9%). Gender Differences The number of males in multi-generational households rose 11.6% from 2007 to 2009, compared with a 9.6% increase among females, and grew more sharply in each of the four types of multi-generational households. The number of males grew most sharply in the relatively small category of the household where more than three generations live under one roof, increasing 18.8%, compared with 16.4% for females. In households where three generations live together, the number of males went up 13.2% and the number of females rose 11.9%.
Share of U.S. Population Living in Multi-generational Households, by Age Group, 2007 and 2009 %
Source: Pew Research Center analysis of 2007 and 2009 American Community Surveys (IPUMS)
PEW RESEARCH CENTER

27
Fighting Poverty in a Tough Economy, Americans Move in with Their Relatives
www.pewsocialtrends.org
In two-generation multi-generational households, the number of males rose 11.3% from 2007 to 2009, while the number of females rose 8.4%. In the skipped generation grandparent-grandchild home, the number of males rose 1.1% while the number of females declined 1.2%. The number of males in multi-generational households grew by 2.5 million from 2007 to 2009. The growth was nearly evenly split between males in two-generation households and males in three-generation households, both up by 1.2 million. However, the number of residents of multi-generational homes includes somewhat more females than males—27.2 million, compared with 24.1 million. A higher share of females (17.5%) than males (15.9%) live in multi-generational homes. In part, this reflects the fact that women on average live longer than men and the fact that most older men are married and most older women are not.23
The profile of the typical male in a multi-generational household differs from the profile of the typical female. Half of males live in two-generation homes that house a parent or parents and grown child or children, while half of females live in households with three or more generations living under one roof. Gender and Two-Generation Households The only type of multi-generational household in which there are more males than females is the two-generation home in which grown children (or others of the same generation) live with their parents—12.1 million men, compared with 11.9 million women. Females greatly outnumber males in the other types of multi-generational households, especially the three-generation household, where there are 13.4 million females, compared with 10.4 million males. Men living in multi-generational households also are more likely than women in such households to be the grown child (or same generation) of the head of the household, 43.2% to 32.9%. The pattern of more young men than young
23 U.S. Department of Health and Human Services (2011).
Population in Multi-generational Households, by Gender and Type of Household, 2009 in thousands Men Women
Two generations 12,115 11,913 Three generations 10,437 13,440 More than three generations 266 396 Skipped generations 1,307 1,498
Note: See Terminology for definitions.
Source: Pew Research Center analysis of the 2009 American Community Survey (IPUMS)
PEW RESEARCH CENTER

28
PEW SOCIAL AND DEMOGRAPHIC TRENDS
www.pewsocialtrends.org
13
23 24 26
18
White Hispanic Black Asian Two or more races
women living with their parents, which has prevailed for many years, has been linked to declines in marriage and more recently to men’s poor economic prospects.24
Females are more likely to be the head of the household, or of the same generation—40.2%, compared with 32.8% of males. Fully 12.1% of females are the parent of the head of the household, compared with 5% of males. These divergent roles within multi-generational households reflect both the larger population of older women and the greater tendency of young adult men to live with their parents. Race and Ethnicity The nation’s major non-Hispanic race groups and Hispanics differ notably in how rapidly the multi-generational population has grown in recent years, as well as how likely they are to live in a multi-generational household and the type of household in which they live. From 2007 to 2009, the sharpest growth in the multi-generational household population was among Hispanics (17.6%) and Americans of two or more races (24.4%). The black population in these households grew by 8.7% from 2007 to 2009, the non-Hispanic white population by 8.5% and the Asian population by 7.3%. In all cases, this growth was more rapid than the overall population increase during this period, which was 6.5% for Hispanics, 14.7% for mixed-race Americans (that is, of two or more races), 1.5% for blacks, 0.4% for whites and 3.8% for Asians.
24 Mather (2011).
Share of U.S. Population in Multi-generational Households, by Race and Ethnicity, 2009 %
Note: Hispanics are of any race. Asians include native Hawaiians and other Pacific Islanders. Race groups are single-race only groups and refer to their non-Hispanic components, e.g., white refers to non-Hispanic whites only.
Source: Pew Research Center analysis of the 2009 American Community Survey (IPUMS)
PEW RESEARCH CENTER
29
Fighting Poverty in a Tough Economy, Americans Move in with Their Relatives
www.pewsocialtrends.org
The most likely groups to live in multi-generational households are Asians (25.8% in 2009), blacks (23.7%) and Hispanics (23.4%). The share living in multi-generational households is notably lower for non-Hispanic whites (13.1%) and mixed-race Americans (17.9%). In terms of numbers, more whites (26 million in 2009) live in multi-generational households than do members of any minority group. But whites account for only half the residents of the nation’s multi-generational households, compared with 65% of the overall population. The most common multi-generational household type for whites is the two-generation home, which most commonly includes a grown child and at least one parent. More than half of whites (55% in 2009) in multi-generational households live in this type of household, the only racial or ethnic group for which this is the case. Hispanics account for the next largest number of residents of multi-generational households—11.3 million people in 2009. Among Hispanics, the three-generation family is the most common multi-generational type—58.7% of multi-generational household residents in 2009 lived in a three-generation household, and the number grew 20.7% from 2007 to 2009. Among Hispanics living in multi-generational households, nearly four-in-ten (39% in 2009) are the grown child of the head of the household (or someone in that same adult-child generation), a higher share than for other race or ethnic groups. That share rose by 2.1 percentage points from 2007 to 2009, a higher increase than for other groups. Among blacks, 8.8 million people lived in multi-generational households in 2009. About half of the black residents of multi-generational households—4.4 million—live in three-generation households. A notable difference between black Americans and other groups is that a higher share of black multi-generational household residents (9%) lives in skipped-generation households, most
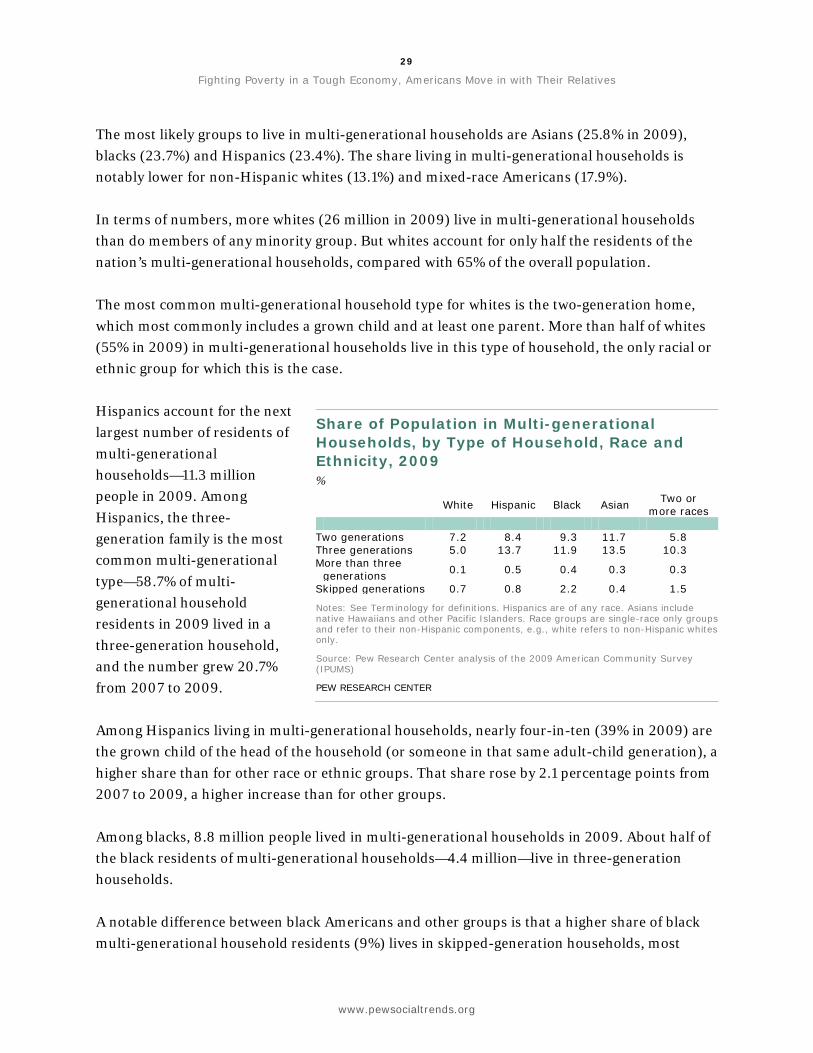
Share of Population in Multi-generational Households, by Type of Household, Race and Ethnicity, 2009 %
White Hispanic Black Asian Two or more races
Two generations 7.2 8.4 9.3 11.7 5.8 Three generations 5.0 13.7 11.9 13.5 10.3 More than three
generations 0.1 0.5 0.4 0.3 0.3
Skipped generations 0.7 0.8 2.2 0.4 1.5
Notes: See Terminology for definitions. Hispanics are of any race. Asians include native Hawaiians and other Pacific Islanders. Race groups are single-race only groups and refer to their non-Hispanic components, e.g., white refers to non-Hispanic whites only.
Source: Pew Research Center analysis of the 2009 American Community Survey (IPUMS)
PEW RESEARCH CENTER
30
PEW SOCIAL AND DEMOGRAPHIC TRENDS
www.pewsocialtrends.org
24.6
15.6 Native
born
Foreign born
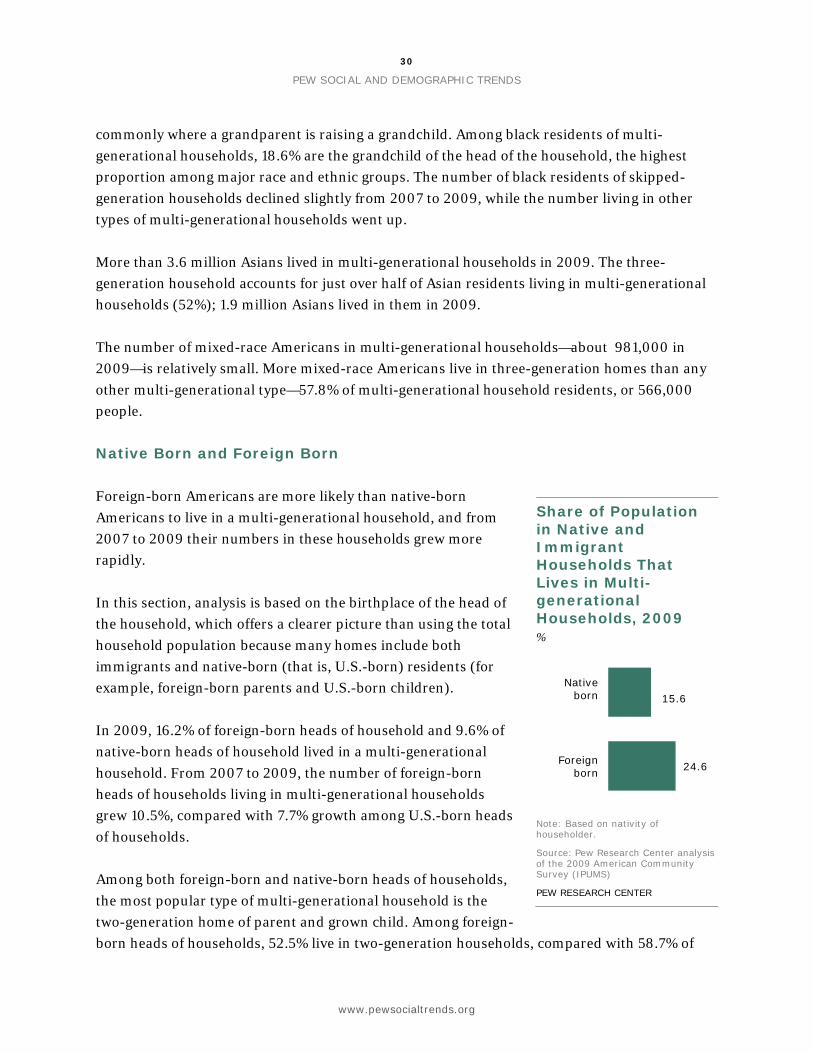
commonly where a grandparent is raising a grandchild. Among black residents of multi-generational households, 18.6% are the grandchild of the head of the household, the highest proportion among major race and ethnic groups. The number of black residents of skipped-generation households declined slightly from 2007 to 2009, while the number living in other types of multi-generational households went up. More than 3.6 million Asians lived in multi-generational households in 2009. The three-generation household accounts for just over half of Asian residents living in multi-generational households (52%); 1.9 million Asians lived in them in 2009. The number of mixed-race Americans in multi-generational households—about 981,000 in 2009—is relatively small. More mixed-race Americans live in three-generation homes than any other multi-generational type—57.8% of multi-generational household residents, or 566,000 people. Native Born and Foreign Born Foreign-born Americans are more likely than native-born Americans to live in a multi-generational household, and from 2007 to 2009 their numbers in these households grew more rapidly. In this section, analysis is based on the birthplace of the head of the household, which offers a clearer picture than using the total household population because many homes include both immigrants and native-born (that is, U.S.-born) residents (for example, foreign-born parents and U.S.-born children). In 2009, 16.2% of foreign-born heads of household and 9.6% of native-born heads of household lived in a multi-generational household. From 2007 to 2009, the number of foreign-born heads of households living in multi-generational households grew 10.5%, compared with 7.7% growth among U.S.-born heads of households. Among both foreign-born and native-born heads of households, the most popular type of multi-generational household is the two-generation home of parent and grown child. Among foreign-born heads of households, 52.5% live in two-generation households, compared with 58.7% of
Share of Population in Native and Immigrant Households That Lives in Multi-generational Households, 2009 %
Note: Based on nativity of householder.
Source: Pew Research Center analysis of the 2009 American Community Survey (IPUMS)
PEW RESEARCH CENTER

31
Fighting Poverty in a Tough Economy, Americans Move in with Their Relatives
www.pewsocialtrends.org
U.S.-born household heads. The number living in two-generation multi-generational households grew 10.3% from 2007 to 2009 for foreign-born household heads and 8.1% for native-born household heads. Among foreign-born heads of households, the sharpest growth from 2007 to 2009 was in the relatively small category of homes with more than three generations, which grew 38.6% but numbered only about 24,000 in 2009. Among the U.S.-born, the three-generation household grew most sharply during that period (8.9%). There are notable differences between the foreign born and native born in the likelihood to live in a three-generation household or a skipped-generation household. Among those living in multi-generational homes, foreign-born household heads (44.0%) are more likely than the native born (32.3%) to live in a three-generation household. But among multi-generational residents, U.S.-born household heads (8.4%) are more likely than the foreign born (2.5%) to live in a skipped-generation household. From 2007 to 2009, the skipped-generation household actually declined in number and in share among foreign-born heads of households.
32
PEW SOCIAL AND DEMOGRAPHIC TRENDS
www.pewsocialtrends.org
REFERENCES Cohen, Philip N. and Lynne M. Casper. “In Whose Home? Multigenerational Families in the
United States, 1998-2000,” Sociological Perspectives 45, No. 1 (2002): 1-20. http://www.unc.edu/~pnc/socforum02.pdf
DeNavas-Walt, Carmen, Bernadette D. Proctor, and Jessica C. Smith. “Income, Poverty, and
Health Insurance Coverage in the United States: 2010,” U.S. Census Bureau, Current Population Reports, P60-239, U.S. Government Printing Office, Washington, D.C. (2011). http://www.census.gov/prod/2011pubs/p60-239.pdf
Flippen, Chenoa and Marta Tienda. “Family Structure and Economic Well-Being of Black,
Hispanic, and White Pre-Retirement Adults,” Office of Population Research, Princeton University (September 1998). http://opr.princeton.edu/papers/opr9802.pdf
Garner, Thesia, Javier Ruiz-Castillo, and Mercedes Sastre. “The Influence of Demographics and
Household-Specific Price Indices on Consumption-Based Inequality and Welfare: A Comparison of Spain and the United States,” Southern Economic Journal 70, No. 1 (2003): 22-48.
Johnson, David S., Timothy M. Smeeding, and Barbara Boyle Torrey. “Economic Inequality
Through the Prisms of Income and Consumption,” Monthly Labor Review 128, No. 4 (April 2005): 11-24.
Kreider, Rose M. “Young Adults Living in Their Parents’ Home,” U.S. Census Bureau, paper
presented at the American Sociological Association annual meetings in New York, N.Y. (August 12, 2007). http://www.census.gov/population/www/socdemo/hh-fam/young-adults-in-parents-home.pdf
Mather, Mark. “In U.S., a Sharp Increase in Men Living at Home,” Population Reference Bureau
(September 2011). http://www.prb.org/Articles/2011/us-young-adults-living-at-home.aspx
Mykyta, Laryssa and Suzanne Macartney. “The Effects of Recession on Household Composition:
‘Doubling Up’ and Economic Well-Being,” U.S. Census Bureau, SEHSD Working Paper No. 2011-4 (2011). http://www.census.gov/hhes/www/poverty/publications/papers.html

33
Fighting Poverty in a Tough Economy, Americans Move in with Their Relatives
www.pewsocialtrends.org
Pew Social and Demographic Trends. “Twenty-to-One: Wealth Gaps Rise to Record Highs Between Whites, Blacks, Hispanics,” Pew Research Center, Washington, D.C. (July 26, 2011). http://pewsocialtrends.org/2011/07/26/wealth-gaps-rise-to-record-highs-between-whites-blacks-hispanics/
Pew Social and Demographic Trends. “The Impact of Long-term Unemployment: Lost Income, Lost Friends—and Loss of Self-respect,” Pew Research Center, Washington, D.C. (July 22, 2010). http://pewsocialtrends.org/files/2010/11/760-recession.pdf
Pew Social and Demographic Trends. “How the Great Recession Has Changed Life in America,”
Pew Research Center, Washington, D.C. (June 30, 2010). http://pewsocialtrends.org/2010/06/30/how-the-great-recession-has-changed-life-in-america/
Pew Social and Demographic Trends. “The Return of the Multi-Generational Family
Household,” Pew Research Center, Washington, D.C. (March 18, 2010). http://pewsocialtrends.org/2010/03/18/the-return-of-the-multi-generational-family-household/
Pew Social and Demographic Trends. “Inside the Middle Class: Bad Times Hit the Good Life,”
Pew Research Center, Washington, D.C. (April 9, 2008). http://pewsocialtrends.org/2008/04/09/inside-the-middle-class-bad-times-hit-the-good-life/
Ruggles, Steven J., Trent Alexander, Katie Genadek, Ronald Goeken, Matthew B. Schroeder, and
Matthew Sobek. Integrated Public Use Microdata Series: Version 5.0 [Machine-readable database]. Minneapolis: University of Minnesota, 2010. http://usa.ipums.org/usa
Short, Kathleen, Thesia Garner, David Johnson, and Patricia Doyle. “Experimental Poverty
Measures: 1990 to 1997,” U.S. Census Bureau, Current Population Reports, Consumer Income, P60-205, Washington, D.C.: U.S. Government Printing Office (1999).
Speare Jr., Alden and Roger Avery. “Who Helps Whom in Older Parent-Child Families,” Journal
of Gerontology 48, Issue 2 (1993): S64-S73. http://geronj.oxfordjournals.org/content/48/2/S64.full.pdf
34
PEW SOCIAL AND DEMOGRAPHIC TRENDS
www.pewsocialtrends.org
U.S. Department of Health and Human Services. “Profile of Older Americans: 2010,” Administration on Aging (February 25, 2011). http://www.aoa.gov/AoARoot/Aging_Statistics/Profile/index.aspx
Wiemers, Emily E. “The Effect of Unemployment on Household Composition and Doubling Up,”
National Poverty Center Working Paper No. 11-12 (April 2011). http://www.npc.umich.edu/publications/working_papers/?publication_id=208&
35
Fighting Poverty in a Tough Economy, Americans Move in with Their Relatives
www.pewsocialtrends.org
APPENDIX A: NOTES ON TERMINOLOGY AND METHODOLOGY Generations. The number of generations in a household is determined by the variable defining the relationship of each person in the household to the head. Each household has a “base” generation determined by the reference person or head of the household. Others in the base generation include the reference person’s spouse, siblings and siblings-in-law. Generations beyond this base are defined by individual relationships:
1. Base generation: reference person, spouse, sibling, sibling-in-law 2. Children (“-1” generation): child of head, child-in-law 3. Parents (“+1” generation): parent of head, parent-in-law 4. Grandchildren (“-2” generation): grandchild of head 5. Others: great-grandchild of head, grandparent of head
The datasets used for the analysis are from Decennial Censuses of 1900-2000 and the American Community Surveys of 2006-200925
http://usa.ipums.org/usa/doc.shtml
as provided by the Integrated Public-Use Microdata Series (IPUMS).The IPUMS are compiled by the University of Minnesota Population Center. Documentation is available at . The IPUMS datasets permit determining generational composition for other types of relationships (e.g., aunt, uncle, niece, nephew) and for persons not related to the household head because the dataset identifies parental linkages where possible. So two generations are also present in a household if a person is determined to have a parent based on the IPUMS variables “MOMLOC” and “POPLOC.” If the parent also has a parent, a third generation is present. Multi-generational Households. For our analyses, save for one exception, multi-generational households are defined as households with at least two generations of adults. The principal type of multi-generational household actually has two generations only—parent(s) and the adult child(ren):
a. Householder (and spouse), parent (or parent-in-law) b. Householder (and spouse), adult child (or child-in-law)
In our analyses, we define adult children as those ages 25 and older rather than ages 18 and older. With this definition, the vast majority of college students living at home are not treated as an adult generation.
25 The 2005 ACS was not analyzed because the survey did not include the entire resident population of the U.S., but only the household population. While this restriction does not limit the estimation of multi-generation households, it does not permit comparisons with the entire population.
36
PEW SOCIAL AND DEMOGRAPHIC TRENDS
www.pewsocialtrends.org
The next largest type of multi-generational household is the three-generation household. There are a number of variants on this type, but the major ones differ as to whether the householder is in the middle generation (i.e., a “sandwich” household) or the older generation (i.e., a “grandparent” household):
a. Householder (and spouse), parent (or parent-in-law), child (or child-in-law) b. Householder (and spouse), child (or child-in-law), grandchild
Note that in these households, the children do not have to be adults. The only type of multi-generational household we define that does not necessarily include two adult generations is what might be called the “skipped” generation household. In these households, a grandchild is present but the grandchild’s parental generation is not present in the household (i.e., it is “skipped”). These multi-generational family households can be of two types:
a. Householder (and spouse), grandchild b. Householder (and spouse), grandparent
Most households are not multi-generational households; they are single-generation households (the householder and possibly a spouse) or two-generation, adult-minor child households. In the early years of the 20th century, there were twice as many of these two-generation households as one-generation households. This pattern began to change in 1930 as one-generation households increased in prevalence. By 1970, there were roughly equal numbers of the two households. In 2008, there were 70% more one-generation than two-generation households. The definition of a multi-generational household used in this report is more expansive than the definition used by the Census Bureau. The Census Bureau defines multi-generational households as follows: A multi-generational household is one that contains three or more parent-child generations; for example, the householder, child of householder (biological, stepchild or adopted child), and grandchildren of householder. A householder with a parent or parent-in-law of the householder and a child of the householder may also be a multi-generational household (see page B-6 in: http://www.census.gov/prod/cen2010/doc/sf1.pdf). According to the Census Bureau, 3.8% of U.S. households in 2010 were multi-generational (http://www.census.gov/newsroom/releases/pdf/acs_2010_highlights.pdf). The definition used in this report finds that 10.5% of all households in 2009 were multi-generational.

37
Fighting Poverty in a Tough Economy, Americans Move in with Their Relatives
www.pewsocialtrends.org
APPENDIX B: ADJUSTING HOUSEHOLD INCOME FOR HOUSEHOLD SIZE Household income data reported in this study are adjusted for the number of people in a household. That is done because a four-person household with an income of, say, $50,000 faces a tighter budget constraint than a two-person household with the same income. At its simplest, adjusting for household size could mean converting household income into per capita income. Thus, a two-person household with an income of $50,000 would have a per capita income of $25,000, double the per capita income of a four-person household with the same total income. A more sophisticated framework for household size adjustment recognizes that there are economies of scale in consumer expenditures. For example, a two-bedroom apartment may not cost twice as much to rent as a one-bedroom apartment. Two household members could carpool to work for the same cost as a single household member, and so on. For that reason, most researchers make adjustments for household size using the method of “equivalence scales” (Garner, Ruiz-Castillo and Sastre, 2003, and Short, Garner, Johnson and Doyle, 1999). A common equivalence-scale adjustment is defined as follows:
Adjusted household income = Household income / (Household size)N
By this method, household income is divided by household size exponentiated by “N,” where N is a number between 0 and 1. Note that if N = 0, the denominator equals 1. In that case, no adjustment is made for household size. If N = 1, the denominator equals household size, and that is the same as converting household income into per capita income. The usual approach is to let N be some number between 0 and 1. Following other researchers, this study uses N = 0.5 (for example, see Johnson, Smeeding and Torrey, 2005). In practical terms, this means that household income is divided by the square root of household size—1.41 for a two-person household, 1.73 for a three-person household, 2.00 for a four-person household, and so on. Once household incomes have been converted to a “uniform” household size, they can be scaled to reflect any household size. The income data reported in this study are computed for three-person households. That is done as follows:
Three-person household income = Adjusted household income * [(3)0.5]

38
PEW SOCIAL AND DEMOGRAPHIC TRENDS
www.pewsocialtrends.org
APPENDIX C: DETAILED TABLES
Number and Share of U.S. Population Living in Multi-generational Households, by Demographic Categories, 2007-2009 2007 2008 2009
Number (in thousands)
Share (%) Number
(in thousands) Share (%) Number
(in thousands) Share (%)
Gender Men 21,619 14.5 22,923 15.3 24,126 15.9 Women 24,857 16.2 26,122 16.9 27,247 17.5
Age group Younger than 18 8,705 11.8 9,204 12.5 9,652 13.0 18-24 4,258 14.3 4,544 15.1 4,760 15.6 25-34 7,442 18.7 7,996 19.8 8,693 21.1 35-44 5,074 11.6 5,345 12.5 5,397 12.9 45-54 7,166 16.3 7,471 16.8 7,768 17.4 55-64 6,558 20.0 6,895 20.5 7,281 20.9 65-74 3,702 19.1 3,881 19.2 4,057 19.5 75-84 2,504 18.8 2,567 19.4 2,585 19.6 85 and older 1,066 20.8 1,142 21.2 1,181 21.5
Race and ethnicity White 23,991 12.1 25,200 12.7 26,023 13.1 Hispanic 9,600 21.2 10,320 22.0 11,292 23.4 Black 8,113 22.2 8,491 23.1 8,820 23.7 Asian 3,377 25.0 3,458 25.4 3,622 25.8 Two or more races 789 16.5 932 18.0 981 17.9
Householder nativity Native born 35,284 14.5 37,141 15.1 38,580 15.6 Foreign born 11,192 22.3 11,904 23.5 12,793 24.6
Note: Hispanics are of any race. Asians include native Hawaiians and other Pacific Islanders. Race groups are single-race only groups and refer to their non-Hispanic components, e.g., white refers to non-Hispanic whites only.
Source: Pew Research Center analysis of 2007, 2008, 2009 American Community Surveys (IPUMS)
PEW RESEARCH CENTER

39
Fighting Poverty in a Tough Economy, Americans Move in with Their Relatives
www.pewsocialtrends.org
2.4
2.2
1.6
1.4
1.4
1.3
1.3
1.3
1.3
1.2
1.1
1.0
0.9
0.8
0.8
0.6
0.4
25-34
Hispanic
Black
Men
Two or more races
All
18-24
35-44
Women
Younger than 18
45-54
White
55-64
75-84
Asian
85 and older
65-74
Change in Share of U.S. Population in Multi-generational Households, by Demographic Categories, 2007-2009 percentage point change
Note: Hispanics are of any race. Asians include native Hawaiians and other Pacific Islanders. Race groups are single-race only groups and refer to their non-Hispanic components, e.g., white refers to non-Hispanic whites only.
Source: Pew Research Center analysis of 2007 and 2009 American Community Surveys (IPUMS)
PEW RESEARCH CENTER

40
PEW SOCIAL AND DEMOGRAPHIC TRENDS
www.pewsocialtrends.org
12.8
10.9
10.4
10.0
9.6
9.0
8.6
8.4
8.1
7.7
7.1
6.8
4.5
4.5
3.3
3.0
1.9
25-34
35-44
Hispanic
Younger than 18
Men
18-24
All
Two or more races
White
Women
Black
45-54
75-84
55-64
Asian
85 and older
65-74
Percentage Change in Share of U.S. Population in Multi-generational Households, by Demographic Categories, 2007-2009 %
Note: Hispanics are of any race. Asians include native Hawaiians and other Pacific Islanders. Race groups are single-race only groups and refer to their non-Hispanic components, e.g., white refers to non-Hispanic whites only.
Source: Pew Research Center analysis of 2007 and 2009 American Community Surveys (IPUMS)
PEW RESEARCH CENTER

41
Fighting Poverty in a Tough Economy, Americans Move in with Their Relatives
www.pewsocialtrends.org
Poverty Rates, by Employment Status and Type of Household, 2007-2009 % All households Multi-generational
households Other households
2007 2008 2009 2007 2008 2009 2007 2008 2009 All 12.9 13.1 14.2 10.5 10.6 11.5 13.1 13.4 14.6
Employed 5.9 6.1 6.5 4.0 4.1 4.4 6.2 6.5 6.9 Unemployed 27.3 27.7 27.0 17.9 17.8 17.5 30.3 31.2 30.3 Not in labor force 18.9 19.6 20.0 14.2 14.5 15.3 20.1 20.9 21.3
Notes: Poverty rates for people living in group quarters or in unidentified household types are not shown separately. Due to the way in which the IPUMS assigns poverty status, these estimates will differ from those that might be provided by the U.S. Census Bureau. The universe for the overall poverty rate includes people whose employment status is not known.
Source: Pew Research Center analysis of 2007, 2008 and 2009 American Community Surveys (IPUMS)
PEW RESEARCH CENTER
Poverty Rates, by Race, Ethnicity, Nativity and Type of Household, 2007-2009 % All households Multi-generational
households Other households
2007 2008 2009 2007 2008 2009 2007 2008 2009 All 12.9 13.1 14.2 10.5 10.6 11.5 13.1 13.4 14.6
White 8.9 9.2 9.9 6.4 6.8 7.2 9.1 9.4 10.2 Hispanic 20.7 21.1 23.3 14.3 14.2 16.0 22.3 23.0 25.5 Black 24.5 23.8 25.5 19.1 18.5 19.2 25.8 25.1 27.3 Asian 10.6 10.5 11.3 6.2 5.8 7.1 12.1 12.1 12.7 Native born 12.5 12.7 13.7 10.8 10.8 11.6 12.6 12.8 14.0 Foreign born 15.4 15.8 17.4 9.4 9.5 11.0 17.1 17.6 19.4
Notes: Poverty rates for people living in group quarters or in unidentified household types are not shown separately. Due to the way in which the IPUMS assigns poverty status, these estimates will differ from those that might be provided by the U.S. Census Bureau. Hispanics are of any race. Asians include native Hawaiians and other Pacific Islanders. Race groups are single-race only groups and refer to their non-Hispanic components, e.g., white refers to non-Hispanic whites only. Some native-born persons could be living in households with foreign-born heads and vice versa.
Source: Pew Research Center analysis of 2007, 2008 and 2009 American Community Surveys (IPUMS)
PEW RESEARCH CENTER
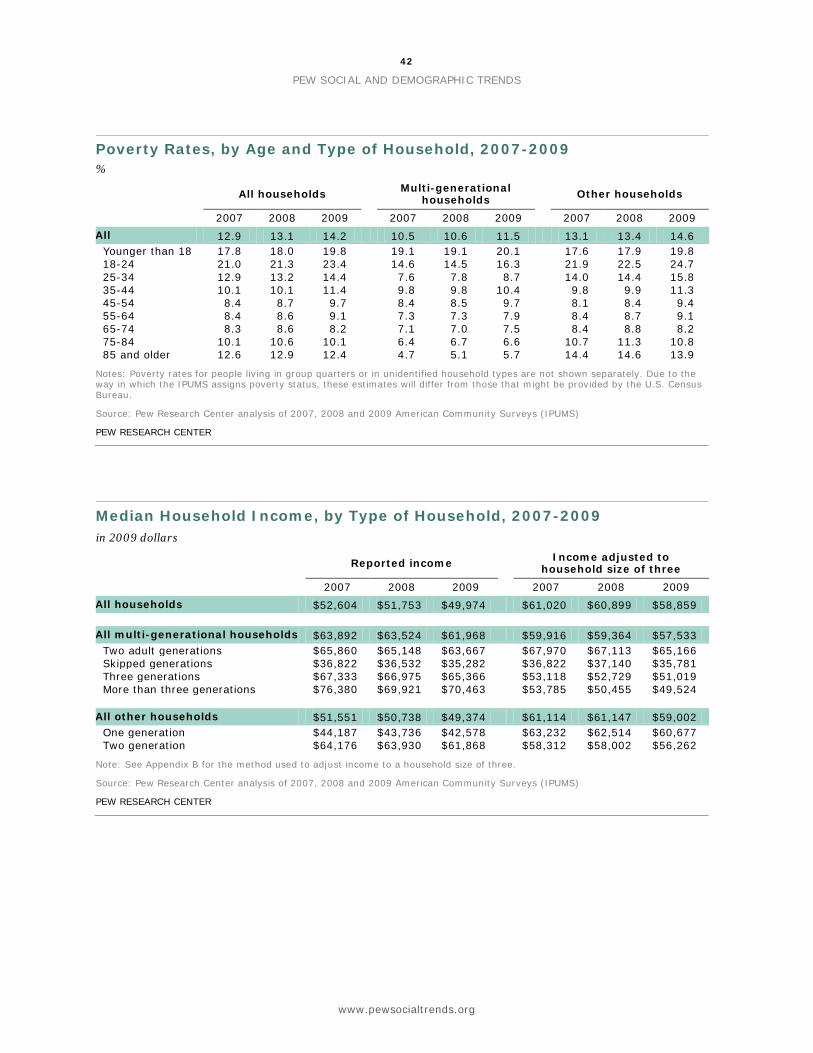
42
PEW SOCIAL AND DEMOGRAPHIC TRENDS
www.pewsocialtrends.org
Poverty Rates, by Age and Type of Household, 2007-2009 % All households Multi-generational
households Other households
2007 2008 2009 2007 2008 2009 2007 2008 2009 All 12.9 13.1 14.2 10.5 10.6 11.5 13.1 13.4 14.6
Younger than 18 17.8 18.0 19.8 19.1 19.1 20.1 17.6 17.9 19.8 18-24 21.0 21.3 23.4 14.6 14.5 16.3 21.9 22.5 24.7 25-34 12.9 13.2 14.4 7.6 7.8 8.7 14.0 14.4 15.8 35-44 10.1 10.1 11.4 9.8 9.8 10.4 9.8 9.9 11.3 45-54 8.4 8.7 9.7 8.4 8.5 9.7 8.1 8.4 9.4 55-64 8.4 8.6 9.1 7.3 7.3 7.9 8.4 8.7 9.1 65-74 8.3 8.6 8.2 7.1 7.0 7.5 8.4 8.8 8.2 75-84 10.1 10.6 10.1 6.4 6.7 6.6 10.7 11.3 10.8 85 and older 12.6 12.9 12.4 4.7 5.1 5.7 14.4 14.6 13.9
Notes: Poverty rates for people living in group quarters or in unidentified household types are not shown separately. Due to the way in which the IPUMS assigns poverty status, these estimates will differ from those that might be provided by the U.S. Census Bureau.
Source: Pew Research Center analysis of 2007, 2008 and 2009 American Community Surveys (IPUMS)
PEW RESEARCH CENTER
Median Household Income, by Type of Household, 2007-2009 in 2009 dollars Reported income Income adjusted to
household size of three 2007 2008 2009 2007 2008 2009
All households $52,604 $51,753 $49,974 $61,020 $60,899 $58,859
All multi-generational households $63,892 $63,524 $61,968 $59,916 $59,364 $57,533 Two adult generations $65,860 $65,148 $63,667 $67,970 $67,113 $65,166 Skipped generations $36,822 $36,532 $35,282 $36,822 $37,140 $35,781 Three generations $67,333 $66,975 $65,366 $53,118 $52,729 $51,019 More than three generations $76,380 $69,921 $70,463 $53,785 $50,455 $49,524
All other households $51,551 $50,738 $49,374 $61,114 $61,147 $59,002 One generation $44,187 $43,736 $42,578 $63,232 $62,514 $60,677 Two generation $64,176 $63,930 $61,868 $58,312 $58,002 $56,262
Note: See Appendix B for the method used to adjust income to a household size of three.
Source: Pew Research Center analysis of 2007, 2008 and 2009 American Community Surveys (IPUMS)
PEW RESEARCH CENTER

43
Fighting Poverty in a Tough Economy, Americans Move in with Their Relatives
www.pewsocialtrends.org
Median Household Income, by Race, Ethnicity, Nativity and Type of Household, 2007-2009 in 2009 dollars Reported income Income adjusted to household
size of three 2007 2008 2009 2007 2008 2009
White $56,917 $56,624 $54,971 $67,423 $67,138 $65,264 Multi-generational households $69,857 $69,004 $67,565 $67,547 $66,526 $64,914 Other households $55,760 $55,812 $53,672 $67,423 $67,237 $65,366
Hispanic $42,083 $40,997 $39,979 $42,083 $42,007 $39,979 Multi-generational households $56,286 $56,827 $54,971 $48,185 $47,795 $46,049 Other households $39,979 $38,967 $37,481 $41,031 $40,591 $38,710
Black $35,118 $35,517 $33,483 $41,912 $42,183 $39,979 Multi-generational households $47,343 $46,781 $45,976 $44,529 $44,018 $43,677 Other households $33,140 $33,284 $31,184 $41,547 $41,990 $39,484
Asian $68,437 $69,643 $68,824 $73,344 $73,203 $72,708 Multi-generational households $89,426 $91,329 $86,855 $76,848 $77,055 $73,446 Other households $64,702 $64,945 $64,866 $72,890 $72,063 $72,222
Native born $52,604 $52,565 $50,674 $63,049 $62,220 $60,590 Multi-generational households $63,124 $62,205 $60,968 $60,638 $59,770 $58,253 Other households $52,604 $51,144 $49,974 $63,137 $62,639 $60,763
Foreign born $48,437 $48,201 $46,776 $49,737 $49,713 $47,740 Multi-generational households $66,806 $67,989 $65,616 $56,812 $57,380 $55,045 Other households $45,344 $44,751 $42,978 $48,107 $47,807 $45,782
Notes: See Appendix B for the method used to adjust income to a household size of three. Hispanics are of any race. Asians include native Hawaiians and other Pacific Islanders. Race groups are single-race only groups and refer to their non-Hispanic components, e.g., white refers to non-Hispanic whites only.
Source: Pew Research Center analysis of 2007, 2008 and 2009 American Community Surveys (IPUMS)
PEW RESEARCH CENTER
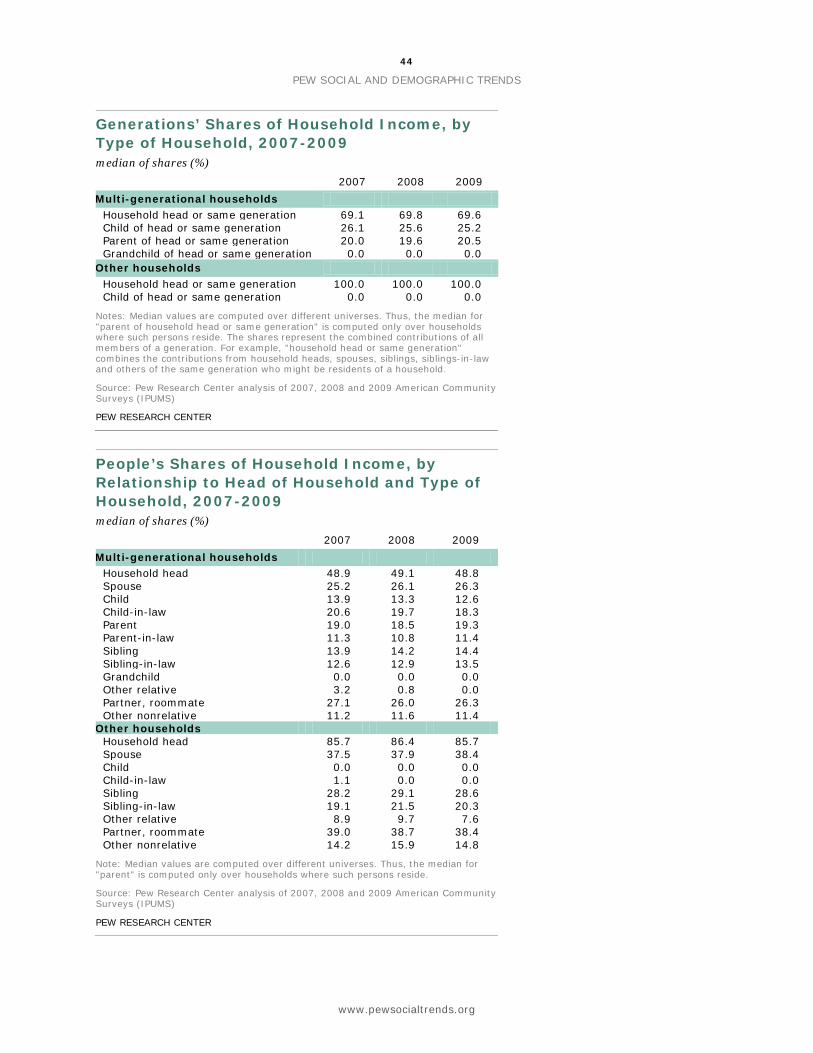
44
PEW SOCIAL AND DEMOGRAPHIC TRENDS
www.pewsocialtrends.org
Generations’ Shares of Household Income, by Type of Household, 2007-2009 median of shares (%) 2007 2008 2009
Multi-generational households Household head or same generation 69.1 69.8 69.6 Child of head or same generation 26.1 25.6 25.2 Parent of head or same generation 20.0 19.6 20.5 Grandchild of head or same generation 0.0 0.0 0.0
Other households Household head or same generation 100.0 100.0 100.0 Child of head or same generation 0.0 0.0 0.0
Notes: Median values are computed over different universes. Thus, the median for "parent of household head or same generation" is computed only over households where such persons reside. The shares represent the combined contributions of all members of a generation. For example, "household head or same generation" combines the contributions from household heads, spouses, siblings, siblings-in-law and others of the same generation who might be residents of a household.
Source: Pew Research Center analysis of 2007, 2008 and 2009 American Community Surveys (IPUMS)
PEW RESEARCH CENTER
People’s Shares of Household Income, by Relationship to Head of Household and Type of Household, 2007-2009 median of shares (%) 2007 2008 2009
Multi-generational households Household head 48.9 49.1 48.8 Spouse 25.2 26.1 26.3 Child 13.9 13.3 12.6 Child-in-law 20.6 19.7 18.3 Parent 19.0 18.5 19.3 Parent-in-law 11.3 10.8 11.4 Sibling 13.9 14.2 14.4 Sibling-in-law 12.6 12.9 13.5 Grandchild 0.0 0.0 0.0 Other relative 3.2 0.8 0.0 Partner, roommate 27.1 26.0 26.3 Other nonrelative 11.2 11.6 11.4
Other households Household head 85.7 86.4 85.7 Spouse 37.5 37.9 38.4 Child 0.0 0.0 0.0 Child-in-law 1.1 0.0 0.0 Sibling 28.2 29.1 28.6 Sibling-in-law 19.1 21.5 20.3 Other relative 8.9 9.7 7.6 Partner, roommate 39.0 38.7 38.4 Other nonrelative 14.2 15.9 14.8
Note: Median values are computed over different universes. Thus, the median for "parent" is computed only over households where such persons reside.
Source: Pew Research Center analysis of 2007, 2008 and 2009 American Community Surveys (IPUMS)
PEW RESEARCH CENTER

45
Fighting Poverty in a Tough Economy, Americans Move in with Their Relatives
www.pewsocialtrends.org
People’s Shares of Household Income in Selected Two-adult Multi-generational Households, by Relationship to Head of Household, 2007-2009 median of shares (%) 2007 2008 2009
Households with adult child of head (no parent or grandchild)
Household head 47.1 47.4 47.8 Spouse 22.2 23.4 24.0 Child (25 or older) 26.5 25.6 24.7 Child-in-law 21.7 20.7 18.3 Sibling 18.2 17.6 20.5 Sibling-in-law 16.1 14.7 13.2 Other relative 8.3 5.1 4.4 Partner, roommate 25.8 25.2 24.5 Other nonrelative 12.9 13.1 13.2
Households with parent of head (no child or grandchild)
Household head 51.7 52.3 51.0 Spouse 30.3 31.6 30.9 Parent 24.3 23.4 24.8 Parent-in-law 15.3 14.9 15.4 Sibling 13.0 13.0 13.5 Sibling-in-law 14.0 15.2 12.8 Other relative 5.0 2.4 3.9 Partner, roommate 27.3 26.0 28.0 Other nonrelative 14.9 18.4 17.1
Households with grandchild of head (no child or parent)
Household head 47.9 48.6 49.3 Spouse 20.1 24.8 24.9 Sibling 13.0 21.9 35.3 Sibling-in-law 26.9 21.2 9.7 Grandchild (25 or older) 37.6 36.2 31.6 Other relative 5.0 17.3 7.0 Partner, roommate 19.2 17.7 31.2 Other nonrelative 30.6 25.0 18.1
Notes: Households with children 25 or older can have younger children present (e.g. a younger sibling of a child older than 25). Contributions of the children younger than 25 are not shown in the table. Median values are computed over different universes. Thus, the median for "spouse" is computed only over households where a spouse is present.
Source: Pew Research Center analysis of 2007, 2008 and 2009 American Community Surveys (IPUMS)
PEW RESEARCH CENTER

46
PEW SOCIAL AND DEMOGRAPHIC TRENDS
www.pewsocialtrends.org
Shares of Household Income for Household Heads and Adult Children, by Employment Status and Type of Household, 2007-2009 median of shares (%) 2007 2008 2009
Multi-generational households Household heads
Employed 54.2 54.6 54.1 Unemployed 38.2 33.7 35.3 Not in labor force 39.4 39.1 39.8
Children 25 and older Employed 32.1 31.1 31.4 Unemployed 9.8 8.7 9.1 Not in labor force 9.3 7.7 8.2
Other households Employed 82.8 83.3 83.2 Unemployed 87.1 84.1 80.8 Not in labor force 96.2 100.0 96.8
Notes: Median values are computed over different universes. Thus, the median for "children 25 and older" is computed only over households where adult children are present. The level of unemployment in 2007 is believed to be overstated in the ACS. Details on this issue are available in a Census Bureau research note titled “Changes to the American Community Survey between 2007 and 2008 and the Effect on the Estimates of Employment and Unemployment” (http://www.census.gov/hhes/www/laborfor/researchnote-report.pdf).
Source: Pew Research Center analysis of 2007, 2008 and 2009 American Community Surveys (IPUMS)
PEW RESEARCH CENTER
Shares of Household Income for Household Heads, by Race, Ethnicity, Nativity and Type of Household, 2007-2009 median of shares (%) Multi-generational
households Other households
2007 2008 2009 2007 2008 2009 All 48.9 49.1 48.8 85.7 86.4 85.7
White 50.0 50.1 50.0 84.3 84.7 84.1 Hispanic 44.1 42.9 42.3 75.6 77.1 75.6 Black 51.6 51.9 52.0 100.0 100.0 100.0 Asian 45.0 44.7 43.9 80.0 80.2 79.2 Native born 50.0 50.3 50.1 86.6 87.2 86.6 Foreign born 44.0 43.2 42.7 78.9 80.0 79.2
Notes: Hispanics are of any race. Asians include native Hawaiians and other Pacific Islanders. Race groups are single-race only groups and refer to their non-Hispanic components, e.g., white refers to non-Hispanic whites only.
Source: Pew Research Center analysis of 2007, 2008 and 2009 American Community Surveys (IPUMS)
PEW RESEARCH CENTER

47
Fighting Poverty in a Tough Economy, Americans Move in with Their Relatives
www.pewsocialtrends.org
Proportion of the Population Living in Multi-generational Households, by State, 2007-2009 % 2007 2008 2009
U.S. 15.4 16.1 16.7 Alabama 15.8 16.4 17.4 Alaska 13.2 13.5 15.3 Arizona 16.1 16.8 18.5 Arkansas 14.0 15.6 15.4 California 20.0 21.2 22.0 Colorado 11.2 12.3 12.3 Connecticut 15.1 14.7 16.6 Delaware 15.5 16.4 17.0 District of Columbia 17.9 17.5 19.2 Florida 16.3 17.2 18.4 Georgia 16.3 17.4 17.5 Hawaii 27.4 29.2 29.1 Idaho 8.7 9.9 11.2 Illinois 15.9 16.3 16.8 Indiana 11.8 12.6 13.5 Iowa 7.7 8.4 8.1 Kansas 9.7 9.6 10.9 Kentucky 13.7 15.0 15.3 Louisiana 18.3 19.3 18.1 Maine 8.8 11.5 10.5 Maryland 16.9 17.1 18.7 Massachusetts 14.4 14.9 15.8 Michigan 13.8 14.6 14.8 Minnesota 8.2 9.1 8.6 Mississippi 18.1 17.9 19.5 Missouri 12.7 12.7 13.2 Montana 10.2 11.2 12.5 Nebraska 7.4 8.7 9.1 Nevada 15.0 16.2 17.9 New Hampshire 11.6 12.3 12.0 New Jersey 18.2 18.6 19.3 New Mexico 16.7 17.2 18.5 New York 18.6 19.5 19.9 North Carolina 13.5 14.0 13.7 North Dakota 6.2 5.7 6.9 Ohio 13.0 13.6 14.2 Oklahoma 13.6 13.9 13.7 Oregon 12.0 12.3 12.6 Pennsylvania 14.4 14.9 15.1 Rhode Island 15.2 16.5 17.2 South Carolina 15.1 16.7 16.9 South Dakota 8.0 7.7 10.6 Tennessee 15.1 16.3 16.8 Texas 17.5 17.9 18.9 Utah 13.6 14.2 15.0 Vermont 8.4 9.6 9.8 Virginia 14.2 14.9 14.5 Washington 11.4 11.9 13.0 West Virginia 15.5 14.9 15.6 Wisconsin 8.8 9.6 10.1 Wyoming 12.2 11.8 11.1
Source: Pew Research Center analysis of 2007, 2008 and 2009 American Community Surveys (IPUMS)
PEW RESEARCH CENTER