d’vera cohn, jeffrey s. passel and ana gonzalez...
TRANSCRIPT
FOR RELEASE December 7, 2017
BY D’Vera Cohn, Jeffrey S. Passel and Ana Gonzalez-Barrera
FOR MEDIA OR OTHER INQUIRIES:
D’Vera Cohn, Senior Writer/Editor
Mark Hugo Lopez, Director of Global Migration and Demography
Jeffrey S. Passel, Senior Demographer
Jessica Pumphrey, Communications Associate
202.419.4372
www.pewresearch.org
RECOMMENDED CITATION
Pew Research Center, December 2017, “Rise in U.S. Immigrants
From El Salvador, Guatemala and Honduras Outpaces Growth
From Elsewhere”

1
PEW RESEARCH CENTER
www.pewresearch.org
About Pew Research Center
Pew Research Center is a nonpartisan fact tank that informs the public about the issues, attitudes
and trends shaping America and the world. It does not take policy positions. The Center conducts
public opinion polling, demographic research, content analysis and other data-driven social
science research. It studies U.S. politics and policy; journalism and media; internet, science and
technology; religion and public life; Hispanic trends; global attitudes and trends; and U.S. social
and demographic trends. All of the Center’s reports are available at www.pewresearch.org. Pew
Research Center is a subsidiary of The Pew Charitable Trusts, its primary funder.
© Pew Research Center 2017

2
PEW RESEARCH CENTER
www.pewresearch.org
Terminology
Central America includes Belize, Costa Rica, El Salvador, Guatemala, Honduras, Nicaragua and
Panama. The Northern Triangle includes El Salvador, Guatemala and Honduras.
Origin refers to the heritage, nationality, lineage or country of birth of the person or the person’s
parents or ancestors before arriving in the United States. U.S.-born residents reporting origins in
El Salvador, Guatemala, Honduras, Central America or Mexico are considered to be of Hispanic
origin; almost all immigrants born in those countries say they are of Hispanic origin.
Foreign born refers to an individual who is not a U.S. citizen at birth — who, in other words, is
born outside the U.S., Puerto Rico or other U.S. territories and whose parents are not U.S. citizens.
The terms “foreign born” and “immigrant” are used interchangeably. Immigrants are identified by
birth country, not origin, so “Salvadoran immigrants” refer only to those born in El Salvador.
U.S. born refers to an individual who is a U.S. citizen at birth, including people born in the
United States, Puerto Rico or other U.S. territories, as well as those born elsewhere to at least one
parent who is a U.S. citizen.
The lawful immigrant population is defined as naturalized U.S. citizens; people granted lawful
permanent residence (previously known as legal permanent residence); those granted asylum;
people admitted as refugees; and people admitted under a set of specific authorized temporary
statuses for longer-term residence and work.
Unauthorized immigrants are all foreign-born noncitizens residing in the U.S. who are not
lawful immigrants, as defined above. These definitions reflect standard and customary usage by
the U.S. Department of Homeland Security and academic researchers. The vast majority of
unauthorized immigrants entered the country without valid documents or arrived with valid visas
but stayed past their visa expiration date or otherwise violated the terms of their admission. Some
who entered as unauthorized immigrants or violated terms of admission have obtained work
authorization by applying for adjustment to lawful permanent status, obtaining Temporary
Protected Status (TPS) and/or receiving Deferred Action for Childhood Arrivals (DACA) status.
This “quasi-lawful” group could account for as much as about 10% of the U.S. unauthorized
immigrant population. Many could also revert to unauthorized status.

3
PEW RESEARCH CENTER
www.pewresearch.org
Table of Contents
About Pew Research Center 1
Terminology 2
Overview 4
1. Recent trends in Northern Triangle immigration 11
2. Geography and characteristics of Northern Triangle immigrants 17
Acknowledgments 23
Methodology 23
Appendix A: References 24
Appendix B: Additional table and charts 28

4
PEW RESEARCH CENTER
www.pewresearch.org
Rise in U.S. Immigrants From El Salvador, Guatemala and
Honduras Outpaces Growth From Elsewhere
The number of immigrants in the United States from El Salvador, Guatemala and Honduras rose
by 25% from 2007 to 2015, in contrast to more modest growth of the country’s overall foreign-
born population and a decline from neighboring Mexico.
During these same years, the total U.S. immigrant population increased by 10%, while the number
of U.S. Mexican immigrants decreased by 6%, according to a Pew Research Center analysis of U.S.
Census Bureau data.
One metric – the number of new immigrants arriving in the U.S. each year – illustrates
dramatically how immigration trends from Mexico and the three Central American nations, known
collectively as the “Northern Triangle,” have diverged in recent years. According to U.S. Census
Since recession, U.S. immigrant populations from Northern Triangle rise as number
from Mexico declines
In thousands
Note: All numbers rounded independently are not adjusted to sum to the U.S. total. See methodology for details. The Great Recession began
in December 2007 and ended in June 2009, according to the National Bureau of Economic Research.
Source: Pew Research Center estimates based on adjusted 1990 census, augmented 1995 and 2000 Current Population Survey and
augmented 2005-2015 American Community Survey (IPUMS).
“Rise in U.S. immigrants From El Salvador, Guatemala and Honduras Outpaces Growth From Elsewhere”
PEW RESEARCH CENTER
5
PEW RESEARCH CENTER
www.pewresearch.org
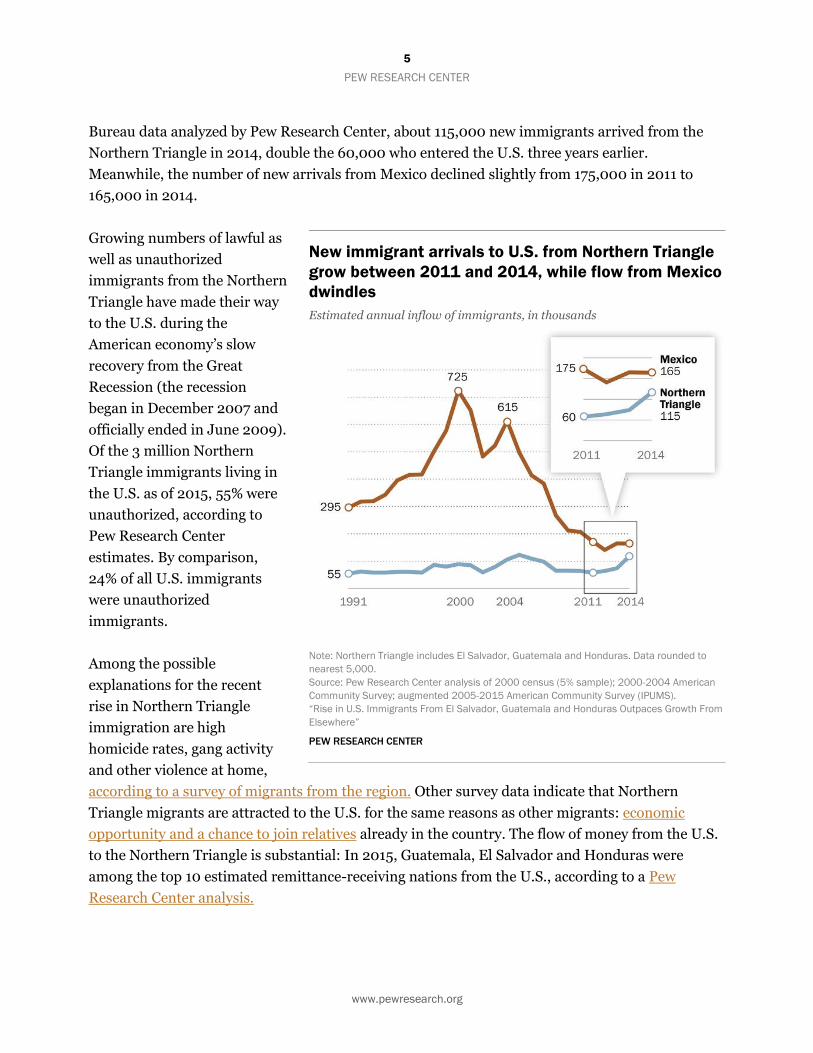
Bureau data analyzed by Pew Research Center, about 115,000 new immigrants arrived from the
Northern Triangle in 2014, double the 60,000 who entered the U.S. three years earlier.
Meanwhile, the number of new arrivals from Mexico declined slightly from 175,000 in 2011 to
165,000 in 2014.
Growing numbers of lawful as
well as unauthorized
immigrants from the Northern
Triangle have made their way
to the U.S. during the
American economy’s slow
recovery from the Great
Recession (the recession
began in December 2007 and
officially ended in June 2009).
Of the 3 million Northern
Triangle immigrants living in
the U.S. as of 2015, 55% were
unauthorized, according to
Pew Research Center
estimates. By comparison,
24% of all U.S. immigrants
were unauthorized
immigrants.
Among the possible
explanations for the recent
rise in Northern Triangle
immigration are high
homicide rates, gang activity
and other violence at home,
according to a survey of migrants from the region. Other survey data indicate that Northern
Triangle migrants are attracted to the U.S. for the same reasons as other migrants: economic
opportunity and a chance to join relatives already in the country. The flow of money from the U.S.
to the Northern Triangle is substantial: In 2015, Guatemala, El Salvador and Honduras were
among the top 10 estimated remittance-receiving nations from the U.S., according to a Pew
Research Center analysis.
New immigrant arrivals to U.S. from Northern Triangle
grow between 2011 and 2014, while flow from Mexico
dwindles
Estimated annual inflow of immigrants, in thousands
Note: Northern Triangle includes El Salvador, Guatemala and Honduras. Data rounded to
nearest 5,000.
Source: Pew Research Center analysis of 2000 census (5% sample); 2000-2004 American
Community Survey; augmented 2005-2015 American Community Survey (IPUMS).
“Rise in U.S. Immigrants From El Salvador, Guatemala and Honduras Outpaces Growth From
Elsewhere”
PEW RESEARCH CENTER
6
PEW RESEARCH CENTER
www.pewresearch.org
More than a quarter million unauthorized immigrants from the Northern Triangle (roughly a fifth
of unauthorized immigrants from the three countries) have temporary protection from
deportation under two federal programs that the White House may phase out – Deferred Action
for Childhood Arrivals (DACA) and Temporary Protected Status (TPS). The three Central
American nations are also the starting points for many of the thousands of unaccompanied
children apprehended along the U.S.-Mexico border since 2013.
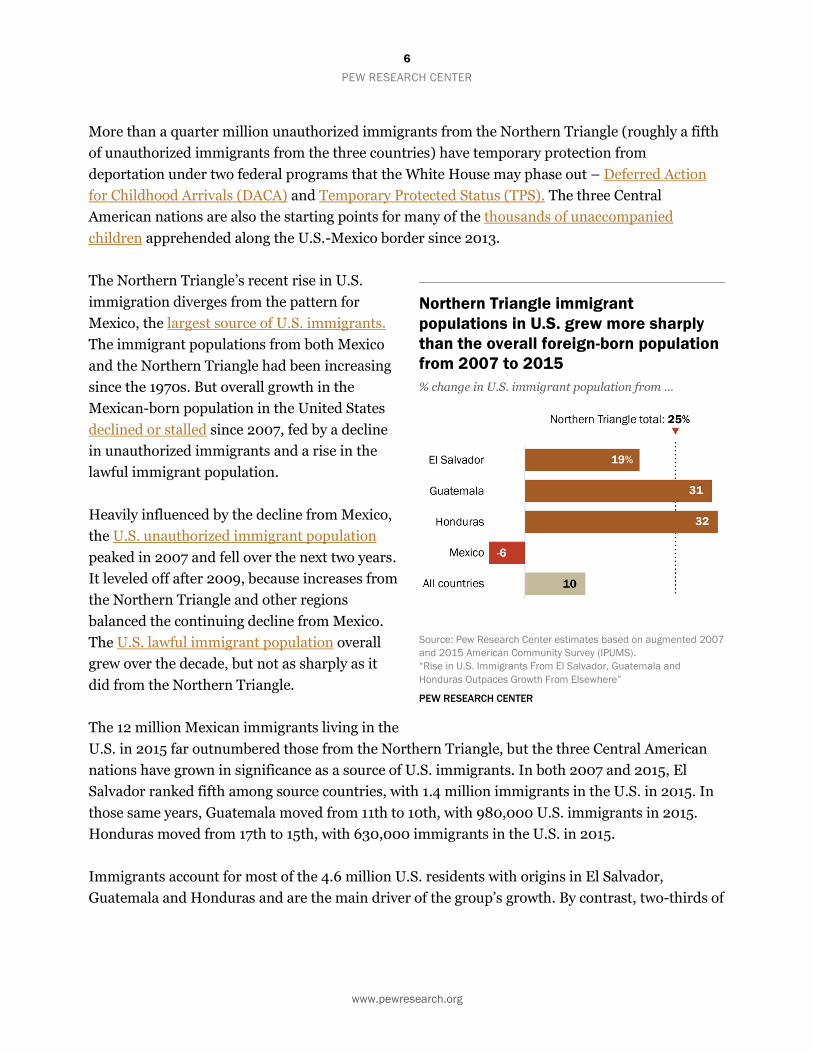
The Northern Triangle’s recent rise in U.S.
immigration diverges from the pattern for
Mexico, the largest source of U.S. immigrants.
The immigrant populations from both Mexico
and the Northern Triangle had been increasing
since the 1970s. But overall growth in the
Mexican-born population in the United States
declined or stalled since 2007, fed by a decline
in unauthorized immigrants and a rise in the
lawful immigrant population.
Heavily influenced by the decline from Mexico,
the U.S. unauthorized immigrant population
peaked in 2007 and fell over the next two years.
It leveled off after 2009, because increases from
the Northern Triangle and other regions
balanced the continuing decline from Mexico.
The U.S. lawful immigrant population overall
grew over the decade, but not as sharply as it
did from the Northern Triangle.
The 12 million Mexican immigrants living in the
U.S. in 2015 far outnumbered those from the Northern Triangle, but the three Central American
nations have grown in significance as a source of U.S. immigrants. In both 2007 and 2015, El
Salvador ranked fifth among source countries, with 1.4 million immigrants in the U.S. in 2015. In
those same years, Guatemala moved from 11th to 10th, with 980,000 U.S. immigrants in 2015.
Honduras moved from 17th to 15th, with 630,000 immigrants in the U.S. in 2015.
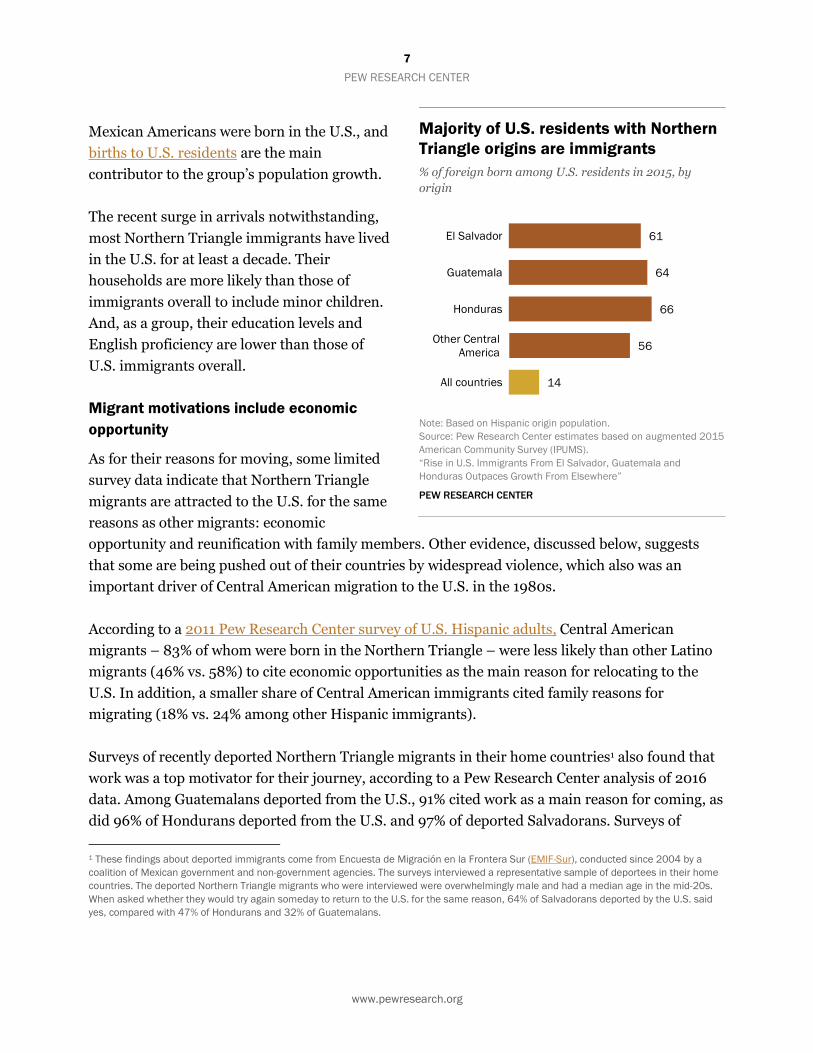
Immigrants account for most of the 4.6 million U.S. residents with origins in El Salvador,
Guatemala and Honduras and are the main driver of the group’s growth. By contrast, two-thirds of
Northern Triangle immigrant
populations in U.S. grew more sharply
than the overall foreign-born population
from 2007 to 2015
% change in U.S. immigrant population from …
Source: Pew Research Center estimates based on augmented 2007
and 2015 American Community Survey (IPUMS).
“Rise in U.S. Immigrants From El Salvador, Guatemala and
Honduras Outpaces Growth From Elsewhere”
PEW RESEARCH CENTER
7
PEW RESEARCH CENTER
www.pewresearch.org
61
64
66
56
14
El Salvador
Guatemala
Honduras
Other
Central America
All countries
Other Central
America
Mexican Americans were born in the U.S., and
births to U.S. residents are the main
contributor to the group’s population growth.
The recent surge in arrivals notwithstanding,
most Northern Triangle immigrants have lived
in the U.S. for at least a decade. Their
households are more likely than those of
immigrants overall to include minor children.
And, as a group, their education levels and
English proficiency are lower than those of
U.S. immigrants overall.
Migrant motivations include economic
opportunity
As for their reasons for moving, some limited
survey data indicate that Northern Triangle
migrants are attracted to the U.S. for the same
reasons as other migrants: economic
opportunity and reunification with family members. Other evidence, discussed below, suggests
that some are being pushed out of their countries by widespread violence, which also was an
important driver of Central American migration to the U.S. in the 1980s.
According to a 2011 Pew Research Center survey of U.S. Hispanic adults, Central American
migrants – 83% of whom were born in the Northern Triangle – were less likely than other Latino
migrants (46% vs. 58%) to cite economic opportunities as the main reason for relocating to the
U.S. In addition, a smaller share of Central American immigrants cited family reasons for
migrating (18% vs. 24% among other Hispanic immigrants).
Surveys of recently deported Northern Triangle migrants in their home countries1 also found that
work was a top motivator for their journey, according to a Pew Research Center analysis of 2016
data. Among Guatemalans deported from the U.S., 91% cited work as a main reason for coming, as
did 96% of Hondurans deported from the U.S. and 97% of deported Salvadorans. Surveys of
1 These findings about deported immigrants come from Encuesta de Migración en la Frontera Sur (EMIF-Sur), conducted since 2004 by a
coalition of Mexican government and non-government agencies. The surveys interviewed a representative sample of deportees in their home
countries. The deported Northern Triangle migrants who were interviewed were overwhelmingly male and had a median age in the mid-20s.
When asked whether they would try again someday to return to the U.S. for the same reason, 64% of Salvadorans deported by the U.S. said
yes, compared with 47% of Hondurans and 32% of Guatemalans.
Majority of U.S. residents with Northern
Triangle origins are immigrants
% of foreign born among U.S. residents in 2015, by
origin
Note: Based on Hispanic origin population.
Source: Pew Research Center estimates based on augmented 2015
American Community Survey (IPUMS).
“Rise in U.S. Immigrants From El Salvador, Guatemala and
Honduras Outpaces Growth From Elsewhere”
PEW RESEARCH CENTER
8
PEW RESEARCH CENTER
www.pewresearch.org
Northern Triangle migrants who were apprehended in Mexico while on the way to the U.S., then
deported, also found that nearly all said they were moving to find work.
Violence may also play a role in immigrants’ motivations to migrate north
However, the same 2011 Pew Research Center survey that found economic opportunity was the top
reason for Central American immigrants to come to the U.S. indicated that violence in Central
America is a factor as well. Central Americans were more likely than other Latino migrants to cite
conflict or persecution as a reason they left – 13% said that was the main reason they came to the
U.S., compared with 4% of other Hispanic migrants, according to the National Survey of Latinos.
A 2014 U.S. Department of Homeland Security document cited poverty and violence in Northern
Triangle nations as forces that motivated unaccompanied children who were being apprehended at
the border in large numbers. The document, which was obtained by Pew Research Center, cited
rural poverty in Guatemala and “extremely violent” conditions in El Salvador and Honduras. At a
conference on Northern Triangle issues this year, U.S. Vice President Mike Pence spoke of “vicious
gangs and vast criminal organizations that drive illegal immigration and carry illegal drugs
northward on their journey to the United States.”
At the time of the 2014 DHS report, Honduras had the world’s highest murder rate – 74.6
homicides per 100,000 residents that year. El Salvador ranked second, with 64.2. Guatemala was
ninth, at 31.2. In 2016, El Salvador had an even higher homicide rate than Honduras, 91.2 per
100,000 people. The Honduras rate was 59.1 and Guatemala’s was 23.7.
Northern Triangle nations also are among the poorest in Latin America. In 2014, some had
relatively high shares of people living on less than $2 a day – 17% of Hondurans, 10% of
Guatemalans and 3% of Salvadorans, according to World Bank data.
A 2013 Pew Research Center survey in El Salvador found that high shares of people living there –
90% or more – said crime, illegal drugs and gang violence were very big problems in their country.
Half (51%) said they were afraid to walk alone at night within a kil0meter of their home.
The same survey also found that most Salvadorans not only knew someone already living in the
U.S., but also wanted to move to the U.S. themselves. Nearly six-in-ten (58%) said they would
move there if they could, including 28% who would move without authorization. Two-thirds of
Salvadorans (67%) said they had friends or relatives who lived in the U.S. Most said people who
move to the U.S. have a better life (64%) than those in their country.
9
PEW RESEARCH CENTER
www.pewresearch.org
$4.6
$7.5
$3.8
El Salvador
Guatemala
Honduras
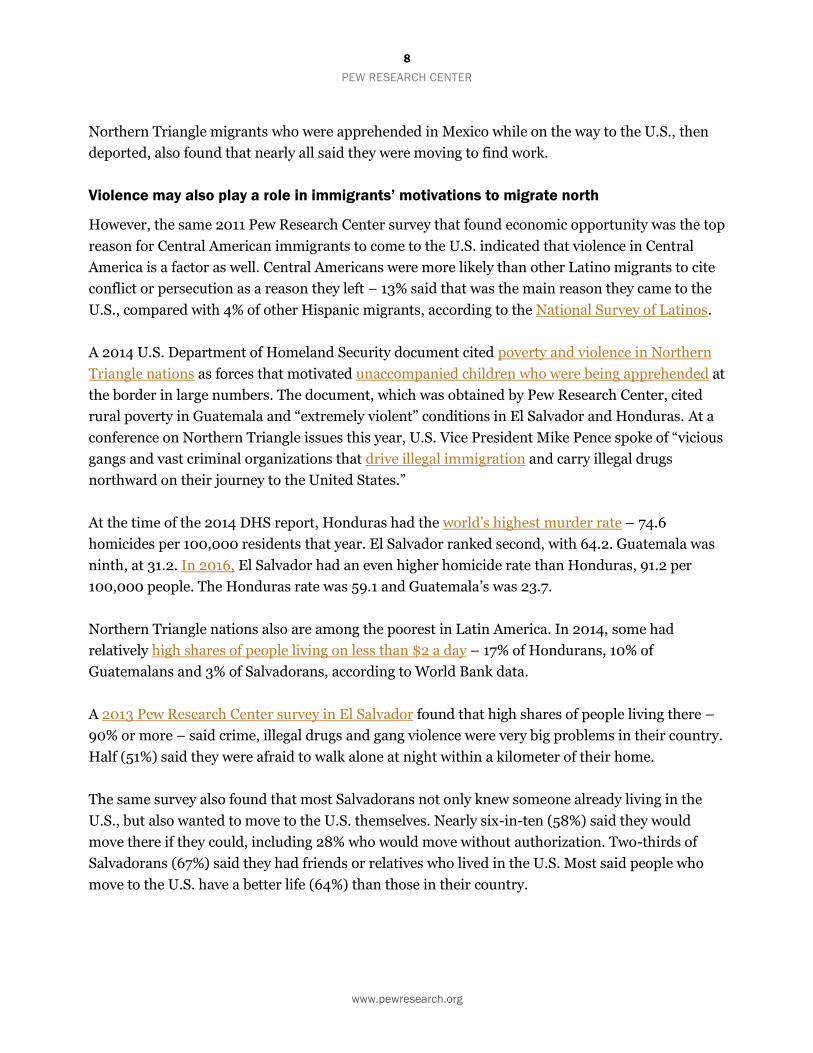
Remittances and the Northern Triangle
The Pew Research Center survey of Salvadorans in 2013 found that 84% said it is good for El
Salvador that many of its citizens live in the U.S.
One reason for that might be the money they send home: According to a Pew Research Center
analysis of World Bank data, Guatemala, El Salvador and Honduras were among the top 10
estimated remittance-receiving nations from immigrants in the U.S. in 2015.
The money that immigrants send home to Northern Triangle nations has grown substantially in
recent years, except for a one-year dip in 2009, the final year of the U.S. recession. In 2016,
according to World Bank estimates, remittances to the three nations totaled $15.9 billion, of which
most came from the U.S. Those remittances were the equivalent of about 17% of the total economic
output (as measured by gross domestic product) in El Salvador, 11% in Guatemala and 18% in
Honduras in 2016.
Guatemalan immigrants around the world
sent home $7.5 billion in remittances in 2016,
while Salvadorans sent $4.6 billion and
Hondurans $3.9 billion, according to World
Bank data. The vast majority of the money
came from immigrants in the U.S.
The rise in remittances to Northern Triangle
nations diverged from a decline in overall
remittances to developing nations in 2016. A
World Bank brief about global remittance
trends, published in October, noted that
money sent home by Northern Triangle and
Mexican migrants went up despite an increase
in deportations from the U.S. The increase in
remittances “is in part due to possible changes
in migration policies. Migrants are sending
their savings back home in case they must return.”
The World Bank brief also stated that remittances may continue to rise because the tighter U.S.
labor market could be driving employment, especially in the construction industry. Immigrants
Northern Triangle migrants sent nearly
$16 billion in remittances home in 2016
In billions of dollars
Source: World Bank Remittances Inflow, 2016.
“Rise in U.S. Immigrants From El Salvador, Guatemala and
Honduras Outpaces Growth From Elsewhere”
PEW RESEARCH CENTER
10
PEW RESEARCH CENTER
www.pewresearch.org
are overrepresented in the U.S. construction industry: They were 17% of the total workforce in
2014, but 24% of the construction workforce.
As these immigrant populations have gone up, Northern Triangle governments have expanded
their outreach to their nationals in the U.S. The Guatemalan government, for example, opened two
new consulates this year, in Raleigh, North Carolina, and in Oklahoma City. El Salvador opened a
consulate in McAllen, Texas, in 2014 and another one in Aurora, Colorado, earlier this year.
This report is based largely on Pew Research Center analysis of U.S. Census Bureau data. Figures
have been adjusted for undercount, so findings differ from official published numbers, but the
trends and patterns are similar for both.

11
PEW RESEARCH CENTER
www.pewresearch.org
51
56
60
27
24
El Salvador
Guatemala
Honduras
Other
Central America
All countries
Other Central
America
1. Recent trends in Northern Triangle immigration
Migration from Central America to the U.S. began rising notably in the 1980s, and continued to
increase in subsequent decades. More recently, the number of immigrants – lawful and
unauthorized – from the three Northern Triangle nations rose by 25% between 2007 and 2015.
During that same period, the immigrant population from Mexico, the largest birth country for U.S.
immigrants, declined 6%. The overall U.S. immigrant population rose 10% during the same
period. Altogether, the 3 million immigrants from the Northern Triangle were 7% of the U.S.
foreign-born population of 44.7 million in 2015.
This Northern Triangle growth included increases in the number of both lawful and unauthorized
immigrants. From 2007 to 2015, the lawful immigrant population from El Salvador, Guatemala
and Honduras grew 24% and the unauthorized immigrant population grew 26%. By comparison,
the national lawful immigrant population increased by 19% from 2007 to 2015, and the
unauthorized immigrant population declined by 10%.
Immigration from the Northern Triangle has helped to expand the origin populations from these
three countries. Including both immigrants and the U.S. born, the number of U.S. Hispanic
residents with origins in the three Northern Triangle countries rose even more sharply (46%) from
2007 to 2015. This total includes 1.2 million U.S.-born children with family origins in these three
countries.
Although the U.S.-born components of these
populations are growing rapidly, at least six-
in-ten U.S. residents of Salvadoran,
Guatemalan or Honduran origin were
immigrants in 2015, compared with 53% of
those with other Central American origins
(Belize, Costa Rica, Nicaragua and Panama). A
third of Mexican Americans (33%) are foreign
born. By comparison, 14% of all U.S. residents
were foreign born in 2015.
Majority of foreign born from Northern
Triangle are unauthorized immigrants
% of U.S. immigrants from ___ who are unauthorized
immigrants, 2015
Source: Pew Research Center estimates based on augmented 2015
American Community Survey (IPUMS).
“Rise in U.S. Immigrants From El Salvador, Guatemala and
Honduras Outpaces Growth From Elsewhere”
PEW RESEARCH CENTER
12
PEW RESEARCH CENTER
www.pewresearch.org
300
575
725
120
375
550
40
250
375
1990 1995 2000 2005 2010 2015
Great Recession
El Salvador
Guatemala
Honduras
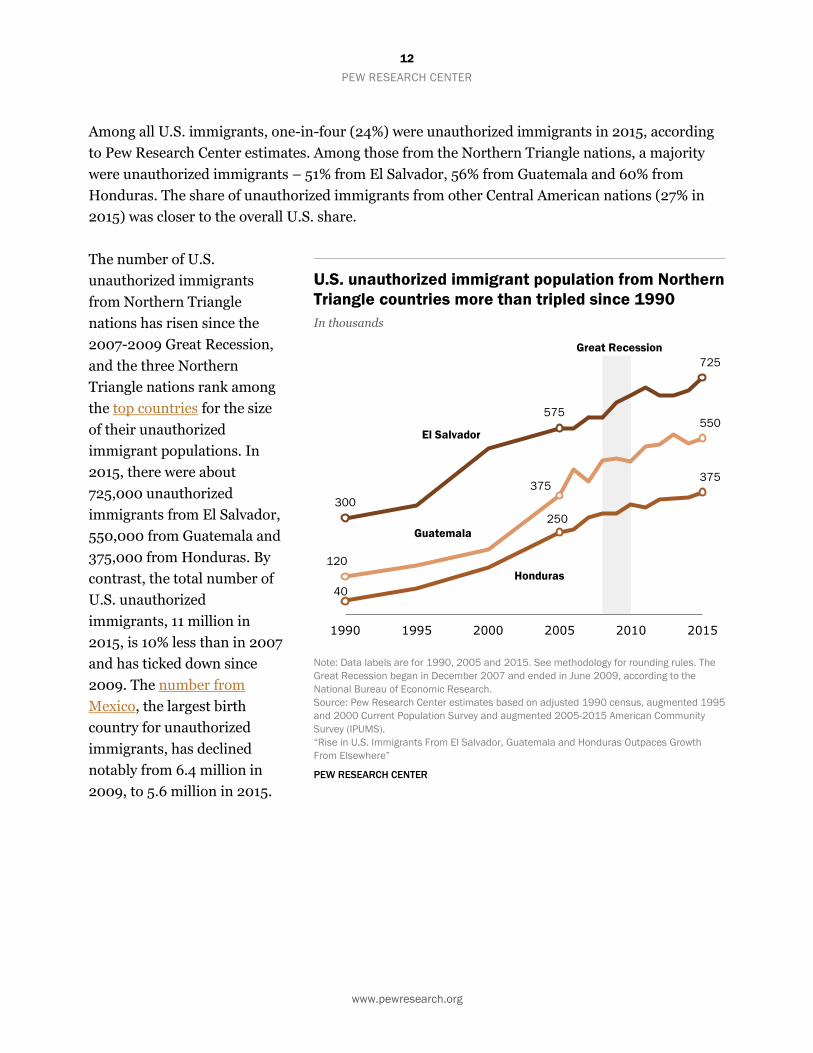
Among all U.S. immigrants, one-in-four (24%) were unauthorized immigrants in 2015, according
to Pew Research Center estimates. Among those from the Northern Triangle nations, a majority
were unauthorized immigrants – 51% from El Salvador, 56% from Guatemala and 60% from
Honduras. The share of unauthorized immigrants from other Central American nations (27% in
2015) was closer to the overall U.S. share.
The number of U.S.
unauthorized immigrants
from Northern Triangle
nations has risen since the
2007-2009 Great Recession,
and the three Northern
Triangle nations rank among
the top countries for the size
of their unauthorized
immigrant populations. In
2015, there were about
725,000 unauthorized
immigrants from El Salvador,
550,000 from Guatemala and
375,000 from Honduras. By
contrast, the total number of
U.S. unauthorized
immigrants, 11 million in
2015, is 10% less than in 2007
and has ticked down since
2009. The number from
Mexico, the largest birth
country for unauthorized
immigrants, has declined
notably from 6.4 million in
2009, to 5.6 million in 2015.
U.S. unauthorized immigrant population from Northern
Triangle countries more than tripled since 1990
In thousands
Note: Data labels are for 1990, 2005 and 2015. See methodology for rounding rules. The
Great Recession began in December 2007 and ended in June 2009, according to the
National Bureau of Economic Research.
Source: Pew Research Center estimates based on adjusted 1990 census, augmented 1995
and 2000 Current Population Survey and augmented 2005-2015 American Community
Survey (IPUMS).
“Rise in U.S. Immigrants From El Salvador, Guatemala and Honduras Outpaces Growth
From Elsewhere”
PEW RESEARCH CENTER
13
PEW RESEARCH CENTER
www.pewresearch.org
Temporary Protected Status and DACA
Several hundred thousand unauthorized immigrants from the Northern Triangle have received
temporary permission to live and work in the U.S. under two federal programs with uncertain
futures.
About 195,000 Salvadorans and 57,000 Hondurans are estimated to be protected from
deportation under Temporary Protected Status (TPS), a program that allows relief based on
natural disasters or other catastrophes in their home countries. In order to qualify, they must meet
residency and criminal-record requirements. The U.S. government’s current designation of
immigrants from El Salvador as eligible for Temporary Protected Status began in 2001, based on a
series of earthquakes in that country that inflicted widespread damage and killed more than a
thousand people. For Honduras, TPS eligibility began in 1999 based on Hurricane Mitch in 1998,
which killed more than 5,600 people and displaced more than a million.
The Temporary Protected Status permits are set to expire July 5 for people from Honduras, and
March 9 for people from El Salvador. The presidents of both countries have asked the U.S.
government to extend the temporary program. The administration is required to state 60 days in
advance whether it intends to extend or terminate the protected status, and protection
automatically extends for six months if such a notice is not published. In advance of the
government’s decision, Secretary of State Rex Tillerson reportedly submitted a required
assessment in which he said that home-country conditions no longer necessitate protected status
for immigrants from Central America.
Although some TPS recipients may be in the U.S. on valid temporary visas, Pew Research Center
assumes that nearly all immigrants with TPS are in the country without authorization.
Nearly 60,000 young unauthorized immigrants from the three countries have received work
permits and relief from deportation under the federal Deferred Action for Childhood Arrivals
program, according to the most recent Department of Homeland Security statistics, released Sept.
4. They include about 25,900 from El Salvador, 17,700 from Guatemala and 16,100 from
Honduras. (There may be some recipients of DACA status who also have Temporary Protected
Status.)
The program, created by President Barack Obama with an executive action signed in August 2012,
provides a two-year renewable work permit and protection from deportation to unauthorized
immigrants who came to the U.S. before age 16 and meet certain other conditions. President

14
PEW RESEARCH CENTER
www.pewresearch.org
229
188 193
128
239
135
201
163
2014 2015 2016 2017
Mexico Northern Triangle
Donald Trump has ordered that the program be phased out, unless Congress passes legislation to
extend it past March 5, 2018.
Apprehensions and
deportations
In addition to the rise in the
number of Northern Triangle
immigrants living in the U.S.,
government statistics also
show a recent increase in
migrants from the three
nations apprehended at the
border. In fact, according to
U.S. Customs and Border
Protection statistics,
apprehensions of Northern
Triangle immigrants
outnumbered those of
Mexicans at the U.S.
Southwest border in fiscal
2014, 2016 and 2017. The law
enforcement agency says fiscal
2014 was the first time that
apprehensions of Central
Americans outnumbered
those from Mexico. About
99% of Central American
apprehensions that year were
of immigrants from the Northern Triangle.
Mexicans continue to be the majority of those deported by U.S. border authorities, but the three
Northern Triangle nations ranked second, third and fourth for deportations in fiscal 2016. In fiscal
2016, about 34,000 Guatemalans, 22,000 Hondurans and 20,000 Salvadorans were removed.
Together they accounted for about a fifth (22%) of deportations by U.S. Department of Homeland
Security officials. About 245,000 Mexicans were deported, or 72% of removals.
Apprehensions of Northern Triangle immigrants
exceed those of Mexicans in most recent fiscal years
Apprehensions at U.S.-Mexico border, in thousands
Note: Northern Triangle includes El Salvador, Guatemala and Honduras. Data refer to
number of reported apprehensions, not the number of unique individuals apprehended.
Source: U.S. Department of Homeland Security
“Rise in U.S. Immigrants From El Salvador, Guatemala and Honduras Outpaces Growth
From Elsewhere”
PEW RESEARCH CENTER
15
PEW RESEARCH CENTER
www.pewresearch.org
People turned back at the border or held in immigrant detention centers are not included in U.S.
Census Bureau immigrant statistics. However, the census data analyzed in this report could
include migrants who are detained and then released in the U.S. while their cases are adjudicated,
though it is not possible to differentiate them from other migrants in the data.
Beginning in fiscal 2013, a rising number of unaccompanied children were apprehended at the
U.S. border with Mexico, according to U.S. Customs and Border Protection data from the
Department of Homeland Security. The number from the Northern Triangle peaked at 51,705 in
fiscal 2014. In the 2017 fiscal year, there were 31,754 apprehensions of children from El Salvador,
Guatemala and Honduras.
Migrants from El Salvador, Guatemala and Honduras also drove a surge in apprehensions of
family groups – children and their parents or guardians – in 2016 and 2017. According to Customs
and Border Protection data, there were 71,145 family apprehensions of Northern Triangle migrants
in fiscal 2017, compared with 2016’s total of 70,407.
Some Northern Triangle nations rank among
the top birth countries for new U.S. lawful
permanent residents, according to U.S.
Department of Homeland Security statistics.
In 2015, El Salvador ranked ninth among
countries for the number of green cards issued
to people born there, and has ranked in the top
14 since 2006. Guatemala ranked 22nd in
2015, and has been in the top 28 since 2006.
Honduras ranked 28th in 2015 and has been
in the top 40 since 2006.
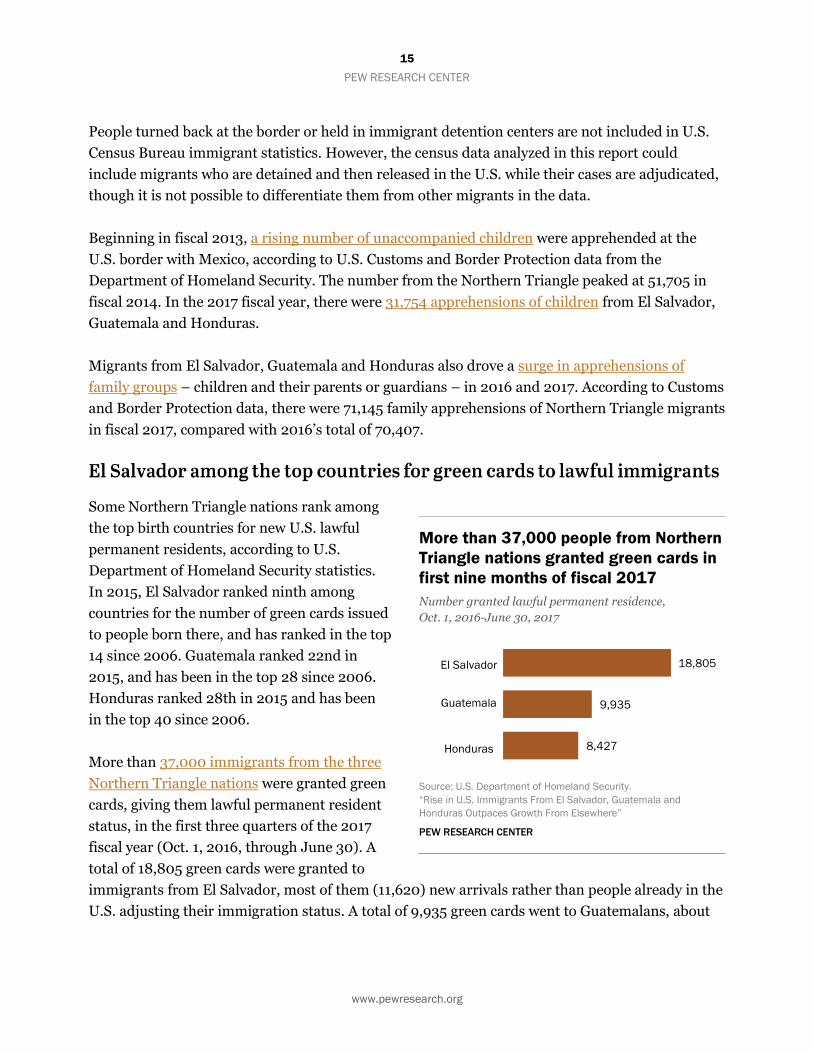
More than 37,000 immigrants from the three
Northern Triangle nations were granted green
cards, giving them lawful permanent resident
status, in the first three quarters of the 2017
fiscal year (Oct. 1, 2016, through June 30). A
total of 18,805 green cards were granted to
immigrants from El Salvador, most of them (11,620) new arrivals rather than people already in the
U.S. adjusting their immigration status. A total of 9,935 green cards went to Guatemalans, about
More than 37,000 people from Northern
Triangle nations granted green cards in
first nine months of fiscal 2017
Number granted lawful permanent residence,
Oct. 1, 2016-June 30, 2017
Source: U.S. Department of Homeland Security.
“Rise in U.S. Immigrants From El Salvador, Guatemala and
Honduras Outpaces Growth From Elsewhere”
PEW RESEARCH CENTER
18,805
9,935
8,427
El Salvador
Guatemala
Honduras

16
PEW RESEARCH CENTER
www.pewresearch.org
half of whom (5,003) were new arrivals. For Hondurans, 8,427 green cards were granted, but less
than half (3,853) went to new arrivals.
Among all 845,951 immigrants who obtained
lawful permanent residence in the first three
quarters of fiscal 2017, about half were new arrivals
and half were people already living in the U.S. who
adjusted their status.
Most Northern Triangle immigrants are admitted
because they have relatives already living in the
U.S., as is true of immigrants overall.
Only a small number of lawful immigrants from
Northern Triangle nations arrive as refugees – 974
from El Salvador, 50 from Guatemala and 93 from
Honduras from Oct. 1, 2016, to June 30, according
to Department of Homeland Security statistics. A
total of 49,232 refugees arrived during that time.
Asylum applications from
Northern Triangle nations rise
since 2013
Asylum applications from people born in
El Salvador, Guatemala and Honduras
have risen sharply in recent years,
according to U.S. government data. There
were more applications in fiscal 2013-
2015 from the three nations than in the
previous 15 years combined, according to
data from the U.S. Department of
Homeland Security.
The three Central American nations
accounted for 37% of all asylum
applications filed with two U.S.
government agencies in fiscal 2015 and
2016. That amounted to 112,151
applications. In fiscal 2014, 24% of
asylum seekers came from the three
Northern Triangle nations.
Partial data for fiscal 2017 also show that
37% of applicants – 79,571 of 215,213
– came from the Northern Triangle.
Numbers are available for the full fiscal
year (October 2016-September 2017)
from the Department of Homeland
Security’s Citizenship and Immigration
Services, which handles “affirmative”
applications from those in the U.S.
Numbers are available through May 2017
from the Justice Department’s Executive
Office for Immigration Review, which
handles “defensive” applications from
those in removal proceedings.

17
PEW RESEARCH CENTER
www.pewresearch.org
30
15
9
8
8
California
Texas
Maryland
New York
Virginia
17
15
11
8
6
Texas
Florida
California
New York
North Carolina
29
8
8
7
5
California
Florida
Texas
New York
New Jersey
2. Geography and characteristics of Northern Triangle
immigrants
Worldwide, more than eight-in-ten migrants born in El Salvador, Guatemala and Honduras live in
the United States, according to United Nations estimates. That included 89% of Salvadoran
migrants, 86% of Guatemalans and 82% of Hondurans in 2015.
Among all those born in El Salvador worldwide – those who live in El Salvador and those who live
elsewhere – 23% reside in the U.S., according to United Nations figures for 2015. For Guatemalans
and Hondurans, the shares in the U.S. are smaller – 6% and 8%, respectively – but still
consequential.
Most Northern Triangle immigrants live in states that also are popular with other immigrants,
especially those from Latin America. In all, 84% of Salvadoran immigrants lived in the 10 most
popular states for immigrants from their country in 2015, as did 72% of Guatemalan and 79% of
Honduran immigrants. Nearly three-quarters (74%) of immigrants overall lived in the most
popular states for the foreign-born population.
More than any other state, California has the largest share of Salvadoran immigrants (30% lived
there in 2015) and Guatemalan immigrants (29%). It’s also the top state for U.S. immigrants
overall – one-in-four live there. For Hondurans, though, Texas (17% in 2015) and Florida (15%)
California, New York, Texas are among top states of residence for Northern Triangle
immigrants
% of immigrants from ____ living in each state
El Salvador Guatemala Honduras
Source: Pew Research Center estimates based on augmented 2015 American Community Survey (IPUMS).
“Rise in U.S. Immigrants From El Salvador, Guatemala and Honduras Outpaces Growth From Elsewhere”
PEW RESEARCH CENTER
18
PEW RESEARCH CENTER
www.pewresearch.org
20
10
5
4
4
Los Angeles
New York
Miami
Houston
Washington D.C.
20
16
12
8
5
Los Angeles
Washington D.C.
New York
Houston
Dallas-Ft. Worth
13
11
10
6
6
New York
Miami
Houston
Los Angeles
Washington D.C.
are at least as popular as California (11%). Texas has the second largest population of U.S.
immigrants; 11% lived there in 2015.
However, several states that are not among the top 10 destinations for immigrants are popular
with those from Northern Triangle countries. They include Maryland for immigrants from all three
countries, North Carolina for Guatemalans and Hondurans, Nevada for Salvadorans and
Louisiana for Hondurans.
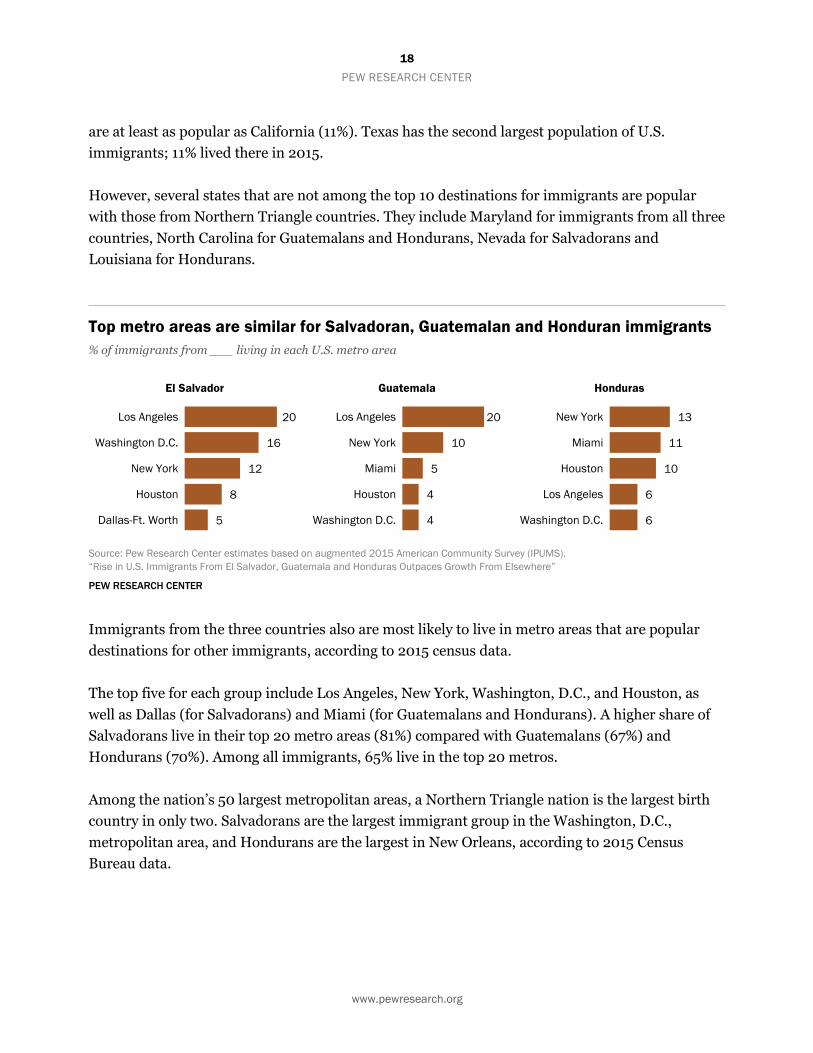
Immigrants from the three countries also are most likely to live in metro areas that are popular
destinations for other immigrants, according to 2015 census data.
The top five for each group include Los Angeles, New York, Washington, D.C., and Houston, as
well as Dallas (for Salvadorans) and Miami (for Guatemalans and Hondurans). A higher share of
Salvadorans live in their top 20 metro areas (81%) compared with Guatemalans (67%) and
Hondurans (70%). Among all immigrants, 65% live in the top 20 metros.
Among the nation’s 50 largest metropolitan areas, a Northern Triangle nation is the largest birth
country in only two. Salvadorans are the largest immigrant group in the Washington, D.C.,
metropolitan area, and Hondurans are the largest in New Orleans, according to 2015 Census
Bureau data.
Top metro areas are similar for Salvadoran, Guatemalan and Honduran immigrants
% of immigrants from ___ living in each U.S. metro area
El Salvador Guatemala Honduras
Source: Pew Research Center estimates based on augmented 2015 American Community Survey (IPUMS).
“Rise in U.S. Immigrants From El Salvador, Guatemala and Honduras Outpaces Growth From Elsewhere”
PEW RESEARCH CENTER
19
PEW RESEARCH CENTER
www.pewresearch.org
78
71
68
85
76
El Salvador
Guatemala
Honduras
Other
Central America
All countries
Other Central
America
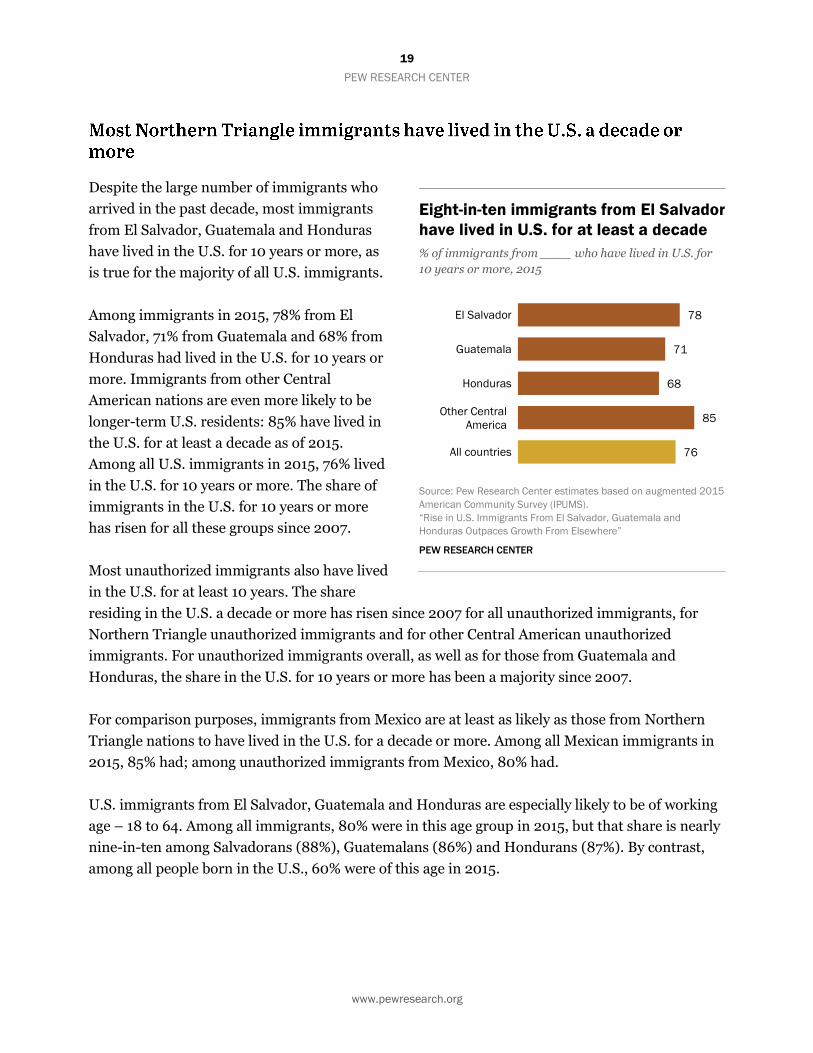
Despite the large number of immigrants who
arrived in the past decade, most immigrants
from El Salvador, Guatemala and Honduras
have lived in the U.S. for 10 years or more, as
is true for the majority of all U.S. immigrants.
Among immigrants in 2015, 78% from El
Salvador, 71% from Guatemala and 68% from
Honduras had lived in the U.S. for 10 years or
more. Immigrants from other Central
American nations are even more likely to be
longer-term U.S. residents: 85% have lived in
the U.S. for at least a decade as of 2015.
Among all U.S. immigrants in 2015, 76% lived
in the U.S. for 10 years or more. The share of
immigrants in the U.S. for 10 years or more
has risen for all these groups since 2007.
Most unauthorized immigrants also have lived
in the U.S. for at least 10 years. The share
residing in the U.S. a decade or more has risen since 2007 for all unauthorized immigrants, for
Northern Triangle unauthorized immigrants and for other Central American unauthorized
immigrants. For unauthorized immigrants overall, as well as for those from Guatemala and
Honduras, the share in the U.S. for 10 years or more has been a majority since 2007.
For comparison purposes, immigrants from Mexico are at least as likely as those from Northern
Triangle nations to have lived in the U.S. for a decade or more. Among all Mexican immigrants in
2015, 85% had; among unauthorized immigrants from Mexico, 80% had.
U.S. immigrants from El Salvador, Guatemala and Honduras are especially likely to be of working
age – 18 to 64. Among all immigrants, 80% were in this age group in 2015, but that share is nearly
nine-in-ten among Salvadorans (88%), Guatemalans (86%) and Hondurans (87%). By contrast,
among all people born in the U.S., 60% were of this age in 2015.
Eight-in-ten immigrants from El Salvador
have lived in U.S. for at least a decade
% of immigrants from ____ who have lived in U.S. for
10 years or more, 2015
Source: Pew Research Center estimates based on augmented 2015
American Community Survey (IPUMS).
“Rise in U.S. Immigrants From El Salvador, Guatemala and
Honduras Outpaces Growth From Elsewhere”
PEW RESEARCH CENTER

20
PEW RESEARCH CENTER
www.pewresearch.org
60
57
60
40
45
El Salvador
Guatemala
Honduras
Other
Central America
All countries
Other Central
America
Guatemala is the only Northern Triangle country from which there are substantially more men
(59% in 2015) than women (41%) among U.S. immigrants. The shares are nearly equal for
Salvadorans and Hondurans, as they are for U.S. immigrants overall. However, there is gender
imbalance in the other direction among other Central American immigrants; this group is 56%
female. Among all U.S. immigrants, 50% are female.
The labor force status of Northern Triangle immigrants varies by gender. Men from the Northern
Triangle are more likely to be working or looking for work than immigrants overall or people born
in the U.S. Among those ages 18 to 64, 91% of Northern Triangle male immigrants were in the
labor force in 2015, compared with 86% of all male immigrants and 79% of U.S.-born men.
Among women ages 18 to 64, labor force participation varies by birth country, but it is lower than
for all U.S.-born women. Linked to their lower labor force participation is their greater likelihood
to have young children at home. Northern Triangle immigrants are at least twice as likely as U.S.-
born women to have young children at home.
Households headed by immigrants from
Northern Triangle nations are more likely to
include children younger than 18 than
immigrant households overall in the U.S.
While 45% of immigrant households included
minor children in 2015, the share was 60% for
those headed by a Salvadoran immigrant, 57%
for those headed by a Guatemalan immigrant
and 60% for those headed by a Honduran
immigrant. Among households headed by
other Central American immigrants, 40%
included minor children. (By contrast, only
29% of households headed by a U.S.-born
adult included children in 2015.)
The share of households with children is
higher for homes headed by unauthorized
immigrants than by lawful ones. Among all
Northern Triangle unauthorized immigrant
households, 63% had minor children in 2015,
Northern Triangle immigrant households
are likely to include children
% of U.S. households headed by immigrants from ___
with children younger than 18, 2015
Source: Pew Research Center estimates based on augmented 2015
American Community Survey (IPUMS).
“Rise in U.S. Immigrants From El Salvador, Guatemala and
Honduras Outpaces Growth From Elsewhere”
PEW RESEARCH CENTER
21
PEW RESEARCH CENTER
www.pewresearch.org
54
58
51
21
29
El Salvador
Guatemala
Honduras
Other
Central America
All countries
Other Central
America
compared with 55% for households headed by a lawful Northern Triangle immigrant.
A single-person household – someone living alone – is relatively uncommon for Central American
immigrants, especially those from the Northern Triangle. Among Salvadoran immigrants, 9% lived
alone in 2015, compared with 12% for Guatemalan immigrants and 14% for Honduran
immigrants. Among all immigrants, 19% did. Among all the U.S. born, 30% did.
According to other census data for individuals (not households), about four-in-ten immigrant
adults from the three Northern Triangle nations live with minor children. The vast majority of
those immigrant adults – about nine-in-ten – live with U.S.-born children, who are U.S. citizens at
birth.
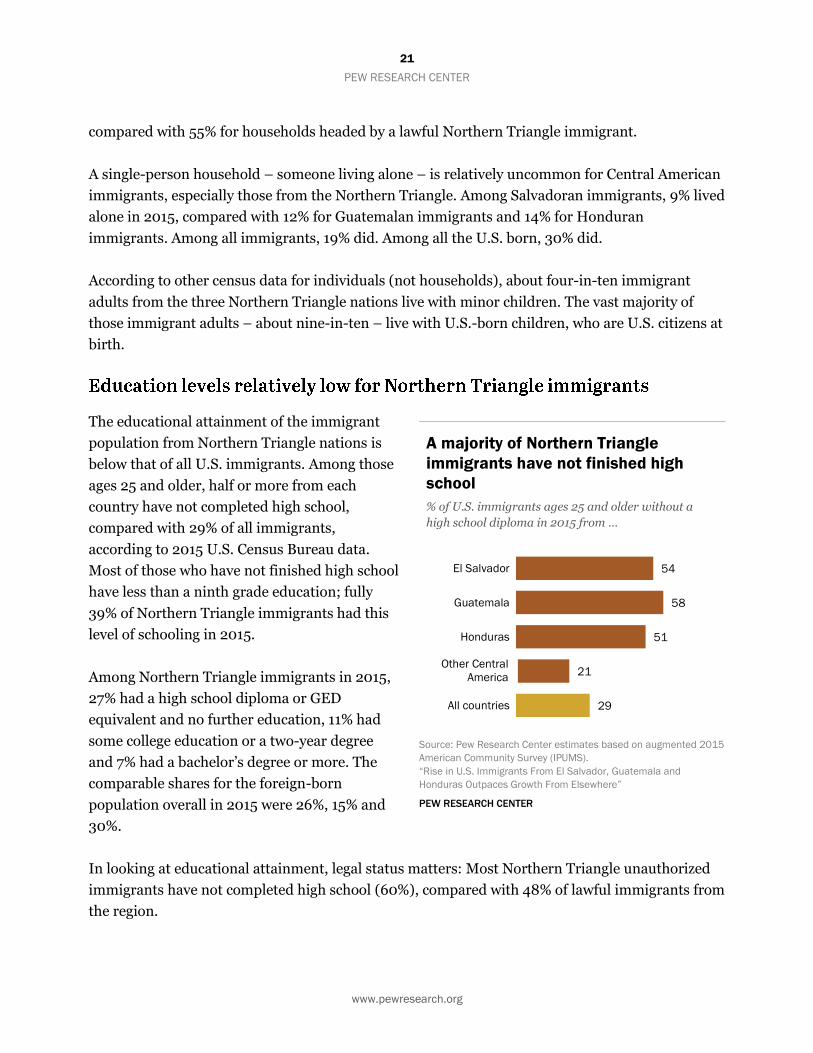
The educational attainment of the immigrant
population from Northern Triangle nations is
below that of all U.S. immigrants. Among those
ages 25 and older, half or more from each
country have not completed high school,
compared with 29% of all immigrants,
according to 2015 U.S. Census Bureau data.
Most of those who have not finished high school
have less than a ninth grade education; fully
39% of Northern Triangle immigrants had this
level of schooling in 2015.
Among Northern Triangle immigrants in 2015,
27% had a high school diploma or GED
equivalent and no further education, 11% had
some college education or a two-year degree
and 7% had a bachelor’s degree or more. The
comparable shares for the foreign-born
population overall in 2015 were 26%, 15% and
30%.
In looking at educational attainment, legal status matters: Most Northern Triangle unauthorized
immigrants have not completed high school (60%), compared with 48% of lawful immigrants from
the region.
A majority of Northern Triangle
immigrants have not finished high
school
% of U.S. immigrants ages 25 and older without a
high school diploma in 2015 from …
Source: Pew Research Center estimates based on augmented 2015
American Community Survey (IPUMS).
“Rise in U.S. Immigrants From El Salvador, Guatemala and
Honduras Outpaces Growth From Elsewhere”
PEW RESEARCH CENTER

22
PEW RESEARCH CENTER
www.pewresearch.org
30
27
29
58
51
El Salvador
Guatemala
Honduras
Other
Central America
All countries
Other Central
America
Educational attainment is notably higher among U.S.-born residents with roots in the three
Central American nations. In that group, the vast majority has a college degree (24% in 2015),
some college (30%) or a high school education (30%). Only 16% did not complete high school.
Immigrants from El Salvador, Guatemala and Honduras are less likely than other foreign-born
residents of the U.S. to be proficient in English. English proficiency is defined as either speaking
only English at home or, if someone speaks another language at home, that person speaks English
very well.
In 2015, half of U.S. immigrants ages 5 and older (51%) were proficient in English, compared with
almost a third of those from the Northern Triangle.
Most households of immigrants from Central
America speak a language other than English at
home. Among immigrants ages 5 and older,
only 4% from El Salvador, 7% from Guatemala
and 4% from Honduras spoke English and no
other language at home in 2015. Nearly all who
do not speak only English at home said they
spoke Spanish. By comparison, among all
immigrants, 16% spoke only English at home,
according to 2015 census data.
English proficiency tends to be higher for
immigrants with college degrees and lawful
status. As with education levels, immigration
status is relevant: Unauthorized immigrants
from each of the three countries are less likely
to be proficient than lawful immigrants. The
relatively high share of Northern Triangle
immigrants who do not have high school
diplomas or lawful status helps explain their
relatively low levels of English proficiency.
Northern Triangle immigrants less
likely to be English proficient than
U.S. immigrants overall
% of U.S. immigrants ages 5 and older who speak
English proficiently in 2015, from …
Note: Those who speak English proficiently are those who speak
only English at home or, if they speak a non-English language at
home, indicate they speak English “very well.”
Source: Pew Research Center estimates based on augmented 2015
American Community Survey (IPUMS).
“Rise in U.S. Immigrants From El Salvador, Guatemala and
Honduras Outpaces Growth From Elsewhere”
PEW RESEARCH CENTER
23
PEW RESEARCH CENTER
www.pewresearch.org
Acknowledgments
This report was written by D’Vera Cohn, senior writer/editor; Jeffrey S. Passel, senior
demographer; and Ana Gonzalez-Barrera, senior researcher. Editorial guidance was provided by
Mark Hugo Lopez, director of Global Migration and Demography research; James Bell, vice
president for global strategy; and Phillip Connor, senior researcher. Charts and tables were created
by Abby Budiman, intern; Michael Keegan, information graphics designer; Gustavo López,
research analyst; and Cohn. López and Antonio Flores, research assistant, number-checked the
report and its graphics. David Kent copy edited the report. Ariana Rodriguez-Gitler was the digital
producer.
Find related reports online at pewresearch.org/Hispanic.
Methodology
Data sources for this report include the 1990 census, the 1995 and 2000 Current Population
Survey, and the 2005-2015 American Community Survey, all from the U.S. Census Bureau. Data
are adjusted and augmented for undercount. For details, see methodology of the Pew Research
Center report “Overall Number of U.S. Unauthorized Immigrants Holds Steady Since 2009.”
Data for the immigrant population from all countries and from Central American countries, as
well as immigrant inflows to the U.S., are rounded to the nearest 5,000 for populations under 1
million, the nearest 10,000 for populations between one and 10 million, and to the nearest 25,000
for populations over 10 million. Estimates for unauthorized immigrant populations are rounded
differently, according to the rounding rules in the Pew Research Center report “Overall Number of
U.S. Unauthorized Immigrants Holds Steady Since 2009.”
The 2011 National Survey of Latinos was conducted from Nov. 9 through Dec. 7, 2011. Results are
based on telephone interviews conducted by Social Science Research Solutions (SSRS), an
independent research company, among a nationally representative sample of 1,220 Latino
respondents ages 18 and older. Of these, 492 respondents were U.S. born (including Puerto Rico)
and 728 were foreign born (excluding Puerto Rico). Of the foreign born, 299 were U.S. citizens,
261 were legal residents and 140 were not citizens and not legal residents.
The Encuesta de Migración en la Frontera Sur (EMIF-Sur) has been conducted since 2004,
although only 2016 data were included in this report. The surveys of deportees are conducted
among a representative sample of people deported from the United States and Mexico in four
cities and in the main airports of the three Northern Triangle nations (El Salvador, Guatemala and
Honduras).
24
PEW RESEARCH CENTER
www.pewresearch.org
Appendix A: References
American Immigration Council, 2017. “Temporary Protected Status: An Overview.” Washington,
D.C.: American Immigration Council, August.
Cohn, D’Vera, 2017. “5 key facts about U.S. lawful immigrants.” Washington, D.C.: Pew Research
Center, August.
Cohn, D’Vera and Jeffrey S. Passel, 2017. “More than 100,00 Haitian and Central American
immigrants face decision on their status in the U.S.” Washington, D.C.: Pew Research Center,
November.
DeSilver, Drew, 2017. “Immigrants don’t make up a majority of workers in any U.S. industry.”
Washington, D.C.: Pew Research Center, March.
Embassy of Guatemala, 2017. “Nuevos Consulados en Estados Unidos.” Washington, D.C.:
Embassy of Guatemala, January.
Gonzalez-Barrera, Ana, 2016. “Apprehensions of Mexican migrants at U.S. borders reach near-
historic low.” Washington, D.C.: Pew Research Center, April.
Gonzalez-Barrera, Ana, 2015. “More Mexicans Leaving than Coming to the U.S.” Washington,
D.C.: Pew Research Center, November.
Gonzalez-Barrera, Ana, Jens Manuel Krogstad and Mark Hugo Lopez, 2014. “DHS: Violence,
poverty are driving children to flee Central America to U.S.” Washington, D.C.: Pew Research
Center, July.
InSight Crime Foundation, 2017. “2016 Homicide Rates for Latin America and the Caribbean.”
Medellin, Colombia, accessed November 2017.
Krogstad, Jens Manuel, 2016. “U.S. border apprehensions of families and unaccompanied children
jump dramatically.” Washington, D.C.: Pew Research Center, May.
Krogstad, Jens Manuel, 2016. “5 facts about Mexico and immigration to the U.S.” Washington,
D.C.: Pew Research Center, February.

25
PEW RESEARCH CENTER
www.pewresearch.org
Krogstad, Jens Manuel and Ana Gonzalez-Barrera, 2014. “Number of Latino children caught
trying to enter U.S. nearly doubles in less than a year.” Washington, D.C.: Pew Research Center,
June.
Lesser, Gabriel and Jeanne Batalova, 2017. “Central American Immigrants in the United States.”
Washington, D.C.: Migration Policy Institute, April.
López, Gustavo and Jens Manuel Krogstad, 2017. “Key facts about unauthorized immigrants
enrolled in DACA.” Washington, D.C.: Pew Research Center, September.
Martin, Susan F., 2011. “A Nation of Immigrants.” New York, N.Y.: Cambridge University Press.
Passel, Jeffrey S. and D’Vera Cohn, 2017. “As Mexican share declined, U.S. unauthorized
immigrant population fell in 2015 below recession level.” Washington, D.C.: Pew Research Center,
April.
Passel, Jeffrey S. and D’Vera Cohn. 2016. “Overall Number of U.S. Unauthorized Immigrants
Holds Steady Since 2009.” Washington, D.C.: Pew Research Center, September.
Passel, Jeffrey S. and D’Vera Cohn. 2016. “Unauthorized immigrant population stable for half a
decade.” Washington, D.C.: Pew Research Center, September.
Pew Research Center, 2016. “Origins and Destinations of the World’s Migrants, from 1990-2015.”
Washington, D.C.: Pew Research Center, May.
Pew Research Center, 2016. “Remittance Flows Worldwide in 2015.” Washington, D.C.: Pew
Research Center, August.
Pew Research Center, 2013. “Mexicans and Salvadorans Have Positive Picture of Life in U.S.”
Washington, D.C.: Pew Research Center, October.
Pew Research Center, 2012. “The Rise of Asian Americans.” Washington, D.C.: Pew Research
Center, June.
Pew Research Center, 2011. “The Mexican-American Boom: Births Overtake Immigration.”
Washington, D.C.: Pew Research Center, July.

26
PEW RESEARCH CENTER
www.pewresearch.org
Ruggles, Steven, Katie Genadek, Ronald Goeken, Josiah Grover, and Matthew Sobek. 2015.
Integrated Public Use Microdata Series: Version 6.0 [Machine-readable database]. Minneapolis,
Minn.: University of Minnesota.
U.S. Citizenship and Immigration Services. “Temporary Protected Status.” Washington, D.C.: U.S.
Citizenship and Immigration Services, accessed November 2017.
U.S. Citizenship and Immigration Services, 2017. “Approximate Active DACA Recipients: Country
of Birth.” Washington, D.C.: U.S. Department of Homeland Security. Accessed Nov. 1, 2017.
U.S. Citizenship and Immigration Services. “Consideration of Deferred Action for Childhood
Arrivals (DACA).” Washington, D.C.: U.S. Department of Homeland Security.
U.S. Citizenship and Immigration Services, 2016. “Extension of the Designation of Honduras for
Temporary Protected Status.” Washington, D.C.: Federal Register, May.
U.S. Citizenship and Immigration Services, 2016. “Extension of the Designation of El Salvador for
Temporary Protected Status.” Washington, D.C.: Federal Register, July.
U.S. Citizenship and Immigration Services. “Obtaining Asylum in the United States.” Washington,
D.C.: U.S. Department of Homeland Security.
U.S. Customs and Border Protection, 2016. “CBP Border Security Report.” Washington, D.C.: U.S.
Department of Homeland Security, December.
U.S. Customs and Border Protection. “U.S. Border Patrol Southwest Border Apprehensions by
Sector.” Accessed Nov. 1, 2017.
U.S. Customs and Border Protection. “Southwest Border Unaccompanied Alien Children FY2014.”
Accessed Nov. 1, 2017.
U.S. Department of Homeland Security, 2017. “Acting Secretary Elaine Duke Announcement on
Temporary Protected Status for Nicaragua and Honduras.” Accessed Nov. 6, 2017.
U.S. Department of Homeland Security, 2017. “Legal Immigration and Adjustment of Status
Report Fiscal Year 2017, Quarter 3.” Accessed Nov. 1, 2017.
27
PEW RESEARCH CENTER
www.pewresearch.org
U.S. Immigration and Customs Enforcement, 2017. “ICE Removals by Country of Citizenship from
January 25th, 2017 to May 8th, 2017.” Accessed Nov. 1, 2017.
U.S. Immigration and Customs Enforcement. “Fiscal Year 2016 ICE Enforcement and Removal
Operations Report.” Accessed Nov. 1, 2017.
The World Bank, 2017. Poverty and Equity Data Portal. Washington, D.C.: The World Bank,
accessed November 2017.
The World Bank, 2017. “Migration and Remittances Data.” Washington, D.C.: The World Bank,
accessed Nov. 20, 2017.
The World Bank, 2017. “Migration and Remittances: Recent Developments and Outlook.”
Washington, D.C.: The World Bank, October.

28
PEW RESEARCH CENTER
www.pewresearch.org
Appendix B: Additional tables and chart
Labor force participation
varies by gender
% of immigrants ages 18-64 who
are working or looking for work
Men Women
El Salvador 90 70
Guatemala 92 60
Honduras 89 62
Source: Pew Research Center estimates
based on augmented 2015 American
Community Survey (IPUMS).
“Rise in U.S. Immigrants From El Salvador,
Guatemala and Honduras Outpaces Growth
From Elsewhere”
PEW RESEARCH CENTER
Educational attainment of Northern Triangle immigrants
% of immigrants ages 25 and older from ___ with designated education level, 2015
Note: Shares may not add to 100% due to rounding. “High school graduate” includes persons who have attained a high school diploma
or its equivalent, such as a GED.
Source: Pew Research Center estimates based on augmented 2015 American Community Survey (IPUMS).
"Rise in U.S. Immigrants From El Salvador, Guatemala and Honduras Outpaces Growth From Elsewhere"
PEW RESEARCH CENTER
Guatemala El Salvador Honduras
Less than 9th grade
9th – 12th grade
High school graduate
Two year degree/
Some college
Bachelor’s degree
or more
44
14
26
10
6
35%
18
28
11
7
38
14
28
12
9
29
PEW RESEARCH CENTER
www.pewresearch.org
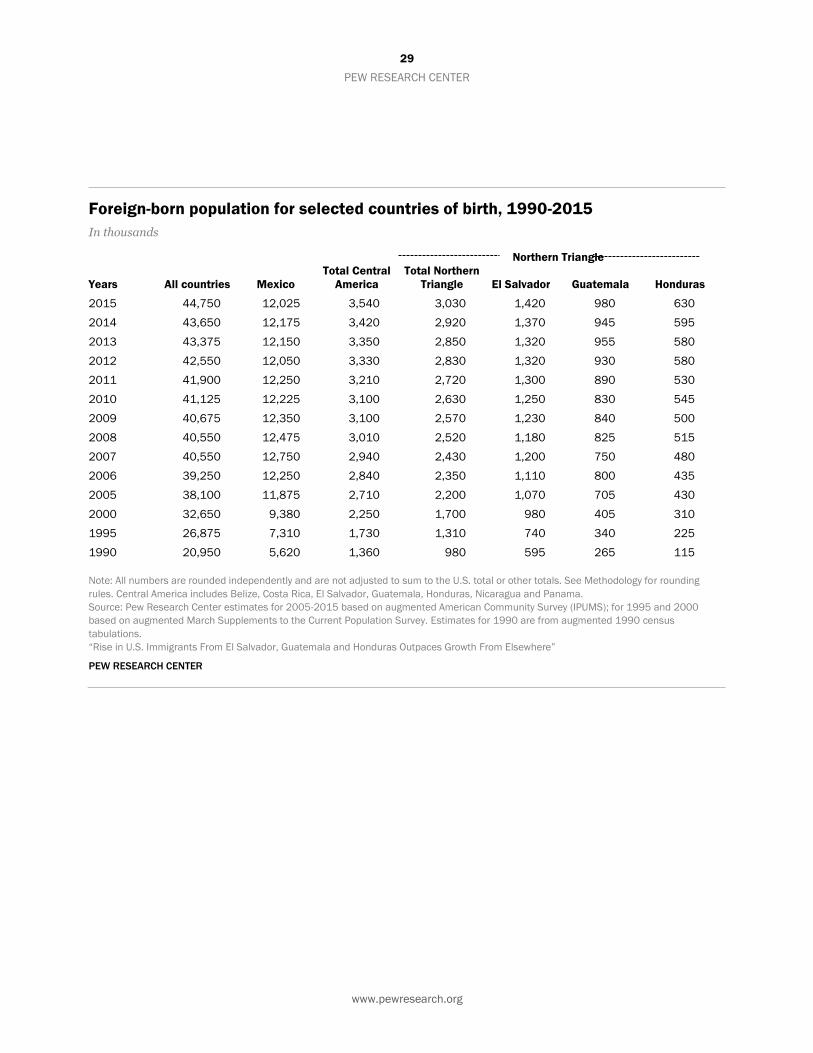
Foreign-born population for selected countries of birth, 1990-2015
In thousands
Northern Triangle
Years All countries Mexico
Total Central
America
Total Northern
Triangle El Salvador Guatemala Honduras
2015 44,750 12,025 3,540 3,030 1,420 980 630
2014 43,650 12,175 3,420 2,920 1,370 945 595
2013 43,375 12,150 3,350 2,850 1,320 955 580
2012 42,550 12,050 3,330 2,830 1,320 930 580
2011 41,900 12,250 3,210 2,720 1,300 890 530
2010 41,125 12,225 3,100 2,630 1,250 830 545
2009 40,675 12,350 3,100 2,570 1,230 840 500
2008 40,550 12,475 3,010 2,520 1,180 825 515
2007 40,550 12,750 2,940 2,430 1,200 750 480
2006 39,250 12,250 2,840 2,350 1,110 800 435
2005 38,100 11,875 2,710 2,200 1,070 705 430
2000 32,650 9,380 2,250 1,700 980 405 310
1995 26,875 7,310 1,730 1,310 740 340 225
1990 20,950 5,620 1,360 980 595 265 115
Note: All numbers are rounded independently and are not adjusted to sum to the U.S. total or other totals. See Methodology for rounding
rules. Central America includes Belize, Costa Rica, El Salvador, Guatemala, Honduras, Nicaragua and Panama.
Source: Pew Research Center estimates for 2005-2015 based on augmented American Community Survey (IPUMS); for 1995 and 2000
based on augmented March Supplements to the Current Population Survey. Estimates for 1990 are from augmented 1990 census
tabulations.
“Rise in U.S. Immigrants From El Salvador, Guatemala and Honduras Outpaces Growth From Elsewhere”
PEW RESEARCH CENTER