fig.1. schematic view of the photoemission (top) and inverse photoemission (bottom) processes....
TRANSCRIPT

-5 0 5
Energy (eV)
unoccupied occupied
Ag
PES/IPES
Fig.1. Schematic view of the Photoemission (top) andInverse Photoemission (bottom) processes.
Fig.2. PES and IPES spectra of polycrystalline silver, plotted with a common Fermi level (at E=0). Together they probe the density of states (DOS).

Fig.3. ‘Universal curve’ of the photoelectron elasticmean free path as a function of kinetic energy.
Fig.4. An impossible ‘vertical transition’ for a free electron (left), and transitions involving reciprocal lattice vectors in a periodic potential.

Fig.5. Escape conditions for a ‘hot’ electron at the sample surface. Only the component of the electron momentum along the surface is conserved. The electron is refracted.
Energy
k < kF
k = kF
k > kF
Σ( )all k~DOS
Fermi edge
k//
E
0=EF
Fig.6. An ARPES experiment on a metal.The energy of the ARPES peak changes with the emission angle (with parallel momentum), reproducing the dispersion of the underlying band.

1 0
Binding Energy (eV)
-0.4 0 0.4
1
0
Wave vector (1/Å)
Fig.7. ARPES spectra of the quasi-1D compound (NbSe4)3I along the 1D direction. The band dispersion is well visible in the intensity map.
Fig.8. ARPES intensity map of LaRu2Si2 measured at E=EF, compared with a theoretical Fermi surface. From Ref. 6.

Kinetic energy →
0' 'sudden
adiabatic
Fig.9. Artist’s view of an ARPES spectrum in the opposite sudden and adiabatic limits. The ‘0’ transition corresponds to the ground state of the (N-1)-electron system.
Fig.10. Artist’s view of the k-dependent ARPES spectral function is the free-electron limit (left) and in an interacting system (right). (adapted from M. Meinders; PhD Thesis, Groningen (1994)).

Fig.11. Theoretical (line) and experimental dispersion of the conduction band of sodium. The band narrowing is a typical consequence of electronic correlations. From Ref. 10.
Wavevector
E*
k*MDC
EDC
Fig.12. Cuts of the ARPES intensity map produce Energy distribution curves (EDCs, at constant k) or Momentum distribution curves (MDCs, at constant energy).

Fig.13. Normal emission spectra from quantum well states in epitaxial Ag(100) films of varying thickness.From Ref. 12.
Fig.14. ARPES Fermi liquid lineshapes in the 2D metal TiTe2. Notice the typical FL tail beyond kF. From Ref. 13.

Binding Energy (meV)
13 K
237 K
35
15
2000 ( )T K
200 0=EF
Fig.15. QP spectra of TiTe2 measured at the Fermi surface at various temperatures. The temperature-dependent linewidth reflects the increasing electron-phonon scattering at high T. (adapted from Ref. 14).
Fig.16. Experimental and theoretical ARPES spectra of a surface state on Be(0001), showing the effect of a strong electron-phonon interaction. The renormalized dispersion is shown in b). From Ref. 15.
b)

-0.4 0Energy (eV)
0=EFBinding Energy (meV)
Bi-2212
k = kF
T > TC
T < TC
0=EF100
Fig.17. Expected dispersion and DOS(top) in a SC or CDW state, within a mean-field scenario.
Fig.18. (left) Gap opening in the SC cuprate Bi-2212. (right) Evolution of the SC gap as a function of doping in Bi-2212. From Ref. 21.

Fig.19. Angular dependence of the SC gap in Bi-2212 extracted from ARPES data. The dependence is consistent with a ‘d-wave’ scenario.From Ref. 22.
Fig.20. PES spectra of V3Si above and below the SC transition. The lines are BCS fits. Notice the small ‘hump’ above EF, from thermally populated states above the gap. (inset) T-dependence of ∆(T).From Ref. 23.

Fig.21. Temperature-dependent raw (left) and symmetrized spectra of a C60 monolayer on the Ag(100) surface, showing the opening of a gap at EF. From Ref. 25.
Fig.22. Temperature-dependent spectra of a gold reference and of the ‘Kondo insulator’ CeRhAsillustrate the opening of a pseudogap at EF in the latter. The spectra were divided by the Fermi distribution. From Ref. 24.
B.E. (meV)
T > TC
T < TC
0.4
0 kF1
0=EF
200Wave vector
kF2
kF1
kF2
0=EF
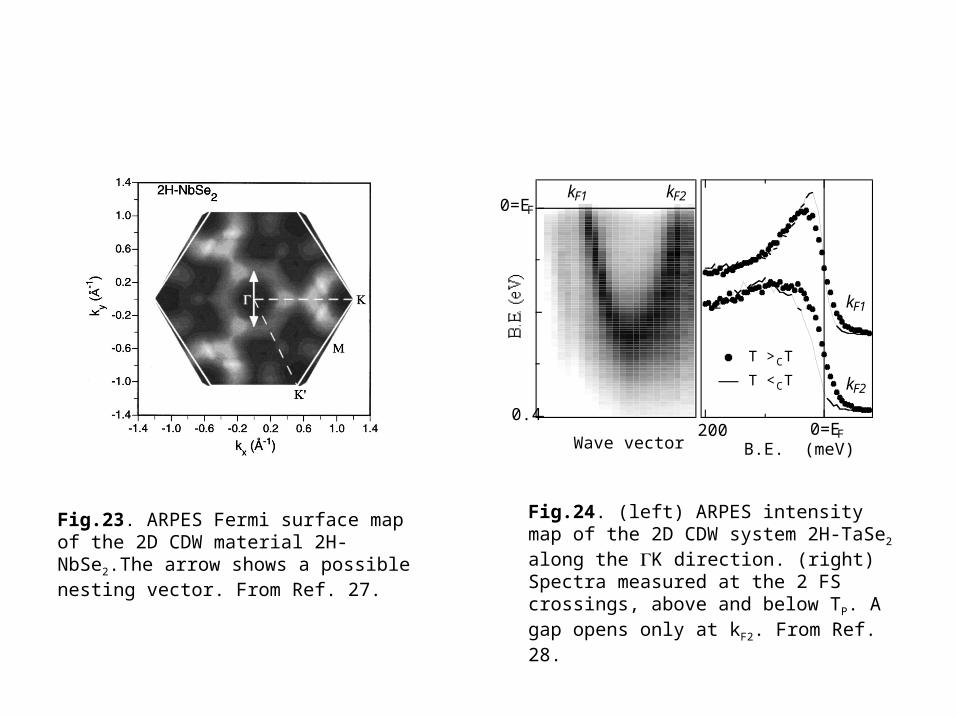
Fig.23. ARPES Fermi surface map of the 2D CDW material 2H-NbSe2.The arrow shows a possible nesting vector. From Ref. 27.
Fig.24. (left) ARPES intensity map of the 2D CDW system 2H-TaSe2 along the K direction. (right) Spectra measured at the 2 FS crossings, above and below TP. A gap opens only at kF2. From Ref. 28.

90 K
1
0
1T-TaS2
←
→
→
1 0. . ( )B E eV
90 K 250 K
1T-TaS2
0=EF WavevectorΜ Μ
Fig.25. Very high resolution spectra of 2H-NbSe2, measured on two different FS sheets across the SC transition (TSC=7.2 K). From Ref. 29.
Fig.26. ARPES intensity map of 1T-TaS2 in the metallic (left) and insulating (center) phase. The opening of a Mott-Hubbard gap is also evident from the spectra (right). From Ref. 30.

1
0
0.4 0Binding Energy (eV)
TTF-TCNQ
k = kF
0=E F Y
0=E F Wavevector
k F
Fig.27. (left) ARPES intensity map for the organic 1D compound TTF-TCNQ. (right) The spectrum at k=kF exhibits a deep pseudogap. From Ref. 31.
Fig.28. Calculated spectral function of the Luttinger Liquid, showing separate spinon and holon excitations. From Ref. 33.

Binding Energy (eV)
12
4
130110
hν
4 0=EF
hν
4f
Fig.29. Experimental valence band dispersion in 1D SrCuO2 and in a 2D cuprate (right). The broader 1D dispersion is compatible with spin-charge separation in 1D. From Ref. 35.
Fig.30. RESPES spectra of the Kondo system CePd3
measured across the Ce 4d absorption edge. (inset) Photon energy dependence of the 4f signal. From Ref. 36.

Fig.31. Decomposition into triplet and singlet components of the spectrum of the SC compound Bi-2212. Spin-resolved data were taken at the Cu 2p-3d resonance. From Ref. 38.
Fig.32. RESPES spectra of the Kondo system CeRu2Si2 measured at the Ce 3d and Ce 4d edges, with different surface sensitivity. From Ref. 39.

Fig.33. Spectra of the 3d core levels of metallic samarium, at 3 different photon energies. The Sm2+ surface component is drastically reduced in the bulk-sensitive high energy spectrum. From Ref. 41.
Fig.34. Band mapping at the Cu(100) surface with high energy photons (hν. (courtesy of C. Dallera)