field calibration and spatial analysis of compaction ... and white 1 1 field calibration and spatial...
TRANSCRIPT

Field Calibration and Spatial Analysis of Compaction Monitoring Technology Measurements By Mark J. Thompson (Corresponding Author) Graduate Research Assistant, Iowa State University, 405 Town Engineering Building Ames, IA 50011-3232 Tel: (515) 294-9023, Fax: (515) 294-8216 Email: [email protected] David J. White, Ph.D. Assistant Professor, Iowa State University, 476 Town Engineering Building Ames, IA 50011-3232 Tel: (515) 294-1463, Fax: (515) 294-8216 Email: [email protected] Word Count Abstract = 0202 Text = 4833 Tables (0 x 250) = 0000 Figures (10 x 250) = 2500 Total = 7535 Submitted on October 21, 2006 for presentation and publication by Transportation Research Board, 86th Annual Meeting, January 2007, Washington, D.C.
TRB 2007 Annual Meeting CD-ROM Paper revised from original submittal.
Thompson and White 1
1
Field Calibration and Spatial Analysis of Compaction Monitoring Technology Measurements ABSTRACT To implement compaction monitoring technologies (i.e., continuous compaction control and intelligent compaction), robust and versatile specifications are needed. These specifications will require field calibration of the various machine sensor outputs to in-situ soil compaction measurements. The goal of this study was to provide insights into: (1) the nature of compaction monitoring measurements, (2) how the measurements are related to soil properties determined from in-situ compaction control tests, and (3) how compaction monitoring technology may be addressed in specifications for using the technology in practice. To accomplish this goal, testing was conducted on one-dimensional test strips with several nominal moisture contents for developing statistical regression models that relate machine drive power (MDP) and compaction meter value (CMV) data to engineering and index properties of soil. Further, a two-dimensional test area with variable lift thickness and moisture content was constructed and tested using both compaction monitoring technology and in-situ devices (e.g., nuclear moisture-density gauge, portable falling weight deflectometer). The spatial distribution of the data was investigated. The significance of this research is that it represents the first documented field calibration of both one-dimensional and two-dimensional tests areas on similar soils and introduces a new approach to generating pass/fail criteria based on compaction monitoring technology.
TRB 2007 Annual Meeting CD-ROM Paper revised from original submittal.

Thompson and White 2
2
INTRODUCTION Compaction monitoring technologies have recently been incorporated into quality acceptance practices of transportation earthwork projects in the United States (1). The use of such technology is anticipated to increase in upcoming years. Transportation agencies and contractors are implementing compaction monitoring technology with the expectation that the systems will improve construction efficiency, streamline quality management programs of earthwork projects, better link quality acceptance parameters and documentation with pavement design, and improve the performance of compacted materials. Before widespread technology implementation in the United States, it follows that research is needed to verify these potential benefits.
For validating various compaction monitoring technologies, previous research efforts have focused on field calibration testing on one-dimensional test strips with various soil conditions using compaction monitoring technology applied to various roller configurations to show that, on a relatively large scale, compaction monitoring technologies can indicate the condition of the compaction layer (2, 3, 4). Much of this research has focused on describing the variability of roller-generated data at different length scales and using both roller data and moisture content to predict in-situ soil properties, including soil density, strength, and modulus. Research findings and results from field demonstration projects (5, 6) have supported continued compaction monitoring technology developments and technology implementation into geoconstruction operations. Continued research studies are needed for a variety of field conditions to develop comprehensive and versatile specifications for use of this technology.
In this paper, experimental testing and results are described for establishing the applicability of using averaged roller data from one-dimensional calibration test strips to assess compaction of a two-dimensional area. Such an evaluation is necessary for verifying the reliability of one-dimensional test strip calibrations as a component of specifications (see 7). The specific objectives of this study included: (1) collection of compaction monitoring results over a two-dimensional area that incorporates variable lift thickness and stiffness properties, (2) documentation of how the result from two different compaction monitoring technologies are related considering spatial variability of soil properties and also measurement variability, (3) evaluation of how accurately two different compaction monitoring technologies predict soil properties compared with using in-situ compaction control tests (e.g., dynamic cone penetrometer, nuclear moisture-density gauge, portable falling weight deflectometers, etc.), and (4) evaluation of previous research findings, such as using moisture content in concert with machine compaction monitoring values to predict soil properties, for implementing the findings into quality statements or specifications.
The two compaction monitoring technologies evaluated in this paper are the vibratory-based compaction meter value (CMV) and the static or vibratory-based machine drive power (MDP). The machine parameters were statistically evaluated for both one-dimensional calibration test strips and a two-dimensional test area for demonstrating how compaction monitoring technology may be implemented on an earthwork project as a quality control/acceptance tool. The findings documented in this paper have broader implications for all compaction monitoring technologies.
TRB 2007 Annual Meeting CD-ROM Paper revised from original submittal.

Thompson and White 3
3
EXPERIMENTAL DESIGN Compaction Monitoring Technology Description A CS-533 vibratory smooth drum roller with capabilities for measurement and real-time output of both CMV and MDP, shown in FIGURE 1, was used for this project. The 10,240-kg roller has a drum diameter of 1.55 m, a drum width of 2.13 m, and a rear wheel-to-drum width of 2.90 m. The roller was additionally fitted with a global positioning system (GPS) to track roller coverage and apply compaction monitoring results to discrete locations over the project area (i.e. mapping).
FIGURE 1 Caterpillar CS-533 vibratory smooth drum roller with compaction monitoring technology.
CMV technology uses accelerometers installed on the drum of a vibratory roller to
measure roller drum accelerations in response to soil behavior during compaction operations. Previous studies have found that the ratio between the amplitude of the first harmonic (A1) and the amplitude of the fundamental frequency (A0) is a reliable indicator of soil compaction. Accordingly, CMV is defined as:
0
1
AA CCMV ⋅= (1)
where C is a constant to give a full scale reading of about 100. CMV technology is further described in (8) and (9). CMV has been correlated to in-situ field compaction measurements for several soils (10).
The use of MDP as a measure of soil compaction is a concept originating from study of vehicle-terrain interaction. MDP, which relates to the soil properties controlling drum sinkage, uses the concepts of rolling resistance and sinkage to determine the stresses acting on the drum and the energy necessary to overcome the resistance to motion (11, 12, 13). Using MDP for describing soil compaction, where higher power indicates soft or weak material and lower power indicates compact or stiff material, is documented by (2), (3), and (4). The net MDP that is required to propel the machine over a layer of soil can be represented as:
TRB 2007 Annual Meeting CD-ROM Paper revised from original submittal.
Thompson and White 4
4
( )bmVaWVPMDP g
sin g +−⎟⎟⎠
⎞⎜⎜⎝
⎛+−= θ (2)
where Pg is the gross power needed to move the machine, W is the roller weight, V is the roller velocity, θ is a slope angle, a is acceleration of the machine, g is acceleration of gravity, m and b are machine internal loss coefficients specific to a particular machine (11). The second and third terms of Equation (2) account for the machine power associated with sloping grade and internal machine loss, respectively. For roller operation at this site on level ground, machine power attributed to sloping grade is generally less than than 20 percent of the gross power; internal machine loss and MDP may each range from 20 to 80 percent of gross power. Further details of the calibration process of machine internal loss coefficients are described in (3). Project Description and Test Plan Design For evaluating compaction monitoring output in terms of soil properties, in-situ spot tests were performed to obtain measures of the soil state and performance characteristics. Soil moisture content and dry unit weight were obtained using a nuclear moisture-density gauge with a constant transmission depth of 200 mm. Soil modulus was obtained using a portable falling weight deflectometer (PFWD) with a 200-mm plate. Modulus determination for this project followed the manufacturer’s protocol of three seating drops, followed by three additional drops from which the average plate settlement was used to calculate soil modulus (14). Clegg impact values (CIV), a measure of soil strength, was obtained at the soil surface by Clegg Impact Tests (both 4.5 kg and 20 kg). Full-depth soil strength (about 900 mm) was measured using the dynamic cone penetrometer (DCP).
Field calibration testing of the roller was performed using four, 30-m test strips constructed at the same site, established parallel to the direction of roller travel on the two-dimensional test area. The first test strip, which was constructed using well-graded subbase material at optimum moisture content, incorporated variable lift thickness (127 to 508 mm). Roller data from this test strip indicated the effect of lift thickness on machine response. The remaining test strips were comprised of uniformly placed and moisture-conditioned material. To identify the influence of moisture content on machine response during compaction, the second test strip was compacted, tested, and then reconstructed at two additional moisture contents. For each of these test strips, five tests were conducted with each test device following 1, 2, 4, 8, and 12 roller passes. This compaction curve testing was used to develop statistical regressions relating MDP, CMV, and moisture content to the various in-situ soil properties.
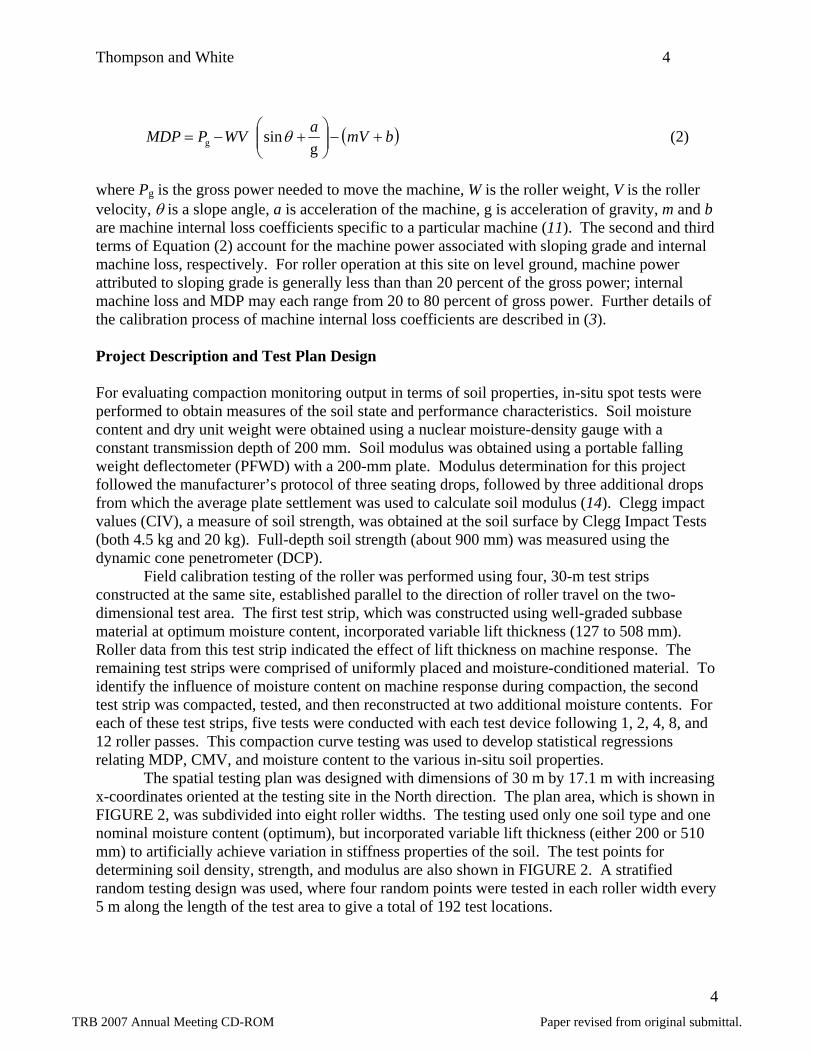
The spatial testing plan was designed with dimensions of 30 m by 17.1 m with increasing x-coordinates oriented at the testing site in the North direction. The plan area, which is shown in FIGURE 2, was subdivided into eight roller widths. The testing used only one soil type and one nominal moisture content (optimum), but incorporated variable lift thickness (either 200 or 510 mm) to artificially achieve variation in stiffness properties of the soil. The test points for determining soil density, strength, and modulus are also shown in FIGURE 2. A stratified random testing design was used, where four random points were tested in each roller width every 5 m along the length of the test area to give a total of 192 test locations.
TRB 2007 Annual Meeting CD-ROM Paper revised from original submittal.
Thompson and White 5
5
X Distance (m)
Y D
ista
nce
(m)
0
5
10
15
20
25
30
4.3 8.5 12.8 17.10.0
200-mm lift
510-mm liftTest point
FIGURE 2 Testing plan for two-dimensional area. Soil Description Compaction curve and spatial testing was conducted using CA6-G (Illinois DOT classification) from a local source. This non-plastic soil is coarse grained (Cu = 30, Cc = 2.7) and classifies as SW-SM well-graded sand with silt and gravel or A-1-b.
Moisture-density tests were performed following the Standard and Modified Proctor test methods. The Standard maximum dry unit weight was about 21.4 kN/m3 with optimum moisture content at approximately 8.0 percent. The Modified maximum dry unit weight was about 21.8 kN/m3 with optimum moisture content at approximately 5.4 percent. The minimum and maximum dry unit weights from relative density testing (ASTM D 4253-00) were approximately 14.4 and 19.8 kN/m3, respectively, for oven dry soil.
The underlying subgrade soil – a glacial till material – classifies as CL sandy lean clay with moderate plasticity.
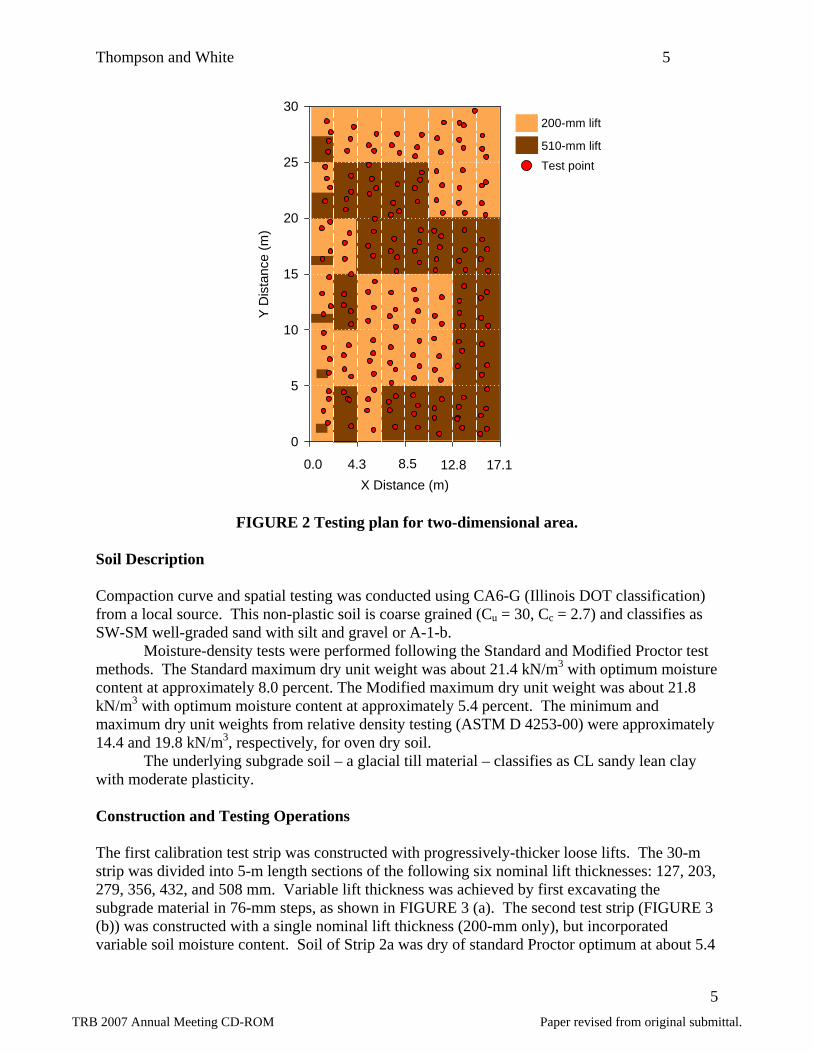
Construction and Testing Operations The first calibration test strip was constructed with progressively-thicker loose lifts. The 30-m strip was divided into 5-m length sections of the following six nominal lift thicknesses: 127, 203, 279, 356, 432, and 508 mm. Variable lift thickness was achieved by first excavating the subgrade material in 76-mm steps, as shown in FIGURE 3 (a). The second test strip (FIGURE 3 (b)) was constructed with a single nominal lift thickness (200-mm only), but incorporated variable soil moisture content. Soil of Strip 2a was dry of standard Proctor optimum at about 5.4
TRB 2007 Annual Meeting CD-ROM Paper revised from original submittal.

Thompson and White 6
6
percent moisture by weight, Strip 2b was moisture conditioned close to optimum moisture content (8.2 percent), and Strip 2c was wet of optimum at about 12.0 percent. For each test strip, spot testing followed 1, 2, 4, 8, and 12 roller passes.
Construction of the spatial test area began by excavating select areas of the existing subgrade material to a depth of 310 mm. The excavated plan area is shown in FIGURE 3 (c). The subgrade material was comparatively stiff at the soil surface, but decreased in stiffness with depth. After excavating the areas of thicker lift, base material (CA6-G) was placed to 200 mm above the original grade to give either 200-mm or 510-mm loose lift. Prior to compaction, several dynamic cone penetration tests were performed to ensure low strength through the entire vertical profile of loose fill.
After construction of the test area, the base material was compacted using the CS-533 vibratory smooth drum roller. The roller was operated at the “high” amplitude (about 1.70 mm) setting, and the frequency of drum vibration was constant at about 32 Hz. Compaction of the test area is shown in FIGURE 3 (d). For this project, the roller did not overlap its path, but rather traveled in designated “lanes”. Near-continuous measurements of CMV and machine power were made approximately every 0.2 m along the length (in the y-direction) of the test area. GPS coordinates were collected with compaction monitoring measurements, such that results were mapped and viewed in real time during compaction operations.
Soil testing was performed over the two-dimensional area following only the second roller pass to obtain the soil density, moisture content, DCP index, CIV, and EPFWD at a total of 192 test locations with the exact spatial location of these test points obtained using a mapping-grade DGPS rover working off the same base station as the roller GPS system.
TRB 2007 Annual Meeting CD-ROM Paper revised from original submittal.
Thompson and White 7
7
(a) (b)
(c) (d)
FIGURE 3 Construction and testing processes: (a) constructed test strip, (b) test Strip 1
excavations for variable lift thickness, (c) excavations for 510-mm lifts in spatial area, (d) compaction of spatial area.
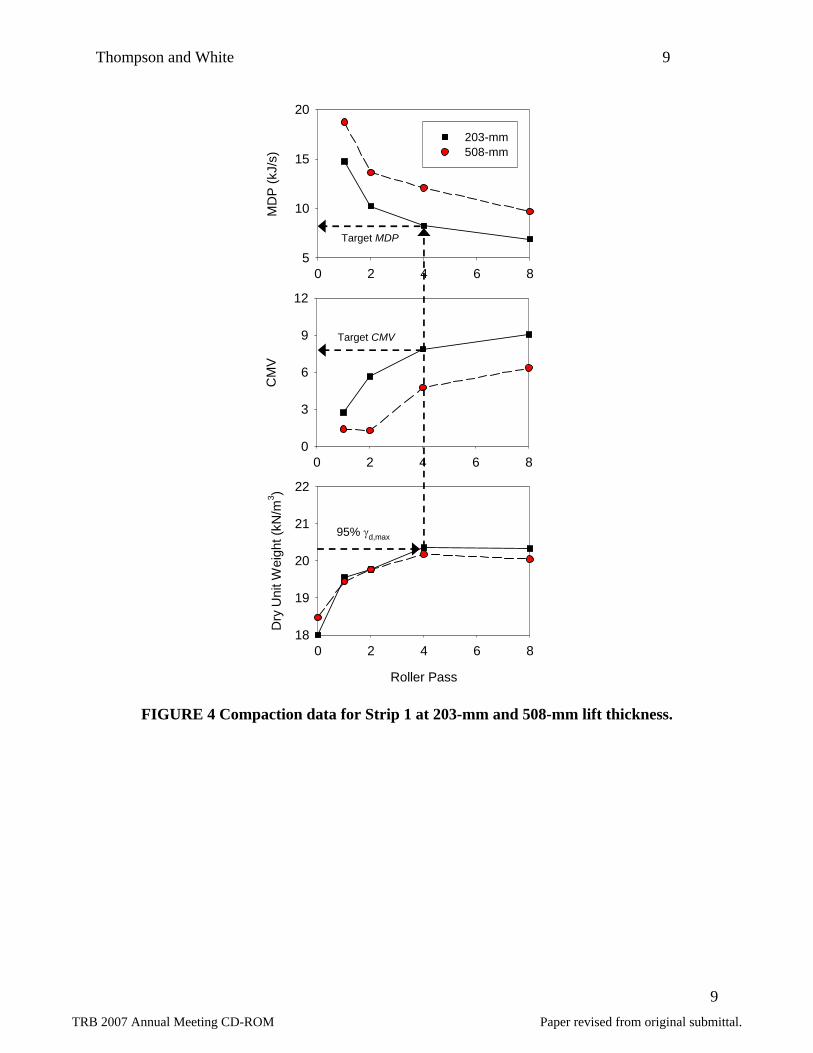
CALIBRATION OF MACHINE POWER AND CMV USING REGRESSION ANALYSIS Calibration of CMV and MDP was accomplished using Strips 1 and 2 by correlating the collected roller data to the measured in-situ soil properties. Coefficients of variation (CV) for CMV, dry unit weight, DCP index, CIV, and EPFWD for similar soil types and construction operations have ranged from 19 to 36 percent, 2 to 4 percent, 10 to 28 percent, 9 to 24 percent, and 17 to 35 percent, respectively (15, 16). MDP standard deviation values have ranged from 2.66 to 4.55 kJ/s (15, 16). Thus, considering the variability associated with the two compaction monitoring technology measurements, as well as the measurement variability of each in-situ spot measurement, data were averaged along the length of the test strips to produce a single data point for each roller pass. Preliminary target compaction monitoring values were selected from the 203-mm lift thickness section of Strip 1. The compaction curves are shown in FIGURE 4 for MDP, CMV, and dry density. The compaction curves for the 508-mm lift thickness section are additionally provided to show the influence of this parameter on machine response, which is to increase MDP and decrease CMV. At 95 percent of the maximum dry unit weight (based on standard Proctor compaction energy), observed after four roller passes, the average MDP equaled 8.3 kJ/s and the
TRB 2007 Annual Meeting CD-ROM Paper revised from original submittal.

Thompson and White 8
8
average CMV equaled 8.0. This relatively simple method for determining quality criteria, while not providing a unified correlation that accounts for all variables affecting machine response, also does not require detailed statistical analyses.
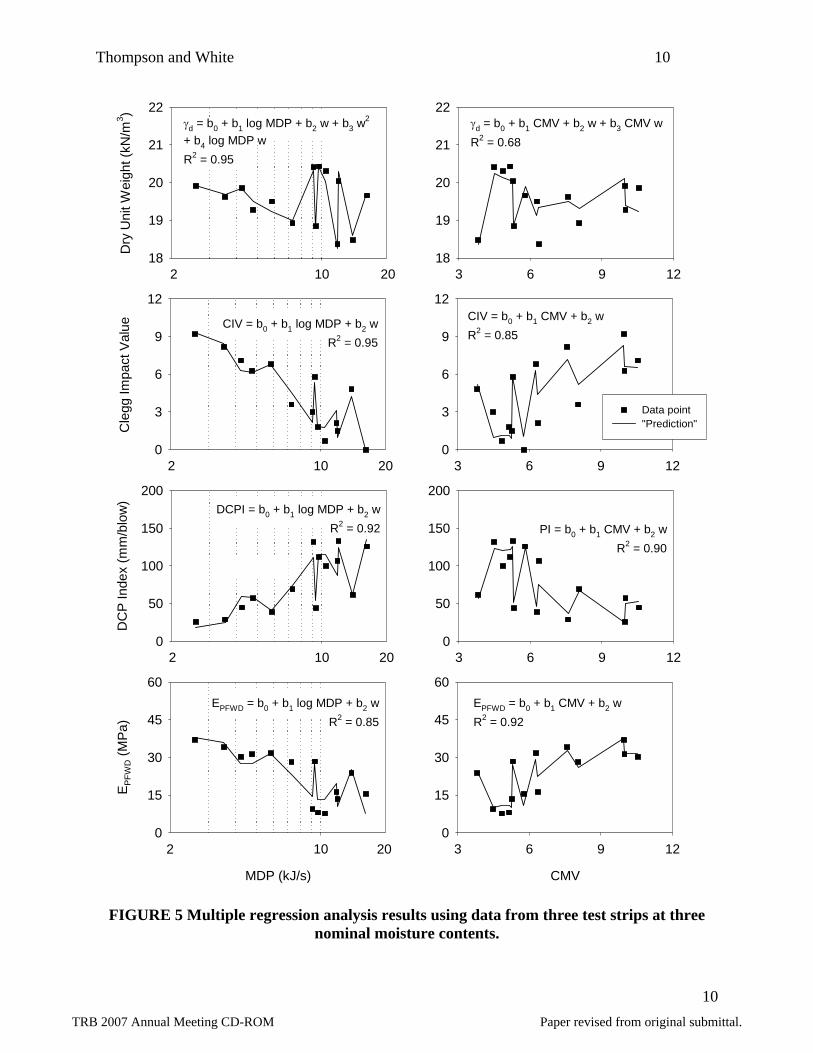
Since the second test strip (2a, 2b, and 2c) was tested following 1, 2, 4, 8, and 12 roller passes; five data points were obtained per test strip to provide a total of 15 data points from which a correlation was developed to account for variable moisture content. The averaging and regression model development procedure is described in (3). Multiple regression analysis results are presented in FIGURE 5 with MDP shown on a log scale and CMV shown on a linear scale. The data points are the average measured values; the solid lines are not functions for any one particular moisture content, but rather connect soil property predictions at average MDP and CMV values. For predicting DCP index, CIV, and EPFWD from compaction monitoring results, the addition of moisture content as a second regression parameter yielded correlation coefficients (R2) that ranged from 0.85 to 0.95 with both MDP and CMV providing reliable results. For predicting soil density, the compaction monitoring technologies differed in that the regression model using MDP yielded a higher correlation coefficient (0.92) than CMV (0.68).
TRB 2007 Annual Meeting CD-ROM Paper revised from original submittal.
Thompson and White 9
9
Roller Pass
0 2 4 6 8
Dry
Uni
t Wei
ght (
kN/m
3 )
18
19
20
21
22
0 2 4 6 8
CM
V
0
3
6
9
12
95% γd,max
0 2 4 6 8M
DP
(kJ/
s)5
10
15
20
203-mm508-mm
FIGURE 4 Compaction data for Strip 1 at 203-mm and 508-mm lift thickness.
Target MDP
Target CMV
TRB 2007 Annual Meeting CD-ROM Paper revised from original submittal.
Thompson and White 10
10
10
Cle
gg Im
pact
Val
ue
0
3
6
9
12
3 6 9 120
3
6
9
12
3 6 9 120
50
100
150
200
CMV
3 6 9 120
15
30
45
60
10
Dry
Uni
t Wei
ght (
kN/m
3 )
18
19
20
21
22
MDP (kJ/s)
10
E PFW
D (M
Pa)
0
15
30
45
60
Data point"Prediction"
10
DC
P In
dex
(mm
/blo
w)
0
50
100
150
200
CIV = b0 + b1 log MDP + b2 wR2 = 0.95
202
202
202
202
γd = b0 + b1 log MDP + b2 w + b3 w2
+ b4 log MDP wR2 = 0.95
3 6 9 1218
19
20
21
22
DCPI = b0 + b1 log MDP + b2 wR2 = 0.92
EPFWD = b0 + b1 log MDP + b2 wR2 = 0.85
γd = b0 + b1 CMV + b2 w + b3 CMV wR2 = 0.68
CIV = b0 + b1 CMV + b2 wR2 = 0.85
PI = b0 + b1 CMV + b2 wR2 = 0.90
EPFWD = b0 + b1 CMV + b2 wR2 = 0.92
FIGURE 5 Multiple regression analysis results using data from three test strips at three nominal moisture contents.
TRB 2007 Annual Meeting CD-ROM Paper revised from original submittal.

Thompson and White 11
11
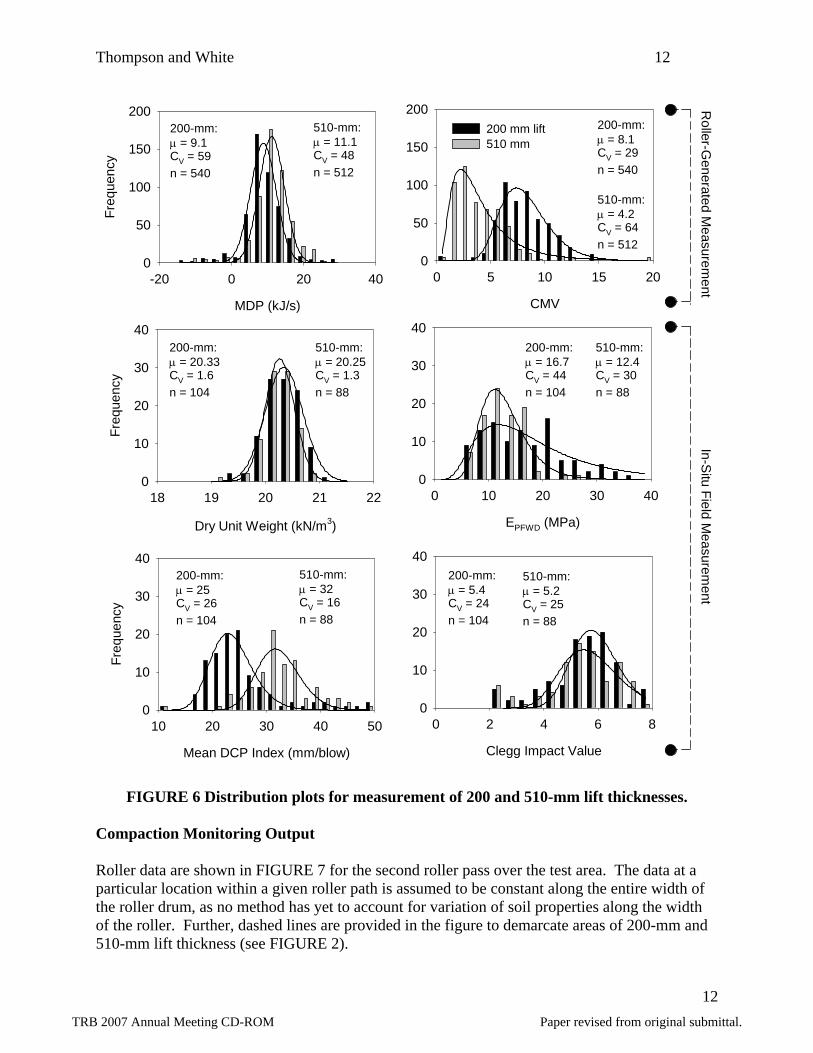
COMPACTION RESULTS FROM SPATIAL AREA Distribution of Soil Property Measurements The variation of soil property measurement results are shown with distribution plots in FIGURE 6. To provide some indication of whether after the second roller pass the compaction monitoring technologies and the in-situ spot tests consistently identified variable lift thickness, the distributions of test results are separated into results performed on a 200-mm or 510-mm lift. Mean values, CV (%), and number of tests (n) are additionally provided in FIGURE 6 for each measurement and for the two nominal lift thicknesses. CMV and full-depth DCP index clearly show the influence of variable lift thickness on the measurements, evidenced by two different distributions of data. MDP and the other compaction control test results, however, provide only a slight indication of a different soil condition. The ability of the measurements to identify regions of different lift thickness is controlled by the measurement influence depths of the measurement system. Future research should investigate similar data comparisons for multiple roller passes and lift thicknesses.
Dry density and moisture content were within a relatively narrow range for the spatial test area. Moisture content of the test area ranged from 7 to 9 percent. Dry density varied from about 19.2 to 21.1 kN/m3 (90 to 99 percent of the maximum dry unit weight). Soil modulus and strength measurements were generally more variable with EPFWD ranging from 6 to 30 MPa, mean DCP index ranging from 10 to 50 mm/blow, and CIV ranging from 2 to about 8.
TRB 2007 Annual Meeting CD-ROM Paper revised from original submittal.
Thompson and White 12
12
Clegg Impact Value
0 2 4 6 80
10
20
30
40
Mean DCP Index (mm/blow)
10 20 30 40 50
Freq
uenc
y
0
10
20
30
40
EPFWD (MPa)
0 10 20 30 400
10
20
30
40
Dry Unit Weight (kN/m3)
18 19 20 21 22
Freq
uenc
y
0
10
20
30
40
Roller-G
enerated Measurem
entIn-S
itu Field Measurem
ent
μ = 12.9σ = 0.5n = 10
CMV
0 5 10 15 200
50
100
150
200
MDP (kJ/s)
-20 0 20 40
Freq
uenc
y
0
50
100
150
200200 mm lift510 mm
200-mm:μ = 20.33CV = 1.6n = 104
510-mm:μ = 20.25CV = 1.3n = 88
200-mm:μ = 16.7CV = 44n = 104
510-mm:μ = 12.4CV = 30n = 88
200-mm:μ = 5.4CV = 24n = 104
510-mm:μ = 5.2CV = 25n = 88
200-mm:μ = 25CV = 26n = 104
510-mm:μ = 32CV = 16n = 88
200-mm:μ = 9.1CV = 59n = 540
510-mm:μ = 11.1CV = 48n = 512
200-mm:μ = 8.1CV = 29n = 540
510-mm:μ = 4.2CV = 64n = 512
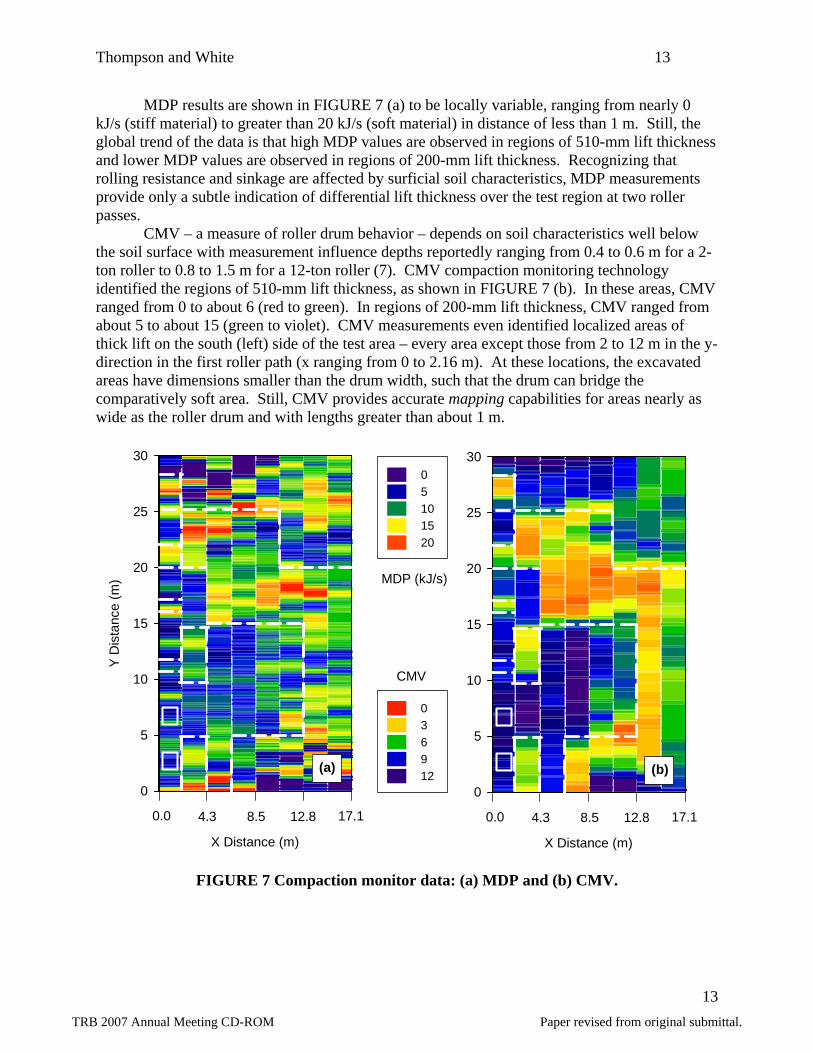
FIGURE 6 Distribution plots for measurement of 200 and 510-mm lift thicknesses. Compaction Monitoring Output Roller data are shown in FIGURE 7 for the second roller pass over the test area. The data at a particular location within a given roller path is assumed to be constant along the entire width of the roller drum, as no method has yet to account for variation of soil properties along the width of the roller. Further, dashed lines are provided in the figure to demarcate areas of 200-mm and 510-mm lift thickness (see FIGURE 2).
TRB 2007 Annual Meeting CD-ROM Paper revised from original submittal.
Thompson and White 13
13
MDP results are shown in FIGURE 7 (a) to be locally variable, ranging from nearly 0 kJ/s (stiff material) to greater than 20 kJ/s (soft material) in distance of less than 1 m. Still, the global trend of the data is that high MDP values are observed in regions of 510-mm lift thickness and lower MDP values are observed in regions of 200-mm lift thickness. Recognizing that rolling resistance and sinkage are affected by surficial soil characteristics, MDP measurements provide only a subtle indication of differential lift thickness over the test region at two roller passes.
CMV – a measure of roller drum behavior – depends on soil characteristics well below the soil surface with measurement influence depths reportedly ranging from 0.4 to 0.6 m for a 2-ton roller to 0.8 to 1.5 m for a 12-ton roller (7). CMV compaction monitoring technology identified the regions of 510-mm lift thickness, as shown in FIGURE 7 (b). In these areas, CMV ranged from 0 to about 6 (red to green). In regions of 200-mm lift thickness, CMV ranged from about 5 to about 15 (green to violet). CMV measurements even identified localized areas of thick lift on the south (left) side of the test area – every area except those from 2 to 12 m in the y-direction in the first roller path (x ranging from 0 to 2.16 m). At these locations, the excavated areas have dimensions smaller than the drum width, such that the drum can bridge the comparatively soft area. Still, CMV provides accurate mapping capabilities for areas nearly as wide as the roller drum and with lengths greater than about 1 m.
0
5
10
15
20
25
30
0 3 6 9 12
0.0 4.3 8.5 12.8 17.1
X Distance (m)
CMV
Y D
ista
nce
(m)
0
5
10
15
20
25
300 5 10 15 20
0.0 4.3 8.5 12.8 17.1
X Distance (m)
MDP (kJ/s)
(b)(a)
FIGURE 7 Compaction monitor data: (a) MDP and (b) CMV.
TRB 2007 Annual Meeting CD-ROM Paper revised from original submittal.
Thompson and White 14
14
Spatial Analysis of Field Measurement Results The semivariogram remains as a standard method to quantify spatial structure of soil properties (17). Spatial variability of each soil measurement was thus described by an experimental variogram derived from measurements taken on the spatial test area. The semivariograms did not fluctuate around a constant value, indicating that field measurements were correlated at the scale of the sampling plan. The ability to observe spatial structure of the data is the principal prerequisite for performing reliable geostatistical analyses; many gridding methods requiring only that a continuous function (or model) be used to express the semivariance as a function of lag distance. The semivariogram models that produced the cross-validation results of the highest accuracy were retained for further geostatistical analysis. Either exponential or spherical models were fitted to the experimental semivariograms for each soil measurement system of this project.
Kriging is an interpolation method of geostatistics that uses spatial dependence and spatial structure of a measured property to predict values of that property at unsampled locations (18). As the method was originally developed for the mining industry, kriging is particularly common in geosciences including geotechnical engineering. Further, kriging provides the least bias in predictions from all linear interpolation methods, because the interpolated or kriged values are computed from equations that minimize the variance of the estimated value. Kriging is an exact interpolation method, where the measured values will always be returned when interpolating to measurement locations. For this project, spatial data from 192 test points (see FIGURE 2) were analyzed using kriging operations and spatial modeling results. Single, nominal moisture content (optimum) was intended for the test area. The contour plot of moisture content (FIGURE 8) shows that, in fact, moisture content was within 1 percent of optimum moisture content (8 percent). Inherent variation in moisture content with strong spatial structure resulting from construction operations was present, however, and impacted measurements of soil stability. The soil moisture content approached 9 percent in the southeast (lower-left), center, and northwest (upper-right) regions of the test area. The moisture content was as low as 7 percent in the southern portion of the test area. Moisture variability on large-scale production areas is generally unavoidable. The moisture variation observed for this project, which was relatively uniform, clearly affect the compaction results as discussed later.
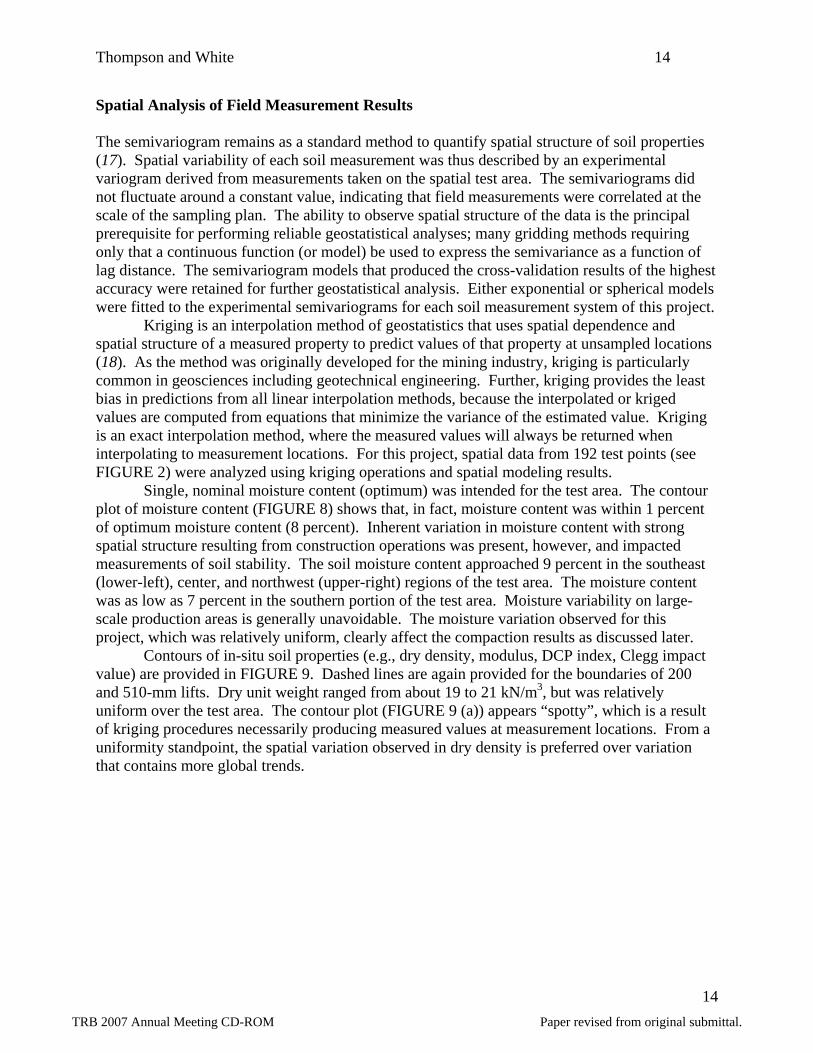
Contours of in-situ soil properties (e.g., dry density, modulus, DCP index, Clegg impact value) are provided in FIGURE 9. Dashed lines are again provided for the boundaries of 200 and 510-mm lifts. Dry unit weight ranged from about 19 to 21 kN/m3, but was relatively uniform over the test area. The contour plot (FIGURE 9 (a)) appears “spotty”, which is a result of kriging procedures necessarily producing measured values at measurement locations. From a uniformity standpoint, the spatial variation observed in dry density is preferred over variation that contains more global trends.
TRB 2007 Annual Meeting CD-ROM Paper revised from original submittal.

Thompson and White 15
15
7.0 7.5 8.0 8.5 9.0
X Distance (m)
Y D
ista
nce
(m)
0
5
10
15
20
25
30
4.3 8.5 12.8 17.10.0
MoistureContent (%)
FIGURE 8 Moisture content. Soil strength and modulus measurements have previously been documented to rapidly decrease with increasing moisture content (11). Soil modulus determined using a PFWD and soil strength determined using a 20-kg Clegg Impact Tester, in particular, show the influence of moisture content. The comparatively high moisture observed in the southeast, center, and northwest regions of the test area are mirrored by lower modulus (less than 8 MPa) and Clegg impact value (less than 4) results, as shown in FIGURES 9 (b) and (d). Mean DCP index results from full-penetration tests, presented in FIGURE 9 (c), are affected by both moisture content and lift thickness. DCP index over the western (upper) portion of the test area (y greater than 15 m) strongly reflects the observed moisture content with higher moisture content producing higher DCP index (lower strength). DCP index over the eastern (lower) portion of the test area (y from 0 to 15 m) reflects the artificially-imposed variation in lift thickness. In regions of 200-mm lift thickness, the DCP index begins to decrease at a depth of 200 mm – the depth of a stiff subgrade layer. In a similar trend, the regions of 510-mm lift thickness also show higher DCP index values for the full depth of the compaction layer. The DCP index contour very clearly identifies regions of variable lift thickness, as the measurement interpretation is essentially a measurement of lift thickness. Even localized regions of thick loose lifts (second roller path from 0 to 5 m and from 10 to 15 m) are identified.
TRB 2007 Annual Meeting CD-ROM Paper revised from original submittal.
Thompson and White 16
16
2 4 6 7 8
X Distance (m)
0
5
10
15
20
25
30
4.3 8.5 12.8 17.10.0
10 20 30 40 50
X Distance (m)
Y D
ista
nce
(m)
0
5
10
15
20
25
30
4.3 8.5 12.8 17.10.0
8 12 16 20 24
0
5
10
15
20
25
30
4.3 8.5 12.8 17.10.0
19.5 20.0 20.5 21.0
Y D
ista
nce
(m)
0
5
10
15
20
25
30
4.3 8.5 12.8 17.10.0
(a) (b)
(d)(c)
Dry Density(kN/m3)
Modulus(MPa)
DCP Index(mm/blow)
CleggImpact Value
FIGURE 9 Soil properties: (a) dry unit weight, (b) EPFWD, (c) DCP index, and (d) Clegg impact value (20 kg).
TRB 2007 Annual Meeting CD-ROM Paper revised from original submittal.
Thompson and White 17
17
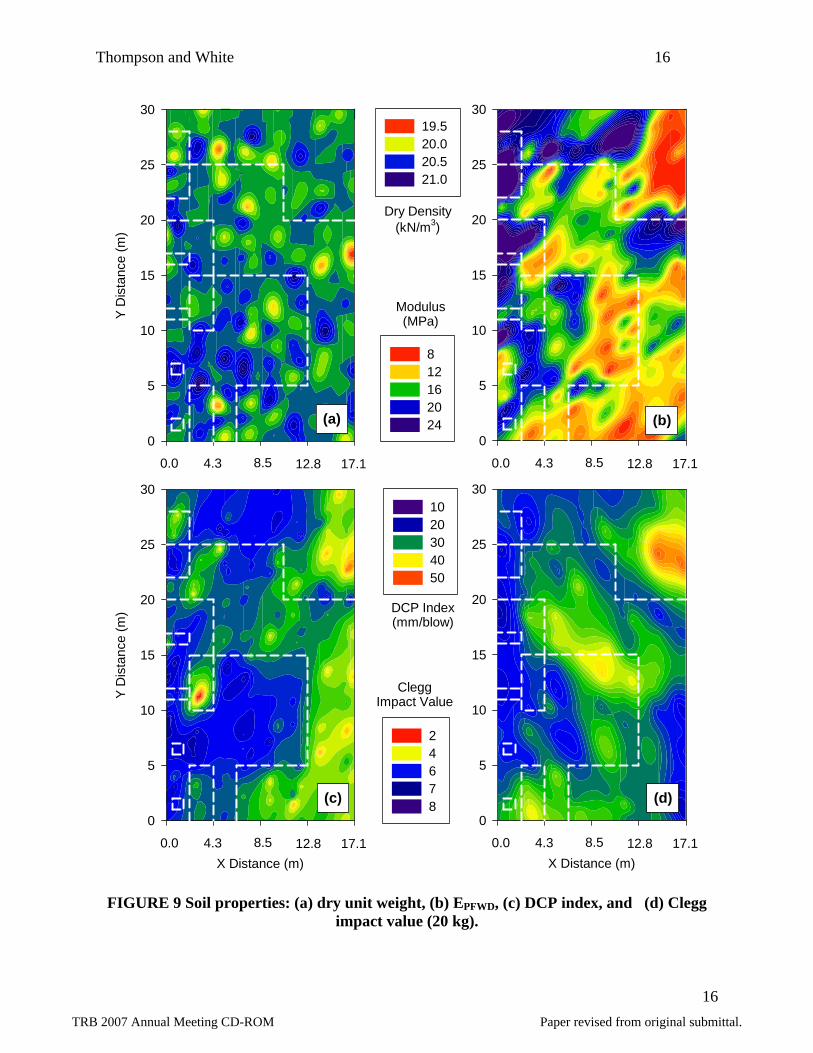
APPLYING COMPACTION MONITORING TECHNOLOGY TO EARTHWORK QUALITY ASSESSMENT Quality Assessment Using Compaction Monitoring Technology The capabilities of a roller in identifying the in-situ characteristics of unbound materials can be separated into three levels of compaction monitoring technology use (10). The most basic of these levels (Level 1) may be the mapping of an area to obtain some compaction value which relates to the density, strength, or stiffness of the area. This capability was demonstrated in FIGURE 7, where MDP and CMV measurements showed differential stiffness over a two-dimensional area. By specifying a target compaction value for a particular compaction monitoring technology, the next level of compaction monitoring technology use (Level 2) may be achieved. In this case, the areas that fail to meet the prescribed specification can easily be identified and differentiated from areas that do meet the quality criterion. Spatial plots that show pass/fail regions of the test area based on quality criteria from FIGURE 4 are provided in FIGURE 10 for MDP and CMV. This presentation of pass/fail regions of a spatial area demonstrates the use of compaction monitoring technology as a quality control and acceptance tool. In FIGURE 10 (a), the test area with MDP exceeding 8.3 kJ/s is shaded black to indicate a failing condition. This is done for CMV in FIGURE 10 (b) with 8.0 as the quality criterion. FIGURES 10 (a) and (b) coincidentally show failing soil conditions in many of the same regions, including those of 510-mm lift thickness. Recognizing that MDP is more locally variable and that this system is more sensitive to surficial characteristics, the failing regions of FIGURE 10 (a) appear to be more scattered. For the maps of FIGURE 10, only 35 and 30 percent of the test area achieved a passing condition according to MDP and CMV, respectively. 47 percent of the test area achieved 95 percent compaction, which was the quality criterion for which the technologies were calibrated. The ultimate use of compaction monitoring technology, which is to precisely convert roller-generated data to either soil density or modulus possibly for pavement design inputs, is described in the following section.
TRB 2007 Annual Meeting CD-ROM Paper revised from original submittal.

Thompson and White 18
18
0
5
10
15
20
25
30
Y D
ista
nce
(m)
0
5
10
15
20
25
30
FailPass
X Distance (m)
0.0 4.3 8.5 12.8 17.1
(a)
X Distance (m)
0.0 4.3 8.5 12.8 17.1
(b)
FIGURE 10 Pass/fail regions as assessed by: (a) machine power (>8.3 kJ/s), (b) CMV (<8.0).
Application of Findings to Technology Verification and Specification Development Evaluation of Pass/Fail Maps For evaluating the previously-described calibration procedure, the fraction of the test area that fails based on results from traditional testing techniques (e.g., density, modulus) can be compared to the fraction of the test area that fails based on compaction monitoring results. Ideally, compaction monitoring results would indicate the same failing regions as field measurements. By using the regression analysis results from strip testing (i.e. calibration of FIGURES 4 and 5), however, the same pass/fail regions could not be created for density, modulus, Clegg impact value, or DCP index. The inability to quantifiably link soil properties with roller measurements for the spatial area, despite achieving very high correlation for test strip results, is attributed to: (1) the different factors affecting compaction monitoring and in-situ compaction control measurements – factors of which many have already been identified, and (2) the relatively high variation observed for the compaction monitoring measurements. The limited measurement influence depths of in-situ compaction control tests resulted in the inability of these devices to differentiate between regions of variable lift thickness. Rather, variation in soil modulus and surface strength measurements resulted only from variable moisture content. Alternatively, the measurement influence depth for the roller was much
TRB 2007 Annual Meeting CD-ROM Paper revised from original submittal.
Thompson and White 19
19
deeper, particularly since the roller was operated at the “high” amplitude setting. For this reason, CMV accurately identified regions of 510-mm lift thickness. Characterizing measurement influence depths and the effect of underlying layers on machine response is an area of ongoing study.
Machine Calibration Design Considerations The empirical relationships between soil properties and compaction monitoring output are influenced by roller size, vibration amplitude and frequency, operating velocity, soil type, and stratigraphy underlying the compaction layer. Machine calibration procedures must therefore be conducted under the same conditions as may be expected during earthwork production. Considering the variation of construction operations and environmental conditions on a project site, however, calibration for every condition is likely not feasible. The implications of this reality are that current calibration procedures may need revision prior implementation in the United States. For example, the influence of stiffness of underlying layers (and how it varies) must be addressed. Instead of 30-m or 60-m control strips, 300-m strips or calibration areas may be used in an attempt to incorporate more variation into the calibration operation – a measure which would likely reduce correlation precision, but increase the robustness and statistical validity of the calibration.
For now, as compaction monitoring technologies continue to be implemented, the technologies must simply be used with special consideration for what the results may actually be measuring and indicating about the soil.
SUMMARY The ability of two compaction monitoring technologies to identify soil properties over a spatial test area was investigated with particular emphasis on demonstrating how the technology may implemented as a quality control/acceptance tool. The following statements summarize the study.
1. Testing conducted on test strips with multiple nominal moisture contents produced regression equations that relate machine data to soil properties. The use of moisture content as a regression parameter yielded correlation coefficients ranging from 0.85 to 0.95 for predicting soil strength and modulus from either MDP or CMV.
2. A two-dimensional test area with variable lift thickness and moisture content was constructed and tested using both compaction monitoring technology and in-situ test devices. MDP, shown to be locally variable, provided some indication of differential lift thickness and variable moisture content. CMV identified the regions of thick compaction layer. In-situ tests for soil engineering properties showed only the influence of moisture content on soil stability.
3. Differences between the spatial distribution of CMV and MDP with that of in-situ test results was attributed to different measurement influence depths and measurement variation of compaction monitoring technology and compaction control tests.
4. Pass/fail maps were generated using machine parameters and calibration results to demonstrate the use of compaction monitoring technology as a quality control and acceptance tool.
TRB 2007 Annual Meeting CD-ROM Paper revised from original submittal.

Thompson and White 20
20
ACKNOWLEDGEMENTS Caterpillar, Inc. sponsored this study. Further, this material is based upon work supported under a National Science Foundation Graduate Research Fellowship. The authors are grateful for this sponsorship. The authors would like to thank Tom Congdon, Allen DeClerk, Don Hutchinson, and Paul Corcoran for their assistance with conducting field studies. The authors would also like to acknowledge Pavana Vennapusa, Heath Gieselman, Amy Heurung, and Mike Kruse at Iowa State University for helping with laboratory and field testing.
TRB 2007 Annual Meeting CD-ROM Paper revised from original submittal.
Thompson and White 21
21
REFERENCES 1. Wilkins, C. “Intelligent compaction creates smart way to achieve uniform highway sub-grade
design specifications.” MnDOT Newsline, http://www.newsline.dot.state.mn.us/articles.html#3. Accessed July 30, 2006.
2. White, D., Jaselskis, E., Schaefer, V., Cackler, E., Drew, I. and L. Li. Field Evaluation of
Compaction Monitoring Technology: Phase I. Final report, Project TR-495, Iowa Department of Transportation, 2004.
3. White, D., Thompson, M., Jovaag, K., Morris, M., Jaselskis, E., Schaefer, V., and E. Cackler.
Field Evaluation of Compaction Monitoring Technology: Phase II. Final report, Project TR-495, Iowa Department of Transportation, 2006.
4. White, D.J., Morris, M., and M. Thompson. Power-based compaction monitoring using
vibratory padfoot roller. Proceedings of GeoCongress 2006 – Geotechnical Engineering in the Information Technology Age, Atlanta, 2006.
5. Petersen, L. Continuous Compaction Control MnROAD Demonstration. Final report,
MN/RC – 2005-07, Minnesota Department of Tranpsortation, 2005. 6. White, D., and M. Thompson. Field Validation of Intelligent Compaction Monitoring
Technology for Unbound Materials and Hot Mix Asphalt. Interim project report, Mn/DOT Contract 82617, Minnesota Department of Transportation, 2006.
7. ISSMGE. Roller-Integrated Continuous Compaction Control (CCC), Technical Contractual
Provisions – Recommendations, International Society for Soil Mechanics and Geotechnical Engineering, 2005.
8. Sandstrom, A., and C. Pettersson. Intelligent systems for QA/QC in soil compaction. CD-
ROM. Transportation Research Board of the National Academies, Washington, D.C., 2004. 9. Thurner, H., and A. Sandstrom. Continuous compaction control, CCC. Compaction of
Granular Materials. Modeling and Properties of Compacted Materials, Paris, 2000. 10. White, D., Thompson, M., and P. Vennapusa. Evaluation of Intelligent Compaction Systems.
Final report, Caterpillar, Inc., 2006. 11. White, D., Jaselskis, E., Schaefer, V., and E. Cackler. Real-time compaction monitoring in
cohesive soils from machine response. Transportation Research Record: Journal of the Transportation Research Board, No. 1936, TRB, National Research Council, Washington, D.C., 2005, p. 173-180.
12. Komandi, G. An evaluation of the concept of rolling resistance. Journal of Terramechanics,
Vol. 36, 1999, p. 159-166.
TRB 2007 Annual Meeting CD-ROM Paper revised from original submittal.
Thompson and White 22
22
13. Muro, T., and J. O’Brien. Terramechanics. A.A. Balkema Publishers: Exton, PA, 2004. 14. Zorn. Light Drop Weight Tester ZFG 2000, Operating Manual, Stendal, Germany, 2003. 15. White, D., and M. Thompson. Predicting soil properties using intelligent compaction
technologies: I. CMV and MDP for cohesionless soils. Journal of Geotechnical and Geoenvironmental Engineering, ASCE, submitted 10/4/06 for review.
16. Thompson, M., and D. White. Predicting soil properties using intelligent compaction
technologies: II. MDP for cohesive soils. Journal of Geotechnical and Geoenvironmental Engineering, ASCE, submitted 10/4/06 for review.
17. Pozdnyakova, L., Gimenez, D., and P. Oudemans. Spatial analysis of cranberry yield at three
scales. Agronomy Journal, Vol. 97, 2005, p. 49-57. 18. Warrick, A. Soil Physics Companion. CRC Press: New York, 2002.
TRB 2007 Annual Meeting CD-ROM Paper revised from original submittal.