ホーム - financial results presentation for the year ended march … · financial results...
TRANSCRIPT

1
Financial Results Presentation
for the Year
Ended March 31, 2015
May 15, 2015

2 Financial Results Presentation for the Year Ended March 31, 2015
Mar. 1981 Graduated from Tohoku University Faculty of Science
Apr. 1981 Joined Kanebo Foods, Ltd. (currently Kracie Foods, Ltd.)
Dec. 2005 Joined Nitta Gelatin Inc.
Mar. 2008 General Manager, R&D Department, Sales & Marketing
Division of the Company
June 2010 Executive Officer of the Company
June 2012 Director of the Company
Mar. 2013 General Manager, Sales & Marketing Division of the Company
Apr. 2015 Representative Director and President of the Company
New Representative Introduction
Koichi Ogata Representative Director and President
From Fukushima Prefecture, born on July 8, 1957

3 Financial Results Presentation for the Year Ended March 31, 2015
1. Business Overview
2. Results for Year Ended March 31, 2015
3. New Management Policy
4. Outlook for Year Ending March 31, 2016
5. Topics
Contents
<Disclaimer>
The opinions, outlooks, forecasts and other forward looking statements contained herein are
based on Nitta Gelatin Inc.’s judgments as of when this presentation was compiled.
Accuracy of information contained in this presentation is by no means guaranteed. Please be
aware that the Company’s earnings going forward may vary materially from the content of this
presentation depending on various variables including the market environment.

4 Financial Results Presentation for the Year Ended March 31, 2015
1. Business Overview

5 Financial Results Presentation for the Year Ended March 31, 2015
Name Nitta Gelatin Inc.
Representative Koichi Ogata, Representative Director and President
Head Office 4-4-26, Sakuragawa, Naniwa-ku, Osaka, Japan
Establishment January 1918
Stock Listing First Section of the Tokyo Stock Exchange (Stock code: 4977)
Capital ¥3,144 million
Consolidated Net Sales ¥31.9 billion (Year ended March 31, 2015)
Consolidated Employees 595 (As of March 31, 2015)
1 Company Overview
Company Overview

6 Financial Results Presentation for the Year Ended March 31, 2015
Business Segment Division Product Application
Collagen
Material
Gelatin
For food Gummy candy, marshmallow and other
confectionery, food products, convenience store
delicatessen items, frozen foods, etc.
For capsules Hard and soft capsules, mini-capsules, etc.
For photography Color film, X-ray film, photographic paper, etc.
Peptide Collagen peptide Dietary food supplements, health supplements,
functional nutrient foods, etc.
Casing Collagen casing Sausages, frankfurters, snack sausages, salamis, etc.
Life Science Collagen, gelatin Testing reagents for laboratory research, synthetic
tissue, synthetic bones, DDS, cell transplants, etc.
Formula
Solution
Food
Materials Gelling agents, Stabilizers and quality enhancers
Dessert jellies, delicatessen items, meat products,
etc.
Adhesives
Sealants (High-performance gaskets)
Smartphones, mobile phones, tablets, digital
cameras, etc.
Hot-melt adhesives Packaging, bookbinding, construction material,
hygiene products, etc.
Animal glues Bookbinding, paper packs, paper crafts, etc.
1
Business Segments, Divisions and Main Products
Company Overview

7 Financial Results Presentation for the Year Ended March 31, 2015
2. Results for Year Ended
March 31, 2015

8 Financial Results Presentation for the Year Ended March 31, 2015
2 Results for Year Ended March 31, 2015
32,814
31,914
25,000
27,500
30,000
32,500
35,000
2014/3 2015/3
(899)
(2.7%)
Temporary decrease in
demand in NA
Fall in demand following
rush demand before
consumption tax hike
Lower demand due to
unseasonable weather
Business Performance (1) : Net Sales
(¥ million)
Net Sales : ¥31,914 million
Change : ¥(899) million
% Change: (2.7 %)

9 Financial Results Presentation for the Year Ended March 31, 2015
2 Results for Year Ended March 31, 2015
955
392
0
250
500
750
1,000
2014/3 2015/3
(562)
(58.9 %)
Rise in raw material price
Higher energy costs
Weak yen
Drop in sales
Business Performance (2) : Operating Income
Operating Income : ¥392 million
Change : ¥(562) million
% Change : (58.9 %)
(¥ million)

10 Financial Results Presentation for the Year Ended March 31, 2015
Negative impact (1)
Rise in overseas raw materials prices
2 Results for Year Ended March 31, 2015
200
300
400
500
600
4Q
1Q
2Q
3Q
4Q
1Q
2Q
3Q
4Q
1Q
2Q
3Q
4Q
1Q
2Q
3Q
4Q
Changes in Meat and Bone Meal Price (US$/metric ton)
Source: Brian Gould, Agricultural and Applied Economics
Data aggregated by Nitta Gelatin
2014/3 2015/3 2013/3 2012/3 2011/3

11 Financial Results Presentation for the Year Ended March 31, 2015
Negative impact (2)
Rise in energy costs in Japan
2 Results for Year Ended March 31, 2015
80
100
120
140
160
180
1Q 2Q 3Q 4Q 1Q 2Q 3Q 4Q 1Q 2Q 3Q 4Q 1Q 2Q 3Q 4Q
Electricity
Gas
Changes in Electricity & Gas unit price of the Company
2015/3 2012/3 2013/3 2014/3
(%)

12 Financial Results Presentation for the Year Ended March 31, 2015
Negative impact (3)
Rise in import costs due to the weak yen
2 Results for Year Ended March 31, 2015
Foreign exchange chart (TTM rate) (yen/US$)
70
80
90
100
110
120
10
/01
04
07
10
11
/01
04
07
10
12
/01
04
07
10
13
/01
04
07
10
14
/01
04
07
10
15
/01

13 Financial Results Presentation for the Year Ended March 31, 2015
2 Results for Year Ended March 31, 2015
1,115
967
0
250
500
750
1,000
1,250
2014/3 2015/3
(147)
(13.2 %)
Increase in foreign
exchange gains
Business Performance (3) : Ordinary Income
Ordinary Income : ¥967 million
Change : ¥(147) million
% Change : (13.2 %)
(¥ million)

14 Financial Results Presentation for the Year Ended March 31, 2015
2 Results for Year Ended March 31, 2015
665
610
0
250
500
750
2014/3 2015/3
(55)
(8.3 %)
Business Performance (4) : Net Income
Net Income : ¥610 million
Change : ¥(55) million
% Change : (8.3 %)
(¥ million)

15 Financial Results Presentation for the Year Ended March 31, 2015
22,436
22,959
1,420
1,101
500
1,000
1,500
17,500
20,000
22,500
2014/3 2015/3
Sales (Left)
Segment Profit (Right)
2 Results for Year Ended March 31, 2015
Sales : ¥22,959 million
Change : ¥522 million
% Change: 2.3 %
Segment profit : ¥1,101 million
Change : ¥(318) million
% Change : (22.4 %)
Collagen Material Business
(¥ million) (¥ million)

16 Financial Results Presentation for the Year Ended March 31, 2015
10,377
8,955 920
647
0
500
1,000
5,000
7,500
10,000
2014/3 2015/3
Sales (Left)
Segment Profit (Right)
2 Results for Year Ended March 31, 2015
Formula Solution Business
Sales : ¥8,955 million
Change : ¥(1,421) million
% Change: (13.7 %)
Segment profit : ¥647 million
Change : ¥(272) million
% Change : (29.6 %)
(¥ million) (¥ million)

17 Financial Results Presentation for the Year Ended March 31, 2015
Overseas
40%
Japan
60%
2 Results for Year Ended March 31, 2015
Overseas
42% Japan
58%
Fiscal year ended March
2014 ¥32.8 billion
Fiscal year ended March
2015 ¥31.9 billion
Overseas Sales Ratio

18 Financial Results Presentation for the Year Ended March 31, 2015
2014/3 2015/3 Change
Current assets 18,685 18,038 (646)
Cash and deposits 2,426 2,622 +196 Notes and accounts receivable-trade 8,164 6,726 (1,438)
Inventory 7,642 8,221 579
Other 452 467 15
Noncurrent assets 12,704 15,893 3,188 Property, plant and equipment 8,804 10,848 2,044
Intangible assets 50 69 18 Investments and other assets 3,849 4,974 1,125
Total assets 31,389 33,932 2,542
2014/3 2015/3 Change
Current liabilities 10,080 10,274 194 Notes and accounts payable-trade 4,255 3,768 (486) Short-term loans & current portion of long-term debt 3,054 3,832 778
Other 2,770 2,673 (97)
Noncurrent liabilities 7,528 8,283 755
Long-term loans payable 4,415 4,867 451 Provision for retirement benefits 2,561 2,700 138
Other 550 715 164
Total liabilities 17,608 18,558 949
Shareholders' equity 14,734 15,423 688 Accumulated other comprehensive income (1,097) (152) 945
Minority interests 144 102 (41)
Total net assets 13,781 15,373 1,592
Total liabilities and net assets 31,389 33,932 2,542
Fixed assets increased due to the acquisition of
tangible fixed assets
Net assets increased due to an increase in
comprehensive income and shareholders' equity
2 Balance Sheets (B/S)
(¥ million)
(¥ million)
Results for Year Ended March 31, 2015

19
2014/3 2015/3
Net cash from operating activities (692) 2,074
Net cash from investing activities (3,105) (2,505)
Net cash from financing activities 3,875 544
Increase in cash and cash equivalents 147 196
End balance of cash and cash equivalents 2,406 2,602
Operating CF : Proceeds from assignment of accounts receivable
Investing CF : Net cash used in plant investments
Financing CF : Proceeds from bank loans (Last year: Proceeds from public
offering)
2
Consolidated Statements of Cash Flows (C/F)
(¥ million)
Results for Year Ended March 31, 2015

20 Financial Results Presentation for the Year Ended March 31, 2015
3. New Management Policy

21 Financial Results Presentation for the Year Ended March 31, 2015
32.7
billion
38.6
billion
32.8
billion 31.9
billion
0
15
30
45
2014/3 2015/3
Medium-Term Management PlanActual Results
3 New Management Policy
1.70
billion
2.74
billion
0.96
billion
0.39
billion
0
1
2
3
2014/3 2015/3
Medium-Term Management PlanActual Results
Net Sales Operating Income (¥ billion) (¥ billion)

22 Financial Results Presentation for the Year Ended March 31, 2015
3
Capital Investment
Shirring facilities of the casing plant in China completed in July 2013
Productivity improvement demonstration facility of the US casing
plant completed in May 2014
US collagen peptide plant completed in May 2014
Gelling agent manufacturing plant in Vietnam completed in Aug. 2014
AIC(Adhesive Innovation Center) in Japan completed in Aug. 2014
2014/3 2015/3 Total
Forecast 3,800 5,400 9,200
Results 2,949 2,449 5,398
Change (851) (2,951) (3,802)
New Management Policy
(¥ million)

23 Financial Results Presentation for the Year Ended March 31, 2015
Strategic Objectives
(1) Develop high value-added products
(2) Ensure optimal production, optimal sales
(3) Strengthen global business foundation
New Corporate Slogan
“Progress with a New Perspective”
Basic Strategy
“Pursue the Highest Quality”
3 New Management Policy

24 Financial Results Presentation for the Year Ended March 31, 2015
4. Outlook for Year Ending
March 31, 2016
25
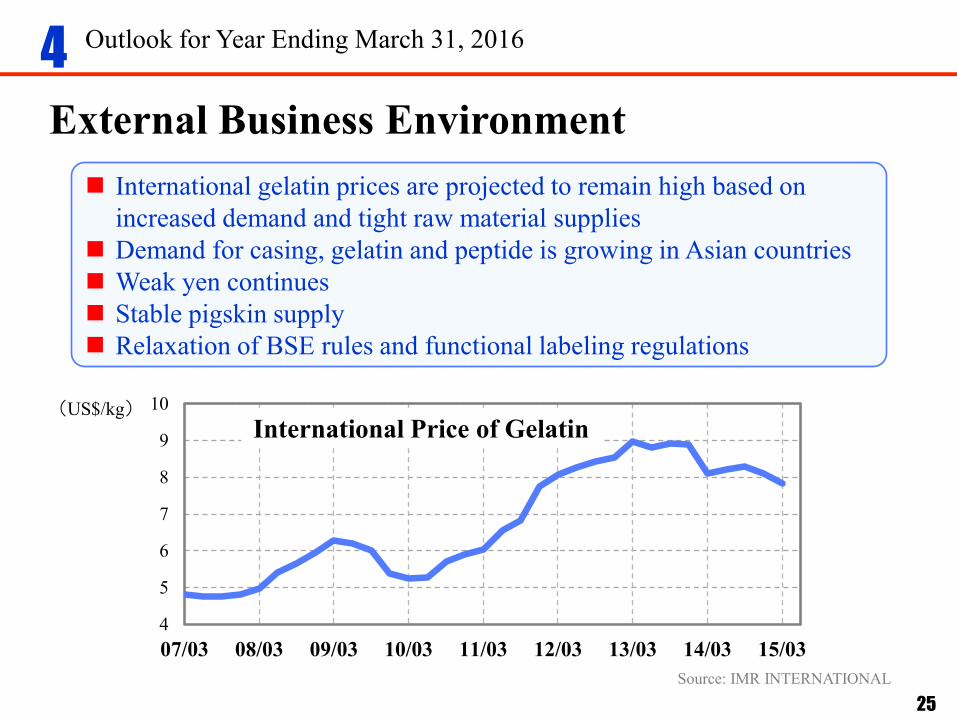
External Business Environment
(US$/kg)
Source: IMR INTERNATIONAL
International gelatin prices are projected to remain high based on
increased demand and tight raw material supplies
Demand for casing, gelatin and peptide is growing in Asian countries
Weak yen continues
Stable pigskin supply
Relaxation of BSE rules and functional labeling regulations
4
5
6
7
8
9
10
07/03 08/03 09/03 10/03 11/03 12/03 13/03 14/03 15/03
4
International Price of Gelatin
Outlook for Year Ending March 31, 2016

26 Financial Results Presentation for the Year Ended March 31, 2015
Business Strategy Action Plan
Gelatin Optimal production
Optimal sales
• Local production for local sales
• Develop new raw material source
Peptide Establish “Wellnex” as
the top brand
• Develop functional peptide
• Create new markets in Asia
Collagen
Casing
Increase production capacity
and enhance quality • Develop high value-added casings
Food
Materials
Create new value by
developing new products
and applications
• Expand business with general food
manufacturing companies
• Expand business in growing markets
Adhesives Structural reform for re-
growth of the business
• Expand sealant material (G-zain)
business
• Expand application range of hot-
melt adhesives
Business Strategy
4 Outlook for Year Ending March 31, 2016

27
Forecasts for Year Ending March 31, 2016
2015/3 (Result)
2016/3 (Forecast) Change
Net Sales 31,914 38,100 19.4%
Operating
Income
392 1,400 256.6%
Margin 1.2% 3.7% -
Ordinary
Income
967 1,100 13.7%
Margin 3.0% 2.9% -
Net Income 610 200 (67.2%)
Margin 1.9% 0.5% -
(¥ million)
Outlook for Year Ending March 31, 2016 4

28
Sales Forecasts by Segment
Net Sales Segment Profit
2015/3 (Result)
2016/3 (Forecast)
Change 2015/3 (Result)
2016/3 (Forecast)
Change
Collagen Material business 22,959 28,700 25.0% 1,101 2,000 81.6%
Formula Solution business 8,955 9,400 5.0% 647 800 23.6%
( Elimination or
corporate expenses) - - - (1,356) (1,400) -
Total 31,914 38,100 19.4% 392 1,400 256.6%
(¥ million)
Outlook for Year Ending March 31, 2016 4

29 Financial Results Presentation for the Year Ended March 31, 2015
4
Conversion of Indian Affiliate Companies
into Consolidated Subsidiaries
Nitta Gelatin India Ltd.
Bamni Proteins Ltd.
Reva Proteins Ltd.
●
●
●
New Delhi
●
Nitta Gelatin India Ltd.
Manufacture and sales of gelatin,
collagen peptide and gelatin raw
material
Bamni Proteins Ltd.
Manufacture of gelatin raw material
Reva Proteins Ltd.
Manufacture of gelatin raw material
Outlook for Year Ending March 31, 2016
on April 1, 2015 (effective acquisition date)

30 Financial Results Presentation for the Year Ended March 31, 2015
Extraordinary loss associated with
the conversion of Indian affiliated companies
into consolidated subsidiaries
4
Difference between the carrying amount
and the fair value
Extraordinary Loss : ¥(620) million
Outlook for Year Ending March 31, 2016

31
Investment Plan 2014/3 (Result)
2015/3 (Result)
2016/3 (Forecast)
Capital investment 2,949 2,449 2,500
Depreciation 914 1,115 1,750
(¥ million)
2016/3 Main Capital Investments
4 Outlook for Year Ending March 31, 2016
India: Facilities for quality improvement and
stable production
NA: Facilities for productivity improvement
Japan: Facilities for productivity improvement

32 Financial Results Presentation for the Year Ended March 31, 2015
Individuals
97.0%
Individuals
97.2%
2014/3 2015/3
Securities
companies
0.5%
Securities
companies
1.5%
Foreign
investors
1.7%
Foreign
investors
4.0%
Financial
institutions
29.8%
Financial
institutions
21.9%
Domestic
companies
33.3% Domestic
companies
32.8%
Individuals
34.7% Individuals
39.8%
2014/3 2015/3
4
Share Distribution
Number of Shares Issued Number of Shareholders
18,373 thousand shares 5,781
+1,179
6,960
Outlook for Year Ending March 31, 2016

33
4
<Dividend Forecast>
<Shareholder Benefit Program>
Year ended March 31, 2015 : ¥6 per share year-end dividend
Year ending March 31, 2016 : ¥12 per share annual dividend
( ¥6 interim dividend )
( ¥6 year-end dividend )
Plans call for continuing the program
Shareholder Returns
Benefit details
100 to less than 500 shares :
¥1,000 shopping certificate for Nitta Gelatin products
500 or more shares : Nitta Gelatin products worth ¥3,000, such as health foods
Outlook for Year Ending March 31, 2016

34 Financial Results Presentation for the Year Ended March 31, 2015
5. Topics

35 Financial Results Presentation for the Year Ended March 31, 2015
Relaxation of BSE regulations
US raw materials will be allowed in use for
edible gelatin
Relaxation of functional labeling regulations
Activation of health food market will lead to
the expansion of collagen peptide sales
5 Topics

36 Financial Results Presentation for the Year Ended March 31, 2015
The 20th International Food Ingredients
& Additives Exhibition and Conference
5
Planning
to Exhibit
Tokyo Big Sight May 20-22, 2015 (Tokyo International Exhibition Center)
We develop products with
customers taking advantage
of our strength in application
and proposals.
Nitta Gelatin’s booth at ifia JAPAN 2013
Topics

37
Thank you for your attention.
