fertilizer management of forage crops in the...
TRANSCRIPT

1
Fertilizer Management of Forage Crops
in the Canadian Great Plains
S. S. Malhi
Agriculture and Agri-Food Canada Research Farm, Highway 6 South
P.O. Box 1240 Melfort, Saskatchewan S0E 1A0
Phone: 306-752-2776 Ext.230 Fax: 306-752-4911
E-mail: [email protected]
D. H. McCartney Agriculture and Agri-Food Canada
Research Centre 6000 C & E Trail
Lacombe, Alberta T5L 1W4
2
CONTENTS Page
Executive Summary…………………………… 3
Introduction…………………………………… 5
Nutrient Requirement and Removal…………… 6
Effects of N Fertilizer on Forages……………… 8
Effect of P Fertilizer on Forages……………… 13
Effect of K Fertilizer on Forages………………. 14
Effect of S Fertilizer on Forages………………… 14
Micronutrients and Forages…………………… 15
Livestock Manure on Perennial Grassland……… 15
Pasture versus Hay Forage Response to Fertilizer 15
Fertilizer as Rejuvenation Techniques…………… 16
Effects of Fertilization of Peat Soils…………… 17
Fertilizer Effects on Soil Properties……………… 17
Greenhouse Gas Emissions from Grasslands… 19
Conclusions ……………………………………… 20
Recommendations……………………………… 21
References……………………………………… 21
Tables…………………………………………… 28

3
Fertilizer Management of Forage Crops in the Canadian Great Plains
S. S. Malhi, Agriculture and Agri-Food Canada, Research Farm, Melfort, Saskatchewan S0E 1A0
D. H. McCartney, Agriculture and Agri-Food Canada, Research Centre, Lacombe, Alberta Forages are the cheapest source of feed for cattle and play an important role in livestock
production in western Canada. Forages are generally grown on low fertility soils and their production can be increased markedly with fertilization. The effectiveness of fertilizers on forages in increasing dry matter yield and economic returns is dependent upon the levels of nutrients in soil, climatic conditions, soil type and forage type.
Grass forages respond very well to N fertilizer on most soils in western Canada and dry matter yield increases from N application are much greater in moist areas than dry areas. Protein content in grass forage can be improved with N application, but the risk of residual N accumulation and downward movement of nitrate-N in soil, and the presence of potentially toxic levels of nitrate-N in the forage increases when N is applied in excess of crop requirements. A large initial one-time application of N produces less sustained production of forage than the equivalent amount of N applied annually over a period of several years. Splitting annual application into two or three increments may not necessarily increase dry matter yield, but tends to distribute forage production over a longer portion of the growing season. Early spring broadcast application of N usually results in higher dry matter yield than autumn or late spring applications. Urea is usually less effective in increasing dry matter yield than ammonium nitrate, but its efficiency can be improved markedly by banding it below the soil surface (i.e., providing the banding operation does not cause any serious damage to grass stand and fertilizer is completely covered with soil).
Seeding high levels of alfalfa in mixed stands with bromegrass can generate savings in N fertilizer costs (for pure bromegrass stands) equivalent to about 100 kg N ha-1 or more, increase net returns and energy performance, without any detrimental effect on forage yield and quality. Forage yield increase and economic returns from N fertilization of grass-legume mixtures are influenced by the percentage of legume in the mixed stands and initial nitrate-N in soil. Addition of N fertilizer to mixed stands reduces the proportion of legume in the stand.
The magnitude of dry matter yield increase from P fertilizer is associated with the level of extractable P in soil. Pure grass stands often respond less to application of P fertilizer than pure legume stands. On P-deficient soils, P application to alfalfa increases dry matter yield, protein and P content in forage. The residual effect of single application of P fertilizer to forage stands can last for 5 to 10 years. The single initial P applications at 50 to 200 kg P ha-1 produced dry matter yield, protein yield, P-use efficiency, recovery of applied P and net economic returns similar to annual P applications for 5 years at 10 to 40 kg P ha-1. Legumes (especially alfalfa) have higher requirements for K than grasses. Potassium fertilization has been shown to increase dry matter yield, protein and K content in forage and reduce winterkill of alfalfa. However, it is not known whether the reduction in winterkill of alfalfa is due to K or Cl. There is no information available in western Canada on the relative efficiency of single initial versus annual K applications on perennial forages. As P and K do not move freely in the soil, placement of these nutrients below the soil surface is more important than in the case of mobile nutrients such as N and S.
Sulphur fertilization increases dry matter yield, protein and S content in forage on S-deficient soils. Elemental S fertilizers may cost less per unit of S than sulphate-S fertilizers, but they were found less effective in the first two or three years after annual applications. Most soils in the Canadian prairies are adequately supplied with micronutrients and deficiencies of micronutrients are rare for perennial forages.
The use of livestock manure in western Canada is increasing in response to a growing livestock industry. Injecting liquid manure improves efficiency of liquid swine manure over surface-applied manure.

4
Important differences exist in the fertility management of forages used for hay and for pasture. Increasing harvest frequency reduces cumulative dry matter yield and protein content in perennial forages. Nutrient redistribution is important to reduce N losses and environmental concerns in pastures. Rejuvenation of old forage stands using N fertilizer was more effective method to improve dry matter yield and forage quality than the mechanical methods. Aeration and other mechanical methods of rejuvenation showed little benefit, while sod seeding forages into unproductive stands is most effective when pasture growth is suppressed. In peat soils, maximum dry matter yield was obtained when N, P and K were all applied.
Long-term fertilizer applications have effects on soil properties and chemical composition of grass forage. The rate of acidification in soil increases with the use of N fertilizer. Soil acidification effects from applied N are generally limited to the surface 15 cm depth. Storage of organic C in soil increases with N fertilizer application and is affected by source of N, with AN providing larger increase than urea. On soils deficient in available S and N, storage of C increased only when both N and S were applied together. Organic N levels closely follow organic C level in soil.
In grazed grassland, emissions of nitrous oxide are affected by numbers of cattle per unit area, and distribution and concentration of dung and urine patches. On hayland, legumes produce more nitrous oxide than grasses. Main points to consider when fertilizing perennial forages are: soil test on a regular basis and apply fertilizers according to soil test recommendations, and whenever possible, band the fertilizers (particularly P, K and urea-N) into the soil for most efficient use of nutrients. Alternatively, rates of these fertilizers be increased to compensate for lower efficiency when surface-broadcasting or broadcasting followed by incorporation method is used.

5
INTRODUCTION Canada is one of the major beef exporting countries. Approximately three-fifths of the
Canadian beef cattle are in the three Prairie Provinces. Forages are the cheapest source of food for cattle and account for about 80% of the feed requirements of beef cattle. Forages also play a role in sustainable cropping systems, as healthy forage stands reduce wind and water erosion on land, and improve soil quality and fertility. Approximately 40% of the agricultural land in western Canada is dedicated to the production of perennial forages (Table 1). Furthermore, sales from domestic ruminant livestock generate over 40% of total on-farm income for prairie farmers. Table 1. Forage land area in Alberta, Saskatchewan and Manitoba Types of forages Hectares (1,000’s) Unimproved pasture 6,674 Improved pasture 1,742 Perennial hay and silage 1,723 Annual hay and silage 741 Seed 93 Total forage land 10,273 Total agricultural land 20,811 Source: Statistics Canada 1991 Census (numbers do not include Crown lands).
Despite the importance of forage crops for livestock production and the on-going
maintenance of the agricultural soil resource, forage crops are often managed poorly. A strong, productive forage stand that will last for several years is the desired objective of most producers. To maintain strong annual crop production, fertilizer nutrients must be applied regularly. However, surveys have shown that less than 25% of the improved pasture and hay land in Alberta receives fertilizer nutrient applications. Therefore, it would appear that there is considerable room for improvement in forage production with the effective use of fertilizer nutrients.
PURPOSE Forage crops, like most other agricultural crops grown in Alberta, respond well to the application
of fertilizer nutrients when soils are deficient in those nutrients. Research has shown that properly fertilized forage crops, grown under a wide range of climatic conditions, will produce higher yields of more nutritious forage than unfertilized crops will. Improved production of forage crops through better use of fertilizers requires a greater understanding of some basic interactions between soil, climate, and the forage crop.
The purpose of this publication is to summarize fertilizer management information for improved production and quality of forage on hay and pasture lands. Nutrient requirements and soil deficiencies are discussed for grasses, legumes, and grass-legume mixtures. Research information is summarized to demonstrate how fertilizers can be applied effectively to improve forage yield and quality. Different fertilizer materials, and times, rates and methods of fertilizer applications are discussed and evaluated. Some information is also given regarding soil acidity and liming, forage quality, and economics.

6
FORAGE NUTRIENTS
Nutrient Requirement and Removal Forages require 16 or more essential nutrient elements from soil for normal healthy
growth (nitrogen, phosphorus, potassium, sulphur, calcium, magnesium, copper. zinc, iron, manganese, boron, sodium, molybdenum, chloride, cobalt, vanadium and silicon). The amounts of these nutrients vary considerably among forage species. Nutrient requirements are quite different for forages compared to annual cereal grains.
In Alberta, one or more of the four main nutrients may be limiting for maximum forage production; N and P are the most commonly deficient nutrients, while K and S may also be deficient for certain crop and soil conditions. Deficiencies of other nutrients have seldom been identified in forage crops in Alberta, but more research is needed.
Large amounts of N, P, K and S are required for high forage yields (Table 2). When forages are harvested as hay or silage, these amounts of nutrients are removed from the field and these nutrients are not returned to the soil unless manure is reapplied to each field from which the forage was removed. This differs from cereal grain production where lesser amounts of nutrients are generally required and only the grain portion of the crop is removed from the field. Variations in crop nutrient requirements between forages and cereals are greatest for N and K. Requirements for these nutrients are higher for forages than for cereals and highest for legume forages.
Table 2. Plant nutrients used by three types of forage crops compared to barley grain (kg/ha) Crop Yield (t/ha) N P K S Grass hay 6.7 125 15 130 10 Legume hay 9.0 270 20 180 20 Cereal silage 6.7 120 13 100 10 Cereal grain (barley) 4.3 90 15 25 15
Source: Plant Nutrients Use by Crops. Compiled by Western Canada Fertilizer Association, October, 1978.
Without adequate fertilizer, three to five years of continuous forage production can deplete soil nutrient reserves and cause a soil nutrient deficiency more quickly than continuous annual grain production. The lack of tillage when perennial forages are grown also slows the rate of nutrient release from the soil. With the exception of N for legume forages, fertilizer nutrients required for forage production generally need to be applied at higher rates than for grain production. Fertilizer Nutrients and Climate
Nutrients contained in fertilizers are applied to make up the deficiency between the nutrients needed for optimum forage growth and the nutrients available from the soil. Although the soil can supply most of the nutrients needed for optimum growth, N and P are usually lacking. Forage yield is always reduced when soil nutrients are lacking.
Large amounts of N are needed by forage crops to produce maximum growth. As grass forage yields increase, greater amounts of N are required. The importance of N fertilizer for balancing N requirements is apparent when the amounts of N needed for increased forage yields are compared to N released from the soil (Figure 1). The N released from the soil is small in relation to the amount of N needed for maximum forage production. If the difference between plant needs and soil supply is recognized and balanced with fertilizer N, the maximum growth potential can be achieved.
As in the case of N, the needs of a forage crop for P, K and S must be balanced with fertilizers to meet maximum crop yield when the soil supply is deficient in these nutrients. Also,

7
when more than one nutrient is deficient in soil and only one is supplied by fertilization, crop yield will still be limited by the nutrient not provided. For example, if both N and S are deficient in the soil, adding only N or only S will not produce the full yield response that would result from the addition of both N and S.
Although N is required in large quantities by forages, only those crops with high percentage of grasses need N fertilizer. Legume forage crops can obtain most of their N requirements directly from the air through a process called N fixation. Nitrogen fixation is discussed in more detail in the section, “Legume Forage for Hay”. Adequate moisture is a critical factor affecting forage crop production, nutrient requirements, and the effectiveness of fertilizer application. Forage crop response to fertilizer application is directly related to the amounts and distribution of growing season precipitation and the ability of the soil to store water. In the drier areas of the province and on some sandy soils, response from fertilizers will be quite low because of limited available water. Fertilizers applied on established forages need to be leached into the soil before they can be used by the forage. Therefore, information regarding times and methods of application that will increase movement of fertilizer to crop roots is important to improve forage response to fertilizer. Even in the wetter areas of the province, variations in the amounts and times of seasonal precipitation can cause erratic responses to fertilizer application. However, in both dry and wet areas, strong responses occur when fertilizers applied on nutrient-deficient soils. Residual effect of fertilizers can last for three or more years after the year of application. For these reasons, economic returns from forage fertilization need to be measured over a period of several years.

8

9
FORAGE YIELD RESPONSE TO APPLIED FERTILIZER Three factors must be considered when determining what rate and kind of fertilizer to use
on forage crops. These factors include: - which nutrients are deficient and how severe are the deficiencies; - what are the yield responses when various rates of fertilizer nutrients are applied; and - what are the net returns from increased yield when crop prices, and fertilizer and application
costs are taken into consideration. The more accurately these three factors can be determined, the greater the potential for profitable
returns from forage fertilization. Methods of estimating nutrient requirements and crop yield response are discussed separately for grass, legume and mixed grass-legume forages.
A. Effects of N Fertilizer on Forages Of the essential plant nutrients, N is the most commonly deficient nutrient in soil and generally
has the greatest impact on forage production.
1. Grasses Perennial grasses generally need large amount of N and will respond very well to fertilizer N
particularly in the moist regions. The amount of N released from soil is usually small in relation to the total amount needed to produce desirable levels of forage yield and quality. Therefore, the difference between plant requirements and soil supply is balanced with N fertilizer. The effectiveness of N fertilizer on forage grasses is strongly influenced by rates, sources, times and methods of N application.
i. Rate of N Application Field investigations in Alberta, Saskatchewan, and Manitoba have shown marked yield response
of forage grasses to applied N fertilizers but dry matter yield response to applied N depends upon climatic conditions, soil type and grass species (Tables 3 and 4). In Alberta, maximum dry matter yield was achieved at lower levels of applied N in east-central and south-central parts than that obtained in north-central and central parts. In a 5-yr study conducted on a Dark Brown Chernozemic loam soil at Scott, Saskatchewan, forage yield was positively related to precipitation received in April and June. In addition to total amount of rainfall, maximum dry matter yield attainable by N fertilization was also influenced by the timeliness of rainfall in the growing season. But, in a 19-yr experiment on a thin Black Chernozemic soil at Crossfield, Alberta, the relationship between dry matter yield and precipitation during the April to August period was not strong and the dry matter yield varied from year to year. In many years, lower dry matter yield and reduced response to applied N appeared to be at least partially associated with a lack of timeliness of rainfall and not because of low precipitation.
In field experiments conducted from 1988 to 1991 on Black Chernozemic and Gray Luvisolic soils in central Alberta with 0 to 300 kg N ha-1 rates, dry matter yield, protein yield and protein concentration increased with increasing N rate while N-use efficiency and recovery of applied N declined at high N rates (Table 5). The increase in protein yield from fertilizer N was proportionally greater than dry matter yield increase due to increase in protein concentration at high N rates and potentially toxic nitrate-N levels (>2.3 g kg-1) were not found in the forage. In experiments at eight sites, there was a negative relationship in the initial nitrate-N in soil and dry matter yield response to applied N or net returns above fertilizer costs. For example, dry matter yield without N fertilizer was quite high and the increase in dry matter yield from applied N was quite low on the Black Chernozemic soils, while Gray Luvisolic soils produced much lower dry matter yield without N fertilizer and much greater increase in dry matter yield from N application. Cutting forage at an early growth stage and more frequently appears to reduce dry matter yield. However, dry matter yield per cut can be increased and the harvesting interval can be shortened with higher N rates. In a four-cut system, increasing rate of N partially compensated for the low dry matter

10
yield in the later cuts, as the growth rate was appreciably lower in late summer and yield response tended to decrease towards the end of the season. Protein in forage is important to livestock nutrition. Nitrogen fertilization increased both dry matter yield and concentration of protein in forage. In some studies, protein concentration in forage continued to increase with N applied beyond the rate needed for maximum dry matter yield. Thus , fertilization of grass with 300 kg N ha-1 rate can also lead to accumulation of nitrate-N in forage at concentrations which are considered potentially toxic (i.e., >2.3 g kg-1) to livestock. In southern Saskatchewan, rates of up to 185 kg N ha-1 seldom increased plant nitrate-N to toxic levels but application of N at 550 and 940 kg N ha-1 resulted in potentially toxic accumulation of nitrate-N in Russian wildrye, crested wheatgrass, stream bank wheatgrass and smooth bromegrass. In Alberta, potentially toxic nitrate-N concentrations at N rates exceeding those required to produce maximum forage yields, with increased frequency at drier sites (east-central Alberta) than at moister sites (central Alberta). However, the rate of N (300 kg N ha-1) required to obtain near-maximum dry matter yield also produced potentially toxic concentrations of nitrate-N in a north-central Alberta site. The tendency of grasses to accumulate nitrate-N varies substantially among species, and is influenced by the type of N fertilizer applied. Nitrate containing fertilizers result in greater accumulation of nitrate-N in forage than ammonium-based fertilizers. Growth restricting conditions (e.g., frost, drought, cloudiness, shortage of nutrients other than N) also increase the risk of nitrate-N accumulation in forage. Some research has shown that application of N fertilizer at low rates decreased protein concentrations in forage at some locations. This was due to the relatively high response of dry matter yield at the start of the growing season and the subsequent lack of available N later (Table 6). In all cases, protein concentration was higher in the first cut than the second cut, which suggested that a split application of N may be able to ensure high forage quality in the later season. In addition to protein concentration and nitrate-N in forage, long-term application of N fertilizer has been found to alter micronutrient and macronutrient composition of bromegrass forage, most likely due to acidification of soil.
ii. Single Initial versus Annual N Applications The potential benefits of high single initial application of N is reduced application cost (include
reduction of operational costs for labor, fuel and machinery). However, single applications of N must be effective for several years and should be economically comparable with annual applications. In Alberta and Saskatchewan, single N application produced lower dry matter yield than annual applications with equivalent amount of N applied over a number of years (Table 7). Single application of N produced the greatest effect on dry matter yield in the first year and its effect decreased with each succeeding year. This probably resulted from the fact that N is subject to losses by leaching, denitrification and volatilization of ammonia and is immobilized as organic N fraction of the soil. In most of the above studies, significant carryover effects of single applications lasted only 2 to 3 years following fertilization. Therefore, it is recommended not to apply massive doses of N to grass because large proportions of applied N were either lost or tied up in biomass. However, in dry area of southwestern Saskatchewan, the residual effect of a single 800 kg N ha-1 to crested wheatgrass on Brown Chernozemic soils lasted up to 10 years.
iii. Annual Single versus Split N Applications Grasses respond strongly to early spring applied N. Single annual applications of N result in
higher forage yields for the initial cuts, but forage yields of later cuts drop considerably. Although splitting of annual applications of N may not consistently increase dry matter yield, this practice is usually more effective than a single application in areas where two or more cuts of hay are regularly harvested and more uniform production for each cut is desired. In central Alberta, comparisons were made between single (100% in autumn or spring), split50 (50% in autumn or spring + 25% after cut 1 + 25% after cut 2), and split33 (33% in autumn or spring + 33% after cut 1 + 33% after cut 2) applications of different N rates (60, 120 and 180 kg N ha-1) to bromegrass (Table 8). The dry matter yield increase was greater in

11
cut 1 and smaller in cut 2 and 3 with single application compared to split applications, which indicated that splitting N application improved distribution of dry matter yield during the growing season and the seasonal total of dry matter yield and protein yield increase were also greater with split than single mode. Applying N in two or more increments can also be beneficial in achieving higher protein concentration in forage throughout the growing season and to avoid the accumulation of potentially toxic levels of nitrate-N in the forage. Uniform distribution of dry matter yield over the growing season is particularly important on pastures, as there is usually a shortage of forage in pasture during late summer or early fall. In dry years or dry areas, where low forage yields are expected and only one cut of hay is usually possible, split N applications are of doubtful value.
iv. Source of N Application In the majority of situations, granular fertilizers are used for forage production. Most producers in
western Canada have used ammonium nitrate to fertilize forage grasses in the past. But urea is now the dominant granular N fertilizer, as it has higher N content and is therefore less bulky and costs less per unit of N than other granular fertilizers. In Alberta, Saskatchewan and Manitoba, early spring applications of urea usually produced lower dry matter yield than ammonium nitrate whether bromegrass was harvested as hay or as simulated pasture, though magnitude of the difference in dry matter yield between urea and AN varied among studies. In Manitoba, solution-N was least effective in promoting growth and quality of forages grasses, urea and ammonium nitrate were equally efficient at increasing dry matter yield of hay-type grasses and urea appeared to be a better source of N for pasture-type grasses.
Recovery of fertilizer N was lower with urea than ammonium nitrate regardless of the application times (early autumn, late autumn, early winter, early spring, late spring and spring-summer split). From 112 kg N ha-1 applied to smooth bromegrass on a thin Black Chernozem soil in central Alberta, there was 10.2% less 15N recovery in plants with surface-broadcast of urea than ammonium nitrate (Table 9). In field experiments during 1998 to 1991 on Black Chernozemic and Gray Luvisolic soils in central Alberta with 0 to 300 kg N ha-1 rates, urea generally produced lower dry matter yield, protein yield, protein concentration, nitrogen use efficiency and recovery of applied N than ammonium nitrate, regardless of the time of application (Table 5). In south-central Alberta, addition of N to bromegrass increased total N, Cu, Mn and Zn while it lowered K and Ca, and there was more N and less Na with ammonium nitrate than urea in forage. v. Time of N application
It is usually recommended that N fertilizers be applied in early spring. However, because of the desire to improve distribution of the farm workload, more favorable weather conditions in the autumn and price concessions for fertilizers in autumn, producers are often interested in other times of N application. In Saskatchewan and Alberta, spring applied N was usually more effective than autumn or winter-applied N in increasing dry matter yield (Table 10). In contrast, forage yields of grasses in Saskatchewan were greater with autumn application than with spring application of N at Scott, Saskatchewan.
In field experiments during 1988 to 1992 on Black Chernozemic and Gray Luvisolic soils in central Alberta, early spring application had highest and early winter application had lowest dry matter yield (Table 5). With application of 60, 120 and 180 kg N ha-1 as ammonium nitrate in autumn and spring, greater increase in dry matter yield and protein yield were observed from autumn than spring application when all the N was applied in single dose, but when only a portion (50 or 33%) of N was applied in autumn or spring and remainder was equally split to apply after cut 1 and cut 2 increase in dry matter yield and protein yield were usually greater with spring than autumn initiated N applications (Table 8). Early spring application provided higher N recovery than all other application times (early autumn, late autumn, early winter, early spring, late spring and spring-summer split) for urea and autumn or winter applications for ammonium nitrate (Table 9).
vi. Method of N Application

12
Surface-broadcasting is the most convenient method of applying N fertilizers on established grass stands. However, surface-applied urea is subject to N loss through ammonia volatilization. The problem of N loss through ammonia volatilization from surface-applied urea can be eliminated by placing the fertilizer below the soil surface. In central Alberta, disc-banded urea produced greater dry matter yield of meadow bromegrass grown as simulated pasture than surface-broadcast urea when applied in autumn (Table 11). For spring application, the dry matter yield advantage for disc-banded over surface-broadcast urea was considerably smaller, and band placement of AN was less effective than surface-broadcast AN. Compared to surface-broadcast urea, forage dry matter yield increased with banding at 15 cm, but it decreased when band spacing was increased to 22.5, 30 or 37.5 cm (Table 12). Uneven growth was observed in the early growing season in some years, with dark green plants on or near the bands and N-deficient plants away from the >22.5 cm bands. It is possible that the N bands did not diffuse enough to nourish all plants equally. It appears that the >22.5 cm band spacing was too wide for spring-applied N. This suggests that if urea is the N source, the fertilizer should be banded below the soil surface to minimize the risk of ammonia volatilization. To make the fertilizer N immediately accessible to more of the plants and to increase fertilizer use efficiency, band spacing should be less than 22.5 cm when urea N is applied in early spring. Knife-banding was comparable to surface-broadcasting but not as effective as disc-banding in the autumn treatments and knife-banding was less effective than both surface-broadcasting disc-banding in the spring treatments. The poor performance of knife-banded urea may have been caused by plant stand disruption and possibly ammonia volatilization loss due to urea not being completely covered.
In a 15N-labelled field experiment, the N recovery from urea in smooth bromegrass increased with sub-surface band placement over surface broadcast by 20% for autumn application and by 16% for spring application. In another 15N-labelled field experiment with 112 kg N ha-1 applied to smooth bromegrass on a thin Black Chernozem soil in south-central Alberta, banding (5 mm wide, 4 cm deep and 22.5 cm apart) showed significantly greater 15N recovery in plants compared to surface-broadcasting of urea but N application method did not influence the 15N recovery from ammonium nitrate (Table 9). vii. Slow-Release Urea
A number of synthetic controlled-release urea products were compared with conventional urea and ammonium nitrate fertilizers at 100 kg N ha-1 surface-applied in central Alberta. In 1994, dry matter yield, protein yield, nitrogen use efficiency and recovery of applied N were similar for urea and ammonium nitrate, and most of the slow-release urea products were inferior to urea, most likely due to delayed (early June) N application (Table 13). But when N was applied in mid-April in 1995, urea showed lower DMY, PY, NUE and NR than ammonium nitrate, and some of the slow-release urea products gave significantly greater dry matter yield, protein yield, nitrogen use efficiency and recovery of applied N than urea, though still less than ammonium nitrate. The 1995 results suggested that when N was applied in April, the effectiveness of surface applied urea on grasslands can be improved by some slow-release products, though the cost of slow-release products should be compared with ammonium nitrate. The rate of N release from slow-release N fertilizers is affected by temperature and moisture conditions. Low temperatures and low soil moisture may cause poor release of N resulting in soil deficiency and losses due to leaching and denitrification in the following spring. The combination of coated and non-coated urea may improve dry matter yield in late cuts over urea alone, but economic analysis has shown that added expense of the coated fertilizer makes it unpractical. The price of coated fertilizers must thus decrease in order to be used for large scale forage production.
viii. Economics Although grass forages respond well to N fertilizer application on most soils in western Canada,
the optimum rate of N is determined by the economics of N application. Economic analysis of the N-rate experiments conducted on bromegrass in Alberta, Saskatchewan and Manitoba indicate that returns above fertilizer costs and the most economical N rates vary with soil-climatic zone, annual weather fluctuations (amount and timeliness of rainfall during the growing season, and total precipitation), soil type, value of

13
forage and cost of fertilizer N. Net returns from N fertilization were greater in moist areas (e.g., Lacombe and Rocky Mountain House) than in dry areas (e.g., Botha) in Alberta (Table 14). In Saskatchewan, N fertilization was found profitable in the Dark Brown soil zone but not in the Brown soil zone, AN was usually more profitable than urea, despite its higher cost per unit of N and traditionally recommended early spring application was generally most economical (Table 15).
In another study in Saskatchewan, net present value returns were greater when N was applied in smaller doses compared to a single one-time application. The net present value returns from different rates of N to smooth bromegrass on a thin Black Chernozem in south-central Alberta decreased markedly when fertilizer cost to hay price ratio increased from 7 to 16, but the optimum N rate remained relatively constant at 112 kg N ha-1 (Table 16). In the same study, net present value returns were generally greater with ammonium nitrate than with urea, were highest when N fertilizers were applied in early spring and were lowest when they were applied in early autumn (Table 17). The differences in net present value returns between N sources narrowed with late spring application, because ammonium nitrate and urea tended to be equally effective in increasing dry matter yield. When the market value of protein in forage was considered, net present value returns increased with use of N fertilizer and the net present value returns benefit of ammonium nitrate and urea became greater, particularly for early autumn application (Tables 16 and 17). In summary, application of N to grass is quite beneficial and appears to be most economical in relatively moist areas. The calculated economic optimum N rates are much greater than the N rates normally used by producers. Economics favor ammonium nitrate over urea as a source of N on established grass stands, but ammonium nitrate is not commonly available. The effectiveness of urea can be improved by placing it in bands below the soil surface.
2. Legumes Legume forages, particularly alfalfa, do not have high requirements for N. Under optimum soil
and climatic conditions, properly inoculated alfalfa can fix large amounts of N from the atmosphere and consequently, additional fertilizer N is not normally required to obtain desirable dry matter yield and protein yield. On acid soils, however, where nodulation and N fixation are severely limited, alfalfa may respond to N application and addition of lime is recommended to improve its growth.
3. Grass-legume mixtures Grasses are often seeded in mixtures with legumes. Management of fertilizer N for mixed grass-
legume stands is complex, because N application stimulates the grass component while reducing the ability of the legume component to survive and to contribute to yield in future years (Table 18). The dry matter yield response of mixed stands to applied N and net returns from N fertilization are influenced by percentage of alfalfa in forage stands, initial soil nitrate-N level, soil type and forage species. Forage stands containing greater than 50% alfalfa responded little to applied N, and dry matter yield increases and net returns from applied N were highest on soils with low percentage of alfalfa in the stands and lower levels of nitrate-N in soil (Table 19). In south-central Alberta, dry matter yield increases were observed from N application to mixed stands which had initial grass:legume ratio of about 2:1 (Table 18). In central Alberta, there was much greater increase in dry matter yield from N application in pure bromegrass than bromegrass-alfalfa mixtures (Table 20). In this study, protein concentration, net margins, and energy performance were greater from bromegrass-alfalfa mixture than from pure bromegrass. The findings suggest that seeding mixed stands could save about 100 kg N ha-1. Adding N to bromegrass caused a decline while including alfalfa to the stand improved energy use efficiency. Increased rates of weight gain in cattle were observed in Manitoba when alfalfa contributed as little as 35% to the sward. In the Peace River Region, an increase in herbage dry matter yield was attained by applying N fertilizer just to grass component when grass-legume stands were grown in alternate strips.

14
B. Effects of P Fertilizer on Forages
i. Rates of P Application Many of the agricultural soils in the Prairie Provinces contain insufficient amounts of plant-
available P and application of P fertilizer is usually required for high yield of forage in stands particularly that contain legumes. Under more favorable moisture conditions, large yield increases of alfalfa have been obtained from early spring annual applications of P fertilizer on P-deficient soils in Manitoba and Alberta (Table 21). In the Manitoba, in addition to increasing dry matter yield, application of P increased dry matter yield, protein content and P content of alfalfa up to 30 kg P ha-1. In central Alberta, yield response of alfalfa to applied P varied between the two locations, partly due to climatic conditions and level of available P in the soil. The response of dry matter yield to P application was greater at Lacombe (located in the higher rainfall area) than at Botha. Also, dry matter yield of alfalfa without P fertilizer decreased and yield responses to applied P increased with the age of the stands. Results on DMY of first and second cuts of alfalfa showed substantial yield increase from P application in the second cut, which suggested that forage production can be extended later into the growing season with the use of P fertilizer. This practice could be used to extend the grazing season and to increase hay production in areas where second hay harvests are possible. Research done in Swift Current on alfalfa and Russian wildrye mixed forage showed not only increases in dry matter yield with application of 17.5 kg P ha-1, but also improved persistence of alfalfa over the control treatments. This may be important in increasing the longevity of legumes in mixed forage stands. In central Alberta, P fertilizer application increased dry matter yield of smooth bromegrass (Table 21). The main increase in dry matter yield resulted from the first 10 kg P ha-1 rate. The dry matter yield increase of bromegrass from P application was smaller than alfalfa at the same site but smooth bromegrass responded to P application in each of the two cuts (data not shown). In south-central Alberta, where the effect of P fertilizer on forage yield and composition was measured in mixed bromegrass-alfalfa stands, forage yield response to P fertilizer was minimal in the first year of application on soils tested deficient in P. The contribution of applied P to dry matter yield increased with each successive year of P fertilization. In subsequent years, dry matter yield increase from P fertilizer was closely associated with available P level in the soil. The amount of precipitation received in the year of application also contributed to the degree of P responsiveness.
ii. Single Initial versus Annual P Applications Because P is relatively immobile in soil, the benefit of surface-broadcast P may not be fully
realized in the initial years of annual fertilizer P application. Therefore, it may be useful to consider the incorporation of higher rates of P fertilizer into the soil prior to stand establishment. Since there is minimal risk of leaching losses with P fertilizer, a single large application of P made at seeding may last several years while contributing to performance of legume components and saving on operational costs needed for annual applications of fertilizer. In central Alberta, single initial applications of P fertilizer 60 kg P ha-1 incorporated into the soil before seeding increased dry matter yield of alfalfa for at least 3 years (Table 22). In these experiments, forage yield response was substantial in the third year. Similarly, the residual effect of a single P application lasted for at least 5 years on bromegrass. Studies comparing one-time initial and annual P applications in relatively dry regions of the Canadian prairies reported forage yield response to residual P fertilizer present in the soil for 10 years after application.
iii. Method of P Application In field experiments in central Alberta to determine the extent of downward movement of
fertilizer P from long-term annual applications of surface-broadcast fertilizer to established stands of grass, alfalfa and grass-alfalfa mixtures, most of the fertilizer P, recovered in soil as extractable P, remained in the top 5 or 7.5 cm layer (Table 23). Other results have indicated that surface-broadcast

15
applications of P fertilizer may not be fully effective in the year of application, because P remains near the surface. Therefore, one would expect greater effectiveness of P fertilizer on established forage stands from sub-surface placement compared to surface-broadcasting.
The results of field research on the comparisons of surface and subsurface placements of P for perennial forages, especially alfalfa, have not been consistent. The results of a 5-year experiment with annual spring application of P fertilizer at 10 to 40 kg P ha-1 to alfalfa showed that total dry matter yield of two cuts was usually higher with disc-banding (15 cm spacing) than surface-broadcasting (Table 24). However, there was no forage yield advantage of subsurface-banding (20 cm spacing) over surface-broadcast application of P fertilizer to alfalfa stands in Manitoba. In that field study, limited yield response to applied P was probably attributable to the disruption of alfalfa stands by band application.
C. Effects of K Fertilizer on Forages Although the majority of agricultural soils in western Canada contain adequate K, there are some
soils that will benefit from K fertilization. The majority of K-deficient soils, particularly the coarse-textured and organic soils, are found in the Black, Dark Gray and Gray soil zones. Perennial forages, particularly alfalfa, remove large quantities of K from soil and have very high requirements for K. In Manitoba, application of K fertilizer to alfalfa has resulted in a dramatic positive effect on dry matter yield and quality of forage, but the degree of forage yield response was dependent on soil test K level (Table 25). Studies in Saskatchewan have shown limited response to K fertilization on alfalfa, even on a K-deficient Gray Luvisolic soil, signifying that most soils in Saskatchewan do not require K fertilization for alfalfa. In central Alberta, dry matter yield responses of bromegrass, timothy, reed canary and bromegrass-alfalfa mixtures to K fertilization were determined on organic soils. On marginally K-deficient soils, legumes may produce well in the first year or so without application of K fertilizer, but after several harvests soil K supply will be insufficient to maintain high forage yields and quality from legumes. Fertilization with KCl has also been shown to reduce winterkill in alfalfa, but Cl has been shown to be associated with suppression of root and leaf diseases of cereals. Therefore, it is not certain whether the reduction in winterkill is due to Cl or K.
D. Effects of S Fertilizer on Forages There are approximately 4 million hectares of agricultural soils in western Canada, which contain
insufficient amounts of available sulphur (S) to sustain optimum growth of all crops. Sulphur deficiencies occur most commonly on Gray soils, but many coarse-textured Dark Gray and some Black soils are also deficient in S. Research in western Canada has shown substantial increases in forage yield of grasses, legumes and mixed stands from S fertilization. Alfalfa, because of its larger S requirement associated with its higher forage yield potential, has produced greater responses to S fertilization than grasses and increasing rates of S fertilizer applied to alfalfa not only increased dry matter yield but also increased S and protein concentration (Table 26). On Gray Luvisolic soils in west-central Alberta, average selenium (Se) concentration in all the forage species decreased with S fertilization and the decrease was most pronounced when S fertilizer increased forage yield and when Se levels without S fertilization were higher (Table 27). In 21 field tests on Gray Luvisolic, Dark Gray and Black Chernozemic soils, forage yield response of legumes to S fertilization showed a negative relationship with sulphate-S in the 0-15 cm and 0-30 cm depths and sulphate-S in the 0-15 cm depth gave excellent delineation between the responsive (<6 kg ha-1 of SO4-S) and non-responsive (>6 kg ha-1 of sulphate-S) soils. Further tests showed that application of 22 kg sulphate-S ha-1 was sufficient to alleviate S deficiency for legume-grass mixtures (Table 28). Plants feed only on sulphate form of S and traditionally producers have used sulphate-S fertilizers to correct S deficiency of crops. However, there are a wide variety of commercial fertilizers that contain S in the elemental form, which cost less per unit of S than the sulphate-S supplying fertilizers. But the effectiveness of these materials depends on how quickly the S is oxidized and contributes to sulphate-S level in soil, which is affected by temperature, moisture, and oxidizing agents present in the soil. Good

16
contact with the soil allows faster particle breakdown of elemental S fertilizers, which is a problem with surface application to perennial forages. In central Alberta, elemental S was found less effective than sulphate-S fertilizers for increasing dry matter yield and S uptake in first two or three years, while it may be as effective in subsequent years depending on soil-climatic conditions (Table 29). Sulphate-S is mobile in soil and its leaching is a concern. As elemental S will only lose the portion oxidized to sulphate, it may give elemental S an advantage over sulphate-S fertilizers under certain conditions.
E. Micronutrients and Forages Most soils in western Canada are able to supply the micronutrients required for maximum
growth. Research is very limited on the effects of application of micronutrients on dry matter yield and quality of forages. Boron deficiencies in alfalfa grown on Gray Luvisolic soils have been acknowledged but not studied. Forage species differ in their requirements for micronutrients and deficiencies may vary in different years based on environmental conditions. Micronutrients are generally expensive even though rates of application are low. Soil testing and the use of check-strips or test plots, to insure adequate plant response and to rule out any macronutrient deficiencies, lowers the economical risk associated with the high cost of micronutrients.
F. Livestock Manure on Perennial Grassland Diversification into livestock production in recent years has increased the availability of livestock
manure in western Canada. Combined with the recent increases in the costs of inorganic fertilizers, manure has become a viable option for improving soil fertility in perennial forage stands. Injection of liquid swine manure is favored over surface-applied manure as losses of ammonium-N can be substantial with surface-applied manure, and environmental concerns with regards to water and air contamination make it less favorable in populated areas. Low disturbance applicators have been developed in response to conservation tillage and continuous cropping systems and have been effective at minimizing disturbances on perennial forage stands.
Studies using both liquid swine and solid cattle manure have shown increased forage yields for grasses and legumes (Table 30). Injection of liquid swine manure increased soil inorganic N levels. But other studies have shown that levels of extractable P and K did not increase significantly, effects on soil pH and EC were negligible, leaching of nitrates was not an issue with most of the nutrients remaining in the 0- to 30-cm soil depth and carryover inorganic N was not significantly higher between rates of application, suggesting high organic N and volatilization. Manure application had positive effects on forage quality, with increasing protein content. Nitrate levels associated with application of manure vary with environmental conditions and physiological differences between crops. The nutrient composition of manure is highly variable, which requires that nutrient analysis be conducted before application to reduce the risk of N losses and to ensure nutrient deficiencies are minimized. It is therefore advisable to test forages for acceptable nitrate levels before use and more research is needed to determine the effect of application time on forage yield and quality.
G. Pasture versus Hay Forage Response to Fertilizer There are important differences in soil fertility requirements between hay and pasture forages. In
each season, hay crops are generally cut one to three times, while pasture may be grazed more often, depending on the management practices of the producer. Fast regrowth is important in pasture stands while even stand growth is more important in hay stands. Also, cattle on pasture generally return 60 to 90% of nutrients as excreta while cutting the forage as hay removes all the nutrients stored in the stems and leaves of the plant. Nutrient redistribution on pasture becomes very important in replenishing soil nutrients and preventing environmental contamination. The re-application of nutrients as excreta has an increased tendency to be lost by volatilization, especially ammonia in urine. Research at Brandon, Manitoba showed distinct increases in soil extractable K, P and S in high use areas along fencelines and watering sites, providing possible nutrient loss and contamination zones. Use of rotational grazing and

17
short grazing periods provided the most even redistribution of soil nutrients. In Saskatchewan, other researchers determined positive effects of N fertilizers on productivity of crested wheatgrass pastures and suggested that for full economic benefits of N fertilization to pasture residual effects beyond the year of application need to be determined.
In grasses, a higher response to fertilizer was shown under hay conditions (two cuts) than under simulated pasture (four cuts) (Table 31). This was most likely due to reduced photosynthetic area with frequent cutting. There were few consistent differences in dry matter yield from different grass species, however, percent regrowth of meadow bromegrass was always greater than either smooth bromegrass or crested wheatgrass. Nitrogen fertilization increased total dry matter yield linearly up to 160 kg N ha-1, but percent regrowth did not respond in a consistent manner. In this study, environment, management and grass species accounted for 38.4, 33.2 and 0.6% of the variation in total dry matter yield, respectively. Grasses managed as hay (two cut system) usually had greater dry matter yield and higher protein concentration and occasionally higher N recovery and nitrogen use efficiency than managed as pasture (three to four cut system). Nitrogen fertilization increased protein concentration and yield.
The effect of N fertilizer on increasing pasture yield and quality has been documented through pasture clipping, but those studies lacked actual animal production data. In a limited number of studies in Saskatchewan, application of N fertilizer to pasture has shown significant improvements in livestock production. In Alberta, on a sandy loam Black Chernozem soil, application of N in combination with P increased both dry matter yield and liveweight gain of steers in a 7-year study with bromegrass, fescue and bromegrass-alfalfa swards (Table 32). But, the increase in feed conversion ratios (kg dry matter kg-1 beef) was observed with pure grass swards only, which suggested that dry matter yield failed to measure DM consumption by animals satisfactorily and very low feed conversion ratios for fescue sward indicated that animals were able to graze its dense basal growth more closely than the mower could clip.
H. Fertilizer as Rejuvenation Technique The price of seed, tillage, seeding and the time required for stand establishment are major cost
factors associated with perennial forages. These costs average between $200 and $250 per ha and may not include the cost of losses of N through volatilization and leaching and increased soil erosion. Perennial forage stands generally have a useful life between 5 and 10 years, by which time high levels of soil N become unavailable as organic matter and invasion of competitive forage and weed species decreases forage yield and quality. In mixed stands, legumes are out-competed by grasses, which results in fewer legume plants causing less N fixation and N deficiency.
Studies in Saskatchewan concluded that broadcasted and banded fertilizers, alone or with mowing, spiking or burning, were more effective in improving forage yield and quality over burning and mechanical methods alone and that the treatments had less effect in older stands (Table 33). The effects in the following years were limited and there were no residual effects of the fertilizer application by the third year. Deep-banded liquid fertilizer showed greater annual yield increase than broadcasted granular fertilizer in all treatments and a greater cumulative effect over the 3 years. By the end of year 3, there was no evidence of a consistent change in stand composition, though increasing N fertilizer decreased alfalfa in mixed stands. Research in central Alberta has also shown that mechanical aeration did not affect forage yield at any of the five sites while forage yield increased significantly with N application in most cases (Table 34). Aeration of pasture and hay forage as a method of rejuvenation showed no consistent increase in forage yield, suggesting that N was the limiting factor in older forage stands, and mechanical treatments were ineffective unless N was applied.
These results indicate that nutrient deficiency, particularly N, was the likely cause of reduced production on these pasturelands and haylands and alleviation of nutrient deficiency via N application or inclusion of legume may be an appropriate strategy for pastureland and hayland rejuvenation. Sod seeding into perennial forage stands is an effective method to reestablish unproductive forage stands. Sod seeding is most effective when growth of the existing forage is suppressed by chemical or mechanical means to limit competition. The success of establishing new forages increases with soil moisture.

18
I. Effect of Fertilization of Peat Soils on Hay Yields In an experiment at Niton Junction, Alberta, average (bromegrass, timothy and reed canarygrass)
dry matter yield was 1.60, 2.70, 3.02 and 3.59 t ha-1 with no-fertilizer, N (56 kg N ha-1), N+P (56 kg N ha-
1 + 45 kg P ha-1) and N+P+K (56 kg N ha-1 + 45 kg P ha-1 + 45 kg K2O ha-1), respectively. In another experiment at Leslieville, bromegrass-alfalfa mixtures responded to K fertilization in the absence as well as in the presence of N and P application and maximum dry matter yield was obtained when N, P and K fertilizers were all applied (Table 35).
J. Fertilizer Effects on Soil Properties Long-term fertilizer applications have effects on soil chemical properties, which are related to the
chemical properties of the applied fertilizer directly and to the increased uptake of nutrients associated with increased plant growth.
i. Soil pH Acid soils with a pH less than 6 form an estimated 2.6 million hectares of the agricultural soils in
western Canada. Plants differ in their ability to tolerate acid soils, with forage grasses generally having a higher tolerance than forage legume species.
Increased use of N fertilizer to bromegrass has accelerated the acidification of soil (Table 36). Acidification associated with the application of N fertilizer occurs at a rate related to the amount, source and time of fertilizer application. Field studies have shown that soil pH reductions associated with N fertilization occur primarily in the 0- to 15-cm layer with some effect at greater depths with very high N rates and depth of acidification increased with rate of applied N. In general, ammonium-N fertilizers have greater effect on soil pH than nitrate-N fertilizers. At 336 kg N ha-1 for example, soil was acidified to a depth of 10, 15 and 30 cm with urea, ammonium nitrate and ammonium sulphate, respectively; with no effect of calcium nitrate on soil pH. Just use long forms
In a field experiment on a Solonetzic soil where different rates of N were applied to smooth bromegrass from 1961 to 1978 and soil samples were collected in 1986, N fertilization at 305 kg N ha-1 with AN depressed soil pH of the Ap horizon and this acidification effect was more pronounced with monoammonium phosphate than at the equivalent rate of N with ammonium nitrate (Table 37).
Rhizobium spp. are sensitive to soil pH and N-fixation may decline substantially as pH decreases. Crops such as alfalfa can remove considerable amount of Ca over time, which may also cause acidification. Combined with high P requirements compared to grasses, liming is therefore more effective for alfalfa. Studies have shown a single application of lime has long term effects ranging from 16 to 27 years in three experiments, based on the initial applied rate of lime, soil type and environmental conditions. Economic analysis has shown favorable returns on investment for a single application of lime (2.2 t/ha at $50/t) independent from the value of the crop (Table 38). This study determined the effectiveness of lime on increasing soil pH on yield and economics of alfalfa, but it is possible that grass forages may show larger returns from lime if N fertilizer is also applied.
ii. Soil Salinity Perennial forages can help reduce the effects of salinity, reclaiming areas and controlling the
spread of salinity. Perennial forages are effective at lowering the water table with their increased root growth to deeper soil. Several species of forage are saline tolerant and will grow well once established. It is recommended that seeding the area with a salt tolerant forage crop should take place before the site becomes unable to support barley growth, which would indicate strong to very strong saline soil . The application of N fertilizer in these areas contributes to increased plant growth, root growth and water uptake, thus increasing the rate of recovery. In a field experiment on a Solonetzic soil where different rates of N were applied to smooth bromegrass from 1961 to 1978 and soil samples were collected in 1986, N fertilization caused a significant decrease in extractable Mg in Ap horizon (plow layer) and there was a trend towards decreased sodium adsorption ratio, soluble Na and extractable Na and Ca (Table 37).

19
iii. Carbon Sequestration There is growing concern over the increased levels of carbon dioxide present in the Earth’s
atmosphere and its effect on agriculture as a whole. Cultivation practices in western Canada have resulted in the loss of organic C from soils over time, which may be contributing to the increased atmospheric levels. The benefits of growing perennial forages on soil C and N are well documented, especially for marginal lands in annual crop production. Studies in Alberta have shown that total organic carbon and/or total organic N is influenced by rate and source of N fertilizer application and level of total N in soil follows closely. The ability of perennial forage stands to sequester C in soil is substantially increased with the addition of N fertilizer (Table 39). In a field experiment on a Solonetzic soil where different rates of N were applied to smooth bromegrass from 1961 to 1978 and soil samples were collected in 1986, amount of microbial biomass and mineralizable C and N decreased while total soil C and N increased with N fertilization (Table 37). The largest increase in total C was realized with AN, while urea produced the smallest increase. Studies in Saskatchewan and Alberta have shown that the addition of N and/or S to a grass forage stand increased dry matter yield substantially compared to the zero-N control, and levels of light fraction carbon and light fraction N showed a large increase. In a Saskatchewan study, the treatments with only N or only S application did not show any increase in dry matter yield or light fraction C, suggesting the importance of balanced nutrition in soil. We hypothesize that the increase in total organic C and light fraction C in soil was associated with the increased root mass of forage grasses in response to N fertilization.
iv. Residual Nitrate-N and Other Nutrients in Soil Successive applications of N fertilizer at rates greater than necessary for maximum yield result in
accumulation of nitrate-N in soil, and the amount of nitrate-N in soil and the depth to which it leaches increases with increasing N rate. But the leaching of this surplus nitrate-N depends on soil type, amount and distribution of precipitation and crop species. In Saskatchewan, there was little or no nitrate-N present in the soil profile after several annual applications of ammonium nitrate to bromegrass at rates up to 200 kg N ha-1. However, in bromegrass plots that received single applications of ammonium nitrate at 800 kg N ha-1, large amounts of residual nitrate-N were recovered in the 30- to 60-cm soil depth. In Alberta, accumulation of nitrate-N in soil was small with N rates of 112 kg N ha-1 or less, but significant accumulation of nitrate-N occurred at higher N rates. Similarly, only 0.9 to 13.8% of the applied N was found as nitrate-N in the 0- to 60-cm depth with application of 112 kg N ha-1 for 11 years. In the same study, application of 336 kg N ha-1 for 5 years as ammonium sulphate, urea, ammonium nitrate and calcium nitrate resulted in 386, 515, 797 and 1252 kg N ha-1 in the 0- to 60-cm depth, respectively. However, these N rates exceeded those required to attain near-maximum forage yields. This suggests that to reduce the risk of accumulation and downward movement of nitrate-N out of the rooting zone, N rates in excess of those required for optimum forage yield or large one-time applications of N should be avoided. This paragraph is hard to follow Nitrate-N concentration was 1.7 to 2.4 times greater for heavy than light grazing intensities in the 0- to 5-, 15- to 30- and 30- to 60-cm soil depths and averaged 2.2 times for the 0- to 60-cm depth; and 22.2 and 13.6 mg nitrate-N kg-1 in the 30- to 60-cm depth was measured under bromegrass (average of meadow and smooth) and triticale, respectively. In the same study, ammonium-N in the 0- to 60-cm depth was greater in meadow bromegrass (30 kg N ha-1) than in triticale (25 kg N ha-1) and weak ammonium fluoride/sulphuric acid-extractable P in the 0- to 15-cm depth was greater in the heavy (154 mg P kg-1) than in medium- (138 mg P kg-1) or light (127 mg P kg-1) grazing intensities. Thus, there was potential for nitrate-N loss through both leaching and denitrification and for P loss by surface runoff.
Application of N increased extractable ammonium-N, Mg, Zn and Fe in the 0-5 cm, increased Na, Al and Mn in the 0-10 cm, and increased ammonium acetate-extractable K in the 0-60 cm. The pH and extractable Ca, Mg and Zn of soil were lower with ammonium nitrate compared to urea, whereas the opposite was true for Fe, Mn, Ca, Na and Al. Earlier, the changes in extractable ammonium-N, P, Ca, Mg and K were correlated to soil pH changes due to N application. In another study, extractable K

20
concentrations decreased with increasing rates of N, where the increased acidification most likely may have caused an increase in weathering rate beyond the required level to compensate for increased plant growth. Concentrations of CaCl2-extractable Al, Fe and Mn in the top 10 cm layer of soil have been shown to increase with increasing N rate, while concentrations of DTPA (diamine triethylene pentacetic acid)-extractable Cu and Zn were not significantly changed (Table 36). The increased soil concentrations of micronutrients increased plant concentrations of total Mn and Zn but decreased plant concentrations of total Al and Fe in bromegrass. In Manitoba, greater concentration of extractable P, somewhat greater concentration of extractable K and no change in sulphate-S concentration were observed with P, K and S fertilization; and a reduction in pH was observed with addition of N fertilization. The extractable Al, Mn and Fe in soil increased with a decline in acidity, while extractable Zn and Cu were not affected; and the changes in concentration of these elements in soil were also reflected in their concentrations in forage hay. K. Greenhouse Gas Emissions from Grasslands
Agriculture is thought to be accounting for one-fifth of the annual increase in anthropogenic greenhouse gas emissions, with most of this due to methane and nitrous oxide. Approximately 70% of all anthropogenic emissions of nitrous oxide are attributed to agriculture. The regional fluxes of nitrous oxide in USA grasslands ranged from 0.18 to 1.02 kg N ha-1 yr-1 with the mean flux of 0.28 kg N ha-1 yr-1, and the flux from Great Plain states were estimated to average 0.24 kg N ha-1 yr-1. Substantial over-winter losses of N have been reported from mass balance studies in Parkland and Boreal regions of Alberta. The estimated annual nitrous oxide emissions from transitional grassland-forest region in Saskatchewan averaged 2.00, 0.04 and 0.02 kg nitrous oxide-N ha-1 from fertilized cropland, pasture/hay land and forest areas, respectively; with weighted-average annual flux of 0.95 kg nitrous oxide-N ha-1 (Table 40).
Approximately 20% of the Earth’s land surface is covered with managed pastures and another 30% with rangelands. On grazed grassland, grazing animals concentrate N in dung and urine patches, which cover only a small fraction of the total surface area and these patches are important sites for N loss via ammonia volatilization, nitrate leaching, denitrification and nitrous oxide emission. In addition, treading and trampling by the animals lead to local compaction of the soil, especially in moist and wet conditions, alter species and herbage composition and C turnover as well as lead to erosion.
Greenhouse gas fluxes could be estimated at landscape or regional scale by establishing quantitative relationships with appropriate ecological variables. Proposed soil type and plant community (production systems being surrogates for plant community in cultivated areas) are controlling factors at landscape scale. In a parallel concept, climate, soil type and plant community were considered the broad integrators of nitrous oxide emissions. Texture and drainage of soil and plant community could explain up to 86% of the spatial variability of annual nitrous oxide emissions in a landscape-level study of denitrification. Climate-soil-management combinations aggregated to an ecodistrict level would be an appropriate scaling-up technique for greenhouse carbon emissions for Canadian agriculture. Substantial (0.4 to 2.6 kg N ha-1) and consistent differences in the magnitude of nitrous oxide-N loss were observed among five ecodistricts in Alberta and annual nitrous oxide-N loss was found to be strongly correlated with clay content of soil. Grazing animals contribute slightly more than 10% (i.e., 1.5 Tg nitrous oxide-N) to the global annual nitrous oxide budget; and specific management options to lower nitrous oxide emission from grazed animals include decreasing the number of grazing animals per unit area, N content in urine, and number of urine and dung patches. Grassland soil low in available N exhibited a 41% reduction in methane uptake in 8 yrs after N fertilization as compared to an unfertilized control, while the methane oxidation capacity of a soil high in mineral N remained unaffected by fertilization. Ammonium containing N fertilizers and atmospheric N2-fixing legumes are known to increase nitrous oxide emissions from soil.
21
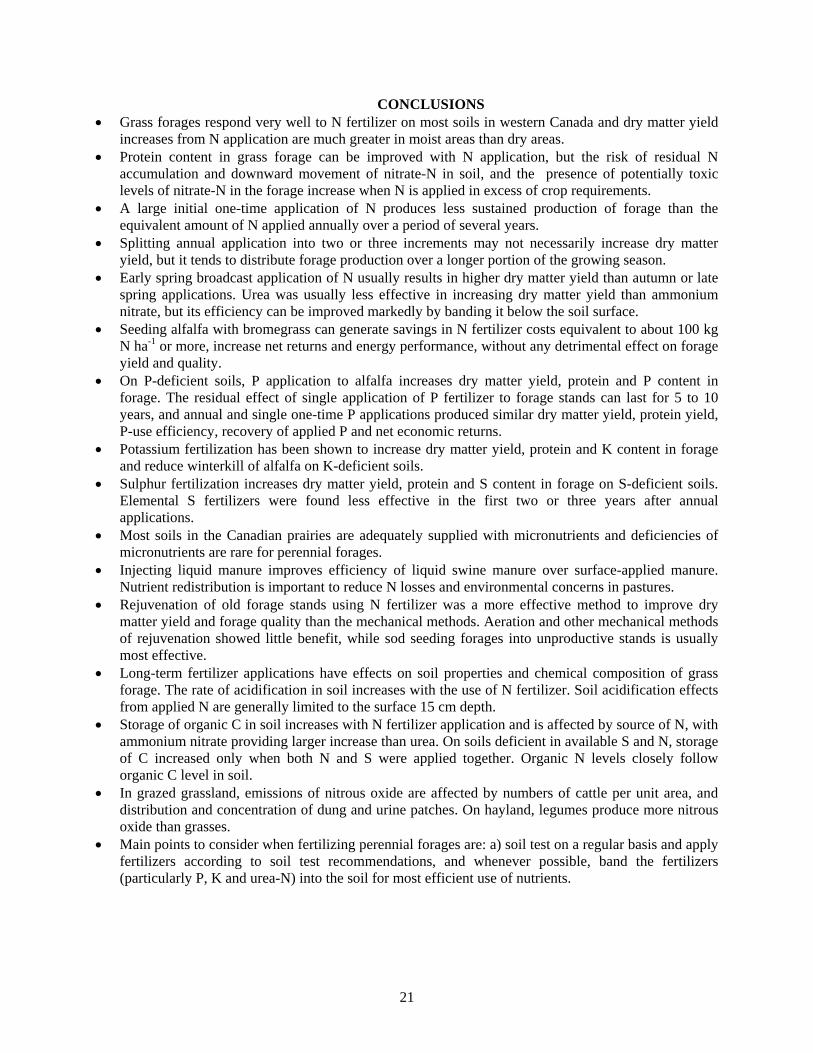
CONCLUSIONS • Grass forages respond very well to N fertilizer on most soils in western Canada and dry matter yield
increases from N application are much greater in moist areas than dry areas. • Protein content in grass forage can be improved with N application, but the risk of residual N
accumulation and downward movement of nitrate-N in soil, and the presence of potentially toxic levels of nitrate-N in the forage increase when N is applied in excess of crop requirements.
• A large initial one-time application of N produces less sustained production of forage than the equivalent amount of N applied annually over a period of several years.
• Splitting annual application into two or three increments may not necessarily increase dry matter yield, but it tends to distribute forage production over a longer portion of the growing season.
• Early spring broadcast application of N usually results in higher dry matter yield than autumn or late spring applications. Urea was usually less effective in increasing dry matter yield than ammonium nitrate, but its efficiency can be improved markedly by banding it below the soil surface.
• Seeding alfalfa with bromegrass can generate savings in N fertilizer costs equivalent to about 100 kg N ha-1 or more, increase net returns and energy performance, without any detrimental effect on forage yield and quality.
• On P-deficient soils, P application to alfalfa increases dry matter yield, protein and P content in forage. The residual effect of single application of P fertilizer to forage stands can last for 5 to 10 years, and annual and single one-time P applications produced similar dry matter yield, protein yield, P-use efficiency, recovery of applied P and net economic returns.
• Potassium fertilization has been shown to increase dry matter yield, protein and K content in forage and reduce winterkill of alfalfa on K-deficient soils.
• Sulphur fertilization increases dry matter yield, protein and S content in forage on S-deficient soils. Elemental S fertilizers were found less effective in the first two or three years after annual applications.
• Most soils in the Canadian prairies are adequately supplied with micronutrients and deficiencies of micronutrients are rare for perennial forages.
• Injecting liquid manure improves efficiency of liquid swine manure over surface-applied manure. Nutrient redistribution is important to reduce N losses and environmental concerns in pastures.
• Rejuvenation of old forage stands using N fertilizer was a more effective method to improve dry matter yield and forage quality than the mechanical methods. Aeration and other mechanical methods of rejuvenation showed little benefit, while sod seeding forages into unproductive stands is usually most effective.
• Long-term fertilizer applications have effects on soil properties and chemical composition of grass forage. The rate of acidification in soil increases with the use of N fertilizer. Soil acidification effects from applied N are generally limited to the surface 15 cm depth.
• Storage of organic C in soil increases with N fertilizer application and is affected by source of N, with ammonium nitrate providing larger increase than urea. On soils deficient in available S and N, storage of C increased only when both N and S were applied together. Organic N levels closely follow organic C level in soil.
• In grazed grassland, emissions of nitrous oxide are affected by numbers of cattle per unit area, and distribution and concentration of dung and urine patches. On hayland, legumes produce more nitrous oxide than grasses.
• Main points to consider when fertilizing perennial forages are: a) soil test on a regular basis and apply fertilizers according to soil test recommendations, and whenever possible, band the fertilizers (particularly P, K and urea-N) into the soil for most efficient use of nutrients.

22
RECOMMENDATIONS Climate and soil type have a significant effect on forage response to fertilizer application,
while forage composition will affect the overall nutrient requirements. Fertilizer requirements for pure stands of grasses or legumes are very straight forward, however, it is much more difficult to develop an effective fertilizer program for mixed grass-legume stands. Fertilizing to Establish a Forage Stand A critical factor in forage stand management is proper establishment. This includes: 1. Soil sampling and testing prior to establishment to properly assess the nutrient status of
the soil and to identify any possible soil limitations, i.e. acidity and salinity. 2. Selection of the best forage species and variety for the intended use, soil type and
climate. 3. Application of the required fertilizers prior to seeding, particularly on very deficient
soils. 4. Proper inoculation and handling of legume forage seed. 5. Proper timing, rates and methods for seeding. Fertilizing to Maintain a Forage Stand Fertilizer application to an established forage stand is essential to maintain the productivity and longevity of the stand. This includes: 1. Regular soil sampling and soil testing to determine the type and amount of fertilizer to
apply. 2. Soil and plant tissue sampling to diagnose problem situations and to monitor changes
that may occur in soils and crops. 3. Annual fertilizer applications are usually more effective than large initial single application made
at the time of establishment for all forage types. 4. Early spring fertilizer application is generally more effective than fall or late spring
application for all forage types, but the effectiveness of fall-applied N can be improved by disc-banding the fertilizer below the soil surface.
5. Split applications of N fertilizer as opposed to one time annual application for grass or low legume forages should be used only in high moisture areas and under irrigation.
6. Urea is less effective than ammonium nitrate as a source of N fertilizer for established grass forages, but its effectiveness can be improved by disc-banding the fertilizer below the soil surface. Even though urea may be less effective than ammonium nitrate, it is still a very good source of N for fertilizing forage crops.
7. Liming acid soil will increase forage production and the life of the forage stand.
REFERENCES
Alberta Agriculture. 1981. Alberta forage manual. 86 pp. Alberta Agriculture, Edmonton, Alberta, Canada.
Bailey, L.D. 1974. The effects of N source on the yield and chemical composition of 4 grasses. Pages 180-192 in 18th Annual Manitoba Soil Science Meeting, 11-12 December, 1974, Winnipeg, Manitoba, Canada.
Bailey, L.D. 1976. The effect of rate, time of application and source of N on the yield and nitrogen uptake of grasses. Pages 29-38 in Proc. Technical and Scientific Papers Presented at Manitoba Agronomists Conference, December, 1976, Winnipeg, Manitoba, Canada.

23
Bailey, L.D. 1983. Effects of potassium fertilizer and fall harvests on alfalfa grown on the eastern Canadian Prairies. Can. J. Soil Sci. 63: 211-219.
Baron, V. 2001. Can pastures slow down global warming. Agriculture and Agri-Food Canada/Alberta Agriculture, Food and Rural Development, Lacombe Research Centre, Lacombe, Alberta, Canada. Vol. 5 (Issue 2): 2-6.
Baron, V.S., Dick, A.C., Mapfumo, E., Malhi,S.S., Naeth, M.M. and Chanasyk, D.S. 2001. Grazing impacts on soil nitrogen and phosphorus under Parkland pasture. J. Range Manage. 54: 704-710.
Bittman, S., McCartney, D.H., Waddington, J., Horton, P.R. and Nuttall, W.F. 1997. Long-term effects of fertilizer on yield and species composition of contrasting pasture swards in the Aspen Parkland of the Northern Great Plains. Can. J. Plant Sci. 77: 607-614.
Bittman, S., McCartney, D.H., Horton, P.R. Hiltz, M. and Nuttall, W.F. 2000. The influence of harvest management and fertilizers on herbage yield of cool-season grasses grown in the Aspen Parkland of northeastern Saskatchewan. Can. J. Plant Sci. 80: 747-753.
Bowes, G. 1995. Sod-seeding forage to improve pasture. Summary of Progress to 1994, Saskatoon Research Centre, April, 1995. Agriculture and Agri-Food Canada, Research Centre, Saskatoon, Saskatchewan, Canada.
Bruynooghe, J. 2000. Salinity control with forages. The Beef Development Report, Vol. 3, Issue 4, Spring 2000. Department of Animal Science, University of Saskatchewan, Saskatoon, Saskatchewan.
Campbell, C.A., Leyshon, A.J., Ukrainetz, H. and Zentner, R.P. 1986. Time of application and source of nitrogen fertilizer on yield, quality, nitrogen recovery, and net returns for dryland forage grasses. Can. J. Plant Sci. 66: 915-931.
Chen, W., McCaughey, W.P., Grant, C.A. and Bailey, L.D. 2001. Pasture type and fertilization effects on soil chemical properties and nutrient redistribution. Can. J. Soil Sci. 81: 395-404.
Cohen, R.D.H., Thomas, L.R. and Wright, S.B.M. 1987. Effect of nitrogen fertilizer on the nutrition and production of beef cattle grazing crested wheatgrass/smooth bromegrass pasture. Proc. Western Section Am. Soc. Anim. Sci. 38: 191-195.
Cohen, R.D.H., Howard, M.D., McCaughey, W.P., Wright, S.B.M. and Thomas, L.R. 1990. Residual effects of nitrogen fertilizer on productivity of crested wheatgrass pastures. Pages 12-20 in Beef Research Report, Department of Animal and Poultry Science, University of Saskatchewan, Saskatoon, Saskatchewan, Canada.
Cooke, D.A., Beacom, S.E. and Dawley, W.K. 1965. Pasture productivity of two grass-alfalfa mixtures in northwestern Saskatchewan. Can. J. Plant Sci. 45: 162-168.
Cooke, D.A., Beacom, S.E. and Robertson, J.A. 1973. Comparison of continuously grazed bromegrass-alfalfa with rotationally grazed crested wheatgrass-alfalfa.. Can. J. Anim. Sci. 53: 423-429.
Corre, M.D., Pennock, D.J., van Kessel, C., Elliott, D.K. 1999. Estimation of annual nitrous oxide emissions from a transitional grassland-forest region in Saskatchewan, Canada. Biogeochemistry 44: 29-49.
Doyle, P.J. and Cowell, L.E. 1993. Sulphur. Pages 202-250 in Rennie, D.A. et al. eds. Impact of micronutrients on crop responses and environmental sustainability on the Canadian prairies. University of Saskatchewan, Saskatoon, Saskatchewan, Canada.
Fairey, N.A. 1991. Effects of nitrogen fertilizer, cutting frequency, and companion legume on herbage production and quality of four grasses. Can. J. Plant Sci. 71: 717-725.
Fairey, N.A. and Lefkovitch, L.P. 1993. Herbage production as influenced by stand management, nitrogen fertility and supplemental water. Can. J. Plant Sci. 74: 115-120.
Fairey, N.A. and Lefkovitch, L.P. 1995. Alternating strips of grass and legume, and nitrogen fertilization strategy for long-term herbage production from a brome-alfalfa stand. Can. J. Plant Sci. 75: 649-654.
Gossen, B.D., Horton, P.R., Wright, S.B.M. and Duncan, C.H. 1994. Field response of alfalfa to harvest frequency, cultivar, crown pathogens, and soil fertility: I. survival and yield. Agron. J. 86: 82-88.

24
Harapiak, J.T. and Flore, N.A. 1984. Behavior of fertilized mixed forage stands. Pages 256-263 in Proc. Alberta Soil Science Workshop, 21-22 February, 1984, Edmonton, Alberta, Canada.
Harapiak, J.T., Malhi, S.S., Nyborg, M. and Flore, N.A. 1992a. Soil chemical properties after long-term nitrogen fertilization of bromegrass: source and time of nitrogen application. Commun. Soil Sci. Plant Anal. 23: 85-100.
Harapiak, J.T., Malhi, S.S., Nyborg, M. and Flore, N.A. 1992b. Dry matter yield and nitrogen recovery from bromegrass in south-central Alberta as affected by rate of long-term nitrogen applications. Commun. Soil Sci. Plant Anal. 23: 1245-1256.
Harapiak, J.T., Malhi, S.S. and Gill, K.S. 2000. Chemical soil properties and bromegrass hay composition as affected by 23 annual fall and spring applications of ammonium nitrate and urea. Commun. Soil Sci. Plant Anal. 31: 3217-3230.
Holt, N.W. and Winkleman, G.E. 1983. Availability of residual fertilizer phosphorus as measured by bromegrass-alfalfa dry matter and phosphorus yield and by extractable phosphorus. Can. J. Plant Sci. 63: 173-181.
Holt, N.W. and Zentner, R.P. 1985. Effects of applying inorganic fertilizer and farmyard manure on forage production and economic returns in east-central Saskatchewan. Can J. Plant Sci. 65: 597-607.
Hoyt, P.B., Nyborg, M. and Penney, D.C. 1974. Farming acid soils in Alberta and northeastern British Columbia. Agriculture Canada, Research Branch, Tech. Bull. A53-1521. Canada Department of Agriculture, Information Division, Ottawa, Ontario, Canada.
Hoyt, P.B., Nyborg, M. and Ukrainetz, H. 1981. Degradation by acidification. Pages 41-71 in Proc. 18th
Alberta Soil Science Workshop, Edmonton, Alberta, Canada.. Lardner, H.A. and Cohen, R.D.H. 1998. Forage stand rejuvenation effective alternative. Feed News,
Feed Resource Centre, Saskatoon, Saskatchewan, Canada. Vol. 3 (Issue 2): 4 pp. Lardner, H.A., Wright, S.B.M., Cohen, R.D.H., Curry, P. and MacFarlane, L. 2000. The effect of
rejuvenation of Aspen Parkland ecoregion grass-legume pastures on dry matter yield and forage quality. Can. J. Plant Sci. 80: 781-791.
Lawrence, T. and Knipfel, J.E. 1981. Yield and digestibility of crested wheatgrass and Russian and Altai wild ryegrass as influenced by N fertilization and date of first cutting. Can. J. Plant Sci. 60: 1179-1189.
Leyshon, A.J. 1982. Deleterious effects on yield of drilling fertilizer into established alfalfa stands. Agron. J. 74: 741-744.
Lutwick, L.E. and Smith, A.D. 1979. Yields and N uptake by seven perennial grass species as affected by high rate of N fertilizer. J. Range Manage. 32: 433-436.
Malhi, S.S. 1995. Influence of source, time and method of application and simulated rainfall on recovery of nitrogen fertilizers applied to bromegrass. Fert. Res. 41: 1-10.
Malhi, S.S. 1997. Rate, source and time of N application for meadow bromegrass in central Alberta, Canada. Nutrient Cycling Agroecosystems 46: 241-247.
Malhi, S.S. and Bjorge, M. 1993. Feasibility of urea as a forage fertilizer on meadow bromegrass grown as simulated pasture in central Alberta. Pages 235-245 in F.K. Taha et al. eds. Proc. First Interprovincial Range Conference in Western Canada, 17-20 January, 1993, Saskatoon, Saskatchewan, Canada.
Malhi, S.S. and Dew, D. 1987. Effect of fertilization of peat soils on hay yields. Canadex (Forage Crops- Soil Fertility and Improvement) 120-530, 2 pp, March, 1987. Agriculture Canada, Research Branch, Ottawa, Ontario, Canada.
Malhi, S.S. and Gill, K.S. 2002. Fertilizer N and P effects on root mass of bromegrass, alfalfa and barley. J. Sustain. Agric. 19: 51-63.
Malhi, S.S., and Heier, K. 1993. Improving effectiveness of urea as a forage fertilizer. Pages 479-482 in N.J. Barrow ed. Developments in plant and soil sciences, Vol. 54. Plant nutrition – from genetic engineering to field practice, Kluwer Academic Publishers, Dordrecht, The Netherlands.

25
Malhi, S.S. and Nyborg, M. 1983. Field study of the fate of fall-applied 15N-labelled fertilizers in three Alberta soils. Agron. J. 75: 71-74.
Malhi, S.S. and Ukrainetz, H. 1990. Effect of band spacing of urea on yield and quality of bromegrass. Fert. Res. 21: 185-187.
Malhi, S.S., Dick, A.C. and Walker, D.R. 1985. Effect of sulphur fertilization on crop yield in central Alberta. Canadex (Field Crops, Forages, Fertilizers) 543, September, 1985. Agriculture Canada, Research Branch, Ottawa, Ontario, Canada. 2 pp.
Malhi, S.S., McBeath, D.K. and Baron, V.S. 1986. Effects of nitrogen application on yield and quality of bromegrass hay in central Alberta. Can. J. Plant Sci. 66: 609-616.
Malhi, S.S., Baron, V.S. and McBeath, D.K. 1987a. Economics of N fertilization of bromegrass for hay in central Alberta. Can. J. Plant Sci. 67: 1105-1109.
Malhi, S.S., Walker, D.R. and Dick, A.C. 1987b. Effect of sulphur fertilization on selenium content of forages. Canadex (Forages – Fertilizers) 120.540, 2 pp, July, 1987. Agriculture Canada, Research Branch, Ottawa, Ontario, Canada.
Malhi, S.S., Walker, D.R., Doran, W.J. and Bowman, G.H. 1987c. Relative productivity of a fertilized and unfertilized pasture. Canadex (Pasture Crops- Cultural Practices) 130-21, 2 pp, July 1987. Agriculture Canada, Research Branch, Ottawa, Ontario, Canada.
Malhi, S.S., Harapiak, J.T., Nyborg, M. and Flore, N.A. 1991a. Soil chemical properties after long-term N fertilization of bromegrass. Nitrogen rate. Commun. Soil Sci. Plant Anal. 22: 1447-1458.
Malhi, S.S., Nyborg, M., Harapiak, J.T. and Flore, N.A. 1991b. Acidification of soil in Alberta by nitrogen fertilizers applied to bromegrass. Pages 547-553 in R.J. Wright et al. eds. Plant-Soil Interactions at Low pH, Kluwer Academic Publishers, Dordrecht, The Netherlands.
Malhi, S.S., Harapiak, J.T., Nyborg, M. and Flore, N.A. 1992a. Dry matter yield, protein concentration, N use efficiency and N recovery of bromegrass in south-central Alberta: Effect of time and source of N application. Commun. Soil Sci. Plant Anal. 23: 953-964.
Malhi, S.S., McBeath, D.K. and Nyborg, M. 1992b. Effect of phosphorus fertilization on bromegrass hay yield. Commun. Soil Sci. Plant Anal. 23: 113-122.
Malhi, S.S., McBeath, D.K., Arshad, M.A. and Gill, K.S. 1992c. Effects of phosphorus fertilization on alfalfa hay yield. Commun. Soil Sci. Plant Anal. 23: 717-724.
Malhi, S.S., Nyborg, M. and Robertson, J.A. 1992d. Nitrogen fertilization of brome-alfalfa mixtures. Agfo 211.003, Lacombe Research Station, July, 1992, 3 pp. Agriculture Canada, Research Station, Lacombe, Alberta, Canada.
Malhi, S.S., Nyborg, M., Harapiak, J.T., Robertson, J.A. and Walker, D.R. 1992e. Downward movement of surface-applied P on established forage stands. Commun. Soil Sci. Plant Anal. 23: 1781-1790.
Malhi, S.S., Laverty, D.H., Harapiak, J.T., Kryzanowski, L.M. and Penney, D.C. 1993. Fertilizer management for forage crops in central Alberta. Agriculture Canada, Research Branch, Tech. Bull. 1993-3E, Agriculture Canada, Research Station, Lacombe, Alberta, Canada.
Malhi, S.S., Nyborg, M. and Harapiak, J.T. 1995a. Recovery of 15N-labelled fertilizers applied to bromegrass on a Thin Black Chernozem soil. Can. J. Soil Sci. 75: 539-542.
Malhi, S.S., Nyborg, M., Harapiak, J.T. and Heaney, D.J. 1995b. Long-term effects of ammonium nitrate application on soil pH, and micronutrients in soil and bromegrass hay. Pages 105-110 in R.A. Date et al. eds. Plant-Soil Interactions at Low pH, Kluwer Academic Publishers, Dordrecht, The Netherlands.
Malhi, S. S., Mumey, G., Nyborg, M., Ukrainetz, H. and Penney, D.C. 1995c. Longevity of liming in western Canada: Soil pH, crop yield and economics. In R.A. Date et al. (eds.), Plant Soil Interactions at Low pH, Kluwer Academic Publishers, Netherlands. Pp. 703-710.
Malhi, S.S., Mumey, G., Harapiak, J.T. and Nyborg, M. 1997a. Economic analysis of nitrogen fertilization of smooth bromegrass for hay. J. Prod. Agric. 10: 490-494.

26
Malhi, S.S., Nyborg, M., Harapiak, J.T., Heier, K. and Flore, N.A. 1997b. Increasing organic C and N in soil under bromegrass with long-term N fertilization. Nutrient Cycling Agroecsystems 49: 255-260.
Malhi, S.S., Heier, K., Zhang, M. and Nyborg, M. 1998a. Meadow bromegrass response to coated and conventional urea fertilizers. Can. J. Plant Sci. 78: 589-595.
Malhi, S.S., Nyborg, M., and Harapiak, J.T. 1998b. Effects of long-term N fertilizer-induced acidification on micronutrients in soil and in bromegrass hay. Soil Tillage Res. 48: 91-101.
Malhi, S.S., Harapiak, J.T., Nyborg, M., and Gill, K.S. 2000a. Effects of long-term applications of various nitrogen sources on chemical soil properties and composition of bromegrass hay. J. Plant Nutr. 23: 903-912.
Malhi, S.S., Heier, K., and Solberg, E. 2000b. Effectiveness of elemental S on forage grass. Can. J. Plant Sci. 80: 105-112.
Mahli, S.S., Heier, K., Nielson, K. Davies, W.E., and Gill, K.S. 2000c. Efficacy of pasture rejuvenation through mechanical aeration or N fertilization. Can. J. Plant Sci. 80: 813-815.
Malhi, S.S., Zentner, R.P. and Heier, K. 2001. Banding increases effectiveness of fertilizer P for alfalfa production. Nutrient Cycling Agroecosystems 59: 1-11.
Malhi, S.S., Gill, K.S., Heier, K. and Lickacz, J. 2002a. Effects of single versus split annual applications of N on forage dry matter yield of smooth bromegrass. Commun. Soil Sci. Plant Anal. 33: 3797-3808.
Malhi, S.S., Harapiak, J.T., Gill, K.S. and Flore, N. 2002b. Long-term N rates and subsequent lime application effects on macroelements concentration in soil and in bromegrass hay. J. Sustain. Agric. 21: 79-97.
Malhi, S.S., Harapiak, J.T., Nyborg, M. and Gill, K.S. 2002c. Autumn and spring applications of ammonium nitrate and urea to bromegrass influence total and light fraction organic C in a soil. Can. J. Soil Sci. 82: 211-217.
Mahli, S.S. Zentner, R.P. and Heier, K. 2002d. Effectiveness of alfalfa in reducing fertilizer N input for optimum forage yield, protein concentration, returns and energy performance of bromegrass-alfalfa mixtures. Nutrient Cycling Agroecsystems 62: 219-227.
Malhi, S.S., Brandt, S. and Gill, K.S. 2003a. Cultivated and grassland type effects on light fraction and total C and N in a Dark Brown Chernozemic soil. Can. J. Soil Sci. 83: 145-153.
Malhi, S.S., Foster, A. and Gill, K.S. 2003b. Harvest time and N fertilization effects on forage yield and quality of quackgrass (Elytrigia repens L.) in northeastern Saskatchewan. Can. J. Plant Sci. 83: 779-784.
Malhi, S.S., Harapiak, J.T., Karamanos, R., Gill, K.S. and Flore, N. 2003c. Distribution of P and K in a grassland soil as affected by long-term surface application of N, P and K fertilizers. Nutrient Cycling Agroecosystems 67: 265-272.
Malhi, S.S., Harapiak, J.T., Nyborg, M., Gill, K.S., Monreal, C.M. and Gregorich, E.G. 2003d. Light fraction organic N, ammonium, nitrate and total N in a thin Black Chernozemic soil under bromegrass after 27 annual applications of different N rates. Nutrient Cycling Agroecosystems 65: 201-210.
Malhi, S.S., Harapiak, J.T., Nyborg, M., Gill, K.S., Monreal, C.M. and Gregorich, E.G. 2003e. Total and light fraction organic C in a thin Black Chernozemic grassland soil as affected by 27 annual applications of six rates of fertilizer N. Nutrient Cycling Agroecosystems. 66: 33-41.
Malhi, S.S., Loeppky, H., Coulman, B., Gill, K.S., Curry, P. and Plewes, T. 2004a. Fertilizer N, P, K and S effects on forage yield, and quality of timothy (Phleum pretense L.) in the Parkland zone of Saskatchewan, Canada. J. Plant Nutr. 27: 1341-1360.
Harapiak, J.T., Malhi, S.S., Gill, K.S. and N. Flore. 2004b. Macronutrients concentration in soil and bromegrass hay after 15 annual applications of four N fertilizers at two rates. J. Range Manage. 57: 219-225.

27
McAndrew, D.W. and Malhi, S.S. 1992. Long-term N fertilization of a Solonetzic soil: effects on chemical and biological properties. Soil Biol. Biochem. 24: 619-623.
McCartney, D.H., Waddington, J. and Lefkovitch, L.P. 1999. Animal and plant response on renovated pastures in western Canada. J. Range Manage. 52: 19-26..
McCartney, D.H., Bittman, S., Horton, P.R., Waddington, J. and Nuttall, W.F. 1998. Uptake of N, P and S in fertilized pasture herbage and herbage yield response to fertilizer as affected by soil nutrients. Can. J. Plant Sci. 78: 241-247.
McCartney, D.H., Bittman, S. and Nuttall, W.F. 2002. Influence of harvest management and applied N on seasonal yield, crude protein concentration and N uptake of pasture and hay type grasses in northeastern Saskatchewan. Can. J. Plant Sci. : In Review.
McCaughey, W.P. 1991. Grazing management in Manitoba past, present and future. Manitoba Agri-Forum Conf., Winnipeg, Manitoba, Canada. 9-10 January, 1991. Pp. 125-131.
McCaughey, W.P. and Simons, R.G. 1996. Harvest management and N-fertilization effects on yield regrowth of smooth bromegrass, crested wheatgrass, and meadow bromegrass in the eastern prairies. Can. J. Plant Sci. 76: 773-782.
McCaughey, W.P. and Simons, R.G. 1998. Harvest management and N-fertilization effects on protein yield, protein content and nitrogen use efficiency of smooth bromegrass, crested wheatgrass, and meadow bromegrass. Can. J. Plant Sci. 78: 281-287.
McCaughey, W.P., Smith, E.G. and Gross, A.T.H. 1990. Economics of N-fertilization of dryland grasses for hay production in southwestern Manitoba. Can. J. Plant Sci. 70: 559-563.
Moulin, A.P., McCaughey, P., McCartney, D., Entz, M., Bittman, S. and Nuttall, W.F. 2003. The effect of forage management on carbon storage in pastureland and rotation. Can. J. Plant Sci. In Review.
Moyer, J.R. 1992. Alfalfa yield in establishment and subsequent years after herbicide and phosphorus application during establishment. Can. J. Plant Sci. 72: 619-625.
Naeth, M.A., Pluth, D.J., Chanasyk, D.S., Bailey, A.W. and Fedkenheuer, A.W. 1990. Soil compacting impacts of grazing in mixed prairie and fescue grassland ecosystems of Alberta. Can. J. Soil Sci. 70: 157-167.
Nuttall, W.F., Cooke, D.A., Waddington, J. and Robertson, J.A. 1980. Effects of nitrogen and phosphorus fertilizers on a bromegrass-alfalfa mixture grown under two systems of pasture management. I. Yield, percentage legume in sward, and soil tests. Agron. J. 72: 289-294.
Nuttall, W.F., McCartney, D.H., Bittman, S., Horton, P.R. and Waddington, J. 1991. The effect of N, P, S fertilizer, temperature and precipitation on the yield of bromegrass and alfalfa pasture established on a Luvisolic soil. Can. J. Plant Sci. 71: 1047-1055.
Nyborg, M., Malhi, S.S., Solberg, E.D. and Izaurralde, R.C. 1999. Carbon storage and light fraction C in a grassland Dark Gray Chernozem, soil as influenced by N and S fertilization. Can. J. Plant Sci. 79: 317-320.
Olson, B.M. and Papworth, L. 1999. Application of manure on forages in southern Alberta. Pages 410-431 in Proc. Manure Management 99 Workshop, Extension Division, University of Saskatchewan. Saskatoon, Saskatchewan, Canada.
Pastl, R., Michie, M. and Schoenau, J. 1999. Shallow injection of hog manure into grassland. Pages 86-93 in Proc. Manure Management 99 Workshop, Extension Division, University of Saskatchewan. Saskatoon, Saskatchewan, Canada.
Penney, D.C., Malhi, S.S. and Kryzankowski, L. 1990. Effect of rate and source of N fertilizer on yield, quality and N recovery of bromegrass grown for hay. Fert. Res. 25: 159-166.
Popp, J.D., McCaughey, W.P., Cohen, R.D.H., McAllister, T.A., and Majak, W. 2000. Enhancing pasture productivity with alfalfa: A review. Can. J. Plant Sci. 80: 513-519.
Read, D.W.L. and Winkleman, G.E. 1982. Residual effects of nitrogen and phosphorus fertilizer on crested wheatgrass under semiarid conditions. Can. J. Plant Sci. 62: 415-425.

28
Robertson, J.A., Cooke, D.A. and Beacom, S.E. 1979. A comparison of four systems of managing yearling beef steers on rotationally grazed bromegrass-alfalfa pasture. Can. J. Anim. Sci. 59: 519-529.
Schoenau, J.J., Bolton, K. and Panchuk, K. 2000. Managing manure as a fertilizer. Farm Facts, November 2000, Saskatchewan Agriculture and Food, Regina, Saskatchewan, Canada.
Selles, F. and Jefferson, P. 2000. Phosphorus and dryland alfalfa production. Semiarid Prairie Agricultural Research Centre, Agriculture and Agri-Food Canada, Swift Current, Saskatchewan, Canada.
Simons, R.G., Grant, C.A. and Bailey, L.D. 1995. Effect of fertilizer placement on yield of established alfalfa stands. Can. J. Plant Sci. 75: 883-887.
Simons, R.G. and Gross, A.T.H. 1985. Growth of four grass species as affected by rate of nitrogen application and year of establishment on two soil types. Can. J. Plant Sci. 65: 581-588.
Smith, A.D. and Lutwick, L.E. 1975. Effects of N fertilizer on total-N and NO3-N content of six grass species. Can. J. Plant Sci. 55: 573-577.
Soon, Y.K. 1997. Effect of rate, placement and frequency of P application on yield and P content of bromegrass-red clover herbage and soil P distribution. Can. J. Soil Sci. 77: 77-81.
Statistics Canada. 1991. Statistics canada 1991 census. Government of Canada, Ottawa, Ontario, Canada.
Ukrainetz, H. and Campbell, C.A. 1988. N and P fertilization of bromegrass in the Dark Brown soil zone of Saskatchewan. Can. J. Plant Sci. 68: 457-470.
Ukrainetz, H., Campbell, C.A., Zentner, R.P. and Monreal, M. 1988. Response of bromegrass to N, P and S fertilizer on a Gray Luvisolic soil in northwestern Saskatchewan. Can. J. Plant Sci. 68: 687-703.
Waddington, J., McCartney, D.H. and Lefkovitch, P. 1999. Effects of management on species dynamics of Canadian aspen parkland pastures. J. Range Manage. 52: 60-67.
Webster, G.R., McBeath, D.K., Heapy, L.A., Lore, H.C., Von Maydell, U.M. and Robertson, J.A. 1976. Influence of fertilizers, soil nutrients and weather on forage yield and quality in central Alberta. Alberta Institute of Pedology Publication Number M-76-10, Edmonton, Alberta, Canada.
Western Canada Handbook. Western Canada Fertilizer Association. Zentner, R.P., Ukrainetz, H. and Campbell, C.A. 1989. The economics of fertilizing bromegrass in
Saskatchewan. Can. J. Plant Sci. 69: 841-859. Zhang, M., Nyborg, M. and Malhi, S.S. 1998. Comparison of controlled-release N fertilizers on
turfgrass in a moderate temperature area. Hort. Sci. 33: 1203-1206.

29
Table 3. Dry matter yield (DMY) of bromegrass hay with annual application of ammonium nitrate (AN) in early spring at various N rates at different locations in Albertaz
Rate of N (kg N ha-1) Location 0 50 100 150 200 300 DMY (t ha-1) North-central
(Ave. 3 yr - 2 sites) 1.37 2.99 4.11 5.16 5.82 7.09
Central
(Ave. 4 yr - 2 sites) 3.60 6.00 8.03 9.84 10.23 10.19
Central
(Ave. 3 yr - 1 site) 4.02 5.82 7.38 7.83 7.43 7.41
East-central
(Ave. 1 yr - 1 site) 3.02 4.92 5.49 5.05 5.16 5.05
Rate of N (kg N ha-1) 0 56 112 168 224 280 336 DMY (t ha-1) South-central
(Ave. 19 yr - thin Black soil)
1.17 3.63 5.24 5.41 5.69 5.62 5.45
Rate of N (kg N ha-1) 0 50 100 150 200 250 300 DMY (t ha-1) Central
(Ave. 4 yr - Black soil)
2.46 4.47 5.86 6.81 8.02 8.56 9.29
Central
(Ave. 4 yr - Gray soil) 2.11 3.84 5.44 6.21 6.70 7.46 7.78
zSource: Penney et al. 1990. Fert. Res. 25: 159-166; Malhi et al. 1986. Can. J. Plant Sci. 66: 609-616; Harapiak et al. 1992b. Commun. Soil Sci. Plant Anal. 23: 1245-1256; Malhi 1997. Nutrient Cycling Agroecosystems 46: 241-247.

30
Table 4. Dry matter yield (DMY) of hay from various grasses with annual applications of ammonium nitrate (AN) in early spring at various N rates at different locations in Saskatchewan and Manitobaz
Rate of N (kg N ha-1) Location 0 50 100 200 Saskatchewan DMY (t ha-1) Loon Lake (Ave. 9 yr - Gray soil)
1.12 2.27 2.86 3.71
Scott
(Ave. 4 yr - Dark Brown soil) 0.57 1.53 2.20 2.57
Swift Current (Ave. 5 yr - Brown soil)
0.79 1.34
Rate of N (kg N ha-1) 0 84 168 252 Manitoba DMY (t ha-1) Clay loam Bromegrass 5.18 6.27 7.31 7.73 IWGy 5.92 7.18 7.79 8.48 CWG 5.30 6.07 6.79 7.43 RWR 3.87 5.03 5.81 6.48 Sandy loam Bromegrass 1.47 3.29 4.27 5.06 IWGy 1.68 3.63 4.45 4.70 CWG 2.04 3.57 4.07 5.12 RWR 0.89 1.82 2.55 2.66 zSource: Ukrainetz and Campbell 1988. Can. J. Plant Sci. 68: 457-470; Ukrainetz et al. 1988. Can. J. Plant Sci. 68: 687-703; Campbell et al. 1986. Can. J. Plant Sci. 66: 915-931; Simons and Gross 1985. Can. J. Plant Sci. 65: 581-588. yIWG, CWG and RWR refer to intermediate wheatgrass, crested wheatgrass and Russian wild ryegrass, respectively.

31
Table 5. Dry matter yield increase (DMYI), protein yield increase (PY), protein concentration (PC), N-use efficiency (NUE) and N recovery (NR) of meadow bromegrass with surface-broadcast of urea and ammonium nitrate (AN) at two sites in central Alberta; different rates o f N applied annually in mid to late April of 1988 to 1991 (Experiment 1) and different times of five 112 kg N ha-1 annual applications, from 1988 to 1992 (Experiment 2)z
Fertilizer/ Eckville Lacombe Application time/ N rate
DMYI (t ha-1)
PYI (kg ha-1)
PC (g kg-1)
NUE (kg DM
kg N-1 ha-1)
NR (%)
DMYI (t ha-1)
PYI (kg ha-1)
PC (g kg-1)
NUE (kg DM
kg N-1 ha-1)
NR (%)
Experiment 1 (average of 1988 to 1991 years) Means across urea and AN for different N rates (kg N ha-1) 50 1.53 186 119 30.7 60 1.95 241 115 39.0 77 100 3.06 434 128 30.6 70 3.32 487 127 33.2 78 150 3.84 605 134 22.6 65 4.24 687 136 28.3 73 200 4.44 797 146 22.2 64 5.31 962 148 26.6 77 250 5.11 996 154 20.4 64 5.97 1158 158 23.9 74 300 5.23 1088 162 17.4 58 6.53 1333 168 21.8 71 LSD0.05 0.35 74 4.1 2.34 6.4 0.32 73 4.3 2.76 ns Means across 50, 100, 150, 200 and 250 kg N ha-1 rates for urea and AN Urea 3.60 594 135 22.5 55.2 4.40 766 139 27.8 71 AN 4.14 775 146 26.5 71.2 4.71 857 145 29.7 79 LSD0.05 0.20 43 2.4 1.35 3.71 0.18 42 2.5 1.60 4.0
Experiment 2 (average of 1988 to 1992 years) Means across urea and AN at 112 kg N ha-1 for different application times Early fall 3.36 378 119 33.6 58.4 2.75 342 123 27.5 60 Late fall 2.95 346 123 29.5 56.5 2.23 286 123 22.3 49 Early winter 2.76 296 119 27.6 46.8 2.20 286 124 22.0 51 Early spring 3.47 414 122 34.7 60.4 2.83 408 129 28.3 67 Late spring 3.20 384 126 32.0 60.5 2.37 368 132 23.7 60 LSD0.05 0.36 39 4.2 3.6 5.7 0.41 40 4.9 4.06 6.6 Means across different application times at 112 kg N ha-1 for urea and AN Urea 2.78 306 119 27.8 47.6 2.29 306 124 22.9 52 AN 3.51 420 125 35.1 65.4 2.66 370 128 26.6 63 LSD0.05 0.22 25 2.7 2.2 3.6 0.26 25 3.1 2.57 4.2 zSource: Malhi 1997. Nutrient Cycling Agroecosystems 46: 241-247.

32
Table 6. Dry matter yield (DMY) and protein concentration (PC) of cut 1 (harvested at flowering) and cut 2 (harvested near end of growing season) bromegrass hay with six annual rates of ammonium nitrate (AN) at two locations in north-central Albertaz
Rate of N (kg N ha-1) Location Cut 0 50 100 150 200 300 DMY (t ha-1) Ellerslie 1 0.61 2.30 2.93 3.38 3.41 4.06 2 NDy ND 0.26 0.52 1.27 2.25 Total 0.61 2.30 3.19 3.90 4.68 6.31 Vimy 1 2.13 3.67 4.11 4.59 4.12 4.38 2 ND ND 0.91 1.83 2.84 3.48 Total 2.13 3.67 5.02 6.42 6.96 7.86 PC (%) Ellerslie 1 100 110 133 144 169 176 2 ND ND 43 56 107 169 Vimy 1 131 102 119 148 163 172 2 ND ND 105 113 116 146 zSource: Penney et al. 1990. Fert. Res. 25:159-166. yND refers to not determined because there was no regrowth in these treatments.
Table 7. Dry matter yield (DMY) of smooth bromegrass hay (kg ha-1) for different rates of N (kg N ha-1) in single initial or annual applications (summed over the study period) at different locations in Alberta and Saskatchewanz
DMY (t ha-1) with single and annual N applications Single Annual Single Annual Location 0 150 3x50 100 3x100 North-central Alberta (2 sites)
4.11 8.27 8.97 10.39 11.33
Single Annual Single Annual 0 200 4x50 400 4x100 Central Alberta (4 sites)
18.43 24.34 27.04 28.53 32.09
Single Annual Single Annual Single Annual 0 200 4x50 400 4x100 800 4x200 Scott, Saskatchewan 2.62 6.54 6.46 7.22 8.74 7.68 9.93 Loon Lake, Saskatchewan 6.70 10.66 11.58 14.52 13.41 17.51 18.53 Single Annual Single Annual Single Annual 0 1000 5x200 600 6x100 400 8x50 Loon Lake, Saskatchewan 20.13 21.09 16.84 17.60 17.44 19.64 zSource: Penney et al. 1990. Fert. Res. 25: 159-166; Malhi et al. 1986. Can. J. Plant Sci. 66: 609-616; Ukrainetz and Campbell 1988. Can. J. Plant Sci. 68: 457-470; Ukrainetz et al. 1988. Can. J. Plant Sci. 68: 687-703.

33
Table 8. Seasonal distribution and total of the increase in dry matter yield (DMY) and protein yield (PY) of bromegrass for autumn and spring initiated single, split50 and split33 modes of N application (averaged across 1993 to 1995 years and 60, 120 and 180 kg N ha-1 rates)z
Initiation of N application
Mode of N application
Cut 1
Cut 2
Cut 3
Total
DMY increase (t ha-1) Autumn Single 2.54 0.36 0.43 3.23 Split50 1.65 0.65 1.12 3.42 Split33 1.16 0.83 1.47 3.46 Spring Single 2.01 0.72 0.59 3.31 Split50 1.48 0.89 1.43 3.80 Split33 1.13 0.94 1.73 3.80 SEM 0.061** 0.155ns
PY increase (kg ha-1) Autumn Single 516 62 40 619 Split50 261 102 121 484 Split33 176 137 166 480 Spring Single 474 133 56 663 Split50 285 150 163 599 Split33 196 160 220 577 SEM 10.4* 27.5ns
zSource: Malhi et al. 2002a. Commun. Soil Sci. Plant Anal. In press y**significant at P<0.01.

34
Table 9. Recovery of fertilizer N (112 kg N ha-1) in bromegrass grown on a Thin Black Chernozem soil at Crossfield, Albertaz Plants Soil Plants Cut 1 Cut 2 Total (0-60 cm) +soil Recovery (%) Means across application times Urea: Broadcast 23.3 5.3 28.6 27.3 55.9Urea: Bandy 27.9 6.0 33.9 33.7 67.5 AN: Broadcast 32.4 6.4 38.8 27.8 66.6AN: Band 33.4 6.5 39.9 35.2 75.1 LSD0.05 2.5 ns 2.6 ns ns Means across placement methods and fertilizer types Early autumn 23.1 5.7 28.8 32.2 61.0Late autumn 24.9 5.4 30.3 31.1 61.4Early spring 31.2 5.8 37.0 28.6 66.6Late spring 36.7 7.1 44.0 32.0 76.0 LSD0.05 4.2 1.1 4.0 ns 5.6zSource: Malhi et al. 1995a. Can. J. Soil Sci. 75: 539-542. yBand was 0.5 cm wide, 4 cm deep and 22.5 cm apart. Table 10. Dry matter yield (DMY) of bromegrass treated annually with ammonium nitrate (AN) and urea fertilizer applied in fall, winter or spring in Alberta and Saskatchewanz
DMY (t ha-1) with different times and sources of N Late Sept. Late Oct. Late Nov. Late Apr. Late May Location Check AN Urea AN Urea AN Urea AN Urea AN Urea Alberta Central (Ave. 4 yr - 2 sites)
2.42 5.86 5.32 5.38 4.84 5.36 4.73 6.11 5.34 5.53 5.11
Late Sept. Late Oct. Late Apr. Late May Check AN Urea AN Urea AN Urea AN Urea South-central (Ave. 15 yr - 4 sites)
2.06 4.39 3.80 4.32 3.85 4.53 3.96 4.26 3.98
Mid. Oct. Mod. Nov. Mid. Dec. Mid. Mar. Mid. Apr. Check AN Urea AN Urea AN Urea AN Urea AN Urea Saskatchewan Scott (Ave. 3 yr - 1 site)
0.72 1.70 1.44 1.65 1.43 1.66 1.40 1.44 1.32 1.51 1.42
Late Oct. Late Nov. Late Dec. Mid. Apr. Check AN Urea AN Urea AN Urea AN Urea Swift Current (Ave. 4 yr - 1 site)
0.79 1.28 1.15 1.27 1.01 1.10 1.06 1.34 1.15
zSource: Malhi 1997. Nutrient Cycling Agroecosystems 46: 241-247; Malhi et al. 1992a. Commun. Soil Sci. Plant Anal. 23: 953-964; Campbell et al. 1986. Can. J. Plant Sci. 66: 915-931.

35
Table 11. Dry matter yield (DMY), protein yield (PY) and N-use efficiency (NUE) of meadow bromegrass, managed as simulated pasture, treated annually with urea and ammonium nitrate (AN) at 80 kg N ha-1 applied in autumn and spring using different methods of placement at two sites in central Alberta (average of 1989 to 1991)z
Fertilizer treatment DMY (t ha-1)
PY (kg ha-1)
NUE (kg DMY kg-1 N ha-1)
Type Time Method Eckville Lacombe Eckville Lacombe Eckville Lacombe Urea Autumn Broadcast 4.51 4.29 485 434 28.5 27.1 Disc-band 4.89 5.11 551 556 33.0 37.4 Knife-
band 4.46 4.84 495 518 27.9 34.0
Urea Spring Broadcast 4.45 5.19 517 602 27.8 38.3 Disc-band 4.61 5.33 548 623 29.7 40.1 Knife-
band 4.11 4.76 481 547 23.6 32.9
AN Spring Broadcast 5.05 5.53 614 664 35.2 42.6 Disc-band 4.87 5.16 585 602 33.0 38.0 Check 2.23 2.12 230 211 zSource: Malhi and Heier 1993. Plant Nutrition 54: 479-482. Table 12. Dry matter yield (DMY) and protein yield (PY) of meadow bromegrass treated with urea (60 kg N ha-1) in late spring following various methods of placement at two sites in central Albertaz
DMY (t ha-1) PY (kg ha-1) Method of placement Lacombe Eckville Lacombe EckvilleCheck 2.92 2.25 283 217Broadcast 3.58 3.06 345 283Band – 15 cm 3.95 3.56 439 332Band – 22.5 cm 3.57 3.48 392 332Band – 30 cm 3.67 3.08 397 304Band – 37.5 cm 3.48 2.81 381 291zSource: Malhi and Ukrainetz 1990. Fert. Res. 21: 185-187.
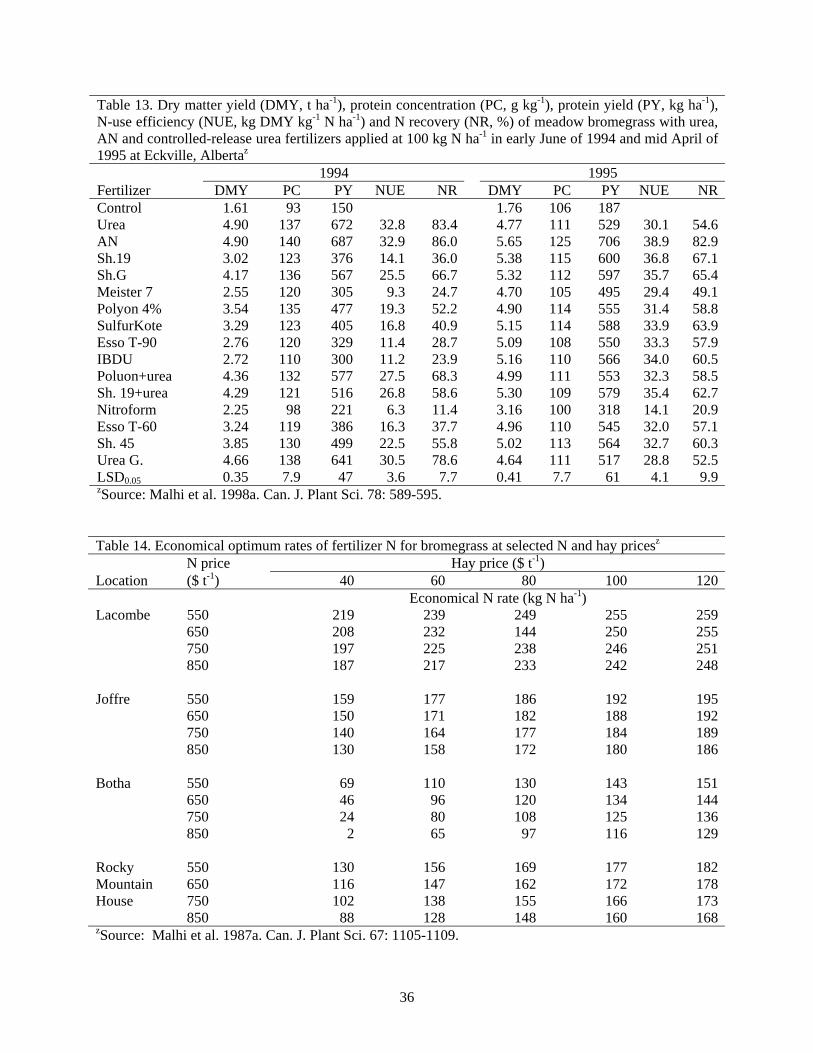
36
Table 13. Dry matter yield (DMY, t ha-1), protein concentration (PC, g kg-1), protein yield (PY, kg ha-1), N-use efficiency (NUE, kg DMY kg-1 N ha-1) and N recovery (NR, %) of meadow bromegrass with urea, AN and controlled-release urea fertilizers applied at 100 kg N ha-1 in early June of 1994 and mid April of 1995 at Eckville, Albertaz
1994 1995 Fertilizer DMY PC PY NUE NR DMY PC PY NUE NRControl 1.61 93 150 1.76 106 187 Urea 4.90 137 672 32.8 83.4 4.77 111 529 30.1 54.6AN 4.90 140 687 32.9 86.0 5.65 125 706 38.9 82.9Sh.19 3.02 123 376 14.1 36.0 5.38 115 600 36.8 67.1Sh.G 4.17 136 567 25.5 66.7 5.32 112 597 35.7 65.4Meister 7 2.55 120 305 9.3 24.7 4.70 105 495 29.4 49.1Polyon 4% 3.54 135 477 19.3 52.2 4.90 114 555 31.4 58.8SulfurKote 3.29 123 405 16.8 40.9 5.15 114 588 33.9 63.9Esso T-90 2.76 120 329 11.4 28.7 5.09 108 550 33.3 57.9IBDU 2.72 110 300 11.2 23.9 5.16 110 566 34.0 60.5Poluon+urea 4.36 132 577 27.5 68.3 4.99 111 553 32.3 58.5Sh. 19+urea 4.29 121 516 26.8 58.6 5.30 109 579 35.4 62.7Nitroform 2.25 98 221 6.3 11.4 3.16 100 318 14.1 20.9Esso T-60 3.24 119 386 16.3 37.7 4.96 110 545 32.0 57.1Sh. 45 3.85 130 499 22.5 55.8 5.02 113 564 32.7 60.3Urea G. 4.66 138 641 30.5 78.6 4.64 111 517 28.8 52.5LSD0.05 0.35 7.9 47 3.6 7.7 0.41 7.7 61 4.1 9.9zSource: Malhi et al. 1998a. Can. J. Plant Sci. 78: 589-595. Table 14. Economical optimum rates of fertilizer N for bromegrass at selected N and hay pricesz
N price Hay price ($ t-1) Location ($ t-1) 40 60 80 100 120 Economical N rate (kg N ha-1) Lacombe 550 219 239 249 255 259 650 208 232 144 250 255 750 197 225 238 246 251 850 187 217 233 242 248 Joffre 550 159 177 186 192 195 650 150 171 182 188 192 750 140 164 177 184 189 850 130 158 172 180 186 Botha 550 69 110 130 143 151 650 46 96 120 134 144 750 24 80 108 125 136 850 2 65 97 116 129 Rocky 550 130 156 169 177 182Mountain 650 116 147 162 172 178House 750 102 138 155 166 173 850 88 128 148 160 168zSource: Malhi et al. 1987a. Can. J. Plant Sci. 67: 1105-1109.

37
Table 15. Economic returns with N application (kg N ha-1) from urea and ammonium nitrate (AN) at different times at Scott and Swift Current (1981 to 1984)z
Time of N application Location
Fertilizer
Check
Mid. Oct
Mid. Nov.
Mid. Dec.
Mid. Mar.
Mid. Apr.
Mid. May
Economic return ($ ha-1) Scott AN 15 48 46 46 25 47 43 Urea 15 31 31 29 19 33 29 Check Late
Oct.Late. Nov.
Late. Dec.
Late Apr.
Economic return ($ ha-1) Swift Current AN 11 13 12 1 14 Urea 7 4 -5 -2 2 zSource: Campbell et al.1986. Can. J. Plant Sci. 66: 915-931. Table 16. Average (from 1968 to 1986) dry matter yield (DMY), protein concentration (PC) and net present value (NPV) using contemporary hay and fertilizer prices, and the effect of PC in hay adjustment on the NPV at N cost/hay price ratio of 7 for bromegrass at seven N rates as AN at Crossfield, Albertaz
Bromegrass Rates of N (kg N ha-1) characteristic 0 56 112 168 224 280 336 SEM DMY (t ha-1) 0.52 1.62 2.34 2.41 2.54 2.52 2.43 0.04 PC (g kg-1) 73 72 85 96 110 109 116 NPV ($ ha-1) 195 306 264 240 170 101 7.4 NPV ($ ha-1) without adjusted for PC
138 217 205 190 158 114 4.9
NPV ($ ha-1) with adjusted for PC
124 225 237 254 222 193 4.9
zSource: Malhi et al. 1997a. J. Prod. Agric. 10: 490-494.

38
Table 17. Average (from 1974 to 1988) dry matter yield (DMY), protein concentration (PC) and net present value (NPV) using contemporary hay and fertilizer prices, and the effect of PC in hay adjustment on the NPV at N cost/hay price ratio of 7 with different sources (urea and AN) an times of 112 kg N ha-1 applied to bromegrass at four sites (Crossfield, Calgary, Okotoks, and Airdrie) in Albertaz
Application DMY PC NPV ($ ha-1) N source time (t ha-1) (g kg-1) Contemporary Not PC adjusted PC adjusted None None 0.93 88 Early fall AN 1.97 104 114 91z 121z
Urea 1.71 94 47 64 77Late fall AN 1.94 102 106 89 114 Urea 1.74 96 52 69 82Early spring AN 2.04 105 138 111 143 Urea 1.78 102 72 84 109Late spring AN 1.89 115 109 91 141 Urea 1.76 113 69 82 126 LSD0.05 0.03 4.9 12.4 12.4zSource: Malhi et al. 1997a. J. Prod. Agric. 10: 490-494. The N cost ratio was 0.8 between urea and AN. Table 18. The relationship of year and nitrogen fertilizer on yield of bromegrass and alfalfa herbage and percent alfalfa in the sward from 1978 to 1980z
N rate (kg N ha-1) N rate (kg N ha-1) Year 0 45 90 0 45 90 DMY (t ha-1) Legume (%) 1978 2.30 3.69 4.16 30.9 22.5 14.01979 4.16 4.31 4.51 17.6 11.5 11.01980 1.17 1.39 1.69 6.1 3.8 5.2zSource: Harapiak and Flore 1984. Proc. Alberta Soil Science Workshop. Pp.256-263.

39
Table 19. Dry matter yield (DMY) and economic returns above fertilizer costs with different rates of N applied to smooth bromegrass-alfalfa mixtures managed as hay at different soils and locations in central Albertaz
Soil type Sites (no.)
NO3-N in soil (kg ha-1)
Study length (years)
Proportion of alfalfa (%)
Rate of N (kg N ha-1)
DMY (t ha-1)
Net return ($ ha-1)
Black 3 55 4 60 0 5.24 Chernozem 45 5.38 -11 90 5.47 -27 135 5.39 -56 180 5.52 -68Gray 2 6 2 or 3 36 0 2.01 Luvisol 45 2.64 28 90 3.13 45 135 3.28 34 180 3.55 33Gray 1 23 4 57 0 4.43 Luvisol 45 4.99 22 90 4.97 -2 135 5.10 -14 180 5.60 4Gray 2 ND 3 to 5 50 0 2.83 Luvisol 22.5 3.15 14 45 3.41 24 90 3.70 25zSource: Webster et al. 1976. Alberta Institute of Pedology Publication Number M-76-10; Malhi et al. 1992d. Agfo 211.003, Lacombe Research Station, 3 pp.

40
Table 20. Dry matter yield (DMY, kg ha-1), protein concentration (PC, g kg-1), protein yield (PY, kg ha-1), net returns (NR, $ ha-1) and energy output/energy input ratio (EO/EI) of hay from various bromegrass-alfalfa compositions, treated annually with different rates of ammonium nitrate at Eckville in central Alberta (average of 1993 to 1995)
Rate of N Composition
(kg N ha-1)
DMY PC (cut 1) PC (cut 2) PY NR EO/EI
Pure bromegrass
0
3748
75.0
122.6
312
119
74.1
50
6571
69.1
107.7
473
169
25.5
100
9336
84.6
103.7
801
310
20.3
150
11199
107.0
98.6
1164
467
17.1
200
13293
118.9
98.7
1459
589
15.6
Bromegrass: alfalfa (2:1)
0
8855
111.8
142.5
1112
555
101.0
50
11894
98.3
137.3
1300
621
39.6
100
12807
98.9
129.0
1355
614
26.0
150
13486
112.2
117.6
1482
642
19.7
200
14261
124.6
107.4
1622
678
16.3
Bromegrass: alfalfa (1:1)
0
10687
121.2
150.2
1409
717
104.5
50
10977
101.2
138.4
1249
590
36.9
100
12534
109.5
131.8
1444
658
25.3
150
13613
111.5
124.2
1529
667
19.7
200
14386
125.2
116.0
1685
712
16.3
Bromegrass: alfalfa (1:2)
0
9850
124.2
141.5
1291
652
101.2
50
11851
121.1
137.1
1479
712
38.7
100
12805
113.4
133.3
1510
693
25.5
150
13650
115.9
126.8
1577
692
19.6
200
14449
132.4
117.2
1732
736
16.2
Pure alfalfa
0
8953
181.7
167.7
1559
785
97.5
50
9542
167.9
163.8
1554
740
32.4
100
10021
187.8
158.9
1723
790
20.4
150
9880
182.3
166.1
1685
731
14.5
200
10251
188.4
161.6
1759
732
11.7
LSD0.05 (comp. x rate)
1090
12.5
9.6
197
106
3.4
zMalhi et al. 2002f. Nutrient Cycling Agoecosystems In Press.

41
Table 21. Average dry matter yield (DMY), protein concentration (PC) and P concentration of forage with six rates of P fertilizer applied annually to alfalfa or bromegrass at different sites in Alberta (Lacombe and Botha) and Manitoba (Brandon)z
Forage Duration Rate of P (kg P ha-1) Type Site (yr) Parameter 0 10 20 30 40 60
Alfalfa Brandony 5 DMY (t ha-1) 5.0 6.1 10.2 12.5 11.2 PC (g kg-1) 113 125 138 200 188 P (g kg-1) 0.8 1.5 2.0 2.2 2.5 Lacombex 3 DMY (t ha-1) 4.53 6.26 7.5 7.47 7.64 7.65 Bothax 4 DMY (t ha-1) 4.07 4.32 4.73 4.98 5.55 4.89 Bromegrass Lacombex 4 DMY (t ha-1) 8.74 10.38 10.59 10.89 10.68 11.38zSource: Bailey, L.D. Personal communication. Agriculture and Agri-Food Canada, Research Centre, Brandon, Manitoba, Canada; Malhi et al. 1992b. Commun. Soil Sci. Plant Anal. 23:113-122; Malhi et al. 1992c. Commun. Soil Sci. Plant Anal. 23: 717-724. yThe rate of P at Brandon was 50 kg P ha-1. xSoil test P was 18 and 27 kg P ha-1 at Lacombe and Botha, respectively. Table 22. Dry matter yield (DMY) of smooth bromegrass and alfalfa treated with four levels of P incorporated into soil in the establishment year (1974) and harvested from 1975 until 1979 at Lacombe in central Albertaz Forage Levels of applied P (kg P/ha) type Year 0 60 120 180 DMY (t ha-1) Bromegrass 1975 10.06 11.47 11.02 12.24 1976 10.79 11.66 13.42 12.38 1977 9.39 10.42 10.87 10.32 1978 8.07 10.90 9.72 9.25 1979 6.69 7.74 7.82 7.74 Alfalfa 1975 5.95 6.63 7.05 7.36 1976 4.21 7.06 7.79 7.73 1977 3.47 6.88 8.50 7.66 zSource: Malhi et al. 1992b. Commun. Soil Sci. Plant Anal. 23: 113-122; Malhi et al. 1992c. Commun. Soil Sci. Plant Anal. 23: 717-724.

42
Table 23. Extractable P in soil after seven and four annual applications of P fertilizer, respectively, to creeping red fescue and alfalfa on a Black Chernozem soil at Lacombe in central Albertaz
Rate of P Soil depth (cm) Soil depth (cm) (kg P ha-1) 0-5 5-15 15-30 0-7.5 7.5-15 15-30 Extractable P (mg kg-1) in creeping red fescue Extractable P (mg kg-1) in alfalfa 0 17 10 6 3 3 110 48 12 9 10 4 220 87 13 8 20 8 240 145 25 10 29 9 280 258 72 19 53 9 2zSource: Malhi et al. 1992e. Commun. Soil Sci. Plant Anal. 23: 1781-1790 Table 24. Influence of rate and method of P application on dry matter yield (DMY) of alfalfa in a field experiment (average of 5 years from 1992 to1996) at Ponoka in north-central Albertaz
Rate of broadcast P (kg P ha-1) Rate of disc-banded P (kg P ha-1) Check 10 20 30 40 10 20 30 40 DMY (t ha-1) 2.16 4.16 6.04 7.23 7.30 5.58 7.19 7.53 8.24zSource: Malhi et al. 2001. Nutrient Cycling Agroecosystems 59: 1-11.
Table 25. Average (across 5 years) dry matter yield (DMY), protein concentration and K concentration in forages with five rates of K fertilizer (KCl) applied annually to alfalfa grown on five soils in Manitoba (numbers in parentheses next to soil represent initial exchangeable K, kg ha-1, in soil)z
Rate of K (kg K ha-1) Measurement Soil 0 50 75 100 200DMY (t ha-1) Souris (50) 1.82 4.16 5.36 6.96 8.28 Miniota (125) 3.46 5.42 6.40 7.02 9.26 Waitville 4.74 6.40 6.96 7.64 9.80 Carroll (695) 11.52 11.48 11.50 11.60 11.59 Newdale (972) 8.96 10.34 10.56 10.52 10.54 PC (g kg-1) Souris (50) 100 119 125 163 200 Miniota (125) 94 113 156 150 219 Waitville 113 150 156 200 219 Carroll (695) 188 206 219 219 238 Newdale (972) 150 188 200 200 225 K (g kg-1) Souris (50) 10 13 15 15 24 Miniota (125) 11 13 15 15 23 Waitville 13 15 18 18 25 Carroll (695) 22 23 26 26 30 Newdale (972) 18 20 21 21 32zSource: Bailey 1983. Can. J. Soil Sci. 63: 211-219.

43
Table 26. Dry matter yield (DMY), protein concentration (PC) and S concentration in forage with five rates of sulphate-S fertilizer applied annually to alfalfa on a Gray Luvisol soil (initial SO4-S of 15 kg S ha-
1 in soil) in Manitoba (average of 5 years)z
Rate of S (kg S ha-1) Measurement 0 17 34 51 67 DMY (t ha-1) 3.6 6.2 9.6 12.0 11.7PC (g kg-1) 88 113 188 206 213S (g kg-1) 1.0 1.6 2.1 2.3 2.3zSource: Western Canada Sulphur Handbook, Western Canada Fertlizer Association.
Table 27. Selenium concentration in top growth of forage species sampled at early flower stage in west-central Albertaz
Forage Species
Yield response to S fertilizer
No. of samples
Without S fertilizer
With S fertilizer
Selenium concentration (ppb) Alfalfa Yes 10 242 (10-1005)y 112 (12-470) No 13 113 (10560) 79 (13-217)Alsike clover Yes 31 18 (3-59) 13 (2-27) No 7 24 (7-68) 15 (6-22)Red clover Yes 26 19 (7-56) 11 (4-23) No 4 8 (6-9) 7 (4-8)Bromegrass Yes 7 28 (12-58) 22 (4-33) No 8 31 12-86() 26 (12-43)Timothy Yes 19 12 (4-19) 11 (5-26) No 6 12 (6-19) 9 (4-17)zSource: Malhi et al. 1987b. Canadex (Field Crops, Forages, Fertilizers) 120.540, Agriculture Canada, 2 pp. yNumbers in parentheses refer to the range of selenium concentration.
Table 28. Effect of different rates of S fertilizer on forage yield of legume-grass mixtures on soils with different rates of SO4-S in the 0-15 cm soilz
Experiment SO4-S in Rate of S (kg S ha-1) number Soil (kg ha-1) Control 5.6 22.4 44.8 Forage yield (t ha-1) 1 0.1 0.97 1.32 2.46 2.522 0.1 0.27 0.63 0.68 0.653 0.9 1.81 2.02 4.23 3.744 2.6 1.09 1.41 1.88 1.625 5.2 2.24 2.50 2.40 2.60zSource: Malhi et al. 1985. Canadex (Field Crops, Forages, Fertilizers) 543, Agriculture Canada, 2 pp.

44
Table 29. Dry matter yield increase of grass with one sulphate-S (Na2SO4) and two elemental S (Agric-Grade 0-0-0-95 and Tiger 90) fertilizers surface-broadcast annually for three years in early spring at different rates at Leslieville, Albertaz
Rate of S Na2SO4 Agric-Grade 0-0-0-95 Tiger 90 (kg S ha-1) yr 1 yr 2 yr 3 yr 1 yr 2 yr 3 yr 1 yr 2 yr 3 DMY increase (t ha-1) in three years 10 1.81 1.11 2.72 0.17 0.97 2.62 0.22 0.31 0.48 20 2.20 1.58 5.45 0.54 1.23 4.27 0.79 0.58 0.52 30 2.53 1.24 5.88 0.50 1.02 4.68 0.15 0.93 0.54 40 2.84 1.16 5.05 1.18 1.36 5.80 0.05 0.83 0.52 50 2.68 1.43 5.66 0.75 0.74 5.76 0.75 0.90 0.52 zSource: Malhi et al. 2000b. Can. J. Plant Sci. 80: 105-112. Table 30. Effect of different rates of swine manure application in autumn 1997 on dry matter yield (DMY), protein concentration (PC), NO3-N concentration and N uptake of forage in 1998, and soil NO3-N and NH4-N in spring, 1998z
Rate of manure (l ha-1) Parameters
0 (check undisturbed
0 (check disturbed)
37,000
74,000
148,000
LSD0.05
Crested Wheatgrass Total N applied (kg N ha-1) 0 0 105 210 420 Ammonium-N applied (kg N ha-1) 0 0 93 186 371 Total P applied (kg P ha-1) 0 0 6 12 25 DMY (t ha-1) 1.00 0.93 2.40 4.39 4.30 0.89 PC (g kg-1) 110 120 140 120 120 ns NO3-N concentration (g ka-1) 0.0 0.0 0.0 0.1 0.5 ns N uptake (kg N ha-1) 18 18 54 84 83 Soil NO3-N (kg N ha-1), 0-30 cm 3.2 0.4 6.0 40.0 85.0 41.0 Soil NO3-N (kg N ha-1), 30-60 cm 0.4 0.4 0.4 0.3 0.4 0.4 Soil NH4-N (kg N ha-1), 0-30 cm 2.4 1.6 2.2 6.2 4.8 2.8 Soil NH4-N (kg N ha-1), 30-60 cm 1.3 0.9 1.4 0.9 1.0 1.1 Russian Wild Ryegrass Total N applied (kg N ha-1) 0 0 100 200 400 Total P applied (kg P ha-1) 0 0 5 10 20 Total K applied (kg K ha-1) 0 0 48 97 193 DMY (t ha-1) 2.25 2.03 2.68 3.36 3.11 0.93 PC (g kg-1) 230 250 250 230 250 ns NO3-N concentration (g kg-1) 0.4 0.2 2.0 6.0 11.0 3.0 N uptake (kg N ha-1) 81 83 107 124 124 Soil NO3-N (kg N ha-1), 0-30 cm 14 9 22 105 18 66 Soil NO3-N (kg N ha-1), 30-60 cm 0.1 1.1 1.0 2.2 3.4 ns Soil NH3-N (kg N ha-1), 0-30 cm 4.3 6.4 4.0 8.4 9.2 ns Soil NH4-N (kg N ha-1), 30-60 cm 6.6 14.0 18.0 17.1 8.8 ns Smooth Brome-Alfalfa Mixture Total N applied (kg N ha-1) 0 0 81 162 324 Total P applied (kg P ha-1) 0 0 65 129 259 Total K applied (kg K ha-1) 0 0 6 12 23 DMY (t ha-1) 1.65 1.31 2.28 2.76 2.46 0.47 PC (g ka-1) 120 130 130 150 160 20 NO3-N concentration (g kg-1) 0.1 0.1 0.1 0.3 0.7 0.3 N uptake (kg N ha-1) 32 27 47 66 63 Soil NO3-N (kg N ha-1), 0-30 cm 16 6 32 43 59 52 Soil NO3-N (kg N ha-1), 30-60 cm 0.8 0.9 1.4 3.1 3.8 ns
zSource: Pastl et al. 1999. Proc. Manure Management 99 Workshop. Pp. 86-93.

45
Table 31. Effect of harvest management and N fertilizer on the dry matter yield (DMY) of grasses on two soil types near Brandon, Manitobaz
Soil Harvest management N fertilizer rate (kg N ha-1) N contrast type Year Hay Pasture SEM 0 4. 8. 120 160 Linear Quad. DMY (t ha-1) Clay 1992 8.81 6.99 0.17 7.05 7.61 7.96 8.37 8.52 *** nsloam 1993 13.07 9.30 0.30 8.84 9.84 10.91 12.36 13.30 *** ns 1994 6.74 5.09 0.22 3.27 4.88 6.16 6.68 8.58 *** ns Sandy 1992 9.61 7.39 0.12 7.91 4.84 8.41 8.99 9.35 *** nsloam 1993 9.24 4.76 0.17 3.74 5.58 7.01 8.64 9.85 *** ns 1994 6.32 4.08 0.14 2.41 3.44 4.74 6.00 6.91 *** ns zSource: McCaughey and Simons 1996. Can. J. Plant Sci. 76: 773-782. Table 32. Dry matter yield (DMY) of pasture swards and average liveweight gain of steers under three fertilizer regimesz
DMY (t ha-1) Liveweight gain (kg ha-1) (kg DM kg-1 beef) Fertilizer regime
Brome-alfalfa
Brome
Fescue
Brome-alfalfa
Brome
Fescue
Brome-alfalfa
Brome
Fescue
Year 1-3 No fertilizer 1.48 1.22 0.76 233 200 194 6.34 6.07 3.9537 kg N ha-1 1.77 1.88 1.19 272 231 239 6.51 7.27 4.9836 kg N ha-1 + 20 kg P ha-1
1.87 1.94 1.37 297 238 268 6.28 6.83 5.11
Year 4-6 No fertilizer 1.49 0.99 0.56 204 164 142 7.30 6.03 3.9672 kg N ha-1 + 40 kg P ha-1
2.56 2.23 1.86 373 354 330 6.86 6.29 5.62
72 kg N ha-1 + 80 kg P ha-1
2.90 2.86 2.14 439 401 390 6.61 7.11 5.49
zSource: Malhi et al. 1987c. Canadex (Field Crops, Pasture Crops, Cultural Practices) 130.21, Agriculture Canada. 2 pp.

46
Table 33. Effect of rejuvenation treatments and fertilizer on dry matter yield (DMY) of grass-legume mixtures at five sites within the Aspen Parkland ecoregion (average of 3 years)z
Rejuvenation Fertilizer Pathlow DHCy DNCy Insinger Mow DMY (t ha-1) at different sites Control No 7.72 8.20 9.40 7.29 11.02 Yes 11.13 9.82 11.39 12.30 14.04Spike No 7.62 8.29 9.31 6.60 13.20 Yes 9.46 9.72 11.16 11.46 14.32Burn No 10.22 8.48 10.54 7.09 10.32 Yes 11.59 10.57 12.88 12.74 15.55Broadcast No 8.35 7.98 9.95 7.72 10.95 Yes 10.77 10.14 11.88 11.73 13.73Deep-band liquid
No 11.07 11.46 12.28 11.72 15.64
Yes 12.45 11.76 13.74 14.62 14.51Mow No 8.30 7.78 10.00 7.34 10.76 Yes 11.30 10.41 11.69 11.76 15.21zSource: Lardner et al. 2000. Can. J. Plant Sci. 80: 781-791. yDHC and DNC refer to
Table 34. Influence of mechanical aeration and N fertilization dry matter yield (DMY) on pastureland (sites 1-4) and hayland (site 5) in 1991 and 1992 in central Albertaz
Site 3 Site 5 Treatment Site 1 Site 2 Site 4 1991 1992 1991 1992 DMY (t ha-1) N (kg N ha-1) treatment means 0 6.30 3.67 0.87 4.68 7.07 9.04 6.14 56 6.91 5.39 2.31 5.82 9.55 9.12 6.38112 7.45 6.92 4.20 6.47 9.10 9.26 7.16 LSD0.05 0.44 0.40 0.34 0.51 0.57 ns 0.65 Aeration treatment means None 7.01 5.28 2.64 5.74 8.53 9.42 6.83Fall 6.87 5.42 2.58 5.60 8.78 9.21 6.71Spring 6.72 5.41 2.37 5.40 8.25 8.51 6.73Fall + spring 6.93 5.19 2.26 5.90 8.73 9.41 5.98 LSD0.05 ns ns ns ns ns ns nszSource: Malhi et al. 2000c. Can. J. Plant Sci. 80: 813-815.

47
Table 35. Dry matter yield (DMY) of bromegrass-alfalfa mixture on a sedge peat soil fertilized with N, P and K in 1964 at Leslieville, Albertaz
Rate of P or K (kg ha-1) Rate of N (kg N ha-1) P K 0 45 90 DMY (t ha-1) 0 0 2.13 2.74 3.00 0 37 4.16 3.94 4.24 0 74 3.66 4.44 4.13 29 0 3.63 3.28 3.81 29 37 4.91 4.95 5.89 29 74 6.35 5.42 6.03 58 0 3.07 3.39 2.73 58 37 5.56 5.80 5.40 58 74 5.67 7.22 6.70 zSource: Malhi and Dew 1987. Canadex (Field Crops, Forage Crops, Soil Fertility and Improvement) 120.530, Agriculture Canada, 2 pp.
Table 36. Influence of ammonium nitrate application from 1968 to 1994 on bromegrass and lime addition in 1991 on soil pH and concentration of extractable Al, Fe, Mn, Zn, and Cu in the 0-5cm soil layer (lime was applied at a rate to bring pH near 7.0)z
Rate of N Lime pH Al Fe Mn Zn Cu(kg N ha-1) Concentration (mg kg-1) 0 No lime 6.8 0.3 43 27.5 3.61 1.0956 6.0 0.3 94 48.6 4.15 1.17112 4.9 1.8 184 77.9 4.82 1.10168 4.1 24.2 266 14.1 3.27 0.73224 4.0 29.2 297 5.1 3.52 0.59336 3.8 33.9 349 2.8 2.45 0.46 0 Lime 7.1 0.2 47 29.7 3.62 1.1256 6.6 0.3 94 39.5 3.62 1.04112 5.9 0.5 240 49.5 3.17 1.04168 5.8 0.4 319 28.5 3.37 1.11224 6.1 0.2 391 10.4 3.61 1.11336 6.2 0.2 412 8.0 3.15 1.09zSource: Malhi et al. 1998b. Soil Tillage Res. 48: 91-101.

48
Table 37. Effect of N fertilization (as ammonium nitrate - AN and mono ammonium phosphate - MAP) to bromegrass on properties in 0-15 cm depth of a Solonetzic soil in east-central Albertaz Soil AN (kg N ha-1) MAP property Control 76 152 305 74 Kg N ha-1 + 139 kg P ha-1 pH (1:2) 5.7 5.6 4.7 4.2 5.0 SAR 10.5 12.8 7.0 7.2 11.9 mmol kg-1 Soluble Na 14 17 11 11 15 Soluble NO3-Ny 0.01 0.01 0.01 0.26 0.01 Extractable Ca 54 28 35 28 25 Extractable Mg 32 29 22 19 27 Extractable Na 30 30 15 15 29 Extractable NH4-N 1.4 1.5 2.1 2.6 1.6 mg kg-1 Biomass C 465 454 332 285 210 Biomass N 41 49 30 5 15 Mineralizable C 392 410 316 199 364 Mineralizable N 286 264 280 171 232 Organic C Organic N zSource: McAndrew and Malhi 1992. Soil Biol. Biochem. 24: 619-623. yAmounts for 30-90 cm depth, and the shallower depths showed no effect of N fertilization.
Table 38. Effects of a single application of lime to an acid soil in 1965 at Chedderville, Alberta on alfalfa hay yield increase, present value (PV) of commodity added by lime, break-even cost of lime and net present value (NPV) from adding lime (discount rate was 12% over 20 years)z
Hay price
Lime rate (t ha-1)
Measurement ($ t-1) 2.2 4.4 6.6 8.8 11.0Mean yield increase (t ha-1)
1.71 1.87 2.03 2.19 2.35
PV of hay 30 383 418 454 490 526from liming 50 638 697 757 817 877($ t-1) 70 893 976 1060 1144 1227 90 1148 1255 1363 1470 1578 Break even cost 30 174 16 16 16 16of lime ($ t-1) 50 290 27 27 27 27 70 406 38 38 38 38 90 522 49 49 49 49 Cost of lime ($ ha-1) at $50 t-1
110 220 330 440 550
NPV of liming 30 273 198 124 50 -24($ ha-1) 50 528 477 427 377 327 70 783 756 730 704 677 90 1038 1035 1033 1030 1028zSource: Malhi et al. 1995b. Plant Soil Interactions at Low pH (1995). 703-710.

49
Table 39. Influence of rate of applied N on total C and N in soil after 27 years of annual applications of ammonium nitrate to bromegrass grown as hayz N rate Soil depth (cm) Soil depth (cm) N source (kg N ha-1) 0-5 5-10 10-15 0-5 5-10 10-15 C concentration (g kg-1) N concentration (g kg-1) Experiment 1. (different N rates) AN 0 50.3 43.6 36.5 3.79 3.41 2.69 56 61.6 51.2 45.8 4.65 3.85 3.40 112 64.2 48.6 44.7 5.19 3.77 3.51 168 75.5 52.0 48.0 5.94 3.96 3.76 224 78.2 52.9 47.9 6.43 4.14 3.99 336 80.2 49.3 45.5 6.44 4.04 3.94 LSD0.05 10.1 3.9 5.3 0.51 0.31 0.43 Experiment 2. (different N sources and rates) None 0 45.3 42.4 39.6 3.78 3.38 3.07 AN 168 67.6 44.1 41.6 5.15 3.47 3.26 336 70.8 44.4 35.4 5.07 3.61 3.14 Urea 168 60.8 45.3 39.2 4.68 3.61 3.08 336 61.0 42.4 41.0 4.92 3.55 3.07 CN 168 63.7 44.1 43.1 4.93 3.65 3.30 336 66.3 43.8 44.5 5.07 3.60 3.32 AS 168 68.5 44.3 43.9 5.02 3.60 3.26 336 71.4 43.3 40.0 5.66 3.90 3.60 LSD0.05 5.9 ns 4.2 0.60 0.22 0.27 zSource: Malhi et al. 1997b. Nutrient Cycling Agroecosystems 49: 255-260.

50
Table 40. Annual N2O fluxes for different landscape positions and soil textures under three plant communities in the Black soil zone of Saskatchewanz
Landscape Percentage N2O FluxSoil texture and plant type position of area (kg N2O-N ha-1 yr-1)Fertilized cropped Sandy (oat) Shoulder 40 0.074 Footslope 60 0.220 Mean (weighted) 0.162 Fine sandy loam (canola) Shoulder 50 1.249 Footslope 50 3.533 Mean (weighted) 2.368 Clay loam (wheat) Shoulder 55 1.680 Footslope 55 3.012 Mean (weighted) 2.279 Pasture Sandy (alfalfa) Shoulder 30 0.002 Footslope 70 0.057 Mean (weighted) 0.041 Clay loam (bromegrass) Shoulder 0.042 Forest Sandy (aspen) Shoulder 45 0.002 Footslope 55 0.004 Mean (weighted) 0.003 Clay loam (aspen) Footslope 0.003zSource: Corre et al. 1999. Biogeochemistry 44: 29-49.