fertility decline in asia: opportunities and challenges ... decline in asia: opportunities and...
TRANSCRIPT

Fertility Decline in Asia: Opportunities and Challenges
Bhakta Gubhaju
1. INTRODUCTION*During the past half century, the world haswitnessed a remarkable decline in total fertility ratesfrom a high level of 5 children per woman in theperiod 1950-1955 to 2.8 in the period 1995-2000.While the fertility transition was already well underway in Europe, Northern America and Australia/New Zealand during the period 1950-1955, TFRwas very high in the Asian region, at around 6children per woman. Fertility continued to declinein Europe from 2.7 in the period 1950-1955 toreplacement level (2.1 children per woman) duringthe 1970s. The total fertility rate has fallen far belowthe replacement level in Europe (figure 1).
In Northern America, TFR declined from 3.5in the period 1950-1955 to the replacement level inthe early 1970s. TFR had reached a low level of1.8 in the period 1980-1985, after which it increasedslightly but remained stable at below thereplacement level. In Australia/New Zealand,replacement level fertility was reached in the late1970s; although there has been some decline, TFR
has levelled off at 1.8.By contrast, Asia presents a very diverse trend
in fertility over the past 50 years. Asia, in general,had very high fertility in the early 1950s, with thefertility transition first occurring in Eastern Asia inthe late 1950s. A sharp drop in fertility occurredbetween the period 1965-1970 and 1975-1980, witha record decline in the number of children by morethan one child every five years. Eventually, EasternAsia represented the below replacement fertilitygroup during the early 1990s.
According to the 2005 ESCAP Population DataSheet, the total fertility rate in the region has droppedto 2.3 births per woman. This regional average,however, masks a considerable difference in thetota l fer ti li ty ra te (TFR) observed amongsubregions. The TFR has plummeted to belowthe replacement level in East and North-East Asia,and North and Central Asia (1.7 births per woman).In sharp contrast, South and South-West Asiaexhibit a total fertility rate of 3.0 births per woman,while in South-East Asia the total fertility rate is
0
1
2
3
4
5
6
7
1950-1955 1960-1965 1970-1975 1980-1985 1990-1995 2000-2005
Tota
l fer
tility
rate
Europe
Northern America
Australia/New Zealand
Asia
Eastern Asia
South-Central Asia
South-Eastern Asia
Western Asia
Figure 1. Fertility trends by major of the world, 1950-2005
Source: World Population Prospects: The 2004 Revision, United Nations Population Division, New York.
The Japanese Journal of Population, Vol.5, No.1 (March 2007)
19

2.4 births per woman (ESCAP, 2005).In view of the fact that countries in the Asian
region are at different levels of fertility, it is pertinentto examine the levels and trends in fertility in theregion. This paper covers three subregions of Asia,namely East and North-East Asia, South-East Asiaand South and South-West Asia. For the purposeof this paper, countries are classified into threecategories according to their level of fertilityestimated during the period 2000-2005--high,intermediate and low fertility. Intermediate fertilitylevel is further classified as transitional and near-replacement fertility while low fertility level isclassified as low and critically low fertility (see table1 for the classification of countries by the level ofTFR).
Using classifications described above, thepaper first presents the levels and trends in fertilityover the past 30 years. Second, the paper discussesdifferentials in fertility. Third, the paper highlightsfactors contributing to fertility decline, and assessesthe reasons for hindering fertility decline in highand transitional fertility countries. The paper thendiscusses the implications of low fertility. Finally,the paper concludes with a discussion of futureprospects for fertility decline, and reviews policiesimplemented by countries in response to low andcritically low fertility.
2. LEVELS AND TRENDS IN FERTILIYTable 1 presents the classification of countries bythe level fertility during the past 30 years, while intable 2 countries are classified by percentagedecline in fertility between the periods 1970-1975and 1990-1995, and 1990-1995 and 2000-2005. Alarge number of countries in Asia (20 out of 28)belonged to the category of high fertility duringthe period 1970-1975. Japan was the only countrywhich had achieved below replacement fertility,while Hong Kong, China and Singapore had reachednear-replacement fertility during that period. China;Republic of Korea; Sri Lanka; Democratic People'sRepublic of Korea and Macao, China had beguntheir fertility transition during the early seventies(table 2). Fertility transition also began in severalother countries during the early seventies, withThailand; China; Singapore; Republic of Korea;Hong Kong, China; and Macao, China joining thelow fertility countries by the period 1990-1995.Data suggest that Islamic Republic of Iran,Democratic People's Republic of Korea and SriLanka have also achieved the replacement levelfertility during the recent period. In total, 10 outof 28 countries belong to the low fertility category,with the fertility level of Singapore; Japan; Republicof Korea; Hong Kong, China and Macao, China
falling at critically low level of below 1.5 childrenper woman. It is also to be noted that all countriesin the region have begun fertility transition exceptTimor-Leste and Afghanistan, countries that aredevastated by war and with questionable dataquality.
Table 2 also shows the classification ofcountries by total fertility rates during the periods,1970-1975, 1990-1995 and 2000-2005. Amongthe low and critically low fertility countries, fertilityremained fairly high until the period 1970-1975 inseveral countries including China, the Republic ofKorea, Sri Lanka and Thailand. Japan was the firstcountry in this region which had completed thefertility transition from high to low by the early1960s (Jones and Leete, 2002). Fertility transitionhad begun in most of the low and critically lowfertility countries prior to the seventies, followedby a precipitous decline thereafter. The mostspectacular decline in fertility occurred in suchcountries as China; Hong Kong, China; Macao,China; the Republic of Korea; Sri Lanka andThailand during the periods 1970-1975 and 1990-1995. It is noteworthy that Singapore exhibited adramatic fall in TFR to 2.6 in the period 1970-1975, down from a high level of 6.4 in the period1950-1955. Singapore continued to experience afurther decline in fertility, reaching 1.4 in the period2000-2005.
It is interesting to note that a large number ofcountries experienced marked declines in fertilityfrom a high level (5 or more) to transitional or near-replacement levels (2.2 to 4.9) during the periods1970-1975 and 1990-1995. Prominent among theseare Bangladesh, Brunei Darussalam, Indonesia,Islamic Republic of Iran, Mongolia, Myanmar,Turkey and Viet Nam. Of particular importance isThailand, which exhibited a remarkable decline infertility from a high level to the replacement level.However, in countries such as Afghanistan, Bhutan,Cambodia, Lao People's Democratic Republic,Maldives, Nepal and Pakistan, fertility remained ata high level during these periods.
Over the last 10 year, between 1990-1995 and2000-2005, several countries exhibited rapid fertilitydeclines. Islamic Republic of Iran exhibited a mostspectacular decline in TFR by more than half, from4.3 in 1990-1995 to 2.1 in 2000-2005. The TFRof Macao, China, which was already low at 1.6 in1990-1995, further declined by almost half,reaching to a critically low level of 0.8 in 2000-2005. More that one quarter decline in fertilitywas recorded in transitional and near-replacementfertility countries such as Maldives, Pakistan,Nepal, Myanmar, Mongolia and Viet Nam. It is alsoto be noted that in the Republic of Korea, the TFR
The Japanese Journal of Population, Vol.5, No.1 (March 2007)
20

Fertility level 1970-1975 1990-1995 2000-2005
High Afghanistan Afghanistan Timor-Leste(TFR ? 5.0) Mongolia Maldives Afghanistan
Maldives Lao PDRViet Nam PakistanPakistan BhutanIran (Islamic Republic of) CambodiaBangladesh NepalLao PDRTimor-LestePhilippinesBhutanNepalMyanmarCambodiaIndiaBrunei DarussalamTurkeyIndonesiaMalaysiaThailand
Transitional China Timor-Leste Lao PDR(TFR 3.0 to 4.9) Republic of Korea Iran (Islamic Republic of) Bhutan
Sri Lanka Philippines MaldivesDPR Korea Bangladesh PakistanMacao, China India Cambodia
Myanmar NepalMalaysia BangladeshMongolia PhilippinesViet Nam IndiaBrunei Darussalam
Near-replacement Hong Kong, China Indonesia Malaysia(TFR 2.2 to 2.9) Singapore Turkey Brunei Darussalam
Sri Lanka TurkeyDPR Korea Myanmar
MongoliaIndonesiaViet Nam
Low Japan Thailand Iran (Islamic Republic of)(TFR 1.6 to 2.1) China DPR Korea
Singapore Sri LankaRepublic of Korea ThailandMacao, China China
Critically low Japan Singapore(TFR =<1.5) Hong Kong, China Japan
Republic of KoreaHong Kong, ChinaMacao, China
Table 1. Fertility trends in Asia: 1970-1975 to 2000-2005
Source: World Population Prospects: The 2004 Revision, United Nations Population Division, New York.
The Japanese Journal of Population, Vol.5, No.1 (March 2007)
21

was further reduced by more than a quarter, from1.7 to 1.2 during the last 10 years (table 3).
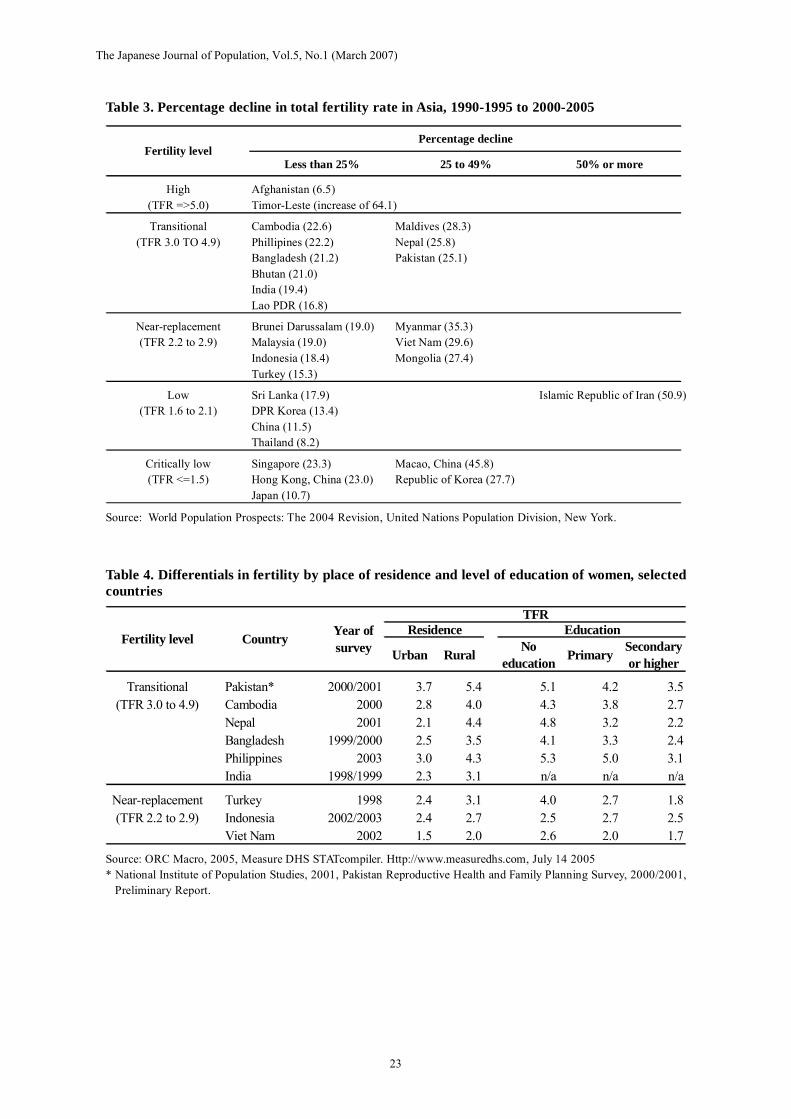
3. DIFFERENTIALS IN FERTILITYThe previous section has shown the diversity ofthe region with respect to the levels and trends infertility. While several countries in the regioncontinue to be in the transitional and near-replacement levels fertility, many have reached lowand critically low levels. Just as there are substantialdifferentials within the region with respect to levelsof fertility, differentials are also evident within thesecountries. Country averages of total fertility ratesmask variations in fertility observed in varioussectors of the population. Thus, in some countries,while fertility may be high at a national level, it hasdeclined among certain groups within the country.Most notable differential is observed between urbanand rural areas and by women's educationalattainment.
Table 4 shows the total fertility rate of selectedcountries in the transitional and near-replacement
levels by type of place of residence and highesteducational level of women. As can be seen fromthe table, while fertility of some countries at thenational level may be at a transitional level, fertilityin urban areas in these countries has approachednear-replacement levels, with the exception ofPakistan and the Philippines. Urban fertility in VietNam has in fact reached a critically low level of1.5 births per woman.
In all countries, as expected, urban fertility islower than rural fertility, although the differencesvary by country. The largest difference is seen inNepal where urban fertility is at replacement level(2.1) while rural fertility continues to be at atransitional level of 4.4 births per woman. InPakistan and the Philippines the difference is alsolarge with urban women having 1.7 and 1.3 fewerbirths than their rural counterparts, respectively.In Cambodia, Bangladesh, India, Turkey and VietNam the difference is about 1 birth between urbanand rural women. Indonesia, on the other hand,exhibits a very small difference with 2.4 births per
Table 2. Percentage decline in total fertility rate in Asia: 1970-1975 to 2000-2005
Source: World Population Prospects: The 2004 Revision, United Nations Population Division, New York.
1970-75 1990-95 2000-05 1970-75 to1990-95
1990-95 to2000-05
High Timor-Leste 6.2 4.8 7.8 -22.8 64.1(TFR =>5.0) Afghanistan 7.7 8.0 7.5 3.9 -6.5
Transitional Lao PDR 6.2 5.8 4.8 -5.7 -16.8(TFR 3.0 TO 4.9) Bhutan 5.9 5.6 4.4 -5.7 -21.0
Maldives 7.0 6.0 4.3 -13.7 -28.3Pakistan 6.6 5.7 4.3 -13.6 -25.1Cambodia 5.5 5.4 4.1 -3.3 -22.6Nepal 5.8 5.0 3.7 -13.7 -25.8Bangladesh 6.2 4.1 3.3 -33.1 -21.2Philippines 6.0 4.1 3.2 -31.0 -22.2India 5.4 3.8 3.1 -29.8 -19.4
Near-replacement Malaysia 5.2 3.6 2.9 -29.7 -19.0(TFR 2.2 to 2.9) Brunei Darussalam 5.4 3.1 2.5 -42.8 -19.0
Myanmar 5.8 3.8 2.5 -33.9 -35.3Turkey 5.3 2.9 2.5 -45.3 -15.3Mongolia 7.3 3.4 2.5 -54.0 -27.4Indonesia 5.2 2.9 2.4 -44.2 -18.4Viet Nam 6.7 3.3 2.3 -50.7 -29.6
Low Iran (Islamic Republic of) 6.4 4.3 2.1 -32.4 -50.9(TFR 1.6 to 2.1) DPR Korea 3.9 2.3 2.0 -40.3 -13.4
Sri Lanka 4.1 2.4 2.0 -41.1 -17.9Thailand 5.0 2.1 1.9 -57.8 -8.2China 4.9 1.9 1.7 -60.5 -11.5
Critically low Singapore 2.6 1.8 1.4 -32.8 -23.3(TFR <=1.5) Japan 2.1 1.5 1.3 -28.0 -10.7
Republic of Korea 4.3 1.7 1.2 -60.4 -27.7Hong Kong, China 2.9 1.2 0.9 -57.8 -23.0Macao, China 3.2 1.6 0.8 -51.6 -45.8
CountryFertility level% DeclineTFR
The Japanese Journal of Population, Vol.5, No.1 (March 2007)
22
Urban Rural Noeducation Primary Secondary
or higher
Transitional Pakistan* 2000/2001 3.7 5.4 5.1 4.2 3.5(TFR 3.0 to 4.9) Cambodia 2000 2.8 4.0 4.3 3.8 2.7
Nepal 2001 2.1 4.4 4.8 3.2 2.2Bangladesh 1999/2000 2.5 3.5 4.1 3.3 2.4Philippines 2003 3.0 4.3 5.3 5.0 3.1India 1998/1999 2.3 3.1 n/a n/a n/a
Near-replacement Turkey 1998 2.4 3.1 4.0 2.7 1.8(TFR 2.2 to 2.9) Indonesia 2002/2003 2.4 2.7 2.5 2.7 2.5
Viet Nam 2002 1.5 2.0 2.6 2.0 1.7
TFRResidence Education
Fertility level Country Year ofsurvey
Table 3. Percentage decline in total fertility rate in Asia, 1990-1995 to 2000-2005
Source: World Population Prospects: The 2004 Revision, United Nations Population Division, New York.
Table 4. Differentials in fertility by place of residence and level of education of women, selectedcountries
Source: ORC Macro, 2005, Measure DHS STATcompiler. Http://www.measuredhs.com, July 14 2005* National Institute of Population Studies, 2001, Pakistan Reproductive Health and Family Planning Survey, 2000/2001,
Preliminary Report.
Less than 25% 25 to 49% 50% or more
High Afghanistan (6.5)(TFR =>5.0) Timor-Leste (increase of 64.1)
Transitional Cambodia (22.6) Maldives (28.3)(TFR 3.0 TO 4.9) Phillipines (22.2) Nepal (25.8)
Bangladesh (21.2) Pakistan (25.1)Bhutan (21.0)India (19.4)Lao PDR (16.8)
Near-replacement Brunei Darussalam (19.0) Myanmar (35.3)(TFR 2.2 to 2.9) Malaysia (19.0) Viet Nam (29.6)
Indonesia (18.4) Mongolia (27.4)Turkey (15.3)
Low Sri Lanka (17.9) Islamic Republic of Iran (50.9)(TFR 1.6 to 2.1) DPR Korea (13.4)
China (11.5)Thailand (8.2)
Critically low Singapore (23.3) Macao, China (45.8)(TFR <=1.5) Hong Kong, China (23.0) Republic of Korea (27.7)
Japan (10.7)
Percentage declineFertility level
The Japanese Journal of Population, Vol.5, No.1 (March 2007)
23

woman in urban areas and 2.7 births per womanin rural areas.
Women's education has been noted to have aninverse relationship with fertility, showing a higherlevel of fertility among women with no education.It is interesting to note that with the exception ofPakistan and the Philippines, fertility level amongwomen with secondary or higher education hasreached near-replacement and low levels.Substantial differences are observed withincountries with respect to fertility of women by theireducational attainment. The largest difference isobserved in Nepal where women with no educationhave 2.6 more births than women with secondaryor higher education. Fertility levels of women withsecondary or higher education in Nepal is at near-replacement of 2.2 births per woman while womenwith no education have 4.8 births per woman. Inthe Philippines and Turkey, women with noeducation give birth to 2.2 more children thanwomen with secondary or higher education. ThePhilippines presents an interesting case in thatfertility level of women with no education andprimary education is at high level of over five birthsper woman. Fertility of women with secondary orhigher education in Turkey and Viet Nam is alreadyat low levels at 1.8 and 1.7 births per woman,respectively. In both Bangladesh and Cambodia,fertility among women with no education is justabove 4.0 births per woman while fertility amongwomen with secondary or higher education is justunder 3.0 at near-replacement levels. Indonesia isan exception among these countries with virtuallyno difference in fertility by education levels. TheTFR is about 2.5 for all three education levels.
4. FACTORS AFFECTING FERTILITYDECLINEThe preceding section reviewed the levels, trendsand differentials in fertility in Asia. The abovereview reveals the diversity of the region withrespect to the level of fertility. The regioncomprises countries where fertility has plummetedto well below the replacement level. On the otherhand, two countries still have high fertility. Withinintermediate fertility countries, fertility is close tothe replacement level in some countries, whileothers, labelled as transitional fertility countries,have shown signs of fertility transition. In theprocess of achieving low fertility some countrieshave followed the conventional theory of fertilitytransition as experienced by industrialized countrieswhile others have deviated from the past theory,adding new dimensions to the fertility transition.
This section first presents a brief overview ofthe fertility transition theory. It then examines the
factors affecting fertility decline in the regionfocusing separately on intermediate and low fertilitycountries. This is because the factors operating toregulate fertility tend to differ by the level of fertility.Country experiences drawn from each level offertility will be presented to highlight the conditionsunder which fertility decline took place.
The classical theories of fertility transitionpostulate that one of the preconditions of fertilitydecline is the changing economic value of childrenand associated decrease in the demand for children.The wealth flow theory of Caldwell (1976) claimsthat, with the introduction of western ideas, thedirection of wealth flow between generationschanges from an upward (children to parents)direction to a downward (parents to children) one.In traditional societies, children have greateconomic value for parents because children workin the field, help with housework and take care ofparents in their old age. Since the net flow of wealthis from children to parents, parents perceiveeconomic advantages by having many children.However, westernization and the concomitantgrowth of mass education increase the costs ofeducation and other expenditures for children,which makes having children more costly. As aresult of reduced economic gains from havingmany children, parents begin to have fewerchildren.
Based on a similar idea of the changing valueof children, Easterlin and Crimmins (1985)presented a more specific model combining cost-benefit analysis with socio-demographic elements.According to the model, fertility decline is the resultof a cost-benefit analysis of the demand forchildren, the supply of children and the cost offertility regulation. Demand is described as thenumber of surviving children that parents wouldwant if the cost of fertility regulation were free.The demand is subject to household income, pricesof other goods and the preference of parents (i.e.,the degree to which parents want children relativeto other goods). The supply depends on theproximate determinants of fertility, such as the ageat marriage, frequency of intercourse andprobability of foetal loss. The cost of fertilityregulation is the aggregated costs (both emotionaland economic) of using contraception. If thesupply of children is greater than the demand, therewill be unwanted children, and people will start toregulate their fertility. Thus, the model suggeststhat the increasing gap between supply and demandis the key to fertility reduction.
The traditional demand theories hypothesizethat the demand for children will decline withchanges in socio-economic conditions. Examining
The Japanese Journal of Population, Vol.5, No.1 (March 2007)
24

the rela tionship between socio-economicdevelopment and the changing level of fertility,studies have concluded that the improvement inhuman development, measured by indicators suchas literacy and life expectancy, plays a major rolein reducing fertility. Economic development (astructural transformation of modes of production),on the other hand, is not a necessary condition forfertility decline (Bongaarts, 2002; Bongaarts andWatkins, 1996; Cleland and Wilson, 1987). Whilethe success of family planning programmes, inmost cases, depends upon the changes in thedemand for children, a prominent contributingfactor in the changing demand for children is rapidsocial development, particularly the spread ofprimary education (Jones and Leete, 2002). AUnited Nations study also concludes that the drivingforce for fertility decline is socio-economicdevelopment, in particular decline in mortality,increased female education and labour forceparticipation rates (United Nations, 2002a).
In addition to the demand factor, some studieshave pointed out that the diffusion of new ideasand behaviours is another prime factor for fertilitydecline. According to the diffusion model, newideas and information spread through socialinteractions, which is the process of changing (ornot changing) people's attitudes towards a newidea. Social norms and traditions also act toencourage or discourage a new idea. Onceinnovative ideas and behaviours are adopted by agroup of people, they tend to diffuse to others.Social interactions, which provide the opportunitiesfor diffusion, are communicated at the personalnetwork, national and international levels (Bongaartsand Watkins, 1996). Thus, the process of fertilitydecline is propelled by the transmission ofinformation and ideas of regulating fertility andusing modern contraceptives.
In examining the impacts of diffusion onfertility decline, the role of Government isparticularly important because it is a majorinstitution that can effectively diffuse informationat the national level. It has been argued byBongaarts (1994:619) that national family planningprogrammes can have powerful impacts on fertilitylevels by "reducing noneconomic costs ofcontraceptive use, such as lack of knowledge, fearof side effects, and social and familial disapproval".Reviewing the development of family planningprogrammes during the latter part of the twentiethcentury, Caldwell and others (2002) emphasizethat national family planning programmes haveplayed a significant role in reducing fertility in thedeveloping world by not only providing newcontraceptive methods for free or at a reasonable
price, but also, even more importantly, bypopularizing the small family norm and legitimizingthe use of contraceptives.
The crucial role of population policy infostering fertility decline in Asia was furtherreinforced by Leete and Alam (1999). They alsoaffirmed that the positive changes in the demandfor children were, to some extent, responsible forthe success of family planning programmes. Whileincreases in the age at marriage have played asignificant role in fertility decline, reductions ininfant and child mortality, rising income levels andimproved access to information and services haveled to a latent demand for contraceptive use in mostcountries of Asia (Seetharam, 2002).
In the following section, attempts will be madeto explain factors affecting fertility decline in near-replacement, low and critically low fertilitycountries by using a combination of classicaltheories of changing demand for children and theimpact of information diffusion, with a particularfocus on governmental population policies. On theother hand, the slowdown of fertility decline intransitional fertility countries will be examined inlight of the low level of education, especially forwomen, and a limited level of women's autonomy.
4.1 Low FertilityThe above review indicates that factors affectingfertility decline have two-dimensions, underlyingsocio-economic conditions that lead to a smallernumber of children and a diffusion mechanism thatspreads the benefits of fertility control and the useof the modern methods of contraceptives. In otherwords, as Coale (1973) has put it, fertility regulationneeds to be a conscious choice of couples, basedon the balance between the advantages anddisadvantages of having a smaller number ofchildren, advantageous to the couples andachievable by easily available effective contraceptivemethods. In fact, the low fertility countries, ingeneral, and Japan, the Republic of Korea andSingapore, in particular, appear to have met theseconditions. Socio-economic conditions and thesocial environment of these countries haveprovided strong motivation for couples to desirefor a small family, and fertility control has becomesocially and culturally acceptable. Methods ofcontrolling fertility were then introduced to meetthe "unmet need" for family planning.
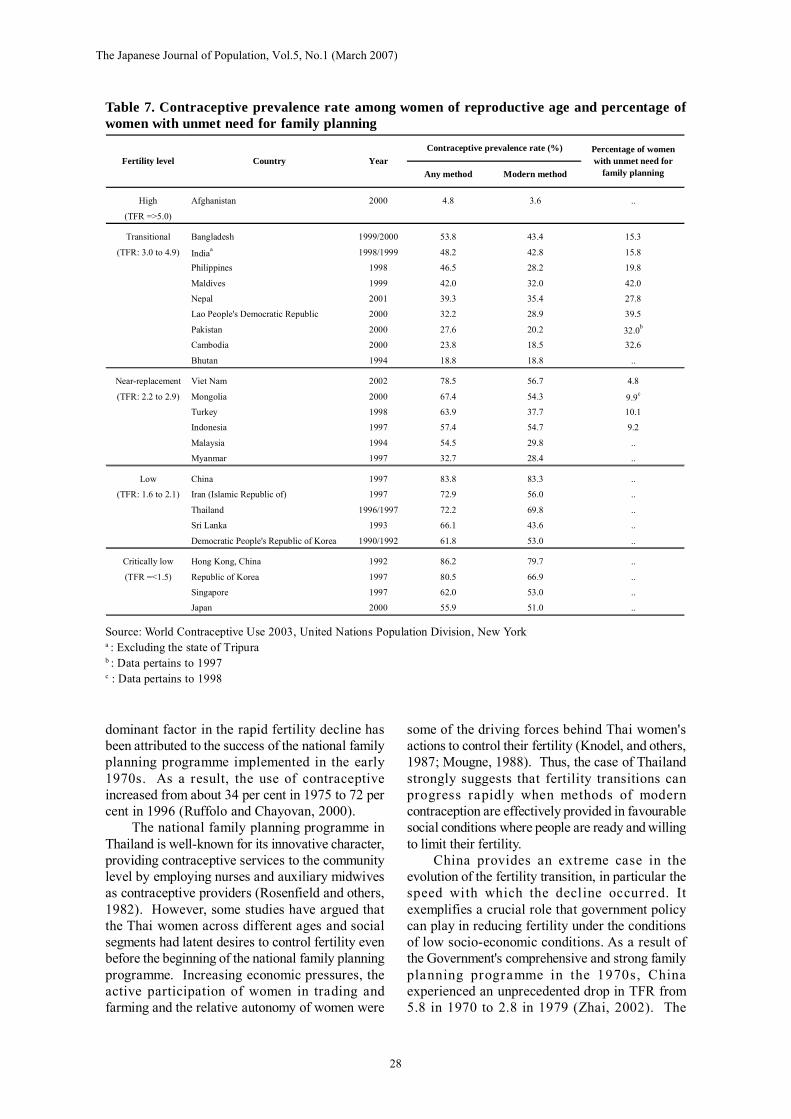
It can be seen from tables 5-7 that these lowfertili ty countries, in general, have lowerproportions ever married among women aged 20-24, a universal female literacy rate, higherpercentage of the population living in urban areas,lower infant mortality rates and higher life
The Japanese Journal of Population, Vol.5, No.1 (March 2007)
25

15-19 20-24
High Afghanistan 1979 53.7 90.7(TFR =>5.0)
Transitional Bangladesh* 1999/2000 46.6 77.8(TFR 3.0 to 4.9) Nepal* 2001 39.8 82.1
Maldives 1990 36.5 85.2India* 1998/1999 33.8 75.8Pakistan* 1990/1991 24.3 59.6Lao People's Democratic Republic 1995 19.7 67.4Cambodia* 2000 12.1 50.9Philippines* 2003 3.9 36.9
Near-replacement Turkey* 1998 15.2 59.3(TFR 2.2 to 2.9) Indonesia* 2002/2003 14.0 57.0
Brunei Darussalam 1991 8.0 38.2Malaysia 1991 7.6 39.9Myanmar 1997 6.6 34.8Viet Nam* 2002 4.1 46.4Mongolia# 1998 3.9 44.5
Low Iran (Islamic Republic of) 1991 25.9 68.6(TFR 1.6 to 2.1) Thailand 1990 15.2 52.0
Sri Lanka* 1987 6.5 40.6China 1990 4.7 58.6
Critically low Macao, China 1991 2.3 22.3(TFR =<1.5) Hong Kong, China 1996 1.7 14.7
Singapore 1990 1.2 21.2Republic of Korea 1995 0.8 16.7Japan 1990 0.7 14.0
Year of census orsurveyFertility level
Percentage ever married amongwomen agedCountry
Table 5. Percentage of married women aged 15-19 and 20-24
Source - World Marriage Patterns 2000, United Nations Population Division, New York.* : ORC Macro 2005. Accessed on 30/06/2005: http://www.measuredhs.com/statcompiler/table_builder.cfm?userid
=147064&usertabid=161706.# : Mongolia Reproductive Health Survey 1998, National Statistical Office of Mongolia.
expectancies at birth. All these indicators, alongwith advanced economic development, havecreated a favourable environment for contraceptiveuse: 56 per cent in Japan, 62 per cent in Singapore,81 per cent in the Republic of Korea, 84 per centin China, and 86 per cent in Hong Kong, China(table 7). Figure 2 reveals that a higher level ofcontraceptive prevalence is associated with lowerfertility. In the majority of low fertility countries,contraceptive prevalence exceeds 60 per cent.However, somewhat lower contraceptive usereported in Japan is due to the legalization ofinduced abortion, which has been credited as oneof the reasons for fostering fertility decline (Atoh,2001).
While socio-economic development hasinfluenced fertility decline in some low fertilitycountries, there have been notable exceptions. Thecase of Sri Lanka illustrates the crucial role ofhuman development in the evolution of fertilitydecline. Despite the fact that Sri Lanka is still alow-income country, the TFR has dropped fromaround 5 children per woman in the late 1960s tothe replacement level in the late 1990s. The mainreasons cited for a sharp decline in fertility in SriLanka are the rise in age at first marriage, increasein the proportions of women remaining single,widespread use of contraception and an increasingpercentage of temporal migration by young marriedwomen (Langford, 2001). More importantly, the
The Japanese Journal of Population, Vol.5, No.1 (March 2007)
26

Table 6. Life expectancy at birth, infant mortality rate, percentage urban and female adult literacyrate
*: 2005 ESCAP Population Data Sheet, ESID/UNESCAP, Bangkok#: UNESCO Institute for Statistics (UIS). Youth (15-24) and Adult (15+) literacy rates by Country and by Gender for 2000-
2004. May 2005.^: Refers to 1998-2002
Infant mortalityrate (per 1,000)*
Percentageurban*
Female adultliteracy rate(aged 15 and
over)#
Males Females 2000-2005 2005 2000-2004
High Timor-Leste 55 58 87 8 …(TFR =>5.0) Afghanistan 47 47 145 24 …
Transitional Maldives 68 67 38 30 96.4(TFR 3.0 to 4.9) Philippines 65 71 26 63 92.7
Cambodia 58 64 73 20 64.1Lao People's Democratic Republic 54 57 84 22 60.9Bangladesh 63 65 54 25 31.4Pakistan 64 64 75 35 35.2Nepal 62 63 68 16 34.9Bhutan 63 65 52 9 …India 62 66 64 29 47.8
Near-replacement Mongolia 63 67 55 57 97.5(TFR: 2.2 to 2.9) Brunei Darussalam 75 79 6 78 90.2
Viet Nam 69 73 18^ 27 86.9Malaysia 71 76 10 65 85.4Indonesia 66 70 38 48 83.4Myanmar 58 64 71 67 86.2Turkey 67 72 39 31 81.1
Low Thailand 67 75 17 31 90.5(TFR: 1.6 to 2.1) Sri Lanka 72 77 16 21 88.6
China 70 74 33 41 86.5Iran (Islamic Republic of) 69 73 31 68 70.4Democratic People's Republic of Korea 61 67 43 62 …
Critically low Singapore 77 81 3 100 88.6(TFR: =<1.5) Macao, China 78 82 7 99 87.8
Hong Kong, China 79 85 4 100 …Japan 78 85 3 79 …Republic of Korea 73 80 4 81 …
Fertility level
Life expectancy at birth(Years)*
(2000-2005)Country
advanced level of human development, reflectedin the high female literacy rate (90 per cent), lowinfant mortality rate (16 per 1,000 per live births)and fairly high life expectancies at birth (72 yearsfor males and 77 years for females), has inevitablyinfluenced the fertility level (see table 6). Thesesocial conditions that facilitated the acceptance ofthe small family norm helped to complete the fertilitytransitions earlier than economic indicators wouldsuggest. The lessons from Sri Lanka clearlydemonstrate that investments in social sectorprogrammes with strong political commitment canbe highly effective in reducing fertility in low-income countries (Sathar and Phillips, 2001).
Thailand provides yet another example which
is often quoted as one of the most successfulcountries in reducing fertility in a short span oftime. Thailand's TFR was close to 5 children perwoman until 1975, after which it drasticallydropped to 3.8 in the 1980s and 2.3 in the early1990s. Fertility continued to decline through the1990s, eventually dropping to below thereplacement level (Chamratrithirong, undated;Gubhaju and Moriki-Durand, 2003). The currentTFR is estimated at 1.7 children per woman(ESCAP, 2005). Several factors contributed to thedecline in fertility in Thailand: age at marriage forboth men and women has gone up, the level ofcelibacy has increased and childbearing wascompressed into a narrow span. However, the
The Japanese Journal of Population, Vol.5, No.1 (March 2007)
27
High Afghanistan 2000 4.8 3.6 ..
(TFR =>5.0)
Transitional Bangladesh 1999/2000 53.8 43.4 15.3
(TFR: 3.0 to 4.9) Indiaa 1998/1999 48.2 42.8 15.8
Philippines 1998 46.5 28.2 19.8
Maldives 1999 42.0 32.0 42.0
Nepal 2001 39.3 35.4 27.8
Lao People's Democratic Republic 2000 32.2 28.9 39.5
Pakistan 2000 27.6 20.2 32.0b
Cambodia 2000 23.8 18.5 32.6
Bhutan 1994 18.8 18.8 ..
Near-replacement Viet Nam 2002 78.5 56.7 4.8
(TFR: 2.2 to 2.9) Mongolia 2000 67.4 54.3 9.9c
Turkey 1998 63.9 37.7 10.1
Indonesia 1997 57.4 54.7 9.2
Malaysia 1994 54.5 29.8 ..
Myanmar 1997 32.7 28.4 ..
Low China 1997 83.8 83.3 ..
(TFR: 1.6 to 2.1) Iran (Islamic Republic of) 1997 72.9 56.0 ..
Thailand 1996/1997 72.2 69.8 ..
Sri Lanka 1993 66.1 43.6 ..
Democratic People's Republic of Korea 1990/1992 61.8 53.0 ..
Critically low Hong Kong, China 1992 86.2 79.7 ..
(TFR =<1.5) Republic of Korea 1997 80.5 66.9 ..
Singapore 1997 62.0 53.0 ..
Japan 2000 55.9 51.0 ..
Fertility levelPercentage of womenwith unmet need for
family planningAny method Modern methodCountry Year
Contraceptive prevalence rate (%)
Table 7. Contraceptive prevalence rate among women of reproductive age and percentage ofwomen with unmet need for family planning
Source: World Contraceptive Use 2003, United Nations Population Division, New Yorka : Excluding the state of Tripurab : Data pertains to 1997c : Data pertains to 1998
dominant factor in the rapid fertility decline hasbeen attributed to the success of the national familyplanning programme implemented in the early1970s. As a result, the use of contraceptiveincreased from about 34 per cent in 1975 to 72 percent in 1996 (Ruffolo and Chayovan, 2000).
The national family planning programme inThailand is well-known for its innovative character,providing contraceptive services to the communitylevel by employing nurses and auxiliary midwivesas contraceptive providers (Rosenfield and others,1982). However, some studies have argued thatthe Thai women across different ages and socialsegments had latent desires to control fertility evenbefore the beginning of the national family planningprogramme. Increasing economic pressures, theactive participation of women in trading andfarming and the relative autonomy of women were
some of the driving forces behind Thai women'sactions to control their fertility (Knodel, and others,1987; Mougne, 1988). Thus, the case of Thailandstrongly suggests that fertility transitions canprogress rapidly when methods of moderncontraception are effectively provided in favourablesocial conditions where people are ready and willingto limit their fertility.
China provides an extreme case in theevolution of the fertility transition, in particular thespeed with which the decline occurred. Itexemplifies a crucial role that government policycan play in reducing fertility under the conditionsof low socio-economic conditions. As a result ofthe Government's comprehensive and strong familyplanning programme in the 1970s, Chinaexperienced an unprecedented drop in TFR from5.8 in 1970 to 2.8 in 1979 (Zhai, 2002). The
The Japanese Journal of Population, Vol.5, No.1 (March 2007)
28

Figure 2. Relationship between total fertility rate and contraceptive prevalence rate in theESCAP region
Source: Population Reference Bureau, 2005 Women of Our World.
0
1
2
3
4
5
6
7
8
0 20 40 60 80 100
CPR
TFR
principles of late marriage, longer birth spacing andfertility limitation were strictly enforced throughoutthe country along with the vigorous implementationof the one-child policy (Jiang and Zhang, 2000).China experienced a sustained decline in fertility,reaching below the replacement level in the early1990s. The TFR has currently remained at 1.7.The successful family planning programme helpedto free married women from high order births andheavy family burdens, providing them moreopportunities to participate in socio-economicactivities. The government commitment to reducethe population growth rate not only contributed tofertility decline but also improved socio-economicconditions and people's ideas about family andgender relations, making them more compatiblewith the low fertility regime (Attane, 2002).
The recent spectacular decline in fertilityachieved by the Islamic Republic of Irandemonstrates the importance of basic social andhealth infrastructures in facilitating the use ofcontraceptives. The TFR in the Islamic Republicof Iran fell rapidly from 5.6 in 1985 to 2.1 in 2000-2005. The decline in fertility has been credited tothe rise in contraceptive use, which increasedsharply from 37 per cent in 1976 to 74 per cent in2000. While improvements in female educationhave made a significant contribution to the increasein contraceptive use, the change in marriage patternhas also affected fertility decline (Roudi-Fahimi,2002). Fertility decline in the Islamic Republic ofIran is so unique that it occurred in all segments ofthe populations, including rural areas. While in
urban areas, fertility fell from 4.5 to 1.8 between1976 and 2000, in rural areas it dropped from 8.1to 2.4 during the same period. This is attributed tothe fact that the government policies to increasepublic education and to establish a health networksystem have resulted in the promotion of successfulfamily planning within the framework of the ruralhealth care network called "health houses"
The implementation of the national familyplanning programme in 1989 was effectivelyenhanced through the health network. Religiousleaders legitimized the family planning programmeby giving full support, which enabled theGovernment to provide family planning servicesto the people without any religious barriers.Moreover, by the mid-1980, the perceived costsof rearing children have increased owing to higheraspirations and investments by families in theirchildren's education (Abbasi-Shavazi, 2002).Hence, the key elements to the success of aphenomenal decline in fertility are: a culturallysensitive family planning programme, investmentsin health infrastructure and human development,and a high level of political commitment (Roudi-Fahimi, 2002).
4.2 Intermediate Fertility (transitional and near-replacement level)Many intermediate fertility (transitional and near-replacement) countries have experienced a rapidfertility decline in the past three decades, and thedeclining trend seems to be continuing towards theachievement of low fertility. These countries
The Japanese Journal of Population, Vol.5, No.1 (March 2007)
29

include, among others, Indonesia and Viet Nam.Some countries in the transitional fertility group,such as Bangladesh, India and the Philippines,which experienced a faster decline during the period1970-1975 to 1990-1995, however, saw a slowdown in fertility decline during the recent period.On the other hand, incipient declines in fertility havebegun in countries such as Cambodia, Nepal,Maldives and Pakistan. Recent surveys haveindicated that the TFR in these countries is around4 children per woman. Factors inhibiting anoticeable fertility decline in these countries arerelated to the lack of socio-economic development,resulting in higher infant mortality, lower lifeex pec ta nc ies a t b i r th, a nd l ow use ofcontraceptives.
Several factors have contributed to the declinein fertility in transitional and near-replacementfertility countries. Fertility decline in most of thesecountries is obviously associated with the rise inthe contraceptive prevalence rate through theimplementation of family planning programmes.However, lessons learned from some countriesunderline the importance of the effect of familyplanning programmes under favourable socio-economic conditions. Viet Nam presents anexample of a sustained decline in TFR from 5.9 inthe early 1970s to 4.0 in the late 1980s and 2.3 in1999. This is consistent with the r ise incontraceptive prevalence from 53 per cent in 1988to 65 per cent in 1994 and 75 per cent in 1997.Although contraceptive use is the main driving forcein the reduction of fertility in Viet Nam, thetransformation towards a market-oriented economyfollowing the unification of the country hasimproved the socio-economic conditions of thepeople at large, thereby strongly affecting familystructure, life style and reproductive behaviour(Hung, 2002).
The successful implementation of theIndonesian national family planning programme isyet another example that contributed significantlyto the reduction in fertility. Indonesia exhibited aremarkable decline in the total fertility rate fromclose to 6 children per woman in the 1960s to lessthan 3 in the 1990s. This is associated with thepercentage of married women currently usingcontraceptives, which increased from less than 20per cent in the mid-1970s to over 50 per cent bythe end of the 1990s. The success of familyplanning programmes in Indonesia is the result ofthe political change that occurred in the 1960s. Thenew political regime has changed the politicalclimate from one that was traditionally Islamic to aless conservative one. The secularization of thegovernment helped the formulation of an effective
family planning programme that is compatible withIslamic values (Hull, 2002).
Furthermore, a study has indicated thatincreased involvement of women in school and theformal workforce further depressed Indonesianfertility (Hull, 2003). A growing number of womenare choosing a life focused on a higher educationand a career rather than the traditional life basedon marriage and childbearing. The social reality ofIndonesia is making it difficult for these youngwomen to have both family and work: as a result,many women are deciding to pursue a non-familiallife. If this trend continues, Indonesian fertilitywill soon decline to below the replacement level,and possibly continue to stay at a low level.
Malaysia exhibits the role of government policywhich influenced the course of fertility transition;however, the transition was not uniform acrossethnic groups. In Malaysia, as a whole, TFRdropped substantially from 5.4 in 1967 to 3.5 in1987 and the decline slowed somewhat to 3.3 in1997 (Peng, 2002). The establishment of thenational family planning programme in the mid-1960s along with the impressive gains in socio-economic indicators led to a sustained decline infertility among Malays and an accelerated declineamong people of Chinese and Indian ethnicity.However, the slow pace of the overall fertilitydecline in Malaysia during the period between 1987and 1997 is the result of a differential response byethnic groups to the inequalities in the level of socio-economic development and government policychanges. Concerned with further reductions infertility, the Government apparently de-emphasizedthe family planning programme and established apronatalist policy in the early 1980s. The immediateeffect of this policy was revealed in a slowing of afurther fall in the TFR of Malays, from 4.5 in theyears 1977 and 1987 to 3.8 in 1997, as the Malaysresponded quickly to the new government policywith its pronatalist messages. The fertility of peopleof Chinese and Indian decent, however, continuedto fall, reaching 2.5 and 2.6 respectively in 1997(Jones and Leete, 2002; Peng, 2002).
The case of India demonstrates the value ofsocial stratification, family structure and women'sautonomy in the uneven fertility transition acrossstates divided between the northern and southernparts of the country. In India, as a whole, fertilitydeclined from 6.0 children per woman in the early1960s to 4.5 in the early 1980s. The process ofdecline continued at a gradual pace, reaching 3.2in 1998. Such a steady decline in fertility at thenational level is obviously rela ted to theimplementation of the government family planningprogramme established in 1951 as well as
The Japanese Journal of Population, Vol.5, No.1 (March 2007)
30

percept ib le cha nges in socio-economicdevelopment of the country over the past 30 years(Ram and Ram, 2002). The aggregate fertility levelof the country is, however, masked by thesubstantial variations in fertility by state. Forexample, in the southern states of Kerala and TamilNadu there has been a spectacular drop in TFRfrom around 5 in the early 1960s to below thereplacement level in 1998. By contrast, women inthe northern states of Bihar, Madhya Pradesh, UttarPradesh, Rajasthan and Uttar Pradesh reported somedeclines in TFR from over 6 children per womanto over 4.0 during the same period (Kumar, 2002).It has been suggested that the fertility transition inmost states began with family planning programme.In Kerala, however, it was initiated in the absenceof any officially committed family planningprogramme. A distinct difference between the northand south is that the fertility transition began in thesouth at a higher level of social development, suchas a higher female literacy rate (over 45 per cent),lower infant mortality (89 per 1,000 live births)and higher female age at marriage (20 years). Onthe other hand, in most of the northern states thefertility transition began when female literacy wasbelow 20 per cent, infant mortality was above 100per 1,000 live births and female age at marriagewas below 18 years (Ram and Ram, 2002).
Some studies have strongly argued theimportance of women's autonomy in themanifestation of a clear fertility difference betweennorthern and southern India, where underlyingfamily structures as well as the status of womenconsiderably differ. In the northern region of India,great emphasis is placed on males and the patrilinealfamily system; dowry is usually required for womento marry, a strong son preference and neglect ofgirls are persistent and the decision-making powerof women is very low. In the south, on the otherhand, marriage usually takes place within a circleof relatives, dowry is not as important and sonpreference is not as strong. The earlier onset ofsocial change in Kerala and Tamil Nadu has alsobeen attributed to the fact that these states areexamples of more equitable societies, withhierarchies that are less strictly defined and moreamenable to change, and the effect of greaterwomen's autonomy, compared with the highlystratified and feudalistic class found in somenorthern states (Sathar and Phillips, 2001; Dyson,2002).
Most of the transitional fertility countries haveexperienced a sustained decline in fertility. However,the fertility rates in some of these countries havestalled at above 3 children per woman. A primeexample is the case of Bangladesh. Although the
TFR in Bangladesh was impressively reduced from6.3 in 1975 to 3.3 in the early 1990s, the declinehas virtually stalled during the last decade. Thespeed with which fertility declined from high totransitional level was largely due to the successfulfamily planning campaign, which was supportedby a strong political commitment to reduce fertility.Culture-sensitive family planning programmesmanifested in household visits by field workers,the involvement of religious leaders in theprogra mmes' promot ion (McEachran andDiamond, 2001) and external funding to supportthe family planning programme (Caldwell andothers, 2002) have facilitated the progress of thecampaign. As a result, the contraceptive prevalencerate increased from less than 10 per cent in themid-1970s to about 40 per cent at the beginning ofthe 1990s. The contraceptive prevalence rateincreased from 45 per cent in 1993/1994 to 54 percent in 1999/2000 (Bairagi and Dutta, 2001).
The stabilization of TFR at slightly above 3children per woman indicates that a subsequentrise in contraceptive prevalence failed to show animpact on fertility decline. A study conducted inMatlab, Bangladesh suggests that, conditioned bystrong son preference in the area, fertility in Matlabhas actually reached the level of couples' desirednumber of children. The impact of the increase incontraceptive use has been offset largely by thedecrease in the incidence of abortion, with the netbalance resulting in the stalling of the total fertilityrate at the desired number of children (Bairagi andDutta, 2001). It has been shown that the presenceof son preference in Bangladesh has actuallyincreased the desired number of children, the resultof which has led to an increase in the TFR in Matlabby 12 per cent (Bairagi, 2001).
It has been shown that a low level of socialdevelopment might be a factor in keeping thedesired number of children at a relatively high level.According to Bongaarts and Watkins (1996), thethreshold level of social development (measuredby the Human Development Index) required forthe onset of fertility decline has lowered over timebecause of the diffusion of information transmittedfrom leading countries in the region which hadinitiated fertility decline. For example, the region'spoorer countries, such as Bangladesh and Nepal,began their fertility transition at a much lower levelof social development (HDI of 0.32 and 0.33respectively in Nepal and Bangladesh). By contrast,the onset of the fertility transition in more advancedcountries, such as Singapore and the Republic ofKorea, occurred when their HDI levels were muchhigher, 0.65 in the former and 0.58 in the latter.Thus, as Bangladesh had begun its fertility transition
The Japanese Journal of Population, Vol.5, No.1 (March 2007)
31

earlier than anticipated in view of its level of socialdevelopment, the social conditions were notsufficient to sustain fertility decline.
A further explanation to the lack of fertility declinein Bangladesh is related to a drop in the use of effectivecontraceptive methods, possibly due to low qualityof care, and an increase in inefficient methods offamily planning with a high discontinuations rate(Jones and Leete, 2002). Furthermore, Islam andothers (2003) found that the quality characteristicsof field workers, including regularity in work,innovative technique in communication, technicalcompetence, enthusiasm for work and conformityto social norms, have had significant positive impactson the current use of contraceptives. They concludethat the presence of or visit by a field worker byitself is not enough to increase contraceptiveprevalence/continuation rates and to decrease failurerates. What is needed is good quality field workers.The Bangladesh experience, therefore, suggests thata further decline in fertility would require renewedprogrammes and intensified training for field workerswith a strong emphasis on the quality of care.
Another example of transitional fertility countrywith a staggered fertility rate is the Philippines,where a religious institution appears to havehindered further progress in the country's fertilitytransition. Although the TFR in the Philippines hadstarted to decline since the mid-1960s, the pace ofthe decline has been quite modest during the past25 years. The TFR has stalled at around 4 childrenper woman over the last 10 years (Cabigon, 2002).This is surprising in light of favourable socialindicators such as higher female literacy rate,relatively low infant mortality rate and higher lifeexpectancies at birth (see table 6). One of themajor reasons for the less- than-expectedperformance is resistance from the Roman CatholicChurch in any effort to promote most forms ofmodern contraception and its ideologicalcommitment to natural family planning methodssuch as the rhythm method. A weak politicalcommitment to establishing a comprehensive familyplanning programme is further worsening thesituation (Cabigon, 2002).
On the other hand, the TFR in Pakistanremained around 6 children per woman throughoutthe 1960s, 1970s and 1980s, while it declinedmarginally to a little over 5 children during the1990s. The lack of fertility decline is supportedby the prevalence of contraception which nominallyincreased from 5.5 per cent in 1968 to 12 per centin 1990/91 and to 24 per cent in 1996/97 (Hakimand Miller, 2001). Recent estimates suggest thatthe TFR in 2000 dropped to about 4.8, with thecontraceptive prevalence rate increasing to about
30 per cent. The rising age at marriage may haveaccounted for some reduction in fertility, if any,before the 1990s, while resumption of politicalinterest in population policies and the familyplanning programme, which started in the mid-1990s, is the reason for the observed decline duringthe 1990s. Unmet need for family planning,however, continues to be high at about 38 per cent(Sathar, 2001).
Comparisons with neighbouring countries inSouth Asia illuminate factors hindering a smootherfertility transition in Pakistan. For example, incontrast to the successful national family planningprogramme in Bangladesh, Pakistan's familyplanning programme suffered from a lack ofpolitical commitment, user-oriented contraceptivedelivery systems, involvement of external agenciesand international donors (Robinson, 2001). Morecritically, low education and the associatedsubordinate position of women have been suggestedas major reasons for inhibiting the onset of thefertility transition in Pakistan. A comparison ofwomen's autonomy in Uttar Pradesh and TamilNadu in northern and southern India, respectively,and Punjab in Pakistan shows that a higher level ofautonomy is associated with a lower desirednumber of children and a higher level ofcontraceptive use. Moreover, women with moreautonomy have fewer unmet needs for familyplanning (Sathar and others, 2001). Becausewomen with a higher autonomy and social statuscan exercise more power over their reproductiverights, thus enhancing their decisive role inadopting family planning methods and fertilityoutcomes.
5. CHALLENGES AND FUTURE PROSPECTSThe preceding sections examined the levels, trendsand differentials in fertility and reviewed the factorsaffecting the fertility decline in Asia. The complexityof the fertility transition does not allow an easygeneralization. However, it is apparent that theprime determinant of the fertility decline lies insocial development, particularly the level ofwomen's education and autonomy, as well ascommitments by Governments to provide effectivefamily planning programmes. This section willpresent future prospects for fertility decline intransitional and near-replacement fertility countries.It will also highlight challenges and emerging issuesfor countries at low and critically low fertility levels.
5.1 Prospects for Fertility Decline in Intermediate(transitional and near-replacement) FertilityCountries and Future ChallengesConsidering the past trends and the current level
The Japanese Journal of Population, Vol.5, No.1 (March 2007)
32

Period Transitional fertility Near-replacement fertility
2005-2010 MyanmarViet Nam
2010-2015 MongoliaBrunei DarussalamIndonesia
2015-2020 Turkey
2020-2025 India MalaysiaPhilippines
2035-2040 BangladeshMaldives
2040-2045 Lao, PDRNepal
2045-2050 CambodiaBhutanPakistan
of fertility, along with some social and economicindicators, the United Nations has projected globaltotal fertility rates up to the year 2050 (UnitedNations, 2004). Table 8 shows the period duringwhich countries in the region are likely to reachthe replacement level of fertility. According to themedium variant projections, all countries in thisregion, except Afghanistan and Timor-Leste willhave achieved the replacement level fertility by theyear 2050.
Among the transitional fertility countries,Cambodia, Bhutan and Pakistan are expected toreach the replacement level fertility in the period2045-2050, while Lao People's DemocraticRepublic and Nepal will reach this level in the period2040-2045. Bangladesh and Maldives will reach thereplacement level fertility in 2035-2040. The UnitedNations projects that India and the Philippines willachieve the replacement level fertility in the period2020-2025.
Of those countries belonging to the near-replacement level fertility, Myanmar and Viet Namare expected to complete their fertility transitionby the period 2005-2010, while Brunei Darussalam,Indonesia and Mongolia will do so in the period2010-2015. Turkey is projected to complete thefertility transition in the period 2015-2020 andMalaysia in 2020-2025.
The future course of fertility in transitional andnear-replacement fertility countries will, however,
depend largely on several factors, including a highlevel of political commitments to providing goodquality reproductive health information and servicesand making investments in socia l sectordevelopment. While contraceptive use has risensignificantly during the past decade, data reveal thatthere is still a high level of unmet need forcontraception (see table 7). In developing countries,17 per cent of married women desire to usecontraception to prevent pregnancy, but are notusing any method. Unmet need is high among thepoorest women in the poorest countries (Ross andWinfrey, 2002). In these countries, greateremphasis needs to be placed on strengtheningfamily planning programmes so that services areaccessible and affordable to couples desiring to usecontraception. At the same time, investmentsshould be made to improve human development,which has been proven to reduce the demand forchildren and increase the demand for contraception.Improving women's autonomy and reducinggender inequality, especially in the case of Pakistan,have also been suggested as modalities for bringingabout positive changes in attitudes towardsincreasing contraceptive use and reducing fertility(Sathar, 2001; Hakim and others, 2003).
Although there are groups in many societiesthat have considerably high fertility levels than isthe societal norm, in general, the gap is highestamong the transitional fertility countries. For
Table 8. Period when fertility is assumed to reach replacement level: Medium variant projections
Source: World Population Prospects: The 2004 Revision, United Nations Population Division, New York.
The Japanese Journal of Population, Vol.5, No.1 (March 2007)
33

example, in the case of India one observesconsiderable variations in fertility among thedifferent states, in general, northern states show ahigher level of fertility as compared with thesouthern states. The situation in Nepal is alsoindicative of a society with a considerable largefertility gap between groups. Both the urban sectorand highly educated women in Nepal exhibitreplacement level fertility, although overall TFR inNepal is 4.1 births per woman. Such variability infertility, therefore, suggests that there are largepockets of population who are less motivated tohave a smaller family and/or have poorer access togood quality family planning services and moderncontraceptives. Thus, as a primary strategy toreduce the gap, special attention should be paid toimprovements of social and economic conditionsalong with an increase in the accessibility andaffordability of good quality reproductive healthservices for all. Moreover, a study suggests that,in order to better serve less-advantaged women, itis important to determine the categories of womenwho still need government-subsidized familyplanning services and women who can afford topurchase contraceptives from commercial sources.If more women with financia l means usecommercial outlets, the private sector will participatemore in family planning, and governmental supportcould be more effectively extended to women inreal need (Foreit, 2002).
Other important issues in the transitionalfertility countries relate to modification andadjustment of national family planning programmes
in the course of the fertility transition. First, theemphasis of programmes needs to be changed froma target-oriented approach to a holistic reproductivehealth approach, with the aim of providing goodquality primary health care, including familyplanning. The case of the Islamic Republic of Iranclearly suggests the effectiveness of establishing agood quality health care system rather thanconcentrating on narrowly focused family planningservices. Second, it is apparent from theexperience of Bangladesh that national familyplanning programmes that heavily rely on externalresources are not sustainable over a long period oftime. In another words, it is necessary to transformprogrammes to more self-supportive systems(Caldwell and others, 2002).
5.2 Consequences of Low FertilityAs a result of low fertility, fewer children are bornand progressively large numbers of adults moveinto the older age groups. Changes in age structureof the population and population ageing areinevitable consequences of low fertility. It can beseen from figure 3 that declining fertility has had asignificant impact on the rising percentage ofpopulation over age 60. It is also evident that theimpact of fertility decline on population ageing ismuch more revealing in the later stage as the highfertility cohort begins to reach the older age groups.In addition, improvement in mortality not onlyincreases life expectancy at birth but also increasesthe number of additional years expected to be livedby older persons aged 60 and 80 years (United
Figure 3. Total fertility rate and percentage of population over age 60, ESCAP region, 1970-2050
0.0
1.0
2.0
3.0
4.0
5.0
6.0
1970 1980 1990 2000 2010 2020 2030 2040 2050
TFR
0
5
10
15
20
25
Population over age 60
TFR Population over age 60
Source: World Population Prospects: The 2004 Revision, United Nations Population Division, New York.
The Japanese Journal of Population, Vol.5, No.1 (March 2007)
34

Nations, 2002b).In the long run, however, population ageing is
not the only radical outcome of persistent lowfertility. Increases in longevity at older ages andthe widening gap between female and male lifeexpectancies at birth will also result in a higherrate of growth of the elderly population, an increasein the old-age dependency ratio and feminizationof the elderly population. By contrast, an ageingpopulation would eventually lead to a decline in theoverall growth of the population in general and theworking-age population in particular. Because anold-age structure provides the momentum for adecline in population, just as the young-agepopulation provides the momentum for anaccelerated growth of population (McDonald2000).
In Asia in general, the overall populationgrowth rate has dropped to 1.3 per cent per annumcurrently. However, persons aged 60 years andolder are growing at a rate almost twice as high asthat of the total population. Persons aged 80 yearsand older are increasing even much faster. UnitedNations projections reveal that, although thepopulation growth rate in Asia would significantlydecline over time, the growth rate of older persons(aged 60 years and older, and 80 years and older)would be expected to increase consistently.
5.2.1 Changes in age structure and populationageing
One of the implications brought about by thelow-fertility regime is a substantial change in theage structure of the population. On one hand, theproportion of the population under age 15 willexperience a continuous fall, while on the other,the proportion of the population aged 60 years andolder will increase during the period 2000 to 2050.In the world as a whole, the proportion of thepopulation under age 15 (young-age population)and that of the population aged 60 years and older(old-age population) will be converging during thenext 50 years. The timing of the crossover,however, varies depending on the timing and speedof the demographic transition: the earlier and fasterthe transition, the earlier the crossover.
The Asian countries will also experience atremendous shift in the proportion of the young-age (under 15 years of age) and the old-agepopulations between 2000 and 2050. During thisperiod, the proportion of population 60 years andolder is expected to increase by two and half times,from 9 to 23 per cent, while the proportion of theyoung-age population is likely to decline by onethird, from 30 per cent to 19 per cent. In Asia asa whole, the old-age population will outnumber the
young-age population by the year 2040 (figure 4).However, as a consequence of an earlier and fasterfertility transition, the old-age population in Japanhas already surpassed the young-age population.In Singapore and the Republic of Korea, such acrossover will occur in 2010 and 2015 respectively.
The impact of a long-term decline in fertilitywill also give rise to a substantial drop in theproportion of the population in the age group 15-59. In the world as a whole and in Asia, theproportion of the population representing this agegroup will remain more or less constant at around60 per cent during the period 2000 to 2025 andwill experience a slight decline to 58 per cent in2050. However, the changes in the age structureof the population are more revealing in countrieswhere fertility declined rapidly. Japan willexperience a considerable drop in the proportionof the population in this age group: by the year2050, only 45 per cent of the population of Japanwill be in this age group, down from 62 per cent in2000. Populations such as the Republic of Koreaand Singapore will also exhibit a lower proportionof populations in the working ages in the next 50years.
It can also been seen from figure 5 that in2000, Japan's old-age population represented 23per cent of the total population as compared withthe young-age population, which represented 15per cent of the total. The old-age population willdrastically increase in the next few decades; it isprojected that in 2050 Japan's old-age populationwill be 42 per cent of the total population, almostthree and half times as high as the proportion ofthe young-age population. As the changingproportions of the young-age and old-agepopulations suggest, Japan will continue to be oneof the most aged countries in the world. Other low-fertility countries in Asia will also experience asubstantial increase in the proportion of olderpersons.
It is worth mentioning that persons aged 80years and older (the so-called oldest-old) currentlyrepresent more than 3 per cent of the totalpopulation in Europe and Northern America. Thepopulation of the oldest-old will increase by morethan three times in the next 50 years in Europe,reaching at least 10 per cent of the total population.Similarly, the population of the oldest-old will bemore than double in Northern America during thesame period. The only country in Asia with asizeable population of the oldest-old is Japan: 3.8per cent of Japan's population in 2000 comprisedpeople aged 80 years and older. Of all the countriesin the world, Japan is projected to witness thelargest proportion of the oldest-old (15.4 per cent)
The Japanese Journal of Population, Vol.5, No.1 (March 2007)
35

Asia
0
10
20
30
40
50
60
70
2000 2010 2020 2030 2040 2050% 0-14 %15-59 %60+
Singapore
01020304050607080
2000 2010 2020 2030 2040 2050
% 0-14 %15-59 %60+
Republic of Korea
01020304050607080
2000 2010 2020 2030 2040 2050
% 0-14 %15-59 %60+
China
01020304050607080
2000 2010 2020 2030 2040 2050
% 0-14 %15-59 %60+
Japan
010203040506070
2000 2010 2020 2030 2040 2050
% 0-14 %15-59 %60+
Thailand
01020304050607080
2000 2010 2020 2030 2040 2050
% 0-14 %15-59 %60+
Figure 4. Percentage distribution of population by broad age groups, 2000-2050
Source: World Population Prospects: The 2004 Revision, United Nations Population Division, New York.
Figure 5. Percentage of population over age 60
Source: World Population Prospects: The 2004 Revision, United Nations Population Division, New York.
0 10 20 30 40 50
ChinaThailand
SingaporeRepublic of Korea
Japan
AsiaAustralia/New Zealand
Northern AmericaEurope
Percentage
2005 2025 2050
The Japanese Journal of Population, Vol.5, No.1 (March 2007)
36

in the total population in 2050. Other countries suchas the Republic of Korea and Singapore are alsoexpected to experience a large growth in thepopulation of the oldest-old. It is noteworthy thatin the Republic of Korea and Singapore, the numberof oldest-old is projected to increase by almost 10times over the next 50 years (Figure 6).
5.2.2 Potential support ratioThe potential support ratio, presented in figure 7,is a simplified measure showing the relationshipbetween the number of working-age population andolder persons. Globally, there are 9 persons in theworking age group per older person. However, inthe next 50 years there is likely to be a vast depletionin the potential support ratio, shrinking by morethan half. Currently, the potential support ratio inEurope-already low at less than 5-will further declineto less than 2 in 2050. Relatively low potentialsupport ratios are found in Northern America (5.4)
and Australia/New Zealand (5.5). Over the nexthalf century, this ratio will drop substantially to2.8 in Northern America and 2.7 in Australia/NewZealand.
In Asia a whole, although the potential supportratio is relatively high at 11, important variationscan be seen at the country level. In the next 50years several low-fertility countries in Asia willexperience a sharp decline in the potential supportratio, eventually falling to 2 or lower. Such countrieswill include Hong Kong, China; Japan; Macao,China; the Republic of Korea; and Singapore.Importantly, the potential support ratio of Japan,currently at 4, is already lower than that of Europe.More importantly, this ratio in Japan is projectedto fall below 1.5 in 2050; the only two othercountries in the world in which such a low ratiowould be expected are Italy and Spain (UnitedNations 2002b).
Figure 6. Percentage of population over age 80
Source: World Population Prospects: The 2004 Revision, United Nations Population Division, New York.
0 5 10 15 20
ChinaThailand
SingaporeRepublic of Korea
Japan
AsiaAustralia/New Zealand
Northern AmericaEurope
Percentage
2005 2025 2050
Figure 7. Potential support ratio (15-64/65+)
Source: World Population Prospects: The 2004 Revision, United Nations Population Division, New York.
0.0 2.0 4.0 6.0 8.0 10.0 12.0 14.0
ChinaThailand
SingaporeRepublic of Korea
Japan
AsiaAustralia/New Zealand
Northern AmericaEurope
2005 2025 2050
The Japanese Journal of Population, Vol.5, No.1 (March 2007)
37

5.2.3 Feminization of the elderly populationIn addition to the increase in elderly dependencyratios, a large gender disparity in the improvementof life expectancy at birth has been observed inlow-mortality countries, with females having higherlife expectancy at birth than males. As a result,women tend to outnumber men in the older agegroups. It is apparent from figured 8 and 9 thatsex ratios at older ages are much lower in Europecompared with those in Northern America,Australia/New Zealand and Asia. This is attributed
to the fact that there is a large gender difference inlongevity in Europe, with females having a muchhigher life expectancy at birth than males. Currently,in Europe women outnumber men by 3 to 2 atages 60 years and older, and by 5 to 2 at ages 80years and older.
Significant differences in the sex ratios of theelderly population can be seen among critically low-fertility countries in Asia. Feminization of the elderlypopulation (more female elderly than male elderly)is particularly pronounced in China and Thailand,
Figure 8. Feminization of the elderly population aged 60+
Figure 9. Feminization of the elderly population aged 80+
Sex ratio of population aged 60+ in 2005
Source: World Population Prospects: The 2004 Revision, United Nations Population Division, New York.
Source: World Population Prospects: The 2004 Revision, United Nations Population Division, New York.
0 20 40 60 80 100
ChinaThailand
SingaporeRepublic of Korea
Japan
AsiaAustralia/New Zealand
Northern AmericaEurope
Females Males
0 20 40 60 80 100
ChinaThailand
SingaporeRepublic of Korea
Japan
AsiaAustralia/New Zealand
Northern AmericaEurope
Females Males
Sex ratio of population aged 80+ in 2005
The Japanese Journal of Population, Vol.5, No.1 (March 2007)
38

where sex ratios at ages 60 years and older and 80years and older are significantly lower. The excessof women in the older ages is typically viewed asproblematic, because it reflects high levels ofwidowhood and the various difficulties associatedwith it. A higher proportion of older women arelikely to be widowed owing to the difference in theage of the spouse at the time of marriage (womentend to be younger than their spouse) and a higherlife expectancy at birth for women compared withmen (Neville, 2000). Percentages of womenwidowed increase with age as they tend to remarryless frequently upon divorce or the death of aspouse. Many older widows in industrializedcountries tend to live alone. Widowed elderlywomen tend to live in poverty. Because womenare less likely to be employed in the formal sector,they tend to have shorter working years and smallerearnings. Also, they often do not have enoughpensions or occupational skills to supportthemselves in old age. Moreover, a majority of theinstitutionalized elderly are the oldest-old womenwho are often widowed and who usually sufferfrom weak health (United Nations, 2001). Theserealities combined with a host of gender differences,such as educational attainment, poverty andfunctional status, pose additional problems forelderly women (National Research Council, 2001).
In conclusion, although critically low fertilitycountries are the region's forerunners in havingreached the replacement level of fertility earlier thantheir European counterparts, a continued depressionin fertility in some of these countries has madethem cautious about a further fertility decline. Infact, national family planning programmes in theRepublic of Korea and Singapore were phased outafter their fertility levels fell well below thereplacement level (Caldwell and others, 2002). Theexperiences of European countries also confirmthat the prospect for reversing fertility to thereplacement level is highly unlikely (United Nations,2000a). Similarly, in Japan, the Republic of Koreaand Singapore, although concerted efforts weremade to reverse the fertility decline, these measuresproved to be unsuccessful.
Therefore, a pressing issue for the criticallylow fertility countries is the ageing of the population.As a consequence of a rapid fertility decline coupledwith an increase in longevity, the increasing numberof low fertility countries will be faced with higherproportions of the population in the older agegroups. The rapidity of the process leading to lowfertility has not allowed enough time for thesecountries to adequately prepare for the problemsassociated with ageing of the population. Forexample, some ageing countries such as Japan, the
Republic Korea and Singapore are facing theproblem of increasing national expenditures for old-age social security and mounting burdens ofproviding care for the growing number of frailelderly and a shrinking labour force. The shrinkinglabour force and the increase in the ageingpopulation have also contributed to loweringpotential support ratios (United Nations, 2002b).For example, countries such as China and Thailand,where fertility declined very rapidly and which haveno established social security system, will face theproblem of supporting increasing proportions ofelderly persons when the proportion of the youngergeneration is growing smaller (Gubhaju and Moriki-Durand, 2003).
Considering the experience of low fertilitycountries, the governments of transitional and near-replacement fertility countries need to foresee theconsequences of declining fertility rates. A crucialagenda for the governments is, therefore, to planfor an ageing society before fertility drops wellbelow the replacement level. In this regard,researchers are urging Governments to startpreparing for policy measures to deal with ageingproblems as soon as possible (Mason, Lee andRusso, 2002). In other words, it is particularlyimportant for Asian countries to recognize thesignificance of ageing problems and startformulating policies for the elderly as it takes severaldecades for government old-age pension insuranceschemes to mature and operate at full scale(Ogawa, 2003).
REFERENCESAbbasi-Shavazi, Mohammad Jalal (2002). "Recent
changes and the future of fertility in Iran", inCompleting the Fertility Transition, (New York,United Nations), pp. 429-439.
Atoh, Makoto (2001). "Very low fertility in Japanand value change hypotheses", Review ofPopulation and Social Policy, (10): 1-21.
Attane, Isabelle (2002). "China's family planningpolicy: an overview of its past and future",Studies in Family Planning, 33(1): 103-113.
Bairagi, Radheshyam (2001). "Effects of sexpreference on contraceptive use, abortion andfertility in Matlab, Bangladesh", InternationalFamily Planning Perspectives, 27(3): 137-143.
Bairagi, Radheshyam and Ashish Kumar Datta(2001). "Demographic transition in Bangladesh:what happened in the twentieth century andwhat will happen next?", Asia-PacificPopulation Journal, 16(4): 3-16.
Bongaarts, John (1994). "The impact of populationpolic ies: comment", Popula t ion andDevelopment Review, 20(3): 616-620.
The Japanese Journal of Population, Vol.5, No.1 (March 2007)
39
------------------- (2002). The End of the FertilityTransition in the Developing World. PolicyResearch Division Working Papers No. 161,(New York, Population Council).
Bongaarts, John and Susan Cotts Watkins (1996)."Social interactions and contemporary fertilitytransitions", Population and DevelopmentReview, 22(4): 639-682.
Cabigon, Josefina V. (2002). "Why is the Philippineslagging behind her Southeast Asian neighborsin fertility decline?", paper presented at theWorkshop on Fertil ity Decline, BelowReplacement Fertility and the Family in Asia:Prospects, Consequences and Policies,Singapore, National University of Singapore.
Caldwell, John C. (1976). "Towards a restatementof demographic theory", Population andDevelopment Review, 2: 321-366.
Caldwell, John C., James F. Phillips and Barkat-e-Khuda (2002). "The future of family planningprograms", Studies in Family Planning, 33(1):1-10.
Chamratrithirong, Aphichat (undated). "The fertilityrevolution in Thailand (1970-1990): a researchperspective", unpublished manuscript,(Bangkok, Institute for Population Studies,Mahidol University).
Cleland, John and Christopher Wilson (1987)."Demand theories of the fertility transition: aniconoclastic view", Population Studies, 41: 5-30.
Coale, Ansley J. (1973). "The demographictransition", in International PopulationConference, Liege, 1973, Vol. I, (Liege,International Union for the Scientific Study ofPopulation), pp. 53-72.
Dyson, Tim (2002). "On the future of humanfertility in India", in Completing the FertilityTransition, (New York, United Nations), pp.392-408.
Easterlin, Richard A. and Eileen M. Crimmins(1985). The Fertility Revolution: A Supply-Demand Analysis, (Chicago, University ofChicago Press).
ESCAP (2000). 2000 ESCAP Population DataSheet, (Bangkok, Economic and SocialCommission for Asia and the Pacific).
--------- (2005). 2005 ESCAP Population DataSheet, (Bangkok, Economic and SocialCommission for Asia and the Pacific).
Foreit, Karen G. Fleischman (2002). "Source ofmaternal and child health care as an indicatorof ability to pay for family planning",International Family Planning Perspectives,
28(3): 167-175.Gubhaju, Bhakta B. and Yoshie Moriki-Durand
(2003). "Below replacement fertility in Eastand South-East Asia: consequences and policyresponses", Journal of Population Research,20(1): 1-18.
Hakim, Abdul and Peter C. Miller (2001). "Familyplanning in Pakistan: a turning point", in Zeba ASathar and James F. Phillips (eds.), FertilityTransition in South Asia, (New York, OxfordUniversity Press), pp. 135-157.
Hakim, Abdul, Sarah Salway and Zubia Mumtaz(2003)., "Women's autonomy and uptake ofcontraception in Pakistan", Asia-PacificPopulation Journal, 18(3): 63-82.
Hull, Terence H. (2002). "Caught in transit:questions about the future of Indonesianfertility," in Completing the Fertility Transition,(New York, United Nations), pp. 409-424.
Hull, Terence H. (2003). "Demographicperspectives on the future of the Indonesianfertility", Journal of Population Research,20(1): 51-66.
Hung, Le Ngoc (2002). "The patterns of fertilitydecline and family changes in Vietnam'semerging market economy: factors and policyimplications", paper presented at IUSSPRegional Population Conference: SoutheastAsia's Population in a Changing Asian Context,Bangkok, 10-13 June.
Islam, M. Mazharul, Monoj Kumar Barua andRa dhesa ym Ba ir agi (2003). "Qua li tychara cter i s t ics of f ie ld worker s a ndcontraceptive use dynamics: lessons fromMatlab, Bangladesh", Asia-Pacific PopulationJournal, 18(1): 43-62.
Jiang, Zhenghua and Lingguang Zhang (2000)."Fertility decline and population policy in China",in Low Fertility and Policy Responses to Issuesof Ageing and Welfare, (Seoul, Korea Institutefor Health and Social Affairs and United NationsPopulation Fund), pp. 195-225.
Jones, Gavin and Richard Leete (2002). "Asia'sfamily planning programs as low fertility isattained", Studies in Family Planning, 33(1):114-126.
Knodel, John, Aphichat Chamratrithirong andNibhon Debavalya (1987). Thailand'sReproductive Revolution: Rapid FertilityDecline in a Third World Setting, (Madison,University of Wisconsin Press).
Kumar, K. Anil (2002). "Why fertility decline inIndia is uneven?", paper presented at theWorkshop on Fertil ity Decline, BelowReplacement Fertility and the Family in Asia:Prospects, Consequences and Policies,
The Japanese Journal of Population, Vol.5, No.1 (March 2007)
40

Singapore, National University of Singapore.Langford, C.M. (2001). "Fertility decline in Sri
Lanka: could fertility now be at aboutreplacement level?", in Zeba A. Sathar and JamesF. Phillips (eds.), Fertility Transition in SouthAsia, (New York, Oxford University Press),pp. 121-134.
Leete, Richard and Iqbal Alam (1999). "Asia'sde mogr a p hi c mi r a c l e : 5 0 ye a r s o funprecedented cha nge" , Asia-Pac i ficPopulation Journal, 14(4): 9-20.
Mason, Andrew, Lee, Sang-Hyop and Russo,Gerard (2002). "As Asia's Population Ages,Worries Grow About the Future". Asia PacificIssues No. 58. Hawaii: East-West Center.
McDonald, Peter (2000). "Below ReplacementFertility in Australia: Trends and Implications".In Low Fertility and Policy Responses to Issuesof Ageing and Welfare, Seoul: Korea Institutefor Health and Social Affairs and United NationsPopulation Fund, 169-194.
McEachran, Juliet and Ian Diamond (2001)."Trends in fertility and contraceptive use inBangladesh", in Zeba A. Sathar and James F.Phillips (eds.), Fertility Transition in South Asia,(New York, Oxford University Press), pp. 158-174.
Mougne, Christine M. (1988). "Structural changeand fer tility decline in a northern Thaicommunity: an historical perspective", in JohnC. Caldwell, Allan G. Hill and Valerie J. Hall(eds.), Micro-Approaches to DemographicResearch, (London, Kegan Paul International),pp. 103-123.
National Research Council (2001). Preparing foran Aging World: the Case for Cross-NationalResearch, (Washington, DC, National AcademyPress).
Neville, Warwick (2000). "Introduction". In LowFertility and Policy Responses to Issues ofAgeing and Welfare, (Seoul, Korea Institute forHealth and Social Affairs and United NationsPopulation Fund), pp. 1-23.
Ogawa, Naohiro (2003). "Ageing Trends andPolicy Responses in the ESCAP Region". InPopulation and Development: Selected Issues.Asian Population Studies Series No. 161,(Bangkok, Economic and Social Commissionfor Asia and the Pacific), pp. 89-127.
Peng,Tey Nai (2002). "Differential response tofertility transition in Malaysia", paper presentedat the Workshop on Fertility Decline, BelowReplacement Fertility and the Family in Asia:Prospects, Consequences and Policies,Singapore, National University of Singapore.
Ram, F. and Usha Ram (2002). "Fertility transitionand family planning in India: policy issues",paper presented at the Workshop on FertilityDecline, Below Replacement Fertility and theFamily in Asia: Prospects, Consequences andPolicies, Singapore, National University ofSingapore.
Robinson, Warren C. (2001). "Common beginningsbut different outcomes: the family planningprogrammes of Pakistan and Bangladesh", inZeba A. Sathar and James F. Phillips (eds.),Fertility Transition in South Asia, (New York,Oxford University Press), pp. 347-363.
Rosenfield, Allan, Anthony Bennett, SomsakVarakamin and Donald Lauro (1982)."Thailand's family planning program: an Asiansuccess story", International Family PlanningPerspectives, 8(2): 43-51.
Ross, John and William Winfrey (2002). "Unmetneed for contraception in the developing worldand the former Soviet Union: and updatedestimate", International Family PlanningPerspectives, 28(3): 138-143.
Roudi-Fahimi, Farzaneh (2002). Iran's FamilyPlanning Program: Responding to a Nation'sNeeds, (Washington DC, Population ReferenceBureau).
Ruffolo, Vipan Prachuanbmoh and NapapornChayovan (2000). "Consequences of lowfertility and policy responses in Thailand", inLow Fertility and Policy Responses to Issuesof Ageing and Welfare, (Seoul, Korea Institutefor Health and Social Affairs and United NationsPopulation Fund), pp. 226-254.
Sathar, Zeba A. (2001). "Fertility in Pakistan: past,present and future," in United Nations Workshopon Prospects for Fertility Decline in HighFertility Countries, (New York, UnitedNations), pp. 14.3-14.13.
Sathar, Zeba A. James F. Phillips (2001)."Introduction", in Zeba A. Sathar and James F.Phillips (eds.), Fertility Transition in South Asia,(New York, Oxford University Press), pp. 1-19.
Sathar, Zeba A., C. Callum and S. Jejeebhoy (2001)."Gender, region, religion and reproductivebehaviour in India and Pakistan", paperpresented at IUSSP, XXIV General PopulationConference, Salvador, Brazil, 18-24 August.
Seetharam, K.S. (2002). "Half a century ofunparalleled demographic change: the Asia-Pacific experience", Asia-Pacific PopulationJournal, 17(4): 13-30.
United Nations (2000a). "Below replacementfertility", Population Bulletin of the United
The Japanese Journal of Population, Vol.5, No.1 (March 2007)
41

Nations, nos. 40/41, 1999, (New York, UnitedNations).
United Nations (2000b). World Marr iagePatterns 2000, (New York, United Nations).
------------------ (2001). Population, Gender andDevelopment: A Concise Report, New York:United Nations.
------------------ (2002a). Completing FertilityTransition, (New York, United Nations).
------------------ (2002b). World PopulationAgeing 1950-2050, (New York, UnitedNations).
------------------ (2003). World Contraceptive Use2003, (New York, United Nations).
------------------- (2004). World Popula tionProspects: The 2004 Revision, (New York,United Nations).
Zhai, Zhenwu (2002). "Social and economic
consequences of rapid fertility decline: casestudy of China", paper presented at theWorkshop on Fertil ity Decline, BelowReplacement Fertility and the Family in Asia:Prospects, Consequences and Policies,Singapore, National University of Singapore.
* This is an updated and modified version of thepaper, entitled "Fertility Levels and Trends in theAsian and Pacific Region", prepared as backgroundinformation for the Fifth Asian and PacificPopulation Conference, held in Bangkok, December2002.
Bhakta Gubhaju (United Nations EconomicCommission for Asia and the Pacific, Bangkok. E-mail: [email protected])
The Japanese Journal of Population, Vol.5, No.1 (March 2007)
42