asia and the decline of silicon valley
TRANSCRIPT

Asia and the death of Silicon ValleyJager McConnell CEO of Crunchbase@jagermcconnell
Source: http://www.laughtraveleat.com/

Asia has already surpassed Silicon ValleyAmount of capital invested
Amou
nt o
f cap
ital i
nves
ted
(in B
illion
s of
USD
)
$10B
$20B
$30B
$40B
$50B
$60B
2008 2009 2010 2011 2012 2013 2014 2015 2016
Silicon Valley Asia
Source: Crunchbase Data

Source: “The Course of the Empire - Destruction” by Thomas Cole, 1836
Disclaimer: Silicon Valley isn’t dead (yet)

how did we get here?

Computer and mathematical occupations
Num
ber o
f Job
s
800,000
900,000
1,000,000
1,100,000
1,200,000
2006 2007 2008 2009 2010 2011 2012 2013 2014 2015 2016
Demand for IT jobs increases in the U.S.
Source: U.S. Bureau of Labor Statistics
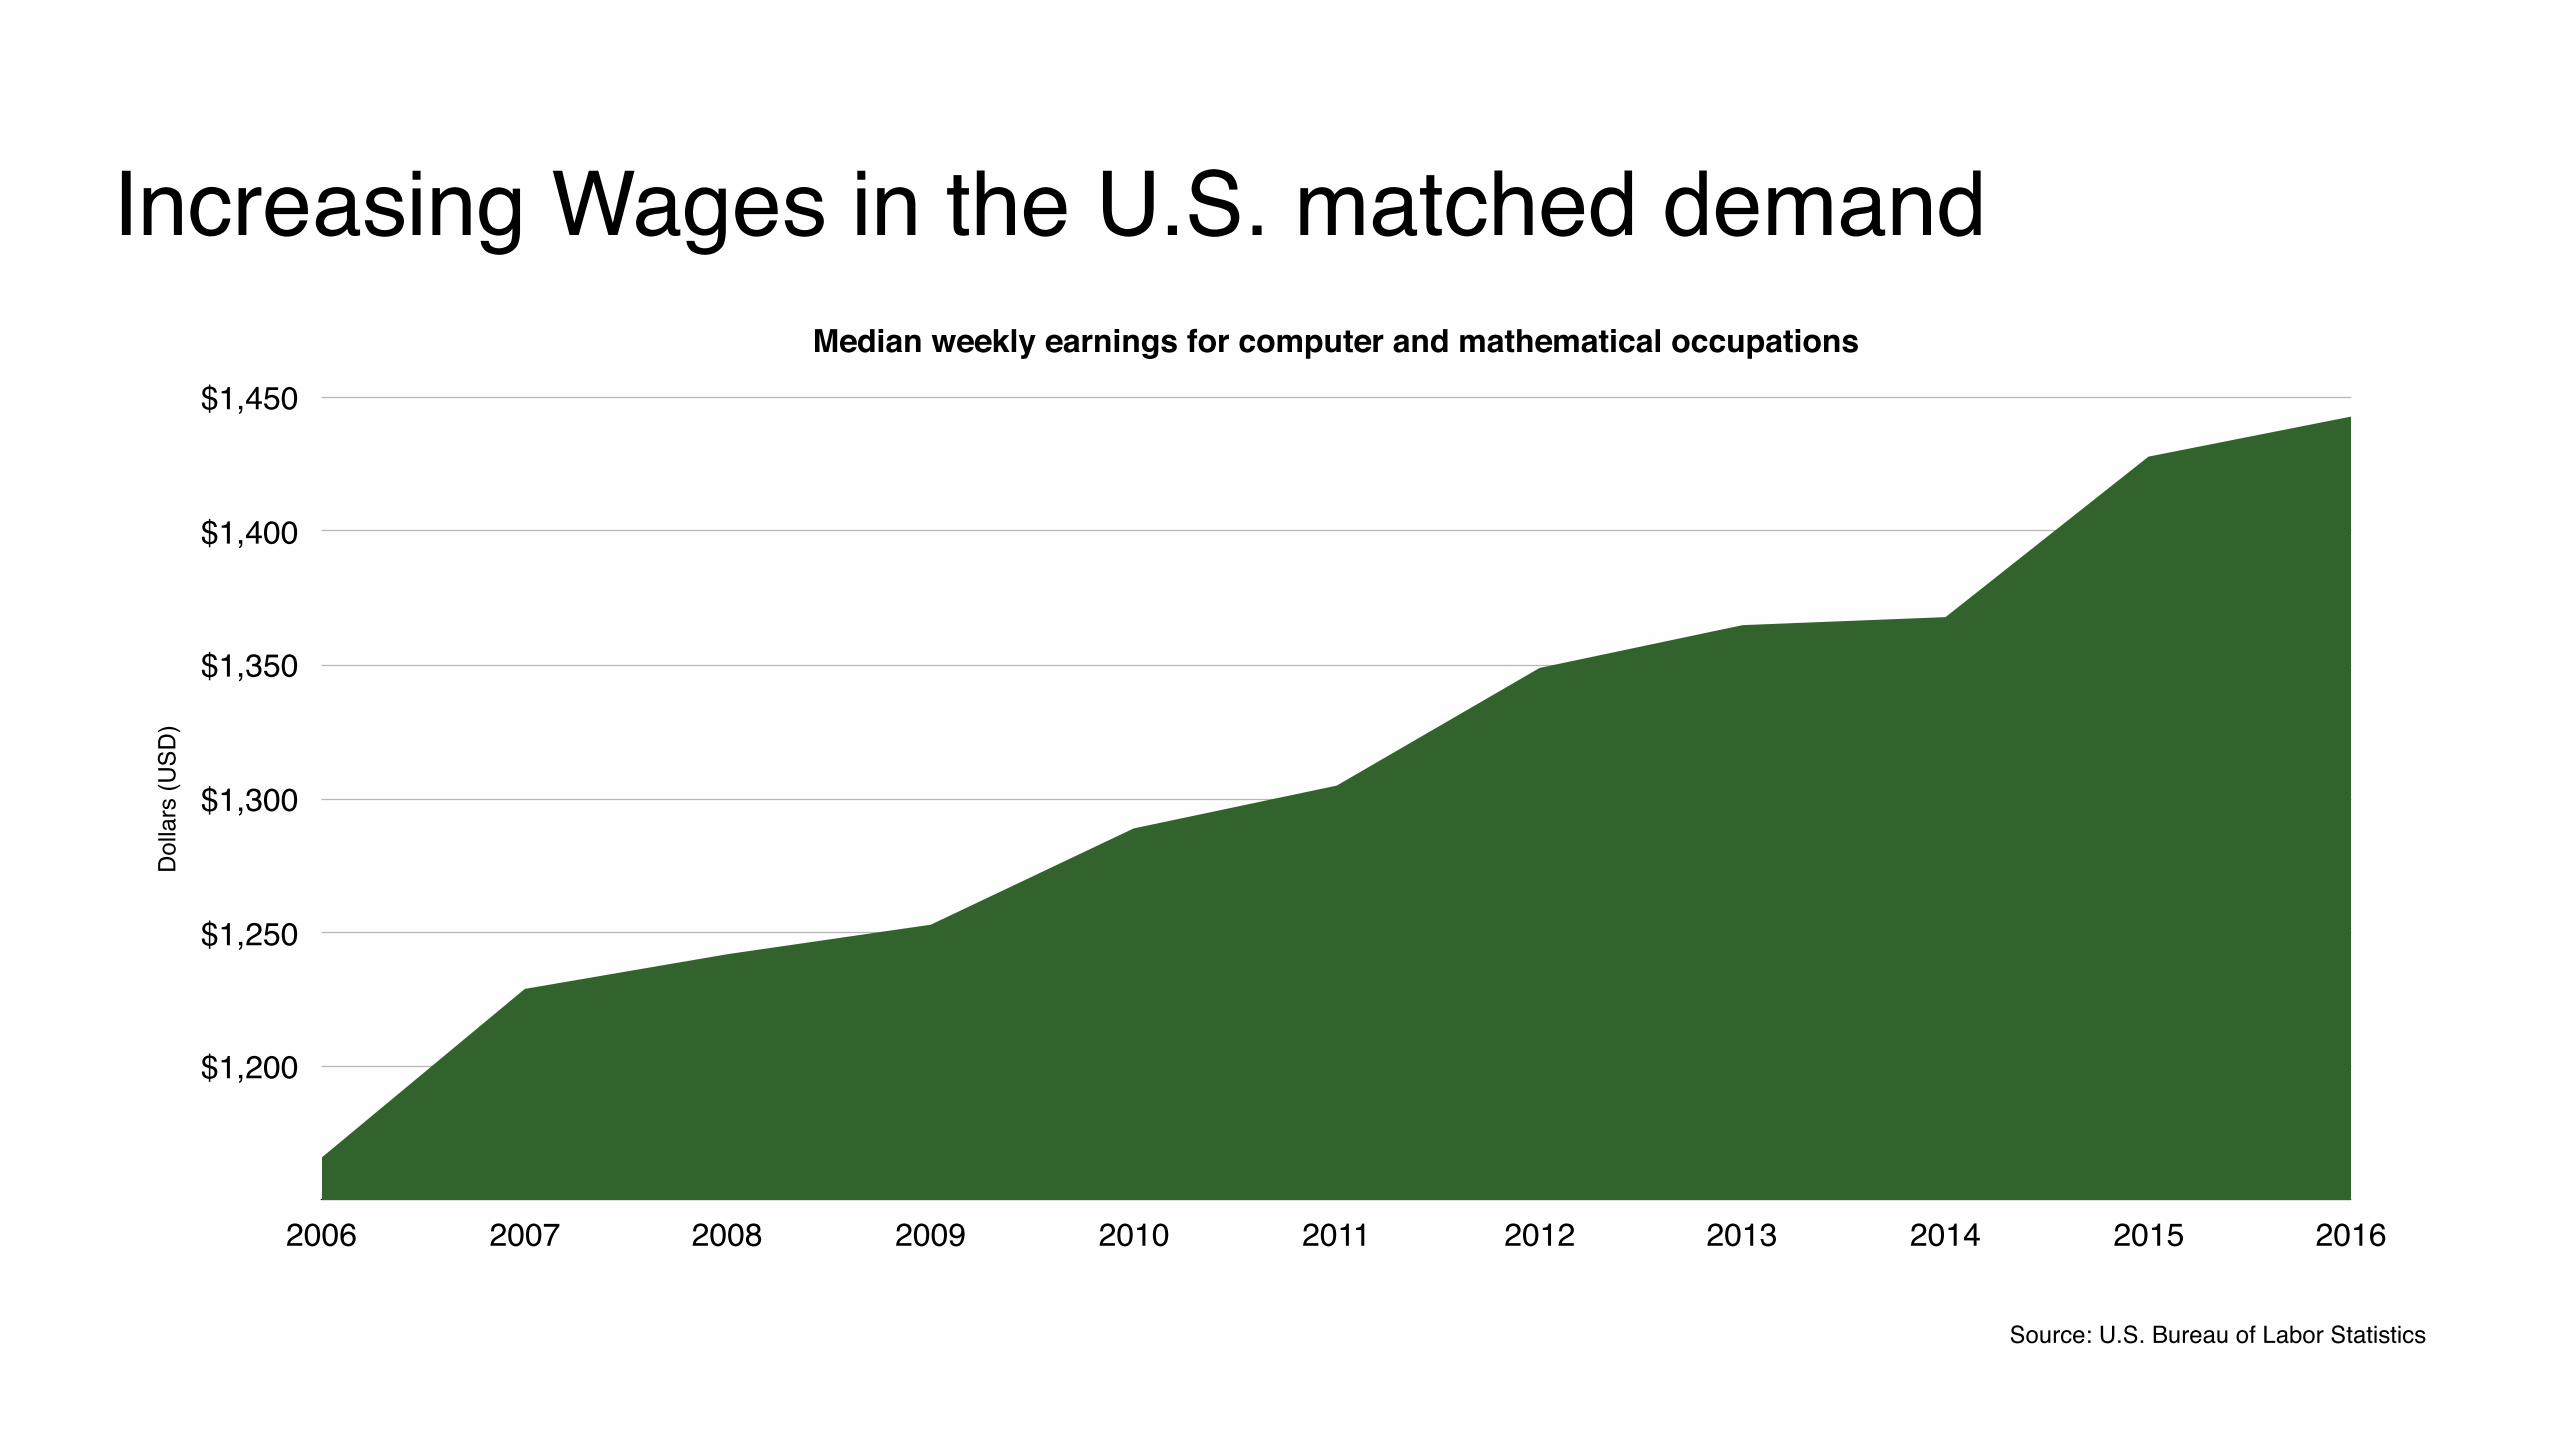
Increasing Wages in the U.S. matched demandMedian weekly earnings for computer and mathematical occupations
Dol
lars
(USD
)
$1,200
$1,250
$1,300
$1,350
$1,400
$1,450
2006 2007 2008 2009 2010 2011 2012 2013 2014 2015 2016
Source: U.S. Bureau of Labor Statistics

Cumulative U.S. jobs displaced by China
Out
sour
ced
Jobs
1,850,000
2,200,000
2,550,000
2,900,000
3,250,000
2006 2007 2008 2009 2010 2011 2012 2013
United States sends its jobs to Asia
Source: Economic Policy Institute

Graduates in Science, Technology, Engineering, and Mathematics in 2016
China
India
United States
Russia
Iran
Indonesia
Japan
1,000,000 2,000,000 3,000,000 4,000,000 5,000,000
Asia invests in education to meet demand
Source: World Economic Forum

Asian companies tracked in Crunchbase
Num
ber o
f com
pani
es fo
unde
d
900
1,200
1,500
1,800
Year of company’s founding
2007 2008 2009 2010 2011 2012 2013 2014
Tech companies founded in Asia dramatically increases
Source: Crunchbase Data

Number of Unicorns founded per year
Num
ber o
f uni
corn
s
5
10
15
20
25
30
Based on year founded, includes exited and private unicorns
2006 2007 2008 2009 2010 2011 2012 2013 2014 2015
Asian unicorns founded
Asia starts breeding unicorns
Source: Crunchbase Data

Number of Unicorns founded per year
Num
ber o
f uni
corn
s
5
10
15
20
25
30
Based on year founded, includes exited and private unicorns
2006 2007 2008 2009 2010 2011 2012 2013 2014 2015
U.S. unicorns founded Asian unicorns founded
Asia outpacing the U.S. in new unicorns
Source: Crunchbase Data

who is profiting?

Investor Portfolio of Asian companies increase in 2016
47%40%
38%
35%28%
27%
25%23%
21%
18%
13%
Top Asian investors leading the way in Asia
Source: Crunchbase Data

Top Silicon Valley investors’ investment count in Asia
Num
ber o
f Inv
estm
ents
30
60
90
120
2012 2013 2014 2015
Sequoia Capital Accel Partners Intel Capital
Increase since 2012
316%
177%
89%
Source: Crunchbase Data
Top Silicon Valley investors are jumping onboard

Geographic distribution of lead investors in Asian-based companies
United States
China
India
Singapore
Israel
Japan
Hong Kong
South Korea
United Kingdom
Number of investment rounds since 2012
200 400 600 800 1000 1200 1400 1600
The United States is outsourcing its capital
Source: Crunchbase Data

what’s next?
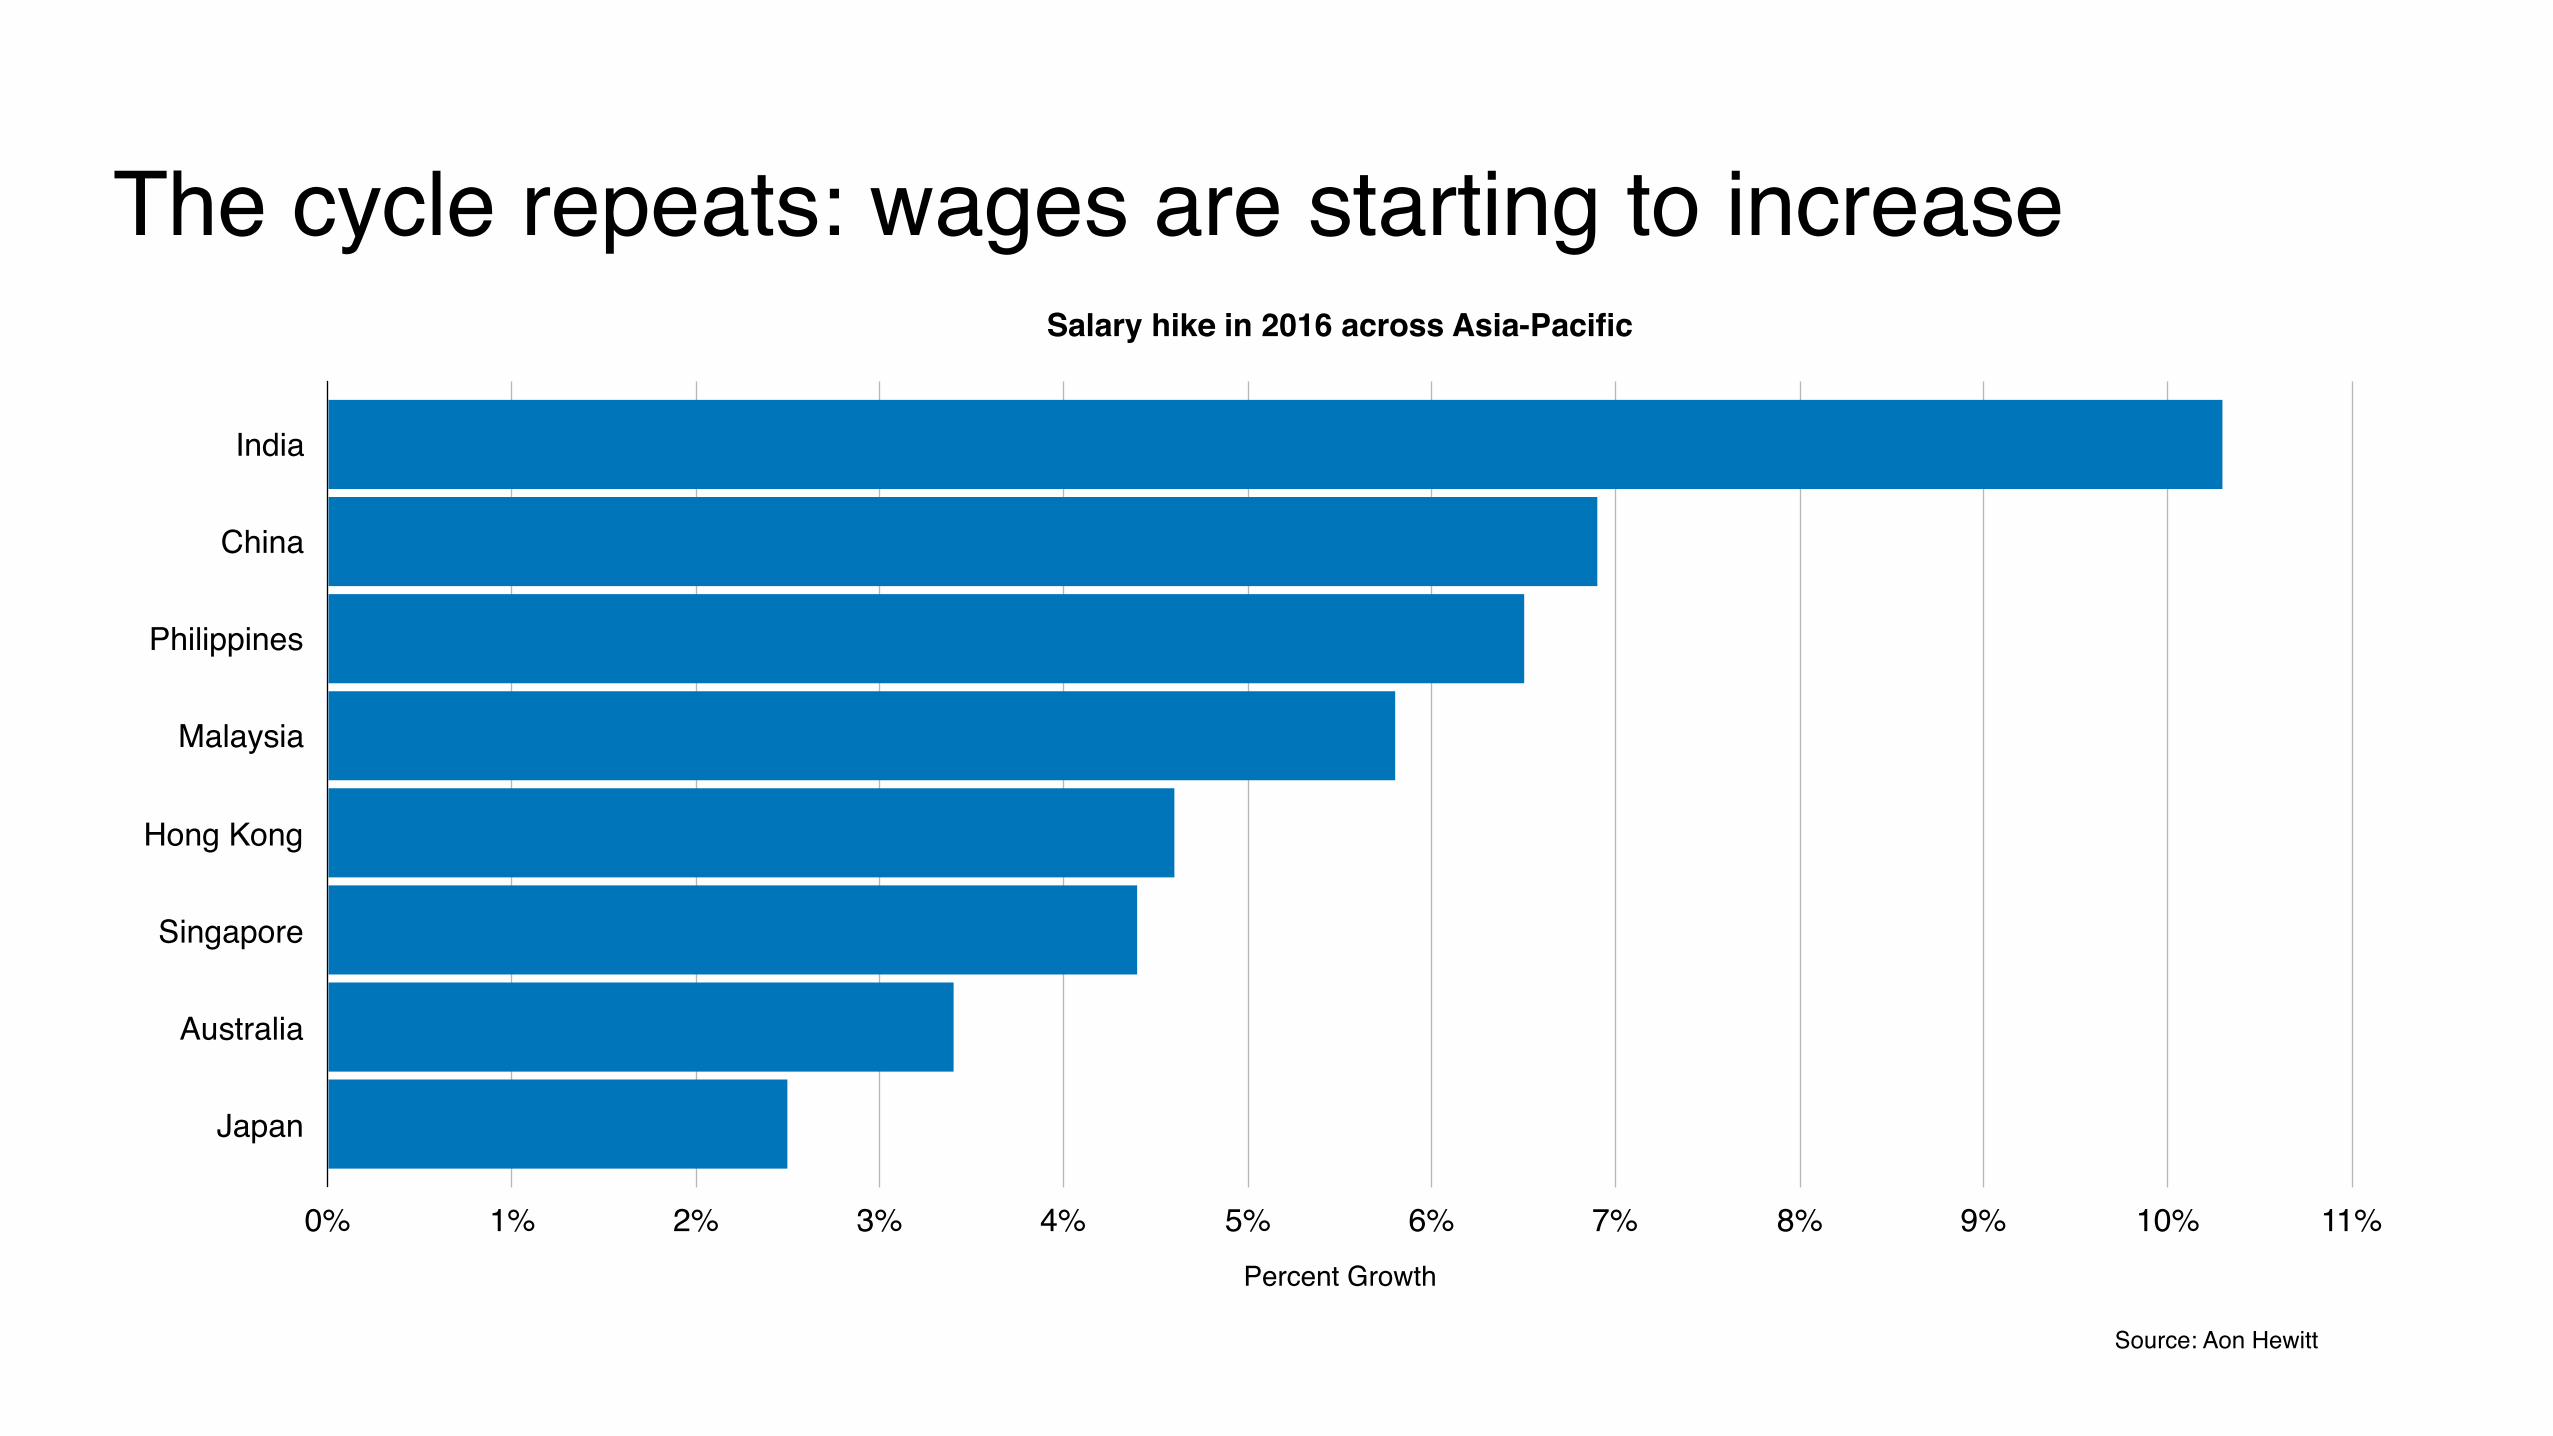
Salary hike in 2016 across Asia-Pacific
India
China
Philippines
Malaysia
Hong Kong
Singapore
Australia
Japan
Percent Growth
0% 1% 2% 3% 4% 5% 6% 7% 8% 9% 10% 11%
The cycle repeats: wages are starting to increase
Source: Aon Hewitt

China’s working-age population
Perc
ent o
f the
pop
ulat
ion
55%
60%
65%
70%
75%
1950 1955 1960 1965 1970 1975 1980 1985 1990 1995 2000 2005 2010 2015
Available workers are starting to decrease
Source: United Nations, National Bureau of Statistics

Change in working age population (age 15-64)
Milli
ons
of p
erso
ns
-100M
-50M
0M
50M
100M
150M
200M
250M
300M
350M
1990 2000 2010 2020 2030 2040 2050 2060
Rest of world
A global decrease of people entering the workforce
Source: IMF, Regional Economic Outlook, Chapter 3, April 2015

Change in working age population (age 15-64)
Milli
ons
of p
erso
ns
-100M
-50M
0M
50M
100M
150M
200M
250M
300M
350M
1990 2000 2010 2020 2030 2040 2050 2060
Sub-Saharan Africa Rest of world
Creating opportunities for other parts of the world
Source: IMF, Regional Economic Outlook, Chapter 3, April 2015

Source: CIA Factbook
Population under the age of 25 years old
Nigeria
Kenya
Zimbabwe
Ghana
South Africa
USA
UK
Japan
Percent of population
0% 10% 20% 30% 40% 50% 60% 70%
As a generation of young people in Africa grows

Job creation in African start-ups
Job
Gro
wth
Rat
e
10%
20%
30%
40%
50%
60%
70%
80%
90%
100%
110%
2011 2012 2013 2014
Jobs in African tech startups skyrocket
Source: The Atlas

Africa primed for the future
Large labor force
29 million workers enter labor force yearly
Booming entrepreneurship
22% start a businessof working age adults
Young population
60% of populationunder 25
Internet readiness
45% of GDPwas transacted via mobile in Kenya
Source: African Economic Outlook 2017

Big players seem to think so

Is Africa China’s China?
Chinese investment in Africa has risen from $7 billion in 2008 to $26
billion in 2013 (“Knowledge@Wharton,” UPenn)
Over $100 billion in African roads, telecom, water, power and light industry financed by
China over the last 15 years (“Delivered,” DHL)
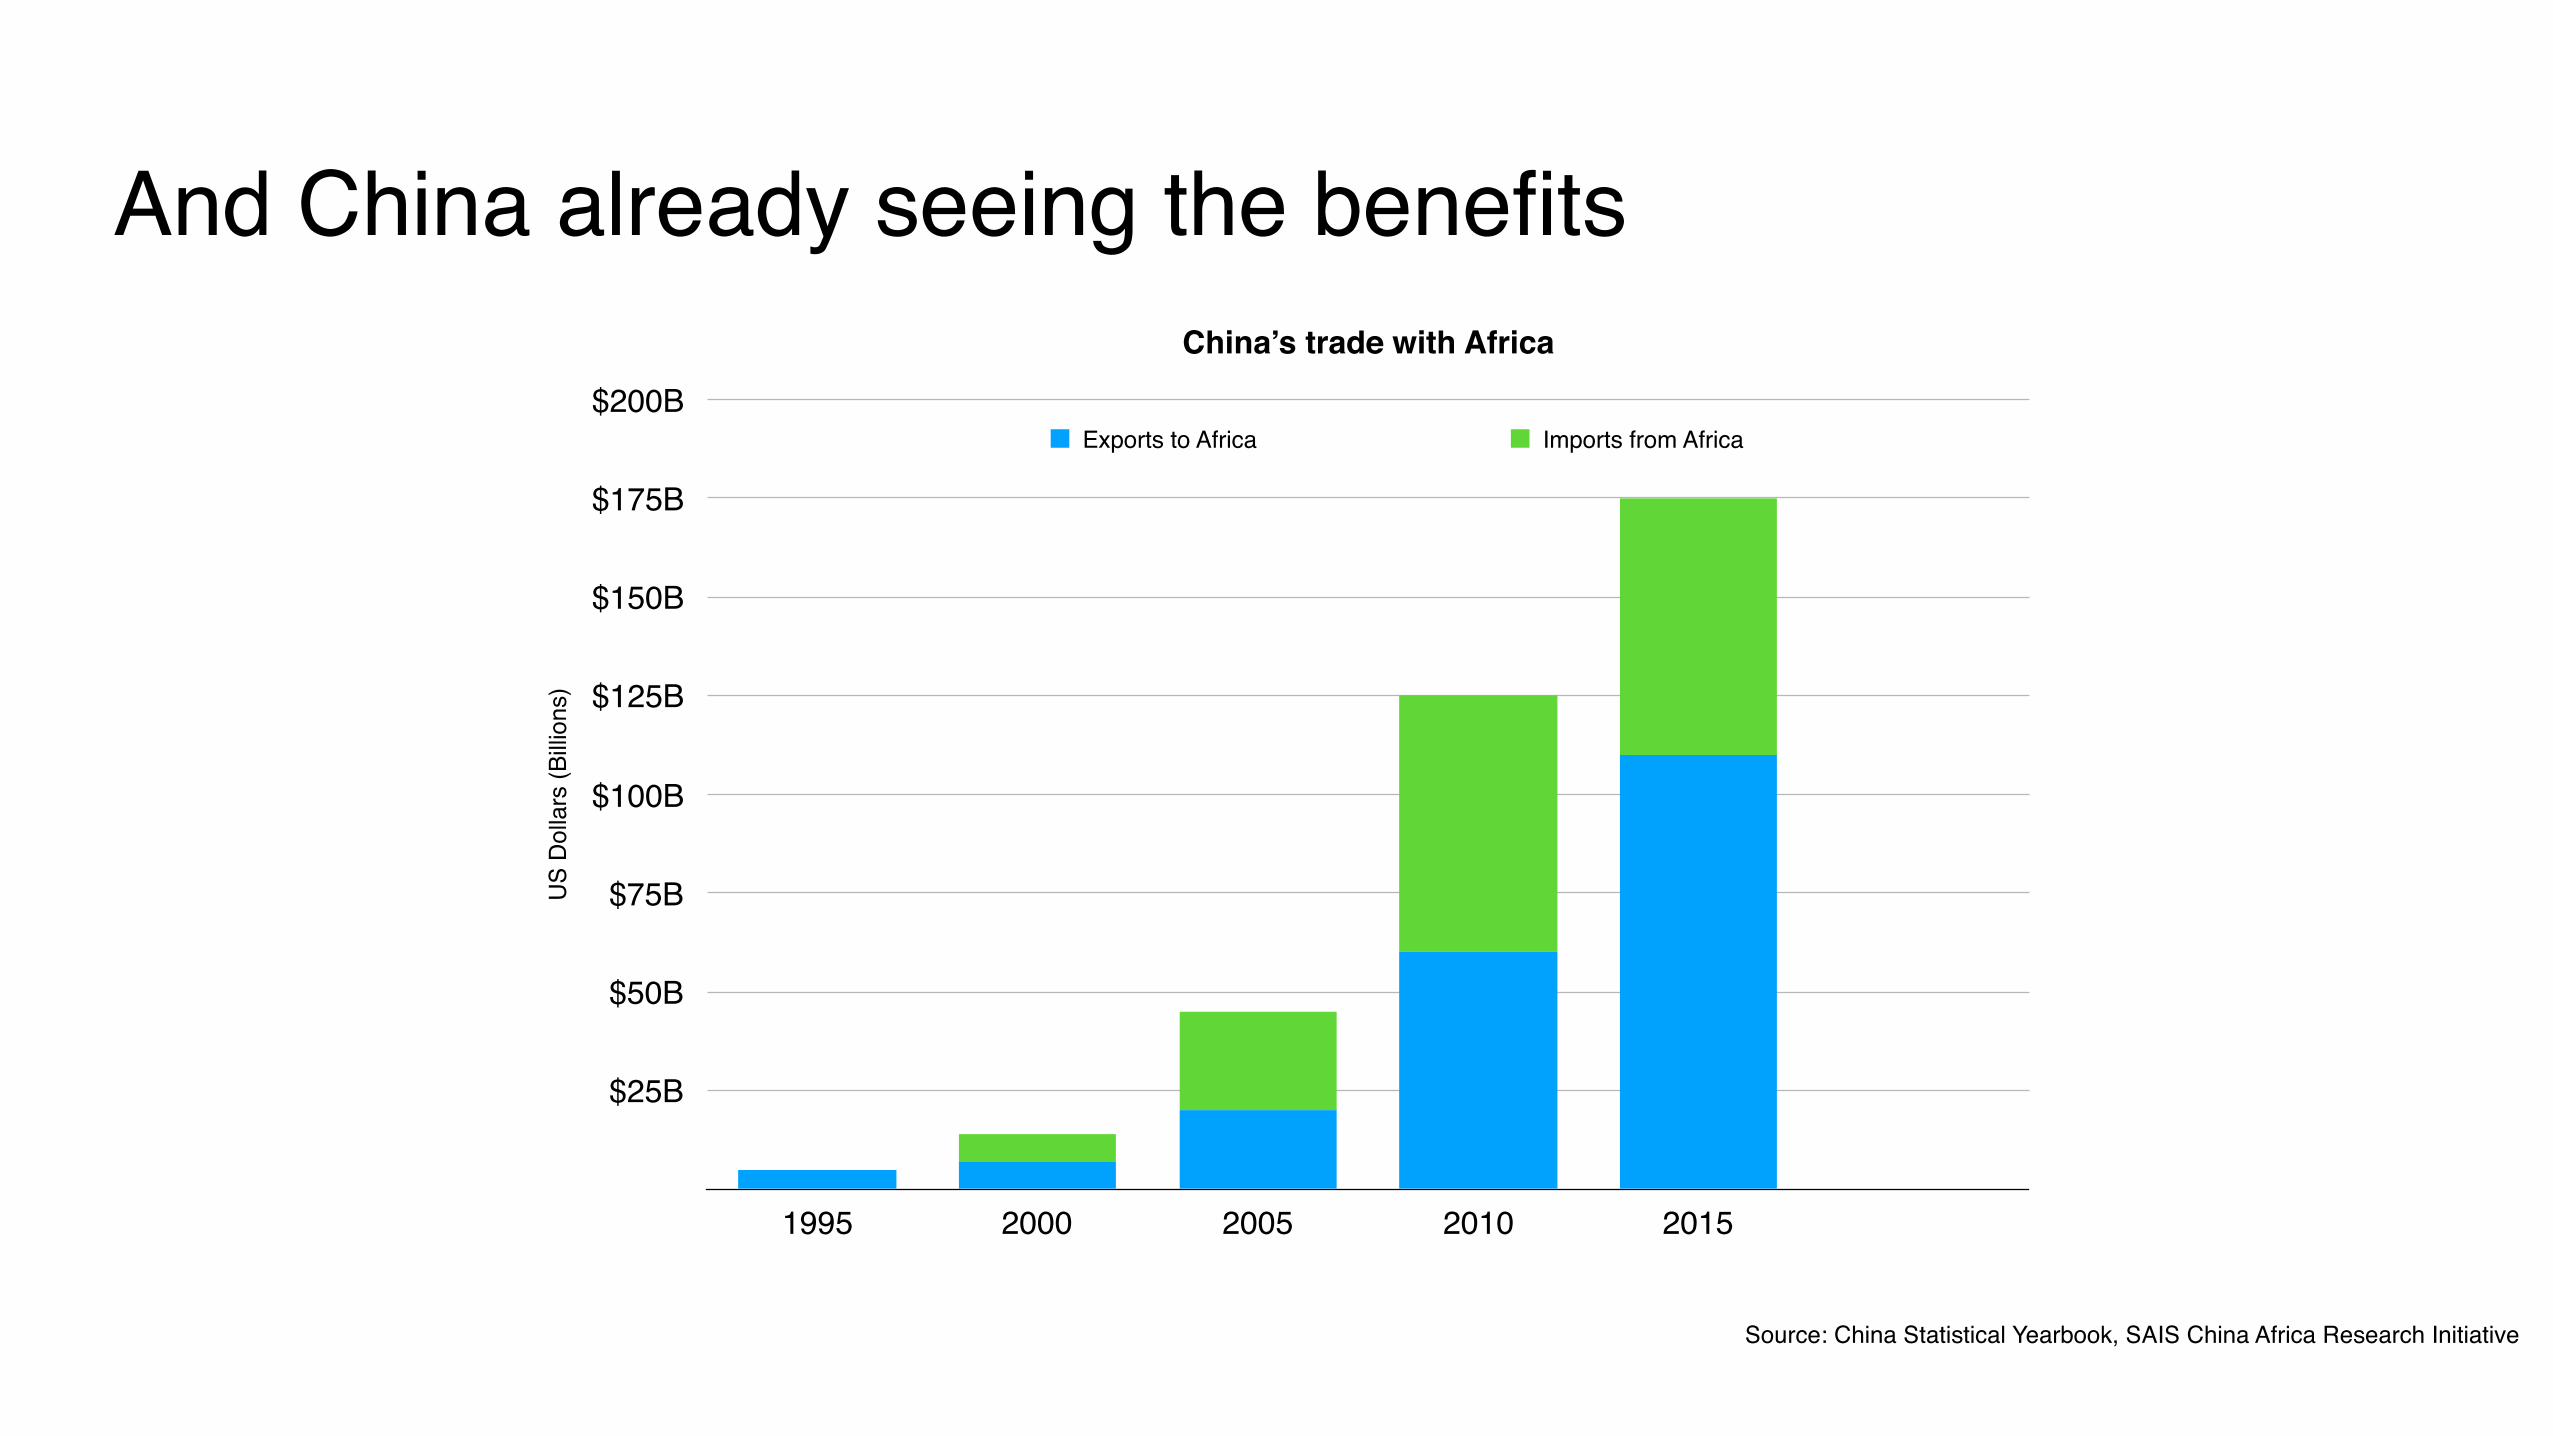
And China already seeing the benefits
Source: China Statistical Yearbook, SAIS China Africa Research Initiative
China’s trade with Africa
US
Dol
lars
(Billi
ons)
$25B
$50B
$75B
$100B
$125B
$150B
$175B
$200B
1995 2000 2005 2010 2015
Exports to Africa Imports from Africa

Will Africa become the world’s next tech hotspot?
Tweet your thoughts @jagermcconnell