fehrenbach fuels for the future 24 1 2017
TRANSCRIPT
Horst Fehrenbach
14. Fachkongress für erneuerbare Mobilität Kraftstoffe der Zukunft 2017 23.-24.01.2017 im CityCube Berlin
GHG emission factors for renewable energy in
the transport sector and reduction potential: Biodiesel, Bioethanol, Biomethane, Elektromobility, Power-to-X

Horst Fehrenbach 2 24.1.2017
Overview
1. Why emission factors?
2. Basics regarding calculation and data bases
3. How to derive emission factors
4. Emission factors for • Biofuels
• Power-to-X
• E-Mobility.
5. conclusion
Horst Fehrenbach 3 24.1.2017
Why emission factors?
• GHG reduction obligation accoring to the RED (2009/28/EG) und FQD (2009/30/EG) für Biokraftstoffe “Recast”: COM(2016) 767 concerning economic operators
• Basis for the compilation of GHG balances e.g. for natioanle emission reporting
• Kyoto Protocol (National Inventory Report)
• Report according to RL 2009/28/EGC article 22 ( deleted by Recat)
• Basis for GHG balances or carbon footprints for companies/producers Goal: Optimizing processes and systems.

Horst Fehrenbach 4 24.1.2017
Life Cycle Assessments, Well-to Wheel-Studies, GHG balances for biofuels have been produced since more than 20 years.
Actually there are lots of data bases
Basics regarding calculation and data bases

Horst Fehrenbach 5 24.1.2017
Basics regarding calculation and data bases
● The one and only emission factor for biofuel etc.
● Ranges result from „natural“ diversity and complexity of settings, circumstances and presumptions, e.g.
– Particularly conservativity of default values – Different methodical approaches – Different background data – Temporal and spatial conditions.
● Efforts to gain harmonization (e.g. BioGrace for conventional biofuels)

Horst Fehrenbach 6 24.1.2017
How to derive emission factors
System boundary (e.g. conventional biofuel):
Nutzungsphase/use phase:
Vorkette/upstream:
direkte
Emissionen
Industrielle
Emissionen
in anderen
Sektoren
Feldemissionen
Herstellung der Anlagen/Infrastruktur
Nutzungs-
emissionen
Agrarrohstoff
Verarbeitung
Nutzung
Vorprodukte
Energie
Energie
Chemikalien
Transport
Transport Kraftstoff
Kraftstoff

Horst Fehrenbach 7 24.1.2017
How to derive emission factors
System boundary according to the RED:
Nutzungsphase:
Vorkette/upstream:
direkte
Emissionen
Industrielle
Emissionen
in anderen
Sektoren
Herstellung der Anlagen/Infrastruktur
für biogene und
EE-Kraftstoff = 0
Agrarrohstoff
Verarbeitung
Nutzung
Vorprodukte
Energie
Energie
Chemikalien
Transport
Transport Kraftstoff
Kraftstoff
Feldemissionen
Horst Fehrenbach 8 24.1.2017
Emission factors
Quelle: ifeu BioEm-Bericht
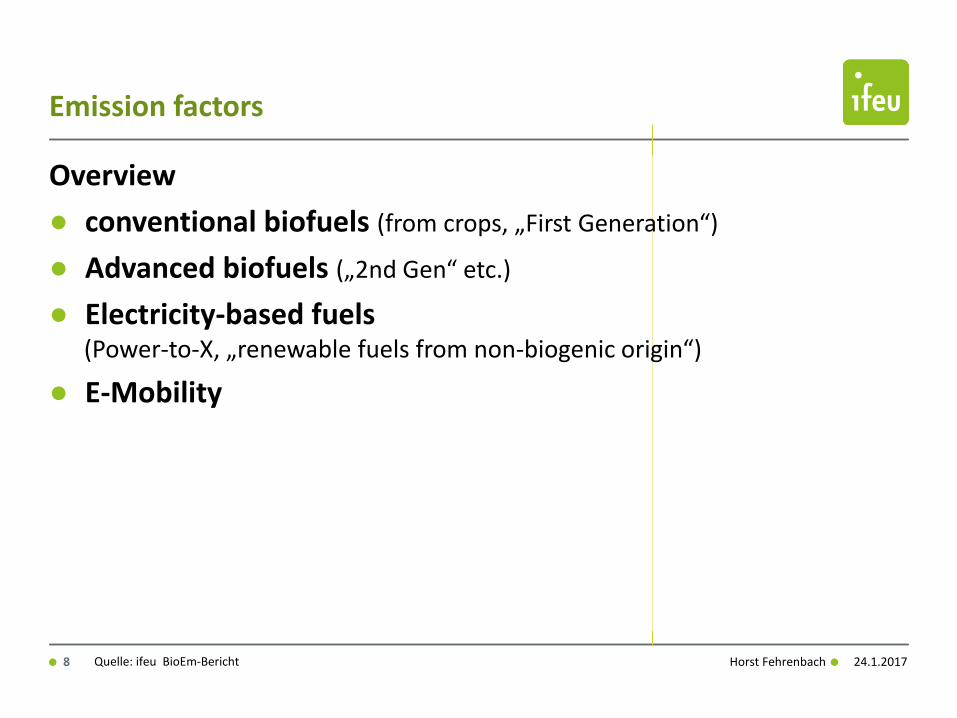
Overview
● conventional biofuels (from crops, „First Generation“)
● Advanced biofuels („2nd Gen“ etc.)
● Electricity-based fuels (Power-to-X, „renewable fuels from non-biogenic origin“)
● E-Mobility

Horst Fehrenbach 9 24.1.2017
Emission factors
Quelle: ifeu BioEm-Bericht
„conventional“ biofuels
50% reduction vs. comparator 94 g CO2e/MJ

Horst Fehrenbach 10 24.1.2017
Emission factors „conventional“ biofuels
Quelle: ifeu BioEm-Bericht
44,0
31,0
28,1
45,5
42,0
40,8
16,0
38,4
9,4
30,0
13,5
typ. Werte RED recast
BLE 2016
Keine CH4 red.
50% reduction vs. comparator 94 g CO2e/MJ
Horst Fehrenbach 12 24.1.2017
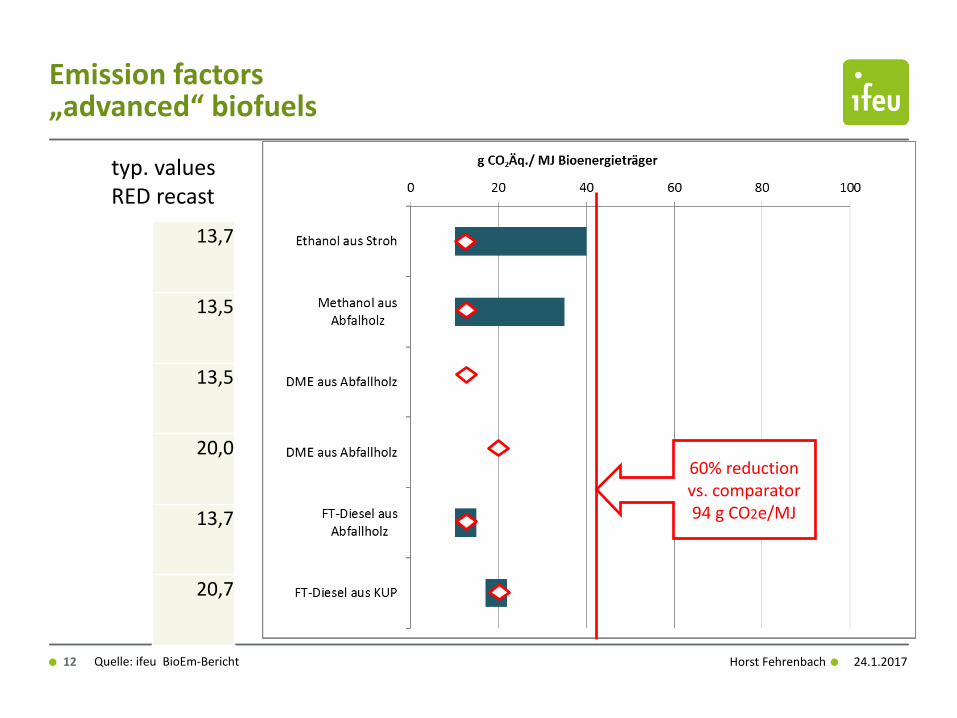
Emission factors „advanced“ biofuels
Quelle: ifeu BioEm-Bericht
typ. values RED recast
13,7
13,5
13,5
20,0
13,7
20,7
60% reduction vs. comparator 94 g CO2e/MJ

Horst Fehrenbach 13 24.1.2017
Bilanzraum bei Kopplung (z.B. über CCR) nicht trivial abzugrenzen
Emission factors PtX
Quelle: ifeu

Horst Fehrenbach 14 24.1.2017
Some examples
Emission factors PtX
fuel System g CO2e/MJ source methanol Electricity mix EU average,
airborne-CO2 306 ifeu
Hydrogen Wind power, airborne-CO2 10,3 ifeu Wind power CO2 from furnace gas
66,5 ifeu
Electricity mix EU average 222 ifeu
Wind power 7,4 ifeu renewable electricity 9,1 RL(EU) 2015/652
methane (SNG) Sabatier process, renewable electricity
3,3 RL(EU) 2015/652

Horst Fehrenbach 15 24.1.2017
Emission factors PtX
Quelle: ifeu BioEm-Bericht
Defaults: RL(EU) 2015/652
60% reduction vs. comparator 94 g CO2e/MJ

Horst Fehrenbach 16 24.1.2017
Emission factors E-mobility
Quelle: ifeu UMBReLa, UBA Emissionsbilanz Erneuerbarer Energieträger
Assumption for direct comparison with fuels: Example Golf: consuming 6 litres Diesel/Petrol per 100 km corresponds to 53 kWh Comparable electric vehicle consumes 9 til 25 kWh/100 km 1 MJ fuel corresponds to 2.1 til 5.9 MJ electricity for traction. Presuming for renewable electricity an emission factor of 30 g CO2-e./kWh 1.4 til 4.0 g CO2-e. converted in way it refers to „1 MJ fuel“

Horst Fehrenbach 17 24.1.2017
Emission factors E-mobility
Quelle: ifeu BioEm-Bericht
60% reduction vs. comparator 94 g CO2e/MJ
Horst Fehrenbach 18 24.1.2017
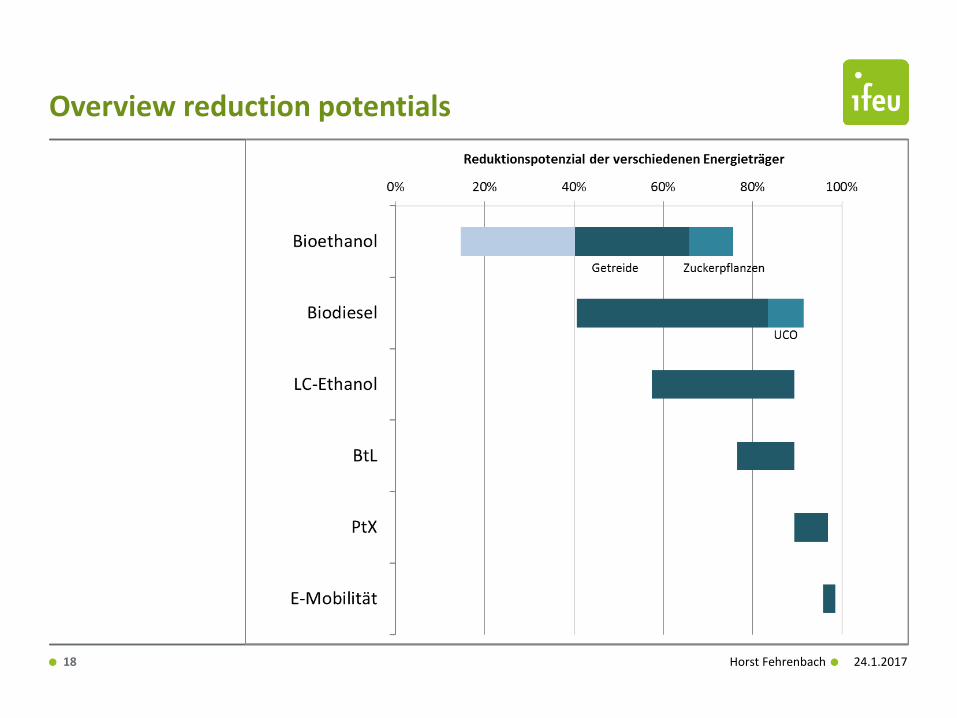
Overview reduction potentials

Horst Fehrenbach 19 24.1.2017
Resumee
• The disclosed renewable fuel and traction types show advantages in general for PtX and E-mobility according to reduction potentials,
• The implementation of the reduction potentials of PtX needs clear framing:
• Availability of sufficient renewable power • Air-borne CO2 because adsorption from flue gases leads to allocation between fuel
and previous process
• E-Mobility needs increased extention of renewable power
• Biofuels show likwise potentials for optimizing, but they don’t catch up with PtX and E-mobility
However

Wilckensstraße 3 69120 Heidelberg Telefon +49 (0)6 221. 47 67 - 0 Telefax +49 (0)6 221. 47 67 - 19 www.ifeu.de Wilckensstraße 3 69120 Heidelberg Telefon +49 (0)6 221. 47 67 - 0 Telefax +49 (0)6 221. 47 67 - 19 www.ifeu.de
Thank you for listening [email protected]