feedstock availability and power costs associated …publish/web/timber...feedstock availability and...
TRANSCRIPT

Feedstock Availability and Power Costs Associated with Using BC’s Beetle-Infested
Pine
Final Report: November 3, 2005
by: Amit Kumar
1
Peter C. Flynn, P. Eng.1
Shahab Sokhansanj, P. Eng.2
1Mechanical Engineering, University of Alberta
2Chemical and Biological Engineering, University of British Columbia
Note: This report is one of two prepared for a re-evaluation of using surplus MPB
killed trees for generating power in B.C. The second report, Trip Report: Site Visit to the 240 MW Alholmens Power Plant, Pietarsaari Finland, is available
from the BIOCAP Canada Foundation (www.biocap.ca) as a companion report.
Prepared for the
BIOCAP Canada Foundation
and the Province of British Columbia
For further information, contact:
BIOCAP Canada Foundation,
156 Barrie Street, Queen’s University, Kingston, Ont. K7L 3N6 Tel: 613 542 0025 Fax: 613 542 0045 Email: [email protected]
Web site: www.biocap.ca1

This work was partially funded by the Province of British Columbia, Ministry of Forests and Range. Publication does not necessarily signify that the contents of this report reflect the views or policies of the Ministry of Forests and Range. The authors are grateful to the BIOCAP Canada Foundation and the Province of British Columbia for the financial support of this study. The authors first issued an analysis of the cost of power from surplus MPB killed trees in British Columbia in April 2005. Many individuals contributed to that first report, and many commented once the first report was issued. Specific acknowledgements are contained within this report, but we express our appreciation to all whose contribution added to this report. We are also grateful to Alholmens, a Finish forestry company operating a 240 MW biomass and coal power plant, Kvaerner Power, who supplied the boiler to Alholmens, and VTT, the Finish Research Institute, who hosted a site visit to Finland that provided very valuable insight into large biomass based power plants. A report on the visit to Finland is contained in a separate report that is a companion to this document. All conclusions are those of the authors and are not endorsed by either of the financial sponsors of this work or the many people who offered comments and suggestions.
2

Mountain Pine Beetle Infested Wood to Power November 2005
Executive Summary In April 2005 the authors issued an initial report on the feedstock availability and cost of producing electricity from surplus Mountain Pine Beetle (MPB) killed trees in the Province of British Columbia. The report generated considerable discussion and the project was considered sufficiently attractive to warrant a reanalysis that reflected a wide range of comments on the first report and a site visit to the world’s largest biomass power generation facility at the Alholmens plant in Pietarsaari, Finland. This report is based on the reanalysis and the information gathered during the plant visit.
The MPB has caused extensive damage to trees in British Columbia, threatening the health of the forestry industry and the viability of several communities in some portions of the province. This study is a conceptual engineering economic analysis of the option of generating electrical power from MPB killed trees that would otherwise go unharvested. The merits of this option include:
• A large scale source of electrical power that is carbon neutral (“green power”), consistent with the mandate within B.C. to source 50% of incremental power from green sources.
• Earlier reforestation of some areas of MPB killed trees, leading to earlier future benefit and reduced hazard of forest fires.
• Employment for forest industry personnel in the harvesting and transportation of trees, providing sustenance to some communities in B.C.
Four cases are evaluated in this study, two sizes at each of two locations. The first location is the West Road/Nazko River area approximately 100 km west of Quesnel along the West Road. This area was chosen because it has been identified as having a very high density of MPB killed trees that are forecast to otherwise go unharvested. The West Road/Nazko River location would incur a premium for plant construction, estimated at 5% higher than Quesnel due to the more remote location. (Relative to a major location serviced by boat or barge (tidewater) the Quesnel site is estimated to have a capital cost premium of 5% and the West Road/Nazko River site a 10% premium.) The West Road/Nazko River site would also require a 100 km dedicated transmission line with an estimated line loss of 1%. The second location is adjacent to Quesnel, B.C., which has a lower density of MPB killed trees in the region and hence a higher cost of transportation of fuel to the plant but that has the advantage of a closer location to the existing high voltage BC Hydro transmission line and a lower plant construction cost. A slightly lower power cost is calculated for the Quesnel location but the difference is within the accuracy of the study. Quesnel is the recommended location based on the future potential for co-generation (use of waste heat) discussed below. A circulating fluidized bed (CFB) steam cycle power plant producing 300 MW of power delivered to the existing BC Hydro transmission line at Quesnel (net of internal power station usage; gross power production is ~330 MW) is evaluated at each location. Note that the transmission line loss means that the West Road/Nazko River plant is slightly larger than the Quesnel based plant. Over an operating life of 20 years these two cases, 1N and 1Q, use 63 million cubic meters of wood chips from whole harvested trees, equivalent to 50 million cubic meters of merchantable timber assuming a merchantable to total tree volume ratio of 0.8. Two additional cases, 2N and 2Q, are based on the same technology power plant producing 240 MW of gross power and a net power to the
3

Mountain Pine Beetle Infested Wood to Power November 2005
grid at 219 and 221 MW respectively (the difference is again due to transmission line loss). These cases use 46 million cubic meters of wood chips over the 20 year operating life, equivalent to 37 million cubic meters of merchantable timber. The 240 MW gross plant is based on the nominal design capacity of the Pietarsaari plant; the 300 MW net plant is based on a tradeoff between the cost benefit of large scale against the risk of building a large single plant. The 300 MW net plant sited in Quesnel is the recommended option, and the levelized cost of power from this size of plant is less than $70 per MW excluding any potential federal or provincial subsidies for green power and excluding the value of any carbon credits from the project. Note that the volumes of wood used in the proposed power plant are low relative to the estimated total future volume of surplus MPB killed trees in B.C. Estimates of this volume range from 200 to 700 million cubic meters of merchantable timber. In this study, the power plant is assumed to be a stand alone base load condensing steam cycle power plant operating on a dedicated supply of MPB killed wood for a period of 20 years. After 20 years it is assumed that the plant will be fully depreciated but can continue to operate if additional MPB killed surplus trees, forest harvest residues, waste wood and other sources of combustible biomass are available. The plant could also operate on a fossil fuel such as coal or a biomass fossil fuel blend in the future, with investment to modify fuel storage and feeding systems and possibly flue gas desulphurization. Note that if a suitable host can be found for low quality heat, the plant could be developed as a cogeneration facility, with improved economics. The critical factor here is identifying a suitable host/heat sink. The Quesnel location has a far higher probability of finding a suitable host with a demand for either low pressure steam or high temperate water. The plant can be designed for a combination of full condensing and heat extraction capability, allowing future development of a host for waste heat. The Pietarsaari plant has the dual capability of operating on full condensing or heat extraction mode. Construction of a 300 MW power plant burning MPB killed trees would place Canada in the forefront of biomass based power plants. It would develop engineering, construction and operation skills in biomass power within Canada. A larger power plant, for example a 450 MW plant, has a lower calculated power cost, but the scale up from existing designs is larger than we project a developer would be comfortable with, given the diminishing benefit realized in lower power cost, which is discussed in further detail below. Smaller power plants generate increasingly more expensive power because the loss of economy of scale in capital equipment has an increasingly significant impact on overall power cost. A 300 MW plant is consistent with other CFB boilers burning fossil fuels. Kvaerner Power, the firm that supplied the boiler at Pietarsaari, and Foster Wheeler, a competing supplier of CFB boilers, both see no technical barrier to the design of a 330 MW gross CFB boiler burning a wood fuel. The CFB technology is recommended because it has been demonstrated and is commercially available at large scale; the Pietarsaari plant has operated on a 100% biomass feedstock, although it often burns some coal due to the lack of adequate supplies of biomass in Finland. A sensitivity study of gasification of woody biomass and combustion of the gas in a combined cycle generator shows a higher power cost, but in
4

Mountain Pine Beetle Infested Wood to Power November 2005
addition the project risk would be far higher because the technology has not been demonstrated at scale greater than 6 MW. In this study, it is assumed that trees are cut, skidded to the roadside and whole trees are chipped. The chips are transported to the plant by a chip van truck where it is combusted to produce power. The estimated draw area for a 300 MW power plant located at West Road/Nazko River is 112 km by 112 km based on the estimated density of otherwise unharvested MPB killed trees. The Quesnel location has a lower estimated gross density of surplus MPB killed trees, and the estimated draw area for this case is 145 km by 145 km. Note that only surplus MPB killed trees are harvested for fuel; other species continue to be harvested for existing uses. The following tables show summary data, key design and cost factors and sensitivities for the four cases; all costs are exclusive of any governmental subsidies for green energy and exclusive of the value of any carbon credits from the project. Capital recovery costs include an 10% pre tax return on total capital; the plant is assumed to have a mix of debt and equity financing that would be specific to a project developer, so a return on equity is not estimated. Table S1: Summary of Results. Item Case 1N
West Road/ Nazko River
Case 1Q Quesnel
Case 2N West Road/
Nazko River
Case 2Q Quesnel
Size of the MPB wood circulating fluidized bed power plant - direct combustion (gross/net MW)
329/300 326/300 240/219 240/221
Amount of biomass required over 20 years (m3)
62,670,800 62,099,310
45,717,290 45,717,290
Equivalent merchantable timber supplied to plant
50,136,620 49,679,450
36,573,830 36,573,830
Project draw area (km x km) Note: only the surplus MPB killed trees within this area are used for fuel.
112 by 112
145 by 145 95 by 95 125 by 125
Cost of power delivered to BC Hydro grid at Quesnel ($/MWh)
70.53 68.08 73.71 70.60
5

Mountain Pine Beetle Infested Wood to Power November 2005
Table S2: Key power cost elements. Cost element Case 1N
West Road/ Nazko River
300 MW ($/MWh)
Case 1Q Quesnel
300 MW ($/MWh)
Case 2N West Road/
Nazko River
219 MW ($/MWh)
Case 2Q Quesnel
221 MW ($/MWh)
Delivered Biomass Cost Components
Harvesting cost 13.30 13.17 13.30 13.17 Transportation cost 7.62 8.71 7.05 8.00
Silviculture cost 2.93 2.90 2.93 2.90 Road Construction cost 3.63 3.60 3.63 3.60
Chipping cost 4.93 4.88 4.93 4.88 Total delivered biomass cost 32.42 33.26 31.85 32.55
Capital cost recovery @ 10% pre tax return on investment
28.58 27.05 30.93 29.21
Operation and Maintenance Cost Components
Storage cost at plant 0.62 0.61 0.62 0.61 Operating cost for plant 4.94 4.68 5.35 5.05
Maintenance cost for plant 1.44 1.43 1.97 1.95 Administration cost for plant 0.55 0.55 0.76 0.75
Ash disposal cost 0.49 0.48 0.49 0.48 Transmission line cost 1.49 0.00 1.75 0.00
Total operation and maintenance cost
9.53 7.76 10.93 8.84
Total Power Cost from MPB Killed Wood
70.53 68.08 73.71 70.60
Table S3: Key wood supply costs here, show as per actual m3 of recovered tree (left) and per merchantable m3 of standing tree (right). The difference arises because branches and tops are chipped for fuel wood but left in the forest when trees are harvested for lumber or pulp. Supply cost elements
Case 1N ($/m3)
Case 1Q ($/m3)
Case 2N ($/m3)
Case 2Q ($/m3)
Felling 4.80/6.00 4.80/6.00 4.80/6.00 4.80/6.00 Skidding 2.40/3.00 2.40/3.00 2.40/3.00 2.40/3.00 Silviculture 2.52/3.15 2.52/3.15 2.52/3.15 2.52/3.15 Roads and infrastructure
3.12/3.90 3.12/3.90 3.12/3.90 3.12/3.90
Overheads 4.00/5.00 4.00/5.00 4.00/5.00 4.00/5.00 Chipping 4.00/5.00 4.00/5.00 4.00/5.00 4.00/5.00 Hauling 4.68/5.85 5.40/6.76 4.34/5.41 4.96/6.20
6

Mountain Pine Beetle Infested Wood to Power November 2005
Supply cost elements
Case 1N ($/m3)
Case 1Q ($/m3)
Case 2N ($/m3)
Case 2Q ($/m3)
Total delivered cost 25.52/31.90 26.25/32.81 25.17/31.46 25.80/32.25 Table S4: Key power plant cost elements. Cost element Case
1N Case 1Q
Case 2N
Case 2Q
Total capital cost (million $) 645 611 509 486 Capital cost ($/kW installed) 1960 1875 2120 2024 Efficiency (%, lower heating value) 39 39 39 39 Staffing 16 16 16 16 Average labor cost ($/hr) 45 45 45 45 Maintenance cost (% of capital cost) 2 2 2 2 Transmission line cost for 100 km (million $)
31 0 31 0
Transmission loss (%) 1 0 1 0 Power for internal use of plant (MW and as % of total power)
26 (8%)
26 (8%)
19 (8%)
19 (8%)
Average capacity factor (%) 90 90 90 90 Remote location factor (% of capital cost) 10 5 10 5 Table S5: Key sensitivities. Cost element Case
1N ($/MWh)
Case 1Q
($/MWh)
Case 2N
($/MWh)
Case 2Q
($/MWh)Base Case 70.53 68.08 73.71 70.60 Project eligible for Canadian Federal green power subsidy of 1 cent per kWh
60.53 58.08 63.71 60.60
Biomass yield is 25% higher per gross hectare
70.11 67.55 73.35 70.14
Biomass felling and skidding cost is 50% higher
74.82 72.33 78.00 74.85
Biomass transportation cost is 25% higher
72.42 70.26 75.47 72.60
Capital cost of plant 10% higher 73.87 71.24 77.32 74.01 Biomass Integrated gasification and combined cycle power plant
67.37 64.26 67.37 64.26
12% pre tax return on investment 75.16 72.47 78.73 75.34 Moisture content of delivered wood is 25% (dry basis) rather than 13%
72.34 69.90 75.51 72.41
7

Mountain Pine Beetle Infested Wood to Power November 2005
Key conclusions of this study are:
• Power can be generated from surplus MPB killed trees in B.C. for a cost including capital recovery of less than $70 per MWh. This cost excludes the impact of any governmental subsidy or carbon credit.
• Scale (size) of the power plant has a significant impact on overall power cost. In
the range of 50 to 500 MW the benefit from capital efficiency from a larger plant exceeds the incremental transportation cost of hauling wood chips from an increased area, as illustrated in Figure S1. (Figure 1 does not include any efficiency penalty for small scale power plants, although the literature suggests that efficiencies at scales on the order of 50 to 100 MW are 50 to 60% of those for larger boilers.) 300 MW of net power was chosen as a judgmental tradeoff in size, since it is a small percentage increase in size above an existing biomass plant, comparable in size to other fossil fuel CFB plants, and because the incremental saving in power cost above this size is also relatively small.
0
15
30
45
60
75
90
105
0 100 200 300 400 500
Power Plant Capacity (MW)
Pow
er C
ost (
$/M
Wh)
Power cost at Quesnel (no transmission line)Power cost at West Road/Nazko River (including transmission line)
Figure S1. Power cost as a function of power plant net capacity.
8

Mountain Pine Beetle Infested Wood to Power November 2005
• The Quesnel location has a higher delivered fuel cost due to a lower density of
surplus MPB killed trees in the surrounding area but gains from a lower construction cost due to its non-remote location and no cost for a transmission line and its associated 1% power loss. The net impact based on estimated availability of surplus MPB killed trees slightly favors the Quesnel location. Based on current estimates of surplus MPB tree availability the Quesnel location is preferred because it also has a higher potential for finding a host that could use low quality exhaust heat from the power plant (steam or hot water). As B.C. refines its estimates of the impact of the MPB infestation the location issue can be re-evaluated.
• The volume of MPB wood used over 20 years in a 300 MW net power plant, 50
million cubic meters of merchantable timber, is low compared to current estimates of the total volume of surplus MPB trees estimated for B.C. In theory more than one power plant could be built in B.C. if future forecasts of surplus MPB killed trees remain high.
• The technology for large scale production of power from biomass such as wood
has been commercially proven in Finland. CFB technology is demonstrated, commercially available, efficient, and flexible to possible future changes in fuel supply, e.g. the addition of other biomass sources such as forest harvest or mill residues.
• The estimated power cost is robust, in that sensitivities to higher input costs do
not cause a catastrophic increase in the delivered cost of power.
• Power from MPB wood is green and consistent with B.C.’s objectives for sourcing of future power. The project has the potential to qualify both for a proposed federal subsidy for new green power initiatives and also for carbon credits, since the impact of the plant is to reduce the demand for incremental future power generation based on fossil fuels.
• Recent power prices in Alberta and the Pacific Northwest are in the range of $70
per MWh (Alberta) and $55 US per MWh (Pacific Northwest). Given the potential of an MPB power plant to receive federal support, as announced in the last budget but not yet implemented, and to receive revenue from the sale of carbon credits, an MPB power plant has the potential to earn an adequate return on investment.
The power price determined in this study ($68 per MWh for a 330 MW gross plant in Quesnel) is significantly lower than the figure of $124 per MWh recently reported in an earlier study on power generation from surplus MPB killed trees by Stennes and McBeath (2005). The difference in the two values can be reconciled as follows:
• We use an efficiency of 39% for the conversion of input fuel LHV to electricity vs. a value of 25.5% in the earlier report assuming the same moisture level for both studies. The 25.5% figure is consistent with the small boiler (100 MW vs. 330 MW gross) in this study. 39% is consistent with operating experience at the 240 MW Alholmens power plant at Pietarsaari, Finland.
9

Mountain Pine Beetle Infested Wood to Power November 2005
• We use an operating availability of 7884 hours per year vs. 7000 in the earlier
study. The 7884 value used in this study is conservative (low) compared to operating experience at the Alholmens power plant.
• Feedstock costs in this study and the earlier study are comparable, and unit
capital costs adjusted for scale are higher in this study than the earlier study, but the larger scale used in this study results in a slightly lower capital cost per kW.
The differences in efficiency and availability between the two studies account for 88% ($49 per MWh) of the cost difference between the two studies. Minor differences in the delivered cost of fuel, capital recovery charges and operating costs account for the remaining 12% ($7 per MWh).
10

Mountain Pine Beetle Infested Wood to Power November 2005
Acknowledgements The authors are grateful to BIOCAP Canada Foundation and the BC Government for providing the financial support to carry out this project. The authors thank Mr. Alex Sinclair, Vice President, Western Division, Forest Engineering Research Institute of Canada (FERIC) for his valuable comments on the harvesting, transportation and storage of biomass. We thank David Layzell (BIOCAP), Jamie Stephen (BIOCAP), Jack McDonald (FERIC), Tony Sauder (FERIC), Henry Benskin (Ministry of Forests, BC) for their input and discussion. The authors are grateful to Hank Sherrod (Kvaerner Power Inc., USA), Pekka Saarivirta (Kvaerner Power Oy, Finland), Walt Sanders (Kvaerner Power Inc., USA) and Matti Jarvinen (Electrowatt-Ekono, Finland) for their input on biomass power plant, technology, efficiency and capital cost. The authors are also grateful to Arvo Leinonen and Jouni Hamalainen of VTT Technical Research Centre of Finland for their input on available technology for large scale forest biomass harvesting. The authors are also thankful to Mr. Marvin Eng for his help in determining the availability of the MPB infested wood. Many others in the forestry and engineering community have provided valuable input as noted in the references. However, all the conclusions, recommendations and opinions are solely the authors, and have not been endorsed by any other party. This report builds on an earlier report in which we received input from many individuals in the forestry industry, including Professor Valerie LeMay (Department of Forest Resource Management, University of British Columbia), Professor Vic Lieffers (Department of Renewable Resources, University of Alberta), Professor Emeritus Gordon Weetman (Department of Forest Sciences, University of British Columbia), Dave Spittlehouse (Ministry of Forests, BC), Tony Lempriere (Natural Resources Canada), Joseph Krupski (Ministry of Forests, BC), Christian Wolfe (Ministry of Forests, BC), Dale Draper (Ministry of Forests, BC), Ian Whitworth (Ministry of Forests, BC), Brad Stennes (Canadian Forest Service), Alec McBeath (Canadian Forest Service), Bill Wilson (Canadian Forest Service), Terry Hatton and Peter Graham.
11

Mountain Pine Beetle Infested Wood to Power November 2005
Table of Contents Section Title Page No.
Title Page
Executive Summary
Acknowledgement
Table of Contents
List of Tables
List of Figures
1
3
11
12
13
14
1.
2.
3.
4.
5.
6.
7.
8.
9.
10.
Background and overview
Biomass source and characteristics
Fuel properties
Scope and cost
Input data and assumptions
Results and discussion
Sensitivities
Discussion
Conclusions
Next steps
References
Appendix
15
16
18
18
25
25
35
36
39
39
41
47
12

Mountain Pine Beetle Infested Wood to Power November 2005
List of Tables Table No. Title Page No.
1.
2.
3.
4.
5.
6.
7.
8.
Fuel wood properties
Comparison of delivered cost of biomass
Biomass production and delivery data
Power plant characteristics and costs
General assumptions
Resource requirement and power cost composition for a
MPB killed tree biomass based power plant over 20 years
Life cycle emissions (g of CO2 equivalent per kWh) from
Sensitivities for a MPB killed tree based biomass power
plant for West Road/Nazko River and Quesnel locations
18
22
26
27
29
31
28
24
35
13

Mountain Pine Beetle Infested Wood to Power November 2005
List of Figures Figure No. Title Page No.
1.
2.
3.
4.
5.
C1.
Map of study area
Power cost as a function of capacity for MPB killed wood
based plant
Impact of carbon credit on power cost based on
displacement of base load coal generation in Western
Canada or the North Western US
Impact of ratio of merchantable volume to total volume of a
tree on power cost for West Road/Nazko River and
Quesnel locations for a biomass power plant
Impact of moisture content on power cost for West
Road/Nazko River and Quesnel locations for a biomass
power plant
Location of Quesnel, BC and Highway 97
17
32
34
38
38
49
14

Mountain Pine Beetle Infested Wood to Power November 2005
1. Background and Overview
The forestry industry of the Province of British Columbia is facing a major problem due to mountain pine beetle (MPB) infestation. According to current estimates the area of infestation in British Columbia was 4.2 million hectares in 2003. This infestation is expected to result in about 500 million m3 of infected wood biomass over three years. At least 40% of this biomass, 200 million cubic meters is forecast to remain unharvested. Some parts of Alberta have also been affected by MPB infestation. Regions where the damaged wood is not harvested will experience loss of jobs in the forestry sector with an impact on the viability of communities. Unharvested areas may not be replanted in a timely manner. The unharvested biomass is a fire hazard to regrowing species, and hence there is the risk of even more future economic damage. This unharvested wood, if left to decay in the stands, would release carbon into the atmosphere. Canada has ratified the Kyoto Protocol on Climate Change. The infected pine can be used to generate green power, which would help mitigate greenhouse gas emissions by displacing future investment in fossil fuel generation. It will thus contribute to Canada’s efforts to comply with Kyoto Protocol while helping sustain the forestry industry in B.C. Many plants around the world burn biomass to make heat, power or a combination of the two. Many of these plants are based on mill residues, for example bark, sawdust and trimmings, and hence are built at a small size that reflects the source of the biomass. An example of this is the 65 MW plant in Williams Lake that uses about 600,000 tonnes of saw mill residue per year, and numerous smaller power plants throughout Canada. California has 28 direct combustion biomass power plants with a generation capacity of 558 MW and an additional 70 MW of generating capacity from cofiring of municipal waste; many other plants are located across the US. Europe has many biomass power plants, including several using straw as a fuel. Several authors have noted that the cost of power from a biomass based plant is dramatically lower for larger plants sizes, greater than 200 to 300 MW (see, for example, Jenkins, 1997; Jenkins, 2005; Kumar et al., 2003; Larson and Marrison, 1997). Because many biomass projects to date are constrained by mill residue supply or by their demonstration nature, only one plant has been built over 100 MW, a 240 MW mixed fuel (fossil plus biomass) Alholmens power plant in Pietarsaari, Finland; the largest North American plant, a US plant burning wood, operates at 80 MW (Wiltsee, 2000; Organization for the Promotion of Energy Technologies, 2004). One component of the second phase of evaluation of an MPB wood based power plant in B.C. was a site visit to the Alholmens power plant; this is reported on separately (Flynn and Kumar, 2005). The principal diseconomic cost factor for small biomass plants is the high cost of plant capital per unit of output. Power cost per MWh rises dramatically for plants at sizes below 250 MW. As plants get larger, biomass transportation distances increase, and this cost factor eventually overwhelms savings from capital efficiency, but not until significant plant sizes are reached. A highly detailed study by Kumar et al. (2003) identified the optimum size of biomass based power plants in western Canada as being 450 MW or larger. Critical factors in determining optimum size are the tradeoff between plant and transportation costs, and the biomass yield per gross area is a key parameter; this study explores this in detail for beetle infested pine in two areas of B.C. The technology for building large scale biomass power plants is well understood; there is no technical hurdle to overcome in the plant design. By building a power plant in the
15

Mountain Pine Beetle Infested Wood to Power November 2005
range of 200 to 400 MW for beetle infested pine, Canada and BC would position themselves at the forefront of power generation from biomass at the very time that this technology will undergo intense scrutiny around the world as a means by which countries can meet their Kyoto targets. In addition to the direct benefit of using beetle infested pine to generate power, Canadian firms would be well positioned to design and/or develop projects in other locations around the world. Given Canada’s large forestry resource, it makes sense for it to be a leader in power from wood. The objective of this study is to incorporate feedback and new information to revise the cost calculations of the first phase techno-economic study for using a portion of BC’s mountain pine beetle damaged pine as a fuel source to generate power (Kumar et al., 2005a). The objective was to estimate the cost of power from biomass plants with gross capacity of 240 MW and 330 MW in two locations: West Road/Nazko River and Quesnel. These locations are identified as most appropriate locations for biomass power plant based on the availability of large amount of unharvestable MPB infested wood (Eng, 2005a). We evaluated four cases: Case 1N – a 300 MW power plant (330 MW gross) at West Road/Nazko River; Case 1Q – a 300 MW power plant (330 MW gross) at Quesnel location; Case 2N – a 219 MW power plant (240 MW gross) at West Road/Nazko River location; and, Case 2Q – a 221 MW power plant (240 MW gross). Our assessment estimates the cost of power from harvesting and transporting a portion of the beetle infested pine wood to a dedicated wood burning power plant for a period of 20 years. 2. Biomass Source and Characteristics The Province of British Columbia has a total land area of 94 million hectares. Timber productive forest land area is about 55% of the total land area. Timber productive volume for the province is about 10,595 million m3 (Wood and Layzell, 2003). As of August, 2003, the annual allowable cut for the province was about 74.4 million m3/yr of wood (Ministry of Forests BC (MOF), 2003). British Columbia’s forest consists of both coniferous and deciduous tree species. The coniferous species include lodgepole pine, douglas fir, spruce, hemlock, cedar, and true firs. Among these lodgepole pine is the most susceptible to MPB attack. The extent of infestation is difficult to estimate because of the variability in the rate of infestation and the increase in infestation every year. MPB attacks mature trees that have larger diameters and thick bark, which helps protect the beetles from predators. MPBs attack the trees in a symbiotic relationship with blue stain fungi. Infected trees are typically 80-100 years old and have low resistance to the fungi. Beetles feed on the sapwood and the fungus attacks the tree’s resistance mechanisms, resulting in the death of the tree (Pacific Forestry Centre, 2005). This study focuses on the killed lodgepole pine in the interior of BC. The standing beetle infested pine trees offer a great opportunity as a relatively dense field source of woody biomass which can support a large scale stand-alone power plant. Current estimates are that at least 200 million m3 of wood would remain unharvested (MOF, 2003) and this may to increase up to 700 million m3. The area included in this study is the Quesnel TSA and specifically locations where the MPB infestation is severe. Two sites within this study area were selected: the West Road/Nazko River area has a very high concentration of surplus MPB killed trees, and the Quesnel is expected to have lower density but still a large amount of unharvested infested wood situated closer to a community, rail line, major access road and major transmission line. Figure 1 shows the study area. In this study the yield for 60 year or older lodgepole pine stands is estimated
16

Mountain Pine Beetle Infested Wood to Power November 2005
using the initial report by MOF (Eng, 2005a) and also from personal communication with Marvin Eng of MOF (Eng, 2005b). Actual amounts of MPB killed trees and the fraction of them that are surplus to existing forestry operations is under current re-evaluation within the MOF, and yield figures may be adjusted in the future. In this study we assume that MPB killed trees are cut and skidded to the roadside. At the roadside the whole tree is chipped and chips are transported to the plant by a chip van. Thus in this case limbs and tops are also chipped and used as fuel. Typically, the residues (limbs and tops) range from 15% to 25% of the total tree biomass in the forest. In this study we have assumed a value of 20% for the residues, and hence actual yield is 25% higher than merchantable volume. The final average standing yield per gross hectare for lodgepole pine is estimated at 64.1 m3 for the West Road/ Nazko location and 37.5 m3 for Quesnel location.. Gross hectares include all other land uses such as other forest species and non-forest land use.
Figure 1: Map of the study region (Ministry of Forests, 2003).
17

Mountain Pine Beetle Infested Wood to Power November 2005
3. Fuel Properties Equilibrium moisture content (EMC) of wood is one of the most important characteristics for its use as fuel. Water in the wood has a tendency to reach equilibrium with the surrounding air. The EMC of wood stored outdoors is a function of the surrounding temperature and relative humidity of the air. The temperature and relative humidity of air varies with the geographic location and time and hence the EMC varies. In this study we estimated the equilibrium moisture content of the wood based on equations developed by William Simpson of the United States Department of Agriculture Forest Service (Simpson, 1998). The equations for estimation of EMC are given in Appendix A. In this study EMC is estimated for Williams Lake, which is approximately in the center of the study area; its temperature and relative humidity are assumed to be representative of the study area. A detailed estimation of temperature and relative humidity of each sub-region in the study area is beyond the scope of this study. Average daily temperature and relative humidity data over 20 years for Williams Lake were gathered from Environment Canada (Environment Canada, 2005); the estimated average daily temperature and relative humidity used in this study were 4.2 oC and 67.6 %, respectively. The calculated value of EMC was 13% (dry basis); other assumed fuel properties are given in Table 1. The value of EMC has a critical impact on the available fuel value of the wood (lower heating value, LHV), and the impact of EMC is explored as a sensitivity in Section 8 of this report. The density of logs depends on the equilibrium moisture content of wood and species specific gravity. In this study log density was estimated using the procedure detailed in Simpson (1993) at the calculated EMC. The equations used in this study are given in Appendix B. Table 1: Fuel wood properties Items Values Comments/Sources Average annual equilibrium moisture content (%, dry basis)
13 Based on the average temp. and relative humidity of Williams Lake. Calculated using equations given in Appendix A (Simpson, 1998).
Higher Heating values (MJ/ dry kg)
20 This is the average heating value of softwood (Demirbas, 1997).
Density of logs at given moisture content (kg/ m3)
455.3 Calculated based on equations given in Appendix B. Density is for lodgepole pine logs at 13% EMC (Simpson, 1993).
Ash in wood (%) 2.5 (McDonald and Sauder, 2005). Hydrogen content of wood (%, dry basis)
5.98 (National Renewable Energy Laboratory, 2005).
Basic specific gravity for lodgepole pine, Gb
0.38 This value is used to estimate the density of logs at 13% EMC (equations given in Appendix B) (Simpson and TenWolde, 1999).
4. Scope and Cost Note: all currency figures in this report are expressed in Canadian dollars and are in base year 2004 unless otherwise noted. Costs from the literature have been adjusted to
18

Mountain Pine Beetle Infested Wood to Power November 2005
the year 2004 using historical inflation rates; an inflation rate of 2% is assumed for 2005 and beyond. MW refers to electrical megawatts unless otherwise noted. The scope of this study is a dedicated power generation plant operating for 20 years using biomass from infested pine trees. Cost factors are developed for each element of the scope and are included in detail in Section 4. Note that for costs affected by scale, the costs are reported for plant capacities of about 330 MW (gross) and 240 MW (gross). This study is based on the existing practices in the forest industry of western Canada. The study assumes clear-cutting throughout the infested pine plots, skidding the whole tree to the roadside, and whole tree chipping at the roadside. Trees are drawn from throughout the harvest area, giving a constant average transportation distance to the power plant over the life of the plant. The study draws on regionally specific detailed studies of the costs of recovering forest biomass performed by the Canadian Forest Service, the Ministry of Forest (British Columbia), the Forest Engineering Research Institute of Canada (FERIC), from other literature, and from personal discussions with researchers and equipment suppliers (Puttock, 1995; Sinclair, 1984; Hudson and Mitchell, 1992; Hankin et al., 1995; Hudson, 1995; Perlack et al., 1996; Zundel and Lebel, 1992; Hall et al., 2001; LeDoux and Huyler, 2001; McKendry, 2002; Zundel et al., 1996; Silversides and Moodie, 1985; Zundel, 1986; Mellgren, 1990; MOF, 2001; MOF, 2004; Kuhnke et al., 2002). Delivered biomass cost from different sources shows a wide variation as these studies include cost of different operations and systems. Table 2 shows the cost factors used in this study and compares them to results from other studies. This study draws on cost studies by FERIC for most of the operations. Harvesting for fuel wood is simpler and involves fewer steps than harvesting for lumber or pulp: trees are not bucked or delimbed, and residues are not left over at the roadside, and trees are not loaded onto trucks but rather left at roadside for chipping. Hence, our costs are at the lower end of the range of FERIC estimates (MacDonald, 2005). The harvesting system in this study is a feller-buncher and a grapple skidder; tree-to-truck cost includes only felling and skidding. Truck loading and unloading costs are included in the transportation cost. MOF and the Canadian Forest Service conduct ongoing resource and logging studies, including ones specific to the Quesnel region (see, for example, Stennes and McBeath, 2005). As with FERIC figures, the MOF figures reflect operations that are not required when recovering trees for fuel wood, so some components of tree to truck costs in this study are lower than MOF figures. However, road construction, infrastructure and overhead costs are comparable to MOF and CFS costs, with overhead costs being adjusted to reflect for example the absence of waste and residue surveys. Chipping cost in this study is lower than other reported values in the literature, which range from $13.41 to $23.70 per dry tonne (Desrochers, 2002; MacIntosh and Sinclair, 1988; Wiksten and Prins, 1980; Folkema 1989; Bowater Newfoundland Ltd., 1983; Favreau, 1992; Spinelli and Hartsough, 2001; Asikainen and Pulkkinen, 1998). Chipping costs are highly dependent on the specific equipment and the scale of chipping; we have relied on FERIC’s estimates in this study, and the low cost is consistent with the large scale of wood chip recovery. Costs for construction of logging roads, and silviculture costs are included for harvesting the infested forest; these are a significant component of overall cost. One key benefit of an MPB wood biomass power plant is replanting of infested areas in a timely manner. Biomass cost in this study is thus based on full
19

Mountain Pine Beetle Infested Wood to Power November 2005
recovery of all costs associated with harvesting, transportation and chipping, including capital recovery. Some cost factors warrant further comment: • Collection of biomass in the forest: Capital costs for harvesting equipment are not
estimated in this study but rather treated as a custom operation cost that includes capital and operating costs; this is equivalent to assuming that the power plant operator contracts out harvesting.
• Transport of biomass to the power plant site: The cost of building logging roads is charged to the project. Biomass projects have a transportation cost that varies with plant capacity. This arises because the area from which biomass is drawn is proportional to plant capacity, and the haul distance is proportional to the square root of that area. Biomass economics are thus sensitive to biomass yield: higher yields per unit area reduce the area required to sustain a given project size. We explore this effect as a sensitivity.
• Storage of biomass at the plant site: Trees are chipped at the roadside in the forest and transported to the plant by a chip van. A small reserve of biomass is stored on plant site (equivalent to about three months operation) to sustain the power plant when roads are impassible.
• Combustion of the biomass in a boiler, with use of the steam solely for power generation: Full capital costs are calculated for power generation, and are adjusted for capacity by a scale factor. Note that cogeneration, the use of low-pressure steam exhausted from turbo generators for heating, is not considered in this study. Cogeneration improves the return from power plants but requires a host/heat sink that matches the operating pattern of the power plant. The Quesnel location would increase the likelihood that a suitable host could be found to enable cogeneration.
o Scale factor: The base case unit scale factor used in this study was 0.75,
where scale factor is an exponent for adjusting the cost of a direct combustion power generation unit from one capacity to another (see equation below).
factorScale
CapacityCapacityxCostCost )(
1
212 =
Scale factors for single boiler biomass power plants from the literature range from 0.7 to 0.8 (Bain et al., 1996; US Department of Energy, 1997; Marrison and Larson, 1995); similar values are reported for coal (Williams, 2002; Silsbe, 2002). Actual cost data is available for a number of straw based plants, although comparison is difficult because the plants use the steam for heat and power, and the relative mix of these varies from plant to plant (Larsen, 1999; Caddet Renewable Energy, 1988, 1998a, 1998b). After modifying the data to adjust for scope, the scale factor is estimated at 0.8, but this reflects plants built in a variety of locations that are always “new” to that location and that are small and built as demonstration units. For that reason, we have assumed that in a large scale facility the scale factor would be lower, particularly since one other large biomass power plant has been recently commissioned.
20

Mountain Pine Beetle Infested Wood to Power November 2005
Previous studies have shown some disagreement on appropriate range of scale factors; Jenkins (1997) has explored a wide range, from zero to 1.0, while Dornburg and Faaji (2001) argue for a narrower range. Based on discussions with firms that have built major energy facilities, we explore the impact of scale factor in the range of 0.7 to 0.8 for a single unit up to 450 MW size.
o Boiler Technology: Circulating fluidized bed (CFB) biomass boiler would be most suitable for this size. CFB boliers are fuel flexible and can operate with variable moisture content; they have lower nitrous oxide emissions. CFB is a more suitable technology for boiler sizes higher than 100 MW, (Sherrod and Saarivirta, 2005). The largest biomass power plant at Pietarsaari, Finland is a CFB boiler with a gross electrical power output of 240 MW. In this study we have estimated cost of biomass power for 240 MW (about 220 net power output) and near 330 MW (300 MW net power output). Selection of CFB vs BFB is discussed further in a trip report from the site visit to Kvaerner Power and the Alholmens power plant (Flynn and Kumar, 2005).
o Capital cost: Data were drawn from a variety of actual plant costs and
literature sources, and show a wide variability (Broek et al., 1995; Caddet Renewable Energy, 1988, 1998a, 1998b). The plant costs for the biomass boilers used in this study for the Quesnel location for Case 1Q (330 MW gross) and Case 2Q (240 MW gross) are $1875 per installed kW and $2024 per installed kW, respectively. At similar capacities, the cost for West Road/Nazko River location for Case 1N and Case 2N are $1960 per installed kW and $2120 per installed kW, respectively; comparable values for new coal-fired plants in Alberta is $1400 per kW at a size of 500 MW gross. We developed the cost estimates used in this study based on discussion with the boiler manufacturer, Kaverner Power Inc. (Sherrod and Saarivirta, 2005) and considering the design differences between a large scale plant using biomass instead of coal, and applying an adjustment to reported values for stand alone coal power plants (Cameron et al. 2004). Several factors contribute to a higher cost for burning biomass, including higher mass flow rate of solid fuel, lower flame temperature (and hence larger convective to radiant ratio in the boiler) and a more corrosive ash (Miles et al., 1996). The cost estimate for a B.C. based plant is higher than the reported cost 240 gross MW Pietarsaari CFB plant at Alholmens of 700 to 850 Euros per kW.
21

Mountain Pine Beetle Infested Wood to Power November 2005
Table 2: Comparison of delivered cost of biomass Components This study*
(based on FERIC’s
estimates)
Kumar et al., 20051
Stennes and
McBeath, 2005
Northern Forestry Centre,
(Kuhnke et al., 2002)3
(Average cost)
Northern Forestry Centre, (Kuhnke
et al.,2002)3
(Subcontractor's cost)
Gingras and
Favreau, 19964
(FERIC)
Zundel and
Lebel, 19925
Folkema, 19896
(FERIC)
Lower limit
Higher limit
Felling ($/m3) 6.00 2.33 2.77 3.68 4.87 5.29 Skidding ($/m3) 3.00 2.13 2.37 3.03 6.78 3.19 Delimbing ($/m3) 2.23 2.93 3.42 4.11 4.24 Tree-to-truck ($/m3) 9.00 6.69 16.652 8.07 10.13 15.76 12.72 11.38 12.09 Silviculture ($/m3) 3.15 3.15 3.51 0.31 Roads and infrastructure ($/m3) 3.90 3.90 3.88 1.26 1.26 2.13 2.13 Overheads ($/m3) 5.00 5.00 6.82 2.60 2.60 3.56 4.27 Chipping ($/m3) 5.00 1.88 3.27 5.008 5.008 Hauling ($/m3) 6.767 5.09 7.02 5.10 5.10 7.11 7.82 Total delivered cost ($/m3) 32.81 25.71 41.15 22.04 24.10 24.18 26.31
*All the costs have been estimated based on the discussion with personnel from FERIC Western Division and is close to FERIC’s lower estimate of biomass delivered cost (McDonald, 2005). 1 - Cost of felling and skidding is estimated based on a merchantable volume of 0.5 m3 per stem. 2 – Costs are from survey of logging contractors. Tree-to truck cost includes other operations such as bucking, slashing, yarding etc. 3 - Hauling cost is estimated using a transportation cost of $0.0354 /t-km and a loading and unloading cost of $3.40/cu.m. 4 - Values are for a full-tree-harvest system in boreal region. 5 - Values are for a full-tree-harvest system. 6 - Values for whole tree chipping system. 7 – Hauling cost for Quesnel location at 300 MW net power (Case 1Q) where average distance of transport is 62 km with a winding factor of 1.2. Hauling cost for West Road/Nazko location at the same capacity (Case 1N) is $5.85 per m3 for an average transport distance of 48 km with a winding factor of 1.2. For Cases 2Q and 2N, hauling costs are $6.20 per m3 and $5.41 per m3, respectively. 8 – Assumed
22

o Location: We have analyzed two locations in this study based on the
availability of majority of unharvested infested wood. There locations are: West Road/Nazko River and Quesnel, BC. The location is driven by availability of infested wood, proximity to existing highways for biomass transportation, proximity to a major power transmission line, and abundant water relative to the need for makeup for cooling and boiler feed water. The interior of British Columbia has a cold winter, but also has a workforce and construction industry well used to working productively in cold weather. The plant would be sufficiently near to the population centers that construction labor would not need to be housed in a camp for the Quesnel location, and hence the capital cost has no provision for a camp in Quesnel. However, some construction labor might have a daily transportation cost (for example, bus to and from Prince George); to allow for this, overall capital costs are escalated by 5% from values for a large tidewater location (Williams, 2002). A biomass power plant located in the West Road/Nazko River location would need a camp for construction labor. Hence, a capital cost penalty of 10% relative to a large tidewater location, equivalent to a 5% premium compared to Quesnel, is applied. Figure C1 in Appendix C shows location of Nazko and Quesnel , BC.
• Disposal of ash: Evidence from two Canadian biomass plants is that once a biomass
power plant starts up, a demand develops for ash, in that farmers (and perhaps foresters) will remove ash from the plant at zero cost, and spread it on fields (Matvinchuk, 2002). However, since this takes some time to develop, in this study we have taken a more conservative approach: ash is hauled to disposal fields at an assumed average haul distance of 50 km, and spread, all at full cost to the power plant. For this scenario, spreading cost is a significant portion of total ash disposal cost. Ash content for wood is given in Table 1.
• Connection of the power plant to the existing transmission grid: Quesnel is near to a
major existing high voltage power line which runs almost parallel to Highway 97. A biomass power plant in this location would not need a new dedicated transmission line to connect to the existing grid. A plant located in West Road/Nazko River will need a new dedicated transmission line. Capital and operating costs for a 100 km long transmission line are included for West Road/Nazko River case and 1% line loss of power in this connection line is also included in the analysis.
• Operating costs: For the biomass power plant staff compensation is estimated at
$45 per hour to cover salary plus benefits.
o Direct operating labor: A single boiler unit is estimated to require six operators per shift including the fuel receiving yard (Setala, 2005; Broek et al., 1995; Matvinchuk, 2002). This level is higher than comparable coal plants, and reflects larger volumes of fuel coming in more numerous truck deliveries and potential difficulties in the receipt, testing and processing of biomass fuel.
o Administration costs: The biomass power plant is assumed to be a stand-alone company, and an administration staffing level of 8 is assumed for each case. In addition 2 lab staff has also been assumed for the plant. For this
23

Mountain Pine Beetle Infested Wood to Power November 2005
study the staff is sited at the power plant location. If a larger firm owned and operated the biomass power plant, savings in administration costs would be possible. However, these are not a significant cost factor in the overall cost of power.
o Maintenance costs: Maintenance is a major source of uncertainty in evaluating biomass plant operating cost. Existing coal power plants in Alberta that pulverize and fire high ash coal have maintenance costs in the range of $2.04 to $2.85 per MWh. Various studies of biomass units show values that are 7 to 10 times higher (Bain et al., 1996; Broek et al., 1995). After some modifying of actual data from a small demonstration straw fired power plant, we estimated maintenance costs at about $21 per MWh (Caddet Renewable Energy, 1997). We cannot explain this wide range in terms of difficulty of processing fuel or expected problems in the boiler, and we attribute them in part to the startup and demonstration nature of most existing biomass plants. In this study we have assumed that maintenance costs (parts plus labor) are 2% of the initial capital cost of the plant, which gives a maintenance cost of $4.94 per MWh and $4.68 per MWh for 300 MW net power plant at the West Road/Nazko River (Case 1N) and Quesnel locations (Case 1Q), respectively. Values for a 240 MW (gross capacity) at the two locations are $5.35 per MWh (for Case 2N) and $5.05 per MWh (Case 2Q), respectively. Actual maintenance costs in large-scale biomass facilities are a critical issue in overall economics of biomass usage. In addition to above we have assumed 6 staff for day to day maintenance.
• Plant reliability and startup profile: Biomass plants have operating outages that are
often associated with solids handling problems. In this study, a plant operating availability of 0.90 is assumed, which is less than levels of 0.92 achieved in new coal-fired plants (note that Jenkins (2005) cites an availability of 0.88 for California biomass power plants). Startup of solids based power generation is rarely smooth, and this is accounted for by assuming a plant availability of 0.80 in year 1 and 0.85 in year 2. In year three and beyond the availability goes to 0.90 (Wiltsee, 2000). The plant is assumed to be base load, i.e. operating at full available load 7 x 24 hours, which is a reasonable assumption in BC where plants in the region (Alberta/BC/US Northwest) with a higher net marginal cost (fired by natural gas) provide non-base load power. The 240 MW Pietarsaari, Finland plant reports an availability of 93.5%, with 1.5% unplanned outages and 5% planned shutdowns (Setala, 2005).
• Reclamation: A site recovery and reclamation cost of 20% of original capital cost,
escalated, is assumed in this study, spent in the 20th year of the project. Because the charge occurs only in the last year, it is an insignificant factor in the cost of power.
• Return: Power cost is calculated to give a pre-tax return of 10%. This value is
consistent with a plant with a secured fuel supply and power sale agreement. The impact of rate of return is assessed in a sensitivity case; an alternate case is run at 12%. Note that an actual plant would be financed by a mix of debt and equity that would be specific to the project developer, hence no attempt is made to calculate a return on equity.
24

Mountain Pine Beetle Infested Wood to Power November 2005
• Power price: Power in B.C. is bought by BC Hydro, who has a mandate to source a fraction of their incremental power from carbon neutral sources. The typical mechanism used by BC Hydro has been a long term power purchase contract for power from green projects. The cost of power in this study is consistent with other sources of green power. BC Hydro is a net exporter of power to both Alberta and the US Northwest. The recent value of power in Alberta has been $75 Cdn per MWh, and the Mid C price in the Pacific Northwest has been about $55 US per MWh. Hence power from MPB killed trees is close to current power values in export markets without including the impact of a potential Canadian federal government subsidy of $10 per MWh announced with the last budget but not yet implemented and the impact of the sale of carbon credits from the project, discussed further below. Note that operation of the biomass power plant during periods when reservoir and turbine capacity allows storage of displaced water at night and generation from the displaced water during the day would in effect realize on peak power price for the incremental power.
5. Input Data and Assumptions Table 3 summarizes the biomass production and delivery data which includes harvesting and transportation costs. Table 4 gives the power plant characteristics and cost data. Table 5 gives the general assumptions for the cost model. 6. Results and Discussion 6.1. Resource requirement and power cost Table 6 gives the amount of wood required over 20 years to support the biomass power plant, the geographical footprint and the power cost for all four cases. Note that if all of the minimum assumed available 200 million m3 of otherwise unharvested MPB wood were to be used for power production, it would support three 300 MW power plants producing, over their life, 164 TWh of electricity. Figure 2 shows the power cost as a function of plant capacity. In theory, the optimum power plant size would be 450 MW of power generation, but in practical terms a unit of 300 MW would reduce the risk to the project developer, because it is comparable to another large power plant using biomass, and would achieve much of the available economy of scale.
25

Table 3: Biomass production and delivery data Factor Formulae Value Source / Comments Whole forest harvest cost including skidding to roadside ($/m3)
• Felling • Skidding
6.00 3.00
Skidding distance is assumed to be 150 m. These numbers are higher than those reported in earlier report by Kumar et al. (2005a).
Chips loading, unloading and transport cost ($/m3)
• Case 1N • Case 1Q • Case 2N • Case 2Q
1.2364*(2.30 + 0.0257D)
5.85 6.76 5.41 6.20
D is the round-trip road distance from the forest to the receiving plant (Favreau, 1992) by a chip van. In this study the cost has been converted to green metric tonnes. Hauling cost for the West Road/Nazko River and Quesnel locations include a winding factor of 1.2.
Piling and removing chips from storage piles ($/m3)
1.90 Basis is that piling and removal cost are 2/3 of truck loading and unloading cost. (Favreau, 1992).
Road construction and infrastructure ($/m3)
3.90 The value is estimated based on discussions with FERIC (McDonald and Sauder, 2005). This figure is similar to the numbers reported in Favreau (1992); Kumar et al. (2003); Kumar et al. (2005a). Infrastructure cost depends on the amount of labor and machine, and possibly the merchantable volume per hectare.
Silviculture cost ($/m3) 3.15 The value is estimated based on a discussion with FERIC (McDonald and Sauder, 2005). Many Canadian provinces require that silviculture treatments be performed shortly after harvesting, so that cut areas are returned to a productive state. This figure is similar to the average silviculture cost for Sub Boreal Pine/Spruce biogeoclimatic zone reported in IAM, 2004 (MOF, 2004) and the same as reported in Kumar et al. (2005a).
Chipping cost for trees ($/m3) 5.00 The value is estimated based on discussions with FERIC (McDonald and Sauder, 2005). This value is lower than the average value reported in the literature. The range of costs is discussed in Section 4 of the report.
26

Mountain Pine Beetle Infested Wood to Power November 2005
Factor Formulae Value Source / Comments Overheads ($/m3) 5.00 These costs include office operations, environmental protection,
consultant fees, archaeological surveys engineering etc. This figure is about two-thirds of the overheads reported for Quesnel district in the Interior Appraisal Manual, 2004 and is similar to the figure suggested by FERIC. We have used two-thirds because some of operations included in estimate are not required for the purpose of power generation (MOF, 2004).
Table 4: Power plant characteristics and costs Factor Value Source / Comments Power plant boiler unit size (MW) 450 Maximum unit size assumed. Plant life (years) 20 Note that the unit could likely run longer than 20 years based on forest harvest
residues, mill wastes, or other sources of biomass. Net plant efficiency (LHV) (%) 39
Internal plant use of power is assumed at 8% of gross (US Department of Energy, 1997; Broek et al., 1995; Wiltsee, 2000; Kumar et al., 2003). The 240 MW (gross) Finland plant has an internal power usage of 7-8% and a LHV efficiency of 39% (Setala, 2005). The efficiency for this has been decided based on the discussion with personnel from biomass boiler manufacturing company, Kaverner Power Inc (Sherrod and Saarivirta, 2005).
Plant operating factor: • Year 1 • Year 2 • Year 3 onwards
0.80 0.85 0.90
Estimated based on discussions with industry.
27

Mountain Pine Beetle Infested Wood to Power November 2005
Factor Value Source / Comments Operating staffing excluding maintenance staff:
• 450 MW or below
6
Staffing levels are derived from the literature (Broek et al., 1995; Wiltsee, 2000; Kumar et al., 2003; Williams and Larson, 1996), and discussions with personnel in the power generation industry (Setala, 2005). For a plant up to 450 MW, operators per shift are fuel receiver (1), fuel handlers (1), control room (2), ash handling plant (1), and other power plant tasks (1). The assumed staffing is five shifts (10,400 hours per shift position per year), which allows for vacation coverage and training.
Power plant capital cost for 4 cases ($ per installed kW)
• Case 1N • Case 1Q • Case 2N • Case 2Q
1960 1875 2120 2024
These are for a circulating fluid bed direct combustion biomass power plant based on the cost data provided by Kaverner Power Inc. (Sherrod and Saarivirta, 2005). This value is about 30% higher than for a pulverized coal power plant and is higher than those reported in the literature (Bain et al., 1996; Broek et al., 1995; Kumar et al., 2003; Stennes and McBeath, 2005). A location specific escalation of 5% is included in the figures for Quesnel to allow for a distributed construction work force that would require daily transportation to the plant site, and an escalation of 10% is included for West Road/Nazko River for a camp based remote construction site.
Average annual labor cost including benefits ($/hr)
• Operators • Administration staff
45.00 45.00
Estimated based on discussions with industry.
Ash disposal cost • Ash hauling cost
($/dry tonne/km) • Ash disposal cost ($/dry tonne/ha) • Amount of ash disposal (dry tonnes/ha)
0.186
25.90
1
Hauling distance for the ash is assumed to be 50 km for the three cases. (Zundel et al., 1996) (Zundel et al., 1996) (Zundel et al., 1996)
Transmission charge (including capital and operating cost) for remote location, West Road/Nazko River ($/MWh);
• Case 1N • Case 2N
1.49 1.75
The transmission charge for cases 1N and 2N are derived from earlier study assuming 100 km of dedicated lines carrying 300 MW at a total capital cost of $31 million at 10% capital recovery plus an operating cost of $128,000 excluding line loss (Kumar et al., 2003). The cost is for the power plant running at full load at a capacity factor of 0.90. However, a power plant location near existing transmission grid in Quesnel, BC would not incur this transmission charge and hence, is not included in this study for cases 1Q and 2Q.
28

Mountain Pine Beetle Infested Wood to Power November 2005
Factor Value Source / Comments Spread of costs during construction (%)
• Year 1 • Year 2 • Year 3
20 35 45
Plant startup is at the end of year 3 of construction. Estimated based on discussions with industry.
Table 5: General assumptions Factor Value Source / Comments Scale factor • Total direct combustion power plant
capacity 20 to 450 MW. • Transmission line capital cost.
• Transmission line operating cost.
0.75
0.49
0.50
(Bain et al., 1996; US Department of Energy, 1997; Williams, 2002). 0.49 is based on fitting a curve to estimates of 300 km transmission lines through remote boreal forest at various capacities (Kumar et al., 2003). This value is an exponent. 0.5 is an exponent for operating costs and is an estimate based on consultation with the electrical industry.
Factor to reflect capital cost impact for location.
• Case 1N • Case 1Q • Case 2N • Case 2Q
1.10 1.05 1.10 1.05
This is based on discussions with EPC contractors regarding construction in various locations (Williams, 2002).
Transmission loss for remote location. 1% of generated power
The value has been estimated based on consultation with the electrical industry experts for a base load 100 km line (Xu, 2002). This factor is used in this study for the West Road/Nazko location (Cases 1N and 2N) only because the location of the power plant in Quesnel (Cases 1Q and 2Q) is assumed to be adjacent to existing transmission lines.
29

Mountain Pine Beetle Infested Wood to Power November 2005
Factor Value Source / Comments Annual maintenance cost. 2% of initial capital
cost per year The value has been assumed based on blending data from existing coal-fired units and from studies of biomass power plants (Bain et al., 1996; Broek et al., 1995; Caddet Renewable Energy, 1997; Kumar et al., 2003).
Aggregate pre-tax return on capital (blend of debt plus equity).
10 % A rate based plant would combine debt at approximately 6.5% and equity at about 10.5%, and hence a blended value of 10% return on capital is conservative.
Site recovery and reclamation costs. 20% of initial capital cost
The reclamation cost is escalated and is assumed to be in the 20th year of operation.
30

Mountain Pine Beetle Infested Wood to Power November 2005
Table 6: Resource requirement and power cost composition for a MPB killed tree biomass based power plant over 20 years Items West Road/Nazko River, BC Quesnel, BC Case 1N
300 MW outputCase 2N
219 MW output Case 1Q
300 MW output Case 2Q
221 MW output Amount of biomass required over 20 years (actual m3)
62,670,780 45,717,290 62,099,310 45,717,290
Amount of biomass required over 20 years (merchantable m3)
50,136,620 36,573,830 49,679,450 36,573,830
Project draw area (km x km) Note: only the surplus MPB killed trees within this area are used for fuel.
112 by 112
95 by 95 145 by 145
125 by 125
Cost elements Delivered Biomass Cost Components
Harvesting cost ($/MWh) 13.30 13.30 13.17 13.17 Transportation cost ($/MWh) 7.62 7.05 8.71 8.00
Silviculture cost ($/MWh) 2.93 2.93 2.90 2.90 Road Construction cost ($/MWh) 3.63 3.63 3.60 3.60
Chipping cost ($/MWh) 4.93 4.93 4.88 4.88 Total delivered biomass cost ($/MWh) 32.42 31.85 33.26 32.55
Capital cost recovery ($/MWh) 28.58 30.93 27.05 29.21 Operation and Maintenance Cost Components
Storage cost at plant ($/MWh) 0.62 0.62 0.61 0.61 Operating cost for plant ($/MWh) 4.94 5.35 4.68 5.05
Maintenance cost for plant ($/MWh) 1.44 1.97 1.43 1.95 Administration cost for plant ($/MWh) 0.55 0.76 0.55 0.75
Ash disposal cost ($/MWh) 0.49 0.49 0.48 0.48 Transmission ($/MWh) 1.49 1.75 0.00 0.00
Total operation and maintenance cost ($/MWh) 9.53 10.93 7.76 8.84 Total Power Cost from MPB Killed Wood ($/MWh) 70.53 73.71 68.08 70.60
31

Mountain Pine Beetle Infested Wood to Power November 2005
0
15
30
45
60
75
90
105
0 100 200 300 400 500
Power Plant Capacity (net MW)
Pow
er C
ost (
$/M
Wh)
Power cost at Quesnel (no transmission line)Power cost at West Road/Nazko River (including transmission line)
Figure 2. Power cost as a function of capacity for MPB killed wood based plant. The above curve shows that the profile of power cost vs. capacity is flat at large plant size, and very steep at low plant size. In biomass projects, two cost factors compete: fuel transportation costs rise in approximate proportion to the square root of capacity, while capital costs per unit capacity decrease. Because the variable component of fuel transportation cost becomes a significant cost factor as biomass yields drop, the result is a very flat profile of cost vs. capacity at large capacities. This result is consistent with previous studies of optimum size (Jenkins 1997; Nguyen and Prince, 1996; Overend, 1982; Larson and Marrison, 1997; Mcllveen-Wright et al., 2001; Kumar et al., 2003). The flatness of cost vs. capacity for large biomass plants is different than coal projects, where “bigger is better”, and the size of a unit is often determined by either the largest available capacity or the largest increment of power generation that the power market can accommodate. The result is that biomass to power projects can be built over a wide range of large sizes, e.g. 300 to 450 MW, without a significant cost penalty, but not at small plant sizes. 300 MW is a reasonable tradeoff between reducing the risk from a new large plant and gaining the benefit of the economy of scale.
32

Mountain Pine Beetle Infested Wood to Power November 2005
6.2. The composition of power cost from biomass Table 7 shows the makeup of biomass power cost per MWh. Note that costs are for the first year of operation at full capacity (year 3), but are deflated back to the base year 2004. Delivered cost of biomass is in the range of 43% - 49% of the total power cost, followed by capital cost (39% - 42%) and operation and maintenance cost (12% - 15%). Transportation cost is in the range of 22% – 26% of the biomass delivered cost which is close to the figures reported in other studies (Aden et al., 2002; Perlack and Turhollow, 2002; Glassner et al., 1999, Kumar et al., 2003 and 2005). In this study, biomass storage cost is not significant component of total cost because it is the cost associated with only three months storage at the plant. Transmission line cost for West Road/Nazko River location is about 2% of the total cost of power. 6.3. Carbon Credit from MPB killed tree biomass based power An MPB wood based power plant is likely to displace a base loaded power plant, i.e. because a biomass based plant is constructed the need for an incremental fossil fuel plant is postponed. In Alberta and portions of the US incremental base load plants burn coal, and that assumption is used in this study, i.e. that the available carbon credit from the MBP wood plant is the assumed displacement of the equivalent amount of coal to generate 300 MW or about 220 MW. Life cycle emissions from biomass power plant Table 7 shows the relative CO2 emissions per kWh for the use of MPB killed biomass in this study and a new coal fired power plant located at the mine (in this case the values have been used for an Alberta based coal power plant). The table uses the values of Spath et al. (1999) for the construction of the power plant and the harvesting of biomass, and incorporates average haul distances for biomass transportation. Transportation of coal has a negligible carbon emission factor because in western Canada the power plant is located adjacent to the mine. Note that the biomass transportation emissions are less than 1% of the emissions of a coal fired plant, per unit of power. Emissions associated with mining coal are included, for both the energy required to move the overburden and recover the coal, and the release of methane. Methane emissions from open pit coal mines reflect not only the methane contained in the mined coal but also methane from the seam near the edge of the pit, which is released to the atmosphere. The approach of Hollingshead (1990) was modified to reflect the large size of a mine supporting a 450 MW coal fired power plant. Methane released from the coal seam is estimated at three times the methane contained in the actual mined coal. Although the transportation distances for biomass power plants in West Road/Nazko River and Quesnel locations are different, the emissions are not significantly different. In this study the emissions for both the locations are assumed to be the same. From Table 7 it is clear that this assumption does not significantly affect the total estimated carbon credit. Impact of carbon credit on power price We expect a market to emerge in Canada for the sale of carbon credits; the value of credits in the future is unknown. Figure 3 shows the relationship between a future carbon credit in Canadian dollars per tonne of CO2 and the effective reduction in power price from this project, i.e. if the project gets the carbon credit revenue (either the power purchaser or the power plant operator), the effective cost of power will be reduced. The
33

Mountain Pine Beetle Infested Wood to Power November 2005
disposition of carbon credits would be a matter of negotiation between BC Hydro and the project developer. Table 7: Life cycle emissions (g of CO2 equivalent per kWh) from the power plants Processes MPB killed tree biomass Coal Production 28.0a 11.6c
Transportation 2.6b 0 Plant construction and decommissioning 12.0a 5.0d
Energy conversion 0 968.0e
Total emissions 42.6 984.6 a – (Mann and Spath, 1999). b - based on truck transportation for an average distance of 48 km for a 300 MW biomass power plant, assuming the energy input of 1.3 MJ tonne-1 km-1 by truck and a release of 3 gC GJ-1 km-1 (Borjesson, 1996). Most of the coal power plants in western Canada are at a mine, so the transportation distance is very small. The emission during transportation would be negligible as compared to the other components. Hence it has been neglected in this case. c – For Genesee, Alberta coal-field, (Hollingshead, 1990). It includes the contribution from methane emission and also the emission during the mining of coal. d – (Spath et al., 1999). e - The emission factor is calculated based on characteristics of Alberta coal and the new 300 MW coal power plant.
0
10
20
30
40
50
60
0 5 10 15 20 25 30 35 40 45 50 55
Carbon Credit ($ / tonne CO2)
Red
uctio
n in
Pow
er C
ost (
$ / M
Wh)
Figure 3. Impact of carbon credit on power cost based on displacement of base load coal generation in Western Canada or the North Western US. There is also a potential subsidy for biomass power: in the 2005 budget the Canadian Federal Government announced its intention to apply a support payment to biomass power of $0.01 per kWh ($10 per MWh). We do not know if this support payment would be available to a project of the size and scope of the MPB wood power plant proposed in
34

Mountain Pine Beetle Infested Wood to Power November 2005
this study. However, if it is available it would have a significant impact on the economics of the project, reducing the effective cost of power from biomass power plant in four cases to: Case 1N - $60.53 per MWh; Case 1Q - $58.08 per MWh; Case 2N - $63.71 per MWh; and, Case 2Q – $60.60 per MWh.
7. Sensitivities Some key sensitivities are shown in Table 8. Table 8: Sensitivities for a MPB killed tree based biomass power plant for West Road/Nazko River and Quesnel locations. Cost element Case 1N
($/MWh) Case 1Q ($/MWh)
Case 2N ($/MWh)
Case 2Q ($/MWh)
Base Case 70.53 68.08 73.71 70.60 Biomass production and delivery related sensitivities Biomass yield is 25% higher per gross hectare
70.11 67.55 73.35 70.14
Biomass yield is 25% lower per gross hectare
71.13 68.86 74.22 71.27
Biomass felling and skidding cost is 50% higher
74.82 72.33 78.00 74.85
Biomass felling and skidding cost is 50% lower
66.24 63.83 69.42 66.35
Biomass transportation cost is 25% higher
72.42 70.26 75.47 72.60
Biomass transportation cost is 25% lower
68.62 65.90 71.94 68.60
Biomass power plant related sensitivities Capital cost of plant 10% higher 73.87 71.24 77.32 74.01 Capital cost of plant 10% lower 67.19 64.92 70.09 67.19 Efficiency of power plant is increased from 39% to 40% (LHV)
69.64 67.16 72.84 69.70
Staffing cost is reduced by 25% 70.02 67.57 73.01 69.92 Maintenance cost is reduced by 25% 69.27 66.89 72.35 69.32 Ash disposal has zero cost 70.03 67.59 73.21 70.11 Pretax return on capital is 12% rather than 10%
75.16 72.47 78.73 75.34
Power generation technology is BIGCC at 250MW1
67.37 64.26 67.37 64.26
1 – BIGCC refers to Biomass Integrated Gasification Combined Cycle. The power cost is for a plant producing 250 MW of gross power and is the capacity is same for all the four cases.
35

Mountain Pine Beetle Infested Wood to Power November 2005
8. Discussion This study is based on the direct combustion of biomass in a boiler and then power generation through a steam turbine. Direct combustion of biomass has a lower efficiency and lower heat rate than gasification, which has higher efficiency and higher capital cost per unit output. Biomass integrated gasification combined cycle (BIGCC) is in the early stages of development. Today the maximum theoretical size of single unit gasifier based BIGCC plant is 250 MW gross (Shilling, 2004); while gas fired turbines of this size have been built, they have never been coupled to a biomass gasifier. The largest actual size of a BIGCC is a 6 MW unit that was operated as a demonstration. The MPB killed tree biomass based power generation using BIGCC technology at a capacity of 250 MW is evaluated as a sensitivity case assuming all the parameters remain the same as direct combustion except the capital cost of the plant and the power generation efficiency. Power costs from BIGCC are calculated at $67.37 per MWh for West Road/Nazko River and $64.26 per MWh for Quesnel locations (at a capital cost of $1840 per kW at 250 MW and LHV efficiency 45% (Cameron et al., 2004)). This indicates that power generation cost from BIGCC is lower than direct combustion for the conditions found in B.C. As expected there is decrease in the delivered cost of biomass ($27.46 per MWh for gasification vs. $32.42 per MWh (Case 1N) and $31.85 per MWh (Case 2N) for direct combustion for West Road/Nazko River location; and $28.02 per MWh for gasification vs. $33.26 per MWh (Case 1Q) and $32.55 per MWh (Case 2Q) for direct combustion for Quesnel location) because of the decrease in the quantity of biomass required. The capital cost of the BIGCC plant per unit is higher for cases 1N and 1Q ($29.52 per MWh for gasification vs. $28.58 per MWh (Case 1N) and $30.93 per MWh (Case 2N) for direct combustion for West Road/Nazko River location; and $27.88 per MWh for gasification vs. $27.05 per MWh (Case 1Q) and $29.20 per MWh (Case 2Q) for direct combustion for Quesnel location). Despite the lower calculated power cost, it is not clear that a project developer would choose BIGCC over direct combustion. The scale up risk for BIGCC is higher than for direct combustion, and the cost uncertainty is higher as well because the BIGCC unit would be first of a kind at that scale while the biomass CFB direct combustion plant would be an extension of an existing design by only 37%, and comparable in size to other CFB boilers designed for fossil fuels. Hence while gasification is a well demonstrated technology, as is firing of low heating value gas in a combined cycle facility, a project developer of a large power plant might select direct combustion given the apparent economic incentive to gasify wood. On an ongoing basis BIGCC is worth evaluation against direct combustion at the project conceptual design stage of any large biomass power plant. Biomass yield in this study has been estimated for a healthy lodgepole pine stand. MPB killed trees might have a different yield than the healthy stands. We have calculated the sensitivity in power cost for higher and lower yields. The ratio of merchantable volume to total volume of the tree is also an important parameter to estimate the amount of biomass available for fuel purposes as it impacts the yield of biomass per unit area. In this study we have used a ratio of 0.8; the impact of this ratio on power cost is shown in Figure 4 for all the four cases. One future step is confirmation of MPB wood yields based on whole tree chipping.
36

Mountain Pine Beetle Infested Wood to Power November 2005
Higher moisture content of the fuel reduces the lower heating value. This study doesn’t include any drying operation. The equilibrium moisture content of wood estimated in this study is for a particular region, and is averaged over a year. EMC varies with relative humidity and temperature, and the impact of varying conditions over the year on both EMC and the energy content of the wood can be evaluated in more detail if the project proceeds. Note that higher moisture content lowers the LHV of the wood, and more biomass would be required to generate the same amount of power. Impact of moisture content on the power cost is shown in Figure 5 for all the four cases. The power price determined in this study ($68 per MWh for a 330 MW gross plant in Quesnel) is significantly lower than the figure of $124 per MWh recently reported in an earlier study on power generation from surplus MPB killed trees by Stennes and McBeath (2005). The difference in the two values can be reconciled as follows:
• We use an efficiency of 39% for the conversion of input fuel LHV to electricity vs. a value of 25.5% in the earlier report assuming the same moisture level for both studies. The 25.5% figure is consistent with the small boiler (100 MW vs. 330 MW gross) in this study. 39% is consistent with operating experience at the 240 MW Alholmens power plant at Pietarsaari, Finland.
• We use an operating availability of 7884 hours per year vs. 7000 in the earlier
study. The 7884 value used in this study is conservative (low) compared to operating experience at the Alholmens power plant.
• Feedstock costs in this study and the earlier study are comparable, and unit
capital costs adjusted for scale are higher in this study than the earlier study, but the larger scale used in this study results in a slightly lower capital cost per kW.
The differences in efficiency and availability between the two studies account for 88% ($49 per MWh) of the cost difference between the two studies. Minor differences in the delivered cost of fuel, capital recovery charges and operating costs account for the remaining 12% ($7 per MWh).
37

Mountain Pine Beetle Infested Wood to Power November 2005
0
10
20
30
40
50
60
70
80
90
0.40 0.50 0.60 0.70 0.80 0.90 1.00
Merchantable tree/Fuel tree
Pow
er c
ost (
$/M
Wh)
Power cost for Case 1N - West Road/Nazko River 300 MW plantPower cost for Case 1Q - Quesnel 300 MW plantPower cost for Case 2N - West Road/Nazko River 219 MW plantPower cost for Case 2Q - Quesnel 221 MW plant
Figure 4: Impact of ratio of merchantable volume to total volume of a tree on power cost for West Road/Nazko River and Quesnel locations for a biomass power plant.
0
10
20
30
40
50
60
70
80
90
10 15 20 25 30 35 40 45 50 55 60
Moisture content (%, dry basis)
Pow
er c
ost (
$/M
Wh)
Power cost for Case 1N - West Road/Nazko River 300 MW plantPower cost for Case 1Q - Quesnel 300 MW plantPower cost for Case 2N - West Road/Nazko River 220 MW plantPower cost for Case 2Q - Quesnel 220 MW plant
Figure 5: Impact of moisture content on power cost for West Road/Nazko River and Quesnel locations for a biomass power plant.
38

Mountain Pine Beetle Infested Wood to Power November 2005
9. Conclusions The cost of generating power using MPB wood in a 300 MW net (330 gross power) direct combustion power plant is $70.53 per MWh for plant located in West Road/Nazko River with a new dedicated transmission line and $68.08 per MWh for plant located in Quesnel without a new dedicated transmission line. Similar figures for two locations from a 240 gross capacity power plant are $73.71 per MWh and $70.60 per MWh, respectively. Delivered cost of biomass is in the range of 43% - 49% of the total power cost, followed by capital cost (39% - 42%) and operation and maintenance cost (12% - 15%). The cost of power from Quesnel location is lower than the power cost at West Road/Nazko River location. Two main reasons for this are transmission line cost and a higher capital cost premium for West Road/Nazko River location plants. The potential for a cogeneration project is higher for a Quesnel location. Hence, a Quesnel location is recommended based on current estimates of available surplus MPB killed trees. Total estimated MPB killed wood that would otherwise remain unharvested is about 200 million m3. A 330 gross MW direct combustion MPB killed tree based power plant would require about 63 million m3 (50 million merchantable m3) and a 240 gross MW power plant would require about 46 million m3 (37 million merchantable m3) of wood over 20 years. The total projected area for a 330 gross MW biomass power plant from which biomass would be drawn is about 112 km by 112 km (average transportation distance including winding factor is 48 km) for the West Road/Nazko River location, and 145 km by 145 km (average transportation distance 62 km) for the Quesnel location. Similar figures for a 240 gross MW power plant would be 95 km by 95 km and 125 km by 125 km for two locations, respectively. MPB killed wood provides a unique opportunity to convert otherwise wasted biomass in BC to useful electrical power, a project that would create jobs, contribute to a clean environment, potentially help Canada meet its obligations under the Kyoto accord, and put Canada at the forefront of biomass utilization. 10. Next Steps We see three steps as critical to the development of a large power plant using significant amounts of surplus MPB killed trees in BC: • Identification of a resource, i.e. wood, that can be dedicated to a power plant
application. It is very unlikely that a capital intensive project such as a power plant would proceed in the absence of a secure wood supply. MOF is the key player, and the critical question is whether a wood supply is available, over what area, and at what cost (stumpage/royalty).
• Confirmation that a market exists for the power. Given the structure of
electricity in B.C., BC Hydro plays a key role, and the critical question is whether 300 MW of green power at a cost of $70 per MWh excluding carbon credits and possible Federal subsidy is attractive given BC Hydro’s power acquisition mandate. Confirmation of the Federal subsidy and a strategy regarding carbon credits may be a component of this step.
39

Mountain Pine Beetle Infested Wood to Power November 2005
• Identification of one or more project developers that have sufficient interest to advance the engineering analysis of the project to firm up cost estimates. Both forestry and power industry experience and judgment will help in this step.
40

Mountain Pine Beetle Infested Wood to Power November 2005
References Aden A, Ruth M, Ibsen K, Jechura J, Neeves K, Sheehan J, Wallace B, Montague L, Slayton A, Lukas J. Lignocellulosic biomass to ethanol process design and economics utilizing co-current dilute acid prehydrolysis and enzymatic hydrolysis for corn stover. Report no. NREL/TP-510-32438, 2002. URL: http://www.nrel.gov/docs/fy02osti/32438.pdf Asikainen A, Pulkkinen P. Comminution of Logging Residues with Evolution 910R chipper, MOHA chipper truck, and Morbark 1200 tub grinder. Journal of Forest Engineering 1998; 9(1):47-53. Bain RL, Overend RP, Craig KR. Biomass-fired power generation. Conference Paper:” Biomass usage for utility and industrial power,” Snowbird Resort and Conference Center, Snowbird, UT, April 29-May 3, 1996, Engineering Foundation, NY, NY. Borjesson PII. Emissions of CO2 from biomass production and transportation in agriculture and forestry. Energy Conversion Management 1996; 37(6-8):1235-1240. Bowater Newfoundland Ltd. Harvesting forest biomass as an alternative fuel. ENFOR, 1983, Project Report P-191. Broek RVD, Faaij A, Wijk AV. Biomass combustion power generation technologies. Background report 4.1 for the EU Joule II+ Project: Energy from biomass: an assessment of two promising systems for energy production. Department of Science, Technology and Society, Utrecht University, 1995, Report 95029. Caddet Renewable Energy. Straw-fired biomass plants in Denmark. Caddet Renewable Energy Newsletter: March 1997. Caddet Renewable Energy. Straw-fired CHP plant in Rudkobing – Providing environmentally. IEA, 1998a, Technical Brochure No. 95. Caddet Renewable Energy. The Masnedo CHP plant – Using indigenous CO2 neutral fuels. International Energy Agency (IEA), 1988, Technical Brochure No. 74. Caddet Renewable Energy. The Sabro straw-fired district heating plant. IEA, 1988, Technical Brochure No. 88, 1998b. Cameron JB, Kumar A, Flynn PC. Does Gasification Improve the Economics of Biomass Utilization? Presented at the 2nd World Conference and Technology Exhibition on Biomass for Energy, Industry and Climate Protection, Palazzo del Congressi, Rome, Italy, May 10-14, 2004. Demirbas A. Calculation of higher heating values of biomass fuels. Fuel 1997:79 (5); 431-434. Desrochers L. Personal communication. Eastern Division, Pointe Claire, Forest Engineering Research Institute (FERIC), 2002.
41
Mountain Pine Beetle Infested Wood to Power November 2005
Dornburg V, Faaij APC. Efficiency and economy of wood-fired biomass energy systems in relation to scale regarding heat and power generation using combustion and gasification technologies. Biomass and Bioenergy 2001; 21(2):91-108. Eng M. Initial analysis of the availability of a wood supply for power generation as a result of as a result of the current mountain pine beetle outbreak. Internal Report, Research Branch, Ministry of Forests, BC, 2005a. Eng M. Personal communication. Research Branch, Ministry of Forests, 2005b. Environment Canada. Canadian Climate Normals or Averages 1971-2000. 2005. http://www.climate.weatheroffice.ec.gc.ca/climate_normals/index_e.html Favreau JFE. In-woods chipping: A comparative cost analysis. FERIC, 1992, Technical Report No TR-105. Flynn PC an Kumar A. Trip Report: Site visit to the 240 MW Alholmens power plant, Pietarsaari, Finland. Report prepared for BIOCAP Canada Foundation, 156 Barrie Street, Queen’s University, Kingston, Ont. K7L 3N6 and the Province of British Columbia, November 2005, 13 pages. Available at: http://www.biocap.ca. Folkema MP. Handbook for small to medium size fuelwood chipping operations. FERIC, 1989, Technical Report No HB-07. Gingras JF, Favreau J. Comparative cost analysis of integrated harvesting and delivery of roundwood and forest biomass. FERIC, 1996, Special Report SR -111. Glassner D, Hettenhaus J, Schechinger T. Corn stover collection project. In Bioenergy’98 – Expanding Bioenergy Partnerships: Proceedings, Volume 2, Madison, WI, pp. 1100-1110, 1998. URL: http://www.ceassist.com/bio98paper.pdf Hall P, Gigler JK, Sims REH. Delivery systems of forest arisings for energy production in New Zealand. Biomass and Bioenergy 2001; 21(6):391-399. Hankin AC, Stokes B, Twaddle A. The transportation of fuel wood from forest to facility. Biomass and Bioenergy 1995, 10(2-3), 149-166. Hollingshead B. Methane emissions from Canadian coal operations: A quantitative estimate. Coal Mining Research Company, Devon, Alberta, 1990, Report No. CI 8936. Hudson JB, Mitchell CP. Integrated harvesting system. Biomass and Bioenergy 1992; 2(1-6):121-130. Hudson JB. Integrated harvesting system. Biomass and Bioenergy 1995; 9(1-5):141-151. Jenkins BM. A comment on the optimal sizing of a biomass utilization facility under constant and variable cost scaling. Biomass and Bioenergy 1997; 13(1/2):1-9. Jenkins BM. Biomass resources in California. Quantities, Availability and Costs of Supply. Presented at the AETC-ASAE Annual meeting, Louisville KY 14-16, Feb 2005.
42

Mountain Pine Beetle Infested Wood to Power November 2005
Kuhnke DH, White WA, Bohning RA. The Alberta logging cost survey: data for 1996-1998. Northern Forestry Centre, Canadian Forest Service, 2002. Information report: NOR-X-375. Kumar A, Cameron JB, Flynn PC. Biomass power cost and optimum plant size in western Canada. Biomass and Bioenergy 2003, Vol. 24(6), pp. 445-464. Kumar A, Cameron JB, Flynn PC. Pipeline Transport and Simultaneous Saccharification of Corn Stover, Bioresource Technology, May 2005b, 96 (7), 819-829. Kumar A, Sokhansanj S, and Flynn PC. British Columbia’s beetle infested pine: biomass feedstocks for producing power. Final Report prepared for BIOCAP Canada Foundation, 156 Barrie Street, Queen’s University, Kingston, Ont. K7L 3N6 and the Province of British Columbia, April 2005a, 56 pages. Available at: http://www.biocap.ca. Larsen JB. The world’s largest straw-fired power plant. 1999. <URL: http://www.nemesis.at/publication/gpi_99_1/articles/27.html> Larson ED, Marrison CI. Economic scales for first-generation biomass-gasifier/gas turbine combined cycles fueled from energy plantations. Journal of Engineering for Gas Turbines and Power 1997; 119:285-290. LeDoux CB, Huyler NK. Comparison of two cut-to-length harvesting systems operating in eastern hardwoods. Journal of Forest Engineering 2001; 12(1):53-59. MacDonald J. Personal communication. Western Division, Forest Engineering Research Institute of Canada, 2005. MacDonald J, Sauder T. Personal communication. Western Division, Forest Engineering Research Institute of Canada, 2005. MacIntosh JE, Sinclair AWJ. Economic feasibility of satellite chipping yards in Alberta. Forest Engineering Research Institute of Canada, Special Report No. SR-53, 1988. Mann MK, Spath PL. Net CO2 emissions and energy balances of biomass and coal-fired power systems. Proceedings of the fourth biomass conference of the Americas, Oakland, California, 29 August – 2 September, 1999:379-385. Marrison CI, Larson ED. Cost versus scale for advanced plantation-based biomass energy systems in the U.S. Proceedings of the Second Biomass Conference of the Americas: Energy, Environment, Agriculture, and Industry, Portland, Oregon, August 1995: 1272-1290. Matvinchuk D. Plant Manager – Whitecourt Biomass Power Generating Station, Alberta, Canada, 2002. McIlveen-Wright DR, Williams BC, McMullan JT. A re-appraisal of wood-fired combustion. Bioresource Technology 2001; 76(3):183-190.
43

Mountain Pine Beetle Infested Wood to Power November 2005
McKendry P. Energy production from biomass (part 1): Overview of biomass. Bioresource Technology 2002; 83(1):37-46. Mellgren PG. Predicting the performance of harvesting systems in different operating conditions. FERIC, 1990, Special Report No SR-67. Miles TR, Miles TR Jr, Baxter LL, Bryers RW, Jenkins BM, Oden LL. Boiler deposits from firing biomass fuels. Biomass and Bioenergy 1996; 10(2-3):125-138. Ministry of Forests (MOF). Beetle salvage timber. Revenue Branch, Victoria, British Columbia, September 2001. Ministry of Forests (MOF). Interior appraisal manual. Revenue Branch, Victoria, British Columbia, November 2004. Ministry of Forests (MOF). Timber supply and the mountain pine beetle infestation in British Columbia. Forest Analysis Branch, British Columbia, October 2003. National Renewable Energy Laboratory. Biomass feedstock composition and property database, 2005. http://www.eere.energy.gov/biomass/feedstock_databases.html Nguyen MH, Prince RGH. A simple rule for bioenergy conversion plant size optimization: bioethanol from sugar cane and sweet sorghum. Biomass and Bioenergy 1996; 10(5/6):361-365. Organisation for the Promotion of Energy Technologies. The world’s largest biofuel CHP plant Alholmens Kraft, Pietarsaari. http://www.tekes.fi/opet/pdf/Alholma_2002.pdf Overend RP. The average haul distance and transportation work factors for biomass delivered to a central plant. Biomass 1982; 2:75-79. Pacific Forestry Centre. Mountain pine beetle. Insect – host interactions, Outbreak origin. Canadian Forest Service, Natural Resources Canada, 2005. http://www.pfc.forestry.ca/entomology/mpb/outbreak/interactions_e.html Perlack RD, Walsh ME, Wright LL, Ostlie LD. The economic potential of whole-tree feedstock production. Bioresource Technology 1996; 55(3):223-229. Perlack, R.D., Turhollow, A.F., 2002. Assessment of options for the collection, handling, and transport of corn stover. Report no. ORNL/TM-2002/44. http://bioenergy.ornl.gov/pdfs/ornltm-200244.pdf Puttock GD. Estimating cost for integrated harvesting and related forest management activities. Biomass and Bioenergy 1995; 8(2):73-79. Setala M. Personal communication. Production supervisor, Alholmens Kraft power plant, Pietarsaari, Finland, 2005.
44

Mountain Pine Beetle Infested Wood to Power November 2005
Shilling NZ. Personal communication. Leader – Process Power Plants, Energy Products. General Electric, USA, 2004. Sherrod H, Saarivirta P. Personal communication. Regional Manager, Sales and Service, Kvaerner Power North America, 3751 Hidalgo, Irving, TX, USA, 75062 and Production Sales Manager, Power Generation Systems, Kvaerner Power Oy, Box 109, Kelloportinkatu 1D, Tampere, 33101, respectively. 2005. Silsbe W. Personal communication. An estimator for AMEC Corporation, Alberta, Canada, 2002. Silversides CR, Moodie RL. Transport of full trees over public roads in eastern Canada – A state of the art report. Forest Engineering Research Institute of Canada (FERIC), 1985, Special Report No SR-35, Energy from forest (ENFOR), Project P-312. Simpson WT. Specific gravity, moisture content, and density relationship for wood. Forest Products Laboratory, Forest service, United States Department of Agriculture, 1993, General Technical Report FPL-GTR-76. Simpson WT. Equilibrium moisture content of wood in outdoor locations in the United States and worldwide. Forest Products Laboratory, Forest service, United States Department of Agriculture, 1998, Research Note FPL-RN-0268. Simpson WT, TenWolde A. Chapter 3 - Physical properties and moisture relations of wood. Wood Handbook – Wood as an Engineering Material. Forest Products Laboratory, Forest service, United States Department of Agriculture, 1999, General Technical Report FPL – GTR – 113. Sinclair AWJ. Recovery and transport of forest biomass in mountainous terrain. Canada Forestry Service, Pacific Forest Research Centre, Canada. Information report, SR-000022, 1984. Spath PL, Mann MK, Kerr DR. Life cycle assessment of coal-fired power production. NREL 1999, Report No. NREL/TP-570-25119. Spinelli R, Hartsough P. A survey of Italian chipping operations. Biomass and Bioenergy 2001; 21(6):433 – 44. Stennes B and McBeath A. Bioenergy options for woody feedstock. Final draft report. Pacific Forestry Centre, Canadian Forestry Service, Victoria, BC, Canada, July 2005. Available at: http://mpb.cfs.nrcan.gc.ca/research/workshops/8-37/Stennes-McBeath_e.pdf US Department of Energy. Renewable energy technology characterizations, Chapter: Direct-fired biomass. Office of Power Technologies, US Department of Energy. 1997. http://www.eren.doe.gov/power/pdfs/direct_fire_bio.pdf Wiksten NA, Prins PG. Cost estimates of forest biomass delivered at the energy conversion plant. ENFOR, 1980, Project Report P-19.
45

Mountain Pine Beetle Infested Wood to Power November 2005
Williams D. Personal communication. Chief estimator for Bantrel Corporation (an affiliate of Bechtel), Alberta, Canada, 2002. Williams RH, Larson ED. Biomass gasifier gas turbine power generating technology. Biomass and Bioenergy 1996, 10(2-3), 149-166. Wiltsee G. Lessons learned from existing biomass power plants. National Renewable Energy Laboratory Report No. NREL/SR-570-26946, 2000. Wood SM, Layzell DB. A Canadian biomass inventory: feedstocks for a bio-based economy. Final report. Prepared for Industry Canada Contract # 5006125. BIOCAP Canada Foundation, Queen’s University, 156 Barrie Street, Kingston, Ontario, Canada, 2003. Xu W. Personal communication. Professor, Department of Electrical and Computer Engineering, University of Alberta, Edmonton, Canada, 2002. Zundel P, Lebel L. Comparative analysis of harvesting and silviculture costs following integrated harvesting. Journal of Forest Engineering 1992; 4(1):31-37. Zundel P. The economics of integrated full-tree harvesting and central processing in jack pine. FERIC, 1986, Special Report No SR-37, ENFOR Project P-322.
46

Mountain Pine Beetle Infested Wood to Power November 2005
Appendix A Equations for Calculation of Equilibrium Moisture Content (Simpson, 1998)
[ ]22211
22211
12(
11800
hKKKKhKhKKKKhK
KhKhx
WEMC
+++
+−
=
Where, W, K, K1, and K2 are the coefficients of an adsorption model and can be calculated by using equations given below. These coefficients depend on the surrounding air temperature T (oC). h in the above equation is the relative humidity of surrounding air (%/100).
20135.029.1349 TTW ++=
200000273.0000736.0805.0 TTK −+=
21 000303.000938.027.6 TTK −−=
2
2 000293.00407.091.1 TTK −+= Appendix B Equations for Calculation of Density (Simpson, 1993)
)265.01( b
bm aG
GG
−=
Where, Gm is the specific gravity based on volume at moisture content M. Gb is the basic specific gravity (based on green volume). For lodgepole pine it is 0.38.
30)30( Ma −
=
Where, M < 30.
)100/1(**1000 MGm +=ρ Where, ρ is the density in kg/m3.
47
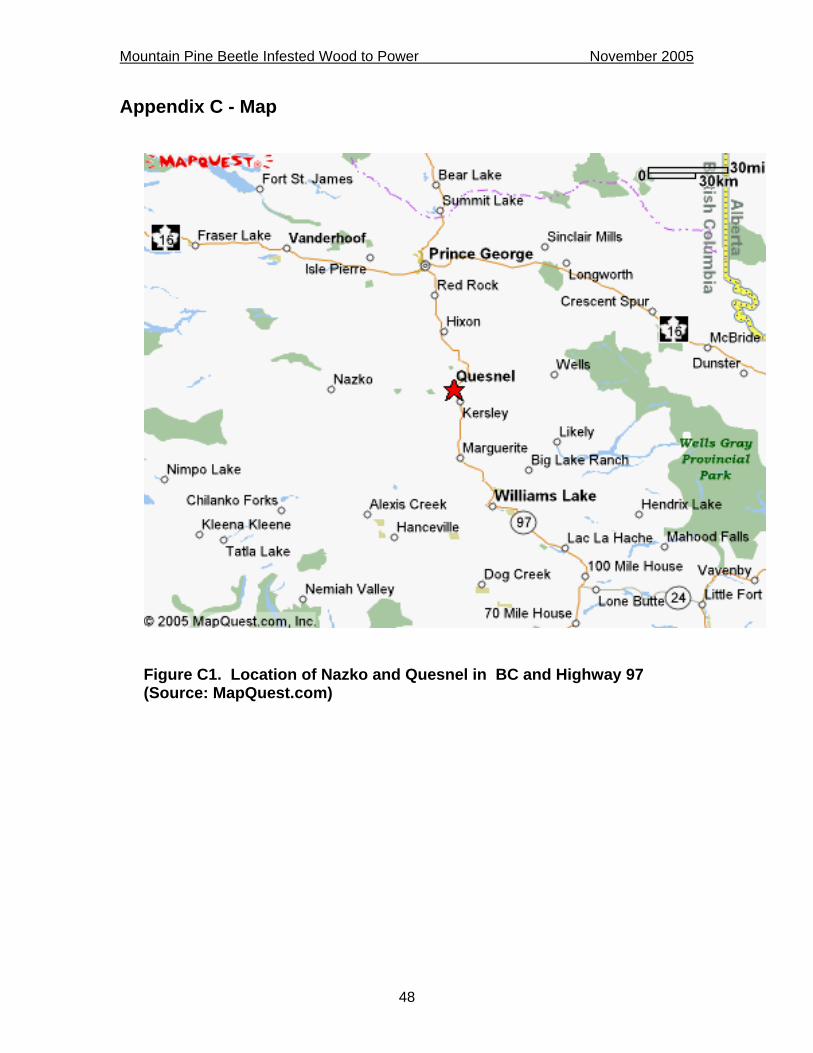
Mountain Pine Beetle Infested Wood to Power November 2005
Appendix C - Map
Figure C1. Location of Nazko and Quesnel in BC and Highway 97 (Source: MapQuest.com)
48