feeding habitat of the whale shark rhincodon typus in the ... · arcgis (esri corporation) and...
TRANSCRIPT

MARINE ECOLOGY PROGRESS SERIESMar Ecol Prog Ser
Vol. 458: 199–211, 2012doi: 10.3354/meps09777
Published July 3
INTRODUCTION
Effective management can be challenging forwide-ranging species because often their geographicrange and habitat requirements are poorly under-
stood and may include several political jurisdictions(Pearce & Boyce 2006). Species distribution modellingis an effective and useful approach for overcoming lo-gistical constraints on data collection required to de-termine habitat preferences within a species’ range.
© Inter-Research 2012 · www.int-res.com*Email: [email protected]
Feeding habitat of the whale shark Rhincodontypus in the northern Gulf of Mexico determined
using species distribution modelling
Jennifer A. McKinney1,4,*, Eric R. Hoffmayer2, Wei Wu3, Richard Fulford3, Jill M. Hendon1
1Center for Fisheries Research and Development, University of Southern Mississippi, Gulf Coast Research Laboratory, Ocean Springs, Mississippi 39564, USA
2National Oceanic and Atmospheric Administration, National Marine Fisheries Service, Mississippi Laboratories, 3209 Frederick Street, Pascagoula, Mississippi 39567, USA
3Department of Coastal Studies, University of Southern Mississippi, Gulf Coast Research Laboratory, Ocean Springs, Mississippi 39564, USA
4Present address: Louisiana Department of Wildlife and Fisheries, Fisheries Management Division, 2000 Quail Dr.,Baton Rouge, Louisiana 70808, USA
ABSTRACT: Whale shark Rhincodon typus is a globally distributed species, but there is a lack ofknowledge pertaining to their biology, seasonal occurrence, and distribution in the northern Gulfof Mexico (NGOM). Understanding critical habitat for whale sharks is essential on both a regionaland global basis for proper management because of their large migratory range. The goal of thepresent study was to describe the regional distribution of whale shark feeding aggregations in theNGOM by exploiting a presence-only dataset collected as a part of a volunteer sighting survey.Whale shark aggregations have been documented in large numbers in the NGOM since 2003, andspecies distribution models provide a unique approach to analyzing these presence data. We usedmaximum entropy and ecological niche factor analysis, 2 algorithms designed for predicting spe-cies distribution based only on presence data, to analyze data for the summer period in 2008 and2009. Cohen’s kappa (kappa) and the ‘area under the receiver operating characteristic curve’(AUC) were used to evaluate model performance with an external testing dataset. Kappa valuesranged from 0.28 to 0.69, and AUC values ranged from 0.73 to 0.80, indicating that the predicteddistribution had a fair to substantial agreement with the testing data. Distance to continental shelfedge, distance to adjacent petroleum platforms, and chlorophyll a were the variables moststrongly related to whale shark sightings, likely due to an association of these variables with highfood availability. Suitable habitat was predicted along the continental shelf edge, with the mostsuitable habitat predicted south of the Mississippi River Delta. The spatial distribution of suitablehabitat is dynamic; therefore, a multi-year study is underway to better delineate temporal trendsin regional whale shark distribution and to identify consistent areas of high suitability. Presence-only habitat models are a powerful tool for delineating important regional habitat for a vulnerable,highly migratory species.
KEY WORDS: Whale shark · Distribution · MaxEnt · ENFA · AUC · Kappa
Resale or republication not permitted without written consent of the publisher
OPENPEN ACCESSCCESS
Mar Ecol Prog Ser 458: 199–211, 2012
Optimally, species distribution data come from a fullyrandomized monitoring program, but, in many cases,regional species distributions can only be describedwith non-random sampling approaches that give onlypresence information. Such data are not applicable tocertain modelling techniques, which require accurateabsence locations, such as generalized linear models(GLM). However, presence locations provide viableinformation on habitat choice, and by quantifying therelationship with predictor variables, presence-onlymodelling can generate predictions at unsampled lo-cations throughout the study area (Guisan & Thuiller2005). For a species in which systematic survey datais not available or difficult to obtain, presence-onlymodelling broadens the range of available data formodel building to include museum collections andvolunteer stakeholder surveys (Hirzel et al. 2002).Presence-only modelling has been successfully ap-plied to many terrestrial and marine species, includ-ing migratory birds (Peterson 2001), marine fishes(Wiley et al. 2003), stony coral seamounts (Tittensor etal. 2009), and Odontoceti whales (Praca et al. 2009).
There is also value in developing regional modelsof population distributions for highly migratory spe-cies due to changing habitat preferences betweenmigratory endpoints, as well as separation betweenhabitats during different life-history stages. Globaldistribution models describing species with largeranges typically demonstrate less accurate predic-tions when modelled as a single population, butwhen subpopulations were modelled individually,the model accuracy increased; this was likely due toregional adaptations in habitat quality and prefer-ence (Stockwell & Peterson 2002). Therefore, the bestapproach may be to first gain an understanding ofpopulation distributions on a regional scale, whichcan then be integrated with other regional studies todevelop a global habitat model. Meaningfully parti-tioning datasets based on known seasonal, behav-ioral, or life-history stages can allow the modelerto gain insight on the critical habitat distributionthroughout these times, thereby reducing generalistpredictions. The habitat of other large pelagic spe-cies, such as Atlantic bluefin tuna Thunnus thynnusand swordfish Xiphias gladius, has been shown tovary considerably between feeding and spawningperiods throughout the year in the Mediterranean(Tserpes et al. 2008, Druon et al. 2011). In the IndianOcean, seasonal habitat distribution of whale sharksRhincodon typus has been modelled using long-termfisheries-based datasets (Sequeira et al. 2012).
Whale sharks would be an excellent choice forpresence-only modelling for multiple reasons. (1)
Whale shark aggregations are known to occur incoastal areas with some predictability in several loca-tions circumglobally through the development ofdirected research and ecotourism industry (Stevens2007), thereby resulting in a large database of pres-ence locations (though often lacking associatedabsence data). (2) Whale sharks are currently listedas a ‘Vulnerable’ species by the International Unionfor the Conservation of Nature and Natural Re -sources (IUCN; www.redlist.org) and included inAppendix II of the Convention on International Tradein Endangered Species of Wild Fauna and Flora(CITES; www.cites.org). These listings are based ontheir susceptibility to fisheries collapse and slowrecovery due to their k-selected life-history charac-teristics (Stevens 2007). Therefore, baseline ecolo -gical data on whale sharks are essential to approp -riately assess population risks and measure thesuccess of protective legislature. (3) Remotely sensedimagery and the geographic information system(GIS) can characterize the features that affect thebiological productivity that whale sharks are asso -ciated with and could therefore be used to providethe broad-scale, continuous environmental data re -quired for modelling whale shark distribution.
Whale sharks have a circumglobal distribution,inhabiting all tropical and warm temperate waters,except the Mediterranean Sea (Compagno 1984).Whale sharks are opportunistic filter-feeders thatrequire large densities of prey to meet their ener-getic demands (Compagno 1984). They are knownto aggregate in areas of high biological productivity,such as near plankton blooms, fish spawns, andareas where changes in water temperatures occur(Compagno 1984, Taylor & Pearce 1999, Heyman etal. 2001, Hoffmayer et al. 2005, Taylor 2007). Theirmovements may correspond to bathymetric and/oroceanographic features, such as thermal fronts,eddies, currents, and zones of high chlorophyll aconcentration (Taylor & Pearce 1999, Hoffmayer etal. 2005, Hsu et al. 2007, Kumari & Raman 2010),likely due to the presence of zooplankton assem-blages and fish populations that are known to accu-mulate near these features (Balch & Byrne 1994).Their distri bution is also believed to be linked tospecific environmental conditions, such as narrowtemperature ranges and areas of upwelling (Colman1997, Se queira et al. 2011). In the northern Gulf ofMexico (NGOM), over 4000 rigs function as thelargest artificial reef system worldwide, which isinhabited by many reef and pelagic species (Franks2000), including whale sharks (Hoffmayer et al.2005).
200

McKinney et al.: Whale shark distribution models in the northern Gulf of Mexico
The present study aims to describe the spatial dis-tribution of whale shark feeding aggregations in theNGOM during their peak season by employing 2species distribution modelling approaches. We hopeto (1) understand the key environmental factors asso-ciated with whale shark feeding aggregations, (2)derive distribution and habitat preference maps forthe region, and (3) evaluate the models’ predictiveperformance.
METHODS
Two modelling approaches that are effective atmodelling with presence-only data were applied todescribe the spatial distribution of whale sharksRhincodon typus in the NGOM: maximum entropy(MaxEnt) (Phillips et al. 2006) and ecological nichefactor analysis (ENFA) (Hirzel et al. 2002, 2007).MaxEnt is a machine-learning technique thatattempts to fit a probability distribution of speciesoccurrence over the entire study area using a com-plex suite of transformations on the environmentalvariables believed to be important to the target spe-cies (Phillips et al. 2006, Elith et al. 2006). On theother hand, the ENFA approach is similar to a princi-pal component analysis, in which a series of orthogo-nal factors are determined based on linear combina-tions of the environmental variables that describe therelationship between the values found at the loca-tions where species are present with those of theentire study area (Hirzel et al. 2002). The ENFAapproach takes into account the mean and standarddeviation of all environmental variables for the entirestudy area and for the cells in which the species ispresent. The ENFA output allows one to look at therelationship between these key factors using margin-ality and specialization scores. Marginality is thestandardized difference between the species meanand the study area mean, whereas specialization isthe ratio of the study area’s and species’ standarddeviations. The predictive model is then constructedso that the first factor accounts for all of the species’marginality and the majority of the specialization isaccounted for by the subsequent factors (Hirzel et al.2002). A suitability score for each cell within thestudy area is then assigned, based on the associationsbetween the presence records and the environmen-tal variables.
Using both model types, each year of the study(2008 and 2009) was modelled separately, due totemporal variability in whale shark distribution andenvironmental variables. Each modelling approach
was implemented with its stand-alone software,available for download online. The Biomapper toolkit(www.unil.ch/biomapper) includes a set of GIS andstatistical tools to develop an ENFA model for anytarget species and creates a habitat-suitability mapbased on optimal model parameterization (Hirzel etal. 2007). MaxEnt software (www.cs.princeton.edu/~schapire/MaxEnt) uses a deterministic algorithmalong with complex feature classes (linear, quadratic,product, threshold, hinge, and categorical) to con-verge on the probability distribution of maximumentropy (Phillips et al. 2006, Phillips & Dudík 2008).
Data preparation
Spatial data (environmental predictor variablesand whale shark presence data) were prepared usingArcGIS (ESRI Corporation) and IDRISI (Clark Labs atUniversity of Clark) GIS software. The working cellsize was determined by the highest resolution ofareal predictor data, which was about 1.1 km2. Allspatial data were resampled to the same cell size(0.009° ~ 1 km2), geographic datum (WGS 1984), andspatial extent (Fig. 1; latitude: 25 to 31°N, longitude:82 to 98°W). The temporal period of June throughSeptember in both 2008 and 2009 was selectedso that the environmental data corresponded to thetime during which most of the presence data werecollected.
Presence data
The University of Southern Mississippi, Gulf CoastResearch Laboratory’s Northern Gulf of MexicoWhale Shark Sightings Survey (WSSS), originated in2003 (Hoffmayer et al. 2005), has compiled whaleshark sightings throughout the NGOM from PortAransas, Texas, to Tampa Bay, Florida. Sightingsdata include: date, time and duration of the en coun -ter, location (GPS coordinates), approximate size andnumber of individuals, observed behavior, and, ifavailable, photographs. Validity of reports was con-firmed via photographs or verbal descriptions of ob -servations. Reports deemed as duplicate were re -moved from the analysis. The survey received a totalof 70 reports in 2008 and 176 reports in 2009. For thepresent study, any report that included 2 or moreindividuals was considered an aggregation. Foranalysis, each 1 km grid cell in the study area waseither considered present or absent, based on theWSSS results; therefore, even if several aggregation
201

Mar Ecol Prog Ser 458: 199–211, 2012
reports occurred within the same grid, it was onlycounted once. The number of records used inour study was similar between years (2008, n = 21;2009, n = 24), though the spatial distribution variedgreatly (Fig. 2). Herein, models will be referenced bythe algorithm and year (i.e. MaxEnt 2008, ENFA2008).
Environmental data
Environmental variables used in thepresent study consisted of a suite of spa-tial data derived from remotely sensedimages and GIS data (Table 1). All vari-ables were selected because they serveas a proxy for food availability or char-acterize the en vironmental habitat asso-ciated with whale shark distributiondescribed in the primary literature. A preliminary analysis was conducted toensure multi-collinearity was not pre-sent amongst variables, using anunweighted pair-group method usingarithmetic averages (UPGMA) (Sneath& Sokal 1973), the results of which areshown in Appendix 1 (Fig. A1). The following independent variables wereincluded in the final models: bathy -metric slope (Slope), distance to conti-nental shelf-edge (Shelf), distance tonearest petroleum platform (Drig), den-sity of petroleum platforms within 1 kmradius (Rigden), chlorophyll a con cen -tration (Chl), sea-surface temperature(SST), and sea-surface height (SSH)(Table 1).
Test data
An independent dataset of whaleshark distribution was developed to testthe predictive capacity of all models.The testing dataset consisted of 80 pres-ence and 80 pseudo-absence locationsderived separately from the datasetused to build the model (Fig. 3). Thepresence locations during the same sea-son (June to September) were extractedfrom aerial survey data collected by theNational Marine Fisheries Service, Mis-sissippi Laboratories, over the en tireNGOM slope waters from Tampa Bay,Florida, to Brownsville, Texas, between
1989 and 1998 (Burks et al. 2006). Pseudo-absencelocations were randomly generated in ArcGIS inareas outside of the observed locations. This datasetcould not be used for model building due to the lackof availability of remotely sensed variables fromthese years; however, it did provide an opportunity toutilize and independently test the data, rather than
202
Fig. 1. Map of the Gulf of Mexico basin depicting bathymetry (gray shading) and delineating the extent of the study area (black box)
Fig. 2. Maps depicting the sightings data used to generate Rhincodon typusdistribution models for (a) 2008 and (b) 2009

McKinney et al.: Whale shark distribution models in the northern Gulf of Mexico
splitting them up to conduct cross-validation. Themain advantage of independent testing was thatthe data were collected using a stratified-samplingmethodology, rather than through volunteer surveys,therefore avoiding potential ob server bias. Althoughcross-validation may be the most commonly usedtesting approach, we did not employ this test, as itrequires splitting the presence data into 2 separatedatasets (model building and model testing); thesample size for the presence data used to develop themodels was too low to be appropriate for a cross- validation approach. Additionally, we believe thatthe external testing dataset used can determine therobustness of the predictive models relative to thehistorically known whale shark distribution through-out the NGOM.
Model evaluation
All models were calibrated usingwhale shark sighting locations as a re-sponse variable and evaluated usingthe independent testing data set. Modelperformance was based on 2 statistics:the ‘area under the re ceiver operatingcharacteristic curve’ (AUC) (Wiley et al.2003) and Cohen’s kappa (Cohen 1960).The AUC represents the probabilitythat a random positive instance and arandom negative instance are correctlyclassified. In presence-only modelling,the technique is applied to distinguishpresence from random occurrance,rather than presence from absence
(Phillips et al. 2006). This approach defines negativeinstances as xrandom so that the AUC is then an indica-tor of whether the model predicts species distributionbetter than random, and can be used to prove statisti-cal significance. An AUC value of >0.5 indicates themodel performed ‘better than random,’ of 0.5 indicates‘random,’ and a value <0.5 means the model actuallyperformed worse than random (Phillips et al. 2006).
Cohen’s kappa statistic (hereafter referred to askappa) is a popular measure of accuracy because itcorrects for the expected accuracy due to chance(Allouche et al. 2006). The kappa score ranges from−1 to +1, where a value <0 indicates the model is per-forming no better than random and an accepted per-formance rating is as follows: 0 to 0.2 = slight agree-ment, 0.21 to 0.4 = fair, 0.41 to 0.6 = moderate, 0.61 to
203
Predictor variable Abbreviation Unit Source Source resolution
Bathymetric slope Slope % rise km−2 ArcGIS deriveda 1 kmDistance to shelf Shelf m ArcGIS deriveda −Distance to rig Drig m ArcGIS derivedb −Rig density Rigden no. of rigs km−2 ArcGIS derivedb −Chlorophyll a Chl mg m−3 SeaWIFSc 4 kmSea-surface height SSH cm − mean sea level Avisod 7 kmSea-surface temp. SST °C AVHRRe 1.1 km
aBathymetry data obtained by National Geophysical Data Center (www.ngdc.noaa.gov/mgg/mggd.html) GEOphysicalData System
bPetroleum platform data obtained by the Minerals Management Service (www.gomr.mms.gov/homepg/pubinfo/repcat/arcinfo/index.html)
cGiovanni (GES-DISC Online Visualization and Analysis Infrastructure) web portal, as part of the National Aeronauticsand Space Administration Goddard Earth Sciences Data and Information Services Center
dwww.aviso.oceanobs.com/en/data/products/sea-surface-height-products/regional/index.html using the ‘Download AvisoSSH dataset to ArcGIS Rasters’ tool in the ‘Marine Geospatial Ecology’ Toolbox (Roberts et al. 2010)
eNational Oceanic and Atmospheric Administration’s advanced very high resolution radiometer (AVHRR) (ftp://eclipse.ncdc.noaa.gov/pub/OI-daily/NetCDF/)
Table 1. Predictor variables used in whale shark Rhincodon typus species distribution models
Fig. 3. Map depicting the testing dataset used to evaluate model perfor-mance. Presence data (black dots) provided by the National Marine Fish-eries Service, Mississippi Laboratories, were collected during aerial surveystargeting marine mammals in the northern Gulf of Mexico from 1989 to1998. Pseudo-absence data (grey dots) were generated using a random point
generator in ArcMap 9.3 (ESRI Corp.)
Mar Ecol Prog Ser 458: 199–211, 2012
0.8 = substantial, and 0.81 to 1.0 =near perfect agreement (Cohen 1960,Landis & Koch 1977). It is also sensi-tive to prevalence (the proportion ofpresence points) in the testing dataset(Mc Pherson et al. 2004). In the pre-sent study, the testing dataset has anequal number of presence and ab -sence locations, in order to eliminatethis potential bias.
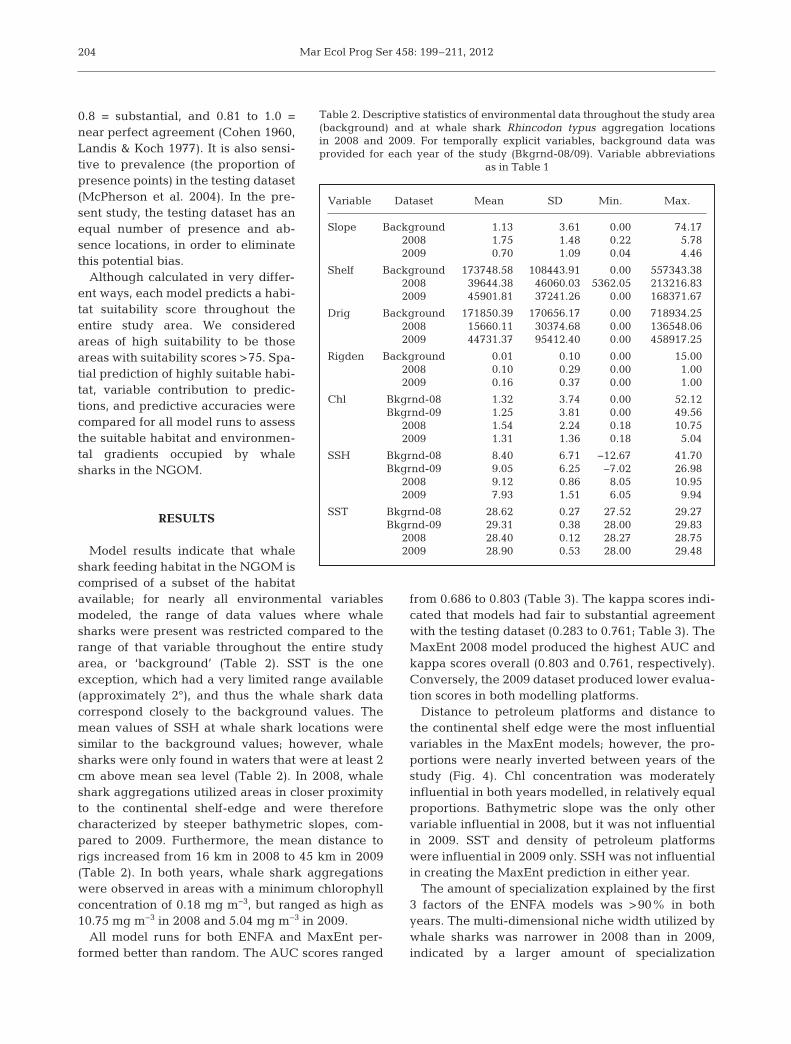
Although calculated in very differ-ent ways, each model predicts a habi-tat suitability score throughout theentire study area. We consideredareas of high suitability to be thoseareas with suitability scores >75. Spa-tial prediction of highly suitable habi-tat, variable contribution to predic-tions, and predictive accuracies werecompared for all model runs to assessthe suitable habitat and environmen-tal gradients occupied by whalesharks in the NGOM.
RESULTS
Model results indicate that whaleshark feeding habitat in the NGOM iscomprised of a subset of the habitatavailable; for nearly all environmental variablesmodeled, the range of data values where whalesharks were present was restricted compared to therange of that variable throughout the entire studyarea, or ‘background’ (Table 2). SST is the oneexception, which had a very limited range available(approximately 2°), and thus the whale shark datacorrespond closely to the background values. Themean values of SSH at whale shark locations weresimilar to the background values; however, whalesharks were only found in waters that were at least 2cm above mean sea level (Table 2). In 2008, whaleshark aggregations utilized areas in closer proximityto the continental shelf-edge and were thereforecharacterized by steeper bathymetric slopes, com-pared to 2009. Furthermore, the mean distance torigs increased from 16 km in 2008 to 45 km in 2009(Table 2). In both years, whale shark aggregationswere observed in areas with a minimum chlorophyllconcentration of 0.18 mg m−3, but ranged as high as10.75 mg m−3 in 2008 and 5.04 mg m−3 in 2009.
All model runs for both ENFA and MaxEnt per-formed better than random. The AUC scores ranged
from 0.686 to 0.803 (Table 3). The kappa scores indi-cated that models had fair to substantial agreementwith the testing dataset (0.283 to 0.761; Table 3). TheMaxEnt 2008 model produced the highest AUC andkappa scores overall (0.803 and 0.761, respectively).Conversely, the 2009 dataset produced lower evalua-tion scores in both modelling platforms.
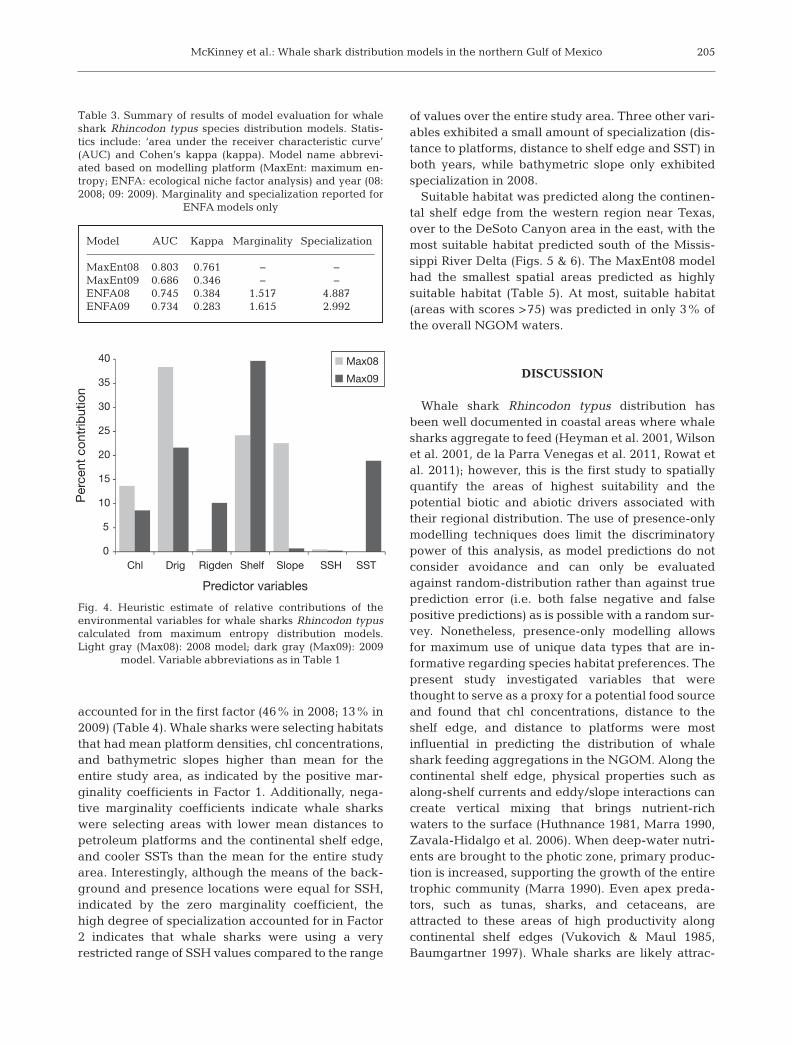
Distance to petroleum platforms and distance tothe continental shelf edge were the most influentialvariables in the MaxEnt models; however, the pro-portions were nearly inverted between years of thestudy (Fig. 4). Chl concentration was moderatelyinfluential in both years modelled, in relatively equalproportions. Bathymetric slope was the only othervariable influential in 2008, but it was not influentialin 2009. SST and density of petroleum platformswere influential in 2009 only. SSH was not influentialin creating the MaxEnt prediction in either year.
The amount of specialization explained by the first3 factors of the ENFA models was >90% in bothyears. The multi-dimensional niche width utilized bywhale sharks was narrower in 2008 than in 2009,indicated by a larger amount of specialization
204
Variable Dataset Mean SD Min. Max.
Slope Background 1.13 3.61 0.00 74.172008 1.75 1.48 0.22 5.782009 0.70 1.09 0.04 4.46
Shelf Background 173748.58 108443.91 0.00 557343.382008 39644.38 46060.03 5362.05 213216.832009 45901.81 37241.26 0.00 168371.67
Drig Background 171850.39 170656.17 0.00 718934.252008 15660.11 30374.68 0.00 136548.062009 44731.37 95412.40 0.00 458917.25
Rigden Background 0.01 0.10 0.00 15.002008 0.10 0.29 0.00 1.002009 0.16 0.37 0.00 1.00
Chl Bkgrnd-08 1.32 3.74 0.00 52.12Bkgrnd-09 1.25 3.81 0.00 49.56
2008 1.54 2.24 0.18 10.752009 1.31 1.36 0.18 5.04
SSH Bkgrnd-08 8.40 6.71 −12.67 41.70Bkgrnd-09 9.05 6.25 −7.02 26.98
2008 9.12 0.86 8.05 10.952009 7.93 1.51 6.05 9.94
SST Bkgrnd-08 28.62 0.27 27.52 29.27Bkgrnd-09 29.31 0.38 28.00 29.83
2008 28.40 0.12 28.27 28.752009 28.90 0.53 28.00 29.48
Table 2. Descriptive statistics of environmental data throughout the study area(background) and at whale shark Rhincodon typus aggregation locationsin 2008 and 2009. For temporally explicit variables, background data was provided for each year of the study (Bkgrnd-08/09). Variable abbreviations
as in Table 1
McKinney et al.: Whale shark distribution models in the northern Gulf of Mexico
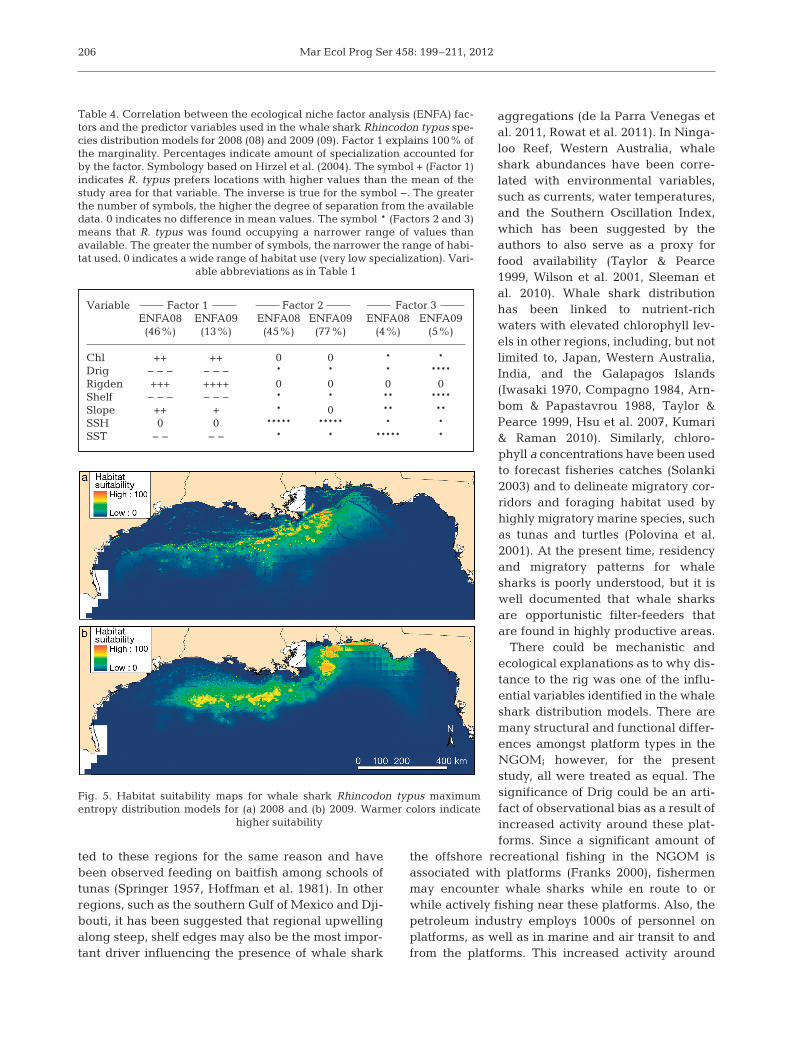
accounted for in the first factor (46% in 2008; 13% in2009) (Table 4). Whale sharks were selecting habitatsthat had mean platform densities, chl concentrations,and bathymetric slopes higher than mean for theentire study area, as indicated by the positive mar-ginality coefficients in Factor 1. Additionally, nega-tive marginality coefficients indicate whale sharkswere selecting areas with lower mean distances topetroleum platforms and the continental shelf edge,and cooler SSTs than the mean for the entire studyarea. Interestingly, although the means of the back-ground and presence locations were equal for SSH,indicated by the zero marginality coefficient, thehigh degree of specialization ac coun ted for in Factor2 indicates that whale sharks were using a veryrestricted range of SSH values compared to the range
of values over the entire study area. Three other vari-ables exhibited a small amount of specialization (dis-tance to platforms, distance to shelf edge and SST) inboth years, while bathymetric slope only exhibitedspecialization in 2008.
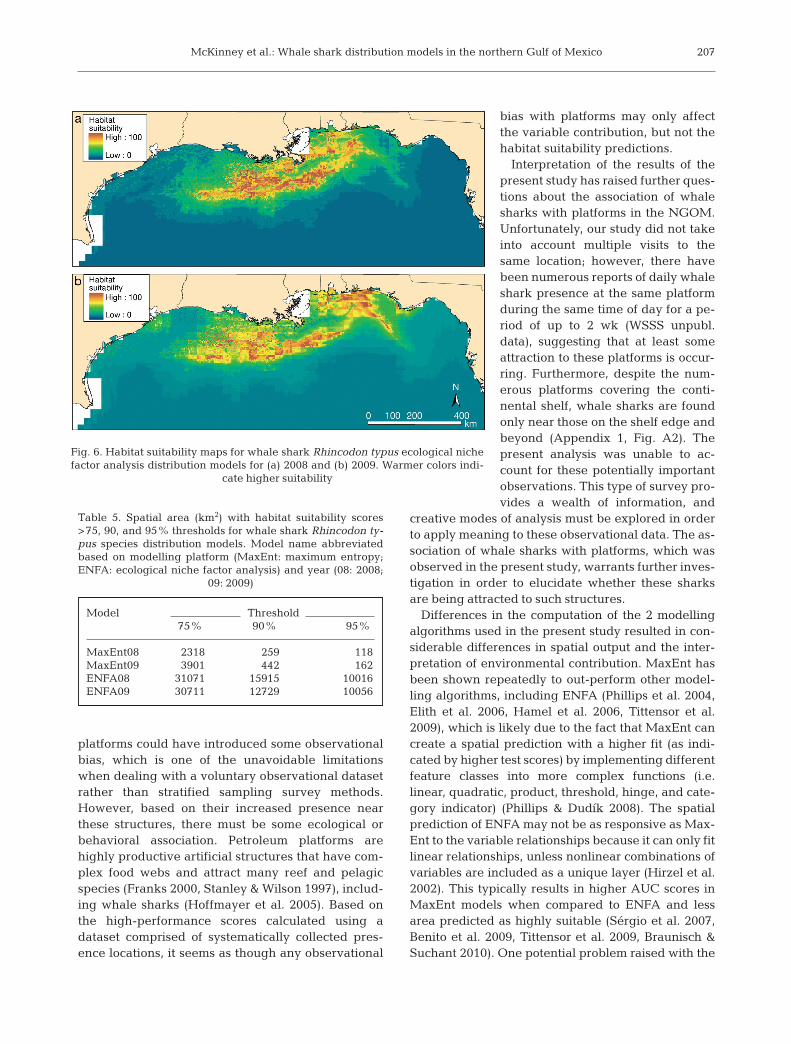
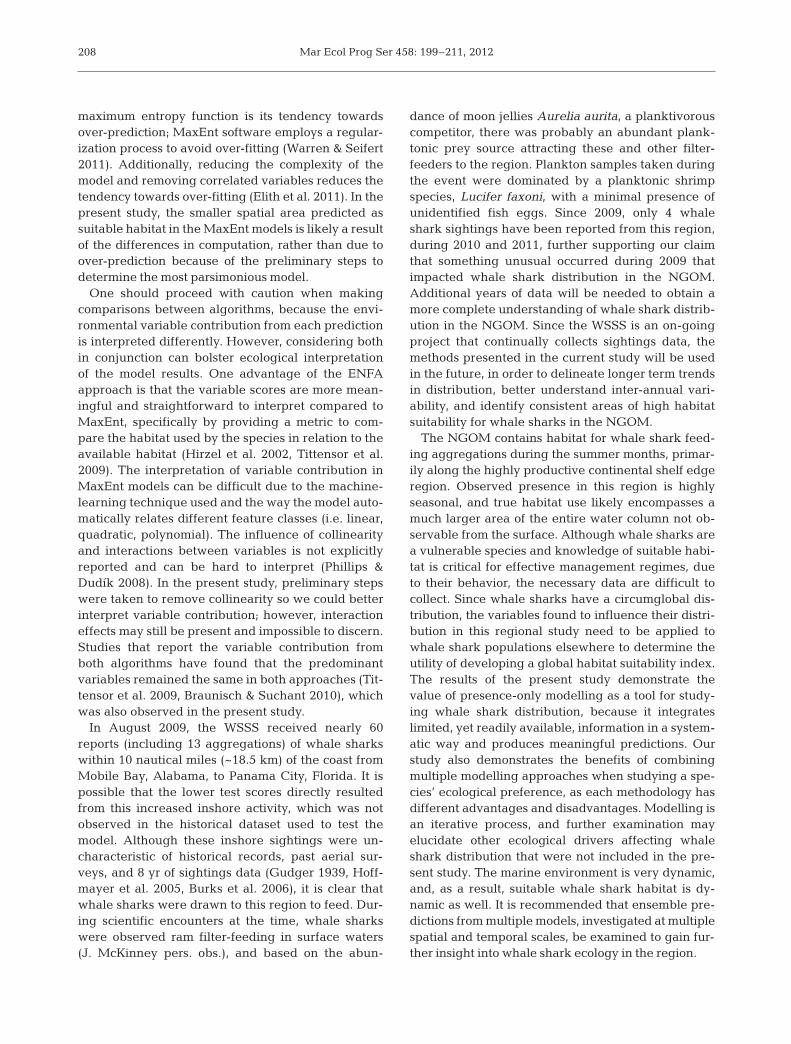
Suitable habitat was predicted along the continen-tal shelf edge from the western region near Texas,over to the DeSoto Canyon area in the east, with themost suitable habitat predicted south of the Missis-sippi River Delta (Figs. 5 & 6). The MaxEnt08 modelhad the smallest spatial areas predicted as highlysuitable habitat (Table 5). At most, suitable habitat(areas with scores >75) was predicted in only 3% ofthe overall NGOM waters.
DISCUSSION
Whale shark Rhincodon typus distribution hasbeen well documented in coastal areas where whalesharks aggregate to feed (Heyman et al. 2001, Wilsonet al. 2001, de la Parra Venegas et al. 2011, Rowat etal. 2011); however, this is the first study to spatiallyquantify the areas of highest suitability and thepotential biotic and abiotic drivers associated withtheir regional distribution. The use of presence-onlymodelling techniques does limit the discriminatorypower of this analysis, as model predictions do notconsider avoidance and can only be evaluatedagainst random-distribution rather than against trueprediction error (i.e. both false negative and falsepositive predictions) as is possible with a random sur-vey. Nonetheless, presence-only modelling allowsfor maximum use of unique data types that are in -formative regarding species habitat preferences. Thepresent study investigated variables that werethought to serve as a proxy for a potential food sourceand found that chl concentrations, distance to theshelf edge, and distance to platforms were mostinfluential in predicting the distribution of whaleshark feeding aggregations in the NGOM. Along thecontinental shelf edge, physical properties such asalong-shelf currents and eddy/slope interactions cancreate vertical mixing that brings nutrient-richwaters to the surface (Huthnance 1981, Marra 1990,Zavala-Hidalgo et al. 2006). When deep-water nutri-ents are brought to the photic zone, primary produc-tion is increased, supporting the growth of the entiretrophic community (Marra 1990). Even apex preda-tors, such as tunas, sharks, and cetaceans, areattracted to these areas of high productivity alongcontinental shelf edges (Vukovich & Maul 1985,Baumgartner 1997). Whale sharks are likely attrac -
205
Model AUC Kappa Marginality Specialization
MaxEnt08 0.803 0.761 − −MaxEnt09 0.686 0.346 − −ENFA08 0.745 0.384 1.517 4.887ENFA09 0.734 0.283 1.615 2.992
Table 3. Summary of results of model evaluation for whaleshark Rhincodon typus species distribution models. Statis-tics include: ‘area under the receiver characteristic curve’(AUC) and Cohen’s kappa (kappa). Model name abbrevi-ated based on modelling platform (MaxEnt: maximum en-tropy; ENFA: ecological niche factor analysis) and year (08:2008; 09: 2009). Marginality and specialization reported for
ENFA models only
0
5
10
15
20
25
30
35
40
Chl Drig Rigden Shelf Slope SSH SST
Per
cent
con
trib
utio
n
Predictor variables
Max08
Max09
Fig. 4. Heuristic estimate of relative contributions of the environmental variables for whale sharks Rhincodon typuscalculated from maximum entropy distribution models.Light gray (Max08): 2008 model; dark gray (Max09): 2009
model. Variable abbreviations as in Table 1
Mar Ecol Prog Ser 458: 199–211, 2012
ted to these regions for the same reason and havebeen observed feeding on baitfish among schools oftunas (Springer 1957, Hoffman et al. 1981). In otherregions, such as the southern Gulf of Mexico and Dji-bouti, it has been suggested that regional upwellingalong steep, shelf edges may also be the most impor-tant driver influencing the presence of whale shark
aggregations (de la Parra Venegas etal. 2011, Rowat et al. 2011). In Ninga-loo Reef, Western Australia, whaleshark abundances have been corre-lated with environmental variables,such as currents, water temperatures,and the Southern Oscillation Index,which has been suggested by theauthors to also serve as a proxy forfood availability (Taylor & Pearce1999, Wilson et al. 2001, Sleeman etal. 2010). Whale shark distributionhas been linked to nutrient-richwaters with elevated chlorophyll lev-els in other regions, including, but notlimited to, Japan, Western Australia,India, and the Galapagos Islands(Iwasaki 1970, Compagno 1984, Arn-bom & Papastavrou 1988, Taylor &Pearce 1999, Hsu et al. 2007, Kumari& Raman 2010). Similarly, chloro-phyll a concentrations have been usedto forecast fisheries catches (Solanki2003) and to delineate mi gratory cor-ridors and foraging habitat used byhighly migratory ma rine species, suchas tunas and turtles (Polovina et al.2001). At the present time, residencyand migratory patterns for whalesharks is poorly un der stood, but it iswell documented that whale sharksare opportunistic filter-feeders thatare found in highly productive areas.
There could be mechanistic andecological explanations as to why dis-tance to the rig was one of the influ-ential variables identified in the whaleshark distribution models. There aremany structural and functional differ-ences amongst platform types in theNGOM; however, for the presentstudy, all were treated as equal. Thesignificance of Drig could be an arti-fact of observational bias as a result ofincreased activity around these plat-forms. Since a significant amount of
the offshore recreational fishing in the NGOM isassociated with platforms (Franks 2000), fishermenmay encounter whale sharks while en route to orwhile actively fishing near these platforms. Also, thepetroleum industry employs 1000s of personnel onplatforms, as well as in marine and air transit to andfrom the platforms. This increased activity around
206
Variable Factor 1 Factor 2 Factor 3ENFA08 ENFA09 ENFA08 ENFA09 ENFA08 ENFA09(46%) (13%) (45%) (77%) (4%) (5%)
Chl ++ ++ 0 0 * *Drig − − − − − − * * * ****Rigden +++ ++++ 0 0 0 0Shelf − − − − − − * * ** ****Slope ++ + * 0 ** **SSH 0 0 ***** ***** * *SST − − − − * * ***** *
Table 4. Correlation between the ecological niche factor analysis (ENFA) fac-tors and the predictor variables used in the whale shark Rhincodon typus spe-cies distribution models for 2008 (08) and 2009 (09). Factor 1 explains 100% ofthe marginality. Percentages indicate amount of specialization accounted forby the factor. Symbology based on Hirzel et al. (2004). The symbol + (Factor 1)indicates R. typus prefers locations with higher values than the mean of thestudy area for that variable. The inverse is true for the symbol −. The greaterthe number of symbols, the higher the degree of separation from the availabledata. 0 indicates no difference in mean values. The symbol * (Factors 2 and 3)means that R. typus was found occupying a narrower range of values thanavailable. The greater the number of symbols, the narrower the range of habi-tat used. 0 indicates a wide range of habitat use (very low specialization). Vari-
able abbreviations as in Table 1
Fig. 5. Habitat suitability maps for whale shark Rhincodon typus maximum entropy distribution models for (a) 2008 and (b) 2009. Warmer colors indicate
higher suitability
McKinney et al.: Whale shark distribution models in the northern Gulf of Mexico
platforms could have introduced some observationalbias, which is one of the unavoidable limitationswhen dealing with a voluntary observational datasetrather than stratified sampling survey methods.However, based on their increased presence nearthese structures, there must be some ecological orbehavioral association. Petroleum platforms arehighly productive artificial structures that have com-plex food webs and attract many reef and pelagicspecies (Franks 2000, Stanley & Wilson 1997), includ-ing whale sharks (Hoffmayer et al. 2005). Based onthe high-performance scores calculated using adataset comprised of systematically collected pres-ence locations, it seems as though any obser vational
bias with platforms may only affectthe variable contribution, but not thehabitat suitability predictions.
Interpretation of the results of thepresent study has raised further ques-tions about the association of whalesharks with platforms in the NGOM.Unfortunately, our study did not takeinto account multiple visits to thesame location; however, there havebeen numerous reports of daily whaleshark presence at the same platformduring the same time of day for a pe-riod of up to 2 wk (WSSS unpubl.data), suggesting that at least some attraction to these platforms is occur-ring. Furthermore, despite the nu m -er ous platforms covering the conti-nental shelf, whale sharks are foundonly near those on the shelf edge andbeyond (Appendix 1, Fig. A2). Thepresent analysis was unable to ac-count for these potentially im portantobservations. This type of survey pro-vides a wealth of information, and
creative modes of analysis must be explored in orderto apply meaning to these observational data. The as-sociation of whale sharks with platforms, which wasobserved in the present study, warrants further inves-tigation in order to elucidate whether these sharksare being attracted to such structures.
Differences in the computation of the 2 modellingalgorithms used in the present study resulted in con-siderable differences in spatial output and the inter-pretation of environmental contribution. MaxEnt hasbeen shown repeatedly to out-perform other model-ling algorithms, including ENFA (Phillips et al. 2004,Elith et al. 2006, Hamel et al. 2006, Tittensor et al.2009), which is likely due to the fact that MaxEnt cancreate a spatial prediction with a higher fit (as indi-cated by higher test scores) by im plementing differentfeature classes into more complex functions (i.e.linear, quadratic, product, threshold, hinge, and cate-gory indicator) (Phillips & Dudík 2008). The spatialprediction of ENFA may not be as responsive as Max-Ent to the variable relationships because it can only fitlinear relationships, unless nonlinear combinations ofvariables are included as a unique layer (Hirzel et al.2002). This typically results in higher AUC scores inMaxEnt models when compared to ENFA and lessarea predicted as highly suitable (Sérgio et al. 2007,Benito et al. 2009, Tittensor et al. 2009, Braunisch &Suchant 2010). One potential problem raised with the
207
Fig. 6. Habitat suitability maps for whale shark Rhincodon typus ecological nichefactor analysis distribution models for (a) 2008 and (b) 2009. Warmer colors indi-
cate higher suitability
Model Threshold75% 90% 95%
MaxEnt08 2318 259 118MaxEnt09 3901 442 162ENFA08 31071 15915 10016ENFA09 30711 12729 10056
Table 5. Spatial area (km2) with habitat suitability scores>75, 90, and 95% thresholds for whale shark Rhincodon ty-pus species distribution models. Model name abbreviatedbased on modelling platform (MaxEnt: maximum entropy;ENFA: ecological niche factor analysis) and year (08: 2008;
09: 2009)
Mar Ecol Prog Ser 458: 199–211, 2012
maximum entropy function is its tendency towardsover-prediction; MaxEnt software employs a regular-ization process to avoid over-fitting (Warren & Seifert2011). Additionally, reducing the complexity of themodel and removing correlated variables reduces thetendency towards over-fitting (Elith et al. 2011). In thepresent study, the smaller spatial area predicted assuitable habitat in the MaxEnt models is likely a resultof the differences in computation, rather than due toover-prediction because of the preliminary steps todetermine the most parsimonious model.
One should proceed with caution when makingcomparisons between algorithms, because the envi-ronmental variable contribution from each predictionis interpreted differently. However, considering bothin conjunction can bolster ecological interpretationof the model results. One advantage of the ENFAapproach is that the variable scores are more mean-ingful and straightforward to interpret compared toMaxEnt, specifically by providing a metric to com-pare the habitat used by the species in relation to theavailable habitat (Hirzel et al. 2002, Tittensor et al.2009). The interpretation of variable contribution inMaxEnt models can be difficult due to the machine-learning technique used and the way the model auto-matically relates different feature classes (i.e. linear,quadratic, polynomial). The influence of collinearityand interactions between variables is not explicitlyreported and can be hard to interpret (Phillips &Dudík 2008). In the present study, preliminary stepswere taken to remove collinearity so we could betterinterpret variable contribution; however, interactioneffects may still be present and impossible to discern.Studies that report the variable contribution fromboth algorithms have found that the predominantvariables remained the same in both approaches (Tit-tensor et al. 2009, Braunisch & Suchant 2010), whichwas also observed in the present study.
In August 2009, the WSSS received nearly 60reports (including 13 aggregations) of whale sharkswithin 10 nautical miles (~18.5 km) of the coast fromMobile Bay, Alabama, to Panama City, Florida. It ispossible that the lower test scores directly resultedfrom this increased inshore activity, which was notobserved in the historical dataset used to test themodel. Al though these inshore sightings were un -characteristic of historical records, past aerial sur-veys, and 8 yr of sightings data (Gudger 1939, Hoff-mayer et al. 2005, Burks et al. 2006), it is clear thatwhale sharks were drawn to this region to feed. Dur-ing scientific en counters at the time, whale sharkswere observed ram filter-feeding in surface waters(J. McKinney pers. obs.), and based on the abun-
dance of moon jellies Aurelia aurita, a planktivorouscompetitor, there was probably an abundant plank-tonic prey source attracting these and other filter-feeders to the region. Plankton samples taken duringthe event were dominated by a planktonic shrimpspecies, Lucifer faxoni, with a minimal presence ofunidentified fish eggs. Since 2009, only 4 whaleshark sightings have been reported from this region,during 2010 and 2011, further supporting our claimthat something unusual occurred during 2009 thatimpacted whale shark distribution in the NGOM.Additional years of data will be needed to obtain amore complete understanding of whale shark distrib-ution in the NGOM. Since the WSSS is an on-goingproject that continually collects sightings data, themethods presented in the current study will be usedin the future, in order to delineate longer term trendsin distribution, better understand inter-annual vari-ability, and identify consistent areas of high habitatsuitability for whale sharks in the NGOM.
The NGOM contains habitat for whale shark feed-ing aggregations during the summer months, primar-ily along the highly productive continental shelf edgeregion. Observed presence in this region is highlyseasonal, and true habitat use likely encompasses amuch larger area of the entire water column not ob-servable from the surface. Although whale sharks area vulnerable species and knowledge of suitable habi-tat is critical for effective management regimes, dueto their behavior, the necessary data are difficult tocollect. Since whale sharks have a circumglobal dis-tribution, the variables found to influence their distri-bution in this regional study need to be applied towhale shark populations elsewhere to determine theutility of developing a global habitat suitability index.The results of the present study demonstrate thevalue of presence-only modelling as a tool for study -ing whale shark distribution, because it integrateslimited, yet readily available, information in a system-atic way and produces meaningful predictions. Ourstudy also demonstrates the benefits of combiningmultiple modelling approaches when studying a spe-cies’ ecological preference, as each methodology hasdifferent advantages and disadvantages. Modelling isan iterative process, and further examination mayelucidate other ecological drivers affecting whaleshark distribution that were not included in the pre-sent study. The marine environment is very dynamic,and, as a result, suitable whale shark habitat is dy-namic as well. It is recommended that ensemble pre-dictions from multiple models, investigated at multiplespatial and temporal scales, be examined to gain fur-ther insight into whale shark ecology in the region.
208
McKinney et al.: Whale shark distribution models in the northern Gulf of Mexico
Acknowledgements. The present study would not havebeen possible without the many submitters to the GCRLwhale shark sightings survey, who are too numerous toname; as well as the many people and organizations thathelped spread the word about the survey. Specifically, wethank Dan Allen and Allen Veret of the Offshore OperatorsCommittee, and Mark Fontenot of the Helicopter SafetyAdvisory Conference. We also acknowledge James G.Acker of NASA GES-DISC for his help in navigatingthrough the NASA data visualizers and accessing the mostup-to-date data products; Jason Roberts of the MGET Cen-ter at Duke University, for his personal assistance with theMGET toolkit; and, lastly, the mission scientists, principalinvestigators, and associated NASA personnel for the pro-duction of the data used in this research effort. We alsothank 4 anonymous reviewers for their contributions to thedevelopment of the manuscript. William Driggers III, MarkPeterson, and James Franks are also acknowledged formany fruitful discussions on the subject matter.
LITERATURE CITED
Allouche O, Tsoar A, Kadmon R (2006) Assessing the accu-racy of species distribution models: prevalence, kappaand the true skill statistic (TSS). J Appl Ecol 43: 1223−1232
Arnbom T, Papastavrou V (1988) Fish in association with thewhale sharks Rhiniodon typus near the GalapagosIslands. Noticias de Galapagos 46: 13−15
Balch WM, Byrne CF (1994) Factors affecting the estimate ofprimary production from space. J Geophys Res 99: 7555−7570
Baumgartner MF (1997) The distribution of Risso’s dolphin(Grampus griseus) with respect to the physiographyof the northern Gulf of Mexico. Mar Mamm Sci 13: 614−638
Benito B, Martínez-Ortega M, Muñoz L, Lorite J, Peñas J(2009) Assessing extinction-risk of endangered plantsusing species distribution models: a case study of habitatdepletion caused by the spread of greenhouses. Bio-divers Conserv 18: 2509−2520
Braunisch V, Suchant R (2010) Predicting species distribu-tions based on incomplete survey data: the trade-offbetween precision and scale. Ecography 33: 826−840
Burks CM, Driggers WB III, Mullin KD (2006) Abundanceand distribution of whale sharks (Rhincodon typus) in thenorthern Gulf of Mexico. Fish Bull 104: 579−584
Cohen J (1960) A coefficient of agreement for nominalscales. Educ Psychol Meas 20: 37−46
Colman JG (1997) A review of the biology and ecology of thewhale shark. J Fish Biol 51: 1219−1234
Compagno LJV (1984) FAO species catalogue. FAO, Romede la Parra Venegas R, Hueter R, González Cano J, Tyminski
J and others (2011) An unprecedented aggregation ofwhale sharks, Rhincodon typus, in Mexican coastalwaters of the Caribbean Sea. PLoS ONE 6: e18994
Druon JN, Fromentin JM, Aulanier F, Heikkonen J (2011)Potential feeding and spawning habitats of Atlanticbluefin tuna in the Mediterranean Sea. Mar Ecol ProgSer 439: 223−240
Elith J, Graham CH, Anderson RP, Dudík M and others(2006) Novel methods improve prediction of species’ dis-tributions from occurrence data. Ecography 29: 129−151
Elith J, Phillips SJ, Hastie T, Dudík M, Chee YE, Yates CJ
(2011) A statistical explanation of MaxEnt for eco logistsDrivers Distrib 17:43–57
Franks JS (2000) Pelagic fishes at offshore petroleum platforms in the northern Gulf of Mexico: diversity, inter-relationships, and perspective. Colloque Caraibe Actesde Colloques Ifremer Aquat Living Resour (France) 13: 502−515
Gudger EW (1939) The whale shark in the Caribbean Seaand the Gulf of Mexico. Sci Mon 48: 261−264
Guisan A, Thuiller W (2005) Predicting species distribution: offering more than simple habitat models. Ecol Lett 8: 993−1009
Hamel P, Barker S, Benítez S, Baldy J and others (2006)Modeling the South American range of the cerulean war-bler. In: Proceedings of the 26th ESRI international userconference. ESRI, San Diego, CA
Heyman WD, Graham RT, Kjerfve B, Johannes RE (2001)Whale sharks Rhincodon typus aggregate to feed on fishspawn in Belize. Mar Ecol Prog Ser 215: 275−282
Hirzel AH, Hausser J, Chessel D, Perrin N (2002) Ecological-niche factor analysis: How to compute habitat-suitabilitymaps without absence data? Ecology 83: 2027−2036
Hirzel AH, Posse B, Oggier PA, Crettenand Y, Glenz C,Arlettaz R (2004) Ecological requirements of reintro-duced species and the implications for release policy: thecase of the bearded vulture. J Appl Ecol 41: 1103−1116
Hirzel AH, Hausser J, Perrin N (2007) Biomapper 4.0. Labo-ratory of Conservation Biology, Department of Ecologyand Evolution, University of Lausanne, Lausanne
Hoffman W, Fritts T, Reynolds R (1981) Whale sharks associ-ated with fish schools off south Texas. Northeast Gulf Sci5: 55−57
Hoffmayer ER, Franks JS, Shelley JP (2005) Recent observa-tions of the whale shark (Rhincodon typus) in north cen-tral Gulf of Mexico. Gulf Caribb Res 17: 117−120
Hsu HH, Joung SJ, Liao YY, Liu KM (2007) Satellite trackingof juvenile whale sharks, Rhincodon typus, in the north-western Pacific. Fish Res 84: 25−31
Huthnance JM (1981) Waves and currents near the conti-nental shelf edge. Prog Oceanogr 10: 193−226
Iwasaki Y (1970) On the distribution and environment of thewhale shark, Rhincodon typus, in skipjack fishinggrounds in the western Pacific Ocean. J Mar Sci TechnolTokai Univ 4: 37−51
Kumari B, Raman M (2010) Whale shark habitat assessmentsin the northeastern Arabian Sea using satellite remotesensing. Int J Remote Sens 31: 379−389
Landis JR, Koch GG (1977) The measurement of observeragreement for categorical data. Biometrics 33: 159−174
Marra JH, Houghton RW, Garside C (1990) Phytoplanktongrowth at the shelf-break front in the Middle AtlanticBight. J Mar Res 48: 851−868
McPherson JM, Jetz W, Rogers DJ (2004) The effects of spe-cies’ range sizes on the accuracy of distribution models: Ecological phenomenon or statistical artefact? J ApplEcol 41: 811−823
Pearce JL, Boyce MS (2006) Modelling distribution andabundance with presence-only data. J Appl Ecol 43: 405−412
Peterson AT (2001) Predicting species’ geographic distribu-tions based on ecological niche modeling. Condor 103: 599−605
Phillips SJ, Dudík M (2008) Modeling of species distribu-tions with MaxEnt: new extensions and a comprehensiveevaluation. Ecography 31: 161−175
209
Mar Ecol Prog Ser 458: 199–211, 2012
Phillips SJ, Dudik M, Schapire RE (2004) A maximumentropy approach to species distribution modeling. In: Proceedings of the 21st international conference onmachine learning. ACM, Banff, Alberta
Phillips SJ, Anderson RP, Schapire RE (2006) Maximumentropy modeling of species geographic distributions.Ecol Model 190: 231−259
Polovina JJ, Howell E, Kobayashi DR, Seki MP (2001) Thetransition zone chlorophyll front, a dynamic global fea-ture defining migration and forage habitat for marineresources. Prog Oceanogr 49: 469−483
Praca E, Gannier A, Das K, Laran S (2009) Modelling thehabitat suitability of cetaceans: example of the spermwhale in the northwestern Mediterranean Sea. Deep-Sea Res I 56: 648−657
Roberts JJ, Best BD, Dunn DC, Treml EA, Halpin PN (2010)Marine Geospatial Ecology Tools: an integrated frame-work for ecological geoprocessing with ArcGIS, Py -thon, R, MATLAB, and C++. Environ Model Softw 25:1197–1207
Rowat D, Brooks K, March A, McCarten C and others (2011)Long-term membership of whale sharks (Rhincodontypus) in coastal aggregations in Seychelles and Djibouti.Mar Freshw Res 62: 621−627
Sequeira A, Mellin C, Rowat D, Meekan MG, BradshawCJA (2012) Ocean-scale prediction of whale shark distri-bution. Divers Distrib 18:504−518
Sérgio C, Figueira R, Draper D, Menezes R, Sousa AJ (2007)Modelling bryophyte distribution based on ecologicalinformation for extent of occurrence assessment. BiolConserv 135: 341−351
Sleeman JC, Meekan MG, Fitzpatrick BJ, Steinberg CR,Ancel R, Bradshaw CJA (2010) Oceanographic andatmospheric phenomena influence the abundance ofwhale sharks at Ningaloo Reef, Western Australia. J ExpMar Biol Ecol 382: 77−81
Sneath PHA, Sokal RR (1973) Numerical taxonomy. Free-man, San Francisco, CA
Solanki HU, Dwivedi RM, Nayak SR, Somvanshi VS, GulatiDK, Pattnayak SK (2003) Fishery forecast using OCMchlorophyll concentration and AVHRR SST: validationresults off Gujarat Coast, India. Int J Remote Sens 24: 3691−3699
Springer S (1957) Some observations of the behavior of
schools of fishes in the Gulf of Mexico and adjacentwaters. Ecology 38: 166−171
Stanley DR, Wilson CA (1997) Seasonal and spatial variationin abundance and size distribution of fishes associatedwith a petroleum platform in the northern Gulf of Mex-ico. Can J Fish Aquat Sci 54: 1166–1176
Stevens JD (2007) Whale shark (Rhincodon typus) biologyand ecology: a preview of the primary literature. Fish Res84: 4−9
Stockwell DRB, Peterson AT (2002) Effects of sample size onaccuracy of species distribution models. Ecol Model 148: 1−13
Taylor JG (2007) Ram filter-feeding and nocturnal feeding ofwhale sharks (Rhincodon typus) at Ningaloo Reef, West-ern Australia. Fish Res 84: 65−70
Taylor JG, Pearce AF (1999) Ningaloo reef currents: implica-tions for coral spawn dispersal, zooplankton and whaleshark abundance. J R Soc West Aust 82: 57−65
Tittensor DP, Baco AR, Brewin PE, Clark MR and others(2009) Predicting global habitat suitability for stonycorals on seamounts. J Biogeogr 36: 1111−1128
Tserpes G, Peristeraki P, Valavanis VD (2008) Distribution ofswordfish in the eastern Mediterranean, in relation toenvironmental factors and the species biology. Hydro -biologia 612: 241−250
Vukovich FM, Maul GA (1985) Cyclonic eddies in the east-ern Gulf of Mexico. J Phys Oceanogr 15: 105−117
Warren DL, Seifert SN (2011) Environmental niche model-ing in MaxEnt: the importance of model complexity andthe performance of model selection criteria. Ecol Appl21:335–342
Wiley EO, McNyset KM, Peterson AT, Robins CR, StewartAM (2003) Niche modeling and geographic range pre-dictions in the marine environment using a machine-learning algorithm. Oceanography (Wash DC) 16: 120−127
Wilson SG, Taylor JG, Pearce AF (2001) The seasonal aggre-gation of whale sharks at Ningaloo Reef, Western Aus-tralia: currents, migrations and the El Niño/SouthernOscillation. Environ Biol Fishes 61: 1−11
Zavala-Hidalgo J, Gallegos-García A, Martínez-López B,Morey S, O’Brien J (2006) Seasonal upwelling on thewestern and southern shelves of the Gulf of Mexico.Ocean Dyn 56: 333−338
210
McKinney et al.: Whale shark distribution models in the northern Gulf of Mexico 211
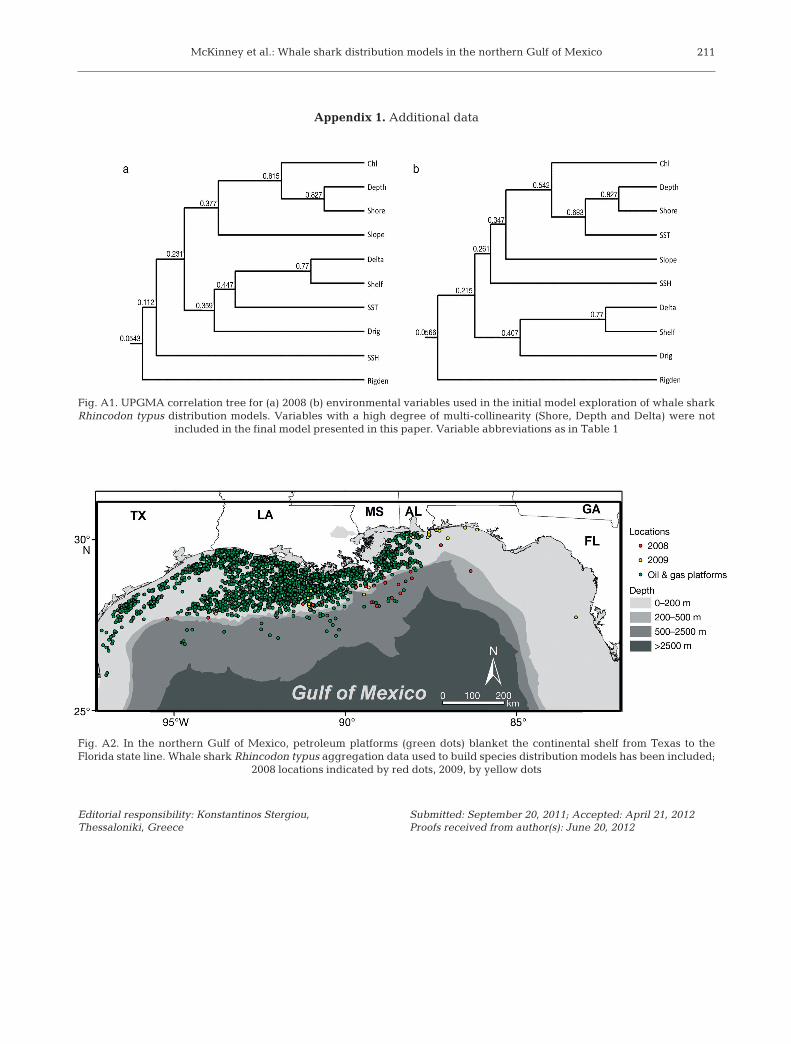
Appendix 1. Additional data
Fig. A1. UPGMA correlation tree for (a) 2008 (b) environmental variables used in the initial model exploration of whale sharkRhincodon typus distribution models. Variables with a high degree of multi-collinearity (Shore, Depth and Delta) were not
included in the final model presented in this paper. Variable abbreviations as in Table 1
Fig. A2. In the northern Gulf of Mexico, petroleum platforms (green dots) blanket the continental shelf from Texas to theFlorida state line. Whale shark Rhincodon typus aggregation data used to build species distribution models has been included;
2008 locations indicated by red dots, 2009, by yellow dots
Editorial responsibility: Konstantinos Stergiou, Thessaloniki, Greece
Submitted: September 20, 2011; Accepted: April 21, 2012Proofs received from author(s): June 20, 2012