federal government technical report - crrc · federal government technical report properties,...
TRANSCRIPT

Federal Government Technical Report
Properties, Composition and Marine Spill Behaviour, Fate and
Transport of Two Diluted Bitumen Products from the Canadian
Oil Sands
Environment Canada
Emergencies Science and Technology
Fisheries and Oceans Canada
Centre for Offshore Oil, Gas and Energy Research
Natural Resources Canada
CanmetENERGY
November 30, 2013

ISBN 978-1-100-23004-7
Cat. No.: En84-96/2013E-PDF
Information contained in this publication or product may be reproduced, in part or in whole, and by
any means, for personal or public non-commercial purposes, without charge or further permission,
unless otherwise specified.
You are asked to:
• Exercise due diligence in ensuring the accuracy of the materials reproduced;
• Indicate both the complete title of the materials reproduced, as well as the
author organization; and
• Indicate that the reproduction is a copy of an official work that is published by
the Government of Canada and that the reproduction has not been produced in affiliation
with or with the endorsement of the Government of Canada.
Commercial reproduction and distribution is prohibited except with written permission
from the author. For more information, please contact Environment Canada's Inquiry Centre
at 1-800-668-6767 (in Canada only) or 819-997-2800 or email to [email protected].
Cover Photos: © Author, Environment Canada
© Her Majesty the Queen in Right of Canada, represented by the Minister of the Environment, 2013
Aussi disponible en français

1
Table of Contents Executive Summary ................................................................................................................................................................ 5
1.0 Introduction ................................................................................................................................................................ 7
2.0 Literature Review of Diluted Bitumen and Synthetic Bitumen Spills, Behaviour and Use of
Chemical Countermeasures............................................................................................................................................... 11
2.1 Properties and Composition of Diluted Bitumen Products from the Canadian Oil Sands ... 11
2.1.1 Diluted Bitumen Products ..................................................................................................................... 11
2.2 Fate and Behaviour of Diluted Bitumen Products and Related Heavy Oils in the Marine
Environment ....................................................................................................................................................................... 15
2.2.1 Fate and Behaviour of Diluted Bitumen Products in Spills ..................................................... 15
2.2.2 Fate and Behaviour of Orimulsion in Spills ................................................................................... 17
2.2.3 Fate and Behaviour of Heavy Oils in Spills ..................................................................................... 18
2.3 Use of Dispersants on Potential Spills of Diluted Bitumen and Related Heavy Oils ............... 21
2.3.1 Use of Dispersants on a Diluted Bitumen Spill ............................................................................. 21
2.3.2 Use of Dispersants on Orimulsion ..................................................................................................... 21
2.3.3 Use of Dispersants on Heavy Fuel Oils ............................................................................................. 21
3.0 Physical Characteristics and Chemical Composition of Diluted Bitumen Products .................... 25
3.1 Samples .................................................................................................................................................................. 25
3.2 Methods .................................................................................................................................................................. 25
3.2.1 Evaporative Weathering ........................................................................................................................ 25
3.3 Characterization of Diluted Bitumen Products ...................................................................................... 26
3.4 Physical Properties of Diluted Bitumens .................................................................................................. 27
3.4.1 Properties of Diluted Bitumens .......................................................................................................... 31
3.4.2 Pan Evaporation of Diluted Bitumens .............................................................................................. 33
3.4.3 Simulated Distillation of Diluted Bitumens ................................................................................... 34
3.4.4 Tendency to form Water-in-Oil Emulsions .................................................................................... 36
3.5 Chemical Composition of Diluted Bitumens ........................................................................................... 36
4.0 Oil Weathering and Buoyancy in Marine Conditions ............................................................................... 42
4.1 Introduction.......................................................................................................................................................... 42
4.2 Materials and Methods ..................................................................................................................................... 43
4.2.1 Oil Types ....................................................................................................................................................... 43
4.2.2 Evaporation ................................................................................................................................................. 43

2
4.2.3 Photo-oxidation ......................................................................................................................................... 44
4.2.4 Oil-Water Mixtures .................................................................................................................................. 44
4.2.5 Oil-Water-Sediment Mixtures ............................................................................................................. 45
4.3 Results ..................................................................................................................................................................... 46
4.3.1 Evaporative Weathering ........................................................................................................................ 46
4.3.2 Photo-oxidative Weathering ................................................................................................................ 47
4.3.3 Mixing with Salt Water ........................................................................................................................... 48
4.3.4 Mixing with Salt Water and Sediment .............................................................................................. 50
4.4 Comparisons with Literature and Historical Spills .............................................................................. 54
5.0 Wave Tank Studies: The Fate and Behaviour of Selected Diluted Bitumen Products in Natural
Sea States and Environmental Conditions .................................................................................................................. 56
5.1 Introduction.......................................................................................................................................................... 56
5.2 Materials and Methods ..................................................................................................................................... 56
5.2.1 Wave Tank Studies ................................................................................................................................... 56
5.2.2 Oil, Dispersant and Mineral Fines Application ............................................................................. 56
5.2.3 Wave Tank In-situ Measuring Devices ............................................................................................ 57
5.2.4 Lab Analysis of Seawater Samples .................................................................................................... 57
5.3 Results and Discussion ..................................................................................................................................... 58
5.3.1 Synthetically Weathered Dilbit Products ....................................................................................... 58
5.3.2 Wave Tank Experiments ........................................................................................................................ 58
5.3.3 Surface Water Profiling .......................................................................................................................... 61
5.3.4 Subsurface Water Column and Dispersant Effectiveness ........................................................ 64
6.0 Conclusions ................................................................................................................................................................ 73
7.0 Research Initiatives ................................................................................................................................................ 76
7.1 Identified Knowledge Gaps from the Literature Review ................................................................... 76
7.2 Gaps Addressed Under This Research Initiative ................................................................................... 76
7.3 Gaps Identified from These Studies and Future Research Initiatives .......................................... 77
7.3.1 Laboratory Dilbit Fate and Behaviour Studies ............................................................................. 78
7.3.2 Meso-Scale Studies and In-situ Field Work ................................................................................... 78
8.0 References .................................................................................................................................................................. 80

3
List of Figures
Figure 1-1 Map of the Athabasca, Cold Lake and Peace River oil sands in Alberta .................................... 9
Figure 1-2 Illustration of the proposed Enbridge Northern Gateway Pipeline and tanker routes. ... 10
Figure 2-1 Simulated distillation data of oil sands products. ............................................................................ 13
Figure 2-2 The effects of regular waves, breaking waves and water temperature on dispersion of
IFO180 ........................................................................................................................................................................................ 23
Figure 3-1 Evaporative weathering of oil .................................................................................................................. 26
Figure 3-2 Density and viscosity at 0°C and 15°C as a function of evaporative weathering for AWB
and CLB ...................................................................................................................................................................................... 31
Figure 3-3 Pan evaporation results for two dilbit oils and IFO 180................................................................ 33
Figure 3-4 High temperature simulated distillation plots .................................................................................. 35
Figure 3-5 Changes to AWB, CLB Hydrocarbon Group Composition with evaporative weathering,
compared to conventional fuels ...................................................................................................................................... 37
Figure 3-6 n-Alkane distributions for AWB. ............................................................................................................. 39
Figure 3-7 Biomarker distributions for AWB. .......................................................................................................... 39
Figure 3-8 PAH distributions for AWB. ....................................................................................................................... 41
Figure 4-1 Effects of evaporative weathering changes on density as a function of temperature for
AWB and CLB samples......................................................................................................................................................... 46
Figure 4-2 Cold Lake Dilbit slick on saltwater, post-photo-oxidation. .......................................................... 48
Figure 4-3 Densities of AWB samples before and after mixing with saltwater. ........................................ 49
Figure 4-4 Mixtures of CLB and kaolin sediment in saltwater .......................................................................... 51
Figure 4-5 Mixture of the W3 fraction of AWB and kaolin sediment ............................................................. 52
Figure 4-6 Mixture of the Fresh and W2 fractions of AWB and diatomaceous earth sediment after
24 hours of settling. .............................................................................................................................................................. 53
Figure 4-7 Mixture of the Fresh and W2 fractions of CLB and sand after 24 hours of settling ........... 53
Figure 5-1 A collage of photos of wave tank studies ............................................................................................. 60
Figure 5-2 Hydrocarbon concentrations (GC-FID) in surface samples collected during the
treatment of CLB under breaking waves in the wave tank .................................................................................. 61
Figure 5-3 Saturates, aromatics, resins and asphaltenes in extracts of surface samples collected
during wave tank studies of CLB ..................................................................................................................................... 62
Figure 5-4 ƩPAH concentrations in surface samples collected during various oil spill treatments of
AWB ............................................................................................................................................................................................. 63
Figure 5-5 ƩPAH concentrations in surface samples collect during various oil spill treatments of
CLB ............................................................................................................................................................................................... 63
Figure 5-6 Cumulative particle size distributions for AWB and CLB from LISST#1 ................................ 66
Figure 5-7 Cumulative particle size distributions for CLB from LISST#2 .................................................... 67
Figure 5-8 Hydrocarbon concentrations in breaking wave conditions at three depths and the
effluent for CLB, CLB with dispersant, CLB with MF and CLB with dispersant and MF ........................... 68
Figure 5-9 Interfacial tension for mesocosm testing of CLB under various treatment conditions .... 70
Figure 5-10 Dynamic dispersion effectiveness for AWB and CLB in breaking wave conditions using
various treatment options ................................................................................................................................................. 71

4
List of Tables
Table 2-1 Selected Physical Properties and Chemical Data for Diluted Bitumen Products .................. 13
Table 2-2 Selected Physical Properties of Intermediate and Heavy Fuel Oil .............................................. 18
Table 3-1 Physical Properties of AWB ......................................................................................................................... 29
Table 3-2 Physical Properties of CLB ........................................................................................................................... 30
Table 4-1 Linear regressions for density as a function of temperature for measured oils ................... 47
Table 4-2 Physical fate and buoyancy of oil-saltwater and oil-saltwater-sediment mixtures ............. 50
Table 5-1 Wave tank experimental conditions ........................................................................................................ 59
Table 5-2 Analysis of variance comparing the effects of dispersant, mineral fines and mineral
fines/dispersant to the natural dispersion of CLB under breaking waves .................................................... 72
Table 5-3 Analysis of variance comparing the effects of dispersant, mineral fines and mineral
fines/dispersant to the natural dispersion of AWB under breaking waves .................................................. 72

5
Executive Summary
Effective spill response depends on good scientific understanding of petroleum product behaviour in the environment (e.g., movement and changes in physical properties and chemical composition of the oil). This study reports the early research simulating diluted bitumen products spilled at sea. This work was undertaken by the Government of Canada as part of the first phase of a strategy to implement a world class prevention, preparedness and response regime for oil spills from ships.
The behaviour of the diluted bitumen products was studied under laboratory conditions in three phases. First, the properties and composition of two samples representative of products currently being shipped in Canada were measured before (fresh) and after (weathered) exposure to environmental conditions. Secondly, the potential for evaporation, exposure to light, mixing with saltwater, and sediments in the saltwater to affect whether diluted bitumen products float or sink in saltwater was examined. Finally, the effectiveness of two existing spill treating agents meant to disperse spilled oil products was evaluated.
This work is a collaborative effort between the Emergencies Science and Technology Section, Environment Canada; the Centre for Offshore Oil, Gas and Energy Research, Fisheries and Oceans Canada; and CanmetENERGY, Natural Resources Canada. As well as the laboratory and wave-tank experiments, a literature review was conducted to identify knowledge gaps on the physical and chemical properties of conventional and non-conventional heavy oils, and their fate and behaviour in marine environments. The use and effectiveness of oil spill treating agents is also reviewed for heavy oils.
Two diluted bitumen products, Access Western Blend (AWB) and Cold Lake Blend (CLB), were selected for study as the highest-volume products transported by pipeline in Canada for 2012–2013. The physical characteristics and chemical composition of each product were measured to aid in potential spill preparation and response.
The major results of the studies were: Like conventional crude oil, both diluted bitumen products floated on saltwater (free of
sediment), even after evaporation and exposure to light and mixing with water; When fine sediments were suspended in the saltwater, high-energy wave action mixed
the sediments with the diluted bitumen, causing the mixture to sink or be dispersed as 1floating tarballs ;
1 The use of the term "tarball" in this report follows convention in the literature and refers to the consistency of floating, heavily-weathered oil. It does not describe the chemical composition of the product.

6
Under conditions simulating breaking waves, where chemical dispersants have proven effective with conventional crude oils, a commercial chemical dispersant (Corexit 9500) had quite limited effectiveness in dispersing dilbit;
Application of fine sediments to floating diluted bitumen was not effective in helping to disperse the products;
The two diluted bitumen products display some of the same behaviours as conventional petroleum products (i.e. fuel oils and conventional crude oils), but also significant differences, notably for the rate and extent of evaporation.
Beyond informing subsequent studies, these results will also immediately help inform spill responders and computer models to better understand and predict the fate and behaviour of these non-conventional petroleum products in the marine environment. Better understanding the potential impacts of a non-conventional oil spill on the marine ecosystem, assists decision makers in making appropriate spill response and remediation choices. This suite of scientific research and activities will advance the knowledge of non-convention petroleum products; provide a better understanding of the potential consequences of a spill of diluted bitumen petroleum product on the marine ecosystem, and information to assist in response and remediation efforts.

7
1.0 Introduction
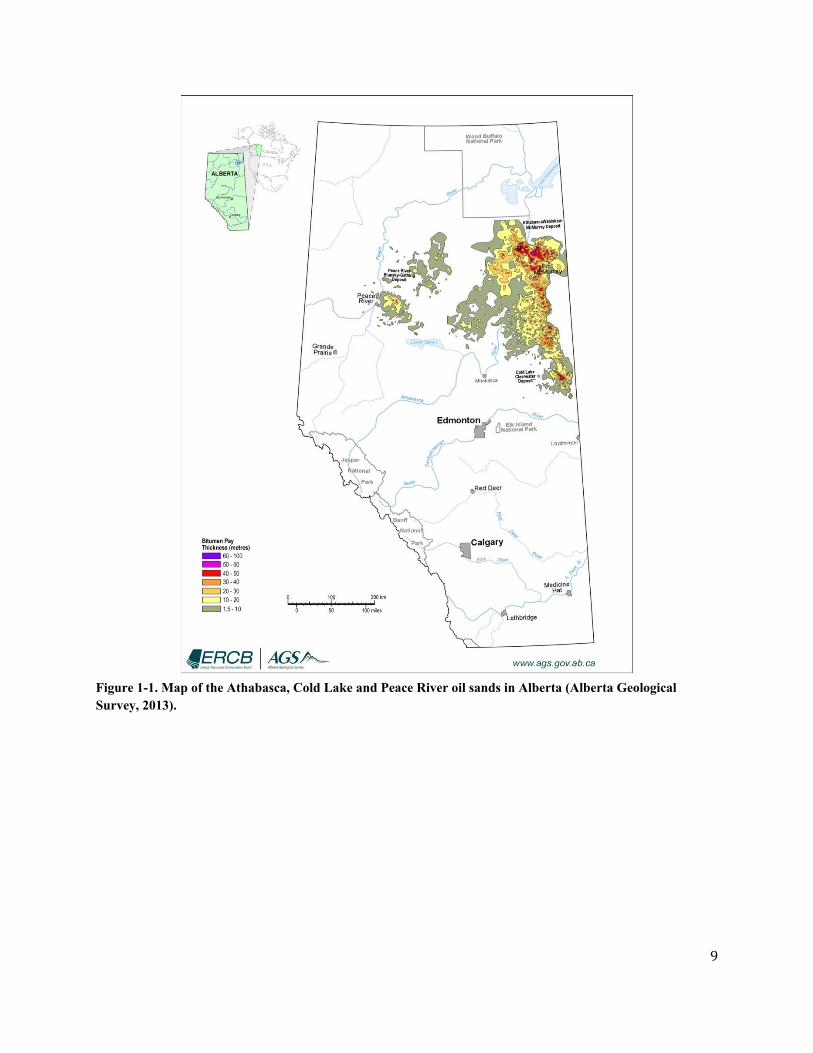
The Canadian oil sands contain the world’s third-largest oil reserves after Saudi Arabia and Venezuela (Alberta Energy, 2011). A map of the source oil sands deposits in northern Alberta can be found in Figure 1-1. Increased exports of oil sands products have been proposed by industry, involving pipeline, rail and marine tanker transport. These recent proposals include the Enbridge Northern Gateway pipeline to Kitimat, British Columbia (proposed pipeline and tanker routes shown in Figure 1-2), the Kinder Morgan Trans Mountain pipeline expansion to Burnaby, B.C., as well as pipeline projects contemplated for eastern Canada by TransCanada Corporation and Enbridge.
Bitumen is produced from the natural oil sands deposits by a number of processes, including direct mining and in-place extraction (Read and Whiteoak, 2003). The produced raw bitumen is a semi-liquid material at room temperature, and is too viscous to transport through a pipeline. In order to move it to market by pipeline, bitumen is diluted with either condensate or synthetic crude oil to form “dilbit” with viscosity, density and other properties engineered for pipeline transportation and use by the customer refineries. In many of the new projects being contemplated, diluted bitumen would be transported by pipeline to a coastal port, and then be shipped by marine tanker to foreign markets.
The potential range of behaviour, fate and treatment options for a possible marine spill of diluted bitumen products is not well understood. While some information on the physical properties and chemical compositions are available from scientific literature and industry sources, there is little information on the spill behaviour, fate, impacts and remediation options for diluted bitumen spills. The behaviour of dilbit in the marine environment, and its potential for alteration by evaporation, solar exposure, or mixing with water and sediment, are largely unknown. The conditions in which diluted bitumen products may float or sink in marine conditions have been the subject of much debate. In addition, the effectiveness of spill treating agents including dispersants and other treatments is not known.
In response to these knowledge gaps and concerns raised by these uncertainties, the Canadian federal government announced the World Class Tanker Safety System on March 18, 2013. Along with a number of tanker safety measures under this program, the Minister of Natural Resources Mr. Oliver, announced that the government will conduct scientific research on non-conventional petroleum products, such as diluted bitumen, to enhance the understanding of these substances and how they behave when spilled in the marine environment (Transport Canada, 2013).
This initiative mandates the Department of Fisheries and Oceans, Environment Canada, and Natural Resources Canada to conduct scientific research and activities on the behaviour, fate and appropriate response to possible marine spills of non-conventional petroleum products. The overall goal of this proposed research program is to characterize the chemical and physical

8
behaviour of spilled non-conventional oil products in order to provide scientific support on assessing the risks and potential impacts a spill might have on the environment and to guide responders in deploying effective response and remediation approaches. The results of this research will also help in the development of tools such as predictive models on the fate and behaviour of spilled non-conventional petroleum products in the marine environment.
The first phase of the Government of Canada’s scientific research initiative is planned to continue through 2016. However, in the interests of providing timely information in event of a spill and to guide future directions for research on marine spills of diluted bitumen, the three government departments have conducted a preliminary study on two selected diluted bitumen product blends: Access Western Blend and Cold Lake Blend. These two products, obtained from industry, were selected to represent the highest volume dilbit products transported by pipeline in Canada in 2012–13. The objectives of the present preliminary research activities are to:
Conduct a literature review of information available in the public domain about thebehaviour and treatment of diluted bitumen spills (Chapter 2);
Provide baseline data on physical characteristics and chemical composition of the two oilsands products (Chapter 3);
Conduct laboratory-scale studies on weathering and buoyancy of the products accordingto a matrix of environmental conditions which are high but of the same order ofmagnitude of measured levels in Canadian coastal environments. (Chapter 4);
Conduct meso-scale wave tank studies to determine the fate and transport of spilled dilbitproducts, and the effectiveness of the application of oil spill countermeasures, undervarious sea states in cold water conditions (Chapter 5).
Together, this suite of scientific research activities will advance the knowledge of dilutedbitumen petroleum products composition, fate and behaviour in marine environments. The data and findings of the present work will improve the preparedness and response for marine spills of non-conventional diluted bitumen products. Responders will be able to make informed decisions on the appropriate oil spill response options and strategies, including the possible use of spill treating agents.
9
Figure 1-1. Map of the Athabasca, Cold Lake and Peace River oil sands in Alberta (Alberta Geological Survey, 2013).

10
Figure 1-2. Illustration of the proposed Enbridge Northern Gateway Pipeline and tanker routes (NEB, 2012)

11
2.0 Literature Review of Diluted Bitumen and Synthetic Bitumen Spills,
Behaviour and Use of Chemical Countermeasures
A comprehensive search for relevant literature available in the public domain was conducted. The primary focus of this search was to determine what information exists on: a) the properties and composition of diluted bitumen as they relate to spill behaviour; b) information on the behaviour and fate of diluted bitumens and similar products; c) the use of chemical dispersants to treat diluted bitumen (dilbit) and synthetic crude oil-bitumen (synbit) mixtures and similar petroleum products; and d) to understand the state of knowledge about the influence of dispersants on the fate and transport of diluted bitumen products following a spill in the marine environment. Anticipating that limited information would be available on dilbit and synbit, the literature search also included non-conventional crude oils such as Orimulsion and fuel oils of a grade that might be similar to the products of particular interest.
Sources used to conduct the search were primarily from the Internet: Elsevier Scopus, Google, Google Scholar, Web of Science, JSTOR and Science Direct. The Department of Fisheries and Ocean’s “Waves” search engine, the Environment Canada Arctic and Marine Oilspill Program Technical Seminar proceedings and the website of the International Oil Spill Conference were also used.
2.1 Properties and Composition of Diluted Bitumen Products from the
Canadian Oil Sands
2.1.1 Diluted Bitumen Products
Oil sands bitumen is the oil found in a mixture of sands and clays native to the north-eastern corner of Alberta. Over a geological timeframe, the lighter, more water soluble components of the oil were biodegraded when the oil came close to the surface of the earth and so cooled enough to allow microbial activity. The remaining oil has relatively high viscosity, organic acid and sulphur content. Natural bitumen is defined as a petroleum with a gas-free viscosity greater than 10 000 cSt compared to an extra-heavy crude with viscosity <10 000 cSt at reservoir temperatures (WEC, 2010). By this definition, oil sands bitumen can be a mixture of bitumen and extra heavy oil (ERCB, 2013). Unconventional techniques are required to produce the oil, including mining, if the ore is close to the surface, or heating with steam, if the reserve is deep. As produced, bitumen does not meet transmission pipeline specifications for density and viscosity.
For transportation purposes, lighter oil called diluent is added to bitumen to decrease its viscosity and density (Crosby et al., 2013). The most commonly used diluent is naphtha-based oil called condensate that can include by-products of natural gas. Typically, dilbit consists of blends of 20% to 30% condensate and 70% to 80% bitumen (Crosby et al., 2013; Crude Quality, 2013). As an alternative to condensate, mixtures of synthetic crude oil and bitumen are also

12
blended at approximately 1:1 ratios and are known as “synbit.” Synthetic crude oil is upgraded bitumen, produced by either coking or residue hydrocracking the bitumen, followed by hydrotreating to crack the larger molecules into smaller species and remove sulphur (Crosby et al., 2013). Bitumen producers create a variety of diluted bitumen products for transport.
Information on the chemical compositions and physical properties of oil sands bitumen and the blended bitumen products is essential in order to determine their fate and behaviour if spilled in the environment. The crudemonitor.ca data portal maintained by Crude Quality Inc. (Crude Quality, 2013) has detailed analyses of selected physical bulk properties and chemical constituents of the oils shipped in pipelines from Alberta, with data covering the last five years. Table 2-1 presents the annual averages and the standard deviation in those averages measured for diluted bitumen and other related oil sands products between October 2012 and October 2013. Figure 2-1 shows the average simulated distillations for the same range of products.
A range of variability can be seen in the annual density averages of approximately 0.5% for all products. For other properties, however, including chemical compositions, larger ranges of variation can be seen in the single year averages for sulphur and sediment content, as well as the total abundance of light ends (the sum of all butanes to decanes) and in the aromatic benzene, toluene, ethylbenzene and xylenes (BTEX) abundances. As expected, those products made from condensate generally can be seen to have higher levels of light ends and BTEX compounds.
The simulated distillation curves, from Figure 2-1, indicate a moderate range of variability in the diluted bitumen products constituted from condensate (Figure 2-1(A)). Much larger differences, however, are apparent in the simulated distillation curves for products diluted with synthetic crude oil and other petroleum products (Figure 2-1(B)).
While the crudemonitor.ca data portal provides an excellent source of data to the dilbit production and transportation industries and their customers, for the purposes of potential spill planning and response, several physical and chemical parameters are not included in the datasets. Parameters important for spill planning and response include: viscosity, surface and interfacial tensions, as well as alkylated families of polycyclic aromatic hydrocarbons. In addition, it is very desirable to measure not only the fresh product as produced or in the pipeline, but also product that has been evaporated and otherwise exposed to environmental weathering processes, to better understand the evolution of a spill.

13
Table 2-1. Selected physical properties and chemical data for diluted bitumen products (Crude Quality, 2013). Name Product Density
(kg/m3) Sulphur (wt%)
Sediment (ppmw)
Light Ends*
*Light Ends compromise the sum of all butanes through decanes, inclusive.
(vol%) BTEX (vol%)
Condensate Blends Access Western Blend (AWB) 922.9 ± 4.6 3.94 ± 0.09 89 ± 8 24.1 ± 1.7 1.20 ± 0.15 Borealis Heavy Blend (BHB) 927.4 ± 5.2 3.67 ± 0.29 94 ± 27 24.1 ± 1.7 0.99 ± 0.09 Christina Dilbit Blend (CDB) 924.9 ± 5.2 3.88 ± 0.09 88 ± 41 22.8 ± 2.2 1.12 ± 0.17 Cold Lake (CL) 927.7 ± 5.0 3.78 ± 0.08 94 ± 42 20.4 ± 1.5 1.06 ± 0.17 Peace River Heavy (PH) 930.5 ± 4.7 5 ± 0.1 97 ± 30 22.4 ± 1.1 1.02 ± 0.09 Statoil Cheecham Blend (SCB) 928.8 ± 4.5 3.81 ± 0.09 169 ± 99 24.1 ± 2.3 1.06 ± 0.14 Western Canadian Select (WCS) 928.1 ± 4.3 3.50 ±0.07 284 ± 23 18.3 ± 1.3 0.83 ± 0.12
Blends Other than Condensate Borealis Heavy Blend (BHB) 927.4 ± 5.2 3.67 ± 0.29 94 ± 27 24 ± 1.7 0.99 ± 0.09 Statoil Cheecham Blend (SCB) 928.8 ± 4.5 3.81 ± 0.09 169 ± 99 24.1 ± 2.3 1.06 ± 0.13 Long Lake Heavy (PSH) 932.6 ± 3.6 3.21 ± 0.16 18 15.9 ± 1.2 0.94 ± 0.10 Statoil Cheecham Synbit (SCS) 930.5 ± 4.2 3.07 ± 0.09 71 ± 11 13.4 ± 1.3 0.76 ± 0.09 Surmont Heavy Blend (SHB) 936.1 ± 3.8 3.08 ± 0.11 101 ± 42 11.3 ± 0.9 0.59 ± 0.09 Suncor Synthetic H (OSH) 936.5 ± 2.2 3.07 ± 0.09 39 10.4 ± 1.0 0.44 ± 0.08 Albian Heavy Synthetic (AHS) 938.7 ± 3.5 2.46 ± 0.23 784 ± 229 23.3 ± 1.4 0.94 ± 0.14
Figure 2-1. Simulated distillation data of oil sands products. On Figure A (left), the distillation curves for seven types of bitumen diluted with condensate are plotted. On Figure B (right), the distillation curves for bitumen products diluted with other diluents are plotted. All data are 12-month averages from October 2012 through 2013, from the crudemonitor.ca data portal (Crude Quality, 2013).
Data sets for MacKay Heavy Bitumen/Synthetic Crude Oil and Cold Lake Bitumen/ Condensate Blends were provided by Enbridge Northern Gateway to the Northern Gateway Joint Review Panel (Belore, 2010). Detailed chemical information, including alkyl polycyclic
% Weight Off
0 20 40 60 80 100
Tem
pera
ture
(°C)
0
100
200
300
400
500
600
700
800
Access Western Blend Borealis Heavy Blend Christina Dilbit BlendCold LakePeace River HeavyStatoil Cheecham BlendWestern Canadian Select
(A)
% Weight Off
0 20 40 60 80 1000
100
200
300
400
500
600
700
800
Long Lake HeavyStatoil Cheecham SynbitSurmont Heavy BlendSuncor Synthetic HeavyAlbian Heavy Synthetic
(B)

14
aromatic hydrocarbon (PAH) data was later also provided in evidence (Stantec Consulting Ltd., 2012a). These data sets provide information on the fresh products as well as evaporated oils.
Detailed n-alkane and aromatic chemistry was reported by Yang and co-workers (Yang et al., 2011) for three oils sands bitumens and two oils sands diluted bitumens. They found that all three oil sands samples had similar compositions of n-alkanes, 2- to 5-ring alkylated PAHs, biomarker terpanes and steranes, and bicyclic sesquiterpanes. However, the composition of the diluted bitumens had been altered by blending with diluents or upgrading processing. A significant chromatographic feature of all of the oil sands products was the predominance of unresolved complex mixtures (UCM) in the chromatograms. The presence of a UCM indicates a complex mixture of hydrocarbons present in oil. This generally indicates both extensive biodegradation of the oil has occurred and that the existing hydrocarbon mixtures will be resistant to further biodegradation.
All of the bitumen samples showed evidence of prior biodegradation compared to a conventional crude oil. Normal alkanes and isoprenoid alkanes were almost completely absent in contrast to the make-up of a typical crude oil. For example, in total, the n-alkanes and isoprenoids make up 7.8% (w/w) of Alberta Sweet Mixed Blend crude oil (Environment Canada, 2006), a mid-weight crude oil. The bitumen samples also contained relatively low concentrations of 2-ring alkylated naphthalenes. The alkylated PAH compounds in all samples showed increasing distribution profile of C0- < C1- < C2- < C3- < C4-, another marker of preferential biodegradation. In comparison, a typical crude oil has a “bell shaped” alkylated PAH distribution for each family of alkylated homologues. A typical distribution profile for a crude oil of fuel would be expected to have relative abundances for each alkyl PAH homologous family similar to C0- < C1- < C2- ≈ C3- > C4-.
All samples of bitumen and diluted bitumen reported by Yang and coworkers (Yang, et al., 2011) were shown to have abundant quantities of biomarker terpanes and bicyclic sesquiterpanes. These distinctive biomarker compositions indicate that they were generated from the same or very similar sources. Diamondoids were also found in significant abundance in samples of Alberta oil sands products. These biomarkers are all less susceptible to biodegradation than the PAH and n-alkane components and so may be useful oil forensic targets for environmental monitoring during spills, or during fate and behaviour experiments, including evaporation, dissolution and biodegradation studies.

15
2.2 Fate and Behaviour of Diluted Bitumen Products and Related Heavy Oils
in the Marine Environment
2.2.1 Fate and Behaviour of Diluted Bitumen Products in Spills
A diluted bitumen blend spill occurred in 2007 from a pipeline operated by Kinder Morgan into Burrard Inlet, Burnaby, B.C. (TSB, 2007). The product spilled was Albian Heavy, a blend of synthetic crude oil and heavier oil sands product. Approximately 224 cubic metres of oil were released, with 210 cubic metres being recovered (TSB, 2007). Oil escaped under pressure from a pipeline rupture. Spilled oil migrated through the sewer system into Burrard Inlet where it began to spread on the water. Approximately 15 000 m of shoreline were affected by the spill.
An assessment of the spill clean-up and environmental impacts was commissioned by Kinder Morgan five years after the spill (Stantec Consulting Ltd., 2012b). The report of that assessment indicated that spill response operations were effective at removing oil from the environment and in limiting the short- and long-term effects of the spill. Oil was recovered by skimming and booming, as well as by flushing and removal from the affected shorelines.
Though shoreline intertidal zones were oiled, most marine sediments had only a small increase in measured PAH concentrations, with 20 of 78 monitored sites exceeding water quality guidelines (Stantec Consulting Ltd., 2012b). Levels of extractable hydrocarbons and PAHs for surface water quality requirements were met in 2007. Subtidal marine sediments were monitored through 2011, with most samples having levels of PAHs below the water quality requirements. Those subtidal sediment samples that did exceed the maximum regulated PAH levels appeared to be caused by sources other than the spill. Based on these observations, only trace amounts or less of oil from the 2007 spill appear to have remained in the marine harbour sediments.
A spill of dilbit occurred in 2010 from an Enbridge pipeline into the Talmadge Creek and 3Kalamazoo River, near Marshall, Michigan. An estimated 843 000 gallons (3190 m ) were
released into the creek and river in flood conditions. Heavy rains caused the river to overtop existing dams and carried oil about 40 miles downstream on the Kalamazoo River. As of May 2013, the United States Environmental Protection Agency (EPA) estimated that 180 000 ±
3100 000 gallons (680 ± 380 m ) of oil remained in the river as submerged oil (EPA, 2013).
An EPA report (Lee et al., 2012) shows epifluorescence micrographs of submerged oil particles in the Kalamazoo River. Lee and co-workers found that oil-sediment aggregates readily formed from native river sediments and the source diluted bitumen oils. These aggregates were stable over a 48-hour observation period. Oil-sediment aggregates similar to those made in the laboratory were also found in the river sediments, though at low concentration, presumed by the authors to be caused by the sediment agitation techniques being used for clean-up. These existing oil-sediment aggregates would have been approximately two years old at the time of the observations, indicating that dilbit can form stable aggregates with river sediments.

16
A third spill of Wabasca Heavy, a heavy oil/bitumen blended with condensate, occurred in 2013 near Mayflower, Arkansas, from an ExxonMobil pipeline into Lake Conway. As of this writing, there is no reported study of the oil fate for this spill.
SL Ross Environmental Research Ltd. (SL Ross, 2013) submitted a report on meso-scale weathering of Cold Lake Blend (CLB) diluted bitumen as evidence to the Enbridge Northern Gateway Joint Review Panel. In this report, the authors examined the behaviour of CLB, with a primary interest to “investigate the density change of the diluted bitumen product” as it weathered in the test tank for up to 15 days. The oil was recirculated in a “racetrack” style flume, while being exposed to shear mixing by passing through a water cascade once per cycle around the flume. A flow of air was also maintained above the water surface to simulate wind. Two test cycles were performed, one for 120 hours, the other for over 300 hours. The first test was conducted with limited light exposure; for the second, approximately one-quarter of each cycle in the flume was exposed to high intensity ultraviolet (UV) lamps. Both tests were conducted in fresh water at 15°C.
In both trials, the CLB oil rapidly formed a water-in-oil mixture. Without UV exposure, the oil/water mixture reached a maximum density of 0.995 g/mL with a water content initially rising to 39% (v/v) but falling to 25% by the end of the test. In the second trial, with UV exposure, the oil/water mixture density rose from the initial 0.945 g/mL to a maximum of 0.998 g/mL in 96 hours. Again, water content rose to a maximum of 34% within the first 24 hour period, but fell back to under 20% as the test proceeded. Viscosity of the oils in both tests increased continuously with time, reaching maxima of 200 000 mPa•s after 120 hours and over 1 000 000 mPa•s after 311 hours for the first and second tests, respectively.
The authors (SL Ross, 2013) remark that, at the water cascade, oil was observed to be shearing into small droplets (1–4 mm diameter). The oil mixed down into the water for a short time but quickly resurfaced to re-form a surface slick. As both tests proceeded and the oil viscosities increased, the oil droplet size at the weir was increased. In the test with UV exposure, after 48 hours small oil droplets were seen in the water column, with the water becoming cloudier with time. The authors concluded that this indicated a natural dispersion of oil droplets, which they estimated to be 30 to 70 µm in diameter by analysis of photographs. The authors also remark that this dispersion was not seen in the first, non-UV exposed test.
At the end of each test, oil was collected from the tank surface and the tank walls. Most of the oil was recovered from the tank surface, the remainder being 15% of the oil recovered from the tank walls deeper than 10 cm below the water surface. The authors attribute this to adhesion of neutrally buoyant drops in the water column to the walls of the tank. Though not stated in their discussion, this implies that at least 15% of the CLB dispersed into the water column over the course of their trials. The authors also note that no oil was found on the bottom of the tank.

17
2.2.2 Fate and Behaviour of Orimulsion in Spills
Orimulsion is a product manufactured until recently in Venezuela from Orinoco bitumen. Orimulsion consists of approximately 70% bitumen, 30% fresh water and a small amount of surfactant (<0.2%) to keep the bitumen in suspension during transport (Miller et al., 2001). Like dilbits and synbits, Orimulsion originates as extra heavy oil (bitumen). However, the Orimulsion is a bitumen-water emulsion that is stabilized with additives; the bitumen components can settle out of the mixture when left undisturbed (Jokuty et al., 1999). Analysis of two Orimulsion products (Wang and Fingas, 1996) can be found in the Environment Canada Oil Properties database (Environment Canada, 2006).
As Orimulsion was made from a similar bitumen resource to that used to blend dilbit, a review of Orimulsion fate and behaviour studies was conducted to draw any information from the similarity in composition of the source bitumen, while keeping in mind the large differences in diluents used for both.
In seawater, Orimulsion forms a cloud of dispersed bitumen droplets, and a dissolved PAH and surfactants aqueous phase, which quickly mixes into the receiving water body. The bitumen droplets chemically resemble a lightly weathered heavy fuel (Jokuty et al., 1999). Studies have shown that Orimulsion will float in salt water and sink in freshwater; however, behaviour in brackish water is more complex and depends on salinity, time, energy and temperature (Fingas et al., 2003; Fingas et al., 2005).
Orimulsion interactions with suspended sediments in water appear to be enhanced by high salinity, sediment surface area and high organic carbon content (Brown et al., 1995). Interestingly, Brown et al. (1995) report that the adhesion of heavy fuel oil (HFO) to the same sediments was negligible compared with Orimulsion, with the HFO taking up much less of the sediment (by mass) compared with the dispersed bitumen. In mid-range to high seawater salinity, dispersed Orimulsion bitumen formed aggregates with sediments that sank easily. In high mixing energy studies, in seawater over 10% of the bitumen sank with 45 mg/L loads of suspended kaolinite (Stout, 1999). However, in fresh water, agglomeration and sinking were not observed, presumed by both authors to be caused by the action of the surfactant.
When stranded on shorelines, experiments showed (Harper and Kory, 1997) that, when fresh, Orimulsion behaves like a heavy oil (see Section 2.2.3 below) and readily penetrates into shoreline sediments. However, the authors reported that when weathered and/or dried, Orimulsion is “stickier” than fresh Orimulsion and will not penetrate beach sediments as easily. As it dries, Orimulsion forms a weathered bitumen coating on the surface of grains or pebble that is difficult to remobilize. These coatings can form quickly to depths of 4 cm in sand, 6–7 cm in granules and 7–8 cm in pebbles.

18
When fresh, dispersed bitumen particles were found to be more mobile within coarse-grained beach substrate than a typical heavy fuel oil. Dispersed bitumen could be flushed from sediments, but normal tidal flushing was found to be unlikely to remove it completely.
Additional studies were undertaken to evaluate bitumen adhesion and removal from the surface of rocks (Harper and Ward, 2003). It was found that wetting the surface of rocks was the important control mechanism of bitumen adhesion. Wetting of the rocks allowed for relatively easy removal of coalesced bitumen from the rock surface. Naturally occurring biofilms found in the lower and mid-intertidal zones were also shown to reduce bitumen retention.
2.2.3 Fate and Behaviour of Heavy Oils in Spills
The possible fate and behaviour of diluted bitumen when spilled have been compared to those of lighter fuel oils in the early part of a spill, changing to heavier fuel oils as weathering occurs (ENG, 2011). The literature on intermediate and heavy fuel oils similar in density and viscosity to diluted bitumen products was therefore included in the present survey of the literature.
The heavy oils considered at greatest risk for sinking are typically heavy fuel oils, sometimes referred to as Bunker C and Fuel Oil No. 6. Detailed analyses of several of these products can be found in the Environment Canada Oil Properties database (Environment Canada, 2006).
Selected physical properties and chemical characteristics of representative intermediate and heavy fuel oils are presented in Table 2-2, taken from the Environment Canada database.
Table 2-2. Selected physical properties of Intermediate and Heavy Fuel Oil IFO 180 HFO 6303
Pour Point (°C) 15 -1 Density (g/mL) 0°C 0.9794 1.0015
15°C 0.9664 0.9888 API Gravity 12.9 11.5 Dynamic Viscosity (mPa•s) 0°C 12400 241000
15°C 1920 22800 Emulsion Formation Stability Class Entrained Entrained Tendency and Stability Complex Modulus (Pa) 144 752
Water Content (% w/w) 42 57.7 Chemical Dispersability (SFT using Corexit 9500) <10% <10% Saturates (%w/w) 49 42.5 Aromatics (%w/w) 32 29.0 Resins (%w/w) 15 15.5 Asphaltenes (%w/w) 4 13.0 Waxes (%w/w) 20 2.5

19
Michel (2010) recently reviewed the literature for heavy oils at risk of sinking in aquatic settings. The author also reviewed historical case studies when oil has been observed to sink. Michel notes that oils typically follow two paths to sinking, for oils less dense than water and for oils denser than water.
If the oil is less dense than water, then the oil will initially float, and will likely only begin to sink if it is mixed with a heavier material such as sediment. The author notes that sediment mixing can typically occur by two mechanisms: 1) stranding on a shore and mixing with sandy sediments; and 2) by mixing with sediments in the water column by wave action, away from shore. Michel notes that the oil can either take up just enough sediment to become neutrally buoyant in the water, and thus be transported by water currents, or be dense enough to sink directly to the water bottom. Finally, the author notes that oil has been observed to shed sediment over time, resulting in refloatation of the oil.
If the oil is more dense than water, then the oil will not float. In freshwater, these oils have a density greater than 1.0 g/mL (or API gravity less than 10); in seawater at 35 parts-per-thousand the oil density must exceed 1.035 g/mL (an API gravity of less than 6). The author (Michel, 2010) notes that evaporation alone has been seen to be sufficient to cause sinking of oils that are already close to the density of water, to switch from the first sinking pathway to the second pathway.
The author also conducted a survey of spills of heavy oil which were reported to involve sunken oil. Several common characteristics were found in the 26 incidents reviewed:
Of the spills where oil was denser then the receiving water and sank upon release, in all cases these were heavy refined products or coal tar. Five were of “slurry oil” or heavy cycle gas oil.
The only crude oils reported to have sunk were heavy crudes from Venezuela. All sank only after the crude oil mixed with sediment from landing on beaches.
Fifteen of the 26 incidents involved heavy fuel oils, sometimes referred to as Bunker C or Fuel No. 6. Many of these were initially buoyant but sank after sediment mixing.
A few incidents involved unique or rarely shipped products including asphalt stock, carbon black feed stock and coal tar oil.
The author remarked that there were no examples in the literature of an intermediate fuel oil that had been observed to sink.
In a monograph compiled by the United States National Research Council (NRC, 1999), five major mechanisms for heavy oil sinking were proposed: evaporation; temperature variations with the day/night cycle causing cyclic sinking and refloating; uptake of solid matter, sand and similar granular material; photo-oxidation; and water uptake.

20
Long-term fates of fuel oil spills have been examined extensively in the cases of the Arrow (Owens, 2010) and the Prestige (Diez et al., 2007) spills. Additionally, the persistence of oils on shorelines, including several cases involving heavy fuels, was reviewed by Owens (2008).
3The wreck of the Arrow spilled an estimated 55000 barrels (8700 m ) of Bunker C fuel, equivalent to the HFO described earlier, along 300 km of shoreline. The effects and clean-up of the spill were extensively studied with follow-up for 30 years. The majority of the studies were unpublished, but are summarized and reviewed by Owens (2010).
Long-term persistence of the Arrow oil occurred by penetration and burial into rocky and cobble beaches primarily above the tidal zone. Following an initial period of removal and attenuation, oil chemistry was not found to change after being sheltered in the coarse sediment and cobble.
Following clean-up, much residue was left on the beaches as a band of oiled cobble. However, in the three years following, it was found that 75% of the oiled cobble shorelines had eroded even in areas of low wave and tidal action. The formation of an oil-water-clay emulsion made the oil bioavailable and removable by the surf. Twenty years following the spill, less than 13 km of oiled shoreline remained, much of the affected shores having been cleaned by this natural process. Oiled cobble was continuing to be slowly eroded by surf, being removed as it was slowly exposed.
Owens (2008) identifies six conditions for long-term persistence of oil on shorelines: (i) heavy or highly-weathered oil types; (ii) large volumes of stranded oil; (iii) coarse-grained surface sediments with a penetration-limiting layer below; (iv) deposition above normal wave action; (v) penetration or burial to a depth below the layer of mobile sediments; and (vi) non-eroding shorelines. Under these conditions, oil can persist buried in the sediment, sequestered in coarse sediments, or form a weathered and degraded asphalt pavement above the tidal zone.
In the case of the Prestige spill in 2002, the fate of the heavy fuel oil at sea and on land was examined (Diez et al., 2007). Evaporation of the oil was found to be a slow, “steady depletion” over the course of a year. Oil on beaches and rocky shores degraded more quickly than in open seawater, thought by the authors to be caused by a combination of higher temperatures on shore and enhanced biodegradation by beach organisms. Dissolution was found to account for a net loss of less than 2% of the total oil, but removed up to 30% of the more soluble PAH species. Over the first year of the spill history, the authors found that biodegradation accounted for a minor part of the oil weathering. Similarly, changes to the oil chemistry by photo-oxidation were “not significant at sea” during the year following the spill. The authors conclude that for the first year following the spill, the heavy fuel oil was highly persistent, with “very low incidence of the natural weathering process.”

21
Recently, highly degraded tarballs on the west coast of Spain have been linked to the wreck of the Prestige (Bernabeu et al., 2013), a decade after the event. The authors conclude, based on the chemical signatures of degradation, that the tarballs likely originate from removal of older oil deposited in subtidal sediments. That is, the tarballs originated in sunken oil that has become free of ocean sediment and refloated as large balls and patties.
2.3 Use of Dispersants on Potential Spills of Diluted Bitumen and Related
Heavy Oils
2.3.1 Use of Dispersants on a Diluted Bitumen Spill
Very few studies have been conducted on the use of chemical dispersants on dilbit, synbit or condensates, and there is no record of chemical oil dispersant being used on an actual dilbit or synbit spill in the ocean. The efficacy of chemical dispersants when used on a surface diluted bitumen slick is largely unknown. In addition, the chemical composition of dilbit can differ depending on the bitumen that is used, and the solvent that is used to dilute it (Crude Quality, 2013); therefore, selection of an ideal dispersant to treat a diluted bitumen spill may prove challenging. In the absence of data specific to dilbit and synbit, the application of dispersants to spills of some conventional hydrocarbon products such as heavy fuel oils (which are characterized by a high proportion of relatively heavy asphaltenes) may in part be comparable.
2.3.2 Use of Dispersants on Orimulsion
The use of chemical dispersants on spills of Orimulsion is not well studied; however, research has shown that Orimulsion will disperse naturally in freshwater. In seawater, following initial dispersion, a certain amount of coalescence of the bitumen droplets will occur, eventually forming a surface slick (Ostazeski et al., 1997). Flume studies with seawater demonstrated that the coalescence of the bitumen occurs rapidly, and bitumen droplets were observed to increase in size from a mean droplet diameter of 120 µm to 140 µm after 8 hours (Ostazeski et al., 1997). Coalescence of oil following dispersant application would suggest that the dispersant product was ineffective in the dispersion of Orimulsion. The applicability of these results to the use of dispersants on spills of dilbit is unclear, based on the vastly different formulations of the two products.
2.3.3 Use of Dispersants on Heavy Fuel Oils
A recent review by Chapman and co-authors (Chapman et al., 2007) examined the use of dispersants on high viscosity oils similar in density and viscosity to diluted bitumen. The authors note that, “as a general rule of thumb, oils with high viscosities and pour points tend to be much less dispersible as delivery of the surfactant to the oil-water interface becomes more difficult.” In reviewing a case study of the Natuna Sea spill of crude oil, they note that when the crude oil viscosity exceeded 50 000 mPa, by reduced temperature and environmental weathering,

22
dispersant use ceased to be effective. Chapman et al. (2007) do note effective uses of dispersant on higher viscosity fuels, including IFO 380, but only in the warm water conditions of the Helicom spill. Chapman et al. (2007), also remark that high asphaltene and wax contents tend to further reduce dispersant effectiveness.
The Centre for Offshore Oil, Gas and Energy Research has conducted wave tank oil spill dispersion experiments on unweathered intermediate fuel oil, IFO 180 (Li et al., 2010). Figure 2-2 shows that IFO 180 is considerably more difficult to disperse. Looking more closely at Figure 2-2, IFO 180 seems to have been dispersible in breaking waves when the temperature was >15°C, but showed very low dispersibility in non-breaking waves or temperatures below 10°C (Li et al., 2010). In the study of Li et al. (2010), analysis of covariance indicates the wave type and temperature significantly affected (p<0.05) the dynamic dispersant effectiveness. Similar results for the dispersibility of IFO 180 have been found in field trials conducted by Colcomb et al. (2005), where chemical dispersants were shown to be effective at a surface temperature of 15°C and with winds of 7–14 knots. Small-scale laboratory dispersant experiments (Clark et al., 2005) further corroborate these reports by showing that IFO 180 is dispersible with chemical oil dispersant, provided that a high level of mixing energy is present. The literature on IFO 180 suggests promising dispersibility characteristics for these two conventional oils; however, the comparability of the IFO products and typical dilbits is complicated by their differing chemistries. As described earlier, dilbit has been compared to much heavier conventional oils such as IFO 380, Bunker C or No. 6 Fuel Oil, which are all considerably heavier than IFO 180. These fuels have API gravities in the range of 11.4–14.1 (Environment Canada, 2006). Lunel and Davies (2001) and Chapman et al. (2007) suggest that chemical oil dispersants are not a particularly effective treatment option for spills of heavy bunker oil or IFO 380. However, Lunel and Davies (2001) also explain that under favourable conditions, some varieties of IFO 380 are dispersible with dispersant products such as Corexit 9500, Dasic Slickgone LTSW, Inipol 90 or Superdispersant 25. The in-situ viscosity of the oil is the primary factor that dictates how dispersible an IFO 380 product will be. All other considerations aside, in ocean temperatures below 10°C or in cases where the oil has formed a highly viscous oil-water emulsion, chemical oil dispersants are not likely to be effective (Lunel and Davies, 2001). In addition, sea state can have both a positive and a negative impact on the dispersability of IFO 380.

23
Figure 2-2. The effects of regular waves (panels A, C and E), breaking waves (panels B, D and F) and water temperature (numbers in the legend) on dispersed IFO180 oil concentration (1 mg/L = 1 ppm) in the middle of the water column and 10 m downstream from the initial oil slick using two chemical oil dispersants. R = regular, B = breaking. Figure taken from Li et al., 2010.
Although an abundance of wave energy will help with the physical mixing and dispersion of the oil, it is also likely to accelerate the production of oil-water emulsion, ultimately decreasing the effectiveness of chemical oil dispersants (Lunel and Davies, 2001). In situations of high wave energy, the window of opportunity for use of chemical oil dispersants is likely to be narrow, i.e., the timeframe during which the countermeasure is effective (Lunel and Davies, 2001).
In small-scale laboratory testing, Stevens and Roberts (2003) and Clark et al. (2005) have also found that given the right conditions, chemical oil dispersants can be effective on IFO 380,

24
albeit at a lower dispersion efficiency than would be achieved with lighter crude oils. Using the Warren Spring Laboratory Test, Stevens and Roberts (2003) found that seven of the nine IFO 380 oils they tested could be dispersed at 15°C using a dispersant-to-oil ratio (DOR) of 1:25. Corexit 9500 and Slickgone EW were the most effective dispersants used in their tests. Similarly, Clark et al. (2005) showed that IFO 380 did disperse in the Baffled Flask Test, Exxon Dispersant Effectiveness Test and the Warren Spring Laboratory Test, but did not disperse as well using the low energy Swirling Flask Test. In these tests, Corexit 9500 and Superdispersant 25 proved to be most effective. Expanding further on their results, Clark et al. (2005) suggest that mixing energy was the most predominant factor in determining dispersion efficiency, and that decreasing the DOR from 1:50 to 1:25 made a bigger difference to IFO 380 than to a relatively lighter oil, IFO 180.
Larger-scale field trials conducted by Colcomb et al. (2005) to examine the dispersion of IFO 380 also showed mixed results. In their study, IFO 380 was both slow to disperse, and ultimately only partially dispersible in sea temperatures of 15°C and with wind speeds between 7 and 14 knots (Colcomb et al., 2005). These experiments support the findings of Clark et al. (2005) in that more wind (higher wave energy) resulted in better dispersion, and that a DOR of 1:25 proved to be more effective than a DOR of 1:50 when attempting to disperse IFO 380. The results of these field tests were later replicated and confirmed at the OHMSETT facility in New Jersey (Trudel, Belore, Guarino, Lewis, and Mullin, 2005), but unfortunately, neither Colcomb et al. (2005) nor Trudel et al. (2005) investigated the potentially competing influence of wave energy on the dispersion of IFO 380 that was identified by Lunel and Davies (2001).

25
3.0 Physical Characteristics and Chemical Composition of Diluted
Bitumen Products
3.1 Samples
In consultation with industry stakeholders, two diluted bitumen products were selected for study on the basis of production and transportation volume: Access Western Blend (AWB) and Cold Lake Blend (CLB). As these products were collected in mid-winter, they contained the maximum content of diluent needed to meet viscosity requirements for transmission pipeline transportation (Crude Quality, 2013).
For comparison, an intermediate fuel oil, IFO 180, used for marine ship fuel, and a mid-to-light reference crude oil, Alberta Sweet Mix Blend, reference pour #5, were also included in some tests.
3.2 Methods
3.2.1 Evaporative Weathering
For most of the measurements reported in this section and for the buoyancy tests reported in Chapter 4, environmental weathering was simulated by rotary evaporation. The oil weathering system consists of a Buchi R220 rotary evaporator with a flask rotation speed of 135 revolutions per minute (rpm) and a positive air flow of 13 L/min (Figure 3-1). The samples are held at 80C. At set intervals, the sample flask is removed and weighed to monitor mass loss. The system has been demonstrated (Fieldhouse et al., 2010) to result in chemical compositions identical to those obtained from evaporation from an open pan for the same total loss of oil mass. That is, composition of oil evaporated in the rotary evaporator is identical chemically to oil evaporating in an uncontrolled pool at ambient temperature and pressure.
Typically, three weathered fractions were prepared for each oil sample. The initial weathering period was 48 hours, the duration chosen to simulate a heavily-weathered state of an oil in the environment. In addition, intermediate fractions of approximately one- and two-thirds of the 48-hour loss by weight were prepared. These were designated as W1, W2 and W3 to represent increasing degrees of weathering (Hollebone, 2010). For the present work, an additional highly weathered fraction, W4, was also prepared at 96 hours’ evaporation at 80C.
For the wave tank studies reported in Chapter 5, the AWB and CLB were artificially weathered 8.8 and 6.2%, respectively. This technique of weathering oil is consistent with the treatment of conventional oil prior to oil dispersion studies in the wave tank (Li et al., 2008).

26
Figure 3-1. Evaporative weathering of oil. (Photo: B. Fieldhouse, Environment Canada)
3.3 Characterization of Diluted Bitumen Products
The physical properties of fresh and weathered dilbits were measured including viscosity (ThermoHaake VT550: Hollebone, 2010, and Brookfield LVT), density by ASTM D5002 (Anton Parr DMA 5000, Mettler Toledo DM45) and surface tension (using a KSV CAM 200 by the pendant/buoyant drop method: Cheng et al., 1990 and using a Krüss K11, by Wilhelmy plate method: Drelich et al., 2002). API gravity was determined from the density measurements by interpolation (Hollebone, 2010). Sulphur content was measured by X-ray fluorescence following ASTM D4294. Pour point was measured according to ASTM D97.
The rate of oil evaporation from an open pan was determined following Fingas (Fingas, 2004). The boiling point fractions of the dilbits were determined by high temperature simulated distillation (ASTM D7169). The hydrocarbon families of saturates, aromatics, resins and asphaltenes (“SARA” groups) were quantified by a combined GC-FID and solvent precipitation method (Hollebone et al., 2003), which is based on ASTM D2007, Appendix X1.
Oil-water mixtures were prepared using a rotary end-over-end mixing of a 1:20 ratio of oil-to-water at a rate of several revolutions per minute for 12 hours at 15ºC. This procedure has been shown to provide a high-energy mixing environment, with sufficient mixing time to ensure

27
that if a mixed water-oil state is possible, it will likely be reached during the test (Fingas and Fieldhouse, 2006). If a continuous oil-water phase is formed, the visco-elasticity and water contents are determined immediately after the mixing, followed by a second measurement seven days later.
The distributions of n-alkanes, PAHs and alky-PAH homologs and petroleum biomarker hopanes and steranes were characterized by gas chromatography coupled with mass spectrometry (Wang et al., 1994).
Unless otherwise noted in the text, all determinations for physical properties and chemical composition measurements were conducted in triplicate. Uncertainties are not shown on the tables below, but the error bars that appear on figures in Chapters 3 and 4 were determined from the standard deviation of the triplicate measurements.
Where applicable, measurement temperatures used were 0°C and 15°C. This range covers most of the marine temperatures experienced in Canadian waters. On the Atlantic coast, monthly average surface water temperatures range from 0°C to 5°C north of Newfoundland to 0°C to 15°C in the Bay of Fundy (DFO, 2013a). In the Gulf of St. Lawrence, seasonal surface temperatures range from 0°C to 17°C (Galbraith, et al., 2012). On the Pacific coast, a similar range of surface sea temperatures are experienced from 5°C to 15°C in the Salish Sea to 5°C to 10°C in Hecate Strait (DFO, 2013b). For the behaviour and fate testing, including pan evaporation, emulsion formation in the present chapter and the sediment interactions reported in Chapter 4, 15°C was chosen as the working temperature. This not only is a representative temperature for warm Canadian ocean waters, but also provides comparability with previous work on evaporation (Fingas, 2004), emulsion formation (Fingas and Fieldhouse, 2006) and behaviour studies (SL Ross, 2013).
3.4 Physical Properties of Diluted Bitumens
The measured physical characteristics and bulk properties for AWB and CLB diluted bitumen can be found in Table 3-1 and Table 3-2, respectively. The properties listed in these tables are among those most relevant to understanding and predicting the behaviour of oils when spilled. Density, viscosity and surface/interfacial tensions are considered among the most significant factors in understanding the behaviour of oil. Density governs the buoyancy of oil in water; viscosity, its rate of spreading and resistance to being dispersed into droplets; surface and interfacial tensions are important at smaller scales, governing the size of dispersed oil droplets, and the final thickness of a spreading oil film. API (American Petroleum Institute) gravity is a petroleum industry standard for describing the density of oil at 60°F (15.6°C) relative to that of water. Pour point is a measure of viscosity that defines the minimum temperature at which oil will flow. Flash point is the minimum temperature at which enough volatile chemicals evaporate to support ignition. Water and sulphur contents describe the percent concentration, by weight, of

28
water and elemental sulphur in the oil. Water is typically dispersed in the oil in droplets; sulphur is bound in a range of chemical forms from inorganic sulphides to organic sulphur compounds.
The tendency for emulsification, the formation of a water-in-oil colloid, is also a very useful test to interpret oil or petroleum behaviour in the environment. As described in section 3.3, following a 12-hour period of shaking, an oil-water mixture is assessed for emulsion formation. Measurements are made of the rheology of the oil, including the complex modulus, the resistance of the oil-water mixture to flow under dynamic (pulsed) stress. This quantity is a combination of both normal viscosity and elastic (reversible) deformation. Water content, as described above, is also measured. Measurements are taken both within 24 hours following mixing and again seven days later to assess the stability of any colloids formed.
Based on these measurements, an oil-water mixture is classified into one of four states (Fingas and Fieldhouse, 2006): a stable emulsion, which can persist indefinitely; a meso-stable emulsion, which typically has a short half-life of hours to days; and an entrained-water state, which is typically lower-water content and complex modulus than the chemically-stabilized emulsions, but which still retains water for periods of days to weeks. The last category is the no-emulsion state, where oil and water remain apart. In the no-emulsion state, the viscosity of the oil is typically unchanged and the water content of the oil phase is minimal, following mixing.

29
Table 3-1. Physical properties of AWB. Degree of Evaporation (Mass Loss w/w%)
Fresh (0%)
W1 (8.5%)
W2 (16.9%)
W3 (25.3%)
W4 (26.5%)
Sulphur Content (% w/w) 3.0 4.1 4.5 4.9 4.8 Water Content (% w/w) 1.5 0.9 0.2 0.0 0.0 Flash Point (°C) < -5 < -5 29 159 173 Pour Point (°C) < -25 < -25 -6 24 33 Density (g/mL) 0°C 0.9399 0.9646 0.9949 1.0214 1.0211
15°C 0.9253 0.9531 0.9846 1.0127 1.0140 20°C 0.9148 0.9547*
*Measured at 8.8% evaporated via sparging.
API Gravity 20.9 16.6 12.0 8.2 8.0 Dynamic Viscosity 0°C 1.30E+03 9.82E+03 2.04E+05 9.35E+07 >1.00E+08 (mPa•s) 15°C 347 1.72E+03 2.97E+04 2.52E+05 7.91E+06
40°C 59.8 348* Emulsion Formation Stability Class Entrained Entrained Entrained Entrained DNF Tendency and Stability Complex Modulus
(Pa) 44.6 89.7 467 1.26E+04 N/A
Water Content (%w/w) 40 35 33 6 N/A
Surface Tension 0°C 31.2 31.9 NM NM NM (Air/Oil, mN/m) 15°C 30.2 31.1 31.2 NM NM
20°C 27.5 Interfacial Tension 0°C 24.8 NM NM NM NM
(Oil/Water, mN/m) 15°C 24.2 28.0 NM NM NM Interfacial Tension 0°C 25.0 NM NM NM NM
(Oil/33‰ Brine, mN/m) 15°C 23.8 26.0 NM NM NM
NM – Not Measurable, too viscous; DNF – Did not Form, too viscous; N/A – Not applicable;
30
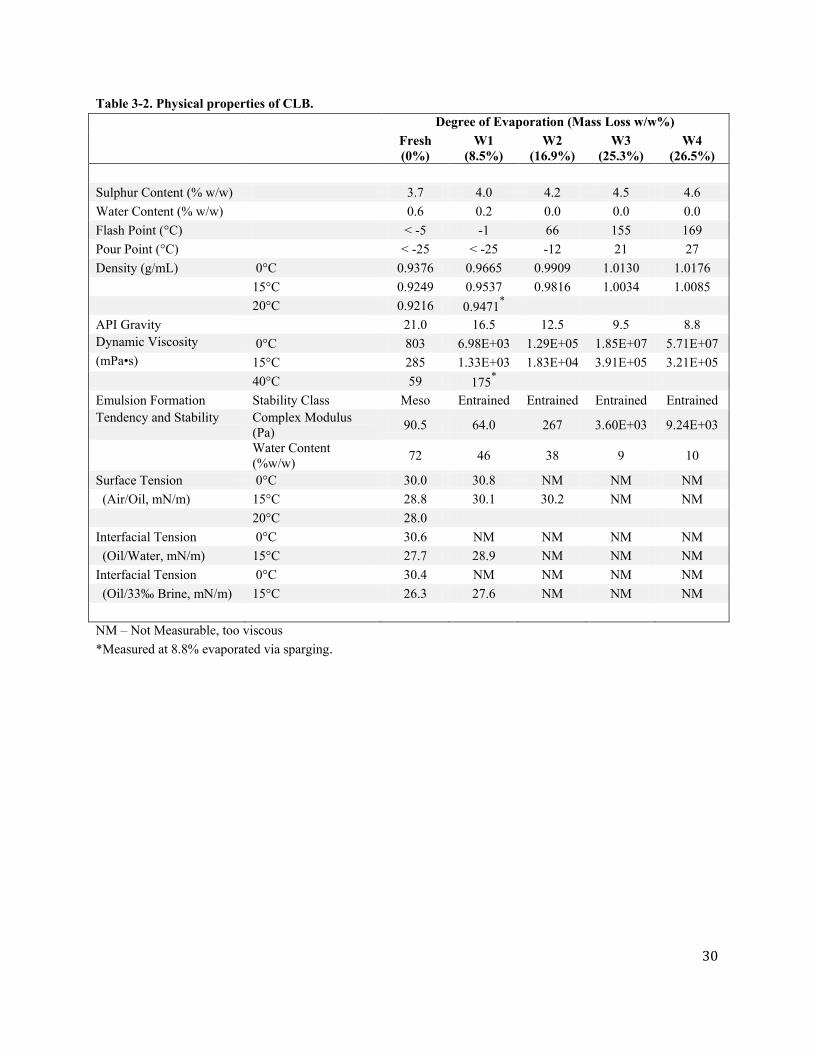
Table 3-2. Physical properties of CLB. Degree of Evaporation (Mass Loss w/w%)
Fresh (0%)
W1 (8.5%)
W2 (16.9%)
W3 (25.3%)
W4 (26.5%)
Sulphur Content (% w/w) 3.7 4.0 4.2 4.5 4.6 Water Content (% w/w) 0.6 0.2 0.0 0.0 0.0 Flash Point (°C) < -5 -1 66 155 169 Pour Point (°C) < -25 < -25 -12 21 27 Density (g/mL) 0°C 0.9376 0.9665 0.9909 1.0130 1.0176
15°C 0.9249 0.9537 0.9816 1.0034 1.0085 20°C 0.9216 0.9471*
*Measured at 8.8% evaporated via sparging.
API Gravity 21.0 16.5 12.5 9.5 8.8 Dynamic Viscosity 0°C 803 6.98E+03 1.29E+05 1.85E+07 5.71E+07 (mPa•s) 15°C 285 1.33E+03 1.83E+04 3.91E+05 3.21E+05
40°C 59 175* Emulsion Formation Stability Class Meso Entrained Entrained Entrained Entrained Tendency and Stability Complex Modulus
(Pa) 90.5 64.0 267 3.60E+03 9.24E+03
Water Content (%w/w) 72 46 38 9 10
Surface Tension 0°C 30.0 30.8 NM NM NM (Air/Oil, mN/m) 15°C 28.8 30.1 30.2 NM NM
20°C 28.0 Interfacial Tension 0°C 30.6 NM NM NM NM
(Oil/Water, mN/m) 15°C 27.7 28.9 NM NM NM Interfacial Tension 0°C 30.4 NM NM NM NM
(Oil/33‰ Brine, mN/m) 15°C 26.3 27.6 NM NM NM
NM – Not Measurable, too viscous
31
3.4.1 Properties of Diluted Bitumens
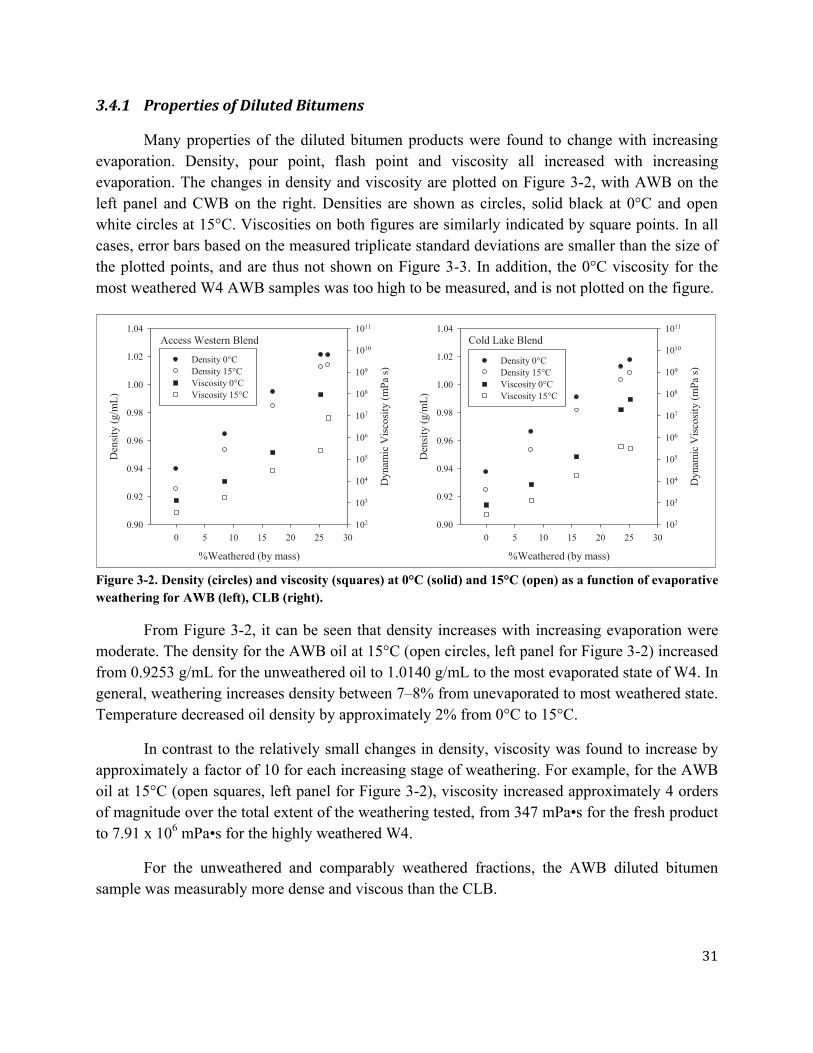
Many properties of the diluted bitumen products were found to change with increasing evaporation. Density, pour point, flash point and viscosity all increased with increasing evaporation. The changes in density and viscosity are plotted on Figure 3-2, with AWB on the left panel and CWB on the right. Densities are shown as circles, solid black at 0°C and open white circles at 15°C. Viscosities on both figures are similarly indicated by square points. In all cases, error bars based on the measured triplicate standard deviations are smaller than the size of the plotted points, and are thus not shown on Figure 3-3. In addition, the 0°C viscosity for the most weathered W4 AWB samples was too high to be measured, and is not plotted on the figure.
Figure 3-2. Density (circles) and viscosity (squares) at 0°C (solid) and 15°C (open) as a function of evaporative weathering for AWB (left), CLB (right).
From Figure 3-2, it can be seen that density increases with increasing evaporation were moderate. The density for the AWB oil at 15°C (open circles, left panel for Figure 3-2) increased from 0.9253 g/mL for the unweathered oil to 1.0140 g/mL to the most evaporated state of W4. In general, weathering increases density between 7–8% from unevaporated to most weathered state. Temperature decreased oil density by approximately 2% from 0°C to 15°C.
In contrast to the relatively small changes in density, viscosity was found to increase by approximately a factor of 10 for each increasing stage of weathering. For example, for the AWB oil at 15°C (open squares, left panel for Figure 3-2), viscosity increased approximately 4 orders of magnitude over the total extent of the weathering tested, from 347 mPa•s for the fresh product
6to 7.91 x 10 mPa•s for the highly weathered W4.
For the unweathered and comparably weathered fractions, the AWB diluted bitumen sample was measurably more dense and viscous than the CLB.
Access Western Blend
%Weathered (by mass)
0 5 10 15 20 25 30
Den
sity
(g/m
L)
0.90
0.92
0.94
0.96
0.98
1.00
1.02
1.04
Dyn
amic
Visc
osity
(mPa
s)
102
103
104
105
106
107
108
109
1010
1011
Density 0°C Density 15°C Viscosity 0°C Viscosity 15°C
Cold Lake Blend
%Weathered (by mass)
0 5 10 15 20 25 30
Den
sity
(g/m
L)
0.90
0.92
0.94
0.96
0.98
1.00
1.02
1.04
Dyn
amic
Visc
osity
(mPa
s)
102
103
104
105
106
107
108
109
1010
1011
Density 0°C Density 15°C Viscosity 0°C Viscosity 15°C

32
From Tables 3-1 and 3-2, for the AWB and CLB respectively, it can also be seen that pour point increased with increasing evaporation, from below -25°C to 27°C for AWB, for example. This paralleled the increases in viscosity, discussed above.
Flash point also increased with increasing weathering, reflecting the loss of volatile compounds in the materials by evaporation. Water in the oil was similarly lost by evaporation, with the more weathered fractions essentially free of water. As received, the CLB and AWB dilbit samples contained 0.6% and 1.5% water (w/w) respectively. However, this was lost during progressive evaporation stages. In contrast, total elemental sulphur did not appear to evaporate from the oil, and instead was increasingly concentrated in proportion to the mass lost by evaporation.
Surface and interfacial tensions of the more weathered products were not measurable, as it was not possible to form interfaces with controlled geometries for highly viscous materials. Measurements for the unweathered and lightly weathered W1 samples, however, show that the two diluted bitumen products had typical air/oil surface tensions (29 to 31 mN/m) and oil/salt water interfacial tensions (24 to 38 mN/m) for light to medium crudes in the Environment Canada database (Environment Canada, 2006).
As discussed in Chapter 2, similarities have been noted between diluted bitumen products and fuel oils (ENG, 2011). IFO 180 has a density of 0.9664 g/mL at 15ºC (Environment Canada, 2006, reproduced in Table 2-2) and dynamic viscosity of 1920 mPa•s at 15°C, which is comparable to the physical properties of “W1” weathered versions of winter dilbits. For the AWB W1sample the corresponding values were a density of 0.9531 g/mL and a viscosity of 982 mPa•s (Table 3-1) For CLB, a density of 0.9537 g/mL and a viscosity of 1330 mPa•s (Table 3-2) were recorded. To examine this comparison in more detail, reference has been made to IFO 180 throughout the present report. Comparisons are made with respect to the weathering behaviour, discussed below, and in the buoyancy fate discussions in Chapter 4. In the wave tank studies discussed in Chapter 5, weathered dilbit products similar to “W1” in Chapter 3 are used. It is not the view of the authors of the present report that IFO 180 is a match or surrogate for diluted bitumen, but that comparisons between the properties, composition and behaviours of the diluted bitumen and IFO 180 may provide some insight on how spills of dilbit compare to conventional fuels.
One interesting difference between the IFO and the dilbits is variation of physical properties with temperature. Comparing the dilbit results to those of IFO 180, the temperature dependence of the viscosity for the fuel oil was significantly larger than that of the dilbits such that at the lowest temperature, the rate of change was found to be 5 to 10 times greater for the IFO 180 than the weathered dilbits.
The highly weathered versions (W2, W3 and W4) of the winter dilbits may be more comparable to heavier intermediate fuel types or even a heavy fuel, such as HFO 6303, as shown

33
in Table 2-2. At 15ºC, HFO 6303 has a density of 0.9888 g/mL and a dynamic viscosity of 241,000 mPa•s. Comparing these values to those of the weathered diluted bitumen in Tables 3-1and 3-2, the density and viscosity of heavy fuel oil 6303 (Environment Canada, 2006, reproduced in Table 2-2) falls between the moderate W2 weathering state and the more highly evaporated W3 for both dilbit types.
Two types of oil transformation behaviour were tested for both products: evaporation and emulsification. The details of these tests are examined below. The effects of these processes on the density and buoyancy of the diluted bitumen are the subject of section 4, below.
3.4.2 Pan Evaporation of Diluted Bitumens
Figure 3-3. Pan evaporation results for two dilbit oils and IFO 180. Measured mass loss in an open pan as a function of time is shown as points, for AWB on the left figure, CLB in the central figure and IFO 180 on the right figure, respectively. Fitted simple expressions are shown as solid lines in red for each result. The results of the fits are indicated in the legends on each graph.
The evaporation rates for the two products were assessed by measuring mass loss from an open pan at 15°C, with air disturbance kept as low as possible, following the procedure described in Fingas (Fingas, 2006). The evaporation curves for the two crudes are shown in Figure 3-3. Test lengths for pan evaporation are typically 200 hours; however, to better determine the rate and final extent of evaporation possible, the time for the AWB was extended to almost 1000 hours, and over 600 hours for the CLB. The relative percentage of mass lost as a function of time (in hours) for AWB is shown on the left panel of Figure 3-3 and the middle panel for CLB,respectively. The evaporation curve measured for IFO 180 is also shown on the right-most panel, for comparison. Rates of evaporation for both the AWB and the CLB were found to be rapid compared to the IFO, as well as occurring to a much higher degree of mass loss. Within 6 hours at 15°C, the AWB had lost 15.9% of its mass, the CLB 11.7% of its mass. By comparison, the
Time (hours)
0 200 400 600 800 1000
% E
vapo
rate
d (w
/w)
0
5
10
15
20
25
30
AWB %Ev=2.398 ln(t)r2=0.928
Time (hours)
0 200 400 600 800
CLB %Ev=2.187ln(t)r2=0.993
Time (hours)
0 200 400
IFO-180%Ev=0.0455sqrt(t)r2=0.992

34
IFO 180 had lost 0.85% of its mass. Within 24 hours, the relative mass losses were 18.4%, 15.6% and 1.75% for the AWB, CLB and IFO 180, respectively.
Both diluted bitumen products exceeded more than 20% mass loss: in 55 hours for AWB and 147 hours for CLB. The IFO 180 was not found to exceed 5% mass loss in a test of usual length: 200 hours. The weathering curve for HFO 6303 is not shown, as it has not been found to evaporate to more than 2.5% (Environment Canada, 2006).
Simple logarithms were fitted to the pan evaporation curves for both dilbits. The results are plotted on Figure 3-2. These curve fits were chosen based on the forms proposed by Fingas (Fingas 2004): %Ev = (A-0.045T) ln(t). For AWB, the best fit result was:
%Ev = (1.72-0.045T) ln (t)
for CWB:
%Ev = (1.51-0.045T) ln (t)
where %Ev is the relative mass loss of the oil over time, as a percentage, T is the temperature in degrees Celsius, and t is the time in minutes. Upon comparison with approximately 200 similar fit results for oils and fuels (Fingas, 2004), the factors of 1.72 for AWB and 1.51 for CWB indicate that both diluted bitumen samples evaporate at an overall rate similar to a mid-weight (API 25-35) crude oil. However, it should be noted that for both cases, the simple logarithm models undershoot the early evaporation period of the measured curves (prior to approximately 50 hours) and overshoot the rate at the longer times. This is most noticeable for the AWB diluted bitumen on the left-most panel of Figure 3-3, but can also be seen in the CLB curve in the middle panel of Figure 3-3. While the overall rate may be equivalent to a crude oil, the shape of the logarithmic curve seems to underestimate the rate of evaporation early on, while overestimating later. Simple fit models may not be very useful for diluted bitumen, particularly in the early stages of a spill.
3.4.3 Simulated Distillation of Diluted Bitumens
The potential for evaporation of the products is also very commonly assessed by examining the distillation curves of the products. A common method for measuring distillation rates, temperature as a function of the fraction of oil distilled, is simulated distillation by gas chromatography, discussed in section 3.2.
The graphs in Figure 3-4 show simulated boiling point distributions of CLB and AWB dilbit samples. On the left side of Figure 3-4, the boiling point distributions for fresh and moderately weathered (W2) fractions of the two dilbits are plotted. The graph on the right side of Figure 3-4 shows the measured boiling point distributions for the two unweathered dilbit samples, a conventional crude (ASMB #5), and an intermediate fuel oil (IFO 180).

35
The low initial boiling points (the y-axis intercept on the left panel of Figure 3-4, at zero mass lost) for the fresh dilbits are evidence of the presence of low-molecular weight condensate in the dilbit blends. The elevation of initial boiling point in the weathered W2 fractions (seen as the vertical shifts between the fresh and W2 samples at low mass on the left panel of Figure 3-4) indicate that some of the “light-end,” low mass molecules were evaporated from the W2 samples. However, at higher temperatures, the lines for the distillations converge, indicating that weathering preferentially removed the low-boiling range compounds of the oil prior to the high-boiling range compounds.
Figure 3-4. High temperature simulated distillation plots for the two dilbits before and after weathering (left) and in comparison to a conventional crude (ASMB #5) and intermediate fuel oil (IFO 180).
While both AWB and CWB are roughly similar in distillation curves, differences are apparent on close examination of Figure 3-4. The AWB curve shows higher mass loss at lower temperatures than the CLB curve, but at just over 200°C, the red and blue curves cross for both the unweathered and weathered samples on the left panel of Figure 3-4. This may indicate a higher concentration of “light-end” condensate in AWB compared with CLB, to compensate for a less-volatile, and thus presumably denser, bitumen feedstock for the AWB compared with the Cold Lake source bitumen.
On the right side of Figure 3-4, the distillation curves of dilbit samples are compared with IFO 180 and a crude oil (ASMB #5). The low-temperature boiling ranges for the diluted bitumens are much more similar to the crude oil than IFO 180, indicating a substantial difference in light, volatile compounds between the dilbit, made by blending with condensate, and the fuel oil. By comparison of the left panel with the right, it is apparent that even the moderately weathered W2 samples retained significant volatile compounds compared with the IFO 180. This difference contrasts with the similarities noted for the bulk properties of density and viscosity

36
above, where the more lightly weathered W1 fractions were comparable to the IFO 180. These differences indicate the caution required in making direct comparisons between dilbit and conventional oils or fuel products.
3.4.4 Tendency to form Water-in-Oil Emulsions
The emulsion formation behaviour of the dilbit compounds was also examined. As can be seen in Tables 3-1 and 3-2 respectively, in most cases both the AWB and the CLB and their synthetically weathered subsamples formed continuous phases of oil containing discrete droplets of (simulated) seawater when mixed with 3.3% NaCl brine. Except for the fresh CLB/seawater mixture, these were all found to fall within the entrained water class of mixtures. Water contents ranged from 7 to 46% for all dilbit/seawater mixtures. However, in the case of the fresh CLB, a true emulsion formed, as can be seen by the elevated water content of 72% and complex modulus in Table 3-2. Complex modulus represents resistance to flow, which includes both inelastic (viscosity) and elastic properties of a substance. In general, for most oils and entrained states, this increases with viscosity. However, as can be seen in Table 3-2, the complex modulus for the unweathered state was observed to be higher than that of the W1 weathered fraction, 90.5 Pa and 64.0 Pa respectively. This indicates an elastic resistance to flow in the fresh CLB/seawater mixture, typical of true emulsion formation. The most-weathered form of AWB also did not incorporate a significant amount of water in the test. It was likely too viscous to trap water in the mixing vessel.
In their tendency to form emulsions with seawater, the diluted bitumens are comparable to the behaviour of IFO 180 and the heavy fuel HFO 6303 (Environment Canada, 2006). As can be seen from Table 2-2, both IFO 180 and HFO 6303 similarly form entrained mixtures with seawater, with water contents of 42% and 58%, respectively. The dilbit/seawater mixtures formed from the lightly weathered fractions, W1, were found to be similar in both water content and complex moduli to a IFO 180/seawater mixture. However, HFO 6303 formed a mixture with 58% water content, much higher than the highly weathered W3 dilbit samples (of comparable density and viscosity, as discussed above), which formed mixtures with lower water contents, 6 to 10%.
3.5 Chemical Composition of Diluted Bitumens
Figure 3-5 summarizes the analysis of the SARA groups for the AWB (left panel) and CLB (centre panel) dilbits. Information on these four main groups of chemicals are important both to the oil production and refining industries, but also have influences over the behaviour of oil, including evaporation and emulsification, as well as implications on the effects of oil spills, including toxicity of the oil. Also included on the right-most panel of Figure 3-5 are data for IFO 180 and HFO 6303 taken from the Environment Canada database (Environment Canada, 2006; also summarized in Table 2-2).
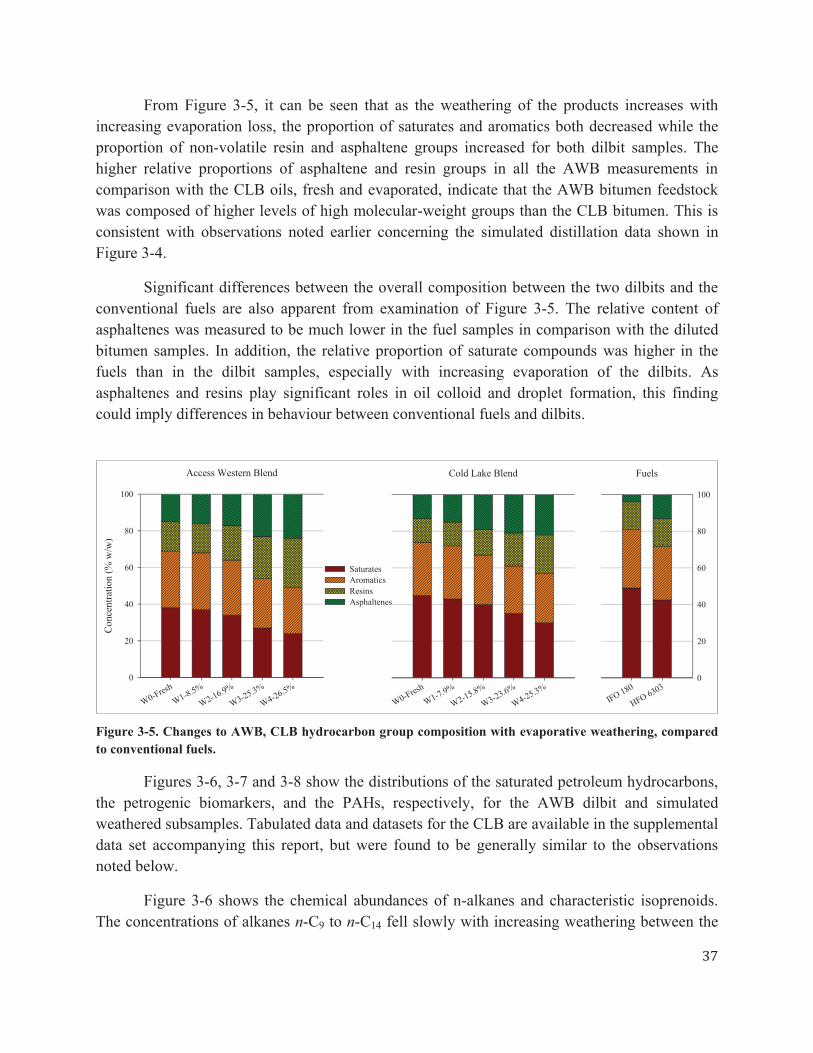
37
From Figure 3-5, it can be seen that as the weathering of the products increases with increasing evaporation loss, the proportion of saturates and aromatics both decreased while the proportion of non-volatile resin and asphaltene groups increased for both dilbit samples. The higher relative proportions of asphaltene and resin groups in all the AWB measurements in comparison with the CLB oils, fresh and evaporated, indicate that the AWB bitumen feedstock was composed of higher levels of high molecular-weight groups than the CLB bitumen. This is consistent with observations noted earlier concerning the simulated distillation data shown inFigure 3-4.
Significant differences between the overall composition between the two dilbits and the conventional fuels are also apparent from examination of Figure 3-5. The relative content of asphaltenes was measured to be much lower in the fuel samples in comparison with the diluted bitumen samples. In addition, the relative proportion of saturate compounds was higher in the fuels than in the dilbit samples, especially with increasing evaporation of the dilbits. As asphaltenes and resins play significant roles in oil colloid and droplet formation, this finding could imply differences in behaviour between conventional fuels and dilbits.
Figure 3-5. Changes to AWB, CLB hydrocarbon group composition with evaporative weathering, compared to conventional fuels.
Figures 3-6, 3-7 and 3-8 show the distributions of the saturated petroleum hydrocarbons, the petrogenic biomarkers, and the PAHs, respectively, for the AWB dilbit and simulated weathered subsamples. Tabulated data and datasets for the CLB are available in the supplemental data set accompanying this report, but were found to be generally similar to the observations noted below.
Figure 3-6 shows the chemical abundances of n-alkanes and characteristic isoprenoids. The concentrations of alkanes n-C9 to n-C14 fell slowly with increasing weathering between the
Cold Lake Blend
W0-Fresh
W1-7.9%
W2-15.8%
W3-23.6%
W4-25.3%
Access Western Blend
W0-Fresh
W1-8.5%
W2-16.9%
W3-25.3%
W4-26.5%
Conc
entra
tion
(% w
/w)
0
20
40
60
80
100
Saturates Aromatics Resins Asphaltenes
Fuels
IFO 180
HFO 63030
20
40
60
80
100

38
fresh and W2 sample, but markedly decreased in abundance between the W2 and W3 samples. Similar trends are observable in the CLB data set.
Figure 3-7 depicts the abundances of the biomarker terpanes and steranes in AWB from fresh to W4. High abundances of biomarkers were detected in all these samples, at 1852, 1968, 2141, 2233, 2312 g/g oil for the fresh, W1, W2, W3, and W4 samples respectively. The increasing relative abundances can be explained by concentration of the refractory biomarkers in the residual weathered oils by loss of the lighter compounds. Similar to the findings of Wang and co-workers (Wang et al., 2011), biomarkers were found in abundance in samples of both AWB, as seen in Figure 3-7, and also in the CLB dataset. In comparison, total biomarkers in IFO 180 are 383 g/g oil and 255 g/g oil in HFO 6303 (Environment Canada, 2006), almost 10 times lower than those in the oil sands products.
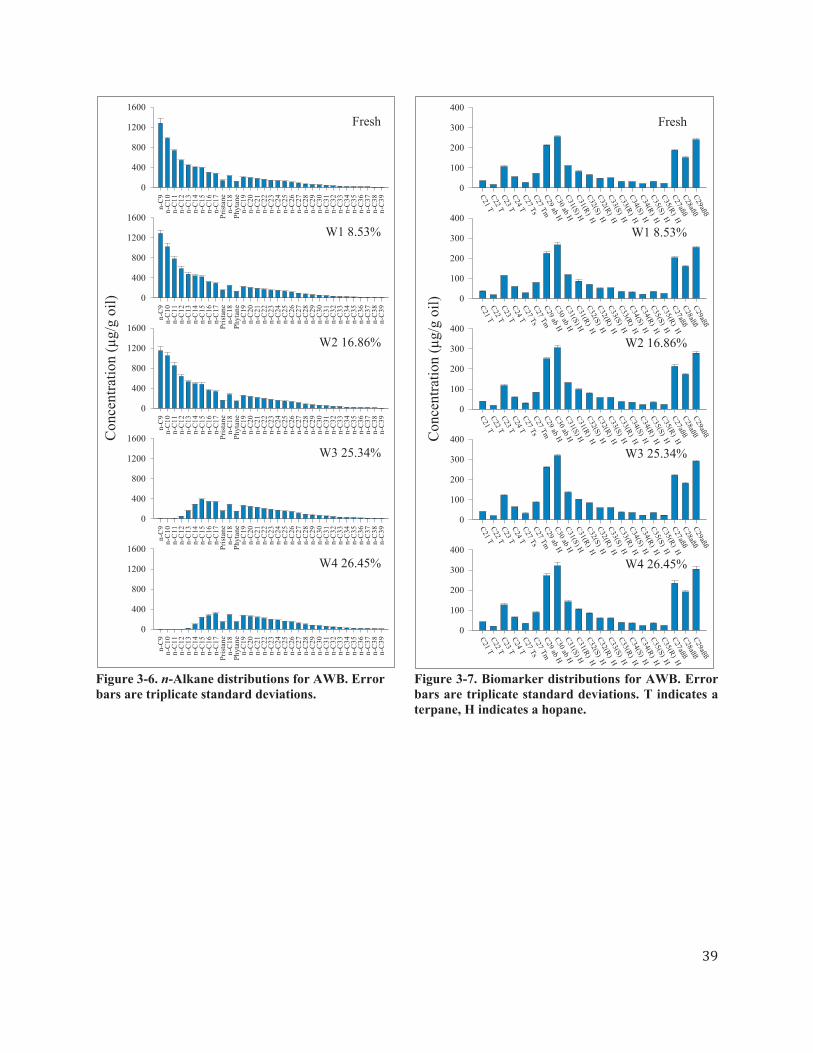
39
Figure 3-6. n-Alkane distributions for AWB. Error bars are triplicate standard deviations.
Figure 3-7. Biomarker distributions for AWB. Error bars are triplicate standard deviations. T indicates a terpane, H indicates a hopane.
Fresh
n-C
9n-
C10
n-C
11n-
C12
n-C
13n-
C14
n-C
15n-
C16
n-C
17Pr
ista
nen-
C18
Phyt
ane
n-C
19n-
C20
n-C
21n-
C22
n-C
23n-
C24
n-C
25n-
C26
n-C
27n-
C28
n-C
29n-
C30
n-C
31n-
C32
n-C
33n-
C34
n-C
35n-
C36
n-C
37n-
C38
n-C
39
0
400
800
1200
1600
W1 8.53%
n-C
9n-
C10
n-C
11n-
C12
n-C
13n-
C14
n-C
15n-
C16
n-C
17Pr
ista
nen-
C18
Phyt
ane
n-C
19n-
C20
n-C
21n-
C22
n-C
23n-
C24
n-C
25n-
C26
n-C
27n-
C28
n-C
29n-
C30
n-C
31n-
C32
n-C
33n-
C34
n-C
35n-
C36
n-C
37n-
C38
n-C
39
0
400
800
1200
1600
W2 16.86%
n-C
9n-
C10
n-C
11n-
C12
n-C
13n-
C14
n-C
15n-
C16
n-C
17Pr
ista
nen-
C18
Phyt
ane
n-C
19n-
C20
n-C
21n-
C22
n-C
23n-
C24
n-C
25n-
C26
n-C
27n-
C28
n-C
29n-
C30
n-C
31n-
C32
n-C
33n-
C34
n-C
35n-
C36
n-C
37n-
C38
n-C
39
Con
cent
ratio
n (μ
g/g
oil)
0
400
800
1200
1600
W3 25.34%
n-C
9n-
C10
n-C
11n-
C12
n-C
13n-
C14
n-C
15n-
C16
n-C
17Pr
ista
nen-
C18
Phyt
ane
n-C
19n-
C20
n-C
21n-
C22
n-C
23n-
C24
n-C
25n-
C26
n-C
27n-
C28
n-C
29n-
C30
n-C
31n-
C32
n-C
33n-
C34
n-C
35n-
C36
n-C
37n-
C38
n-C
39
0
400
800
1200
1600
W4 26.45%
n-C
9n-
C10
n-C
11n-
C12
n-C
13n-
C14
n-C
15n-
C16
n-C
17Pr
ista
nen-
C18
Phyt
ane
n-C
19n-
C20
n-C
21n-
C22
n-C
23n-
C24
n-C
25n-
C26
n-C
27n-
C28
n-C
29n-
C30
n-C
31n-
C32
n-C
33n-
C34
n-C
35n-
C36
n-C
37n-
C38
n-C
39
0
400
800
1200
1600
Fresh
C21 TC22 TC23 TC24 TC27 TsC27 TmC29 ab HC30 ab HC31(S) HC31(R) HC32(S) HC32(R) HC33(S) HC33(R) HC34(S) HC34(R) HC35(S) HC35(R) HC27aßßC28aßßC29aßß
0
100
200
300
400
W1 8.53%
C21 TC22 TC23 TC24 TC27 TsC27 TmC29 ab HC30 ab HC31(S) HC31(R) HC32(S) HC32(R) HC33(S) HC33(R) HC34(S) HC34(R) HC35(S) HC35(R) HC27aßßC28aßßC29aßß
0
100
200
300
400
W2 16.86%C21 TC22 TC23 TC24 TC27 TsC27 TmC29 ab HC30 ab HC31(S) HC31(R) HC32(S) HC32(R) HC33(S) HC33(R) HC34(S) HC34(R) HC35(S) HC35(R) HC27aßßC28aßßC29aßßC
once
ntra
tion
(μg/
g oi
l)
0
100
200
300
400
W3 25.34%
C21 TC22 TC23 TC24 TC27 TsC27 TmC29 ab HC30 ab HC31(S) HC31(R) HC32(S) HC32(R) HC33(S) HC33(R) HC34(S) HC34(R) HC35(S) HC35(R) HC27aßßC28aßßC29aßß
0
100
200
300
400
W4 26.45%
C21 TC22 TC23 TC24 TC27 TsC27 TmC29 ab HC30 ab HC31(S) HC31(R) HC32(S) HC32(R) HC33(S) HC33(R) HC34(S) HC34(R) HC35(S) HC35(R) HC27aßßC28aßßC29aßß
0
100
200
300
400

40
Figure 3-8 depicts the distributions of four series of alkylated PAH homologs in AWB and the evaporated samples: naphthalene (N), phenanthrene (P), fluorine (F) and chrysene (C), as well as the sulphur-containing series, dibenzothiophene (DBT). Degree of alkylation is indicated by the prefix, C#, where # indicates the number of methyl carbons. For example, C2-N indicates all the dimethyl and ethyl isomers for the naphthalene parent PAH. The sums of all measured isomers are shown as the vertical bars in Figure 3-8.
The relative abundances of the EPA priority PAHs are shown in a graph inset in the upper right corner of each respective alkyl PAH graph. In order of increasing molecular mass, these are biphenyl (Bph), Acenaphthylene (Acl), Acenaphthene (Ace), Anthracene (An), Fluoranthene (Fl), Pyrene (Py), Benz(a)anthracene (BaA), Benzo(b)fluoranthene (BbF), Benzo(k)fluoranthene, (BkF), Benzo(e)pyrene (BeP), Benzo(a)pyrene, (BaP), Perylene (Pe), Indeno(1,2,3-cd)pyrene, (IP), Dibenzo(ah)anthracene (DA) and Benzo(ghi)perylene (BgP).
The total target PAHs in the AWB were 1919, 2140, 2331, 2265, 2246 g/g oil for the fresh, 8.53% (W1), 16.86% (W2), 25.34% (W3), and 26.45% (W4) evaporated fractions respectively. The fresh through W2 samples were both found to have characteristic bell-shaped distribution patterns for the naphthalene alkyl-PAH series, most likely from the lighter diluent component of the product. It can be seen, from Figure 3-8, however, that the phenanthrene, dibenzothiophene, fluorene and chrysene families all have a pattern of increasing abundance with increasing alkylation, typical of biodegraded oil, such as bitumen. For a single homologous family, the abundance of each alkyl derivative group increased with alkylation. For the fluorenes, for example, the relative abundances of the unalkylated fluorene: C1-fluorenes : C2-fluorenes : C3-fluorenes were 22.8:75.8:185:251, respectively (expressed as µg/g oil). For the W3 and W4 samples, the naphthalene family also showed this pattern, indicating that the majority of the diluent components had evaporated. The alkyl PAH data for CLB were also very similar to this finding. This observation is again consistent with the findings of Wang and co-workers (Wang et al., 2011), who noted similar strong evidence of biodegradation in the patterns of the alkyl PAH that distributions they examined for both dilbit and native bitumen samples.
Differences were found again in the fuels in comparison to the diluted bitumen samples. The total alkyl PAHs in HFO 6303 was 28 300 g/g oil, while in the IFO 180, the total PAHs was 27 700 g/g oil (Environment Canada, 2006), more than ten times higher than that found in any of the dilbit samples.

41Figure 3-8. PAH distributions for AWB. Error bars are triplicate standard deviations. Chemical codes are
described in the text.
Fresh
C0-
NC
1-N
C2-
NC
3-N
C4-
NC
0-P
C1-
PC
2-P
C3-
PC
4-P
C0-
DC
1-D
C2-
DC
3-D
C0-
FC
1-F
C2-
FC
3-F
C0-
CC
1-C
C2-
CC
3-C
0
100
200
300
400
500
Bph
Acl
Ace An Fl Py
BaA
BbF
BkF
BeP
BaP Pe IP DA
BgP
0
5
10
15
W1 8.53%
C0-
NC
1-N
C2-
NC
3-N
C4-
NC
0-P
C1-
PC
2-P
C3-
PC
4-P
C0-
DC
1-D
C2-
DC
3-D
C0-
FC
1-F
C2-
FC
3-F
C0-
CC
1-C
C2-
CC
3-C
0
100
200
300
400
500
Bph
Acl
Ace An Fl Py
BaA
BbF
BkF
BeP
BaP Pe IP DA
BgP
0
5
10
15
W2 16.86%
C0-
NC
1-N
C2-
NC
3-N
C4-
NC
0-P
C1-
PC
2-P
C3-
PC
4-P
C0-
DC
1-D
C2-
DC
3-D
C0-
FC
1-F
C2-
FC
3-F
C0-
CC
1-C
C2-
CC
3-C
Con
cent
ratio
n (μ
g/g
oil)
0
100
200
300
400
500
Bph
Acl
Ace An Fl Py
BaA
BbF
BkF
BeP
BaP Pe IP DA
BgP
0
5
10
15
W3 25.34%
C0-
NC
1-N
C2-
NC
3-N
C4-
NC
0-P
C1-
PC
2-P
C3-
PC
4-P
C0-
DC
1-D
C2-
DC
3-D
C0-
FC
1-F
C2-
FC
3-F
C0-
CC
1-C
C2-
CC
3-C
0
100
200
300
400
500
Bph
Acl
Ace An Fl Py
BaA
BbF
BkF
BeP
BaP Pe IP DA
BgP
0
5
10
15
W4 26.45%
C0-
NC
1-N
C2-
NC
3-N
C4-
NC
0-P
C1-
PC
2-P
C3-
PC
4-P
C0-
DC
1-D
C2-
DC
3-D
C0-
FC
1-F
C2-
FC
3-F
C0-
CC
1-C
C2-
CC
3-C
0
100
200
300
400
500
Bph
Acl
Ace An Fl Py
BaA
BbF
BkF
BeP
BaP Pe IP DA
BgP
0
5
10
15

42
4.0 Oil Weathering and Buoyancy in Marine Conditions
4.1 Introduction
Following a spill, oil undergoes transformations in the environment. These processes, referred to as weathering, alter the physical properties and chemical composition of the oil. These chemical and physical changes drive the behaviour and fate of the oil in the environment
Oil density is the crucial factor in sinking. Studies have shown that oils with a density greater than 0.90 g/mL, and especially when this density approaches that of seawater (1.025 to 1.033 g/mL), can be over-washed (submerged under the water surface, but not sinking to the sea floor) under some sea conditions (Clark et al., 1987). The major mechanisms for oil submergence in water that have been observed include (NRC, 1999):
1. Evaporation increases an oil density with longer exposure (Wang et al, 2004). Evaporation alone, however, has been shown to be unlikely to increase density enough to cause sinking in seawater (Lee et al., 1989).
2. Photo-oxidation. Oils can oxidize in sunlight to form a dense crust on the surface of exposed oil (Bobra and Tennyson, 1989).
3. Water uptake. Mixing with water will not cause an oil to sink, but emulsion formation and/or water incorporation due to kinetic factors may change the properties of the oil such that sinking by other processes is more likely.
4. Mixing with solids can increase the density of the resulting mixtures. When mixed with silica sand, 2 to 3% mineral content in the oil phase is sufficient to cause sinking (NRC, 1999). Many studies have shown (see Chapter 2) that oil-sediment interaction is a common phenomenon.
Given the unknowns surrounding the uncertainty of the buoyancy of diluted bitumen products and the effects of environmental weathering and other factors such as mixing with seawater and sediment, a study was developed to investigate the range of possible behaviours of oil when subjected to these four types of weathering.
The objective of this study, reported in summary here, was to observe the range of possible fates of oil in salt water, when subject to evaporation, photo-oxidation, water uptake or mixing and sediment uptake or mixing. A series of experiments was designed to test the possible range of behaviours that might be exhibited by dilbits in the marine environment.

43
The following combinations were examined:
Oil types: AWB, CLB, IFO 180 Evaporation: Fresh, W1, W2, W3, W4 (note that only fresh was evaluated for IFO
180) Photo-oxidized: Phox-W2 Salt water brine + oil mixing: Fresh through W4 (only fresh for IFO) Salt water brine + photo-oxidized oil: Phox-W2 Salt water brine + oil + kaolin clay: Fresh through W4 (only fresh for IFO) Salt water brine + photo-oxidized oil + kaolin clay: Phox-W2 Salt water brine + oil + sand: Fresh, W2 Salt water brine + oil + diatomaceous earth: Fresh, W2
The intent of the study was not to examine mechanisms of formation, but the possible end states of the processes, i.e., their fates. Each of the factors would be tested at the limits of what would be possible in the natural environment: high mixing energy conditions, high sediment loads, long evaporative and photo-oxidizing exposures. These conditions are discussed in the following section.
4.2 Materials and Methods
As this study was designed to examine the extent of behaviours possible, it was desirable to use high but still realistic influences for each of the factors. The production of samples for each of these factors is discussed in detail below.
4.2.1 Oil Types
The two types of diluted bitumen, CLB and AWB, were studied for their weathering behaviour, as well as resulting chemical and physical properties (see Chapter 3), to determine the relationship of oil properties to fate and behaviour for applications such as spill modelling and emergency response tactics. An intermediate fuel oil used for marine ship fuel, IFO 180, was also included for comparison.
4.2.2 Evaporation
Oils were evaporated in a rotary evaporator as described in Chapter 3, with known pressure and temperature to simulate evaporative weathering. As described in Chapter 3, this method of evaporation has been found to result in oil chemically similar to oil evaporated under ambient conditions from an open pan (Fieldhouse et al., 2010). Four fractions of weathered samples were generated, yielding different degrees of weathered fractions: fresh sample, 1/3 and 2/3 weathered (by mass lost), and finally 48 and 96 hours of simulated weathering, representing the end condition in the environment, designated as W1, W2, W3 and W4 respectively.
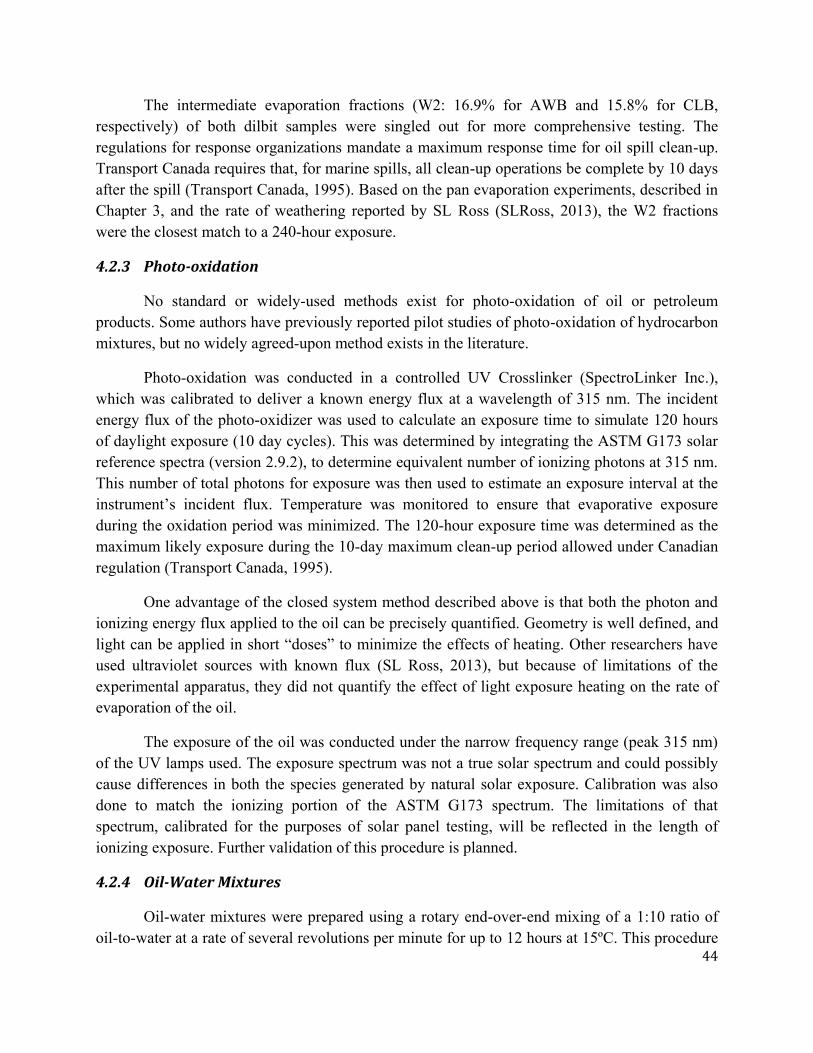
44
The intermediate evaporation fractions (W2: 16.9% for AWB and 15.8% for CLB, respectively) of both dilbit samples were singled out for more comprehensive testing. The regulations for response organizations mandate a maximum response time for oil spill clean-up. Transport Canada requires that, for marine spills, all clean-up operations be complete by 10 days after the spill (Transport Canada, 1995). Based on the pan evaporation experiments, described in Chapter 3, and the rate of weathering reported by SL Ross (SLRoss, 2013), the W2 fractions were the closest match to a 240-hour exposure.
4.2.3 Photo-oxidation
No standard or widely-used methods exist for photo-oxidation of oil or petroleum products. Some authors have previously reported pilot studies of photo-oxidation of hydrocarbon mixtures, but no widely agreed-upon method exists in the literature.
Photo-oxidation was conducted in a controlled UV Crosslinker (SpectroLinker Inc.), which was calibrated to deliver a known energy flux at a wavelength of 315 nm. The incident energy flux of the photo-oxidizer was used to calculate an exposure time to simulate 120 hours of daylight exposure (10 day cycles). This was determined by integrating the ASTM G173 solar reference spectra (version 2.9.2), to determine equivalent number of ionizing photons at 315 nm. This number of total photons for exposure was then used to estimate an exposure interval at the instrument’s incident flux. Temperature was monitored to ensure that evaporative exposure during the oxidation period was minimized. The 120-hour exposure time was determined as the maximum likely exposure during the 10-day maximum clean-up period allowed under Canadian regulation (Transport Canada, 1995).
One advantage of the closed system method described above is that both the photon and ionizing energy flux applied to the oil can be precisely quantified. Geometry is well defined, and light can be applied in short “doses” to minimize the effects of heating. Other researchers have used ultraviolet sources with known flux (SL Ross, 2013), but because of limitations of the experimental apparatus, they did not quantify the effect of light exposure heating on the rate of evaporation of the oil.
The exposure of the oil was conducted under the narrow frequency range (peak 315 nm) of the UV lamps used. The exposure spectrum was not a true solar spectrum and could possibly cause differences in both the species generated by natural solar exposure. Calibration was also done to match the ionizing portion of the ASTM G173 spectrum. The limitations of that spectrum, calibrated for the purposes of solar panel testing, will be reflected in the length of ionizing exposure. Further validation of this procedure is planned.
4.2.4 Oil-Water Mixtures
Oil-water mixtures were prepared using a rotary end-over-end mixing of a 1:10 ratio of oil-to-water at a rate of several revolutions per minute for up to 12 hours at 15ºC. This procedure
45
has been shown to provide a high-energy mixing environment, with sufficient mixing time to ensure that if a mixed water-oil state is possible, it will likely be reached in the test. In the case of high-viscosity heavy oils, the dominant form of result observed is the “entrained-water” state (Fingas and Fieldhouse, 2006), which has a typical water content of 30%. Chemically-stabilized stable or meso-stable emulsions of intermediate and heavy fuel oils are uncommon.
4.2.5 Oil-Water-Sediment Mixtures
In the event of a spill into water, both suspended and bottom sediments can interact with oil, impacting its fate. Interactions often result in the formation of oil-sediment aggregates, which may become denser than water and sink. Oil-sediment aggregates that enter the water column may also release oil droplets over time (Lee et al., 2002). While natural sediments contain a range of sizes from sub-micrometre to millimetres, size-segregated sediments may give insights into sediment interactions as a function of particle size, which might lead to different fates (Aijiolaiya et al., 2006). Natural sediments may also contain a significant amount of organic material, which can affect oil-particle interactions as well. To simplify interpretation for the present work, mineral-only sediments were used.
Three size ranges of particles were selected. Different sediment size ranges may be encountered by oil, by suspended particulates in the open ocean, from a river mouth bearing sediment, and by contact with beach and shore sediments. This guided the selection of the sediments used in the present study. The sediments used include:
1. Kaolin – hydrated aluminum silicate, Al2Si2O5(OH)4. This fine particulate typically fallsin the range of 1–2 micrometre in diameter. It is acidic when mixed with water. Brinemixtures were neutralized with sodium hydroxide prior to use. Kaolin was also selectedto allow for comparability with the sediment addition experiments reported in Chapter 5.
2. Diatomaceous earth – silicon oxide, SiO2. The medium-sized particulate had anapproximate mesh size of 325, about 44 micrometre diameter.
3. Sand – silicon oxide, SiO2. Approximate mesh size range 50–70, or 200–300 micrometresin diameter.
The sediment loading chosen was 10 g sediment/L brine. While high, this level of suspended sediment has been found in coastal river outflows. In a set of 44 estuaries measured in the deltas at the site of maximum turbidity at high tides, depth-averaged suspended sediment concentrations were reported from 1.0 to 48 400 mg/L (Uncles et al., 2002). For the Fraser River delta in British Columbia, surface suspended sediment concentrations have been reported approaching 1 g/L during the highest annual flows (Kostaschuk et al., 1993). Amos (Amos, 1996) reported a maximum depth-averaged suspended particulate matter concentration of 3.5 g/L in the Bay of Fundy.

46
Oil-sediment interaction was assessed by first preparing a sediment-water mixture of 10 mg/L sediment in 600 mL of 33 ppt NaCl brine in a 2.2-L vessel. The water pH was checked, then adjusted to 7.0 when necessary, and allowed to equilibrate.
A 30-mL portion of oil was then added to the vessels. The mixing bottles were then sealed and allowed to thermally equilibrate for at least 4 hours. The vessels were mixed for 12 hours on the rotary end-over-end mixer at 15ºC. If the sediment interaction resulted in a well-dispersed mixture with no separate phase, the contents were poured into 1-L graduated cylinders to monitor settling. If water-in-oil emulsions were formed, the emulsion phases were collected and transferred to wide-mouthed glass jars for observation and analysis (water content, viscoelastic properties, just after mixing and at 1 week).
4.3 Results
4.3.1 Evaporative Weathering
Figure 4-1. Effects of evaporative weathering changes on density as a function of temperature for AWB and CLB samples. Data on conventional fuels and a light crude type are provided for comparison. Lines for fresh water and natural seawater from Spieweck and Bettin, 1992 and UNESCO, 1981, respectively.
The effects of evaporative weathering are plotted on Figure 4-1 for AWB on the left panel, CLB in the middle panel, and conventional oils and fuels for comparison on the right panel. Experimental measurements are shown as individual points. Note that standard errors, determined from the standard deviation of triplicate measurements, are smaller than the points plotted on Figure 4-1, and thus are not shown. Linear regressions fitted the curves of the fresh and moderately evaporated samples (“W2”), shown as lines. Details of the regressions can be found in Table 4-1. Lines for seawater (UNESCO, 1981) and fresh (distilled) water (Spieweck and Bettin, 1992) are shown for visual reference.
Temperature (°C)
0 10 20 30 40
Den
sity
(g/m
L)
0.80
0.85
0.90
0.95
1.00
1.05
1.10
Temperature (°C)
0 10 20 30 40
Temperature (°C)
0 10 20 30 400.80
0.85
0.90
0.95
1.00
1.05
1.10
Saltwater
Freshwater
Saltwater Saltwater
Alberta Sweet Mixed Blend
IFO 180
HFO 6303
Access Western Blend Cold Lake Blend
Freshwater Freshwater
AWB Fresh
W2
Conventional Oil and Fuels
W1
W3&4
CLB Fresh
W2W1
W3&4
47
From Figure 4-1, it can be seen that the density of the fresh AWB and CLB products, approximately 0.92 g/mL at 15°C, rises to approximately 1.01 to 1.02 g/mL at 15°C at the maximum level of evaporation achieved in the W4 samples.
Table 4-1. Linear regressions for density as a function of temperature for measured oils. Density (g/mL) vs. Temperature (°C) Linear Fit r2
AWB Fresh ρ = 0.937 - (0.000847 * T) 0.935 AWB W2 ρ = 1.005 - (0.000870 * T) 0.999 CLB Fresh ρ = 0.937 - (0.000660 * T) 0.955 CLB W2 ρ = 0.993 - (0.000650 * T) 0.999 HFO 6303 ρ = 1.001 - (0.000732 * T) 0.994 ASMB#5 ρ = 0.846 - (0.000460 * T) 0.999 IFO 180 ρ = 0.981 - (0.000860 * T) 0.999
As can be seen from Figure 4-1, the change in the density for both oil sands products was found to be linear with temperature. This is consistent with the usual behaviour for natural petroleum and refined products, as can be seen by comparison with heavy and intermediate fuels oils (HFO 6303 and IFO 180, respectively) and a crude oil (ASMB #5). As described previously in Chapter 3, the density line of the IFO 180 is most similar to the W1 evaporated samples of both types of dilbit. The HFO 6303 data falls between the W2 and W3 evaporated dilbits, in both cases. The density of reference conventional oil, Alberta Sweet Mix Blend #5 (ASMB #5) was considerably lower than that of the dilbits (Figure 3-2) for all temperatures.
These results indicate that evaporation in combination with typical marine temperature ranges seen in Canada (0–15°C) is not sufficient to cause oil sinking for both the AWB and CLB products in fully salt marine waters, even at temperatures approaching freezing.
4.3.2 Photo-oxidative Weathering
Photo-oxidation for the simulated 120-hour exposure (10 ×12-hour days) produced a visible change in the oil from the unexposed weathered sample. Photo-oxidation of oils resulted in surface temperature change, and often with time pH decrease in the water phase, from pH 7.0 initially to pH 6.3 to 6.8 for the CLB and pH 6.19 to 6.72 for the AWB following light exposure. There was crust and film formation on the oil slick, as can be seen in Figure 4-2. However, the photo-oxidized samples for both CLB and for AWB did not have densities significantly different from the corresponding non-UV-exposed W2 samples.
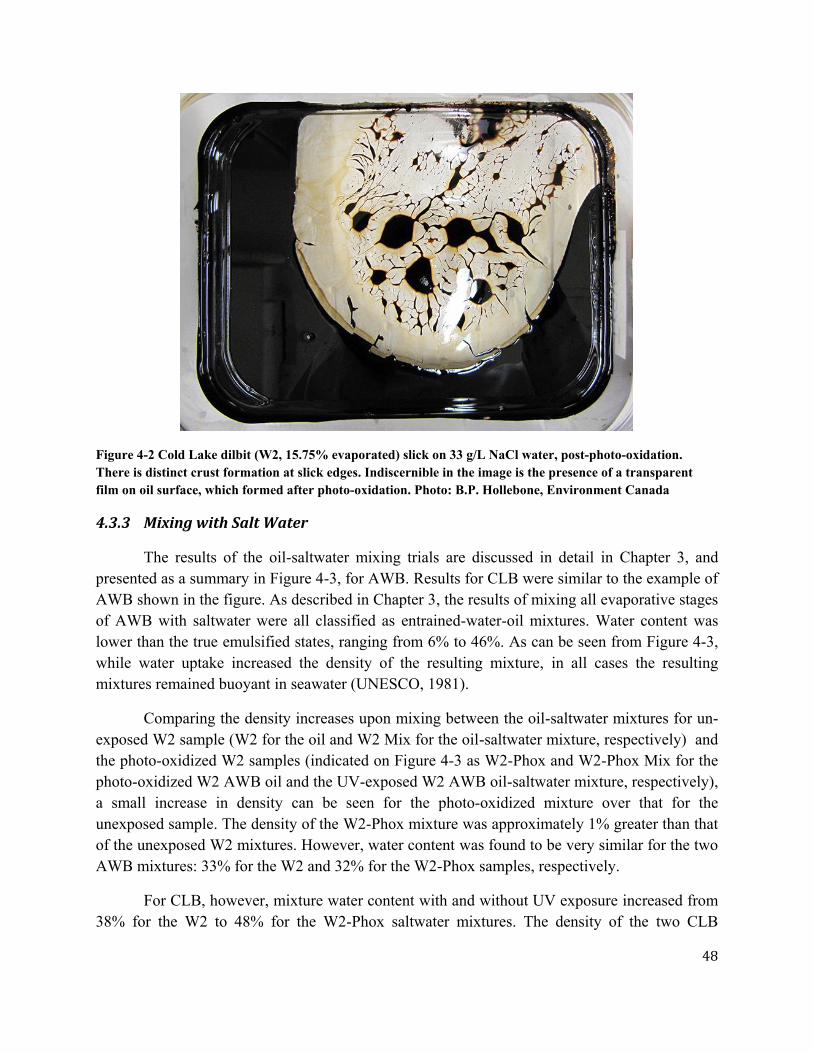
48
Figure 4-2 Cold Lake dilbit (W2, 15.75% evaporated) slick on 33 g/L NaCl water, post-photo-oxidation. There is distinct crust formation at slick edges. Indiscernible in the image is the presence of a transparent film on oil surface, which formed after photo-oxidation. Photo: B.P. Hollebone, Environment Canada
4.3.3 Mixing with Salt Water
The results of the oil-saltwater mixing trials are discussed in detail in Chapter 3, and presented as a summary in Figure 4-3, for AWB. Results for CLB were similar to the example of AWB shown in the figure. As described in Chapter 3, the results of mixing all evaporative stages of AWB with saltwater were all classified as entrained-water-oil mixtures. Water content was lower than the true emulsified states, ranging from 6% to 46%. As can be seen from Figure 4-3, while water uptake increased the density of the resulting mixture, in all cases the resulting mixtures remained buoyant in seawater (UNESCO, 1981).
Comparing the density increases upon mixing between the oil-saltwater mixtures for un-exposed W2 sample (W2 for the oil and W2 Mix for the oil-saltwater mixture, respectively) and the photo-oxidized W2 samples (indicated on Figure 4-3 as W2-Phox and W2-Phox Mix for the photo-oxidized W2 AWB oil and the UV-exposed W2 AWB oil-saltwater mixture, respectively), a small increase in density can be seen for the photo-oxidized mixture over that for the unexposed sample. The density of the W2-Phox mixture was approximately 1% greater than that of the unexposed W2 mixtures. However, water content was found to be very similar for the two AWB mixtures: 33% for the W2 and 32% for the W2-Phox samples, respectively.
For CLB, however, mixture water content with and without UV exposure increased from 38% for the W2 to 48% for the W2-Phox saltwater mixtures. The density of the two CLB

49
mixtures, however, was approximately only 1% different, 0.9887 g/mL and 0.9767 g/mL for the CLB W2 and CLB W2-Phox oil/saltwater mixture densities respectively.
The density of the W3 oil-saltwater mixture appeared to be lower than that of the starting oil. Water content of the W3 mixture increased slightly from the starting oil, from 0% to 6% (refer to Table 3-1). The reason for this depression in density for the AWB W3 sample is not well understood, but was verified in replicate testing for this sample.
Mixture results for the most highly weathered AWB W4 sample are not shown as no water uptake was found for this sample; no mixture formed. Also, as previously discussed in Chapter 3, a similarly-buoyant entrained-water state formed during the IFO 180 mixture test as well.
Figure 4-3. Densities of AWB samples before and after mixing with 33g/L NaCl saltwater at 15°C. Arrows indicate the relationship between oils before and after mixing. Reference lines indicate the density of fresh and natural seawater at 15°C. The last point (W3 Tarballs) is described in section 4.3.4.
Access Western Blend
Fresh
Mix Fresh
AWB W1Mix W1 W2
W2 Mix
W2-Phox
W2-Phox Mix W3W3 Mix
W3 Tarballs
Den
sity
(g/m
L)
0.90
0.92
0.94
0.96
0.98
1.00
1.02
1.04Seawater (15°C)
Freshwater (15°C)

50
4.3.4 Mixing with Salt Water and Sediment
The results of oil/saltwater/sediment mixing tests are shown in Table 4-2. In general, mixtures with kaolin formed finely divided oil-sediment particles that sank in the salt water, with one exception for the highly weathered fractions for both AWB and CLB. Mixtures with the larger particles of diatomaceous earth likewise dispersed and sank, though a portion of the oil remained unmixed and floating on the surface. Mixtures with the coarser sand, however, formed a single, continuous phase of floating oil-saltwater entrained mixtures, and only a small portion sank as an oily sediment mixture.
Table 4-2. Physical fate and buoyancy of oil-saltwater and oil-saltwater-sediment mixtures. No Sediment Kaolin
(1-2 µm) Diatomaceous Earth
(44 µm) Sand
(200--300 µm) AWB Fresh Emulsion – Entrained
Float Disperse
Sink Disperse
Sink Emulsion–Entrained
W1 Emulsion – Entrained Float
Disperse Sink
W2 Emulsion – Entrained Float
Disperse Sink
Disperse Sink
Emulsion–Entrained
W3 Emulsion – Entrained Float
Tarballs Float
W4 No change W2-Phox
Emulsion – Entrained Float
Disperse Sink
CLB Fresh Emulsion–Meso Disperse Sink
Disperse Sink
Emulsion–Entrained
W1 Emulsion – Entrained Float
Disperse Sink
W2 Emulsion – Entrained Float
Disperse Sink
Disperse Sink
Emulsion–Entrained
W3 Emulsion – Entrained Float
Tarballs Float
W4 Emulsion – Entrained Float
Tarballs Float
W2-Phox
Emulsion – Entrained Float
Disperse Sink
IFO 180 Fresh Emulsion – Entrained Float
Disperse Sink
Disperse Sink
Emulsion–Entrained
Kaolin, when mixed with the oils, had a dispersive effect. When mixtures were poured into columns to settle, several phenomena were observed (see Figure 4-4). The fresh oil and three of the evaporated subsamples, as well as the photo-oxidized intermediate subsample (fresh, W1, W2 and photo-oxidized W2 AWB and fresh, W1, W2 and photo-oxidized W2 CLK), formed dispersions that settled to the bottom of the saltwater columns with time. With an increasing level of evaporation, the settled layer of oil-sediment became more compacted (see Figure 4-4). However, in contrast to the less-evaporated fractions, the highly-evaporated third and fourth fractions formed a state similar to tarballs which remained floating (see Figure 4-5).

51
When measured, these floating tarballs were found to have a density of 1.006 to 1.009 for the AWB W3 and 1.004 to 1.005 g/mL for the CLB W3 sample. For AWB, the density of the tarballs (W3 Tarballs) formed compared with those of the fresh oil (W3) the oil/saltwater mixture (W3 Mix).
Figure 4-4. Mixtures of Cold Lake dilbit (2013) and kaolin sediment (10 g/L) in salt water (33 g/L NaCl). In each image, from left to right: 0%, 7.88%, 15.75% weathered. Sedimentation appears more prevalent for less weathered oils: (a) after 1 hour, (b) after 3 hours, (c) after 24 hours, (d) after 1 week. Photo: B.P. Hollebone, Environment Canada
(a) (b)
(c) (d)

52
Figure 4-5. Mixture of the W3 fraction of AWB (25.34% mass loss) and 10 g/L kaolin sediment. Photo: B.P. Hollebone, Environment Canada
Diatomaceous earth (DE) interacted similarly with the oils to form a dispersed mixture as can be seen in Figure 4-6 for the fresh and moderately weathered (W2) AWD, but which settled over time more quickly than kaolin. From examination of Figure 4-6, the appearance of the oil-DE aggregates appear similar; however, significant amounts of oil also remain floating on the surface of the saltwater columns. Testing this floating layer showed that the oil was similar to the water-oil mixtures formed without sediment present. The volume of the settled phase was also significantly lower than that of kaolin samples, suggesting that the higher particle size may have resulted in a denser final state.
The typical result of sand mixing with diluted bitumen oil can be seen in Figure 4-7, for the example of fresh and moderately weathered (W2) CLB. Results for AWB were very similar. The majority of the oil remained floating on the surface of the saltwater column. Testing revealed that the oils were emulsified and were very similar to the mixtures formed in the oil/saltwater mixing tests without sediments, assessed in terms of water content and complex modulus. However, as can also be seen in the bottom of Figure 4-7, some of the oil was found to be coated in a thin layer of sand, and had sunk to the bottom of the saltwater column as larger blob-like particles. These blobs were observed to shed large droplets of oil periodically; the oil would then rise to rejoin the surface layer.
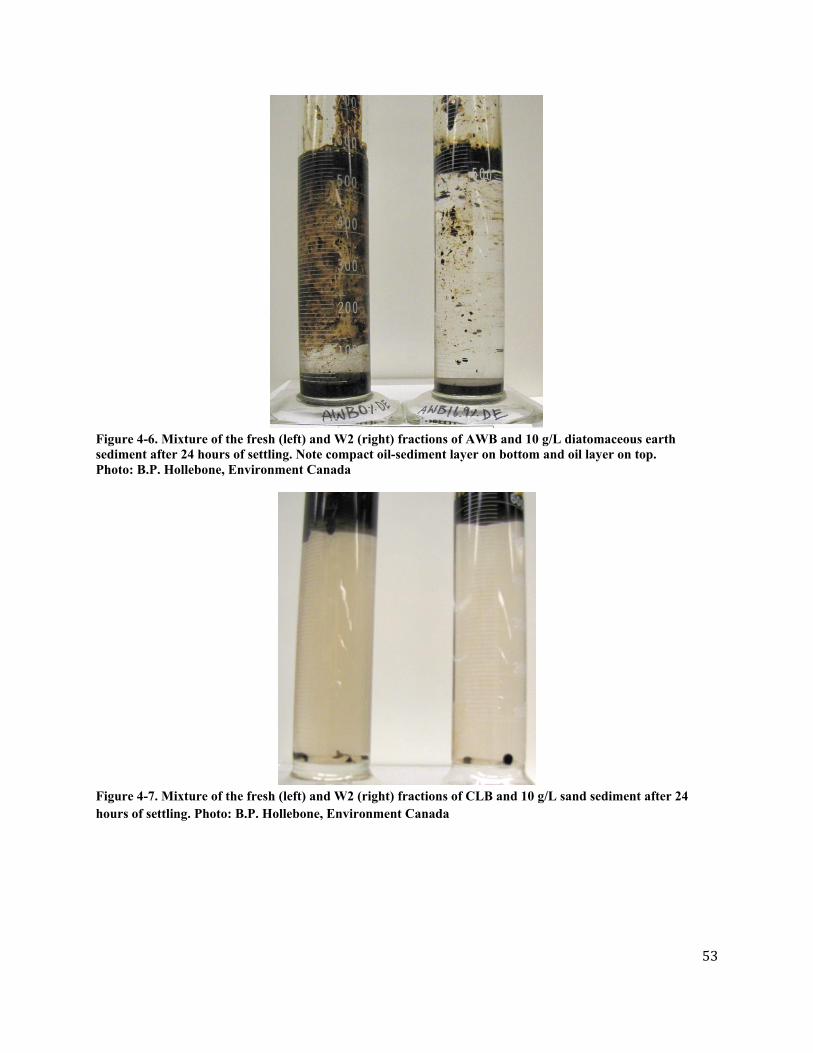
53
Figure 4-6. Mixture of the fresh (left) and W2 (right) fractions of AWB and 10 g/L diatomaceous earth sediment after 24 hours of settling. Note compact oil-sediment layer on bottom and oil layer on top. Photo: B.P. Hollebone, Environment Canada
Figure 4-7. Mixture of the fresh (left) and W2 (right) fractions of CLB and 10 g/L sand sediment after 24 hours of settling. Photo: B.P. Hollebone, Environment Canada

54
While single examples of all mixing experiments are shown in Figures 4-5 through 4-7, substantially similar results were found for both diluted bitumen samples: (1) dispersal and sinking of finely divided particles when mixed with the kaolin for the fresh to W2 (and W2-Phox) samples; (2) tarball formation when mixed with kaolin for the highly weathered W3 (and W4) samples; (3) dispersal and sinking of finely divided particles, with some oil-saltwater mixtures on the top of the column for the DE trials; and (4) very little mixing with silica sand, with the majority of the oil forming oil/saltwater mixtures on the surface of the column, with a few large sand-encrusted larger blobs that sank. Trials of IFO 180 mixed with saltwater alone and with the three sediment types showed over-all behaviour for this fuel to be similar to the moderately-weathered AWB and CLB W2 fractions.
4.4 Comparisons with Literature and Historical Spills
The results of the present study, when compared to the findings of SL Ross (SLRoss, 2013), agree with many of the SL Ross results for oil-saltwater mixing. Water uptake for fresh oil was observed to be higher for the fresh CLB (72% w/w) in the present work than in the SL Ross flume, 39% and 34% (v/v) in the two trials, but that may be explainable by the much lower mixing energy available in the SL Ross flume.
Understanding the differences in weathering methods, rotary evaporation for the present work, open exposure on-water with wind for the SL Ross studies, it would seem that the W2 fraction results in the present work are likely the most similar to the end-states in the SL Ross experiments. On this basis, the W2-saltwater mixtures for CLB were found to be 38% water and 48% for the W2-Phox-saltwater mixtures, while SL Ross found that water contents fell to 25% for the trial with no UV exposure and 20% with UV exposure after their tests were concluded in 120 and 300 hours, respectively. Again, the different mixing energies available between the tumbling flasks used in the present study and the overflow weir used in the SL Ross flume may be the best explanation of these differences. One significant finding from both studies is the uncertainty in the effect of photo-oxidation on water uptake during mixing: in the present work for the AWB and CLB photo-oxidation results (similar water uptake for AWB, more for CLB) and again between the CLB results found by SL Ross (lower water uptake with UV exposure).
The results of the present work also match qualitatively with observations made at the Burnaby 2007 spill of Albian Heavy Synthetic (TSB, 2007). In that spill, oil flowed out of a sewage discharge into Burrard Inlet in conditions of clear weather and moderate wind. No oil was reported or found to have sunk, based on sediment and water quality monitoring following the spill (Stantec Consulting Ltd., 2012b). Given the speed of the clean-up operations, and the calm conditions that prevailed, it is unlikely that any oil-water mixtures or oil-sediment mixtures would have been likely to form. As shown in Figure 4-1, under these conditions, the oil would be expected to float, as observed, even if extensively evaporated.

55
During the Kalamazoo spill of 2010, the EPA documents the spill of a mixture of two types of dilbit, AWB and Canada Western Select (EPA, 2013) into a tributary of the Kalamazoo River, flowing quickly into the river itself. The oil was carried 40 miles downstream during a flood. While much of the oil was removed from surface water and the shorelines following the spill, an estimated 10% to 20% of the oil mixed with sediment in the turbulent flood water and sank to the bottom of the river (EPA, 2013). Epifluorescence micrographs of the sunken oil particles (Lee et al., 2012), indicated small oil droplets encrusted with sediment. Qualitatively, the oil-sediment agglomerations in the Kalamazoo River (Lee et al., 2012) appear to be very similar to the structures observed in the kaolin and diatomaceous earth tests in the present work.
56
5.0 Wave Tank Studies: The Fate and Behaviour of Selected Diluted
Bitumen Products in Natural Sea States and Environmental Conditions
5.1 Introduction
The objective of this phase of the research initiative was to evaluate the natural attenuation and the application of a conventional oil spill treating agent and mineral fines to determine how they influence the behaviour, fate and transport of diluted bitumen (dilbit) spilled at sea. Two synthetically weathered dilbit products, AWB and CLB were treated with a chemical dispersant, sediment (e.g., mineral fines) and a combination of the two and compared to natural attenuation (no treatment), in limited hydrodynamic and environmental conditions. All experiments were conducted in seawater at average temperatures of 8.3 ± 1.3°C.
5.2 Materials and Methods
5.2.1 Wave Tank Studies
The wave tank facility where the work was undertaken is located at the Bedford Institute of Oceanography (BIO) in Dartmouth, Nova Scotia. Tank dimensions are 2 m high, 0.6 m wide and 32 m long. Further details on the wave tank can be found in Li et al. (2008). The wave tank is capable of producing breaking and non-breaking waves. As previously reported for breaking waves, the energy dissipation rate decreased from -21.0 × 10 watts/kg a few centimetres below the surface to -45.0 × 10 watts/kg 20 cm deep into the water column. Non-breaking waves produced an energy dissipation rate of -65.0 × 10 watts/kg 20 cm deep into the water column (Wickley-Olsen et al., 2008). Calibration of wave energies is an ongoing exercise, as new and improved technologies associated with hydrodynamics are continuously introduced to the wave tank facility. The wave energy dissipation rates reported are similar to those measured in the field by Terray et al., 1996 and Drennan et al., 1996. Four water sampling devices were deployed, one at 2 m upstream from the oil release point and the other three at 2 m, 10 m and 14 m downstream from the oil release point. Each of the four samplers collected water (~100 mL) at three depths (5, 75 and 145 cm) from the tank at various time points (5, 15, 30, 45 and 60 minutes). In addition, surface and effluent samples were collected. Samples (t=0) were taken at location “D” (14 m downstream) during each experimental run. The factorial design in Table 5-1 was conducted in random order to reduce confounding effects from wind, rain, seawater salinity and temperature. The selected oil spill treating agent has been successfully used in the past to treat conventional crude oils under various conditions (Li et al., 2008; Li et al., 2009a&b; Li et al., 2010).
5.2.2 Oil, Dispersant and Mineral Fines Application
For each experimental run, oil was released from a 40 cm i.d. containment ring, following the procedure used in Li et al., 2008. Dispersant applied by pressurized sprayer to produce a

57
uniform distribution of dispersant onto the surface of the oil slick at a dispersant-to-oil ratio of ~1:20 (Li et al., 2008; Li et al., 2009a&b; Li et al., 2010).
Mineral fines (kaolin, see description in Chapter 4) were prepared as a seawater slurry (1:20 w:v). The slurry was applied by a hand-operated sprayer. This provided even distribution of fines over the oil surface and gentle application preventing minimal disruption of oil on the surface. As an additional treatment option, mineral fines were used in combination with dispersant application.
5.2.3 Wave Tank In-situ Measuring Devices
Two particle size counters (LISST-100X, Sequoia Scientific, Inc.) were employed during the experiments, at 1.2 m and 12 m downstream of the oil release point and at a depth of 45 cm. Particle size distributions were recorded every 2 to 5 seconds for 1 hour per experiment (Li et al., 2008; Li et al., 2009a; Li et al., 2010). Fluorometers (Turner Cyclops C7) were attached in-situ in the same locations as the LISST particle size analyzers to monitor changes in fluorescence produced from dispersed oil droplets entering the water column.
5.2.4 Lab Analysis of Seawater Samples
Subsamples (20 mL) of collected water samples were used to measure surface tension in a temperature-controlled environment (20.7 ± 0.4°C) following the Wilhelmy plate method (Drelich et al., 2002). A Hydro-Bios surface sampler was deployed to collect surface samples from the top to a depth of 1 cm (sea surface microlayer). Details on the design of the sampler are found in Guitart et al., (2008), and the sampler is commercially available through the supplier, Hydro-Bios. Water samples (surface and subsurface) were extracted and analyzed for total petroleum hydrocarbons (TPH) using a gas chromatograph equipped with flame ionization detection according to the method of Cole et al. (2007).
Extracts of seawater surface samples were evaluated for SARA compound groups using thin-layer chromatography coupled with flame ionization detection (Maki and Saski, 1997). Some of these extracts were further processed to measure PAHs and their alkylated homologues using a gas chromatograph interfaced to a mass spectrometer (EPA method 8270 C).

58
5.3 Results and Discussion
5.3.1 Synthetically Weathered Dilbit Products
Evaporation is expected to play an important role in oil weathering in the initial stages of a spill. Light oils lose up to 75% of their initial volume, medium oils lose 40% of their initial volume, and heavy or residual oils will lose ~5% of their volume in the first few days of an oil spill (Fingas, 1999). Synthetic weathering of the two oil products prior to testing in the BIO wave tank facility resulted in losses of >6% of their mass (weathering process cited in Chapter 3), which, based on Fingas, may represent a couple to a few days of weathering in the natural environment, a period of time that might be expected before spill response measures can be initiated in some incidents. Synthetically weathering oils removes volatiles, thus reducing experimental variance due to evaporation (Li et al., 2008).
5.3.2 Wave Tank Experiments
Initial wave tank studies of dilbit dispersion were carried out in a seawater environment (8.3 ± 1.3°C) that represents surface water temperatures reported during springtime in Douglas Channel (Stronach et al., 2010). As outlined in Table 5-1, salinity ranged from 25 to 30 parts-per-thousand (ppt). Salinities in Douglas Channel vary from less than 20 to 33 ppt depending on location and seawater depth (ASL Environmental Sciences, 2010). The humidity values were included, which provide an indication of precipitation such as rainfall. The introduction of freshwater can be a confounding factor of oil dispersion effectiveness. In these limited environmental conditions, most of the wave tank experiments were carried out in breaking waves with current flow.
A limited number of treatments including natural attenuation and the addition of mineral fines and dispersant to the weathered products were assessed in non-breaking waves with current flow. These were conducted to illustrate that, as a minimum, breaking wave energy is required to maximize the effectiveness of oil spill treatments. Other oil recovery methods such as mechanical skimmers and booms are more effective during calm sea states. Figure 5-1 is a collage of photos from wave tank studies illustrating the behaviour of dilbit in the presence and absence of chemical dispersant in non-breaking and breaking waves.

59
Table 5-1. Wave tank experimental conditions. Each grouping represents replicate runs of the same conditions (AWB = Access Western Blend, CLB = Cold Lake Blend).
Exp.# Oil Type
Oil (g)
Corexit 9500 (g)
Kaolin Slurry (g/L)
Water Temp. (°C)
Wind Speed
(km/hr)
Humidity (%)
Air Temp. (°C)
Salinity (ppt)
1-1 AWB 253.60 12.08 0 6.4 6.1 6 12.2 29.2 2-1 AWB 238.98 15.37 25 7.6 5.8 6 5.5 29.0 3-1 AWB 247.80 0 0 8.0 4.6 5 11.0 29.5 4-1 AWB 240.84 0 25 6.2 5.2 5 6.9 29.2 5-1 CLB 264.60 12.17 0 6.6 6.7 7 6.4 29.1 6-1 CLB 267.76 13.51 25 8.0 4.1 4 10.0 29.3 7-1 CLB 295.40 0 0 7.6 16.8 17 11.2 28.8 8-1 CLB 232.80 0 25 6.5 5.7 6 8.9 28.5
1-2 AWB 252.29 12.15 0 9.0 3.1 3 11.2 29.4 2-2 AWB 276.07 12.99 25 8.9 8.2 8 8.0 29.0 3-2 AWB 264.80 0 0 9.7 16.2 16 10.8 27.9 4-2 AWB 272.60 0 25 8.5 8.2 8 22.0 29.3 5-2 CLB 264.45 12.72 0 10.5 23.8 24 16.0 25.9 6-2 CLB 257.22 13.58 25 9.5 3.9 4 10.0 25.6 7-2 CLB 259.76 0 0 9.0 19.0 19 6.0 26.7 8-2 CLB 262.42 0 25 9.9 13.6 14 10.0 26.9
1-3 AWB 276.05 12.54 0 7.5 4.0 4 11.6 29.4 2-3 AWB 260.05 12.77 25 9.2 19.0 19 9.2 28.2 3-3 AWB 293.81 0 0 9.5 15.2 15 14.2 27.5 4-3 AWB 266.76 0 25 6.9 2.9 3 7.0 30.0 5-3 CLB 259.78 12.01 0 8.7 19.6 20 13.0 28.9 6-3 CLB 278.00 13.19 25 9.4 5.5 5 9.4 27.9 7-3 CLB 237.27 0 0 9.2 22.1 22 8.0 24.8 8-3 CLB 254.71 0 25 7.0 5.6 6 8.2 29.4
Avg 261.58 12.92 8.3 10.3 28.3 STDev 15.96 0.94 1.3 3.6 1.4

60
Figure 5-1. A collage of photos: A) Wave tank facility; B) Non-breaking waves; C) Breaking waves; D) Dilbit as a non-dispersed slick in non-breaking wave (no dispersant); E) Dilbit coalescence and surface slick formation in breaking waves (no dispersant); F) Dilbit as a non-dispersed oil slick in non-breaking waves (with dispersant); and G) Chemically dispersed dilbit in the subsurface water column in breaking waves. Photo: T.L. King, Department of Fisheries and Oceans.

61
5.3.3 Surface Water Profiling
In breaking waves, the dilbit products with no oil spill treatments were driven into the subsurface water column; however the products resurfaced as large oil droplets (e.g., >75 µm) and coalesced at the surface, forming an oil slick. For the tests of the two dilbit products, including the application of chemical dispersant and mineral fines (MFs), oil concentrations were highest in surface samples during the initial stages of testing as presented in Figure 5-2. These concentrations decreased over time as oil either adhered to the tank walls or was discharged through the effluent ports. Water-in-oil emulsions were visible on the seawater surface, but under these experimental conditions they were unstable since the water separated from the oil over time. The application of dispersant and MFs reduced the amount of oil detected on the seawater surface, and, in particular, chemical dispersant application alone was more effective than the other treatments.
Figure 5-2. Hydrocarbon concentrations (GC-FID) in surface samples collected during the treatment of CLB under breaking waves in the wave tank.
Surface samples collected at 60 minutes were evaluated for SARA composition. Under natural conditions, the chemical composition of the dilbit products altered significantly prior to release due to weathering. The aromatics separate from the CLB with no treatment; however, the application of dispersant and MFs appears to impede this process (Figure 5-3). Similar results were found for AWB, however, not to the same degree by the application of the spill treatments. Initially, significant quantities of aromatics were detected, implying that changes in the chemical composition of the products are the result of natural processes such as evaporation and dissolution. Figure 5-4 illustrates that for AWB, the ƩPAH (summed parental and alkylated) concentrations are the highest within the first 30 minutes of wave tank experiments and near their lowest at a time point of 60 minutes for all oil spill treatments. For CLB, there are notably
0
2000
4000
6000
0 10 20 30 40 50 60
HC
(ppm
)
Time (minutes)
CLB CLB/Disp. CLB/MF CLB/Disp./MF

62
higher ƩPAH concentrations at 60 minutes when it is treated with dispersant and/or MFs (Figure 5-5). As the low molecular weight aromatics separate from the dilbit products, the products become more dense and viscous, since they contain a greater percentage of the high molecular weight resins and asphaltenes.
During wave tank studies in non-breaking waves, oil remained on the seawater surface as a non-dispersed slick and was carried downstream where it coated parts of the tank at the seawater surface. Even under these low energy wave conditions, “tarballs” and “tarmats” were visible on the seawater surface, but to a lesser extent compared to breaking wave conditions.
Figure 5-3. Saturates, aromatics, resins and asphaltenes in extracts of surface samples collected at a time point of 60 minutes during wave tank studies of CLB.
0.0% 20.0% 40.0% 60.0% 80.0% 100.0%
Sat
Aro
Resins
Asph
Total Hydrocarbons
CLB/Disp./MF CLB/Disp. CLB/MF CLB
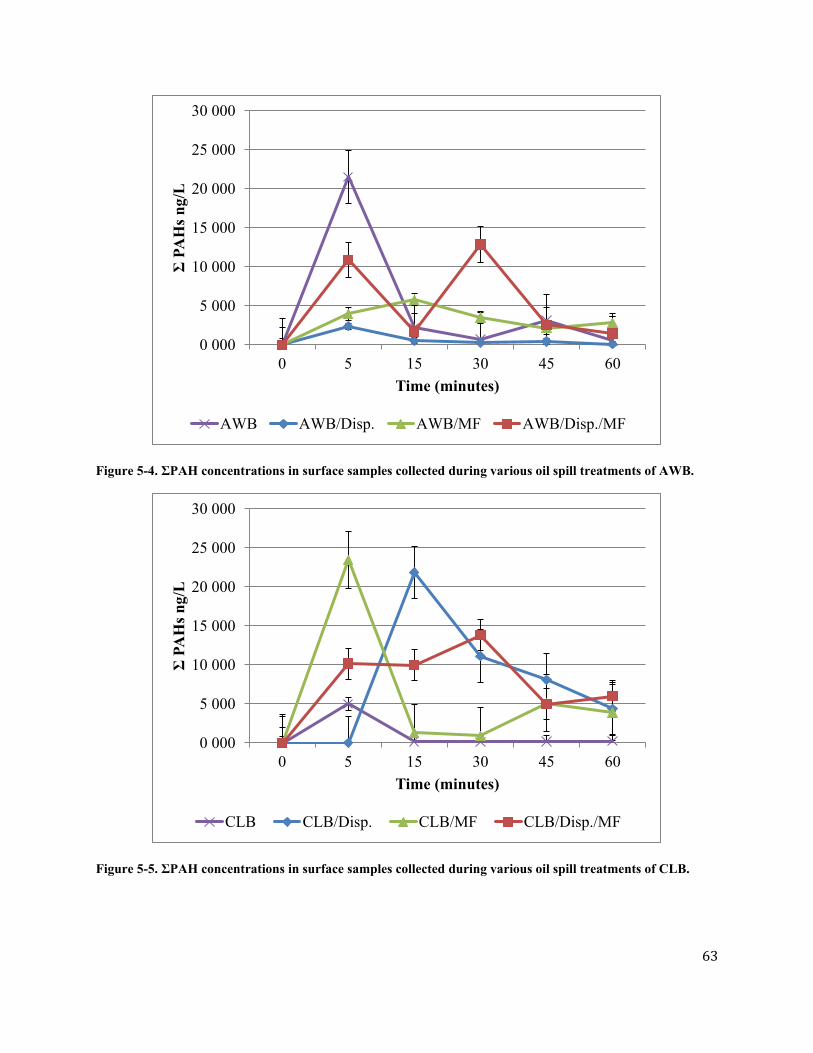
63
Figure 5-4. ƩPAH concentrations in surface samples collected during various oil spill treatments of AWB.
Figure 5-5. ƩPAH concentrations in surface samples collected during various oil spill treatments of CLB.
0 000
5 000
10 000
15 000
20 000
25 000
30 000
0 5 15 30 45 60
Ʃ PA
Hs n
g/L
Time (minutes)
AWB AWB/Disp. AWB/MF AWB/Disp./MF
0 000
5 000
10 000
15 000
20 000
25 000
30 000
0 5 15 30 45 60
Ʃ PA
Hs n
g/L
Time (minutes)
CLB CLB/Disp. CLB/MF CLB/Disp./MF

64
5.3.4 Subsurface Water Column and Dispersant Effectiveness
5.3.4.1 In-situ Fluorescence
Without chemical dispersion, neither type of dilbit product was detected by the in-situ fluorometer. However, the addition of chemical dispersant resulted in an increase in fluorescence for both products, although fluorescence was significantly higher for CLB compared with AWB. The difference suggests a greater abundance of low- to mid-weight aromatic compounds in CLB than compared with AWB. The weak fluorescence in the detection of the low molecular weight aromatics associated with AWB is attributed to a lower degree of dispersion of the oil. In reference to Chapter 3, characterization of the two dilbit products revealed aromatics containing 2- to 5-ring structures. Caution should be exercised when using in-situ fluorometry to monitor unconventional oils such as diluted bitumen in the water column. The excitation and emission wavelengths of the Turner refined fuels optics are targeted towards the detection of lighter oils (i.e., shorter wavelengths). Further study needs to be conducted to determine the optimal (longer) wavelengths for the dilbit products. In addition, the influence of droplet size on the fluorescence should also be considered. Fluorometers typically respond to changes in concentrations of compounds in the dissolved phase. Since dilbit disperses into visibly larger droplets than typically observed with conventional oils, any potential bias as a result of these larger droplets on the measured fluorescence should be resolved.
5.3.4.2 In-situ LISST
In previous wave tank studies, conventional oil products dispersed into the water column by breaking waves in the presence of dispersant resulted in oil droplet sizes in the range of 2.5 to 70 µm with a bimodal droplet size distribution (Li et al., 2010). These oil droplets remain dispersed and do not coalesce. However, oil droplets produced by breaking waves in the absence of dispersant are typically larger than 70 µm, have a unimodal distribution, and tend to ascend and coalesce at the surface.
For all treatments of the dilbit products in non-breaking waves, the measured particle size distributions provided no evidence of enhanced dispersion of the products. The oil simply did not disperse; no oil droplets were detected in the subsurface water column.
Figure 5-6 shows the cumulative particle size distributions located near the oil release point for the AWB over four treatments applied in breaking waves. Without dispersant, oil droplets were very large, with an average volume mean diameter (VMD) of 393 µm, and greater than 90% of total volume of all droplets were larger than 280 µm. During the experiments, large droplets could be seen in the water column. Much of the oil either resurfaced or remained on the water surface. The LISST-100X is only capable of detecting particles in the size range of 2.5 to 500 µm.

65
The addition of Corexit 9500 to AWB significantly altered the oil droplet size distribution, lowering the averaged VMD to 164 µm. The particle size distribution (PSD) profile also changed compared with the natural attenuation experiments, with 20% of the total volume of all droplets < 60 µm and only 15% of total particle volume > 280 µm. In addition, not only were the droplets smaller with the chemical dispersant treatment, but there were more total
-1particles in the water column with a mean total particle concentration (TPC) of 20.1 µL·L -1compared to a mean TPC of 4.4 µL·L for the natural attenuation treatments.
Chemically dispersed CLB oil droplets resulted in a VMD of 71.6 µm whereas under natural attenuation, the VMD was 310.3 µm (Figure 5-6). There was also a shift in cumulative particle size distributions of CLB, with the chemically-dispersed treatments having almost 70% of the total particle volume consisting of droplets < 60 µm and less than 5% > 280 µm. Without the addition of chemical dispersants, more than 70% of the total particle volume was > 280 µm. Compared to the AWB, the lower viscosity CLB was more effectively dispersed with Corexit 9500, where there is notably a higher TPC and smaller oil droplets (Figure 5-6). These results were authenticated by higher hydrocarbon concentrations in the subsurface water column and the dynamic dispersant effectiveness data described subsequently.
Cumulative particle size distributions 12 m downstream of the oil release can be found in Figure 5-7. For the chemically-dispersed treatment of AWB, less than 5% of the total particle volume was > 280 µm. In comparison with the CLB, very little difference was observed in the particle size distributions as the dispersed oil plume transported downstream. However, for both dilbit products, the total concentration of oil droplets in the water column decreased, likely due to dilution of the plume as it travelled horizontally. On average, the travel time of the plume over the 12 m distance was less than 10 minutes, so dissolution and coalescence would have been minimal, and hence minimal changes in particle size distributions were observed.
The effect of the addition of MF both with and without dispersant on the particle size distributions can be seen in the lower panels of Figures 5-7 for downstream LISST#2. For most of the treatments, the addition of MFs resulted in an increase in the VMD compared with the equivalent dispersant-only treatment in the top panels. A decrease in VMD when MFs were added suggests that the MFs adhered to the oil on the water surface and thus did not enter the subsurface water column. However, these data should be viewed with caution, since the LISST cannot discriminate between oil droplets, MF particles and oil-mineral aggregates in the water column.
The LISST generated unanticipated particle size distributions for CLB and AWB that are similar in shape to a unimodal distribution, with oil droplet VMDs of ~70 µm for CLB and ~160 µm for AWB, when dilbit products were treated with chemical dispersant under breaking waves (Figure 5-6). The dispersed oil droplet size patterns were dissimilar to conventional crudes. By comparison, heavy conventional oil such as IFO 180 treated with chemical dispersant under

66
similar conditions have typically produced dispersed oil droplet sizes with VMD of 60 µm with oil droplet size distribution patterns similar to unweathered medium crudes, e.g., MESA oil, a South American crude (Li et al., 2010). The droplet size distributions patterns for conventional crudes are typically bimodal shape.
Figure 5-6. Cumulative particle size distributions for AWB (top) and CLB (bottom) obtained from LISST#1 (1.2 m from oil release). Each plot is an average of triplicate experiments using the particle size distribution data obtained at the time point of maximum total particle concentration within the first 20 min of the experiment (X-axis has been log transformed).

67
Figure 5-7. Cumulative particle size distributions for CLB from LISST#2 (12 m from oil release). Each plot is an average of triplicate experiments using the particle size distribution data obtained at the time point of maximum total particle concentration within the first 20 min of the experiment (X-axis has been log transformed).
5.3.4.3 Hydrocarbon Analyses
During the wave tank experiments, samples at various locations and depths were analyzed over time for hydrocarbon concentrations. In dynamic sea conditions, the mean of three replicates for three depths 12 m downstream of oil release and the effluent were plotted against time for each of the four treatments applied to the dilbit products shown in Figure 5-8.

68
Figure 5-8. Hydrocarbon concentrations in breaking wave conditions at three depths and the effluent for: A) CLB; B) CLB with dispersant; C) CLB with mineral fines; and D) CLB with a combination of dispersant and mineral fines.
0.0
2.0
4.0
0 20 40 60
HC
(ppm
) Time (minutes)
CLB
5 cm 75 cm 140 cm Effluent
A
0.0
12.0
24.0
0 20 40 60
HC
(ppm
)
Time (minutes)
CLB/Disp.
5 cm 75 cm 140 cm Effluent
B
0.0
2.0
4.0
0 20 40 60
HC
(ppm
)
Time (minutes)
CLB/MF
5 cm 75 cm 140 cm Effluent
C
0.0
12.0
24.0
0 20 40 60
HC
(ppm
)
Time (minutes)
CLB/Disp./MF
5 cm 75 cm 140 cm Effluent
D

69
The application of chemical dispersant enhanced the dispersion of both products, where hydrocarbon concentrations were highest (~6×) at all depths and in the oil purged from the tank. Dispersed oil droplets are influenced by current flow, and over time they are effectively diluted by clean water entering the tank. Of the two products, chemical dispersant had a greater influence on CLB, dispersing more of the product into the subsurface water column. As described previously, the in-situ LISST data also indicated that CLB was more effectively dispersed compared with AWB, supporting these findings.
MFs added as a surface active agent to enhance oil dispersion proved to be ineffective based on the limited application. A higher concentration of MFs may be more effective. Based on observations during wave tank studies, the application of MFs appeared to promote increased oil congealing, and the products appeared to have a greater tendency to stick to the sides of the tank. However, their use provides some insight on how they interact with dilbit products and aids improving the wave tank protocols, so that the natural interaction of dilbit products with sediments indigenous to Douglas Channel can be studied.
In non-breaking waves, the oil was transported as a non-dispersed surface slick downstream within minutes where it coated the tank walls and wave absorbers. Oil concentrations in the subsurface water column were consistently less than the detection limit of <1 mg/L. Application of chemical dispersant was similarly ineffective at dispersing the dilbit products. MFs were not applied under non-breaking waves.
5.3.4.4 Surface Tension
Surface tension measurements were performed on all collected seawater samples to assess the dispersion of conventional oil in the subsurface water column (King et al., 2013). In non-breaking waves, no changes were expected to be observed in seawater surface tension, since the dispersion of oil was expected to be unsatisfactory.
In breaking wave conditions, the mean surface tension measurements from three depths at sampling location “D” (14 m downstream of oil release) were plotted against time for each of the four treatments applied to the weathered dilbit products presented in Figure 5-9. Significant reductions in seawater surface tension were observed, indicating more effective dispersion of dilbit products when chemical dispersant is applied compared with natural dispersion or addition of mineral fines. Seawater surface tension decreased over time as chemically-dispersed oil droplets moved through the water column. Surface tensions eventually returned to background levels at the end of the experiment, because dispersed oil droplets were influenced by current flow and were either diluted or purged from the tank.

70
Figure 5-9. Interfacial tension (average of all depths) for mesocosm testing of CLB under various treatment conditions.
5.3.4.5 Dynamic Dispersant Effectiveness
To evaluate dispersant effectiveness, the fraction of oil entrained in the water column of the wave tank had to be determined. A large number of discrete samples were collected, as indicated previously in section 5.2.1, to directly measure the oil dispersed in the water column. With the wave tank in flow-through operation, assessments of dispersant effectiveness also included the concentration of oil in the effluent purged from the tank. Dynamic dispersant effectiveness (DDE) can be used to evaluate the fate and transport of spilled dilbit, including the application of oil spill treating agents under natural sea states and environmental conditions (Li et al., 2010). Since dispersion of dilbit products was ineffective in non-breaking waves, DDE was applied only to treatments of spilled dilbit products in breaking waves. DDE can therefore provide information on the best response options encountered in actual spills based on conditions simulated in the wave tank.
DDE (equation 1) over the duration of an entire experiment can be evaluated by computing the fraction of dispersed oil purged from the wave tank (%Poil) and the residual dispersed oil in the water column (%Dwc) at the end of each experiment:
%DDE %Poil %Dwc (1)
Further details on DDE calculation can be found in Li et al., 2010. Oil was applied quantitatively; therefore, the distribution of the entire amount of oil released can be estimated. The assumption here is that total oil released (Toil; 100%) is the summation of %DDE and the percentage of oil on the water surface or stuck to the walls of the tank (%Soil). The only unknown
65.0
70.0
75.0
80.0
0 10 20 30 40 50 60 70
mN
/m
Time (minutes)
CLB CLB/Disp. CLB/MF CLB/Disp./MF

71
Figure 5-10. Dynamic dispersion effectiveness (n=3) for AWB and CLB in breaking wave conditions using various treatment options (Poil = oil purged from the wave tank, Dwc = dispersed oil in the water column, Soil = oil remaining on the water surface or adhered to walls of the tank).
is %Soil (equation 2), which can be calculated as follows:
%Soil Toil %DDE (2)
The averaged hydrocarbon values for all depths at each sampling location (A, B, C and D) were used to generate %DDE values. The average values of triplicate trials for %Soil, %Poil and %Dwc for all treatments were plotted for each dilbit product (Figure 5-10). Analysis of Variance (ANOVA evaluating oil dispersion; Microsoft Excel 2010) illustrates the effects of dispersant, MFs and the combination of MFs and dispersant on the fate and transport of CLB and AWB in breaking wave conditions. A p-value ≤ 0.1 provides a 90% confidence that the mean values are statistically different. Evaluation of oil spill treatment agents illustrated that both dispersant and MFs/dispersant influenced CLB dispersion (p-values ≤0.1 for 90% confidence interval), where dispersant only had an effect on AWB (p-value ≤0.1 for a 90% confidence interval) dispersion compared with the other spill treating options under similar conditions (Tables 5-2 and 5-3). At seawater temperatures of 8.3 ± 1.3°C, the estimated %DDE for Corexit 9500 applied to CLB and AWB was 45% and 30%, respectively. However, a greater percentage of released oil remained as a non-dispersed oil slick on the seawater surface. The data generated represents the testing of two dilbit products under a limited range of hydrodynamic and environmental conditions.
0.0% 20.0% 40.0% 60.0% 80.0% 100.0%
AWB
AWB/disp.
AWB/MF
AWB/disp/MF
CLB
CLB/disp.
CLB/MF
CLB/disp/MF
Poil Dwc Soil

72
Table 5-2. Analysis of variance comparing the effects of dispersant, mineral fines and mineral fines/dispersant to the natural dispersion of CLB under breaking waves.
Treatment n SS df MS F p-value F crit Criteria Dispersant 3 2541 1 2541 9.0 0.04 4.5 Accept; p≤0.1 MF 3 18 1 18 1.3 0.31 4.5 Reject; p>0.1 MF/Dispersant 3 1324 1 1324 4.5 0.10 4.5 Accept; p≤0.1
Table 5-3. Analysis of variance comparing the effects of dispersant, mineral fines and mineral fines/dispersant to the natural dispersion of AWB under breaking waves.
Treatment n SS df MS F p-value F crit Criteria Dispersant 3 942 1 942 4.5 0.10 4.5 p≤0.1 MF 3 6.2 1 6.2 0.11 0.75 4.5 Reject; p>0.1 MF/Dispersant 3 77 1 77 0.72 0.44 4.5 Reject; p>0.1
73
6.0 Conclusions
A review of the scientific literature revealed knowledge gaps on the physical and chemical properties of dilbit and synbit products; their fate, behaviour and transport in the marine environment; and the application of oil spill response technologies to enhance the natural attenuation of the products.
Two diluted bitumen products, which are representative of high-volume commercial pipeline traffic in Canada, AWB and CLB, were evaluated using a variety of chemical and physical tests. The physical and chemical properties for unaltered and synthetically weathered dilbit products are presented. As seen in Chapter 4, the measured properties of the synthetically weathered products indicate that evaporation alone is likely not sufficient to cause sinking of either product in marine environments, even at temperatures approaching freezing. Mixing of the products with seawater led to water-uptake that increased the density of the resulting mixture; however, the mixtures remained buoyant in all cases.
The laboratory studies described in Chapter 3 and 4 provide essential information on dilbit physical and chemical properties, product weathering, and fate and behaviour under various controlled conditions on a small scale. These small-scale lab studies provide a quick, initial assessment of factors that affect oil behaviour and fate. The information forms the foundation to further investigate the behaviour and fate of oil products in sea states and environmental conditions that can be simulated in a wave tank facility.
As discussed in Chapter 4, the buoyancy behaviour of the AWB and CLB products in marine conditions depends most strongly on the presence of medium-to-fine sediment in the water column. Evaporative weathering alone and evaporative and photo-oxidative weathering in combination all resulted in products that were buoyant in marine conditions. Mixing with water generally increased the density of the products, but all oils tested remained buoyant in seawater even when saturated with water. When mixed with fine- and moderate-sized sediments, however, the fresh to moderately weathered diluted bitumen products sank in saltwater. Interestingly, when mixed with the same fine sediments at high degrees of evaporative weathering, the more viscous oil did not mix as well with either fine or medium sediment, and discrete floating tarballs began to form. The work illustrates the first observation of the initial stages of tarball formation for highly evaporated dilbit. When mixed with coarse sediment, the lower-viscosity fresh and moderately-weathered fractions of both dilbit products did not readily take up silica sand, and instead formed mostly floating entrained-water-in-oil states, similar to those formed by seawater-oil mixtures with no sediment present. However, some large sand-encrusted blobs of oil were observed to sink in the sand-mixing tests.
This work demonstrates that, in waters where fine- to moderate-sized sediment is present, these oils are at risk to sink, when there is a high degree of mixing energy available. However,

74
the effects of different mixing regimes, including current flow, on oil-sediment interactions have not been examined in the present work. Comparisons to meso-scale testing in lower mixing energies by other researchers have revealed some differences between, for example, water-uptake by oils. Testing in the wave tank described in Chapter 5, moderate mixing of the oil-sediment aggregates, resulted in a suspension of the materials. Available mixing energy factors seem to have an influence on the fate of the formed oil-sediment aggregates. While the present work illustrates some of the forms that these oils may possibly adopt following a spill, more work is needed to understand the mechanisms and rates of formation of these states, and to understand the factors that govern the transitions between these fates.
In Chapter 5, studies were conducted in a flow-through wave tank facility to examine the fate, behaviour and transport of oil at the meso-scale, as well as the effectiveness of selected oil spill treating agents in breaking and non-breaking waves with current flow in seawater at average temperatures of 8.3 ± 1.3°C. In non-breaking waves, the dilbit products were not influenced by oil spill treating agents, individually or in combination, and remained as a non-dispersed slick on the seawater surface.
In breaking wave conditions, untreated dilbit entered the subsurface water column as large droplets that quickly resurfaced and coalesced into a surface oil slick. Natural processes acting on the slick significantly altered the chemical composition of the products, forming visibly weathered fractions including unstable water-in-oil emulsions, tarballs and tarmats on the seawater surface. Application of chemical dispersant caused partial dispersion of the products in breaking waves at an average seawater temperature of 8.3 ± 1.3°C. Chemical dispersant application was more effective in dispersing the lower-viscosity CLB. These findings were supported by particle size distributions; however, the observed oil droplet size distributions were unimodal, distinctly different from the bimodal oil droplet distributions for dispersion of conventional oils. Even though the dilbit products were partially dispersed in breaking waves, a greater percentage of the released oil persisted as a non-dispersed oil slick at the seawater surface.
The in-situ fluorescence instrument was challenged when tracking the chemically-dispersed AWB, but showed some promise in monitoring chemically-dispersed CLB in the water column. The fluorometer is a field unit that records changes in fluorescence compared with background levels (prior to oil release). The instrument used in this study has a fixed wavelength, and it is limited to detecting aromatics with 1- to 3-ring structures. As outlined in Chapter 3, dilbit products contain aromatics with 1- to 5-ring structures. Deploying fluorometers with different fixed wavelengths to cover the full spectrum of aromatics will provide more information on the fate of dilbit products in marine settings.
The question of whether dilbit products spilled in the marine environment will float or sink depends on their exposure to a number of natural processes and the duration of exposure.

75
These wave tank studies suggest that if these two dilbit products lose ~6 to 9% of their mass by natural processes such as evaporation, they will remain floating, and partial movement into the water column with the application of dispersant may be possible under the limited environmental conditions outlined in this study.
In previous testing (Li et al., 2009a; Li et al., 2009b; Li et al., 2010), it was shown that a variety of oil types are effectively dispersed in a dynamic environment within the first hour of their release and that temperature can have an effect on oil spill treating agent effectiveness. Longer test times in the current study with dilbit products could not be considered, as they adhered to the walls and wave absorbers of the tank restricting further evaluation. These were unexpected observations that did not transpire during previous work with conventional oils. Effective dispersion of oil products produces small oil droplets <70 µm in size. These small droplets are buoyant in the water column where they are diluted by current and spatially distributed. In addition, these small droplets provide an ideal surface area for microbes to attach themselves, and the carbon associated with the oil droplets provides a source of energy for them. This process of dispersing oil potentially encourages other natural processes such as biodegradation of the spilled oil. The chemical dispersion of oil may be applicable to achieve a “Net Environment Benefit” where all available spill response options need to be considered. The oil spill treating agent (chemical dispersant) and mineral fines used in this study were either ineffective or partially effective when applied to the dilbit products under these limited conditions. The physical properties (e.g., density, viscosity and adhesiveness) of these products limit the effectiveness of currently-available spill treating agents, thus restricting remediation and potentially contributing to the persistence of the products in marine environments where seawater temperature is <8°C.
The wave tank studies outlined in this report were conducted under limited conditions; partially covering the temperature ranges listed in Chapters 3 and 4 and weathered dilbit products similar to “W1”.. Further work is required to determine the influence of other temperature ranges, in particular in warmer waters, on these products and how they influence the effectiveness of spill treating agents. Since the treating agents applied to the dilbit products under these conditions were ineffective to partially effective, there is no need to test products weathered beyond “W1.” Treatment of weathered dilbit products beyond “W1” would require the development of new spill treating agents.
76
7.0 Research Initiatives
7.1 Identified Knowledge Gaps from the Literature Review
From a review of the literature, a number of knowledge gaps related to dilbit and synbit were identified, including:
1. The rate of diluent evaporation could be difficult to predict during a spill. The applicability of oil spill evaporation models has not been assessed for these products.
2. How weathering of dilbit or synbit affects its tendency to float, sink or become suspended in the water column is not well known.
3. How long it might take for the oil to leave the surface in a dilbit or synbit spill is unknown, yet this is significant for the window of opportunity during spill response.
4. Research regarding how bitumen products will further biodegrade in the environment is insufficient.
5. A variety of bitumen products should be tested, including application of existing oil spill treating agents in natural sea states and environmental conditions, since diluted bitumen properties can be diverse.
7.2 Gaps Addressed Under This Research Initiative
Based on the gaps identified in the literature review (section 7.1), the following items were addressed in the present work:
7.1, Bullets 1, 2 and 3:
The physical and chemical properties were characterized for two winter dilbit blends. The oil products showed some similarities, but there were also differences in physical characteristics and chemical composition, in particular in the amount of condensate blended with the bitumen and between the bitumen feedstocks themselves. Preliminary results discussed in Chapter 3 suggest that some models of evaporation may not be very suitable to diluted bitumen products. Differences in the distillation data and in composition data for the saturate, aromatic, resin and asphaltene groups were apparent for the two dilbit types. The oil products were weathered to various degrees and their physical properties were assessed. The dilbit products and their various weathered samples were evaluated under limited environmental conditions. In their most weathered forms, the products were found to float on seawater; however, interactions with sediments can change the behaviour and fate of the products where partial sinking was observed and some suspended tarball formation occurred.
7.1, Bullet 5:
Wave tank studies were conducted on two slightly weathered dilbit products (similar to “W1” in Chapter 3) spilled on seawater, including the application of an oil spill treating agent

77
and sediment. The two dilbit products were tested in breaking and non-breaking wave conditions and in seawater at an average temperature of 8.3 ±1.3 ºC. The products applied to seawater float, and the application of chemical dispersant showed partial dispersion of the oil products under these limited test conditions. Differences in the products’ behaviour and fate included greater effectiveness for chemically-enhanced dispersion of CLB compared to AWB. Overall, under these limited conditions, the products were observed to be very sticky, and they adhered to the tank walls and absorbers, thus limiting the dispersion of the oil products.
Finally, the findings of this work should be integrated into fate and behaviour models and, eventually, incorporated into large-scale circulation models.
7.3 Gaps Identified from These Studies and Future Research Initiatives
The physical and chemical properties of the two dilbit products examined show some dissimilarity. Laboratory testing of the products and their weathered samples showed differences in their behaviour and fate when evaporated (rates of evaporation), mixed with saltwater (formations of emulsions versus entrained water mixtures), exposed to ionizing light (water uptake when forming oil-saltwater mixtures) and in how they interacted with sediments. There is lack of information on the nature of sediment interaction with dilbit products, the rate of tarball formation and mixing energy to sediment loadings required to form tarballs. In Chapter 4, it was shown that when mixed with fine- and moderate-sized sediments, the fresh-to-moderately weathered dilbit products dispersed and sank. These studies were conducted in high-energy mixing flasks in a laboratory, so it is uncertain whether dispersed products would be suspended or sink under particular natural conditions. Future work should investigate the interaction of dilbit products with suspended sediments on a larger scale and under different mixing energy regimes to determine the fate and transport of oil droplets influenced by sediment interactions (oil-sediment aggregate formation) in natural sea states and environmental conditions. Further, a range of sediment types, including natural sediments, and sediments incorporating organic material should also be included in any future testing.
Since access to products weathered in the natural environment is difficult, oil products used in these studies were synthetically weathered. It is not well understood how synthetically weathered oil products relate to various degrees of weathering of dilbit products in the natural environment based on hours, days and weeks. This point to the need for an enhanced test facility in which oil products can be exposed to controlled weathering conditions over an extended period of time, including control of temperature, illumination, and wind and wave-mixing conditions.
Laboratory studies have resulted in the measurement of physical and chemical properties of two representative dilbit products under different temperature conditions. The large-scale wave tank studies were limited to 8.3 ± 1.3ºC. Further meso-scale wave tank studies are required for other temperature ranges, to cover the whole range of surface sea temperatures experienced

78
in the Canadian marine environment. These studies are important in order to determine how warmer and colder seawater temperatures will affect the fate and behaviour of dilbit products under natural sea states. In addition, there is a need for new spill treating agents that are effective on dilbit products in seawater at temperatures below 8°C. Under these preliminary test conditions, the interaction of dilbit products with microbes and their potential to biodegrade these products have not been considered. This gap was also identified in the literature review.
The Government of Canada is working closely with academia in an effort to assess the biological effects of a dilbit spill as well as studying the effectiveness of available spill treating agents. Biological effects studies will evolve as research continues toward assessing the behaviour and fate of dilbit spilled at sea.
In order to adequately characterize the behaviour and fate of the two winter dilbit products, further studies are required:
7.3.1 Laboratory Dilbit Fate and Behaviour Studies
The preliminary buoyancy and behaviour studies on dilbit products summarized in the present work will be applied to the design of a future set of experiments to examine the nature of these interactions, to understand the rates of formation, the effects of sunlight and ionizing light exposure, the thresholds of mixing energy/sea state and sediment types and concentrations necessary to pose risks of sinking or tarball formation.
Work will also be undertaken to develop new methods for understanding oil weathering behaviour, with in-situ control of evaporation, UV exposure, shear-mixing energies and temperatures. It is anticipated that such facilities and tools will allow for improved simulation of real-world spill fates and behaviour, and also allow for long-term in-situ weathering experiments.
7.3.2 Meso-Scale Studies and In-situ Field Work
Evaluate seawater temperatures above 15ºC on spill treating agent effectiveness and their influence on the behaviour and fate of the winter dilbit products (wave tank studies);
Evaluate existing laboratory assessment methods for spill-treating effectiveness screening (e.g., the swirling flask test and the baffled flask test), and compare with the results of the wave tank studies;
Natural weathering of the winter products to establish a link with degrees of weathering in relationship to the number of days at sea and to evaluate how long the winter dilbit products will remain on the seawater surface (meso-scale and field studies);
In-situ field experiments to assess the biodegradation rates of the winter dilbit products and the products treated with dispersant to address Bullet 4 under gaps identified in the literature review and this study, both in seawater and on marine shorelines;

79
Over the next two years, the initial development of algorithms to predict the fate and transport of diluted bitumen products in the marine environment; and
Interaction of these winter dilbit products with suspended sediments in natural sea states and environmental conditions at the meso-scale in a wave tank to further evaluate the findings from the lab studies in Chapter 4 of this report.

,
80
,
8.0 References
Aijiolaiya, L.O., Hill, P.S., Khelifa, A., Islam, R.M., and Lee, K., 2006. Laboratory Investigation of the Effects of Mineral Size and Concentration on the Formation of Oil-Mineral Aggregates, Marine Pollution Bulletin, 52, pp. 920-927.
Alberta Energy, 2011. Website: www.energy.alberta.ca/OilSands/791.asp accessed August 2013.
Alberta Geological Survey, 2013. Website: www.ags.gov.ab.ca/energy/oilsands/index.html
accessed September 2013.
Amos, C., 1996. Siliciclastic tidal flats, in: Perillo, G.M.E. (Ed.), Geomorphology and sedimentology of estuaries, 2nd Edition. Elsevier, Amsterdam, pp. 273-306.
ASL Environmental Sciences Inc., 2010. Marine Physical Environmental in the CCAA Technical Data Report. Prepared for: Northern Gateway Pipelines Inc., Calgary, AB.
ASTM D 97, Standard test method for pour point of petroleum products, ASTM International, West Conshohocken, PA, 2012.
ASTM D2007, Standard Test Method for Characteristic Groups in Rubber Extender and Processing Oils and Other Petroleum-Derived Oils by the Clay-Gel Absorption Chromatographic Method, ASTM International, West Conshohocken, PA, 2011.
ASTM D 4294, Standard Test Method for Sulfur in Petroleum and Petroleum Products by Energy Dispersive X-ray Fluorescence Spectrometry, ASTM International, West Conshohocken, PA, 2010.
ASTM D 5002, Standard test method for density and relative density of crude oils by digital density analyzer, ASTM International, West Conshohocken, PA, 2010.
ASTM D7169, Standard Test Method for Boiling Point Distribution of Samples with Residues Such as Crude Oils and Atmospheric and Vacuum Residues by High Temperature Gas Chromatography, ASTM International, West Conshohocken, PA, 2011.
ASTM G173-03, Standard Tables for Reference Solar Spectral Irradiances: Direct Normal and Hemispherical on 37° Tilted Surface, ASTM International, West Conshohocken, PA, 2003.
Bernabeu, A.M., Fernández-Fernández, S., Bouchette, F., Rey, D., Arcos, A., Bayona, J.M., and Albaiges, J., 2013. Recurrent arrival of oil to Galician coast: The final step of the Prestige deep oil spill, Journal of Hazardous Materials, 250-251, pp. 82-90.
Belore, R., 2010. Technical Data Report: Properties and Fate of Hydrocarbons Associated with Hypothetical Spills at the Marine Terminal and in the Confined Channel Assessment Area, SLRoss Environmental Research Ltd., Ottawa, Ontario, 40 p. ENG exhibit number B16-31.
Brown, J., Fuentes, H., Jaffé, R., and Tsihrintzis, V., 1995. Comparative evaluation of physical and chemical fate processes of Orimulsion and fuel oil No. 6 in the Tampa Bay marine environment. In: Comparative Ecological Risk Assessment-Technical Support Document for the Comparison of the Ecological Risks to the Tampa Bay Ecosystem from Spills of

,
,
, .
81
Fuel Oil #6 and Orimulsion-Final Report, Ault, J. S., M. A. Harwell, and V. Myers, (eds.). Miami, Florida: University of Miami, Center for Marine and Environmental Analyses, Rosenstiel School of Marine and Atmospheric Science.
Bobra, M., and Tennyson, E.J., 1989. Photooxidation of Petroleum, in the Proceedings of the Twelfth Arctic Marine Oilspill Program Technical Seminar, Environment Canada, Ottawa, Ontario, pp. 129-147.
Chapman, H., Purnell, K., Law, R.J., and Kirby, M.F., 2007. The use of chemical dispersants to combat oil spills at sea: A review of practice and research needs in Europe, Marine Pollution Bulletin, 54(7), pp. 827-838.
Cheng, P., Li, D., Boruvka, L., Rotenberg, Y., and Neumann, A.W., 1990. Automation of axisymmetric drop shape analysis for measurements of interfacial tensions and contact angles, Colloids and Surfaces, 43(2), pp. 151-167.
Clark, B., Parsons, J., Yen, C., Ahier, B., Alexander, J., and Mackay, D., 1987. A Study of Factors Influencing Oil Submergence, EE-90, Environment Canada, Ottawa, Ontario, 77 p.
Clark, J., Becker, K., Venosa, A., and Lewis, A., 2005. Assessing dispersant effectiveness for heavy fuel oils using small-scale laboratory tests, in Proceedings of the International Oil Spill Conference, American Petroleum Institute, Washington, D.C., pp. 59-63.
Colcomb, K., Salt, D., Peddar, M., and Lewis, A., 2005. Determination of the limiting oil viscosity for chemical dispersion at sea, in Proceedings of the International Oil Spill Conference, American Petroleum Institute, Washington, D.C., pp. 53-58.
Cole, M., King, T., and Lee, K., 2007. Analytical technique for extracting hydrocarbons from water using sample container as extraction vessel in combination with a roller apparatus. Canadian Technical Report of Fisheries and Aquatic Sciences 2733, pp. 1-12.
Crosby, S., Fay, R., Groark, C., Kani, A., Smith, J. R., and Sullivan, T., 2013. Transporting Alberta’s Oil Sands Products: Defining the Issues and Assessing the Risks. 180 p. Website: www.crrc.unh.edu/workshops/oil_sands_washington/Final%20NOAA%20Oil%20Sands%20Report_03_22.pdf
Crude Quality Inc., 2013. Website: crudemonitor.ca, www.crudemonitor.ca/home.php accessed September 2013.
Díez, S., Jover, E., Bayona, J.M., Albaigés, J., 2007. Prestige oil spill. III. Fate of a heavy oil in the marine environment, Environmental Science and Technology, 41(9), pp. 3075-3082.
DFO, Department of Fisheries and Oceans, Coastal Shallow Water Temperature Climatology for Atlantic Canada, www2.mar.dfo-mpo.gc.ca/science/ocean/coastal_temperature/coastal_temperature.html accessed November 2013.
DFO, Department of Fisheries and Oceans, Sea Surface Temperature in the Gulf of Alaska, www.pac.dfo-mpo.gc.ca/science/oceans/data-donnees/sst-tsm/index-eng.html accessed November 2013.
82
Drelich, J., Fang, Ch., and White, C.L., 2002. Measurement of interfacial tension in fluid-fluid systems. Encyclopedia of Colloid Science, pp. 3152-3165.
Drennan, W.M., Donelan, M.A., Terray, E.A., and Katsaros, K.B. 1996. Oceanic turbulence dissipation measurements in SWADE. Journal of Physical Oceanography, 26(5), pp. 808-815.
ENG, 2011. Enbridge Northern Gateway, 2011, Information Requests Round # 1 to the Applicant Government of Canada, ENG JRP Exhibit #B41-4, 246 p.
Environment Canada, 2006. Oil Properties Database. www.etc-cte.ec.gc.ca/databases/OilProperties/oil_prop_e.html accessed August 2013.
EPA, 2013. Dredging Begins on Kalamazoo River, www.epa.gov/enbridgespill/pdfs/enbridge_fs_201308.pdf, accessed October 2013.
ERCB, 2013. Energy Resources Conservation Board, 2013. Alberta’s Energy Reserves 2012 and Supply/Demands Outlook 2013-2022, ST98-2013, p3-1. www.aer.ca/documents/sts/ST98/ST98-2013.pdf accessed November 2013.
Fieldhouse, B.G., Hollebone, B.P., Singh, N.R., Tong, T.S., and Mullin, J.V., 2010. Artificial Weathering of Oils by Rotary Evaporator, Proceedings of the Thirty-third AMOP Technical Seminar on Environmental Contamination and Response, Environment Canada, Ottawa, Ontario, pp. 159-180.
Fingas, M. 1999. Evaporation of oil spills: development and implementation of new prediction methodology, in Proceedings of the International Oil Spill Conference, American Petroleum Institute, Washington, D.C., pp. 281-287.
Fingas, M., 2004. Modeling evaporation using models that are not boundary-layer regulated Journal of Hazardous Materials, 107(1-2), pp. 27-36.
Fingas, M., and Fieldhouse, B, 2006. A Review of Knowledge on Water-in-oil Emulsions, in Proceedings of the Twenty-ninth Arctic and Marine Oilspill Program Technical Seminar, Environment Canada, Ottawa, Ontario, pp. 1-56.
Fingas, M., Fieldhouse, B., Wang, Z., and Landriault, M., 2005. The dynamics of Orimulsion in water with varying energy, salinity and temperature, in Proceedings of the International Oil Spill Conference, American Petroleum Institute, Washington, D.C., pp. 11408-11411.
Fingas, M., Hollebone, B., Wang, Z., Smith, P., and MacKay, R., 2003. The properties of heavy oils and Orimulsion: Another look, in Proceedings of the Twenty-sixth Arctic and Marine Oilspill Program Technical Seminar, Environment Canada, Ottawa, Ontario, pp. 43-62.
Galbraith, P.S., Larouche, P., Chasse, J., Petrie, B., 2012. Sea-surface temperature in relation to air temperature in the Gulf of St. Lawrence: Interdecadal variability and long term trends, Deep-Sea Research II: Topical Studies in Oceanography, 77-80, pp.10–20
Guitart, C., Frickers, P., Horrilla-Carballo, J., Law, R.J., and Readman, J.W. Characterization of sea surface chemical contamination after shipping accidents. Environmental Science and Technology, 42(7), pp. 2275-2282.
Harper, J.R. and Kory, M., 1997. “Orimulsion: Sediment Interaction Experiments,”, Environment Canada, Ottawa, ON, 45 p.

83
Harper, J.R. and Ward, S., 2003. “Adhesion and Removal of Orimulsion Bitumen from Rock Surfaces,” Environment Canada, Edmonton, Alberta, 51 p.
Hollebone, B., Wang, Z., Landriault, M., and Smith, P., 2003. A New Method for the Determination of the Hydrocarbon Groups in Oils: Saturates, Aromatics Resins and Asphaltenes (SARA), in Proceedings of the Twenty-sixth Arctic and Marine Oilspill Program Technical Seminar, Environment Canada, Ottawa, Ontario, pp. 31-42.
Hollebone, B., 2010. “Measurement of Oil Properties,” in Oil Spill Science and Technology, Ed. M. Fingas, Elsevier Inc., Oxford, UK, pp. 63-85.
King, T., Clyburne, J.A.C., Lee, K. and Robinson, B., 2013. Interfacial film formation: Influence on oil spreading rates in lab basin tests and dispersant effectiveness testing in a wave tank. Marine Pollution Bulletin, 73(1-2), pp. 83-91.
Kostaschuk, R.A., Stephan, B.A., and Luternauer, J.L., 1993. Suspended sediment concentration in a buoyant plume: Fraser River, Canada, Geo-Marine Letters, 13(3), pp. 165-171.
Jokuty P, Whiticar S, Wang Z, Doe K, Fieldhouse B, and Fingas M. 1999. Orimulsion-400: A comparative study. Report EE-160. Environment Canada, Ottawa, ON.
Lee, K., Bugden, J., Cobanli, S., King, T., McIntyre, C., Robinson, B., Ryan, S., Wohlgeschaffen, G., 2012. UV- Epifluorescence Microscopy Analysis of Sediments Recovered from the Kalamazoo River, U.S. EPA Kalamazoo Administrative Record, document #1277, www.epa.gov/enbridgespill/ar/enbridge-AR-1277.pdf, accessed November 2013.
Lee, S.C., D. Mackay, F. Bonville, E. Joner and W.Y. Shiu, 1999, “A Study of the Long-Term Weathering of Submerged and Overwashed Oil”, in Proceedings of the Twelfth Arctic Marine Oilspill Program Technical Seminar, Environment Canada, Ottawa, Ontario, pp. 33-60.
Li, Z., Lee, K., King, T., Boufadel, M. C., and Venosa, A. D., 2008. Assessment of chemical dispersant effectiveness in a wave tank under regular non-breaking and breaking wave conditions. Marine Pollution Bulletin, 56(5), pp. 903-912.
Li, Z., Lee, K., King, T., Boufadel, M. C., and Venosa, A. D., 2009a. Evaluating crude oil chemical dispersion efficacy in a flow-through wave tank under regular non- breaking wave and breaking wave conditions. Marine Pollution Bulletin, 58(5), pp. 735-744.
Li, Z., Lee, K., King, T., Kepkay, P., Boufadel, M., and Venosa, A., 2009b. Evaluating chemically dispersant efficacy in a wave tank: dispersant effectiveness as a function of energy dissipation rate. Environmental Engineering Science, 26(6), pp. 1139-1148.
Li, Z., Lee, K., King, T., Boufadel, M. C., and Venosa, A. D., 2010. Effects of temperature and wave conditions on chemical dispersion efficacy of heavy fuel oil in an experimental flow-through wave tank. Marine Pollution Bulletin, 60(9), pp. 1550-1559.
Lunel, T., and Davies, L., 2001. Response to Bunker Fuel Oil: The Options, in Proceedings of the International Oil Spill Conference, American Petroleum Institute, Washington, D.C., pp. 597-603.
Maki, H., and Sasaki, T., 1997. Analytical method of crude oil and characterization of spilled heavy oil. Journal Japan Society on Water Environment, 20(9), pp. 639-642.
Michel, J., 2010. “Submerged Oil” in in Oil Spill Science and Technology, Ed. M. Fingas, Elsevier Inc., Oxford, UK, pp. 959-981.

84
NEB, 2012. National Energy Board, Enbridge Northern Gateway Project Joint Review Panel, http://gatewaypanel.review-examen.gc.ca/clf-nsi/prtcptngprcss/rlsttmntmp-eng.html, accessed November 2013.
NRC, 1999, Spills of Nonfloating Oils: Risk and Response, National Academy of Science, National Research Council, Washington, D.C., 88 p.
Ostazeski, S. A., Macomber, S. C., Roberts, L. G., Uhler, A. D., Bitting, K. R., and Hiltabrand, R., 1997. The Environmental Behavior of Orimulsion Spilled on Water, in Proceedings of the International Oil Spill Conference, American Petroleum Institute, Washington, D.C., Vol. 1997, pp. 469-477.
Owens, E.H., Taylor, E., Humphrey, B., 2008. The persistence and character of stranded oil on coarse-sediment beaches, Marine Pollution Bulletin, 56(1), pp. 14-26.
Owens, E.H. 2010. Shoreline response and long-term oil behaviour studies following the 1970 “Arrow” spill in Chedabucto Bay, NS, in Proceedings of the Thirty-third AMOP Technical Seminar on Environmental Contamination and Response, Environment Canada, Ottawa, Ontario, pp. 207-221.
Read, J., and Whiteoak, D., 2003. The Shell Bitumen Handbook, 5th edition, Thomas Telford Publishing, London, UK, 460 p.
SL Ross Environmental Research Ltd., 2013. Meso-scale Weathering of Cold Lake Bitumen/Condensate Blend, Ottawa, Ontario, 2012, 27 p., ENG JRP Exhibit #B193-2.
Spieweck, F., and Bettin, H., 1992. Review: Solid and liquid density determination, Technisches Messen, 59, pp. 285-292.
Stevens, L., and Roberts, J., 2003. Dispersant effectiveness on heavy fuel oil and crude oil in New Zealand, in Proceedings of the International Oil Spill Conference, American Petroleum Institute, Washington, D.C., Vol. 2003, No. 1, pp. 509-513.
Stantec Consulting Ltd., 2012a. Technical Data Report: Ecological and Human Health Risk Assessment for Pipeline Spills, Calgary, Alberta, ENG JRP Exhibit #B80-2, 94 p.
Stantec Consulting Ltd., 2012b. Summary of Clean up and Effects of the 2007 Spill of Oil from the Trans Mountain Pipeline to Burrard Inlet, www.transmountain.com/uploads/pages/1374960812-2012-Summary-2007-Spill-
Clean-Up---Effects-REV2.pdf accessed October 2013. Stout, S. A. 1999. Predicting the Behavior of Orimulsion Spilled on Water. U.S. Department of
Transportation, Project No. 4120.11/UDI283, U.S. Coast Guard, Groton, Connecticut. Stronach, J., Wang, E., Draho, B., and Miguez, T., 2010. Wind observations in Douglas Channel,
Squally Channel, and Caamano. Hayco Technical Data Report, www.ceaa.gc.ca/050/documents_staticpost/cearref_21799/2431/Wind_1of3.pdf accessed November, 2013.
Terray, E.A., Donelan, M.A., Agrawal, Y.C., Drennan, W.M., Kahman, K.K., Williams, A.J., Hwang, P.A., and Kitaigorodskii, S.A., 1996. Estimate of kinetic energy dissipation under breaking waves. Journal of Physical Oceanography, 26(5), pp. 792-807.

85
Transport Canada, 1995. Response Organizations Standards, Marine Safety Publication TP 12401. www.tc.gc.ca/eng/marinesafety/tp-tp12401-menu-2162.htm accessed October 2013.
Transport Canada, 2013. Website: www.tc.gc.ca/eng/mediaroom/releases-2013-h031e-7089.htm accessed August 2013.
TSB, 2007. Transportation Safety Board of Canada Pipeline Investigation Report P07H0040. www.tsb.gc.ca/eng/rapports-reports/pipeline/2007/p07h0040/p07h0040.asp accessed August 2013.
Trudel, B., Belore, R., Guarino, A., Lewis, A., and Mullin, J., 2005. Determining the viscosity limits for effective chemical dispersion: relating Ohmsett results to those from tests at-sea, in Proceedings of the International Oil Spill Conference, American Petroleum Institute, Washington, D.C., pp. 71-76.
Uncles, R.J., Stephens, and J.A, Smith, R.E., 2002. The dependence of estuarine turbidity on tidal intrusion length, tidal range and residence time, Continental Shelf Research, 22, pp. 1835-1856.
UNESCO, 1981. Tenth report of the Joint Panel on Oceanographic Tables and standards, UNESCO Technical Papers in Marine Science 36, United Nations Educational, Scientific and Cultural Organization, Division of Marine Sciences, Paris, France, 28 p.
US Environmental Protection Services, 1996. EPA Method 8270C: Semivolatile Organic Compounds by Gas Chromatography/Mass Spectrometry. Revision 3, pp. 1-54.
US Geological Survey 2006. National Assessment of Oil and Gas Fact Sheet: Natural Bitumen Resources of the United States (Vol. 2006–3133).
Wang, Z. D., Fingas, M. and Li, K., 1994. Fractionation of ASMB Oil, Identification and Quantitation of Aliphatic Aromatic and Biomarker Compounds by GC/FID and GC/MSD (Parts I and II), Journal of Chromatographic Science, Vol. 32, pp. 361-382.
Wang Z, and Fingas, M. 1996. Separation and characterization of petroleum hydrocarbons and surfactant in Orimulsion dispersion samples. Environ. Sci. Technol., Vol. 30, pp. 3351-3361.
WEC, 2010. World Energy Council “2010 Survey of Energy Resources. Natural Bitumen and Extra-Heavy Oil”, – Chapter 4, pp. 123-150. energy.usgs.gov/portals/0/Rooms/economics/text/WEC10NBEHO.pdf, accessed November 2013.
Wickley-Olsen, E., Boufadel, M., King, T., Li, Z., Lee, K., and Venosa, A., 2008. Regular and breaking waves in a wave tank for dispersion effectiveness testing, in the Proceedings of the International Oil Spill Conference, American Petroleum Institute, Washington, D.C., pp. 499-508.
Yang, C., Wang, Z., Yang, Z., Hollebone, B.P., Brown, C.E., Landriault, M. and Fieldhouse, B., 2011. Chemical Fingerprints of Alberta Oil Sands and Related Petroleum Products, Environmental Forensics, 12(2), pp. 173-188.