federal aviation optimization of airspace administration
TRANSCRIPT

Federal Aviation Administration 1
Optimization of Airspace and Procedures in the
Metroplex (OAPM)
Presentation To: Phoenix Facilities and Industry Name: Phoenix OAPM Study Team Date: April 3 & 4, 2013
Federal Aviation Administration
Phoenix Metroplex Study Team Final Outreach
Federal Aviation Administration 2
Agenda
• Overview of Process • Industry Comments • Analysis Methodology • Identified Issues/Procedures, Proposed Solutions, Benefits/Impacts/Risks
and Analysis Results • Alternate Procedures • Satellite Airports • RNP Procedures • Issues for Consideration During the Design Phase • Summary of Potential Benefits • Plan Forward – Dennis Roberts, Director, ATO Airspace Services, AJV-1

Federal Aviation Administration 3
Overview of Process

Federal Aviation Administration 4
OAPM Study Team Process
• Kickoff Meeting • Discuss concepts and proposed schedules • Establish facility POCs • Make data requests
• Administrative Week • First Outreach: Existing Operations and Planning • Study Team Work (focus on operational challenges) • Second Outreach: Enhancement Opportunities • Study Team Work (focus on solutions, costs, and benefits) • Final Outreach: Summary of Recommendations • Final Documentation
• April 19, 2013

Federal Aviation Administration 5
Focus of the Phoenix Study Team
• Addressing issues through the implementation of Performance Based Navigation (PBN) procedures and airspace optimization enabling predictable, repeatable flight paths; improved situational awareness; reduced Air Traffic Control (ATC) task complexity; and increased efficiency – Collaboratively identify and characterize existing issues – Propose conceptual PBN procedures that increase efficiency and address
the identified issues • Identification of considerations, risks, and benefits associated with the
proposed changes • Quantification of potential annual benefits by comparing distance, flight
time, fuel burn, and carbon emissions between the currently flown tracks and proposed PBN procedures

Federal Aviation Administration 6
Industry Comments

Federal Aviation Administration 7
Industry Participants
Wes Googe – US Airways B737 Check Airman/Tech Pilot
Marv Meng – Southwest Airlines RNP Development/Line Pilot

Federal Aviation Administration 8
Analysis Methodology

Federal Aviation Administration 9
Key Assumptions and Benefit Mechanisms
• All proposed routes/procedures are based on PBN • Final design details (altitudes, speeds, transitions, etc.) will be
determined during the Design Phase • Lateral and Vertical Benefits:
– Lateral • Current track data is compared to Study Team proposed procedure • Current published procedures are compared to Study Team proposed
procedures – Vertical
• Current vertical profile is compared to Study Team proposed procedures

Federal Aviation Administration 10
Qualitative and Quantitative Assessments
• Qualitative Assessments – Impact on ATC task complexity – Ability to apply procedural deconfliction (e.g., laterally or vertically
segregated flows) – Ability to enhance safety – Reduction in transmissions (cockpit and controller) – Impact on Phoenix airport interdependencies
• Quantitative Assessments of Baseline and Proposed Procedures – Time/distance spent in level flight – Track length changes – Fuel loading – Fuel burn by aircraft type – Carbon emissions

Federal Aviation Administration 11
Tools and Techniques
• PDARS (Performance Data Analysis and Reporting System) • Quantify level flight segments • Visually represent current issues • Analyze traffic counts and runway/flow usage • Compare current vs. proposed procedures
• TARGETS (Terminal Area Route Generation Evaluation and Traffic
Simulation) • Compare actual tracks to current routes • Compare current vs. proposed procedures • Develop proposed PBN routes
Federal Aviation Administration 12
Tools and Techniques
• NTML (National Traffic Management Log) – Identify occurrence and magnitude of Traffic Management Initiatives (TMIs)
• ETMS (Enhanced Traffic Management System) – Count annual traffic by aircraft categories
• ATA Lab (Air Traffic Airspace Lab) National Offload Program (NOP) Data queries – Generate baseline track samples for use in visualization and analysis – Identify runway usage over time
• Flight Simulations – A320, B737

Federal Aviation Administration 13
Analysis Assumptions
• Four high-volume traffic days were utilized for visualization of directional traffic flow for various airports
– 10/12/11 – 01/12/12 – 04/27/12 – 07/14/12
• Based on historical flow configurations, Phoenix operations are 60 percent west and 40 percent east
• All fuel burn and emissions estimates are annualized, assuming a fuel price per gallon of $2.96
– Based on fuel costs for Calendar Year 2012 from Research and Innovative Technology Administrations (RITA) Bureau of Transportation Statistics
• http://www.transtats.bts.gov/fuel.asp
• Fuel loading assumption (cost to carry): 10% additional fuel required – Standards provided by industry representatives – Cost to carry for wide body and/or international operations may be significantly
higher

Federal Aviation Administration 14
Analysis Methodology
• Fuel burn modeling was performed for Phoenix Sky Harbor International Airport (KPHX) with filed IFR operations
• Procedures were developed but not modeled for the following airports: • Scottsdale (KSDL) • Phoenix-Mesa Gateway (KIWA) • Phoenix Deer Valley (KDVT)
• Traffic from the entire month of July 2011, was selected for the preparation of traffic baselines and fuel burn analysis • The National Analysis Team (NAT) examined the month of track data and
the Study Team proposed procedures to build flight profile models • The NAT then applied the European Organization for the Safety of Air
Navigation (EUROCONTROL) Base of Aircraft Data (BADA) fuel flow model and flight simulations to determine a range of fuel burn and emissions for both level-offs and distances
Federal Aviation Administration 15
Number of Operations and Modeled Fleet Mix
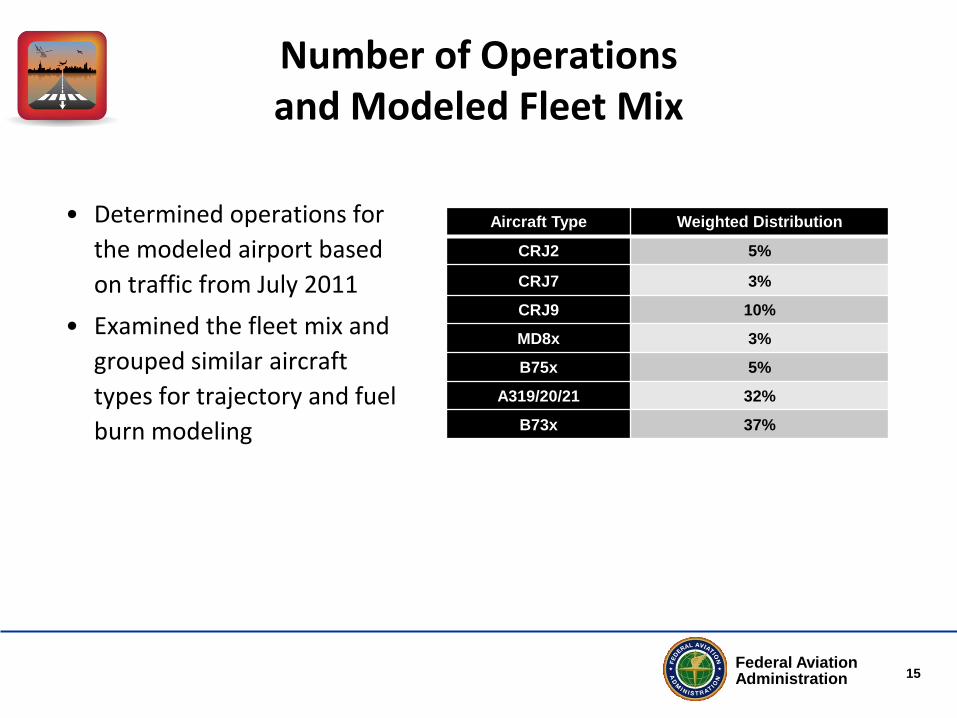
• Determined operations for the modeled airport based on traffic from July 2011
• Examined the fleet mix and grouped similar aircraft types for trajectory and fuel burn modeling
Aircraft Type Weighted Distribution
CRJ2 5%
CRJ7 3%
CRJ9 10%
MD8x 3%
B75x 5%
A319/20/21 32%
B73x 37%

Federal Aviation Administration 16
Sample Analysis Walkthrough
• Analyze level-offs and track length using 30 days of data
• Develop baseline routes that mimic the average vertical and lateral path of the tracks in the flow
• Develop proposed route • Estimate impacts of the proposed route
compared to the current published procedure and the baseline route • Vertical
Compare current vertical path with associated level-offs to proposed vertical path with fewer or shorter level-offs
• Lateral Filed miles = published route – proposed route Distance = baseline route – proposed route
• Estimated fuel and cost savings Filed miles savings = Cost to carry only Distance savings = Fuel savings + cost to carry Profile savings = Fuel savings + cost to carry
Filed mile savings
Distance savings
Published procedure Baseline route Proposed route
Level-offs
Level-offs mitigated
Baseline
Proposal

Federal Aviation Administration 17
Benefits Sample
*Based on a fuel cost of $2.96 per gallon

Federal Aviation Administration 18
Identified Issues, Proposed Solutions, Benefits/Impacts/Risks and Analysis Results

Federal Aviation Administration 19
Design Concepts and PBN Benefits
• PBN Procedures: • Optimized profile descents/climbs • Optimized lateral paths • Proposed runway transitions • Removed unused transitions from current procedures
• Transitional Separation (terminal to en route) • 3NM increasing to 5NM aircraft separation where practical
• PBN Benefits Include: • Predictable, repeatable flight paths • Reduced ATC/Pilot task complexity • Reduced frequency congestion • Potential for increased airspace throughput • Accurate fuel planning • Deconflicted STARs and SIDs where possible
Federal Aviation Administration 20
Review of Issue Statements and
Potential Solutions

Federal Aviation Administration 21
Phoenix SIDs

22 Federal Aviation Administration
SIDs Benefits and Impacts
FAA Operational/Safety Benefits Impacts/Risks
• PBN benefits • Increased airspace throughput • Reduced vectoring • Optimized lateral/vertical flight
paths • ATC task complexity
• LOA revisions • Training • Sectorization
Airspace User Benefits Impacts/Risks
• PBN benefits • Reduced fuel burn and carbon
emissions
• Chart clutter
Environmental Considerations • Noise screening/analysis • Emissions analysis • Runway transition assessment

Federal Aviation Administration 23
Phoenix SIDs
Northeast • YOTES • FORPE • FTHLS
Southeast • SHRIF • BNYRD
Southwest • GBEND • HBUUB
Northwest • ZEPER • SNOBL

Federal Aviation Administration 24
YOTES RNAV SID

Federal Aviation Administration 25
YOTES SID
Identified Issues • Lack of RNAV procedure • Inefficient lateral paths
Conceptual Solutions • RNAV SID • Optimized lateral paths to
reduce flight track miles • RNAV VM leg (radar vectors) to
join the course
ST Proposed Current

Federal Aviation Administration 26
YOTES SID Terminal View
ST Proposed
210 KTS

Federal Aviation Administration 27
YOTES SID En Route View
ST Proposed Current

Federal Aviation Administration 28
YOTES SID
*Based on a fuel cost of $2.96 per gallon

Federal Aviation Administration 29
FORPE RNAV SID

Federal Aviation Administration 30
FORPE SID
Identified Issues • Lack of RNAV procedure • Connectivity to MAXXO
(FTHLS)
Conceptual Solutions • RNAV SID • Optimized lateral paths
to reduce flight track miles
• RNAV VM leg (radar vectors) to join the course when on a west flow
• RNAV off-the-ground when on an east flow
ST Proposed Current

Federal Aviation Administration 31
FORPE SID Terminal View
ST Proposed
210 KTS

Federal Aviation Administration 32
FORPE SID En Route View
ST Proposed Current

Federal Aviation Administration 33
FORPE SID
*Based on a fuel cost of $2.96 per gallon

Federal Aviation Administration 34
FTHLS RNAV SID

Federal Aviation Administration 35
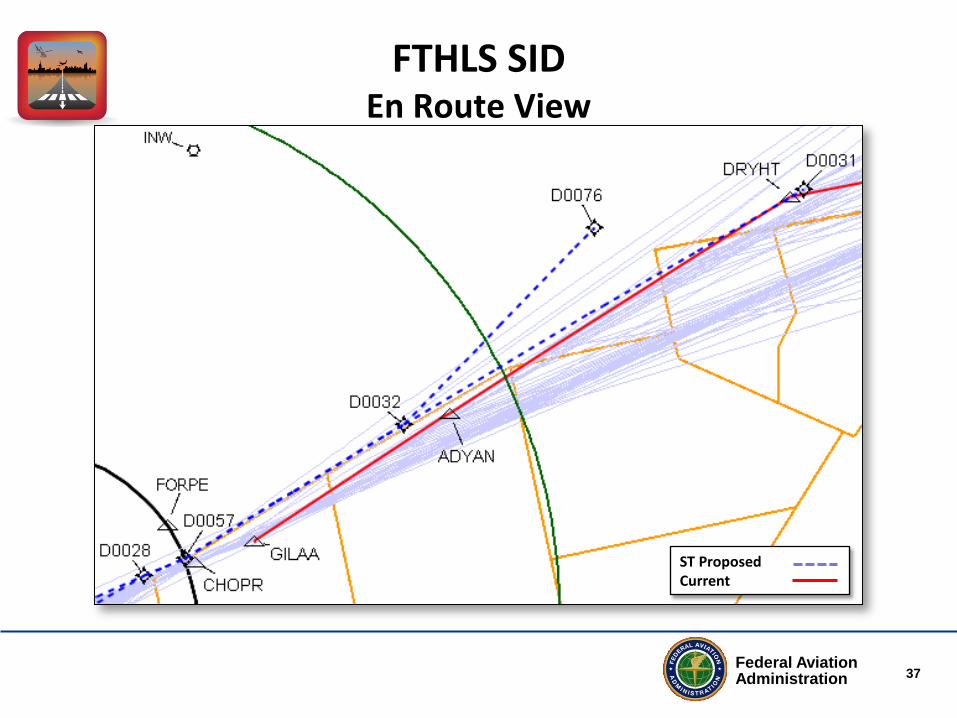
FTHLS SID
Identified Issues • Lack of RNAV procedure • Lack of connectivity to SJN SID
(FORPE)
Conceptual Solutions • RNAV SID • Connectivity to SJN SID
(FORPE) • Optimized lateral paths to
reduce flight track miles • RNAV VM leg (radar vectors) to
join the course when on a west flow
• RNAV off-the-ground when on an east flow
ST Proposed Current

Federal Aviation Administration 36
FTHLS SID Terminal View
ST Proposed Current
210 KTS
Federal Aviation Administration 37
FTHLS SID En Route View
ST Proposed Current

Federal Aviation Administration 38
FTHLS SID
*Based on a fuel cost of $2.96 per gallon

Federal Aviation Administration 39
SHRIF RNAV SID

Federal Aviation Administration 40
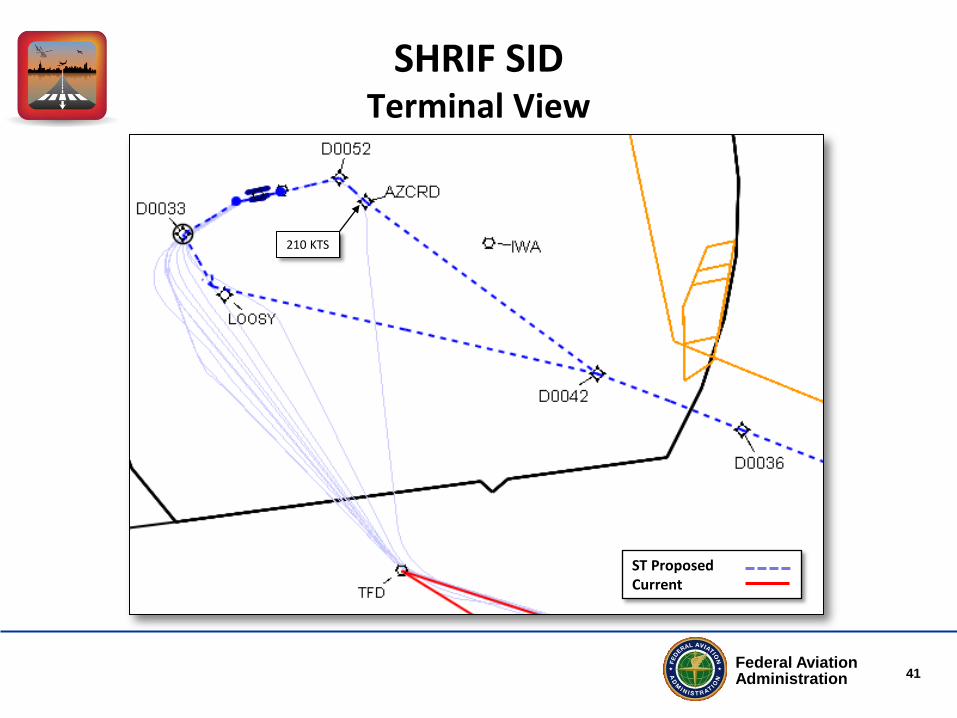
SHRIF SID
Identified Issues • Lack of RNAV procedure • Inefficient lateral paths
Conceptual Solutions • RNAV SID • Optimized lateral paths to reduce flight track miles • RNAV VM leg (radar vectors) to join the course when on
a west flow • RNAV off-the-ground when on an east flow
ST Proposed Current
Federal Aviation Administration 41
SHRIF SID Terminal View
ST Proposed Current
210 KTS

Federal Aviation Administration 42
SHRIF SID En Route View
ST Proposed Current
Federal Aviation Administration 43
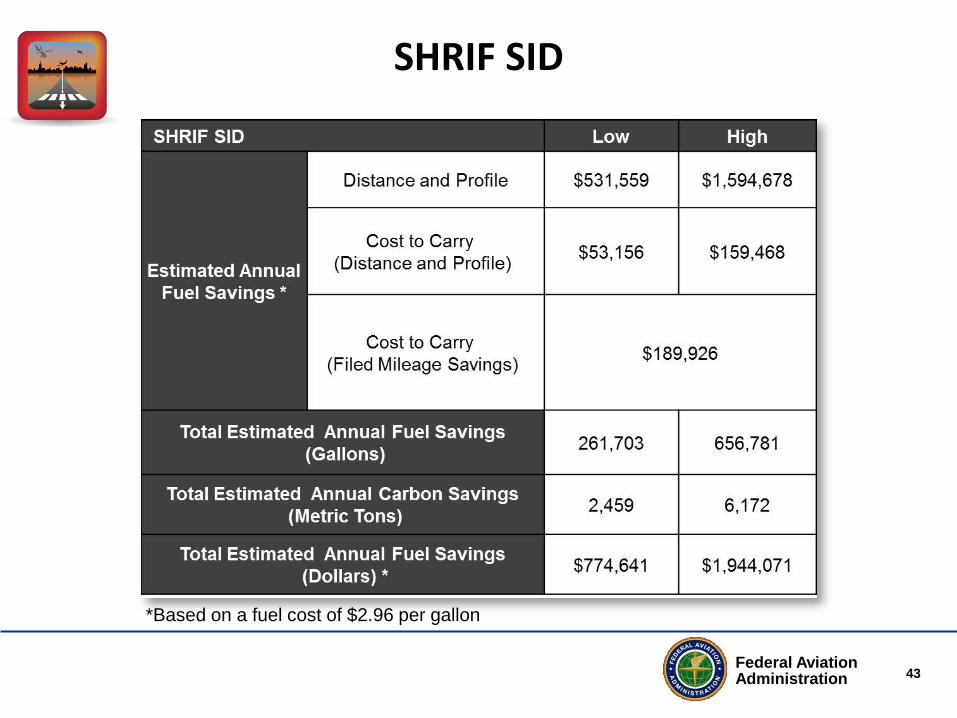
SHRIF SID
*Based on a fuel cost of $2.96 per gallon

Federal Aviation Administration 44
BNYRD RNAV SID

Federal Aviation Administration 45
BNYRD SID
Identified Issues • Lack of RNAV procedure
Conceptual Solutions • RNAV specifically designed for
TUS/Mexico • Optimized lateral paths to reduce
flight track miles • RNAV VM leg (radar vectors) to
join the course when on a west flow
• RNAV off-the-ground when on an east flow
ST Proposed Current

Federal Aviation Administration 46
BNYRD SID Terminal View
ST Proposed Current
210 KTS

Federal Aviation Administration 47
BNYRD SID En Route View
ST Proposed Current

Federal Aviation Administration 48
BNYRD SID
*Based on a fuel cost of $2.96 per gallon

Federal Aviation Administration 49
GBEND RNAV SID

Federal Aviation Administration 50
GBEND SID
Identified Issues • Lack of RNAV procedure
Conceptual Solutions • RNAV SID • Optimized lateral paths to
reduce flight track miles • RNAV VM leg (radar vectors) to
join the course when on a west flow
• RNAV off-the-ground when on an east flow
ST Proposed Current

Federal Aviation Administration 51
GBEND SID Terminal View
ST Proposed Current
210 KTS

Federal Aviation Administration 52
GBEND SID En Route View
ST Proposed Current

Federal Aviation Administration 53
GBEND SID
*Based on a fuel cost of $2.96 per gallon

Federal Aviation Administration 54
HBUUB RNAV SID

Federal Aviation Administration 55
HBUUB SID
Identified Issues • Lack of RNAV procedure • Inefficient lateral paths • Unused transitions
Conceptual Solutions • Optimized lateral paths to reduce flight
track miles • RNAV off-the-ground
ST Proposed Current

Federal Aviation Administration 56
HBUUB SID Terminal View
ST Proposed Current
AT OR ABOVE 7000
210 KTS

Federal Aviation Administration 57
HBUUB SID En Route View
ST Proposed Current

Federal Aviation Administration 58
HBUUB SID
*Based on a fuel cost of $2.96 per gallon

Federal Aviation Administration 59
ZEPER RNAV SID

Federal Aviation Administration 60
ZEPER SID
Identified Issues • Lack of RNAV procedure • Inefficient lateral paths • Unused transitions
Conceptual Solutions • RNAV SID • Optimized lateral paths to
reduce flight track miles • RNAV VM leg (radar
vectors) to join the course when on an east flow
• RNAV off-the-ground when on a west flow
ST Proposed Current

Federal Aviation Administration 61
ZEPER SID Terminal View
ST Proposed Current
210 KTS

Federal Aviation Administration 62
ZEPER SID En Route View
ST Proposed Current

Federal Aviation Administration 63
ZEPER SID
*Based on a fuel cost of $2.96 per gallon

Federal Aviation Administration 64
SNOBL RNAV SID

Federal Aviation Administration 65
SNOBL SID
Identified Issues • Lack of RNAV procedure • Unused transitions • Connectivity to Q35
Conceptual Solutions
• RNAV SID • Optimized lateral paths to reduce
flight track miles • Procedure ends prior to GCN • RNAV VM leg (radar vectors) to
join the course
ST Proposed Current

Federal Aviation Administration 66
SNOBL SID Terminal View
ST Proposed
210 KTS

Federal Aviation Administration 67
SNOBL SID En Route View
ST Proposed Current

Federal Aviation Administration 68
SNOBL SID
*Based on a fuel cost of $2.96 per gallon

Federal Aviation Administration 69
Phoenix SID Benefits
Federal Aviation Administration 70
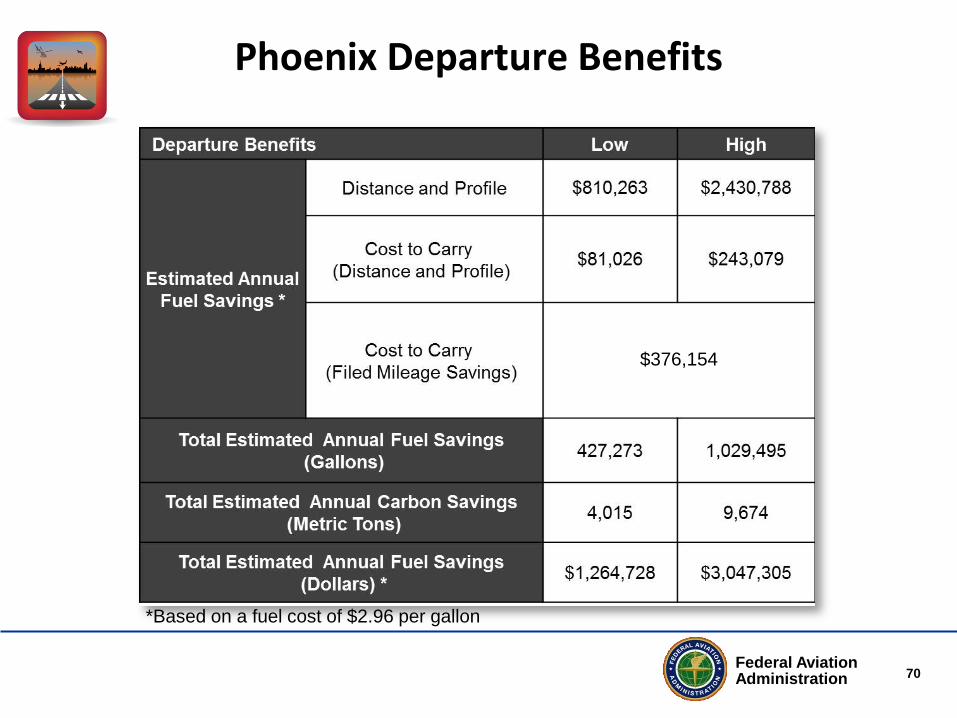
Phoenix Departure Benefits
*Based on a fuel cost of $2.96 per gallon
$376,154

Federal Aviation Administration 71
Phoenix STARs

72 Federal Aviation Administration
STARs Benefits and Impacts
FAA Operational/Safety Benefits Impacts/Risks
• PBN benefits • Increased airspace throughput • Multiple runway transitions • Reduced vectoring
• Runway transitions • LOA revisions • Training • Sectorization
Airspace User Benefits Impacts/Risks
• PBN benefits • Reduced fuel burn and carbon
emissions
• Preferred runway assignment
Environmental Considerations • Noise screening/analysis • Emissions analysis • Runway transition assessment

Federal Aviation Administration 73
Phoenix STARs
Northeast • EAGUL Primary OPD • Offload OPD/Turboprop
Southeast • PINNG Primary OPD • Turboprop Offload
Southwest • HYDRR North OPD • HYDRR Southwest OPD • Turboprop Offload
Northwest • BROAK OPD

Federal Aviation Administration 74
EAGUL Primary OPD STAR

Federal Aviation Administration 75
EAGUL OPD STAR (Primary)
Identified Issues • Dogleg at PAYSO (compression issue) • Turboprops restrict descend via • J74 Interaction (TINIZ restriction) • Terminal compression/vectors
Conceptual Solutions • RNAV STAR with Optimized Profile
Descent (OPD) • Optimized lateral paths to reduce flight
track miles • Transitions for east and west flows • Offload STAR • Floating fix for crossovers
ST Proposed Current

Federal Aviation Administration 76
EAGUL OPD STAR (Primary) En Route View
ST Proposed Current
AT OR BELOW FL330

Federal Aviation Administration 77
EAGUL OPD STAR (Primary) Terminal View
ABOVE 4000
AT 7000
AT OR BELOW 17000
ST Proposed Current
AT OR ABOVE 4000

Federal Aviation Administration 78
EAGUL OPD STAR (Primary)
*Based on a fuel cost of $2.96 per gallon

Federal Aviation Administration 79
EAGUL Offload OPD STAR

Federal Aviation Administration 80
EAGUL OPD STAR (Offload)
Identified Issues • Turboprops restrict descend via • Terminal compression/vectors
Conceptual Solutions
• RNAV STAR with Optimized Profile Descent (OPD)
• Optimized lateral paths to reduce flight track miles
• Transitions for east and west flows • Turboprop offload developed • Floating fix for crossovers
ST Proposed Current

Federal Aviation Administration 81
EAGUL OPD STAR (Offload) En Route View
ST Proposed Current
AT OR BELOW FL330

Federal Aviation Administration 82
EAGUL OPD STAR (Offload) Terminal View
AT OR BELOW 17000
ST Proposed Current
AT 11000
AT 5000

Federal Aviation Administration 83
EAGUL OPD STAR (Offload)
*Based on a fuel cost of $2.96 per gallon

Federal Aviation Administration 84
PINNG OPD STAR

Federal Aviation Administration 85
PINNG OPD STAR
Identified Issues • Turboprops restrict descend via • Parachute areas • International route restrictions
Conceptual Solutions • RNAV STAR with Optimized Profile
Descent (OPD) • Optimized lateral paths to reduce
arrival/departure interaction • Transitions for east and west flows • Common fix in ZAB airspace • IAF for RNAV arrival to Runway 26 • Create a turboprop offload STAR* *Satellite turbojet arrivals can be routed on the
PINNG or offload procedure
ST Proposed Current

Federal Aviation Administration 86
PINNG OPD STAR En Route View
ST Proposed Current
AT OR BELOW FL280
AT OR ABOVE 15000

Federal Aviation Administration 87
PINNG OPD STAR Terminal View
ST Proposed Current
AT OR ABOVE 15000
AT 5000
AT OR ABOVE 7000
AT 4000

Federal Aviation Administration 88
PINNG OPD STAR
*Based on a fuel cost of $2.96 per gallon
Federal Aviation Administration 89
Southeast Turboprop/Satellite STAR

Federal Aviation Administration 90
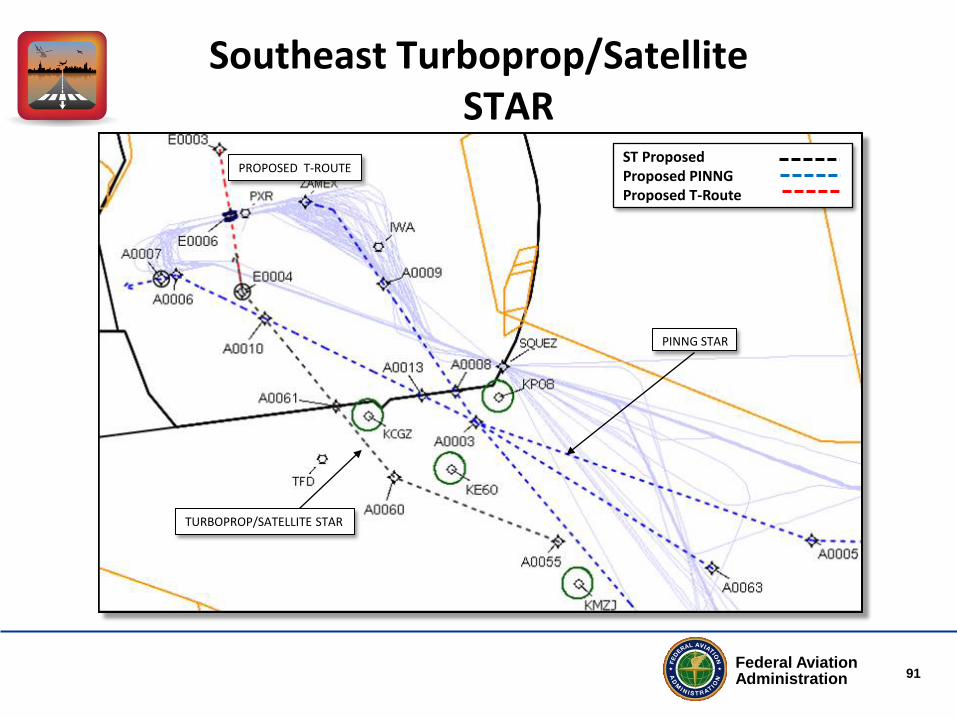
Southeast Turboprop/Satellite STAR
Identified Issues • PHX turboprops/satellite
arrivals restrict descend via on PHX arrivals
Conceptual Solutions • Laterally segregated from
PINNG RNAV OPD • Connectivity to proposed
T-Route • RNAV STAR for:
• PHX turboprops • Satellite arrivals*
* Satellite turbojet arrivals can be routed on the PINNG or offload procedure
ST Proposed
Federal Aviation Administration 91
Southeast Turboprop/Satellite STAR
PINNG STAR
TURBOPROP/SATELLITE STAR
PROPOSED T-ROUTE ST Proposed Proposed PINNG Proposed T-Route

Federal Aviation Administration 92
HYDRR North/South OPD STARs

Federal Aviation Administration 93
HYDRR North/South OPD STAR
Identified Issues • Turboprops restrict descend via • South satellite airport flow interactions • Limited airspace to blend two feeds • Inefficient lateral paths • ZLA-ZAB LOA constraints
Conceptual Solutions • RNAV STAR with Optimized Profile Descent (OPD) • Optimized lateral paths to reduce flight track
miles • Transitions for east and west flows • PHX turboprop/satellite offload route • Segregated MOHAK flow
ST Proposed Current

Federal Aviation Administration 94
HYDRR North OPD STAR

Federal Aviation Administration 95
HYDRR North OPD STAR En Route View
ST Proposed Current 19000
12000
33000 28000

Federal Aviation Administration 96
HYDRR North OPD STAR Terminal View
11000 10000
AT 7000
AT OR BELOW 16000
AT OR ABOVE 9000
AT 7000
ST Proposed Current

Federal Aviation Administration 97
HYDRR North OPD STAR
*Based on a fuel cost of $2.96 per gallon

Federal Aviation Administration 98
HYDRR South OPD STAR

Federal Aviation Administration 99
HYDRR South OPD STAR En Route View
35000 29000
ST Proposed Current
21000 13000

Federal Aviation Administration 100
HYDRR South OPD STAR Terminal View
ST Proposed Current
AT 17000
21000 13000
AT 8000

Federal Aviation Administration 101
HYDRR North and South OPD STARs Terminal View
ST Proposed Current
AT 17000
AT OR BELOW 16000

Federal Aviation Administration 102
HYDRR South OPD STAR
*Based on a fuel cost of $2.96 per gallon

Federal Aviation Administration 103
HYDRR Turboprop/South Satellite STAR

Federal Aviation Administration 104
HYDRR Phoenix Turboprop/South Satellite STAR
Identified Issues • Turboprops restrict descend via
on PHX arrivals • South satellite arrivals also on
HYDRR
Conceptual Solutions • RNAV STAR for PHX turboprops
and south satellites jets and turboprops
ST Proposed

Federal Aviation Administration 105
HYDRR Turboprop/South Satellite STAR with GEELA and MOHAK Flows
MOHAK FLOW TO PHX
GEELA FLOW TO PHX
SOUTH SATELLITES
ST Proposed Proposed SID/STAR

Federal Aviation Administration 106
BROAK OPD STAR

Federal Aviation Administration 107
BROAK OPD STAR
Identified Issues • Turboprops restrict descend via • Inefficient lateral paths • Inefficient vertical paths • Interactions with LAS TYSSN STAR • ZLA LOA constraints
Conceptual Solutions
• RNAV STAR with Optimized Profile Descent (OPD)
• Optimized lateral paths to reduce flight track miles
• Transitions for east and west flows
• Floating fix for crossovers • IAF for RNAV arrival to Runway
07R • Common routes in ZAB airspace • Revise ZLA/ZAB LOA to allow for
higher tops of descent
ST Proposed Current

Federal Aviation Administration 108
BROAK OPD STAR En Route View
36000 31000
ST Proposed Current
17000 14000
36000 31000

Federal Aviation Administration 109
BROAK OPD STAR Terminal View
AT 7000
AT OR ABOVE 4000
ST Proposed Current 17000
14000

Federal Aviation Administration 110
BROAK OPD STAR
*Based on a fuel cost of $2.96 per gallon

Federal Aviation Administration 111
Phoenix STAR Benefits

Federal Aviation Administration 112
Phoenix Arrival Benefits
*Based on a fuel cost of $2.96 per gallon

Federal Aviation Administration 113
Alternative Designs

Federal Aviation Administration 114
Northeast Alternative

Federal Aviation Administration 115
Northeast Alternative (West Flow Only)
Considerations • West flow only • Industry strongly supports a notional
design with dual arrival routes • Arrival route over FORPE will be the
offload STAR • Potential for reduced optimization due to
Q route location • ATC task complexity • Automation • While not recommended by the Study
Team, this alternative proposal is contained in this report to provide flexibility to further explore potential benefits during the Design Phase. • Due to unknown flow assignments the
Study Team was unable to complete a benefit analysis.
ST Proposed STAR ST Proposed SID

Federal Aviation Administration 116
Northeast Alternative En Route View
ST Proposed STAR ST Proposed SID

Federal Aviation Administration 117
Northeast Alternative Terminal View
ST Proposed STAR ST Proposed SID
Federal Aviation Administration 118
Southeast Alternative

Federal Aviation Administration 119
Southeast Alternative
Identified Issues • Parachute jump activity • Route efficiency
Conceptual Solutions/ Considerations
• West flow design • RNAV STAR with Optimized Profile Descent (OPD) • RNAV SID with optimized lateral paths to reduce flight track miles • ATC task complexity • Automation • While not recommended by the Study Team, this
west flow alternative proposal is contained in this report to provide flexibility to further explore potential benefits during the Design Phase.
ST Alternative STAR ST Alternative SID
WEST FLOW
EAST FLOW

Federal Aviation Administration 120
Satellite Procedures

Federal Aviation Administration 121
Satellite Airport Procedures
• Phoenix-Mesa Gateway Airport (KIWA) • Scottsdale Airport (KSDL) • Phoenix Deer Valley Airport (KDVT) • Other
Federal Aviation Administration 122
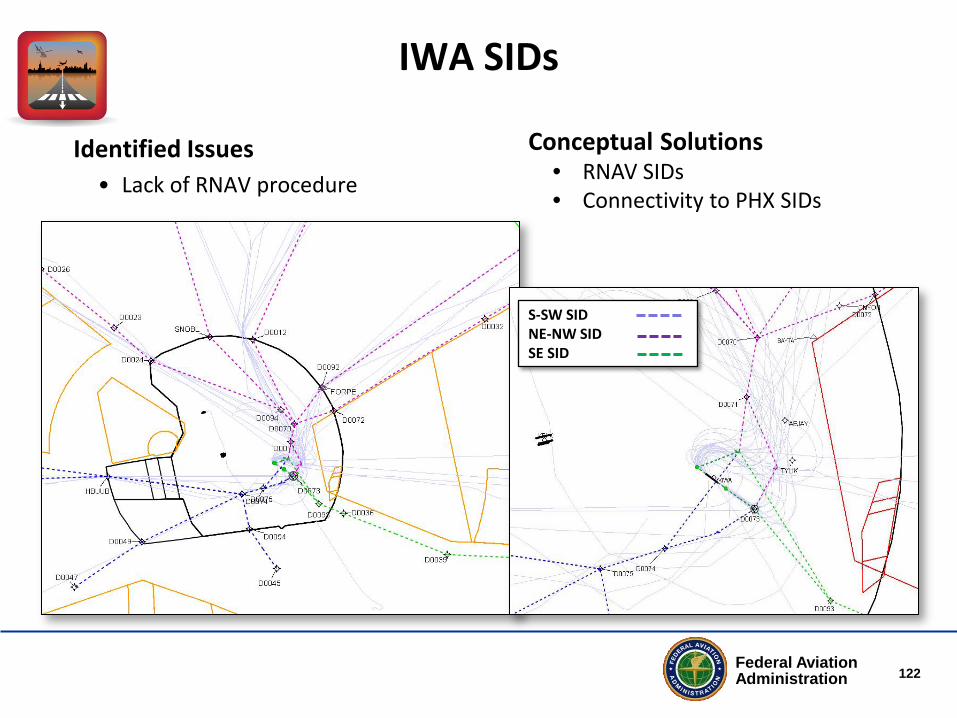
IWA SIDs
Identified Issues • Lack of RNAV procedure
Conceptual Solutions • RNAV SIDs • Connectivity to PHX SIDs
S-SW SID NE-NW SID SE SID

Federal Aviation Administration 123
IWA STAR
Identified Issues • Crosses multiple traffic
streams • Altitude restricted
Conceptual Solutions • RNAV STAR • Laterally segregated in the
en route environment from PHX departures
• Mimics PHX Offload STAR
ST Proposed Current

Federal Aviation Administration 124
SDL SIDs
Identified Issues • Lack of RNAV procedure • Cannot deconflict
simultaneous SDL and DVT releases
Conceptual Solutions • North and South RNAV SIDs • Connectivity to PHX SIDs
ST Proposed

Federal Aviation Administration 125
DVT SID
Identified Issues • Lack of RNAV procedure
Conceptual Solutions
• RNAV SIDs • Connectivity to PHX SIDs
Proposed

Federal Aviation Administration 126
North Satellite Airports West STAR

Federal Aviation Administration 127
North Satellite Airports West STAR
Identified Issues • Lack of RNAV procedure
Conceptual Solutions
• RNAV STAR
Proposed

Federal Aviation Administration 128
Other Satellite Airports Identified by Industry for Procedure Development
During the Design Phase
Identified Issue • PBN approaches into all satellite airports. There is significant
flight training activity in the Phoenix area, and a lack of instrument approach procedures is a hindrance to general aviation flight operations.
Conceptual Solutions • RNAV procedures with optimized lateral/vertical paths • Possible other airports for PBN procedure development
• CHD, GYR, GEU, FFZ

Federal Aviation Administration 129
Q and T-Routes

Federal Aviation Administration 130
Proposed East/West Q Routes
Identified Issues • Conflictions with EAGUL STAR with
J74
FLG PAYSO
ZUN SJN DRYHT
GUP
ABQ
CNX
PKE
HIPPI DRK
PSP
TRM
TNP TXO
TCC
CIM
PXR
CIM-TNP NOFLY-TNP TXO-PSP
NOFLY
Conceptual Solutions • Q Routes segregating EAGUL while adding
needed structure for overflight traffic

Federal Aviation Administration 131
Proposed East/West Q Routes
PAYSO
FLG
PKE
HIPPI DRK
PSP
TRM
TNP
CIM-TNP NOFLY-TNP TXO-PSP
NOFLY
Proposed Q route from PSP to TXO is 0.3NM shorter than J74 Aircraft filed J74.DRK.J231.TNP
has approximately 7.0NM savings
Aircraft filed J134.DRK.J231.TNP has approximately 1.4 NM savings

Federal Aviation Administration 132
North/South T-Route
PROPOSED T-ROUTE

Federal Aviation Administration 133
RNP/RNAV Approach Procedures

Federal Aviation Administration 134
Phoenix RNP Approach Procedures West Flow
ST Proposed STAR ST Proposed RNP

Federal Aviation Administration 135
Phoenix RNP Approach Procedures East Flow
ST Proposed STAR ST Proposed RNP

Federal Aviation Administration 136
Phoenix RNAV Approach Procedures West/East Flow
RNAV APPROACH USED TO TRANSITION TO RUNWAY 26
ST Proposed RNAV Notional RNAV
RNAV APPROACH USED TO TRANSITION TO RUNWAY 7R

Federal Aviation Administration 137
Issues for Consideration During Design Phase
Federal Aviation Administration 138
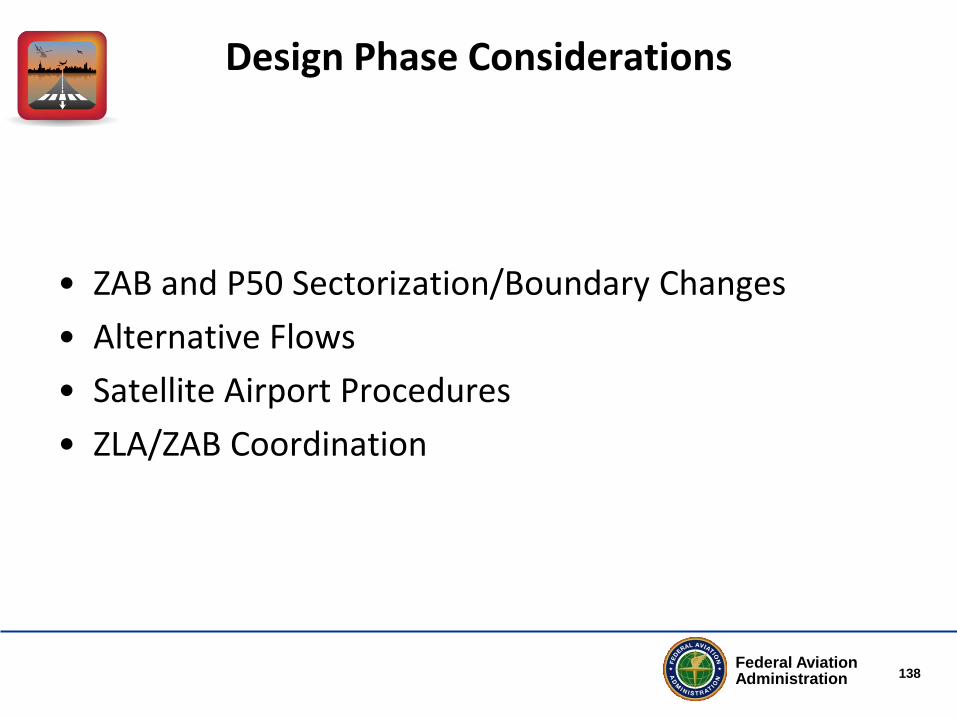
Design Phase Considerations
• ZAB and P50 Sectorization/Boundary Changes • Alternative Flows • Satellite Airport Procedures • ZLA/ZAB Coordination

Federal Aviation Administration 139
Example of Facility Re-Sectorization
Potential Sector Changes • ZAB38/39/43/45 • P50 Internal Sectors
EAGUL Primary/ Offload OPD STAR
YOTES RNAV SID
SNOBL RNAV SID

Federal Aviation Administration 140
Summary of Potential Benefits

Federal Aviation Administration 141
Study Team Notional Benefits
*Based on a fuel cost of $2.96 per gallon
$993,750

Federal Aviation Administration 142
Plan Forward
Federal Aviation Administration 143
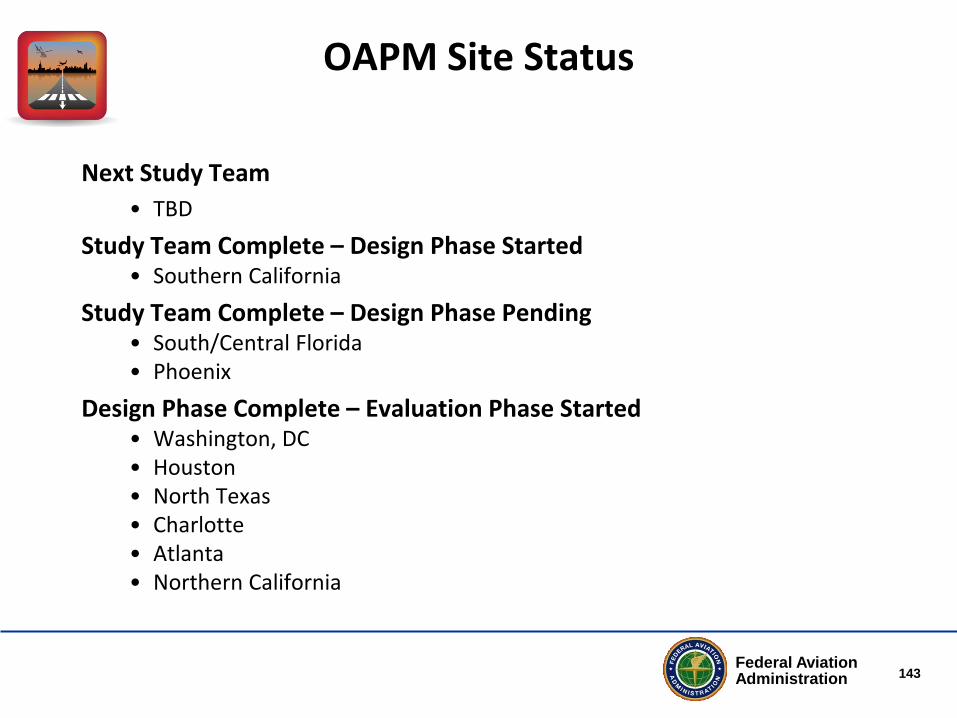
OAPM Site Status
Next Study Team • TBD
Study Team Complete – Design Phase Started • Southern California
Study Team Complete – Design Phase Pending • South/Central Florida • Phoenix
Design Phase Complete – Evaluation Phase Started • Washington, DC • Houston • North Texas • Charlotte • Atlanta • Northern California
Federal Aviation Administration 144
Plan Forward for Phoenix
• Study Team completes Project Proposal and Study Team Report • FAA HQ makes final decision whether to proceed with D&I
– If approved, D&I Project Manager and the NATCA Article 48 Co-Lead are selected and Phoenix D&I Team begins Design Phase