february 2015 greater boston real estate market trends report
TRANSCRIPT

Monthly Indicators A RESEARCH TOOL PROVIDED BY THE GREATER BOSTON ASSOCIATION OF REALTORS®
February 2015 Quick Facts
23456789
10111213
Data is refreshed regularly to capture changes in market activity so figures shown may be different than previously reported. Current as of March 16, 2015. All data from MLS PropertyInformation Network, Inc. Provided by Greater Boston Association of REALTORS® and the Massachusetts Association of REALTORS®. Powered by 10K Research and Marketing.
+ 5.0%Year-Over-Year(YoY) Change inClosed Sales
Single-Family Only
There has been talk of abundant cold and snow this winter (unless you happen to live in California!). When weather patterns turn bad, like wicked bad, real estate industry pundits tend to go gloom, assuming that Americans hungry for homeownership are bothered by a little frozen precipitation. The nation will unfreeze, inventory is expected to rise and home sales are widely expected to increase. These are good times, indeed, and many of us now have an enchanting shared experience that we can walk uphill to school both ways.
New Listings in the Greater Boston region were down 38.7 percent for detached homes and 33.7 percent for condominiums. Closed Sales increased 5.0 percent for detached homes but decreased 1.8 percent for condominiums.
The Median Sales Price was up 7.9 percent to $439,500 for single-family properties and 3.5 percent to $403,568 for condominiums. Months Supply of Inventory decreased 32.7 percent for single-family units and 31.7 percent for townhouse-condo units.
In national financial news, rumors that Fannie Mae and Freddie Mac could one day be a thing of the past have people wondering about the future of the 30-year fixed-rate mortgage. But let's not sound the alarm just yet. A drastic change to lending's gold standard is certainly not on the immediate horizon. Meanwhile, Federal Reserve Chair Janet Yellen seems to have no immediate interest in raising interest rates for the first time since 2006. The economy remains stable, which should keep housing rolling through the short-named months.
- 1.8%Year-Over-Year(YoY) Change inClosed Sales
Condominium Only
+ 1.9%Year-Over-Year(YoY) Change inClosed SalesAll Properties
Single-Family Market Overview
Condominium Market Overview
Closed Sales
Median Sales Price
Housing Affordability Index
Inventory of Homes for Sale
Months Supply of Inventory
Days On Market Until Sale
Percent of Original List Price Received
City of Boston Overview
Pending Sales
New Listings

Single-Family Market Overview Key market metrics for the current month and year-to-date figures for Single-Family Homes Only.
Key Metrics Historical Sparklines Feb-2014 Feb-2015 + / – YTD 2014 YTD 2015 + / –
95.5% 95.4%
+ 10.8%
- 0.1%Percent of OriginalList Price Received
Days on Market Until Sale
95.8%
+ 11.4%
- 0.7%
105
95.1%
Pending Sales
Median Sales Price
+ 3.7%1,494795 735 - 7.5% 1,441
- 29.3% -- --
- 1.4% 105 103 - 1.3%
--
Housing Affordability Index
Inventory of Homes for Sale
Months Supply of Inventory 5.4
$407,450 + 7.8%
94
106 104
96
-- -- --
2,817 1,992
3.6 - 32.7%
$439,500 + 7.9% $410,900
87
1,284 + 2.6%
All data from MLS Property Information Network, Inc. Provided by the Greater Boston Association of REALTORS® and the Massachusetts Association of REALTORS®. Powered by 10K Research and Marketing. | 2
New Listings 1,141 700 - 38.7% 2,078 1,596 - 23.2%
Closed Sales 520 546 + 5.0% 1,252
$443,048
2-2012 2-2013 2-2014 2-2015
2-2012 2-2013 2-2014 2-2015
2-2012 2-2013 2-2014 2-2015
2-2012 2-2013 2-2014 2-2015
2-2012 2-2013 2-2014 2-2015
2-2012 2-2013 2-2014 2-2015
2-2012 2-2013 2-2014 2-2015
2-2012 2-2013 2-2014 2-2015
2-2012 2-2013 2-2014 2-2015
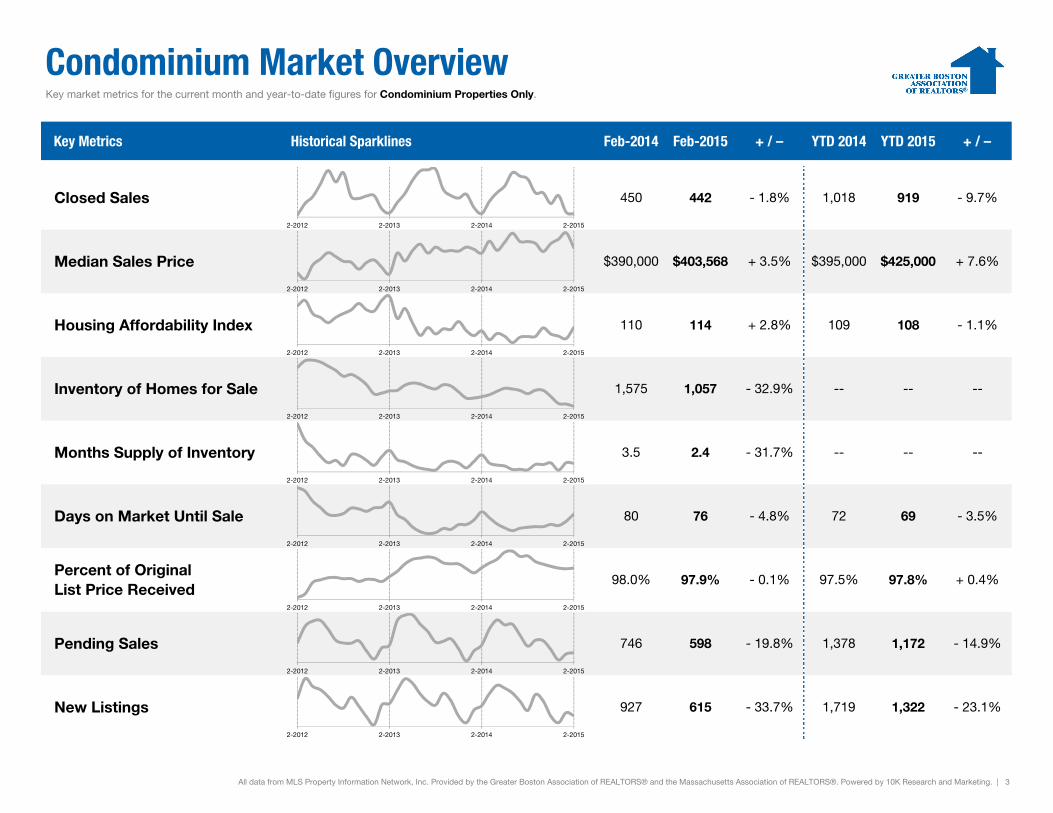
Condominium Market Overview Key market metrics for the current month and year-to-date figures for Condominium Properties Only.
Key Metrics Historical Sparklines Feb-2014 Feb-2015 + / – YTD 2014 YTD 2015 + / –
- 9.7%
Median Sales Price $390,000 $403,568 + 3.5% $395,000 $425,000 + 7.6%
Closed Sales 450 442 - 1.8% 1,018 919
- 1.1%
Inventory of Homes for Sale 1,575 1,057 - 32.9% -- -- --
Housing Affordability Index 110 114 + 2.8% 109 108
--
Days on Market Until Sale 80 76 - 4.8% 72 69 - 3.5%
Months Supply of Inventory 3.5 2.4 - 31.7% -- --
+ 0.4%
Pending Sales 746 598 - 19.8% 1,378 1,172 - 14.9%
Percent of OriginalList Price Received
98.0% 97.9% - 0.1% 97.5% 97.8%
- 23.1%
All data from MLS Property Information Network, Inc. Provided by the Greater Boston Association of REALTORS® and the Massachusetts Association of REALTORS®. Powered by 10K Research and Marketing. | 3
New Listings 927 615 - 33.7% 1,719 1,322
2-2012 2-2013 2-2014 2-2015
2-2012 2-2013 2-2014 2-2015
2-2012 2-2013 2-2014 2-2015
2-2012 2-2013 2-2014 2-2015
2-2012 2-2013 2-2014 2-2015
2-2012 2-2013 2-2014 2-2015
2-2012 2-2013 2-2014 2-2015
2-2012 2-2013 2-2014 2-2015
2-2012 2-2013 2-2014 2-2015

Closed Sales A count of the actual sales that have closed in a given month.
Single-FamilyYoY
ChangeCondominium
YoYChange
Mar-2014 711 - 9.5% 692 + 3.6%
Apr-2014 862 - 6.4% 867 + 2.0%
May-2014 1,206 - 9.3% 999 - 10.2%
Jun-2014 1,683 - 3.7% 1,266 - 2.6%
Jul-2014 1,738 - 1.5% 1,196 - 9.5%
Aug-2014 1,516 - 10.5% 1,138 - 14.8%
Sep-2014 1,066 - 6.4% 862 - 7.4%
Oct-2014 1,045 - 4.0% 863 + 6.8%
Nov-2014 958 - 8.0% 650 - 14.4%
Dec-2014 1,114 + 3.1% 809 - 3.1%
Jan-2015 738 + 0.8% 477 - 16.0%
Feb-2015 546 + 5.0% 442 - 1.8%
Total 13,183 - 4.8% 10,261 - 6.2%
All data from MLS Property Information Network, Inc. Provided by the Greater Boston Association of REALTORS® and the Massachusetts Association of REALTORS®. Powered by 10K Research and Marketing. | 4
546
462
520
450
546
442
Single-Family Condominium
February
200
400
600
800
1,000
1,200
1,400
1,600
1,800
Jan-2003 Jan-2004 Jan-2005 Jan-2006 Jan-2007 Jan-2008 Jan-2009 Jan-2010 Jan-2011 Jan-2012 Jan-2013 Jan-2014 Jan-2015
Historical Closed Sales Activity Single-Family Condominium
-1.8%-2.6%-4.8%
20152014 20152014
1,297
1,003
1,252
1,018
1,284
919
Single-Family Condominium
Year to Date
-9.7%+1.5%-3.5%
20152014 20152014
+5.0% +2.6%
2013 2013 2013 2013

Median Sales Price Median price point for all closed sales, not accounting for seller concessions, in a given month.
Single-FamilyYoY
ChangeCondominium
YoYChange
Mar-2014 $427,000 + 13.0% $420,000 + 7.7%
Apr-2014 $440,000 + 4.8% $397,000 + 7.3%
May-2014 $464,250 + 6.1% $417,500 + 5.3%
Jun-2014 $510,000 + 5.2% $439,950 + 6.7%
Jul-2014 $505,000 + 7.4% $419,000 + 7.4%
Aug-2014 $490,000 + 4.3% $419,000 + 3.5%
Sep-2014 $424,900 - 1.5% $414,500 + 4.9%
Oct-2014 $435,302 + 3.6% $394,000 - 0.6%
Nov-2014 $450,000 + 8.4% $414,000 + 4.8%
Dec-2014 $443,500 + 2.0% $425,000 + 4.9%
Jan-2015 $448,500 + 7.3% $441,000 + 10.4%
Feb-2015 $439,500 + 7.9% $403,568 + 3.5%
Median $464,000 + 5.5% $419,000 + 5.5%
All data from MLS Property Information Network, Inc. Provided by the Greater Boston Association of REALTORS® and the Massachusetts Association of REALTORS®. Powered by 10K Research and Marketing. | 5
$368,250
$337,750
$407,450$390,000
$439,500
$403,568
Single-Family Condominium
February
$250,000
$300,000
$350,000
$400,000
$450,000
$500,000
$550,000
$600,000
Jan-2003 Jan-2004 Jan-2005 Jan-2006 Jan-2007 Jan-2008 Jan-2009 Jan-2010 Jan-2011 Jan-2012 Jan-2013 Jan-2014 Jan-2015
Historical Median Sales Price Single-Family Condominium
+3.5%+15.5%+10.6%
20152014 20152014
$373,000$346,000
$410,900$395,000
$443,048$425,000
Single-Family Condominium
Year to Date
+7.6%+14.2%+10.2%
20152014 20152014
+7.9% +7.8%
2013 2013 2013 2013

Housing Affordability Index
Single-FamilyYoY
ChangeCondominium
YoYChange
Mar-2014 101 - 19.2% 103 - 15.3%
Apr-2014 98 - 14.8% 108 - 16.8%
May-2014 95 - 10.5% 106 - 9.8%
Jun-2014 87 - 4.5% 100 - 5.9%
Jul-2014 87 - 7.4% 105 - 7.4%
Aug-2014 90 - 2.9% 106 - 2.2%
Sep-2014 103 + 0.3% 106 - 5.9%
Oct-2014 102 - 3.1% 113 + 1.1%
Nov-2014 99 - 12.1% 108 - 9.1%
Dec-2014 101 - 1.4% 106 - 4.2%
Jan-2015 102 + 0.4% 104 - 2.4%
Feb-2015 104 - 1.4% 114 + 2.8%
Average 98 -6.4% 106 -6.2%
This index measures housing affordability for the region. An index of 120 means the median household income was 120% of what is necessary to qualify for the median-priced home under prevailing interest rates. A higher number means greater affordability.
All data from MLS Property Information Network, Inc. Provided by the Greater Boston Association of REALTORS® and the Massachusetts Association of REALTORS®. Powered by 10K Research and Marketing. | 6
129140
106 110104
114
Single-Family Condominium
February
50
60
70
80
90
100
110
120
130
140
150
Jan-2004 Jan-2005 Jan-2006 Jan-2007 Jan-2008 Jan-2009 Jan-2010 Jan-2011 Jan-2012 Jan-2013 Jan-2014 Jan-2015
Historical Housing Affordability Index Single-Family Condominium
+2.8%-21.3%-17.9%
127137
105 109103 108
Single-Family Condominium
Year to Date
-1.1%-20.4%-17.6%
20152014 20152014 20152014 20152014
-1.4% -1.3%
2013 2013 2013 2013
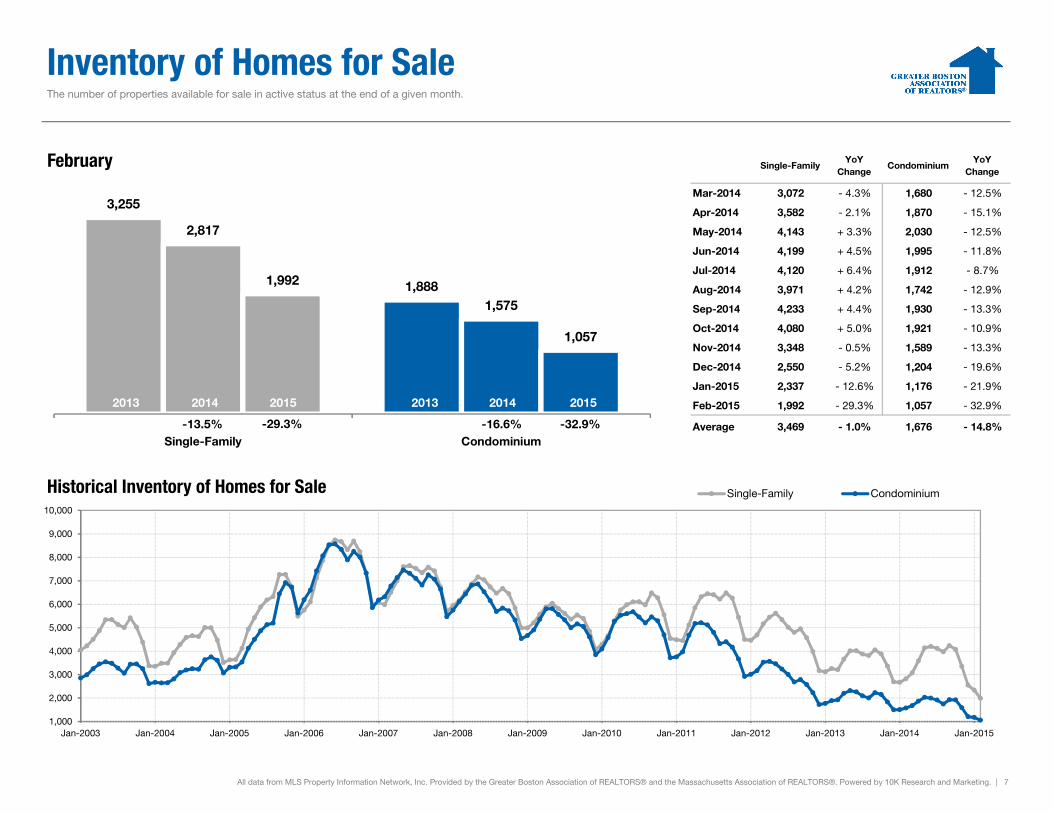
Inventory of Homes for Sale The number of properties available for sale in active status at the end of a given month.
Single-FamilyYoY
ChangeCondominium
YoYChange
Mar-2014 3,072 - 4.3% 1,680 - 12.5%
Apr-2014 3,582 - 2.1% 1,870 - 15.1%
May-2014 4,143 + 3.3% 2,030 - 12.5%
Jun-2014 4,199 + 4.5% 1,995 - 11.8%
Jul-2014 4,120 + 6.4% 1,912 - 8.7%
Aug-2014 3,971 + 4.2% 1,742 - 12.9%
Sep-2014 4,233 + 4.4% 1,930 - 13.3%
Oct-2014 4,080 + 5.0% 1,921 - 10.9%
Nov-2014 3,348 - 0.5% 1,589 - 13.3%
Dec-2014 2,550 - 5.2% 1,204 - 19.6%
Jan-2015 2,337 - 12.6% 1,176 - 21.9%
Feb-2015 1,992 - 29.3% 1,057 - 32.9%
Average 3,469 - 1.0% 1,676 - 14.8%
All data from MLS Property Information Network, Inc. Provided by the Greater Boston Association of REALTORS® and the Massachusetts Association of REALTORS®. Powered by 10K Research and Marketing. | 7
3,255
1,888
2,817
1,575
1,992
1,057
Single-Family Condominium
February
1,000
2,000
3,000
4,000
5,000
6,000
7,000
8,000
9,000
10,000
Jan-2003 Jan-2004 Jan-2005 Jan-2006 Jan-2007 Jan-2008 Jan-2009 Jan-2010 Jan-2011 Jan-2012 Jan-2013 Jan-2014 Jan-2015
Historical Inventory of Homes for Sale Single-Family Condominium
-32.9%-16.6%-13.5%
20152014 20152014
-29.3%
2013 2013

Months Supply of Inventory The inventory of homes for sale at the end of a given month, divided by the average monthly pending sales from the last 12 months.
Single-FamilyYoY
ChangeCondominium
YoYChange
Mar-2014 4.3 + 5.8% 2.4 - 15.5%
Apr-2014 4.2 + 4.6% 2.2 - 16.7%
May-2014 3.4 + 14.0% 2.0 - 2.5%
Jun-2014 2.5 + 8.5% 1.6 - 9.4%
Jul-2014 2.4 + 8.0% 1.6 + 0.9%
Aug-2014 2.6 + 16.4% 1.5 + 2.2%
Sep-2014 4.0 + 11.6% 2.2 - 6.4%
Oct-2014 3.9 + 9.5% 2.2 - 16.5%
Nov-2014 3.5 + 8.1% 2.4 + 1.2%
Dec-2014 2.3 - 8.0% 1.5 - 17.0%
Jan-2015 3.2 - 13.3% 2.5 - 7.0%
Feb-2015 3.6 - 32.7% 2.4 - 31.7%
Average 3.1 - 0.7% 1.9 - 14.3%
All data from MLS Property Information Network, Inc. Provided by the Greater Boston Association of REALTORS® and the Massachusetts Association of REALTORS®. Powered by 10K Research and Marketing. | 8
6.0
4.1
5.4
3.53.6
2.4
Single-Family Condominium
February
0
2
4
6
8
10
12
14
16
Jan-2004 Jan-2005 Jan-2006 Jan-2007 Jan-2008 Jan-2009 Jan-2010 Jan-2011 Jan-2012 Jan-2013 Jan-2014 Jan-2015
Historical Months Supply of Inventory Single-Family Condominium
-31.7%-14.4%-9.1%
20152014 20152014
-32.7%
2013 2013

Days on Market Until Sale Average number of days between when a property is listed and when an offer is accepted in a given month.
Single-FamilyYoY
ChangeCondominium
YoYChange
Mar-2014 89 - 19.9% 69 - 7.3%
Apr-2014 86 - 12.4% 58 - 12.4%
May-2014 65 - 18.9% 51 - 3.0%
Jun-2014 59 - 1.6% 46 + 4.4%
Jul-2014 56 + 12.9% 50 + 23.8%
Aug-2014 60 + 17.1% 52 + 22.9%
Sep-2014 67 + 5.2% 53 + 6.6%
Oct-2014 70 + 12.2% 53 + 9.9%
Nov-2014 75 + 6.1% 57 + 0.5%
Dec-2014 79 + 10.5% 55 - 3.3%
Jan-2015 90 + 10.1% 63 - 3.6%
Feb-2015 105 + 11.4% 76 - 4.8%
Total 71 + 1.5% 53 + 4.4%
All data from MLS Property Information Network, Inc. Provided by the Greater Boston Association of REALTORS® and the Massachusetts Association of REALTORS®. Powered by 10K Research and Marketing. | 9
114
9894
80
105
76
Single-Family Condominium
February
30
50
70
90
110
130
150
170
Jan-2003 Jan-2004 Jan-2005 Jan-2006 Jan-2007 Jan-2008 Jan-2009 Jan-2010 Jan-2011 Jan-2012 Jan-2013 Jan-2014 Jan-2015
Historical Days on Market Until Sale Single-Family Condominium
-4.8%-17.8%-17.3%
112
9387
72
96
69
Single-Family Condominium
Year to Date
-3.5%-22.5%-22.7%
20152014 20152014 20152014 20152014
+11.4% +10.8%
2013 2013 2013 2013

Percent of Original List Price Received
Single-FamilyYoY
ChangeCondominium
YoYChange
Mar-2014 96.4% + 2.0% 98.7% + 1.4%
Apr-2014 97.4% + 1.2% 99.4% + 0.8%
May-2014 98.2% + 1.0% 100.6% + 1.2%
Jun-2014 98.7% + 0.6% 100.7% + 1.1%
Jul-2014 98.2% + 0.4% 99.8% + 0.1%
Aug-2014 97.8% + 0.1% 99.9% + 0.4%
Sep-2014 96.7% - 0.2% 99.0% + 0.2%
Oct-2014 96.5% - 0.4% 98.6% - 0.1%
Nov-2014 96.3% + 0.2% 98.2% - 0.4%
Dec-2014 95.2% - 0.6% 97.9% + 0.1%
Jan-2015 95.6% + 0.3% 97.8% + 0.7%
Feb-2015 95.1% - 0.7% 97.9% - 0.1%
Average 97.1% + 0.3% 99.3% + 0.5%
All data from MLS Property Information Network, Inc. Provided by the Greater Boston Association of REALTORS® and the Massachusetts Association of REALTORS®. Powered by 10K Research and Marketing. | 10
Percentage found when dividing a property’s sales price by its original list price, then taking the average for all properties sold in a given month, not accounting for seller concessions.
93.8% 96.5%95.8% 98.0%95.1% 97.9%
Single-Family Condominium
February
89%
91%
93%
95%
97%
99%
101%
103%
105%
Jan-2003 Jan-2004 Jan-2005 Jan-2006 Jan-2007 Jan-2008 Jan-2009 Jan-2010 Jan-2011 Jan-2012 Jan-2013 Jan-2014 Jan-2015
Historical Percent of Original List Price Received Single-Family Condominium
-0.1%+1.5%+2.1%
93.7% 96.0%95.5% 97.5%95.4% 97.8%
Single-Family Condominium
Year to Date
+0.4%+1.5%+1.9%
20152014 20152014 20152014 20152014
-0.7% -0.1%
2013 2013 2013 2013

Pending Sales A count of the properties in UAG status between the first and last day in a given month, regardless of current status (based on Off Market Date).
Single-FamilyYoY
ChangeCondominium
YoYChange
Mar-2014 1,255 - 9.3% 1,053 - 13.1%
Apr-2014 1,479 - 10.2% 1,225 - 7.0%
May-2014 1,618 - 7.7% 1,131 - 14.4%
Jun-2014 1,518 - 1.2% 1,143 0.0%
Jul-2014 1,195 - 0.8% 930 - 7.0%
Aug-2014 1,002 - 8.9% 723 - 9.5%
Sep-2014 1,069 + 1.0% 836 + 2.5%
Oct-2014 1,185 + 3.9% 828 - 3.9%
Nov-2014 933 + 5.7% 658 - 1.9%
Dec-2014 676 + 13.6% 459 + 4.6%
Jan-2015 759 + 17.5% 574 - 9.2%
Feb-2015 735 - 7.5% 598 - 19.8%
Total 13,424 - 2.3% 10,158 - 7.3%
All data from MLS Property Information Network, Inc. Provided by the Greater Boston Association of REALTORS® and the Massachusetts Association of REALTORS®. Powered by 10K Research and Marketing. | 11
821747
795746735
598
Single-Family Condominium
February
200
400
600
800
1,000
1,200
1,400
1,600
Jan-2003 Jan-2004 Jan-2005 Jan-2006 Jan-2007 Jan-2008 Jan-2009 Jan-2010 Jan-2011 Jan-2012 Jan-2013 Jan-2014 Jan-2015
Historical Pending Sales Activity Single-Family Condominium
-19.8%-0.1%-3.2%
1,642
1,4391,4411,378
1,494
1,172
Single-Family Condominium
Year to Date
-14.9%-4.2%-12.2%
20152014 20152014 20152014 20152014
-7.5% +3.7%
2013 2013 2013 2013

New Listings A count of the properties that have been newly listed on the market in a given month.
Single-FamilyYoY
ChangeCondominium
YoYChange
Mar-2014 1,776 + 9.2% 1,305 - 7.2%
Apr-2014 2,242 - 6.5% 1,568 - 11.2%
May-2014 2,479 + 2.8% 1,477 - 9.2%
Jun-2014 1,997 + 7.5% 1,324 + 2.3%
Jul-2014 1,500 + 1.5% 1,063 + 1.1%
Aug-2014 1,266 - 7.3% 778 - 17.8%
Sep-2014 1,840 + 2.2% 1,277 - 3.0%
Oct-2014 1,544 + 5.1% 1,078 0.0%
Nov-2014 799 - 9.5% 598 + 0.2%
Dec-2014 590 + 9.9% 395 + 0.3%
Jan-2015 896 - 4.4% 707 - 10.7%
Feb-2015 700 - 38.7% 615 - 33.7%
Total 17,629 - 1.5% 12,185 - 7.7%
All data from MLS Property Information Network, Inc. Provided by the Greater Boston Association of REALTORS® and the Massachusetts Association of REALTORS®. Powered by 10K Research and Marketing. | 12
1,196
998
1,141
927
700615
Single-Family Condominium
February
0
250
500
750
1,000
1,250
1,500
1,750
2,000
2,250
2,500
2,750
Jan-2003 Jan-2004 Jan-2005 Jan-2006 Jan-2007 Jan-2008 Jan-2009 Jan-2010 Jan-2011 Jan-2012 Jan-2013 Jan-2014 Jan-2015
Historical New Listing Activity Single-Family Condominium
-33.7%-7.1%-4.6%
2,316
1,9512,078
1,7191,596
1,322
Single-Family Condominium
Year to Date
-23.1%-11.9%-10.3%
20152014 20152014 20152014 20152014
-38.7% -23.2%
2013 2013 2013 2013

City of Boston – Market Overview Key market metrics for the current month and year-to-date figures for the City of Boston.
Key Metrics Historical Sparklines Feb-2014 Feb-2015 + / – YTD 2014 YTD 2015 + / –
- 15.4%
Median Sales Price $472,750 $489,000 + 3.4% $468,750 $488,250 + 4.2%
Closed Sales 244 205 - 16.0% 539 456
- 1.3%
Inventory of Homes for Sale 728 503 - 30.9% -- -- --
Housing Affordability Index 106 104 - 1.4% 105 103
--
Days on Market Until Sale 78 77 - 1.1% 68 67 - 2.1%
Months Supply of Inventory 3.0 2.5 - 17.8% -- --
- 1.0%
Pending Sales 372 314 - 15.6% 685 621 - 9.3%
Percent of OriginalList Price Received
98.1% 96.5% - 1.6% 97.7% 96.7%
- 21.4%
All data from MLS Property Information Network, Inc. Provided by the Greater Boston Association of REALTORS® and the Massachusetts Association of REALTORS®. Powered by 10K Research and Marketing. | 13
New Listings 482 328 - 32.0% 874 687
2-2012 2-2013 2-2014 2-2015
2-2012 2-2013 2-2014 2-2015
2-2012 2-2013 2-2014 2-2015
2-2012 2-2013 2-2014 2-2015
2-2012 2-2013 2-2014 2-2015
2-2012 2-2013 2-2014 2-2015
2-2012 2-2013 2-2014 2-2015
2-2012 2-2013 2-2014 2-2015
2-2012 2-2013 2-2014 2-2015